spherical bearings loader slot bearings rod end bearings ...

IOP PUBLISHING and INTERNATIONAL ATOMIC ENERGY AGENCY NUCLEAR FUSION
Nucl. Fusion 51 (2011) 083050 (15pp) doi:10.1088/0029-5515/51/8/083050
A survey of electron Bernstein waveheating and current drive potential forspherical tokamaksJakub Urban1, Joan Decker2, Yves Peysson2, Josef Preinhaelter1,Vladimir Shevchenko3, Gary Taylor4, Linda Vahala5 andGeorge Vahala6
1 Institute of Plasma Physics AS CR, v.v.i., Association EURATOM/IPP.CR, Prague, CzechRepublic2 CEA, IRFM, F-13108 Saint Paul Lez Durance, France3 EURATOM/CCFE Fusion Association, Culham Science Centre, Abingdon, OX14 3DB, UK4 Princeton Plasma Physics Laboratory, Princeton, NJ 08543, USA5 Frank Batten College of Engineering and Technology, Old Dominion University, Norfolk,VA 23529, USA6 College of William & Mary, Williamsburg, VA 23185, USA
E-mail: [email protected]
Received 4 April 2011, accepted for publication 13 July 2011Published 8 August 2011Online at stacks.iop.org/NF/51/083050
AbstractThe electron Bernstein wave (EBW) is typically the only wave in the electron cyclotron (EC) range that can beapplied in spherical tokamaks for heating and current drive (H&CD). Spherical tokamaks (STs) operate generally inhigh-β regimes, in which the usual EC O- and X-modes are cut off. In this case, EBWs seem to be the only optionthat can provide features similar to the EC waves—controllable localized H&CD that can be used for core plasmaheating as well as for accurate plasma stabilization.
The EBW is a quasi-electrostatic wave that can be excited by mode conversion from a suitably launchedO- or X-mode; its propagation further inside the plasma is strongly influenced by the plasma parameters. Theserather awkward properties make its application somewhat more difficult. In this paper we perform an extensivenumerical study of EBW H&CD performance in four typical ST plasmas (NSTX L- and H-mode, MAST Upgrade,NHTX). Coupled ray-tracing (AMR) and Fokker–Planck (LUKE) codes are employed to simulate EBWs of varyingfrequencies and launch conditions, which are the fundamental EBW parameters that can be chosen and controlled.Our results indicate that an efficient and universal EBW H&CD system is indeed viable. In particular, power canbe deposited and current reasonably efficiently driven across the whole plasma radius. Such a system could becontrolled by a suitably chosen launching antenna vertical position and would also be sufficiently robust.
(Some figures in this article are in colour only in the electronic version)
1. Introduction
Present research in electron cyclotron (EC) wave heatingand current drive (H&CD) for magnetic confinementthermonuclear fusion [1] is focused on conventional aspectratio tokamaks, and particularly ITER. However, in the‘alternative’ spherical tokamak (ST) with aspect ratio A ≡R0/a close to unity (R0 and a being the major and minorradii, respectively) and weaker external toroidal magnetic field,the usual EC transverse O- and X-modes are mostly cut offand cannot be used for H&CD. The role of ST research isnevertheless very important. For their relatively high neutronflux density and economy, STs are being considered as a
candidate for a component test facility (ST-CTF) [2, 3] and, forthe same reasons, appear in fusion–fission hybrid concepts [4].
The low magnetic field of STs has a major impact onthe propagation of EC waves in the plasma. This frequencyrange is of crucial importance for auxiliary H&CD systems inpresent and future tokamaks. Typically, in STs, the electronplasma frequency ωpe = 2πfpe ≡ (nee
2/meε0)1/2 is much
higher than the EC frequency ωce = 2πfce ≡ eB/me.Here, ne is the electron density, B is the total magneticfield, e is the electron charge, me is the electron mass andε0 is the vacuum permittivity. A similar situation oftenarises in stellarators, which do not have any principal MHDstability density limits. In this so-called overdense regime,
0029-5515/11/083050+15$33.00 1 © 2011 IAEA, Vienna Printed in the UK & the USA

Nucl. Fusion 51 (2011) 083050 J Urban et al
particularly when ωpe > nωce, n > 3 in most of the plasmacross-section, the O- and X-modes of EC waves with first,second and third harmonic frequencies (ωce < ω < 4ωce)
are cut off and cannot propagate inside the overdense plasma.Higher harmonic EC waves are not of interest because oftheir very weak absorption (low optical depth). However,the electron Bernstein wave (EBW) [5]—a quasi-electrostatickinetic EC mode—can propagate and be strongly absorbed inan overdense plasma.
EC waves are extremely useful because they can belaunched far from the plasma (they do not need large plasma-facing antenna structures such as ion–cyclotron or lower-hybrid waves) and feature highly localized and controllableH&CD capabilities. The application of the overdense mode—the EBW—is, however, complicated by its electrostatic nature.First, EBWs must be excited by appropriately launched O-or X-mode via a so-called OXB or XB mode-conversionscheme. This mode conversion takes place in the upper hybridresonance (UHR) region, where the wave frequency satisfies
ω = ωUH ≡√
ω2pe + ω2
ce. This typically occurs near the
plasma edge. The mode-conversion efficiency depends on thewave and plasma parameters and is thus a potential sourceof power loss. The excited EBW can subsequently propagateinside the overdense plasma; however, because of its dispersioncharacteristics, the propagation strongly depends on plasmaparameters and the wave vector can change considerably invarious ways (unlike O- and X-mode propagation, duringwhich the parallel wave number is mostly conserved).
H&CD by EBWs have already been demonstratedexperimentally in magnetic confinement fusion devices,particularly in COMPASS-D [6] and Wendelstein 7-AS[7, 8]. Numerical studies of advanced (steady-state) sphericaltokamak operations consider EBWs as one of the vital currentdrive systems that can stabilize MHD instabilities [9].
In this paper, we pursue an overall study of EBWH&CD on spherical tokamaks by means of numerical ray-tracing and Fokker–Planck simulations. Two coupled codes—AMR (Antenna, Mode-conversion, Ray-tracing) [10, 11] andLUKE [12, 13]—are employed. These codes have provento be very suitable for EBWs [11, 14]. A large number ofcases with different injection parameters is simulated in fourdifferent ST conditions: two experimental discharges of theNSTX tokamak [15], an ST-CTF-like MAST Upgrade H-modescenario [16, 17] and an NHTX scenario [15]. The resultingextensive collection of results is analysed with emphasison H&CD performance—viability, effectiveness, flexibility,controllability and robustness.
The paper is organized into five sections. After theintroduction, the description of EBW physics involved in thisstudy is given. Section 3 describes the context of the numericalsimulation—the target plasmas and the EBW parameters.Numerical results—particularly the current drive localizationand efficiency, the role of N‖, Zeff , the quasilinear effects andthe robustness—are presented in section 4. Finally, section 5discusses the conclusions of our work.
2. EBW description
The EBW has been known for decades [5]. It appears asanother EC branch, in addition to the cold plasma O- and
X-modes, when solving the kinetic dispersion relation of aplasma in an external magnetic field. It was later applied tomagnetic confinement fusion for H&CD while EBW emissionwas introduced as a diagnostic tool; an overview of EBWexperiments is given in [18]. EBW physics can basicallybe separated into three areas: the mode conversion, thepropagation and the wave-plasma power transfer.
2.1. Mode conversion
The EBW mode conversion is a full wave process in whichtransverse EC modes and the EBW are involved. The modeconversion always requires the slow X-mode to be excited,which can then fully convert into the EBW at the UHR. Thisstudy is confined to EBW excitation from the low-field side(LFS) of a tokamak, where two possibilities exist: the XB [19]and the OXB [20, 21] conversion. The XB conversion ischaracterized by a direct coupling between the fast and the slowX-mode while in the OXB scheme the O-mode is converted tothe slow X-mode (in fact, it is converted to the fast branchof the X-mode, which propagates towards higher density andthen smoothly converts to the slow branch, which propagatesbackwards to the UHR). The XB scheme is typically efficientfor lower frequencies and requires the density scale length to bespecifically adjusted (for details see [19]). The OXB scheme,on the other hand, is more universal in terms of frequenciesand density scale lengths as efficient conversion only requiresthe O-mode to be incident at the optimum angle. In 1D theory,this angle is given by [20, 23]
N2‖opt = (1 + ω/ωce)
−1 , Npol = 0, (1)
where N ≡ ck/ω is the normalized wave vector, N‖ ≡N · B/B and Npol ≡ N · (B × ∇ne)/‖B × ∇ne‖. Ifthe incident angle is not optimum, the O- to X-mode powerconversion efficiency of a plane wave decays approximatelyexponentially as [21, 23]
COX = e−πk0Ln
√ωce/2ω
(2(1+ωce/ω)(N‖opt−N‖)
2+N2
pol
), (2)
where Ln ≡ ne/(dne/dr) is the density scale length, and(2) is evaluated at the O-mode cutoff. This formula agreeswell with numerical results for k0Ln > 1 when N‖ is almostoptimum [22] so that COX > 0.9. When N‖ is further from theoptimum, larger k0Ln is required for good agreement [22]. A1D formalism has also been developed [24] which solves themode-conversion problem for almost arbitrary inhomogeneityscale length. In general conditions, the conversion efficiencymust be calculated by full-wave codes, either in the coldplasma [25] or the hot plasma [26] approximation. Thesecodes also take into account the incident wave polarizationand the parasitic slow to fast X-mode tunnelling, which candecrease the OXB conversion efficiency, especially whenthe density gradient is very steep and consequently k0Ln issmall. Numerical and analytical results are in good agreementparticularly around the optimum incidence. As a consequenceof the exponential efficiency dependence, there always existsan angular window where the mode conversion is sufficientlyeffective.
Recently, 2D theory and simulations of the OXBconversion have been developed [27–30]. 2D effects are
2

Nucl. Fusion 51 (2011) 083050 J Urban et al
shown to be important for off-equatorial launch, where theO-mode cutoff and X-mode cutoff surfaces are no longerparallel [29]. In [30], it is shown that the beam curvatureshould be matched to the plasma surface curvature in orderto optimize the conversion efficiency. The effect of thebeam size, which obviously determines the beam spectrum,is also studied, showing that larger beams, i.e. narrowerk-spectrum, tend to be more efficiently converted [30]. Non-linear effects can also play a role, for example a parametricdecay [31] or higher harmonic wave generation [32]. Anotherfactor typically not considered in the conversion process isdensity fluctuations. An estimate, based on a probabilitydistribution function and the 1D formula (2), was made andexperimentally demonstrated in [7], showing a considerabledecrease in the conversion efficiency for large density scalelengths. A detailed treatment of this problem should employa 2D approach.
In this paper, even though the mode conversion is nottreated in detail, it is nonetheless not neglected. We considerthe OXB scheme for its universality. However, the results aredirectly applicable to any mode-conversion scheme as long asEBWs are excited at the same place with similar N‖. TheOXB scheme was successfully demonstrated in various pastand present experiments [18]. Our EBW H&CD simulationstarts from an antenna, which emits a Gaussian beam [33] ofa given frequency and waist radius w0, which, in our case, iscalculated from the Rayleigh range
zR ≡ πw20/λ0 = k0w
20/2, (3)
where λ0 and k0 are the vacuum wavelength and thewavenumber, respectively. At the distance zR from the waist,the Gaussian beam doubles its spot size (the beam radiusbecomes
√2w0). At a fixed zR, the beam divergence is
similar for all frequencies. Large divergence, i.e. wide beamk-spectrum, would cause poor O–X conversion efficiency.
We now calculate the conversion efficiency of a Gaussianbeam. The electric field of a Gaussian beam in the Fourierspace is
E ∝ exp
(−w2
0
4
(k2x + k2
y
)), (4)
where kx,y are wave vectors perpendicular to the direction ofthe beam propagation. The corresponding energy density is∝ |E|2. We can evaluate the total power of the O–X convertedGaussian beam using the analytic formula (2) and Parseval’stheorem:
POX
P0=
∫ ∞−∞
∫ ∞−∞ |E|2 COX dkx dky∫ ∞
−∞∫ ∞−∞ |E|2 dkx dky
. (5)
We assume here that the error introduced by changing theintegration limits from k2
x + k2y � k2
0 to ±∞ is negligible,which is valid for beams with not too large divergence. We nowassume that the z-axis is along the beam propagation directionand that the launch angle is optimum by setting, without anyloss of generality, the magnetic field at the O-mode cutoff to
be B/B = (0, ±√
1 − N2‖,opt, N‖,opt). That is, the magnetic
field is assumed to be homogeneous across the beam spot at
the O-mode cutoff. The integral (5) then becomesPOX
P0=
[∫ ∞
−∞
∫ ∞
−∞|E|2
× e− πLn
√ωce
k0√
2ω(2(1+ωce/ω)(k0N‖,opt∓ky
√1−N2
‖,opt−√
k20−k2
x−k2yN‖,opt)
2+k2x )
dkx dky
]
×[∫ ∞
−∞
∫ ∞
−∞|E|2 dkx dky
]−1
. (6)
This can be evaluated analytically after Taylor-expanding theexponent in kx,y around 0 to second order, yielding
POX
P0=
(1 + 3
κ
zR+ 2
κ2
z2R
)− 12
, (7)
where κ ≡ πLn
√ωce/2ω. This is an important result which,
in fact, imposes an upper limit to the conversion efficiency ofa Gaussian beam. This limit depends on Ln/zR for a fixedωce/ω. (Note that 0.4 <
√ωce/2ω < 0.7 for the first two
harmonics.) It also tells us how narrow (i.e. how divergent) abeam can be used while keeping the OXB conversion efficient.The beam conversion efficiency is shown graphically for thediscussed scenarios in section 3.2. In a similar fashion, we canalso evaluate the conversion efficiency of a Gaussian beam fornon-optimum central wave vector.
2.2. Propagation
The EBW is, apart from the ‘cold’ O- and X-modes, a solutionto the kinetic (hot) dispersion relation of a plasma in an externalmagnetic field [5]. Numerous analytical and numericalstudies of EBW propagation have been performed and EBWpropagation is hence quite well explored. The characteristicproperties of EBW propagation are the following.
• The polarization is quasi-electrostatic; hence, in mostsituations, the electrostatic dispersion relation describesEBWs satisfactorily [34–36].
• EBWs can propagate in plasmas if ωce < ω � ωUH7. As
ω ∼ nωce, n = 1, 2, . . ., it implies nωce < ωUH. Noteagain that EC O- and X-modes are mostly cut off underthese conditions. There is no upper density cutoff forEBWs.
• The phase velocity is almost perpendicular to the externalmagnetic field (k⊥ k‖); the group velocity is generallydifferent from the phase velocity in both magnitude anddirection.
• The wavelength is of the order of the electron gyroradiusρe ≡ vTe/ωce (vTe ≡ √
Te/me is the electron thermalvelocity and Te is the electron temperature in energyunits), i.e.
kρe∼= k⊥ρe ∼ 1. (8)
• EBW characteristics vary significantly depending onwhether it approaches a resonance at the lower harmonic(ω > nωce) or at the higher harmonic (ω < nωce). Inparticular, the perpendicular wave vector is much smallernear the resonance if ω < nωce, where k⊥ρe � 1 andelectromagnetic effects are no longer negligible. Yet, asthe wave approaches the resonance, the power is usuallyabsorbed before the electrostatic approximation becomesinvalid [34].
7 ω < ωUH holds for ω < 2ωce. Higher frequency EBWs can propagate in ararified plasma up to a certain lower electron density limit.
3

Nucl. Fusion 51 (2011) 083050 J Urban et al
• The parallel refractive index N‖ evolves during thepropagation and can be greater than one (unlike O- andX-modes). Depending on the magnetic field topology andthe vertical launch position, the wave parallel index caneither stay close to its initial value, or oscillate aroundzero, or increase/decrease steadily. During the actualEBW propagation, the wave parallel index can changethe regime. In general, waves close to the midplanetend to have a flat or oscillating N‖ [37], while for off-midplane rays N‖ increases or decreases steadily at a rateproportional to the distance from the midplane [19]. Thisproperty forms the basis for controlling EBWs.
EBW propagation in a tokamak plasma is far from trivial andnecessitates a numerical simulation. The ray-tracing techniqueis well suited for EBW propagation since the WKB validityconditions are well fulfilled due to the short wavelength.We employ the AMR code [10, 11] to simulate the EBWpropagation. This code uses a conventional ray-tracing method[38, 39] with an electrostatic kinetic non-relativistic dispersionrelation [40]:
D ≡ 1 +
(ω2
pe
k2v2Te
) (1 +
∑n
ω√2k‖vTe
e−bIn (b) Z (ξn)
)= 0,
(9)where
ξn ≡ ω + nωce√2
∣∣k‖∣∣ vTe
, b ≡(
k⊥vTe
ωce
)2
, (10)
Z is the plasma dispersion function [41] and In is the modifiedBessel function of the first kind. The ray trajectory is then asolution to the Hamiltonian-type equations
dr
dt= −∂� (D)
∂k
/∂� (D)
∂ω,
dk
dt= ∂� (D)
∂r
/∂� (D)
∂ω.
(11)
Equations (11) conserve D = 0 at zeroth order in the parameter (D)/�(D), i.e. in a weak damping approximation.
In this study, we neglect the collisional damping, whichcan, however, be of critical importance, as was previouslyshown by our modelling and by experiments at NSTX [42, 43].Collisional damping is extremely sensitive to edge plasmaconditions, particularly the temperature (or, more precisely,the collision frequency) in the mode-conversion layer. Asthese conditions cannot be sufficiently accurately predicted,we completely ignore the effect of collisions.
By using the non-relativistic electrostatic dispersion (9),we neglect relativistic and transverse electric field effects inthe wave propagation. These effects were studied in [34, 44],and also in [45], where a fully relativistic electromagneticray-tracing code was used. Some differences are seen in theray propagation and in the polarization. These differencesare, however, rather small and would not change the overallpicture of our survey. The fully relativistic approach isalso computationally very intensive and would require anextensive amount of computation time to simulate all casespresented here.
2.3. Wave absorption
In this section, we describe the theory of the EBW absorption.EBWs can be absorbed by resonant electrons, which satisfythe resonance condition
ω − nωce/γ − k‖v‖ = 0, (12)
where γ ≡ (1 − v2/c2)−1/2 is the usual relativisticfactor. While the absorption mechanism—the EC harmonicdamping—is identical to that for O- and X-modes, thepolarization of EBWs is different (quasi-electrostatic), and thisleads to a strong interaction even for low temperatures at anyEC harmonic. In the ray-tracing approach, the wave absorptionis assumed to be weak and can thus be handled independently.This requires the anti-Hermitian part of the dielectric tensorto be much smaller than the Hermitian part, or, alternatively, (D) � �(D).
The zeroth order solution of the dispersion relationleads, as shown in the previous section, to the ray-tracingequations (11). The first-order solution then leads to theradiative transfer equation [38]
dP
dt= ϑ − αP, (13)
where
α ≡ − 2 (D)
|∂� (D) /∂ω| (14)
is the absorption coefficient, ϑ the emissivity and P the raypower. The non-relativistic dispersion function (9) is, however,inappropriate for the damping calculations. For this reason,the ray-tracing code rather employs the weakly relativisticabsorption coefficient by Decker and Ram [34], which is veryfast and sufficiently accurate. Assuming high incident raypower P0, the emissivity can be neglected and the solutionto equation (13) is
P = P0e− ∫ ∞0 α dt . (15)
Since equation (15) provides a linear damping solution, anymodifications to the electron distribution function by thewaves are not taken into account. However, quasilineareffects due to the modified distribution function can play animportant role in EC H&CD. For this reason, we employLUKE—a fully relativistic, bounce-averaged, 3D Fokker–Planck solver [12]—which calculates the evolution of theelectron distribution function for axisymmetric plasmas in thelow-collisionality regime. LUKE particularly accounts forcollisions and quasilinear diffusion due to RF waves. Thecode uses a fully relativistic, parallel momentum conservingcollision operator and a fully implicit 3D time evolutionscheme for a fast convergence to the time-asymptotic solution.It has been verified that the damping profile calculated byLUKE in the low power limit agrees with linear theory [13].
2.4. Simulation model
Our model antenna emits a Gaussian beam, parametrizedby its frequency, beam waist vertical and radial positionsZA, RA and waist radius w0. The beam radius is, in ourcase, calculated from the Rayleigh range, therefore fixing the
4

Nucl. Fusion 51 (2011) 083050 J Urban et al
beam divergence and consequently the beam O–X conversionefficiency (putting aside the variable density scale lengths andthe ωce/ω dependence) for all frequencies.
The antenna angles used in the following simulations areoptimized for the OXB mode conversion, i.e. determined by thecondition (1) for each beam waist position. The average overa single harmonic frequency range (nωce < ω < (n + 1)ωce)
is chosen as the optimum angle for these frequencies ratherthan the optimum evaluated for a particular frequency. Thedifferences in the resulting ray-tracing initial conditions arenegligible and central ray mode-conversion efficiencies do notdrop below 90% in most cases. The launch conditions are alsochecked using AMR’s 1D full-wave calculation [25].
The beam is discretized by a bundle of 16 individualrays. We denote the positions of the intersections of the rayswith the beam waist by r0
i , i = 1 . . . 16. Using a straightline propagation, the intersection of the central ray with theO-mode cutoff is found. At this point, the Gaussian beamsize is calculated and the beam is again discretized by thesame, proportionally scaled 16 ray pattern. We denote theseray spot positions r1
i . The intersections of the straight lines,connecting r0
i and r1i , with the O-mode cutoff surface are
used as the starting points for ray tracing: i.e. we assumestraight propagation of the O-mode from the beam waist tothe O-mode cutoff surface, but still taking the beam divergenceinto account. The initial wave vectors for ray tracing are foundby solving the electrostatic dispersion relation (9) with respectto N⊥, using
N‖0 = N0 · B/B, (16)
where N0 = (r1i − r0
i )/‖r1i − r0
i ‖ is the ray vacuum wavevector and B is evaluated at the O-mode cutoff.
After finding the initial wave vector, the electrostatic raytracing is started. The principal results are the ray trajectoriesand wave vector evolutions. When ray tracing is finished,the outputs are passed to LUKE, along with the magneticequilibrium and plasma profiles. The AMR–LUKE interfacehas been particularly verified to keep all quantities consistent.Moreover, the interface is user friendly and LUKE can belaunched by AMR, and vice versa, by a single option in theconfiguration file.
Finally, LUKE determines a distribution function fql thatis consistent with the quasilinear wave absorption. In additionto the flux-averaged absorbed power density profile Pd(ρ), theflux-averaged EBW-driven current density profile
j‖ (ρ) = −e
⟨∫v‖fql dp3
⟩(17)
is also calculated. Here, 〈·〉 denotes flux surface averaging andρ is a flux surface coordinate based on the poloidal magneticflux ψ :
ρ = ρpol ≡√
ψ − ψaxis
ψLCFS − ψaxis, (18)
where ψaxis and ψLCFS are the poloidal magnetic flux at themagnetic axis and at the last closed flux surface (LCFS),respectively.
Table 1. Fundamental parameters of the target ST scenarios: majorradius R0 (m), minor radius a (m), central toroidal magnetic fieldB0 (T), central electron density ne0 (1019 m−3), central temperatureTe0 (keV), plasma current Ip (MA).
Name R0 a B0 ne0 Te0 Ip Origin
NSTX L-mode 1.0 0.52 0.5 2.6 2.9 0.6 shot 123435NSTX H-mode 1.0 0.5 0.5 3.9 1.4 1.0 shot 130607MAST Upgrade 0.93 0.41 0.78 3.5 2.4 1.2 TRANSPNHTX 1.2 0.37 2.0 20.0 5.7 3.5 TRANSP
3. Simulated scenarios of EBW H&CD
3.1. Fundamental target plasma parameters
As already mentioned in the introduction, EBW H&CD issimulated here in four different target spherical tokamakscenarios, whose fundamental parameters are listed in table 1.As can be seen, the chosen scenarios differ in variousfundamental parameters. Two of them are typical NSTX L- andH-mode experimental discharges, the other two are TRANSP(a plasma transport code) [46] model scenarios of the plannedMAST Upgrade [17] and of NHTX (a potential plasma-facingcomponent test facility).
The midplane radial profiles of the characteristicfrequencies for the target scenarios are plotted in figure 1.The simulated frequency ranges are marked by shaded areas,whose areas delimit the EBW propagation regions, i.e. fromthe UHR at the edge to the cold EC resonance, which istheoretically accessible by N‖ = 0 waves only. Clearly,the plasma is overdense (fpe > nfce) and the first three ECharmonics are inaccessible for O- and X-modes in NSTX andMAST. In NHTX, the third harmonic is more or less accessibleand the corresponding frequency is compatible with present-day gyrotron technology. The first two EC harmonics havebeen selected for NSTX and MAST, as higher harmonics willprobably be overlapping because of the Doppler broadening.The same applies to NHTX, where, however, only the firstharmonic is simulated since the second is only marginallyoverdense and the OXB conversion region occurs in the coreplasma rather than at the plasma edge. Moreover, the highsecond harmonic frequency (∼100 GHz) combined with therelatively long density scale length in the conversion regionsmakes the OXB mode-conversion angular window rathernarrow.
3.2. EBW system parameters
As already shown in numerous previous works (see, e.g.[19, 47]), the propagation path and the N‖ evolution ofEBW rays strongly depends on the vertical launch position.N‖ appears in the resonance condition (12) and can thusinfluence the wave absorption location. Moreover, N‖ isan important factor in the EBW current drive. The verticallaunch position is therefore a crucial parameter of any EBWlauncher, which, in addition to the frequency, can be chosenarbitrarily. The toroidal and poloidal angles must be optimizedfor the conversion efficiency and we can only select negative orpositive initial N‖0. These properties and restrictions dictatethe EBW launcher parameters to be scanned in our survey:wave frequency, vertical launch position and the sign of N‖0.
5

Nucl. Fusion 51 (2011) 083050 J Urban et al
Figure 1. Radial profiles (in the midplane) of the characteristic frequencies for the target scenarios. fpe—electron plasma frequency,fUHR—upper hybrid frequency, nfce—nth EC harmonic. Filled areas represent the simulated frequency ranges.
Table 2. EBW launcher system parameters used in this study.
Scenario First harmonic frequencies (GHz) Second harmonic frequencies (GHz) Vertical launch positions (m)
NSTX L-mode 11, 11.5, 12, 12.5, 13, 14, 15, 16, 17, 18 21, 22, 23, 24, 25, 26, 27, 28, 29, 30 0, 0.1, 0.2, 0.3, 0.4, 0.5NSTX H-mode 12, 12.5, 13, 13.5, 14, 14.5, 15, 16, 17, 18, 19, 20 22, 23, 24, 25, 26, 27, 28, 29, 30 0, 0.1, 0.2, 0.3, 0.4, 0.5MAST-U 19, 20, 21, 22, 23, 24, 25, 26, 28 32, 33, 34, 35, 36, 37, 38, 39, 40, 41 0, 0.1, 0.2, 0.3, 0.4, 0.5, 0.6NHTX 52, 54, 56, 58, 60, 64, 68, 72, 76 none 0, 0.2, 0.4, 0.6, 0.8, 1.0, 1.2
The waves propagate far enough from the plasma top andbottom so that we can assume up–down symmetry. It has beenverified for several cases that the above-midplane launcherpower and current density profiles are symmetric with thebelow-midplane launcher profiles with the opposite sign ofN‖0. In particular,
P(ρ, N‖0, zA) = P(ρ, −N‖0, −zA),
j (ρ, N‖0, zA) = −j (ρ, −N‖0, −zA).(19)
The reason for this is that the flux surfaces are axiallysymmetric with respect to the midplane. As a result, EBW raysbelow and above the midplane are driven in opposite verticaldirections with N‖ having opposite signs. Subsequently, theray paths are symmetric when starting from ±zA with oppositeN‖, and thus resulting in symmetric power deposition profiles.The opposite sign of N‖ then causes a reversal in the drivencurrent direction.
The frequencies and vertical launch positions used in oursurvey are given in table 2. The antenna beam Rayleighrange for all simulations is set to 0.5 m. In figures 2 and3 the maximum Gaussian beam O–X conversion efficienciescalculated from equation (7) for typical target plasma densityscale lengths and the dependence on Ln for various Rayleighranges are shown. The selected zR of 0.5 m is a compromisebetween small beams with poor conversion efficiency and large
beams with high conversion efficiency but presumably widepower deposition profiles.
A launcher that would span the whole parameter rangelisted in table 2 is certainly unrealistic. Multi-frequencysystems are rather challenging—even though such systemsare actively being studied [48]. For these reasons we focusmore on single-frequency systems. A concept of such asystem is sketched in figure 4. This system is designed tohave a vertically movable mirror, which can be rotated in twodimensions (toroidally and poloidally), thus providing variablevertical launch positions with optimum OXB launch anglesat the same time. In-vessel components are shielded fromthe plasma by screens that can either be part of the machinevacuum vessel (the smaller vessel variant) or placed insidea large MAST-like (cylinder) shape vessel (the larger vesselvariant). This system is feasible with present-day technologiesand provides enough flexibility required for an advanced EBWsystem, as will be shown hereinafter.
The principle of using EBW control based on a verticallyadjustable launcher is demonstrated in figure 5. It is clearlyseen that the vertical launch position (in addition to thefrequency) has a major effect on the ray propagation andstrongly influences the location of the power deposition. Wealso notice the typical behaviour of EBW rays: midplane rayswith frequencies for which the cold EC resonance surfaces(typically concave shaped) occur in the inboard half of the
6

Nucl. Fusion 51 (2011) 083050 J Urban et al
Figure 2. Gaussian beam maximum conversion efficiency,equation (7) dependence on zR. The average Ln in themode-conversion region is used; ωce/ω = 0.5.
Figure 3. Gaussian beam maximum conversion efficiency,equation (7) dependence on Ln; ωce/ω = 0.5.
plasma typically propagate straight until they reach the vicinityof a cold EC resonance, where their |N‖| grows exponentiallyand the rays are damped [37]. Rays with lower frequencies,whose cold EC resonance layers appear in the outboard halfwith typically convex shape, oscillate around the midplaneand their N‖ oscillate around zero [37]. Rays launched off-midplane are characterized by steadily and monotonicallyvarying N‖. This behaviour is shown graphically in section 4.2.This results in a significant Doppler shift of the EC frequencyand hence these waves are absorbed quite far from the coldresonance.
4. EBW H&CD performance—numerical results
In this section, we present our result on EBW H&CDperformance in the previously listed scenarios. The modeconversion, which is a well-separable problem, is alwaysassumed to be 100%. There are two fundamental reasonsfor this assumption. First, we would like to focus on EBWpropagation, absorption and current drive. These aspects, aswill be shown hereinafter, are complex enough even whenneglecting the mode conversion. Second, the theoreticaldescription of the mode-conversion process is so complex thatwe can arrive to almost any results depending on which theoriesand processes are considered. Moreover, the knowledge ofthe edge plasma, where the mode conversion occurs, is verylimited.
4.1. Localization and current drive efficiency
The current drive efficiency can be expressed in various ways.The most straightforward and suitable from the experimentaland engineering point of view is the absolute efficiency
η ≡ IRF
P0, (20)
where IRF is the total current driven by the RF waves andP0 is the total injected RF power. However, the currentdrive efficiency unavoidably depends on plasma parameters,particularly the collisionality, and hence a quantity that reflectsthis intrinsic behaviour would be better suited for comparingdifferent plasmas and current drive mechanisms. Commonlyused for EC waves is the normalized efficiency ζ [49], whichscales out the electron density and temperature collisionaleffects and the plasma size. However, ζ does not reflectthe intrinsic effects of particle trapping and effective ioncharge (Zeff). The original definition assumes that the powerdeposition profile is well localized so the plasma parameters(density and temperature) do not change there. This is notalways valid and we therefore use an absorbed power weightedaverage:
ζ ≡ e3
ε20
R0
P0
∫ne (ρ)
Te (ρ)
dIRF
dρdρ. (21)
Here, dIRF is the RF-driven current in a plasma surfaceenclosed by ρ and ρ + dρ flux surfaces. In the numericalsimulations, LUKE selects a ρ-grid (based on the powerdeposition profile) so the volumes become finite:
ϒi ≡ V
(ρi − ρi−1
2,ρi+1 − ρi
2
), (22)
where V (ρ, ρ ′) denotes the plasma volume enclosed by theflux surfaces ρ and ρ ′. ρi are the LUKE grid points. Thediscrete form of (21) is then
ζ = e3
ε20
R0
P0
∑i
ne (ρi)
Te (ρi)Ii
∼= 3.27R0 [m]
P0 [W]
∑i
ne (ρi)[1019 m−3
]Te (ρi) [keV]
Ii [A], (23)
where Ii is the current driven in the poloidal cross-section ofϒi . Note that ζ reflects the sign of the driven current.
In figures 6–9 we show the current drive efficiency ζ
for all plasma and launch scenarios listed in table 2, i.e.for the different frequencies, vertical launch positions andtoroidal injection directions. The classification of the currentdrive mechanism is performed automatically by calculatingthe average (absorbed power weighted) N‖ of the raysand subsequently comparing the LUKE-calculated currentdirection to Ohkawa and Fisch–Boozer current directions. Incertain cases, this leads to ambiguous results, either becausethe rays have mixed signs of N‖ or they are absorbed atdifferent harmonics. The results were obtained by AMR andLUKE coupled simulations with 1 MW incident power. Weimmediately notice the importance of the launch parametersas they strongly influence the location of the wave powerdeposition (which obviously coincides with the driven currentlocation) and the current drive efficiency in a fixed plasmaequilibrium. Clearly, by changing these parameters, we can
7

Nucl. Fusion 51 (2011) 083050 J Urban et al
Figure 4. A possible concept of an EBW launcher system with a vertically movable antenna. The design is sketched for two (existing)vacuum vessel shapes—NSTX-like (spherical) and MAST-like (cylindrical). Two variants are proposed—either inside a larger vessel oroutside a smaller vessel.
Figure 5. Ray trajectories for various frequencies and vertical launch positions for (a) NSTX L-mode, first harmonic, (b) NSTX L-modesecond harmonic, (c) MAST-U first harmonic. Ray trajectories are plotted with solid lines, dashed and dashed–dotted lines show first andsecond cold EC resonance surfaces, respectively.
select a specific scenario—on/off axis deposition at almost anyρ with high/low |ζ |. There is full flexibility in the direction ofthe driven current because of the (a)symmetry (19). EBWsare most flexible and efficient in driving current in NSTXplasmas, mainly because in this case the magnetic field ismonotonic without any magnetic well in the edge region.|ζ | ∼= 0.4 can be reached at almost any radius in NSTX. Ourcurrent drive efficiencies are similar to experimental valuesfrom COMPASS-D [6] or Wendelstein 7-AS [8] as well as tonumerical results obtained for MAST-U [50] or NSTX [51].
While similar efficiencies can be reached using EC X-and O-modes in the central region, the X- and O-mode currentdrive efficiency typically decreases with radius, particularlybecause of trapping effects (see, e.g. [49]), which is not thecase with EBWs. The L-mode plasma parameters cause higherabsolute current drive efficiency, i.e. higher η/ζ . There existseveral significantly higher efficiency second harmonic caseswith ρ ∼= 0.1 (i.e. almost on the magnetic axis) in both L- and
H-modes. Even though the results reported here indicatea limited on-axis accessibility and flexibility, this may notnecessarily hold for slightly different frequencies or launchpositions.
Typically we find that in the central plasma regions wedrive a Fisch–Boozer current [52] while Ohkawa current [53]in edge regions. Higher harmonic absorption, i.e. absorptionon the nth harmonic with nωce > ω, favours the Ohkawamechanism. Typically we can distinguish three EBW efficientcurrent drive regions:
(i) Fisch–Boozer current drive with lower harmonicabsorption predominantly near the centre.
(ii) Ohkawa current drive with lower harmonic absorptionpredominantly near the edge.
(iii) Ohkawa current drive with higher harmonic absorptionpredominantly between the plasma centre and edge (i.e.between the first and second regions).
8

Nucl. Fusion 51 (2011) 083050 J Urban et al
Figure 6. Current drive efficiency ζ (symbols) and η/ζ conversion factor (dashed line) versus ρ, NSTX L-mode first (full symbols) andsecond (open symbols) harmonics, all frequencies and vertical launch positions as listed in table 2, both positive and negative N‖0, 1 MWincident power. Neither the vertical launch position nor the N‖0 sign can be graphically distinguished in the figure.
Figure 7. Same as figure 6, but for the NSTX H-mode.
Figure 8. Same as figure 6, but for the MAST-U plasma.
The location and size of these regions are very different inthe investigated plasmas and these regions typically overlap.There also exist cases when the harmonics are overlapping, i.e.the wave is absorbed on two different EC harmonics. Quite
interestingly, in these cases the current is still driven in onedirection even though the resonant electrons have their v‖res
having different signs. This occurs because the lower harmonicabsorption favours the Fisch–Boozer mechanism (for which
9
Nucl. Fusion 51 (2011) 083050 J Urban et al
Figure 9. Same as figure 6, but for the NHTX plasma.
Figure 10. Current drive efficiency versus the magnitude of themean N‖, for all NSTX L-mode cases, P0 = 1 MW.
v‖res · j < 0), while the higher harmonic absorption favoursthe Ohkawa mechanism (for which v‖res · j > 0).
In going from an NSTX L-mode to an NSTX H-modeto a MAST-U and then to an NHTX plasma, the externalmagnetic field increases together with the appearance ofmagnetic wells near the edge (these wells being caused bystrong edge currents) and we observe a decrease in the currentdrive efficiency, as well a decrease in the flexibility of the EBWabsorption and central plasma accessibility.
4.2. N‖ and quasilinear effects
In order to show the effects of N‖, we calculate its averagevalue (not to be confused with the initial N‖), weighted by theabsorbed power:
⟨N‖
⟩ =
∑i
�P (ϒi)
∑rays, ρ∈ϒi
N‖�Pray(N‖,ρ)∑rays, ρ∈ϒi
�Pray(N‖,ρ)∑i
�P (ϒi). (24)
Figure 10 shows the current drive efficiency versus |〈N‖〉|. Itis found that the two quantities are clearly uncorrelated. As aconsequence of the short wavelength of EBWs (k⊥ρe ∼ 1),the resonant v⊥ is low, irrespective of the value of N‖.The dominant factors in EBW CD efficiency are the N‖-spectrum (mixing of signs), harmonic overlapping (becauseof large |N‖|) and Fisch–Boozer versus Ohkawa effects.
Figure 11. Current drive efficiency versus absolute variance of N‖,for all NSTX L-mode cases, P0 = 1 MW.
Figure 12. Current drive efficiency versus relative variance of N‖,for all NSTX L-mode cases, P0 = 1 MW.
Figures 11 and 12 show the current drive efficiency versus theabsolute and the relative N‖ variance: again, we find no clearcorrelation. There is only a weak (logarithmic) decrease withthe relative variance, starting at ∼0.1. Most of the cases havea rather narrow N‖ spectrum, with absolute variance <0.2 andrelative variance <0.1. NSTX H-mode, MAST-U and NHTXresults show very similar behaviour.
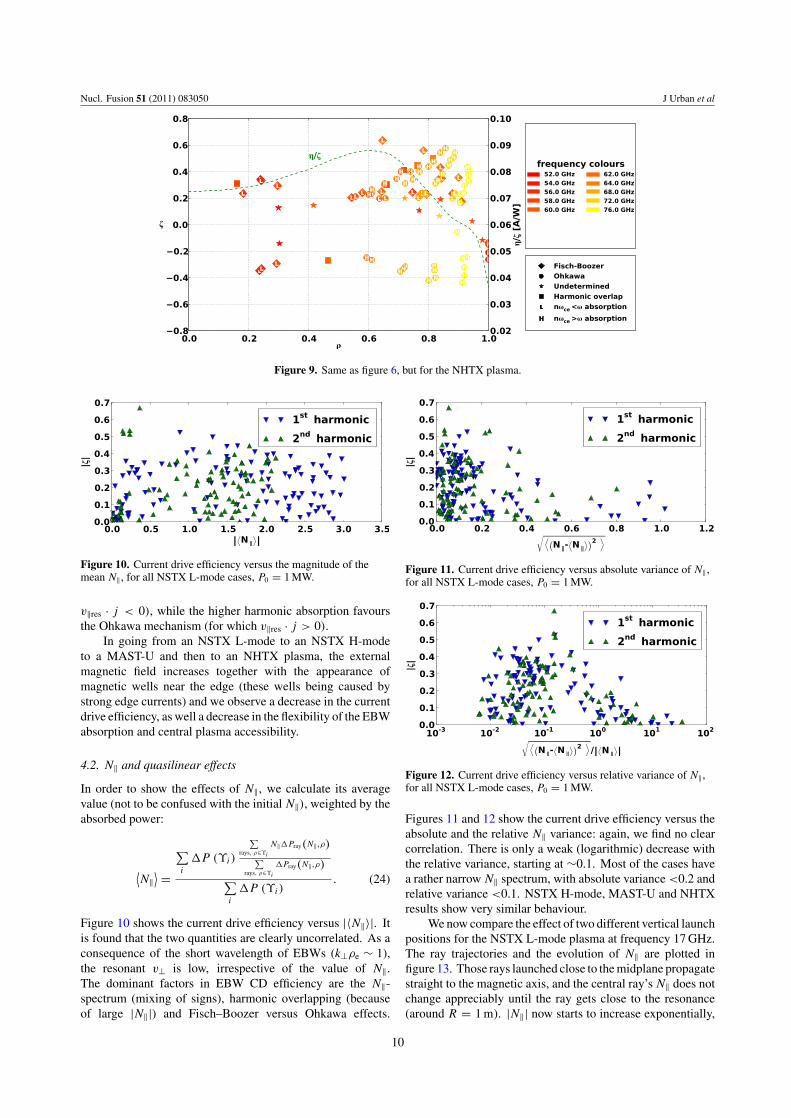
We now compare the effect of two different vertical launchpositions for the NSTX L-mode plasma at frequency 17 GHz.The ray trajectories and the evolution of N‖ are plotted infigure 13. Those rays launched close to the midplane propagatestraight to the magnetic axis, and the central ray’s N‖ does notchange appreciably until the ray gets close to the resonance(around R = 1 m). |N‖| now starts to increase exponentially,
10
Nucl. Fusion 51 (2011) 083050 J Urban et al
Figure 13. Ray trajectories and the evolution of N‖ for two NSTX L-mode cases at 17 GHz with different vertical launch positions: 0 and0.3 m.
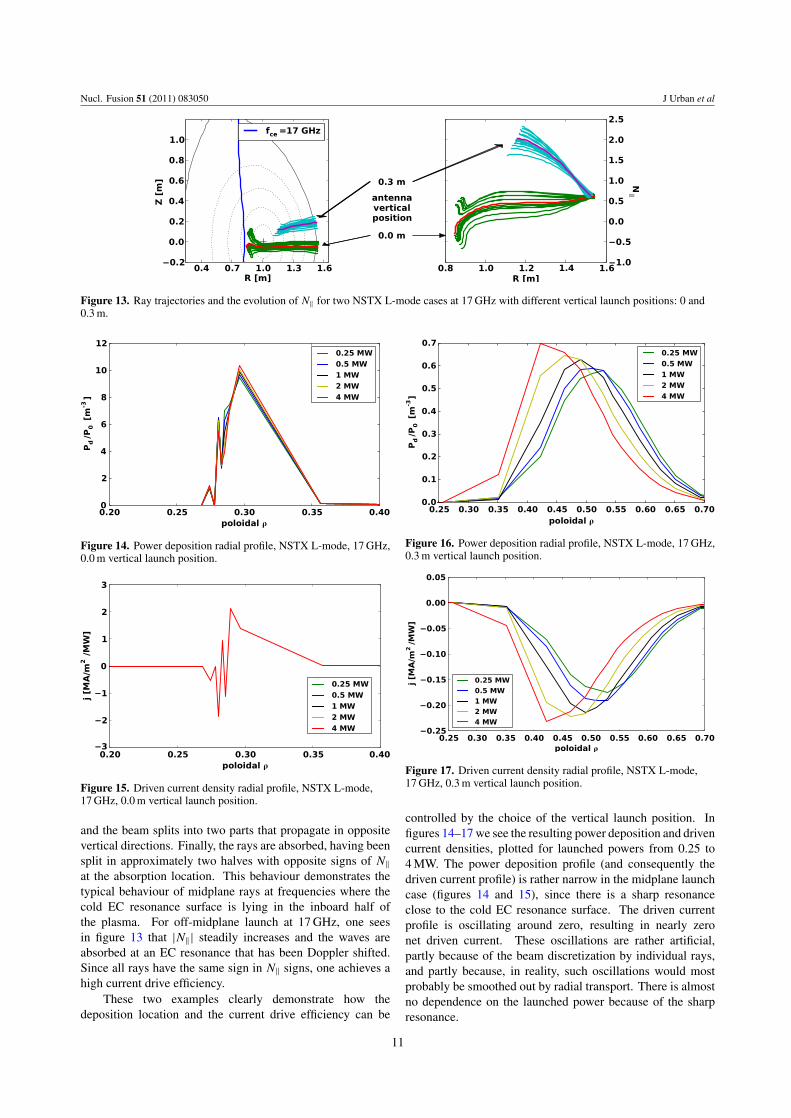
Figure 14. Power deposition radial profile, NSTX L-mode, 17 GHz,0.0 m vertical launch position.
Figure 15. Driven current density radial profile, NSTX L-mode,17 GHz, 0.0 m vertical launch position.
and the beam splits into two parts that propagate in oppositevertical directions. Finally, the rays are absorbed, having beensplit in approximately two halves with opposite signs of N‖at the absorption location. This behaviour demonstrates thetypical behaviour of midplane rays at frequencies where thecold EC resonance surface is lying in the inboard half ofthe plasma. For off-midplane launch at 17 GHz, one seesin figure 13 that |N‖| steadily increases and the waves areabsorbed at an EC resonance that has been Doppler shifted.Since all rays have the same sign in N‖ signs, one achieves ahigh current drive efficiency.
These two examples clearly demonstrate how thedeposition location and the current drive efficiency can be
Figure 16. Power deposition radial profile, NSTX L-mode, 17 GHz,0.3 m vertical launch position.
Figure 17. Driven current density radial profile, NSTX L-mode,17 GHz, 0.3 m vertical launch position.
controlled by the choice of the vertical launch position. Infigures 14–17 we see the resulting power deposition and drivencurrent densities, plotted for launched powers from 0.25 to4 MW. The power deposition profile (and consequently thedriven current profile) is rather narrow in the midplane launchcase (figures 14 and 15), since there is a sharp resonanceclose to the cold EC resonance surface. The driven currentprofile is oscillating around zero, resulting in nearly zeronet driven current. These oscillations are rather artificial,partly because of the beam discretization by individual rays,and partly because, in reality, such oscillations would mostprobably be smoothed out by radial transport. There is almostno dependence on the launched power because of the sharpresonance.
11

Nucl. Fusion 51 (2011) 083050 J Urban et al
Figure 18. Input power scan of current drive efficiency and radiallocation of the current peak for 17 GHz NSTX L-mode cases withpositive initial N‖. Line plots with symbols represent ζ whilesymbols with vertical error bars represent the radial current locationρj max and its width σj (upper and lower limits represent ρj±1). Eachgroup of the cross symbols belongs to one antenna position, and ahorizontal shift is employed to separate the lines visually.
However, in the 0.3 m vertical launch position case(figures 16 and 17), both the power deposition profile andthe current drive profile are much broader. This is due to thestrongly Doppler-shifted absorption with a relatively large N‖spectral width, as well as Doppler broadening effects [34]. Thecurrent is driven in one direction as the sign ofN‖ is identical forall rays. For this case there is power deposition on overlappingEC harmonics. Moreover, this is one of the interesting casesmentioned in the previous section, in which the Fisch–Boozercurrent from the deposition on the lower harmonic and theOhkawa current from the deposition on the higher harmonicare in the same direction.
In this configuration, the power is deposited onsuprathermal electrons [34] and EBW H&CD is thereforestrongly affected by quasilinear effects. Quasilinear flatteningof the distribution function with increasing power levels yieldsa relative reduction of the absorbed power, resulting in a moreinward deposition.
An input power scan for several NSTX L-mode cases ispresented in figures 18 and 19. We find that there is no generaltendency of the current drive efficiency to increase or decreasewith the input power. Cases exist with increasing, decreasingor invariant ζ dependence on input power. However, in mostcases, increasing power leads to either lower or similar currentdrive efficiency. In figures 18 and 19 we also show the currentprofile maximum radial location ρj and its width σj , defined as
ρj max ≡ arg maxρ∈[0,1]
|j (ρ)| , (25)
ρj−1/2 ≡ min{ρ : |j (ρ)| = |j (ρj max)/2| ∧ 0 � ρ < ρjmax},(26)
ρj+1/2 ≡ max{ρ : |j (ρ)| = |j (ρj max)/2| ∧ ρjmax < ρ � 1},(27)
σj ≡ ρj+1/2 − ρj−1/2. (28)
In other words, σj corresponds to the full-width at half-maximum if the current profile is considered single-peaked.Increasing power causes the wave absorption to occur furtheralong the direction of propagation, which can either be towardsthe axis if the absorption occurs on the outboard side or
Figure 19. Same as figure 18, but for negative initial N‖.
away from the axis in the opposite case. This is causedby the quasilinear flattening of the distribution function andconsequently lower absorption rate.
4.3. The effect of Zeff
So far we assumed Zeff = 2, which is a realistic experimentalvalue. However, Zeff can vary and it is very important toshow the effect on EBW performance. We employ here thecases from the previous section and rerun the simulationswith Zeff ranging from 1 to 3. Figure 20 shows the effectof Zeff on the current drive efficiency and the position of thecurrent peak. Zeff affects the electron–ion collision frequencyand particularly pitch-angle scattering. A larger value ofZeff results in faster isotropization of current-carrying fastelectrons. Thus, the current drive efficiency is inverselyproportional to Zeff [52]. The general trend of ζ versus Zeff
is shown in figure 21. Compared to the Zeff = 2 results, theEBW current drive efficiency increases on average by 29% forZeff = 1, while a decrease of 18% is observed for Zeff = 3.There is also a minor effect of Zeff on the EBW depositionlocation, as can be seen in figure 20. This is again causedby the collision frequency change, which affects the plasmaquasilinear response to the wave power.
4.4. Robustness
An important factor of any H&CD system is its robustness—the sensitivity to changes in plasma conditions or in thesystem’s parameters. In the previous section we have alreadyinvestigated what happens if the injected power is changed.Moreover, the effect of changing the vertical launch positioncan be seen in figures 18 and 19; this effect is rather strong andtherefore the vertical launch position must be carefully chosenand controlled. In this section we focus on the EBW H&CDperformance sensitivity to plasma parameters.
In figures 22 and 23 we show the sensitivity of EBWsto plasma electron density and temperature variations in the±50% range. All vertical launch positions and both initial N‖signs of 17 GHz NSTX L-mode cases are used to calculate themedians of absolute location difference �ρj max and relativecurrent drive efficiency and profile widths |�ζ |/|ζ0| and|�σj |/|σj0|, where the 0 subscripts denote results with theoriginal plasma profiles. We first see a monotonic dependenceof all the plotted quantities (except for two cases in |�σj |),
12

Nucl. Fusion 51 (2011) 083050 J Urban et al
Figure 20. Zeff scan of current drive efficiency and radial locationof the current peak for 17 GHz NSTX L-mode cases with negativeinitial N‖, P0 = 1 MW. Line plots with symbols represent ζ whilesymbols with vertical error bars represent the radial current locationρj max and its width σj (similarly to figure 18).
Figure 21. Relative (with respect to Zeff = 2 values, denoted as ζ0)changes of the current drive efficiency versus Zeff for all 17 GHzNSTX L-mode cases with both positive and negative initial N‖,P0 = 1 MW.
indicating a non-chaotic behaviour of EBW performance withchanging plasma profiles. Quantitatively, the radial currentlocation changes fractionally compared with the typical σj ∼0.1. However, very precise localization might be important forcertain applications, in which case a feedback system is highlyadvisable. The median difference in current drive efficiencyis below 5% for less than 25% changes in the plasma profiles,which is very favourable. The current profile width is slightlymore sensitive, a consequence of Doppler broadening. Notshown here are the variances. However, the highest sensitivityis generally observed at lower frequencies, close to a midplanelaunch where the rays tend to oscillate, leading to current driveefficiencies that are typically low. In most cases the results areclose to the median values.
Another parameter that can vary in tokamaks is the plasmacurrent and the toroidal magnetic field. Unlike density andtemperature profiles, which are only crudely pre-programmedand evolve during the discharge, it is typical that the plasmacurrent and toroidal magnetic field do not change during thedischarge (except, of course, in the start-up and shut-downphases) and that their properties are pre-programmed with highconfidence. This makes the demands on the sensitivity on thesequantities less stringent as compared with the temperature and
Figure 22. Medians of absolute current location difference �ρj max
and relative current drive efficiency and current profile widthdifferences versus varying plasma electron density. 17 GHz NSTXL-mode 1 MW cases (similarly to figure 18) are used to calculate themedians.
Figure 23. Same as figure 22, but for varying electron temperature.
the density. In figures 24 and 25 we show the sensitivityof 17 GHz L-mode cases to poloidal and toroidal magneticfield changes. The fields are simply changed by multiplyingthe respective components so that the resulting equilibriumis no longer a solution of the Grad–Shafranov equation.Significantly larger effects of the magnetic field changes onEBW results can immediately be noticed. The sensitivityis particularly high for the toroidal field simply because thetoroidal field is much larger than the poloidal field in mostof the plasma cross-section. Also notice that changing thetotal magnetic field by 10% is similar to changing the heatingfrequency by 1.4 GHz, which is the change in the central ωce.For large magnetic field changes we can even change the ECabsorption harmonic number—e.g. decreasing Btor by 25%shifts 17 GHz into the second harmonic range.
5. Conclusions
By means of coupled ray-tracing and Fokker–Plancksimulations, we have thoroughly investigated electronBernstein wave H&CD prospects for spherical tokamaks. Forthe first time, a simple analytic formula for the O–X conversionefficiency of a Gaussian beam is derived from 1D plane wavetheory. This formula supports our choice of the Rayleighrange as the antenna beam principal parameter that is fixedfor all simulated cases. On an extensive set of EBW launchscenarios with varying frequency, vertical antenna position and
13

Nucl. Fusion 51 (2011) 083050 J Urban et al
Figure 24. Same as figure 22, but for varying poloidal magneticfield.
Figure 25. Same as figure 24, but for varying toroidal magneticfield. Results for Btor − 50% could not be calculated.
toroidal injection angle, we show that EBWs can be absorbedat almost arbitrary radius and that EBWs can drive currentwith efficiencies comparable to electron cyclotron O- or X-modes. Moreover, the efficiency does not change with radius,while typically the efficiency of X- and O-modes decreaseswith radius. The best results in terms of efficiency andflexibility are achieved in NSTX plasmas, where the electroncyclotron frequency radial profiles are monotonic. In general,normalized current drive efficiencies |ζ | on the order of 0.3–0.4 are feasible for all target plasmas, absolute efficiencies thendepend on the plasma parameters as IRF/P0
∼= 0.31ζTe/R0ne,where the units are keV for Te, m for R0 and 1019 m−3 for ne.These results, however, do not reflect the mode-conversionefficiency, which, as we have shown, is limited by the beamdivergence and can be further degraded by other effects.
For EBWs, the initial value of |N‖| is fixed by the mode-conversion process and only the sign of N‖ can be chosen atwill. The evolution of N‖ is determined by the wave frequency,the vertical launch position and by the plasma parameters. Wehave shown how different vertical launch positions stronglyinfluence the N‖ spectrum and consequently the current driveefficiency. However, there seems to be no general correlationbetween the current drive efficiency and the N‖ spectrum andits width.
Input power scans have been performed to investigate thequasilinear effects. Increasing power generally leads to eitherlower or similar current drive efficiency. Higher power alsocauses the wave absorption to occur further along the direction
of propagation, which can either be towards the axis if theabsorption occurs on the outboard side or away from the axisin the opposite case. An important factor is the effectiveion charge, which affects the electron–ion collisionality, and,consequently, the current drive efficiency significantly dependson Zeff . A minor effect of Zeff on the driven current locationcan be observed, which is caused by changing the plasmaquasilinear response.
The sensitivity of EBW H&CD to changes in plasmaparameters has been investigated. It has been shown thatthe EBW performance is rather robust. Neither the currentdrive efficiency nor the radial location changes significantlywhen the electron temperature or density changes moderately.Larger sensitivity is observed for magnetic field changes,especially the (dominant) toroidal field.
In conclusion, the EBW is a promising candidate for apowerful and flexible auxiliary H&CD system for sphericaltokamaks, in many aspects comparable to EC systems forstandard aspect ratio tokamaks. However, several problems,which are not included in this survey, particularly the coupling,need to be addressed and better understood. High-powerexperiments on major spherical tokamaks or similar machineswould be greatly beneficial to tackle these topics and validateour results.
Acknowledgments
This work was supported by the grant no 202/08/0419 of CzechScience Foundation, the Academy of Sciences of the CzechRepublic IRP #AV0Z20430508, the Ministry of Education,Youth and Sports CR #7G10072, US Department of EnergyDE-AC02-09CH11466 and European Communities underthe contract of Association between EURATOM/IPP.CR NoFU07-CT-2007-00060 and under the contract of Associationbetween Euratom and CEA and carried out within theframework of the European Fusion Development Agreement.The views and opinions expressed herein do not necessarilyreflect those of the European Commission.
© Euratom 2011.
References
[1] Prater R. 2004 Phys. Plasmas 11 2349–76[2] Peng Y.K.M. et al 2005 Plasma Phys. Control. Fusion
47 B263–B83[3] Voss G.M., Davis S., Dnestrovskij A., Kirk A., Knight P.J.,
Loughlin M., O’Brien M.H., Sychugov D., Tabasso A. andWilson H.R. 2008 Fusion Eng. Des. 83 1648–53
[4] Kotschenreuther M., Valanju P.M., Mahajan S.M. andSchneider E.A. 2009 Fusion Eng. Des. 84 83–8
[5] Bernstein I.B. 1958 Phys. Rev. 109 10–21[6] Shevchenko V., Baranov Y., O’Brien M. and Saveliev A. 2002
Phys. Rev. Lett. 89 265005[7] Laqua H.P., Erckmann V., Hartfuss H.J. and Laqua H. 1997
Phys. Rev. Lett. 78 3467–70[8] Laqua H.P., Maassberg H., Marushchenko N.B., Volpe F.,
Weller A. and Kasparek W. 2003 Phys. Rev. Lett. 90 075003[9] Kessel C.E. et al 2006 Phys. Plasmas 13 056108
[10] Preinhaelter J., Laqua H.P., Urban J., Vahala L. and Vahala G.2009 Plasma Phys. Control. Fusion 51 125008
[11] Urban J., Preinhaelter J., Diem S.J., Laqua H.P., Pavlo P.,Shevchenko V., Taylor G., Vahala G., Vahala L. and
14

Nucl. Fusion 51 (2011) 083050 J Urban et al
Valovic M. 2009 J. Plasma Fusion Res. Ser. 8 1153–7http://www.jspf.or.jp/JPFRS/PDF/Vol8/jpfrs2009 08-1153.pdf
[12] Decker J. and Peysson Y. 2004 DKE: a fast numerical solverfor the 3-D relativistic bounce-averaged electron driftkinetic equation Report EUR-CEA-FC-1736 (Cadarache:EURATOM/CEA)
[13] Decker J. 2005 Electron bernstein wave current drive modelingin toroidal plasma confinement PhD Thesis (MassachusettsInstitute of Technology, Boston, MA)
[14] Urban J., Decker J., Peysson Y., Preinhaelter J., Taylor G.,Vahala L. and Vahala G. 2009 AIP Conf. Proc. 1187 465–8
[15] Gates D.A. et al 2009 Nucl. Fusion 49 104016[16] Meyer H. et al 2009 Nucl. Fusion 49 104017[17] Stork D. et al 2010 Proc. 23rd Int. Conf. on Fusion Energy
(Daejeon, Korea, 2010) (Vienna: IAEA) CD-ROM fileICC/P5-06 and http://www-naweb.iaea.org/napc/physics/FEC/FEC2010/html/index.htm
[18] Laqua H.P. 2007 Plasma Phys. Control. Fusion 49 R1–42[19] Ram A.K. and Schultz S.D. 2000 Phys. Plasmas 7 4084–94[20] Preinhaelter J. and Kopecky V. 1973 J. Plasma Phys. 10 1–12[21] Preinhaelter J. 1975 Czech J. Phys. 25 39–50[22] Hansen F.R., Lynov J.P., Maroli C. and Petrillo V. 1988
J. Plasma Phys. 39 319–37[23] Mjølhus E. 1984 J. Plasma Phys. 31 7–28[24] Piliya A.D. and Tregubova E.N. 2005 Plasma Phys. Control.
Fusion 47 143–54[25] Urban J. and Preinhaelter J. 2006 J. Plasma Phys. 72 1041–4[26] Ram A.K., Bers A. and Lashmore-Davies C.N. 2002 Phys.
Plasmas 9 409–18[27] Popov A.Y. 2010 Plasma Phys. Control. Fusion 52 035008[28] Shalashov A.G. and Gospodchikov E.D. 2008 Plasma Phys.
Control. Fusion 50 045005[29] Irzak M.A. and Popov A.Y. 2008 Plasma Phys. Control.
Fusion 50 025003[30] Kohn A., Cappa A., Holzhauer E., Castejon F., Fernandez A.
and Stroth U. 2008 Plasma Phys. Control. Fusion50 085018
[31] Gusakov E.Z. and Surkov A.V. 2007 Plasma Phys. Control.Fusion 49 631–9
[32] Xiang N. and Cary J.R. 2008 Phys. Rev. Lett. 100 085002[33] Goldsmith P.F. 1998 Quasioptical Systems: Gaussian Beam,
Quasioptical Propagation and Applications (Piscataway,NJ: IEEE)
[34] Decker J. and Ram A.K. 2006 Phys. Plasmas 13 112503[35] Puri S., Leuterer F. and Tutter M. 1973 J. Plasma Phys.
9 89–100[36] Saveliev A.N. 2007 Plasma Phys. Control. Fusion
49 1061–74[37] Piliya A.D., Popov A.Y. and Tregubova E.N. 2005 Plasma
Phys. Control. Fusion 47 379–94[38] Bornatici M., Cano R., Debarbieri O. and Engelmann F. 1983
Nucl. Fusion 23 1153–257[39] Bernstein I.B. 1975 Phys. Fluids 18 320–4[40] Ginzburg V.L. and Rukhadze A.A. 1975 Volny v
Magnitoaktivnoi Plazme (Moscow: Nauka)[41] Fried B.D. and Conte S.D. 1961 The Plasma Dispersion
Function the Hilbert Transform of the Gaussian (New York:Academic)
[42] Diem S.J., Taylor G., Caughman J.B., Efthimion P.C.,Kugel H., LeBlanc B.P., Phillips C.K., Preinhaelter J.,Sabbagh S.A. and Urban J. 2009 Phys. Rev. Lett.103 015002
[43] Diem S.J. et al 2009 Nucl. Fusion 49 095027[44] Ram A.K., Decker J. and Peysson Y. 2005 J. Plasma Phys.
71 675–93[45] Nelson-Melby E., Harvey R.W., Smirnov A.P. and Ram A.K.
2007 Plasma Phys. Control. Fusion 49 1913–29[46] Hawryluk R.J. 1981 Proc. Int. School of Plasma Physics vol 1
(Varenna: Pergamon) p 19[47] Forest C.B., Chattopadhyay P.K., Harvey R.W. and
Smirnov A.P. 2000 Phys. Plasmas 7 1352–5[48] Wagner D.H. et al 2009 IEEE Trans. Plasma Sci.
37 395–402[49] Petty C.C., Prater R., Lohr J., Luce T.C., Fox W.R.,
Harvey R.W., Kinsey J.E., Lao L.L. and Makowski M.A.2002 Nucl. Fusion 42 1366–75
[50] Shevchenko V. and Saveliev A. 2009 AIP Conf. Proc.1187 457–60
[51] Taylor G., Efthimion P.C., Kessel C.E., Harvey R.W.,Smirnov A.P., Ershov N.M., Carter M.D. and Forest C.B.2004 Phys. Plasmas 11 4733–9
[52] Fisch N.J. and Boozer A.H. 1980 Phys. Rev. Lett.45 720–2
[53] Ohkawa T. 1976 Steady state operation of tokamaksby rf heating Report GA-A13847 (San Diego, CA:General Atomics)
15
Copyright © 2022 FDOKUMEN