Dynamic fracture of inorganic glasses by hard spherical and ...
38
1 Dynamic fracture of inorganic glasses by hard spherical and conical projectiles M. Munawar Chaudhri Cavendish Laboratory, Department of Physics, University of Cambridge, J J Thomson Avenue, Cambridge CB3 0HE, UK Electronic mail: [email protected] Abstract In this article high-speed photographic investigations of the dynamic crack initiation and propagation in several inorganic glasses by the impact of small spherical and conical projectiles are described. These were carried out at speeds of up to ~ 2 x 10 6 frames s -1 . The glasses were fused silica, ‘Pyrex’ (a borosilicate glass), soda-lime and B 2 O 3 . The projectiles were 0.8 to 2 mm diameter spheres of steel, glass, sapphire and tungsten carbide and their velocities were up to 340 m.s -1 . In fused silica and Pyrex spherical projectiles’ impact produced Hertzian cone cracks travelling at terminal crack velocities, whereas in soda-lime glass fast splinter cracks were generated. No crack bifurcation was observed, which has been explained by the nature of the stress intensity factor of the particle-impact-generated cracks, which leads to a stable crack growth. Crack bifurcation was, however, observed in thermally tempered glass; this bifurcation has been explained by the tensile residual stress and the associated unstable crack growth. A new explanation has been proposed for the decrease of the included angle of the Hertzian cone cracks with increasing impact velocity. B 2 O 3 glass showed dynamic compaction and plasticity due to impact with steel spheres. Other observations, such as total contact time, crack lengths, and response to oblique impacts have also been explained. Keywords: Terminal crack velocity; crack bifurcation; high-speed photography; particle impact; fused silica; Pyrex; soda-lime glass; B 2 O 3 ; Hertzian cone crack angle 1. Introduction Inorganic glasses are highly brittle materials and are prone to being damaged when they are subjected to localised contact loading, quasi-static or dynamic, with hard spherical and pointed projectiles. The nature of the ensuing damage depends on whether the contact is elastic or elastic/plastic. Quasi-static loading on a glass specimen can be carried out using a mechanical testing machine, whereas impact loading requires a suitable particle propulsion apparatus. Several investigations of the damage in glass surfaces due to quasi-static loading with hard spheres have been made since the late 19 th century [1-10]. In these studies the most dominant
-
Upload
khangminh22 -
Category
Documents
-
view
0 -
download
0
Transcript of Dynamic fracture of inorganic glasses by hard spherical and ...

1
Dynamic fracture of inorganic glasses by hard spherical and conical projectiles
M. Munawar Chaudhri
Cavendish Laboratory, Department of Physics,
University of Cambridge,
J J Thomson Avenue,
Cambridge CB3 0HE, UK
Electronic mail: [email protected]
Abstract
In this article high-speed photographic investigations of the dynamic crack initiation and
propagation in several inorganic glasses by the impact of small spherical and conical
projectiles are described. These were carried out at speeds of up to ~ 2 x 10⁶ frames s
-1. The
glasses were fused silica, ‘Pyrex’ (a borosilicate glass), soda-lime and B2O3. The projectiles
were 0.8 to 2 mm diameter spheres of steel, glass, sapphire and tungsten carbide and their
velocities were up to 340 m.s-1
. In fused silica and Pyrex spherical projectiles’ impact
produced Hertzian cone cracks travelling at terminal crack velocities, whereas in soda-lime
glass fast splinter cracks were generated. No crack bifurcation was observed, which has been
explained by the nature of the stress intensity factor of the particle-impact-generated cracks,
which leads to a stable crack growth. Crack bifurcation was, however, observed in thermally
tempered glass; this bifurcation has been explained by the tensile residual stress and the
associated unstable crack growth. A new explanation has been proposed for the decrease of
the included angle of the Hertzian cone cracks with increasing impact velocity. B2O3 glass
showed dynamic compaction and plasticity due to impact with steel spheres. Other
observations, such as total contact time, crack lengths, and response to oblique impacts have
also been explained.
Keywords: Terminal crack velocity; crack bifurcation; high-speed photography; particle
impact; fused silica; Pyrex; soda-lime glass; B2O3; Hertzian cone crack angle
1. Introduction
Inorganic glasses are highly brittle materials and are prone to being damaged when they are
subjected to localised contact loading, quasi-static or dynamic, with hard spherical and
pointed projectiles. The nature of the ensuing damage depends on whether the contact is
elastic or elastic/plastic.
Quasi-static loading on a glass specimen can be carried out using a mechanical testing
machine, whereas impact loading requires a suitable particle propulsion apparatus.
Several investigations of the damage in glass surfaces due to quasi-static loading with hard
spheres have been made since the late 19th
century [1-10]. In these studies the most dominant
2
aspect of the damage was the Hertzian cone cracking. Early studies of cone cracking in
inorganic glasses by impact with hard spheres were made by Raman [11], Benerji [12] and
Andrews [13]. Interestingly, all these three authors [i.e. Ref. [11-13]] suggested confidently
that the impact-generated cone cracking was due to the shear stresses. However, this view is
not now generally held and it is widely accepted that cone cracking is due to the surface
radial tensile stress at the circle of contact between the sphere and the target, generated by the
impact.
There are, however, relatively few in situ observations from impact loading of glass
specimens with spherical or pointed projectiles. The main reason for the paucity of such
studies appears to be due to the fact that the total contact time between a test glass surface
and the impinging projectile, 1 to 2 mm in diameter, is only about a couple of microseconds.
Thus, in order to make in situ observations of a small particle impact on a glass surface and
the ensuing damage in the latter, specialised high-speed photographic techniques and particle
propulsion methods are required.
Such high-speed photography techniques have been available in the Cavendish Laboratory
since the 1950s when the Laboratory obtained a Beckman and Whitley Model 189 rotating
mirror high-speed framing camera (Beckman and Whitley Inc., California, USA) capable of
recording images at up to ~ 2 million frames per second (private communication, Dr A. D.
Yoffe, Cavendish Laboratory (1985)). In the early 1970s a particle propulsion system was
designed and constructed [14] in the laboratory, with which it became possible to make
investigations of the impact response of a wide range of inorganic glasses [15-20] and ionic
crystals [21].
The main aims of this study were (a) to investigate the time sequence of the initiation and
growth of the localised damage when small, hard spherical and conical projectiles impact
inorganic glass surfaces normally or obliquely at velocities of up to 300 m.s-1
, (b) to examine
the nature of the damage generated, (c) to measure the velocities of the dynamic cracks, and
(d) to examine the effects of the residual stress in specimens, especially due to thermal
toughening, on the nature of the damage produced.
In this article we describe our experimental work from two ‘anomalous’ and two ‘normal’
glasses. The definitions of ‘normal’ and ‘anomalous’ can be found in Ref.[19]. (Basically, for
normal glasses 1/G.dG/dT is negative, whereas this expression is positive for anomalous
glasses, where G and T are the shear modulus of the glass and the temperature. Moreover, it
is well known that when loaded with a Vickers diamond indenter, normal glasses deform by
genuine shear, but anomalous glasses deform by the process of compaction.) It is shown
below that the particle impact response of anomalous glasses is significantly different from
that of normal glasses. Moreover, the experimental results presented below are also
particularly relevant to the studies of erosion and strength degradation of solids due to solid
particle impact.
2. Theoretical background
(a) Elastic regime
3
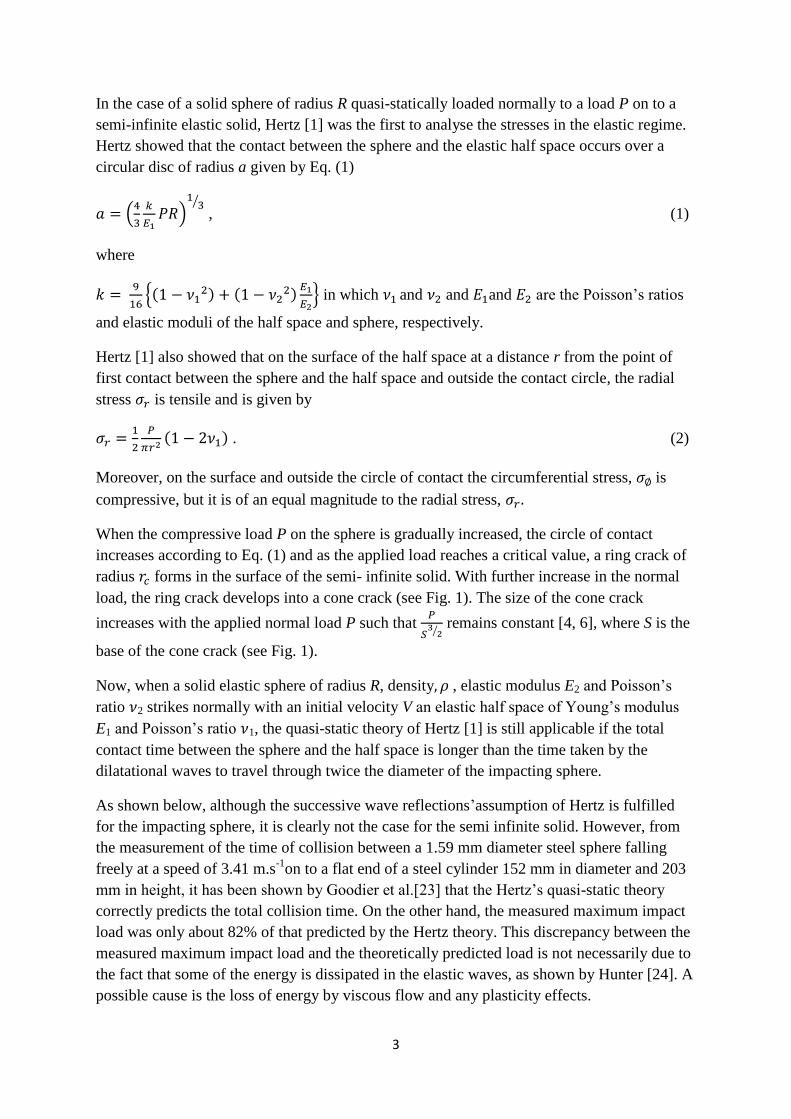
In the case of a solid sphere of radius R quasi-statically loaded normally to a load P on to a
semi-infinite elastic solid, Hertz [1] was the first to analyse the stresses in the elastic regime.
Hertz showed that the contact between the sphere and the elastic half space occurs over a
circular disc of radius a given by Eq. (1)
𝑎 = (4
3
𝑘
𝐸1𝑃𝑅)
13⁄
, (1)
where
𝑘 = 9
16{(1 − 𝜈1
2) + (1 − 𝜈22)
𝐸1
𝐸2} in which 𝜈1 and 𝜈2 and 𝐸1and 𝐸2 are the Poisson’s ratios
and elastic moduli of the half space and sphere, respectively.
Hertz [1] also showed that on the surface of the half space at a distance r from the point of
first contact between the sphere and the half space and outside the contact circle, the radial
stress 𝜎𝑟 is tensile and is given by
𝜎𝑟 =1
2
𝑃
𝜋𝑟2(1 − 2𝜈1) . (2)
Moreover, on the surface and outside the circle of contact the circumferential stress, 𝜎∅ is
compressive, but it is of an equal magnitude to the radial stress, 𝜎𝑟 .
When the compressive load P on the sphere is gradually increased, the circle of contact
increases according to Eq. (1) and as the applied load reaches a critical value, a ring crack of
radius 𝑟𝑐 forms in the surface of the semi- infinite solid. With further increase in the normal
load, the ring crack develops into a cone crack (see Fig. 1). The size of the cone crack
increases with the applied normal load P such that 𝑃
𝑆3
2⁄ remains constant [4, 6], where S is the
base of the cone crack (see Fig. 1).
Now, when a solid elastic sphere of radius R, density, 𝜌 , elastic modulus E2 and Poisson’s
ratio 𝜈2 strikes normally with an initial velocity V an elastic half space of Young’s modulus
E1 and Poisson’s ratio 𝜈1, the quasi-static theory of Hertz [1] is still applicable if the total
contact time between the sphere and the half space is longer than the time taken by the
dilatational waves to travel through twice the diameter of the impacting sphere.
As shown below, although the successive wave reflections’assumption of Hertz is fulfilled
for the impacting sphere, it is clearly not the case for the semi infinite solid. However, from
the measurement of the time of collision between a 1.59 mm diameter steel sphere falling
freely at a speed of 3.41 m.s-1
on to a flat end of a steel cylinder 152 mm in diameter and 203
mm in height, it has been shown by Goodier et al.[23] that the Hertz’s quasi-static theory
correctly predicts the total collision time. On the other hand, the measured maximum impact
load was only about 82% of that predicted by the Hertz theory. This discrepancy between the
measured maximum impact load and the theoretically predicted load is not necessarily due to
the fact that some of the energy is dissipated in the elastic waves, as shown by Hunter [24]. A
possible cause is the loss of energy by viscous flow and any plasticity effects.

4
Ignoring the above discrepancy, according to Hertz [1] the maximum impact-generated load,
Pmax , is given by
𝑃max = (5
3𝜋𝜌)
35⁄
(4
3
𝑘
𝐸1)
−25⁄
𝑅2𝑉6
5⁄ (3)
in which all the variables have been defined in the above.
The theoretical maximum elastic impact mean normal pressure, pm, is given by
𝑝𝑚 =1
𝜋(
5
3𝜋𝜌)
15⁄
(4
3
𝑘
𝐸1)
−45⁄
𝑉2
5⁄ (4)
The total theoretical elastic contact time, telastic, between the impacting sphere and the half
space is given by
telastic = 2.94 [5
4πρ (
1−ν1 2
E1+
1−ν2 2
E2)]
25⁄
R
V1
5⁄ (5)
(b) Elastic/plastic regime
If during the sphere’s impact with the half space, the latter deforms plastically, then Hertz’s
equations (1-5) are no longer applicable and a different set of equations as, for example, that
developed by Yoffe [25], comes into play. According to Yoffe’s model, the new stress field is
a combination of the Boussinesq field [26] due to a point loading on the surface of the half
space and a localized field due to the plastically deformed zone (or densified/compacted zone
in the case of some glasses).Yoffe [25] named this localized field as the ‘blister’ field, named
so as the plastically deformed zone causes ‘discomfort’ similar to that caused by a blister.
Note that the blister field varies as 1
𝑟3 and thus it is a local one (it may also be noted that the
stress field due to the expanding cavity model is also a local one and cannot be applied to the
loading of an indenter on a surface of an elastic/plastic solid [25]). The strength of the blister
field B (see Eq. (6) below) is dependent upon the maximum applied load, the capability of the
half space to be compacted, and the geometrical shape of the impacting particle. The value of
B can be determined, as shown by Chaudhri [27]. Taking the z-axis along the particle’s load
axis (also for this direction of z-axis, 𝜃 = 0 and 𝜃 =𝜋
2 along the loaded surface), the various
principal stresses at a distance r from the initial point of contact in spherical coordinates
during the loading under an applied load P are
𝜎𝑟 =𝑃
4𝜋𝑟2(1 − 7 cos 𝜃) +
𝐵
𝑟3(19(cos 𝜃)2 − 7) (6a)
𝜎𝜃 = 𝑃
4𝜋𝑟2(
(cos 𝜃)2
1+cos 𝜃) −
𝐵
𝑟3(cos 𝜃)2 (6b)
𝜎∅ = 𝑃
4𝜋𝑟2 (cos 𝜃 − 1
1+cos 𝜃) +
𝐵
𝑟3(2 − 3(cos 𝜃)2) (6c)
On the surface z = 0 and 𝜃 =𝜋
2. Therefore, Eqs. (6 a-c) become
5
𝜎𝑟,𝜋
2 =
𝑃
4𝜋𝑟2 −7𝐵
𝑟3 (7a)
𝜎𝜃,𝜋
2= 0 (7b)
𝜎∅,𝜋
2= −
𝑃
4𝜋𝑟2 +2𝐵
𝑟3 (7c).
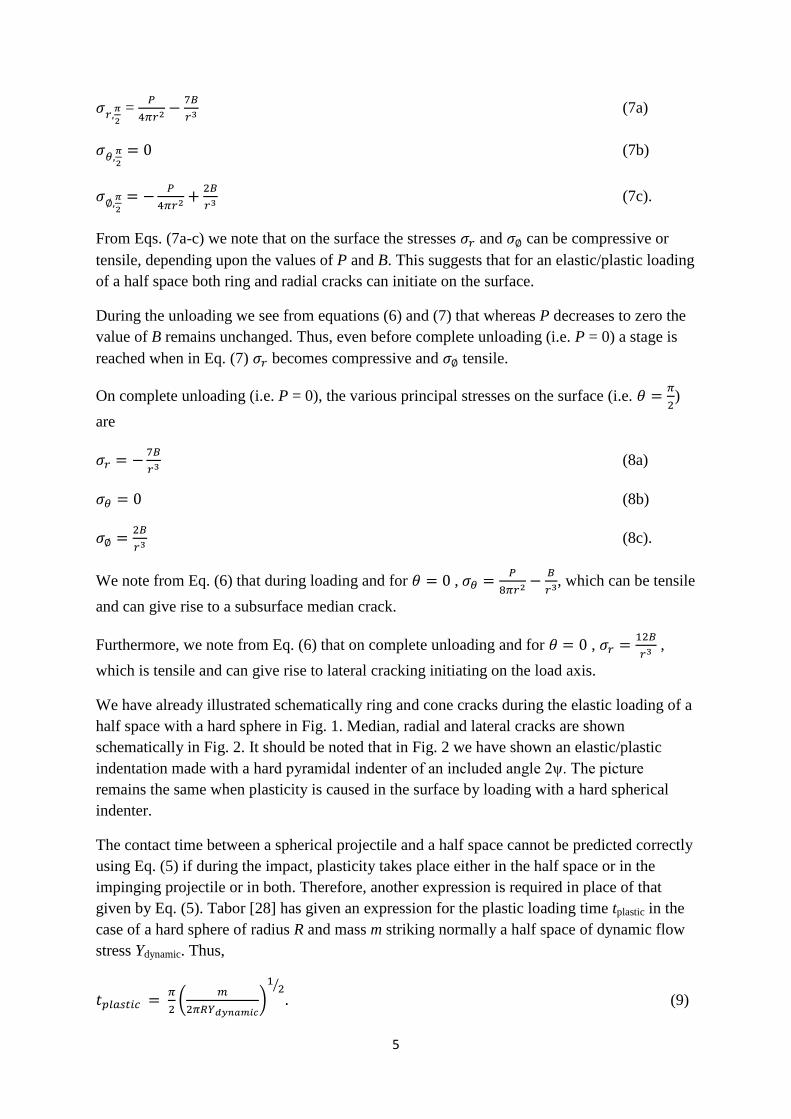
From Eqs. (7a-c) we note that on the surface the stresses 𝜎𝑟 and 𝜎∅ can be compressive or
tensile, depending upon the values of P and B. This suggests that for an elastic/plastic loading
of a half space both ring and radial cracks can initiate on the surface.
During the unloading we see from equations (6) and (7) that whereas P decreases to zero the
value of B remains unchanged. Thus, even before complete unloading (i.e. P = 0) a stage is
reached when in Eq. (7) 𝜎𝑟 becomes compressive and 𝜎∅ tensile.
On complete unloading (i.e. P = 0), the various principal stresses on the surface (i.e. 𝜃 =𝜋
2)
are
𝜎𝑟 = −7𝐵
𝑟3 (8a)
𝜎𝜃 = 0 (8b)
𝜎∅ =2𝐵
𝑟3 (8c).
We note from Eq. (6) that during loading and for 𝜃 = 0 , 𝜎𝜃 =𝑃
8𝜋𝑟2 −𝐵
𝑟3, which can be tensile
and can give rise to a subsurface median crack.
Furthermore, we note from Eq. (6) that on complete unloading and for 𝜃 = 0 , 𝜎𝑟 =12𝐵
𝑟3 ,
which is tensile and can give rise to lateral cracking initiating on the load axis.
We have already illustrated schematically ring and cone cracks during the elastic loading of a
half space with a hard sphere in Fig. 1. Median, radial and lateral cracks are shown
schematically in Fig. 2. It should be noted that in Fig. 2 we have shown an elastic/plastic
indentation made with a hard pyramidal indenter of an included angle 2ψ. The picture
remains the same when plasticity is caused in the surface by loading with a hard spherical
indenter.
The contact time between a spherical projectile and a half space cannot be predicted correctly
using Eq. (5) if during the impact, plasticity takes place either in the half space or in the
impinging projectile or in both. Therefore, another expression is required in place of that
given by Eq. (5). Tabor [28] has given an expression for the plastic loading time tplastic in the
case of a hard sphere of radius R and mass m striking normally a half space of dynamic flow
stress Ydynamic. Thus,
𝑡𝑝𝑙𝑎𝑠𝑡𝑖𝑐 = 𝜋
2(
𝑚
2𝜋𝑅𝑌𝑑𝑦𝑛𝑎𝑚𝑖𝑐)
12⁄
. (9)
6
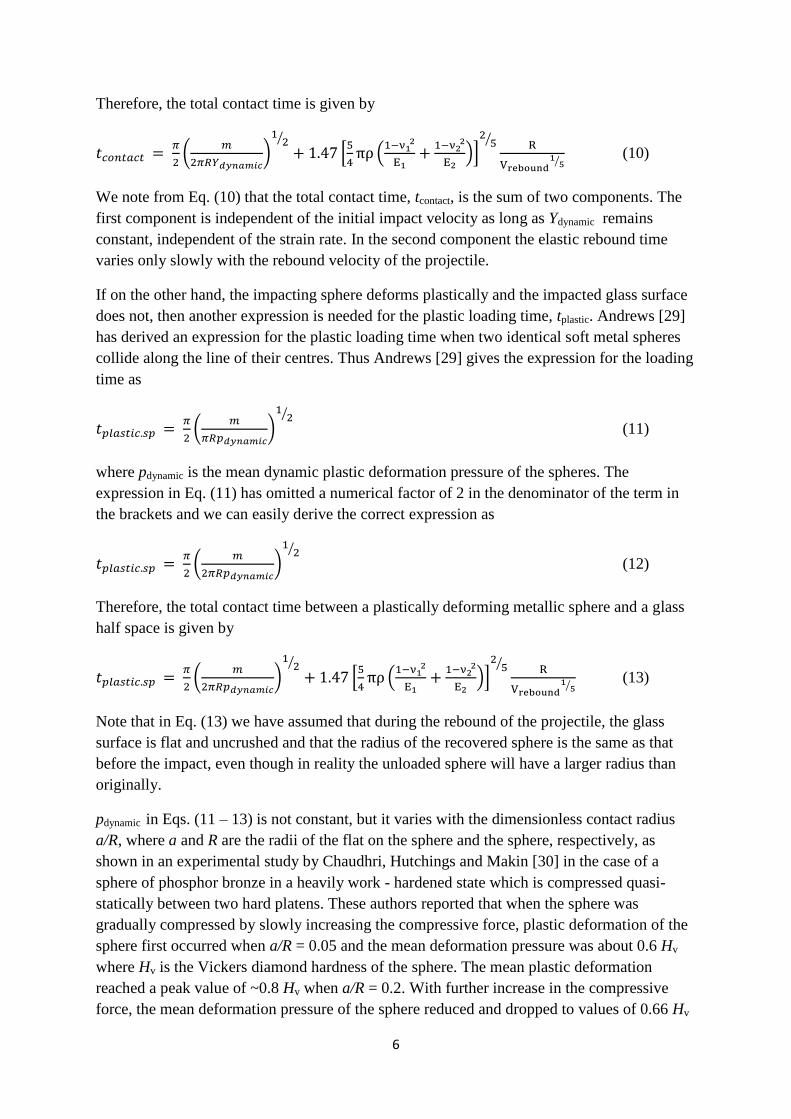
Therefore, the total contact time is given by
𝑡𝑐𝑜𝑛𝑡𝑎𝑐𝑡 = 𝜋
2(
𝑚
2𝜋𝑅𝑌𝑑𝑦𝑛𝑎𝑚𝑖𝑐)
12⁄
+ 1.47 [5
4πρ (
1−ν1 2
E1+
1−ν2 2
E2)]
25⁄
R
Vrebound1
5⁄ (10)
We note from Eq. (10) that the total contact time, tcontact, is the sum of two components. The
first component is independent of the initial impact velocity as long as Ydynamic remains
constant, independent of the strain rate. In the second component the elastic rebound time
varies only slowly with the rebound velocity of the projectile.
If on the other hand, the impacting sphere deforms plastically and the impacted glass surface
does not, then another expression is needed for the plastic loading time, tplastic. Andrews [29]
has derived an expression for the plastic loading time when two identical soft metal spheres
collide along the line of their centres. Thus Andrews [29] gives the expression for the loading
time as
𝑡𝑝𝑙𝑎𝑠𝑡𝑖𝑐.𝑠𝑝 = 𝜋
2(
𝑚
𝜋𝑅𝑝𝑑𝑦𝑛𝑎𝑚𝑖𝑐)
12⁄
(11)
where pdynamic is the mean dynamic plastic deformation pressure of the spheres. The
expression in Eq. (11) has omitted a numerical factor of 2 in the denominator of the term in
the brackets and we can easily derive the correct expression as
𝑡𝑝𝑙𝑎𝑠𝑡𝑖𝑐.𝑠𝑝 = 𝜋
2(
𝑚
2𝜋𝑅𝑝𝑑𝑦𝑛𝑎𝑚𝑖𝑐)
12⁄
(12)
Therefore, the total contact time between a plastically deforming metallic sphere and a glass
half space is given by
𝑡𝑝𝑙𝑎𝑠𝑡𝑖𝑐.𝑠𝑝 = 𝜋
2(
𝑚
2𝜋𝑅𝑝𝑑𝑦𝑛𝑎𝑚𝑖𝑐)
12⁄
+ 1.47 [5
4πρ (
1−ν1 2
E1+
1−ν2 2
E2)]
25⁄
R
Vrebound1
5⁄ (13)
Note that in Eq. (13) we have assumed that during the rebound of the projectile, the glass
surface is flat and uncrushed and that the radius of the recovered sphere is the same as that
before the impact, even though in reality the unloaded sphere will have a larger radius than
originally.
pdynamic in Eqs. (11 – 13) is not constant, but it varies with the dimensionless contact radius
a/R, where a and R are the radii of the flat on the sphere and the sphere, respectively, as
shown in an experimental study by Chaudhri, Hutchings and Makin [30] in the case of a
sphere of phosphor bronze in a heavily work - hardened state which is compressed quasi-
statically between two hard platens. These authors reported that when the sphere was
gradually compressed by slowly increasing the compressive force, plastic deformation of the
sphere first occurred when a/R = 0.05 and the mean deformation pressure was about 0.6 Hv
where Hv is the Vickers diamond hardness of the sphere. The mean plastic deformation
reached a peak value of ~0.8 Hv when a/R = 0.2. With further increase in the compressive
force, the mean deformation pressure of the sphere reduced and dropped to values of 0.66 Hv

7
and 0.42 Hv for a/R values of 0.4 and 0.6, respectively. We assume that in our impact
experiments the plastic deformation behaviour of the steel spheres was similar to the response
of the phosphor bronze sphere. In our impact experiments with steel spheres (see below),
plasticity of the spheres occurred at an impact velocity of greater than 80 m.s-1
and for impact
velocities in the range 200 to 250 m.s-1
the values of the dimensionless radius a/R were in the
range 0.6 to 0.65, which correspond to dynamic loads of 1170 and 1330 N, respectively.
3. Experimental
The projectile impact experiments were carried out on optically polished blocks of pure fused
silica (Vitreosil, Thermal Syndicate Ltd. UK), of size 50 mm x 25 mm x 10 mm, Pyrex (a
borosilicate glass trademark, Corning Glass, USA) of size 50 mm x 50 mm x 25 mm, soda –
lime glass (Pilkington, UK) of size 50 mm x 50 mm x 25 mm, and B2O3, which was prepared
in the laboratory [19]. Blocks of this glass of size 20 mm x 10 mm x 10 mm were prepared
and polished to a good optical finish just before carrying out experiments on them. This was
necessary in order to reduce the interaction of the atmosphere with the glass surfaces, which
made them translucent and, therefore, difficult to see through clearly. Fused silica and Pyrex
glass are anomalous glasses, whereas soda-lime and B2O3 glasses are normal types [19].
The projectiles were 0.8 and 1.0 mm diameter hardened steel spheres, 1 mm diameter soda-
lime glass spheres, 1 mm diameter synthetic ruby spheres, 1 and 2 mm diameter tungsten
carbide spheres, and tungsten carbide cones of an included angle of 90˚ and a base of 1 mm
diameter. The apex of the tungsten carbide cones was ~ 10 µm in diameter, but the surface of
the cones was not shiny, as they were made by grinding 1 mm diameter tungsten carbide rods
with a fine diamond wheel. The cones were then cut off from the rods, using a fine diamond
saw. The surface of the steel, tungsten carbide and ruby spheres was of an optical quality,
whereas the surface roughness of the glass spheres was ~ 1 µm. The surface roughness of the
tungsten carbide cones was also about 1 µm. Some relevant physical properties of the various
projectiles and glass blocks are given in Table 1.
The projectiles were propelled at velocities of up to 300 m.s-1
. In most cases the projectiles
impacted the targets (i.e. glass blocks) at normal incidence, but in some cases we also
investigated oblique impacts. An explosive gun [14] was used for the propulsion of the
projectiles. In order to observe in situ the process of impact and ensuing fractures during the
various stages of an impact, a high-speed framing camera (Beckman and Whitley model 189,
Beckman and Whitley Inc. California, USA) working at framing speeds of up to 1.7 x 10⁶
frames per second was used. A schematic diagram of the experimental arrangement used can
be found in Ref. [15]. A 35 mm HP5 (Ilford) film was used in the camera. Some
photographic sequences were recorded on Kodak VR 1000 colour film (1000 ASA). The
event was back-lit with the flash (duration: ~135 - 140 µs) from a Xenon-filled FA 5 flash
tube. In the photographs, this arrangement made the cracks look dark.
8
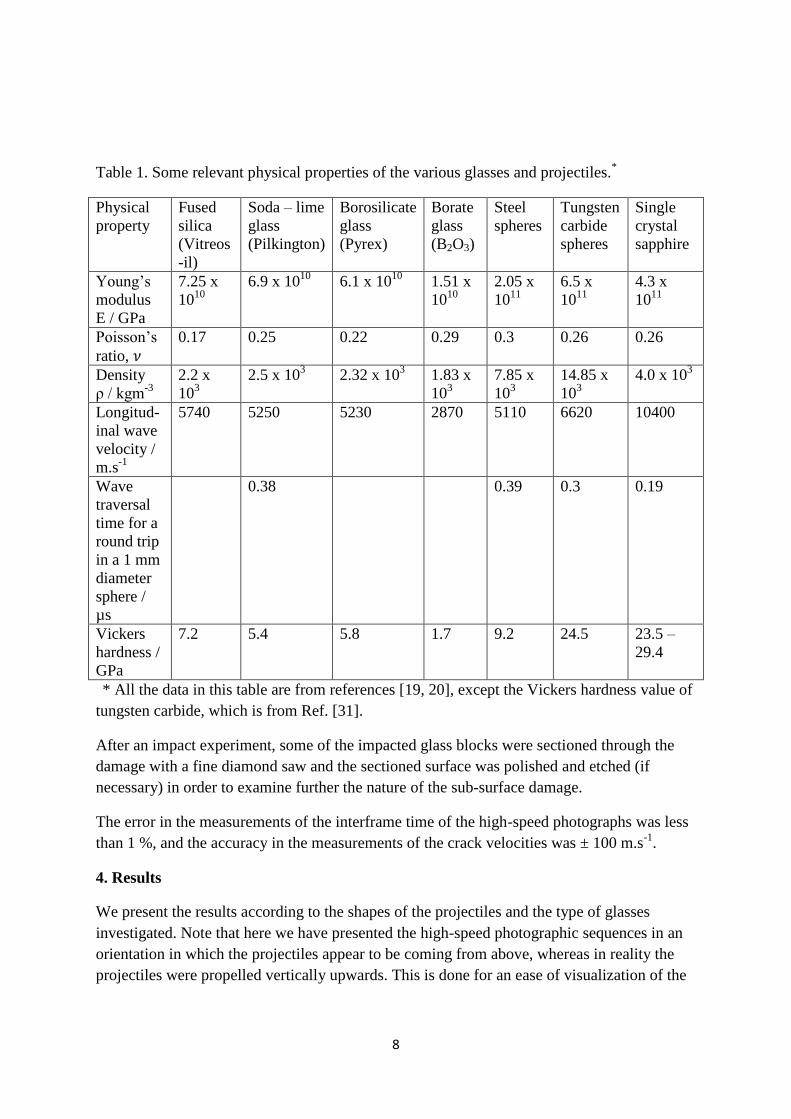
Table 1. Some relevant physical properties of the various glasses and projectiles.*
Physical
property
Fused
silica
(Vitreos
-il)
Soda – lime
glass
(Pilkington)
Borosilicate
glass
(Pyrex)
Borate
glass
(B2O3)
Steel
spheres
Tungsten
carbide
spheres
Single
crystal
sapphire
Young’s
modulus
E / GPa
7.25 x
1010
6.9 x 10¹⁰
6.1 x 10¹⁰
1.51 x
1010
2.05 x
1011
6.5 x
1011
4.3 x
1011
Poisson’s
ratio, 𝜈
0.17 0.25 0.22 0.29 0.3 0.26 0.26
Density
ρ / kgm-3
2.2 x
103
2.5 x 10³
2.32 x 10³
1.83 x
103
7.85 x
103
14.85 x
103
4.0 x 10³
Longitud-
inal wave
velocity /
m.s-1
5740 5250 5230 2870 5110 6620 10400
Wave
traversal
time for a
round trip
in a 1 mm
diameter
sphere /
µs
0.38 0.39 0.3 0.19
Vickers
hardness /
GPa
7.2 5.4 5.8 1.7 9.2 24.5 23.5 –
29.4
* All the data in this table are from references [19, 20], except the Vickers hardness value of
tungsten carbide, which is from Ref. [31].
After an impact experiment, some of the impacted glass blocks were sectioned through the
damage with a fine diamond saw and the sectioned surface was polished and etched (if
necessary) in order to examine further the nature of the sub-surface damage.
The error in the measurements of the interframe time of the high-speed photographs was less
than 1 %, and the accuracy in the measurements of the crack velocities was ± 100 m.s-1
.
4. Results
We present the results according to the shapes of the projectiles and the type of glasses
investigated. Note that here we have presented the high-speed photographic sequences in an
orientation in which the projectiles appear to be coming from above, whereas in reality the
projectiles were propelled vertically upwards. This is done for an ease of visualization of the

9
impact and the ensuing damage. Moreover, in the sequences the various crack systems have
been identified with reference to Figs. 1 and 2.
(a) The impact of spherical projectiles on anomalous glasses
A general observation from the impact experiments on anomalous glasses was that for all
impact velocities used, Hertzian cone cracks formed in both fused silica and Pyrex glasses.
However, in both these glasses the included angles of the cone cracks formed were
significantly smaller than the included angles of the cones formed under quasi – static
loading.
A sequence of high-speed photographs of the impact of a 1 mm diameter steel sphere at
normal incidence on a block of Pyrex glass at 160 m.s-1
is shown in Fig. 3. The impact occurs
between frames 2 and 3 and the ensuing cracks in the Pyrex glass block formed about 0.1 to
0.2 µs before frame 3. The uncertainty in the moment of contact is due to the fact that at a
framing rate of 1µs per frame the exposure time of each frame is 1/6th
of the inter-frame time.
It will be seen in frame 3 that a cone crack of a semi-included angle of 43.5˚ has already
formed just below the contact between the projectile and the glass and its length, as measured
along the skirt of the cone, is approximately 0.35 mm. Therefore, the velocity of this cone
crack is 3500 to 1800 m.s-1
. In frame 4 the cone crack has already reached the bottom of the
frame, which means that between frames 3 and 4 the cone crack velocity is at least 2500
m.s-1
. Note that the included angle of the cone crack remains the same as the angle in frame
3. It will also be seen from frame 4 that on the left of the impact site a radial crack, R, has
formed. Another point to note is that in this frame the cone crack appears dark, which means
that the flanks of the cone crack are slightly lifted upwards relative to the impacted surface,
which reduces the transmission of the light from the flash tube. However, in the very next
frame the flanks of the cone crack start closing up with the result that more light is
transmitted through the crack system. We estimate that the sphere leaves the surface of the
Pyrex block about 0.1 µs before frame 5, thus giving a total contact time of about 2 µs. Note
also that during the rebound of the sphere a lateral crack has opened up on the left of the
impact site, but the radial crack, R, has closed up, not healed. Moreover, the flanks of the
cone crack have risen up again, resulting in reduced transmission of light. The opening and
closing of the flanks of the cone crack continues at a frequency of 5 x 10⁵ s
-1 up to at least
frame 10.
We also note from frames 8 to 10 that following behind the rebounding sphere, some broken
up glass is thrown normally upwards from the impact site at ~ 70 m.s-1
. The rebound velocity
of the sphere is 120 m.s-1
.
A photographic sequence, taken at a framing rate of 1.7 x 10⁶ frames per second, of the
formation and growth of damage in another anomalous glass, namely fused silica, when it
was impacted normally with a 1 mm diameter tungsten carbide sphere at a velocity of 200
m.s-1
can be found in Ref. [18]. In this case both cone and median cracks travelling at a
maximum velocity of (2350 ± 40) m.s-1
formed and developed. This crack velocity is about
10
10 % higher than the maximum crack velocity reported by Schardin [32] from his tensile
experiments. In our experiments we did not observe any crack bifurcation.
(b) Normal glasses
In this section we shall give two examples from normal glasses. Fig. 4 shows a sequence of
photographs when a polished block of soda-lime glass is impacted at normal incidence with a
0.8 mm diameter steel sphere at a velocity of 300 m.s-1
. The impact occurs 0.6 µs after frame
1. This immediately leads to the creation of jets of fine debris of glass particles travelling in
the air at speeds of up to 600 – 700 m.s-1
. Within the glass block itself fast finger-like cracks
travelling at ~ 1500 m.s-1
are generated. From this sequence of photographs it is not clear
whether any cone cracks are formed before the generation of the finger – like cracks.
However, other photographic sequences have shown that when a 2 mm diameter tungsten
carbide sphere impacted a block of soda – lime glass at normal incidence at a velocity of 130
m.s-1
, first a cone crack is formed which is rapidly followed by fast finger – like cracks (or
splinter cracks) (sequence not shown here).
In frame 3 of Fig. 4 a median crack, M, is shown along the load axis. Although in this frame
the glass debris obscures the impacting sphere, it appears that the sphere has begun its
rebound with the formation of lateral cracks (see at L in frame 3). The lateral cracks continue
to grow in frames 4 and 5. When some of these lateral cracks reach the impacted surface,
chips of the detached glass are formed. One such a chip is shown in frame 12, which is about
11 µs after the initial impact.
The second example showing the response of another normal glass to impact with a spherical
projectile is presented in Fig. 5. Here a 1 mm diameter steel sphere impacts at normal
incidence a block of the B2O3 glass at a velocity of 150 m.s-1
. The contact between the sphere
and the B2O3 block occurs in frame 3. No cracks appear to form during the loading period,
but some densification takes place, which can be seen at the arrow in frame 3. In fact, within
this densified zone two white arcs appear. A possible cause for the appearance of the arcs
may be the refraction of the transmitted light through the densified zone. Unloading begins
between frames 4 and 5 and several radial and lateral cracks form (see frame 5), which
continue to grow for another µs after the sphere has left the surface of the glass block (see at
L in frame 6). It will also be seen that in frame 5 a dark protrusion has just appeared on the
glass surface around the contact during the unloading (i.e. rebound) of the sphere. This dark
protrusion is, in fact, a ring of detached B2O3, which leaves the impact surface in a direction
normal to it at a velocity of 135 m.s-1
and a dent is left behind in the glass surface. This
rebound velocity of the sphere is relatively high, being about 85% of the incident velocity.
This relatively high rebound velocity is reasonable, as little or no loss of energy occurs
because of the absence of any cracking during the loading part of the impact.
It is interesting to mention that if B2O3 is mixed with 32.5 % by weight of Na2O, the response
of the resulting glass is quite similar to that of soda-lime glass [19].
11
(c) Variation of the Hertzian cone angle with the projectile impact velocity
Previously [16], we reported that the included angle of the Hertzian cone crack in Pyrex glass
decreased with increasing impact velocity with the 1.0 and 0.8 mm diameter hardened steel
projectiles. For example, the semi - included angles of the Hertzian cones in Pyrex for impact
velocities of ~ 95 and 240 m.s-1
were 55˚ and 35˚, respectively. The semi included angle of
the Hertzian cone crack in Pyrex produced by quasi-static loading with a hard sphere is 62.5˚.
Our experiments have shown that both soda – lime glass and fused silica glass also show a
similar response. However, we are not certain if impacts at velocities greater than 180 m.s-1
produce any Hertzian cone cracks in soda – lime glass. On the other hand, in fused silica,
cone cracks formed up to the highest impact velocity of 320 – 340 m.s-1
studied. Fig. 6 (a – c)
shows some typical Hertzian cones in blocks of fused silica produced by impacts with 1 mm
diameter steel spheres at velocities of (a) 25, (b) 155, and (c) 310 m.s-1
. The semi-included
angles at these velocities were measured to be 68.5˚, 46˚, and 32.5˚, respectively. It would be
interesting to see if Hertzian cone cracks still form in fused silica and Pyrex when 1 mm
diameter steel spheres impacted blocks of these glasses at 500 m.s-1
.
Hertzian cone angle variation with impact velocity was also observed for the fused silica with
1 mm diameter projectiles of soda – lime glass and sapphire. Collective data are shown in
Fig. 7. In this figure the solid line is drawn through the steel sphere data points. The points
corresponding to the glass projectiles lie above the line, whereas those due to the sapphire
projectiles agree with those for the steel projectiles up to impact velocities of 170 m.s-1
,
above which the Hertzian cones are narrower with the sapphire projectiles. Fig. 7 also shows
the experimental quasi – static value of (62.8˚ ± 1.2˚) for the Hertzian cones produced by a 1
mm diameter steel spheres (It may be remarked that the theoretical semi – included angle of
the Hertzian cone crack in fused silica for ν = 0.17 is ~ 53˚, which is considerably smaller
than the experimental value. Interestingly, this problem also exists in the case of the Hertzian
cone cracks in soda – lime glass. So far, no satisfactory explanation of this discrepancy has
been put forward.).
(d) Oblique impact of tungsten carbide spheres on blocks of soda-lime glass
Quite frequently, the impact angle between a target surface and a projectile is not along the
surface normal to the impacted block. In such a situation what is the nature of the damage
produced by a projectile impact? To investigate this question, 2 mm diameter tungsten
carbide projectiles were propelled on to blocks of polished soda lime glass at several angles
to the surface normal at impact velocities in the range of 125 – 150 m.s-1
and the ensuing
damage was photographed at 106 frames s
-1. It was found that the main characteristics of the
damage were quite similar to those produced by normal impacts. However, there was one
significant difference; for oblique impacts the resulting Hertzian cone cracks were not
oriented symmetrically to the target’s surface normal. In fact, it was found that as the angle of
impact decreased from 90˚ (i.e. being along the surface normal), that between the axis of the
resulting Hertzian cone fracture and the normal to the impact surface increased in the
projectile’s forward direction.
12
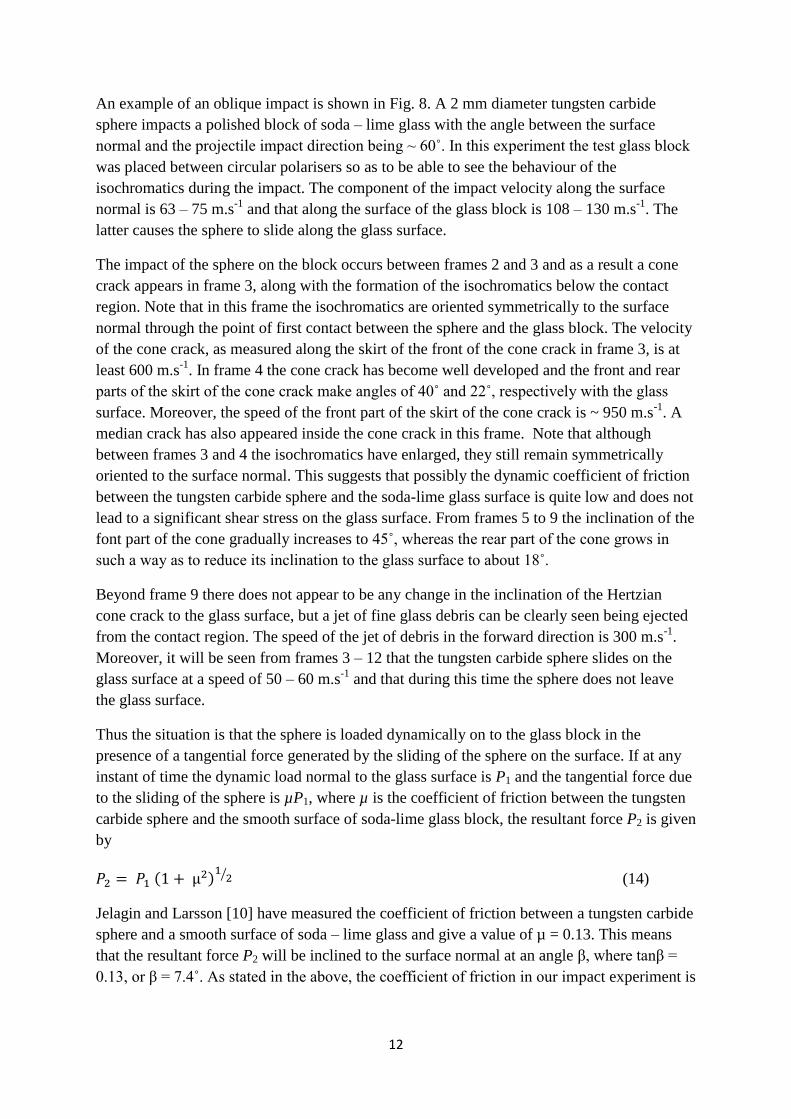
An example of an oblique impact is shown in Fig. 8. A 2 mm diameter tungsten carbide
sphere impacts a polished block of soda – lime glass with the angle between the surface
normal and the projectile impact direction being ~ 60˚. In this experiment the test glass block
was placed between circular polarisers so as to be able to see the behaviour of the
isochromatics during the impact. The component of the impact velocity along the surface
normal is 63 – 75 m.s-1
and that along the surface of the glass block is 108 – 130 m.s-1
. The
latter causes the sphere to slide along the glass surface.
The impact of the sphere on the block occurs between frames 2 and 3 and as a result a cone
crack appears in frame 3, along with the formation of the isochromatics below the contact
region. Note that in this frame the isochromatics are oriented symmetrically to the surface
normal through the point of first contact between the sphere and the glass block. The velocity
of the cone crack, as measured along the skirt of the front of the cone crack in frame 3, is at
least 600 m.s-1
. In frame 4 the cone crack has become well developed and the front and rear
parts of the skirt of the cone crack make angles of 40˚ and 22˚, respectively with the glass
surface. Moreover, the speed of the front part of the skirt of the cone crack is ~ 950 m.s-1
. A
median crack has also appeared inside the cone crack in this frame. Note that although
between frames 3 and 4 the isochromatics have enlarged, they still remain symmetrically
oriented to the surface normal. This suggests that possibly the dynamic coefficient of friction
between the tungsten carbide sphere and the soda-lime glass surface is quite low and does not
lead to a significant shear stress on the glass surface. From frames 5 to 9 the inclination of the
font part of the cone gradually increases to 45˚, whereas the rear part of the cone grows in
such a way as to reduce its inclination to the glass surface to about 18˚.
Beyond frame 9 there does not appear to be any change in the inclination of the Hertzian
cone crack to the glass surface, but a jet of fine glass debris can be clearly seen being ejected
from the contact region. The speed of the jet of debris in the forward direction is 300 m.s-1
.
Moreover, it will be seen from frames 3 – 12 that the tungsten carbide sphere slides on the
glass surface at a speed of 50 – 60 m.s-1
and that during this time the sphere does not leave
the glass surface.
Thus the situation is that the sphere is loaded dynamically on to the glass block in the
presence of a tangential force generated by the sliding of the sphere on the surface. If at any
instant of time the dynamic load normal to the glass surface is P1 and the tangential force due
to the sliding of the sphere is µP1, where µ is the coefficient of friction between the tungsten
carbide sphere and the smooth surface of soda-lime glass block, the resultant force P2 is given
by
𝑃2 = 𝑃1 (1 + μ2)1
2⁄ (14)
Jelagin and Larsson [10] have measured the coefficient of friction between a tungsten carbide
sphere and a smooth surface of soda – lime glass and give a value of µ = 0.13. This means
that the resultant force P2 will be inclined to the surface normal at an angle β, where tanβ =
0.13, or β = 7.4˚. As stated in the above, the coefficient of friction in our impact experiment is
13
lower still because the isochromatics remain symmetrically oriented to the surface normal
(see frames 3 and 4).
It may be noted that in the case of a Hertzian cone crack formed due to the sliding of a sphere
on a surface under a normal load, it has been suggested [33] that because of the tilt of P2 to
the surface normal the axis of any Hertzian cone crack formed will be along P2 , which means
that the front part (in the direction of sliding) of the skirt of the cone crack will make a
smaller angle to the glass surface than the rear part of the skirt of the cone crack. The high-
speed photographic sequence presented in Fig. 8 shows the inclination of the Hertzian cone
crack being opposite to the suggestion made in Ref. [33]. As suggested by us earlier [34], the
orientation of the cone crack is controlled by the fact that after the formation of the ring crack
under the impacting sphere, the contact disc between the sphere and the glass surface covers
more and more of the front part of the ring crack due to the sliding and at the same time the
rear part of the ring crack will be covered less and less by the contact disc. This means that
the front part of the Hertzian cone crack will grow along steeper stress trajectories than the
rear part of the cone. As a result the front part of the cone crack will make a larger angle with
the impact surface than will the rear part of the cone.
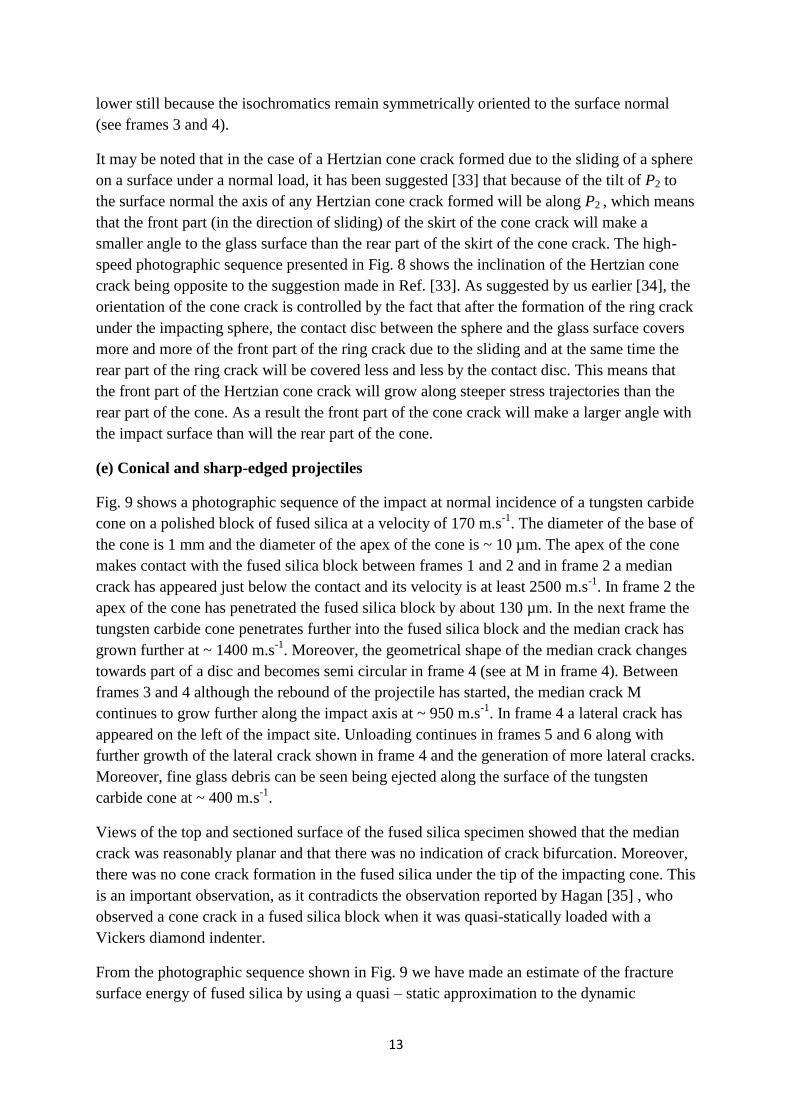
(e) Conical and sharp-edged projectiles
Fig. 9 shows a photographic sequence of the impact at normal incidence of a tungsten carbide
cone on a polished block of fused silica at a velocity of 170 m.s-1
. The diameter of the base of
the cone is 1 mm and the diameter of the apex of the cone is ~ 10 µm. The apex of the cone
makes contact with the fused silica block between frames 1 and 2 and in frame 2 a median
crack has appeared just below the contact and its velocity is at least 2500 m.s-1
. In frame 2 the
apex of the cone has penetrated the fused silica block by about 130 µm. In the next frame the
tungsten carbide cone penetrates further into the fused silica block and the median crack has
grown further at ~ 1400 m.s-1
. Moreover, the geometrical shape of the median crack changes
towards part of a disc and becomes semi circular in frame 4 (see at M in frame 4). Between
frames 3 and 4 although the rebound of the projectile has started, the median crack M
continues to grow further along the impact axis at ~ 950 m.s-1
. In frame 4 a lateral crack has
appeared on the left of the impact site. Unloading continues in frames 5 and 6 along with
further growth of the lateral crack shown in frame 4 and the generation of more lateral cracks.
Moreover, fine glass debris can be seen being ejected along the surface of the tungsten
carbide cone at ~ 400 m.s-1
.
Views of the top and sectioned surface of the fused silica specimen showed that the median
crack was reasonably planar and that there was no indication of crack bifurcation. Moreover,
there was no cone crack formation in the fused silica under the tip of the impacting cone. This
is an important observation, as it contradicts the observation reported by Hagan [35] , who
observed a cone crack in a fused silica block when it was quasi-statically loaded with a
Vickers diamond indenter.
From the photographic sequence shown in Fig. 9 we have made an estimate of the fracture
surface energy of fused silica by using a quasi – static approximation to the dynamic
14
situation. A value of ≤ 1.1 J.m-2
is obtained, which is considerably smaller than the value of
14 .1 J.m-2
obtained from quasi-static conical indentations [18] and the value of 4.42 J.m-2
reported by Wiederhorn [36] from double cantilever experiments at room temperature.
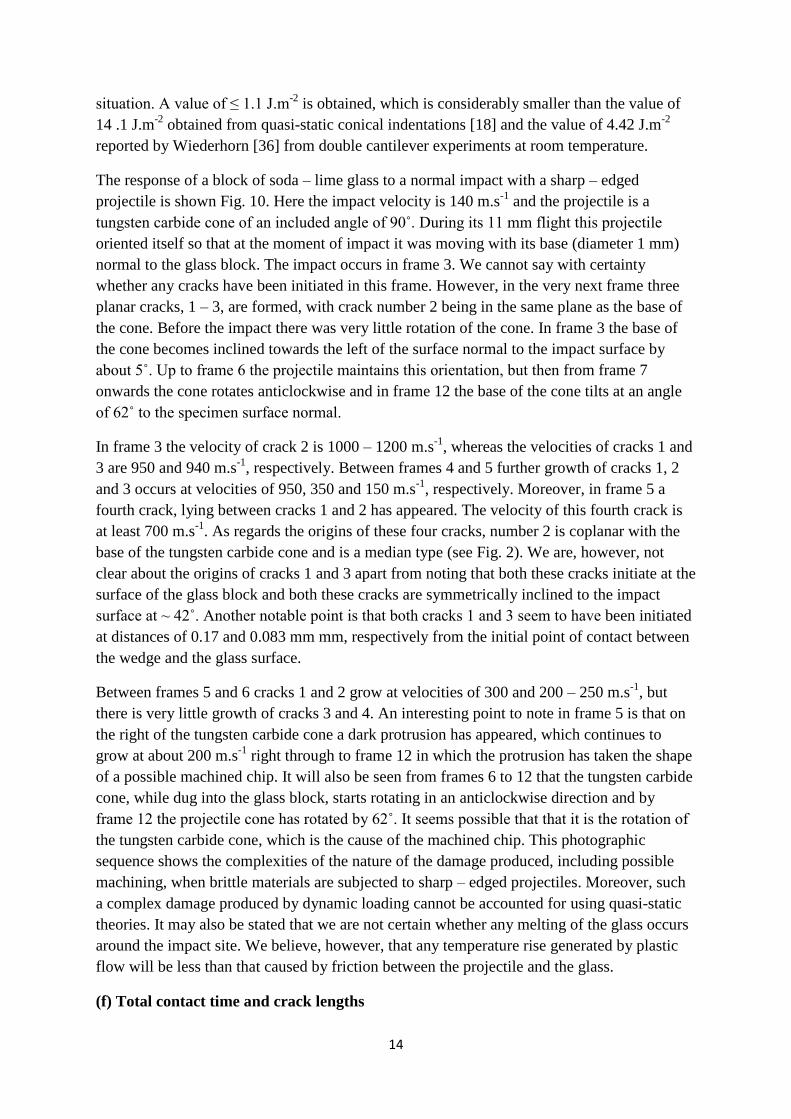
The response of a block of soda – lime glass to a normal impact with a sharp – edged
projectile is shown Fig. 10. Here the impact velocity is 140 m.s-1
and the projectile is a
tungsten carbide cone of an included angle of 90˚. During its 11 mm flight this projectile
oriented itself so that at the moment of impact it was moving with its base (diameter 1 mm)
normal to the glass block. The impact occurs in frame 3. We cannot say with certainty
whether any cracks have been initiated in this frame. However, in the very next frame three
planar cracks, 1 – 3, are formed, with crack number 2 being in the same plane as the base of
the cone. Before the impact there was very little rotation of the cone. In frame 3 the base of
the cone becomes inclined towards the left of the surface normal to the impact surface by
about 5˚. Up to frame 6 the projectile maintains this orientation, but then from frame 7
onwards the cone rotates anticlockwise and in frame 12 the base of the cone tilts at an angle
of 62˚ to the specimen surface normal.
In frame 3 the velocity of crack 2 is 1000 – 1200 m.s-1
, whereas the velocities of cracks 1 and
3 are 950 and 940 m.s-1
, respectively. Between frames 4 and 5 further growth of cracks 1, 2
and 3 occurs at velocities of 950, 350 and 150 m.s-1
, respectively. Moreover, in frame 5 a
fourth crack, lying between cracks 1 and 2 has appeared. The velocity of this fourth crack is
at least 700 m.s-1
. As regards the origins of these four cracks, number 2 is coplanar with the
base of the tungsten carbide cone and is a median type (see Fig. 2). We are, however, not
clear about the origins of cracks 1 and 3 apart from noting that both these cracks initiate at the
surface of the glass block and both these cracks are symmetrically inclined to the impact
surface at ~ 42˚. Another notable point is that both cracks 1 and 3 seem to have been initiated
at distances of 0.17 and 0.083 mm mm, respectively from the initial point of contact between
the wedge and the glass surface.
Between frames 5 and 6 cracks 1 and 2 grow at velocities of 300 and 200 – 250 m.s-1
, but
there is very little growth of cracks 3 and 4. An interesting point to note in frame 5 is that on
the right of the tungsten carbide cone a dark protrusion has appeared, which continues to
grow at about 200 m.s-1
right through to frame 12 in which the protrusion has taken the shape
of a possible machined chip. It will also be seen from frames 6 to 12 that the tungsten carbide
cone, while dug into the glass block, starts rotating in an anticlockwise direction and by
frame 12 the projectile cone has rotated by 62˚. It seems possible that that it is the rotation of
the tungsten carbide cone, which is the cause of the machined chip. This photographic
sequence shows the complexities of the nature of the damage produced, including possible
machining, when brittle materials are subjected to sharp – edged projectiles. Moreover, such
a complex damage produced by dynamic loading cannot be accounted for using quasi-static
theories. It may also be stated that we are not certain whether any melting of the glass occurs
around the impact site. We believe, however, that any temperature rise generated by plastic
flow will be less than that caused by friction between the projectile and the glass.
(f) Total contact time and crack lengths
15
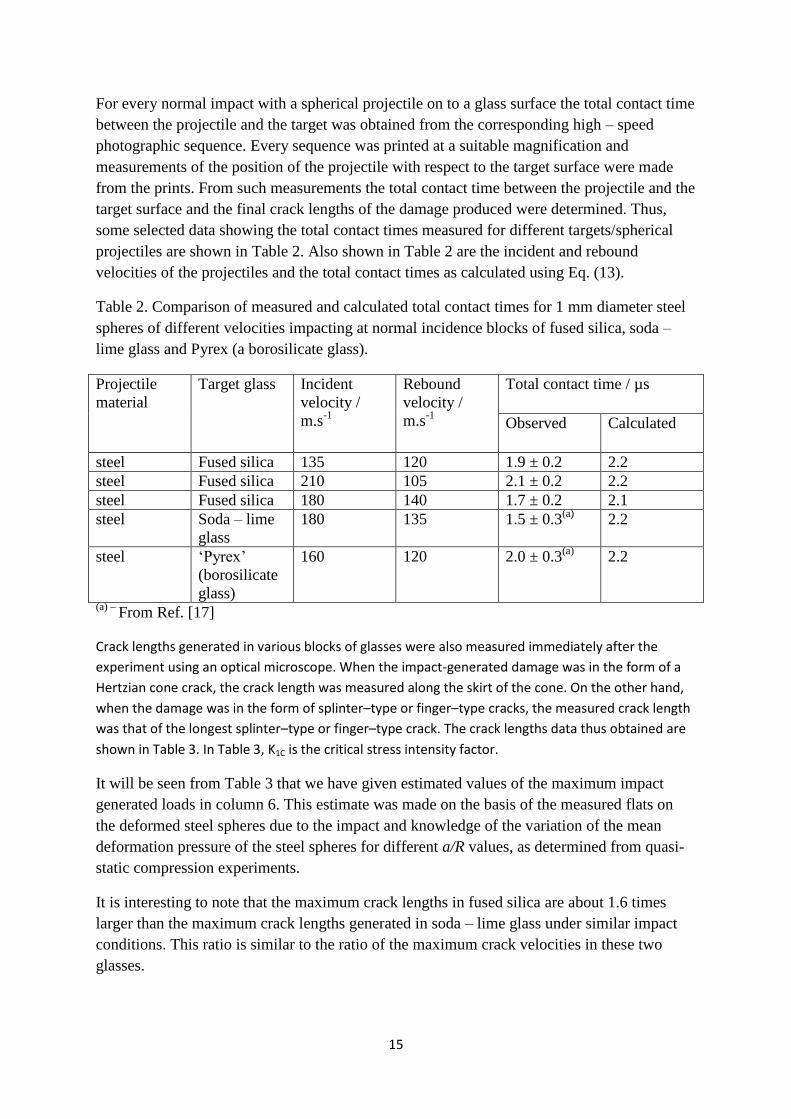
For every normal impact with a spherical projectile on to a glass surface the total contact time
between the projectile and the target was obtained from the corresponding high – speed
photographic sequence. Every sequence was printed at a suitable magnification and
measurements of the position of the projectile with respect to the target surface were made
from the prints. From such measurements the total contact time between the projectile and the
target surface and the final crack lengths of the damage produced were determined. Thus,
some selected data showing the total contact times measured for different targets/spherical
projectiles are shown in Table 2. Also shown in Table 2 are the incident and rebound
velocities of the projectiles and the total contact times as calculated using Eq. (13).
Table 2. Comparison of measured and calculated total contact times for 1 mm diameter steel
spheres of different velocities impacting at normal incidence blocks of fused silica, soda –
lime glass and Pyrex (a borosilicate glass).
Projectile
material
Target glass Incident
velocity /
m.s-1
Rebound
velocity /
m.s-1
Total contact time / µs
Observed Calculated
steel Fused silica 135 120 1.9 ± 0.2 2.2
steel Fused silica 210 105 2.1 ± 0.2 2.2
steel Fused silica 180 140 1.7 ± 0.2 2.1
steel Soda – lime
glass
180 135 1.5 ± 0.3(a)
2.2
steel ‘Pyrex’
(borosilicate
glass)
160 120 2.0 ± 0.3(a)
2.2
(a) – From Ref. [17]
Crack lengths generated in various blocks of glasses were also measured immediately after the
experiment using an optical microscope. When the impact-generated damage was in the form of a
Hertzian cone crack, the crack length was measured along the skirt of the cone. On the other hand,
when the damage was in the form of splinter–type or finger–type cracks, the measured crack length
was that of the longest splinter–type or finger–type crack. The crack lengths data thus obtained are
shown in Table 3. In Table 3, K1C is the critical stress intensity factor.
It will be seen from Table 3 that we have given estimated values of the maximum impact
generated loads in column 6. This estimate was made on the basis of the measured flats on
the deformed steel spheres due to the impact and knowledge of the variation of the mean
deformation pressure of the steel spheres for different a/R values, as determined from quasi-
static compression experiments.
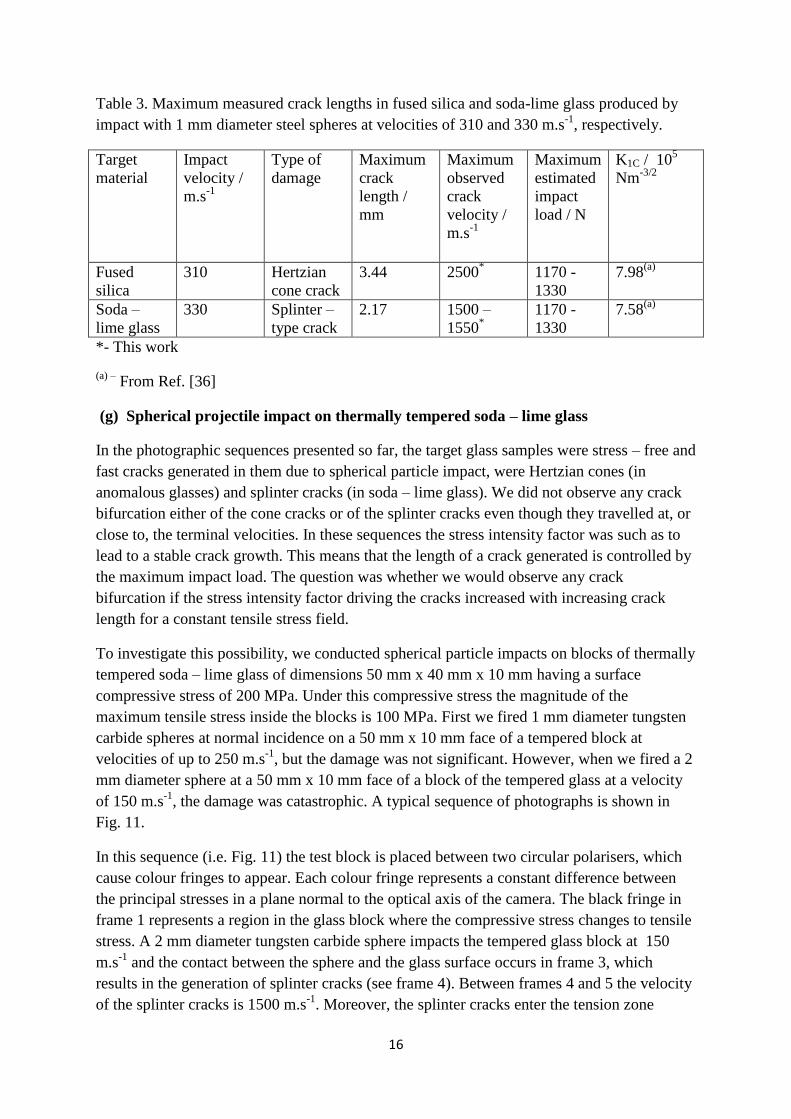
It is interesting to note that the maximum crack lengths in fused silica are about 1.6 times
larger than the maximum crack lengths generated in soda – lime glass under similar impact
conditions. This ratio is similar to the ratio of the maximum crack velocities in these two
glasses.
16
Table 3. Maximum measured crack lengths in fused silica and soda-lime glass produced by
impact with 1 mm diameter steel spheres at velocities of 310 and 330 m.s-1
, respectively.
Target
material
Impact
velocity /
m.s-1
Type of
damage
Maximum
crack
length /
mm
Maximum
observed
crack
velocity /
m.s-1
Maximum
estimated
impact
load / N
K1C / 105
Nm-3/2
Fused
silica
310 Hertzian
cone crack
3.44 2500*
1170 -
1330
7.98(a)
Soda –
lime glass
330 Splinter –
type crack
2.17 1500 –
1550*
1170 -
1330
7.58(a)
*- This work
(a) – From Ref. [36]
(g) Spherical projectile impact on thermally tempered soda – lime glass
In the photographic sequences presented so far, the target glass samples were stress – free and
fast cracks generated in them due to spherical particle impact, were Hertzian cones (in
anomalous glasses) and splinter cracks (in soda – lime glass). We did not observe any crack
bifurcation either of the cone cracks or of the splinter cracks even though they travelled at, or
close to, the terminal velocities. In these sequences the stress intensity factor was such as to
lead to a stable crack growth. This means that the length of a crack generated is controlled by
the maximum impact load. The question was whether we would observe any crack
bifurcation if the stress intensity factor driving the cracks increased with increasing crack
length for a constant tensile stress field.
To investigate this possibility, we conducted spherical particle impacts on blocks of thermally
tempered soda – lime glass of dimensions 50 mm x 40 mm x 10 mm having a surface
compressive stress of 200 MPa. Under this compressive stress the magnitude of the
maximum tensile stress inside the blocks is 100 MPa. First we fired 1 mm diameter tungsten
carbide spheres at normal incidence on a 50 mm x 10 mm face of a tempered block at
velocities of up to 250 m.s-1
, but the damage was not significant. However, when we fired a 2
mm diameter sphere at a 50 mm x 10 mm face of a block of the tempered glass at a velocity
of 150 m.s-1
, the damage was catastrophic. A typical sequence of photographs is shown in
Fig. 11.
In this sequence (i.e. Fig. 11) the test block is placed between two circular polarisers, which
cause colour fringes to appear. Each colour fringe represents a constant difference between
the principal stresses in a plane normal to the optical axis of the camera. The black fringe in
frame 1 represents a region in the glass block where the compressive stress changes to tensile
stress. A 2 mm diameter tungsten carbide sphere impacts the tempered glass block at 150
m.s-1
and the contact between the sphere and the glass surface occurs in frame 3, which
results in the generation of splinter cracks (see frame 4). Between frames 4 and 5 the velocity
of the splinter cracks is 1500 m.s-1
. Moreover, the splinter cracks enter the tension zone
17
between frames 4 and 5. This leads to the initiation of the catastrophic failure of the glass,
with the process of fracture being propagated and controlled by the tensile stress present in
the glass. In fact, from frame 5 to frame 12 the fracture spreads almost throughout the glass
block, showing repeated crack bifurcation. Note that this crack propagation behaviour is quite
different from the particle-impact-generated fracture behaviour in stress – free blocks of soda
– lime glass.
5. Discussion
In this work several aspects of dynamic crack initiation and propagation in inorganic glasses
due to small particle impact have been examined experimentally using high-speed framing
photography. We shall discuss below each of these aspects separately.
First, we consider the results from the 1 mm diameter steel spheres’ impact on various
glasses. It was found that in all glasses examined, except the B2O3, Hertzian cone cracks
formed for impact velocities of up to ~ 180 m.s-1
. Above this velocity, for example for a
velocity of 200 m.s-1
, the response of the anomalous glasses, Pyrex and fused silica, was quite
different from the response of the soda – lime glass (a normal glass). Whereas in Pyrex
Hertzian cone cracks formed (Figs. 3 ), there were no cone cracks formed in the soda – lime
glass and instead splinter – type cracks formed (Fig. 4). In fact, in fused silica Hertzian cone
cracks formed even at the maximum projectile velocity of ~330 m.s-1
. In the case of the
Pyrex, Hertzian cone cracks formed at the maximum impact velocity of 250 m.s-1
used [16].
Another anomalous glass, namely Ge2O, has also shown a similar response [19].The
formation of the Hertzian cone cracks due to impacts at relatively high velocities would
suggest that the anomalous glasses behaved as if they were elastic. In the case of the impacts
with the steel spheres, the maximum impact pressure is expected to rise to ~ 0.8 x Hv [30],
where Hv is the Vickers hardness of the steel spheres, if we liken the plastic deformation
behaviour of an impacting sphere to that of a sphere being compressed quasi-statically
between two hard platens. Now, Hv of the steel spheres is 9.2 GPa (Table 1). Therefore, the
maximum deformation pressure generated on impact with a steel sphere on to a block of
Pyrex or fused silica would be 0.8 x 9.2 = 7.36 GPa. In the case of the steel spheres, it is
unlikely that the high strain rates prevailing during an impact will cause any significant
increase in the yield stress (or the hardness) of the steel, as has been shown by Davies [38].
On the other hand, in the case of soda – lime glass, Gunasekera and Holloway [39] have
shown that the indentation hardness of this glass increased by a factor of 3 when the loading
time reduced from 60 s to 10-3
s. Since in our impact experiments the loading times are only
about 1 – 2 µs, further increase in the dynamic indentation hardness of the soda – lime glass
may be expected.
Although at present there is little or no information available in the open literature on the
dynamic hardness of fused silica and Pyrex, it seems quite likely that the indentation hardness
of these anomalous glasses will also increase. Therefore in the case of an impact with a 1 mm
diameter steel sphere on fused silica, Pyrex, or soda – lime glass, plasticity is not expected. It
may be added here that in the case of the impact of a 1 mm diameter tungsten carbide sphere
on a block of fused silica at a velocity of 200 m.s-1
, a maximum pressure of 14. 6 GPa would
18
occur, as calculated using Eq. (4). But crushing of the silica in the contact zone is unlikely to
allow the pressure to reach this value.
Furthermore, it is observed that crushing of all three glasses below the contact between the
impacting sphere and the test block does take place, but the degree of the crushing varies with
the type of glass. Crushing is much more extensive in soda – lime silica glass than in fused
silica or Pyrex. It may be said that the stiffness of the glasses in the crushed state will be less
than that of the glasses in their intact state. It seems possible that in the crushed state any
further dynamic loading is likely to cause the material to deform in a somewhat similar
manner to the deformation behaviour of a plastically deforming solid, supporting shear
deformation. As a consequence, in impact loading the material below the impact will flow
rapidly forming jets of material, as we see in the case of an impact of a 1 mm diameter steel
sphere on soda – lime glass (Fig. 4).
An important difference between soda – lime glass and the two anomalous glasses Pyrex and
fused silica is that the latter possess an ‘open’ structure. (The density of fused silica is 2.2 x
103 kg. m
-3, whereas the density of crystalline quartz is 2.67 x 10
3 kg.m
-3. This relative low
density of fused silica gives rise to an ‘open’ structure, with all the bonds intact. Pyrex glass
also has a low density of 2.23 x 10³ kg.m
-3. On the other hand, soda-lime glass is a amodified
form of silica containing several oxides as fillers. These oxides are Na2O, CaO, MgO and
others. The density of soda-lime glass is 2.48 x 10³ kg.m
-3 and it is a ‘filled’ structure’.). This
means that any localised stress, such as that produced by an impact with a steel sphere, can be
accommodated with the rotation of strong covalent bonds [19] in fused silica. This will lead
to some densification and compaction. On the other hand, soda – lime silica is a ‘filled’
structure and when a localised compressive stress is applied, the glass will tend to deform by
the process of genuine shear [40] rather than by compaction. The tendency in soda – lime
glass to shear under applied local stress would also encourage jetting.
The behaviour of the B2O3 glass to impact with a steel sphere is quite unusual. It is a normal
glass, but it is relatively soft having a Vickers hardness of 1.7 GPa (Table. 1). When impacted
with a 1 mm diameter steel sphere at a velocity of 150 m.s-1
, no cracks of any type formed
during the loading part of the impact. Moreover, under the impacting sphere it appeared to
densify considerably. However, during the rebound of the projectile, the densification
partially recovered and then as soon as the projectile left the surface of the glass, radial and
lateral cracks formed, as would be expected from the elastic/plastic model given in section 2
(b). The ring of material that detaches during the rebound of the impacting sphere had, in
fact, piled up around the sphere, as if it flowed plastically [41], during the loading part of the
impact (see Fig. 5, frame 3) and then detached from the glass surface as the steel sphere
started its rebound.
The second aspect of this work is about the variation of the Hertzian cone crack semi-
included angle in fused silica when it is impacted at normal incidence with 1 mm diameter
steel, glass and sapphire spheres in the velocity range 15 to 340 m.s-1
. It is clear from Figs. 6
and 7 that the semi- included angle of the cone cracks decreases systematically with
increasing impact velocity of the projectiles. Moreover, it is shown in Fig. 7 that such

19
behaviour occurs for all three types of projectile. Previously [16], it was suggested that the
Hertzian cone crack angle in Pyrex decreased with increasing impact velocity of the steel
spheres because the diameter of the plastically deformed flat on the steel projectiles increased
with increasing impact velocity. This meant that after the initiation of a ring crack during the
early part of the loading cycle, the radius of contact between the glass and the sphere and the
impact load continued to increase with time. The implication of this was that any further
growth of the cone crack would occur along sub-surface principal stress trajectories of an
increasing steepness to the impacted surface. However, now we have a different view
because a close examination of several high–speed photographic sequences has revealed that
the included angle of a cone crack formed within about 0.1 µs of the contact does not change
at all during the remainder of the loading time. As an example, it will be seen from Fig. 3
(frame 3) that the included angle of 87˚ of the cone crack formed within 0.1 µs of the impact
is exactly the same as the included angle after another µs (see Fig. 3, frame 4) or even 7 µs
later (Fig. 3, frame 10).
We know from Huber’s [42] sub-surface stress analysis in the case of the loading of an elastic
sphere on an elastic half space that the inclination of the sub-surface principal stress
trajectories is dependent upon the Poisson’s ratio of the half space and it is the inclination of
stress trajectory at 𝑟 ≅ a (see Fig. 1) that determines the included angle of the Hertzian cone
crack. We would, therefore, like to suggest that during an impact the Poisson’s ratio of the
elastic half space close to the impact site decreases and that the degree of the decrease is
dependent upon the impact – generated loading rate. So, the higher the loading rate, the
greater will be the decrease in the value of the Poisson’s ratio. Support for this suggestion
comes from some recent work by Bo et al. [43], who showed that during the dynamic
compression of granite specimens at loading rates in the range 100 MPa.s
-1 to 10
5 MPa.s
-1 the
Poisson’s ratio of a granite sample containing 3.28 % voids decreased from 0.31 to 0.23 as
the loading rate increased from 5 x 100 MPa.s
-1 to 10
5 MPa.s
-1.
We believe that the effect of the loading rate on the Poisson’s ratios will also occur for fused
silica, Pyrex and soda-lime silica glasses.
Another observation that gives support to our suggestion comes from Fig.7. It will be seen
that the data points due to impact with the 1 mm diameter glass spheres lie distinctly above
those due to impact with the steel spheres. This means that for the same impact velocity the
semi-included angle of the Hertzian cone crack is smaller for a steel-sphere-impact than for a
glass-sphere-impact. This observation is consistent with the fact that for the same impact
velocity the loading rate for the steel projectiles will be greater than with the glass projectiles,
and consequently there will be a greater reduction in the value of the Poisson’s ratio for the
steel projectiles than will the case for the glass projectiles. It may also be noted from Fig. 7
that for a given projectile impact velocity, the semi included angle of the Hertzian cone
produced in fused silica due to a 1 mm diameter sapphire sphere is smaller than that produced
with a glass projectile.
The third aspect of this work concerns the total contact time during an impact and the lengths
of the cracks generated in different glasses. Table 2 shows that the observed total contact
20
times when steel projectiles impacted different glasses at velocities in the range 135 – 210
m.s-1
agree reasonably well with the contact times calculated using Eq. (13). We assume that
even at higher impact velocities of 300 to 340 m.s-1
the loading times for the impacts of 1 mm
diameter steel projectiles on to fused silica and soda – lime glass may be similar, though
crushing of the glasses is likely to increase the loading times, but because of the ejected
debris masking the projectiles, we were not able to measure the loading times. However,
from several high-speed photographic sequences we were able to measure and to confirm that
in the impacted glasses the cracks of all types travel at or close to their terminal velocities for
almost the entire loading times. Therefore, the maximum crack lengths in fused silica and
soda-lime glasses will be given by
Maximum crack length in fused silica = Terminal crack velocity in fused silica x loading
time,
Maximum crack length in soda-lime glass = Terminal crack velocity in soda –lime glass x
loading time.
Now, the loading times in fused silica and soda – lime glass are approximately the same (see
Table 2). Therefore the ratio of the maximum crack lengths in the two glasses will be
𝑀𝑎𝑥𝑖𝑚𝑢𝑚 𝑐𝑟𝑎𝑐𝑘 𝑙𝑒𝑛𝑔𝑡ℎ 𝑖𝑛 𝑓𝑢𝑠𝑒𝑑 𝑠𝑖𝑙𝑖𝑐𝑎
𝑀𝑎𝑥𝑖𝑚𝑢𝑚 𝑐𝑟𝑎𝑐𝑘 𝑙𝑒𝑛𝑔𝑡ℎ 𝑖𝑛 𝑠𝑜𝑑𝑎−𝑙𝑖𝑚𝑒 𝑔𝑙𝑎𝑠𝑠=
𝑇𝑒𝑟𝑚𝑖𝑛𝑎𝑙 𝑐𝑟𝑎𝑐𝑘 𝑣𝑒𝑙𝑜𝑐𝑖𝑡𝑦 𝑖𝑛 𝑓𝑢𝑠𝑒𝑑 𝑠𝑖𝑙𝑖𝑐𝑎
𝑇𝑒𝑟𝑚𝑖𝑛𝑎𝑙 𝑐𝑟𝑎𝑐𝑘 𝑣𝑒𝑙𝑜𝑐𝑖𝑡𝑦 𝑖𝑛 𝑠𝑜𝑑𝑎−𝑙𝑖𝑚𝑒 𝑔𝑙𝑎𝑠𝑠 (15)
Using the maximum measured crack velocities in fused silica given in Table 3 in Eq. (15), we
see that the ratio of the maximum crack lengths in the two glasses should be 2500
1500 = 1.66.
From Table 3 we obtain the ratio of the maximum crack lengths in fused silica and soda-lime
glass as 3.44
2.17 = 1.6.
The two ratios are fairly close to each other, suggesting that this method of estimating the
particle impact-generated crack lengths is better than using the quasi – static theories (see, for
example, Ref. [44]) in which no consideration is given either to the impact loading times or to
the crack velocities and in which significant discrepancy is found between the theoretically
predicted strength degradation and experimental observations.
The next aspect of our work is the dynamic loading of a tungsten carbide cone of an included
angle of 90˚ on to a block of fused silica at 170 m.s-1
(see Fig. 10). It is very unusual to see
the formation and propagation of a planar median crack in fused silica rather than a Hertzian
type conical crack. We believe that in the impact situation at this velocity the fused silica was
not able to compact and densify around the tip of the cone and to lead to the formation of a
conical crack. It would be interesting to load dynamically a block of fused silica with a
similar cone at different velocities and to examine if there is a velocity below which only
Hertzian type cone cracks form.
We next consider the loading of a block of soda – lime glass by oblique impact loading (Fig.
8). It is clear from this photographic sequence and others not shown here that a Hertzian cone
crack does form on oblique impact, but its orientation is not symmetrical to the normal to the
21
impacted surface. Instead, the front part (i.e. in the direction of the impact) of the skirt of the
cone crack makes a considerably larger angle to the impacted surface than does the rear part
of the skirt of the cone crack. This orientation has been found to be similar to the orientation
of the Hertzian cone crack in a block of soda – lime glass when the latter is loaded at an
oblique angle quasi-statically [34]. As explained in section 4, this type of crack orientation is
a result of the geometrical coverage of the front part of the surface ring crack with the contact
disc and the uncovering of the rear part of the ring crack due to the sliding of the impacting
sphere. Interestingly, the observed cone crack orientation of the cone crack is completely
opposite to the orientation proposed in Ref. [33].
Finally, we briefly discuss the absence of bifurcation of fast cracks generated in fused silica,
Pyrex and soda-lime silica by small particle impact. We believe that the reason for the cracks
travelling even at their terminal velocities, not to bifurcate is that the stress intensity factor
driving the cracks is such so as to lead to a stable crack growth. This means that for a given
applied load, the cracks would elongate to a fixed distance. On the other hand, when a crack
is driven by a tensile stress so that the value of the stress intensity factor increases with
increasing crack length, such as in the propagation of cracks within the tension zone of a
thermally tempered glass (see Fig. 11), the stress intensity factor increases with increasing
crack length until bifurcation occurs and then the bifurcation process repeats again.
6. Conclusions
The response of several inorganic glasses to impact with spherical projectiles of diameters 0.8
to 2.0 mm made of different materials has been investigated using high – speed framing
photography at rates of up to ~ 2 x 10⁶ frames per second. The glasses were fused silica and
‘Pyrex; (a borosilicate glass), soda-lime glass and B2O3. The first two are ‘anomalous’,
whereas the other two are normal types. The projectile materials were steel, glass, sapphire
and tungsten carbide. High-speed photography has shown that in the case of the ‘anomalous’
glasses at moderate impact velocities of 200 – 300 m.s-1
Hertzian cone cracks initiated at the
impacted surface within 0.1 µs of the contact being made and then travelled at crack terminal
velocities, without any bifurcation, during the remainder of the loading time. In the case of
soda-lime glass, fast splinter cracks formed, but B2O3 showed compaction and plastic flow.
A new proposal has been made about the decrease of the Hertzian cone angle with increasing
projectile impact velocity. According to this proposal, as the loading rate increases with
increasing projectile impact velocity, the Poisson’s ratio of the target material decreases
accordingly, resulting in a cone crack of a smaller included angle.
In the case of a tungsten carbide conical projectile impacting a block of fused silica, high-
speed photography has revealed that a fast planar crack (median type) forms immediately
below the apex of the projectile. This observation is quite different from the observation
when a Vickers diamond pyramidal indenter is loaded on to fused silica quasi-statically,
resulting in the formation of a conical crack. The impact of a wedge-like projectile on a block
of soda-lime glass has also been shown to result in a fast planar crack.

22
It has been argued that particle – impact – generated crack lengths in glasses are a function of
the projectile loading time and the terminal velocities of the cracks in the target materials. An
example has been provided to support this suggestion.
High-speed photography has also revealed that when a tungsten carbide sphere impacts a
block of soda-lime glass at an angle to the surface normal, the Hertzian cone crack formed is
not oriented symmetrically to the surface normal, but it is so inclined that the front part of the
skirt of the cone crack makes a larger angle with the impacted surface than does the rear part
of the cone crack. This has been explained by the sliding of the impacting projectile and
covering the surface ring crack in the sliding direction during the formation and growth of the
cone crack.
Finally, a high speed photographic sequence has been provided in which the impact of a 2
mm diameter tungsten carbide on thermally tempered glass generates long enough splinter
cracks, which penetrate into the tension zone of the block and start a self-sustained crack
propagation process, with repeated crack bifurcation. The bifurcation of the cracks in this
situation is caused by the residual tensile stress in the specimen for which the stress intensity
factor is such so as to lead to an unstable crack growth.
Acknowledgements
I would like to acknowledge sincerely the many stimulating discussions on the phenomena of
indentation, fracture and friction which I had over the past 35 years with the late Dr Elizabeth
H. Yoffe, who passed away in July 2014. I thank Kelvin Fagan, the Cavendish Laboratory
photographer, for his help with the figures.
23
References
[1] Hertz H. 1896 In Miscellaneous Papers, translated by D E Jones and G H Schott,
Macmillan and Co. Ltd., London. Chapters 5 and 6.
[2] Auerbach F. 1891 On the absolute measurement of hardness. Ann. Phys. Chem. 43, 61 –
100
[3] Tolansky S, Howes VR. 1954 Optical studies of ring cracks on glass. Proc. Phys. Soc.
(Lond) B 67, 467 – 472. (doi: 10.1088/0370 - 1301/67/6/303)
[4] Benbow JJ. 1960 Cone cracks in fused silica. Proc. Phys. Soc. (Lond), 75, 697 – 699.
(doi: 10.1088/0370 -1328/75/5/308)
[5] Tillett JPA. 1956. Fracture of glass by spherical indenters. Proc. Phys. Soc. (Lond). B69,
47 – 54. ((doi: 10.1088/0370 - 1301/69/1/306)
[6] Roesler FC. 1956. Brittle fracture near equilibrium. Proc. Phys. Soc. (Lond). B69, 981 –
992.(doi: 10.1088/0370 – 1301/69/10/303)
[7] Chaudhri MM, Yoffe EH. 1981 The area of contact between a small sphere and a flat
surface. Philos. Mag. A 44, 667 – 675.
[8] Wilshaw TR. 1971 The Hertzian fracture test. J. Phys. D, 4, 1567 – 1581. (doi:
10.1088/0022 – 3727/4/10/316)
[9] Chen SY, Farris TN, Chandrasekar S. 1995 Contact mechanics of Hertzian cone cracking,
Int. J. Solids Structures, 32, 329 – 340. (doi: 10.1016/0020 – 7683(94)00127 – 1)
[10] Jelagin D, Larsson PL. 2008 On indentation and initiation of fracture in glass. Int. J.
Solids Structures, 45, 2993 - 3008. (doi: 10.1016/j.ijsolstr.2008.01.008)
[11] Raman CV. 1919 Percussion figures in isotropic solids. Nature, 104, 113 – 114.
[12] Benerji K. 1926-1927 On the permanent deformations produced by contact of solids.
Indian J. Phys. 1, 59 – 74.
[13] Andrews JP. 1931 Observations on percussion figures. Proc. Phys. Soc. 43, 18 – 25.
[14] Chaudhri MM. 1972 Shock initiation of fast decomposition in crystalline solids.
Combustion and Flame, 19, 419 – 425. (doi: 10.1016/0010 – 2180(72)90011 – 9)
[15] Chaudhri MM, Knight CG, Swain MV. 1977 Impact of microparticles on brittle solids.
Proc. 12th
International Congress on High Speed Photography, Toronto 1976. SPIE, 97, 371 –
376.
[16] Knight CG, Swain MV, Chaudhri MM. 1977 Impact of small steel spheres on glass
surfaces. J. Mater. Sci. 12, 1573 – 1586. (DOI: 10.1007/BF00542808)
[17] Chaudhri MM, Walley SM. 1978 Damage to glass surfaces by the impact of small glass
and steel spheres. Philos. Mag. A 37, 153 – 165.
24
[18] Chaudhri MM, Brophy PA. 1980 Single particle impact damage of fused silica. J. Mater.
Sci. 15, 345 – 352. (doi: 10.1007/BF02396782)
[19] Chaudhri MM, Kurkjian CR. 1986 Impact of small steel spheres on the surfaces of
“normal” and “anomalous” glasses. J. Am. Ceram. Soc. 69, 404 – 410. (DOI: 10.1111/j.1151-
2916.1986.tb04769.x)
[20] Chaudhri MM. 1985 High-speed photographic investigations of the dynamic localised
loading of some oxide glasses. In Strength of inorganic glass (ed. C. R. Kurkjian), pp. 87 –
113. Plenum, New York. First presented at a NATO Advanced Research Workshop March 21
– 25, 1983 in Algarve, Portugal.
[21] Chaudhri MM, Wells JK, Stephens A. 1981 Dynamic hardness, deformation and fracture
of simple ionic crystals at very high rates of strain. Philos. Mag. A 43, 643 – 664.
[22] Chaudhri MM, Phillips MA. 1990 Quasi-static indentation cracking of thermally
tempered - soda lime glass with spherical and Vickers indenters. Philos. Mag. A 62, 1 – 27.
[23] Goodier JN, Jahsman WE, Ripperger EA. 1959 An experimental surface wave method
for recording force – time curves in elastic impacts. J. Appl. Mech. 26, 3 – 7.
[24] Hunter SC. 1957 Energy absorbed by elastic waves during impact. J. Mech. Phys. Solids,
5, 162 – 171. (doi: 10. 10160022 – 5096(57) 90002 -9)
[25] Yoffe EH. 1982 Elastic stress fields caused by indenting brittle materials. Philos. Mag A
46, 617 – 628.
[26] Boussinesq J. 1885 Application des potentials a l E tude de l Equillibre et du mouvement
des solids E lastiques. Gauthier – Villars, Paris.
[27] Chaudhri MM. 2004 Dislocations and Indentations. In Dislocations in Solids, Vol. 12
editors F. R. N. Nabarro and J. P. Hirth, Elsevier, Amsterdam, pp. 447 – 550.
[28] Tabor D. 1951. The hardness of metals, Oxford University Press, Clarendon. P. 132.
[29] Andrews JP. 1930 LVI. Theory of collision of spheres of soft metals. Philos. Mag
(series 7) 9, 593 – 610.
[30] Chaudhri MM, Hutchings IM, Makin PL. 1984 Plastic compression of spheres. Philos.
Mag. A 49, 493 – 503. (doi: 10.1080/014186184082-3655)
[[31] Atkins AG. 1973 High-temperature hardness and creep. In The science of hardness
testing and its research applications, (editors J. H. Westbrook and H. Conrad) pp. 223 – 240.
American Society for Metals, Menlo Park, Ohio. First presented at a symposium of the
American Society for Metals, October 18 to 20, 1971.
[32] Schardin H. 1959 Velocity effects in fracture. In Fracture editors Averbach BL, Felbeck
DK, Hahn GT, Thomas DA, John Wiley, New York, pp. 297 – 330. First presented at an
25
international conference on atomic mechanisms of fracture held in Swampscott,
Massachusetts, April 12 – 16, 1959.
[33] Lawn BR, Wiederhorn SM, Roberts DE. 1984 Effect of sliding friction forces on the
strength of brittle materials. J. Mater. Sci., 19, 2561 – 2569. (doi: 10. 1007/BF00550810)
[34] Chaudhri MM, Liangyi Chen. 1989. The orientation of the Hertzian cone crack in soda-
lime glass formed by oblique dynamic and quasi-static loading with a hard sphere. J. Mater.
Sci., 24, 3441 – 3448. (doi: 10 1007/BF02385722)
[35] Hagan JT. 1979 Cone cracks around Vickers indentations in fused silica glass. J. Mater.
Sci., 14, 462 – 466. (doi: 10. 1007/BF00589840)
[36] Wiederhorn SM. 1969 Fracture surface energy of glass. J. Am. Ceram. Soc. 52, 99 – 105.
(doi: 10. 1111/j. 1151.2916.1969tb13350x)
[37] Chaudhri MM, Liangyi Chen. 1986 The catastrophic failure of thermally tempered glass
caused by small-particle impact. Nature, 320, 48 – 50. (doi: 10.1038/320048a0)
[38] Davies RM. 1949 The determination of static and dynamic yield stresses using a steel
ball. Proc. Roy. Soc. (Lond) A, 197, 416 – 432. (doi: 10: 1098/rspa.1949.0073)
[39] Gunasekera SP, Holloway DG. 1973 Effect of loading time and environment on
indentation hardness of glass. Phys. Chem. Glasses, 14, 45 – 52.
[40] Peter KW. 1970 Densification and flow phenomena of glass in indentation experiments.
J. Non-Crystalline solids, 5, 103 – 113.
[41] Bridgman PW, Simon I. 1953 Effects of very high pressures on glass. J. Appl. Phys. 24,
405 – 413. (doi: 10. 1063/1.1721294)
[42] Huber MT. 1904 On the theory of contact of solid elastic substances. Ann. Physik, 14,
153 – 163.
[43] Bo L, Xiang X, Chong Y. 2013 Dynamic mechanical compression of rock material with
different weathering degrees. Environmental Engineering and Management Journal, 12,
1797 – 1801.
[44] Wiederhorn SM, Lawn BR. 1977 Strength degradation of glass resulting from impact
with spheres. J. Am. Ceram. Soc. 60, 451 – 458. (doi: 10. 1111/j.115-2916.1977tb15531.x)
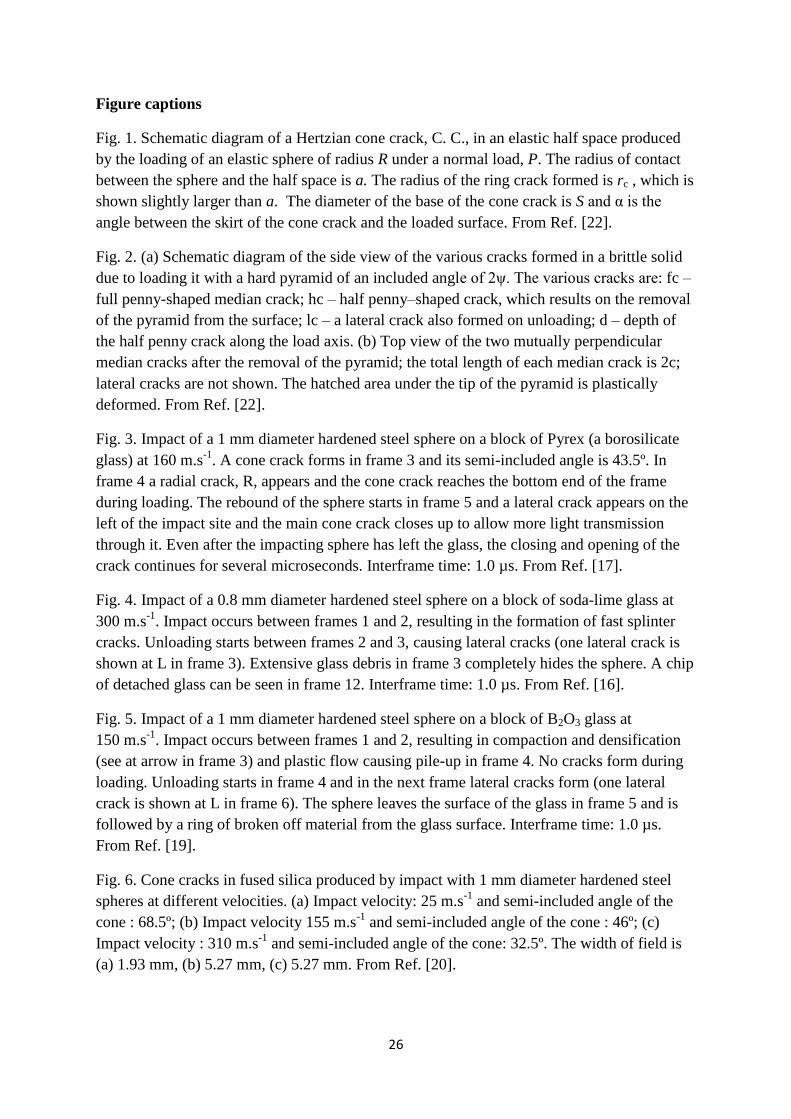
26
Figure captions
Fig. 1. Schematic diagram of a Hertzian cone crack, C. C., in an elastic half space produced
by the loading of an elastic sphere of radius R under a normal load, P. The radius of contact
between the sphere and the half space is a. The radius of the ring crack formed is rc , which is
shown slightly larger than a. The diameter of the base of the cone crack is S and α is the
angle between the skirt of the cone crack and the loaded surface. From Ref. [22].
Fig. 2. (a) Schematic diagram of the side view of the various cracks formed in a brittle solid
due to loading it with a hard pyramid of an included angle of 2ψ. The various cracks are: fc –
full penny-shaped median crack; hc – half penny–shaped crack, which results on the removal
of the pyramid from the surface; lc – a lateral crack also formed on unloading; d – depth of
the half penny crack along the load axis. (b) Top view of the two mutually perpendicular
median cracks after the removal of the pyramid; the total length of each median crack is 2c;
lateral cracks are not shown. The hatched area under the tip of the pyramid is plastically
deformed. From Ref. [22].
Fig. 3. Impact of a 1 mm diameter hardened steel sphere on a block of Pyrex (a borosilicate
glass) at 160 m.s-1
. A cone crack forms in frame 3 and its semi-included angle is 43.5º. In
frame 4 a radial crack, R, appears and the cone crack reaches the bottom end of the frame
during loading. The rebound of the sphere starts in frame 5 and a lateral crack appears on the
left of the impact site and the main cone crack closes up to allow more light transmission
through it. Even after the impacting sphere has left the glass, the closing and opening of the
crack continues for several microseconds. Interframe time: 1.0 µs. From Ref. [17].
Fig. 4. Impact of a 0.8 mm diameter hardened steel sphere on a block of soda-lime glass at
300 m.s-1
. Impact occurs between frames 1 and 2, resulting in the formation of fast splinter
cracks. Unloading starts between frames 2 and 3, causing lateral cracks (one lateral crack is
shown at L in frame 3). Extensive glass debris in frame 3 completely hides the sphere. A chip
of detached glass can be seen in frame 12. Interframe time: 1.0 µs. From Ref. [16].
Fig. 5. Impact of a 1 mm diameter hardened steel sphere on a block of B2O3 glass at
150 m.s-1
. Impact occurs between frames 1 and 2, resulting in compaction and densification
(see at arrow in frame 3) and plastic flow causing pile-up in frame 4. No cracks form during
loading. Unloading starts in frame 4 and in the next frame lateral cracks form (one lateral
crack is shown at L in frame 6). The sphere leaves the surface of the glass in frame 5 and is
followed by a ring of broken off material from the glass surface. Interframe time: 1.0 µs.
From Ref. [19].
Fig. 6. Cone cracks in fused silica produced by impact with 1 mm diameter hardened steel
spheres at different velocities. (a) Impact velocity: 25 m.s-1
and semi-included angle of the
cone : 68.5º; (b) Impact velocity 155 m.s-1
and semi-included angle of the cone : 46º; (c)
Impact velocity : 310 m.s-1
and semi-included angle of the cone: 32.5º. The width of field is
(a) 1.93 mm, (b) 5.27 mm, (c) 5.27 mm. From Ref. [20].
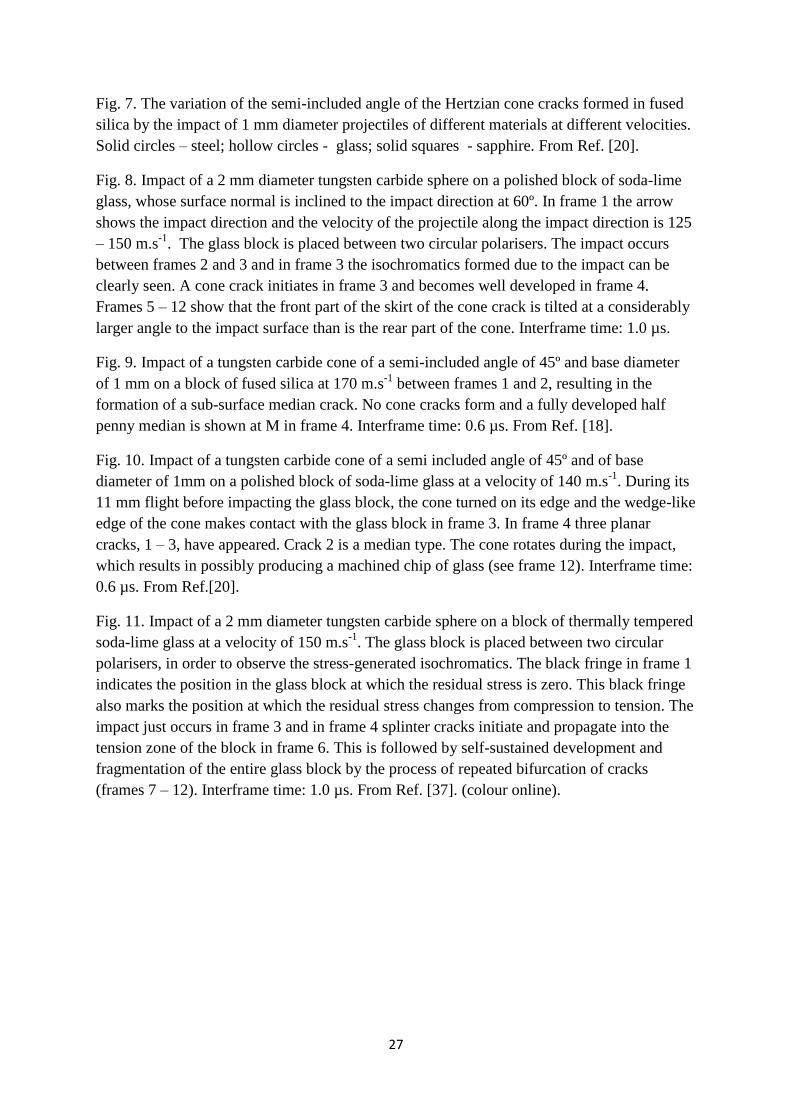
27
Fig. 7. The variation of the semi-included angle of the Hertzian cone cracks formed in fused
silica by the impact of 1 mm diameter projectiles of different materials at different velocities.
Solid circles – steel; hollow circles - glass; solid squares - sapphire. From Ref. [20].
Fig. 8. Impact of a 2 mm diameter tungsten carbide sphere on a polished block of soda-lime
glass, whose surface normal is inclined to the impact direction at 60º. In frame 1 the arrow
shows the impact direction and the velocity of the projectile along the impact direction is 125
– 150 m.s-1
. The glass block is placed between two circular polarisers. The impact occurs
between frames 2 and 3 and in frame 3 the isochromatics formed due to the impact can be
clearly seen. A cone crack initiates in frame 3 and becomes well developed in frame 4.
Frames 5 – 12 show that the front part of the skirt of the cone crack is tilted at a considerably
larger angle to the impact surface than is the rear part of the cone. Interframe time: 1.0 µs.
Fig. 9. Impact of a tungsten carbide cone of a semi-included angle of 45º and base diameter
of 1 mm on a block of fused silica at 170 m.s-1
between frames 1 and 2, resulting in the
formation of a sub-surface median crack. No cone cracks form and a fully developed half
penny median is shown at M in frame 4. Interframe time: 0.6 µs. From Ref. [18].
Fig. 10. Impact of a tungsten carbide cone of a semi included angle of 45º and of base
diameter of 1mm on a polished block of soda-lime glass at a velocity of 140 m.s-1
. During its
11 mm flight before impacting the glass block, the cone turned on its edge and the wedge-like
edge of the cone makes contact with the glass block in frame 3. In frame 4 three planar
cracks, 1 – 3, have appeared. Crack 2 is a median type. The cone rotates during the impact,
which results in possibly producing a machined chip of glass (see frame 12). Interframe time:
0.6 µs. From Ref.[20].
Fig. 11. Impact of a 2 mm diameter tungsten carbide sphere on a block of thermally tempered
soda-lime glass at a velocity of 150 m.s-1
. The glass block is placed between two circular
polarisers, in order to observe the stress-generated isochromatics. The black fringe in frame 1
indicates the position in the glass block at which the residual stress is zero. This black fringe
also marks the position at which the residual stress changes from compression to tension. The
impact just occurs in frame 3 and in frame 4 splinter cracks initiate and propagate into the
tension zone of the block in frame 6. This is followed by self-sustained development and
fragmentation of the entire glass block by the process of repeated bifurcation of cracks
(frames 7 – 12). Interframe time: 1.0 µs. From Ref. [37]. (colour online).
28
Fig. 1

29
Fig. 2

30
Fig. 3

31
Fig. 4

32
Fig. 5
33
Fig. 6

34
Fig. 7
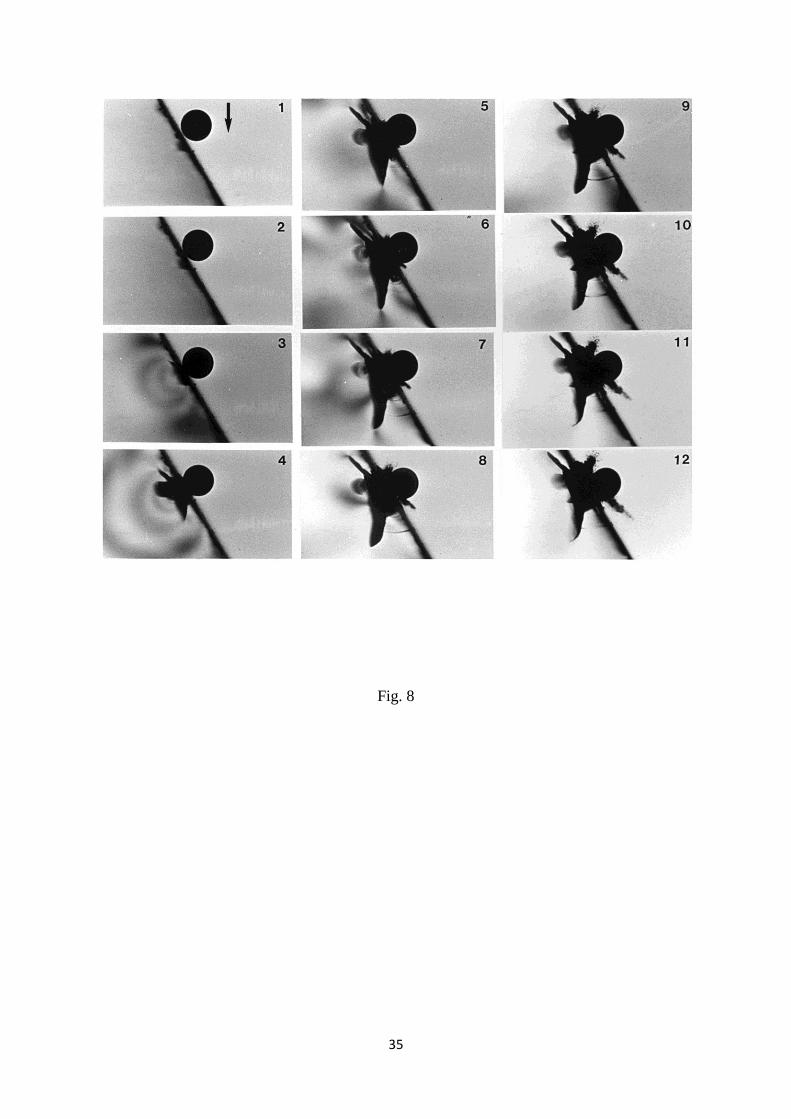
35
Fig. 8
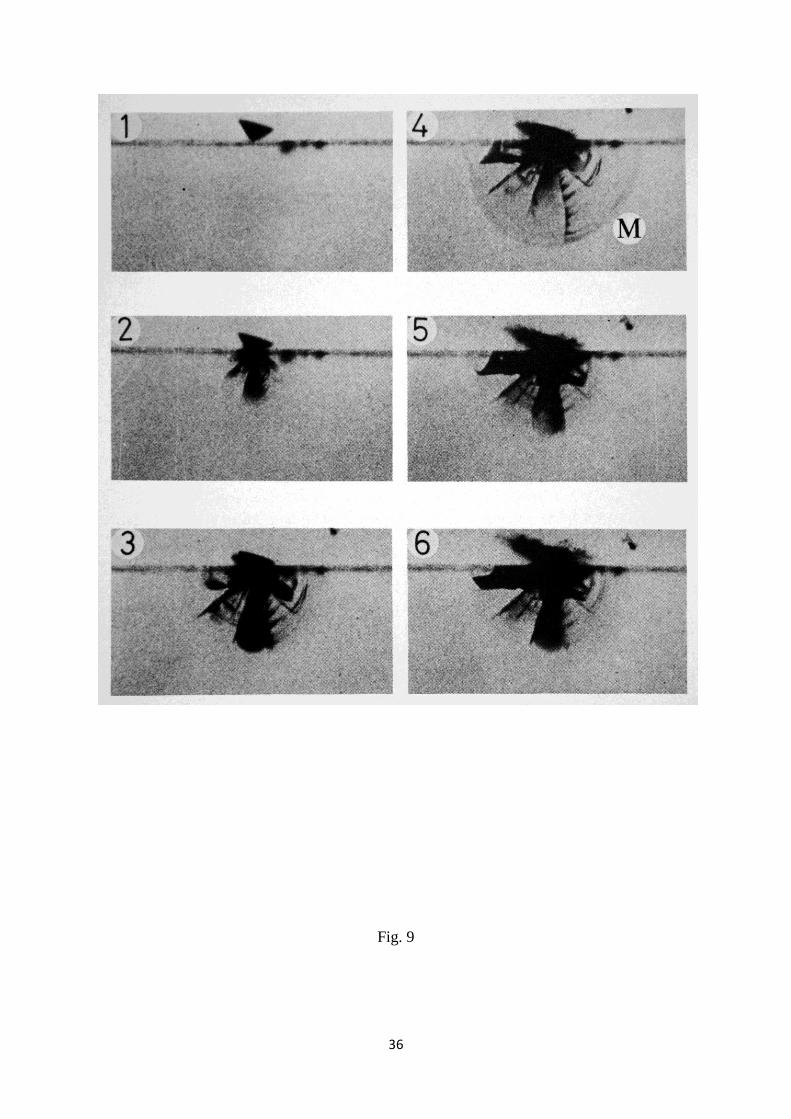
36
Fig. 9
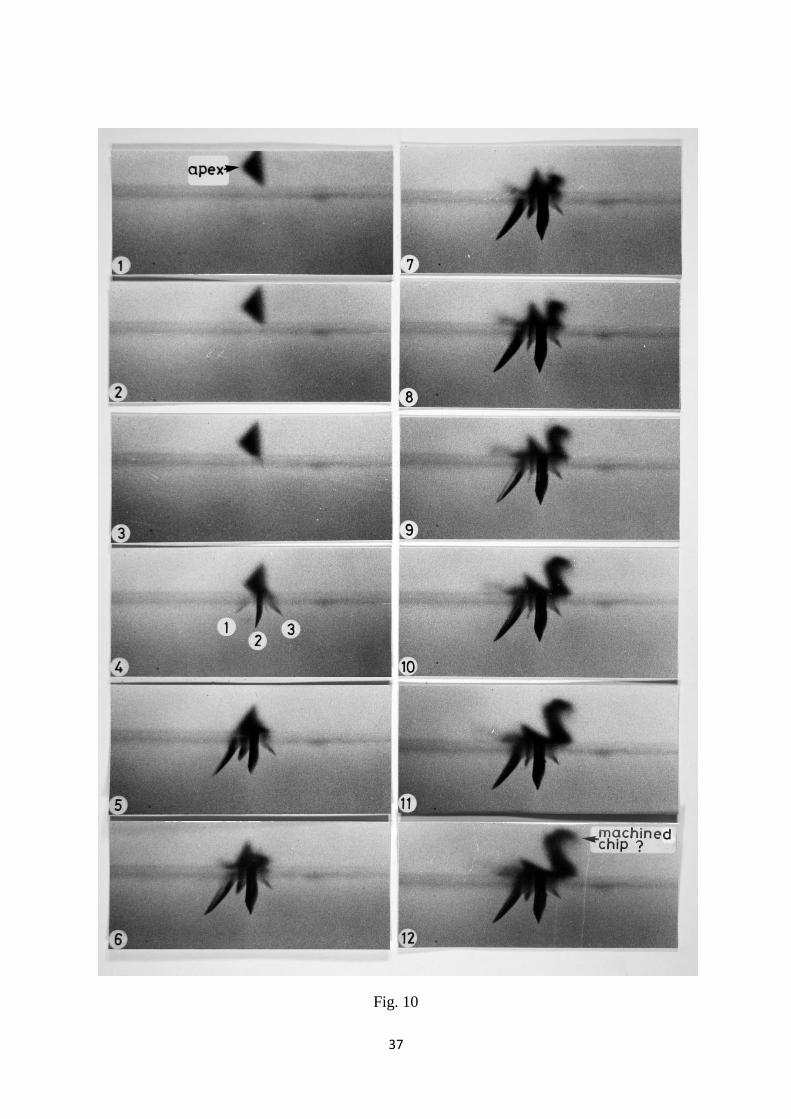
37
Fig. 10
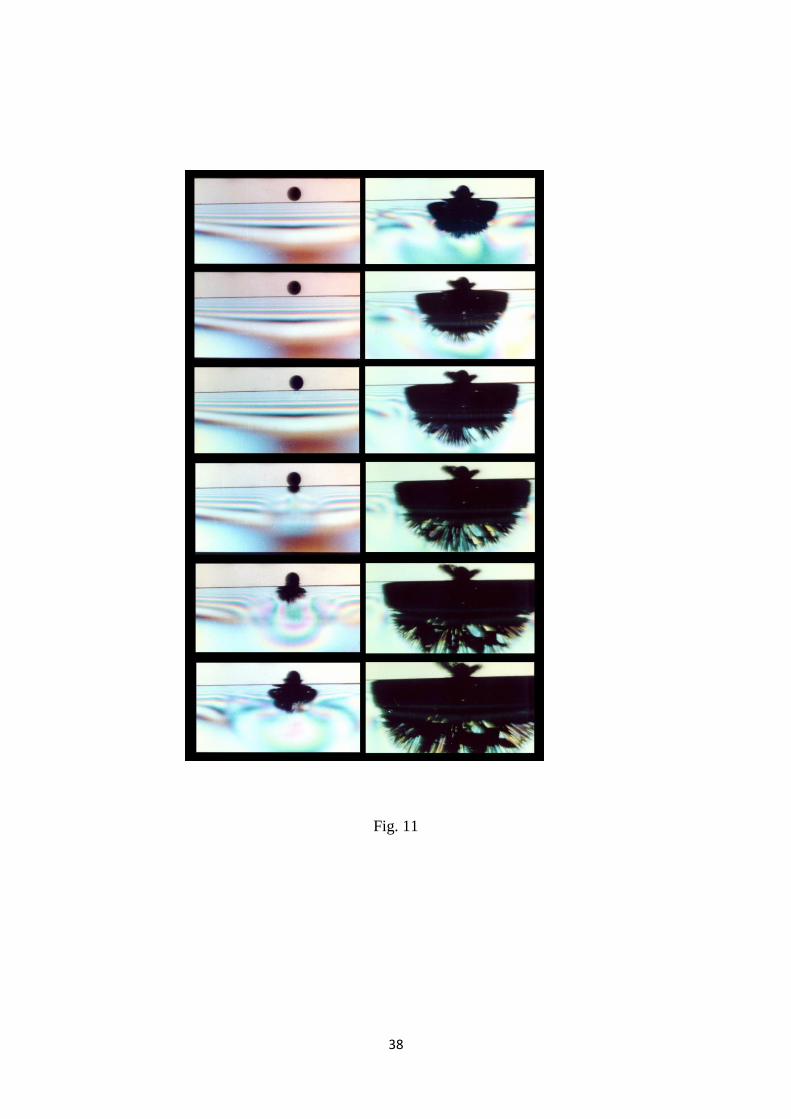
38
Fig. 11