
Spectroscopic infrared ellipsometry on functional polymer films
Upload
independentCategory
view
1download
0
Ae
MD
a
ARR2A
KPDFFFN
1
paflsWtbsplpbwta
1d
Spectrochimica Acta Part A 85 (2012) 241– 250
Contents lists available at SciVerse ScienceDirect
Spectrochimica Acta Part A: Molecular andBiomolecular Spectroscopy
j ourna l ho me page: www.elsev ier .com/ locate /saa
structural and spectroscopic study on para-aminohippuric acid withxperimental and theoretical approaches
ehmet Karabacak, Zeliha Cinar, Mehmet Cinar ∗
epartment of Physics, Afyon Kocatepe University, 03040 Afyonkarahisar, Turkey
r t i c l e i n f o
rticle history:eceived 20 August 2011eceived in revised form5 September 2011ccepted 1 October 2011
eywords:ara-aminohippuric acidFTT-IRT-Raman and UV spectrarontier molecular orbitals
a b s t r a c t
In this work, the molecular conformation, vibrational and electronic analysis of para-aminohippuricacid (pAHA, C9H10N2O3) were presented for the ground state using experimental techniques (FT-IR, FT-Raman and UV) and density functional theory (DFT) employing B3LYP exchange correlation with the6-311++G(d,p) basis set. FT-IR and FT-Raman spectra were recorded in the regions of 400–4000 cm−1
and 50–4000 cm−1, respectively. The UV absorption spectra of the compound that dissolved in ethanoland water solution were recorded in the range of 190–400 nm. Potential energy curve was computedby means of scanning NCC O torsion angle. The geometry optimization and the energies associatedpossible four conformers (C1–C4) were computed. The computational results diagnose the most sta-ble conformer of pAHA as the C1 form. Optimized structure of compound was interpreted and comparedwith the earlier reported experimental values. The complete assignments of fundamental vibrations wereperformed on the basis of the total energy distribution (TED) of the vibrational modes, calculated with
LO scaled quantum mechanics (SQM) method. A study on the electronic properties, such as frontier molec-ular energies, absorption wavelengths and oscillator strengths, were predicted by time-dependent DFT(TD-DFT) approach, while taking solvent effects into account. To investigate non-linear optical proper-ties: polarizability, anisotropy of polarizability and molecular first hyperpolarizability of molecule werecomputed. Thermodynamic properties (heat capacity, entropy and enthalpy) of the title compound atdifferent temperatures were calculated.
. Introduction
Amino acids and its compounds also with different metal ionslay an important role in biology, pharmacy and industry [1]. Para-minohippuric acid is used to determine the effective renal plasmaow being freely filtered at the glomerular level but it is also exten-ively secreted and very poorly reabsorbed within the tubules.
hen pAHA introduced into the bloodstream and kept at rela-ively low plasma concentrations, is rapidly excreted into the uriney both glomerular filtration and tubular secretion. Hence, lots oftudies depend on clearance or measuring the concentration ofAHA in biological fluids have been reported [2–9]. However, the
iterature based on the spectroscopic behaviors of pAHA is quiteoor. The geometric structure of present compound determinedy Chakrabarti and Dattagupta [10] and by Dobson and Gerkinith hydrogen-bonding geometry [11]. Badawi and Al-Saadi inves-
igated the molecular structure and vibrational spectra of hippuricnd 4-aminohippuric acids [12].
∗ Corresponding author. Tel.: +90 272 2281311; fax: +90 272 2281235.E-mail address: [email protected] (M. Cinar).
386-1425/$ – see front matter © 2011 Elsevier B.V. All rights reserved.oi:10.1016/j.saa.2011.10.001
© 2011 Elsevier B.V. All rights reserved.
The analysis of the vibrational and UV spectra is indeed veryhelpful not only for the structural characterization of molecularcompounds but also because detailed information on the electronicresponse can be derived from spectroscopic observables. In thisstudy, a detailed interpretation of the vibrational spectra of pAHAhas been made on the basis of the calculated TED and recordedvibrational spectra. An experimental (UV) and theoretical (TD-DFT)investigation on electronic system was evaluated and electronicfeatures of studied compound were examined. In addition, non-linear optical (NLO) and thermo-dynamical properties were studiedusing DFT method. TED calculations were performed by using paral-lel quantum solution (PQS) program [13] and remainder theoreticalstudies were carried out using Gaussian 09 program package on thepersonal computer [14].
2. Experimental
The pAHA sample in solid state was purchased from AcrosOrganics Company with a stated purity 99% and it was used as
such without further purification. The standard KBr technique with1 mg of sample per 200 mg of KBr was used. The FT-IR spectrum ofmolecule was recorded in the region 400–4000 cm−1 on a PerkinElmer FT-IR System Spectrum BX spectrometer calibrated using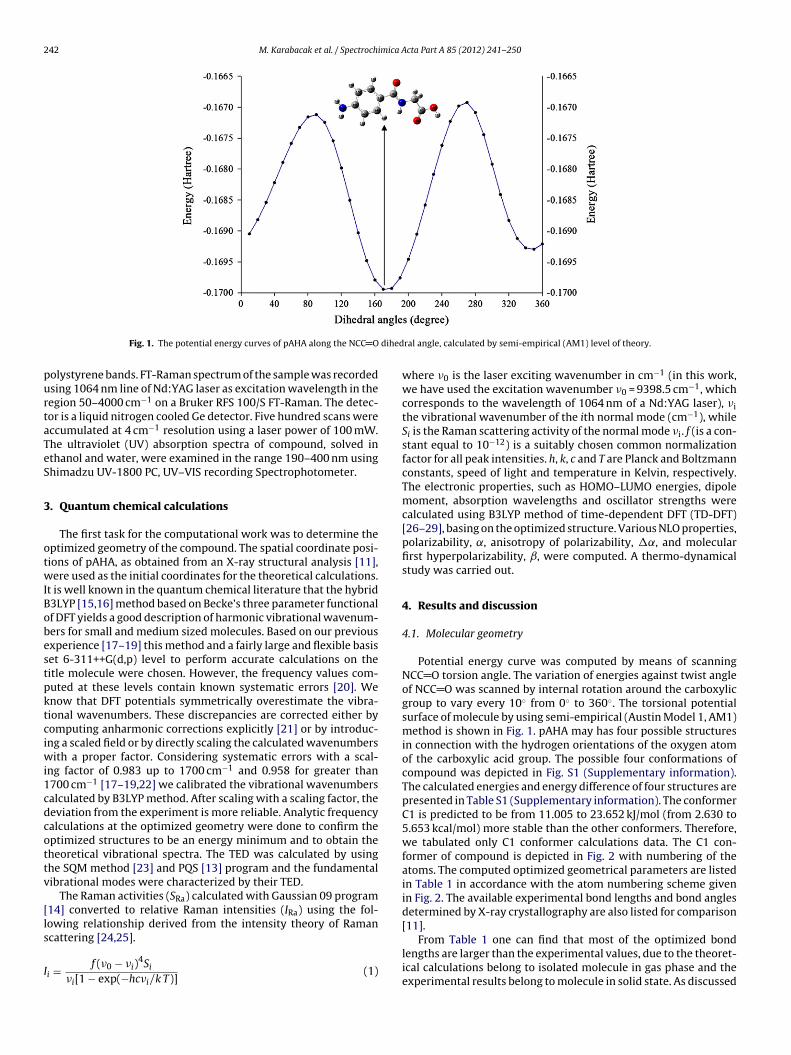
242 M. Karabacak et al. / Spectrochimica Acta Part A 85 (2012) 241– 250
dihed
purtaTeS
3
otwIBobestpktciwi1cdcottv
[ls
I
Fig. 1. The potential energy curves of pAHA along the NCC O
olystyrene bands. FT-Raman spectrum of the sample was recordedsing 1064 nm line of Nd:YAG laser as excitation wavelength in theegion 50–4000 cm−1 on a Bruker RFS 100/S FT-Raman. The detec-or is a liquid nitrogen cooled Ge detector. Five hundred scans wereccumulated at 4 cm−1 resolution using a laser power of 100 mW.he ultraviolet (UV) absorption spectra of compound, solved inthanol and water, were examined in the range 190–400 nm usinghimadzu UV-1800 PC, UV–VIS recording Spectrophotometer.
. Quantum chemical calculations
The first task for the computational work was to determine theptimized geometry of the compound. The spatial coordinate posi-ions of pAHA, as obtained from an X-ray structural analysis [11],ere used as the initial coordinates for the theoretical calculations.
t is well known in the quantum chemical literature that the hybrid3LYP [15,16] method based on Becke’s three parameter functionalf DFT yields a good description of harmonic vibrational wavenum-ers for small and medium sized molecules. Based on our previousxperience [17–19] this method and a fairly large and flexible basiset 6-311++G(d,p) level to perform accurate calculations on theitle molecule were chosen. However, the frequency values com-uted at these levels contain known systematic errors [20]. Wenow that DFT potentials symmetrically overestimate the vibra-ional wavenumbers. These discrepancies are corrected either byomputing anharmonic corrections explicitly [21] or by introduc-ng a scaled field or by directly scaling the calculated wavenumbers
ith a proper factor. Considering systematic errors with a scal-ng factor of 0.983 up to 1700 cm−1 and 0.958 for greater than700 cm−1 [17–19,22] we calibrated the vibrational wavenumbersalculated by B3LYP method. After scaling with a scaling factor, theeviation from the experiment is more reliable. Analytic frequencyalculations at the optimized geometry were done to confirm theptimized structures to be an energy minimum and to obtain theheoretical vibrational spectra. The TED was calculated by usinghe SQM method [23] and PQS [13] program and the fundamentalibrational modes were characterized by their TED.
The Raman activities (SRa) calculated with Gaussian 09 program14] converted to relative Raman intensities (IRa) using the fol-owing relationship derived from the intensity theory of Raman
cattering [24,25].i = f (�0 − �i)4Si
�i[1 − exp(−hc�i/k T)](1)
ral angle, calculated by semi-empirical (AM1) level of theory.
where �0 is the laser exciting wavenumber in cm−1 (in this work,we have used the excitation wavenumber �0 = 9398.5 cm−1, whichcorresponds to the wavelength of 1064 nm of a Nd:YAG laser), �ithe vibrational wavenumber of the ith normal mode (cm−1), whileSi is the Raman scattering activity of the normal mode �i. f (is a con-stant equal to 10−12) is a suitably chosen common normalizationfactor for all peak intensities. h, k, c and T are Planck and Boltzmannconstants, speed of light and temperature in Kelvin, respectively.The electronic properties, such as HOMO–LUMO energies, dipolemoment, absorption wavelengths and oscillator strengths werecalculated using B3LYP method of time-dependent DFT (TD-DFT)[26–29], basing on the optimized structure. Various NLO properties,polarizability, ˛, anisotropy of polarizability, �˛, and molecularfirst hyperpolarizability, ˇ, were computed. A thermo-dynamicalstudy was carried out.
4. Results and discussion
4.1. Molecular geometry
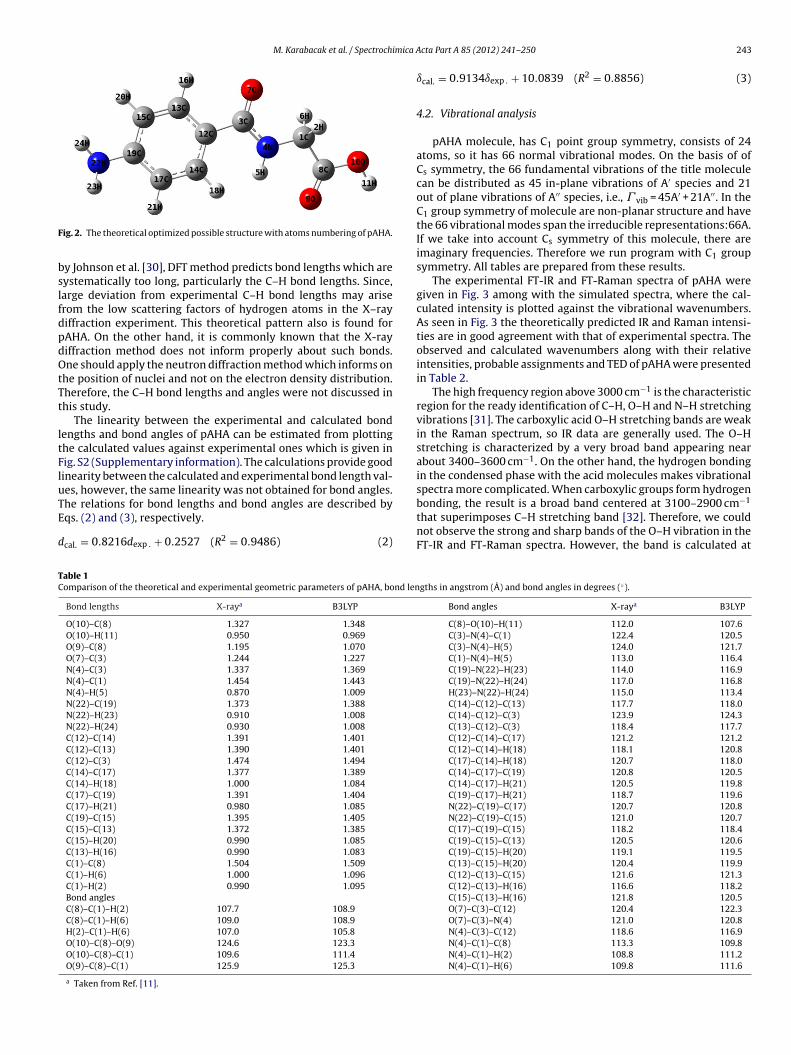
Potential energy curve was computed by means of scanningNCC O torsion angle. The variation of energies against twist angleof NCC O was scanned by internal rotation around the carboxylicgroup to vary every 10◦ from 0◦ to 360◦. The torsional potentialsurface of molecule by using semi-empirical (Austin Model 1, AM1)method is shown in Fig. 1. pAHA may has four possible structuresin connection with the hydrogen orientations of the oxygen atomof the carboxylic acid group. The possible four conformations ofcompound was depicted in Fig. S1 (Supplementary information).The calculated energies and energy difference of four structures arepresented in Table S1 (Supplementary information). The conformerC1 is predicted to be from 11.005 to 23.652 kJ/mol (from 2.630 to5.653 kcal/mol) more stable than the other conformers. Therefore,we tabulated only C1 conformer calculations data. The C1 con-former of compound is depicted in Fig. 2 with numbering of theatoms. The computed optimized geometrical parameters are listedin Table 1 in accordance with the atom numbering scheme givenin Fig. 2. The available experimental bond lengths and bond anglesdetermined by X-ray crystallography are also listed for comparison[11].
From Table 1 one can find that most of the optimized bondlengths are larger than the experimental values, due to the theoret-ical calculations belong to isolated molecule in gas phase and theexperimental results belong to molecule in solid state. As discussed
M. Karabacak et al. / Spectrochimica A
F
bslfdpdOtTt
ltFluTE
d
−1
TC
ig. 2. The theoretical optimized possible structure with atoms numbering of pAHA.
y Johnson et al. [30], DFT method predicts bond lengths which areystematically too long, particularly the C–H bond lengths. Since,arge deviation from experimental C–H bond lengths may ariserom the low scattering factors of hydrogen atoms in the X–rayiffraction experiment. This theoretical pattern also is found forAHA. On the other hand, it is commonly known that the X-rayiffraction method does not inform properly about such bonds.ne should apply the neutron diffraction method which informs on
he position of nuclei and not on the electron density distribution.herefore, the C–H bond lengths and angles were not discussed inhis study.
The linearity between the experimental and calculated bondengths and bond angles of pAHA can be estimated from plottinghe calculated values against experimental ones which is given inig. S2 (Supplementary information). The calculations provide goodinearity between the calculated and experimental bond length val-es, however, the same linearity was not obtained for bond angles.
he relations for bond lengths and bond angles are described byqs. (2) and (3), respectively.cal. = 0.8216dexp . + 0.2527 (R2 = 0.9486) (2)
able 1omparison of the theoretical and experimental geometric parameters of pAHA, bond len
Bond lengths X-raya B3LYP
O(10)–C(8) 1.327 1.348
O(10)–H(11) 0.950 0.969
O(9)–C(8) 1.195 1.070
O(7)–C(3) 1.244 1.227
N(4)–C(3) 1.337 1.369
N(4)–C(1) 1.454 1.443
N(4)–H(5) 0.870 1.009
N(22)–C(19) 1.373 1.388
N(22)–H(23) 0.910 1.008
N(22)–H(24) 0.930 1.008
C(12)–C(14) 1.391 1.401
C(12)–C(13) 1.390 1.401
C(12)–C(3) 1.474 1.494
C(14)–C(17) 1.377 1.389
C(14)–H(18) 1.000 1.084
C(17)–C(19) 1.391 1.404
C(17)–H(21) 0.980 1.085
C(19)–C(15) 1.395 1.405
C(15)–C(13) 1.372 1.385
C(15)–H(20) 0.990 1.085
C(13)–H(16) 0.990 1.083
C(1)–C(8) 1.504 1.509
C(1)–H(6) 1.000 1.096
C(1)–H(2) 0.990 1.095
Bond anglesC(8)–C(1)–H(2) 107.7 108.9
C(8)–C(1)–H(6) 109.0 108.9
H(2)–C(1)–H(6) 107.0 105.8
O(10)–C(8)–O(9) 124.6 123.3
O(10)–C(8)–C(1) 109.6 111.4
O(9)–C(8)–C(1) 125.9 125.3
a Taken from Ref. [11].
cta Part A 85 (2012) 241– 250 243
ıcal. = 0.9134ıexp . + 10.0839 (R2 = 0.8856) (3)
4.2. Vibrational analysis
pAHA molecule, has C1 point group symmetry, consists of 24atoms, so it has 66 normal vibrational modes. On the basis of ofCs symmetry, the 66 fundamental vibrations of the title moleculecan be distributed as 45 in-plane vibrations of A′ species and 21out of plane vibrations of A′′ species, i.e., � vib = 45A′ + 21A′′. In theC1 group symmetry of molecule are non-planar structure and havethe 66 vibrational modes span the irreducible representations:66A.If we take into account Cs symmetry of this molecule, there areimaginary frequencies. Therefore we run program with C1 groupsymmetry. All tables are prepared from these results.
The experimental FT-IR and FT-Raman spectra of pAHA weregiven in Fig. 3 among with the simulated spectra, where the cal-culated intensity is plotted against the vibrational wavenumbers.As seen in Fig. 3 the theoretically predicted IR and Raman intensi-ties are in good agreement with that of experimental spectra. Theobserved and calculated wavenumbers along with their relativeintensities, probable assignments and TED of pAHA were presentedin Table 2.
The high frequency region above 3000 cm−1 is the characteristicregion for the ready identification of C–H, O–H and N–H stretchingvibrations [31]. The carboxylic acid O–H stretching bands are weakin the Raman spectrum, so IR data are generally used. The O–Hstretching is characterized by a very broad band appearing nearabout 3400–3600 cm−1. On the other hand, the hydrogen bondingin the condensed phase with the acid molecules makes vibrationalspectra more complicated. When carboxylic groups form hydrogen
bonding, the result is a broad band centered at 3100–2900 cmthat superimposes C–H stretching band [32]. Therefore, we couldnot observe the strong and sharp bands of the O–H vibration in theFT-IR and FT-Raman spectra. However, the band is calculated atgths in angstrom (Å) and bond angles in degrees (◦).
Bond angles X-raya B3LYP
C(8)–O(10)–H(11) 112.0 107.6C(3)–N(4)–C(1) 122.4 120.5C(3)–N(4)–H(5) 124.0 121.7C(1)–N(4)–H(5) 113.0 116.4C(19)–N(22)–H(23) 114.0 116.9C(19)–N(22)–H(24) 117.0 116.8H(23)–N(22)–H(24) 115.0 113.4C(14)–C(12)–C(13) 117.7 118.0C(14)–C(12)–C(3) 123.9 124.3C(13)–C(12)–C(3) 118.4 117.7C(12)–C(14)–C(17) 121.2 121.2C(12)–C(14)–H(18) 118.1 120.8C(17)–C(14)–H(18) 120.7 118.0C(14)–C(17)–C(19) 120.8 120.5C(14)–C(17)–H(21) 120.5 119.8C(19)–C(17)–H(21) 118.7 119.6N(22)–C(19)–C(17) 120.7 120.8N(22)–C(19)–C(15) 121.0 120.7C(17)–C(19)–C(15) 118.2 118.4C(19)–C(15)–C(13) 120.5 120.6C(19)–C(15)–H(20) 119.1 119.5C(13)–C(15)–H(20) 120.4 119.9C(12)–C(13)–C(15) 121.6 121.3C(12)–C(13)–H(16) 116.6 118.2C(15)–C(13)–H(16) 121.8 120.5O(7)–C(3)–C(12) 120.4 122.3O(7)–C(3)–N(4) 121.0 120.8N(4)–C(3)–C(12) 118.6 116.9N(4)–C(1)–C(8) 113.3 109.8N(4)–C(1)–H(2) 108.8 111.2N(4)–C(1)–H(6) 109.8 111.6

244 M. Karabacak et al. / Spectrochimica Acta Part A 85 (2012) 241– 250
d infr
3icpw
ai3rwNi1aFigwimos
Ct
Fig. 3. The observed and simulate
697 cm−1, may be due to the presence of strong hydrogen bond-ng in the OH group. While the in-plane O–H bending modes werealculated at 1117 and 1262 cm−1, the out-of-plane modes wereredicted at 492 and 622 cm−1 which show excellent agreementith experimental FT-IR values of 485 and 624 cm−1.
The symmetric and asymmetric stretch due to the amino groupnd NH stretching appear in the spectral region as O–H stretch-ng bands. The amino group bands were obtained at 3383 and472 cm−1 in FT-IR for symmetric and asymmetric stretching,espectively. According to the computed results, the N–H stretchas calculated with a value between symmetric and asymmetricH2 stretching, 3619 cm−1, and cannot be observed in the exper-
mental spectra. The NH2 scissoring deformation appears in the638–1575 cm−1 region with strong to very strong IR intensity. Wessigned the band at 1600 cm−1 (FT-IR) and corresponding band inT-Raman spectrum at 1594 cm−1 due to the NH2 scissoring, whichs in coincidence with theoretical value of 1594 cm−1. The NH2 wag-ing modes recorded at 472 and 509 cm−1 are in good agreementith theoretical results of 465 and 501 cm−1. The computed rock-
ng and twisting modes of amino group at 363 and 318 cm−1 areissing in both FT-IR and FT-Raman spectra. The pure mode of
ut-of-plane bending of NH was obtained in FR-IR at 448 cm−1 and
hows excellent agreement with predicted value.The band observed in the 1700–1800 cm−1 region due to theO stretching vibration is one of the characteristic features of
he carboxylic group. On this basis, the vibrational wavenumber
ared and Raman spectra of pAHA.
at 1745 cm−1 recorded in FT-IR and 1734 cm−1 in FT-Raman spec-trum were assigned to C O stretching mode. The other C O doublebond stretching was obtained at 1647 and 1642 cm−1 in FT-IR andFT-Raman, respectively. According to their TED, both of are puremodes.
In the present study, the four adjacent hydrogen atoms aroundthe ring give rise four C–H stretching modes, four in plane andfour out-of-plane bending vibrations. As expected, all stretchingvibrations are pure modes since their TED contributions are ca.100%. The C–H in-plane bending frequencies appear in the range of1000–1300 cm−1 and C–H out-of-plane bending vibration in rangeof 750–1000 cm−1. Both in-plane and out–of-plane C–H bend-ing vibrations were assigned in the range that mentioned above.According to the calculated TED, the out-of-plane vibrations aredescribed as pure and in-planes are mixed modes. The change inthe frequencies of these deformations from the values in benzeneis almost determined exclusively by the relative position of thesubstituents and is almost independent of their nature [33].
The asymmetric stretching for the CH2, NH2 and CH3 has magni-tude higher than the symmetric stretching [34,35]. The asymmetricand symmetric CH2 stretching appears strongly at ca. 2926 and2853 cm−1 in IR and Raman [34]. The asymmetric CH2 stretch cal-
culated with B3LYP after scaling down gives the value of 3001 cm−1while the symmetric stretch was calculated at 2981 cm−1. Accord-ing to the calculated TED, our calculations show that they are purevibrations. The scissoring mode of the CH2 group gives rise to a

M. Karabacak et al. / Spectrochimica Acta Part A 85 (2012) 241– 250 245
Table 2The observed FT-IR, FT-Raman and calculated wavenumbers (in cm−1) using B3LYP/6-311++G(d,p) along with their relative intensities, probable assignments and total energydistribution (TED) of pAHA.
No. Experimental Unscaledwavenumbers
Scaledwavenumbers
IInfrared SRaman IRaman TED (>10%)
FT-IR FT-Raman
�1 3761 3697 92.73 159.67 0.03 �OH (100)�2 3472 3681 3619 21.50 67.24 0.01 �NHasym (100)�3 3619 3557 56.81 58.44 0.01 �NH (100)�4 3383 3580 3519 42.63 300.91 0.07 �NHsym (100)�5 3250 3199 3145 2.65 85.92 0.03 �CHring (100)�6 3176 3122 10.71 114.65 0.04 �CHring sym (99)�7 3160 3106 16.83 104.36 0.04 �CHring (99)�8 3067 3052 3157 3104 15.21 66.74 0.03 �CHring asym (100)�9 3012 3053 3001 5.05 74.84 0.03 �CH2 asym (100)�10 3032 2981 30.45 163.44 0.07 �CH2 sym (100)�11 1745 1734 1809 1778 249.19 13.23 0.03 �C O (carboxyl group) (93)�12 1647 1642 1706 1677 296.27 89.27 0.25 �C O (80)�13 1600 1594 1664 1594 271.83 120.64 0.39 �NH2 (70)�14 1566 1563 1647 1578 88.40 149.91 0.50 �CCring (58) + �NH2 (24)�15 1553 1607 1540 15.86 15.71 0.06 �CCring (66)�16 1516 1554 1489 49.87 47.39 0.19 �CHring (38) + �CCring (21) + �NH (11)�17 1524 1460 421.73 12.90 0.05 �NH (40) + �CN (20)�18 1439 1436 1486 1424 29.95 4.83 0.02 �CH2 (95)�19 1411 1407 1463 1401 0.37 2.84 0.01 �CHring (37) + �CCring (36)�20 1346 1345 1412 1353 328.25 19.29 0.10 �CH2 (31) + �C–CH2 (20) + �OH (15)�21 1317 1322 1362 1304 0.49 1.98 0.01 �CCring (50) + �CHring (25) + rNH2 (14)�22 1299 1301 1335 1279 1.59 2.20 0.01 �CHring (51) + �CCring (33)�23 1317 1262 3.25 11.63 0.07 �OH (35) + �C–NH2 (11)�24 1257 1255 1313 1258 86.47 23.41 0.14 �C–NH2 (40) + �CCring (20) + �OH (11)�25 1264 1211 75.78 147.98 1.00 �NH (32) + �C-ring (16) + �OH (11)�26 1184 1187 1236 1184 0.95 7.99 0.06 tCH2 (90)�27 1164 1212 1161 23.99 6.34 0.05 �CHring (53) + �CCring (16) + �N–CH2 (12)�28 1188 1138 141.17 36.46 0.29 �N–CH2 (29) + �CHring (21)) + �CC (11)�29 1166 1117 270.38 1.30 0.01 �CO (carboxyl group) (32) + �OH
(22)) + �CC (13)�30 1136 1133 1152 1103 57.49 5.15 0.04 �CHring (58) + �CCring (19) + rNH2 (11)�31 1085 1066 1095 1049 49.04 0.40 0.00 �CN (41) + rNH2 (11)�32 1012 1072 1027 2.96 1.71 0.02 rNH2 (52) + �CCCring breathing (24)�33 996 994 1025 982 0.05 0.15 0.00 �CCCring deformation (65) + �CHring (30)�34 1013 970 2.93 0.60 0.01 rCH2 (74)�35 955 944 988 947 1.37 0.14 0.00 �CHring (88)�36 952 912 0.16 0.42 0.01 �CHring (89)�37 885 884 941 901 30.44 29.30 0.41 �C–CH2 (33) + �OCN (14) + �CNC (11)�38 842 854 857 821 8.24 16.42 0.29 Ring breathing (42) + �C–CH2 (13) + �CCCH
(11)�39 851 815 27.36 2.73 0.05 �CHring (52)�40 821 787 1.90 2.76 0.05 �CHring (65)�41 770 771 818 784 0.30 12.09 0.24 �CHring (22) + �C–CH2 (13) + �C–NH2 (11)�42 779 746 30.29 4.80 0.11 �CNCO (35) + �CCCH (19) + �CCCC (15)�43 666 704 674 11.90 0.19 0.01 �CCCC (37) + �CCCH (24) + �CNCO (24)�44 636 653 626 0.85 5.92 0.19 �CCCring deformation (77)�45 624 649 622 107.42 0.27 0.01 �OH (74) + rCH2 (12)�46 638 611 12.94 1.44 0.05 �COC (52) + �CCC (15)�47 550 555 620 594 16.79 1.95 0.07 �COC (30) + �CCO (15) + �CCN (14)�48 527 549 526 70.37 0.31 0.02 �CCN (29) + �CCO (17) + �OCO (11)�49 509 523 501 30.61 3.71 0.20 �NH2 (34) + �CCCH (22) + �CCCC (13)�50 485 514 492 9.00 3.98 0.22 �OH (41) + rCH2(35) + �OCCN (11)�51 472 486 465 376.33 15.67 1.00 �NH2 (65) + �NH (11)�52 448 469 449 51.51 1.03 0.07 �NH (52)�53 427 418 427 409 13.53 0.44 0.04 rNH2 (18) + �CCO (11) + �CCCC (10)�54 410 415 397 4.69 0.18 0.02 �CCCCring (38) + �CCCH (18)�55 379 363 1.91 0.81 0.09 rNH2 (51)�56 332 318 15.58 0.18 0.00 tNH2 (97)�57 308 311 298 2.79 0.79 0.00 �OCN (28) + �C–COOH (20)�58 288 276 12.70 1.91 0.00 �CCCN (25) + �CCCC (19)�59 248 251 241 0.50 2.48 0.01 �CNC (36) + �NC–COOH (22)�60 188 201 193 14.23 0.36 0.00 �CCC (36) + �NC–COOH (30)�61 156 150 4.20 0.59 0.00 rCH2 (32) + �CCNC (21)�62 101 102 98 2.13 1.16 0.01 �CCCC (25) + �OCCN (16) + �OCCH (13)�63 70 67 3.93 0.72 0.01 �CCN (42) + �CCCN (15) + �CCCO (10)�64 58 55 6.09 1.03 0.01 �CCCN (31) + �CNCC (29)�65 46 44 0.18 0.20 0.00 �C–COOH (44) + �CCCN (30) + �CCCO (19)�66 21 20 0.17 3.31 0.13 �CNCC (36) + �CNCH (27) + �CCCN (24)
Wavenumbers (cm−1); IR intensities, IInfrared (K m/mol); Raman scattering activities, SRaman (Å amu−1); �, stretching; �, in-plane bending; �, out-of-plane bending; ω, wagging;�, scissoring; r, rocking; t, twisting.
246 M. Karabacak et al. / Spectrochimica Acta Part A 85 (2012) 241– 250
cI1
tcaimTa
ebe
�
4
evgeatauaiawha�
ltteafo(op
l an
d
calc
ula
ted
abso
rpti
on
wav
elen
gth
(, n
m),
exci
tati
on
ener
gies
(E, e
V),
abso
rban
ce
valu
es
and
osci
llat
or
stre
ngt
hs
(f, a
.u.)
of
pA
HA
in
gas
ph
ase,
eth
anol
and
wat
er
solu
tion
s.
ts
Exp
erim
enta
l
TD-D
FT
(B3L
YP)
/6-3
11++
G(d
,p)
Eth
anol
Wat
erM
ajor
con
trib
uti
ona
Gas
Eth
anol
Wat
er
(nm
)
E
(eV
)
Abs
.
(nm
)
E
(eV
)
Abs
.
(nm
)
E
(eV
)
f (a.
u.)
(nm
)
E
(eV
)
f (a.
u.)
(nm
)
E
(eV
)
f (a.
u.)
283
4.41
70
1.49
8
274
4.56
20
0.97
5
H
→
L +
2
(36%
)
269
4.61
65
0.09
66
274
4.52
12
0.46
30
274
4.52
08
0.46
2021
6
5.78
70
0.97
5
212
5.85
58
0.99
3
H
→
L (3
0%)
264
4.69
31
0.15
05
269
4.61
37
0.09
16
269
4.61
25
0.08
82H
→
L
+
3
(47%
)26
0
4.77
44
0.06
18
249
4.97
92
0.00
19
249
4.98
38
0.00
18
has
e
(≥30
);
H, H
OM
O;
L,
LUM
O.
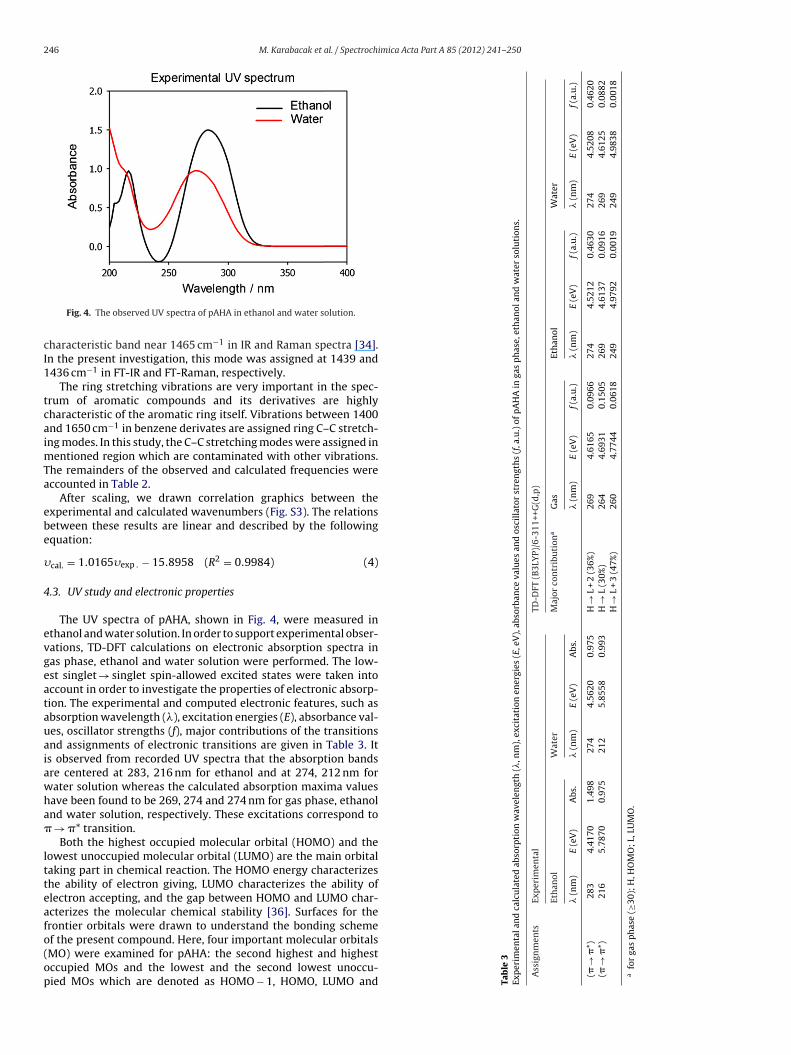
Fig. 4. The observed UV spectra of pAHA in ethanol and water solution.
haracteristic band near 1465 cm−1 in IR and Raman spectra [34].n the present investigation, this mode was assigned at 1439 and436 cm−1 in FT-IR and FT-Raman, respectively.
The ring stretching vibrations are very important in the spec-rum of aromatic compounds and its derivatives are highlyharacteristic of the aromatic ring itself. Vibrations between 1400nd 1650 cm−1 in benzene derivates are assigned ring C–C stretch-ng modes. In this study, the C–C stretching modes were assigned in
entioned region which are contaminated with other vibrations.he remainders of the observed and calculated frequencies wereccounted in Table 2.
After scaling, we drawn correlation graphics between thexperimental and calculated wavenumbers (Fig. S3). The relationsetween these results are linear and described by the followingquation:
cal. = 1.0165�exp . − 15.8958 (R2 = 0.9984) (4)
.3. UV study and electronic properties
The UV spectra of pAHA, shown in Fig. 4, were measured inthanol and water solution. In order to support experimental obser-ations, TD-DFT calculations on electronic absorption spectra inas phase, ethanol and water solution were performed. The low-st singlet → singlet spin-allowed excited states were taken intoccount in order to investigate the properties of electronic absorp-ion. The experimental and computed electronic features, such asbsorption wavelength (), excitation energies (E), absorbance val-es, oscillator strengths (f), major contributions of the transitionsnd assignments of electronic transitions are given in Table 3. Its observed from recorded UV spectra that the absorption bandsre centered at 283, 216 nm for ethanol and at 274, 212 nm forater solution whereas the calculated absorption maxima valuesave been found to be 269, 274 and 274 nm for gas phase, ethanolnd water solution, respectively. These excitations correspond to
→ �* transition.Both the highest occupied molecular orbital (HOMO) and the
owest unoccupied molecular orbital (LUMO) are the main orbitalaking part in chemical reaction. The HOMO energy characterizeshe ability of electron giving, LUMO characterizes the ability oflectron accepting, and the gap between HOMO and LUMO char-cterizes the molecular chemical stability [36]. Surfaces for therontier orbitals were drawn to understand the bonding scheme
f the present compound. Here, four important molecular orbitalsMO) were examined for pAHA: the second highest and highestccupied MOs and the lowest and the second lowest unoccu-ied MOs which are denoted as HOMO − 1, HOMO, LUMO and Table
3Ex
per
imen
ta
Ass
ign
men
(�→
�*)
(�→
�*)
afo
r
gas
p

M. Karabacak et al. / Spectrochimica Acta Part A 85 (2012) 241– 250 247
fronti
LFTtfTgpHic
TCa
Fig. 5. The frontier and second
UMO + 1, respectively. The features of these MOs can be seen inig. 5 (the positive phase is red and the negative one is green).he HOMO is located over the benzene ring and amino group,he HOMO → LUMO transition implies an electron density trans-er to C O and N–H group from the benzene ring and amino group.his electronic absorption corresponds to the transition from theround to the first excited state and due to the Frank–Condonrinciple, this peak (max) corresponds to vertical excitation. The
OMO and LUMO energy calculated by B3LYP method is shownn Table 4. Energy difference between HOMO and LUMO orbital isalled as energy gap that is an important stability for structures
able 4alculated frontier orbital energies (eV) and dipole moment (D) in gas phase, ethanolnd water solution.
Parameters Gas Ethanol Water
EHOMO −6.0519 −6.0881 −6.0924ELUMO −1.0177 −1.1796 −1.1902�EHOMO–LUMO 5.0341 4.9084 4.9022EHOMO−1 −7.0543 −7.2889 −7.2984ELUMO+1 −0.6463 −0.6893 −0.6953�EHOMO−1–LUMO+1 6.4081 6.5996 6.6032x −1.4762 −1.9556 −1.9786y −2.6943 −3.7679 −3.8294z 0.5210 0.6602 0.6689tot 3.1161 4.2962 4.3620
er molecular orbitals of pAHA.
[37] and is given in Table 4. Recently, the energy gap betweenHOMO and LUMO has been used to prove the bioactivity fromintramolecular charge transfer [38,39]. The major contributionsof the transitions were designated with the aid of Swizard pro-gram [40]. In view of calculated absorption spectra, the maximumabsorption wavelength corresponds to the electronic transitionfrom HOMO to LUMO + 2 with 36% contribution for gas phase. Theother wavelength, excitation energies, oscillator strengths, calcu-lated counterparts with major contributions and assignments canbe seen in Table 3. The dipole moment (�) for each condition werepresented in Table 4. We can say that in going from the gas phaseto the solvent phase, the dipole moment value increases (Table 4).
The calculation of effective atomic charges plays an impor-tant role in the application of quantum mechanical calculationsto molecular systems. We have examined the Mulliken atomiccharges both in gas phase and in solution (ethanol and water).In Table 5, the Mulliken atomic charges of pAHA calculated byDFT/B3LYP method using the 6-311++G(d,p) basis set are comparedand total charge of ring and tail part of compound was given. As canbe seen in Table 5 all hydrogen atoms have a net positive charge; inparticular, the hydrogen atom H11 that has charge of 0.292, 0.321and 0.322 for gas, ethanol and water solution, respectively. The
same effect can be seen for H5. If we consider the results, it maybe noted that the oxygen atoms (O7, O9) have large net negativecharge. The presence of large amounts of negative charge on oxy-gen atoms and net positive charge on hydrogen atom (H11) may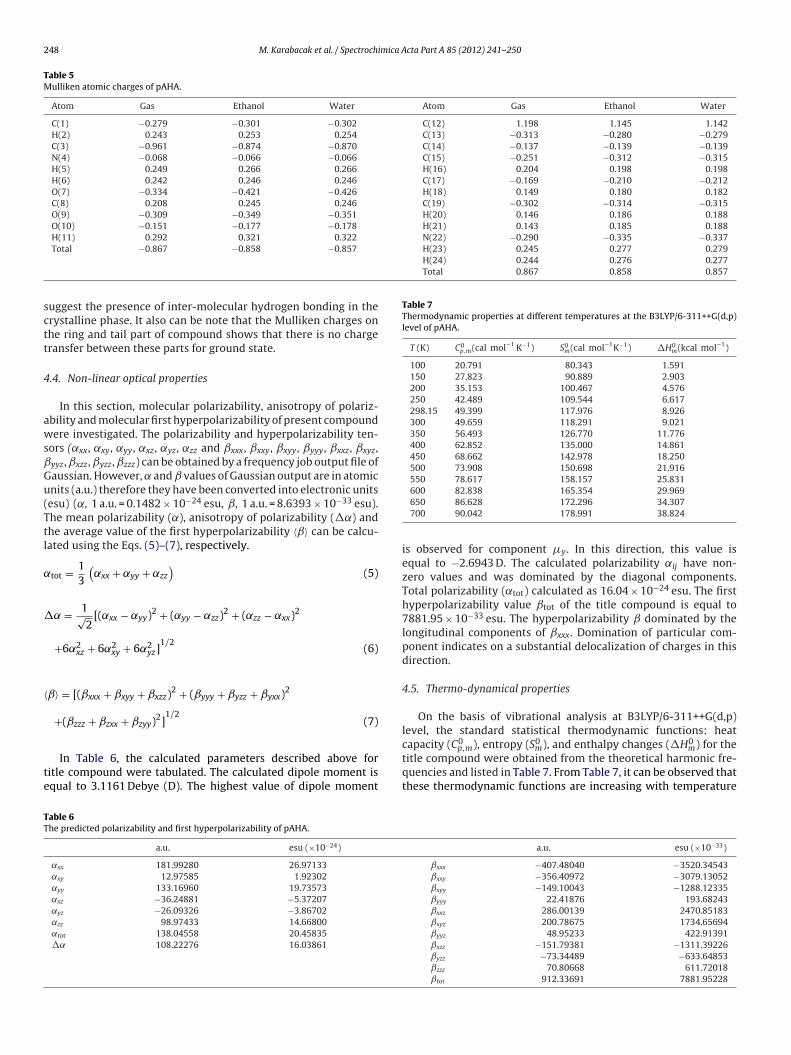
248 M. Karabacak et al. / Spectrochimica Acta Part A 85 (2012) 241– 250
Table 5Mulliken atomic charges of pAHA.
Atom Gas Ethanol Water Atom Gas Ethanol Water
C(1) −0.279 −0.301 −0.302 C(12) 1.198 1.145 1.142H(2) 0.243 0.253 0.254 C(13) −0.313 −0.280 −0.279C(3) −0.961 −0.874 −0.870 C(14) −0.137 −0.139 −0.139N(4) −0.068 −0.066 −0.066 C(15) −0.251 −0.312 −0.315H(5) 0.249 0.266 0.266 H(16) 0.204 0.198 0.198H(6) 0.242 0.246 0.246 C(17) −0.169 −0.210 −0.212O(7) −0.334 −0.421 −0.426 H(18) 0.149 0.180 0.182C(8) 0.208 0.245 0.246 C(19) −0.302 −0.314 −0.315O(9) −0.309 −0.349 −0.351 H(20) 0.146 0.186 0.188O(10) −0.151 −0.177 −0.178 H(21) 0.143 0.185 0.188H(11) 0.292 0.321 0.322 N(22) −0.290 −0.335 −0.337
H(23) 0.245 0.277 0.279H(24) 0.244 0.276 0.277Total 0.867 0.858 0.857
sctt
4
awsˇGu(Ttl
˛
�
〈
te
Table 7Thermodynamic properties at different temperatures at the B3LYP/6-311++G(d,p)level of pAHA.
T (K) C0p,m(cal mol−1 K−1) S0
m(cal mol−1K−1) �H0m(kcal mol−1)
100 20.791 80.343 1.591150 27.823 90.889 2.903200 35.153 100.467 4.576250 42.489 109.544 6.617298.15 49.399 117.976 8.926300 49.659 118.291 9.021350 56.493 126.770 11.776400 62.852 135.000 14.861450 68.662 142.978 18.250500 73.908 150.698 21.916550 78.617 158.157 25.831
TT
Total −0.867 −0.858 −0.857
uggest the presence of inter-molecular hydrogen bonding in therystalline phase. It also can be note that the Mulliken charges onhe ring and tail part of compound shows that there is no chargeransfer between these parts for ground state.
.4. Non-linear optical properties
In this section, molecular polarizability, anisotropy of polariz-bility and molecular first hyperpolarizability of present compoundere investigated. The polarizability and hyperpolarizability ten-
ors (˛xx, ˛xy, ˛yy, ˛xz, ˛yz, ˛zz and ˇxxx, ˇxxy, ˇxyy, ˇyyy, ˇxxz, ˇxyz,yyz, ˇxzz, ˇyzz, ˇzzz) can be obtained by a frequency job output file ofaussian. However, and values of Gaussian output are in atomicnits (a.u.) therefore they have been converted into electronic unitsesu) (˛, 1 a.u. = 0.1482 × 10⁻²⁴ esu, ˇ, 1 a.u. = 8.6393 × 10⁻³³ esu).he mean polarizability (˛), anisotropy of polarizability (�˛) andhe average value of the first hyperpolarizability 〈ˇ〉 can be calcu-ated using the Eqs. (5)–(7), respectively.
tot = 13
(˛xx + ˛yy + ˛zz
)(5)
= 1√2
[(˛xx − ˛yy)2 + (˛yy − ˛zz)2 + (˛zz − ˛xx)2
+6˛2xz + 6˛2
xy + 6˛2yz]
1/2(6)
ˇ〉 = [(ˇxxx + ˇxyy + ˇxzz)2 + (ˇyyy + ˇyzz + ˇyxx)2
+(ˇzzz + ˇzxx + ˇzyy)2]1/2
(7)
In Table 6, the calculated parameters described above foritle compound were tabulated. The calculated dipole moment isqual to 3.1161 Debye (D). The highest value of dipole moment
able 6he predicted polarizability and first hyperpolarizability of pAHA.
a.u. esu (×10−24)
˛xx 181.99280 26.97133
˛xy 12.97585 1.92302
˛yy 133.16960 19.73573
˛xz −36.24881 −5.37207
˛yz −26.09326 −3.86702
˛zz 98.97433 14.66800
˛tot 138.04558 20.45835
�˛ 108.22276 16.03861
600 82.838 165.354 29.969650 86.628 172.296 34.307700 90.042 178.991 38.824
is observed for component y. In this direction, this value isequal to −2.6943 D. The calculated polarizability ˛ij have non-zero values and was dominated by the diagonal components.Total polarizability (˛tot) calculated as 16.04 × 10⁻²⁴ esu. The firsthyperpolarizability value ˇtot of the title compound is equal to7881.95 × 10−33 esu. The hyperpolarizability dominated by thelongitudinal components of ˇxxx. Domination of particular com-ponent indicates on a substantial delocalization of charges in thisdirection.
4.5. Thermo-dynamical properties
On the basis of vibrational analysis at B3LYP/6-311++G(d,p)level, the standard statistical thermodynamic functions: heat
capacity (C0p,m), entropy (S0m), and enthalpy changes (�H0
m) for thetitle compound were obtained from the theoretical harmonic fre-quencies and listed in Table 7. From Table 7, it can be observed thatthese thermodynamic functions are increasing with temperature
a.u. esu (×10−33)
ˇxxx −407.48040 −3520.34543ˇxxy −356.40972 −3079.13052ˇxyy −149.10043 −1288.12335ˇyyy 22.41876 193.68243ˇxxz 286.00139 2470.85183ˇxyz 200.78675 1734.65694ˇyyz 48.95233 422.91391ˇxzz −151.79381 −1311.39226ˇyzz −73.34489 −633.64853ˇzzz 70.80668 611.72018ˇtot 912.33691 7881.95228
M. Karabacak et al. / Spectrochimica A
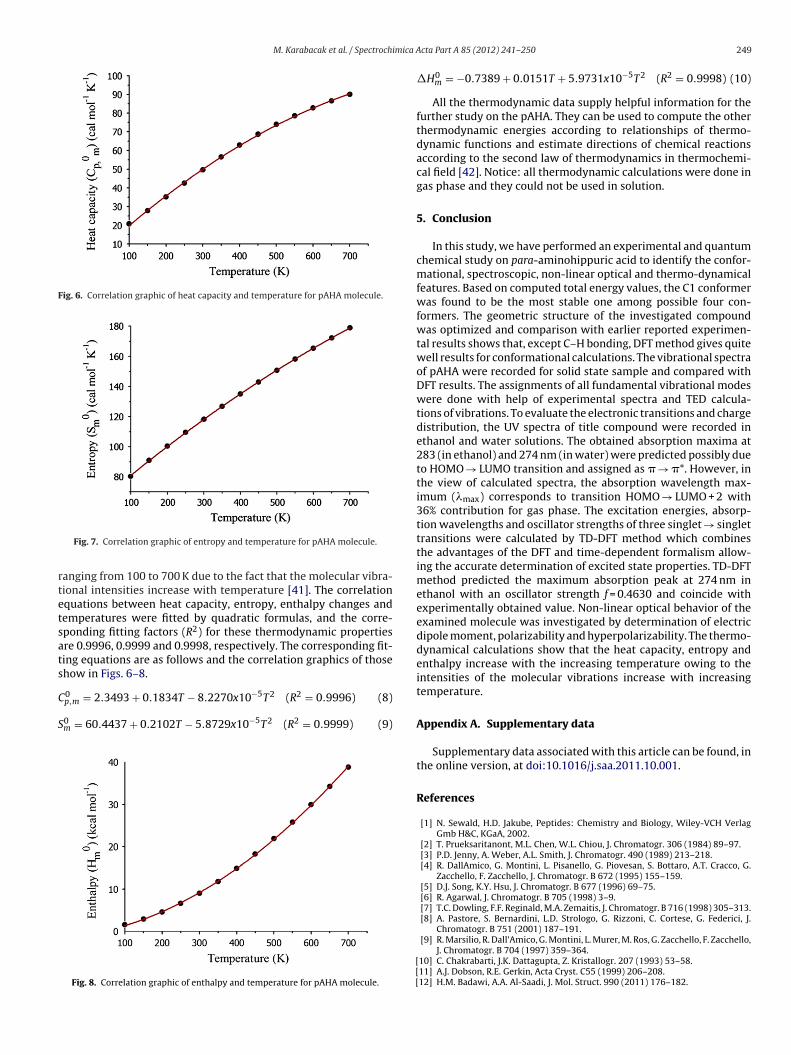
Fig. 6. Correlation graphic of heat capacity and temperature for pAHA molecule.
rtetsats
C
S
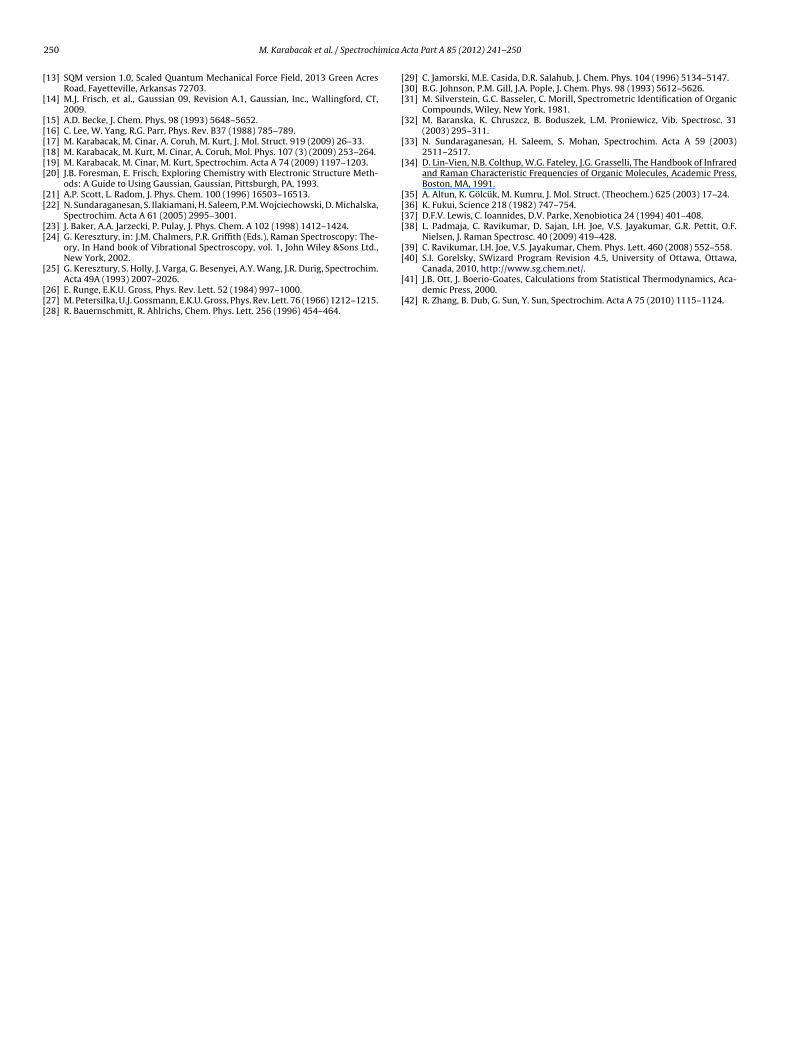
Fig. 7. Correlation graphic of entropy and temperature for pAHA molecule.
anging from 100 to 700 K due to the fact that the molecular vibra-ional intensities increase with temperature [41]. The correlationquations between heat capacity, entropy, enthalpy changes andemperatures were fitted by quadratic formulas, and the corre-ponding fitting factors (R2) for these thermodynamic propertiesre 0.9996, 0.9999 and 0.9998, respectively. The corresponding fit-ing equations are as follows and the correlation graphics of thosehow in Figs. 6–8.
0p,m = 2.3493 + 0.1834T − 8.2270x10⁻⁵T2 (R2 = 0.9996) (8)
0m = 60.4437 + 0.2102T − 5.8729x10⁻⁵T2 (R2 = 0.9999) (9)
Fig. 8. Correlation graphic of enthalpy and temperature for pAHA molecule.
[[[
cta Part A 85 (2012) 241– 250 249
�H0m = −0.7389 + 0.0151T + 5.9731x10⁻⁵T2 (R2 = 0.9998) (10)
All the thermodynamic data supply helpful information for thefurther study on the pAHA. They can be used to compute the otherthermodynamic energies according to relationships of thermo-dynamic functions and estimate directions of chemical reactionsaccording to the second law of thermodynamics in thermochemi-cal field [42]. Notice: all thermodynamic calculations were done ingas phase and they could not be used in solution.
5. Conclusion
In this study, we have performed an experimental and quantumchemical study on para-aminohippuric acid to identify the confor-mational, spectroscopic, non-linear optical and thermo-dynamicalfeatures. Based on computed total energy values, the C1 conformerwas found to be the most stable one among possible four con-formers. The geometric structure of the investigated compoundwas optimized and comparison with earlier reported experimen-tal results shows that, except C–H bonding, DFT method gives quitewell results for conformational calculations. The vibrational spectraof pAHA were recorded for solid state sample and compared withDFT results. The assignments of all fundamental vibrational modeswere done with help of experimental spectra and TED calcula-tions of vibrations. To evaluate the electronic transitions and chargedistribution, the UV spectra of title compound were recorded inethanol and water solutions. The obtained absorption maxima at283 (in ethanol) and 274 nm (in water) were predicted possibly dueto HOMO → LUMO transition and assigned as � → �*. However, inthe view of calculated spectra, the absorption wavelength max-imum (max) corresponds to transition HOMO → LUMO + 2 with36% contribution for gas phase. The excitation energies, absorp-tion wavelengths and oscillator strengths of three singlet → singlettransitions were calculated by TD-DFT method which combinesthe advantages of the DFT and time-dependent formalism allow-ing the accurate determination of excited state properties. TD-DFTmethod predicted the maximum absorption peak at 274 nm inethanol with an oscillator strength f = 0.4630 and coincide withexperimentally obtained value. Non-linear optical behavior of theexamined molecule was investigated by determination of electricdipole moment, polarizability and hyperpolarizability. The thermo-dynamical calculations show that the heat capacity, entropy andenthalpy increase with the increasing temperature owing to theintensities of the molecular vibrations increase with increasingtemperature.
Appendix A. Supplementary data
Supplementary data associated with this article can be found, inthe online version, at doi:10.1016/j.saa.2011.10.001.
References
[1] N. Sewald, H.D. Jakube, Peptides: Chemistry and Biology, Wiley-VCH VerlagGmb H&C, KGaA, 2002.
[2] T. Prueksaritanont, M.L. Chen, W.L. Chiou, J. Chromatogr. 306 (1984) 89–97.[3] P.D. Jenny, A. Weber, A.L. Smith, J. Chromatogr. 490 (1989) 213–218.[4] R. DallAmico, G. Montini, L. Pisanello, G. Piovesan, S. Bottaro, A.T. Cracco, G.
Zacchello, F. Zacchello, J. Chromatogr. B 672 (1995) 155–159.[5] D.J. Song, K.Y. Hsu, J. Chromatogr. B 677 (1996) 69–75.[6] R. Agarwal, J. Chromatogr. B 705 (1998) 3–9.[7] T.C. Dowling, F.F. Reginald, M.A. Zemaitis, J. Chromatogr. B 716 (1998) 305–313.[8] A. Pastore, S. Bernardini, L.D. Strologo, G. Rizzoni, C. Cortese, G. Federici, J.
Chromatogr. B 751 (2001) 187–191.
[9] R. Marsilio, R. Dall’Amico, G. Montini, L. Murer, M. Ros, G. Zacchello, F. Zacchello,J. Chromatogr. B 704 (1997) 359–364.10] C. Chakrabarti, J.K. Dattagupta, Z. Kristallogr. 207 (1993) 53–58.11] A.J. Dobson, R.E. Gerkin, Acta Cryst. C55 (1999) 206–208.12] H.M. Badawi, A.A. Al-Saadi, J. Mol. Struct. 990 (2011) 176–182.
2 imica A
[
[
[[[[[[
[[
[[
[
[[[
[[[
[
[
[
[[[[
[[40] S.I. Gorelsky, SWizard Program Revision 4.5, University of Ottawa, Ottawa,
50 M. Karabacak et al. / Spectroch
13] SQM version 1.0, Scaled Quantum Mechanical Force Field, 2013 Green AcresRoad, Fayetteville, Arkansas 72703.
14] M.J. Frisch, et al., Gaussian 09, Revision A.1, Gaussian, Inc., Wallingford, CT,2009.
15] A.D. Becke, J. Chem. Phys. 98 (1993) 5648–5652.16] C. Lee, W. Yang, R.G. Parr, Phys. Rev. B37 (1988) 785–789.17] M. Karabacak, M. Cinar, A. Coruh, M. Kurt, J. Mol. Struct. 919 (2009) 26–33.18] M. Karabacak, M. Kurt, M. Cinar, A. Coruh, Mol. Phys. 107 (3) (2009) 253–264.19] M. Karabacak, M. Cinar, M. Kurt, Spectrochim. Acta A 74 (2009) 1197–1203.20] J.B. Foresman, E. Frisch, Exploring Chemistry with Electronic Structure Meth-
ods: A Guide to Using Gaussian, Gaussian, Pittsburgh, PA, 1993.21] A.P. Scott, L. Radom, J. Phys. Chem. 100 (1996) 16503–16513.22] N. Sundaraganesan, S. Ilakiamani, H. Saleem, P.M. Wojciechowski, D. Michalska,
Spectrochim. Acta A 61 (2005) 2995–3001.23] J. Baker, A.A. Jarzecki, P. Pulay, J. Phys. Chem. A 102 (1998) 1412–1424.24] G. Keresztury, in: J.M. Chalmers, P.R. Griffith (Eds.), Raman Spectroscopy: The-
ory, In Hand book of Vibrational Spectroscopy, vol. 1, John Wiley &Sons Ltd.,New York, 2002.
25] G. Keresztury, S. Holly, J. Varga, G. Besenyei, A.Y. Wang, J.R. Durig, Spectrochim.Acta 49A (1993) 2007–2026.
26] E. Runge, E.K.U. Gross, Phys. Rev. Lett. 52 (1984) 997–1000.27] M. Petersilka, U.J. Gossmann, E.K.U. Gross, Phys. Rev. Lett. 76 (1966) 1212–1215.28] R. Bauernschmitt, R. Ahlrichs, Chem. Phys. Lett. 256 (1996) 454–464.
[
[
cta Part A 85 (2012) 241– 250
29] C. Jamorski, M.E. Casida, D.R. Salahub, J. Chem. Phys. 104 (1996) 5134–5147.30] B.G. Johnson, P.M. Gill, J.A. Pople, J. Chem. Phys. 98 (1993) 5612–5626.31] M. Silverstein, G.C. Basseler, C. Morill, Spectrometric Identification of Organic
Compounds, Wiley, New York, 1981.32] M. Baranska, K. Chruszcz, B. Boduszek, L.M. Proniewicz, Vib. Spectrosc. 31
(2003) 295–311.33] N. Sundaraganesan, H. Saleem, S. Mohan, Spectrochim. Acta A 59 (2003)
2511–2517.34] D. Lin-Vien, N.B. Colthup, W.G. Fateley, J.G. Grasselli, The Handbook of Infrared
and Raman Characteristic Frequencies of Organic Molecules, Academic Press,Boston, MA, 1991.
35] A. Altun, K. Gölcük, M. Kumru, J. Mol. Struct. (Theochem.) 625 (2003) 17–24.36] K. Fukui, Science 218 (1982) 747–754.37] D.F.V. Lewis, C. Ioannides, D.V. Parke, Xenobiotica 24 (1994) 401–408.38] L. Padmaja, C. Ravikumar, D. Sajan, I.H. Joe, V.S. Jayakumar, G.R. Pettit, O.F.
Nielsen, J. Raman Spectrosc. 40 (2009) 419–428.39] C. Ravikumar, I.H. Joe, V.S. Jayakumar, Chem. Phys. Lett. 460 (2008) 552–558.
Canada, 2010, http://www.sg.chem.net/.41] J.B. Ott, J. Boerio-Goates, Calculations from Statistical Thermodynamics, Aca-
demic Press, 2000.42] R. Zhang, B. Dub, G. Sun, Y. Sun, Spectrochim. Acta A 75 (2010) 1115–1124.
Copyright © 2022 FDOKUMEN