Did markets react efficiently to the 1994 Mexican peso crisis? Evidence from Mexican ADRS
A SIX-WAVE STUDY OF THE CONSISTENCY OF MEXICAN/MEXICAN AMERICAN PREADOLESCENTS’ LIFETIMESUBSTANCE USE REPORTS
DAVID A. WAGSTAFF, Ph.D.,The Pennsylvania State University
STEPHEN KULIS, Ph.D., andArizona State University
ELVIRA ELEK, Ph.D.Research Triangle International
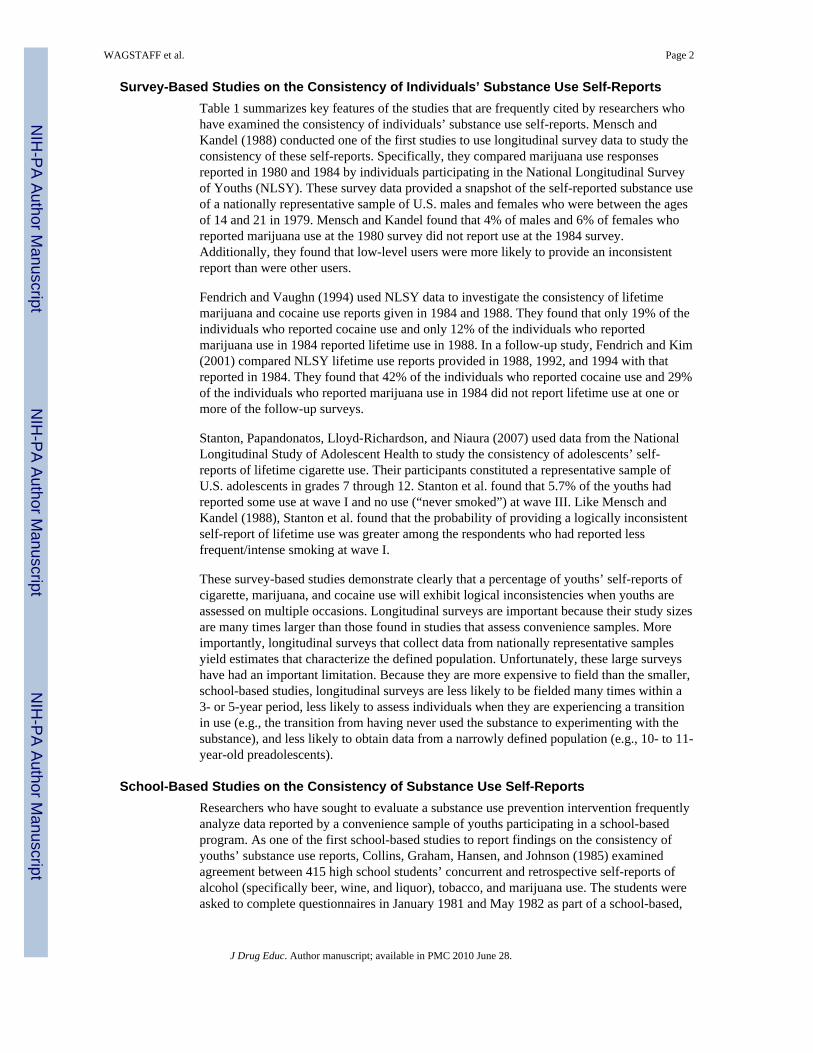
AbstractIn the Fall of 2004, 1,948 5th grade students from Phoenix, AZ enrolled in an evaluation of aschool-based, substance use prevention intervention. To assess the consistency of Mexican andMexican-American students’ self-reports of lifetime substance use, the present study analyzed datareported by 1,418 students who reported Mexican ancestry and completed 2 to 6 questionnairesadministered over a 40-month period. By wave 6, which was completed in March 2008, lifetimealcohol, cigarette, marijuana, and inhalant use rates were 86.0%, 65.0%, 64.5%, and 62.1%,respectively. Corresponding rescission rates were 24.0%, 9.6%, 5.8%, and 9.2%. Reportingpatterns with one “Yes–No” sequence accounted for more than 88% of the inconsistent self-reports. This finding suggests that the majority of Mexican/Mexican-American preadolescentsparticipating in a substance use prevention intervention provided logically consistent self-reportsof lifetime substance use.
INTRODUCTIONLongitudinal studies provide an efficient and cost-effective means of monitoring substanceuse among American youths and assessing the progress made toward meeting nationalhealth objectives. Additionally, longitudinal studies are ideally suited to investigate theconsistency of respondents’ self-reports of substance use (see Bailey, Flewelling, & Rachal,1992; Fendrich & Kim, 2001; Fendrich & Mackesy-Amiti, 2000; Fendrich & Rosenbaum,2003; Fendrich & Vaughn, 1994; Johnston & O’Malley, 1997). Studies that investigate theconsistency of individuals’ self-report of lifetime substance use rest on two assumptions.The first assumption is that once individuals have reported that they have used a substance,they should report that they have used the substance when they are asked the same or alogically consistent question on a subsequent questionnaire. The second assumption is thatindividuals use the same cognitive strategies to retrieve the same information and render thesame report they gave initially. Given these assumptions, any subsequent report of lifetimeuse that is logically inconsistent with an earlier report always indicates response error. Eitherthe initial report was in error (and any resulting prevalence estimate was negatively biased)or the subsequent report was in error (and any prevalence estimate was positively biased).
Direct reprint requests to: David A. Wagstaff, 153 Henderson Building, College of Health and Human Development, ThePennsylvania State University, University Park, PA 16802, [email protected].
NIH Public AccessAuthor ManuscriptJ Drug Educ. Author manuscript; available in PMC 2010 June 28.
Published in final edited form as:J Drug Educ. 2009 ; 39(4): 361–384.
NIH
-PA Author Manuscript
NIH
-PA Author Manuscript
NIH
-PA Author Manuscript
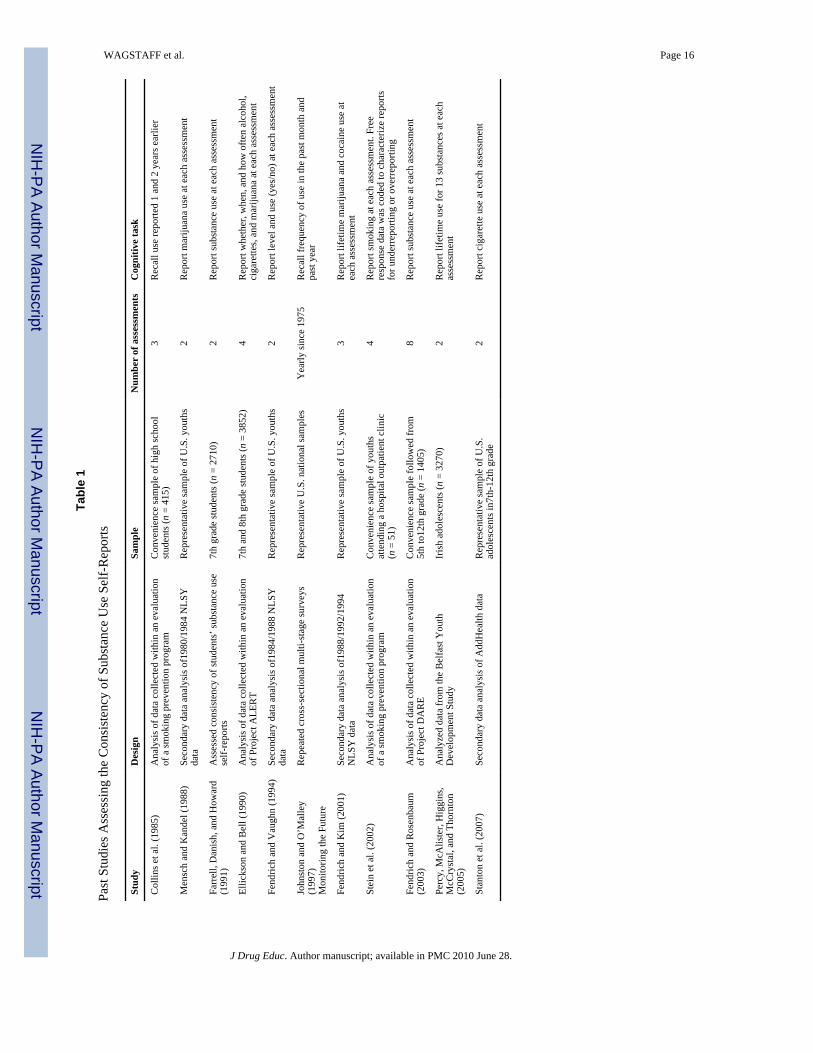
Survey-Based Studies on the Consistency of Individuals’ Substance Use Self-ReportsTable 1 summarizes key features of the studies that are frequently cited by researchers whohave examined the consistency of individuals’ substance use self-reports. Mensch andKandel (1988) conducted one of the first studies to use longitudinal survey data to study theconsistency of these self-reports. Specifically, they compared marijuana use responsesreported in 1980 and 1984 by individuals participating in the National Longitudinal Surveyof Youths (NLSY). These survey data provided a snapshot of the self-reported substance useof a nationally representative sample of U.S. males and females who were between the agesof 14 and 21 in 1979. Mensch and Kandel found that 4% of males and 6% of females whoreported marijuana use at the 1980 survey did not report use at the 1984 survey.Additionally, they found that low-level users were more likely to provide an inconsistentreport than were other users.
Fendrich and Vaughn (1994) used NLSY data to investigate the consistency of lifetimemarijuana and cocaine use reports given in 1984 and 1988. They found that only 19% of theindividuals who reported cocaine use and only 12% of the individuals who reportedmarijuana use in 1984 reported lifetime use in 1988. In a follow-up study, Fendrich and Kim(2001) compared NLSY lifetime use reports provided in 1988, 1992, and 1994 with thatreported in 1984. They found that 42% of the individuals who reported cocaine use and 29%of the individuals who reported marijuana use in 1984 did not report lifetime use at one ormore of the follow-up surveys.
Stanton, Papandonatos, Lloyd-Richardson, and Niaura (2007) used data from the NationalLongitudinal Study of Adolescent Health to study the consistency of adolescents’ self-reports of lifetime cigarette use. Their participants constituted a representative sample ofU.S. adolescents in grades 7 through 12. Stanton et al. found that 5.7% of the youths hadreported some use at wave I and no use (“never smoked”) at wave III. Like Mensch andKandel (1988), Stanton et al. found that the probability of providing a logically inconsistentself-report of lifetime use was greater among the respondents who had reported lessfrequent/intense smoking at wave I.
These survey-based studies demonstrate clearly that a percentage of youths’ self-reports ofcigarette, marijuana, and cocaine use will exhibit logical inconsistencies when youths areassessed on multiple occasions. Longitudinal surveys are important because their study sizesare many times larger than those found in studies that assess convenience samples. Moreimportantly, longitudinal surveys that collect data from nationally representative samplesyield estimates that characterize the defined population. Unfortunately, these large surveyshave had an important limitation. Because they are more expensive to field than the smaller,school-based studies, longitudinal surveys are less likely to be fielded many times within a3- or 5-year period, less likely to assess individuals when they are experiencing a transitionin use (e.g., the transition from having never used the substance to experimenting with thesubstance), and less likely to obtain data from a narrowly defined population (e.g., 10- to 11-year-old preadolescents).
School-Based Studies on the Consistency of Substance Use Self-ReportsResearchers who have sought to evaluate a substance use prevention intervention frequentlyanalyze data reported by a convenience sample of youths participating in a school-basedprogram. As one of the first school-based studies to report findings on the consistency ofyouths’ substance use reports, Collins, Graham, Hansen, and Johnson (1985) examinedagreement between 415 high school students’ concurrent and retrospective self-reports ofalcohol (specifically beer, wine, and liquor), tobacco, and marijuana use. The students wereasked to complete questionnaires in January 1981 and May 1982 as part of a school-based,
WAGSTAFF et al. Page 2
J Drug Educ. Author manuscript; available in PMC 2010 June 28.
NIH
-PA Author Manuscript
NIH
-PA Author Manuscript
NIH
-PA Author Manuscript

smoking prevention program. In Spring 1983, they were asked to recall the frequency of usethat they had reported in 1981 and 1982. Agreement between the reports spaced 1 year and 2years apart ranged from 74% (liquor) to 89% (marijuana). When Collins et al. examined theeffect of the current level of use on the individual’s recall of earlier use, they found that thelevel of current use accounted for 50% to 71% of the explained variance among studentswhose reports of the frequency of use had differed. Moreover, Collins et al. found that theprobability of providing a logically inconsistent self-report was greater among therespondents who had reported less frequent use. They concluded that students’ currentsubstance use levels can bias their recall of past use and that this bias may be quite severefor students’ recall of past alcohol use.
For an evaluation of Project ALERT, Ellickson and Bell (1990) asked 7th- and 8th-gradestudents to complete four assessments administered over a 15-month period. On average,5% of the middle school students reported no use after they had reported use earlier; lessthan 1% had reported less or no use after they had reported frequent use at an earlier wave.Like Collins et al. (1985), Ellickson and Bell found that the majority of the inconsistencieswere reported by students who were experimenting with drugs or reported by studentswhose recall of when they had used the substance differed. Ellickson and Bell also foundthat participants in the treatment schools were no more likely to provide an inconsistentreport than were participants in the control schools.
Finally, for their evaluation of Project DARE, Fendrich and Rosenbaum (2003) examinedthe consistency among students’ self-reports of lifetime alcohol, cigarette, marijuana, andcocaine use. Students completed a baseline assessment when they were in 5th/6th grade;they completed seven follow-up assessments as they advanced to the 11th/12th grade. Whenthey analyzed data obtained from the students who participated in the baseline assessmentand at least four follow-up assessments, Fendrich and Rosenbaum found that 45% of thestudents had provided inconsistent lifetime reports of alcohol use, 51% had providedinconsistent lifetime reports of cigarette use, and 81% had provided inconsistent lifetimereports of cocaine use.
These studies illustrate many of the interpretative problems reflected in the literature on theconsistency of individuals’ self-reports of substance use. Specifically, researchers have notused the same cognitive task to assess the consistency. Some researchers ask students toreport the frequency with which a substance was used; other researchers ask students toreport lifetime use; and other researchers ask students to report particulars such as the age atwhich the substance was first used (see Table 1). Additionally, because evaluations ofschool-based, drug use prevention programs are based on data provided by students inmiddle, junior high, or high school and because researchers have asked these students tocomplete different cognitive tasks, it is difficult to organize the various findings on theconsistency of students’ substance use self-reports. Moreover, although school-based studiesare better situated to ask students more detailed questions about the cognitive strategies theymay have used to respond to an item, few, if any, school-based studies have done so.
Stein et al. (2002) may have conducted the only study to ask adolescents why they mightunder- or over-report their substance use (specifically, smoking). The adolescents (n = 51)were recruited from a hospital outpatient clinic or emergency department and enrolled in abrief intervention designed to reduce their smoking. As participants, the adolescentscompleted a baseline assessment and three follow-up assessments that were conducted 1, 3,and 6 months after the baseline assessment. Stein et al. found that 3.9% of the youths hadconsistently under-reported their smoking, that 15.7% had sometimes under-reported theirsmoking, that 3.9% had sometimes over-reported their smoking, and that 3.9% had reportedboth less and more smoking than they had actually done. The two most prevalent reasons
WAGSTAFF et al. Page 3
J Drug Educ. Author manuscript; available in PMC 2010 June 28.
NIH
-PA Author Manuscript
NIH
-PA Author Manuscript
NIH
-PA Author Manuscript

that youths gave for providing an inaccurate report were the youths’ perception that theinterviewer wanted them to report less use (41.2%) and the youths’ perception that theirparents wanted to know about the project (41.2%). Stein et al. concluded that researchershad to take steps to enhance participants’ beliefs that their responses would not be sharedwith others. Stein et al. also noted that researchers needed to establish rates of misreportingso that instruments could be evaluated properly.
Collectively, the studies summarized in Table 1 suggest the following four points. First, theresearchers reported that the probability of observing an inconsistent lifetime substance usereport increases with an increasing number of completed assessments. More assessmentssimply provide youths with more opportunities to give a subsequent report that is logicallyinconsistent with an earlier report. Moreover, if it is recognized that (a) some reportingerrors are inevitable and (b) that a logically inconsistent lifetime use report has to bepreceded by a report of lifetime use, and given the definition of prevalence (number ofcases/number at risk), it follows that the probability of an inconsistent report would increasewith an increasing number of reports. Second, the majority of the inconsistent reports aregiven by youths who are not frequent or regular users. Our understanding of cognition andmemory tells us that the particular features that characterize a well-established behavior areeasier to recall than are those that characterize a behavior we enact infrequently or enactedlong ago (Johnson, Gerstein, & Rasinski, 1998). Third, the percentage of inconsistentlifetime substance use reports will fluctuate during the course of a multi-year study that hasperiodic assessments. Although the cumulative probability of an inconsistent report cannotdecrease as the number of assessments increases, the marginal probability of an inconsistentreport at the Tth assessment can be less than, equal to, or greater than the probability of aninconsistent report at an earlier assessment. A trend in the observed proportion ofinconsistent reports across the assessments would suggest that a non-random process hadbeen invoked and was in play (e.g., at the Tth assessment youths are capable of exercisingthe necessary care when they answer the substance use items). Finally, the cited studiessuggest that the probability of an inconsistent lifetime substance use report is subject todemand characteristics and other social concerns (privacy, social stigma, legal sanction).
What this review of the literature does not convey is that inconsistent self-reports of lifetimesubstance use have been observed even when steps have been taken to catch theseinconsistencies when the individual gave the inconsistent report. Indeed, in the NationalSurvey on Drug Use and Health, inconsistencies were observed even when the data werecollected using computer-assisted interviewing, when study retention criteria were used todrop respondents who did not provide data on lifetime substance use, and after data editingand imputation procedures were used to identify and resolve inconsistencies amongvariables related to key drug use measures (Substance Abuse and Mental Health ServicesAdministration, 2007, pp. 122, 134).
The present study used data collected on six occasions that spanned a 40-month period toexamine the consistency of Mexican and Mexican-American pre-adolescents’ self-reports oflifetime alcohol, cigarette, marijuana, and inhalant use. The youths were participating in astudy that had been designed to evaluate two substance use prevention curricula forelementary school students. The first assessment was conducted when the youths were in 5thgrade and most youths were 10 or 11 years old. The sixth assessment was conducted whenthe youths completed 8th grade and most were 14 or 15 years old. This 5-year period is acritical period when many youths initiate and experiment with substance use. As such, astudy of youths’ perceptions and substance use behaviors during this period provides astrategic opportunity. In addition to taking advantage of its timing, the present studydescribes the pattern of reports provided by our participating preadolescents. Althoughprevious studies have reported the aggregate rate of inconsistent reports observed when
WAGSTAFF et al. Page 4
J Drug Educ. Author manuscript; available in PMC 2010 June 28.
NIH
-PA Author Manuscript
NIH
-PA Author Manuscript
NIH
-PA Author Manuscript
participants were assessed repeatedly, no other report to date has described the observedpatterns or described how the rate of inconsistent reporting changes as respondents completean additional assessment.
The present study focuses on Mexican and Mexican-American youths for three reasons.First, these youths constitute 71.5% of the youths who participated in the parent study.Second, and more importantly, our sample of Mexican and Mexican-Americanpreadolescents were assessed during a critical period in their lives. Prior to 8th grade, thesubstance-specific prevalence rates observed for Hispanic youths are greater than thoseobserved for African-American youths and roughly comparable to those observed forCaucasian youths. However, by 8th grade, the rates reported by Hispanic youths exceedthose reported by African-American and by Caucasian youths (Johnston, O’Malley,Bachman, & Schlenberg, 2006). Third, unlike the survey-based studies that treat individualswith any Latino heritage as one homogeneous group (e.g., the Hispanic Health and NutritionExamination Survey), the present study reports data provided by youths who self-identifiedas Mexican or Mexican American.
METHODSchools Participating in the Parent and in the Present Study
Twenty-nine public elementary schools in the Phoenix, Arizona metropolitan area agreed toparticipate in the evaluation of a NIDA-funded, school-based, substance use preventionintervention. The participating schools represented 7 of the 16 Phoenix school districts andwere approximately half of the eligible elementary schools.
For their participation in the parent study, the 16 intervention schools received curriculum-specific teacher training and materials. Additionally, they received $500 to help defray thecost of implementing the intervention’s booster component. Students’ regular classroomteachers implemented the 12-lesson curriculum in the 5th and 7th grades; they supervisedapproximately five booster activities in the 6th and 8th grades. Curriculum implementationaveraged 13 weeks for the 5th grade students and 16 weeks for the 7th grade students.Booster implementation averaged 18 weeks for the 6th grade students and 9 weeks for the8th grade students. It should be noted that many of the intervention schools providedadditional substance use programming to their students.
For their participation in the parent study, each of the 13 control schools received $1,000 foreach year they participated in the parent study and permitted research staff to assess theirstudents. Many control schools implemented substance use prevention activities or curricula.
Consent ProcessResearch assistants (RAs) initiated an active parental consent process and studentrecruitment by giving students consent forms to take home to their parents. Studentsreceived “kooky eggs” as an incentive to encourage them to return the consent forms to theRAs in a timely manner. The RAs obtained students’ assent before they administered eachassessment. Although the teacher remained in the classroom as the questionnaire wasadministered, the RAs explained the importance of their maintaining confidentiality,encouraged the teachers to participate in other responsibilities (e.g., grading), and tookprecautions to ensure that the teachers did not view any student’s responses.
Steps Taken to Obtain Reliable DataBecause we anticipated that many of the 5th grade students would not be familiar with theconcept of confidentiality or with certain phrasing and formats used with our questionnaires,
WAGSTAFF et al. Page 5
J Drug Educ. Author manuscript; available in PMC 2010 June 28.
NIH
-PA Author Manuscript
NIH
-PA Author Manuscript
NIH
-PA Author Manuscript
we developed a detailed script for our RAs. Prior to obtaining a student’s assent, the RAstated:
Today you will be taking a survey for researchers at Arizona State University thatasks questions about you, your family, your school, and about your experienceswith drugs and alcohol. This is not a test. There are no right or wrong answers andno one will know how you respond to the questions. It will take about 45 minutesto complete all of the items.
After the RA had distributed blank assent forms and questionnaires to the students who hadobtained a parent’s informed consent, the RA stated:
Please read the front page letter while I pass out the surveys. This survey isconfidential. To make sure that it is not connected to any information about youplease tear off the letter before we go on. The survey is voluntary (you can refuse toparticipate), and it is confidential. This means that no one will know how youanswered the questions except you. You should be assured that it will beimpossible to identify you.
The students then completed the assent forms and passed them to the RA, who put them intoa separate envelope. As a final assurance of confidentiality, students were told that theyshould not put their names anywhere on the questionnaire and that:
Your answers will go to Arizona State University where the research staff will havethe sheets scanned and then the surveys will be stored in locked file cabinets.
The RA then used a script and led the class in an exercise designed to take them through keyquestions. The latter included items used to collect data on students’ sociodemographiccharacteristics (sex, birth date) as well as items that the students might have difficultyanswering. For example, to ensure a common understanding of the ethnicity items, the RAgave a verbal definition of ethnic group and then wrote the definition on the board. Finally,the RA also made the students aware of any “skip patterns,” particularly the pattern that thestudent was supposed to follow if the student had never used alcohol, cigarettes, marijuana,or inhalants. Collectively, these steps suggest that efforts were taken to ensure that thestudents were aware of our desire that they provide honest and complete responses.
The RAs administered six assessments. Wave 1 was administered from September 2004 toJanuary 2005; Wave 2 was administered from February to June 2005; Wave 3 wasadministered from February to May 2006; Wave 4 was administered from September toDecember 2006; Wave 5 was administered from February to May 2007; and Wave 6 wasadministered from January to March 2008. At the beginning of the 2004 school year, 2,459students were enrolled in the 5th grade and attending one of the 29 study schools that hadagreed to participate in an evaluation of the parent study’s substance use preventioncurriculum. Slightly less than 83% of these students returned signed parental consent forms.To date, 1,984 students have participated in one or more of the parent study’s assessments.The institutional review board of Arizona State University (ASU) approved all protocols andquestionnaires. Additionally, ASU obtained a Certificate of Confidentiality from theNational Institutes of Health.
MeasuresAt each wave, the data were collected with a questionnaire that was administered during a45-minute classroom session and later scanned by project staff using Remark Office OMRsoftware. Students could complete the questionnaires in Spanish or English. The percentageof students who identified as Mexican/Mexican American and completed the questionnairesin Spanish at each wave was 8.6%, 7.7%, 4.5%, 3.7%, 2.3%, and 1.8% respectively.
WAGSTAFF et al. Page 6
J Drug Educ. Author manuscript; available in PMC 2010 June 28.
NIH
-PA Author Manuscript
NIH
-PA Author Manuscript
NIH
-PA Author Manuscript

Study Condition—At the parent study’s baseline assessment, a dummy variable identifiedthe students who were enrolled in a school that had been randomly assigned to anintervention condition (cond = 1) or the comparison condition (cond = 0).
Demographic Characteristics—We used two items at each wave to collect data on thestudent’s gender and race/ethnicity. Specifically, we asked students to fill in the circle nextto the word to indicate whether they were a “boy” or a “girl.” We also asked students tomark all that applied to “What is your ethnicity?” The seven response choices were:“American Indian or Alaskan Native,” “African American or Black,” “Asian or PacificIslander,” “White or Anglo,” “Mexican, Mexican American or Chicano,” “Some OtherLatino or Hispanic Group,” and “Other ethnicity.” Students were included in the presentstudy if they self-identified as “Mexican, Mexican-American, or Chicano” at any wave andhad participated in at least two of the six assessments (n = 1,418). Students participating inthe present study were 71.5% of the youths who participated in any assessment (n = 1,984).
Risk Taking—We used two items at baseline and wave 4 to assess student’s propensity totake risks. In particular, students were asked to respond to the following two items: “Is itworth getting in trouble to have fun?” and “How often do you do things that adults tell younot to do?” Each item was scored on the following 5-point scale: 1 = “Never,” 2 = “Almostnever,” 3 = “Sometimes,” 4 = “Often,” and 5 = “Always.” A scale score was calculated asthe mean of the two item scores, and increasing scale scores indicated an increasingpropensity to engage in risky behavior. Spearman’s rho for the present sample was 0.24 (n =1088) and 0.47 (n = 677) at baseline and wave 4, respectively.
Descriptive Substance Use Norms—We used two items at each wave to assess astudent’s perception of how many of her or his friends and schoolmates had ever usedalcohol, cigarettes, or marijuana. The items were adapted from a study conducted by Hansenand Graham (1991). Specifically, students were asked “Now think about the friends youhang out with. How many do you think have used alcohol, cigarettes, or marijuana at leastonce?” and “About how many kids in your school would you guess have used alcohol,cigarettes or marijuana at least once?” Each item was scored on the following 4-point scale:1 = “All or most,” 2 = “Half,” 3 = “Some,” and 4 = “Hardly any or none.” We reversedcoded each item so that increasing item values would reflect an increasing prevalenceamong one’s friends and schoolmates. We then created four binary indicators (i.e., twoindicators for each item). The indicator was set equal to 0 if students reported that theythought that “Hardly any or none” of their friends (kids in your school) “have used alcohol,cigarettes, or marijuana at least once.” The indicator was set equal to 1 if students reportedthat they thought that “Some,” “Half,” or “All or most” of their friends (kids in your school)“have used alcohol, cigarettes, or marijuana at least once.” This dummy coding schemecontrasted students who believed that few of their friends (kids in your school) had usedalcohol, cigarettes, or marijuana at least once with students who believed that at least someof their friends had used alcohol, cigarettes, or marijuana at least once.
Honest Responding—For the parent study’s baseline assessment, students were asked touse a 4-point Likert scale to indicate the extent to which they agreed with the statement “Iwas completely honest in filling out this survey.” The four response choices were 1 =“Strongly agree,” 2 = “Agree,” 3 = “Disagree,” and 4 = “Strongly disagree.” For the presentstudy, item scores were reverse coded so that increasing values indicated stronger agreementand increasing confidence in the belief that one had provided completely honest responses.
Lifetime Substance Use—We used four items at each wave to assess a student’s lifetimeuse of “Alcohol (beer, wine, and liquor),” “Cigarettes or tobacco,” “Marijuana (pot, weed),”
WAGSTAFF et al. Page 7
J Drug Educ. Author manuscript; available in PMC 2010 June 28.
NIH
-PA Author Manuscript
NIH
-PA Author Manuscript
NIH
-PA Author Manuscript

and “Inhalants (sniff glue or paint).” The bubbles that students were to fill in for eachsubstance they had tried appeared at the top of the page; they were aligned in one row andseparated by a distance of 7/8 inch. The students were to select the “None of these” choice ifit was the appropriate response and then follow the instructions for the indicated skippattern. Students were classified as having used one or more of the four substances if theyhad filled in the bubble for any one of the four substances; students were classified as havingnever used one of the four substances if they selected the “none of these” choice or they didnot fill in the bubble for any one of the four substances.
We used an additional four items at baseline and at wave 4 to assess the number of times astudent had used one of the four substances in her or his lifetime. In particular, we asked“How many times have you drunk more than a sip of alcohol (beer, wine, or liquor) in yourlifetime?” “How many times have you smoked cigarettes in your lifetime?” “How manytimes have you smoked marijuana (pot, weed) in your lifetime?” and “How many times haveyou sniffed glue, spray cans, paint, or other inhalants to get high in your lifetime?” Eachitem was initially scored on the following 7-point scale: 1 = “0 times,” 2 = “1–2 times,” 3 =“3–5 times,” 4 = “6–9 times,” 5 = “10–19 times,” 6 = “20–39 times,” and 7 = “40 or moretimes.” For the present study, we moved the origin to 0 (i.e., a value of 0 indicated 0 times)and created a 3-point scale where 1 = “1–9 times” and 2 = “10 or more times.” This codingallowed us to categorize students as non-users, light users, and heavier users; and assess theimpact of the level of substance use on the probability of rescinding the correspondinglifetime substance use report.
Rescission of Behavior—Rodgers, Billy, and Udry (1982) used the term “rescission” todescribe the inconsistent responses observed among adolescents’ self-reports of their sexualbehavior. This term may be more appropriate than “deny” or “recant,” terms used by laterresearchers. Deny suggests that respondents were aware that their responses were logicallyinconsistent; the use of rescission conveys the understanding that the respondent’sinconsistent responses have called into question the researcher’s prevalence estimates andthe conclusions that are based on those estimates. To assess participants’ rescission of theirself-reports of lifetime substance use after baseline, we created five 0/1 binary variables.Each indicator was set equal to 1 if the student indicated that she or he had ever tried thesubstance at an earlier assessment and then did not do so for the current assessment; theindicator was set equal to 0 if the student did not indicate that she or he had ever tried thesubstance at an earlier assessment and did not do so for the current assessment. For thepresent study, we excluded 147 students who only participated in one wave and, therefore,could not provide an inconsistent substance use report.
Participant TrackingWhen the research staff received a signed parental consent form, the staff assigned a uniqueidentification number to the student and entered the student’s identifying information whichincluded class, teacher, and school into a tracking database. This database could only beaccessed by two research team members. On the six occasions when research liaisons wentto the students’ classroom to conduct an assessment, they distributed questionnaires whichhad a student assent form attached to the front of each questionnaire. Before studentscompleted a questionnaire, they completed an assent form. These forms (and the completedquestionnaires) were collected separately and returned to the research office. Research staffused the information that students provided on the assent forms (first, middle, and lastnames; day and month of birth; updated contact information) to track the students during the40-month study period. Additional tracking information was also obtained from the classrosters that the research liaisons obtained from school personnel. Discrepancies or questionsabout the information (e.g., slight variation in the spelling of a name) obtained from the
WAGSTAFF et al. Page 8
J Drug Educ. Author manuscript; available in PMC 2010 June 28.
NIH
-PA Author Manuscript
NIH
-PA Author Manuscript
NIH
-PA Author Manuscript

signed parental consent form, the signed assent forms, and the class rosters were resolved bya research liaison who asked the student and/or teacher for clarification. In summary, theASU research team members used repeated face-to-face contacts with school personnel andstudents to identify, verify, and track our study participants over the 40-month study periodas they completed the six assessments, advanced from 5th grade to 8th grade, and changedclassrooms and, in some cases, as they changed schools.
Statistical AnalysesWe used Stata’s programs for complex sample surveys (Stata, 2007) to obtain summarystatistics (specifically means, proportions, and odds ratios) and their standard errors. Theseprograms provided Student t-tests to assess mean differences and Chi Square tests to assessthe homogeneity of proportions. (To account for the data dependencies associated with thestudents nested within schools, the test statistic reported for the test of homogeneity is an Fstatistic.) We used Stata’s complex sample survey logistic regression program (and abackward elimination procedure) to identify correlates of inconsistent reporting of lifetimealcohol, cigarette, marijuana, and inhalant use. Stata’s complex sample survey programsallowed us to account for the fact that we had obtained data from 29 intact groups of public,middle-school students. With intact social groups, we would not expect the observationsreported by any two randomly selected students attending the same school to be statisticallyindependent. Failure to account for this statistical dependence would result in standard errorsthat were underestimated, test statistics that were inflated, and p-values that were smallerthan they would be if an appropriate statistical method had been used (Cornfield, 1978).
RESULTSRoughly 40 months after administration of the parent study’s baseline assessment, the sixwaves of data reported by 1,418 urban, public, middle-school students who had self-identified as Mexican, Mexican American, or Chicano were consolidated. Slightly morethan 32% of these students (n = 1,418) had participated in six assessments; 15.1%, 14.0%,21.7%, and 17.1% had participated in five, four, three, and two assessments, respectively.
The number of students (and the percent female) at each wave were 1,390 (51%), 1,349(50%), 1,120 (51%), 733 (53%), 688 (54%), and 722 (53%), respectively. A test ofhomogeneity of proportions indicated that female students, who were 50.5% of the 1,418students, were as likely as male students to complete k = 2, …, 6 assessments (F(3.65,102.13) = 2.11, p = .09). The decline in the number of students who completed anassessment during the course of the study reflects decisions made by the individual studentsand their parents, and by school administrators. Each year, between 9% and 23% of thestudents transferred from each school. Prior to wave 4, when the students were in 7th grade,three of the original 29 schools decided that they could no longer participate in the parentstudy and two additional schools were dropped from the parent study when theadministrators declined to move to the scheduled “non-implementing” condition.
As Table 2 shows, the percentage of students reporting lifetime alcohol, cigarette,marijuana, and inhalant use increased with each wave. The rates of lifetime use were mostsimilar for the first two waves, when students were in 5th grade, and then most similar forthe next two waves, which were administered 14–18 months and 20–25 months after thebaseline assessment, when students were in 6th and then 7th grade. Table 2 also shows thatthe rate of self-reported lifetime alcohol use greatly exceeded that of cigarette, marijuana,and inhalant use at each wave: By wave 6, slightly less than 60% of the youths who hadcompleted two or more assessments reported that they had had more than a sip of alcohol(beer, wine, or liquor) in their lifetime.
WAGSTAFF et al. Page 9
J Drug Educ. Author manuscript; available in PMC 2010 June 28.
NIH
-PA Author Manuscript
NIH
-PA Author Manuscript
NIH
-PA Author Manuscript

Finally, Table 2 also displays the rates of inconsistent reporting associated with the students’self-reports of lifetime alcohol, cigarette, marijuana, and inhalant use. Again, each value isbased on the number of students who participated in two or more assessments and whoparticipated in that wave. All students were scored as “consistent” at wave 1 and“inconsistent” if any later report was logically inconsistent with any earlier report. By wave6, almost one-fourth of the students had rescinded an earlier report of lifetime alcohol use.
Table 3 summarizes the patterns of lifetime reports for the patterns with one or moreinconsistent reports. (There were 35 = 243 possible sequences as a student could reportlifetime use (Yes), no lifetime use (No), or not provide data (missing) at any assessment.)With six waves, the most complex of the observed patterns was “YNYNYN,” whichindicates that the student initially reported lifetime use and then gave a report that wasinconsistent with the preceding assessment. The simplest sequence was an isolated “YN”(i.e., a two character sequence preceded by one or more Ys and/or ms for missing, andsucceeded by Ns or ms): this sequence indicates that the student reported lifetime use andthen did not report lifetime use at the next assessment. The “YNYNYN” sequence was onlyobserved for students’ self-reports of lifetime alcohol use: although 24% of the students (n =1,418) gave an inconsistent alcohol use report, only one student alternated between use andno use.
Two patterns accounted for the majority of the inconsistent lifetime substance use reports.For the most prevalent pattern, the student reported lifetime use and then did not reportlifetime use at the next assessment (i.e., one “YN” sequence among four remainingcharacters). For the second most prevalent pattern, the student provided two inconsistentreports and then missed the next assessment (i.e., “YNm”). These two patterns accounted for79% of the inconsistent alcohol use reports, 82% of the inconsistent cigarette use reports,84% of the inconsistent marijuana use reports, and 73% of the inconsistent inhalant usereports. Collectively, patterns with at most one “YN” (i.e., one inconsistent) sequenceaccounted for 91% of the inconsistent alcohol use reports, 92% of the inconsistent cigaretteuse reports, 93% of the inconsistent marijuana use reports, and 89% of the inconsistentinhalant use reports.
Having assessed lifetime substance use with (a) four yes/no items at each wave and (b) fourfrequency of lifetime use items that were assessed at baseline and at wave 4, we used thetwo sets of items to assess the rate of inconsistent reporting of lifetime alcohol, cigarette,marijuana, and inhalant use within the baseline and wave 4 assessments. At baseline, therates of inconsistent reporting based on the four yes/no items and the four lifetime frequencyitems were 2.5% (alcohol), 2.2%, 1.3%, and 4.6% (inhalant), respectively; at wave 4, therates were 4.8%, 5.4%, 3.0%, and 8.3%. Clearly, our students were far less likely to provideinconsistent lifetime substance use reports when they responded to different lifetimesubstance use measures that were on the same questionnaire; they were far more likely toprovide inconsistent reports when they responded to the same lifetime substance use itemson successive questionnaires.
Finally, we fit four logistic regression models to determine if we could identify variablesassociated with the odds that a student had provided an inconsistent report of lifetimealcohol, cigarette, marijuana, and inhalant use. Each model included the student’s: gender;age at baseline; parent study condition (intervention, control); number of completedassessments; the student’s assessment at baseline of how completely honest he or she hadbeen in answering questionnaire items; the student’s perception at baseline of her or hispropensity for engaging in risky behavior; a binary indicator for the student’s perception atbaseline of how many friends “used alcohol, cigarettes, or marijuana at least once”; a binaryindicator for the student’s perception at baseline of how many “… kids in [the] school …
WAGSTAFF et al. Page 10
J Drug Educ. Author manuscript; available in PMC 2010 June 28.
NIH
-PA Author Manuscript
NIH
-PA Author Manuscript
NIH
-PA Author Manuscript
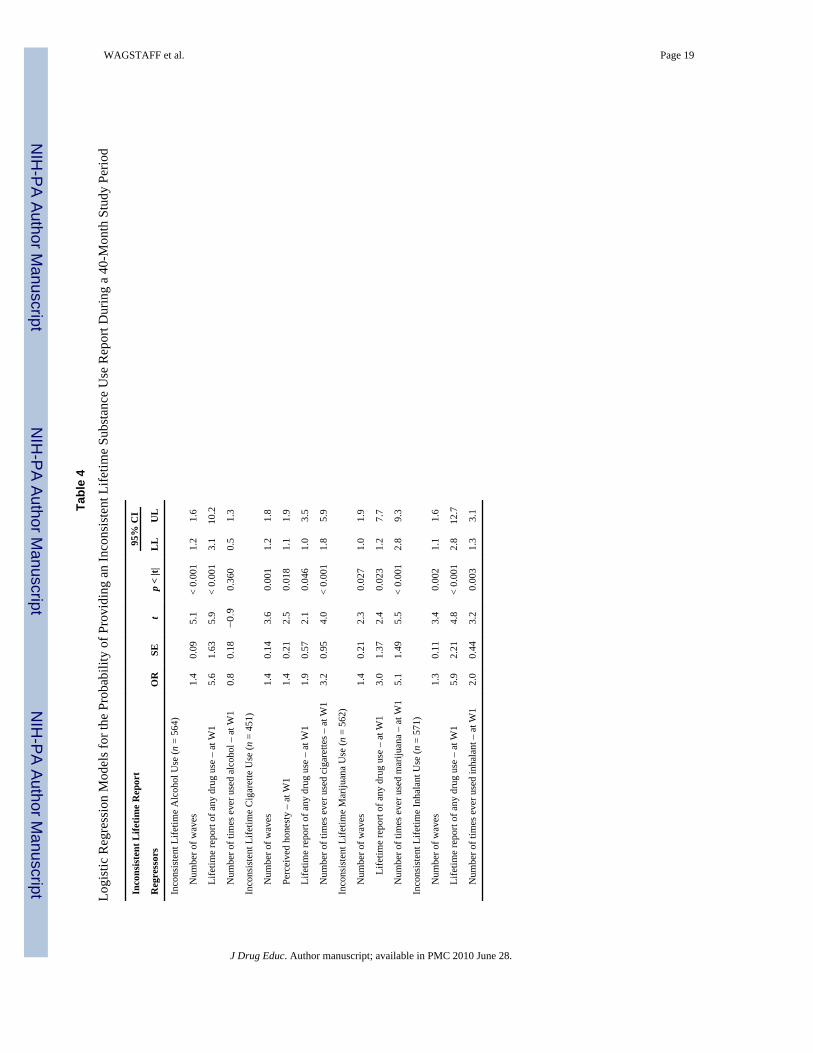
used alcohol, cigarettes, or marijuana at least once”; and a trichotomous indicator for thestudent’s baseline report of the number of times the student had used the substance. Afterfitting a saturated model, we used backward elimination to obtain the reduced modelspresented in Table 4.
As Table 4 indicates, the log odds of an inconsistent substance use report were positivelyrelated to the number of completed assessments: the more assessments a student hadcompleted, the greater the odds that the student had given an inconsistent report of lifetimeuse. Moreover, with the exception of alcohol use, we found that there was a statisticallysignificant relation between the number of times the student had ever used the substance atbaseline (“no use,” “1–9 times,” and “10 or more times”) and the log odds that the studentwould give an inconsistent report of lifetime use for the substance. Linear contrasts on themean predicted probability of an inconsistent substance use report indicated that thepredicted probability of an inconsistent lifetime report increased with the number of timesthe students reported that they had ever used the substance at baseline.
It should be noted that the log odds of an inconsistent lifetime substance use report were notrelated to the students’ perception of their willingness to engage in risky behavior or theirperception of how many of their friends or schoolmates “have used alcohol, cigarettes, ormarijuana at least once.” Moreover, the log odds of inconsistent lifetime substance usereport were not related to how honest students believed that they had been. At baseline, 70%of the male students and 76% of the female students agreed or strongly agreed that they hadbeen completely honest. (Twenty-one of the students participating in the baselineassessment did not provide data for the honesty item.) The students who had providedinconsistent lifetime alcohol, marijuana, and inhalant use reports believed that they had beenas honest as the students who had provided consistent reports. However, the students whoprovided inconsistent lifetime cigarette use reports perceived that they had been less candid(m = 3.3) than the students (m = 3.6) who provided consistent lifetime use reports (Δ = .28,SE = .095, t(28) = 2.92, p = 0.007).
DISCUSSIONWe examined urban, public, middle-school students’ self-reports of lifetime alcohol,cigarette, marijuana, and inhalant use that had been assessed repeatedly over a 40-monthperiod. The students joined the parent study when they were in 5th grade. They wereincluded in the present study because they had self-identified as Mexican or MexicanAmerican and had participated in two or more assessments. The latter were conductedduring the Fall of 2004 (baseline) and 4–7 months, 14–18 months, 21–25 months, 27–30months, and 38–40 months after the baseline assessment. All four self-reported lifetime userates reached their maximum value at wave 6, when the students were in 8th grade. Theincreasing prevalence rates observed among our participants as they negotiated the transitionfrom elementary school to middle school is consistent with recent research on the patterns ofuse among African-American, Caucasian, and Hispanic youths (Johnston et al., 2006).
At each assessment and when averaged across the six assessments, the rate of self-reportedlifetime alcohol use greatly exceeded that reported for cigarettes, marijuana, and inhalants.This finding suggests that alcohol was much more available and/or that the costs (economic,social, lost opportunities) associated with attaining and consuming alcohol use were muchless than the costs associated with the other substances. The rate of lifetime marijuana usestarted to differ from the rates of lifetime inhalant and cigarette use by wave 3. After wave 3,the self-reported lifetime marijuana and cigarette use rates increased steadily while theinhalant use rate remained relatively flat.
WAGSTAFF et al. Page 11
J Drug Educ. Author manuscript; available in PMC 2010 June 28.
NIH
-PA Author Manuscript
NIH
-PA Author Manuscript
NIH
-PA Author Manuscript

With respect to the rescission of a lifetime substance use report, our Mexican/Mexican-American preadolescent males were as likely as their female counterparts to rescind anearlier lifetime alcohol, cigarette, or marijuana use report. This finding is consistent with thefinding reported by Johnston and O’Malley (1997) who used data reported by repeatedcross-sectional surveys of nationally representative samples.
Our finding that the risk of an inconsistent lifetime substance use report increased with thelifetime frequency of use that the preadolescent students reported at baseline may bedifferent from the findings reported by Collins et al. (1985), Mensch and Kandel (1988), andStanton et al. (2007). The latter found that the probability of an inconsistent lifetimesubstance use report was greatest among the participants who initially reported the least useand who were thought to be experimenting. However, we found that the probability of aninconsistent lifetime substance use report was greatest among the participating Mexican andMexican-American preadolescents who reported the greatest number of substance useoccasions at baseline, not the least number of occasions. The different findings may beexplained in part by the relatively young age of our study participants, by the fact that ourheaviest lifetime use category was “more than 10 times,” and by the fact that researchers donot have widely-accepted definitions regarding the number of drug use occasions that defineexperimentation, occasional use, and regular use.
Our finding that the risk of an inconsistent lifetime substance use report increased linearlywith the number of completed assessments is consistent with the finding reported byFendrich and Rosenbaum (2003), and undoubtedly reflects the fact that some studentssimply had more opportunity to rescind an earlier report. For these students, we do not knowwhether they simply did not recall the occasion that resulted in their reporting that they hadused the substance on the earlier assessment. For some students, their inconsistent reportingmay reflect their coming to a different definition, for example, of their having ever had a sipof alcohol or having ever tried a cigarette.
Finally, our finding that the majority of the inconsistent reports of lifetime substance usecould be described by an isolated “YN” pattern that was not preceded or followed byanother “YN” combination suggests that the majority of the inconsistencies were not due toa student’s intentionally trying to misreport his or her lifetime use of a substance. Moreover,our findings that (a) the majority of our participants believed that they had provided honestreports and (b) that students’ rating of their honesty in answering the questionnaire itemswas not consistently associated with the probability that they had rescinded an earlier reportof lifetime substance use were consistent with findings reported by Siegel, Aten, &Roghmann (1998). The latter used two items to assess the honesty of students’ self-reportsof their sexual behavior (specifically, whether they had ever had sexual intercourse and thefrequency of intercourse). The students were participating in an intervention designed toprevent pregnancy and sexually transmitted infection. Although 78% of their middle schoolmales (n = 793) and 98% of their middle school females (n = 825) reported that they hadbeen very or completely honest, 14% of the males acknowledged that they had overstatedtheir actual behavior, and 8% of the females acknowledged that they had understated theirbehavior. When Siegel et al. analyzed the associations between students’ ratings of theirhonesty and four reported sexual behaviors, they found that the associations were mostconsistent among the students who had understated their behavior.
LimitationsAlthough random assignment of schools to study condition provides a basis for drawinginferences in our parent study, the youths participating in the present study constitute aconvenience sample of Mexican and Mexican-American youths attending a public middleschool in Phoenix, Arizona. As such, we do not claim that any of the reported sample
WAGSTAFF et al. Page 12
J Drug Educ. Author manuscript; available in PMC 2010 June 28.
NIH
-PA Author Manuscript
NIH
-PA Author Manuscript
NIH
-PA Author Manuscript
statistics are unbiased estimates of their nominal population parameters. As with anyobservational study, the reported sample statistics may reflect an unobserved bias ofunknown magnitude.
Henry (2007) analyzed self-report data collected on 8th- and 10th-grade students who wereparticipating in the 2003 wave of Monitoring the Future. She found that 10.5% of 8th-gradestudents and 16.4% of 10th-grade students reported that they had skipped school within thepast month. More importantly, she found that students who were disengaged from schooland who reported that they had used drugs within the past month were the most likely toreport a recent truancy. If Henry’s findings were to hold for our middle school students, wewould expect that a proportion of the youths who could not be assessed because they hadskipped school on the day a questionnaire was administered were using drugs. Finally, wemay not have detected correlates of Mexican/Mexican-American preadolescents’inconsistent reporting of their lifetime substance use because 5 of the 29 schoolsparticipating in the parent study had withdrawn from the latter by the 6th and final wave.Although the loss of their students undoubtedly made it more difficult to detect a variablethat predicted a missing response, it also made it more difficult to identify an individual-level characteristic that may have been correlated with inconsistent reporting.
CONCLUSIONSRescission rates for lifetime alcohol, cigarette, marijuana, and inhalant use among oursample of Mexican/Mexican-American, urban, public, middle school students differedacross the four substances. The rescission rate was 9.2% for lifetime inhalant use, 9.6% forlifetime cigarette use, and 5.8% for lifetime marijuana use. Offsetting these lesser rates, therescission rate for lifetime alcohol use during the 40-month period was 24%. For eachsubstance, the rescission rate kept pace with the corresponding lifetime substance use ratereported for its assessment period. As noted earlier, the fact that the rescission rate observedfor each follow-up assessment increased as the reported lifetime substance use rate increasedis not surprising as the youths had to report use before they could rescind an earlier report.More importantly, if the number of inconsistent reports is proportional to the number ofindividuals reporting use of the substance at time T, then the number of inconsistent reportsat time T would be a function of the prevalence at time T and the number of individualsproviding a report at time T.
On balance, the present study found that the majority of preadolescent Mexican andMexican-American youths who are participating in an evaluation of a substance useprevention intervention will report lifetime substance used in a manner that is logicallyconsistent over time when they are assured that their data will be treated in a confidentialmanner. Compared to past studies of inconsistent substance use reporting, the present studyis unique in the following three respects. First, it analyzed self-report data collected frompublic middle school students who self-identified as Mexican or Mexican American.Students who identify as Mexican American are projected to become the majority in manypublic schools in the United States. Indeed, Mexican-American students were the majorityin many of the parent study’s participating schools. Second, the present study analyzed datacollected through six assessments that were conducted over a 40-month period. Past studieshave been largely limited to two or three assessments which necessarily limit the potentialfor observing inconsistent substance use reports. Third, and most importantly, the presentstudy appears to be the only study to describe the various patterns of inconsistent reportingthat were observed. This observation is surprising as response patterns are used to defineediting rules and address logical inconsistencies in respondents’ data.
WAGSTAFF et al. Page 13
J Drug Educ. Author manuscript; available in PMC 2010 June 28.
NIH
-PA Author Manuscript
NIH
-PA Author Manuscript
NIH
-PA Author Manuscript

AcknowledgmentsThe data used in the present study would not have been available had it not been for the dedication of the DrugResistance Strategies Project team members in Phoenix, Arizona. These researchers were led by Drs. FlavioMarsiglia, Stephen Kulis, and Patricia Dustman. Finally, we would like to thank Dr. Heather Cecil and Dr. TanyaNieri for their helpful comments and suggestions.
This publication was supported by Grant Number (RO1 DA005629) from the National Institute on Drug Abuse toThe Pennsylvania State University (Michael Hecht, Principal Investigator). Its contents are solely the responsibilityof the authors and do not necessarily represent the official views of the National Institutes of Health.
ReferencesBailey SL, Flewelling RL, Rachal JV. The characterization of inconsistencies in self-reports of alcohol
and marijuana use in a longitudinal study of adolescents. Journal of Studies on Alcohol1992;53:636–647. [PubMed: 1434637]
Collins L, Graham JW, Hansen WB, Johnson CA. Agreement between retrospective accounts ofsubstance use and earlier reported substance use. Applied Psychological Measurement 1985;9:301–309.
Cornfield J. Randomization by group: A formal analysis. American Journal of Epidemiology1978;108:100–102. [PubMed: 707470]
Ellickson PL, Bell RM. Drug prevention in junior high: A multi-site longitudinal test. Science1990;247:1299–1305. [PubMed: 2180065]
Farrell AD, Danish SJ, Howard CW. Evaluation of data screening methods in surveys of adolescents’drug use. Psychological Assessment: A Journal of Consulting and Clinical Psychology 1991;3:295–298.
Fendrich M, Kim JYS. Multiwave analysis of retest artifact in the National Longitudinal Survey ofYouth drug use. Drug and Alcohol Dependence 2001;62:239–253. [PubMed: 11295329]
Fendrich M, Mackesy-Amiti ME. Decreased drug reporting in a cross-sectional student drug usesurvey. Journal of Substance Abuse 2000;11:1–12. [PubMed: 10756509]
Fendrich M, Rosenbaum DP. Recanting of substance use reports in a longitudinal prevention study.Drug and Alcohol Dependence 2003;70:241–253. [PubMed: 12757962]
Fendrich M, Vaughn CM. Diminished lifetime substance use over time: An inquiry into differentialunderreporting. Public Opinion Quarterly 1994;58:96–123.
Hansen WB, Graham JW. Preventing alcohol, marijuana, and cigarette use among adolescents: Peerpressure resistance training versus establishing conservative norms. Preventive Medicine1991;20:414–430. [PubMed: 1862062]
Henry KL. Who’s skipping school: Characteristics of truants in 8th and 10th grade? Journal of SchoolHealth 2007;77:29–35. [PubMed: 17212757]
Johnson RA, Gerstein GA, Rasinski RA. Adjusting survey estimates for response bias: An applicationto trends in alcohol and marijuana use. Public Opinion Quarterly 1998;62:354–377.
Johnston, LD.; O’Malley, PM. The recanting of earlier reported drug use by young adults. In:Harrison, L.; Hughes, A., editors. The validity of self-reported drug use: Improving the accuracyof survey estimates. Rockville, MD: U.S. Government Printing Office; 1997. p. 59-80.NIDAResearch Monograph 167 (NIH Publication No. 97–4147)
Johnston, LD.; O’Malley, PM.; Bachman, JG.; Schlenberg, JE. Monitoring the future national resultson adolescent drug use: Overview of key findings, 2005. (NIH Publication No. 06-5882).Bethesda, MD: National Institute on Drug Abuse; 2006.
Mensch BS, Kandel DB. Underreporting of substance use in a national youth cohort: Individual andinterviewer effects. Public Opinion Quarterly 1988;52:100–124.
Percy A, McAlister S, Higgins K, McCrystal P, Thornton M. Response consistency in youngadolescents’ drug use self-reports: A recanting rate analysis. Addiction 2005;100:189–196.[PubMed: 15679748]
Rodgers JL, Billy JOG, Udry JR. The rescission of behaviors: Inconsistent responses in adolescentsexuality data. Social Science Research 1982;11:280–296.
WAGSTAFF et al. Page 14
J Drug Educ. Author manuscript; available in PMC 2010 June 28.
NIH
-PA Author Manuscript
NIH
-PA Author Manuscript
NIH
-PA Author Manuscript
Siegel DM, Aten MJ, Roghmann KJ. Self-reported honesty among middle and high school studentsresponding to a sexual behavior questionnaire. Journal of Adolescent Health 1998;23:20–28.[PubMed: 9648019]
Stanton CA, Papandonatos G, Lloyd-Richardson EE, Niaura R. Consistency of self-reported smokingover a 6-year interval from adolescence to young adulthood. Addiction 2007;102:1831–1839.[PubMed: 17784897]
Stata Corporation. Stata statistical software: Release10.0. College Station, TX: Author; 2007.Stein LAR, Colby SM, O’Leary TA, Monti PM, Rohsenow DJ, Spirito A, et al. Response distortion in
adolescents who smoke: A pilot study. Journal of Drug Education 2002;32:271–286. [PubMed:12556133]
Substance Abuse and Mental Health Services Administration. Results from the 2006 National Surveyon Drug Use and Health: National Findings (Office of Applied Studies, NSDUH Series H-32,DHHS Publication No. SMA 07-4293). Rockville, MD: 2007. [Available as a PDF athttp://www.oas.samhsa.gov/nsduh/]
WAGSTAFF et al. Page 15
J Drug Educ. Author manuscript; available in PMC 2010 June 28.
NIH
-PA Author Manuscript
NIH
-PA Author Manuscript
NIH
-PA Author Manuscript
NIH
-PA Author Manuscript
NIH
-PA Author Manuscript
NIH
-PA Author Manuscript
WAGSTAFF et al. Page 16
Tabl
e 1
Past
Stu
dies
Ass
essi
ng th
e C
onsi
sten
cy o
f Sub
stan
ce U
se S
elf-
Rep
orts
Stud
yD
esig
nSa
mpl
eN
umbe
r of
ass
essm
ents
Cog
nitiv
e ta
sk
Col
lins e
t al.
(198
5)A
naly
sis o
f dat
a co
llect
ed w
ithin
an
eval
uatio
nof
a sm
okin
g pr
even
tion
prog
ram
Con
veni
ence
sam
ple
of h
igh
scho
olst
uden
ts (n
= 4
15)
3R
ecal
l use
repo
rted
1 an
d 2
year
s ear
lier
Men
sch
and
Kan
del (
1988
)Se
cond
ary
data
ana
lysi
s of1
980/
1984
NLS
Yda
taR
epre
sent
ativ
e sa
mpl
e of
U.S
. you
ths
2R
epor
t mar
ijuan
a us
e at
eac
h as
sess
men
t
Farr
ell,
Dan
ish,
and
How
ard
(199
1)A
sses
sed
cons
iste
ncy
of st
uden
ts’ s
ubst
ance
use
self-
repo
rts7t
h gr
ade
stud
ents
(n =
271
0)2
Rep
ort s
ubst
ance
use
at e
ach
asse
ssm
ent
Ellic
kson
and
Bel
l (19
90)
Ana
lysi
s of d
ata
colle
cted
with
in a
n ev
alua
tion
of P
roje
ct A
LER
T7t
h an
d 8t
h gr
ade
stud
ents
(n =
385
2)4
Rep
ort w
heth
er, w
hen,
and
how
ofte
n al
coho
l,ci
gare
ttes,
and
mar
ijuan
a at
eac
h as
sess
men
t
Fend
rich
and
Vau
ghn
(199
4)Se
cond
ary
data
ana
lysi
s of1
984/
1988
NLS
Yda
taR
epre
sent
ativ
e sa
mpl
e of
U.S
. you
ths
2R
epor
t lev
el a
nd u
se (y
es/n
o) a
t eac
h as
sess
men
t
John
ston
and
O’M
alle
y(1
997)
Mon
itorin
g th
e Fu
ture
Rep
eate
d cr
oss-
sect
iona
l mul
ti-st
age
surv
eys
Rep
rese
ntat
ive
U.S
. nat
iona
l sam
ples
Yea
rly si
nce
1975
Rec
all f
requ
ency
of u
se in
the
past
mon
th a
ndpa
st y
ear
Fend
rich
and
Kim
(200
1)Se
cond
ary
data
ana
lysi
s of1
988/
1992
/199
4N
LSY
dat
aR
epre
sent
ativ
e sa
mpl
e of
U.S
. you
ths
3R
epor
t life
time
mar
ijuan
a an
d co
cain
e us
e at
each
ass
essm
ent
Stei
n et
al.
(200
2)A
naly
sis o
f dat
a co
llect
ed w
ithin
an
eval
uatio
nof
a sm
okin
g pr
even
tion
prog
ram
Con
veni
ence
sam
ple
of y
outh
sat
tend
ing
a ho
spita
l out
patie
nt c
linic
(n =
51)
4R
epor
t sm
okin
g at
eac
h as
sess
men
t. Fr
eere
spon
se d
ata
was
cod
ed to
cha
ract
eriz
e re
ports
for u
nder
repo
rting
or o
verr
epor
ting
Fend
rich
and
Ros
enba
um(2
003)
Ana
lysi
s of d
ata
colle
cted
with
in a
n ev
alua
tion
of P
roje
ct D
AR
EC
onve
nien
ce sa
mpl
e fo
llow
ed fr
om5t
h to
12th
gra
de (n
= 1
405)
8R
epor
t sub
stan
ce u
se a
t eac
h as
sess
men
t
Perc
y, M
cAlis
ter,
Hig
gins
,M
cCry
stal
, and
Tho
rnto
n(2
005)
Ana
lyze
d da
ta fr
om th
e B
elfa
st Y
outh
Dev
elop
men
t Stu
dyIr
ish
adol
esce
nts (
n =
3270
)2
Rep
ort l
ifetim
e us
e fo
r 13
subs
tanc
es a
t eac
has
sess
men
t
Stan
ton
et a
l. (2
007)
Seco
ndar
y da
ta a
naly
sis o
f Add
Hea
lth d
ata
Rep
rese
ntat
ive
sam
ple
of U
.S.
adol
esce
nts i
n7th
-12t
h gr
ade
2R
epor
t cig
aret
te u
se a
t eac
h as
sess
men
t
J Drug Educ. Author manuscript; available in PMC 2010 June 28.

NIH
-PA Author Manuscript
NIH
-PA Author Manuscript
NIH
-PA Author Manuscript
WAGSTAFF et al. Page 17
Tabl
e 2
Cum
ulat
ive
Life
time
Subs
tanc
e U
se R
ate
(%) a
nd C
umul
ativ
e R
esci
ssio
n R
ate
(%) b
y Su
bsta
nce
and
Wav
e
Wav
e
Subs
tanc
e1a
23
45
6
Alc
ohol
20.7
31.5
43.3
49.0
53.2
59.9
7.3
13.5
17.1
20.6
24.0
Cig
aret
tes
3.6
6.9
11.4
14.6
17.6
21.9
2.3
3.7
5.4
6.9
9.6
Mar
ijuan
a2.
64.
08.
511
.715
.420
.7
1.1
1.8
3.0
4.2
5.8
Inha
lant
s4.
27.
310
.311
.913
.315
.9
2.8
5.1
6.2
7.5
9.2
a The
deno
min
ator
for t
he p
erce
ntag
e di
spla
yed
in e
ach
cell
was
141
8.
J Drug Educ. Author manuscript; available in PMC 2010 June 28.

NIH
-PA Author Manuscript
NIH
-PA Author Manuscript
NIH
-PA Author Manuscript
WAGSTAFF et al. Page 18
Table 3
Patterns of Inconsistent Reports
Patterna Alcohol (n = 340)b Cigarette (n = 136) Marijuana (n = 82) Inhalant (n = 131)
YNYNYN 0.3 0.0 0.0 1.5
YNYYN 1.2 2.2 0.0 1.5
YNYN 4.7 2.2 1.2 1.5
YmYN 1.2 0.7 0.0 0.8
YNm 26.2 21.3 18.3 16.0
YmN 6.8 5.9 1.2 9.2
mYN 3.8 2.9 7.3 5.3
YN 52.6 61.0 65.9 57.3
Misc. 3.2 3.7 6.1 6.9
Total 100.0 100.0 100.0 100.0
Note:
aAll participants provided at least two reports for which Y = Reported lifetime use, N = Reported no lifetime use, and m = Missing data;
bThe four n’s in the table heading give the number of youths who provided the pattern of inconsistent lifetime substance use reports identified by
the row heading.
J Drug Educ. Author manuscript; available in PMC 2010 June 28.
NIH
-PA Author Manuscript
NIH
-PA Author Manuscript
NIH
-PA Author Manuscript
WAGSTAFF et al. Page 19
Tabl
e 4
Logi
stic
Reg
ress
ion
Mod
els f
or th
e Pr
obab
ility
of P
rovi
ding
an
Inco
nsis
tent
Life
time
Subs
tanc
e U
se R
epor
t Dur
ing
a 40
-Mon
th S
tudy
Per
iod
Inco
nsis
tent
Life
time
Rep
ort
95%
CI
Reg
ress
ors
OR
SEt
p <
|t|L
LU
L
Inco
nsis
tent
Life
time
Alc
ohol
Use
(n =
564
)
N
umbe
r of w
aves
1.4
0.09
5.1
< 0.
001
1.2
1.6
Li
fetim
e re
port
of a
ny d
rug
use
– at
W1
5.6
1.63
5.9
< 0.
001
3.1
10.2
N
umbe
r of t
imes
eve
r use
d al
coho
l – a
t W1
0.8
0.18
−0.9
0.36
00.
51.
3
Inco
nsis
tent
Life
time
Cig
aret
te U
se (n
= 4
51)
N
umbe
r of w
aves
1.4
0.14
3.6
0.00
11.
21.
8
Pe
rcei
ved
hone
sty
– at
W1
1.4
0.21
2.5
0.01
81.
11.
9
Li
fetim
e re
port
of a
ny d
rug
use
– at
W1
1.9
0.57
2.1
0.04
61.
03.
5
N
umbe
r of t
imes
eve
r use
d ci
gare
ttes –
at W
13.
20.
954.
0<
0.00
11.
85.
9
Inco
nsis
tent
Life
time
Mar
ijuan
a U
se (n
= 5
62)
N
umbe
r of w
aves
1.4
0.21
2.3
0.02
71.
01.
9
Life
time
repo
rt of
any
dru
g us
e –
at W
13.
01.
372.
40.
023
1.2
7.7
N
umbe
r of t
imes
eve
r use
d m
ariju
ana
– at
W1
5.1
1.49
5.5
< 0.
001
2.8
9.3
Inco
nsis
tent
Life
time
Inha
lant
Use
(n =
571
)
N
umbe
r of w
aves
1.3
0.11
3.4
0.00
21.
11.
6
Li
fetim
e re
port
of a
ny d
rug
use
– at
W1
5.9
2.21
4.8
< 0.
001
2.8
12.7
N
umbe
r of t
imes
eve
r use
d in
hala
nt –
at W
12.
00.
443.
20.
003
1.3
3.1
J Drug Educ. Author manuscript; available in PMC 2010 June 28.
Copyright © 2022 FDOKUMEN