Birth month affects lifetime disease risk - Oxford Academic
12
RECEIVED 7 January 2015 REVISED 23 March 2015 ACCEPTED 18 April 2015 PUBLISHED ONLINE FIRST 3 June 2015 Birth month affects lifetime disease risk: a phenome-wide method Mary Regina Boland 1,2 , Zachary Shahn 3 , David Madigan 2,3 , George Hripcsak 1,2 , Nicholas P Tatonetti 1,2,4,5, * ABSTRACT .................................................................................................................................................... Objective An individual’s birth month has a significant impact on the diseases they develop during their lifetime. Previous studies reveal relation- ships between birth month and several diseases including atherothrombosis, asthma, attention deficit hyperactivity disorder, and myopia, leaving most diseases completely unexplored. This retrospective population study systematically explores the relationship between seasonal affects at birth and lifetime disease risk for 1688 conditions. Methods We developed a hypothesis-free method that minimizes publication and disease selection biases by systematically investigating disease- birth month patterns across all conditions. Our dataset includes 1 749 400 individuals with records at New York-Presbyterian/Columbia University Medical Center born between 1900 and 2000 inclusive. We modeled associations between birth month and 1688 diseases using logistic regres- sion. Significance was tested using a chi-squared test with multiplicity correction. Results We found 55 diseases that were significantly dependent on birth month. Of these 19 were previously reported in the literature (P < .001), 20 were for conditions with close relationships to those reported, and 16 were previously unreported. We found distinct incidence patterns across disease categories. Conclusions Lifetime disease risk is affected by birth month. Seasonally dependent early developmental mechanisms may play a role in increasing lifetime risk of disease. .................................................................................................................................................... Keywords: electronic health records, personalized medicine, seasons, cardiovascular diseases, embryonic and fetal development, prenatal nutri- tional physiological phenomena, pregnancy, maternal exposure. INTRODUCTION Hippocrates described a connection between seasonality and disease nearly 2500 years ago, “for knowing the changes of the sea- sons ... how each of them takes place, he [the clinician] will be able to know beforehand what sort of a year is going to ensue ... for with the seasons the digestive organs of men undergo a change.” 1 Following in footsteps laid more than 2 millennia ago, recent stud- ies have linked birth month with neurological, 2–4 reproductive, 5–9 endocrine 10 and immune/inflammatory disorders, 11 and overall lifespan. 12 Many disease-dependent mechanisms exist relating disease-risk to birth month. For example, evidence linking a subtype of asthma to birth month was presented in 1983. 13 They found that individuals born in seasons with more abundant home dust mites had a 40% increased risk of developing asthma complicated by dust mite allergies. Their finding was corroborated later when it was found that sensitization to allergens during infancy increases lifetime risk of developing aller- gies. 14 In addition, some neurological conditions may be associated with birth month because of seasonal variations in vitamin D and thy- mic output. 15 Understanding disease birth month dependencies is challenging because of the diversity of seasonal affects and connec- tions to disease-risk. The recent adoption of electronic health records (EHRs) allows meaningful use 16 of data recorded during the clinical encounter for high-throughput exploratory analyses. 17,18 Using EHR data requires overcoming problems with definition discrepancies, 19 data sparse- ness, data quality, 20 bias, 21 healthcare process effects, 22 and pri- vacy issues. 23 Informatics methods overcome these challenges, e.g., standardized ontologies minimize definition discrepancies, 24 concordance measured across integrated datasets allows for data sparseness and quality assessment, 20 and statistical methods can minimize bias and healthcare process effects. 25–27 Using informatics approaches, EHR discovery methods 28 were developed with suc- cessful applications in diverse areas including: dentistry, 29 genet- ics, 30–32 and pharmacovigilance. 33,34 Novel disease association patterns 35,36 and seasonal dependencies 37–39 have also been estab- lished using EHRs. Advances in health informatics coupled with the availability of large clinical databases enable systematic investigation of birth month-dis- ease dependencies. All previous disease-birth month association stud- ies were hypothesis-driven and focused on popular diseases leaving rare diseases unstudied (selection bias). Also, in the literature there is a propensity to publish studies that find an association over those that fail to find a relationship, illustrating publication bias. 26,27,40,41 In con- trast, we developed a high-throughput, hypothesis-free algorithm that mines for disease-birth month associations across millions of records. We call our approach: Season-Wide Association Study (SeaWAS) as it finds all conditions associated with birth month. We show that SeaWAS detects diseases with seasonal components related to early development. * Correspondence to Nicholas Tatonetti, PhD, Department of Biomedical Informatics, Department of Systems Biology, Department of Medicine, Columbia University, 622 West 168 th Street, VC-5, New York, NY 10032, USA; [email protected] V C The Author 2015. Published by Oxford University Press on behalf of the American Medical Informatics Association. This is an Open Access article distributed under the terms of the Creative Commons Attribution Non-Commercial License (http://creativecommons.org/licenses/by-nc/ 4.0/), which permits non-commercial re-use, distribution, and reproduction in any medium, provided the original work is properly cited. For commercial re-use, please contact [email protected] For numbered affiliations see end of article. RESEARCH AND APPLICATIONS 1042 Boland MR, et al. J Am Med Inform Assoc 2015;22:1042–1053. doi:10.1093/jamia/ocv046, Research and Applications Downloaded from https://academic.oup.com/jamia/article/22/5/1042/930268 by guest on 11 July 2022
-
Upload
khangminh22 -
Category
Documents
-
view
1 -
download
0
Transcript of Birth month affects lifetime disease risk - Oxford Academic

RECEIVED 7 January 2015REVISED 23 March 2015ACCEPTED 18 April 2015
PUBLISHED ONLINE FIRST 3 June 2015
Birth month affects lifetime disease risk:a phenome-wide method
Mary Regina Boland1,2, Zachary Shahn3, David Madigan2,3, George Hripcsak1,2,Nicholas P Tatonetti1,2,4,5,*
ABSTRACT....................................................................................................................................................
Objective An individual’s birth month has a significant impact on the diseases they develop during their lifetime. Previous studies reveal relation-ships between birth month and several diseases including atherothrombosis, asthma, attention deficit hyperactivity disorder, and myopia, leavingmost diseases completely unexplored. This retrospective population study systematically explores the relationship between seasonal affects atbirth and lifetime disease risk for 1688 conditions.Methods We developed a hypothesis-free method that minimizes publication and disease selection biases by systematically investigating disease-birth month patterns across all conditions. Our dataset includes 1 749 400 individuals with records at New York-Presbyterian/Columbia UniversityMedical Center born between 1900 and 2000 inclusive. We modeled associations between birth month and 1688 diseases using logistic regres-sion. Significance was tested using a chi-squared test with multiplicity correction.Results We found 55 diseases that were significantly dependent on birth month. Of these 19 were previously reported in the literature (P< .001),20 were for conditions with close relationships to those reported, and 16 were previously unreported. We found distinct incidence patterns acrossdisease categories.Conclusions Lifetime disease risk is affected by birth month. Seasonally dependent early developmental mechanisms may play a role in increasinglifetime risk of disease.
....................................................................................................................................................
Keywords: electronic health records, personalized medicine, seasons, cardiovascular diseases, embryonic and fetal development, prenatal nutri-tional physiological phenomena, pregnancy, maternal exposure.
INTRODUCTIONHippocrates described a connection between seasonality and diseasenearly 2500 years ago, “for knowing the changes of the sea-sons . . . how each of them takes place, he [the clinician] will be ableto know beforehand what sort of a year is going to ensue . . . for withthe seasons the digestive organs of men undergo a change.”1
Following in footsteps laid more than 2 millennia ago, recent stud-ies have linked birth month with neurological,2–4 reproductive,5–9
endocrine10 and immune/inflammatory disorders,11 and overalllifespan.12
Many disease-dependent mechanisms exist relating disease-riskto birth month. For example, evidence linking a subtype of asthma tobirth month was presented in 1983.13 They found that individuals bornin seasons with more abundant home dust mites had a 40% increasedrisk of developing asthma complicated by dust mite allergies. Theirfinding was corroborated later when it was found that sensitization toallergens during infancy increases lifetime risk of developing aller-gies.14 In addition, some neurological conditions may be associatedwith birth month because of seasonal variations in vitamin D and thy-mic output.15 Understanding disease birth month dependencies ischallenging because of the diversity of seasonal affects and connec-tions to disease-risk.
The recent adoption of electronic health records (EHRs) allowsmeaningful use16 of data recorded during the clinical encounter forhigh-throughput exploratory analyses.17,18 Using EHR data requires
overcoming problems with definition discrepancies,19 data sparse-ness, data quality,20 bias,21 healthcare process effects,22 and pri-vacy issues.23 Informatics methods overcome these challenges,e.g., standardized ontologies minimize definition discrepancies,24
concordance measured across integrated datasets allows for datasparseness and quality assessment,20 and statistical methods canminimize bias and healthcare process effects.25–27 Using informaticsapproaches, EHR discovery methods28 were developed with suc-cessful applications in diverse areas including: dentistry,29 genet-ics,30–32 and pharmacovigilance.33,34 Novel disease associationpatterns35,36 and seasonal dependencies37–39 have also been estab-lished using EHRs.
Advances in health informatics coupled with the availability of largeclinical databases enable systematic investigation of birth month-dis-ease dependencies. All previous disease-birth month association stud-ies were hypothesis-driven and focused on popular diseases leavingrare diseases unstudied (selection bias). Also, in the literature there isa propensity to publish studies that find an association over those thatfail to find a relationship, illustrating publication bias.26,27,40,41 In con-trast, we developed a high-throughput, hypothesis-free algorithm thatmines for disease-birth month associations across millions of records.We call our approach: Season-Wide Association Study (SeaWAS) as itfinds all conditions associated with birth month. We show thatSeaWAS detects diseases with seasonal components related to earlydevelopment.
* Correspondence to Nicholas Tatonetti, PhD, Department of Biomedical Informatics, Department of Systems Biology, Department of Medicine, Columbia University,
622 West 168th Street, VC-5, New York, NY 10032, USA; [email protected] The Author 2015. Published by Oxford University Press on behalf of the American Medical Informatics Association.
This is an Open Access article distributed under the terms of the Creative Commons Attribution Non-Commercial License (http://creativecommons.org/licenses/by-nc/
4.0/), which permits non-commercial re-use, distribution, and reproduction in any medium, provided the original work is properly cited. For commercial re-use,
please contact [email protected] For numbered affiliations see end of article.
RESEARCHAND
APPLICATIONS
1042
Boland MR, et al. J Am Med Inform Assoc 2015;22:1042–1053. doi:10.1093/jamia/ocv046, Research and ApplicationsD
ownloaded from
https://academic.oup.com
/jamia/article/22/5/1042/930268 by guest on 11 July 2022

METHODSPopulationWe used the Columbia University Medical Center (CUMC)’s healthrecord data, previously converted to the standardized Common DataModel (CDM) developed by the Observational Medical OutcomesPartnership (now the Observational Health Data Sciences andInformatics).42 CUMC data was initially recorded using InternationalClassification of Diseases, version 9 (ICD-9) codes. These ICD-9 codeswere mapped to Systemized Nomenclature for Medicine-ClinicalTerms (SNOMED-CT) codes according to the CDM v.4.42 We selectedSNOMED-CT because it captures more clinical content then ICD-9codes,43 making SNOMED-CT ideal for phenotype classification.Additionally, using this standardized CDM increases the portability ofour method across institutions enhancing data sharing.44
We extracted all individuals born between 1900 and 2000 inclusive(N¼ 1749400 individuals) who were treated at CUMC (between 1985and 2013), demographics given in Table 1. The median age of ourpopulation was 38 years (interquartile range, IQR: 22–58). We per-formed a Fisher-exact test between the birth month distributions foreach sex vs the average birth month distribution. Likewise the birthmonth distributions by birth decade (e.g., 1900–1909, 1990–1999)were compared to the overall average birth month distribution. No sta-tistically significant differences were found (P¼ 1 for all comparisons).Therefore, yearly and sex-based variation in the birth month distribu-tion is minimal and should not affect our analyses (SI Appendix FigureS1 and S2).
We verified that our monthly birth rate data was consistent withknown New York City (NYC) births using data from the Centers ofDisease and Control (CDC) for 1990–2000 inclusive.45 CUMC datawere highly correlated with CDC birth rates from the Bronx (r¼ 0.833,P¼ .001), New York (r¼ 0.796, P¼ .002), and Queens (r¼ 0.791,P¼ .002) counties (SI Appendix Figure S3). We performed this verifi-cation check because confirming the place of birth for individuals canbe complex,46 and was not possible for our CUMC dataset.Subsequently, for the 1990–2000 period we were able to obtain dataregarding the number of babies admitted to CUMC on the day of theirbirth for the 1990–2000 period and found that the proportion (no. ofpatients admitted to CUMC on their day of birth/no. of patients in-cluded in SeaWAS) ranged from 17.97% to 31.28% by birth year withthe average proportion being 22.98%. CUMC’s Institutional ReviewBoard approved this study.
MethodsWe investigated associations with birth month across all recorded con-ditions. A condition is defined as any SNOMED-CT code mapped usingthe CDM.42 For controls, we randomly sampled individuals from thesame EHR population without the disease ensuring that our controlsample size was ten times the size of the case population. We thenmodeled the association between birth month (as an integer) and eachcondition as a logistic regression model with significance assessedusing chi-square (R v.3.1.0). Therefore, the monthly birth rate wascompared between the case and control populations for each conditionadjusting for monthly birth month variation effects. For multiplicity cor-rection, we only selected conditions passing the Benjamini-Hochbergadjustment that controls for the false discovery rate (FDR).47 To ensuresufficient sample size across all 12 months, we only investigated con-ditions having at least 1000 individuals born between 1900 and 2000inclusive (this amounted to 1688 conditions).
To evaluate SeaWAS, we extracted all articles from PubMed withthe term “birth month” and an additional article referenced by alocated article (n¼ 156). We manually reviewed all abstracts and
removed articles related to nonhumans (n¼ 8), breeding (n¼ 7),sports (n¼ 10), or where birth month was used for another purpose,e.g., for matching controls (n¼ 34), perspective/meta-analysis papers(n¼ 2), papers not available in English (n¼ 2), and one paper with astatistical error noted in PubMed. This process identified 92 relevantarticles. We then manually classified each paper by the disease stud-ied, and whether they found or failed to find an association. Someconditions associated with birth month in the literature, e.g., height,were not extractable from our EHR (36 diseases were not extractable).In total, 19 diseases reported in the literature could be mapped to EHRconditions. Of those diseases, 16 were positively associated (>50% ofliterature supported an association) and 3 were not associated (�50%of literature failed to find an association). We extracted all relevantEHR codes for each of the 16 positive associations (n¼ 172 codes).These literature associations were used for quality assessment ofSeaWAS results.
We used an internal evaluation technique to evaluate novel associ-ations discovered by SeaWAS. We ran the SeaWAS algorithm on a re-stricted sample comprising 80% of the original sample, randomlychosen. We then corrected for multiplicity using the Benjamini-
Table 1: Demographics of Patients Included inSeaWAS Study (N¼ 1749400)
Demographic N (%)
Sexa
Female 956 465 (54.67)
Male 791 534 (45.25)
Other/unidentified 1401 (0.08)
Race
White 665 366 (38.03)
Othera 456 185 (26.08)
Unidentified 386 533 (22.10)
Black 189 123 (10.81)
Declined 29 747 (1.70)
Asian 20 746 (1.19)
Native American/Indian 1511 (0.09)
Pacific Islander 189 (0.01)
Ethnicity
Non-Hispanic 590 386 (33.75)
Unidentified 458 071 (26.18)
Hispanic 361 123 (20.64)
Declined 339 820 (19.42)
Other attributes Median (first–thirdquartile)
Total SNOMED-CT codes per patient 6 (1–32)
Distinct SNOMED-CT codes per patient 3 (1–8)
Age (year of service–year of birth) 38 (22–58)
Years of Follow-up 1 (1–3)
aOther (includes Hispanics not otherwise identified)
RESEARCHAND
APPLICATIONSBoland MR, et al. J Am Med Inform Assoc 2015;22:1042–1053. doi:10.1093/jamia/ocv046, Research and Applications
1043
Dow
nloaded from https://academ
ic.oup.com/jam
ia/article/22/5/1042/930268 by guest on 11 July 2022

Hochberg adjustment that controls the FDR. We took all novel associa-tions (i.e., not reported in the literature) revealed in the restricted sam-ple, and then validated them using the validation set (containing 20%of the original population). Twelve of the 16 discovered associationswere validated in this manner.
Permutation analysis was also used for empirical evaluation ofSeaWAS. We randomly selected 55 diagnosis codes from the set of1688 codes included in our study. We then set all codes in this ran-domly derived set as “positive” associations. Next, the number of pos-itive literature results in each random sample was measured. Thiswas done for 1000 random samples. The overall distribution of theserandom samples was compared to our SeaWAS results. This allowedus to assess the true positive rate, false positive rate, positive predic-tive value, and the total number of confirmed literature associationsobtained from SeaWAS.
For all significant associations, we calculated the proportion of in-dividuals having the condition using their birth month and day out ofall individuals with the same birth month and day. This generated aset of proportions for every day in the year (366 days). We then used a2-month window10 to smooth the daily proportion rate (1 month before
the date and 1 month after the date). The weekly and monthly aver-ages were then computed. An overview of the algorithm is shown inFigure 1.
All SeaWAS results were compared to the literature in a binarymanner to ascertain if the association was previously reported.Afterwards, we analyzed the disease-birth month risk plots from theliterature. We used three criteria to select studies, namely: 1) pub-lished raw data; 2) raw data includes some adjustment for natural var-iation in birth month depending on study region; and 3) disease-birthmonth data were at a similar granularity level to allow for effectivecomparisons (e.g., this criterion would exclude studies that groupedmultiple diseases together or removed certain disease subtypes). Wesought to include pattern data for at least one study per disease cate-gory to compare with SeaWAS.
RESULTSEHR Mining of 1688 Conditions Reveals 55 Conditions Dependenton Birth MonthWe used SeaWAS to mine birth month associations for 1688SNOMED-CT conditions with at least 1000 individuals recorded at
Figure 1: Overview of the SeaWAS algorithm. The algorithm takes all 1688 conditions as initial input, finds significant asso-ciations over all months, then it models each birth month’s association with the condition by smoothing the birth monthproportions using a 2-month window. We then extracted all relevant birth month articles from PubMed (n ¼ 92) andmapped the results to extractable codes from electronic health records. SeaWAS found 7 of the 16 diseases reported asassociated with birth month in the literature corresponding to 19/55 associated codes.
RESEARCHAND
APPLICATIONS
Boland MR, et al. J Am Med Inform Assoc 2015;22:1042–1053. doi:10.1093/jamia/ocv046, Research and Applications
1044
Dow
nloaded from https://academ
ic.oup.com/jam
ia/article/22/5/1042/930268 by guest on 11 July 2022

CUMC. After multiplicity correction using FDR (a¼ 0.05, n¼ 1688\conditions), 55 conditions were found associated with birth month. Allreported P-values are FDR adjusted (q-values).
Literature Validation of SeaWAS ResultsUsing our curated reference set of 16 conditions (that mapped to 172SNOMED-CT codes), we found 19 SeaWAS results (7 distinct diseases)were supported by the literature (SI Appendix Table S1), representinga significant enrichment with OR¼ 3.4 (95% CI: 1.9–6.0, P< .0001,Figure 2a). SeaWAS successfully ruled-out associations between birthmonth and disease risk for all “true negatives” in our reference set(Figure 2a). We compared SeaWAS results for known and closely re-lated diseases (Figure 2b) to help elucidate gaps in the literature. Wefound that some diseases, e.g., reproductive performance, featuredprominently in both the literature and SeaWAS results, whereas, otherdiseases featured heavily in the literature but not as strongly in ourresults, e.g., asthma/allergy and rhinitis. A potential literature gapexists for respiratory syncytial virus (2 publications Figure 2a),which had many SeaWAS known or highly related associations (8 totalassociations, Figure 2b). A Manhattan plot visualizes our results
by disease category (Figure 2c) showing that some categories includ-ing, circulatory, and respiratory diseases appear prominently in ourresults.
We found 20 conditions associated with birth month that weresimilar to those in our reference set (SI Appendix Table S2) and 16that were completely novel (Table 2). Nine of these 16 associationswere cardiovascular conditions including: atrial fibrillation (P< .001),essential hypertension (P< .001), congestive cardiac failure(P< .001), angina (P¼ .001), cardiac complications of care(P¼ .027), mitral valve disorder (P¼ .024), pre-infarction syndrome(P¼ .036), cardiomyopathy (P¼ .009), and chronic myocardial ische-mia (P¼ .022). Seven discovered associations were non-cardiovascu-lar: primary malignant neoplasm of prostate, malignant neoplasm ofoverlapping lesion of bronchus and lung, acute upper respiratory infec-tion, nonvenomous insect bite, venereal disease screening, bruising,and vomiting.
Internal Evaluation of Discovered AssociationsWe internally evaluated all novel associations found using SeaWAS. Weran SeaWAS on an 80% restricted sample and then validated the novel
Figure 2: SeaWAS Results Show Enrichments for Literature Associations. (A) shows the breakdown of SeaWAS results bynumber of publications demonstrating a relationship. (B) shows the number of SeaWAS associations known to be relatedto disease from the literature (solid black), and those that are closely related to known diseases (curvy lines). (C) Depicts allbirth month–disease associations in a Manhattan plot organized by their respective ICD-9 disease categories (x axis). A sig-nificant SeaWAS association is a disease–birth month association remaining significant after FDR adjustment.
RESEARCHAND
APPLICATIONSBoland MR, et al. J Am Med Inform Assoc 2015;22:1042–1053. doi:10.1093/jamia/ocv046, Research and Applications
1045
Dow
nloaded from https://academ
ic.oup.com/jam
ia/article/22/5/1042/930268 by guest on 11 July 2022

Table 2: Birth Month-Disease Associations Discovered Using SeaWAS (n¼ 16)
EHR Condition in SeaWAS N Passed InternalValidation?
Adjusted P1 Seasonal Pattern Birth Month Risk
High Low
Cardiovascular (n 5 9)
Atrial fibrillation 48 961 Yes <0.001 March October
Essential hypertension 269 913 Yes <0.001 January October
Congestive cardiac failure 61 448 Yes <0.001 March October
Angina 20 741 Yes <0.001 April September
Cardiac complications of care 13 653 Yes 0.027 April September
Cardiomyopathy 17 873 Yes 0.009 January September
Pre-infarction syndrome 25 028 No 0.036 June October
Chronic myocardial ischemia 10 010 No 0.022 April November
Mitral valve disorder 22 966 No 0.024 March November
Other (n 5 7)
Acute upper respiratory infection 112 487 Yes <0.001 October May
Bruising 8904 Yes 0.015 December April
Nonvenomous insect bite 7435 Yes 0.001 October February
Venereal disease screening 69 764 Yes 0.003 October June
Primary malignant neoplasm of prostate 20 353 Yes 0.002 March October
Malignant neoplasm of overlappinglesion of bronchus and lung
2714 Yes 0.014 February November
Vomiting 30 495 No 0.029 September January
1P-values adjusted using Benjamini-Hochberg method (see Methods)
RESEARCHAND
APPLICATIONS
Boland MR, et al. J Am Med Inform Assoc 2015;22:1042–1053. doi:10.1093/jamia/ocv046, Research and Applications
1046
Dow
nloaded from https://academ
ic.oup.com/jam
ia/article/22/5/1042/930268 by guest on 11 July 2022

associations in the validation set (20% original sample size). 12 of the 16novel associations were validated including 6 out of 9 novel cardiovascu-lar conditions. Table 2 denotes the discovered conditions that passed theinternal validation. Four conditions were not significant after correctionin the restricted sample including: mitral valve disorder, pre-infarctionsyndrome, chronic myocardial ischemia, and vomiting.
Evaluation Using Permutation AnalysisWe used permutation analysis to assess the concordance we foundbetween our SeaWAS results and what was reported in the literature.We randomly selected 55 codes from the set of 1688 codes includedin our study and set them as “positives.” We then measured the num-ber of positive literature results in our random samples and comparedto SeaWAS. We did this for 1000 random samples. Results are shownin Figure 3. SeaWAS consistently and significantly (P< .001) outper-formed random for TPR, FPR, and PPV at finding more literature vali-dated associations.
SeaWAS Replicates Established Birth Month Trends: Asthma,Reproductive Performance, and ADHDWe calculated smoothed birth month proportions for all 55 SeaWASbirth month associations. We then compared conditions with knownassociations to birth month and their published trends. The smoothedweekly and monthly proportions are shown in Figure 4 for 3 estab-lished associations: asthma, Attention Deficit Hyperactivity Disorder(ADHD) and reproductive performance and three discovered associa-tions: atrial fibrillation, mitral valve disorder, and chronic myocardialischemia. Relative risk plots for the associations are given in SIAppendix Figure S4. To compare our results with the published pro-portions from other studies, we used an asthma study fromDenmark,13 a reproductive performance study from Austria,8 and anADHD study from Sweden.3
Comparing our results with Denmark’s asthma study13 showedhighly similar seasonal patterns. They found two large peaks in May
and August, with 2 smaller peaks in June and July.13 Our results wereshifted by 2 months with large peaks in July and October and smallerpeaks in August and September. We extracted data on the averagemonthly sunshine exposure for NYC and Denmark48,49 for comparison(Figure 4). For reproductive performance, we compared our results toan Austrian study8 (Figure 4). We validated a dip in births amongfemales born in May through September as this was also found in theAustrian study. We compared our ADHD smoothed proportions to oddsratios reported by a Swedish study and found a similar upward trendtowards the later part of the year peaking in November3 (Figure 4).
We sought to include at least one seasonality comparison for eachdisease category (n¼ 7) of known associations to those found bySeaWAS (SI Appendix Table S1). This includes: allergy/asthma/rhinitis,reproductive performance, ADHD, eye conditions/problems, respiratorysyncytial virus, otitis media, and colitis. Literature studies on eye condi-tions/problems failed our 3 criteria for inclusion as data was presentedat different disease granularity levels (e.g., mild myopia was excluded)preventing effective comparisons. We found data for conditions in thethree remaining categories, otitis media, colitis, and respiratory syncytialvirus (SI Appendix Figures S5–S7). We found many similarities amongthese data, but the exact mechanistic relationship between these condi-tions and birth seasonality remains obscure.
Discovered Associations: Cardiovascular Conditions and BirthMonthWe found 16 associations with no prior literature, we highlight 3 ofthese in Figure 4, including: atrial fibrillation, mitral valve disorder, andchronic myocardial ischemia. For illustration purposes, we selectedcardiovascular conditions whose pattern of association between birthmonth and disease risk differs. Mitral valve disorder demonstrates aclear bimodal seasonal pattern with a major disease risk peak amongthose born in March and a second smaller disease risk peak for thoseborn in August. Whereas, risk for atrial fibrillation is unimodal and
Figure 3: SeaWAS vs random reveals higher true positive rate, lower false positive rate, higher positive predictive value,and more confirmed literature associations. We used 1000 randomly generated samples. For each sample, 55 randomcodes were pulled (from the set of 1688), and then the number of confirmed literature associations was measured.SeaWAS consistently performed better than random across all measures.
TPR
Freq
uenc
y
0.00 0.02 0.04 0.06 0.08 0.10 0.12
010
025
0
FPR
Freq
uenc
y
0.020 0.025 0.030 0.035 0.040
015
035
0PPV
Freq
uenc
y
0.0 0.1 0.2 0.3 0.4 0.5
010
025
0
No. of Confirmed Literature AssociationsFr
eque
ncy
0 5 10 15 20
010
025
0
RandomSeaWAS
RESEARCHAND
APPLICATIONSBoland MR, et al. J Am Med Inform Assoc 2015;22:1042–1053. doi:10.1093/jamia/ocv046, Research and Applications
1047
Dow
nloaded from https://academ
ic.oup.com/jam
ia/article/22/5/1042/930268 by guest on 11 July 2022
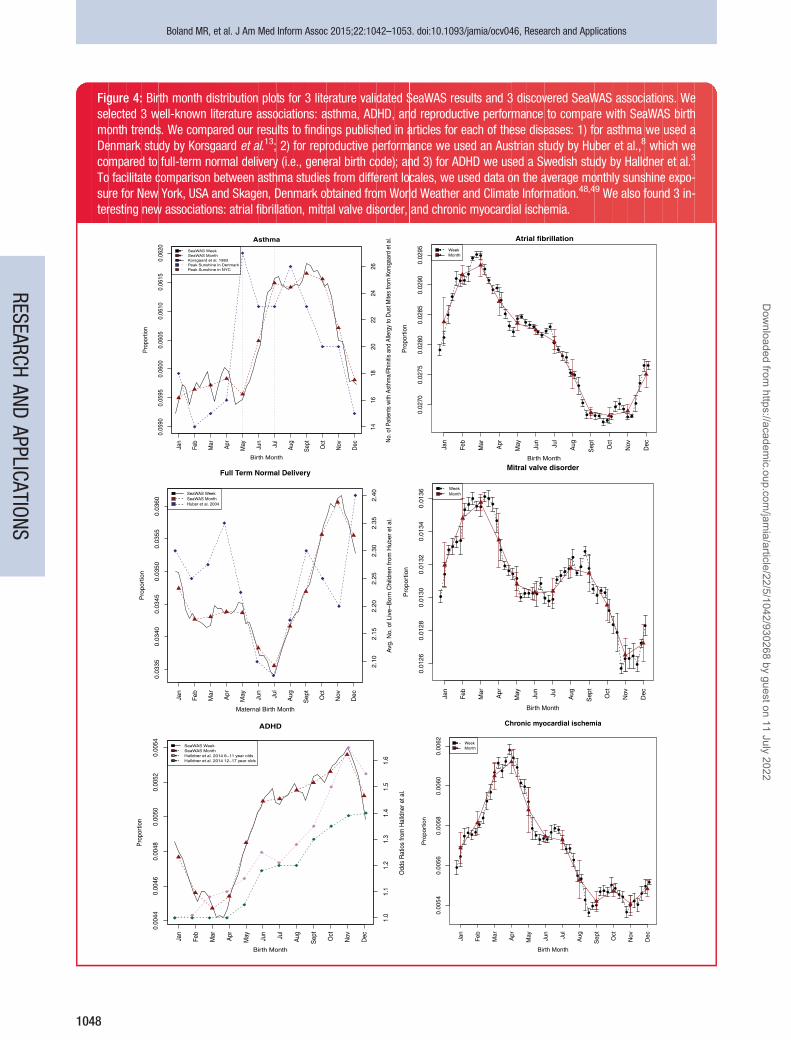
Figure 4: Birth month distribution plots for 3 literature validated SeaWAS results and 3 discovered SeaWAS associations. Weselected 3 well-known literature associations: asthma, ADHD, and reproductive performance to compare with SeaWAS birthmonth trends. We compared our results to findings published in articles for each of these diseases: 1) for asthma we used aDenmark study by Korsgaard et al.13; 2) for reproductive performance we used an Austrian study by Huber et al.,8 which wecompared to full-term normal delivery (i.e., general birth code); and 3) for ADHD we used a Swedish study by Halldner et al.3
To facilitate comparison between asthma studies from different locales, we used data on the average monthly sunshine expo-sure for New York, USA and Skagen, Denmark obtained from World Weather and Climate Information.48,49 We also found 3 in-teresting new associations: atrial fibrillation, mitral valve disorder, and chronic myocardial ischemia.
0.05
900.
0595
0.06
000.
0605
0.06
100.
0615
0.06
20
Asthma
Birth Month
Pro
porti
on
1416
1820
2224
26
No.
of P
atie
nts
with
Ast
hma/
Rhi
nitis
and
Alle
rgy
to D
ust M
ites
from
Kor
sgaa
rd e
t al.
Jan
Feb
Mar
Apr
Ma y Jun
Jul
A ug
Sep
t
Oct
Nov
Dec
SeaWAS WeekSeaWAS MonthKorsgaard et al. 1983Peak Sunshine in DenmarkPeak Sunshine in NYC
0.02
700.
0275
0.02
800.
0285
0.02
900.
0295
Atrial fibrillation
Birth Month
Pro
port
ion
Jan
Feb
Mar
Apr
May Jun
Jul
Aug
Sep
t
Oct
Nov
Dec
WeekMonth
0.03
350.
0340
0.03
450.
0350
0.03
550.
0360
Full Term Normal Delivery
Maternal Birth Month
Pro
port
ion
Jan
Feb
Mar
Apr
May Jun
Jul
Aug
Sep
t
Oct
Nov
Dec
2.10
2.15
2.20
2.25
2.30
2.35
2.40
Avg
. No.
of L
ive
Bor
n C
hild
ren
from
Hub
er e
t al.
SeaWAS WeekSeaWAS MonthHuber et al. 2004
0.01
260.
0128
0.01
300.
0132
0.01
340.
0136
Mitral valve disorder
Birth Month
Pro
port
ion
J an
Feb
Mar
Apr
May Jun
Jul
Aug
Sep
t
Oct
Nov
Dec
WeekMonth
0.00
440.
0046
0.00
480.
0050
0.00
520.
0054
ADHD
Birth Month
Pro
port
ion
Jan
F eb
Mar
Apr
May J un
Jul
Aug
Sep
t
Oct
Nov
Dec
1.0
1.1
1.2
1.3
1.4
1.5
1.6
Odd
s R
atio
s fro
m H
alld
ner e
t al.
SeaWAS WeekSeaWAS MonthHalldner et al. 2014 6 11 year oldsHalldner et al. 2014 12 17 year olds
0.00
540.
0056
0.00
580.
0060
0.00
62
Chronic myocardial ischemia
Birth Month
Pro
port
ion
Jan
Feb
Mar
Apr
May Jun
J ul
Aug
Sep
t
Oct
Nov
Dec
WeekMonth
RESEARCHAND
APPLICATIONS
Boland MR, et al. J Am Med Inform Assoc 2015;22:1042–1053. doi:10.1093/jamia/ocv046, Research and Applications
1048
Dow
nloaded from https://academ
ic.oup.com/jam
ia/article/22/5/1042/930268 by guest on 11 July 2022

peaks among those born in March with a trough between Septemberand November.
Patterns of Birth-month Dependencies Cluster by Disease TypeOf nine discovered cardiovascular associations, six had high-risk birthmonths in March or April suggesting that high-risk birth months maycluster by disease category. We examined the disease category–birthmonth relationship and found that individuals born in March were atincreased risk for cardiovascular diseases (Figure 5), but they hadgreater protection against respiratory illnesses and neurological condi-tions. Contrastingly, individuals born in October were at increased riskfor respiratory conditions with increased protection against developingcardiovascular conditions. Overall, we found that some months,namely May and July, had zero at risk diseases (Figure 5, top). Thecomplete list of protective and at risk diseases by birth month is givenin SI Appendix Table S3 with all 55 conditions and their patterns givenin SI Appendix Table S4.
Cardiovascular Disease Risk-Birth Month and Lifespan-Birth MonthWe compared our cardiovascular disease findings (n¼ 10) fromSeaWAS to published data relating overall lifespan and birth month,12
see Figure 6. Months with lower cardiovascular disease risk corre-sponded with months having longer life expectancies from Doblhammeret al.’s previous study.12 Six of the 10 cardiovascular conditions weresignificantly anti-correlated with life-expectancy data. The strongestanti-correlation was cardiac complications of care (Denmark:r¼�0.815, P¼ .001; Austria: r¼�0.863, P< .001); followed bychronic myocardial ischemia (Denmark: r¼�0.810, P¼ .001; Austria:r¼�0.826, P< .001); pre-infarction syndrome (Denmark:r¼�0.712, P¼ .009; Austria: r¼�0.918, P< .001); coronary arte-riosclerosis (Denmark: r¼�0.617, P¼ .030; Austria: r¼�0.773,P¼ .003); atrial fibrillation (Denmark: r¼�0.615, P¼ .033; Austria:r¼�0.763, P¼ .004); and angina (Denmark: r¼�0.611, P ¼ .035;Austria: r¼�0.771, P¼ .003).
DISCUSSIONMany diseases demonstrate birth month dependencies with knownmechanistic etiologies, including: asthma,13 ADHD,3 reproductive per-formance,8 and myopia.50 In these studies birth month was used as aproxy for seasonal variations in physiological state or changes in envi-ronmental exposures. Understanding dependencies between diseasesand these variations is an important and challenging research task.Large clinical databases, such as EHRs, represent a novel resource forsystematically investigating diseases.17,18 We present a novel method,SeaWAS, for investigating birth-month dependencies across all dis-eases in a large EHR. Prior studies analyzed a single disease, or a dis-ease spectrum (e.g., Immune-mediated Diseases) at a time. Thesehypothesis-driven methods suffer from publication bias, whereby pa-pers demonstrating an association between a disease of interest andbirth month are more likely to be published than papers that fail tofind an association.26,27,40 Prior methods also suffer from diseaseselection bias whereby diseases of popular interest are studied morefrequently potentially overlooking other important disease-birth monthassociations. SeaWAS overcomes these challenges using a hypothe-sis-free method that does not relying on a priori hypotheses.
SeaWAS Confirms Known Disease-Birth Month AssociationsSeaWAS confirmed a literature-validated association between asthma(hyper-reactive airway disease) and birth month reported by studiesfrom Denmark13 and Sweden.51 When we compared our findings tothe Denmark study,13 we found a 2-month shift in the birth month-
asthma pattern that corresponds with a shift in the peak sunshine (afactor in asthma complicated by dust mite allergies) betweenDenmark and NYC48,49 (Figure 4).
Likewise, comparing our reproductive performance results to anAustrian study8 revealed that the dip in births among females born inMay through September was observed in both studies.8 Importantly,the female reproductive system, unlike males, is established earlywith females being born with their lifetime maximum number of oo-cytes.52,53 Oocyte count is thought to be linked to fertility.54 Manystudies show a link between maternal birth month and number of off-spring supporting the belief that prenatal and early developmental ef-fects can alter a female’s lifetime fertility.5–9 SeaWAS findings bolsterthis body of literature.
We compared our ADHD smoothed proportions to odds ratios re-ported by a Swedish study and found a similar upward trend towardsthe later part of the year peaking in November.3 A rationale for theirfindings (and ours) is that relative immaturity (born later in the year)may result in increased ADHD detection.3 This occurs because moreimmature children (i.e., younger in age) face higher demands early onin their school years making them more susceptible to ADHD diagno-sis. The age cutoff for schools in Sweden is 31 December, which isthe same for NYC public schools. Alternatively, the relationshipbetween Vitamin D and ADHD and learning patterns has been estab-lished in rats55,56 and Vitamin D deficiency in early development (inutero or shortly after birth) could be related to ADHD.
Discovered Cardiac Condition-Birth Month RelationshipSeaWAS revealed nine cardiovascular conditions associated with birthmonth. Importantly, children born to survivors of the H1N1 1918 sub-type were associated with a >20% excess risk of cardiovascular dis-ease,57 suggesting a relationship between maternal infection andcardiovascular disease risk that is independent of maternal malnutri-tion.57 Therefore, maternal infection during the winter months(January–March) could contribute to the increased cardiovascular dis-ease risk among children born in those months.
Looking at all 10 (9 novel) cardiovascular conditions revealed thatindividuals born in the autumn (September–December) were protectedagainst cardiovascular conditions while those born in the winter(January–March) and spring (April–June) were associated with in-creased cardiovascular disease risk (Figure 5). Interestingly, one studyfound that people born in the autumn (October–December) lived longerthan those born in the spring (April–June).12 Furthermore the relation-ship between cardiovascular disease risk and lifespan is established.58
We compared our results to the Doblhammer et al. study investigatinglifespan’s dependency on birth month and found 6 cardiovascular dis-eases were significantly anti-correlated. This indicates that birthmonths with low risk for 6 cardiovascular diseases in our studywere also associated with longer lifespan in Doblhammer’s study12
(Figure 6). Our findings suggest that the relationship between lifespanand birth month12 could be explained by increased cardiovascular dis-ease risk.
The relationship between cardiovascular disease and birth monthcould be mediated through a developmental Vitamin D-related path-way. Serum 25-hydroxyvitamin D levels are lower and parathyroidhormone levels are higher during the winter when no supplementationis given.59 Even with maternal supplementation, seasonally dependentVitamin D deficiency has been observed among breastfed infants60
and newborns.61 This is important because levels of parathyroid hor-mone and Vitamin D are associated with cardiovascular disease.62,63
Specifically, elevated parathyroid hormone is correlated with increasedheart failure in elderly males.64 Studies focusing on adolescents found
RESEARCHAND
APPLICATIONSBoland MR, et al. J Am Med Inform Assoc 2015;22:1042–1053. doi:10.1093/jamia/ocv046, Research and Applications
1049
Dow
nloaded from https://academ
ic.oup.com/jam
ia/article/22/5/1042/930268 by guest on 11 July 2022

Figure 5: Disease risk status breakdown by birth month illustrates disease category dependency. Some months, e.g., May,June, August, January, and December, provide no overall advantage or disadvantage to those born in that particular month(Figure 5, top). Other months, e.g., November, are more likely to be associated with increased disease risk while others,e.g., February, tend to be associated with decreased disease risk. The relationship between birth month and disease riskdepends on disease category, and this is shown in the 4 lower subplots. Light gray lines represent risk curves for diseasesbelonging to a particular category. For example, individuals born in October are at increased risk for respiratory conditionsand at the same time are at decreased risk for cardiovascular conditions.
RESEARCHAND
APPLICATIONS
Boland MR, et al. J Am Med Inform Assoc 2015;22:1042–1053. doi:10.1093/jamia/ocv046, Research and Applications
1050
Dow
nloaded from https://academ
ic.oup.com/jam
ia/article/22/5/1042/930268 by guest on 11 July 2022

that Vitamin D deficiency resulted in an increased likelihood of hyper-tension (a SeaWAS discovered association)65,66 and high-density lipo-protein cholesterol,66 both risk factors for cardiovascular disease.
SeaWAS vs PheWAS: Looking Towards the FutureWe present SeaWAS a Phenome-Wide approach that systematically in-vestigates birth month-disease dependencies using EHRs. Our methoduses birth month as a proxy for prenatal or perinatal exposure/effectsof seasonality on development, and the disease-risk conferred bythese perturbations. Denny et al.’s30 Phenome-Wide Association Study(PheWAS) investigates the relationship between diseases recorded inEHRs and genomic markers in a similar high-throughput manner.Recently, an obesity risk factor gene was found to be associated withyear of birth67 suggesting the importance of combined genetic–envi-ronmental etiologies in complex phenotypes. In the near future it maybe possible to harness SeaWAS and PheWAS methods for high-throughput identification of diseases tied to prenatal environmentalfactors (SeaWAS) and then reveal the genetic drivers (PheWAS) under-lying the prenatal seasonality effects from EHRs.
Limitations and Future WorkStudy limitations include the lack of condition independence (condi-tions rarely occur in isolation) potentially affecting multiplicity correc-tion. Also, we cannot rule out indirect mechanisms (e.g., depressionaffects fertility, and learning ability) behind associations between dis-ease risk and birth month. Some conditions associated with birth
month may be associated because the infant was born in a high-riskperiod, e.g., acute bronchiolitis-autumn births. These associations dif-fer from lifetime disease effects; however, we do not distinguish be-tween them in our analyses because both are presented in theliterature as birth month–disease associations. Another limitation isour exclusive use of EHR data, which is affected by the healthcare pro-cess22,68 and can introduce bias,21 e.g., sick patients tend to be over-represented in EHR populations.69 Importantly, we showed that ourbirth month by year data correlated with CDC data (SI Appendix FigureS3) indicating that our EHR population adequately represents the“true” NYC-born population (which includes healthy people) with re-spect to birth month. Hence, we do not expect this bias to affect ourfindings.
Additionally, our study uses one institution’s data only; therefore,all birth month-disease risk findings are based on the NYC climate.Because our data is from one locale and climate, the effects we ob-serve are likely due to the climate effects of the NYC region, and ismost comparable to Northern European climates. Future work, in-volves applying our SeaWAS methodology to other institutions and ad-justing for climatic differences, which is important when includingdata from diverse locales and climates.70
CONCLUSIONWe present a high-throughput algorithm called SeaWAS that uncoversconditions associated with birth month without relying on a priori hy-potheses. SeaWAS confirms many known connections between birth
Figure 6: SeaWAS cardiovascular condition-birth month proportions correlate with published lifespan-birth month resultsfrom Doblhammer et al. 2001. All 10 (9 novel) cardiovascular disease–birth month associations found by SeaWAS werecompared to Doblhammer et al.’s lifespan-birth month dependencies for Denmark and Austria12 The lifespan-birth monthassociations are shown in Figure 6a. Six of the 10 were anti-correlated (i.e., months with low cardiovascular disease riskwere also months with longer life expectancies from Doblhammer et al.’s study.12 The top 3 anti-correlated cardiovasculardiseases are shown in Figure 6b, cardiac complications of care (Denmark: r¼�0.815, P¼ .001; Austria: r¼�0.863,P< .001); chronic myocardial ischemia (Denmark: r¼�0.810, P¼ .001; Austria: r¼�0.826, P< .001); and pre-infarction syndrome (Denmark: r¼�0.712, P¼ .009; Austria: r¼�0.918, P< .001). In Figure 6b, **denotes P� 0.001and *denotes P< .01 for both comparisons (Austria and Denmark).
Feb Apr Jun Aug Oct Dec
Doblhammer et al. 2001
Birth Month
Ave
rage
Add
ed Y
ears
of L
ife
0.5
0.4
0.3
0.2
0.1
00.
10.
20.
30.
40.
5
AustriaDenmark
Feb Apr Jun Aug Oct Dec
0.90
0.95
1.00
1.05
1.10
Birth Month
Rel
ativ
e R
isk
Cardiac complications of care **Chronic myocardial ischemia **Preinfarction syndrome *
A B
shorter lives
longer lives
higher incidence of disease
lower incidence of disease
RESEARCHAND
APPLICATIONSBoland MR, et al. J Am Med Inform Assoc 2015;22:1042–1053. doi:10.1093/jamia/ocv046, Research and Applications
1051
Dow
nloaded from https://academ
ic.oup.com/jam
ia/article/22/5/1042/930268 by guest on 11 July 2022

month and disease including: reproductive performance, ADHD,asthma, colitis, eye conditions, otitis media (ear infection), and respi-ratory syncytial virus. We discovered 16 associations with birth monththat have never been explicitly studied previously. Nine of these asso-ciations were related to cardiovascular conditions strengthening thelink between cardiac conditions, early development, and Vitamin D.Seasonally-dependent early developmental mechanisms might play arole in increasing lifetime disease risk.
CONTRIBUTIONSM.R.B.: Ms. Boland designed methodology, conducted all analyses, and wrote
the manuscript.Z.S.: Mr Shahn helped with statistical analyses, reviewed, and noted points of
revision for the manuscript.D.M.: Dr Madigan engaged in the design of the statistical methods, reviewed,
and noted points of revision for the manuscript.G.H.: Dr Hripcsak helped design aspects of the methodology particularly as they
pertained to appropriate use of Electronic Health Records, provided guidance
on the interpretation of the analyses, and reviewed the manuscript.N.P.T.: Dr Tatonetti was involved in all stages of the study design and imple-
mentation. He contributed resources, helped refine aspects of the methodology,
provided critical insights into validation of methods, and critically reviewed and
edited the manuscript.
FINANCIAL DISCLOSUREThe authors have no financial disclosures relevant to this article.
CONFLICT OF INTERESTThe authors have no conflicts of interest.
CLINICAL TRIAL REGISTRATIONNot Applicable.
SUPPLEMENTARY MATERIALSupplementary material is available online at http://jamia.oxfordjournals.org/.
ACKNOWLEDGEMENTS
M.R.B. was supported by the National Library of Medicine training grant T15
LM00707, G.H. supported by LM006910, N.P.T. supported by R01 GM107145.
REFERENCES1. Hippocrates, Adams Ft. On Airs, Waters, and Places. http://classics.mit.edu/
Hippocrates/airwatpl.mb.txt. 460 BCE. Accessed August 7, 2014.2. McGrath JJ, Eyles DW, Pedersen CB, et al. Neonatal vitamin d status and
risk of schizophrenia: A population-based case-control study. Arch GeneralPsychiatr. 2010;67(9):889–894.
3. Halldner L, Tillander A, Lundholm C, et al. Relative immaturity and ADHD:findings from nationwide registers, parent- and self-reports. J Child PsycholPsychiatr. 2014;55(8):897–904.
4. Willer CJ, Dyment DA, Sadovnick AD, Rothwell PM, Murray TJ, Ebers GC.Timing of birth and risk of multiple sclerosis: population based study. BMJ.2005;330(7483):120.
5. Huber S, Didham R, Fieder M. Month of birth and offspring count of women:data from the Southern hemisphere. Hum Reprod. 2008;23(5):1187–1192.
6. Huber S, Fieder M. Strong association between birth month and repro-ductive performance of Vietnamese women. Am J Hum Biol. 2009;21(1):25–35.
7. Huber S, Fieder M. Perinatal winter conditions affect later reproductive per-formance in Romanian women: intra and intergenerational effects. Am JHum Biol. 2011;23(4):546–552.
8. Huber S, Fieder M, Wallner B, Moser G, Arnold W. Brief communication:birth month influences reproductive performance in contemporary women.Hum Reprod. 2004;19(5):1081–1082.
9. Kemkes A. The impact of maternal birth month on reproductive perfor-mance: controlling for socio-demographic confounders. J Biosoc Sci. 2010;42(2):177–194.
10. Kahn HS, Morgan TM, Case LD, et al. Association of type 1 diabetes withmonth of birth among US youth the SEARCH for Diabetes in Youth Study.Diabetes Care. 2009;32(11):2010–2015.
11. Disanto G, Chaplin G, Morahan JM, et al. Month of birth, vitamin D andrisk of immune mediated disease: a case control study. BMC Med. 2012;10(1):69.
12. Doblhammer G, Vaupel JW. Lifespan depends on month of birth. Proc NatlAcad Sci. 2001;98(5):2934–2939.
13. Korsgaard J, Dahl R. Sensitivity to house dust mite and grass pollen inadults. Influence of the month of birth. Clin Allergy. 1983;13(6):529–535.
14. Wahn U, Lau S, Bergmann R, et al. Indoor allergen exposure is a risk factorfor sensitization during the first three years of life. J Allergy Clin Immunol.1997;99(6, Part 1):763–769.
15. Disanto G, Watson CT, Meier UC, Ebers GC, Giovannoni G, Ramagopalan SV.Month of birth and thymic output. JAMA Neurol. 2013;70(4):527–528.
16. Jha AK. Meaningful use of electronic health records: the road ahead. JAMA.2010;304(15):1709–1710.
17. Roque FS, Jensen PB, Schmock H, et al. Using electronic patient records todiscover disease correlations and stratify patient cohorts. PLoS Comput Biol.2011;7(8):e1002141.
18. Jensen PB, Jensen LJ, Brunak S. Mining electronic health records: towardsbetter research applications and clinical care. Nat Rev Genet. 2012;13(6):395–405.
19. Boland MR, Hripcsak G, Shen Y, Chung WK, Weng C. Defining a comprehen-sive verotype using electronic health records for personalized medicine.JAMIA. 2013;20(e2):e232–e238.
20. Weiskopf NG, Weng C. Methods and dimensions of electronic health record
data quality assessment: enabling reuse for clinical research. JAMIA. 2013;
20(1):144–151.21. Hripcsak G, Knirsch C, Zhou L, Wilcox A, Melton G. Bias associated with
mining electronic health records. J Biomed Discov Collab. 2011;6:48–52.22. Hripcsak G, Albers DJ. Correlating electronic health record concepts with
healthcare process events. JAMIA. 2013;20(e2):e311–e318.23. Loukides G, Gkoulalas-Divanis A, Malin B. Anonymization of electronic med-
ical records for validating genome-wide association studies. Proc Natl Acad
Sci. 2010;107(17):7898–7903.24. Elkin PL, Brown SH, Husser CS, et al. Evaluation of the Content Coverage of
SNOMED CT: ability of SNOMED Clinical Terms to Represent Clinical
Problem Lists. Mayo Clinic Proc. 2006;81(6):741–748.25. Hripcsak G, Knirsch C, Zhou L, Wilcox A, Melton GB. Using discordance to
improve classification in narrative clinical databases: an application to com-
munity-acquired pneumonia. Comput Biol Med. 2007;37(3):296–304.26. Stern JM, Simes RJ. Publication bias: evidence of delayed publication in a
cohort study of clinical research projects. 1997;315:640.27. Dickersin K. The existence of publication bias and risk factors for its occur-
rence. JAMA. 1990;263(10):1385–1389.28. Jensen PB, Jensen LJ, Brunak S. Mining electronic health records: towards
better research applications and clinical care. Nat Rev Genet. 2012;13(6):395–405.
29. Boland MR, Hripcsak G, Albers DJ, et al. Discovering medical conditions as-sociated with periodontitis using linked electronic health records. J ClinPeriodontol. 2013;40(5):474–482.
30. Denny JC, Ritchie MD, Basford MA, et al. PheWAS: demonstrating the feasi-bility of a phenome-wide scan to discover gene-disease associations.Bioinformatics. 2010;26(9):1205–1210.
31. Kohane IS. Using electronic health records to drive discovery in disease ge-nomics. Nat Rev Genet. 2011;12(6):417–428.
32. Crawford DC, Crosslin DR, Tromp G, et al. eMERGEing progress in geno-mics—the first seven years. Front Genet. 2014;5:184.
RESEARCHAND
APPLICATIONS
Boland MR, et al. J Am Med Inform Assoc 2015;22:1042–1053. doi:10.1093/jamia/ocv046, Research and Applications
1052
Dow
nloaded from https://academ
ic.oup.com/jam
ia/article/22/5/1042/930268 by guest on 11 July 2022

33. Wang X, Hripcsak G, Markatou M, Friedman C. Active computerizedpharmacovigilance using natural language processing, statistics,and electronic health records: a feasibility study. JAMIA. 2009;16(3):328–337.
34. Haerian K, Varn D, Vaidya S, Ena L, Chase H, Friedman C. Detection of phar-macovigilance-related adverse events using electronic health records andautomated methods. Clin Pharmacol Therap. 2012;92(2):228–234.
35. Holmes AB, Hawson A, Liu F, Friedman C, Khiabanian H, Rabadan R.Discovering disease associations by integrating electronic clinical data andmedical literature. PloS ONE. 2011;6(6):e21132.
36. Doshi-Velez F, Ge Y, Kohane I. Comorbidity clusters in autism spectrum dis-orders: an electronic health record time-series analysis. Pediatrics. 2014;133(1):e54–e63.
37. Melamed RD, Khiabanian H, Rabadan R. Data-driven discovery of seasonallylinked diseases from an Electronic Health Records system. BMCBioinformatics. 2014;15 (Suppl 6):S3.
38. Cohen HA, Blau H, Hoshen M, Batat E, Balicer RD. Seasonality of asthma: aretrospective population study. Pediatrics. 2014;133(4):e923–e932.
39. Randolph C. Seasonality of asthma: a retrospective population study.Pediatrics. 2014;134 (Suppl 3):S165–S166.
40. Easterbrook PJ, Gopalan R, Berlin JA, Matthews DR. Publication bias in clin-ical research. The Lancet. 1991;337(8746):867–872.
41. Vawdrey DK, Hripcsak G. Publication bias in clinical trials of electronic healthrecords. J Biomed Inform. 2013;46(1):139–141.
42. Overhage JM, Ryan PB, Reich CG, Hartzema AG, Stang PE. Validation of acommon data model for active safety surveillance research. JAMIA. 2012;19(1):54–60.
43. Campbell JR, Payne TH. A comparison of four schemes for codification ofproblem lists. Proceedings / the Annual Symposium on ComputerApplication [sic] in Medical Care Symposium on Computer Applications inMedical Care. 1994:201–205.
44. Margolis R, Derr L, Dunn M, et al. The National Institutes of Health’s BigData to Knowledge (BD2K) initiative: capitalizing on biomedical big data.JAMIA. 2014;21(6):957–958.
45. CDC. Vital Stats Beyond 20/20. National Vital Statistics System USDepartment of Health and Human Services. 2014. http://205.207.175.93/Vitalstats/Common/Login/Login.aspx. Accessed July 1, 2014.
46. Duncan J, Narus SP, Clyde S, Eilbeck K, Thornton S, Staes C. Birth of iden-tity: understanding changes to birth certificates and their value for identityresolution. JAMIA. 2015;22:e120–e129.
47. Benjamini Y, Hochberg Y. Controlling the false discovery rate: a practicaland powerful approach to multiple testing. J R Stat Soc Series B. 1995;57:289–300.
48. Average sunshine in Skagen, Denmark. World Weather and ClimateInformation. 2014. http://www.weather-and-climate.com/average-monthly-hours-Sunshine,skagen,Denmark. Accessed August 8, 2014.
49. Average sunshine in New York, United States of America. World Weatherand Climate Information. 2014. http://www.weather-and-climate.com/aver-age-monthly-hours-Sunshine,New-York,United-States-of-America.Accessed August 8, 2014.
50. Mandel Y, Grotto I, El-Yaniv R, et al. Season of birth, natural light, and myo-pia. Ophthalmology. 2008;115(4):686–692.
51. Aberg N. Birth season variation in asthma and allergic rhinitis. Clin ExpAllergy. 1989;19(6):643–648.
52. Morita Y, Tilly JL. Oocyte apoptosis: like sand through an hourglass. DevBiol. 1999;213(1):1–17.
53. Baker T. A quantitative and cytological study of germ cells in human ovaries.Proc R Soc Lond. 1963;158(972):417–433.
54. Tilly JL, Niikura Y, Rueda BR. The current status of evidence for and againstpostnatal oogenesis in mammals: a case of ovarian optimism versus pessi-mism? Biol Reprod. 2009;80(1):2–12.
55. Burne THJ, Feron F, Brown J, Eyles DW, McGrath JJ, Mackay-Sim A.Combined prenatal and chronic postnatal vitamin D deficiency in ratsimpairs prepulse inhibition of acoustic startle. Physiol Behav. 2004;81(4):651–655.
56. Becker A, Eyles DW, McGrath JJ, Grecksch G. Transient prenatal vitamin Ddeficiency is associated with subtle alterations in learning and memoryfunctions in adult rats. Behav Brain Res. 2005;161(2):306–312.
57. Mazumder B, Almond D, Park K, Crimmins EM, Finch CE. Lingering prenataleffects of the 1918 influenza pandemic on cardiovascular disease. J DevOrigins Health Dis. 2010;1(1):26–34.
58. Stamler J, Stamler R, Neaton JD, et al. Low risk-factor profile and long-termcardiovascular and noncardiovascular mortality and life expectancy: findingsfor 5 large cohorts of young adult and middle-aged men and women. JAMA.1999;282(21):2012–2018.
59. Dawson-Hughes B, Dallal GE, Krall EA, Harris S, Sokoll LJ, Falconer G.Effect of vitamin D supplementation on wintertime and overall boneloss in healthy postmenopausal women. Ann Int Med. 1991;115(7):505–512.
60. Halicioglu O, Sutcuoglu S, Koc F, Yildiz O, Akman SA, Aksit S. Vitamin D sta-tus of exclusively breastfed 4-month-old infants supplemented during dif-ferent seasons. Pediatrics. 2012;130(4):e921–e927.
61. Lee JM, Smith JR, Philipp BL, Chen TC, Mathieu J, Holick MF. Vitamin D de-ficiency in a healthy group of mothers and newborn infants. Clin Pediatr.2007;46(1):42–44.
62. Lee JH, O’Keefe JH, Bell D, Hensrud DD, Holick MF. Vitamin D deficiencyanimportant, common, and easily treatable cardiovascular risk factor? J AmCollege Cardiol. 2008;52(24):1949–1956.
63. Wang TJ, Pencina MJ, Booth SL, et al. Vitamin D deficiency and risk of car-diovascular disease. Circulation. 2008;117(4):503–511.
64. Wannamethee SG, Welsh P, Papacosta O, Lennon L, Whincup PH, Sattar N.Elevated parathyroid hormone, but not vitamin D deficiency, is associatedwith increased risk of heart failure in older men with and without cardiovas-cular disease. Circ Heart Fail. 2014;7(5):732–739.
65. Reis JP, von Muhlen D, Miller ER 3rd, Michos ED, Appel LJ. Vitamin D statusand cardiometabolic risk factors in the United States adolescent popula-tion. Pediatrics. 2009;124(3):e371–e379.
66. Kumar J, Muntner P, Kaskel FJ, Hailpern SM, Melamed ML. Prevalence andassociations of 25-hydroxyvitamin D deficiency in US children: NHANES2001-2004. Pediatrics. 2009;124(3):e362–e370.
67. Rosenquist JN, Lehrer SF, O’Malley AJ, Zaslavsky AM, Smoller JW,Christakis NA. Cohort of birth modifies the association between FTO geno-type and BMI. Proc Natl Acad Sci. 2015;112(2):354–359.
68. Hripcsak G, Albers DJ. Next-generation phenotyping of electronic health re-cords. 2013;20(1):117–121.
69. Weiskopf NG, Rusanov A, Weng C. Sick patients have more data: the non-ran-dom completeness of electronic health records. AMIA Annual SymposiumProceedings; 2013 American Medical Informatics Association; 2013: 1472-1477.
70. Flamand C, Fabregue M, Bringay S, et al. Mining local climate data to as-sess spatiotemporal dengue fever epidemic patterns in French Guiana.JAMIA. 2014;21(e2):e232–e240.
AUTHOR AFFILIATIONS....................................................................................................................................................1Department of Biomedical Informatics2Observational Health Data Sciences and Informatics (OHDSI)3Department of Statistics
4Department of Systems Biology5Department of Medicine, Columbia University, New York, NY, USA
RESEARCHAND
APPLICATIONSBoland MR, et al. J Am Med Inform Assoc 2015;22:1042–1053. doi:10.1093/jamia/ocv046, Research and Applications
1053
Dow
nloaded from https://academ
ic.oup.com/jam
ia/article/22/5/1042/930268 by guest on 11 July 2022