Development of a chitosan–polyglutamate based injectable polyelectrolyte complex scaffold
A PREDICTION OF CELL DIFFERENTIATION AND PROLIFERATION
WITHIN A COLLAGEN-GLYCOSAMINOGLYCAN SCAFFOLD
SUBJECTED TO MECHANICAL STRAIN AND PERFUSIVE FLUID FLOW
AJF Stops1, 2, KB Heraty1, 2, M Browne3, F 4, 5, PE McHugh1, 2
1. Department of Mechanical and Biomedical Engineering, National University
of Ireland Galway, Galway, Ireland.
2. National Centre for Biomedical Engineering Science, National University of
Ireland Galway, Galway, Ireland.
3. Irish Centre for High-End Computing, Dublin, Ireland.
4. Department of Anatomy, Royal College of Surgeons in Ireland, Dublin,
Ireland.
5. Trinity Centre for Bioengineering, Trinity College Dublin, Dublin, Ireland
Corresponding author: Adam Stops. Address: NCBES, Orbsen Building, National
University of Ireland Galway, Galway, Ireland. Telephone: +353 (0)91 493849. Email:
ORIGINAL ARTICLE
WORD COUNT 3644
Title Page & Abstract
ABSTRACT
Background: Mesenchymal stem cell (MSC) differentiation can be influenced by biophysical
stimuli imparted by the host scaffold. Yet, causal relationships linking scaffold strain magnitudes
and inlet fluid velocities to specific cell responses are thus far underdeveloped. This investigation
attempted to simulate cell responses in a Collagen-glycosaminoglycan (CG) scaffold within a
bioreactor. Methodology: CG scaffold deformation was simulated using µ-Computed
Tomography (CT) and an in-house finite element solver (FEEBE/linear). Similarly, the internal
fluid velocities were simulated using the aforementioned µCT dataset with a computational fluid
dynamics solver (ANSYS/CFX). From the ensuing cell-level mechanics, albeit octahedral shear
strain or fluid velocity, the proliferation and differentiation of the representative cells were
predicted from deterministic functions. Results: Cell proliferation patterns concurred with
previous experiments. MSC differentiation was dependent on the level of CG scaffold strain and
the inlet fluid velocity. Furthermore, MSC differentiation patterns indicated that specific
combinations of scaffold strains and inlet fluid flows causes phenotype assemblies dominated by
single cell types. Discussion: Further to typical laboratory procedures, this predictive
methodology demonstrated loading-specific differentiation lineages and proliferation patterns. It is
hoped these results will enhance in-vitro tissue engineering procedures by providing a platform
from which the scaffold loading applications can be tailored to suit the desired tissue.
KEYWORDS: Collagen-Glycosaminoglycan scaffold, Perfusion Bioreactor, Tissue Engineering.
1
1 INTRODUCTION
Tissue engineering requires cells to differentiate and proliferate within artificial scaffolds. These
scaffolds provide structural support and nutrient transport to cells, which in turn allow cell functions
to be tailored to suit the desired tissue [McMahon et al., 2008]. By externally straining or imposing
fluid to flow through, complex micro-environments of deformation transpire. In fact, due to their
architectural heterogeneity, many porous materials endure compounding fluid-solid interactions that
make measuring such micro-environments exceedingly difficult [Holmes and Mow, 1990; Gu et al.,
2004]. It is however, these micromechanical deformations that impart biophysical stimuli onto the
cells, and so it is these micro-environments that hold the key to understanding how cells function
within artificial scaffolds.
Mechanoregulatory models can predict cell function and tissue growth. Accordingly, biophysical
stimuli regulates skeletal tissue growth, albeit in bone fracture healing [Carter and Beaupré 2001;
Lacroix and Prendergast, 2002], distraction osteogenesis [Isakkson et al., 2006], osteochondral
defect healing [Kelly and Prendergast, 2005], bone ingrowth into porous implants [Andreykiv et al.,
2005], in-vitro growth of articular cartilage [Ficklin et al., 2009] and tissue engineering [Byrne et
al., 2007]. Interestingly, mechanoregulatory models that combine octahedral shear strain and
interstitial fluid velocity as tissue growth determinants prove most accurate [Isakkson et al., 2006].
In particular, by comparing a finite element (FE) simulation to distraction osteogenesis within an
ovine bone specimen, Isaksson et al. (2006) showed tissue formation can be accurately predicted
using octahedral shear strain and fluid velocity. Furthermore, McMahon et al. (2008) recently
confirmed strain and fluid velocities to be the most influential stimuli on cell behaviour in a CG
scaffold.
CG scaffolds display many positive indicators for tissue engineering, including cell mechanics
[Harley et al., 2008; Schulz Torres et al., 2000], cell growth [Farrell et al., 2006; McMahon et al.,
*Manuscript
2
2008], mechanical loading [Harley et al., 2007; Haugh et al., 2009] and fluid flow within
bioreactors [Jungreuthmayer et al., 2008]. This paper intends to explore the biophysical stimuli
within a CG scaffold to further enhance this promising construct. Importantly, a timeframe
spanning the initial 14 days after seeding, which is prior to matrix deposition and microstructural
changes [Farrell et al., 2006], will be investigated. Specifically, this paper intends to,
1. Quantify cell numbers and cell differentiation pathways resulting from local strains and
interstitial fluid velocities within a CG scaffold (arising from the biophysical loading imparted
by a typical bioreactor).
2. Determine the magnitudes of apparent strains and inlet fluid velocities, applied by a typical
bioreactor, that encourages the growth of bone, cartilage and fibrous tissue.
3. Compare the findings of this predictive study with published data to assess model validity.
2 METHODOLGY
In the following two sections, methodologies are presented to 1) describe how the architecture of a
CG scaffold was imaged and then subsequently used to generate FE and CFD models, respectively,
and then 2) how cell functions were represented using descriptions from published experiments.
2.1 CG Scaffold Representation
Image Thresholding Procedure
Given that the microstructure between CG multiple scaffold samples varies by only 0.5%
et al., 2004], only one CG scaffold, manufactured using a lyophilisation process at a freezing drying
temperature of -40°C and dehydrothermal treatment, crosslinked at 105°C for 24 hours in a large
stainless steel pan of 169x253mm [ et al., 2004], was characterised using µCT-imaging
( ) [SCANCO, Switzerland]. With purpose-written thresholder (MATLAB®) and mesher (Intel®
FORTRAN90) codes, a 3D interconnecting microstructure that characterised the entire depth of the
3
CG scaffold (1.5 x 1.5 x 3.9mm) was generated. To ensure mesh accuracy, the microstructural
stress magnitudes within the mesh were corroborated by a supplementary sub-micron resolution
mesh (SKYSCAN, Belgium).
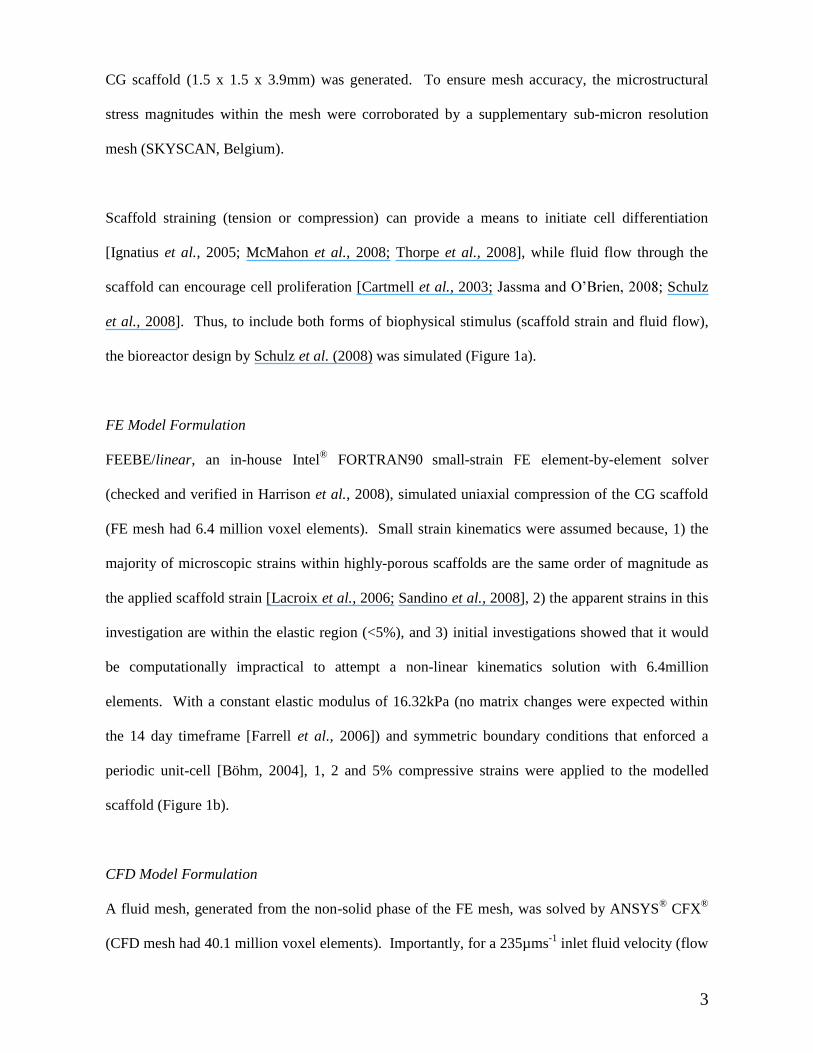
Scaffold straining (tension or compression) can provide a means to initiate cell differentiation
[Ignatius et al., 2005; McMahon et al., 2008; Thorpe et al., 2008], while fluid flow through the
scaffold can encourage cell proliferation [Cartmell et al., 2003; ; Schulz
et al., 2008]. Thus, to include both forms of biophysical stimulus (scaffold strain and fluid flow),
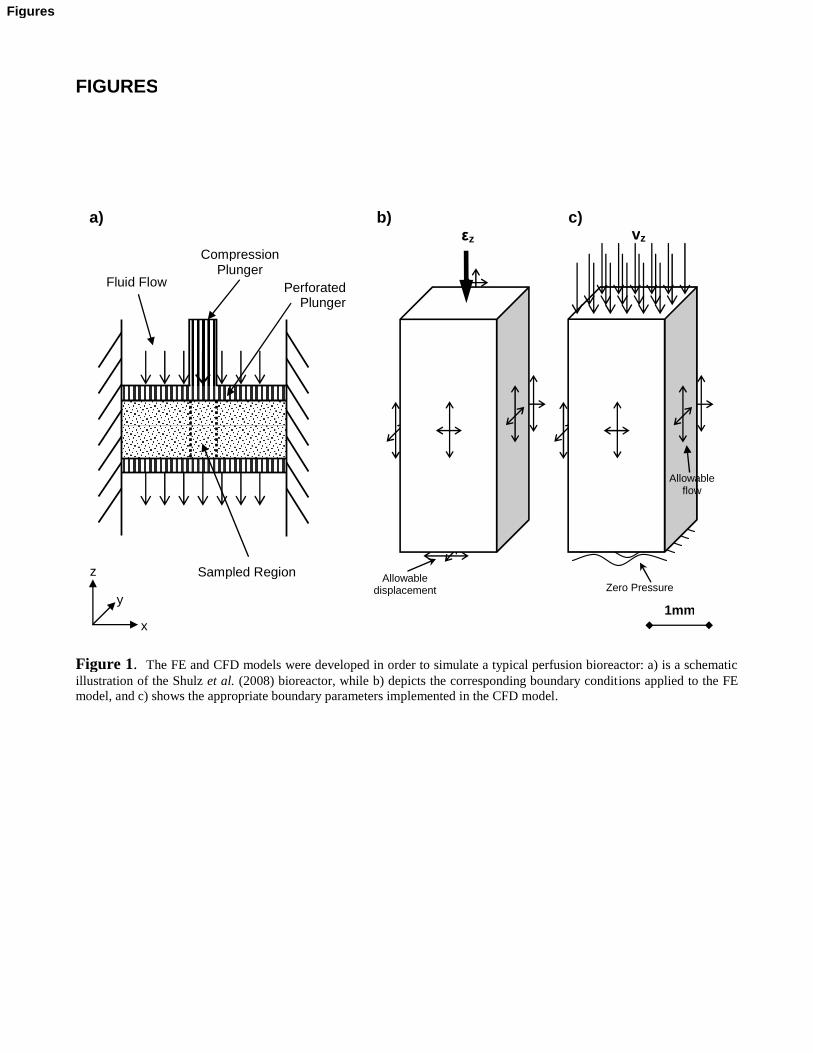
the bioreactor design by Schulz et al. (2008) was simulated (Figure 1a).
FE Model Formulation
FEEBE/linear, an in-house Intel® FORTRAN90 small-strain FE element-by-element solver
(checked and verified in Harrison et al., 2008), simulated uniaxial compression of the CG scaffold
(FE mesh had 6.4 million voxel elements). Small strain kinematics were assumed because, 1) the
majority of microscopic strains within highly-porous scaffolds are the same order of magnitude as
the applied scaffold strain [Lacroix et al., 2006; Sandino et al., 2008], 2) the apparent strains in this
investigation are within the elastic region (<5%), and 3) initial investigations showed that it would
be computationally impractical to attempt a non-linear kinematics solution with 6.4million
elements. With a constant elastic modulus of 16.32kPa (no matrix changes were expected within
the 14 day timeframe [Farrell et al., 2006]) and symmetric boundary conditions that enforced a
periodic unit-cell [Böhm, 2004], 1, 2 and 5% compressive strains were applied to the modelled
scaffold (Figure 1b).
CFD Model Formulation
A fluid mesh, generated from the non-solid phase of the FE mesh, was solved by ANSYS® CFX®
(CFD mesh had 40.1 million voxel elements). Importantly, for a 235µms-1 inlet fluid velocity (flow
4
rate Q=1 ml/min), the relative deformation, or the relative structural difference between an
undeformed and deformed CG scaffold, caused by interstitial fluid flow is less than 0.2%
[Jungreuthmayer et al., 2009]. Such minimal structural deformation from fluid flow can be
attributed to two factors: CG scaffold permeability is relatively high (~10 ) [Tierney et al., 2009;
et al., 2007] and the inlet fluid velocity of 235µms-1 is relatively low: meaning negligible
fluid drag forces and negligible solid compaction. Thus, the walls of the scaffold can be considered
rigid for an inlet fluid velocity below 235µms-1. Consequently, as previously implemented
[Sandino et al., 2008], an uncoupled fluid analysis simulated a perfusion bioreactor [Schulz et al.,
2008]. The bioreactor was not expected to have fluid flow around and into the sides of the scaffold
as an O-ring prevented peripheral flow [Jaasma et al., 2008] (Figure 1a). Consequently, with
symmetric boundary conditions applied to the four external sides (planes of flow and geometry), an
inlet surface at the air-side and a zero pressure outlet at the pan-side was enforced. With laminar
flow, incompressible Newtonian fluid with a viscosity of 0.001Pas and no-slip scaffold walls, a
-1 inlet velocities were implemented. (Figure 1c).
2.2 Cell Representation
Cell Description
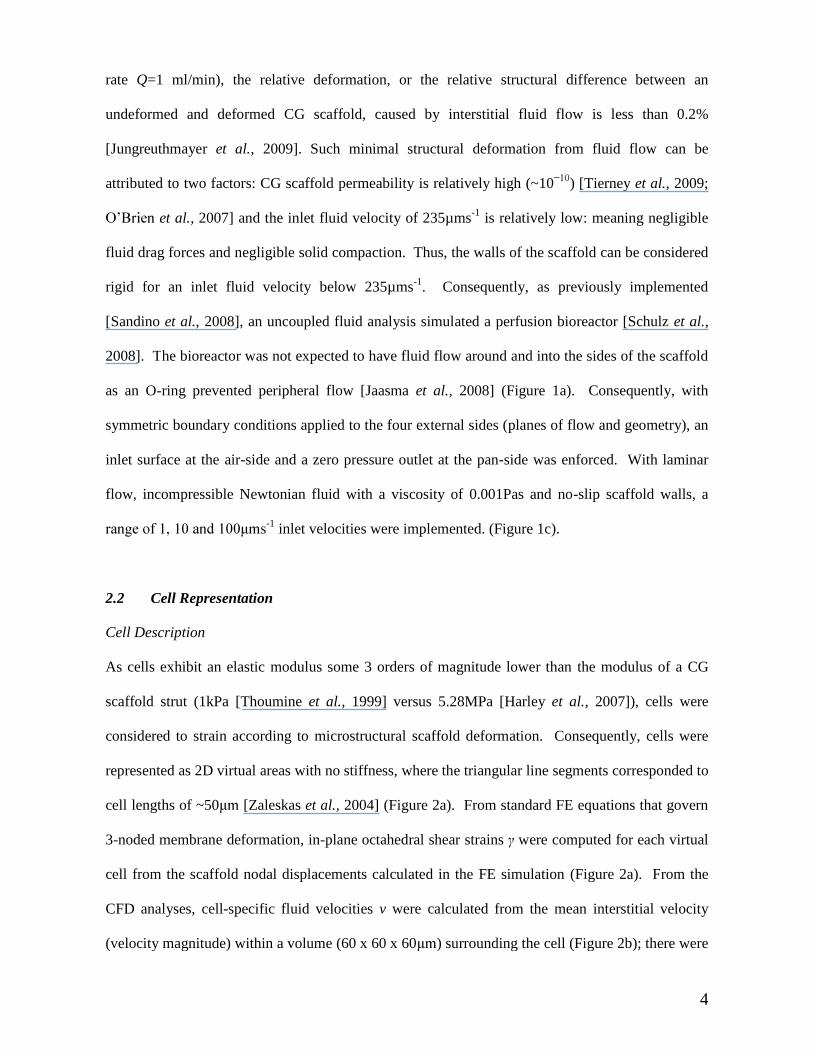
As cells exhibit an elastic modulus some 3 orders of magnitude lower than the modulus of a CG
scaffold strut (1kPa [Thoumine et al., 1999] versus 5.28MPa [Harley et al., 2007]), cells were
considered to strain according to microstructural scaffold deformation. Consequently, cells were
represented as 2D virtual areas with no stiffness, where the triangular line segments corresponded to
cell lengths of ~50 [Zaleskas et al., 2004] (Figure 2a). From standard FE equations that govern
3-noded membrane deformation, in-plane octahedral shear strains were computed for each virtual
cell from the scaffold nodal displacements calculated in the FE simulation (Figure 2a). From the
CFD analyses, cell-specific fluid velocities v were calculated from the mean interstitial velocity
(velocity magnitude) within a volume (60 x 60 x 60 ) surrounding the cell (Figure 2b); there were
5
no cells in the CFD meshes so the volume of space occupied by the cell determined cell-specific
fluid velocity.
Cell Formulae
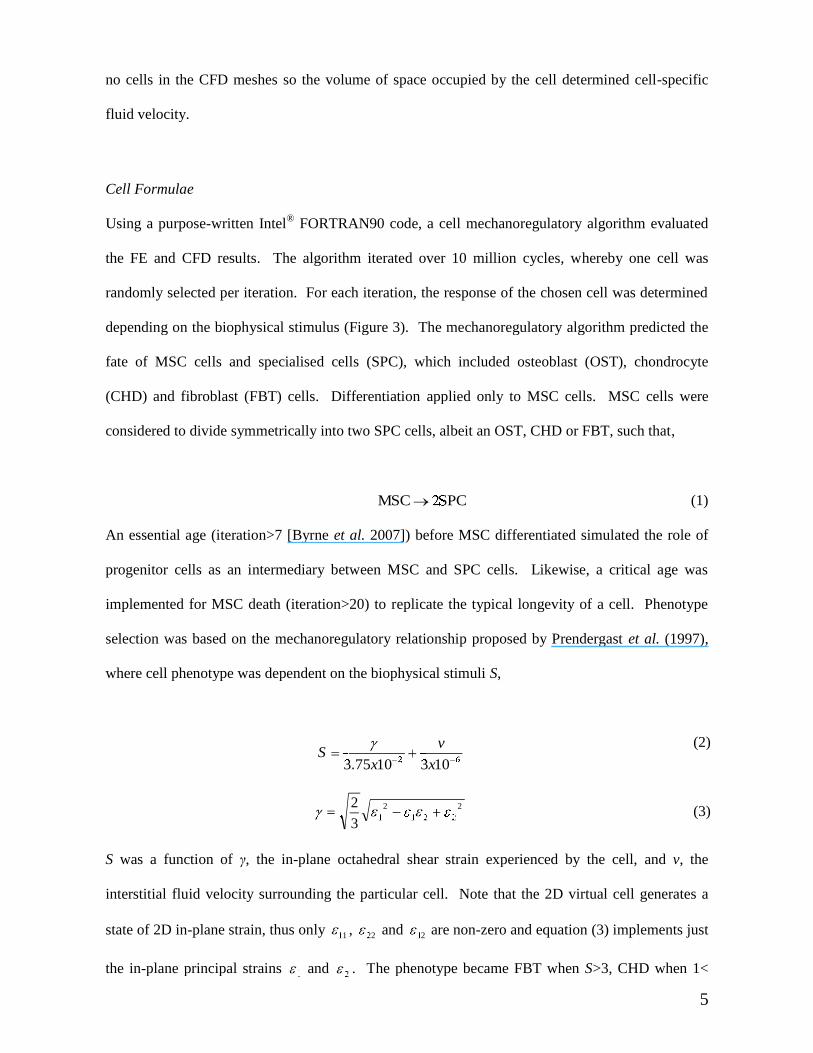
Using a purpose-written Intel® FORTRAN90 code, a cell mechanoregulatory algorithm evaluated
the FE and CFD results. The algorithm iterated over 10 million cycles, whereby one cell was
randomly selected per iteration. For each iteration, the response of the chosen cell was determined
depending on the biophysical stimulus (Figure 3). The mechanoregulatory algorithm predicted the
fate of MSC cells and specialised cells (SPC), which included osteoblast (OST), chondrocyte
(CHD) and fibroblast (FBT) cells. Differentiation applied only to MSC cells. MSC cells were
considered to divide symmetrically into two SPC cells, albeit an OST, CHD or FBT, such that,
SPC2MSC (1)
An essential age (iteration>7 [Byrne et al. 2007]) before MSC differentiated simulated the role of
progenitor cells as an intermediary between MSC and SPC cells. Likewise, a critical age was
implemented for MSC death (iteration>20) to replicate the typical longevity of a cell. Phenotype
selection was based on the mechanoregulatory relationship proposed by Prendergast et al. (1997),
where cell phenotype was dependent on the biophysical stimuli S,
62 10310753 x
v
xS
.
2
221
2
13
2
(2)
(3)
S was a function of , the in-plane octahedral shear strain experienced by the cell, and v, the
interstitial fluid velocity surrounding the particular cell. Note that the 2D virtual cell generates a
state of 2D in-plane strain, thus only 11 , 22 and 12 are non-zero and equation (3) implements just
the in-plane principal strains 1 and 2 . The phenotype became FBT when S>3, CHD when 1<
6
S<3 and OST when S<1 [Perez and Prendergast, 2007; Byrne et al., 2007].
A cell proliferation potential P, where subscripts denote phenotype, included the net result of
proliferation minus necrosis and was defined as,
2
2
1
1
00000
v
v
fedcba
fedcba
fedcba
a
p
p
p
p
OSTOSTOSTOSTOSTOST
CHDCHDCHDCHDCHDCHD
FBTFBTFBTFBTFBTFBT
MSC
OST
CHD
FBT
MSC
(4)
The constant MSCa was defined as 0.3 [Perez and Prendergast, 2007], while the remaining constants
were calculated from published experimental data that coincided with the 14 day post-seeding
timeframe of this investigation (explained below).
A perfusion bioreactor [Cartmell et al., 2003] provided data on cell proliferations for scaffold inlet
flow rates Q, of 0.01, 0.1, 0.2 and 1 ml/min. The inlet flow rates were converted to cell-level fluid
velocities by an analytical method [Jungreuthmayer et al., 2008], where the mean interstitial
velocities within the scaffold, uscaff, are,
2r
Quscaff
(5)
where is the scaffold porosity and r is the chamber radius [Cartmell et al., 2003]. Note equation
(5) estimates interstitial velocities within the scaffold (uscaff) from external inlet velocities applied to
the scaffold (Q). A quadratic function (R2 =1) was then used to describe the relationship between
cell proliferation (P) and mean interstitial scaffold velocity (uscaff), such that
7
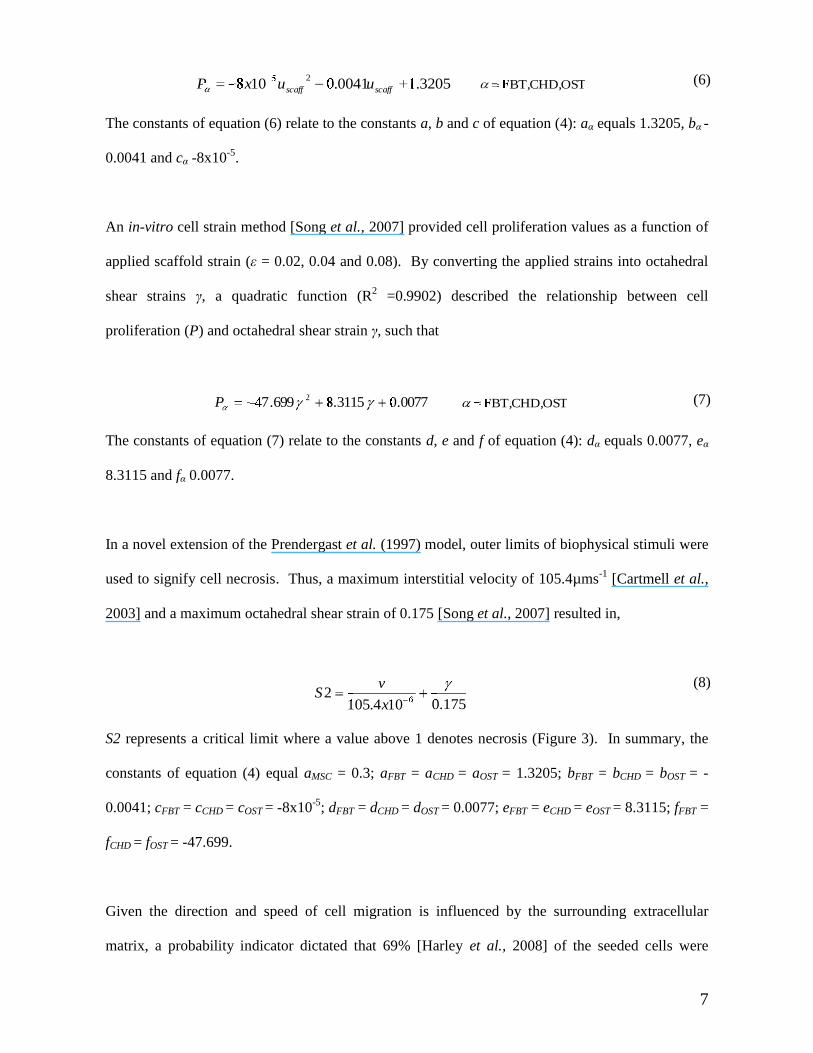
3205.10041.010825
scaffscaff uuxP OSTCHD,FBT, (6)
The constants of equation (6) relate to the constants a, b and c of equation (4): a equals 1.3205, b -
0.0041 and c -8x10⁻⁵.
An in-vitro cell strain method [Song et al., 2007] provided cell proliferation values as a function of
applied scaffold strain ( = 0.02, 0.04 and 0.08). By converting the applied strains into octahedral
shear strains , a quadratic function (R2 =0.9902) described the relationship between cell
proliferation (P) and octahedral shear strain , such that
0077.03115.8699.47 2P OSTCHD,FBT, (7)
The constants of equation (7) relate to the constants d, e and f of equation (4): d equals 0.0077, e
8.3115 and f 0.0077.
In a novel extension of the Prendergast et al. (1997) model, outer limits of biophysical stimuli were
used to signify cell necrosis. Thus, a maximum interstitial velocity of 105.4µms-1 [Cartmell et al.,
2003] and a maximum octahedral shear strain of 0.175 [Song et al., 2007] resulted in,
175.0104.1052
6x
vS
(8)
S2 represents a critical limit where a value above 1 denotes necrosis (Figure 3). In summary, the
constants of equation (4) equal aMSC = 0.3; aFBT = aCHD = aOST = 1.3205; bFBT = bCHD = bOST = -
0.0041; cFBT = cCHD = cOST = -8x10⁻⁵; dFBT = dCHD = dOST = 0.0077; eFBT = eCHD = eOST = 8.3115; fFBT =
fCHD = fOST = -47.699.
Given the direction and speed of cell migration is influenced by the surrounding extracellular
matrix, a probability indicator dictated that 69% [Harley et al., 2008] of the seeded cells were
8
motile at any given time.
Finally, using a 3D lattice (25 x 25 x 65) of the cell compartments (Figure 2), cell positions were
monitored throughout the analyses. Within each compartment, one cell could occupy the space (if
chosen by the mechanoregulatory algorithm) which resulted in a maximum cell density of 4.63x10⁶
cells/cm3. Additionally, the local cell density also contributed to the proliferation potential.
Specifically, the local cell density was calculated by monitoring the neighbouring environments,
whereby the neighbouring environment constituted 3 x 3 x 3 compartments, resulting in a inspected
volume of 180 x 180 ticular cell.
3 RESULTS
Scaffold Strain Mechanics
The apparent elastic modulus of 392Pa related well to experiments (~206Pa [Harley et al., 2007]
and ~500Pa [Haugh et al., 2009]). As also previously measured (~80% for dry CG scaffold [Harley
et al., 2007]), anisotropy was observed, i.e. Ex and Ey were approximately 60% of Ez. The principal
stress distribution within the scaffold was highly heterogeneous (Figure 4a). Distinct stress
concentrations (Figure 4a) were also evident, though the mean principal stress of -27.95 ±40.84Pa
was relatively close to zero (1% scaffold compression).
Scaffold Fluid Velocities
The mean interstitial fluid velocities within the scaffold relate well to published data. In particular,
the mean interstitial velocity for each flow condition was higher than the inlet velocity
(1.11± -1, 11.12± -1 and 111.22± -1 for an inlet of 1, 10 and -1,
respectively); Jungreuthmayer et al. (2008) found a mean interstitial velocity of 296 -1 for an
-1. Figure 4b illustrates the heterogeneity of the fluid velocities ( -1 inlet
velocity).
9
Cell Growth
A total cell number of ~4.20x10⁶ cells/cm3 proved consistent for many of the scaffold strains and
inlet fluid velocities (Figure 5i-vi). However, for an -1 inlet velocity, cell numbers were
greatly reduced to a relatively low density of ~1.30x10⁶ cells/cm3 for scaffold strains of 1 and 2%
compression, while at a strain of 5%, the density only reached ~0.69x10⁶ cells/cm3 (Figure 5vii-ix).
The rate of total cell numbers began with a toe-region before quickly increasing linearly and before
levelling out just below the respective maximum density (Figure 5i-vi). Interestingly, the
proliferation for each phenotype was not consistent. In fact, MSC proliferation displayed a
substantial decrease immediately following a peak (Figure 5i-vi), while the SPC phenotypes
demonstrated a lesser increase in cell number, yet depending on specific combinations of stimuli,
did however tend to plateau at a particular cell density (Figure 5i-vi).
MSC differentiation showed a phenotype preference to specific combinations of scaffold strains and
inlet fluid velocities (Figure 6). In particular, for the lowest combination of scaffold strain (1%
-1), OST cells dominated the differentiation lineage
(84.9% of total cell number); see Figure 7c. For -1 inlet velocity,
FBT cells were the majority phenotype (73.9% of total cell number); see Figure 7a. However,
unlike its counterparts, there was no explicit combination of scaffold strain and inlet velocity that
encouraged solely CHD cells. The most suitable combination of stimuli arose from 5% scaffold
s-1 inlet velocity (56.7% CHD); see Figure 6iv and 7b.
MSC differentiation also elicited phenotype preferences for specific regions (Figure 8). While the
air-side negatively influenced OST cells, the intermediate regions demonstrated positive effects for
both FBT and CHD cells, though interestingly, all cells were negatively influenced by the pan-side.
10
4 DISCUSSION
This investigation predicted cell growth within a CG scaffold for a range of scaffold strains and
inlet fluid velocities. As a result, the simulations were able to propose cell-specific preferences to
particular combinations of CG scaffold loads.
A rigorous validation procedure that allows multiple phenotypic markers to be identified and
quantified within a mixed cell population is not available. Thus, unfortunately, there are no data or
experimental methodologies available to directly validate the results of this investigation.
Consequently, the findings in this investigation are purely predictive. However, despite this
limitation, every cell parameter, albeit a differentiation potential or a biophysical stimulus, was
calibrated with published experiments. Thus, as each and every step was calibrated to experimental
measurements, the system of methodologies employed herein could be considered reasonably
meaningful; in the subsequent sections, published data are employed to assess the physical
appropriateness of the results.
The sample size (n=1) used in this study was small. However, previous work by one of the authors
et al., 2004) found a very small variance (0.5%) in the microstructure across multiple
samples of CG scaffolds (achieved by comparing pore size characteristics). In fact, the fabrication
technique presented by this 2004 paper (constant cooling rate lyophilisation) was developed in
order to provide a method that minimised the microstructural variance between samples. As only a
0.5% variance is apparent between multiple samples, then the use of a single sample can be
considered representative of this type of scaffold. Furthermore, other authors have also noted this
relative uniformity between CG scaffold samples [Harley et al., 2007, Harley et al., 2008].
By modelling the cells as triangular elements, cell representation was limited to one morphology.
However, as 76% of cells within a CG scaffold are attached across multiple struts [Stops et al.,
11
2008], the implementation of a geometry that spread over multiple struts (cells were attached by 3
strut nodes), could be considered reasonably representative. Furthermore, the passive nature of the
modelled cells omitted the contractile property that has been shown to impart bending forces on
struts [Harley et al., 2008]. Primarily, in justification, the complexity of incorporating an
interactive component in the FE and CFD simulations proved too computationally expensive (the
simulations contained 6.4 and 40.1 million elements respectively). However, as cells contract in
order to distort the scaffold and create a strain-rich environment [Freyman et al., 2002], then as the
modelled scaffold was loaded, it is likely that cells seeded in this already highly-strain-rich
environment would not seek to actively distort the scaffold.
Analysis of Results
Cell growth was highly influenced by CG scaffold loading. In fact, for scaffold strains of 1-5%
compression with inlet fluid velocities of 1- -1, the cells proliferated to such an extent that the
maximum cell density was almost achieved (Figure 5-7). However, in stark contrast was the fast
-1, which influenced cell growth so significantly that along with a scaffold
strain of 5% compression, almost no proliferation occurred. This finding can be explained by the
mean interstitial -1, the mean interstitial velocity
was 111.22± -1 -1 threshold set by the proliferation
algorithm (based on experimental measurements). Interestingly, previous experiments [Cartmell et
al., -1 to decrease cell viability, while very
fast inlet velocities -1
these fast inlet velocities impart shearing forces that either detach the seeded cells from the scaffold,
or disrupt cell integrity. Consequently, to encourage cell proliferation, it appears that inlet
velocities should afford mean interstitial -1.
For the biophysical stimuli shown in Figure 6 (1-5% scaffold strain with 1- -1 inlet fluid
12
velocities), the proliferation of the total cell number followed experiments [Ignatius et al., 2005;
Kaspar et al., 2002; Wang et al., 2005]. Interestingly, these six simulations all demonstrated a peak
cell density of ~4.20x10⁶ cells/cm3, ~90% of the maximum 4.63x10⁶ cells/cm3. These densities
concur with CG scaffold experiments (~1.6x10⁶ cells/cm3 seeding density [Tierney et al., 2009])
-1 inlet velocity, OST cells dominated the array
(84.9% of total cell number). This suggested that bone-like tissue may form under these conditions.
Interestingly, at low fluid velocities and low shear strains, Søballe et al. (1992a, b) and Søballe
(1993) also found significant OST proliferation within a facture callus. Under a combination of 5%
-1 inlet velocity, FBT cells dominated the cell assortment (73.9%). Again
Søballe et al. (1992a, b) and Søballe (1993) observed a similar pattern: fast fluid velocities and high
shear strains encouraged FBT. Interestingly, a predominance of CHD was not found. Yet for 5%
-1 inlet velocity, CHD comprised the majority of the total cell number
(56.7%), but had significant contributions from OST and FBT (26.2% and 13.3% respectively).
This suggested high octahedral shear strain with low fluid velocity encourages cartilage-type
growth. However, CHD cells also contributed largely -1 inlet
velocity: FBT cells had 55.6% and CHD 41.3%. As a result, this suggested low octahedral shear
strain with relatively high fluid velocity encourages cartilage-type growth. Though not the majority
phenotype in this latter case, CHD cells do appear to favour a range of biophysical stimuli. Simply,
these two assortments might be classified as osteo-cartilaginous and fibro-cartilaginous tissues.
Interestingly, regional phenotype preference was observed within the CG scaffold. In particular,
trends indicated that the pan-side had a negative effect on all phenotypes (Figure 8). However, the
lowermost and uppermost intermediate regions showed positive effects on FBT and CHD
differentiation (Figure 8i and ii). Conversely, the uppermost portion suggested negative effects on
FBT (Figure 8iii), though the air-side demonstrated positive effects on OST growth (Figure 8iv).
13
This regional preference can be explained by the fluid profiles. As there were only a few holes that
permitted fluid to pass in the thin film-like structure on the air-side (Figure 4b), the air-side had
hotspots of high pressure causing a high variance of fluid velocities (peaks and troughs).
Conversely, the remainder of the scaffold experienced a relatively low velocity variance due to the
more equiaxed pore structure. Consequently, even though the mean velocities are similar, these two
portions had very different fluid profiles: the air-side endured high variance in velocity, while the
remainder had a low velocity variance. Thus, it is likely that CHD and FBT cells, which are suited
to medium velocities, are conducive to the low variance portion, while OST cells, which are suited
-side portion. What
effect this mechanism would have if the scaffold is orientated differently in the bioreactor is
unknown, but it does suggest that architecture plays an important role in MSC differentiation.
Acknowledgements
Funding was provided by the Programme for Research in Third Level Institutions (PRTLI),
administered by the Higher Education Authority (HEA) and a SFI Foundation Ireland President of
Some simulations were performed on the SGI Altix
high performance computer at NUI Galway under an academic license from Intel Fortran, Inc.
Furthermore, the authors wish to acknowledge the SFI/HEA Irish Centre for High-End Computing
(ICHEC) for the provision of computational facilities and support.
Conflict of Interest Statement
No conflicts of interest.
1
REFERENCES
Andreykiv A., Prendergast P.J., van Keulen F., Swieszkowski W., Rozing P.M., 2005. Bone ingrowth
simulation for a concept glenoid component design. Journal of Biomechanics; 38(5): 1023-1033.
Böhm H.J., 2004. A Short Introduction to Continuum Micromechanics; in Mechanics of
Microstructured Materials (Ed.: H.J.Böhm), 1-40; CISM Courses and Lectures Vol.464, Springer-
Verlag, Vienna, Austria, pp. 86-112.
Byrne D.P., Lacroix D., Planell J.A., Kelly D.J., Prendergast P.J., 2007. Simulation of tissue
differentiation in a scaffold as a function of porosity, Young's modulus and dissolution rate:
Application of mechanobiological models in tissue engineering. Biomaterials; 28(36): 5544-5554.
Carter D.R., Beaupré G.S., 2001. Skeletal Function and Form: Mechanobiology of Skeletal
Development, Aging, and Regeneration. Cambridge University Press, USA, pp. 118-129.
Cartmell S.H., Porter B.D, Garcia A.J., Guldberg R.E., 2003. Effects of Medium Perfusion Rate on
Cell-Seeded Three-Dimensional Bone Constructs in Vitro. Tissue Engineering; 9(6): 1197-1203.
Cohen J., 1977. Statistical power analysis for behavioral sciences (revised ed.). New York: Academic
Press, New York, pp. 58-79.
Farrell E. .J., Doyle P., Fischer J., Yannas I., Harley B.A., O ., Prendergast P.J.,
Campbell V.A., 2006. A Collagen-glycosaminoglycan Scaffold Supports Adult Rat Mesenchymal
Stem Cell Differentiation Along Osteogenic and Chondrogenic Routes. Tissue Engineering; 12(3):
459-468.
Ficklin T.P., Davol A., Klisch S.M., 2009. Simulating the growth of articular cartilage explants in a
permeation bioreactor to aid in experimental protocol design. Journal of Biomechanical Engineering;
131: 041008.
Freyman T.B., Yannas I.V., Yokoo R., Gibson L.J., 2002. Fibroblast Contractile Force Is Independent
of the Stiffness Which Resists the Contraction. Experimental Cell Research; 272: 153 162.
References
2
Gu W.Y., Sun D.N., Lai W.M., Mow V.C., 2004. Analysis of the dynamic permeation experiment
with implication to cartilaginous tissue engineering. Journal of Biomechanical Engineering; 126: 485-
491.
Heterogeneous linear elastic trabecular bone modelling using micro-CT attenuation data and
experimentally measured heterogeneous tissue properties. Journal of Biomechanics; 41(11): 2589-
2596.
Harley B.A., Leung J.H., Silva E., Gibson L.J., 2007. Mechanical characterization of collagen-
glycosaminoglycan scaffolds. Acta Biomaterialia; 3: 463 474.
Harley B.A.C, Kim H-D., Zaman M.H., Yannas I.V., Lauffenburger D.A., Gibson L.J., 2008.
Microarchitecture of Three-Dimensional Scaffolds Influences Cell Migration Behavior via Junction
Interactions. Biophysical Journal; 95(8): 4013-4024.
Haugh M.G., Jaasma M.J., O'Brien F.J., 2009. The effect of dehydrothermal treatment on the
mechanical and structural properties of collagen-GAG scaffolds. Journal of Biomedical Material
Research A; 89(2): 363-9.
Holmes M.H., Mow V.C., 1990. The nonlinear characteristics of soft gels and hydrated connective
tissue in ultrafiltration. Journal of Biomechanics; 23: 1145-1156.
Ignatius A., Blessing H., Liedert A., Schmidt C., Neidlinger-Wilke C., Kaspar D., Friemert B., Claes
L., 2005. Tissue Engineering of Bone: Effects of Mechanical Strain on Osteoblastic Cells in Type, I.
Collagen Matrices. Biomaterials; 26: 311 318.
Isaksson H., Donkelaar C.C., Huiskes R., Ito K., 2006. Corroboration of mechanoregulatory
algorithms for tissue differentiation during fracture healing: comparison with in vivo results. Journal of
Orthopaedic Research; 24(5): 898 907.
Kaspar D., Seidl W., Neidlinger-Wilke C., Beck A., Claes L., Ignatius A., 2002. Proliferation of
3
human-derived osteoblast-like cells depends on the cycle number and frequency of uniaxial strain.
Journal of Biomechanics; 35: 873 880.
Kelly D.J., Prendergast P.J., 2005. Mechanoregulation of stem cell differentiation and tissue
regeneration in osteochondral defects, Journal of Biomechanics, 38, 1413 1422.
n F.J., 2008. Mechanical stimulation of osteoblasts by steady and dynamic fluid
flow. Tissue Engineering; 14, 1213.
. Design and validation of a dynamic flow perfusion
bioreactor for use with compliant tissue engineering scaffolds. Journal of Biotechnology, 133, 490
496.
Jungreuthmayer C., Donahue S.W., Jaasma M.J., Al-Munajjed A.A., Zanghellini J., Kelly D.J.,
.J., 2008. A Comparative Study of Shear Stresses in Collagen-Glycosaminoglycan and
Calcium Phosphate Scaffolds in Bone Tissue-Engineering Bioreactors. Tissue Engineering: Part A;
14(00).
Jungreuthmayer C., Jaasma M.J., Al-Munajjed A.A., Zanghellini J., Kelly D.J. .J., 2009.
Deformation simulation of cells seeded on a collagen-GAG scaffold in a flow perfusion bioreactor
using a sequential 3D CFD-elastostatics model. Medical Engineering & Physics, 31, 420 427.
Lacroix D., Prendergast P.J., 2002. A mechanoregulation model for tissue differentiation during
fracture healing: analysis of gap size and loading. Journal of Biomechanics; 35: 1163 1171.
Lacroix D., Chateau A., Ginebra M.-P., Planell J.A., 2006. Micro-finite element models of bone tissue-
engineering scaffolds. Biomaterials; 27: 5326 5334.
McMahon L.A., Reid A.J., Campbell V.A., Prendergast P.J., 2008. Regulatory effects of mechanical
strain on the chondrogenic differentiation of MSCs in a collagen-GAG scaffold: experimental and
computational analysis. Annals of Biomedical Engineering; 36(2): 185-94.
F.J., Harley B.A., Yannas I.V., Gibson L.G., 2004. Influence of freezing rate on pore structure
4
in freeze-dried collagen-GAG scaffolds. Biomaterials, 25, 1077 1086.
O'Brien F.J., Harley B.A., Waller M.A., Yannas I.V., Gibson L.J., Prendergast P.J., 2007. The effect of
pore size on permeability and cell attachment in collagen scaffolds for tissue engineering. Technology
and Health Care; 15(1): 3-17.
Perez M.A., Prendergast P.J., 2007. Random-walk models of cell dispersal included in
mechanobiological simulations of tissue differentiation. Journal of Biomechanics; 40: 2244 2253.
Prendergast P.J., Huiskes R., Søballe K., 1997. Biophysical stimuli on cells during tissue
differentiation at implant interfaces. Journal of Biomechanics; 30(6): 539-548.
Sandino C., Planell J.A., Lacroix D., 2008. A finite element study of mechanical stimuli in scaffolds
for bone tissue engineering. Journal of Biomechanics; 41(5): 1005-1014.
Schulz Torres D., Freyman T., Yannas I., Spector M., 2000. Tendon cell contraction of collagen-GAG
matrices in vitro: effect of crosslinking. Biomaterials, 21, 1607 19.
Schulz R.N., Wüstneck N., van Donkelaar C.C., Shelton J.C., Bader A., 2008. Development and
Validation of a Novel Bioreactor System for Load- and Perfusion-Controlled Tissue Engineering of
Chondrocyte-Constructs. Biotechnology and Bioengineering; 101(4): 714-728.
Søballe K., 1993. Hydroxyapatite ceramic coating for bone implant iixation. Mechanical and
histological studies in dogs. Acta Orthopaedica Scandinavica; 64 (Suppl. 255).
Søballe K., Hansen E.S., B-Rasmussen H., Jorgensen P.H., Biinger C., 1992a. Tissue ingrowth into
titanium and hydroxyapatite coated implants during stable and unstable mechanical conditions. Journal
of Orthopaedic Research; 10(2): 285-99.
Søballe K., B-Rasmussen H., Hansen E.S., Biinger C., 1992b. Hydroxyapatite coating modifies implant
membrane formation. Controlled micromotion studied in dogs. Acta Orthopaedica Scandinavica; 63:
I28 -140.
5
Song G., Ju Y., Shen X., Luo Q., Shi Y., Qin J., 2007. Mechanical stretch promotes proliferation of rat
bone marrow mesenchymal stem cells. Colloids and Surfaces B: Biointerfaces; 58: 271 277.
Prediction of Strain on Cells in a Highly Porous Collagen-Glycosaminoglycan Scaffold. Journal of
Biomechanical Engineering; 130(6): 1001-1011.
Thorpe S.D., Buckley C.T., Vinardell T. .J., Campbell V.A., Kelly D.J., 2008. Dynamic
compression can inhibit chondrogenesis of mesenchymal stem cells. Biochemical and Biophysical
Research Communications; 377(2): 458-462.
Thoumine O., Ott A., Cardoso O., 1999. Microplates: a new tool for manipulation and mechanical
perturbation of individual cells. Journal of Biochemical Biophysical Methods; 39: 47 62.
Tierney C.M., Haugh M.G., Liedl J., Mulcahy F., Hayes B. .J., 2009. The effects of
collagen concentration and crosslink density on the biological, structural and mechanical properties of
collagen-GAG scaffolds for bone tissue engineering. Journal of the Mechanical Behavior of
Biomedical Materials; 2(2): 202-209.
Wang J.G., Miyazu M., Xiang P., Lia S.N., Sokabe M., Naruse K., 2005. Stretch induced cell
proliferation is mediated by FAK-MAPK pathway. Life Sciences; 76: 2817 2825.
Zaleskas J., Kinner B., Freyman T., Yannas I., Gibson L., Spector M., 2004. Contractile forces
generated by articular chondrocytes in collagen-glycosaminoglycan matrices. Biomaterials; 25: 1299
1308.
FIGURES
Figure 1. The FE and CFD models were developed in order to simulate a typical perfusion bioreactor: a) is a schematicillustration of the Shulz et al. (2008) bioreactor, while b) depicts the corresponding boundary conditions applied to the FEmodel, and c) shows the appropriate boundary parameters implemented in the CFD model.
a) b) c)
Sampled Region
PerforatedPlunger
Fluid Flow
CompressionPlunger
z vz
Allowabledisplacement
Allowableflow
Zero Pressure
1mmx
z
y
Figures
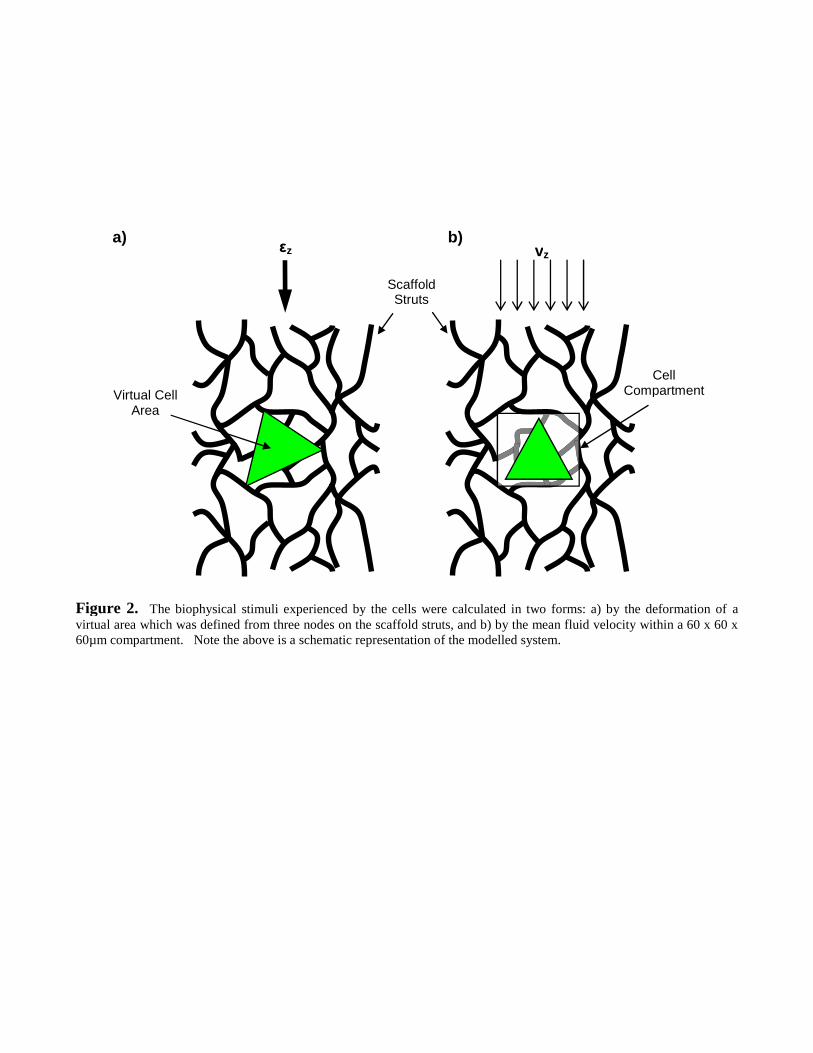
Figure 2. The biophysical stimuli experienced by the cells were calculated in two forms: a) by the deformation of avirtual area which was defined from three nodes on the scaffold struts, and b) by the mean fluid velocity within a 60 x 60 x60µm compartment. Note the above is a schematic representation of the modelled system.
z vz
Virtual CellArea
CellCompartment
ScaffoldStruts
a) b)
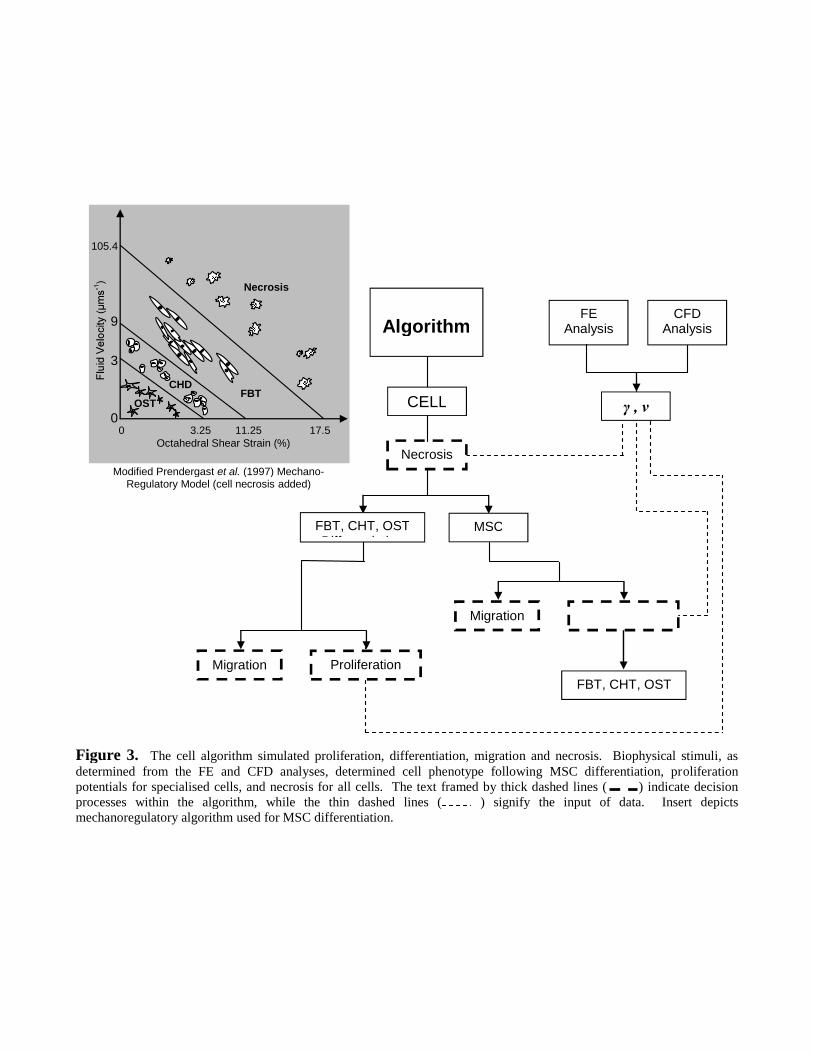
Figure 3. The cell algorithm simulated proliferation, differentiation, migration and necrosis. Biophysical stimuli, asdetermined from the FE and CFD analyses, determined cell phenotype following MSC differentiation, proliferationpotentials for specialised cells, and necrosis for all cells. The text framed by thick dashed lines ( ) indicate decisionprocesses within the algorithm, while the thin dashed lines ( ) signify the input of data. Insert depictsmechanoregulatory algorithm used for MSC differentiation.
AlgorithmFE
AnalysisCFD
Analysis
CELL
Necrosis
MSC
Migration
ProliferationMigration
FBT, CHT, OST
0 3.25 11.25 17.5
105.4
9
3
0
Octahedral Shear Strain (%)
Necrosis
FBTCHD
OST
FBT, CHT, OSTDifferentiation
Modified Prendergast et al. (1997) Mechano-Regulatory Model (cell necrosis added)
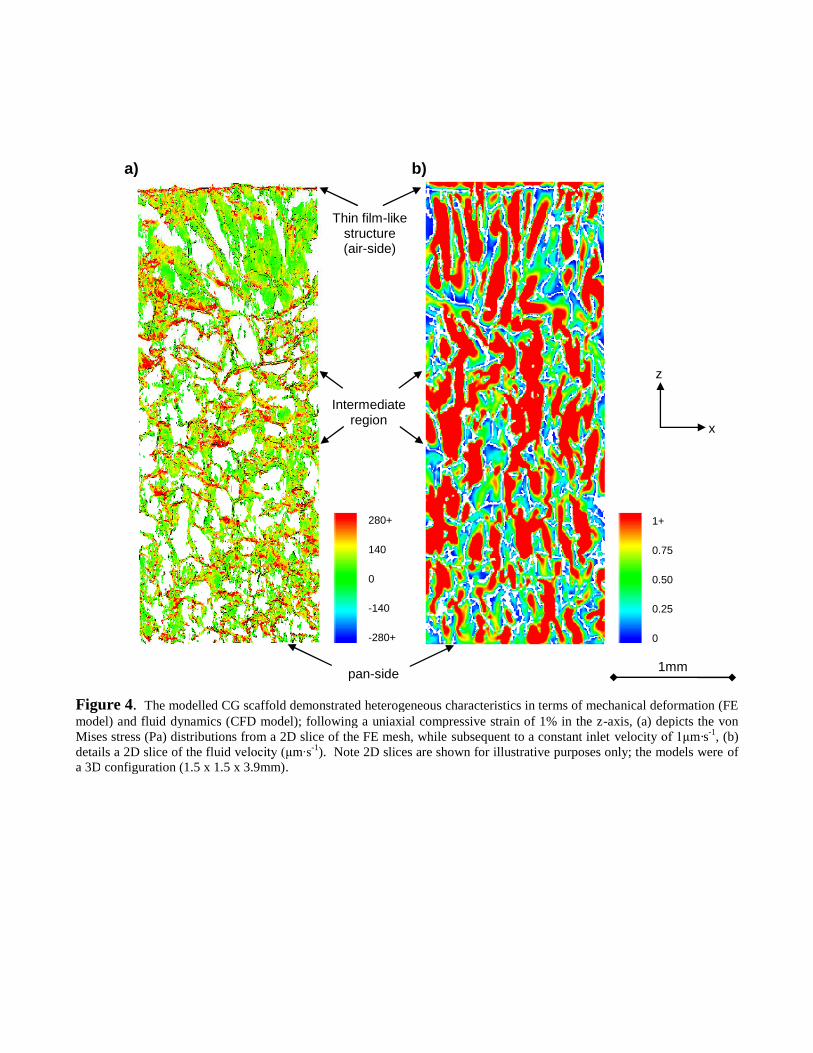
Figure 4. The modelled CG scaffold demonstrated heterogeneous characteristics in terms of mechanical deformation (FEmodel) and fluid dynamics (CFD model); following a uniaxial compressive strain of 1% in the z-axis, (a) depicts the vonMises stress (Pa) distributions from a 2D slice of the FE mesh, while subsequent to a constant inlet velocity m·s-1, (b)details a 2D slice of the fluid v -1). Note 2D slices are shown for illustrative purposes only; the models were ofa 3D configuration (1.5 x 1.5 x 3.9mm).
x
z
1+
0.75
0.50
0.25
0
280+
140
0
-140
-280+
1mm
a) b)
Thin film-likestructure(air-side)
pan-side
Intermediateregion
Inlet-1
0
1
2
3
4
5
0
1
2
3
4
5
0
1
2
3
4
5
Inlet-1
0
1
2
3
4
5
0
1
2
3
4
5
0
1
2
3
4
5
Inlet-1
0
0.2
0.4
0.6
0.8
1
0
0.2
0.4
0.6
0.8
1
0
0.2
0.4
0.6
0.8
1
Figure 5. The proliferation of the cells are shown for the nine simulated regimes; i-iii) show cell responses to -1
fluid inlet velocity with 1, 2 and 5% scaffold strain, iv-vi) 10 -1 fluid inlet velocity with 1, 2 and 5% scaffold strain andvii-ix) depicts the proliferation for 100 -1 fluid inlet velocity with 1, 2 and 5% scaffold strain respectively. Note the
horizontal axes correspond to time, while the vertical axes refer to cell density (x106 cells/cm3).
Scaffold Strain = 1% Scaffold Strain = 2% Scaffold Strain = 5%
TOTAL MSC FBT CHD OST
i) ii) iii)
iv) v) vi)
vii) viii) ix)
Inlet-1
Inlet F-1
Figure 6. The predicted cell phenotypes within the modelled volume are shown in terms relative to total cell number.Note the annotations referring to strain and fluid velocity denote the respective scaffold model inputs for the correspondingpie chart. Note only 6 models are presented here as the remaining models did not provide sufficient cell densities to allow astatistical comparison.
ScaffoldStrain = 1%
ScaffoldStrain = 2%
ScaffoldStrain = 5%
OST CHD FBT MSC
Figure 7. The predicted differentiation patterns within the modelled volume are shown here for a) a FBT dominatedvolume (where 73.9% of the cells were FBT) which resulted from a 5% scaffold strain and a 1 -1 inlet velocity, b) avolume with mostly CHD cells (56.7% CHD -1 inlet velocity and, c) anOST cell majority (84.9% OST) which was a product of -1 inlet velocity.
OST CHD FBT MSC
a) b) c)
z
xy
-0.60
-0.40
-0.20
0.00
0.20
0.40
0.60
Figure 8. The regionalmethodology [Cohen, 1977]. Indications are made for occurrences of 3 or more contiguous regions with likewise effectsabove ~0.1: i) shows the lowermost intermediate regions to have a positive effect on FBT growth, ii) the uppermostintermediate regions a positive influence on CHD, iii) the uppermost regions to have a negative effect on FBT, and iv)suggests the air-side regions to have a positive effect on OST differentiation. Note, the horizontal axis refers to the positionalong the z- -position of 3.90mm is equiva -
OST CHD FBT
0 0.39 0.78 1.17 1.56 1.95 2.34 2.73 3.12 3.51 3.90
(mm)
i
ii
iii
iv

ݱ²º´·½¬ ±º ײ¬»®»¬ ͬ¿¬»³»²¬
̸»§ ¿®» ²± ½±²º´·½¬ ±º ·²¬»®»¬ ¬± ¼»½´¿®» ¾§ ¬¸» ¿«¬¸±®ò
* Conflict of Interest Statement
Copyright © 2022 FDOKUMEN