Strengthening health systems to respond to women subjected ...

Granular Matter (2011) 13:365–378DOI 10.1007/s10035-010-0233-4
ORIGINAL PAPER
Structural properties of wet granular beds subjected to tapping
R. O. Uñac · A. M. Vidales
Received: 24 June 2010 / Published online: 5 December 2010© Springer-Verlag 2010
Abstract Based on a simple numerical model for wetgranular beds, we study the structural properties of wet parti-cles subjected to tapping in terms of the global anisotropy andangular distribution presented by their contacts. The modelallows to generate 2-dimensional packings of disks that canform capillary bridges due to the presence of interstitial liq-uid. A pseudodynamic simulation of adhesive hard disks hasbeen implemented. The bed is subjected to a tapping-likeexcitation and we study the evolution of structural anisot-ropy of the packing with the number of taps. We also ana-lyse the behavior of the angular distribution of contacts andanisotropy as a function of tapping intensity and liquid con-tent. Present results help to better understand the behaviorfound in a previous work for the packing fraction of thesesystems. They also demonstrate that anisotropy alone notalways helps to completely understand the behavior of thestructural properties of wet particles.
Keywords Anisotropy · Hard disks · Capillary bridges ·Pseudodynamics · Compaction · Tapping
1 Introduction
Although problems involving the presence of wet granularmedia have a long history in both the technological and indus-trial interest as in the basic science, little is yet known aboutthe mechanisms that govern the mechanical behavior of thesemedia. However, there are some studies that have laid thebasis for the beginning of a systematic and detailed treatment
R. O. Uñac (B) · A. M. VidalesDepartamento de Física, Instituto de Física Aplicada(INFAP-CONICET), Universidad Nacional de San Luis,Ejército de los Andes 950, 5700 HHW, San Luis, Argentinae-mail: [email protected]
of the main forces involved in the interaction between twowet grains [1,2].
The development of models for wet granular materials isstill incipient but there has been a growing interest in the lastyears [3–8].
In [3] authors reported an experimental study for the pack-ing of spherical particles with special reference to the effectof liquid addition. In particular, they discussed how dry basedporosity increased to a maximum value and then remainedconstant with liquid content increase. They showed that therelationship between porosity and liquid content is mainlycontrolled by the properties of particles and liquid, specially,particle size and surface tension. The same experiments wereperformed for packings of multi-sized coarse spheres [4].Here again, results indicated that, in addition to water con-tent, porosity was also strongly affected by particle sizes andtheir distribution.
On the other hand, DEM simulations were used to studythe effect of material properties on the packing structure offine particles due to cohesive interparticles forces [5]. Theresults are analyzed in terms of porosity, mean coordinationnumber and radial distribution function. It was demonstratedthat porosity can be described as a function of the force ratiobetween the van der Waals force and gravity force on a par-ticle but the relationship varies with the sliding and rollingfriction coefficients.
Molecular dynamics simulations were used to investi-gate the structure and mechanical properties of a simpletwo-dimensional model of a cohesive granular material [6].Interparticle forces were used taking into account elastic-ity, Coulomb friction, and a short-range attraction like thevan der Waals force in powders. The microstructure of thecohesive packing under low pressure was shown to dependsensitively on the assembling procedure which is applied tothe initially isolated particles of a granular gas. While a direct
123

366 R. O. Uñac, A. M. Vidales
compression produced a final equilibrated configuration witha similar density to that of cohesionless systems, the forma-tion of large aggregates prior to the application of an externalpressure resulted in much looser stable packings.
A physical and numerical work studying the settling ofuniform spheres in liquids has shown that interparticle forcesplay a critical role in forming the so-called random loosepacking (RLP) [7]. In the same year, three-dimensionalmolecular dynamics simulations were performed to studystress transmission in wet granular media in the pendularstate [8]. It was shown that the tensile action of capillarybonds induces a self-stressed particle network organized intwo percolating “phases” of positive and negative particlepressures. When a confining pressure was applied, the num-ber of tensile bonds falled off and the negative phase brokeinto aggregates and isolated sites.
Three dimensional contact dynamics simulations of cohe-sive powders have been used to study porosity under weakuniaxial compression [9]. Rigid spherical particles of iden-tical sizes were considered, but force and also torque trans-mission were allowed at contacts. The total normal forcebetween two grains has two constituents: an attractive part,which is a constant cohesion force, and a force due to theexcluded volume constraint. Authors found that the porosityis well represented as the sum of independent contributionsof the torsion and rolling friction. Their results suggest thateach relative motion mode, if it is suppressed, results in anadditional free volume in the system independently of theother modes.
In the same context of contact dynamics but in two dimen-sions, authors in [10] have proposed a model to capturethe essential microscopic physical processes underlying thedynamics of a collapsing suspension/soil. They comparedthe model with real data obtained from in situ measurementsperformed with a natural collapsing/suspension soil. Theypresented the consistency between the shear strength behav-ior of their collapsing suspension/soil model and the behaviorof the real system, for both the unperturbed and the perturbedphases of the material. In their work, the bonding betweentwo particles is considered in terms of a cohesion model witha constant attractive force acting within a finite range, so thatfor the opening of a contact a finite energy barrier must beovercome. In that paper the cohesion force dominates thebehavior and the energy barrier plays a minor role but its exis-tence is of crucial importance to avoid simulation artifacts.The main characteristic of the metastable granular structuresinvestigated by them is that they collapse, e.g. when an exter-nal load is applied.
Numerical simulations have also been used to observe andcharacterize, at both macroscopic and microstructural lev-els, the consolidation behavior in isotropic compression ofmodel cohesive powders [11]. In that paper, authors focusedon the effect of geometry and collective rearrangements on
the material behavior. They observed the loose packing states,as assembled under growing confining pressure, to undergoimportant structural changes, while the solid fraction param-eter irreversibly increases. They found their results shownqualitative differences between cohesive and cohesionlessgranular systems. Some of the main differences are the pres-ence of stable loose structure and the compaction phenome-non due the cohesion in the macroscopic behavior. Due to thefact that attractive and repulsive contact forces, of the orderof tensile strength, tend to compensate under low pressure,the force distribution and the values of intergranular forceswere not simple to estimate at the microstructural level.
It is well known that both in dry and wet granular sys-tems, forces are transmitted only through interparticle con-tacts, leading to strong inhomogeneities through a system[12]. In this sense, a packing of cohesionless grains that has agiven anisotropy can develop a change in its contact networkdue to the presence of cohesion forces, leading to the forma-tion of different kind of contacts along preferential directions.This structural change translates into changes in macroscopicquantities such as, for instance, the compaction capacity ofa system of wet grains. For this reason, some authors havereferred to the anisotropy as a relevant parameter to reflectthose changes [13]. In this sense, authors in [14] have inves-tigated the bulk microstructure in cohesive powders. Theywere able to link the compressive strain with the measuredanisotropy, thus creating the link between macroscopic andmicroscopic behaviours.
In [15] the probability density functions of normal forcesin dry and wet granular systems from 3D simulations bymolecular dynamics and contact dynamics methods havebeen compared. Using a model of capillary cohesion, imple-mented as a force law expressing the capillary force as afunction of water volume and the distance between particles,it was found that force distributions were exponential for bothcompressive and tensile forces.
Given the state of the art, we considered it is appropri-ate to develop simple models to calculate some parametersto characterize the mechanical state of a granular system inthe presence of moisture. In this sense, pseudodynamic sim-ulations have proven to be useful for analyzing the packingfraction of a two dimensional bed of disks subject to tapping[16–18]. One of the important aspects to consider in suchsystems is the structure of the packing as a function of liquidcontent and the intensity of tapping.
A wet granular sample at low content of liquid has a net-work of capillary bridges connecting the grains. The structureof this network of bridges largely determines the mechani-cal properties of the sample [1,19]. We consider situationsin which the cohesion is higher than other effects due tothe presence of fluid in the system such as lubrication andviscosity. Our model represents a set of grains in the so-called pendular state, according to the liquid content rate [1].
123
Structural properties of wet granular beds subjected to tapping 367
In the pendular state particles are held together by attractionof capillary bridges at their contact points. In a wet sample,the capillary bridge is formed when two adjacent particleshave a point of contact. At this point, the liquid surface ofthe films that wet the particles has a sharp bend. This in factis not an equilibrium situation. When liquid films meet, thecurvature of the liquid surface is very large and negative.This creates a major depression that sucks the liquid into thecontact region. Equilibrium is reached when the liquid hasacquired a spatially constant mean curvature. If the particlesare moved away from each other by a certain distance, aso-called pendular bridge appears due to the bridge stretch-ing [2].
In an earlier paper [18], we have presented a simple modelto describe the response of a granular bed to a tapping-likeexcitation when grains can form capillary bridges due tothe presence of interstitial liquid. In that paper, a pseudo-dynamic simulation method (PMDM) of adhesive hard diskswas implemented. The PMDM method has proven to be asatisfactory tool taking into account that due to the high com-pactness of the system a grain never gets sufficient time toaccelerate to large velocities [16,20]. In [18], the packingfraction and coordination number after the steady state ofthe tapping process has been reached were investigated andcompared for different tapping intensities and liquid con-tents. We found some contrasting behavior with dry systemsand qualitative agreement with experimental data.
Regarding the cohesive force used in our model and com-paring it to some of the above mentioned models, we remarkthat our cohesion model introduces the non homogeneity ofthe liquid distribution between particles through a stochasticcomponent for the force, i.e., the model has a non determin-istic character for the formation of capillary bridges. Thisstochastic character will be described in more detail below.
Our main objective here is to complete the study of thestructural properties of systems subjected to tapping as theyachieve the steady state. So, we present here results on theanisotropy of wet granular media subject to tapping and onthe distribution of contact angles. We will describe and showthat anisotropy is not always a parameter that completelyreflects the structure of packing. However, the distribution ofcontact angles will help us to infer the pattern of the packingstructure in all situations.
2 Simulation model
The simulation method for a wet granular bed used here hasbeen depicted in a previous work, for additional technicaldetails and model assumptions, the reader might refer to[16–18]. For the sake of completeness, we provide a sum-marized description below.
The simulation model used is a pseudodynamic algorithmwhich allows to deposit inelastic hard disks in a rectangularcontainer thus forming a two-dimensional packing. Differ-ently than molecular dynamics method, the equations ofmotion are not solved for the interacting grains. The move-ment of a grain is always performed in the direction of gravityunless local geometrical constrains exerted by other particlesmake the falling grain to stop or rotate. Basically, the methodconsists in small falls and rolls of the grains until they cometo rest by contacting other particles or the system bound-aries. In the case of dry disks, it is consider that a disk is ina stable position if it has reached two contacts such that thex-coordinate of its center of mass lies between them.
The deposition algorithm consists in picking up a disk inthe system and performing a free fall of length δ. If in thecourse of that fall a disk collides with another disk (or thebase), the falling disk is put just in contact and this contactis defined as its first supporting contact.
If the disk has already one single supporting contact welet it rotate an arc-length δ around the point of contact withits supporting particle. Clearly, the contact point moves asthe disk rolls over the other. If in the course of a roll of lengthδ a disk collides with another disk (or a wall), the rolling diskis put just in contact. If the first supporting contact and thesecond contact are such that the disk is in a stable position,the second contact is defined as the second supporting con-tact; otherwise, the lowest of the two contacting particlesis taken as the first supporting contact of the rolling diskand the second supporting contact is left undefined. Diskswith two supporting contacts are considered stable and leftin their positions. A moving disk can change the stability stateof other disks supported by it, therefore, this information isupdated after each move. The deposition is over once eachparticle in the system has both supporting contacts defined oris in contact with the base (particles at the base are supportedby a single contact).
Particles are moved one at a time, but they perform onlysmall moves that do not perturb to a significant extent theulterior motion of the other particles in the system. Particlesare moved always in the same order although this order doesnot affect the final state of the system.
Iteration consists in moving every disk in the systemby a distance δ—or the amount allowed by the constraintsimposed by neighboring disks. Notice that after iterationmany disks may be left in unstable positions. A number ofiterations are needed before every disk finds its stable con-figuration. For very small values of δ, this method yields arealistic simultaneous deposition of grains with zero restitu-tion coefficient. An important point in this simulation is theeffect that the parameter δ has in the results since particles donot move simultaneously but one at a time. One might expectthat in the limit δ → 0 we should recover a fairly realisticdynamics for fully inelastic rough disks dragged downwards
123
368 R. O. Uñac, A. M. Vidales
at constant velocity [17]. The dependence of the results onparameter δ has already been studied [17]. Since results agreewithin statistical uncertainties for δ ≤ 0.01 we decided to usethis maximum value as a convenient choice for our simula-tions. Lower values of δ require larger CPU times; whereasfor δ above 0.01, the results depend on δ.
This model has been deeply described elsewhere and wewill avoid extending too much the explanation here. We remitthe interested reader to references [16,17].
Within this model, one may introduce cohesive forces dueto capillary liquid bridges formed by the presence of moisturein the system. A wet granular sample at low content of liquidpresents a network of capillary bridges connecting the grains.The structure of this network of bridges determines to a largeextent the mechanical properties of the sample [1,19]. Weconsider situations where cohesion outweighs other effectsof the presence of liquid in the system such as lubricationand viscosity. Our model represents a granular assembly inthe so called “pendular state” according to the classificationby liquid content [1]. In the pendular state particles are heldtogether by the attraction of the capillary bridges at theircontact points.
In a wet sample, capillary bridges form when two adjacentparticles have a contact point. If the particles are moved awayfrom each other by a certain distance, a so-called pendularbridge appears due to the bridge stretching [2].
Taking into account the four main factors affecting thetotal capillary force in a static liquid bridge [21], we assumethat: the first factor, the wetting angle, is zero (complete wet);the second one, the surface tension of the liquid, is constantall over the system; the remaining factors, (the separation dis-tance between two particles and the liquid bridge volume),can be considered as stochastic variables since each bridgein the system may have a different volume and separationdepending on local conditions and contact history [18]. Weintroduce these two important factors through a single param-eter P0 that will be described below. It is important to noticethat in the above mentioned pendular state some particlesmay be stable thanks to the geometrical constrains imposedby others. In this situation capillary bridges may exist at thecontact points with the supporting grains; however, the sta-bility of the particle is not determined by these bridges. Inour model we will only count as a capillary bridge the parti-cle–particle contacts that support the entire weight of one ofthe touching grains.
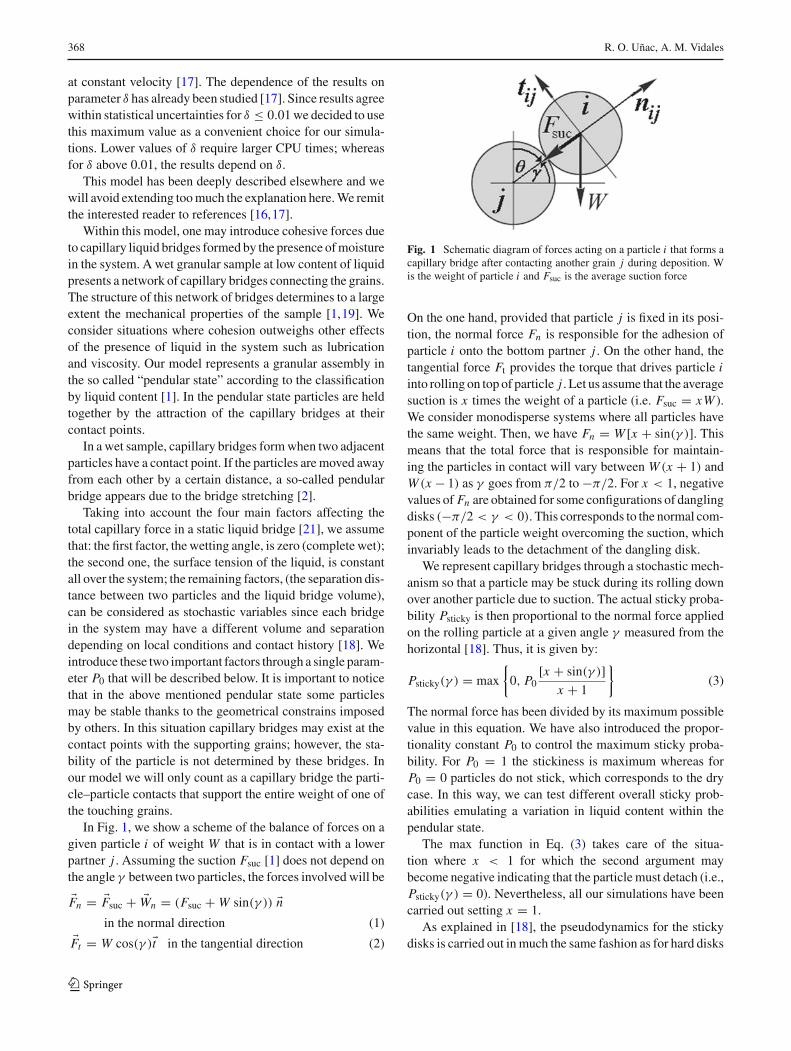
In Fig. 1, we show a scheme of the balance of forces on agiven particle i of weight W that is in contact with a lowerpartner j . Assuming the suction Fsuc [1] does not depend onthe angle γ between two particles, the forces involved will be
�Fn = �Fsuc + �Wn = (Fsuc + W sin(γ )) �nin the normal direction (1)
�Ft = W cos(γ )�t in the tangential direction (2)
Fig. 1 Schematic diagram of forces acting on a particle i that forms acapillary bridge after contacting another grain j during deposition. Wis the weight of particle i and Fsuc is the average suction force
On the one hand, provided that particle j is fixed in its posi-tion, the normal force Fn is responsible for the adhesion ofparticle i onto the bottom partner j . On the other hand, thetangential force Ft provides the torque that drives particle iinto rolling on top of particle j . Let us assume that the averagesuction is x times the weight of a particle (i.e. Fsuc = xW ).We consider monodisperse systems where all particles havethe same weight. Then, we have Fn = W [x + sin(γ )]. Thismeans that the total force that is responsible for maintain-ing the particles in contact will vary between W (x + 1) andW (x − 1) as γ goes from π/2 to −π/2. For x < 1, negativevalues of Fn are obtained for some configurations of danglingdisks (−π/2 < γ < 0). This corresponds to the normal com-ponent of the particle weight overcoming the suction, whichinvariably leads to the detachment of the dangling disk.
We represent capillary bridges through a stochastic mech-anism so that a particle may be stuck during its rolling downover another particle due to suction. The actual sticky proba-bility Psticky is then proportional to the normal force appliedon the rolling particle at a given angle γ measured from thehorizontal [18]. Thus, it is given by:
Psticky(γ ) = max
{0, P0
[x + sin(γ )]x + 1
}(3)
The normal force has been divided by its maximum possiblevalue in this equation. We have also introduced the propor-tionality constant P0 to control the maximum sticky proba-bility. For P0 = 1 the stickiness is maximum whereas forP0 = 0 particles do not stick, which corresponds to the drycase. In this way, we can test different overall sticky prob-abilities emulating a variation in liquid content within thependular state.
The max function in Eq. (3) takes care of the situa-tion where x < 1 for which the second argument maybecome negative indicating that the particle must detach (i.e.,Psticky(γ ) = 0). Nevertheless, all our simulations have beencarried out setting x = 1.
As explained in [18], the pseudodynamics for the stickydisks is carried out in much the same fashion as for hard disks
123

Structural properties of wet granular beds subjected to tapping 369
[17]. Following the steps for the simulation process alreadydepicted in detail in that paper, we will just recall here someof the main features necessary for understanding the resultspresented and discussed in the present paper.
If in a given iteration a disk already has one single potentialsupporting contact there are two possibilities: (1) to stickthrough a capillary bridge to the supporting particle and sobecome immobilized (probability Psticky(γ )), or (2) to moveon by either a roll or a free fall. A particle that sticks is anexample of the situation in which the strength of the capillarybridge is enough to prevent the particle from further rollingon top of its supporting disk. If the supporting particle doesnot move further in future time steps the disk will remain inits stable position held by the capillary bridge.
A particle that does not stick to its first potential support(probability [1 − Psticky(γ )]) corresponds to the situation inwhich either a capillary bridge does not form at the contact orthe weight of the disk overcomes the strength of the capillarybridge. For this reason the particle can roll down the surfaceof the lower partner. If a bridge exists, and the suction is nottoo weak, one expects that the particle may keep rolling with-out detaching from the surface of the contacting disk evenafter reaching a lower position with respect to its partner. Allalong the rolling the disk has a chance to stick [Psticky(γ )] atevery iteration and become immobilized. However, once theparticle has rolled to a position beneath its supporting partner,and provided that the particle does not stick, there is a proba-bility for the particle to detach and fall freely and a probabilityfor it to keep rolling in contact. We use again Psticky(γ ) toset the probability that a particle dangling beneath its supportwill roll in contact without detaching. This probability doesnot need to be the same as the sticky probability, but it hasto be related to the strength of the capillary bridge. We havechosen Psticky(γ ) for this probability to reduce the number ofcontrol parameters in the model. Notice that in this case thedisk is not stuck—i.e., it is not immobilized—but remainsin contact. In the next iteration, the disk will again have thechance to stick. It is worth mentioning that, since in our sim-ulations Psticky(−π/2) = 0 (recall that x = 1), all particlesthat do not stick but roll dangling from its partner will even-tually detach at the point θ = −π/2, unless a second contactis formed during rolling.
In summary, a particle that contacts another disk with0 < γ < π/2 has a probability Psticky(γ ) to stick and aprobability [1 − Psticky(γ )] to roll. However, if −π/2 <
γ < 0, the particle has a probability Psticky(γ ) to stick, aprobability [1 − Psticky(γ )]Psticky(γ ) to roll, and probability[1 − Psticky(γ )]2 to detach.
After the array of particles attains a stable configuration,a tapping process is started. All vertical coordinates are mul-tiplied by a factor A > 1 and the particles are also allowedto move under random displacements of length 0 < ξ <
A − 1 [18]. As frequently used, we employ � = √A − 1 as
a measure of the tapping intensity. This quantity is propor-tional to the energy input given by a realistic tap with peakacceleration �g, with g the acceleration of gravity [22].
3 Previous results and anisotropy calculation
Based on the simple model for wetting grains describedabove, a study on the response of a granular bed subjectedto a tapping-like excitation was presented in a previous work[18]. In that paper, results of the behavior of the mean packingfraction, <φ>, and mean coordination number, <z>, afterthe steady state of the tapping process has been reached, arecompared for different tapping intensities and liquid con-tents. Extensive simulations were performed with a rectan-gular box of width L = 20 where 1,000 monosized disks ofradius r = 0.1+1/
√2 ≈ 0.807 were deposited. The number
of particles used in our simulations is the minimum necessaryto save computing time without significant size effects.
We have chosen the parameter x that accounts for thestrength of the suction in such way that a particle danglingright beneath another disk has probability 1 of falling freely,i.e. x = 1. This situation corresponds to the case where thesuction is just as strong as the weight of the particle.
In Figs. 2 and 3 we show the corresponding behaviorfound for <φ> as a function of tapping intensity � and liquidcontent P0. These results show that the increase of P0 pro-motes the formation of open chain like structures with verylow packing fractions (below 0.5 at high tapping intensities)and low coordination numbers. However, the effect of theincrease of P0 levels off beyond P0 = 0.125. At low tap-ping intensities it is possible to reach relatively high packingfractions even with large liquid contents.
Fig. 2 Mean steady state packing fraction <φ> as a function oftapping intensity � at different liquid content (as measured bythe sticky probability P0). From top to bottom P0 = 0.0, 0.005,
0.025, 0.05, 0.125, 0.25, 0.5, 1.0 (see Ref. [18])
123

370 R. O. Uñac, A. M. Vidales
Fig. 3 Packing fraction <φ> as a function of liquid content P0. Eachcurve corresponds to a different tapping intensity as follows: � = 0.173(squares), 0.224 (stars), 0.274 (circles), 0.316 (up triangles), 0.448(down triangles), 0.548 (diamonds), 0.707 (left triangles), 1.000 (righttriangles), 1.414 (hexagons) (see ref. [18])
In this context, it is interesting to analyze the structure ofthe resulting packings in the course of tapping in terms of theanisotropy. In [18] it was found that even in the dilute case,the structure keeps a signature of a triangular lattice withcontact normals along particular directions. In this sense, thekey questions would be how does the anisotropy evolve withthe number of taps and how does it depend on the parameters� and P0.
The evolution of the packing structure will depend on therearrangements of the relaxation process, thus, the extent ofthe tapping intensity and the probability for the formationof capillary bridges will control the directional ordering ofthe contact network. Typically, the distribution of contactdirections can be characterized by means of the fabric tensorF defined by the following equation [13,23]:
Fαβ = 1
N
N∑i=1
niαni
β (4)
where N is the total number of contacts in the packing, ni isthe normal contact vector whose components are sin θ i andcos θ i , while ni
α and niβ are, respectively, the α and β com-
ponents of ni . Figure 1 shows a schematic representation ofa contact formed by a falling particle i with particle j in thearray. The contact between the two particles is representedby the segment joining the two centers of the them. The angleθ ι of this contact is indicated respect to the vertical directionand coincides with the direction of the normal contact.
The fabric tensor can be calculated when the distributionof contact directions is measured. Once the tensor is con-structed, its eigenvalues f1 and f2 can be determined and
the structural anisotropy characterizing the packing is com-puted from:
a = 2( f1 − f2) (5)
In the next section we will discuss the results obtained bythe computation of a on the packings generated for differentvalues of � and P0 already shown in Figs. 2 and 3.
4 Results and discussion
Figure 4 shows the results obtained when anisotropy a is cal-culated on the final structure of a packing after 1,500 tappingsat a given intensity �. Each curve represents the behaviourfor a different liquid content P0. Comparing this plot withthat of Fig. 2, we see that for � ≥ 0.447, systems with lowerliquid content (which present a higher degree of compaction)
Fig. 4 Anisotropy as a function of tapping intensity at different liquidcontent. For P0 = 0.0 (dry case) and from P0 = 0.005 to P0 = 1.0(wet cases)
Fig. 5 Anisotropy as a function of liquid content P0. Each curve cor-responds to a different tapping intensity from � = 0.224 to � = 1.414
123

Structural properties of wet granular beds subjected to tapping 371
Fig. 6 First row: snapshots of a fully deposited bed of disks after 1,500taps for P0 = 0.01 (a), 0.05 (b), 0.25 (c). All systems were tapped at� = 0.448. Only part of the whole assembly is shown. Second row:
(d–f) polar diagrams of the distribution of contact angles for packingsin the first row, respectively. Third row: (g–i) anisotropy as a functionof tapping number for the same packings, respectively
have the lowest values of anisotropy. In this region and fora given P0, a shows almost constant values as � increases.However, for � < 0.447, curves show interesting featuresthat can be analyzed better if we plot the anisotropy in termsof P0. For this reason, we present the behavior of a vs. liquidcontent at different tapping intensities in Fig. 5. Keeping inmind the results for <φ> vs. P0 presented in Fig. 3, onecould say that, while packing fraction decreases with P0,anisotropy has an increasing trend. Non monotonic behaviorof a for certain values of � leads us to analyze in greaterdetail the results shown in Fig. 5, where three different fam-
ilies of curves can be distinguished: (i) for � ≥ 0.447, (ii)for 0.274 < � ≤ 0.354 and (iii) for � ≤ 0.274.
For case (i), we note that a increases monotonically withincreasing P0. Anisotropy tends to zero when liquid contentalso tends to zero (dry limiting case).
In Fig. 6 (parts a–c), we display a set of snapshots forthe typical change in the structures of the packings as P0
increases from 0.01 to 0.25 with a tapping intensity � =0.447. In the same figure, the second row shows the polardiagrams of the distribution of contact angles correspondingthe the same packings (parts d–f). The last row of Fig. 6 plots
123

372 R. O. Uñac, A. M. Vidales
Fig. 7 First row: snapshots of a fully deposited bed of disks after 1,500taps for P0 = 0.01 (a), 0.025 (b), 0.05 (c). All systems were tappedat � = 0.316. Only part of the whole assembly is shown. Second row:(d–f) polar diagrams of the distribution of contact angles for packings
in the first row, respectively. Third row: (g–i) anisotropy as a function oftapping number for the same packings, respectively. The scale for thepolar plot is 7 times smaller than the corresponding for the precedingfigure to highlight the different features
the evolution of a as a function of the number of tappings(parts g–i).
Looking at Fig. 6a (low liquid content), a disordered struc-ture can be observed. The angular distribution of contacts(Fig. 6d) indicates that there are two moderately preferredorientations around directions 30◦ and 330◦, with a low inten-sity at 0◦, keeping a typical signature of a triangular lattice. Inaddition, there is a not so even distribution with low intensityfor contacts angles greater than 90◦ and smaller than 270◦,
representing the directions of capillary bridges exclusively.The corresponding evolution of a with tapping number showsthat only fluctuations around a constant value are possible(Fig. 6g).
Figure 6b (moderate liquid content) shows a more chain-like structure for particles, resulting in a more open structurecompared with the previous case. The preferential orienta-tion of these chains is depicted by the polar distribution inFig. 6e. The contacts are distributed with greater uniformity,
123

Structural properties of wet granular beds subjected to tapping 373
Fig. 8 First row: snapshots of a fully deposited bed of disks after 1,500taps for P0 = 0.01 (a), 0.05 (b), 0.25 (c). All systems were tapped at� = 0.224. Only part of the whole assembly is shown. Second row:(d–f) polar diagrams of the distribution of contact angles for packings
in the first row, respectively. Third row: (g–i) anisotropy as a functionof tapping number for the same packings, respectively. The scale forthe polar plot is 7 times smaller than the corresponding for Fig. 6 tohighlight the different features
i.e., the trace of a triangular distribution of contacts is less vis-ible. Several peaks at different orientations appear for anglesgreater then 60◦ and smaller that 300◦. Besides, the numberof contacts oriented at 0◦ increases. Anisotropy is greaterthan for the case before, with fluctuations around a constantvalue.
Figure 6c (high liquid content) shows an even more chain-like structure compared with the two previous cases. Thechains of particles are mainly oriented in an almost vertical
direction. The angular distribution of contacts has a maxi-mum at 0◦ and is fairly evenly distributed between 60◦ and330◦. Practically, there are no contacts for angles between90◦ and 270◦ which correspond to contacts associated withcapillary bridges exclusively. Here again, anisotropy showsfluctuations around a constant value that is greater than forprecedent cases.
In short, the increment of P0 results in an increment in thechain-like structure of the packing. The angular distribution
123

374 R. O. Uñac, A. M. Vidales
Fig. 9 Comparison between the behavior of packing fraction and anisotropy as a function of the tapping number for the case � = 0.224 andP0 = 0.01
Fig. 10 Evolution of polar diagrams of the distribution of contact angles at different tapping number: 1 (a), 100 (b), 200 (c), 300 (d), 450 (e) and600 (f)
of the contacts changes from a disordered structure that keepsa poor signature of a triangular lattice to a nearly verticalchain configuration. Anisotropy increments are related to thispreferential orientation of chains that show up as a result of ahigh probability for the formation of capillary bridges (Eq. 3).This behavior explains the fact that, at this extent of tappingintensities, the packing fraction decreases, as was reportedin [18].
Concerning the changes of a with the number of tap-pings, the trends observed in the three plots follow the same
qualitative behavior found for the corresponding packingfraction results. We will show some examples later on.
As can be appreciated in Fig. 5, the curves belonging tocase (ii) present, for low liquid content, a decrease of a withP0 until they find the value of anisotropy corresponding tocase (i). From then on, anisotropy starts to rise following theset of curves of case (i).
Figure 7 (parts a–c) shows that the structure, initiallyordered in a rather triangular pattern, starts to disorder asP0 grows. This is reflected by the probability distribution of
123

Structural properties of wet granular beds subjected to tapping 375
Fig. 11 First row: snapshots of a fully deposited bed of disks after1,500 taps for � = 0.224 (a), 0.448 (b), 1.0 (c). In all systems theliquid content is P0 = 0.25. Only part of the whole assembly is shown.
Second row: (d–f) polar diagrams of the distribution of contact anglesfor packings in the first row, respectively. Third row: (g–i) anisotropyas a function of tapping number for the same packings, respectively
angles for the contacts, shown in parts e to g in the same fig-ure. Indeed, at low P0, the contacts are preferentially orientedat 30◦ and 330◦ directions, which correspond to a highly tri-angular lattice structure. As P0 increases, the emergence ofnew capillary bridges starts to distort the strong triangulartrace. The peaks in the polar plots are less important andthe dispersion around the preferential directions becomesevident. This translates in a change of a, showing a min-imum value for certain liquid content. This behavior can
be explained as the competition between two effects. Atlow P0, the organization of the structure follows the ste-ric constraints that conduct to a triangular lattice. As P0
increases, the apparition of capillary bridges sticking the par-ticles creates contacts in other directions close around theoriginals, decreasing anisotropy. As P0 is still greater, this lasteffect dominates and particles start to orientate their contactsaround the vertical, resulting in an increasing anisotropy.This competition effect is more evident for greater tapping
123

376 R. O. Uñac, A. M. Vidales
intensities. The probability for the formation of a contact (dueto a capillary bridge) at a different angle than the one for atriangular structure is greater as greater is the space betweenparticles.
For case (iii) and looking at Fig. 5, we found that a donot vary too much as P0 increases for beds tapped at low�. Let us see how the packings behave for three typicalpoints on the curve for � = 0.224, for example. In Fig. 8(parts a–c) the snapshots demonstrate that the structures keeppractically unchanged as liquid content increases, showingan ordered organization with a high triangular trace. Thisfeature is reflected in the polar plots (parts d–f) that havetwo important peaks at 30◦ and 330◦, and low intensityones at 90◦, 150◦, 210◦ and 270◦ directions. These last fourdirections represent the contribution of suspended particlesdue to capillary bridges. Some interesting remarks show upwhen we analyze the evolution of the peaks as liquid con-tent increases. For low or relatively low P0, the probabilitydistribution of angles is almost the same, while for greaterliquid content, the contacts belonging to suspended particlestend to disappear and a little dispersion around 30◦ and 330◦directions is observed. As a result, a small increment in a isobtained for this last case.
It is worthy to mention that in all the cases above thechanges of a with tapping number qualitatively mirror thebehavior of the packing fraction. For the sake of brevity,we will show just one plot for � = 0.224 and P0 = 0.01.Figure 9 displays the comparison. It is clear that for this casethe packing fraction growth is accompanied by an increase inanisotropy. This increase in a is due to the preferential orien-tation of contacts in directions corresponding to a triangularlattice. The evolution of the polar distribution of contacts vs.tapping number is plotted in Fig. 10. At the beginning, con-tacts are fairly distributed in upward directions with a slightpreference at 30◦ and 330◦. As the tapping process is in pro-gress, growth of the peaks in those directions is evident.
At this stage, it is interesting to go back to Fig. 5. Closearound P0 = 0.25, anisotropy for all tapping intensities doesnot change too much. However, packing fraction is greaterat lower tapping intensities (see Fig. 3). To clarify this point,Fig. 11 shows the polar graphs and snapshots for P0 = 0.25and three different values of �. It is clear that the arrangementof particles is very different as � increases. The polar graphsshow the different distribution of contacts for each case. Forsmall �, structure retains the triangular appearance. As �
increases and more space is available for particles to establishcapillary bridges in different directions during the relaxationprocess (after each tapping), contacts between particles canreorient losing the trace of the triangular array and formingchains around the vertical direction. This results in the reduc-tion of the compaction capacity associated with more openstructures. At this point, we should note that the distribution
Fig. 12 Anisotropy as a function of liquid content for all the range ofP0. Each curve corresponds to a different tapping intensity as in Fig. 5
of angles well describes the topological properties of the sys-tem in all cases.
Going further in the analysis, Fig. 12 presents the behav-ior of a for all the range of P0. For 0.5 < P0 ≤ 1 anisotropyclearly depends on tapping intensity. In Fig. 13 we show theresults for P0 = 1.0 and three different values for �. Hereagain the corresponding distributions of contacts are differentfor each case. At low � (part a) the particles conform nearlyvertical chains. On the other hand, as the tapping intensityis higher (parts b and c) the chains branch. The polar plotsreflect this behavior. The contact distribution shows a clearpreferential orientation at 0◦ for low � (part d), whereas forhigher � (parts e and f) contacts are distributed over a rangebetween 60◦ and 300◦.
The analysis of the last two paragraph shows that for low �
the effect of liquid content is determinant in the final structureadopted by the particles. The preferential directions changesubstantially with P0 (compare Fig. 11a with Fig. 13a),resulting in an increased anisotropy. However no large dif-ferences were found for the other two intensities, althoughthere is an increase of contacts in the vertical direction forP0 = 1 compared with P0 = 0.25. The precedent discus-sion again demonstrates that a alone is not a good quan-titative indicator to analyze the compaction capacity of asystem.
It is important to mention that the results obtained here fora at P0 = 1 and low � approaches the value calculated fora random ballistic deposition model controlled by a criticalangle [13]. The value calculated here (a = 0.58) is lowerthan the theoretical value of 2/3 calculated for that modelbecause in [13] sticking of the particles have a deterministiccharacter that only depends on the critical angle, while hereit is conducted stochastically (Eq. 3).
123

Structural properties of wet granular beds subjected to tapping 377
Fig. 13 First row: snapshots of a fully deposited bed of disks after1500 taps for � = 0.224 (a), 0.448 (b), 1.0 (c). In all systems the liq-uid content is P0 = 1.0. Only part of the whole assembly is shown.
Second row: (d–f) polar diagrams of the distribution of contact anglesfor packings in the first row, respectively. Third row: (g–i) anisotropyas a function of tapping number for the same packings, respectively
5 Conclusions
Based on the results discussed so far we can concludewith some remarks on the general trends for the behav-ior of anisotropy observed here. From Figs. 3 and 12, asP0 decreases, packing fraction increases while anisotropydecreases (for all �, in general). It should be noted that<φ> decreases monotonically with P0 while a presentsa minimum value for � < 0.448, except for the case of� = 0.224.
Looking at Figs. 2 and 4, as � decreases, both packingfraction and anisotropy increase, for all P0. This is consis-tent with the fact that the packing keeps the almost triangular(for low and intermediate P0) or vertically branched latticestructure (for high P0).
In summary, there is a competition between two phe-nomena. On the one hand the increase in tapping intensity(introducing more void space between particles) promotesthe distribution of contacts in all directions, lowering anisot-ropy. On the other hand, a higher P0 increases the likelihood
123

378 R. O. Uñac, A. M. Vidales
of “freezing” contacts in certain directions, favoring theemergence of privileged orientations in the capillary bridges.This produces a freeze on the packing structure and depend-ing on how the system reaches equilibrium, anisotropy willincrease or decrease.
In other words, the anisotropy of the system will depend onthe extent of tappings introducing disorder competing withthe potential freezing of this disorder given by the value of P0.This explains the non monotonic behavior shown in Fig. 12.
The above results demonstrate that anisotropy alone isnot a good parameter to characterize the structure of a pack-ing uniquely. Instead, we have shown that the distribution ofcontact angles allows to infer adequately the structure of thepacking in all situations.
Finally, and concerning the evolution with the tappingnumber, anisotropy follows the same qualitative behaviorthan packing fraction. In general, one can expect that forP0 ≥ 0.25, a fluctuates around a constant value for all �
and the same behavior is found for � > 0.448 and all P0.Instead, for � < 0.448 and P0 < 0.25, a increases withtapping number until fluctuations around a constant valueshow up.
The results obtained so far for the structural properties ofwet particles subjected to tapping encourage us to addressin the future jamming problems due to arching (for instance,during the discharge of particles in a hopper) and their rela-tionship with those structural properties of the system.
Acknowledgments The authors thanks Dr. Luis Pugnaloni (IFLY-SIB-CONICET, Argentina) for his contribution to the development ofpart of the code used here. Authors acknowledge financial support fromCONICET (Argentina).
References
1. Mitarai, N., Nori, F.: Wet granular materials. Adv. Phys. 55, 1–45(2006); and references therein
2. Herminghaus, S.: Dynamics of wet granular matter. Adv. Phys.54, 221–244 (2005)
3. Feng, C.L., Yu, A.B.: Effect of liquid addition on the packing ofmono-sized coarse spheres. Powder Tech. 99, 22–28 (1998)
4. Zou, R.P., Xu, J.Q., Feng, C.L., Yu, A.B., Johnston, S., Standish, N.:Packing of multi-sized mixtures of wet coarse spheres. PowderTech. 130, 77–83 (2003)
5. Yang, R.Y., Zou, R.P., Yu, A.B.: Effect of material properties onthe packing of fine particles. J. Appl. Phys. 94, 3025–3034 (2003)
6. Gilabert, F.A., Roux, J.-N., Castellanos, A.: Computer simula-tion of model cohesive powders: influence of assembling pro-cedure and contact laws on low consolidation states. Phys. Rev.E 75, 011303 (2007)
7. Dong, K.J., Yang, R.Y., Zou, R.P., Yu, A.B.: Role of interparti-cle forces in the formation of random loose packing. Phys. Rev.Lett. 96, 145505 (2006)
8. Richefeu, V., Radjaï, F., El Youssoufi, M.S.: Stress transmission inwet granular materials. Eur. Phys. J. E 21, 359–369 (2006)
9. Bartels, G., Unger, T., Kadau, D., Wolf, D.E, Kertesz, J.: The effectof contact torques on porosity of cohesive powders. Granul. Matter7, 139–143 (2005)
10. Kadau, D., Andrade, J.S. Jr., Herrmann, H.J.: Collapsing granularsuspensions. Eur. Phys. J. E 30, 275–281 (2009)
11. Gilabert, F.A., Roux, J.-N., Castellanos, A.: Computer simula-tion of model cohesive powders: plastic consolidation, struc-tural changes, and elasticity under isotropic loads. Phys. Rev.E 78, 031305 (2008)
12. Radjai, F., Wolf, D.E., Moreau, M.J., Moreau, J.J.: Bimodal char-acter of stress transmission in granular packings. Phys. Rev. Lett.80, 61–64 (1998); and references therein
13. Bratberg, I., Radjai, F., Hansen, A.: Dynamic rearrangements andpacking regimes in randomly deposited two-dimensional granularbeds. Phys. Rev. E 66, 031303 (2002)
14. Andersson, R., Bouwman, W.G., Plomp, J., Mulder, F.M., Schim-mel, H.G., De Schepper, I.M.: Structure, anisotropy and fractals incompressed cohesive powders. Powder Tech. 189, 6–13 (2009)
15. Richefeu, V., El Youssoufi, M.S., Azéma, E., Radjaï, F.: Force trans-mission in dry and wet granular media. Powder Tech. 190, 258–263 (2009)
16. Manna, S.S., Khakhar, D.V.: Internal avalanches in a granularmedium. Phys. Rev. E 58, R6935–R6939 (1998)
17. Pugnaloni, L.A., Valluzzi, M.G., Valluzzi, L.G.: Arching in tappeddeposit of hard disks. Phys. Rev. E 73, 051302 (2006)
18. Uñac, R.O., Vidales, A.M., Pugnaloni, L.A.: Simple model forwet granular beds subjected to tapping. Granul. Matter 11, 371–378 (2009)
19. Fournier, Z., Geromichalos, D., Herminghaus, S., Kohonen, M.M.,Mugele, F., Scheel, M., Schulz, M., Schulz, B., Schier, Ch.,Seemann, R., Skudelny, A.: Mechanical properties of wet gran-ular materials. J. Phys. Condens. Matter 17, S477–S502 (2005)
20. Manna, S.S., Herrmann, H.J.: Intermittent granular flow and clog-ging with internal avalanches. Eur. Phys. J. E 1, 341–344 (2000)
21. Yang, S.C., Hsiau, S.S.: The simulation of powders with liq-uid bridges in a 2D vibrated bed. Chem. Eng. Sci. 56, 6837–6849 (2001)
22. Philippe, P., Bideau, D.: Numerical model for granular compactionunder vertical tapping. Phys. Rev. E 63, 051304 (2001)
23. Madadi, M., Tsoungui, O., Lätzel, M., Luding, S.: On the fab-ric tensor of polydisperse granular materials in 2D. Int. J. SolidsStruct. 41, 2563–2580 (2004)
123
Copyright © 2022 FDOKUMEN