Structural Reliability of RCC buildings subjected to seismic ...
13
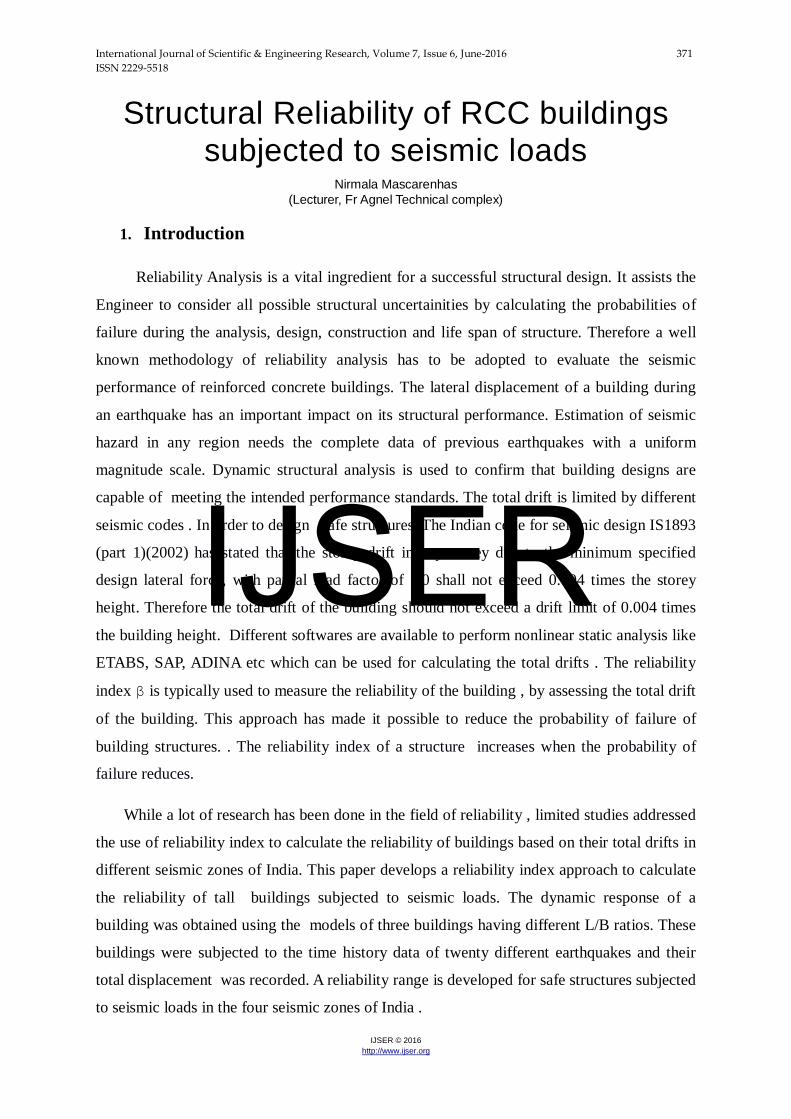
International Journal of Scientific & Engineering Research, Volume 7, Issue 6, June-2016 371 ISSN 2229-5518 IJSER © 2016 http://www.ijser.org Structural Reliability of RCC buildings subjected to seismic loads Nirmala Mascarenhas (Lecturer, Fr Agnel Technical complex) 1. Introduction Reliability Analysis is a vital ingredient for a successful structural design. It assists the Engineer to consider all possible structural uncertainities by calculating the probabilities of failure during the analysis, design, construction and life span of structure. Therefore a well known methodology of reliability analysis has to be adopted to evaluate the seismic performance of reinforced concrete buildings. The lateral displacement of a building during an earthquake has an important impact on its structural performance. Estimation of seismic hazard in any region needs the complete data of previous earthquakes with a uniform magnitude scale. Dynamic structural analysis is used to confirm that building designs are capable of meeting the intended performance standards. The total drift is limited by different seismic codes . In order to design safe structures, The Indian code for seismic design IS1893 (part 1)(2002) has stated that the storey drift in any storey due to the minimum specified design lateral force, with partial load factor of 1.0 shall not exceed 0.004 times the storey height. Therefore the total drift of the building should not exceed a drift limit of 0.004 times the building height. Different softwares are available to perform nonlinear static analysis like ETABS, SAP, ADINA etc which can be used for calculating the total drifts . The reliability index β is typically used to measure the reliability of the building , by assessing the total drift of the building. This approach has made it possible to reduce the probability of failure of building structures. . The reliability index of a structure increases when the probability of failure reduces. While a lot of research has been done in the field of reliability , limited studies addressed the use of reliability index to calculate the reliability of buildings based on their total drifts in different seismic zones of India. This paper develops a reliability index approach to calculate the reliability of tall buildings subjected to seismic loads. The dynamic response of a building was obtained using the models of three buildings having different L/B ratios. These buildings were subjected to the time history data of twenty different earthquakes and their total displacement was recorded. A reliability range is developed for safe structures subjected to seismic loads in the four seismic zones of India . IJSER
-
Upload
khangminh22 -
Category
Documents
-
view
2 -
download
0
Transcript of Structural Reliability of RCC buildings subjected to seismic ...
International Journal of Scientific & Engineering Research, Volume 7, Issue 6, June-2016 371 ISSN 2229-5518
IJSER © 2016 http://www.ijser.org
Structural Reliability of RCC buildings subjected to seismic loads
Nirmala Mascarenhas (Lecturer, Fr Agnel Technical complex)
1. Introduction
Reliability Analysis is a vital ingredient for a successful structural design. It assists the
Engineer to consider all possible structural uncertainities by calculating the probabilities of
failure during the analysis, design, construction and life span of structure. Therefore a well
known methodology of reliability analysis has to be adopted to evaluate the seismic
performance of reinforced concrete buildings. The lateral displacement of a building during
an earthquake has an important impact on its structural performance. Estimation of seismic
hazard in any region needs the complete data of previous earthquakes with a uniform
magnitude scale. Dynamic structural analysis is used to confirm that building designs are
capable of meeting the intended performance standards. The total drift is limited by different
seismic codes . In order to design safe structures, The Indian code for seismic design IS1893
(part 1)(2002) has stated that the storey drift in any storey due to the minimum specified
design lateral force, with partial load factor of 1.0 shall not exceed 0.004 times the storey
height. Therefore the total drift of the building should not exceed a drift limit of 0.004 times
the building height. Different softwares are available to perform nonlinear static analysis like
ETABS, SAP, ADINA etc which can be used for calculating the total drifts . The reliability
index β is typically used to measure the reliability of the building , by assessing the total drift
of the building. This approach has made it possible to reduce the probability of failure of
building structures. . The reliability index of a structure increases when the probability of
failure reduces.
While a lot of research has been done in the field of reliability , limited studies addressed
the use of reliability index to calculate the reliability of buildings based on their total drifts in
different seismic zones of India. This paper develops a reliability index approach to calculate
the reliability of tall buildings subjected to seismic loads. The dynamic response of a
building was obtained using the models of three buildings having different L/B ratios. These
buildings were subjected to the time history data of twenty different earthquakes and their
total displacement was recorded. A reliability range is developed for safe structures subjected
to seismic loads in the four seismic zones of India .
IJSER
International Journal of Scientific & Engineering Research, Volume 7, Issue 6, June-2016 372 ISSN 2229-5518
IJSER © 2016 http://www.ijser.org
2. Method Formulation
In order to develop a reliability range, three different buildings were modeled in a well
known structural software called ETABS. These buildings having different L/B ratios. ie
Building 1 (L/B =1.19), Building 2 (L/B =1.44) and Building 3 (L/B = 1.72) were used. All
the buildings are thirty storied with 3 m as the floor to floor height. Therefore the total height
of these buildings is 90m .
These buildings were modeled for twenty actual earthquakes and analysed in the four seismic
zones of India . The drifts thus obtained were tabulated and the safety margin curve was
plotted. Reliability Index is than calculated based on the total drift obtained from these
structures.A building fails when the total drift of a building is more than the allowable drift.
The margin of safety of a building is given by the following equation:
M = ∆ - δ ------------------------------------------------------------------------------------------ (1)
where ∆ is the allowable drift given by the equation
∆ = HT * D1 --------------------------------------------------------------------------------- (2)
HT is the total building height and D1 is the drift index as specified by the code
(0.004)
δ is the actual total displacement of the building.
Hence the probability of failure is given by the following equation :
pf = P(M<0) ---------------------------------------------------------------------------------------- (3)
= ∅(0−µ𝑀𝜎𝑀
)
Where ∅ is the standard normal cumulative probability distribution function
µM is the mean value of M
sM is the standard deviation of M
Therefore pf = ∅(−µ𝑀𝜎𝑀
) --------------------------------------------------------------------------- (4)
The reliability index is obtained by the equation :
b = (µ𝑀𝜎𝑀
) -------------------------------------------------------------------------------------- (5)
IJSER
International Journal of Scientific & Engineering Research, Volume 7, Issue 6, June-2016 373 ISSN 2229-5518
IJSER © 2016 http://www.ijser.org
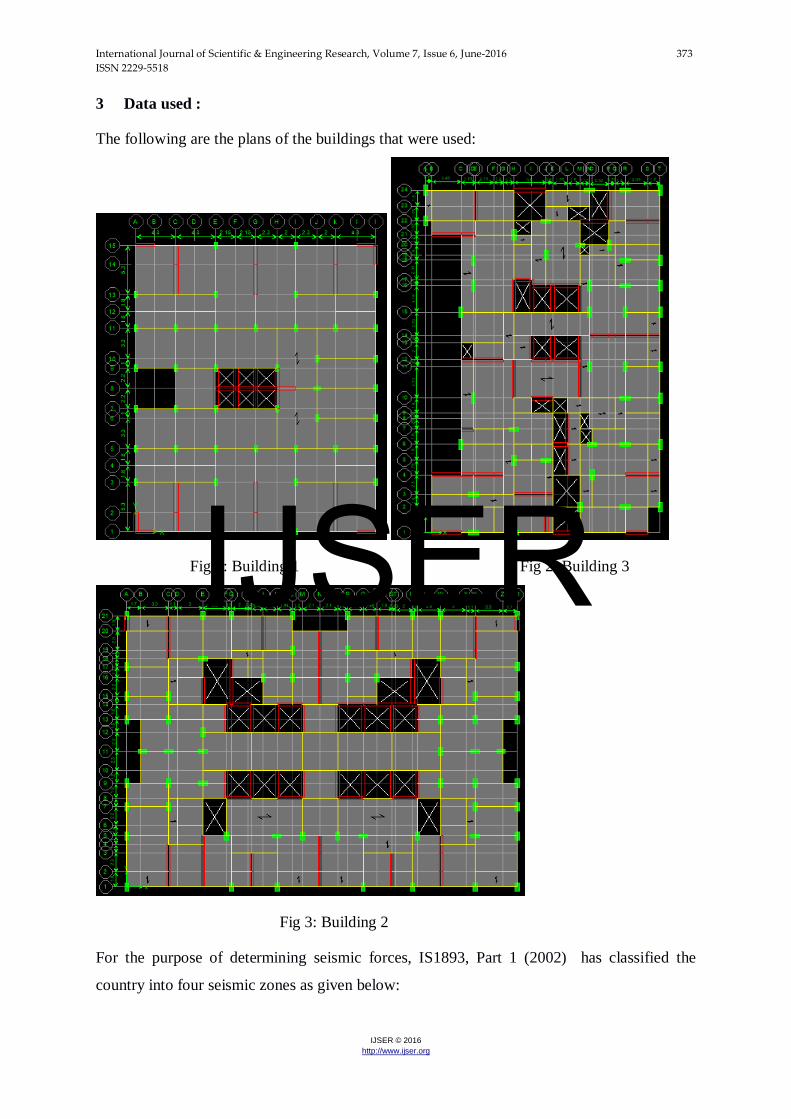
3 Data used :
The following are the plans of the buildings that were used:
Fig 1: Building 1 Fig 2: Building 3
Fig 3: Building 2
For the purpose of determining seismic forces, IS1893, Part 1 (2002) has classified the
country into four seismic zones as given below:
IJSER
International Journal of Scientific & Engineering Research, Volume 7, Issue 6, June-2016 374 ISSN 2229-5518
IJSER © 2016 http://www.ijser.org
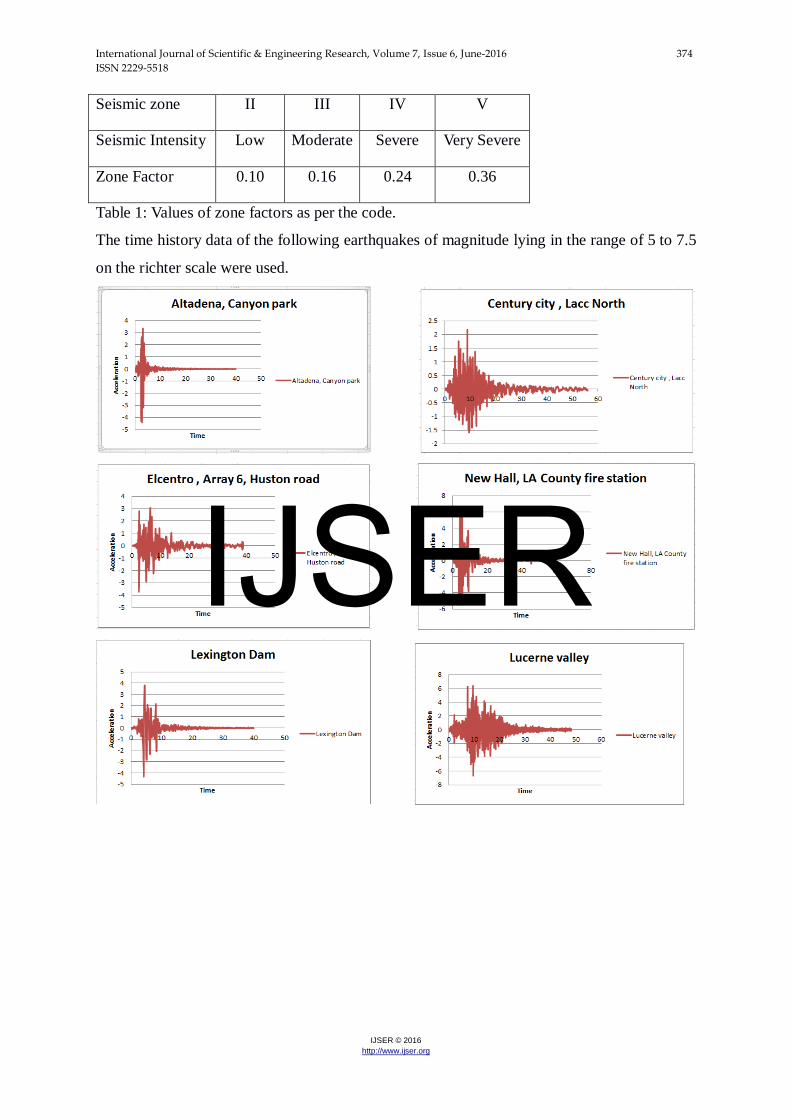
Seismic zone II III IV V
Seismic Intensity Low Moderate Severe Very Severe
Zone Factor 0.10 0.16 0.24 0.36
Table 1: Values of zone factors as per the code.
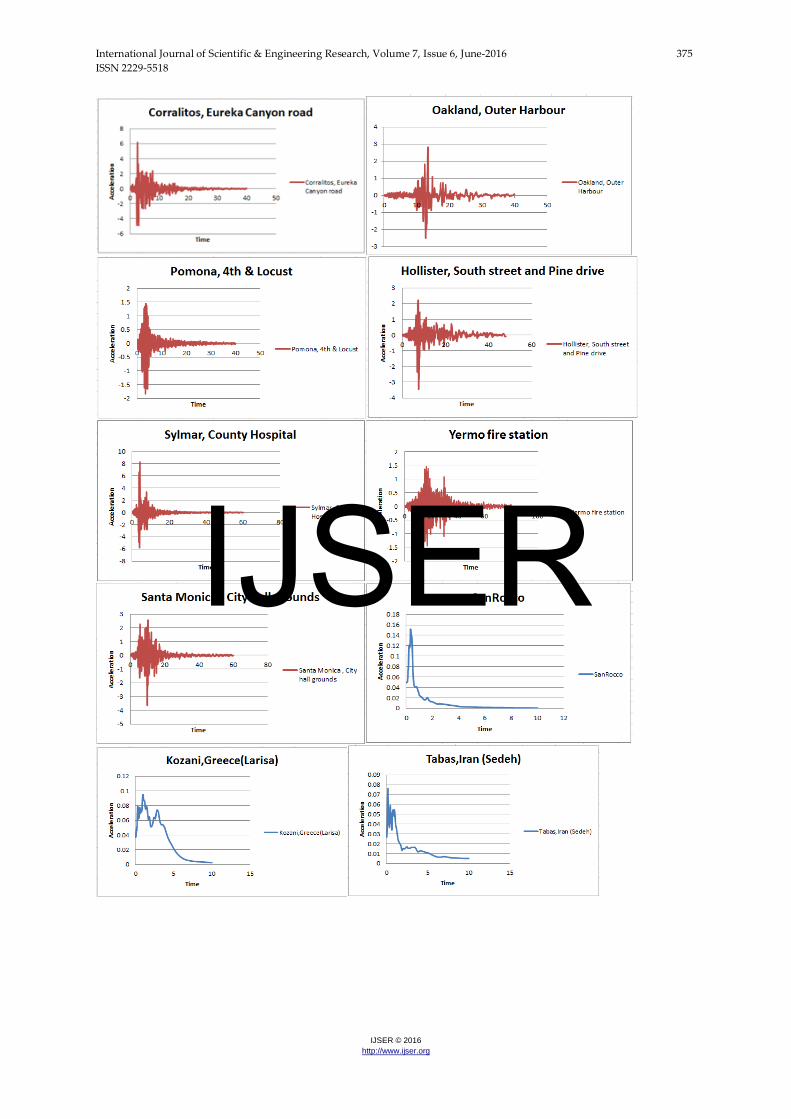
The time history data of the following earthquakes of magnitude lying in the range of 5 to 7.5
on the richter scale were used.
IJSER
International Journal of Scientific & Engineering Research, Volume 7, Issue 6, June-2016 375 ISSN 2229-5518
IJSER © 2016 http://www.ijser.org
IJSER
International Journal of Scientific & Engineering Research, Volume 7, Issue 6, June-2016 376 ISSN 2229-5518
IJSER © 2016 http://www.ijser.org
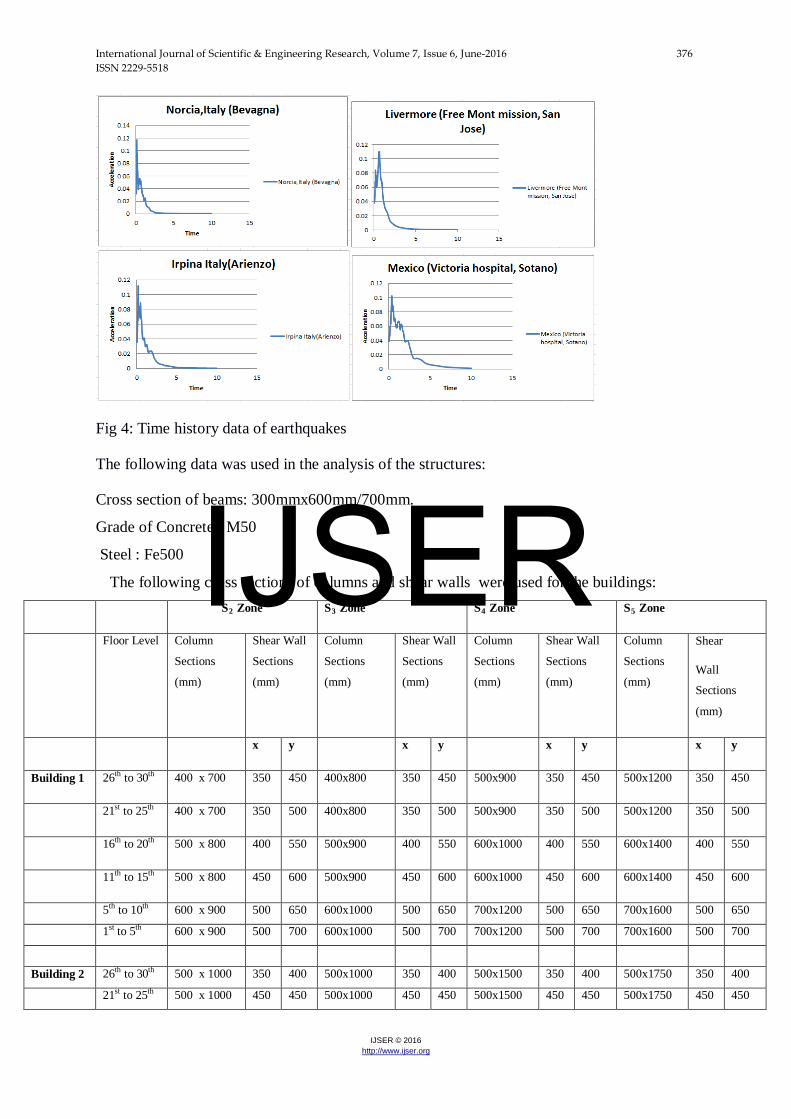
Fig 4: Time history data of earthquakes
The following data was used in the analysis of the structures:
Cross section of beams: 300mmx600mm/700mm.
Grade of Concrete : M50
Steel : Fe500
The following cross sections of columns and shear walls were used for the buildings: S2 Zone S3 Zone S4 Zone S5 Zone
Floor Level Column
Sections
(mm)
Shear Wall
Sections
(mm)
Column
Sections
(mm)
Shear Wall
Sections
(mm)
Column
Sections
(mm)
Shear Wall
Sections
(mm)
Column
Sections
(mm)
Shear
Wall
Sections
(mm)
x y x y x y x y
Building 1 26th to 30th 400 x 700 350 450 400x800 350 450 500x900 350 450 500x1200 350 450
21st to 25th 400 x 700 350 500 400x800 350 500 500x900 350 500 500x1200 350 500
16th to 20th 500 x 800 400 550 500x900 400 550 600x1000 400 550 600x1400 400 550
11th to 15th 500 x 800 450 600 500x900 450 600 600x1000 450 600 600x1400 450 600
5th to 10th 600 x 900 500 650 600x1000 500 650 700x1200 500 650 700x1600 500 650
1st to 5th 600 x 900 500 700 600x1000 500 700 700x1200 500 700 700x1600 500 700
Building 2 26th to 30th 500 x 1000 350 400 500x1000 350 400 500x1500 350 400 500x1750 350 400
21st to 25th 500 x 1000 450 450 500x1000 450 450 500x1500 450 450 500x1750 450 450
IJSER
International Journal of Scientific & Engineering Research, Volume 7, Issue 6, June-2016 377 ISSN 2229-5518
IJSER © 2016 http://www.ijser.org
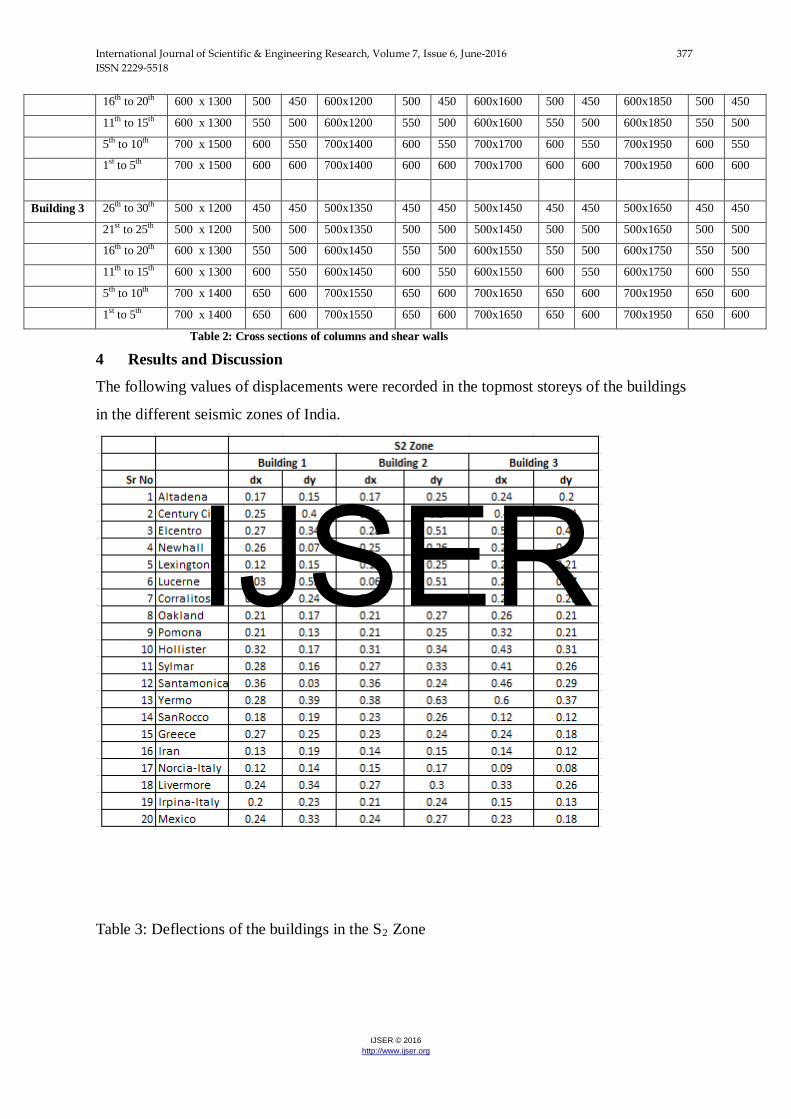
16th to 20th 600 x 1300 500 450 600x1200 500 450 600x1600 500 450 600x1850 500 450
11th to 15th 600 x 1300 550 500 600x1200 550 500 600x1600 550 500 600x1850 550 500
5th to 10th 700 x 1500 600 550 700x1400 600 550 700x1700 600 550 700x1950 600 550
1st to 5th 700 x 1500 600 600 700x1400 600 600 700x1700 600 600 700x1950 600 600
Building 3 26th to 30th 500 x 1200 450 450 500x1350 450 450 500x1450 450 450 500x1650 450 450
21st to 25th 500 x 1200 500 500 500x1350 500 500 500x1450 500 500 500x1650 500 500
16th to 20th 600 x 1300 550 500 600x1450 550 500 600x1550 550 500 600x1750 550 500
11th to 15th 600 x 1300 600 550 600x1450 600 550 600x1550 600 550 600x1750 600 550
5th to 10th 700 x 1400 650 600 700x1550 650 600 700x1650 650 600 700x1950 650 600
1st to 5th 700 x 1400 650 600 700x1550 650 600 700x1650 650 600 700x1950 650 600
Table 2: Cross sections of columns and shear walls
4 Results and Discussion
The following values of displacements were recorded in the topmost storeys of the buildings
in the different seismic zones of India.
Table 3: Deflections of the buildings in the S2 Zone
IJSER

International Journal of Scientific & Engineering Research, Volume 7, Issue 6, June-2016 378 ISSN 2229-5518
IJSER © 2016 http://www.ijser.org
Table 4: Deflections of the buildings in the S3 Zone
Table 5: Deflections of the buildings in the S4 Zone
IJSER

International Journal of Scientific & Engineering Research, Volume 7, Issue 6, June-2016 379 ISSN 2229-5518
IJSER © 2016 http://www.ijser.org
Table 6: Deflections of the buildings in the S5 Zone
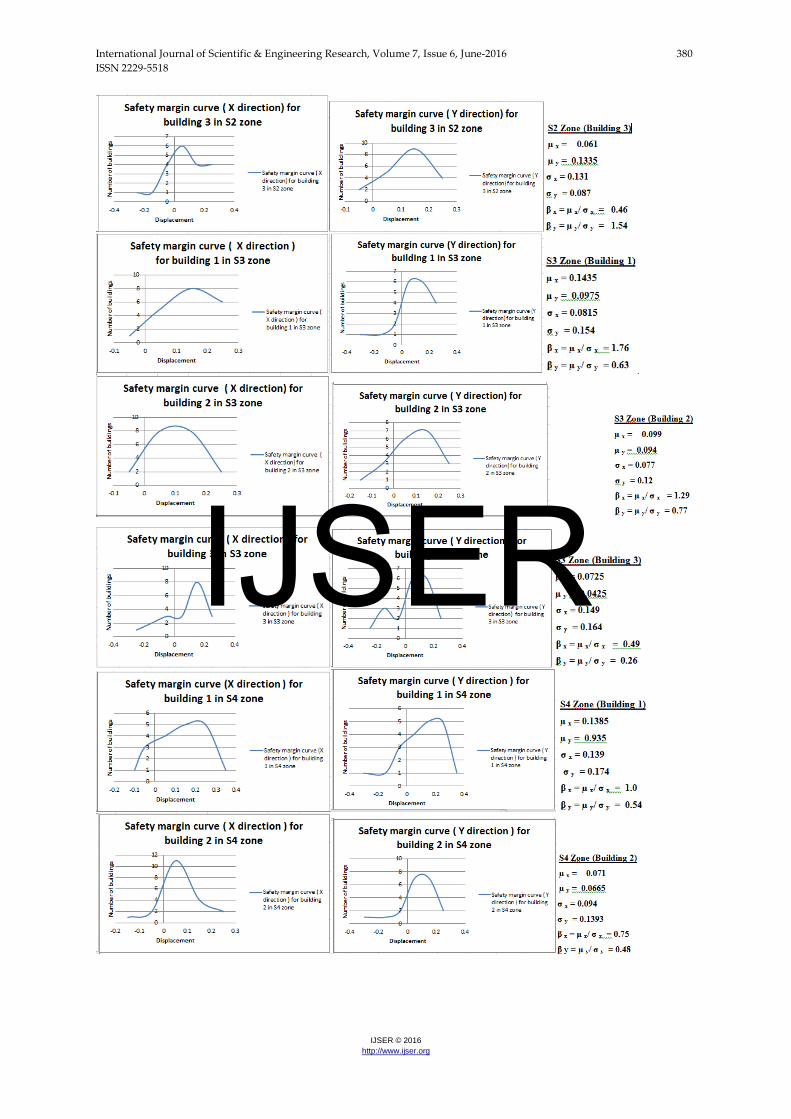
The margin of safety is calculated from these values and the safety margin curve in the x
and y direction is plotted. The mean and standard deviation of these values is than calculated
and is used to find the reliability index. IJSER
International Journal of Scientific & Engineering Research, Volume 7, Issue 6, June-2016 380 ISSN 2229-5518
IJSER © 2016 http://www.ijser.org
IJSER
International Journal of Scientific & Engineering Research, Volume 7, Issue 6, June-2016 381 ISSN 2229-5518
IJSER © 2016 http://www.ijser.org
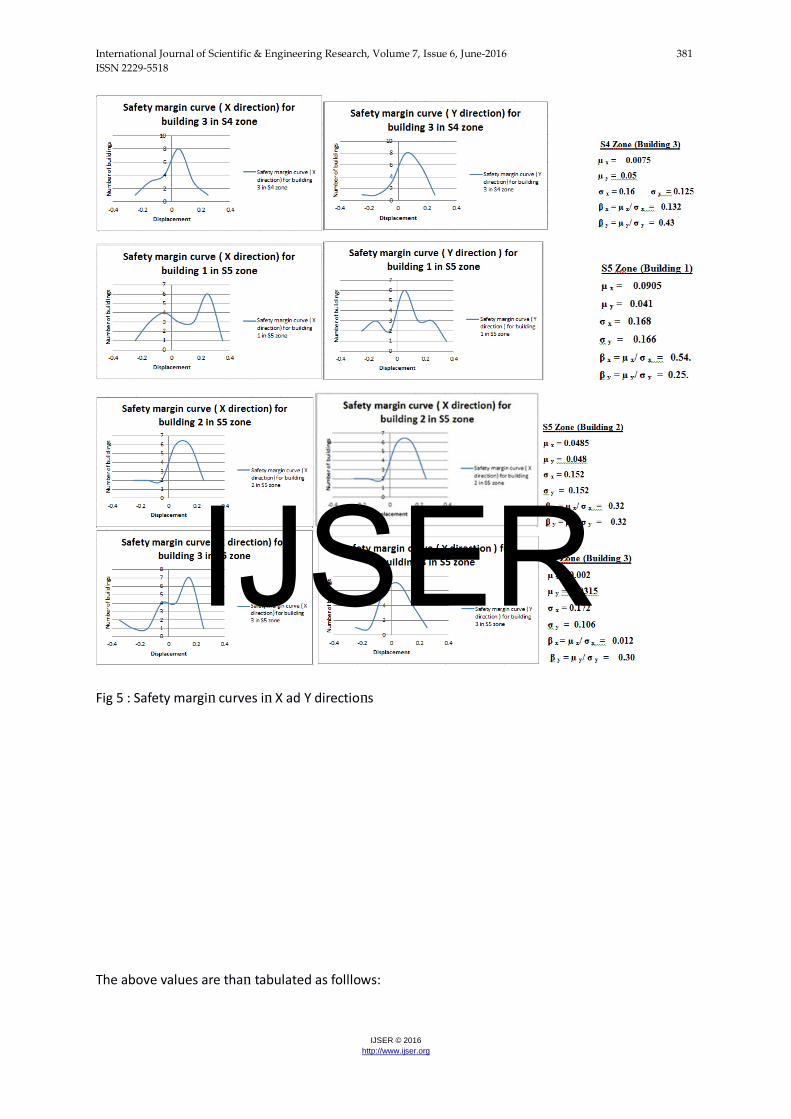
Fig 5 : Safety margin curves in X ad Y directions
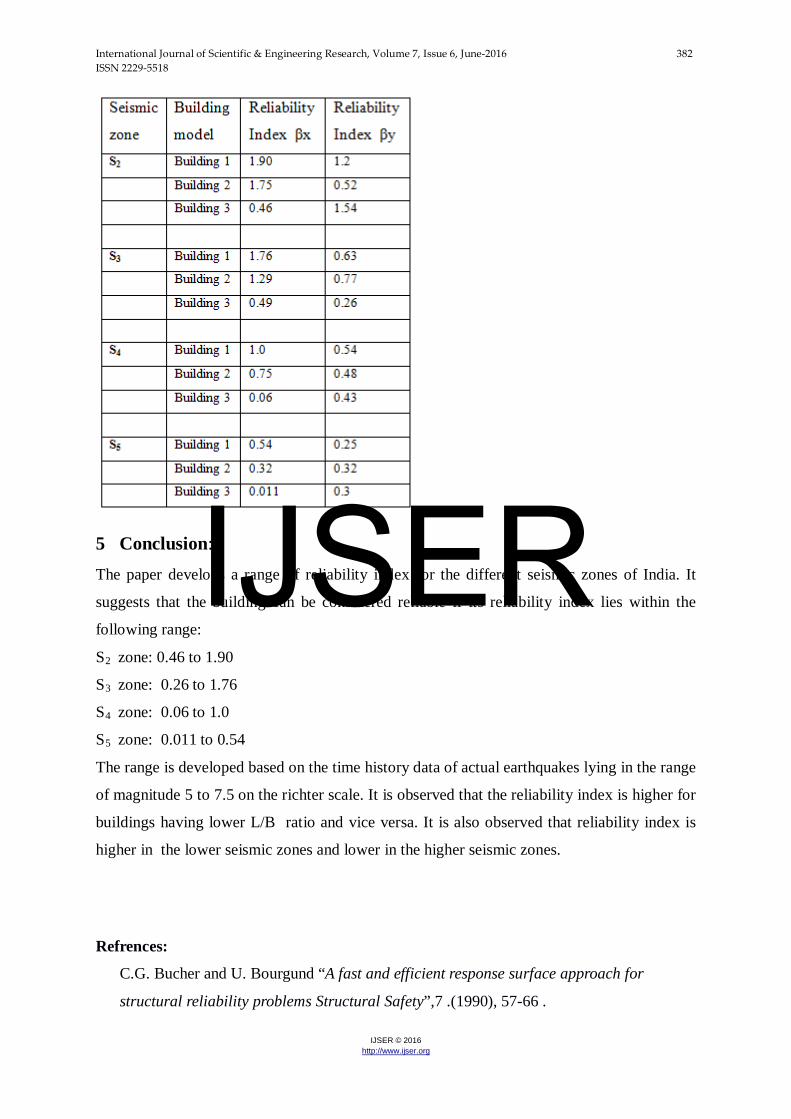
The above values are than tabulated as folllows:
IJSER
International Journal of Scientific & Engineering Research, Volume 7, Issue 6, June-2016 382 ISSN 2229-5518
IJSER © 2016 http://www.ijser.org
5 Conclusion: The paper develops a range of reliability index for the different seismic zones of India. It
suggests that the building can be considered reliable if its reliability index lies within the
following range:
S2 zone: 0.46 to 1.90
S3 zone: 0.26 to 1.76
S4 zone: 0.06 to 1.0
S5 zone: 0.011 to 0.54
The range is developed based on the time history data of actual earthquakes lying in the range
of magnitude 5 to 7.5 on the richter scale. It is observed that the reliability index is higher for
buildings having lower L/B ratio and vice versa. It is also observed that reliability index is
higher in the lower seismic zones and lower in the higher seismic zones.
Refrences:
C.G. Bucher and U. Bourgund “A fast and efficient response surface approach for
structural reliability problems Structural Safety”,7 .(1990), 57-66 .
IJSER
International Journal of Scientific & Engineering Research, Volume 7, Issue 6, June-2016 383 ISSN 2229-5518
IJSER © 2016 http://www.ijser.org
M.Yener & H.Shen “ Structural reliability analysis under earthquake loading
Earthquake Engineering”, Tenth world Conference, Balkerna, Rotterdam (1992).
Luis Esteva, Orlando j Díaz-López and Enrique Mendoza “ Reliability indexes
in earthquake resistant design of Multi-storey frame buildings”. 12 WCEE, (2000)1662.
Paul Waarts and Ton Vrouwenvelder –“ Structural reliability using the finite element
Method” , Delft University of technology, Netherlands ,(2002).
Yiannis Tsompanakis , Vissarion Papadopoulos,Nikos D Lagaros and Manolis
Papadrakakis “Reliability Analysis of structures under seismic loading, Fifth World Conference on computational mechanics”(2002).
6 El Ghoulbzouri A,Khamlichi A.,Bezzazi M.,Mourabit T.,López-Almansa F.:
“Reliability Analysis For Seismic Performance Assessment Of Reinforced Concrete
Buildings” . 3rd International conference on Integrity, reliability and failure, (2009) 352.
7 Bahador Bagheri, Ehsan Salimi Firoozabad, and Mohammadreza Yahyaei:
“Comparative Study of the Static and Dynamic Analysis of Multi-Storey Irregular
Building”, World Academy of Science, Engineering and Technology Vol:6 (2012),11-2.
8 Mohammed S.Al- Ansari - “Reliability Index of Tall Buildings in Earthquake Zones”.
Open Journal of earthquake research, (2013), 39-46.
IJSER