STRESS-STRAIN CHARATERIZATION OF RCC MIXES AT ...
22
STRESS-STRAIN CHARATERIZATION OF RCC MIXES AT GERD PROJECT AND THERMAL - SEISMIC DAM BEHAVIOR ANALYSES G. Pietrangeli STUDIO ING. G. PIETRANGELI s.r.l. ITALIA A. Bezzi STUDIO ING. G. PIETRANGELI s.r.l. ITALIA P. Mastrofini WE BUILD S.P.A ITALIA A. Masciotta STUDIO MASCIOTTA s.r.l ITALIA 1. INTRODUCTION The Grand Ethiopian Renaissance Dam (GERD) Project is located along the Blue Nile (Abbai) almost at Ethiopian-Sudanese border, few kilometers upstream of Roseires Dam in Sudan and 700 km NE of Addis Ababa, in the Benishangul – Gumaz region. The plant, with its 5’150 MW of installed power and 15.7 TWh of annual energy production, is one the most important projects in the Ethiopian
-
Upload
khangminh22 -
Category
Documents
-
view
1 -
download
0
Transcript of STRESS-STRAIN CHARATERIZATION OF RCC MIXES AT ...

STRESS-STRAIN CHARATERIZATION OF RCC MIXES AT GERD PROJECT AND THERMAL - SEISMIC DAM BEHAVIOR ANALYSES
G. Pietrangeli
STUDIO ING. G. PIETRANGELI s.r.l.
ITALIA
A. Bezzi
STUDIO ING. G. PIETRANGELI s.r.l.
ITALIA
P. Mastrofini
WE BUILD S.P.A
ITALIA
A. Masciotta
STUDIO MASCIOTTA s.r.l
ITALIA
1. INTRODUCTION
The Grand Ethiopian Renaissance Dam (GERD) Project is located along the
Blue Nile (Abbai) almost at Ethiopian-Sudanese border, few kilometers upstream
of Roseires Dam in Sudan and 700 km NE of Addis Ababa, in the Benishangul –
Gumaz region.
The plant, with its 5’150 MW of installed power and 15.7 TWh of annual
energy production, is one the most important projects in the Ethiopian

Government’s commitment to meet the country’s present and future power
requirements.
The whole project includes a roller compacted concrete (RCC) Main Dam
(175 m high, 10.2 Mm3 of RCC volume) and a concrete faced rockfill (CFRD)
Saddle Dam (65 m high, 5 km long, 15 Mm3 of embankment volume). The 5,150
MW installed power will be generated by 13 Francis turbines in two outdoor power-
houses located at the Main Dam toe on the right and left riverside. The project also
includes a nine-bay gated-spillway, an un-gated auxiliary spillway, an emergency
spillway, and two middle outlets to allow the control of the reservoir impounding.
The dam is at date under construction; when completed, GERD will feature the
largest dam in Africa.
The Project is being implemented by the Ethiopian Electric Power company
(EEP), with Webuild S.p.A (ex Salini-Impregilo) as EPC Contractor and Studio
Pietrangeli as Designer.
This paper describes the extensive tests campaign carried out at GERD
Project on the RCC mixes to investigate the stress-strain curve showing a non-
linear behaviour, as well as the correlation between horizontal and vertical direct
tensile strength for the same portion of RCC and between tensile and compressive
moduli.
The results of above tests have been used for a proper evaluation of thermal
strain capacity, and to verify mixes with lower cementitious content and less heat
of hydration for areas of high stress.
The dynamic and thermal analyses are discussed along with the
methodology adopted for thermal monitoring and control measures.
2. KEY CHARACTERISTICS OF THE RCC DAM
2.1. GENERAL LAYOUT
The Main Dam is a roller compacted concrete gravity dam with a maximum
height of 175 m and a length of about 2 km at crest elevation (645 m a.s.l.). Two
typical sections are designed:
• Overflow Section (stepped spillway)
The upstream face has a 0.14:1 (H:V) slope in the lower portion (below
elev. 575 m a.s.l.) and vertical in the upper portion. The stepped
downstream face has an average slope ranging from 0.77:1 to 0.95:1 (H:V).
• Non-Overflow Section
The upstream face has a 0.10:1 (H:V) slope in the lower portion (below
elev. 545 m a.s.l.) and vertical in the upper portion. The stepped
downstream face has an average slope of 0.77:1 (H:V).

The general layout of GER Main Dam is illustrated in Fig. 1,the key
components are listed below:
• a river diversion system, including 4 culverts for the dry season discharge
up to 2700 m3/s (December to June) and a temporary stepped spillway
located in the central part of the dam (see Fig. 2), for dam overtopping
during the wet season up to 14’700 m3/s ;
• a free-flow crest stepped spillway located on the overflow section of the
main dam which is auxiliary to the main service gated spillway, located on
a saddle area to the immediate left of the main dam;
• two steel-lined bottom outlets (6 m diameter), embedded in the dam body,
which allow the control of reservoir level and the discharge during plant
outage periods;
• thirteen penstocks (8 m diameter), embedded in the dam body. 2 penstocks
at lower elevation are dedicated to early generation during reservoir
impounding;
• two outdoor power houses located at the Main Dam toe on the right and left
riverside housing 7 Francis turbine units and 6 Francis turbine units
respectively, totalling 5’150 MW installed capacity;
• one 500 kV switchyard on right bank.
Figure 1 – GERdp hydroelectric project, Main Dam general layout plan view.
Centrale hydroélectrique du GERDp, vue en plan du barrage principal
The dam has 85 monolith blocks separated by cutting joints into the freshly
RCC after compaction. The vertical contraction joints are equipped in the upstream
zone with double waterstops and control drainage. The contraction joint spacing
along the dam axis varies from 18 to 27 m.
The joints spacing is mainly controlled by the dimensions of the concrete
structures of electro-mechanical equipment (penstocks, culverts and bottom
outlets) crossing the dam body.

Figure 2 – GERdp hydroelectric project, Main Dam temporary stepped spillway.
Centrale hydroélectrique du GERDp, déversoir en gradins temporaire du barrage principal
The dam is equipped with 5 main longitudinal galleries, every 30-40 m of
height, located close to the upstream face and sized in order to provide and
efficient drainage system aimed at mitigating and control uplift pressure.
Transversal (u/s-d/s) galleries are foreseen to allow the access from the
downstream face, seepage water monitoring and discharge and additional
drainages along weak zones encountered during foundation excavation.
2.2. RCC MIXES ZONING
Figure 3 illustrates the overflow section of the dam with the RCC mixes
zoning, including their mechanical characteristics and extent of systematic bedding
mix at lift joints.
Extensive mix designs and testing have been carried out in order to define
the specific RCC mixes for different areas of the dam as described in chapter 3
below.
Five different mixes have been used with guaranteed compressive strength
fc values ranging between 8 to 15 MPa.
CEM II-BP 32,5 N (Pozzolanic cement) is being used for the most part of
dam body (to date equal to about 8,5 Mm3).
Cement contents vary, through the cross section of the dam, from 80 to 142
kg/m3. No fly ash has been used giving the presence of pozzolan in the cement
itself. Good proportion of sound granite and weathered granite has guaranteed
enough content of fine sand in the mix in order to prevent segregation.
Specific admixture from Mapei has been used to retard the setting time and
allow hot and warm joint for the majority of the joints placed.

Figure 3 – GERDp overflow section (geometry, mechanical characteristics
zoning, extension of lift bedding mix)
Section de débordement du barrage du GERD (géométrie, caractéristiques
mécaniques, zonage, extension du « bedding mix »)
A higher cement content is used in both the upstream part of the dam, to
meet the tensile strength under extreme seismic load and permeability
requirements, and the downstream toe, for compressive strength requirements.
Mixes with low cement content are used in the central zone of the dam in
order to control the temperature rise and the consequent risk of cracking.
The overall average of cement content used, taking into account the volume
for each different zones, is about 105 kg/m3
As shown in the figure a systematic bedding mix (continuous line hatch) is
prescribed only in the upstream portion of the dam, in order to meet the
impermeability requirements at lift joints, and for the first 3 m above the foundation.
In the remaining part of the dam the bedding mix (dashed line) is prescribed
only for the warm and cold joints with maturity higher than the initial setting time of
the mixes (8-12 hours).
Lift joint maturity monitoring and cohesion results have been used to divide
different type of joint condition.
The impervious upstream face uses grout enriched RCC (GE-RCC) with a
width varying from 40 to 60 cm.
In the overflow section the downstream steps are protected by conventional
concrete with Silica Fume; a GE-RCC transition is foreseen between the concrete
and the RCC mixes.
A GERCC layer, 40 cm wide, is instead used at the downstream slope of
non-overflow section to enhance the face appearance and durability.

3. DESCRIPTION OF RCC TESTING CAMPAIGN AT GERD
The testing campaign of tensile and stress-strain analysis described in this
paper has been performed at the Grand Ethiopian Renaissance Dam (GERD)
Project during different steps of investigation.
The testing campaign for RCC included about 500 cores from different zones
of the dam body, comparing compressive and tensile strength with accompanying
stress-strain curves and modulus values for both horizontal and vertical samples
of unjointed RCC cores.
In addition to testing on site, some cores were also sent to the Mapei
laboratory in Milano, Italy, for further verification and comparison.
Results obtained have shown that tensile modulus was significantly lower
than the compressive modulus as shown in the table 1.
Table 1: Compressive and tensile modulus at GERDP (avg values)
Modules de compression et de traction au GERDp (valeurs moyennes)
Typical compressive and tensile stress-strain curves, plotted as a percent of
ultimate strength and ultimate strain for the GERD project are shown in Figures 4
and 5.
Figure 4: RCC, Typical stress-strain curves for compression at GERD
BRC, courbes typiques contraintes-déformations en compression au GERD

Figure 5: RCC, Typical stress-strain curves for tension at GERD
BRC, courbes typiques contraintes-déformations en traction au GERD
Figure 6: Direct tensile strength machine used at GERD site laboratory
Équipement d’essai de traction directe utilisé au laboratoire de chantier du
GERD
The properties of concrete for a horizontal core are typically thought to have
the same properties as for a vertical core.

However, this is not always true for RCC, especially for tensile strength. The
tests carried out at the GERD project in the site laboratory have shown a tensile
strength from the horizontal cores greater than the tensile strength from the
homologue vertical cores sampled in the same portion of RCC.
A specific investigation campaign, including about 100 adjacent companion
cores, has been made to establish the difference between properties in the
horizontal and vertical directions.
Homologues couples of cores were obtained by first sawing blocks and later
coring the blocks in the two direction of the same lift. Tests have been carried out
in each of the three main zones in the dam with cement contents of 130 to 142
kg/m3 (A), 80 to 85 kg/m3 (B), and 110 to 119 kg/m3(C) were tested.
For each zone, the tests have shown a much greater RCC tensile strength
and strain capacity in the horizontal direction compared to the vertical direction.
These results were duly considered in the thermal cracking analysis,
because thermal stresses develop mainly along horizontal directions.
On the contrary seismic analysis shows that major tensile stresses are along
vertical direction and therefore the lower value of tensile RCC strength have been
accordingly considered for structural verifications. Table 2 summarizes results
obtained.
Table 2. Correlation between vertical and horizontal properties for different zones
(mixes) at GERD
Corrélation entre paramètres horizontaux et verticaux pour différentes zones (mélanges) au GERD
The overall average horizontal tensile strength was a significant 172% greater
than the vertical tensile strength.
A close examination of the concrete, including microscopy and petrography did
not identify any issue such as trapped air or microscopic horizontal separations
under coarse aggregate particles. The overall air voids of the RCC was about 1-
2%.
It should be highlighted that while compressive tests are not particularly difficult
and can be done in every RCC project the direct tensile tests with meaningful strain
measurements require care, expertise and equipment and need to be carefully
verified. This was also the reason for the repetition of some specific tests made
also in the Mapei Laboratory in Milan after that hundreds of cores and cylinders
have been tested in Gerd site laboratory.
DTVP 1.29 Ratio V/H 1.01 Ratio V/H 0.96 Ratio V/H
DTVJ 1.27 0.95 0.76
DTHP 1.91 1.93 1.43
DTSP 1.96 1.83 1.5
Zone B
0.84
57%1.48
DT cores results in MPa
65%
Zone A Zone C
0.97
52%1.85
Direct tensile vertical parent
Direct tensile vertical joint
Direct tensile horizzontal parent
Direct tensile by splitting parent
1.25
1.93

4. THERMAL ANALYSIS AND TEMPERATURE CONTROL
Considering the RCC volume (higher than 10 Mm3) and production rates (up
to a maximum of 370’000 m3/month) of GER Main Dam, temperature control has
been one of the most important issues during construction of this project.
The main measures to control temperature rise in the dam consist in: pre-
cooling of materials (i.e. aggregates, water), utilization of cement with lower heat
of hydration, mixes with low cement content, appropriate construction schedule,
solar radiation protection by continuous curing.
The degree of pre-cooling (i.e. maximum allowable placing temperature of
RCC) is defined by accurate thermal study. Transient thermal analysis has been
conducted by finite differences software developed by Studio Pietrangeli in order
to evaluate the temperature distribution histories in the dam. SP’s in-house thermal
model considers the main parameters that influence thermal behaviour of an RCC
dam, including: time-dependent ambient conditions (fluctuation of air temperature
and solar radiation, heat transfer by convection from the external surface of RCC
lift); time variation of thermal properties of the RCC/Grout Enriched-RCC mixes
and production parameters (placing temperature, construction start, lift height and
lift placement rate).
The thermal properties of the mixes, preliminary estimated by conventional
laboratory tests, are calibrated by back analysis of the first RCC dam block partially
placed and used in the river diversion scheme. This block, measuring
approximately 130 x 14 x 20 m (40’000 m3), is on purpose equipped with 31
thermocouples.
The results of transient analysis together with the thermo-mechanical
properties and degree of restraint present in the different locations of the dam are
used to evaluate mass and surface cracking in the RCC mass and upstream face.
The non-linear behaviour and the related increased strain capacity also has
major benefit with regard to thermal stresses and the associated maximum allowed
temperature.
During the progress of dam construction, a continuous monitoring of the RCC
temperatures at GERD has been implemented, and the measures were
periodically compared with the maximum allowable temperatures deduced from
thermal studies as a function of dam zone and mechanical characteristics of the
RCC mixes.
Hundreds of thermocouples have been installed for this purpose in addition
to the basic design instrumentation, and supplemental instrumentation to be
installed for long term monitoring.
These temperature limits, together with an indication of prompt actions to be
taken in case anomalous temperatures are detected, are included in the
temperature monitoring and early warning procedure implemented during the GER
Main Dam construction.
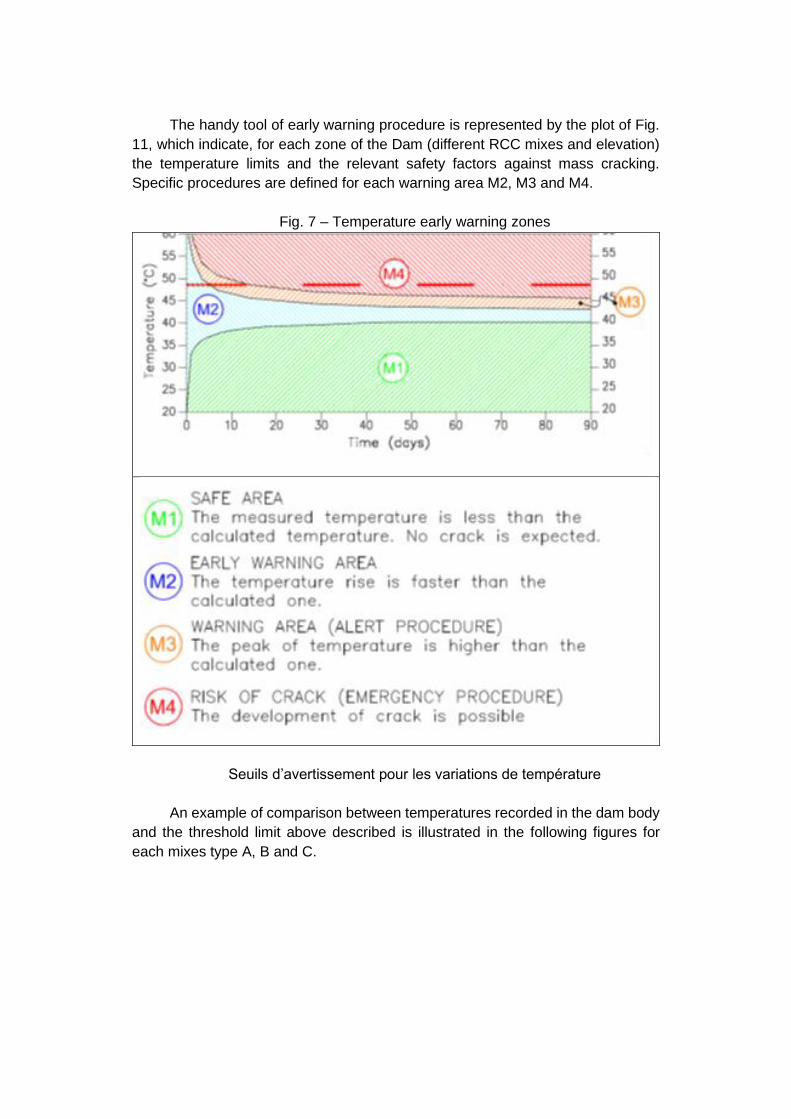
The handy tool of early warning procedure is represented by the plot of Fig.
11, which indicate, for each zone of the Dam (different RCC mixes and elevation)
the temperature limits and the relevant safety factors against mass cracking.
Specific procedures are defined for each warning area M2, M3 and M4.
Fig. 7 – Temperature early warning zones
Seuils d’avertissement pour les variations de température
An example of comparison between temperatures recorded in the dam body
and the threshold limit above described is illustrated in the following figures for
each mixes type A, B and C.

Fig. 8: Temperatures early warning graph (upstream zone A), in the zone
A1 at 0-10% of the elevation of the dam from the foundation
Diagramme de la variation de température (zone A, à l’amont), dans la
zone A1 à 0-10% de hauteur du barrage depuis la fondation
Fig. 9: Temperatures early warning graph (central zone B), at 10-20% of
the elevation of the dam from the foundation
Diagramme de la variation de température (zone B, centrale), à 10-20% de hauteur du barrage depuis la fondation

Fig. 10: Temperatures early warning graph (downstream zone C) at 20-
40% of the elevation of the dam from the foundation
Diagramme de la variation de température (zone C, à l’aval), à 20-40% de hauteur du barrage depuis la fondation
To date, with about 8.5 Mm3 of RCC placed, temperatures recorded in the
dam body are in line with calculation predictions, confirming the good match with
the values predicted by the calibrated model.
5. DYNAMIC STABILITY ANALYSIS
The stability analyses of the RCC dam were performed following an
increasing degree complexity, as usual in engineering practice.
The basic geometry of the dam was preliminarily established by a simple
Rigid Body Analysis, verifying the overturning and the sliding stability in
accordance with international standards.
At Level One Design, FEM analyses were performed to define a more
reliable and complete stress distribution within the dam body, to optimize the shape
of the dam and to outline the RCC and bedding mix zoning.
The behavior of the dam under seismic loads was evaluated by means of
Response Spectrum Analysis for the calculation of maximum expected tensile and

compressive stresses under earthquake, and by means of Equivalent Lateral
Force method for the purposes of sliding stability analysis.
The dam behavior was assumed to be essentially two-dimensional, being the
height of the dam much smaller than the length of the crest and therefore
considering the 3D effects almost negligible.
The simplified Equivalent Lateral Force Method proved to be very reliable
and it allowed to establish the final geometry of the dam, since all the investigated
2D cross sections respected the requirement that the first vibration mode
contributed as much as 80-percent or more to the total seismic response of
structure.
At the Level Two Design stage, further and more accurate analyses were
performed in order to confirm the final dimensions of the dam and to study local
effects with the most refined procedures proposed by literature.
In order to ponder the possibility of cracks propagating from the upstream
face of the dam, a Non Linear Static Analysis with gap friction elements was
performed using Straus 7 finite element code, release 2.4.6.
These are linear elements between two nodes; a gap can open and close
during the load process and it is active only when in compression. When an
element is active, it may have a stiffness contribution both in axial and lateral
directions.
The axial force is used to model the normal contact force, while the lateral
force is used to model the friction between the surfaces on which the nodes lie.
Fig. 11: FEM model theoretical crack propagation in deformed mesh, with
gap friction elements (red line)
Propagation théorique des fissures par modélisation aux éléments finis avec
maillage déformé et éléments d’interface (ligne rouge)
The calculations were performed with an iterative process supposing a crack
length and the consequent uplift distribution, checking that the computed crack
length was almost equal to the assumed value, until convergence was obtained.

This further analysis allowed to establish the optimum position of the
drainage lines: for the blocks in which a crack could be expected, the drains were
moved towards downstream in order not to let the theoretical crack propagate until
them.
Seismic behavior was evaluated by means of linear time history procedure.
This type of analysis involves the direct integration of the equations of motion and
therefore it is the most powerful method available in literature for evaluating the
response of structures to earthquakes.
The performance evaluation and the assessment of damage level was
formulated based on magnitudes of Demand-Capacity Ratios (DCR), cumulative
duration of stress excursions beyond the tensile strength of the RCC.
The dam response to the earthquake was considered to be within the linear-
elastic range of behavior with little or no possibility of damage, if the computed
stress demand-capacity ratios was less than or equal to 1.
The dam would exhibit nonlinear response in the form of cracking of the RCC
and/or opening of construction joints if the estimated stress demand-capacity ratios
exceeded 1.
Fig. 12: Time history of vertical stresses under a SEE earthquake (left) and
related graph of cumulative inelastic duration (right)
Diagramme contraintes verticales-temps sous charge sismique SEE (gauche) et période inélastique cumulatif (droit)
Given the main direction of stress due to earthquake loads, the lower values
of RCC tensile strength, corresponding to DTVJ vertical Joint Tensile strength have
been assumed.
The compressive and tensile modules have been assumed the same but
increased of 30 % for dynamic loads in accordance to recommendation of EM 110-
2-6051, and Poisson dynamic rations assumed 30% smaller than those used for
static analysis (EM 1110-2-6053).

For the cross sections considered representative of the tallest blocks of the
RCC dam, where the highest seismic amplification was achieved, Non-Linear
Analysis was performed to ensure that collapse could not occur.
On the one hand, these further dynamic analyses confirmed the reliability of
the main dimensions of the dam, decided at Level 1 Design and on the other hand,
they allowed to refine the RCC zoning.
A Final 3D FEM model was produced, also, using MIDAS GTS NX software.
It confirmed the reliability of the assumption of two-dimensional behavior of the
dam, especially under static loads, and it allowed us to study with better
approximation some aspects including the stability of the banks and the behavior
of the dam under bank to bank earthquakes.
Fig. 13: GERdp – 3D FEM of the whole dam, bank to bank accelerations under a
design earthquake
GERDp – Modélisation FEM 3D du barrage et accélérations sous charge
sismique de projet

6. CONCLUSIONS
This paper describes the results of the campaign of tests carried out at GERD
Project on the RCC mixes showing the non-linear stress-strain behavior of RCC
mixes and anisotropy of tensile strength value. These results have been used by
the designer to properly characterize the tensile strain capacity of the mixes and to
optimize the RCC zoning in the dam body.
Particularly the following main aspects have been evaluated in detail:
• Different moduli of elasticity have been used to estimate of stresses in
the structure for the different loading conditions (static, dynamic and
thermal loads);
• The correlation between tensile modulus and compressive modulus,
have been investigated and considered in the design. A lower tensile
modulus, compared with his homologue compressive modulus, has been
considered for the estimate of tensile strain capacity in the thermal
analyis;
• Higher horizontal direct tensile strength, compared with his homologue
vertical direct tensile strength has been taken into account. The
horizontal stresses resulted averagely 1,6 times greater the vertical one,
has been considered for the thermal analysis, the lower values of vertical
direct tensile strength have been considered in the dynamic analysis;
• An Early warning temperature monitoring procedure have been
implemented, based on the tensile strain capacity calculated according
to the above described results of tests, to prevent the risk of cracks which
could develop in the dam body;
• More than 1000 days of monitoring for each thermocouples, placed in
different zones of the dam, has confirmed the assumption of thermal
analysis.
• The experience carried out in GERdp has been used, from the authors,
also to optimize other projects design of RCC dam
ACKNOWLEDGEMENT
The authors wish to thank the Salini-Impregilo laboratory staff, for their huge
commitment in testing, the site project manager Mr. Riccardo Marinai and the site
production manager Mr. A. Passarani for their fully assistance. The authors want
to thank also Mapei technical and laboratory staff. Finally special thanks must be
addressed to Ernest Schrader and Mauro Giovagnoli for their continuous support
and help during every phase of design and evaluation of test results.

REFERENCES
[1] SCHRADER, E. K. AND RASHED, A, 2002, benefits of non-linear stress-
strain properties and membranes for RCC dams, proceedings of the
international conference on roller compacted concrete dam construction in
the middle east, jordan university of science and technology, irbid, jordan,
pp.331-344.
[2] SCHRADER, E.,1999, Design, construction, and performance of Burton
Gorge Dam, hydropower & dams, issue one, pp 63-71.
[3] SCHRADER, E. 1995, strain, cracking, and failure described by an ultimate
modulus, proceedings of 2nd canmet/aci international symposium on
advances in concrete technology, Las Vegas, pp 27-43.
[4] C. ROSSINI, E. SCHRADER, 2013, “GIBE III dam: project summary,
mixes, properties, thermal issues and cores”, water storage & hydropower
development for africa.
[5] PIETRANGELI, G., BEZZI, A., ROSSINI, C., MASCIOTTA, A., D’ALBERTI
D., (2017). Design of Gram Ethiopian Renaissance RCC Main Dam (H =
175m). Water Storage & Hydropower development for Africa.
[6] GIOVAGNOLI, M., MASTROFINI, P., SACCONE, R., and SCHRADER, E.,
March, 2018, RCC tensile strength and non-linear stress strain behaviour
at gerdp ethiopia. how a better knowledge of tensile strength may help in
better design of rcc dams, hydropower&dam 2018 conference, danang,
vietnam, aqua-media international, wallington, surrey, uk.
[7] SCHRADER E., MASTROFINI P., LE NGOC H., SACCONE R., September
2018, Correct tensile vs compressive modulus & stress-strain of concrete
horizzontal vs vertical fast vs slow conventional vs rcc . third international
dam world conference. Iguazu, Brazil
7. SUMMARY AND KEYWORDS

The Grand Ethiopian Renaissance Dam (GERD) Project is located along the
Blue Nile (Abbai) almost at Ethiopian-Sudanese border, a few kilometres upstream
of Roseires Dam in Sudan and 700 km NE of Addis Ababa, in the Benishangul –
Gumaz region.
The plant, with its 5’150 MW of installed power and 15.7 TWh of annual
energy production, is one the most important projects in the Ethiopian
Government’s commitment to meet the country’s present and future power
requirement, once completed GERD will feature the largest dam in Africa.
The whole project includes a roller compacted concrete (RCC) Main Dam
(175 m high, 10.2 Mm3 of RCC volume) and a concrete faced rockfill (CFRD)
Saddle Dam (65 m high, 5 km long, 15 Mm3 of embankment volume). The 5,150
MW installed power will be generated by 13 Francis turbines in two outdoor power-
houses located at the Main Dam toe on the right and left riverside
The Project is being implemented by the Ethiopian Electric Power company
(EEP), Webuild S.p.A (ex Salini-Impregilo) is the EPC Contractor and Studio
Pietrangeli the Designer.
The GERDp Main Dam is a roller compacted concrete gravity dam with a
maximum height of 175 m and a length of about 2 km at crest elevation (645 m
a.s.l.).
Extensive mix designs and testing have been carried out in order to define
the specific RCC mixes for different areas of the dam as described in paragraph 3
below.
Five different mixes have been used with guaranteed compressive strength
fc values ranging between 8 to 15 MPa. Cement contents vary, through the cross
section of the dam, from 80 to 142 kg/m3.
A higher cement content is used in both the upstream part of the dam, to
meet the tensile strength under extreme seismic load and permeability
requirements, and the downstream toe, for compressive strength requirements.
Mixes with low cement content are used in the central zone of the dam in order to
control the temperature rise and the consequent risk of cracking.
The testing campaign for RCC carried at the GERDp site laboratory, included
about 500 cores from different zones of the dam body, comparing compressive
and tensile strength with accompanying stress-strain curves and modulus values
for both horizontal and vertical samples of unjointed RCC cores.
Results obtained have shown that tensile modulus was significantly lower
than the compressive modulus.
Furthermore, the tests have shown a tensile strength from the horizontal
cores greater than the tensile strength from the homologue vertical cores sampled
in the same portion of RCC.
These results were duly considered in the thermal cracking analysis,
because thermal stresses develop mainly along horizontal directions. On the
contrary seismic analysis shows that major tensile stresses are along vertical

direction and therefore the lower value of tensile RCC strength have been
accordingly considered for structural verifications .
It is noted that the above results are particularly meaningful, because the direct
tensile tests, differently from the compressive tests, require significant care,
expertise and suitable equipment, therefore are seldom performed in a large
number at dam’s construction sites.
These results of the extensive test campaign carried at the GERDp site have
been used by the designer to properly characterize the tensile strain capacity of
the mixes and to optimize the RCC zoning in the dam body, as follows:
• Different moduli of elasticity have been used to estimate of stresses in
the structure for the different loading conditions (static, dynamic and
thermal loads);
• The lower tensile modulus, compared with his homologue compressive
modulus, has been considered for the estimate of tensile strain capacity
in the thermal aanalyis;
• The higher horizontal direct tensile strength, compared with his homologue vertical direct tensile strength has been as well taken into account for the thermal analysis;
• The lower values of vertical direct tensile strength, compared with the homologue horizontal values, have been considered for the dynamic analysis;
Finally, an advanced early warning temperature monitoring procedure have been implemented, based on the tensile strain capacity calculated according to the above described results of tests, to prevent the risk of cracks which could develop in the dam body. More than 1000 days of monitoring for each thermocouples, placed in different zones of the dam, has confirmed the assumption of thermal analysis.

RESUME ET MOTS CLES
Le projet du Grand Ethiopian Renaissance Dam (GERD) se situe le long du
Nil Bleu (Abbai) à proximité de la frontière entre l’Ethiopie et le Soudan, à quelques
kilomètres à l’amont du Barrage de Roseires au Soudan et à 700 km au nord-est
d’Addis Abeba, dans la région de Benishangul – Gumaz.
Avec ses 5.150 MW de puissance installée et sa production annuelle
d’énergie de 15,7 TWh, cette centrale hydroélectrique représente un des projets
les plus importants du Gouvernement de l’Ethiopie pour faire face aux besoins
d’énergie présents et futurs du pays. Une fois la construction terminée, le projet
GERD inclura le barrage le plus grand d’Afrique.
Dans sa globalité, le projet comprend un barrage principal en béton
compacté au rouleau (BCR) de 175 m d’hauteur et 10,2 Mm3 de volume et un
barrage de col en enrochement avec noyau bitumineux protégé par des dalles en
béton (hauteur du barrage 65 m, longueur 5 km, volume 15 Mm3). La puissance
de 5,150 MW sera générée par 13 turbines type Francis placées dans deux
centrales électriques à l’aval du barrage principal en rive droite et en rive gauche
du cours d’eau.
La maitrise d’ouvrage est assurée par la société Ethiopian Electric Power
(EEP) qui a mandaté l’entreprise Webuild S.p.A. (anciennement Salini-Impregilo)
pour la construction des ouvrages. Le projet est réalisé par Studio Pietrangeli.
Une conception pointue du béton et une campagne d’investigation poussée
ont été mises en œuvre afin de définir les mélanges de BCR pour les différentes
parties du barrage comme décrit dans le chapitre 3 ci-dessous.
Cinq différents mélanges ont été utilisés avec une résistance à la
compression fc comprise entre 8 et 15 MPa. Pour une coupe type du barrage, la
teneur en ciment varie entre 80 et 142 kg/m3.
Une teneur en ciment plus élevée est employée dans la partie amont du
barrage, afin de respecter les exigences de perméabilité et de résistance à la
traction vis-à-vis de charges sismiques extrêmes, et pour le socle aval, pour des
exigences de résistance à la compression.
Des mélanges de BCR avec une faible teneur en ciment sont utilisés dans
la partie centrale du barrage afin de limiter l’augmentation de la température et le
risque de fissuration.
La campagne d’essai du BCR réalisée au laboratoire de chantier du GERDp
a vu l’exécution d’environ 500 carottages à différents endroits du barrage afin
d’apprécier la résistance à la compression et à la traction directe ainsi que les
courbes contraintes-déformations et les modules d’élasticité d’échantillons de BCR
sans joints prélevés en direction horizontale et verticale.
Les résultats obtenus ont montré que le module de traction était
considérablement plus faible que le module de compression.

De plus, les essais ont montré que pour une même portion de BCR, la
résistance à la traction des échantillons prélevés en direction horizontale était plus
élevée que celle en direction verticale.
Ces résultats ont été pris en compte dans l’analyse thermique de la
fissuration du béton car les contraintes thermiques se développent principalement
selon des directions horizontales. Au contraire, l’analyse sismique a mis en
évidence que les contraintes de traction les plus importantes se développent en
direction verticale et donc des valeurs plus faibles de résistance du BCR ont été
considérées dans le calcul.
Il est ainsi souligné que les résultats décrits ci-dessus sont très importants
et nécessitent des précautions, une expertise et un équipement spécifique qui
doivent être mis en place pour l’exécution d’essais de traction directe. C’est pour
ces raisons que ce type d’essai n’est que très rarement exécuté en si grande
quantité dans des chantiers de construction de barrages.
Les résultats de la campagne d’essai réalisée au GERDp ont été utilisés par
le concepteur afin d’étudier la capacité de déformation sous charge de traction de
différents mélanges de BCR et pour optimiser le zonage du corps du barrage
comme suit :
Des différents modules d’élasticité ont été utilisés pour analyser les
contraintes dans l’ouvrage correspondant à plusieurs combinaisons de
chargement (statiques, dynamiques et thermiques) ;
Dans l’analyse thermique, un module de traction réduit, par rapport à son
homologue en compression, a été utilisé pour estimer la capacité de déformation
en traction ;
Une résistance à la traction en direction horizontale plus élevée qu’en
direction verticale a été considérée dans l’analyse thermique ;
Dans l’analyse dynamique, une valeur plus faible de résistance à la traction
en direction verticale a été utilisée.
Finalement, afin d’éviter le risque de fissuration du béton, une surveillance
de la variation de température et une procédure d’alarme ont été mises en œuvre
à partir des phases initiales de la construction en se basant sur le calcul de la
capacité de déformation en traction déterminée grâce aux résultats de la
campagne d’essai.
A présent, plus de 1000 jours de surveillance de chaque thermocouple placé
à différents endroits dans le barrage ont confirmé les conclusions de l’analyse
thermique.

Keywords
RCC dams, RCC mix design, Tensile Stress-strain behaviour, tensile strain
capacity, Dam thermal analysis, dam stability dynamic analysis.
Mots clés
Barrages en BRC, Conception de mélanges de BRC, Réponse contraintes-
déformations en traction, Analyse thermique de barrages, Analyse dynamique de
barrages.
.