Changes in granule cells of the ferret olfactory bulb associated with imprinting on prey odours

A Motion-sensitive Area in FerretExtrastriate Visual Cortex: an Analysis inPigmented and Albino Animals
R. Philipp, C. Distler and K.-P. Hoffmann
Allgemeine Zoologie und Neurobiologie, Ruhr-Universitaet
Bochum, Postfach 102148, D-44780 Bochum, Germany
In search of the neuronal substrate for motion analysis in the ferret(Mustela putorius furo), we extracellularly recorded from extra-striate visual cortex in five pigmented and two albino ferrets undergeneral anaesthesia and paralysis. Visual stimulation consisted oflarge area random dot patterns moving either on a circular path inthe frontoparallel plane or expanding and contracting radially.Strongly direction-selective neurons were recorded in a circum-scribed area in and just posterior to the suprasylvian sulcus, thusnamed by us the posterior suprasylvian area (area PSS). Altogether,we recorded 210 (90%) and 95 (72%) PSS neurons in pigmented andalbino ferrets, respectively, that were direction selective. In theseneurons responses during random dot pattern stimulation in thepreferred direction were at least twice as strong than stimulation inthe non-preferred direction. Response strength in preferred directionand tuning sharpness of PSS neurons in albinos were significantlyreduced when compared to pigmented animals (median values: 34.1versus 14.8 spikes/s and 142 versus 165� for pigmented and albinoferrets, respectively). Inter-spike-intervals during visual stimulationwere significantly shorter in pigmented (median 9ms) than in albinoPSS neurons (median 14ms). Our data indicate that area PSS mayplay a crucial role in motion perception in the ferret.
Keywords: albinism, direction selectivity, extrastriate visual cortex,ferret, radial motion sensitivity
Introduction
Perception of moving objects in the external world is crucial for
normal orienting in everyday life. If motion perception is
reduced due to pathological processes patients are severely
impaired (e.g. Zeki, 1991). Also in other higher mammals such
as cats and primates cortical areas have been identified that are
highly sensitive to moving stimuli, and lesions of these areas lead
to distinct deficits in perception and oculomotor behaviour. In
the cat, the posteromedial lateral suprasylvian area (PMLS) is
characterized by a high proportion of direction-selective
neurons, two-thirds of which also respond to optical flow
patterns (e.g. Spear and Baumann, 1975; Strong et al., 1984;
Rauschecker et al., 1987; Tusa et al., 1989; Toyama et al., 1994;
Li et al., 2000; Brosseau-Lachaine et al., 2001). In monkeys,
superior temporal areas MT and MST have been directly linked
to motion perception and oculomotor behaviour (e.g. Maunsell
and Van Essen, 1983; Newsome et al., 1985; Mikami et al., 1986;
Duersteler and Wurtz, 1988; Komatsu and Wurtz, 1988; Albright
1989; Lagae et al., 1993, 1994), and human correlates to these
areas have been identified in functional magnetic resonance
imaging (fMRI) studies (e.g. Zeki et al., 1991; Nakamura et al.,
2003; Orban et al., 2003). Due to these common properties
areas PMLS and the middle temporal area (MT) and the middle
superior temporal area (MST) have been proposed to represent
at least analogous if not homologous areas (Payne, 1993; Dreher
et al., 1996).
In a series of experiments, Innocenti and colleagues recently
described the location and the retinotopy of various visual
cortical areas in the occipital, parietal and temporal lobe of the
ferret (Mustela putorius furo) (Innocenti et al., 2002; Manger
et al., 2002a,b, 2004). A motion-sensitive area comparable to
PMLS and MT/MST, however, initially mentioned by Sherk
(1988) has yet to be analysed in detail in the ferret’s visual
cortex.
Why study ferret visual cortex? Beside the suitability of the
ferret for developmental studies due to its birth at a comparably
early gestational age the ferret has the advantage that its visual
system closely resembles the cat and that albinotic strains are
easy to come by. Oculocutaneous albinism leads to various
severe abnormalities in the visual system. Recently, we found
that the optokinetic reaction is severely impaired in albino
ferrets due to a loss of direction selectivity in the key
visuomotor structure for this reflex, the nucleus of the optic
tract and dorsal terminal nucleus of the accessory optic system
(NOT--DTN) (Hoffmann et al., 2004). In addition, behavioural
investigations indicate that motion perception is reduced in
albino ferrets (Hupfeld and Hoffmann, 2005).
In the present study we localized a motion-sensitive area in
the ferret visual cortex. By comparing the response properties
of cortical motion-sensitive neurons in pigmented and albino
ferrets we tried to judge to which extent cortical physiology
may contribute to the loss of direction selectivity in the NOT--
DTN and to the behavioural deficits observed in albino ferrets.
The data are discussed in relation to the evolution of neocortical
function and organization in mammals.
Materials and Methods
AnimalsAll experiments were approved by the local authorities (Regierungs-
prasidium Arnsberg) and were carried out in accordance with the
Deutsche Tierschutzgesetz of 12 April 2001, the European Communi-
ties Council Directive of 24 November 1986 (S6 609 EEC) and NIH
guidelines for care and use of animals for experimental procedures. The
electrophysiological experiments were performed on five pigmented
and two albino ferrets of both sexes, 1--2 years old. All animals were bred
and raised in the animal facility of the Department of General Zoology
and Neurobiology, Ruhr-University Bochum and were group-housed in
an enriched environment with access to an outdoor enclosure.
SurgeryAnimals were initially treated with 0.05 mg atropine sulphate (Braun)
and anaesthetized with 20 mg/kg ketamine and 2 mg/kg xylazine
(Rompun�) i.m. Then they were intubated through the mouth, and an
i.v. catheter was introduced into the forearm vein. After additional local
� The Author 2005. Published by Oxford University Press. All rights reserved.
For permissions, please e-mail: [email protected]
Cerebral Cortex June 2006;16:779--790
doi:10.1093/cercor/bhj022
Advance Access publication August 31, 2005

anaesthesia with bupivacain hydrochloride the animals were placed in
a stereotaxic frame and artificially ventilated with air and 0.2--0.6%
halothane as needed throughout the entire experiment. Pupils were
dilated with atropine sulfate and corneae were protected with contact
lenses. The skin overlying the skull was cut, the temporalis muscle
deflected and a craniotomy was performed allowing access to the
extrastriate visual cortex. In addition, a head post was implanted. During
the experiment, the animal was held with this head post. During the
entire procedure heart rate, endtidal CO2 and body temperature were
monitored and maintained at physiological levels. During the record-
ings, animals were paralysed with alcuronium chloride (Alloferin �). The
depth of anaesthesia was controlled based on the ongoing heart rate and
cardiac reaction to tactile or acoustic stimuli. After completion of the
recording session, the wound was closed in appropriate layers and
covered with antibiotic ointment (Nebacetin�). After full recovery the
animals were returned to their home enclosure and treated with
analgetics (Carprofen, 2.5 mg/kg, Rimadyl �) for 2 days and broadband
antibiotics (enrofloxacin, Baytril�) for one week after surgery. Electro-
physiological recordings were repeated 3--5 times with 2--3 weeks
recovery in between. We chose this procedure because the quality of
recordings during longterm acute experiments declined with time.
With repeated shorter recordings (12--13 h duration during the chronic
experiments and up to 48 h during terminal experiments), the quality
and the amount of data recorded from individual animals dramatically
increased. This procedure was well tolerated by the ferrets as shown by
their normal feeding and play behaviour.
ElectrophysiologyElectrophysiological recordings in extrastriate visual cortex were per-
formed with tungsten in glass microelectrodes using standard proce-
dures. The electrode was angled ~40� from medial to lateral in the
coronal plane to achieve penetrations parallel to the cortical layers.
Histological reconstruction of the recording sites implies that data were
collected from all cortical layers. Neuronal activity was conventionally
amplified, passed through a window discriminator and stored for offline
analysis.
Visual StimulationThe two visual stimuli used consisted of large area random dot patterns
(43� horizontal, 39� vertical extent; dot size was 1� at a mean inter-
dot distance of 4.5�; contrast was 0.975; dots: 65 cd/m2; background:
0.8 cd/m2) for appropriate ‘full field’ stimulation. These two patterns
moved either on a circular path (6234ms per cycle) in the frontoparallel
plane or were expanding/contracting radially (7333 ms per cycle with
the stimulus moving for 1634 ms in each direction; stimulus pre-
sentation was interrupted by two phases where dots first appeared on
a black screen and paused for several milliseconds before they started to
expand or contract). In addition, the neuronal activity was measured
during a 5000 ms presentation of the stationary stimulus. To exclude
transient activity after appearance of the pattern dots were visible for
several seconds before starting the recording.
In order to determine a neuron’s preferred direction for movement in
the frontoparallel plane, the center of the random dot pattern followed
a circular path 24.5� in radius (continuous mapping of directional
selectivity; see also e.g. Schoppmann and Hoffmann, 1976). Thus, all
random dots have the same direction and speed (tangential speed was
typically 21.5�/s) at a given moment. In this paradigm the speed of the
stimulus is constant throughout a stimulus trial (cycle), but stimulus
direction changes continuously (0--360�) within a complete stimulus
cycle. This stimulus is not sensitive to receptive field size. On the other
hand, depending on the receptive field size and the radius of the circular
pathway a given dot was visible only during a given period of its own
pathway. This kind of stimulation is different from traditional mapping
procedures to determine a neuron’s preferred direction (PD), where
responses to several (typically four or eight) unidirectional pattern
movements are compared. Experiments in a number of species and
areas, i.e. rat and cat pretectum, cat visual cortex, monkey pretectal
nuclei (NOT/DTN) and monkey visual cortical areas MT, MST and VIP
have shown that directional tunings obtained using the continuous
mapping procedure are equivalent to the tunings obtained by unidirec-
tional pattern movements (Schoppmann and Hoffmann, 1976; Hoffmann
and Schoppmann, 1981; Bauer et al., 1989; Hoffmann and Distler, 1989;
Schmidt et al., 1998, Bremmer et al., 1997, 2002).
For each data point (obtained during circular path and expansion/
contraction stimulation), the neuronal activity was sampled over 10
trials which were looped continuously. All data were collected at
a stimulus velocity of 21.5�/s after qualitative tests had ensured that this
velocity lies well in the range of stimulus speeds effective to drive the
neurons under investigation. The visual stimuli were projected onto
a semicircular screen (angular extent was ±90�) 143cm in front of the
animal via a beamer (ProScan 4750, Philips).
We did not measure the receptive field location and extent of all
neurons recorded quantitatively. Instead we determined the receptive
field’s position and boundaries by screening the visual field with a small
(B: ~0.5--8�) light spot using a handheld lamp. This ensured that we
adjusted our stimuli to be centered on the receptive field and that the
complete receptive field was covered by the large area random dot
patterns.
The visual stimuli were viewed binocularly with unaligned eyes.
Furthermore, because of technical problems, we could not determine
where the center of gaze was for each eye.
Quantitative AnalysisPreferred directions of visual stimulus motion were determined utilizing
the weighted average method. Each spike time was assigned a vector
corresponding to the stimulus direction at this time corrected by the
neuron’s response latency. In other words: a response at time t = x ms
was related to a stimulus direction at t = (x – latency) ms. Unless
otherwise determined, this latency was set to a fixed value of t = 100 ms,
i.e. the assumed average response latency for a sample of 305 neurons
(210 and 95 direction-selective neurons for pigmented and albino
ferrets, respectively). Even if this value of t = 100 ms was not the
neuron’s ‘correct’ latency, this estimate of preferred direction is
comparable to other measurements (e.g. testing four or eight different
directions). This is for the following reason: assume that the response
latency of a neuron was 150 ms rather than 100 ms. In such case,
the estimate of this neuron’s PD would have to be corrected for
the directional difference corresponding to this latency difference,
i.e. (150 – 100) ms = 50 ms. Given that the whole stimulus trial lasted
T = 6200 ms, the resulting error in determining the PD would have been
(50/6200) 3 360� = 2.9�. This error in estimating the PD (Dangle < 3.0�)is an order of magnitude smaller than the error in determining a neuron’s
PD when testing with patterns moving linearly in typically four or eight
different directions.
We wanted to determine whether or not the responses for PD
stimulation were significantly different from responses for a stimulus
moving into the non-preferred direction (NPD). Given the nature of the
stimulus (direction changes continuously throughout a trial) we had to
find a reasonable trade-off between the width of the response window
being small enough to represent the response for PD (NPD) stimulation
and being large enough to allow for a reliable statistical testing. We
therefore decided for test windows being t = 620 ms wide, correspond-
ing to a directional window of A = (620/6200) 3 360� = 36�. This analysiswindow was centered in the temporal domain on two points corre-
sponding to the cell’s PD and NPD. In other words, we determined
in a trial by trial analysis responses for stimulus directions [(PD – 18�) –
(PD + 18�)] and [(NPD – 18�) – (NPD + 18�)], respectively. These data
sets then were tested for significant differences with a distribution free
Mann--Whitney rank test.
A direction selectivity index (DS) was calculated to quantify the
neuronal responses as follows: DS = PD – NPD/PD + NPD, with PD being
the neuronal activity during stimulation in the preferred direction, and
NPD the activity during stimulus movement in the non-preferred
direction. In case of expansion/contraction stimuli, PD was taken as
activity during expansion, NPD as activity during contraction of stimulus
movement. Neurons were defined as direction selective if DS> 0.33 for
random dot patterns moving on a circular path or expanding radially,
and DS< –0.33 (PD 100% larger than NPD) for contracting dot patterns.
Wilcoxon signed rank and Mann--Whitney rank sum tests were used for
statistical analysis.
780 A Motion-sensitive Area in Ferret Visual Cortex d Philipp et al.

HistologyAfter completion of the electrophysiological experiments the animals
were sacrificed with an overdose of pentobarbital and perfused trans-
cardially with 0.9% saline and 4% paraformaldehyde. Frontal sections
were cut at 50 lm on a cryostat and stained for Nissl, myeloarchitecture
(Gallyas, 1979, as modified by Hess and Merker, 1983) and cytochrome
C histochemistry (Wong-Riley, 1979). Extrastriate recording sites were
reconstructed based on microlesions, the penetration scheme and the
depth reading of the electrode microdrive.
Results
Recording Sites
In search of direction-selective areas in ferret visual cortex we
first mapped visual areas 17, 18, 19 and 21 according to the
retinotopic organization of these areas described in the litera-
ture (Innocenti et al., 2002; Manger et al., 2002a). By the same
procedure we found an area which in contrast to the more
posterior visual areas responded verywell tomoving randomdot
patterns mostly in a direction-selective way. As such response
properties were not prominent in more posterior recording
sites, i.e. in area 18, 19 or 21wewere able to distinguish this area
by the high incidence of motion and direction-selective neu-
rons. Moving the recording electrode another 1--2 mm further
anterior we would regularly record acoustic responses. There-
fore, in later experiments acoustic responses served as vantage
point to quickly localize the direction-selective area. The data
presented in this studywere collected in a region in and up to ~1mm posterior to the suprasylvian sulcus (SS) and 5.5--7 mm
lateral to the midline. Thus, the newly described area is
positioned between the posterior parietal cortex PPc (Manger
et al., 2002b) and the recently described areas 20b and PS
(Manger et al., 2004) in the mediolateral axis, and between the
auditory cortex and area 21 in the anterior--posterior axis
(Wallace et al., 1997; Innocenti et al., 2002). Figure 1B
summarizes the position of recording sites marked by micro-
lesions of all animals used in the present study in a reconstruc-
tion of the lateral view of the left cortical hemisphere.
Approximate areal borders of areas 17, 18, 19 and 21 averaged
from all animals are indicated by dashed lines, and the location of
areas PPc, 20b and PS are taken from the literature (Manger et al.,
2002b, 2004). Note that recording sites of direction-selective
neurons in the depth of the posterior bank of the sulcus are
projected on the surface of the brain and thus can come to lie
anterior to the suprasylvian sulcus in the reconstruction.
Lesions marking recording sites of direction-selective neu-
rons were always located in a densely myelinated region
Figure 1. (A) Digital photomontage of a frontal section through ferret area PSS, parietal cortex PPc and temporal cortex stained for myeloarchitecture. Arrows point to themyeloarchitectonic borders of area PSS. Area PSS is characterized by dense myelination in all cortical layers. By contrast, in area PPc supragranular layers are less myelinated, deeplayers are rich in horizontal fibres. Temporal cortex is readily distinguished from PSS by its weak myelination especially in supragranular layers. L, microlesion at the recording site ofdirection-selective neurons. (B) Composite reconstruction of the ferret left cortical hemisphere showing the area studied in the present investigation in six animals (four pigmentedand two albino). Filled dots mark the projection of recording sites of direction-selective neurons onto the cortical surface, open circles mark recording sites of auditory responses.The vertical line indicates the anterior-posterior level of the frontal section shown in (A). ls, lateral sulcus; ps, pseudosylvian sulcus; rf, rhinal fissure; ss, suprasylvian sulcus. Scalebars represent 1 mm for (A), 2 mm for (B).
Cerebral Cortex June 2006, V 16 N 6 781

(Fig. 1A). Even though the lateral part of the posterior parietal
cortex (PPc) (Fig. 1A) appears densely myelinated as well it
could be readily distinguished from area PSS by the following
criteria: first, in area PSS the dense myelination also includes the
uppermost layers which are somewhat paler in PPc; secondly,
PPc displays more horizontal fibres in deep cortical layers than
area PSS (Fig. 1A). The lateral sulcus is always less myelinated
than PP or area PSS. As this could be a consequence of the
compression of cortical layers in the depth of the sulcus, we do
not assume that theremay be an additional area located between
PSS and PPc. The distinction of area PSS from more lateral
cortical areas was even easier because this region is unequivo-
cally characterized by a very weak myelination especially in the
upper cortical layers. Four of the brains were also stained for
cytochrome C histochemistry. In three of the four cases area PSS
was distinguishable from more medial and more lateral areas by
the darker staining of the supragranular layers and the especially
weak staining of the infragranular layers. These criteria were
used to delineate area PSS from the surrounding cortex in the
frontal sections shown in Figure 2. Myeloarchitectural borders
are marked by arrows in Figures 1A and 2. All lesions marking
recording sites of direction-selective neurons were located in
the denselymyelinated area just described andwere thus used as
the main criterion for characterizing area PSS. The myeloarch-
itecture around the lesion sites was extrapolated to indicate the
borders of the whole area. At this time we do not have enough
anatomical tract tracing data to verify the exact borders of area
PSS and to exclude possible influences of cortical gross anatomy
as curvature of the gyri and sulci on our myelin borders.
All neurons considered in our further quantitative analysis
were recorded from this area PSS. The transition from medial
areas to area PSS was marked by the sudden appearance of
neurons with clearly direction-selective responses to moving
random dot stimuli. In most cases, direction-selective cells were
clustered (filled dots in Fig. 2). Non-selective visual (open
triangles) neurons that did not respond to our random dot
stimulus or a Julesz pattern and motion selective cells that
reacted to moving dots in a non-direction-selective manner
(open circles) were encountered less frequently in this region.
Altogether, 217 direction-selective, 36 motion-sensitive and 16
non-selective visual cells were recorded in PSS of the pigment-
ed ferrets and 95 direction-selective, 45 motion-sensitive and
5 non-selective visual cells were recorded in the albinos. Thus,
81 and 65.5% of the PSS neurons were direction selective in
the pigmented and albino ferrets, respectively. The following
results of our study are related only to cells which showed any
modulation in their activity to our random dot stimulus and
could thus be analysed quantitatively.
Preferred Directions in PSS Neurons duringFrontoparallel Stimulus Movement
Of 235 neurons in the pigmented and 132 neurons in the albino
ferrets for which we succeeded to compile average response
time histograms with a random dot pattern moving along
Figure 2. Drawings of frontal sections with microlesions marking recording sites of direction-selective neurons are shown on the left of each panel, the inset is enlarged on the rightside of each panel. The enlargements show reconstructions of penetration tracks with filled dots marking recording sites of direction-selective neurons, open circles marking motion-sensitive neurons, and open triangles marking unspecific visual neurons. Microlesions are indicated by dashed areas. Arrows point to myeloarchitectonic borders. (A--D) Pigmentedanimals; (E, F) albinos. Scale bars represent 1 mm.
782 A Motion-sensitive Area in Ferret Visual Cortex d Philipp et al.
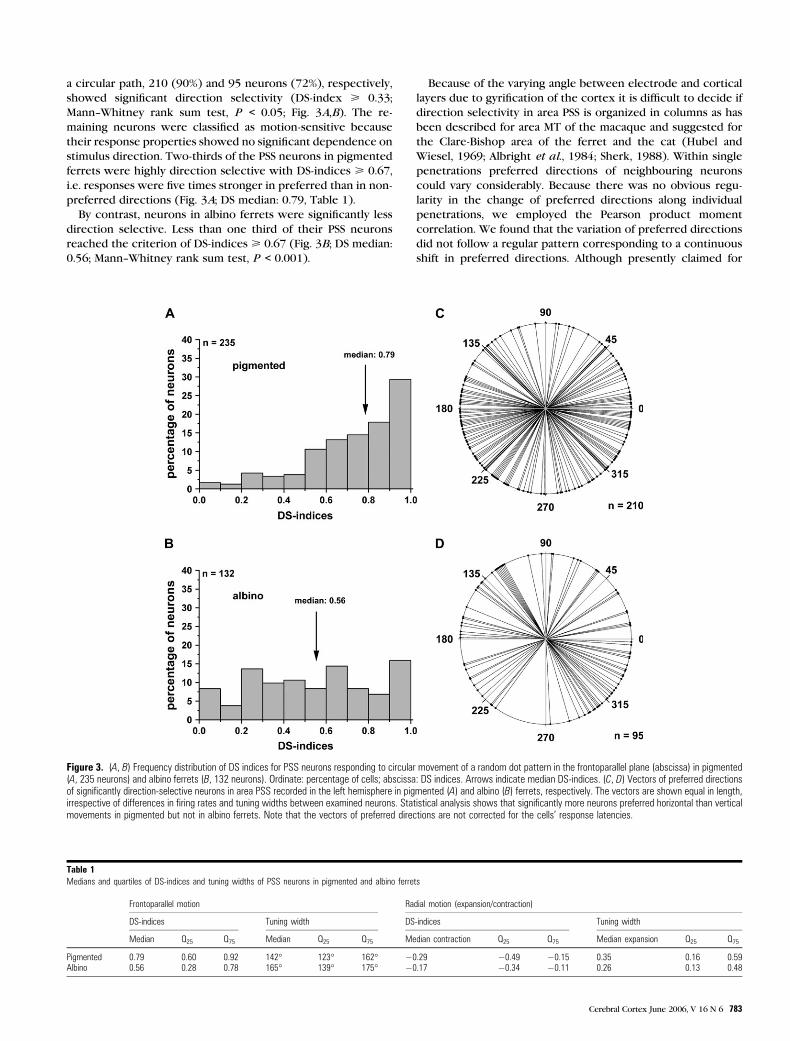
a circular path, 210 (90%) and 95 neurons (72%), respectively,
showed significant direction selectivity (DS-index > 0.33;
Mann--Whitney rank sum test, P < 0.05; Fig. 3A,B). The re-
maining neurons were classified as motion-sensitive because
their response properties showed no significant dependence on
stimulus direction. Two-thirds of the PSS neurons in pigmented
ferrets were highly direction selective with DS-indices > 0.67,
i.e. responses were five times stronger in preferred than in non-
preferred directions (Fig. 3A; DS median: 0.79, Table 1).
By contrast, neurons in albino ferrets were significantly less
direction selective. Less than one third of their PSS neurons
reached the criterion of DS-indices > 0.67 (Fig. 3B; DS median:
0.56; Mann--Whitney rank sum test, P < 0.001).
Because of the varying angle between electrode and cortical
layers due to gyrification of the cortex it is difficult to decide if
direction selectivity in area PSS is organized in columns as has
been described for area MT of the macaque and suggested for
the Clare-Bishop area of the ferret and the cat (Hubel and
Wiesel, 1969; Albright et al., 1984; Sherk, 1988). Within single
penetrations preferred directions of neighbouring neurons
could vary considerably. Because there was no obvious regu-
larity in the change of preferred directions along individual
penetrations, we employed the Pearson product moment
correlation. We found that the variation of preferred directions
did not follow a regular pattern corresponding to a continuous
shift in preferred directions. Although presently claimed for
Table 1Medians and quartiles of DS-indices and tuning widths of PSS neurons in pigmented and albino ferrets
Frontoparallel motion Radial motion (expansion/contraction)
DS-indices Tuning width DS-indices Tuning width
Median Q25 Q75 Median Q25 Q75 Median contraction Q25 Q75 Median expansion Q25 Q75
Pigmented 0.79 0.60 0.92 142� 123� 162� �0.29 �0.49 �0.15 0.35 0.16 0.59Albino 0.56 0.28 0.78 165� 139� 175� �0.17 �0.34 �0.11 0.26 0.13 0.48
Figure 3. (A, B) Frequency distribution of DS indices for PSS neurons responding to circular movement of a random dot pattern in the frontoparallel plane (abscissa) in pigmented(A, 235 neurons) and albino ferrets (B, 132 neurons). Ordinate: percentage of cells; abscissa: DS indices. Arrows indicate median DS-indices. (C, D) Vectors of preferred directionsof significantly direction-selective neurons in area PSS recorded in the left hemisphere in pigmented (A) and albino (B) ferrets, respectively. The vectors are shown equal in length,irrespective of differences in firing rates and tuning widths between examined neurons. Statistical analysis shows that significantly more neurons preferred horizontal than verticalmovements in pigmented but not in albino ferrets. Note that the vectors of preferred directions are not corrected for the cells’ response latencies.
Cerebral Cortex June 2006, V 16 N 6 783

the ferret (Sherk, 1988) and documented for cat and monkey
movement-sensitive areas, our data do not support the notion of
a systematically mapped columnar organization of direction
selectivity in ferret PSS. They do not exclude, however, in-
dividual directional columns perpendicular to the layers in PSS.
There was no obvious difference in the demarkation of
receptive fields between pigmented and albino animals. Our
sample of cortical neurons includes central as well as peripheral
receptive field locations in the entire contralateral visual hemi-
field. In a qualitative analysis we were unable to detect any
correlation between receptive field location and medio-lateral
location of neurons in the brain. Likewise, we did not find any
correlation between receptive field eccentricity and direction
selectivity or preferred direction.
Figure 3C,D demonstrates the vectors of preferred directions
of all neurons whose response to stimulus movement in the
preferred direction differed significantly from the response to
movement in the non-preferred direction (Mann--Whitney rank
sum test, P < 0.05). To investigate if certain directions were
more strongly represented than others we divided the polar
plots in four 90� sectors (contraversive: 315� to 45�; up: 45� to135�; ipsiversive: 135� to 225�; down: 225� to 315�). A statistical
analysis showed a tendency that the preferred directions of
neurons in area PSS were not equally distributed (Kolmogorov--
Smirnov, P = 0.001). In pigmented ferrets, more neurons
coded for horizontal than for vertical stimulus movement
(v2-test, P < 0.0001). A preference for ipsiversive or contra-
versive stimulus movement did not exist (v2-test, P > 0.05). In
albino ferrets, a preference for horizontal stimulus movement
or an ipsiversive--contraversive asymmetry was not evident
(v2-test, P > 0.05).
Directional Tuning of Neurons in Area PSS
We determined the tuning width of direction-selective neurons
as the range of directions that elicited a more than half maximal
response (Fig. 4A,B). The tuning width was significantly
narrower in pigmented than in albino PSS neurons (pigmented:
median bandwidth: 142�, n = 206; albino: median bandwidth:
165�, n = 95; Table1). This difference was statistically significant
(Mann--Whitney rank sum test, P < 0.001). Thus, individual
albino PSS neurons respond to a broader range of directions
than cells in pigmented ferret. This, together with the lower
direction selectivity index found in PSS neurons, documents the
degradation of direction selectivity in albino ferrets.
Quantitative Analysis of Visual Responsiveness toStimuli Moving on a Circular Path
To investigate the cause for the lower direction selectivity in
albino ferrets we plotted response strength to PD stimulation
versus response to NPD stimulation on log scales (Fig. 5A).
Activity during PD stimulation was significantly higher in
pigmented (filled circles) than in albino ferrets (open circles)
(pigmented: median 34.1 spikes/s, albino: median 14.8 spikes/s;
Mann--Whitney rank sum test, P < 0.001). Furthermore, the
range of response strength to PD stimulation was wider in
pigmented than in albino ferrets where data points cluster
below 30 spikes/s. Figure 5A again illustrates the weaker
direction selectivity in albino ferrets indicated by the clustering
of albino data points close to the unity slope.
The ongoing activity was measured in 203 neurons of
pigmented and in 120 neurons of albino ferrets while the
animals watched a stationary random dot pattern (Fig. 5B,C).
Cell activity was sampled after onset of stimulus presentation
(see methods). The median of this activity was not significantly
different between the two groups of animals (5.0 and 3.9
spikes/s, respectively; Mann--Whitney rank sum test, P = 0.073).
In Figure 5 we plot the response to PD stimulation (filled circles
in Fig. 5B,C) and to NPD stimulation (open circles in Fig. 5B,C)
versus ongoing activity on log scales. In a high proportion of
neurons in pigmented ferrets (71 cells out of 203 cells in our
population) the activity during NPD was suppressed to 50% of
the ongoing activity (Fig. 5B). This suppression was not as
marked in albinos (27 cells out of 120 cells; Fig. 5C). This
difference in the proportion of suppressed cells between albino
and pigmented animals was significant (P < 0.02, v2-test). Theabove analysis indicates that the reduction in direction selec-
tivity in albino compared to pigmented ferrets results at least
from two factors, a lower response to stimulation in the
preferred direction and a less frequent suppression of activity
during stimulation in the non-preferred direction.
Responses to Radially Expanding or Contracting Stimuli
The location and extent of the receptive fields was mapped
qualitatively using a handheld lamp before centering the focus of
expansion and contraction of our stimulus in the center of the
receptive field to ensure balanced whole field stimulation.
Altogether, 186 neurons in pigmented and 114 neurons in
albino ferrets were tested with the radially expanding or
Figure 4. Frequency distribution of directional tuning widths of PSS neurons inpigmented (A) and albino ferrets (B). Ordinate: percentage of cells; abscissa: tuningwidth (�).
784 A Motion-sensitive Area in Ferret Visual Cortex d Philipp et al.
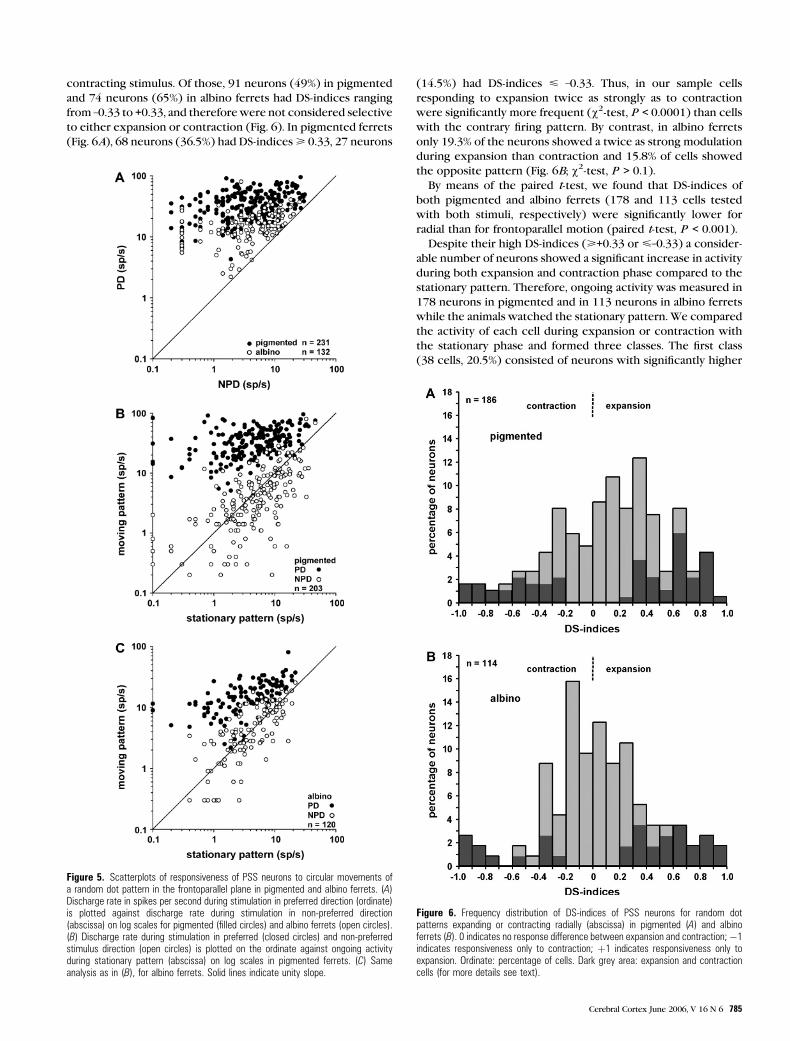
contracting stimulus. Of those, 91 neurons (49%) in pigmented
and 74 neurons (65%) in albino ferrets had DS-indices ranging
from –0.33 to +0.33, and therefore were not considered selective
to either expansion or contraction (Fig. 6). In pigmented ferrets
(Fig. 6A), 68 neurons (36.5%) had DS-indices> 0.33, 27 neurons
(14.5%) had DS-indices < –0.33. Thus, in our sample cells
responding to expansion twice as strongly as to contraction
were significantly more frequent (v2-test, P < 0.0001) than cells
with the contrary firing pattern. By contrast, in albino ferrets
only 19.3% of the neurons showed a twice as strong modulation
during expansion than contraction and 15.8% of cells showed
the opposite pattern (Fig. 6B; v2-test, P > 0.1).
By means of the paired t-test, we found that DS-indices of
both pigmented and albino ferrets (178 and 113 cells tested
with both stimuli, respectively) were significantly lower for
radial than for frontoparallel motion (paired t-test, P < 0.001).
Despite their high DS-indices (>+0.33 or <–0.33) a consider-
able number of neurons showed a significant increase in activity
during both expansion and contraction phase compared to the
stationary pattern. Therefore, ongoing activity was measured in
178 neurons in pigmented and in 113 neurons in albino ferrets
while the animals watched the stationary pattern. We compared
the activity of each cell during expansion or contraction with
the stationary phase and formed three classes. The first class
(38 cells, 20.5%) consisted of neurons with significantly higher
Figure 6. Frequency distribution of DS-indices of PSS neurons for random dotpatterns expanding or contracting radially (abscissa) in pigmented (A) and albinoferrets (B). 0 indicates no response difference between expansion and contraction;�1indicates responsiveness only to contraction; þ1 indicates responsiveness only toexpansion. Ordinate: percentage of cells. Dark grey area: expansion and contractioncells (for more details see text).
Figure 5. Scatterplots of responsiveness of PSS neurons to circular movements ofa random dot pattern in the frontoparallel plane in pigmented and albino ferrets. (A)Discharge rate in spikes per second during stimulation in preferred direction (ordinate)is plotted against discharge rate during stimulation in non-preferred direction(abscissa) on log scales for pigmented (filled circles) and albino ferrets (open circles).(B) Discharge rate during stimulation in preferred (closed circles) and non-preferredstimulus direction (open circles) is plotted on the ordinate against ongoing activityduring stationary pattern (abscissa) on log scales in pigmented ferrets. (C) Sameanalysis as in (B), for albino ferrets. Solid lines indicate unity slope.
Cerebral Cortex June 2006, V 16 N 6 785

activity during expansion than contraction (t-test, P < 0.01). In
addition the expansion activity was significantly higher than the
activity during stationary pattern presentation (t-test, P < 0.01).
The second class (24 cells, 12.9%) showed higher activity during
contraction in the same way. In the following and to simplify the
matter, we refer to these neurons as expansion and contraction
cells, respectively (marked in dark grey in Fig. 6). All other
neurons were described as not significantly modulated because
their responses did not differ significantly from ongoing activity
(based on t-test, third class). In albino ferrets 22 (19.5%) and 11
(9.7%) neurons were classified as expansion and contraction
cells, respectively. There was no statistically significant differ-
ence between the proportion of expansion and contraction
cells in pigmented or in albino ferrets (v2-test, P > 0.05).
In order to compare the response strengths of the entire
populations in pigmented and albino ferrets also the cells with
no significant difference between expansion and contraction
activity were included in the analysis presented in Figure 7.
Altogether 186 neurons in pigmented and 114 neurons in albino
ferrets were analysed.
Neuronal activity during expansion is plotted versus activity
during contraction on log scales for pigmented (Fig. 7A) and
albino (Fig. 7B) ferrets. Filled circles indicate expansion
neurons (activity during expansion was significantly higher
than during contraction and stationary phase; t-test, P < 0.01)
and open circles indicate contraction neurons (activity during
contraction was significantly higher than during expansion
and stationary phase; t-test, P < 0.01). All other neurons were
classified as not significantly modulated (open triangles).
Comparing response strength between pigmented and albino
ferrets we found that stimulus driven activity in both expansion
and contraction cells was significantly higher in pigmented than
in albino ferrets (Mann--Whitney rank sum test, P < 0.001).
Within each animal group, expansion cells did not differ from
contraction cells (Mann--Whitney rank sum test, P > 0.05).
Temporal Structure of Neuronal Responses
In addition to the response strength measured as mean rate, we
analysed the temporal structure of the neuronal responses.
Because there was no difference between the response char-
acteristics to frontoparallel and radial motion data were pooled.
Assuming a gaussian distribution of inter-spike intervals, values
of 200 ms for ongoing activity and 30--60 ms for stimulus-driven
activity should be expected for pigmented and albino animals
according to the discharge rates presented above. Figure 8
demonstrates the inter-spike interval histograms during moving
(Fig. 8A,C) and stationary pattern presentation (Fig. 8B,D)
in pigmented (Fig. 8A,B) and albino (Fig. 8C,D) PSS neurons.
In pigmented ferrets, responses to moving stimuli were
characterized by significantly shorter inter-spike intervals than
responses to stationary patterns (moving: median 9 ms; station-
ary: median 13 ms; Mann--Whitney rank sum test, P < 0.001).
This difference in the albino PSS neurons did not reach
significance (moving: median 14 ms; stationary: median 19 ms;
Mann--Whitney rank sum test, P = 0.107). Altogether, inter-spike
intervals were significantly shorter in pigmented than in albino
PSS neurons corresponding to the mean rate measurements
above (Mann--Whitney rank sum test, P < 0.001 for motion
responses, P = 0.005 for stationary pattern responses). Never-
theless, the inter-spike intervals indicate for pigmented as well
as albino animals that most of the action potentials are fired in
groups or bursts and no qualitative difference exists in this
respect between the discharge patterns of pigmented and
albino ferrets.
Discussion
Characterization of Area PSS
In this study we identify a hitherto not clearly described area in
the ferret extrastriate cortex that is characterized by large
receptive fields, clear responses to random dot patterns, and
a high incidence of direction-selective neurons. Area PSS is
located in the posterior part of the suprasylvian sulcus and on its
posterior bank bordering the parietal cortex medially, areas 20b
and PS laterally, auditory cortex anteriorly and area 21 posteri-
orly. Area PSS is characterized by dense myelination and can
thus be distinguished from the parietal cortex medially and the
temporal cortex laterally. Unfortunately, based on this criterion
alone, the anatomical distinction of area PSS from auditory area
ME (Wallace et al., 1997) and area 21 (Innocenti et al., 2002) is
far less clear than, for example, the distinction of macaque area
MT from the surrounding cortex. As pointed out before, we
cannot wholly exclude the possibility that our myelin borders
Figure 7. Scatterplots of responsiveness of PSS neurons to a random dot patternexpanding or contracting radially in pigmented and albino ferrets. (A) Discharge rate (inspikes per second, ordinate) during expansion is plotted against discharge rate duringcontraction of the dot pattern (abscissa) on log scales for pigmented ferrets. Filledcircles indicate expansion neurons and open circles indicate contraction neurons (seetext for more details). All other neurons were classified as not significantly modulated(open triangles). (B) Same analysis (with the same conventions) as in (A), for albinoferrets. Solid lines indicate unity slope.
786 A Motion-sensitive Area in Ferret Visual Cortex d Philipp et al.

may have been confounded by gross cortical anatomy. However,
by extrapolating the myeloarchitecture around lesions at re-
cording sites of direction-selective cells we have a good esti-
mate of the extent of this area. In our opinion, the combination
of physiological characterization of response properties with
anatomical criteria is much more valid than anatomical criteria
by themselves.
The most characteristic response property of PSS neurons is
their direction-selective response to moving dot patterns. In
addition to motion sensitivity in the frontal plane, PSS neurons
are sensitive to radial stimulus movements (expansion/contrac-
tion). We found significantly higher DS-indices for stimulation in
the frontal plane than for radial stimulus movements. It could
not be excluded that this difference was due to the neuron’s
reduced response strength to the preferred direction caused by
the remaining dots moving in non-preferred directions. Further
investigations will show whether this sensitivity to expanding/
contracting stimuli is a prerequisite for a optic flow analysis in
the visual system of the ferret. Data from the literature (Gibber
et al., 2001; Usrey et al., 2003) and preliminary data from our
laboratory indicate a significantly higher incidence of direction-
selective neurons in area PSS as a distinguishing feature when
compared with areas 17, 18, 19 and 21.
Direction Anisotropy
Our data reveal that in PSS of pigmented ferrets horizontal
directions are more strongly represented and that upward
directions are underrepresented. Directional anisotropies have
also been described in other mammals and visual areas (Bauer
et al., 1989; Paolini and Sereno, 1998). In cat area PMLS a large
proportion of neurons prefers centrifugal stimulus directions
(Rauschecker et al., 1987; Weyand and Gafka, 2001; but see also
Sherk et al., 1995). A similar finding was described for the
peripheral field representation of macaque area MT (Albright,
1989) but not for MT in general.
Due to the varying angle between electrode track and cortical
layers, it is difficult to decide if direction preference is indeed
organized in cortical columns in ferret PSS as has been de-
scribed for ferret Clare-Bishop area (Sherk, 1988), ferret area 17
(Gibber et al., 2001) and macaque area MT (Albright et al., 1984;
Liu and Newsome, 2003), and indicated for cat area PMLS
(Rauschecker et al., 1987; Sherk, 1988). Optical recordings
from ferret area 17 indicate a systematic representation of
direction preferences consisting of a mosaic-like map (Weliky
et al., 1996). Unfortunately, this method has not been applied to
area PSS so far to clarify the discrepancy between our data
showing no systematic topographic arrangement of preferred
directions and the claim by Sherk (1988) of such an arrange-
ment in this area.
Comparison with other Species
There is ample evidence that area PMLS of the cat is involved in
3D motion analysis (Toyama and Kozasa, 1982; Toyama et al.,
1985, 1986a,b; Akase et al., 1998). This area is characterized
Figure 8. Frequency distribution of inter-spike intervals (ISI) (abscissa, in ms) of PSS neurons during moving (A, C) and stationary (B, D) patterns in pigmented (A, B) and albino (C,D) ferrets. Because there was no difference between the ISIs during frontoparallel and radial motion, data were pooled. Ordinate shows the relative number of cells in percent. Forpigmented ferrets we found significantly shorter ISIs during moving stimuli than during the stationary pattern (moving: median 9 ms; stationary: median 13 ms, P\0.001). This wasnot the case in the albino PSS neurons (moving: median 14 ms; stationary: median 19 ms, P 5 0.107).
Cerebral Cortex June 2006, V 16 N 6 787

by a high proportion of direction-selective neurons many of
which prefer high stimulus velocities. PMLS neurons are only
moderately orientation selective and most respond to random
dot patterns (Rauschecker et al., 1987; Toyama et al., 1994;
Dreher et al., 1996; Li et al., 2000; Brosseau-Lachaine et al.,
2001). Two-thirds of the PMLS neurons are sensitive for
contraction or expansion, and about half of this population
reacts direction selectively (Kim et al., 1997; Mulligan et al.,
1997; Li et al., 2000; Brosseau-Lachaine et al., 2001). Evidence
that PMLS is involved in motion analysis comes also from
behavioural studies (Pasternak et al., 1989; Krueger et al.,
1993; Lomber et al., 1994, 1996; Rudolph and Pasternak, 1996;
Sherk and Fowler, 2002).
Area MT of the macaque monkey is thought to be homolo-
gous to area PMLS of cat (Payne, 1993). It is characterized by
a large population of direction-selective neurons (76--88%) (e.g.
Maunsell and Van Essen, 1983; Albright et al., 1984; Mikami
et al., 1986; Tanaka et al., 1986). Neighbouring area MST also
contains many direction-selective neurons that have larger
receptive fields and also respond well to large area random
dot patterns (e.g. Desimone and Ungerleider, 1986; Saito et al.,
1986; Tanaka et al., 1986; Komatsu andWurtz, 1988). Both areas
also respond to optic flow patterns (Saito et al., 1986; Lagae
et al., 1994) and specificity for various flow patterns is more
pronounced in MST that in MT (Lagae et al., 1994).
Comparing our results on area PSS in the ferret with data for
area PMLS of the cat or area MT/MST of macaque monkey, it is
clear that area PSS with its high amount of direction-selective
cells and its responsiveness to expanding and contracting
stimuli, with its mostly large receptive fields and a preference
for higher stimulus velocities qualifies for an area specialized in
the analysis of visual motion. Thus, we propose that area PSS is at
least analogous if not homologous to area PMLS of the cat or
area MT/MST of the macaque.
Deficits in Neurons of Albino Area PSS
Why study visual cortical neurons in albinos? The albino
mutation leads, probably via a lack of dihydroxyphenylalanine
in the retina, to a cascade of spatiotemporal perturbations of
retinal maturation and by that to the well known misprojections
to retinorecipient visual centers (Jeffery, 1997). These mispro-
jections, i.e. the abnormal amount of crossing retinofugal fibres,
in turn lead to alterations in the cortical representation of the
visual field. as has been demonstrated in albino ferrets (Akerman
et al., 2003) and Siamese cats (Shatz, 1977; Chino et al., 1984). It
is only logical to assume that beside the retinotopical organiza-
tion also physiological properties may be influenced by the
albino mutation.
Indeed, we found fewer direction-selective neurons in albino
ferret PSS which, in addition, were significantly less direction
selective than neurons in pigmented ferrets. In pigmented
ferrets, significantly more neurons coded for horizontal than
for vertical stimulus movements. This was not the case in
albinos. Also the tuning width was significantly wider in albino
than in pigmented PSS neurons. An additional effect in pig-
mented ferrets was the prevalence of suppression of neuronal
activity below the activity during stationary stimuli if PSS
neurons were stimulated in non-preferred directions. A similar
suppression of activity during stimulation in non-preferred
directions has also been described for retinal slip cells in the
NOT--DTN of pigmented ferrets and other mammals (Hoffmann
et al., 2004). In albino ferrets this suppression was not as
evident. All these facts — response to a broader range of
directions, lower response strength to stimulation in the
preferred direction and a missing suppression of activity
during stimulation in the non-preferred direction in albino PSS
neurons — point to less effective inhibitory mechanisms which
could contribute to the lower direction selectivity in albino
ferrets. The moderate though significant degradation of di-
rection selectivity in cortical area PSS as a probable source of
input to the NOT--DTN certainly cannot explain the total loss of
direction selectivity in this subcortical relay of visual informa-
tion to the optokinetic system in albino ferrets (Hoffmann et al.,
2004). Altered inhibitory mechanisms as the cause for degrada-
tion or even loss of direction selectivity are currently in-
vestigated in our laboratory. So far we found a significant
decrease in the amplitude of IPSCs in pyramidal cells in slices
of visual cortex in albino rats in comparison to pigmented rats
(Barmashenko et al., 2005). This clearly shows that the albino
central visual system is not only altered anatomically but also at
the cellular and molecular level with severe influences on
physiology and behaviour.
Position of Area PSS in the Cortical Hierarchy
In a series of experiments, Manger and colleagues recently
undertook the identification of visual cortical areas in the ferret
based on the retinotopic visual field representation and on
callosal connections (Innocenti et al., 2002; Manger et al.,
2002a,b, 2004). They conclude that the classical parcellation of
primate visual cortex in a dorsal (‘Where’) and a ventral (‘What’)
stream (Ungerleider and Mishkin, 1982) is not a de novo
development in primates but can also be found in such
carnivores as the cat (Lomber et al., 1996) and the ferret.
They argue that ferret area 21 may correspond to macaque area
V4, that ferret posterior parietal areas PPc and PPr correspond to
primate parietal cortex. Furthermore, area 20a of cat and ferret
supposedly corresponds to macaque area TF, area 20b corre-
sponds to TH and area PS corresponds to TG (Payne, 1993;
Manger et al., 2004). A further, not yet clearly identified, visual
area, SSY, medial to PS and anterior to area 21, is thought to
correspond to areas DLS and VLS of the cat and areas TEO and
TE of the macaque, thus also belonging to the ventral processing
stream.
The area indicated by Manger and colleagues seems to at least
partly overlap with our area PSS. In our study, we did not put
particular emphasis on the retinotopic order in area PSS. Rather,
we concentrated on the neuronal responses to specific visual
stimuli and found that in contrast to the posterior visual areas
17, 18, 19 and 21 area PSS is characterized by a high proportion
of neurons with large receptive fields strongly responding to
moving random dot stimuli. Based on our physiological data,
area PSS in this respect clearly resembles area PMLS of the cat
and areas MT/MST of the macaque and thus should be
considered part of the dorsal processing stream.
Notes
We thank H. Korbmacher and S. Kramer for expert technical assistance,
F. Bremmer and P. Knipschild for creating the analysing software, and
F. Bremmer for helpful comments on this manuscript. This study
was supported by DFG grant Sonderforschungsbereich 509/A11.
Address correspondence to Prof. K.-P. Hoffmann, Allgemeine Zoologie
undNeurobiologie, Ruhr-Universitat Bochum, Postfach102148,D-44780
Bochum, Germany. Email [email protected].
788 A Motion-sensitive Area in Ferret Visual Cortex d Philipp et al.

References
Akase E, Inokawa H, Toyama K (1998) Neuronal responsiveness to
three-dimensional motion in cat posteromedial lateral suprasylvian
cortex. Exp Brain Res 122:214--226.
Akerman CJ, Tolhurst DJ, Morgan JE, Baker GE, Thompson ID (2003)
The relay of visual information to the lateral geniculate nucleus and
the visual cortex in albino ferrets. J Comp Neurol 461:217--235.
Albright TD (1989) Centrifugal directional bias in the middle temporal
area (MT) of the macaque. Vis Neurosci 2:177--188.
Albright TD, Desimone R, Gross CG (1984) Columnar organization of
directionally selective cells in visual area MT of the macaque.
J Neurophysiol 51:16--31.
Barmashenko G, Schmidt M, Hoffmann K-P (2005) Differences between
cation-chloride cotransporters NKCC1 and KCC2 function in the
visual cortex of pigmented and albino rats. Eur J Neurosci
21:1189--1195.
Bauer R, Hoffmann K-P, Huber HP, Mayr M (1989) Different anisotropies
of movement direction in upper and lower layers of the cat’s area 18
and their implications for global optic flow processing. Exp Brain Res
74:395--401.
Bremmer F, Ilg UJ, Thiele A, Distler C, Hoffmann K-P (1997) Eye position
effects in monkey cortex. I. Visual and pursuit related activity in
extrastriate areas MT and MST. J Neurophysiol 77:944--961.
Bremmer F, Duhamel JR, Ben Hamed S, Graf W (2002) Heading encoding
in the macaque ventral intraparietal area (VIP). Eur J Neurosci
16:1554--1568.
Brosseau-Lachaine O, Faubert J, Casanova C (2001) Functional sub-
regions for optic flow processing in the posteromedial lateral
suprasylvian cortex of the cat. Cereb Cortex 11:989--1001.
Chino YM, Shansky, MS, Jankowski WL (1984) Spatial frequency tuning
and contrast threshold of striate neurons in Siamese cats. Exp Brain
Res 56: 227:234.
DeAngelis GC, Newsome WT (1999) Organization of disparity-selective
neurons in macaque area MT. J Neurosci 19:1398--1415.
Desimone R, Ungerleider LG (1986) Multiple visual areas in the caudal
superior temporal sulcus of the macaque. J Comp Neurol
248:164--189.
Dreher B, Wang C, Turlejski KJ, Djavadian RL Burke W (1996) Areas
PMLS and 21a of cat visual cortex: two functionally distinct areas.
Cereb Cortex 6:585--599.
Duersteler MR, Wurtz RH (1988) Pursuit and optokinetic deficits
following chemical lesions of cortical areas MT and MST. J Neuro-
physiol 60:940--65.
Gallyas F (1979) Silver staining of myelin by means of physical
development. Neurol Res 1:203--209.
Gibber M, Chen B, Roerig B (2001) Direction selectivity of excitatory
and inhibitory neurons in ferret visual cortex. Neuroreport
12:2293--2296.
Hess DT, Merker BH (1983) Technical modifications of Gallyas’ silver
stain for myelin. J Neurosci Methods 8:95--97.
Hoffmann K-P, Schoppmann A (1981) A quantitative analysis of the
direction-specific response of neurons in the cat’s nucleus of the
optic tract. Exp Brain Res 42:146--157.
Hoffmann K-P, Distler C (1989) Quantitative analysis of visual receptive
fields of neurons in nucleus of the optic tract and dorsal terminal
nucleus of the accessory optic tract in macaque monkey. J Neuro-
physiol 62:416--28.
Hoffmann K-P, Garipis N, Distler C (2004) Optokinetic deficits in albino
ferrets (Mustela putorius furo): a behavioral and electrophysiolog-
ical study. J Neurosci 24:4061--4069.
Hubel DH, Wiesel TN (1969) Visual area of the lateral suprasylvian gyrus
(Clare-Bishop area) of the cat. J Physiol 202:251--60.
Hupfeld D, Hoffmann K-P (2005) Visual motion perception in albinotic
and pigmented ferrets (Mustela putorius f. furo). Neuroforum 1
(Suppl) :182A.
Innocenti GM, Manger PR, Masiello I, Colin I, Tettoni L (2002)
Architecture and callosal connections of visual areas 17, 18, 19 and
21 in the ferret (Mustela putorius). Cereb Cortex 12:411--422.
Jeffery G (1997) The albino retina:an abnormality that provides insight
into normal retinal development. Trends Neurosci 20:165--169.
Kim J-N, Mulligan K, Sherk H (1997) Simulated optic flow and
extrastriate cortex. I. Optic flow versus texture. J Neurophysiol
77:554--561.
Komatsu H, Wurtz RH (1988) Relation of cortical areas MT and MST to
pursuit eye movements. I. Localization and visual properties of
neurons. J Neurophysiol 60:580--603.
Krueger K, Kiefer W, Groh A, Dinse HR, von SeelenW (1993) The role of
the lateral suprasylvian visual cortex of the cat in object-background
interactions: permanent deficits following lesions. Exp Brain Res
97:40--60.
Lagae L, Raiguel S, Orban GA (1993) Speed and direction selectivity of
macaque middle temporal neurons. J Neurophysiol 69:19--39.
Lagae L, Maes H, Raiguel S, Xiao DK, Orban GA (1994) Response of
macaque STS neurons to optic flow components: a comparison of
areas MT and MST. J Neurophysiol 71:1597--1626.
Li B, Li BW, Chen Y, Wang LH, Diao YC (2000) Response properties of
PMLS and PLLS neurons to simulated optic flow patterns. Eur J
Neurosci 12:1534--1544.
Liu J, Newsome WT (2003) Functional organization of speed tuned
neurons in visual area MT. J Neurophysiol 89:246--256.
Lomber SG, Cornwell P, Sun JS, MacNeil MA, Payne BR (1994) Reversible
inactivation of visual processing operations in middle suprasylvian
cortex of the behaving cat. Proc Natl Acad Sci USA 91:2999--3003.
Lomber SG, Payne BR, Cornwell P, Long KD (1996) Perceptual and
cognitive visual functions of parietal and temporal cortices in the cat.
Cereb Cortex 6:673--695.
Manger PR, Kiper D, Masiello I, Murillo L, Tettoni L, Hunyadi Z, Innocenti
GM (2002a) The representation of the visual field in three
extrastriate areas of the ferret (Mustela putorius) and the relation-
ship of retinotopy and field boundaries to callosal connectivity.
Cereb Cortex 12:423--437.
Manger PR, Masiello I, Innocenti GM (2002b) Areal organization of the
posterior parietal cortex of the ferret (Mustela putorius). Cereb
Cortex 12:1280--1297.
Manger PR, Nakamura1 H, Valentiniene S, Innocenti GM (2004) Visual
areas in the lateral temporal cortex of the ferret (Mustela putorius).
Cereb Cortex 14:676--689.
Maunsell JH, Van Essen DC (1983) Functional properties of neurons
in middle temporal visual area of the macaque monkey. I. Selectivity
for stimulus direction, speed, and orientation. J Neurophysiol
49:1127--47.
Mikami A, Newsome WT, Wurtz RH (1986) Motion selectivity in
macaque visual cortex. I. Mechanisms of direction and speed
selectivity in extrastriate area MT. J Neurophysiol 55:1308--27.
Mulligan K, Kim JN, Sherk H (1997) Simulated optic flow and
extrastriate cortex. II. Responses to bar versus large-field stimuli.
J Neurophysiol 77:562--570.
Nakamura H, Kashii S, Nagamine T, Matsui Y, Hashimoto T, Honda Y,
Shibasaki H (2003) Human V5 demonstrated by magnetoencepha-
lography using random dot kinematograms of different coherence
levels. Neurosci Res 46:423--433.
Newsome WT, Wurtz RH, Duersteler MR, Mikami A (1985) Deficits in
visual motion processing following ibotenic acid lesions of the
middle temporal visual area of the macaque monkey. J Neurosci
5:825--840.
Orban GA, Fize D, Peuskens H, Denys K, Nelissen K, Sunaert S, Todd J,
Vanduffel W (2003) Similarities and differences in motion processing
between the human and macaque brain: evidence from fMRI.
Neuropsychologia 41:1757--1768.
Paolini M, Sereno MI (1998) Direction selectivity in the middle lateral
and lateral (ML and L) visual areas in the California ground squirrel.
Cereb Cortex 8:362--371.
Pasternak T, Horn, KM, Maunsell JHR (1989) Deficits in speed
discrimination following lesions of the lateral suprasylvian cortex
in the cat. Vis Neurosci 3:365--375.
Payne BR (1993) Evidence for visual cortical area homologs in cat and
macaque monkey. Cereb Cortex 3:1--25.
Rauschecker JP, von Grunau MW, Poulin C (1987) Centrifugal organi-
zation of direction preferences in the cat’s lateral suprasylvian visual
cortex and its relation to flow field processing. J Neurosci 7:943--958.
Cerebral Cortex June 2006, V 16 N 6 789

Rudolph KK, Pasternak T (1996) Lesions in cat lateral suprasylvian
cortex affect the perception of complex motion. Cereb Cortex
6:814--822.
Saito H, Yukie M, Tanaka K, Hikosaka K, Fukada Y, Iwai E (1986)
Integration of direction signals of image motion in the superior
temporal sulcus of the macaque monkey. J Neurosci 6:145--157.
Schmidt M, van der Togt C, Wahle P, Hoffmann KP (1998) Character-
ization of a directional selective inhibitory input from the medial
terminal nucleus to the pretectal nuclear complex in the rat. Eur J
Neurosci 10:1533--1543.
Schoppmann A, Hoffmann K-P (1976) Continuous mapping of direction
selectivity in the cat’s visual cortex. Neurosci Lett 2:177--181.
Shatz C (1977) A comparison of visual pathways in Boston and
Midwestern Siamese cats. J Comp Neurol 171:205--228.
SherkH (1988) Retinotopic order and functional organization in a region
of suprasylvian visual cortex, the Clare-Bishop area. In: Progress in
brain research, vol. 75. Vision within extrageniculostriate systems
(Hicks TP, Benedek G, eds), pp. 237--244. Amsterdam: Elsevier
Science Publishers BV.
Sherk H, Kim JN, Mulligan K (1995) Are the preferred directions of
neurons in cat extrastriate cortex related to optic flow? Vis Neurosci
12:887--894.
Sherk H, Fowler GA (2002) Lesions of extrastriate cortex and con-
sequences for visual guidance during locomotion. Exp Brain Res
144:159--171.
Spear PD, Baumann TP (1975) Receptive field characteristics of single
neurons in lateral suprasylvian visual area of the cat. J Neurophysiol
38:1403--1420.
Strong NP, Malach R, Lee P, Van Sluyters RC (1984) Horizontal
optokinetic nystagmus in the cat: recovery from cortical lesions.
Brain Res 315:179--192.
Tanaka K, Hikosaka K, Saito H, Yukie M, Fukada Y, Iwai E (1986) Analysis
of local and wide-field movements in the superior temporal visual
areas of the macaque monkey. J Neurosci 6:134--144.
Toyama K, Kozasa T (1982) Responses of Clare-Bishop neurones to
three dimensional movement of a light stimulus. Vision Res
22:571--574.
Toyama K, Komatsu Y, Kasai H, Fujii K, Umetani K (1985) Responsive-
ness of Clare-Bishop neurons to visual cues associated with motion
of a visual stimulus in three-dimensional space. Vision Res
25:407--414.
Toyama K, Komatsu Y, Kozasa T (1986a) The responsiveness of Clare-
Bishop neurons to motion cues for motion stereopsis. Neurosci Res
4:83--109.
Toyama K, Fujii K, Kasai S, Maeda K. (1986b) The responsiveness of
Clare-Bishop neurons to size cues for motion stereopsis. Neurosci
Res 4:110--128.
Toyama K, Mizobe K, Akase E, Kaihara T (1994) Neuronal responsive-
ness in areas 19 and 21a, and the posteromedial lateral suprasylvian
cortex of the cat. Exp Brain Res 99:289--301.
Tusa RJ, Demer JL, Herdman SJ (1989) Cortical areas involved in OKN
and VOR in cats: cortical lesions. J Neurosci 9:1163--1178.
Ungerleider LG, Mishkin M (1982) Two cortical visual systems In:
Analysis of visual behaviour (Ingle DJ, Goodale MA, Mansfield RJW,
eds), pp 549--586. Cambridge, MA: MIT Press.
Usrey WM, Sceniak MP, Chapman B (2003) Receptive fields and
response properties of neurons in layer 4 of ferret visual cortex.
J Neurophysiol 89:1003--1015.
Wallace MN, Roeda D, Harper MS (1997) Deoxyglucose uptake in the
ferret auditory cortex. Exp Brain Res 117:488--500.
Weliky M, Bosking WH, Fitzpatrick D (1996) A systematic map of
direction preference in primary visual cortex. Nature 379:725--728.
Weyand TG, Gafka AC (2001) Visuomotor properties of corticotectal
cells in area 17 and posteromedial lateral suprasylvian (PMLS) cortex
of the cat. Vis Neurosci 18:77--91.
Wong-Riley M (1979) Changes in the visual system of monocularly
sutured or enucleated cats demonstrable with cytochrome oxidase
histochemistry. Brain Res 171:11--28.
Zeki S (1991) Cerebral akinetopsia (visual motion blindness). A review.
Brain 114:811--824.
Zeki S, Watson JD, Lueck CJ, Friston KJ, Kennard C, Frackowiak RS
(1991) A direct demonstration of functional specialization in human
visual cortex. J Neurosci 11:641--649.
790 A Motion-sensitive Area in Ferret Visual Cortex d Philipp et al.
Copyright © 2022 FDOKUMEN