Genetic Studies in Naturally Pigmented Cotton-Fillip for Organic Textile
241
Transcript of Genetic Studies in Naturally Pigmented Cotton-Fillip for Organic Textile


PREFACE AND ACKNOWLEDGEMENT Cotton (Gossypium spp.) is an important fiber yielding cash crop with a
unique spinnable cellulosic textile fiber with about 95 per cent cellulose. Cotton inthe form of cloth suffices one of the basic necessities of the human population. India has a prominent place in the global cotton scenario owing to its largestcotton growing area (11.7 million hectares) and second largest cotton producingcountry (33.4 million bales) after china (44.53 million bales) accounting to 21percent of world’s produce as per the year 2013 statistics.
Worldwide cotton of commerce is white; cotton with lint color other thanwhite is commonly referred as naturally colored cotton. Lint in naturally coloredcotton available in brown, chocolate, blue, purple, green, tan, red and creamywhite. Naturally colored cottons are a very small niche market. Now China is thelargest color cotton producing country and known for its spinning and weavingprocesses. The color cottons available today are usually shorter, weaker and finerthan regular upland cottons, but they can be spun successfully into ring and rotoryarns for many applications. They can be blended with normal white cottons orblended among themselves. For a limited number of colors, the use of dyes andother chemicals can be completely avoided in textile finishing, possibly generatingsome savings, which can compensate for the higher raw material price.
Conventional breeding strategies for the improvement of naturally colorcotton in other countries and also in India have proved without doubt thesuitability of brown and green cottons for the fabric production. The present studyis aimed at germplasm enhancement, exploration of elite germplasm in naturallycolored cotton and study of wide genetic variation among inter-specific and intra-specific derivatives of brown and shades of brown cotton Gossypium Spp forgenetic improvement of productivity and fiber quality.
In order to study the Genetics of brown color in naturally colored cottondiverse brown colored parents crossed with white cotton and studied for threeconsecutive generations F1, F2 and F3 for confirmation of inheritance pattern ofcolor. Molecular marker studies as an initial step by using SSR markers (MicroSatellites) of fiber development for studying diversity among colored and whitecotton.
I take this opportunity to profusely thank my esteemed advisor Dr. ManjulaS. Maralappanavar, Senior Scientist (Cotton Breeding) All India Co-ordinated

Cotton Improvement Project, Agricultural Research Station, University ofAgricultural Sciences, Dharwad-580007, India for their constant guidance andencouragement for this master’s research work. I place on record my sinceregratitude to my professor Dr. S. S. Patil, Principle Scientist (Advance Plantbreeding- Cotton) ARS Dharwad for their whole-hearted support during theconduct of research programme. I thank all the committee members for sparingtheir valuable time in attending discussions on research programme. I am thankfulto all the fellow colleagues for their constant help during my research programme. I am indebted to my father and mother for their blessings and loving support of mybrothers and sisters.
I sincerely hope that this study shall serve the purpose of color cottonresearch and development in the county so that an ever vibrant color cottonproduction scenario is ensured in the years to come for achieving number onestatus in the world of color cotton.
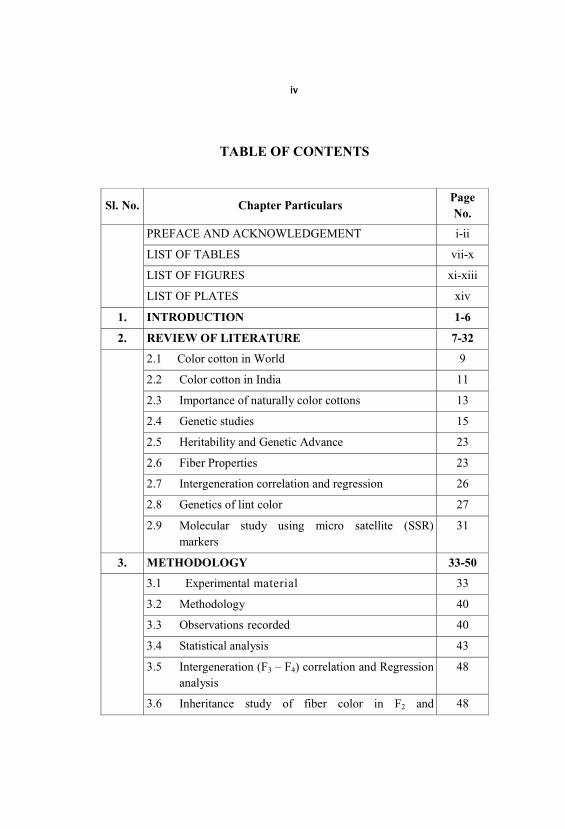
TABLE OF CONTENTS
Sl. No. Chapter ParticularsPageNo.
PREFACE AND ACKNOWLEDGEMENT i-ii
LIST OF TABLES vii-x
LIST OF FIGURES xi-xiii
LIST OF PLATES xiv
1. INTRODUCTION 1-6
2. REVIEW OF LITERATURE 7-32
2.1 Color cotton in World 9
2.2 Color cotton in India 11
2.3 Importance of naturally color cottons 13
2.4 Genetic studies 15
2.5 Heritability and Genetic Advance 23
2.6 Fiber Properties 23
2.7 Intergeneration correlation and regression 26
2.8 Genetics of lint color 27
2.9 Molecular study using micro satellite (SSR)markers
31
3. METHODOLOGY 33-50
3.1 Experimental material 33
3.2 Methodology 40
3.3 Observations recorded 40
3.4 Statistical analysis 43
3.5 Intergeneration (F3 – F4) correlation and Regressionanalysis
48
3.6 Inheritance study of fiber color in F2 and 48

confirmation in F3 generations derived from browncolor and white linted crosses
3.7 Molecular marker study between the color andwhite linted Gossypium hirsutum genotypes
49
3.8 Identification of superior F4 lines for productivityand Fiber length
54
4 EXPERIMENTAL RESULTS 55-145
4.1 Evaluation of stabilized color cotton genotypes foryield, yield attributing and fiber traits
55
4.2 Evaluation of F4 lines of brown color cotton derivedfrom intraspecific (HH) and interspecific (HB)crosses for yield, yield attributing and fiber traits
66
4.3 Intergeneration correlation and regression analysis 146
4.4 Inheritance study of fiber color in F2 andconfirmation in F3 generation derived from diversecrosses of color and white linted (Gossypiumhirsutum) genotypes
149
4.5 Molecular marker studies in white and color cottonGossypium hirsutum genotypes
157
5. DISCUSSION 161-199
5.1 Per se performance of color cotton genotypes. 163
5.2Comparison of variability and heritabilityparameters among different population of colorcotton genotypes.
190
5.3 Character association and path analysis for variouscomponent traits in F4 lines of color cottongenotypes.
192
5.4 Intergeneration correlation and regression analysis. 195
5.5 Genetics of fiber color in Gossypium hirsutumcottons.
198

5.6 Molecular characterization of white and color lintedcotton genotypes.
199
6. SUMMARY AND CONCLUSIONS 202- 204
REFERENCES 205-215

LIST OF TABLES
TableNo.
TitlePageNo.
1. Experimental material and statistical designs ofexperiments
34
2. List of SSR Primers used for screening 39
3. Analysis of variance for yield and yield attributing traitsin stabilized genotypes of color cotton
56
4. Mean performance of stabilized color cotton genotypes 61
5. Variability and heritability parameters in stabilizedcolor cotton genotypes
60
6. Analysis of variance for yield and yield attributing traitsin intra hirsutum F4 lines of color cotton
67
7. Mean performance of selected intra hirsutum F4 lines ofcolor cotton, categorized under Light brown lint color(Score-2)
72
8. Selected intra hirsutum F4 lines of color cotton superiorfor 2.5%SL, categorized under Light brown lint color(Score-2)
87-88
9 Selected intra hirsutum F4 lines of color cotton superiorfor Boll weight, categorized under Light brown lintcolor (Score-2)
73
10 Selected intra hirsutum F4 lines of color cotton superiorfor GOT %, categorized under Light brown lint color(Score-2)
81-82
11 Mean performance of selected intra hirsutum F4 lines ofcolor cotton, categorized under Medium brown lintcolor (Score-3)
74

12 Selected intra hirsutum F4 lines of color cotton superiorfor 2.5%SL, categorized under Medium brown lintcolor (Score-3)
89
13 Selected intra hirsutum F4 lines of color cotton superiorfor Boll weight, categorized under Medium brown lintcolor (Score-3)
75
14 Selected intra hirsutum F4 lines of color cotton superiorfor GOT %, categorized under Medium brown lint color(Score-3)
83-84
15 Mean performance of selected intra hirsutum F4 lines ofcolor cotton, categorized under Dark brown lint color(Score-4)
77
16 Selected intra hirsutum F4 line of color cotton superiorfor 2.5%SL, categorized under Dark brown lint color(Score-4)
78
17 Selected intra hirsutum F4 lines of color cotton superiorfor Boll weight, categorized under Dark brown lintcolor (Score-4)
76
18 Selected intra hirsutum F4 lines of color cotton superiorfor GOT %, categorized under Dark brown lint color(Score-4)
85
19 Variability and heritability parameters in intra hirsutumF4 lines of color cotton
92
20. Correlation studies on yield, yield attributing and fiberquality traits in intra hirsutum F4 lines of color cotton
96
21 Path coefficient analysis of all component traits versusseed cotton yield in intra hirsutum F4 lines of colorcotton
102
22 Analysis of variance for yield and yield attributing traitsin inter specific (HxB) F4 lines of color cotton
105
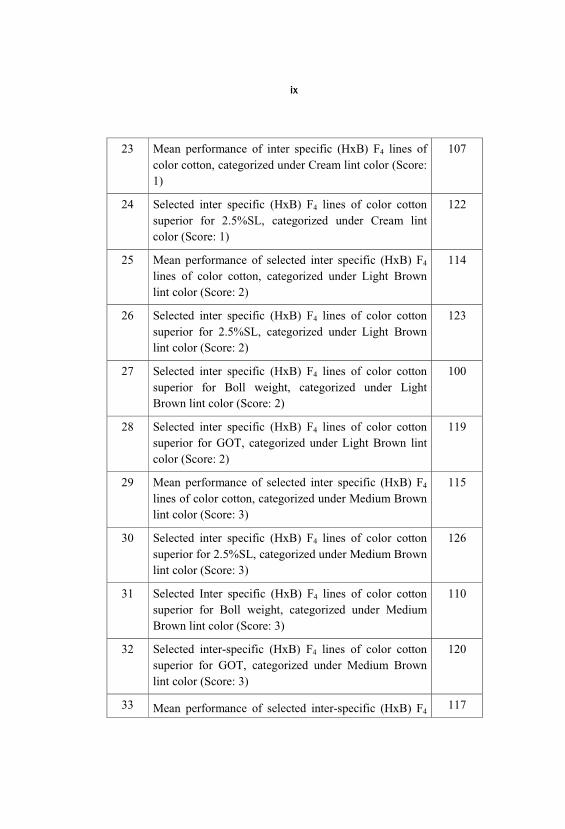
23 Mean performance of inter specific (HxB) F4 lines ofcolor cotton, categorized under Cream lint color (Score:1)
107
24 Selected inter specific (HxB) F4 lines of color cottonsuperior for 2.5%SL, categorized under Cream lintcolor (Score: 1)
122
25 Mean performance of selected inter specific (HxB) F4
lines of color cotton, categorized under Light Brownlint color (Score: 2)
114
26 Selected inter specific (HxB) F4 lines of color cottonsuperior for 2.5%SL, categorized under Light Brownlint color (Score: 2)
123
27 Selected inter specific (HxB) F4 lines of color cottonsuperior for Boll weight, categorized under LightBrown lint color (Score: 2)
100
28 Selected inter specific (HxB) F4 lines of color cottonsuperior for GOT, categorized under Light Brown lintcolor (Score: 2)
119
29 Mean performance of selected inter specific (HxB) F4
lines of color cotton, categorized under Medium Brownlint color (Score: 3)
115
30 Selected inter specific (HxB) F4 lines of color cottonsuperior for 2.5%SL, categorized under Medium Brownlint color (Score: 3)
126
31 Selected Inter specific (HxB) F4 lines of color cottonsuperior for Boll weight, categorized under MediumBrown lint color (Score: 3)
110
32 Selected inter-specific (HxB) F4 lines of color cottonsuperior for GOT, categorized under Medium Brownlint color (Score: 3)
120
33 Mean performance of selected inter-specific (HxB) F4117

lines of color cotton, categorized under Dark Brown lintcolor (Score: 4)
34 Selected inter specific (HxB) F4 lines of color cottonsuperior for 2.5%SL, categorized under Dark Brownlint color (Score: 4)
127-128
35 Selected inter specific (HxB) F4 lines of color cottonsuperior for Boll weight, categorized under Dark Brownlint color (Score: 4)
111
36 Selected inter specific (HxB) F4 lines of color cottonsuperior for GOT, categorized under Dark Brown lintcolor (Score: 4)
129
37 Variability and heritability parameters inter specific(HxB) F4 lines of color cotton
132
38 Correlation studies on yield, yield attributing and fiberquality traits in inter-specific (HxB) F4 lines of colorcotton
136
39 Path coefficient analysis of all component traits versusseed cotton yield in inter-specific (HxB) F4 lines ofcolor cotton
140
40 Correlation studies on yield, yield attributing and fiberquality traits in F4 lines of color cotton
145
41 Intergeneration correlation coefficients between parent(F3) and progeny (F4) for quantitative and qualitativetraits in intra hirsutum (HH) and inter specific (HB)crosses of colored and white cottons genotypes
146
42 Heritability (Narrow Sense) estimates for Yield perplant and fiber length in parent (F3) progeny (F4) ofintra hirsutum (HH) and inter specific (HB) crossesbetween colored and white cotton genotypes
148
43 Color classes of F2 derived from two crosses DDB-106x Sahana and DMB-102 x Sahana
151

44 Inheritance pattern of fiber color in F2 populationderived from color and white cotton crosses (DDB-106X Sahana) and (DMB-102 X Sahana)
152
45 Genetic Similarity Coefficients between the whitecotton genotype (RAH100) and colored cottongenotypes (DMB-225, DDB-12, DGC-78)
158
46 Allelic variation of 23 Simple Sequence Repeats (SSR)loci among 1 white and 3 colored cotton Gossypiumhirsutum genotypes
159
47 Range values for different trait components in differentcolors of HH and HB F4 lines of color cotton
189
LIST OF FIGURES
PlateNo. Title
Page No.
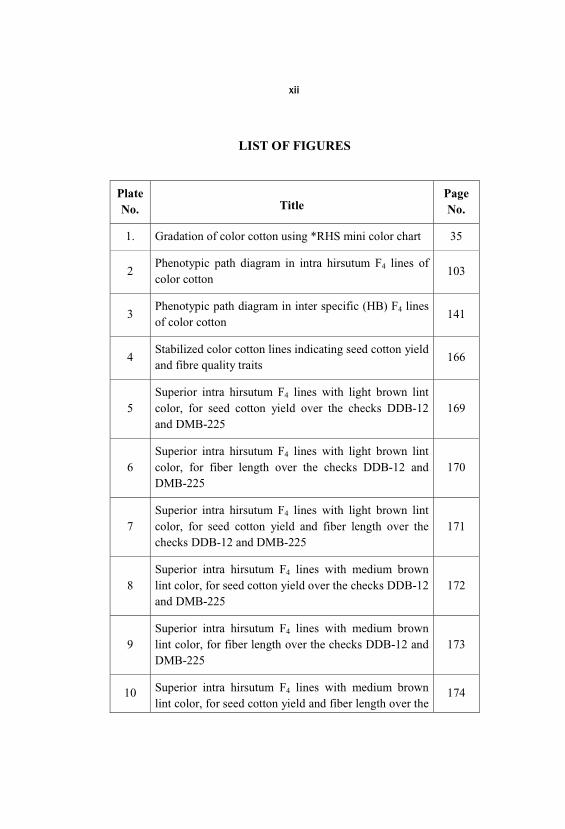
1. Gradation of color cotton using *RHS mini color chart 35
2Phenotypic path diagram in intra hirsutum F4 lines ofcolor cotton
103
3Phenotypic path diagram in inter specific (HB) F4 linesof color cotton
141
4Stabilized color cotton lines indicating seed cotton yieldand fibre quality traits
166
5Superior intra hirsutum F4 lines with light brown lintcolor, for seed cotton yield over the checks DDB-12and DMB-225
169
6Superior intra hirsutum F4 lines with light brown lintcolor, for fiber length over the checks DDB-12 andDMB-225
170
7Superior intra hirsutum F4 lines with light brown lintcolor, for seed cotton yield and fiber length over thechecks DDB-12 and DMB-225
171
8Superior intra hirsutum F4 lines with medium brownlint color, for seed cotton yield over the checks DDB-12and DMB-225
172
9Superior intra hirsutum F4 lines with medium brownlint color, for fiber length over the checks DDB-12 andDMB-225
173
10 Superior intra hirsutum F4 lines with medium brownlint color, for seed cotton yield and fiber length over the
174

checks DDB-12 and DMB-225
11Superior intra hirsutum F4 lines with dark brown lintcolor, for seed cotton yield over the checks DDB-12and DMB-225
175
12Superior intra hirsutum F4 lines with dark brown lintcolor, for fiber length over the checks DDB-12 andDMB-225
176
13Inter specific (HB) F4 lines with cream lint color, forfiber length comparing to the checks DDB-12 andDMB-225
180
14Superior inter specific (HB) F4 lines with light brownlint color, for seed cotton yield over the checks DDB-12and DMB-225
181
15Superior inter specific (HB) F4 lines with light brownlint color, for fiber length over the checks DDB-12 andDMB-225
182
16Superior inter specific (HB) F4 lines with mediumbrown lint color, for seed cotton yield over the checksDDB-12 and DMB-225
183
17Superior inter specific (HB) F4 lines with mediumbrown lint color, for fiber length over the checks DDB-12 and DMB-225
184
18Superior inter specific F4 lines with medium brown lintcolor, for seed cotton yield and fiber length over thechecks DDB-12 and DMB-225
185
19Superior inter specific F4 lines with medium brown lintcolor, for seed cotton yield over the checks DDB-12and DMB-225
186

20Superior inter specific F4 lines with dark brown lintcolor, for fiber length over the checks DDB-12 andDMB-225
187
21Superior inter specific F4 lines with dark brown lintcolor, for seed cotton yield and fiber length over thechecks DDB-12 and DMB-225
188
22Phenotypic correlation coefficients for thirteen traitswith seed cotton yield (q/ha) in intra hirsutum F4 linesof color cotton
194
23Phenotypic correlation coefficients for thirteen traitswith seed cotton yield (q/ha) in inter specific (HB) F4
lines of color cotton196
24Phenotypic correlation coefficients for thirteen traitswith seed cotton yield (q/ha) in F4 lines of color cotton
197
25Dendrogram depicting molecular diversity betweenwhite and color cotton genotypes
200

LIST OF PLATES
PlateNo. Title
Page No.
1. Characterization of stabilized genotypes on lint colorusing RHS color chart
36-37
2Lint color of F1 and F2 of the dark brown (DDB-106)and white (Sahana) cross
153
3Lint color of selected F2 progenies of the dark brown(DDB-106) and white (Sahana) cross
154
4Lint color of F1 and F2 of the medium brown (DMB-102) and white (Sahana) cross
155
5Lint color of selected F2 progenies of the mediumbrown (DMB-102) and white (Sahana) cross
156
6General view of medium brown and dark brown colorcotton of experimental plot
167
7PAGE analysis of SSR markers for one white and threecolored genotypes
160
8 Superior stabilized genotypes 168
1. INTRODUCTION
Cotton (Gossypium spp.) is an important fiber yielding cash cropwith an unique spinnable cellulosic textile fiber with about 95 per centcellulose. It has proved to be a fiber that has conquered all fibers in theworld from times immemorial till today and is rightly called as ‘Queen ofthe fibers’. It is closely linked to the human civilization itself bydistinguishing their existence from other animals. Cotton in the form ofcloth suffices one of the basic necessities of the human population.
Cotton crop is the backbone of our large domestic textile industry. Cotton holds prominent position as raw material for textile industry in spiteof the competition from manmade (regenerated and synthetic) fibers andother natural fibers. It contributes about 7.0 per cent to Indian GDP, fetching export earnings. It provides substantial employment in theproduction, promotion, processing and trade. Cotton is grown mostly forfiber, accounting to 45 per cent of the world fiber. It is also a food crop(cotton seed)- the major end uses for cottonseeds are vegetable oil, whichcontributes about 10 per cent to world edible oil production for humanconsumption; whole seed, meal, hulls for animal feed and chemicalcellulose (Rathore, 2005 and Phillip et al., 2006).
Cotton is grown in tropical and subtropical regions of more than 80countries the world over. The major cotton producing countries are China, India, USA, Pakistan, Uzbekistan, Egypt, Argentina, Australia, Greece, Brazil and Turkey. These countries contribute about 85 to 90 per cent to theglobal Cotton production.
India has a prominent place in the global cotton scenario owing to itslargest cotton growing area. It is cultivated on an area of 11.7 millionhectares which is 34 per cent of the world area. The Indian cottonproduction during 2012-13 was 33.4 million bales (1bale=170kgs lint), accounting to 21 per cent of world production and making it the secondlargest cotton producing country in the world after China with 44.53million bales. Karnataka produces 12 lakh bales of cotton lint from an areaof 4.85 lakh hectares with productivity of 430.35 kg per ha (Anon., 2013).

In India, about 70 per cent area is covered by hybrids, 20 per cent byupland varieties and 10 per cent by diploid cultivars (Anon., 2012 a). TheEgyptian cotton area is meager (2 per cent) falling in few pockets of TamilNadu and Andhra Pradesh. Gossypium herbaceum is confined to two states, Gujarat and Karnataka. Two species viz., Gossypium hirsutum andGossypium arboreum are cultivated in all the nine cotton growing states inIndia.
Worldwide, the commercial cotton is almost white (creamy yellow tobright white), white linted cotton in all the four cultivated species andcreamy white in Gossypium barbadense L. These cotton varieties arespontaneous mutants of plants that normally produce white fiber. Thevirgin white color is stable and will not lose its brightness (Phillip et al.,2006 and Narayananan et al., 1996).
Cotton with naturally colored lint, other than white, is commonlyreferred as color cotton. There are genotypes or species which producenaturally color cotton and most of the wild species have color lint or fuzz, but are non-spinnable (Anon., 1992). The early primitive forms of thecultivated species must have been color linted to dirty white and nearwhite; brown appears to be the basic color (Narayananan et al., 1996). Inthe phylogenetic pathway of diploid and tetraploid cultivated cottons, theprimary role of wild species and racial forms having color lint hairs hasbeen postulated in Gossypium spp. such as Gossypium anomalum, Gossypium herbaceum race africanum and Gossypium raimondii(Hutchinson, 1971).
In nature, color and white linted cottons are found from timeimmemorial. As evidenced from excavation of Huaca Prieta on thenorthern Peruvian Coast of South America indicated the usage andcultivation of color cotton since 2500 B.C., lint samples recovered fromthis area were brown, chocolate, blue, purple, green, tan, red and creamywhite (Stephens, 1975, Apodaca, 1990 and Manjula, 2005).
In the journey from fiber to fabric of white cotton large quantity ofwater and hazardous chemicals are being used for bleaching and dyeingpurposes, which pollute the environment and affect the human health. The
textile effluents are often discharged with hazardous heavy metals intorivers and lakes making water unfit for consumption, which also imposethreat to ground water (Aslam et al., 2004). Also there are reports ofallergic reactions to the synthetic or dyed fabric. Some reactive dyes areeither toxic or can be biologically converted to toxic or carcinogeniccompounds (Brown and De Vito, 1993, Pinheiro et al., 2004 and Ka et al., 2010).
Indian dyestuff industry has attained huge growth during the lastdecade accounting for 12 per cent of the global colorant industry, out ofwhich nearly 2/3rd is exported. In 2010, India produced ~2, 00,000 tonnesof dyes, making it the second largest producer of dyes and intermediates inAsia. The Central Pollution Control Board (CPCB) puts their number at900 units. There are around 700 varieties of dyes and dye intermediatesproduced in India, mainly direct dyes, acid dyes, reactive dyes andpigments. Most of these dyes have not been evaluated for their impact onhealth and the environment. Nearly 70 per cent of the dyestuff was suppliedto the textile industry while leather, paper, paints, plastics, printing andeven in the food industries accounted for the remaining (Anon., 2012b).
Materials and products that are harmful to the ecosystem and humanhealth are being increasingly discouraged in the modern society. Withincreased concern to environment and human health in the modern society, particularly Europe and U.S.A. are now demanding cotton textiles bereft ofharmful dyes and pesticide residues. This eco awareness has led to therevival of naturally color linted cottons, these color cottons have once againcrawled out with the efforts of an American scientist, Sally Fox, she startedimproving color cotton since 1982 and developed naturally Color CottonCorporation that markets color cotton fabrics (Fox, 1987). The negativeeffects of dyeing are mitigated by naturally color cottons. Naturally colorcottons are unique in that they grows in colors and do not have to be dyedin fabric manufacturing. Naturally color cottons are presently grown inChina, Peru, Israel and India. The amount available in 2005 was verysmall, perhaps 10,000 U.S. bale equivalents (about 2270 metric tons)(Veerland, 1993 and Manjula, 2005).
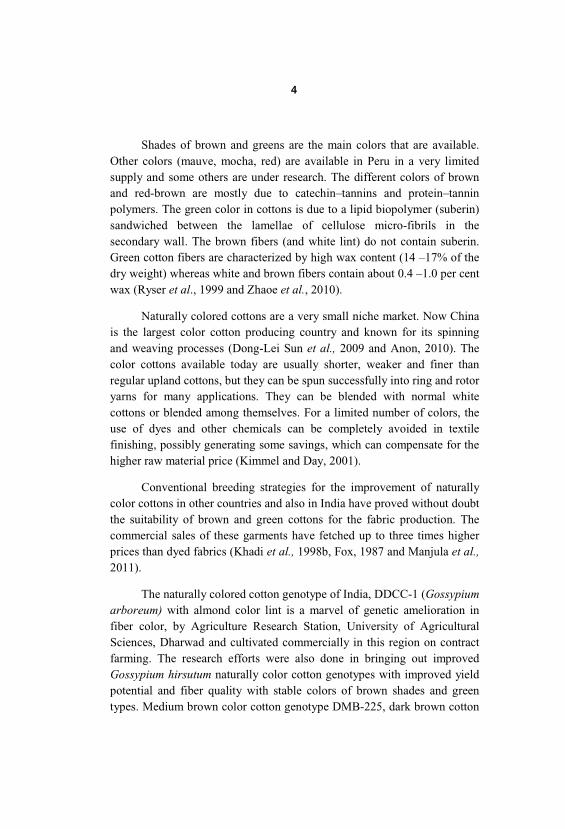
Shades of brown and greens are the main colors that are available. Other colors (mauve, mocha, red) are available in Peru in a very limitedsupply and some others are under research. The different colors of brownand red-brown are mostly due to catechin–tannins and protein–tanninpolymers. The green color in cottons is due to a lipid biopolymer (suberin)sandwiched between the lamellae of cellulose micro-fibrils in thesecondary wall. The brown fibers (and white lint) do not contain suberin. Green cotton fibers are characterized by high wax content (14 –17% of thedry weight) whereas white and brown fibers contain about 0.4 –1.0 per centwax (Ryser et al., 1999 and Zhaoe et al., 2010).
Naturally colored cottons are a very small niche market. Now Chinais the largest color cotton producing country and known for its spinningand weaving processes (Dong-Lei Sun et al., 2009 and Anon, 2010). Thecolor cottons available today are usually shorter, weaker and finer thanregular upland cottons, but they can be spun successfully into ring and rotoryarns for many applications. They can be blended with normal whitecottons or blended among themselves. For a limited number of colors, theuse of dyes and other chemicals can be completely avoided in textilefinishing, possibly generating some savings, which can compensate for thehigher raw material price (Kimmel and Day, 2001).
Conventional breeding strategies for the improvement of naturallycolor cottons in other countries and also in India have proved without doubtthe suitability of brown and green cottons for the fabric production. Thecommercial sales of these garments have fetched up to three times higherprices than dyed fabrics (Khadi et al., 1998b, Fox, 1987 and Manjula et al., 2011).
The naturally colored cotton genotype of India, DDCC-1 (Gossypiumarboreum) with almond color lint is a marvel of genetic amelioration infiber color, by Agriculture Research Station, University of AgriculturalSciences, Dharwad and cultivated commercially in this region on contractfarming. The research efforts were also done in bringing out improvedGossypium hirsutum naturally color cotton genotypes with improved yieldpotential and fiber quality with stable colors of brown shades and greentypes. Medium brown color cotton genotype DMB-225, dark brown cotton
genotype DDB-12 and green color genotype DGC-78, which have beenregistered during the year 2012-13 at National Bureau of Plant GeneticResources (NBPGR), (Manjula et al., 2011 and 2013).
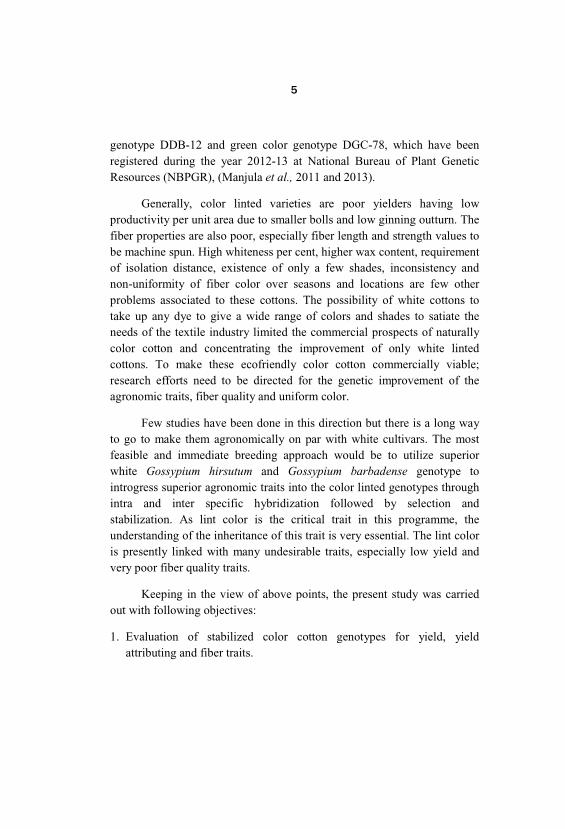
Generally, color linted varieties are poor yielders having lowproductivity per unit area due to smaller bolls and low ginning outturn. Thefiber properties are also poor, especially fiber length and strength values tobe machine spun. High whiteness per cent, higher wax content, requirementof isolation distance, existence of only a few shades, inconsistency andnon-uniformity of fiber color over seasons and locations are few otherproblems associated to these cottons. The possibility of white cottons totake up any dye to give a wide range of colors and shades to satiate theneeds of the textile industry limited the commercial prospects of naturallycolor cotton and concentrating the improvement of only white lintedcottons. To make these ecofriendly color cotton commercially viable;research efforts need to be directed for the genetic improvement of theagronomic traits, fiber quality and uniform color.
Few studies have been done in this direction but there is a long wayto go to make them agronomically on par with white cultivars. The mostfeasible and immediate breeding approach would be to utilize superiorwhite Gossypium hirsutum and Gossypium barbadense genotype tointrogress superior agronomic traits into the color linted genotypes throughintra and inter specific hybridization followed by selection andstabilization. As lint color is the critical trait in this programme, theunderstanding of the inheritance of this trait is very essential. The lint coloris presently linked with many undesirable traits, especially low yield andvery poor fiber quality traits.
Keeping in the view of above points, the present study was carriedout with following objectives:
1. Evaluation of stabilized color cotton genotypes for yield, yieldattributing and fiber traits.

2. Evaluation of F4 brown color cotton lines derived from intraspecific (Hx H) and interspecific (H x B) crosses for yield, yield attributing andfiber traits.
3. Inheritance study of fiber color in F2 and confirmation in F3 generationderived from diverse crosses of color and white linted (Gossypiumhirsutum) genotypes.
4. Molecular studies in white and color cotton Gossypium hirsutumgenotypes.

2. REVIEW OF LITERATURE
Man is almost dependent on plants for his food. Plants are also themajor source, of most clothing. Considering the prime importance ofplants, it is not surprising that men have long been concerned withdeveloping plant types better suited to satisfying their needs. The science ofgenetics and plant breeding paved a way for understanding, improving andselection of genotypes as per the needs of human being.
The commercially cultivated cotton is white, in the journey fromfiber to fabric of white huge amount of poisonous and hazardous chemicalsare being used for bleaching and dyeing purposes, which strongly pollutethe environment and affect the human health. Thus, materials and productsthat are harmful to the ecosystem and human health are being increasinglydiscouraged. This eco-awareness and concern towards the human healthlead to the revival of naturally color cottons.
Naturally color cottons are as old as white linted cottons and in noway different from white cotton except the color of the lint but fiber qualitywise naturally color cottons are poor. Naturally color cottons are unique inthat they grow in colors and do not have to be dyed in fabricmanufacturing. Naturally color cotton is an attractive proposition for thetextile industry as indiscriminate use of chemicals in cotton production andfor dyeing and finishing of fabrics, causes considerable environmentalpollution (Waghmare and Koranne, 1998).
Naturally color cotton has its origin in the ancient America, whereweavers cultivated and spun their native green and brown color cottonssince their domestication about 4,500 years ago. Most of the naturallypigmented cotton lines grown commercially in the world have descendedfrom pre-Columbian stocks selected by ancient Americans. Early farmingsocieties domesticated crop plants, independently selected and improvedtwo entirely different tropical, perennial species of cotton, which have verypoor fiber properties along with sparse fibers. Today improved cultivarswith high yield, day length neutrality and annualized with easily ginnedabundant fiber of uniform color dominate the naturally pigmented cottonpicture. The source of these improved genotypes can be traced back to

5000 years both cytogenetically and archeologically to the cultural centersof Central America and the Andean coast of western South America(Manjula, 2005).
In the higher plants it is now commonly accepted that virtually allphenotypic effects are not related to the gene in any simple way. Ratherthey result from a chain of physio-chemical reaction and interactionsinitiated by genes but leading through complex chains of events, controlledor modified by other genes, the external environment to the final phenotype(Qui Xin-mian, 2004).
In plant breeding, pleiotrophy or linkage of genes may showfavorable or unfavorable effects, although the genetic basis of thedifference is quite different in the two cases. Interaction between genes atdifferent loci termed as epistasis. The phenomenon of epistasis, the effectof one gene may change according to the presence or absence of anothergene or genes. Gene character relationship involves with small effects thatexert their chief influence by intensifying or diminishing the expression ofmajor genes. These genes are appropriately called modifying factors. Theeffects of modifying genes are primarily quantitative and can be describedaccurately only in terms of measurements. Inheritance of many segregatinggenes with small, similar and cumulative effects explain the inheritance ofquantitative characters. The complexity of genetic situation increasesexponentially with increase in the number of segregating gene pairs. Increased yield has been the ultimate aim of most plant breedingprogramme by combining characters present in different lines of cultivatedspecies or their wild relatives using conventional breeding such asintrogressive hybridization in the transfer of certain features of one speciesto the other species without impairment of taxonomic integrity. Thus, broadening its base of variability and increasing the variety ofrecombination products which may be secured from it. Plant breeders selectplants with desirable traits by looking at the phenotype. Most of these traitsare polygenic with complex non-allelic and environmental interactions. Better genotype selection for desired traits with more accuracy and alsodiversity among the genotypes at molecular level could be supported by theuse of molecular techniques (Allard, 1960).

The efforts made to understand the work done by earlier workers inthis direction have been reviewed under the following headings.
2.1 Color cotton in World
Evidences indicate the cultivation of color cotton for indigenous andcommercial use in Guatemala, Mexico, Colombia, Peru, Haiti, China, Egypt, India and Russia during 1800’s.Some twelve shades of naturalbrown cotton were identified in Northern Peru at the end of the lastcentury. Since 1982, the Native Cotton Development Project of Peru hasrecovered a number of landraces of naturally pigmented cotton, nowcommercially marketed by Pakucho Pax. Pakucho Pax Co-ordinates andmarkets the naturally color cotton produced by hundreds of small growersand also maintains some 75 different landraces of white and naturallypigmented fiber lines. The estimated 15,000 peasants and Indians who tilltoday cultivate color cotton in Peru is the largest single group of naturallycolor lint producers worldwide. Six principal color lines have beenrecovered and stabilized by project researchers viz., cream, tan, mediumbrown, reddish brown, chocolate brown and mauve (Singh et al., 1993;Manjula, 2005).
2.1.1 North America
Naturally color cotton has been cultivated since 1604. The publicitygiven to the Soviet brown cotton production by the American press duringWorld War II led to spinning tests on Nankeen brown and Arkansas green. In California, Gus Hyer, a USDA cotton geneticist, worked with color lintlines largely of upland varieties for several decades. Hayer’s seed stockshave formed the foundation and improvement that began in California inthe 1980’s. Sally Fox, a plant breeder (basically an Entomologist) inArizona and California working since 1982 using traditional plant breedingtechniques has developed several unique varieties which have been grantedplant variety protection status. Cotton lint of these varieties has beencommercially marketed as Fox Fiber ® since 1989 and Natural CottonColors, Inc has been formed in Arizona which is privately held (Manjula, 2005).
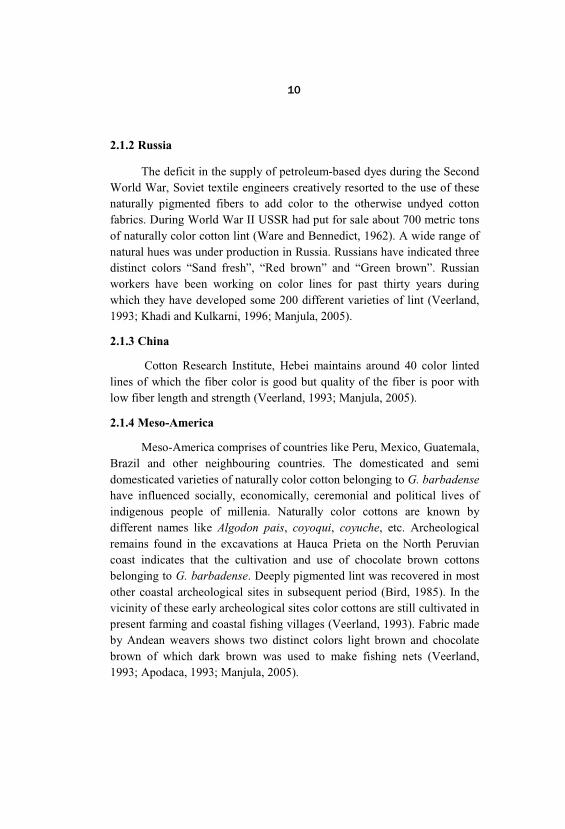
2.1.2 Russia
The deficit in the supply of petroleum-based dyes during the SecondWorld War, Soviet textile engineers creatively resorted to the use of thesenaturally pigmented fibers to add color to the otherwise undyed cottonfabrics. During World War II USSR had put for sale about 700 metric tonsof naturally color cotton lint (Ware and Bennedict, 1962). A wide range ofnatural hues was under production in Russia. Russians have indicated threedistinct colors “Sand fresh”, “Red brown” and “Green brown”. Russianworkers have been working on color lines for past thirty years duringwhich they have developed some 200 different varieties of lint (Veerland, 1993; Khadi and Kulkarni, 1996; Manjula, 2005).
2.1.3 China
Cotton Research Institute, Hebei maintains around 40 color lintedlines of which the fiber color is good but quality of the fiber is poor withlow fiber length and strength (Veerland, 1993; Manjula, 2005).
2.1.4 Meso-America
Meso-America comprises of countries like Peru, Mexico, Guatemala, Brazil and other neighbouring countries. The domesticated and semidomesticated varieties of naturally color cotton belonging to G. barbadensehave influenced socially, economically, ceremonial and political lives ofindigenous people of millenia. Naturally color cottons are known bydifferent names like Algodon pais, coyoqui, coyuche, etc. Archeologicalremains found in the excavations at Hauca Prieta on the North Peruviancoast indicates that the cultivation and use of chocolate brown cottonsbelonging to G. barbadense. Deeply pigmented lint was recovered in mostother coastal archeological sites in subsequent period (Bird, 1985). In thevicinity of these early archeological sites color cottons are still cultivated inpresent farming and coastal fishing villages (Veerland, 1993). Fabric madeby Andean weavers shows two distinct colors light brown and chocolatebrown of which dark brown was used to make fishing nets (Veerland, 1993; Apodaca, 1993; Manjula, 2005).
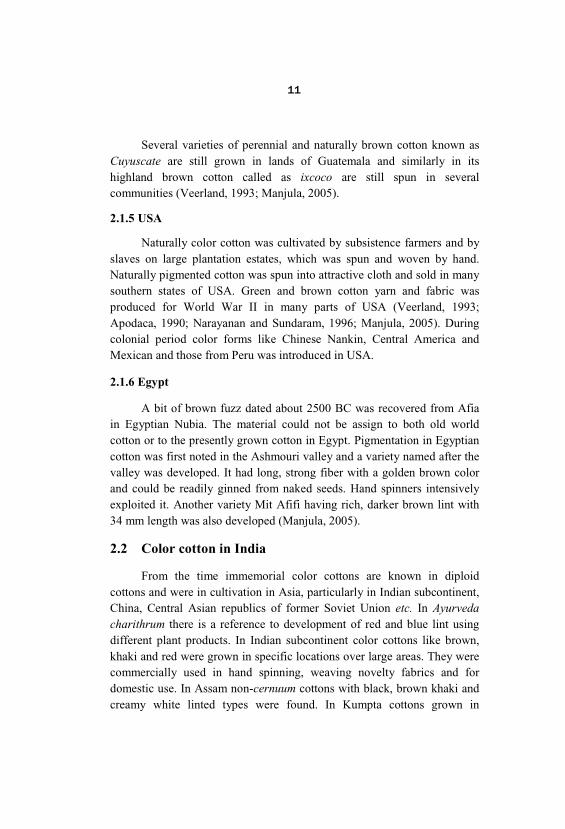
Several varieties of perennial and naturally brown cotton known asCuyuscate are still grown in lands of Guatemala and similarly in itshighland brown cotton called as ixcoco are still spun in severalcommunities (Veerland, 1993; Manjula, 2005).
2.1.5 USA
Naturally color cotton was cultivated by subsistence farmers and byslaves on large plantation estates, which was spun and woven by hand. Naturally pigmented cotton was spun into attractive cloth and sold in manysouthern states of USA. Green and brown cotton yarn and fabric wasproduced for World War II in many parts of USA (Veerland, 1993;Apodaca, 1990; Narayanan and Sundaram, 1996; Manjula, 2005). Duringcolonial period color forms like Chinese Nankin, Central America andMexican and those from Peru was introduced in USA.
2.1.6 Egypt
A bit of brown fuzz dated about 2500 BC was recovered from Afiain Egyptian Nubia. The material could not be assign to both old worldcotton or to the presently grown cotton in Egypt. Pigmentation in Egyptiancotton was first noted in the Ashmouri valley and a variety named after thevalley was developed. It had long, strong fiber with a golden brown colorand could be readily ginned from naked seeds. Hand spinners intensivelyexploited it. Another variety Mit Afifi having rich, darker brown lint with34 mm length was also developed (Manjula, 2005).
2.2 Color cotton in India
From the time immemorial color cottons are known in diploidcottons and were in cultivation in Asia, particularly in Indian subcontinent, China, Central Asian republics of former Soviet Union etc. In Ayurvedacharithrum there is a reference to development of red and blue lint usingdifferent plant products. In Indian subcontinent color cottons like brown, khaki and red were grown in specific locations over large areas. They werecommercially used in hand spinning, weaving novelty fabrics and fordomestic use. In Assam non-cernuum cottons with black, brown khaki andcreamy white linted types were found. In Kumpta cottons grown in
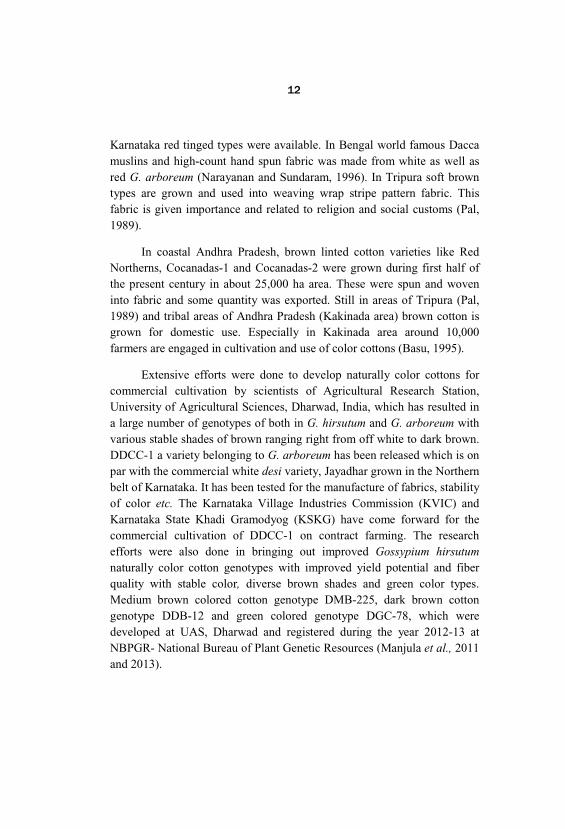
Karnataka red tinged types were available. In Bengal world famous Daccamuslins and high-count hand spun fabric was made from white as well asred G. arboreum (Narayanan and Sundaram, 1996). In Tripura soft browntypes are grown and used into weaving wrap stripe pattern fabric. Thisfabric is given importance and related to religion and social customs (Pal, 1989).
In coastal Andhra Pradesh, brown linted cotton varieties like RedNortherns, Cocanadas-1 and Cocanadas-2 were grown during first half ofthe present century in about 25,000 ha area. These were spun and woveninto fabric and some quantity was exported. Still in areas of Tripura (Pal, 1989) and tribal areas of Andhra Pradesh (Kakinada area) brown cotton isgrown for domestic use. Especially in Kakinada area around 10,000farmers are engaged in cultivation and use of color cottons (Basu, 1995).
Extensive efforts were done to develop naturally color cottons forcommercial cultivation by scientists of Agricultural Research Station, University of Agricultural Sciences, Dharwad, India, which has resulted ina large number of genotypes of both in G. hirsutum and G. arboreum withvarious stable shades of brown ranging right from off white to dark brown. DDCC-1 a variety belonging to G. arboreum has been released which is onpar with the commercial white desi variety, Jayadhar grown in the Northernbelt of Karnataka. It has been tested for the manufacture of fabrics, stabilityof color etc. The Karnataka Village Industries Commission (KVIC) andKarnataka State Khadi Gramodyog (KSKG) have come forward for thecommercial cultivation of DDCC-1 on contract farming. The researchefforts were also done in bringing out improved Gossypium hirsutumnaturally color cotton genotypes with improved yield potential and fiberquality with stable color, diverse brown shades and green color types.Medium brown colored cotton genotype DMB-225, dark brown cottongenotype DDB-12 and green colored genotype DGC-78, which weredeveloped at UAS, Dharwad and registered during the year 2012-13 atNBPGR- National Bureau of Plant Genetic Resources (Manjula et al., 2011and 2013).
2.3 Importance of naturally color cottons
Organic agriculture is an ecological production management systemthat promotes and enhances biodiversity, biological cycles and soilbiological activity. It is based on minimal use of farm inputs and onmanagement practices that restore, maintain and enhance ecologicalharmony.
Though the color cotton has created a growing niche market in thedeveloped countries, its fibers in general are too short and weak to be spun. Hence, the varieties and hybrids with the pigmented lint with acceptablefiber qualities are being developed to give a fillip to agriculture, trade andindustries.
The growing concern for environment and health hazards associatedwith the use of synthetic dyes, particularly in western countries have givenfillip for cultivation of naturally color cotton and research in our country(Basu, 1995). A revival of interest in chemically free raw materials, minimally handled, environmentally “friendly” production strategies andtransformational processes are contributing to a new demand for naturallypigmented cotton fiber (Veerland, 1993).
Naturally color cottons can play a very important role in the presentworld of eco-awareness especially in countries, which follow strictpollution standards. Most important and major use is that these cottons canbe used without the processes of bleaching and dyeing, which are highlychemical and time intensive. In the US, where naturally color cottons aresold commercially, it costs approximately 2.40 a pound to dye a darkbrown yarn including the cost of dye, energy, water and toxic dye coastdisposal. In contrast, the use of naturally brown shades has a costadvantage anywhere from 20 per cent to 50 per cent compared to the sameshades dyed with chemicals. Thus these are both ecological andeconomical.
In the present era of serious concern of the consequences of thedepleting Ozone layer which protects the earth from of the UV rays whichhave been identified as the cause of an increase in incidence of skin cancer

especially in the European population, a very recent finding shows howthese naturally pigmented cottons can play a pivotal role in the humanhealth.
The study by Gwendolyn and Patricia (2005) demonstrates thatnaturally pigmented cottons have excellent sun protection properties (highUV protection factor (UPF values), which are far superior to conventionalbleached or unbleached cotton (green cotton UPF = 30 to 50 +; tan UPF=20 to 45; brown UPF = 40 to 50+; bleached conventional UPF = 4;unbleached convential uPF = 8). The UPF values of the naturally –pigmented cottons remained high enough, even after 80 AFUs (AmericanAssociation of Textile Chemicals and colorists fading units) of xenon lightexposure, so that the fabrics merited sun protection ratings of “good” to“very good” according to ASTM (American Society for Testing Materials)6603 voluntary labeling guide terms for UV-protection textiles. Accordingto which an UPF rating of 15 and above is required before a fabric may belabeled sun protective.
White cotton has to be bleached and processed before dyeing withcolors. Almost all these processes involve the use of chemicals, which areknown to have bad impact on health, for example chlorinated products, bleaching agents, phenols, formaldehyde cause skin diseases.
Dyes containing traces of heavy elements such as arsenic, lead, cadmium cobalt, zinc and chromium are skin irritants, especially forchildren. Azodyes are proven carcinogens. The water from millsdischarging into the water source pollutes the water and affects the aquaticlife. Therefore many of the developed countries have banned the use ofthese hazardous chemicals and even the import of textiles dyed with thesechemicals. Germany has banned the import of cloth dyed with azodyes. Ina situation like this if not replace, naturally color cottons can initiate ahumble beginning in the struggle to reduce the environmental pollution. Also naturally color cottons bring medical remedy for over fifty differentsomatic and psychosomatic diseases of man (Veerland, 1993). Variousstudies indicate that color fastness to light and washing is much better thanthe original fiber colors (Sundaramurthy et al., 1994). A study by Khyadiand Naik (1999) indicated that the fabric of naturally color cotton was

darker by 131, 147 and 277 per cent after 20 washes with natural cleansingagents, soaps and detergents respectively. Commercial scouring andmercerization increased the fabric color by 338 and 440 per centrespectively. A wide range of shades from parent colors like brown, greenand inter mixing can be got. In extending the boundaries of application, fibers of natural color cottons can be blended with polyester fibers, silk etc.
Advantages
No hidden environmental costs
No damage to the cotton fiber caused by harsh dyes
Intensification of color with washing
Consumer recognition and demand
New yarn and fabric design potentials
“Dye lots” the size of the bale lay down. Normal dye lots are in thethousands of pounds. A 60 bale lay down using Fox Fiber cotton ascolor produces a Fox Fiber “Color lot” of 30,000 pounds.
New mills may be established in places where abundant water andenergy are not available.
2.4 Genetic studies
Reports on the genetic studies in naturally color cottons are limited. The available studies have being reviewed. Corresponding studies in whitecotton have also been included where no reports in color linted cottons arereported.
2.4.1 Genetic variability
The success of breeding programme depends upon the extent andmagnitude of variability existing in the germplasm. Variability may bedefined as the amount of variation present among the members of apopulation or species for one or more characters at genotypic or phenotypiclevels. A comprehensive summary of methods for estimating genetic

variance is presented by Cockerham (1963). The different components ofgenetic variability include all three types of variances viz., genotypic (Vg), phenotypic (Vp) and environmental (Ve). Phenotypic variability isobservable, and it includes both genotypic and environmental conditions. Itis measured in terms of genotypic variance and consists of additive, dominance and epistatic components. Environmental variance is measuredin terms of error mean variance. Generally, genotypic coefficient ofvariability (GCV) and phenotypic coefficient of variability (PCV) are usedto assess the extent of variation between two different contrastingcharacters. Heritability is the transmissibility of characters from parents toprogeny. Heritability in a broad sense is the ratio of genotypic variance tothe total phenotypic variance in percentage. Effectiveness of selection ofgenotype depends on heritability. Genetic advance (GA) is theimprovement over the base population that can be potentially achievedfrom selection. It is a function of the heritability of the trait, the amount ofphenotypic variation and the selection differential (s) that the breeder uses. When high heritability is accompanied with high genetic advance, itindicates additive gene effect and selection may be effective. When lowheritability accompanied with low genetic advance, it indicatespredominance of environmental effects and selection would be ineffective. High heritability with low genetic advance indicates the importance ofadditive gene effects. Variability for growth, earliness, yield and yieldcomponents in cotton has been reported by several workers.
A critical estimate of genetic variability is a prerequisite for initiatingappropriate breeding procedures in crop improvement programmes. Thevariability observed in any population could be due to two factors, thegenetic and environmental, which were explained in the early part of lastcentury by Johanson (1909), who attributed the variation in a segregatingpopulation to both heritable and non-heritable factors and the variationwithin pure line is only due to environment.
Nelson Ehle (1909) and East (1916) later confirmed Johanson’s workand showed that continuous variation also conforms to MendelianGenetics.

Charles and Smith (1939), Powers (1942) and Powers et al. (1950)partitioned genetic variance from total variances using the estimate ofenvironmental variance in non-segregating population.
The heritable variation was further divided into additive and non-additive components and later fraction included dominance and interallelicinteraction (Fisher et al., 1932; Panse, 1940; Lush, 1945; Mather, 1949 andFalconer, 1981).
Importance of estimates of genotypic and phenotypic variability informulating efficient breeding procedures in cotton have been emphasizedby Hutchinson (1940) and Miller et al. (1958). They have established thatgenetic variance has a direct bearing on the prospect of advance in cottonbreeding programmes.
2.4.2 Variances and coefficient of variation
2.4.2.1 Growth parameters
Growth parameters include plant height, number of monopodia andsympodia and days to first boll open. Moderate variation was noticed incolor cotton for plant height by Singh et al. (1996), Mandloi et al. (1996)and Bijapur (1996). Low variability was observed by Bijapur (1996) fordays to first boll burst. In case of number of monopodia low variation wasreported by Mandloi et al. (1996), whereas Bijapur (1996) indicated highvariability with high degree of variance, GCV and PCV. Mandloi et al. (1996) reported moderate variation for sympodial number whereas Bijapur(1996) reported low variability for the same.
2.4.2.2 Yield
Singh et al. (1993) observed high variability in seventeen colorcotton genotypes studied. The yield ranged from 11.89 g per plant to 68.7 gper plant. Rajashekaran et al. (1993) observed yield ranging from 166 kgper hectare to 554 kg/ha. In 15 genotypes evaluated by Mandloi et al. (1996) yield varied from 6 g/plant to 22 g/plant. Khadi et al. (1996b)evaluated 28 genotypes wherein yield varied from 3.65 to 13.31 q/ha. Similarly in another set of 75 genotypes yield ranged from 2.6 to 12.4 q/ha.
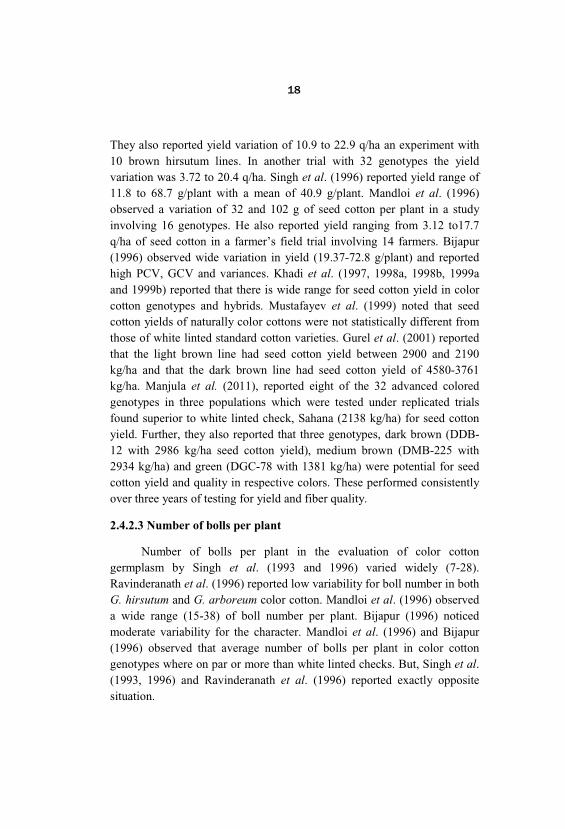
They also reported yield variation of 10.9 to 22.9 q/ha an experiment with10 brown hirsutum lines. In another trial with 32 genotypes the yieldvariation was 3.72 to 20.4 q/ha. Singh et al. (1996) reported yield range of11.8 to 68.7 g/plant with a mean of 40.9 g/plant. Mandloi et al. (1996)observed a variation of 32 and 102 g of seed cotton per plant in a studyinvolving 16 genotypes. He also reported yield ranging from 3.12 to17.7q/ha of seed cotton in a farmer’s field trial involving 14 farmers. Bijapur(1996) observed wide variation in yield (19.37-72.8 g/plant) and reportedhigh PCV, GCV and variances. Khadi et al. (1997, 1998a, 1998b, 1999aand 1999b) reported that there is wide range for seed cotton yield in colorcotton genotypes and hybrids. Mustafayev et al. (1999) noted that seedcotton yields of naturally color cottons were not statistically different fromthose of white linted standard cotton varieties. Gurel et al. (2001) reportedthat the light brown line had seed cotton yield between 2900 and 2190kg/ha and that the dark brown line had seed cotton yield of 4580-3761kg/ha. Manjula et al. (2011), reported eight of the 32 advanced coloredgenotypes in three populations which were tested under replicated trialsfound superior to white linted check, Sahana (2138 kg/ha) for seed cottonyield. Further, they also reported that three genotypes, dark brown (DDB-12 with 2986 kg/ha seed cotton yield), medium brown (DMB-225 with2934 kg/ha) and green (DGC-78 with 1381 kg/ha) were potential for seedcotton yield and quality in respective colors. These performed consistentlyover three years of testing for yield and fiber quality.
2.4.2.3 Number of bolls per plant
Number of bolls per plant in the evaluation of color cottongermplasm by Singh et al. (1993 and 1996) varied widely (7-28). Ravinderanath et al. (1996) reported low variability for boll number in bothG. hirsutum and G. arboreum color cotton. Mandloi et al. (1996) observeda wide range (15-38) of boll number per plant. Bijapur (1996) noticedmoderate variability for the character. Mandloi et al. (1996) and Bijapur(1996) observed that average number of bolls per plant in color cottongenotypes where on par or more than white linted checks. But, Singh et al. (1993, 1996) and Ravinderanath et al. (1996) reported exactly oppositesituation.

2.4.2.4 Boll weight
It was observed that boll weight did not show much variation amongdifferent genotypes studied by many workers. The range of boll weight incolor cotton genotypes reported by different researchers is as follows.
AuthorsNumber of genotypes
studiedRange of boll weight
(g/boll)
Singh et al. (1993) 17 2.7 to 4.4
Mandloi et al. (1996) 15 1.5 to 3.7
Khadi et al. (1996b) 20 2.1 to 4.23
Mandloi et al. (1996b) 15 2.7 to 3.9
Ravinderanath et al. (1996)G. hirsutum
G. arboretum
2
2
3.0
1.5 to 2
Singh et al. (1996) 5 3.0 to 4.0
Bijapur (1996) 26 2.1 to 4.3
Manjula et al. (2011) 19 (Population I) 3.1 to 4.5
Manjula et al. (2011) 11(Population II) 3.2 to 4.3
Manjula et al. (2011) 8(Population III) 2.7 to 4.1
In all above reports it was observed that boll weight of color cottongenotypes was usually on par with that of white linted checks used.
2.4.2.5 Seed index
Seed index varied widely in studies of Singh et al. (1996) andBijapur (1996). But, Mandloi et al. (1996) and Ravinderanath et al. (1996)reported less variability in color cotton genotypes for seed index.
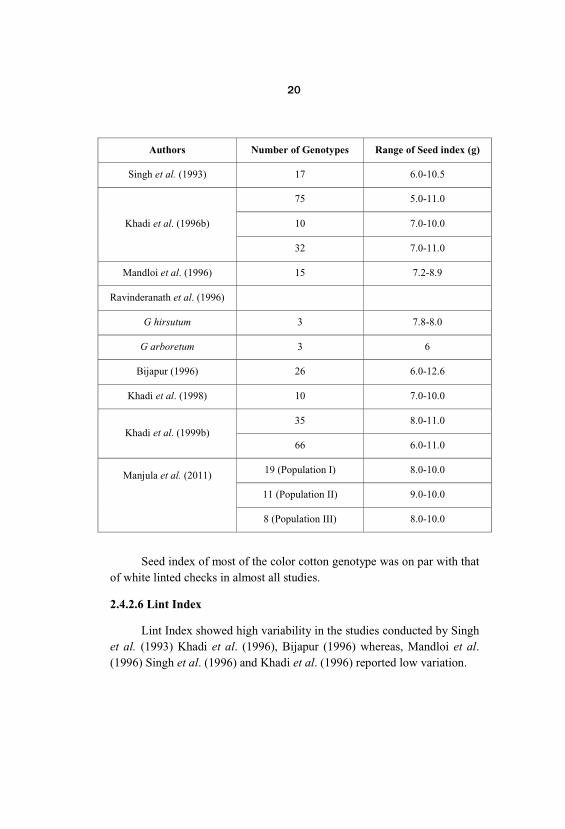
Authors Number of Genotypes Range of Seed index (g)
Singh et al. (1993) 17 6.0-10.5
Khadi et al. (1996b)
75 5.0-11.0
10 7.0-10.0
32 7.0-11.0
Mandloi et al. (1996) 15 7.2-8.9
Ravinderanath et al. (1996)
G hirsutum 3 7.8-8.0
G arboretum 3 6
Bijapur (1996) 26 6.0-12.6
Khadi et al. (1998) 10 7.0-10.0
Khadi et al. (1999b)35 8.0-11.0
66 6.0-11.0
Manjula et al. (2011) 19 (Population I) 8.0-10.0
11 (Population II) 9.0-10.0
8 (Population III) 8.0-10.0
Seed index of most of the color cotton genotype was on par with thatof white linted checks in almost all studies.
2.4.2.6 Lint Index
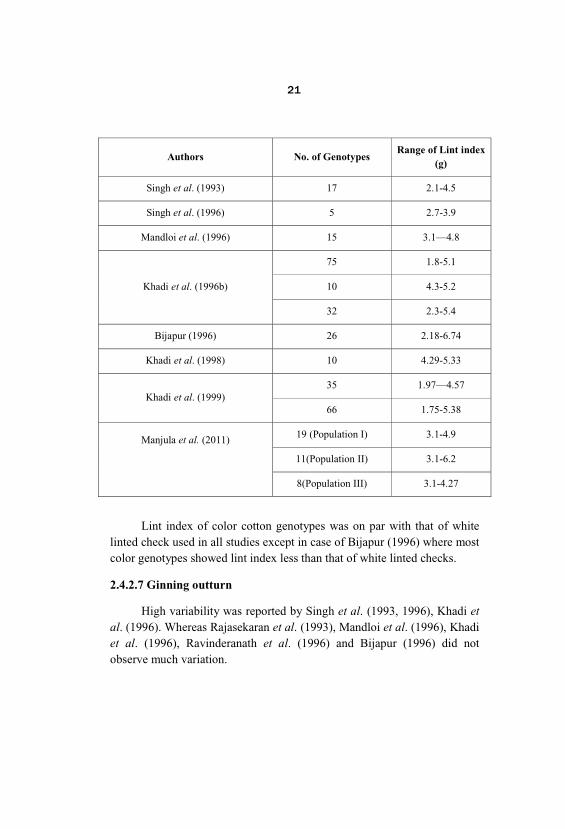
Lint Index showed high variability in the studies conducted by Singhet al. (1993) Khadi et al. (1996), Bijapur (1996) whereas, Mandloi et al. (1996) Singh et al. (1996) and Khadi et al. (1996) reported low variation.
Authors No. of GenotypesRange of Lint index
(g)
Singh et al. (1993) 17 2.1-4.5
Singh et al. (1996) 5 2.7-3.9
Mandloi et al. (1996) 15 3.1—4.8
Khadi et al. (1996b)
75 1.8-5.1
10 4.3-5.2
32 2.3-5.4
Bijapur (1996) 26 2.18-6.74
Khadi et al. (1998) 10 4.29-5.33
Khadi et al. (1999)35 1.97—4.57
66 1.75-5.38
Manjula et al. (2011)
19 (Population I) 3.1-4.9
11(Population II) 3.1-6.2
8(Population III) 3.1-4.27
Lint index of color cotton genotypes was on par with that of whitelinted check used in all studies except in case of Bijapur (1996) where mostcolor genotypes showed lint index less than that of white linted checks.
2.4.2.7 Ginning outturn
High variability was reported by Singh et al. (1993, 1996), Khadi etal. (1996). Whereas Rajasekaran et al. (1993), Mandloi et al. (1996), Khadiet al. (1996), Ravinderanath et al. (1996) and Bijapur (1996) did notobserve much variation.

Authors No.of Genotypes Range (%)
Singh et al. (1993) 17 19.5-35.1
Rajashekaran et al. (1993) 7 25.0-35.8
Mandloi et al. (1996) 15 30.4-36.6
Deshpande (1996) 11 34.8-42.8
Ravinderanath et al. (1996)
G. hirsutum 3 34.0-35.0
G. arboreum 3 33.0-37.0
Mandloi et al. (1996) 15 30.0-35.5
Khadi et al. (1996b)75 18.6-30.8
10 30.0-40.0
32 20.0-40.0
Bijapur (1996) 26 23.7-36.7
Khadi et al. (1998a) 10 30.0-40.0
Khadi et al. (1999a) 35 18.6-33.7
Khadi et al. (1999b) 66 19.09-40.0
Lale Efe et al. (2010) 37.1-39.2
Manjula et al. (2011)
19 (Population I) 25.0-35.0
11 (Population II) 25.0-41.0
8 (Population III) 25.0-32.0
The ginning percentage of color cotton genotypes in above studiesreported by authors was on par with that of white linted check except incase of studies conducted by Bijapur (1996).
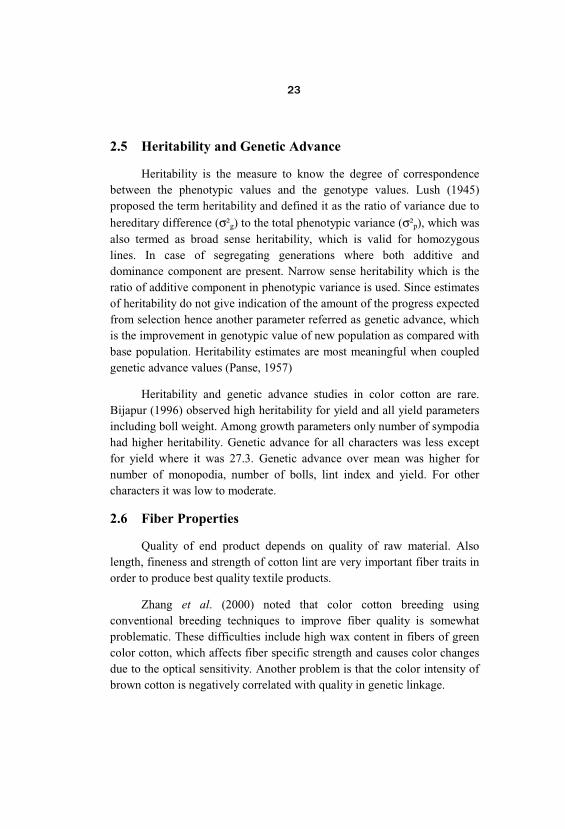
2.5 Heritability and Genetic Advance
Heritability is the measure to know the degree of correspondencebetween the phenotypic values and the genotype values. Lush (1945)proposed the term heritability and defined it as the ratio of variance due tohereditary difference (σ²g) to the total phenotypic variance (σ²p), which wasalso termed as broad sense heritability, which is valid for homozygouslines. In case of segregating generations where both additive anddominance component are present. Narrow sense heritability which is theratio of additive component in phenotypic variance is used. Since estimatesof heritability do not give indication of the amount of the progress expectedfrom selection hence another parameter referred as genetic advance, whichis the improvement in genotypic value of new population as compared withbase population. Heritability estimates are most meaningful when coupledgenetic advance values (Panse, 1957)
Heritability and genetic advance studies in color cotton are rare. Bijapur (1996) observed high heritability for yield and all yield parametersincluding boll weight. Among growth parameters only number of sympodiahad higher heritability. Genetic advance for all characters was less exceptfor yield where it was 27.3. Genetic advance over mean was higher fornumber of monopodia, number of bolls, lint index and yield. For othercharacters it was low to moderate.
2.6 Fiber Properties
Quality of end product depends on quality of raw material. Alsolength, fineness and strength of cotton lint are very important fiber traits inorder to produce best quality textile products.
Zhang et al. (2000) noted that color cotton breeding usingconventional breeding techniques to improve fiber quality is somewhatproblematic. These difficulties include high wax content in fibers of greencolor cotton, which affects fiber specific strength and causes color changesdue to the optical sensitivity. Another problem is that the color intensity ofbrown cotton is negatively correlated with quality in genetic linkage.
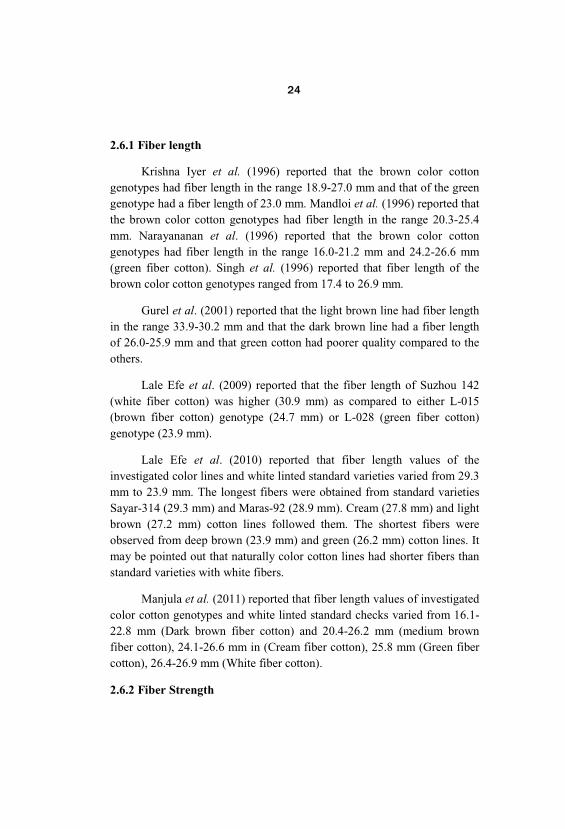
2.6.1 Fiber length
Krishna Iyer et al. (1996) reported that the brown color cottongenotypes had fiber length in the range 18.9-27.0 mm and that of the greengenotype had a fiber length of 23.0 mm. Mandloi et al. (1996) reported thatthe brown color cotton genotypes had fiber length in the range 20.3-25.4mm. Narayananan et al. (1996) reported that the brown color cottongenotypes had fiber length in the range 16.0-21.2 mm and 24.2-26.6 mm(green fiber cotton). Singh et al. (1996) reported that fiber length of thebrown color cotton genotypes ranged from 17.4 to 26.9 mm.
Gurel et al. (2001) reported that the light brown line had fiber lengthin the range 33.9-30.2 mm and that the dark brown line had a fiber lengthof 26.0-25.9 mm and that green cotton had poorer quality compared to theothers.
Lale Efe et al. (2009) reported that the fiber length of Suzhou 142(white fiber cotton) was higher (30.9 mm) as compared to either L-015(brown fiber cotton) genotype (24.7 mm) or L-028 (green fiber cotton)genotype (23.9 mm).
Lale Efe et al. (2010) reported that fiber length values of theinvestigated color lines and white linted standard varieties varied from 29.3mm to 23.9 mm. The longest fibers were obtained from standard varietiesSayar-314 (29.3 mm) and Maras-92 (28.9 mm). Cream (27.8 mm) and lightbrown (27.2 mm) cotton lines followed them. The shortest fibers wereobserved from deep brown (23.9 mm) and green (26.2 mm) cotton lines. Itmay be pointed out that naturally color cotton lines had shorter fibers thanstandard varieties with white fibers.
Manjula et al. (2011) reported that fiber length values of investigatedcolor cotton genotypes and white linted standard checks varied from 16.1-22.8 mm (Dark brown fiber cotton) and 20.4-26.2 mm (medium brownfiber cotton), 24.1-26.6 mm in (Cream fiber cotton), 25.8 mm (Green fibercotton), 26.4-26.9 mm (White fiber cotton).
2.6.2 Fiber Strength
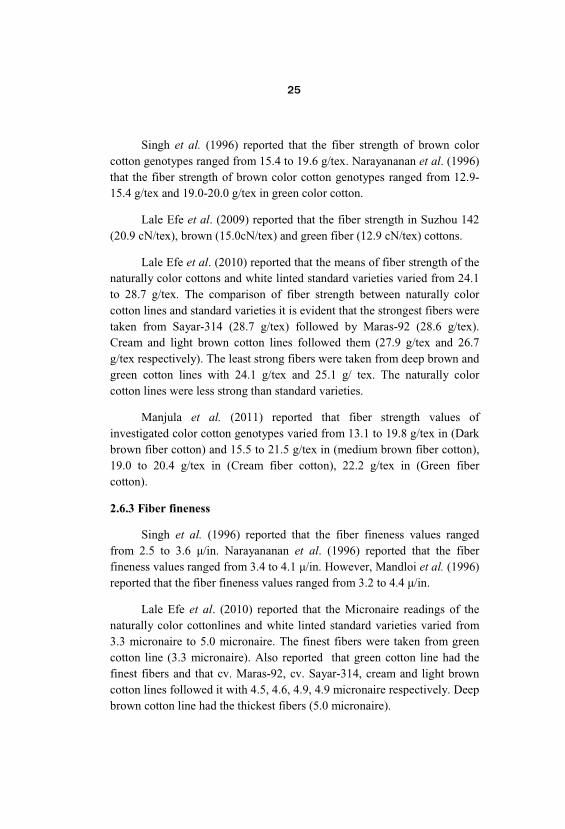
Singh et al. (1996) reported that the fiber strength of brown colorcotton genotypes ranged from 15.4 to 19.6 g/tex. Narayananan et al. (1996)that the fiber strength of brown color cotton genotypes ranged from 12.9-15.4 g/tex and 19.0-20.0 g/tex in green color cotton.
Lale Efe et al. (2009) reported that the fiber strength in Suzhou 142(20.9 cN/tex), brown (15.0cN/tex) and green fiber (12.9 cN/tex) cottons.
Lale Efe et al. (2010) reported that the means of fiber strength of thenaturally color cottons and white linted standard varieties varied from 24.1to 28.7 g/tex. The comparison of fiber strength between naturally colorcotton lines and standard varieties it is evident that the strongest fibers weretaken from Sayar-314 (28.7 g/tex) followed by Maras-92 (28.6 g/tex). Cream and light brown cotton lines followed them (27.9 g/tex and 26.7g/tex respectively). The least strong fibers were taken from deep brown andgreen cotton lines with 24.1 g/tex and 25.1 g/ tex. The naturally colorcotton lines were less strong than standard varieties.
Manjula et al. (2011) reported that fiber strength values ofinvestigated color cotton genotypes varied from 13.1 to 19.8 g/tex in (Darkbrown fiber cotton) and 15.5 to 21.5 g/tex in (medium brown fiber cotton), 19.0 to 20.4 g/tex in (Cream fiber cotton), 22.2 g/tex in (Green fibercotton).
2.6.3 Fiber fineness
Singh et al. (1996) reported that the fiber fineness values rangedfrom 2.5 to 3.6 /in. Narayananan et al. (1996) reported that the fiberfineness values ranged from 3.4 to 4.1 /in. However, Mandloi et al. (1996)reported that the fiber fineness values ranged from 3.2 to 4.4 /in.
Lale Efe et al. (2010) reported that the Micronaire readings of thenaturally color cottonlines and white linted standard varieties varied from3.3 micronaire to 5.0 micronaire. The finest fibers were taken from greencotton line (3.3 micronaire). Also reported that green cotton line had thefinest fibers and that cv. Maras-92, cv. Sayar-314, cream and light browncotton lines followed it with 4.5, 4.6, 4.9, 4.9 micronaire respectively. Deepbrown cotton line had the thickest fibers (5.0 micronaire).

Manjula et al. (2011) reported that fiber fineness values ofinvestigated color cotton genotypes ranged from 3.2 to 5.1 /in (Darkbrown fiber cotton) and 2.4 to 4.4 /in (medium brown fiber cotton), 3.2-4.1 /in (Cream fiber cotton), 2.8 /in (Green fiber cotton).
2.6.4 Character association
Character association analysis measures association between variouscharacters and helps to determine the components on which selection canbe based for improvement. The correlation coefficients studied werephenotypic, genotypic and environmental. The association that isobservable and measured is referred as phenotypic correlation whichincludes genotypic value and environmental deviation. The genotypiccorrelation is the inherent association between two variables resultingeither from pleiotropic effects of genes or linkage of genes governinginheritance of two or more characters or both.
Correlation due to linkage is relatively ephemeral whereas, correlations from pleiotrophy is long lasting and is usually the net effect ofall the segregating genes that influence both the attributes (Falconer, 1981;Dabholkar, 1992; Al-Jabouri et al., 1958)
Lale Efe et al. (2010) reported that correlation analysis of the fiberquality characters i.e. fiber length; strength and fineness have strongcorrelation with cellulose content (0.91, 0.90 and 0.99, respectively). Onthe other hand, pigment content showed significant negative correlationwith fiber length (-0.51), fiber strength (-0.44), fiber fineness (-0.10), cellulose content (-0.20) characters. Since, pigment content is considered asthe indication of density of color in fiber, the negative correlation betweenpigment content indicated that increase in pigment inhibit the length anddegrade the overall quality. Cellulose content showed the negativecorrelation with pigment content indicating the fact that increase inpigment matter decreases the cellulose content and consequently degradethe quality of fiber in colored type of cotton fibers.
2.7 Intergeneration correlation and regression

As depicted in the studies of Prakash et al. (2011) and Abid et al. (2013). Intergeneration correlation coefficients give an idea about theeffectiveness of single plant selection and to some extent nature of geneaction. If the correlation coefficient is high, it would mean high heritableportion and probably the additive component.
2.8 Genetics of lint color
Lint color may be white, dull gray, various shades of brown fromlight cream to mahagony red, bright green which speedily fades to greenishbrown, rusty brown when exposed to sunlight. Brown cottons of variousshades exist in the Asiatic group and in new world cottons browns arerepresented in all species. Some species have both brown as well as whitelint whereas some others have only color lint.
Naturally- colored cotton results from deposited pigments on thefiber cells at the fiber cell wall thickening stage. The fiber pigment, notonly decreased the cellulose content in fiber, but directly participated in thefiber deposition of cellulose in fiber during the fiber development.
Production and accumulation of the fiber pigment were related tospecial expression of enzymatic genes for pigment synthesis in the fibercells.
Cotton breeders are trying to produce superior varieties of coloredcotton. However, often, the gene(s) for lint color is found to be pleiotrophici.e. they control more than one trait (Murty, 2001). The genes for brownand green in upland cotton inhibit the fiber development (Richmond, 1944).
In old world cotton Fletcher (1907) remarked that color lint isdominant over white. Kottur (1923) intercrossed a reddish ting dull whiteherbaceum and white arboreum. The F1 was dull white with reddish tinge. The F2 segregated into three white or dull white and one brown.
Balls (1908) studied crosses of brown barbadense and whitehirsutum. He found F1 intermediate and F2 gave 1 brown: 2 cream: 1 white. Ware (1932) in intra hirsutum cross reported that brown with three shades

was incompletely dominant over white lint with mono factorial segregationin F2.
Ramanathan and Balasubrahmanyan (1933) considered that lint colorin the old world cotton is governed by three factors , viz., one basic gene , X which is essential for color and can produce pigmentation of lint only inthe presence of K1 and or K2. None of them can impart color individually. When either K1 or K2 was present with X, the lint was cream color. BothK1 and K2 are of equal potency in color production. The three genestogether produce brown lint. Several modifiers seemed to be present.
Hutchinson (1934) first reported that khaki lint color in the old worldcottons is controlled by a single gene K, linked with leaf shape locus L. Later in 1935 after obtaining segregation for color in backcrosses andpostulated the existence of three factors controlling lint color character.
Harland (1935) studied in an intra barbadense cross between darkbrown and cream, the F1 was intermediate but near to brown parent. F2
segregation was of the blending type which is characteristic of inter-specific crosses. It was established after three back crosses to brown parentthat one main factor pair KB-KB conditioned brown and light brown lint. Blending in F2 was due to the segregation of modifiers as well as the maingene. Another cross of brown barbadense and brown hirsutum indicatedinvolvement of duplicate genes for lint color. It was also indicated that thebrown lint color in G. taitense was due to the same genes as in hirsutum(Harland, 1939).
Silow (1945) indicated that lint color in Asiatic cottons is determinedby main genes as four loci Lc1, Lc2, Lc3 and Lc4 and by a variablecomplex of minor genes. At Lc1 only one fully dominant gene Lc1k whichis not affected by modifiers and is only subjected to slight fading existed. At Lc2 a multiple alleles series occurred and included khaki (Lc2K), medium brown (Lc2 M), light brown (Lc 2 B), very light brown (Lc2V) andwhite brown (Lc2). Lc2K was regarded a duplicate of Lc1. Lc2B reported tohave low dominance and highly susceptible to modifier effect to fading. Similarly at Lc4 only one khaki linted gene Lc4 K was identified. Brownlint color genes were reported to have cumulative effects.

Balasubrahmanyan et al. (1950) studied inheritance of lint color inCocanadas. The results indicated that white was recessive to khaki andstrain Cocanada-1 carried the very light brown gene Lc2V and othergenotypes viz., 125 and 129 probably carried Lc2 B. Nankin khaki showedsimple dominance over cocanandas -1, thus indicating it carried darkerallele and cross Cicadas -1 x A9 exhibited bifactorial differences.
Silow (1944) suggested that lint color situation in new world cottonshad a similarity with old world species G. hirsutum had a high level ofmodifying complexes but main lint color were not common. In barbadenseone main gene for brown color lint with a strong suppressing modifiersbackground was identified.
Genes determining brown lint in G. punctatum and G. darwinii werereported to be independent of Lc1K. Mahagony was distinct from all othersin intensity of color induced. Similarly two genes for brown were reportedin G. tomentosum. Some minor genes for lint color that change white to offwhite , or even pale brown or dark brown were reported in hirsutum, marigalante, barbadense and tomentosum (Hutchinson, 1946). Brain(1950) reported same series of alleles for lint color in hirsutum, whereasbarbadense carried two independent loci for character.
Kohel (1985) undertook genetic analysis of fiber color in elevenbrown lines. The dark brown lint lines tested were conditioned by alleles atthe Lc1 locus, except for morrilli brown lint. There was no evidence formore than one Lc1 allele. Lousiana brown carried a second brown lintlocus, but the expression of the allele at the locus was so weak that whenisolated it could not be identified readily in segregating population.
Morrilli brown (Lc1 , Lc3) lint was reported to be conditioned bydark brown lint alleles at one new locus which was closely linked to asecond new locus carrying light brown alleles ( Lc5). The dark brown locuswas assigned the gene symbol Lc3.
Four light brown lines carried alleles at the Lc2 locus. Another twolines G233 and TT were reported to be independent of all other brown lintloci and were assigned to gene symbol Lc4.

Richmond (1944) observed that the lint colors in Nankeen and TexasRust were conditioned by a single gene which was incompletely dominantin crosses with white. Genes for Nankeen and Texas Rust appeared to beconditioned by single gene which was probably independent of the genes ofNankeen and Texas Rust.
Green lint in G. hirsutum would be bright green but fades onexposure to sunlight to brownish green. Hutchinson and Silow, (1939)reported that the green lint type is simply dominant to white and the factorresponsible was designated Lglg.
In a color inheritance study Richmond, (1944) concluded that Texasgreen lint (TGL) was conditioned by a single gene which was incompletelydominant in crosses with white lint. The genes for Texas green wereindependent from the genes governing Nankeen and Texas Rust.
Harland (1929 and 1932) reported that green was dominant to whitebut with a reduced amount of color. In F2, Segregation could be followedclearly in some crosses whereas in others blending occurred due tosegregation modifiers. The technical committee of U.S. Regional Projectconcerned with cotton genetics and cytogenetics research has establishedrules for genetic nomenclature and lists the following genetic mutantmarkers for color lint (Endrizzi et al., 1984)
Many researchers pointed out that natural fiber color of these cottonswere governed by one or two pairs of dominant gene, but some thoughtthey were governed by multiple genes. The fiber color of F1 fell betweenthose of two parents when color fiber parent crossed with white fiber parentand there were some segregation, white fiber and color fiber in F2. Overall, the fiber color of the F2 generation was continuously distributed, the resultof χ2 test supported that the proportion of colored to white fiber type wasaccording to Mendel’s law of segregation. Thus fiber color was controlledby single dominant gene and expressed incompletely dominant. The traitsof natural brown fiber and green fiber were governed by a non-completedominant gene. Brown color was dominant to white and green color wasdominant to brown (Qui Xin-mian, 2004).

Sl.No. Gene Symbol Name Gossypium species
1 Lc1K Khaki lint arboreum and herbaceum
2 Lc2B Light brown lint arboreum and herbaceum
3 Lc2K Khaki lint arboreum and herbaceum
4 Lc2M Medium brown
lint arboreum and herbaceum
5 Lc2V Very light brown
lint arboreum and herbaceum
6 Lc2B Light brown lint arboreum and herbaceum
7 Lc4K Khaki lint arboreum
8 Dw Dirty white lint Raimondii
9 Lg Green lint hirsutum
10 Lc1 Brown lint hirsutum
11 Lc2 Brown lint barbadense , darwinii and
tomentosum
2.9 Molecular study using micro satellite (SSR) markers
Evaluation of the genetic diversity will provide a guide for choosingdesirable parents and predicting the inheritance, variation and heterosis ofthe important agronomic traits of the color cottons. Molecular markeranalysis is a modern technique that discloses genetic differences at theDNA level in plants and is an effective tool for testing genetic diversity ofgermplasm in breeding programs (Jia, 1996; Xie et al., 1998). The researchon color cotton diversity has shifted from the phenotypic, cellular, andbiochemical levels to the DNA level. There are only a few reports on the

genetic diversity of color cotton (Ma et al., 2003; Guo et al., 2004; Zhanget al., 2004). Limited evaluation of color cotton germplasm further restrictscolor cotton improvement, making it necessary to identify and evaluatecolor cotton germplasm systematically. The simple sequence repeat (SSR)marker technique is a fast and convenient method, with goodreproducibility and high veracity which can be used to evaluate cottongermplasm genetic similarity (GS) at the molecular level. Using SSRmarkers, we made a thorough analysis of the genetic relationship andevaluated the genetic diversity of typical color cotton lines. This willprovide some new information for efficient genetic improvement of colorcotton.
In the studies of Dong- Lei et al. (2009), forty brown and twenty onegreen cotton lines were used for genetic diversity study in color cottonanalysed by simple sequence repeat (SSR) markers. To know the differenceamong the genotypes for ten agronomic traits such as boll mass, lint percent, fiber length, fiber strength, microns, uniformity ratio, elongation rate, plant height, number of sympodia and number of bolls.
3. MATERIALS AND METHODS
The proposed research programme was carried out during kharif-2012 atAgricultural Research Station, Dharwad Farm, which is located at 15° 26′ Northlatitude, 76° 7′ East longitude and altitude of 678 m above mean sea level (MSL) in theNorthern transitional zone (Zone No. 8) of Karnataka as obtained from meteorologicaldata of the year kharif-2012.
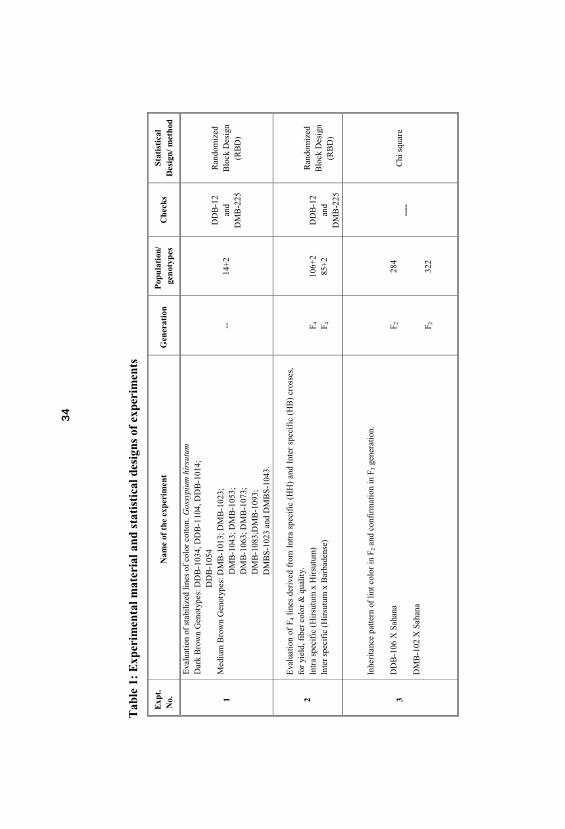
3.1 Experimental material
The field trials consisted of three experiments as detailed in Table 1. The molecular marker study was taken up in one white and three colorlinted genotypes. Experiment was laid out in red loamy soil and plots werehomogeneous with respect to nutrient status. The average rainfall for theyear 2012-13 was 549 mm which was below optimum both in terms of totalprecipitation and distribution (). However 2-4 protective irrigations weregiven at critical crop growth stages to get good crop stand in order torealize its potential expression for fiber and other properties. The details ofthe material used, methods and protocols followed and statistical toolsemployed for analysis, in different experiments are presented under therespective experiments separately.
Based on the intensity of the lint color, scores were assigned to allthe genotypes and the lines as follows,
Lint color Score
Cream color lint 1
Light brown color lint 2
Medium brown color lint 3
Dark brown color lint 4
Tab
le1:
Exp
erim
enta
lmat
eria
land
stat
isti
cald
esig
nsof
expe
rim
ents
Exp
t.
No.
N
ame
ofth
eex
peri
men
tG
ener
atio
nP
opul
atio
n/ge
noty
pes
Che
cks
Stat
isti
cal
Des
ign/
met
hod
1
Eva
luat
ion
ofst
abili
zed
lines
ofco
lor
cotto
n.G
ossy
pium
hirs
utum
Dar
kB
row
nG
enot
ypes
:DD
B-1
034,
DD
B-1
104,
DD
B-1
014;
DD
B-1
054
Med
ium
Bro
wn
Gen
otyp
es:D
MB
-101
3;D
MB
-102
3;
D
MB
-104
3;D
MB
-105
3;
D
MB
-106
3;D
MB
-107
3;
D
MB
-108
3;D
MB
-109
3;
D
MB
S-10
23an
dD
MB
S-10
43.
--14
+2
DD
B-1
2an
dD
MB
-225
Ran
dom
ized
Blo
ckD
esig
n(R
BD
)
2
Eva
luat
ion
ofF 4
lines
deri
ved
from
Intr
asp
ecif
ic(H
H)
and
Inte
rsp
ecif
ic(H
B)
cros
ses,
fo
ryi
eld,
fib
erco
lor
&qu
alit
y.
Intr
asp
ecif
ic(H
irsu
tum
xH
irsu
tum
)In
ter
spec
ific
(Hir
sutu
mx
Bar
bade
nse)
F 4 F 4
106+
285
+2
DD
B-1
2an
dD
MB
-225
Ran
dom
ized
Blo
ckD
esig
n(R
BD
)
3
Inhe
rita
nce
patt
ern
ofli
ntco
lor
inF 2
and
conf
irm
atio
nin
F 3ge
nera
tion.
DD
B-1
06X
Saha
na
DM
B-1
02X
Saha
na
F 2 F 2
284
322
----
Chi
squa
re
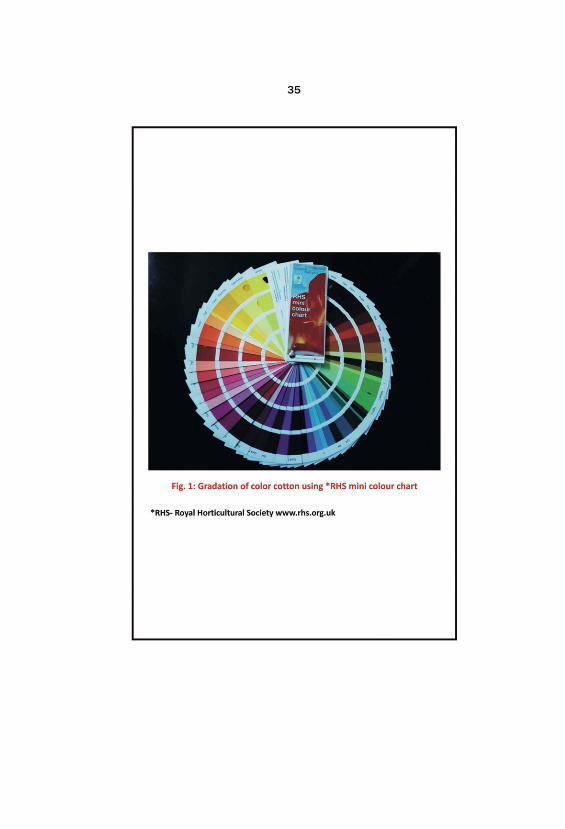


3.1.1 Evaluation of stabilized color cotton genotypes
Stabilized lines of color cotton comprising four dark brown and tenmedium brown color cotton genotypes were evaluated along with twochecks by following RBD in two replications as detailed in Table 1. Genotypes were categorized based on RHS (Royal Horticulture Society), Mini color chart (Fig.1) and photos lint samples are depicted in Plate 1.
3.1.2 Evaluation of F4 lines derived from intraspecific (HH) andinterspecific (HB) crosses in brown color genotypes
Individual plant selections effected in F2 and F3 generation weresown in progeny rows (F4 generation). The selections were effected both inintraspecific Gossypium hirsutum (brown) x Gossypium hirsutum (Sahana-white) and interspecific Gossypium hirsutum (brown) x Gossypiumbarbadense (Suvin-white).
3.1.3 Inheritance study of fiber color in F2 and confirmation in F3
generations derived from brown color and white linted crosses
For the inheritance study of fiber color, F2 population derived out oftwo separate diverse crosses for fiber color, between Dark Brown genotypeand white linted genotype (DDB-106 X Sahana) and similarly MediumBrown genotype and white linted genotype (DMB-102 X Sahana) weresown. Plant to progenies of few F2 plants in different classes of color weregrown for confirmation of inheritance pattern in F3 generation.
3.1.4 Molecular study between the color and white linted Gossypiumhirsutum genotypes
Three color cotton genotypes namely DDB-12 (Dark Brown Color), DMB-225 (Medium Brown Color) and DGC-78 (Green Color) and onewhite linted cotton genotype RAH-100 were used for molecular markerdiversity study using 23 sets of cotton micro satellite markers (SSR) linkedto fiber strength trait as mentioned in Table 2.

Tab
le2:
Lis
tof
SSR
Pri
mer
sus
edfo
rsc
reen
ing
Sl. N
o.
Mar
ker
Nam
eF
orw
ard
Pri
mer
(5’-
3’)
Rev
erse
Pri
mer
(3’-
5’)
1B
NL
3140
(GA
)11
CA
CC
AT
TG
TG
GC
AA
CT
GA
GT
GG
AA
AA
GG
GA
AA
GC
CA
TT
GT
2B
NL
4030
(GT
)10
CC
TC
CC
TC
AC
TT
AA
GG
TG
CA
AT
GT
TG
TA
AG
GG
TG
CA
AG
GC
3B
NL
2570
(GA
)13
TT
CT
AC
AA
AA
AA
AG
AA
AA
AA
TG
GG
AA
AT
AC
GG
AT
GG
GA
CC
AA
CC
4B
NL
3948
(AC
)11
GT
AA
TG
TT
CA
AC
AC
TT
TG
CT
AT
TC
CG
TT
GG
TT
GG
GT
GA
GC
AG
AA
T
5B
NL
3029
(AG
)12
TC
CT
GA
AA
GC
AA
AA
AG
AG
GG
TT
GA
TC
GG
AG
CA
TC
AG
TC
TG
6B
NL
3661
(CT
)17
AG
GA
CA
GC
GA
TG
TG
TT
GT
TG
AT
GG
AA
TG
AA
TA
AA
AT
AA
GA
AC
AA
CG
7B
NL
1122
(AG
)16
TC
GA
TA
AC
GG
CT
AT
AG
TA
AT
CT
CT
CC
AA
CA
AA
TA
AG
CA
GC
CA
AG
AA
A
8B
NL
3806
(TG
)18,
(A
G)1
8,
(AC
)9+N
+(C
A)7
+C
+N
+(C
A)2
+(A
T)5
GA
CA
GG
CC
AG
AC
CA
GA
AC
AT
TC
AA
AC
AA
AG
CA
CA
TA
TA
TA
AT
AC
AC
A
9C
IR07
0A
C8
AA
CC
AC
CA
AC
CA
TT
CA
TG
GG
AC
TC
GG
TC
AT
C
10C
IR24
6T
G6
TT
AG
GG
TT
TA
GT
TG
AA
TG
GA
TG
AA
CA
CA
CG
CA
CG
11C
IR38
1A
C7
TT
TC
CA
TC
CT
TT
TG
TG
AA
AG
GA
GA
AG
AA
CA
AG
CA
A
12C
IR32
8C
A5
AT
CC
CT
AT
GC
TT
GT
CA
TC
AT
TA
CC
AT
TC
AT
TC
AC
CA
C
13C
IR14
8T
G8
CT
AA
TC
TT
TG
GA
TT
CT
AC
CC
TC
CA
AG
CC
CA
GA
TA
AG
T
14C
IR08
1A
C7
AA
AG
AA
CC
CA
TG
AG
AA
GA
GC
TG
TC
TA
TG
TT
GG
TG
G
15C
IR07
8G
T7
TG
CA
TG
AT
GA
AG
TT
AG
AA
CA
TA
AA
TC
CC
AA
GA
AC
16N
AU
923(
TC
TT
TT
)4G
GA
AT
TC
AA
GG
TT
GA
AG
GA
GC
CT
CT
TC
TT
TG
GC
TC
TG
AA
A
17N
AU
1043
(TT
C)1
4G
TA
TC
CG
CC
CA
CA
AA
TA
AA
GG
CA
TC
GT
GA
GA
GA
AA
GT
GA
A
18N
AU
1369
(AG
GC
GG
)3T
GG
CA
GA
GA
TG
AA
TG
TA
AG
CG
GT
AA
CG
GA
TG
GA
AA
AT
CA
C
19N
AU
3654
tga
TT
AC
CA
GC
AG
CC
AA
CA
CT
AA
TC
CC
CT
TC
AA
CA
TC
TT
CT
TC
20N
AU
1218
(AT
)19
TG
TG
AT
GA
AG
AA
CC
CT
CT
CA
CA
CT
CA
AC
CC
AA
TG
AA
AC
AA
21M
USS
501
TC
(8)
GG
CA
GA
CA
AA
AT
CT
AA
GG
GC
TG
AG
GG
TT
TT
AA
CG
GT
GA
GC
22C
IR34
7(A
T)6
+(G
T)7
23JE
SPR
-7G
CT
GA
CG
GA
AG
TG
AC
AG
GA
CC
CT
GT
CT
CC
TT
CC
CC
TT
CC
TC
TT
CT
TC

3.2 Methodology
3.2.1 Experimental layout
Three independent field experiments as detailed in Table 1 wereconducted; experiments 1 and 2 were laid out in randomized block design(RBD) in two replications. The two checks DDB-12 and DMB-225 wereused in both the experiments 1 and 2.
3.2.1.1 Evaluation of stabilized lines of color cotton
Fourteen stabilized lines as detailed in Table 1 were grown alongwith two checks DDB-12 and DMB-225 in two replications by followingRandomized Block Design during Kharif 2012-13. Each replication hadone block within which each genotype were sown in four lines withspacing of 90 x 20 cm.
3.2.1.2 Evaluation of F4 lines derived from intraspecific (HH) andinterspecific (HB) crosses in brown color genotypes
One hundred and six intra hirsutum (HH) and eighty five interspecific (HB) F4 lines as detailed in I and III were grown along with twochecks DDB-12 and DMB-225 in two replications by following RBDduring kharif 2012-13.
3.3 Observations recorded
Five plants at random in each plot were chosen leaving 1m distancefrom line end and labeled for recording observations in the above mentionedexperiments. The mean of five plants was used for statistical analysis. Dataon morphological, yield and fiber parameters were recorded.
3.3.1 Morphological and yield characters
1. Plant height (cm)
Plant height was measured in centimeters from the base of the plantto the apex of the plant at maturity.
2. Number of monopodia per plant
Number of branches on main stem which were lateral and axillaryin position with vertical growth in acropetal succession was counted atmaturity stage, avoiding small sprouts.
3. Number of sympodia per plant
Branches which are extra axillary in position and normally horizontal with zigzag pattern of fruiting points were taken as sympodia, the number of such sympodia on main stem were counted at maturitystage.
4. Number of bolls per plant
The number of bolls on the plant, which contributed to seed cottonyield were counted and recorded at the time of harvest.
5. Boll weight (g)
Seed cotton obtained from a random sample of 20 bolls collectedfrom each genotype was used to determine the per boll weight in grams.
6. Seed cotton yield (q ha-1)
The seed cotton yield harvested till final picking from the twolines in each replication was expressed in quintals per ha.
7. Seed index (g)
Hundred seeds were weighed to determine the seed index in grams.
8. Lint index (g)
It is the weight of lint obtained from 100 seeds and expressed ingrams. This was calculated by using the formula,
Weight of 100 seeds × Ginning out turn
Lint index = -------------------------------------------------------
100 - Ginning out turn

9. Ginning out turn (%)
A random sample of 300 g seed cotton from each entry was ginnedand the lint yield obtained from it was utilized for working out the GOT byusing the formula,
Weight of lint (g)
Ginning outturn (%) = ------------------------------ x 100
Weight of seed cotton (g)
10. Days to 50% flower opening
The number of days taken to produce flowering in 50 per cent ofplants in each line is considered as days to 50 per cent flowering.
11. Days to boll opening
The numbers of days required for first boll open was recorded.
12. Fiber color recorded
Fiber color for all the experiments mentioned as in Table 1 wasrecorded visually.
3.3.2 Fiber quality characters
The fiber quality is determined by parameters like fiber length, fineness, maturity, uniformity and strength. The fiber quality analysis wascarried out by CIRCOT unit ARS, Dharwad as per CIRCOT standards.
1. 2.5 per cent span length (mm)
2.5 per cent span length (mm) is defined as the distance spanned by a specified percentage of fiber in the specimen being tested. Fiber length at 2.5 per cent span was estimated by using HVI andexpressed in millimeters.
2. Micronaire value (µg/in)
It is the average weight per unit length of fiber. It is used in
determining the fiber fineness. Linear density of fiber is expressed inmicrograms per inch.
3. Fiber strength (g/tex)
It is the force required to break of fiber of unit linear density. Fiber strength was determined by using HVI. It was expressed in g/tex.
4. Uniformity ratio (%)
Ratios of 50 per cent span length to 2.5 per cent span length. Itindicates the uniformity of fiber length. Fiber uniformity ratio was estimatedby using HVI and expressed in percentage.
50% span length
Uniformity ratio (%) = ---------------------------- x 100
2.5% span length
5. Maturity coefficient
It is an index of extent of fiber development. The maturity dependsmainly on the degree of secondary thickening of fiber. The ratio of lumenand cell wall is less than one in case of mature fiber, 1-2 for half maturefiber and more than two for immature fiber. Fiber maturity was determinedby using High Volume Instrument (HVI).
3.4 Statistical analysis
The data recorded were used to derive statistical parameters viz.range, mean, standard error and coefficient of variation for all traits. Thedata was subjected to randomized block design analysis. The data wasanalyzed using software, Windostat version 8.5. The statistical methodsadopted were as follows.
3.4.1 Phenotypic data analysis
Sum of observations of all the plants for each genotype
i. General mean (⎯X) = ——————————————————————
Number of plants

ii. Range = The minimum and maximum values for each trait within population
σe
iii. Coefficient of variation = —— x 100
⎯X
Where, σe = Square root of error variance, ⎯X = General mean of the character
3.4.1.1 Analysis of variance (ANOVA)
Analysis of variance as outlined by Cochram and Cox (1959) wascomputed by using mean values of genotypes for different characters. TheANOVA is as follows.
Source DfSum ofsquares
Mean Sum ofSquares
Expected sumof squares
Replication
Genotype
Error
Total
(r-1)
(g-1)
(r-1) (g-1)
(rg-1)
RSS
GSS
ESS
TSS
MSS r
MSS g
MSS e
σ²e + r σ²g
σ²e
Where,
r = Number of replication
g = Number of genotypes
MSS r = Mean sum of squares due to replication
MSS g = Mean sum of squares due to genotypes
MSS e = Mean sum of squares due to error
σ²g = Genotypic variance
σ²e = Error variance
Significance was tested by comparing calculated F values to table Fat 1 per cent and 5 per cent level of significance.
3.4.2 Estimation of genetic parameters
In order to assess and quantify the genetic variability among thegenotypes for the characters under study, the following parameters wereestimated.
3.4.3 Estimation of variance components
Phenotypic and genotypic variances were estimated using thefollowing formula.
MSS(genotypes) – MSS(error)
Genotypic variance (σ²g) = ⎯⎯⎯⎯⎯⎯⎯⎯⎯⎯⎯⎯⎯⎯
Number of replications
Phenotypic variance (σ²p) = σ²g + σ²e
3.4.4 Genotypic coefficient of variability (GCV)
σg
GCV (%) = ⎯⎯⎯⎯ x 100
⎯X
3.4.5 Phenotypic coefficient of variability (PCV)
σp
PCV (%) = ⎯⎯⎯⎯ x 100
⎯X
Where,
σg = Genotypic standard deviation
σp = Phenotypic standard deviation
X = General mean of the characters

GCV and PCV values were categorized as low, moderate and high asindicated by Sivasubramanian and Menon (1973).
0-10% : Low
10-20% : Moderate
20% and above : High
3.4.6 Heritability (Broad Sense)
Heritability in broad sense was estimated as the ratio of genotypic tothe phenotypic variance and was expressed in percentage.
σ²g
Heritability (h²) (%) = ⎯⎯⎯ x 100
σ²p
The heritability was categorized as low, moderate and high as givenby Robinson et al. (1949).
0-30% : Low
30-60% : Moderate
60% and above : High
3.4.7 Genetic Advance (GA)
The extent of genetic advance to be expected from selecting five percent of the superior progeny was calculated by using the following formula.
Genetic advanced (GA) = ih² σp
i = Intensity of selection
h² = Heritability in broad sense
σp = Phenotypic standard deviation
The value of i was taken as 2.06 assuming 5 per cent selection intensity.

3.4.8 Genetic Advance over Mean (GAM)
Genetic advance over mean was estimated using the followingformula
GA
GAM = ⎯⎯⎯ x 100
⎯X
Where,
GA = Genetic advance
X = general mean of the character
Genetic advance as per cent mean was categorized as low, moderateand high as given by Johnson et al. (1955).
0-10% : Low
10-20% : Moderate
20% and above : High
3.4.9 Estimation of correlation coefficient
In all the F4 lines, the simple correlation coefficients were calculatedto determine the direction and magnitude of associations among differentcharacters and tested against table‘t’ values (Fisher and Yates, 1963) at (n-2) degree of freedom both at 0.05 and 0.01 probability levels for theirsignificance. Simple correlations were calculated by using the formula,
Cov (x y)
r = ----------------
σx σy
Where,
Cov (x.y) = Covariance of x and y
σx = Standard deviation of x
σy = Standard deviation of y
3.5 Intergeneration (F3 – F4) correlation and Regressionanalysis
Correlation co-efficient of quantitative trait yield per plant, qualitative traits fiber length and uniformity ratio between F3 and F4
generation was found out by calculating the phenotypic correlationcoefficient taking the same character in both the generations.
Intergeneration correlation coefficient analysis was done for twopopulations comprising of intra hirsutum (HH) and inter specific (HB) ofselected F3 and F4 progenies for the traits mentioned above.
3.5.1 Narrow sense heritability estimates
Narrow sense heritability estimates were made based on theregression of F4 on F3 using the following formula (Cahaner and Hillet, 1980).
b (F4F3) =
Regression of three characters between F4 and F3 was found out bycalculating the regression coefficient taking the same character in both thegenerations. Regression coefficient between F4 and F3 generations wasestimated as heritability value using multiplicative factor of 2\3 or 0.67. Heritability estimates were computed for both the populations separatelyfor comparison.
3.6 Inheritance study of fiber color in F2 and confirmation inF3 generations derived from brown color and whitelinted crosses
Covariance of F3F4
Variance of F3
F2 seed material derived from two crosses, of color and white parentsviz., Medium Brown genotype X white linted genotype (DMB-102 XSahana) and Dark Brown genotype X white linted genotype (DDB-106 XSahana) were sown with spacing of 90 x 20 cm and studied for segregationpattern of fiber color.
The F2 plants of both these crosses were observed for lint color usingRoyal Horticulture Society mini color chart and classified into white, orange brown, light yellow brown, and yellow brown colors.
Based on those color categories, completely opened boll fromselected F2 plants from both the crosses and were used for advancing to F3
generation. Observation was made for lint color in every line of F3 andobserved for segregation for fiber color.
3.7 Molecular marker study between the color and whitelinted Gossypium hirsutum genotypes
3.7.1 DNA extraction
DNA extraction was done using CTAB method with some modifications.
1. One to two grams of fresh weight of young leaves from shoot apex oftwo to three leaf seedlings was taken in micro centrifuge tube andproperly labeled.
2. 400 ml of extraction buffer was added to micro centrifuge tubescontaining the sample.
3. The tissue was crushed until it become fine.
4. The samples were kept at 650C for 30 min.
5. Balanced tubes were centrifuged for 5 min at 13,000 rpm.
6. Supernatant was transferred to another micro centrifuge tube.
7. Equal volume of chloroform: IAA (Indole Acetic Acid) was added tothe tube and centrifuged at 13,000 rpm for 5 min.
8. Supernatant was transferred to new micro centrifuge tube.
9. Equal volume (100 μl) of pre-chilled Isopropenol was added andcentrifuged for 10 min at 13,000 rpm.
10.Decant the supernatant.
11.The DNA pellet obtained was washed with 70 per cent ethanol and thetubes were inverted on blotting paper to air dry the pellet.
12.Later, DNA was suspended in 100 μl T10 E1 buffer and stored at -200C(pH 8.4).
3.7.2 DNA quantity and quality estimation
The concentration of DNA was assessed spectrophotometrically andalso by gel electrophoresis using 0.8 per cent agarose gel with knownconcentrations of uncut DNA.
To test the quality of DNA, samples were run on 0.8 per cent agarosegel with 1X TAE buffer and stained with ethidium bromide and checkedfor contamination by RNA (which usually runs ahead) (RNA is to beremoved by RNAase) and the DNA was evaluated by comparing it with astandard undigested DNA sample. Serial dilutions were carried out to getdesired quantity (30 mg) of DNA for PCR.
3.7.3 Requirements for polymerase chain reaction
1. Template DNA: Purified genomic DNA (40ng) of recombinant linewas used as template DNA per reaction.
2. SSR primers: Primers information obtained from cotton marker database were used in the present study.
3. dNTPs: Individual dNTPs, dATP, dGTP, dCTP and DTTP obtainedfrom M/S Bangalore Genei, Pvt. Ltd., Bangalore were used.
4. Taq DNA polymerase: Taq DNA polymerase (3units per µl) and 10xTaq buffer were obtained from M/S Bangalore Genei Pvt. Ltd., Bangalore.

5. Thermal cycler: Eppendorf, Master cycler gradient supplied byEppendorf, 2231, Hamburg Germany was used for cyclic amplificationof DNA.
3.7.4 Amplification reaction mixture
One primer at a time was used to study the polymorphism betweengenotypes by PCR assay. Master mix required was prepared afresh togetherto avoid handling errors. The master mix was distributed uniformly (17μl/tube) and 3 μl of template DNA from respective genotypes was added tomake the total reaction volume to 20 μl.
Sl. No. Components Quantity
1. 10X assay buffer 2.0 μl
2. dNTP mix (2.5 mM each) 1.6 μl
3. Primer (5 pM/μl)
a. Forward (5 pM/μl) 2.0 μl
b. Reverse (5 pM/μl) 2.0 μl
4. Taq DNA polymerase (3U/μl) 0.2 μl
5. Template DNA (15 ng/μl) 3.0 μl
6. Sterile double distilled water 7.6μl
3.7.5 The Thermo profile PCR
The PCR amplification for SSR analysis was performed according toWilliams et al. (1990) with certain modifications. The amplificationconditions were as follows,

Sl. No.
StepsTemperature
(0C)Duration
(min)No. ofcycles
1. Denaturation (initial) of genomicDNA
94 5 1
2. Denaturation of DNA 94 1
3. Annealing of primers 48 + 5 1
4. Extension of primers 72 1
5. Final extension of primers 72 5 1
6. Hold (storage) 4 ∞ -
After the completion of the PCR, the products were stored at 4oCuntil the gel electrophoresis was done.
3.7.6 Electrophoresis
PCR products were confirmed for amplification on 1.2 % agarose gelbefore loading them in the sequencing gel. For separation of amplifiedDNA fragments, non-denaturing polyacrylamide gel electrophoresis(PAGE) and capillary electrophoresis (ABI 3700) were employed.
3.7.7 Non-Denaturing gel electrophoresis
After PCR amplification, one µl of orange dye was added to 5 µlreaction mixture and mixed by short spinning. 2.5 µl of this reactionmixture was loaded in each lane of 96 track of 6% non-denaturing PAGEusing multichannel pipette (Finipipette) and the 100 base pair ladder wasloaded after every 24 samples. 75 ml of 6 % non-denaturingpolyacrylamide gel was sufficient for Biorad PAGE unit. The recipe for 75ml of gel consisted of 7.5 ml of 10X TBE buffer, 15 ml of 29:1 (w/w)acrylamide: bisacrylamide, 53 ml distilled water, 450 µl of Ammonium persulphate (APS) and 100 µl of TEMED. After polymerization, the gel platewas set for pre-running for 10 minutes at 750 volts to warm the plate. Then
25

the samples were loaded. Electrophoresis was run at 800 volts for 2 hours30 minutes or until the desired resolution has been reached (determined bythe dye front) using 0.5 X TBE running buffer.
Amplified products were then visualized by using silver stainingprotocol (Kolodny 1984). Initially the gel was rinsed in distilled water for3-5 minutes with gentle shaking followed by soaking the gel in 1.5 liters of0.1% CTAB for 12-15 minutes and then kept in 1.5 liters of 0.3% liquidammonia for 15 minutes with gentle shaking. In the next step, the gel wasplaced in silver nitrate solution (1.5 g silver nitrate, 6 ml of 1M NaOH, in1.5 liters of water and then titrated with 6-8 ml of 25 per cent ammoniauntil the solution became clear) for 15 minutes with gentle shaking. Thenthe gel was cleaned with distilled water to stop further staining. In the laststep, the gel was kept in developer solution (22.5 g of sodium carbonate +400 µl of formaldehyde in 1.5 µl of distilled water) until the bands becamevisible.
The gel was kept in water for 5 minutes to remove the gel debrisattached to another side of plate and to stop further staining.
3.7.8 Marker Diversity Analysis
Four genotypes of Gossypium hirsutum cotton genotypes selectedbased on the basis of phenotypic polymorphic and pedigree. Out of fourgenotypes one was white genotype (RAH 100) and other three were colorcotton genotypes (DDB-12, DMB-225, and DGC-78). All the 4 cottongenotypes were subjected for DNA profiling for a preliminary study togenetic relatedness among the genotypes mentioned. We used 23 SSRprimers specific for boll development, primer information as detailed inTable 2. After observing the PCR electrophoresis results, the bands ofDNA fragments were scored as present (1) or absent (0). Genetic diversityanalysis was made on the basis of these scores.
The statistical methods and formulae used were as follows:
1. Simpson diversity index, also known as polymorphism informationcontent:

PIC= 1- p2i
Where: pi represents the variation in frequency of the ith allele.
2. GS coefficients (Jaccard’s coefficients) among varieties, calculatedusing the ‘‘Qualitative Date’’ program of NTSYSpc2.0 software(Biostatistics, New York).
3. Clustering analysis performed using NTSYS-pc (ver. 2.0 a), to calculatethe GS matrices, and dendrograms constructed by UPGMA.
3.8 Identification of superior F4 lines for productivity andFiber length
To assay the potentiality of different F4 lines sorting was donepopulation wise for different lint colors, lines showing better performancefor yield, fiber length and yield and fiber length, were identified based onmean ± SD (Standard deviation) in both the F4 populations.

4. EXPERIMENTAL RESULTS
The results of the present study on evaluation of color cottonGossypium hirsutum genotypes are presented under the following headings.
4.1 Evaluation of stabilized color cotton genotypes for yield, yieldattributing and fiber traits.
4.2 Evaluation of F4 lines of brown color cotton derived fromintraspecific (HH) and interspecific (HB) crosses for yield, yieldattributing and fiber traits.
4.3 Intergeneration correlation and regression analysis.
4.4 Inheritance study of fiber color in F2 and confirmation in F3
generation derived from diverse crosses of color and whitelinted (Gossypium hirsutum) genotypes.
4.5 Molecular marker studies in white and color cotton Gossypiumhirsutum genotypes.
4.1 Evaluation of stabilized color cotton genotypes for yield, yield attributing and fiber quality traits
4.1.1 Analysis of variance for yield and yield attributing traits instabilized genotypes of color cotton
Sixteen stabilized genotypes including two checks (DDB-12 andDMB-225) were evaluated for days to 50% flowering, days to first bollopening, boll weight, plant height, number of sympodia, number ofmonopodia, number of bolls per plant, ginning out turn, seed index, lintindex and seed cotton yield characters. The mean sum of squares (MSS) forall the characters studied is presented in Table 3. From the table it is clearthat all the traits studied exhibited significant mean sum of squaresindicating the presence of highly significant variation in the genotypesstudied.
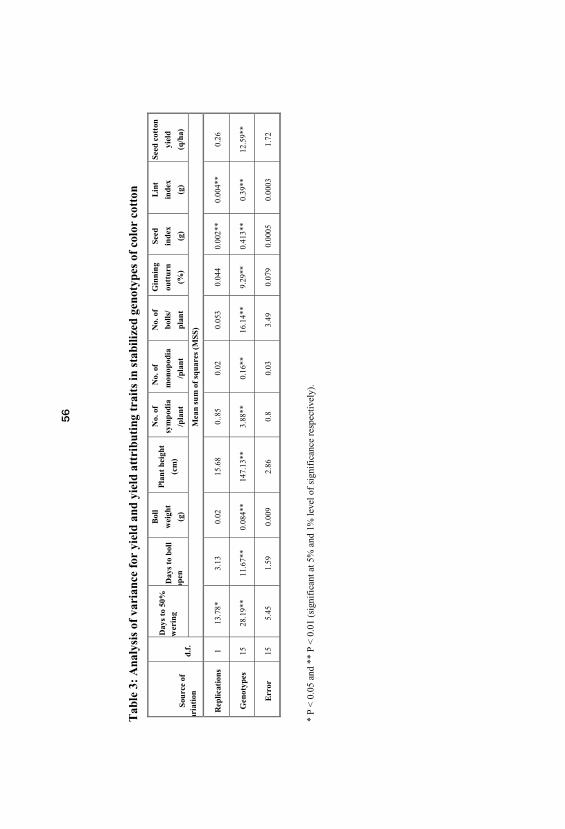
Tab
le3:
Ana
lysi
sof
vari
ance
for
yiel
dan
dyi
eld
attr
ibut
ing
trai
tsin
stab
ilize
dge
noty
pes
ofco
lor
cott
on
Sour
ceof
aria
tion
d.f.
Day
sto
50%
ower
ing
Day
sto
boll
open
Bol
l
wei
ght
(g)
Pla
nthe
ight
(cm
)
No.
of
sym
pod
ia
/pla
nt
N
o. o
f
mon
opod
ia
/pla
nt
No.
of
bolls
/
plan
t
Gin
ning
outt
urn
(%)
Seed
inde
x
(g)
Lin
t
inde
x
(g)
Seed
cott
on
yiel
d
(q/h
a)
Mea
nsu
mof
squa
res
(MSS
)
Rep
licat
ions
113
.78*
3.13
0.02
15.6
80.
.85
0.02
0.05
30.
044
0.00
2**
0.00
4**
0.26
Gen
otyp
es15
28.1
9**
11.6
7**
0.08
4**
147.
13**
3.88
**0.
16**
16.1
4**
9.29
**0.
413*
*0.
39**
12.5
9**
Err
or15
5.45
1.59
0.00
92.
860.
80.
033.
490.
079
0.00
050.
0003
1.72
*P
<0.
05an
d**
P<
0.01
(sig
nifi
cant
at5%
and
1%le
velo
fsi
gnif
ican
cere
spec
tive
ly).
4.1.2 Mean performance of stabilized color cotton genotypes
The data collected on each of the characters studied in 14 stabilizedlines and two checks DDB-12 (Dharwad Dark Brown-12) and DMB-225(Dharwad Medium Brown-225) is presented in Table 4. The mean valuesfor different traits were obtained by using statistical package Windostat 8.5version.
4.1.2.1 Days to 50 per cent flowering
The genotype DMBS-1043 recorded maximum of 81 days for 50 percent flowering and similar observation was seen in the check DMB-225indicating these genotypes were late flowering and the genotypes DMB-1053, DMB-1013 and DMB-1043 were early flowering types (70 days). Whereas DDB-12 recorded 75.5 days to 50 per cent flowering as detailedin Table 4.
4.1.2.2 Days to first boll opening
The highest mean value (140 days) for days to first boll opening wasobserved in the genotype DMBS-1043 and early boll opening wasexhibited by the genotype DMB-1073 (133 days). However, in the checkDDB-12, first boll opening was seen at 138.5 days (Table 4).
4.1.2.3 Boll weight (g)
Among all the stabilized genotypes evaluated, the highest bollweight (3 g) was recorded in the medium brown genotype DMB-1053 andthe lowest (2.25 g) was recorded in the dark brown genotype DDB-1054. Average boll weight in two checks, DMB-225 and DDB-12 was 2.4 g and2.75 g respectively. The genotypes DMB-1073, DMBS-1043, DMB-1053, DMB-1083, DMBS-1023, DMB-1023, DMB-1013, DMB-1043 and DMB-1063 were superior over the check DMB-225. However, none of thegenotypes showed increased boll weight over the check DDB-12 (Table 4).
4.1.2.4 Plant height (cm)
The genotype DMBS-1043 recorded highest plant height of 117.4cm and dwarf plants (88.5 cm) were observed in the genotype DDB-1014.

The checks DMB-225 and DDB-12 recorded 94.5 cm and 106.4 cm for thetrait respectively as detailed in Table 4.
4.1.2.5 Number of sympodia
The genotype, DMB-1093 recorded highest number of sympodiaper plant (21.85) and the genotypes, DDB-1054 and DDB-1014 recordedlowest number (16.5) of sympodia per plant. The two checks, DMB-225and DDB-12 recorded 17.3 and 19.5 sympodia per plant respectively. Thegenotypes DMB-1073, DMBS-1043, DMB-1083, DMBS-1023, DMB-1093 and DMB-1063 were observed to be superior to the check DMB-225. In dark brown lint color class, none of the genotypes were superior over thedark brown check DDB-12 (Table 4).
4.1.2.6 Number of monopodia
Average number of vegetative branches per plant was 1.65. Highestnumber of monopodia per plant (2.5) was observed in the genotype DMBS-1043 whereas the genotypes DMBS-1023 and DMB-1093 recorded lowestnumber (1.3) of monopodia per plant. The mean values for the trait in thechecks DMB-225 and DDB-12 were 1.7 and 1.5 numbers respectively(Table 4 and 5).
4.1.2.7 Number of bolls per plant
Average numbers of bolls per plant was 18. Highest number of bollsper plant (26 bolls) was recorded in the medium brown check DMB-225and the genotype DMB-1013 had the lowest number of bolls per plant (13bolls). The dark brown check DDB-12 recorded 20 bolls per plant. Nogenotypes recorded superior to both the checks. However, the genotypesDDB-1054, DDB-1014, DDB-1104 and DDB-1034 were on par with thedark brown check DDB-12 (Table 4 and 5).
4.1.2.8 Ginning out turn (%)
Highest (41.03 per cent) and lowest (34.45 per cent) Ginning outturn (GOT) was recorded in the genotype DMB-1083 and in the checkDMB-225. The mean GOT value of the dark brown check DDB-12 was34.71 per cent. The genotypes DMB-1073, DMBS-1043, DMB-1053,
DMB-1083, DMBS-1023, DMB-1023, DMB-1093, DMB-1013, DMB-1043 and DMB-1063 were superior over the medium brown check DMB-225 and the genotypes DDB-1054, DDB-1014 and DDB-1104, were betterthan dark brown check DDB-12 (Table 4).
4.1.2.9 Seed index (g)
Average seed index recorded was 5.99 g; the genotype DMB-1053exhibited high seed index (6.78 g) and lowest seed index (5.23 g) wasrecorded in the genotype DMB-1093. The checks recorded seed index of5.89 g and 5.82 g in the medium brown DMB-225 and in the dark brownDDB-12 respectively. The genotypes DMBS-1043, DMB-1053, DMB-1083, DMBS-1023, DMB-1013 and DMB-1043 were superior over thecheck DMB-225 and the genotype DDB-1034 was found superior to thecheck DDB-12 and DDB-1014 was on par as detailed in Table 4 and 5.
4.1.2.10 Lint index (g)
Among all the genotypes, DMBS-1043 exhibited highest lint index(4.45 g), and lowest lint index (3.09 g) was recorded in the check DMB-225. The mean value of the dark brown check DDB-12 was 3.14 g. Thegenotypes DMB-1073, DMBS-1043, DMB-1053, DMB-1083, DMBS-1023, DMB-1023, DMB-1093, DMB-1013, DMB-1043 and DMB-1063recorded superior values compared to the check DMB-225. The genotypesDDB-1014 and DDB-1104 were superior over the dark brown check DDB-12 (Table 4)..
4.1.2.11 Seed cotton yield (q/ha)
Average seed cotton yield obtained was 13.27 q/ha; Highest yield(18.45 q/ha) was observed in the medium brown check DMB-225. Themean yield potential of dark brown check DDB-12 was 13.05 q/ha. Thegenotypes DDB-1014 and DDB-1104 performed better than the dark browncheck DDB-12. However, no genotypes in medium brown class weresuperior to the medium brown check DMB-225 (Table 4 and 5).
4.1.2.12 Fiber length (mm)

Mean fiber length was 20.29 mm; the genotype DMBS-1043recorded longest fiber length (25.28 mm). In contrast, DMB-1093 genotypefalling in same lint score had shortest fiber (18.5 mm). The genotype DDB-1053 resulted with fiber length of 18.53 mm. The checks DMB-225 andDDB-12 recorded 20.24 mm and 20.84 mm respectively. Among all thegenotypes for medium brown lint color class, DMB-1073, DMBS-1043, DMB-1083, DMBS-1023, DMB-1043 and DMB-1063 had better fiberlength than the check DMB-225. None of genotypes in dark brown lintcolor class were better than the dark brown check DDB-12 (Table 4).
4.1.2.13 Uniformity Index
The genotype DMBS-1043 recorded highest uniformity index (80.7)and lowest uniformity index (73.4) was observed in the genotype DDB-1054. The mean value for the trait in the checks DMB-225 and DDB-12recorded 78 and 77.1 respectively. The genotypes DMBS-1043 and DMB-1063 were superior to the medium brown check DMB-225 and thegenotype DDB-1034 was superior over the check DDB-12 (Table 4).
4.1.2.14 Fiber fineness (µ/in)
Average micronaire value was 2.93 µ/in; the lowest value (2.51µ/in) was observed in the medium brown check DMB-225 and the highestvalue (3.48 µ/in) was observed in the genotype DMB-1053 respectively. Dark brown check DDB-12 recorded 2.83 µ/in (Table 4).
4.1.2.15 Fiber strength (g/tex)
Mean value for fiber strength was 22.7 g/tex and the fiber strengthvalues ranged from 19.8 to 26.1 g/tex. The highest value for the fiberstrength was recorded in the genotype DMB-1093. Checks DMB-225 andDDB-12 recorded 22.3 g/tex and 20.9 g/tex respectively. The genotypesDMB-1053, DMB-1023, DMB-1093 and DMB-1013 were superior to themedium brown check DMB-225 and the genotypes DDB-1054, DDB-1014, DDM-1104 and DDB-1034 were better than the dark brown checkDDB-12 as detailed in Table 4.

Tab
le4:
Mea
npe
rfor
man
ceof
stab
ilize
dco
lor
cott
onge
noty
pes
Sl. N
o.
Gen
otyp
esD
FD
BO
BW (g)
PH
(cm
)N
SN
MB
PP
GO
T%
SI (g)
LI
(g)
SCY
(q/h
a)
UH
ML
(mm
)U
IM
icro
nair
eva
lue
Ten
acit
tex)
Elg
. %
Scor
efo
r
Lin
tol
or
1D
MB
-107
371
.013
32.
911
3.3
19.1
1.9
1837
.89
5.77
3.52
15.7
521
.28
75.4
3.37
21.0
6.7
3
2D
MB
S-10
4381
140
2.7
117.
419
2.5
2040
.25
6.67
4.45
15.7
225
.28
80.7
3.15
20.5
6.2
3
3D
MB
-105
370
.013
73.
093
.317
.01.
717
38.4
46.
784.
2014
.50
18.9
475
.63.
4824
.56.
93
4D
MB
-108
371
.513
3.5
2.6
103.
517
.85
1.9
1841
.03
6.25
4.35
13.3
421
.51
76.5
2.78
19.8
6.7
3
5D
MB
S-10
2372
136
2.55
108.
918
.61.
315
37.8
06.
173.
7611
.78
20.4
477
.52.
7322
.06.
93
6D
MB
-102
378
.513
6.5
2.5
110.
117
.41.
719
40.3
85.
703.
8711
.12
19.3
474
3.03
24.1
7.0
3
7D
MB
-109
371
.013
42.
2511
5.0
21.8
51.
319
40.1
25.
233.
5610
.80
18.5
077
.53.
1326
.16.
83
8D
MB
-101
370
.013
3.5
2.5
107.
217
.61.
513
36.8
86.
433.
7910
.69
19.4
578
2.84
23.7
6.9
3
9D
MB
-104
370
.013
32.
6510
4.8
16.9
1.7
1638
.46
6.67
4.16
10.0
921
.67
76.4
2.7
20.2
6.6
3
10D
MB
-106
372
.013
6.5
2.6
111.
618
.31.
515
36.9
95.
713.
369.
5520
.66
78.3
2.54
21.0
6.9
3
11D
DB
-105
471
133
2.25
92.6
16.5
1.5
1938
.09
5.49
3.39
15.9
718
.53
73.4
3.06
22.7
7.1
4
12D
DB
-101
474
137
2.45
88.5
16.5
1.7
1835
.88
5.82
3.27
14.4
819
.23
75.8
2.86
247.
14
13D
DB
-110
473
134
2.50
102.
617
.61.
518
39.6
35.
633.
7214
.42
19.2
376
.33.
124
.66.
94
14D
DB
-103
471
136.
52.
4510
9.9
19.2
1.5
1834
.49
5.89
3.14
12.6
419
.50
78.2
2.76
25.3
6.8
4
Che
cks
DM
B-2
2581
140
2.4
94.5
17.3
1.7
2634
.45
5.89
3.09
18.4
520
.24
782.
5122
.36.
93
DD
B-1
275
.513
8.5
2.75
106.
419
.51.
520
34.7
15.
823.
1413
.05
20.8
477
.12.
8320
.96.
94
DF
–D
ays
to50
%fl
ower
ing
DB
O–
Day
sto
boll
open
BW
–B
ollw
eigh
t
PH–
Plan
thei
ght
NS
–N
umbe
rof
sym
podi
a
NM
–N
umbe
rof
mon
opod
ia
BPP
–B
olls
per
plan
t
GO
T–
Gin
ning
outt
urn
SI–
Seed
inde
x
L
I–
Lin
tind
ex
SCY
–Se
edco
tton
yiel
d
2.5%
SL–
2.5%
span
leng
thU
I–
Uni
form
ity
Inde
x
E
lg. -
Elo
ngat
ion
%
4.1.2.16 Fiber Elongation (%)
The dark brown genotypes DDB-1054 recorded highest fiberelongation of 7.1 %. The value of both medium brown check DMB-225and dark brown check DDB-12 was 6.9 per cent as detailed in Table 4.
4.1.3 Variability and heritability parameters
Magnitude of variability present was significant for all the charactersstudied. The values of mean, range, coefficient of variation, heritability, genetic advance and genetic advance as per cent mean for eleven traits arepresented in Table 5.
4.1.3.1 Days to 50 per cent flowering
The trait recorded low GCV (4.60 %) and PCV (5.12 %) with highbroad sense heritability (80 %). However, genetic advance (6.24 %) andgenetic advance as per cent mean (8.52 %) for the trait were low.
4.1.3.2 Days to first boll opening
GCV (1.65 %) and PCV (1.78 %) observed for the trait was low. Broad sense heritability (86 %) recorded was high. Low genetic advanceand genetic advance as per cent mean for the trait were recorded 4.29 and3.17 per cent respectively.
4.1.3.3 Boll weight (g)
The trait recorded low GCV and PCV for the trait, the values being, 7.52 and 7.98 per cent respectively. High broad sense heritability (89 %)coupled with low to moderate genetic advance (0.37 %) and geneticadvance as per cent mean (14.61 %) respectively.
4.1.3.4 Plant height (cm)
Range varied from 88.5 cm to 117.4 cm with mean plant height of104.8cm. The trait recorded low GCV (8.10 %) and PCV (8.18 %). Highbroad sense heritability (98 %) coupled with moderate genetic advance(17.33 %) and genetic advance as per cent mean (16.52 %) were observed.

4.1.3.5 Number of sympodia
Mean value for number of sympodia per plant was 16.4 and rangedfrom 16.5 to 21.85. Low GCV (6.82 %) and PCV (7.68 %) were observedfor the trait. Broad sense heritability (79 %) was high. Genetic advance andgenetic advance as per cent mean for the trait was low (2.26 %) tomoderate (12.49 %) respectively.
4.1.3.6 Number of monopodia
Moderate GCV (15.73 %) and PCV (17.43 %) were recorded for thetrait. High broad sense heritability (82 %) was recorded. However, lowgenetic advance (0.48 %) and high genetic advance as per cent mean (29.24%) was observed respectively.
4.1.3.7 Number of bolls per plant
Range for the number of bolls per plant varied from 13 to 26 andmean value for the trait was 18 numbers. The trait recorded moderate GCV(13.88 %) and PCV (15.68 %). High broad sense heritability (78 %)coupled with high (25.30 %) genetic advance as per cent mean and low(4.58 %) genetic advance was obtained for the trait.
4.1.3.8 Ginning out turn (%)
Low GCV (5.67 %) and PCV (5.09 %) were recorded for the traitrespectively. Broad sense heritability (99 %) was high. Genetic advancewas low (4.40 %) and genetic advance as per cent mean for the trait wasmoderate (11.63 %).
4.1.3.9 Seed index (g)
The trait recorded high broad sense heritability (99 %) coupled withmoderate (15.62 %) genetic advance as per cent mean, low (0.94 %)genetic advance along with low GCV (7.58 %) and PCV (7.58 %).
4.1.3.10 Lint index (g)
Moderate GCV (12.03 %) and PCV (12.04 %) with high broad senseheritability (99 %) coupled with high genetic advance as per cent mean(24.78 %) and low genetic advance (0.9 %) for the trait was observed.
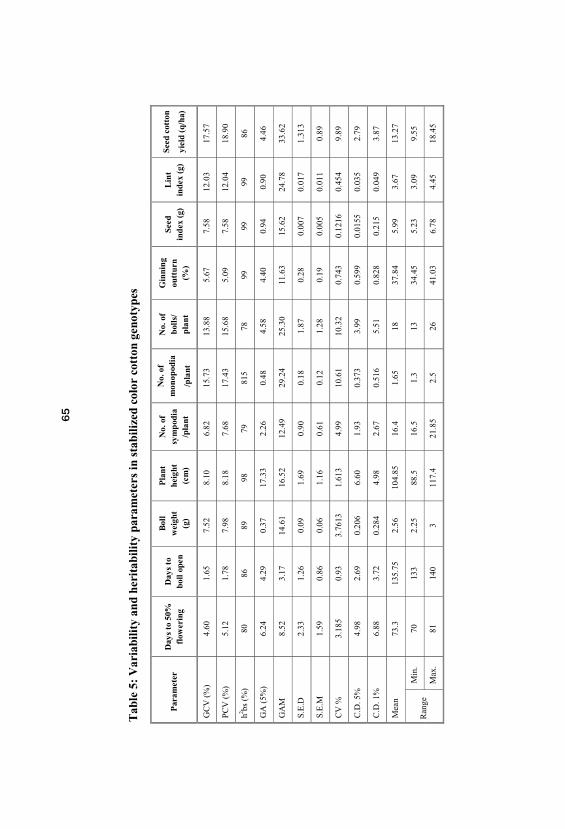
Tab
le5:
Var
iabi
lity
and
heri
tabi
lity
para
met
ers
inst
abili
zed
colo
rco
tton
geno
type
s
Par
amet
erD
ays
to50
%fl
ower
ing
Day
sto
boll
open
Bol
lw
eigh
t(g
)
Pla
nthe
ight
(cm
)
No.
of
sym
pod
ia/p
lant
No.
of
mon
opod
ia
/pla
nt
No.
of
bolls
/pl
ant
Gin
ning
outt
urn
(%)
Seed
inde
x(g
)L
int
inde
x(g
)
Seed
cott
on
yiel
d(q
/ha)
GC
V(%
)4.
601.
657.
528.
106.
8215
.73
13.8
85.
677.
5812
.03
17.5
7
PCV
(%)
5.12
1.78
7.98
8.18
7.68
17.4
315
.68
5.09
7.58
12.0
418
.90
h2 bs(%
)80
8689
9879
815
7899
9999
86
GA
(5%
)6.
244.
290.
3717
.33
2.26
0.48
4.58
4.40
0.94
0.90
4.46
GA
M8.
523.
1714
.61
16.5
212
.49
29.2
425
.30
11.6
315
.62
24.7
833
.62
S.E
.D2.
331.
260.
091.
690.
900.
181.
870.
280.
007
0.01
71.
313
S.E
.M1.
590.
860.
061.
160.
610.
121.
280.
190.
005
0.01
10.
89
CV
%3.
185
0.93
3.76
131.
613
4.99
10.6
110
.32
0.74
30.
1216
0.45
49.
89
C.D
. 5%
4.98
2.69
0.20
66.
601.
930.
373
3.99
0.59
90.
0155
0.03
52.
79
C.D
. 1%
6.88
3.72
0.28
44.
982.
670.
516
5.51
0.82
80.
215
0.04
93.
87
Mea
n73
.313
5.75
2.56
104.
8516
.41.
6518
37.8
45.
993.
6713
.27
Ran
geM
in.
7013
32.
2588
.516
.51.
313
34.4
55.
233.
099.
55
Max
. 81
140
311
7.4
21.8
52.
526
41.0
36.
784.
4518
.45

4.1.3.11 Seed cotton yield (q/ha)
Mean seed cotton yield obtained was 13.27q/ha and ranged from 9.5to 18.5 q/ha. Both GCV (17.57 %) and PCV (18.9 %) recorded moderatevalues. High broad sense heritability (86 %) coupled with high geneticadvance as per cent mean (33.62 %) and low genetic advance (4.46 %) wasobserved for the trait.
4.2 Evaluation of F4 lines of brown color cotton derivedfrom intraspecific (HH) and interspecific (HB) crossesfor yield, yield attributing and fiber traits
4.2.1 Analysis of variance for yield and yield attributing traits in intrahirsutum F4 lines of color cotton
One hundred and six intra hirsutum F4 lines along with two checksDDB-12 and DMB-225 were evaluated for eleven traits viz., days to 50%flowering, days to first boll opening, boll weight, plant height, number ofsympodia, number of monopodia, bolls per plant, ginning out turn, seedindex, lint index and seed cotton yield. The mean sum of squares for thesecharacters is presented in Table 6 which indicated F4 lines exhibited highlysignificant variation.
4.2.2 Mean performance of intra hirsutum F4 lines of color cotton
The results presented on each of the characters in 106 intra hirsutumF4 lines and two checks DDB-12 (Dharwad Dark Brown-12) and DMB-225(Dharwad Medium Brown-225) are as follows.
4.2.2.1 Days to 50 per cent flowering
In light brown color (Score-2), medium brown color (Score-3) anddark brown color (Score-4) cotton lines, average days to 50 per centflowering was 75.3, 73.9 and 75 days respectively The days taken for 50per cent flowering in the checks DDB-12 and DMB-225 were 77.04 and75.08 respectively.
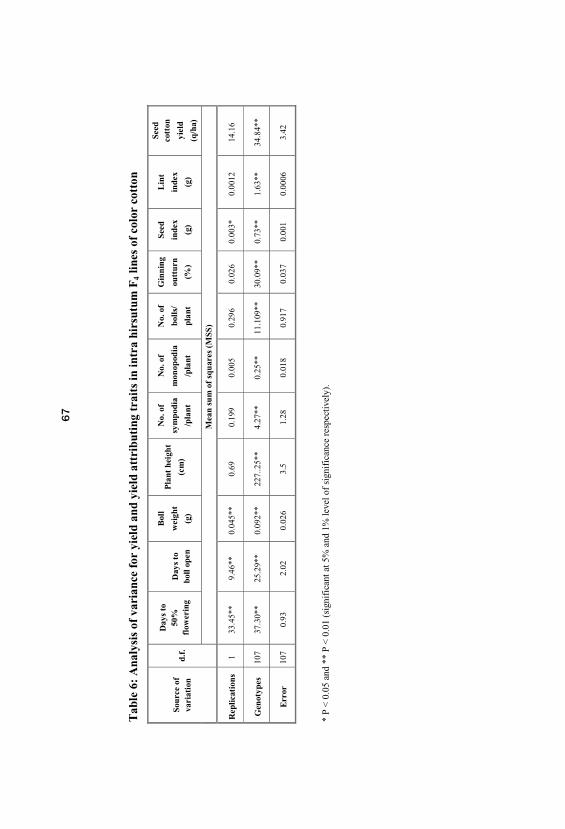
Tab
le6:
Ana
lysi
sof
vari
ance
for
yiel
dan
dyi
eld
attr
ibut
ing
trai
tsin
intr
ahi
rsut
umF
4lin
esof
colo
rco
tton
Sour
ceof
vari
atio
nd.
f.
Day
sto
50%
flow
erin
gD
ays
tobo
llop
en
Bol
l
wei
ght
(g)
Pla
nthe
ight
(cm
)
No.
of
sym
podi
a
/pla
nt
No.
of
mon
opod
ia
/pla
nt
No.
of
boll
s/
plan
t
Gin
ning
outt
urn
(%)
Seed
inde
x
(g)
Lin
t
inde
x
(g)
Seed
cott
on
yiel
d
(q/h
a)
Mea
nsu
mof
squ
ares
(MSS
)
Rep
licat
ions
133
.45*
*9.
46**
0.04
5**
0.69
0.19
90.
005
0.29
60.
026
0.00
3*0.
0012
14.1
6
Gen
otyp
es10
737
.30*
*25
.29*
*0.
092*
*22
7..2
5**
4.27
**0.
25**
11.1
09**
30.0
9**
0.73
**1.
63**
34.8
4**
Err
or10
70.
932.
020.
026
3.5
1.28
0.01
80.
917
0.03
70.
001
0.00
063.
42
*P
<0.
05an
d**
P<
0.01
(sig
nifi
cant
at5%
and
1%le
velo
fsi
gnif
ican
cere
spec
tive
ly).

4.2.2.2 Days to first boll opening
Average number of days for the first boll opening recorded was onpar in all color classes such as light brown color (Score-2), medium browncolor (Score-3) and dark brown color (Score-4) cotton lines were 134.7, 134.4 and 135 days respectively.
4.2.2.3 Plant height (cm)
Mean plant height values in all the three color classes viz., lightbrown color (Score-2), medium brown color (Score-3) and dark browncolor (Score-4) cotton lines were on par the values being 97.8, 97.1 and 95cm respectively; range for plant height was maximum in the dark brownlines (70.3-107.65 cm) while there was not much variation for plant heightin light brown (119-120 cm) and medium brown lines (71-73.25 cm).
4.2.2.4 Number of monopodia
In all the three color classes of light brown color (Score-2), mediumbrown color (Score-3) and dark brown color (Score-4) cotton lines, theaverage number of monopodia per plant ranged from 1.5 to 1.6. Meanvalue in the checks DDB-12 and DMB-225 for the trait was 1.35 and 1.5respectively.
4.2.2.5 Number of sympodia
The range of the number of sympodia per plant was on par in all thethree color classes, light brown, medium brown and dark brown (13.6-19.55, 13.6 -20.1-and 13.6-18.95respectively.
The checks DDB-12 and DMB-225 were observed to have 17.13 and17.37 number of sympodia per plant respectively. Among the 46 lightbrown F4 lines, eleven lines HH F4 12-42, HH F4 12-98, HH F4 12-9, HH F4
12-99, HH F4 12-63, HH F4 12-76, HH F4 12-38, HH F4 12-61, HH F4 12-72, HH F4 12-97 and HH F4 12-17 recorded superior values of the trait toboth the checks.

In 48 medium brown F4 lines ten lines HH F4 12-107, HH F4 12-88, HH F4 12-85, HH F4 12-24, HH F4 12-78, HH F4 12-39, HH F4 12-52, HHF4 12-81, HH F4 12-117 and HH F4 12-2 were superior over both thechecks DMB-225 and DDB-12
In 12 dark brown F4 lines, the line HH F4 12-186 recorded highestnumber of sympodia per plant (18.95). The five lines HH F4 12-186, HH F4
12-147, HH F4 12-132, HH F4 12-102 and HH F4 12-151 were found to besuperior over both checks.
4.2.2.6 Number of bolls per plant
Average number of bolls per plant recorded in different colorclasses was 17 and 16.8 revealing no much variation in mean values amongcolor types for the trait. Range observed for the trait was 12-22.5, 12-23and 14-21 in respective light, medium and dark brown color classes. Theaverage number of bolls per plant in the checks DDB-12 and DMB-225were 17.13 and 17.37 respectively.
In light brown color (Score-2) cotton lines, highest number of bollsper plant (22.5) was observed in the line HH F4 12-61 and was alsosuperior over both the checks for the trait. The lines HH F4 12-76, HH F4
12-63, HH F4 12-97, HH F4 12-66, HH F4 12-105, HH F4 12-98, HH F4 12-17, HH F4 12-19, HH F4 12-103, HH F4 12-62, HH F4 12-35 and HH F4 12-65 exhibited higher number of bolls per plant than the check DDB-12.
In medium brown color (Score-3) cotton lines, highest number ofbolls per plant (23) was recorded in the line HH F4 12-78 and lowest in theline HH F4 12-94 (12). The lines HH F4 12-78 and HH F4 12-24 weresuperior over both the checks for the trait. The F4 lines viz., HH F4 12-102and HH F4 12-101 recorded highest number of bolls per plant (21) in darkbrown color (Score-4) class which were also found to be superior over thecheck DDB-12.
4.2.2.7 Boll weight (g)

Average boll weight of F4 lines was 2.35, and there was not muchvariation in the mean values of different color classes. Average boll weightin two checks, DDB-12 and DMB-225 was 2.37 g and 2.49 g respectively.
In light brown color (Score-2) cotton lines, highest boll weight (2.7g) was observed in the line HH F4 12-71. Ten lines HH F4 12-19, HH F4
12-103, HH F4 12-95, HH F4 12-17, HH F4 12-60, HH F4 12-53, HH F4 12-9, HH F4 12-38, HH F4 12-71 and HH F4 12-4 were superior over both thechecks (Table 7).
In medium brown color (Score-3) cotton lines, highest boll weightwas recorded in the line HH F4 12-26 (2.92 g). Eight lines HH F4 12-24, HH F4 12-117, HH F4 12-26, HH F4 12-85, HH F4 12-39, HH F4 12-29, HHF4 12-28 and HH F4 12-30 were better than both the checks (Table 11).
In dark brown color (Score-4) cotton lines, the line HH F4 12-177(2.72 g) recorded highest boll weight and lowest was observed in the lineHH F4 12-151 (2.12 g). The lines superior to the check DDB-12 in thisclass were HH F4 12-102, HH F4 12-183 and HH F4 12-147 as detailed inTable 15.
4.2.2.8 Seed cotton yield (q/ha)
Average seed cotton yield in light brown color (Score-2), mediumbrown color (Score-3) and dark brown color (Score-4) cotton lines was 21.6, 21.4 and 22.1 q/ha respectively, while yield potential of the checksDDB-12 and DMB-225 was 22.87 and 27.98 q/ha.
In light brown color (Score-2) cotton lines, the line HH F4 12-19performed good with highest seed cotton yield (28.35 q/ha). Eighteen lineswere observed to be superior for seed cotton yield (q/ha) over the checksare detailed in Table 7.
Among the medium brown color (Score-3) cotton lines, the highestseed cotton yield (33.25 q/ha) was obtained in the line HH F4 12-24. Seventeen lines were superior for seed cotton yield (q/ha) over checks(Table 11).
The line HH F4 12-102 in the dark brown lint color (Score-4) classhad highest seed cotton yield of 28.3q/ha. All the F4 lines evaluated in this

color class were superior to the dark brown check DDB-12 as detailed inTable 15.
4.2.2.9 Seed index (g)
Mean seed index obtained in the entire color classes were almostsimilar 6.0 to 5.9 g. Range for the trait was comparatively much similar4.2-7.8, 4.9-7.6 and 4.8-7.1g
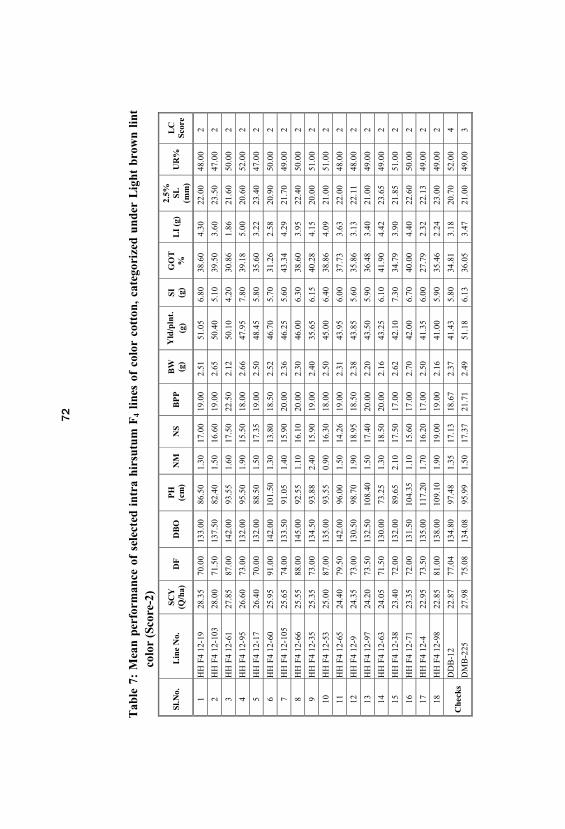
Tab
le7:
Mea
npe
rfor
man
ceof
sele
cted
intr
ahi
rsut
umF
4lin
esof
colo
rco
tton
, ca
tego
rize
dun
der
Lig
htbr
own
lint
colo
r(S
core
-2)
Sl.N
o.
Lin
eN
o.
SCY
(Q/h
a)D
FD
BO
PH
(cm
)N
MN
SB
PP
BW (g)
Yld
/pln
t.
(g)
SI (g)
GO
T%
LI
(g)
2.5% SL (mm
)U
R%
LC
Scor
e
1H
HF4
12-1
928
.35
70.0
013
3.00
86.5
01.
3017
.00
19.0
02.
5151
.05
6.80
38.6
04.
3022
.00
48.0
02
2H
HF4
12-1
0328
.00
71.5
013
7.50
82.4
01.
5016
.60
19.0
02.
6550
.40
5.10
39.5
03.
6023
.50
47.0
02
3H
HF4
12-6
127
.85
87.0
014
2.00
93.5
51.
6017
.50
22.5
02.
1250
.10
4.20
30.8
61.
8621
.60
50.0
02
4H
HF4
12-9
526
.60
73.0
013
2.00
95.5
01.
9015
.50
18.0
02.
6647
.95
7.80
39.1
85.
0020
.60
52.0
02
5H
HF4
12-1
726
.40
70.0
013
2.00
88.5
01.
5017
.35
19.0
02.
5048
.45
5.80
35.6
03.
2223
.40
47.0
02
6H
HF4
12-6
025
.95
91.0
014
2.00
101.
501.
3013
.80
18.5
02.
5246
.70
5.70
31.2
62.
5820
.90
50.0
02
7H
HF4
12-1
0525
.65
74.0
013
3.50
91.0
51.
4015
.90
20.0
02.
3646
.25
5.60
43.3
44.
2921
.70
49.0
02
8H
HF4
12-6
625
.55
88.0
014
5.00
92.5
51.
1016
.10
20.0
02.
3046
.00
6.30
38.6
03.
9522
.40
50.0
02
9H
HF4
12-3
525
.35
73.0
013
4.50
93.8
82.
4015
.90
19.0
02.
4035
.65
6.15
40.2
84.
1520
.00
51.0
02
10H
HF4
12-5
325
.00
87.0
013
5.00
93.5
50.
9016
.30
18.0
02.
5045
.00
6.40
38.8
64.
0921
.00
51.0
02
11H
HF4
12-6
524
.40
79.5
014
2.00
96.0
01.
5014
.26
19.0
02.
3143
.95
6.00
37.7
33.
6322
.00
48.0
02
12H
HF4
12-9
24.3
573
.00
130.
5098
.70
1.90
18.9
518
.50
2.38
43.8
55.
6035
.86
3.13
22.1
148
.00
2
13H
HF4
12-9
724
.20
73.5
013
2.50
108.
401.
5017
.40
20.0
02.
2043
.50
5.90
36.4
83.
4021
.00
49.0
02
14H
HF4
12-6
324
.05
71.5
013
0.00
73.2
51.
3018
.50
20.0
02.
1643
.25
6.10
41.9
04.
4223
.65
49.0
02
15H
HF4
12-3
823
.40
72.0
013
2.00
89.6
52.
1017
.50
17.0
02.
6242
.10
7.30
34.7
93.
9021
.85
51.0
02
16H
HF4
12-7
123
.35
72.0
013
1.50
104.
351.
1015
.60
17.0
02.
7042
.00
6.70
40.0
04.
4022
.60
50.0
02
17H
HF4
12-4
22.9
573
.50
135.
0011
7.20
1.70
16.2
017
.00
2.50
41.3
56.
0027
.79
2.32
22.1
349
.00
2
18H
HF4
12-9
822
.85
81.0
013
8.00
109.
101.
9019
.00
19.0
02.
1641
.00
5.90
35.4
62.
2423
.00
49.0
02
Che
cks
DD
B-1
222
.87
77.0
413
4.80
97.4
81.
3517
.13
18.6
72.
3741
.43
5.80
34.8
13.
1820
.70
52.0
04
DM
B-2
2527
.98
75.0
813
4.08
95.9
91.
5017
.37
21.7
12.
4951
.18
6.13
36.0
53.
4721
.00
49.0
03
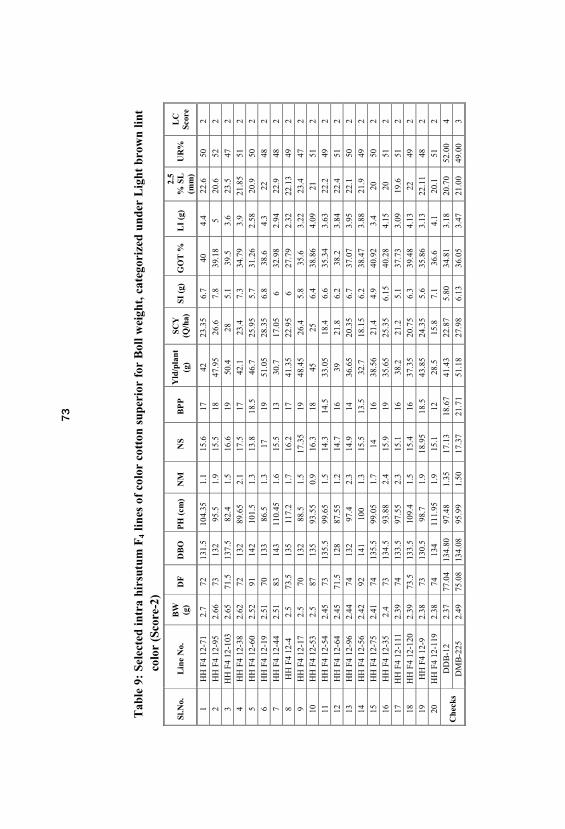
Tab
le9:
Sele
cted
intr
ahi
rsut
umF
4lin
esof
colo
rco
tton
supe
rior
for
Bol
lwei
ght,
cat
egor
ized
unde
rL
ight
brow
nlin
tco
lor
(Sco
re-2
)
Sl.N
o.
Lin
eN
o.
BW (g)
DF
DB
OP
H(c
m)
NM
NS
BP
PY
ld/p
lant
(g)
SCY
(Q/h
a)SI
(g)
GO
T%
LI
(g)
2.5
%SL
(mm
)U
R%
LC
Scor
e
1H
HF4
12-7
12.
772
131.
510
4.35
1.1
15.6
1742
23.3
56.
740
4.4
22.6
502
2H
HF4
12-9
52.
6673
132
95.5
1.9
15.5
1847
.95
26.6
7.8
39.1
85
20.6
522
3H
HF4
12-1
032.
6571
.513
7.5
82.4
1.5
16.6
1950
.428
5.1
39.5
3.6
23.5
472
4H
HF4
12-3
82.
6272
132
89.6
52.
117
.517
42.1
23.4
7.3
34.7
93.
921
.85
512
5H
HF4
12-6
02.
5291
142
101.
51.
313
.818
.546
.725
.95
5.7
31.2
62.
5820
.950
26
HH
F412
-19
2.51
7013
386
.51.
317
1951
.05
28.3
56.
838
.64.
322
482
7H
HF4
12-4
42.
5183
143
110.
451.
615
.513
30.7
17.0
56
32.9
82.
9422
.948
28
HH
F412
-42.
573
.513
511
7.2
1.7
16.2
1741
.35
22.9
56
27.7
92.
3222
.13
492
9H
HF4
12-1
72.
570
132
88.5
1.5
17.3
519
48.4
526
.45.
835
.63.
2223
.447
210
HH
F412
-53
2.5
8713
593
.55
0.9
16.3
1845
256.
438
.86
4.09
2151
2
11H
HF4
12-5
42.
4573
135.
599
.65
1.5
14.3
14.5
33.0
518
.46.
635
.34
3.63
22.2
492
12H
HF4
12-6
42.
4571
.512
887
.55
1.2
14.7
1639
21.8
6.2
38.2
3.84
22.4
512
13H
HF4
12-9
62.
4474
132
97.4
2.3
14.9
1436
.65
20.3
56.
737
.07
3.95
22.1
502
14H
HF4
12-5
62.
4292
141
100
1.3
15.5
13.5
32.7
18.1
56.
238
.47
3.88
21.9
492
15H
HF4
12-7
52.
4174
135.
599
.05
1.7
1416
38.5
621
.44.
940
.92
3.4
2050
216
HH
F412
-35
2.4
7313
4.5
93.8
82.
415
.919
35.6
525
.35
6.15
40.2
84.
1520
512
17H
HF4
12-1
112.
3974
133.
597
.55
2.3
15.1
1638
.221
.25.
137
.73
3.09
19.6
512
18H
HF4
12-1
202.
3973
.513
3.5
109.
41.
515
.416
37.3
520
.75
6.3
39.4
84.
1322
492
19H
HF4
12-9
2.38
7313
0.5
98.7
1.9
18.9
518
.543
.85
24.3
55.
635
.86
3.13
22.1
148
220
HH
F412
-119
2.38
7413
411
1.95
1.9
15.1
1228
.515
.87.
136
.64.
120
.151
2
Che
cks
DD
B-1
22.
3777
.04
134.
8097
.48
1.35
17.1
318
.67
41.4
322
.87
5.80
34.8
13.
1820
.70
52.0
04
DM
B-2
252.
4975
.08
134.
0895
.99
1.50
17.3
721
.71
51.1
827
.98
6.13
36.0
53.
4721
.00
49.0
03

Tab
le11
:M
ean
perf
orm
ance
ofse
lect
edin
tra
hirs
utum
F4
lines
ofco
lor
cott
on,
cate
gori
zed
unde
rM
ediu
mbr
own
lint
colo
r(S
core
-3)
Sl.N
o.
Lin
eN
o.
SCY
(Q/h
a)D
FD
BO
PH
(cm
)N
MN
SB
PP
BW (g)
Yld
/pln
t.
(g)
SI (g)
GO
T%
LI
(g)
2.5% SL (mm
)U
R%
LC
Scor
e
1H
HF4
12-2
433
.25
79.5
137
100.
61.
618
.522
.52.
6260
.56
39.3
53.
8819
.63
543
2H
HF4
12-1
1733
.05
73.5
133
93.9
51.
517
.522
2.56
39.5
6.7
36.5
3.84
22.1
503
3H
HF4
12-7
829
.35
8014
011
12
18.5
232.
4252
.85.
936
.74
3.4
18.5
533
4H
HF4
12-2
629
.25
83.5
139.
512
0.2
1.3
15.2
182.
9252
.65
6.6
37.7
43.
9917
.955
3
5H
HF4
12-8
528
.25
73.5
135
103.
91.
318
.619
2.68
50.8
55.
740
3.8
2151
3
6H
HF4
12-1
1327
.06
74.5
133.
593
.51.
317
.219
.52.
2549
.76.
435
.43.
518
.951
3
7H
HF4
12-8
126
.25
7313
4.5
99.6
51.
317
.521
2.25
47.2
56.
537
.39
3.89
19.6
523
8H
HF4
12-9
325
.85
7413
286
.91.
316
.819
2.26
46.5
5.3
38.1
2.45
19.9
513
9H
HF4
12-3
925
.273
.513
798
.95
1.5
18.2
518
2.52
45.5
5.9
39.5
93.
8917
.855
3
10H
HF4
12-2
024
.75
7014
074
.65
1.5
16.5
192.
3444
.55
5.4
40.2
3.65
19.3
523
11H
HF4
12-2
924
.55
7413
694
.55
2.7
14.7
17.5
2.52
44.1
56.
137
.75
3.7
18.8
543
12H
HF4
12-2
824
.05
7613
890
.52.
115
.416
2.75
43.3
6.55
39.9
24.
3619
.353
3
13H
HF4
12-9
023
.85
7213
211
3.5
1.9
1618
2.39
436
363.
3819
.351
3
14H
HF4
12-1
1223
.874
133.
510
1.8
1.3
15.8
192.
1842
.85
5.9
38.8
93.
6520
503
15H
HF4
12-4
823
.35
7413
4.5
98.5
1.3
14.6
172.
6242
.17
35.7
63.
9219
.352
3
16H
HF4
12-3
023
.15
7413
584
.25
1.9
14.9
152.
7841
.76.
238
.73.
9217
.555
3
17H
HF4
12-2
323
7514
010
4.2
2.5
16.2
518
2.3
41.4
5.6
37.5
3.36
20.3
523
Che
cks
DD
B-1
222
.87
77.0
413
4.80
97.4
81.
3517
.13
18.6
72.
3741
.43
5.80
34.8
13.
1820
.70
52.0
04
DM
B-2
2527
.98
75.0
813
4.08
95.9
91.
5017
.37
21.7
12.
4951
.18
6.13
36.0
53.
4721
.00
49.0
03
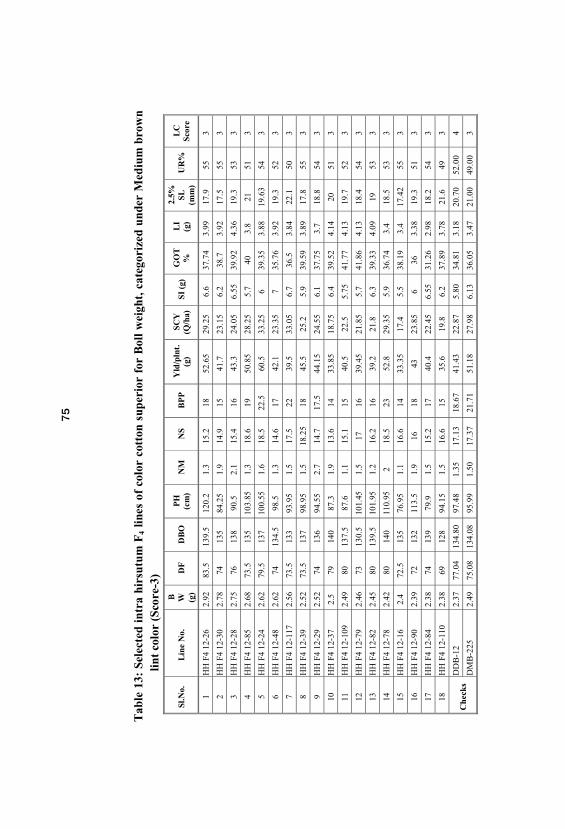
Tab
le13
:Se
lect
edin
tra
hirs
utum
F4
lines
ofco
lor
cott
onsu
peri
orfo
rB
ollw
eigh
t, c
ateg
oriz
edun
der
Med
ium
brow
nlin
tco
lor
(Sco
re-3
)
Sl.N
o.
Lin
eN
o.
B W (g)
DF
DB
OP
H(c
m)
NM
NS
BP
PY
ld/p
lnt.
(g
)SC
Y(Q
/ha)
SI(g
)G
OT
%L
I(g
)
2.5% SL (mm
)U
R%
LC
Scor
e
1H
HF4
12-2
62.
9283
.513
9.5
120.
21.
315
.218
52.6
529
.25
6.6
37.7
43.
9917
.955
3
2H
HF4
12-3
02.
7874
135
84.2
51.
914
.915
41.7
23.1
56.
238
.73.
9217
.555
3
3H
HF4
12-2
82.
7576
138
90.5
2.1
15.4
1643
.324
.05
6.55
39.9
24.
3619
.353
3
4H
HF4
12-8
52.
6873
.513
510
3.85
1.3
18.6
1950
.85
28.2
55.
740
3.8
2151
3
5H
HF4
12-2
42.
6279
.513
710
0.55
1.6
18.5
22.5
60.5
33.2
56
39.3
53.
8819
.63
543
6H
HF4
12-4
82.
6274
134.
598
.51.
314
.617
42.1
23.3
57
35.7
63.
9219
.352
3
7H
HF4
12-1
172.
5673
.513
393
.95
1.5
17.5
2239
.533
.05
6.7
36.5
3.84
22.1
503
8H
HF4
12-3
92.
5273
.513
798
.95
1.5
18.2
518
45.5
25.2
5.9
39.5
93.
8917
.855
3
9H
HF4
12-2
92.
5274
136
94.5
52.
714
.717
.544
.15
24.5
56.
137
.75
3.7
18.8
543
10H
HF4
12-3
72.
579
140
87.3
1.9
13.6
1433
.85
18.7
56.
439
.52
4.14
2051
3
11H
HF4
12-1
092.
4980
137.
587
.61.
115
.115
40.5
22.5
5.75
41.7
74.
1319
.752
3
12H
HF4
12-7
92.
4673
130.
510
1.45
1.5
1716
39.4
521
.85
5.7
41.8
64.
1318
.454
3
13H
HF4
12-8
22.
4580
139.
510
1.95
1.2
16.2
1639
.221
.86.
339
.33
4.09
1953
3
14H
HF4
12-7
82.
4280
140
110.
952
18.5
2352
.829
.35
5.9
36.7
43.
418
.553
3
15H
HF4
12-1
62.
472
.513
576
.95
1.1
16.6
1433
.35
17.4
5.5
38.1
93.
417
.42
553
16H
HF4
12-9
02.
3972
132
113.
51.
916
1843
23.8
56
363.
3819
.351
3
17H
HF4
12-8
42.
3874
139
79.9
1.5
15.2
1740
.422
.45
6.55
31.2
62.
9818
.254
3
18H
HF4
12-1
102.
3869
128
94.1
51.
516
.615
35.6
19.8
6.2
37.8
93.
7821
.649
3
Che
cks
DD
B-1
22.
3777
.04
134.
8097
.48
1.35
17.1
318
.67
41.4
322
.87
5.80
34.8
13.
1820
.70
52.0
04
DM
B-2
252.
4975
.08
134.
0895
.99
1.50
17.3
721
.71
51.1
827
.98
6.13
36.0
53.
4721
.00
49.0
03

Tab
le17
:Se
lect
edin
tra
hirs
utum
F4
lines
ofco
lor
cott
onsu
peri
orfo
rB
ollw
eigh
t, c
ateg
oriz
edun
der
Dar
kbr
own
lint
colo
r(S
core
-4)
Sl.N
o.
Lin
eN
o.
BW (g)
DF
DB
OP
H(c
m)
NM
NS
BP
PY
ld/p
lnt.
(g
)SC
Y(Q
/ha)
SI (g)
GO
T%
LI
(g)
2.5% SL (mm
)U
R%
LC
Scor
e
1H
HF4
12-1
772.
7273
.513
8.5
92.7
1.7
14.1
1643
.622
.27.
141
.37
4.99
18.3
552
4
2H
HF4
12-1
832.
6873
132.
588
.35
1.3
15.2
1848
.15
26.7
56.
141
.64.
3519
.452
4
3H
HF4
12-1
472.
5681
141
93.1
51.
718
.317
42.8
523
.85
6.5
32.7
83.
1719
.152
4
4H
HF4
12-1
322.
4580
140
104.
81.
717
.715
36.8
20.4
6.3
36.5
73.
6618
.153
4
5H
HF4
12-1
132.
4373
133
99.4
1.7
16.5
1433
.95
18.8
57.
134
.89
3.79
22.2
504
6H
HF4
12-1
022.
4373
.513
1.5
101.
551.
517
.621
50.9
528
.36.
138
.22
3.78
18.4
544
7H
HF4
12-1
892.
4272
131
107.
651.
417
1637
.620
.95.
0538
.95
3.22
19.3
524
8H
HF4
12-1
012.
3674
133.
594
.95
2.1
13.6
2149
.627
.65.
637
.53.
3618
.653
4
Che
cks
DD
B-1
22.
3777
.04
134.
8097
.48
1.35
17.1
318
.67
41.4
322
.87
5.80
34.8
13.
1820
.70
52.0
04
DM
B-2
252.
4975
.08
134.
0895
.99
1.50
17.3
721
.71
51.1
827
.98
6.13
36.0
53.
4721
.00
49.0
03

Tab
le15
:M
ean
perf
orm
ance
ofse
lect
edin
tra
hirs
utum
F4
lines
ofco
lor
cott
on,
cate
gori
zed
unde
rD
ark
brow
nlin
tco
lor
(Sco
re-4
)
Sl.N
o.
Lin
eN
o.
SCY
(Q/h
a)D
FD
BO
PH
(cm
)N
MN
SB
PP
BW (g)
Yld
/pln
t.
(g)
SI (g)
GO
T%
LI
(g)
2.5% SL (mm
)U
R%
LC
Scor
e
1H
HF4
12-1
0228
.373
.513
1.5
101.
551.
517
.621
2.43
50.9
56.
138
.22
3.78
18.4
544
2H
HF4
12-1
0127
.674
133.
594
.95
2.1
13.6
212.
3649
.65.
637
.53.
3618
.653
4
3H
HF4
12-1
8326
.75
7313
2.5
88.3
51.
315
.218
2.68
48.1
56.
141
.64.
3519
.452
4
4H
HF4
12-1
4723
.85
8114
193
.15
1.7
18.3
172.
5642
.85
6.5
32.7
83.
1719
.152
4
Che
cks
DD
B-1
222
.87
77.0
413
4.80
97.4
81.
3517
.13
18.6
72.
3741
.43
5.80
34.8
13.
1820
.70
52.0
04
DM
B-2
2527
.98
75.0
813
4.08
95.9
91.
5017
.37
21.7
12.
4951
.18
6.13
36.0
53.
4721
.00
49.0
03
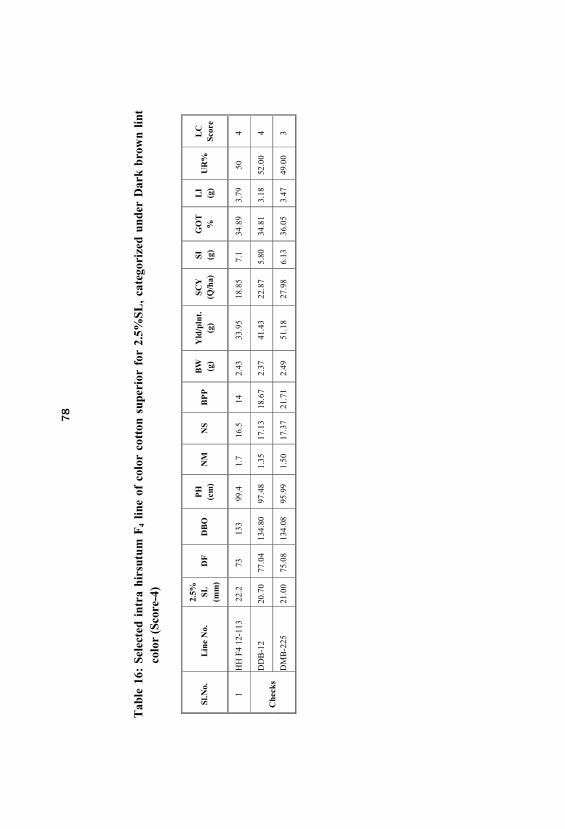
Tab
le16
:Se
lect
edin
tra
hirs
utum
F4
line
ofco
lor
cott
onsu
peri
orfo
r2.
5%SL
, ca
tego
rize
dun
der
Dar
kbr
own
lint
colo
r(S
core
-4)
Sl.N
o.
Lin
eN
o.
2.5% SL (mm
)D
FD
BO
PH
(cm
)N
MN
SB
PP
BW (g)
Yld
/pln
t.
(g)
SCY
(Q/h
a)SI (g
)G
OT
%L
I(g
)U
R%
LC
Scor
e
1H
HF4
12-1
1322
.273
133
99.4
1.7
16.5
142.
4333
.95
18.8
57.
134
.89
3.79
504
Che
cks
DD
B-1
220
.70
77.0
413
4.80
97.4
81.
3517
.13
18.6
72.
3741
.43
22.8
75.
8034
.81
3.18
52.0
04
DM
B-2
2521
.00
75.0
813
4.08
95.9
91.
5017
.37
21.7
12.
4951
.18
27.9
86.
1336
.05
3.47
49.0
03

in respective color classes of light brown, medium brown and dark brownrespectively. The mean seed index values in the checks DDB-12 and DMB-225 were 5.8 g and 6.13 g respectively.
Among 46 light brown color (Score-2) cotton lines, 28 lines foundsuperior to both the checks, the highest seed index was recorded in the lineHH F4 12-95 (7.8 g) and lowest was obtained in HH F4 12-61 (4.2 g). Thetop three lines are HH F4 12-95, HH F4 12-38 and HH F4 12-119.
Among 48 medium brown color (Score-3) cotton lines, 19 linesfound superior to both the checks. The line HH F4 12-94 recorded highest(7.6 g) seed index and lowest was obtained in the line HH F4 12-107 (4.9g). The top three lines are HH F4 12-94, HH F4 12-48 and HH F4 12-116.
Among 12 dark brown color (Score-4) cotton lines, highest (7.1 g)seed index was recorded in the line HH F4 12-113 and lowest (4.8 g)obtained in the line HH F4 12-134. Out of twelve, four lines HH F4 12-113, HH F4 12-177, HH F4 12-147 and HH F4 12-132 were superior over boththe checks DDB-12 and DMB-225.
4.2.2.10 Ginning Out Turn (%)
Range obtained for GOT was relatively similar 27.79-43.34, 25.75-44.6 and 32.78-43.34 per cent in respective color classes of light brown, medium brown and dark brown. The mean ginning out turn of the checksDDB-12 and DMB-225 was 34.81 and 36.05 per cent respectively.
In light brown color (Score-2) cotton lines, the line HH F4 12-105recorded highest ginning out turn (43.34 %) and lowest (27.79 %) wasobtained in HH F4 12-4. Among 46 F4 lines of light brown type, thirty fivelines were superior to the checks are detailed in Table 10. The top five linesare HH F4 12-105, HH F4 12-63, HH F4 12-76, HH F4 12-31 and HH F4 12-69.
Among forty eight medium brown color (Score-3) cotton lines, highest ginning out turn was recorded in the line HH F4 12-40 (44.6 %) andlowest (25.75 %) was observed in the line HH F4 12-118. Thirty eight linesrecorded superior over both the checks are presented in Table 14. The top

five lines are HH F4 12-40, HH F4 12-1, HH F4 12-88, HH F4 12-79 andHH F4 12-109.
In dark brown color (Score-4) cotton lines, highest (43.34 %)ginning out turn was recorded in line HH F4 12-186. Superior lines HH F4
12-186, HH F4 12-183, HH F4 12-177, HH F4 12-189, HH F4 12-102, HHF4 12-101, HH F4 12-149, HH F4 12-134 and HH F4 12-135 over the checksare detailed in Table 18.
4.2.2.11 Lint Index (g)
Range of lint index in respective color classes of light brown, medium brown and dark brown was comparatively similar being, 1.86-5.0, 2.05-4.66 and 2.9-4.99 g. The lint index obtained in the checks DDB-12and DMB-225 were 3.18 and 3.47 g respectively.
Among 46 light brown color (Score-2) cotton lines, the line HH F4
12-95 exhibited highest lint index (5 g) and lowest (1.86 g) was obtained inthe line HH F4 12-61. Thirty one lines were found superior to both thechecks DDB-12 and DMB-225. The four lines HH F4 12-97, HH F4 12-75, HH F4 12-104 and HH F4 12-17 found superior only to the check DDB-12.
Among forty eight medium brown color (Score-3) cotton lines, theline HH F4 12-116 recorded highest (4.66 g) lint index and lowest (2.05 g)was obtained in the line HH F4 12-118. Thirty four lines were foundsuperior over both the checks. However, eight lines HH F4 12-107, HH F4
12-78, HH F4 12-16, HH F4 12-90, HH F4 12-45, HH F4 12-23, HH F4 12-14 and HH F4 12-52, recorded superior to the check DDB-12.
Among twelve dark brown color (Score-4) cotton lines, highest value(4.99 g) for lint index was observed in the line HH F4 12-177 and lowest(2.9 g) was obtained in the line HH F4 12-134. Six lines HH F4 12-177, HHF4 12-183, HH F4 12-186, HH F4 12-113, HH F4 12-102 and HH F4 12-132, were superior to both the checks. However, the lines HH F4 12-101, HH F4
12-149, HH F4 12-151 and HH F4 12-18 found superior to the check DDB-12.

Tab
le10
:Se
lect
edin
tra
hirs
utum
F4
lines
ofco
lor
cott
onsu
peri
orfo
rG
OT
%,
cate
gori
zed
unde
rL
ight
brow
nlin
tco
lor
(Sco
re-2
)
Sl.N
o.
Lin
eN
o.
GO
T%
DF
DB
OP
H(c
m)
NM
NS
BP
PB
W (g)
Yld
/pln
t.
(g)
SCY
(Q/h
a)SI (g
)L
I(g
)
2.5% SL (mm
)
UR %
LC
Scor
e
1H
HF4
12-1
0543
.34
7413
3.5
91.0
51.
415
.920
2.36
46.2
525
.65
5.6
4.29
21.7
492
2H
HF4
12-6
341
.971
.513
073
.25
1.3
18.5
202.
1643
.25
24.0
56.
14.
4223
.65
492
3H
HF4
12-7
641
.55
7213
1.5
97.5
51.
217
.821
2.06
40.2
522
.55
5.85
4.2
2248
24
HH
F412
-31
41.4
473
.513
710
5.55
1.7
16.3
152.
1532
.517
.95
6.1
4.35
20.1
512
5H
HF4
12-6
941
.39
72.5
130.
590
.25
1.1
14.8
16.5
2.3
37.9
521
.05
5.65
3.99
21.2
550
26
HH
F412
-75
40.9
274
135.
599
.05
1.7
1416
2.41
38.5
621
.44.
93.
420
502
7H
HF4
12-3
40.7
671
.513
2.5
84.7
1.2
15.6
162.
2833
.15
18.4
5.3
3.62
19.8
532
8H
HF4
12-3
640
.75
72.5
135
113.
452.
116
.518
2.05
3620
5.5
3.8
21.1
512
9H
HF4
12-6
240
.65
73.5
140
90.5
51.
216
.119
2.22
39.8
22.0
55.
53.
7820
.75
502
10H
HF4
12-1
0440
.374
132
92.2
1.5
15.1
172.
0333
.218
.45
4.9
3.34
18.4
542
11H
HF4
12-3
540
.28
7313
4.5
93.8
82.
415
.919
2.4
35.6
525
.35
6.15
4.15
2051
2
12H
HF4
12-6
40.2
273
133
95.3
51.
315
.116
.52.
1840
.122
.25
5.7
3.85
18.2
353
213
HH
F412
-71
4072
131.
510
4.35
1.1
15.6
172.
742
23.3
56.
74.
422
.650
214
HH
F412
-103
39.5
71.5
137.
582
.41.
516
.619
2.65
50.4
285.
13.
623
.547
215
HH
F412
-120
39.4
873
.513
3.5
109.
41.
515
.416
2.39
37.3
520
.75
6.3
4.13
2249
216
HH
F412
-95
39.1
873
132
95.5
1.9
15.5
182.
6647
.95
26.6
7.8
520
.652
217
HH
F412
-53
38.8
687
135
93.5
50.
916
.318
2.5
4525
6.4
4.09
2151
218
HH
F412
-46
38.7
273
.513
2.5
106.
31.
815
.413
2.12
27.6
515
.36.
33.
9522
502
19H
HF4
12-6
738
.68
7113
793
.51.
116
.26
13.5
2.31
31.2
517
.35
6.3
3.97
22.4
492
20H
HF4
12-1
938
.670
133
86.5
1.3
1719
2.51
51.0
528
.35
6.8
4.3
2248
221
HH
F412
-66
38.6
8814
592
.55
1.1
16.1
202.
346
25.5
56.
33.
9522
.450
222
HH
F412
-70
38.5
473
134.
590
.15
0.9
15.3
162.
3237
.220
.65
6.5
4.05
22.1
502
23H
HF4
12-5
638
.47
9214
110
01.
315
.513
.52.
4232
.718
.15
6.2
3.88
21.9
492

24H
HF4
12-6
438
.271
.512
887
.55
1.2
14.7
162.
4539
21.8
6.2
3.84
22.4
512
25H
HF4
12-5
937
.89
73.5
138
94.8
51.
415
.28
152.
0527
.415
.26.
13.
621
.949
226
HH
F412
-11
37.7
570
131
95.9
1.3
15.8
172.
0434
.65
19.2
55.
13.
0920
.85
512
27H
HF4
12-6
537
.73
79.5
142
961.
514
.26
192.
3143
.95
24.4
63.
6322
482
28H
HF4
12-1
1137
.73
7413
3.5
97.5
52.
315
.116
2.39
38.2
21.2
5.1
3.09
19.6
512
29H
HF4
12-9
637
.07
7413
297
.42.
314
.914
2.44
36.6
520
.35
6.7
3.95
22.1
502
30H
HF4
12-9
936
.89
81.5
138
118.
151.
318
.615
2.21
33.8
18.7
56.
33.
6921
.950
231
HH
F412
-10
36.8
7313
2.5
83.8
2.3
13.4
514
.52.
0129
.516
.25
5.3
3.08
2250
232
HH
F412
-119
36.6
7413
411
1.95
1.9
15.1
122.
3828
.515
.87.
14.
120
.151
233
HH
F412
-97
36.4
873
.513
2.5
108.
41.
517
.420
2.2
43.5
24.2
5.9
3.4
2149
234
HH
F412
-92
36.4
374
.513
110
0.9
1.2
1516
2.35
3921
.65
5.5
3.16
21.8
551
235
HH
F412
-100
36.3
73.5
131.
598
.31.
515
.516
2.21
35.4
19.7
6.5
3.7
22.2
492
36H
HF4
12-4
236
7213
0.5
119
1.4
19.5
516
.52.
2526
.416
.65
6.2
3.49
22.6
502
37H
HF4
12-9
35.8
673
130.
598
.71.
918
.95
18.5
2.38
43.8
524
.35
5.6
3.13
22.1
148
238
HH
F412
-72
35.7
274
135.
510
0.35
1.5
17.5
18.5
1.85
34.2
519
.05
52.
7822
472
39H
HF4
12-1
735
.670
132
88.5
1.5
17.3
519
2.5
48.4
526
.45.
83.
2223
.447
2
40H
HF4
12-9
835
.46
8113
810
9.1
1.9
1919
2.16
4122
.85
5.9
2.24
2349
241
HH
F412
-54
35.3
473
135.
599
.65
1.5
14.3
14.5
2.45
33.0
518
.46.
63.
6322
.249
242
HH
F412
-38
34.7
972
132
89.6
52.
117
.517
2.62
42.1
23.4
7.3
3.9
21.8
551
2
Che
cks
DD
B-1
234
.81
77.0
413
4.80
97.4
81.
3517
.13
18.6
72.
3741
.43
22.8
75.
803.
1820
.70
52.0
04
DM
B-2
2536
.05
75.0
813
4.08
95.9
91.
5017
.37
21.7
12.
4951
.18
27.9
86.
133.
4721
.00
49.0
03

Tab
le14
:Se
lect
edin
tra
hirs
utum
F4
lines
ofco
lor
cott
onsu
peri
orfo
rG
OT
%, c
ateg
oriz
edun
der
Med
ium
brow
nlin
tco
lor
(Sco
re-3
)
Sl.N
o.
Lin
eN
o.
GO
T%
DF
DB
OP
H(c
m)
NM
NS
BP
PB
W (g)
Yld
/pln
t.
(g)
SCY
(Q/h
a)SI
(g)
LI
(g)
2.5% SL (mm
)U
R%
LC
Scor
e
1H
HF4
12-4
044
.674
139
105.
11.
816
.65
152.
1130
.75
17.1
5.85
4.12
18.7
533
2H
HF4
12-1
42.3
872
135
711.
515
.25
172.
0332
.518
.05
5.55
4.05
17.6
553
3H
HF4
12-8
842
.24
7213
211
0.55
1.1
18.8
519
2.15
37.5
520
.85
5.3
3.89
19.1
523
4H
HF4
12-7
941
.86
7313
0.5
101.
451.
517
162.
4639
.45
21.8
55.
74.
1318
.454
35
HH
F412
-109
41.7
780
137.
587
.61.
115
.115
2.49
40.5
22.5
5.75
4.13
19.7
523
6H
HF4
12-1
0741
6912
810
7.55
1.1
20.1
14.5
1.86
27.9
515
.55
4.9
3.42
18.7
533
7H
HF4
12-2
040
.270
140
74.6
51.
516
.519
2.34
44.5
524
.75
5.4
3.65
19.3
523
8H
HF4
12-1
1640
.13
7413
2.5
109.
51.
717
.213
2.16
28.1
515
.66.
954.
6621
.951
39
HH
F412
-85
4073
.513
510
3.85
1.3
18.6
192.
6850
.85
28.2
55.
73.
821
513
10H
HF4
12-1
0640
73.5
133.
592
.81.
313
.816
2.21
36.2
520
.26
3.99
21.1
523
11H
HF4
12-1
540
7213
390
.15
1.1
15.4
181.
9534
18.9
6.5
4.33
20.1
513
12H
HF4
12-2
839
.92
7613
890
.52.
115
.416
2.75
43.3
24.0
56.
554.
3619
.353
313
HH
F412
-39
39.5
973
.513
798
.95
1.5
18.2
518
2.52
45.5
25.2
5.9
3.89
17.8
553
14H
HF4
12-3
739
.52
7914
087
.31.
913
.614
2.5
33.8
518
.75
6.4
4.14
2051
315
HH
F412
-80
39.4
371
133
107.
651.
317
.216
.52.
0533
.85
18.8
5.55
3.6
19.8
551
316
HH
F412
-24
39.3
579
.513
710
0.55
1.6
18.5
22.5
2.62
60.5
33.2
56
3.88
19.6
354
317
HH
F412
-82
39.3
380
139.
510
1.95
1.2
16.2
162.
4539
.221
.86.
34.
0919
533
18H
HF4
12-5
39.1
869
128
116.
31.
516
.95
16.5
2.15
27.7
15.4
5.7
3.69
18.2
543
19H
HF4
12-2
38.9
573
134
93.8
51.
517
.418
2.18
39.1
521
.75
5.9
3.74
1952
320
HH
F412
-112
38.8
974
133.
510
1.8
1.3
15.8
192.
1842
.85
23.8
5.9
3.65
2050
321
HH
F412
-30
38.7
7413
584
.25
1.9
14.9
152.
7841
.723
.15
6.2
3.92
17.5
553
22H
HF4
12-4
138
.47
73.5
133
109.
51.
715
.814
.52.
3634
.519
.05
6.5
4.09
22.1
503

23H
HF4
12-8
38.3
470
.513
080
.95
1.3
16.5
18.5
1.71
31.6
517
.65.
73.
5419
.150
324
HH
F412
-16
38.1
972
.513
576
.95
1.1
16.6
142.
433
.35
17.4
5.5
3.4
17.4
255
325
HH
F412
-93
38.1
7413
286
.91.
316
.819
2.26
46.5
25.8
55.
32.
4519
.951
3
26H
HF4
12-1
1037
.89
6912
894
.15
1.5
16.6
152.
3835
.619
.86.
23.
7821
.649
3
27H
HF4
12-2
937
.75
7413
694
.55
2.7
14.7
17.5
2.52
44.1
524
.55
6.1
3.7
18.8
543
28H
HF4
12-2
637
.74
83.5
139.
512
0.2
1.3
15.2
182.
9252
.65
29.2
56.
63.
9917
.955
3
29H
HF4
12-2
337
.575
140
104.
152.
516
.25
182.
341
.423
5.6
3.36
20.3
523
30H
HF4
12-5
537
.473
134.
511
2.25
116
.417
2.22
37.8
521
6.05
3.62
2053
3
31H
HF4
12-8
137
.39
7313
4.5
99.6
51.
317
.521
2.25
47.2
526
.25
6.5
3.89
19.6
523
32H
HF4
12-5
237
.273
130.
510
2.35
1.3
18.2
16.5
2.21
34.4
19.1
5.4
3.2
19.6
523
33H
HF4
12-7
836
.74
8014
011
0.95
218
.523
2.42
52.8
29.3
55.
93.
418
.553
3
34H
HF4
12-4
536
.73
7313
3.5
103.
151.
116
.414
2.28
31.8
517
.75.
83.
3620
.352
3
35H
HF4
12-9
436
.63
7313
1.5
113.
951.
416
.612
2.17
26.1
14.5
7.6
4.38
20.5
513
36H
HF4
12-1
1736
.573
.513
393
.95
1.5
17.5
222.
5639
.533
.05
6.7
3.84
22.1
503
37H
HF4
12-2
136
.37
73.5
135.
598
.45
1.6
1517
2.34
39.8
522
.16.
23.
5522
.43
503
38H
HF4
12-1
436
.26
7213
1.5
74.5
51.
213
.916
2.24
37.1
20.6
5.8
3.29
19.5
513
39H
HF4
12-9
036
7213
211
3.5
1.9
1618
2.39
4323
.85
63.
3819
.351
3
40H
HF4
12-5
735
.974
133.
593
.95
1.6
13.9
152.
334
.519
.15
6.5
3.63
22.9
493
41H
HF4
12-4
835
.76
7413
4.5
98.5
1.3
14.6
172.
6242
.123
.35
73.
9219
.352
3
42H
HF4
12-1
1535
.43
7413
2.5
87.3
1.7
14.7
152.
3334
.919
.46.
353.
523
493
43H
HF4
12-1
1335
.474
.513
3.5
93.5
1.3
17.2
19.5
2.25
49.7
27.0
66.
43.
518
.951
3
44H
HF4
12-5
834
.973
.513
295
.35
1.6
15.8
513
2.01
17.3
59.
655.
62.
922
.547
3
Che
cks
DD
B-1
234
.81
77.0
413
4.80
97.4
81.
3517
.13
18.6
72.
3741
.43
22.8
75.
803.
1820
.70
52.0
04
DM
B-2
2536
.05
75.0
813
4.08
95.9
91.
5017
.37
21.7
12.
4951
.18
27.9
86.
133.
4721
.00
49.0
03
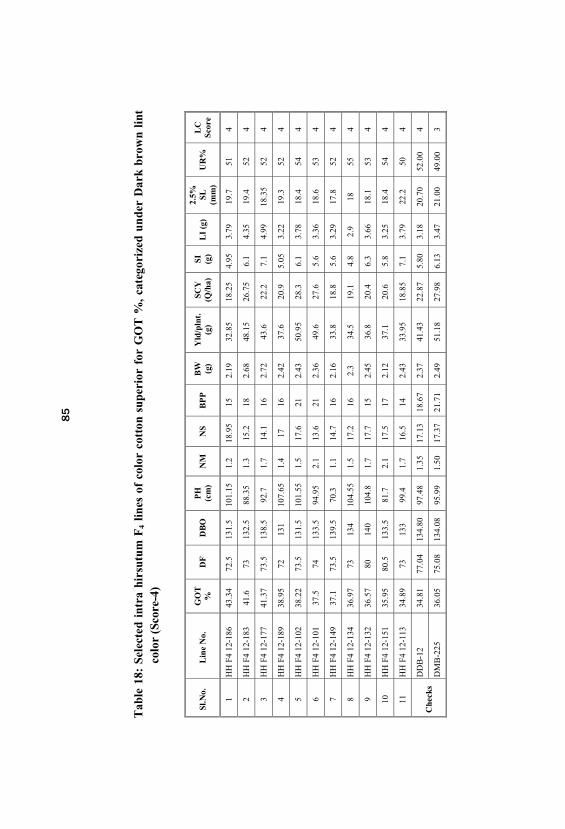
Tab
le18
:Se
lect
edin
tra
hirs
utum
F4
lines
ofco
lor
cott
onsu
peri
orfo
rG
OT
%,
cate
gori
zed
unde
rD
ark
brow
nlin
tco
lor
(Sco
re-4
)
Sl.N
o.
Lin
eN
o.
GO
T%
DF
DB
OP
H(c
m)
NM
NS
BP
PB
W (g)
Yld
/pln
t.
(g)
SCY
(Q/h
a)SI (g
)L
I(g
)2.
5% SL (mm
)U
R%
LC
Scor
e
1H
HF4
12-1
8643
.34
72.5
131.
510
1.15
1.2
18.9
515
2.19
32.8
518
.25
4.95
3.79
19.7
514
2H
HF4
12-1
8341
.673
132.
588
.35
1.3
15.2
182.
6848
.15
26.7
56.
14.
3519
.452
4
3H
HF4
12-1
7741
.37
73.5
138.
592
.71.
714
.116
2.72
43.6
22.2
7.1
4.99
18.3
552
4
4H
HF4
12-1
8938
.95
7213
110
7.65
1.4
1716
2.42
37.6
20.9
5.05
3.22
19.3
524
5H
HF4
12-1
0238
.22
73.5
131.
510
1.55
1.5
17.6
212.
4350
.95
28.3
6.1
3.78
18.4
544
6H
HF4
12-1
0137
.574
133.
594
.95
2.1
13.6
212.
3649
.627
.65.
63.
3618
.653
4
7H
HF4
12-1
4937
.173
.513
9.5
70.3
1.1
14.7
162.
1633
.818
.85.
63.
2917
.852
4
8H
HF4
12-1
3436
.97
7313
410
4.55
1.5
17.2
162.
334
.519
.14.
82.
918
554
9H
HF4
12-1
3236
.57
8014
010
4.8
1.7
17.7
152.
4536
.820
.46.
33.
6618
.153
4
10H
HF4
12-1
5135
.95
80.5
133.
581
.72.
117
.517
2.12
37.1
20.6
5.8
3.25
18.4
544
11H
HF4
12-1
1334
.89
7313
399
.41.
716
.514
2.43
33.9
518
.85
7.1
3.79
22.2
504
Che
cks
DD
B-1
234
.81
77.0
413
4.80
97.4
81.
3517
.13
18.6
72.
3741
.43
22.8
75.
803.
1820
.70
52.0
04
DM
B-2
2536
.05
75.0
813
4.08
95.9
91.
5017
.37
21.7
12.
4951
.18
27.9
86.
133.
4721
.00
49.0
03

4.2.2.12 2.5 per cent Span length (mm)
The mean 2.5 per cent span length was 21.6 mm among the lightbrown color (Score-2) cotton lines; the highest value of 23.65 mm wasobserved in the line HH F4 12-63. The 2.5 per cent span length in thechecks DDB-12 and DMB-225 was 20.7 mm and 21 mm respectively. Among forty six light brown color cotton lines, thirty two lines were foundsuperior over both the checks are presented in Table 8. The top ten lines areHH F4 12-63, HH F4 12-17, HH F4 12-98, HH F4 12-44, HH F4 12-42, HHF4 12-71, HH F4 12-64, HH F4 12-66, HH F4 12-67 and HH F4 12-54.
The mean 2.5 per cent span length was 19.8 mm among the mediumbrown color (Score-3) cotton lines; the line HH F4 12-115 recorded highestvalue of 23 mm. Out of forty eight lines in the medium brown color class, nine lines HH F4 12-115, HH F4 12-57, HH F4 12-58, HH F4 12-21, HH F4
12-117, HH F4 12-41, HH F4 12-116, HH F4 12-110 and HH F4 12-106found superior over both the checks are detailed in Table 12.
The line HH F4 12-113 had the highest 2.5 per cent span length (22.2mm) which the only line found superior over both the checks DDB-12 andDMB-225 as detailed in Table 16. While the mean value was 18.9 mmamong the dark brown color (Score-4) cotton lines.
4.2.2.13 Uniformity Ratio (%)
Uniformity ratio in all the three class of colors was having almostsimilar mean values 49.8, 51.9 and 52.5 per cent. Ranges obtained for thetrait, in respective color classes were relatively similar 47-54, 47-55 and50-55. The mean uniformity values in the checks DDB-12 and DMB-225were 53 and 49 per cent as detailed in I.
In light brown color (Score-2) cotton lines, highest uniformity ratio(54 %) was recorded in the line HH F4 12-104 and lowest (47 %) wasobtained in the line HH F4 12-103. Three lines were superior to the checkDDB-12 and twenty four lines recorded superior to DMB-225.
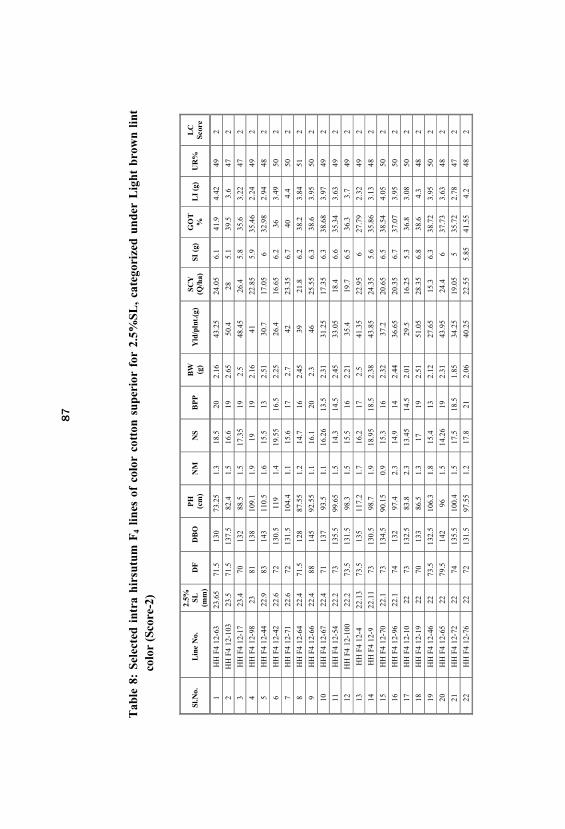
Tab
le8:
Sele
cted
intr
ahi
rsut
umF
4lin
esof
colo
rco
tton
supe
rior
for
2.5%
SL,
cate
gori
zed
unde
rL
ight
brow
nlin
tco
lor
(Sco
re-2
)
Sl.N
o.
Lin
eN
o.
2.5% SL (mm
)D
FD
BO
PH
(cm
)N
MN
SB
PP
BW (g)
Yld
/pln
t.(g
)SC
Y(Q
/ha)
SI(g
)G
OT
%L
I(g
)U
R%
LC
Scor
e
1H
HF4
12-6
323
.65
71.5
130
73.2
51.
318
.520
2.16
43.2
524
.05
6.1
41.9
4.42
492
2H
HF4
12-1
0323
.571
.513
7.5
82.4
1.5
16.6
192.
6550
.428
5.1
39.5
3.6
472
3H
HF4
12-1
723
.470
132
88.5
1.5
17.3
519
2.5
48.4
526
.45.
835
.63.
2247
2
4H
HF4
12-9
823
8113
810
9.1
1.9
1919
2.16
4122
.85
5.9
35.4
62.
2449
2
5H
HF4
12-4
422
.983
143
110.
51.
615
.513
2.51
30.7
17.0
56
32.9
82.
9448
2
6H
HF4
12-4
222
.672
130.
511
91.
419
.55
16.5
2.25
26.4
16.6
56.
236
3.49
502
7H
HF4
12-7
122
.672
131.
510
4.4
1.1
15.6
172.
742
23.3
56.
740
4.4
502
8H
HF4
12-6
422
.471
.512
887
.55
1.2
14.7
162.
4539
21.8
6.2
38.2
3.84
512
9H
HF4
12-6
622
.488
145
92.5
51.
116
.120
2.3
4625
.55
6.3
38.6
3.95
502
10H
HF4
12-6
722
.471
137
93.5
1.1
16.2
613
.52.
3131
.25
17.3
56.
338
.68
3.97
492
11H
HF4
12-5
422
.273
135.
599
.65
1.5
14.3
14.5
2.45
33.0
518
.46.
635
.34
3.63
492
12H
HF4
12-1
0022
.273
.513
1.5
98.3
1.5
15.5
162.
2135
.419
.76.
536
.33.
749
2
13H
HF4
12-4
22.1
373
.513
511
7.2
1.7
16.2
172.
541
.35
22.9
56
27.7
92.
3249
2
14H
HF4
12-9
22.1
173
130.
598
.71.
918
.95
18.5
2.38
43.8
524
.35
5.6
35.8
63.
1348
2
15H
HF4
12-7
022
.173
134.
590
.15
0.9
15.3
162.
3237
.220
.65
6.5
38.5
44.
0550
2
16H
HF4
12-9
622
.174
132
97.4
2.3
14.9
142.
4436
.65
20.3
56.
737
.07
3.95
502
17H
HF4
12-1
022
7313
2.5
83.8
2.3
13.4
514
.52.
0129
.516
.25
5.3
36.8
3.08
502
18H
HF4
12-1
922
7013
386
.51.
317
192.
5151
.05
28.3
56.
838
.64.
348
2
19H
HF4
12-4
622
73.5
132.
510
6.3
1.8
15.4
132.
1227
.65
15.3
6.3
38.7
23.
9550
2
20H
HF4
12-6
522
79.5
142
961.
514
.26
192.
3143
.95
24.4
637
.73
3.63
482
21H
HF4
12-7
222
7413
5.5
100.
41.
517
.518
.51.
8534
.25
19.0
55
35.7
22.
7847
2
22H
HF4
12-7
622
7213
1.5
97.5
51.
217
.821
2.06
40.2
522
.55
5.85
41.5
54.
248
2

23H
HF4
12-1
2022
73.5
133.
510
9.4
1.5
15.4
162.
3937
.35
20.7
56.
339
.48
4.13
492
24H
HF4
12-5
621
.992
141
100
1.3
15.5
13.5
2.42
32.7
18.1
56.
238
.47
3.88
492
25H
HF4
12-5
921
.973
.513
894
.85
1.4
15.2
815
2.05
27.4
15.2
6.1
37.8
93.
649
2
26H
HF4
12-9
921
.981
.513
811
8.2
1.3
18.6
152.
2133
.818
.75
6.3
36.8
93.
6950
2
27H
HF4
12-3
821
.85
7213
289
.65
2.1
17.5
172.
6242
.123
.47.
334
.79
3.9
512
28H
HF4
12-9
221
.85
74.5
131
100.
91.
215
162.
3539
21.6
55.
536
.43
3.16
512
29H
HF4
12-1
0521
.774
133.
591
.05
1.4
15.9
202.
3646
.25
25.6
55.
643
.34
4.29
492
30H
HF4
12-6
121
.687
142
93.5
51.
617
.522
.52.
1250
.127
.85
4.2
30.8
61.
8650
2
31H
HF4
12-6
921
.25
72.5
130.
590
.25
1.1
14.8
16.5
2.3
37.9
521
.05
5.65
41.3
93.
9950
2
32H
HF4
12-3
621
.172
.513
511
3.5
2.1
16.5
182.
0536
205.
540
.75
3.8
512
33H
HF4
12-5
321
8713
593
.55
0.9
16.3
182.
545
256.
438
.86
4.09
512
34H
HF4
12-9
721
73.5
132.
510
8.4
1.5
17.4
202.
243
.524
.25.
936
.48
3.4
492
35H
HF4
12-6
020
.991
142
101.
51.
313
.818
.52.
5246
.725
.95
5.7
31.2
62.
5850
2
36H
HF4
12-1
120
.85
7013
195
.91.
315
.817
2.04
34.6
519
.25
5.1
37.7
53.
0951
2
37H
HF4
12-6
220
.75
73.5
140
90.5
51.
216
.119
2.22
39.8
22.0
55.
540
.65
3.78
502
Che
cks
DD
B-1
220
.70
77.0
413
4.80
97.4
81.
3517
.13
18.6
72.
3741
.43
22.8
75.
8034
.81
3.18
52.0
04
DM
B-2
2521
.00
75.0
813
4.08
95.9
91.
5017
.37
21.7
12.
4951
.18
27.9
86.
1336
.05
3.47
49.0
03

Tab
le12
:Se
lect
edin
tra
hirs
utum
F4
lines
ofco
lor
cott
onsu
peri
orfo
r2.
5%SL
, cat
egor
ized
unde
rM
ediu
mbr
own
lint
colo
r(S
core
-3)
Sl.N
o.
Lin
eN
o.
2.5% SL (mm
)D
FD
BO
PH
(cm
)N
MN
SB
PP
BW (g)
Yld
/pln
t.
(g)
SCY
(Q/h
a)SI (g
)G
OT
%L
I(g
)U
R%
LC
Scor
e
1H
HF4
12-1
1523
7413
2.5
87.3
1.7
14.7
152.
3334
.919
.46.
3535
.43
3.5
493
2H
HF4
12-5
722
.974
133.
593
.95
1.6
13.9
152.
334
.519
.15
6.5
35.9
3.63
493
3H
HF4
12-5
822
.573
.513
295
.35
1.6
15.8
513
2.01
17.3
59.
655.
634
.92.
947
3
4H
HF4
12-2
122
.43
73.5
135.
598
.45
1.6
1517
2.34
39.8
522
.16.
236
.37
3.55
503
5H
HF4
12-1
1722
.173
.513
393
.95
1.5
17.5
222.
5639
.533
.05
6.7
36.5
3.84
503
6H
HF4
12-4
122
.173
.513
310
9.5
1.7
15.8
14.5
2.36
34.5
19.0
56.
538
.47
4.09
503
7H
HF4
12-1
1621
.974
132.
510
9.5
1.7
17.2
132.
1628
.15
15.6
6.95
40.1
34.
6651
3
8H
HF4
12-1
1021
.669
128
94.1
51.
516
.615
2.38
35.6
19.8
6.2
37.8
93.
7849
3
9H
HF4
12-1
0621
.173
.513
3.5
92.8
1.3
13.8
162.
2136
.25
20.2
640
3.99
523
10H
HF4
12-8
521
73.5
135
103.
851.
318
.619
2.68
50.8
528
.25
5.7
403.
851
3
11H
HF4
12-1
1820
.778
.513
4.5
97.8
1.9
15.6
162.
0332
.418
5.9
25.7
52.
0550
3
Che
cks
DD
B-1
220
.70
77.0
413
4.80
97.4
81.
3517
.13
18.6
72.
3741
.43
22.8
75.
8034
.81
3.18
52.0
04
DM
B-2
2521
.00
75.0
813
4.08
95.9
91.
5017
.37
21.7
12.
4951
.18
27.9
86.
1336
.05
3.47
49.0
03

In medium brown color (Score-3) cotton lines, the lines HH F4 12-39, HH F4 12-16, HH F4 12-26, HH F4 12-1 and HH F4 12-30 recordedhighest uniformity ratio (55%) and lowest was obtained in the line HH F4
12-58 (47 %). Sixteen lines found superior to the check DDB-12 andtwenty six lines found better than the check DMB-225.
In dark brown color (Score-4) cotton lines, the line HH F4 12-134recorded highest (55 %) uniformity ratio and lowest (50 %) was observedin the line HH F4 12-113. Five lines found superior to the check DDB-12and seven lines recorded superior to the check DMB-225.
4.2.3 Variability and heritability parameters in intra hirsutum F4 linesof color cotton
The intra hirsutum F4 lines showed significant variability for all thecharacters studied. The values of mean, range, coefficient of variation, heritability, genetic advance and genetic advance as per cent mean foreleven traits are presented in Table 19.
4.2.3.1 Days to 50 per cent flowering
The trait recorded low GCV (5.71 %) and PCV (5.79 %). High broadsense heritability (98 %) coupled with low to moderate genetic advance(8.68 %) and genetic advance as per cent mean (11.62 %) for the trait.
4.2.3.2 Days to first boll opening
Low GCV (2.54 %) and PCV (2.64 %) with high broad senseheritability (92 %) were obtained for the trait. Low genetic advance (6.75%) and genetic advance as per cent mean (5.02 %) were obtained.
4.2.3.3 Boll weight (g)
High (72 %) broad sense heritability, low GCV (7.82 %) and PCV(9.22 %). were observed for boll weight. Low (0.32 %) to moderate (13.67%) genetic advance and genetic advance as per cent mean was obtained forthe trait respectively.
4.2.3.4 Plant height (cm)
Moderate GCV (10.89 %) and PCV (10.97 %) were obtained for thetrait. High (98 %) broad sense heritability coupled with high geneticadvance (21.62 %) and genetic advance as per cent mean (22.25 %) wereobserved for the trait.
4.2.3.5 Number of sympodia
The trait recorded low GCV (7.54 %) and PCV (9.01 %). High (70%) broad sense heritability, low genetic advance (2.1 %) and moderategenetic advance as per cent mean (12.99 %) was observed for the trait.
4.2.3.6 Number of monopodia
High GCV (22.35 %) and PCV (23.20 %) coupled with high broadsense heritability (93 %) was observed for the trait. Genetic advance andgenetic advance as per cent mean for the trait were low (0.68 %) and high(44.36 %) respectively.
4.2.3.7 Number of bolls per plant
Moderate GCV (13.49 %) and PCV (13.89 %) were observed for thetrait. High (94 %) broad sense heritability coupled with low (4.58 %)genetic advance and moderate (27.02 %) genetic advance as per cent meanwere recorded for the trait.
4.2.3.8 Ginning out turn (%)
The trait recorded moderate GCV (10.20 %) and PCV (10.21 %). Broad sense heritability recorded was high (99 %). Low (7.98) to high (21)genetic advance and genetic advance as per cent mean for the trait wereobserved respectively.
4.2.3.9 Seed index (g)
Moderate GCV (10.08 %) and PCV (10.09 %) were recorded for thetrait. High (99 %) broad sense heritability was recorded. Genetic advanceand genetic advance as per cent mean for the trait recorded were 1.24 %and 20.74 % respectively.
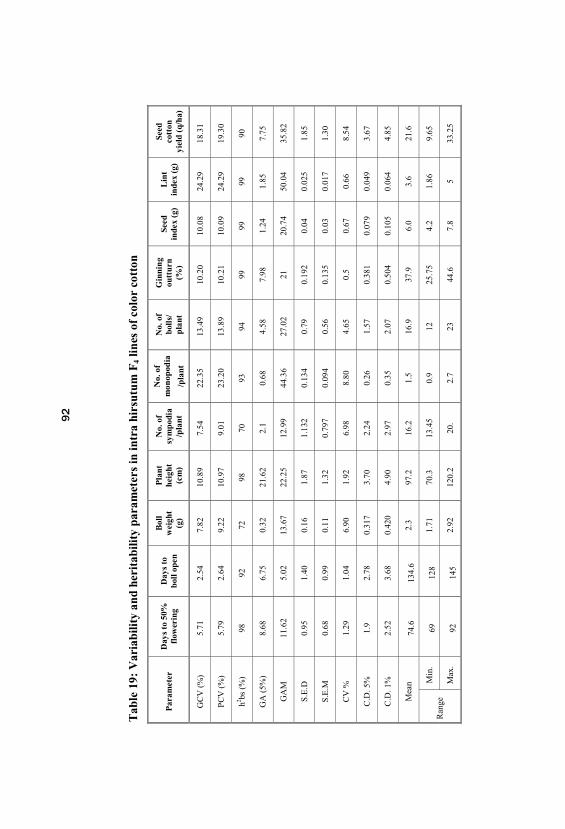
Tab
le19
:V
aria
bilit
yan
dhe
rita
bilit
ypa
ram
eter
sin
intr
ahi
rsut
umF
4lin
esof
colo
rco
tton
Par
amet
erD
ays
to50
%fl
ower
ing
Day
sto
boll
open
Bol
lw
eigh
t(g
)
Pla
nthe
ight
(cm
)
No.
of
sym
podi
a/p
lant
No.
of
mon
opod
ia
/pla
nt
No.
of
boll
s/pl
ant
Gin
ning
outt
urn
(%)
Seed
inde
x(g
)L
int
inde
x(g
)
Seed
cott
onyi
eld
(q/h
a)
GC
V(%
)5.
712.
547.
8210
.89
7.54
22.3
513
.49
10.2
010
.08
24.2
918
.31
PC
V(%
)5.
792.
649.
2210
.97
9.01
23.2
013
.89
10.2
110
.09
24.2
919
.30
h2 bs(%
)98
9272
9870
9394
9999
9990
GA
(5%
)8.
686.
750.
3221
.62
2.1
0.68
4.58
7.98
1.24
1.85
7.75
GA
M11
.62
5.02
13.6
722
.25
12.9
944
.36
27.0
221
20.7
450
.04
35.8
2
S.E
.D0.
951.
400.
161.
871.
132
0.13
40.
790.
192
0.04
0.02
51.
85
S.E
.M0.
680.
990.
111.
320.
797
0.09
40.
560.
135
0.03
0.01
71.
30
CV
%1.
291.
046.
901.
926.
988.
804.
650.
50.
670.
668.
54
C.D
. 5%
1.9
2.78
0.31
73.
702.
240.
261.
570.
381
0.07
90.
049
3.67
C.D
. 1%
2.52
3.68
0.42
04.
902.
970.
352.
070.
504
0.10
50.
064
4.85
Mea
n74
.613
4.6
2.3
97.2
16.2
1.5
16.9
37.9
6.0
3.6
21.6
Ran
geM
in.
6912
81.
7170
.313
.45
0.9
1225
.75
4.2
1.86
9.65
Max
. 92
145
2.92
120.
220
. 2.
723
44.6
7.8
533
.25

4.2.3.10 Lint index (g)
High GCV (24.29 %) and PCV (24.29 %) were recorded for the trait. High (99 %) broad sense heritability coupled with low (1.85 %) to high(50.54 %) genetic advance and genetic advance as per cent mean wereobtained for the trait respectively.
4.2.3.11 Seed cotton yield (q/ha)
The trait recorded moderate GCV (18.31 per cent) and PCV (19.30per cent). Broad sense heritability recorded was high (90 %). Geneticadvance and genetic advance as per cent mean of the trait were 7.75 and35.82 respectively.
4.2.4 Phenotypic correlation studies for different traits in intrahirsutum F4 lines of color cotton
The lines differed significant (P <0.05) for the traits studied, indicating the presence of sufficient genetic variability in the material. Thecorrelation coefficients of 13 independent variables against seed cottonyield are presented in Table 20.
Days to 50 per cent flowering showed significant positive correlationwith days to first boll opening (0.687) and boll weight (0.23). However, thetrait exhibited significant negative correlation with ginning out turn (-0.255).
Days to first boll opening exhibited significant positive correlationwith days to 50 per cent flowering (0.687), boll weight (0.246) and seedcotton yield (0.204). But, significant negative correlation was observedwith number of sympodia (-0.155) and ginning out turn (-0.182).
Plant height showed significant positive correlation with number ofsympodia (0.324) while there was no significant correlation with the othertraits..
Boll weight exhibited significant positive correlation with days tofirst boll opening (0.246), number of monopodia (0.146), seed index(0.425), lint index (0.286), uniformity ratio (0.14) and seed cotton yield

(0.588). However, the trait showed significant negative correlation withnumber of sympodia (-0.143).
Number of sympodia exhibited significant positive correlation withplant height (0.324), bolls per plant (0.329) and seed cotton yield (0.151). However, significant negative correlation was observed with days to firstboll opening (-0.155) and boll weight (-0.143).
Number of monopodia exhibited significant positive correlation withboll weight (0.146) and significant negative correlation with ginning outturn (-0.213) and lint index (-0.135).
Bolls per plant exhibited significant positive correlation with numberof sympodia (0.329), seed cotton yield (0.81) and significant negativecorrelation with seed index (-0.212).
Ginning out turn exhibited significant positive correlation with lintindex (0.846). However, the trait showed significant negative correlationwith days to 50 per cent flowering (-0.255), days to first boll opening (-0.182) and number of monopodia (-0.213).
Seed index exhibited significant positive correlation with boll weight(0.425), lint index (0.42) and 2.5 per cent span length (0.19). However, with number of sympodia (-0.173) and bolls per plant (-0.212) the traitshowed significant negative correlation.
Lint index showed significant positive correlation with boll weight(0.286), ginning out turn (0.846) and seed index (0.42) and the trait showedsignificant negative correlation with number of monopodia (-0.135).
2.5 per cent span length exhibited significant positive correlationwith seed index (0.19) and negative correlation with uniformity ratio (-0.854) and lint color (-0.595).
Uniformity ratio showed significant positive correlation with bollweight (0.14), lint color (0.537), and seed cotton yield (0.537) and with 2.5per cent span length (-0.854) the trait showed significant negativecorrelation.
Lint color exhibited significant positive correlation with uniformity
ratio (0.537) and significant negative correlation with 2.5 per cent span
length (-0.595).
Seed cotton yield showed significant positive correlation with days
to first boll opening (0.204), boll weight (0.588), number of sympodia
(0.151), bolls per plant (0.81) and uniformity ratio (0.537).
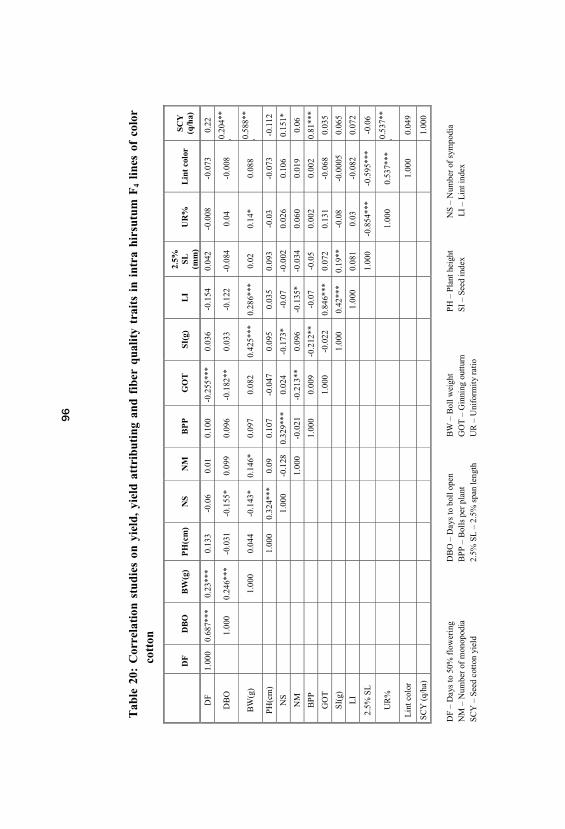
Tab
le20
:C
orre
lati
onst
udie
son
yiel
d, y
ield
attr
ibut
ing
and
fibe
rqu
alit
ytr
aits
inin
tra
hirs
utum
F4
lines
ofco
lor
cott
on
DF
DB
OB
W(g
)P
H(c
m)
NS
NM
BP
PG
OT
SI(g
)L
I2.
5% SL (mm
)U
R%
Lin
tco
lor
SCY
(q/h
a)
DF
1.00
00.
687*
**0.
23**
*0.
133
-0.0
60.
010.
100
-0.2
55**
*0.
036
-0.1
540.
042
-0.0
08-0
.073
0.22
DB
O
1.
000
0.24
6***
-0.0
31-0
.155
*0.
099
0.09
6-0
.182
**0.
033
-0.1
22-0
.084
0.04
-0.0
080.
204*
**
BW
(g)
1.00
00.
044
-0.1
43*
0.14
6*0.
097
0.08
20.
425*
**0.
286*
**0.
020.
14*
0.08
80.
588*
**
PH(c
m)
1.
000
0.32
4***
0.09
0.10
7-0
.047
0.09
50.
035
0.09
3-0
.03
-0.0
73-0
.112
NS
1.00
0-0
.128
0.32
9***
0.02
4-0
.173
*-0
.07
-0.0
020.
026
0.10
60.
151*
NM
1.00
0-0
.021
-0.2
13**
0.09
6-0
.135
*-0
.034
0.06
00.
019
0.06
BP
P
1.
000
0.00
9-0
.212
**-0
.07
-0.0
50.
002
0.00
20.
81**
*
GO
T
1.
000
-0.0
220.
846*
**0.
072
0.13
1-0
.068
0.03
5
SI(
g)
1.00
00.
42**
*0.
19**
-0.0
8-0
.000
50.
065
LI
1.
000
0.08
10.
03-0
.082
0.07
2
2.5%
SL
1.
000
-0.8
54**
*-0
.595
***
-0.0
6
UR
%
1.
000
0.53
7***
0.53
7**
*
Lin
tcol
or
1.00
00.
049
SCY
(q/h
a)
1.
000
DF
–D
ays
to50
%fl
ower
ing
DB
O–
Day
sto
boll
open
BW
–B
ollw
eigh
t
PH–
Plan
thei
ght
NS
–N
umbe
rof
sym
podi
a
N
M–
Num
ber
ofm
onop
odia
B
PP–
Bol
lspe
rpl
ant
G
OT
–G
inni
ngou
ttur
n
SI
–Se
edin
dex
LI
–L
inti
ndex
SCY
–Se
edco
tton
yiel
d
2.5%
SL–
2.5%
span
leng
thU
R–
Uni
form
ity
rati
o

4.2.5 Path co-efficient analysis of all component traits versus seed
cotton yield in intra hirsutum F4 lines of color cotton.
The path co-efficient analysis is presented in Table 21 and Fig. 2.
Days to 50 per cent flowering showed direct positive effect on yield (0.076)
and showed indirect positive effect on yield through days to first boll
opening (0.052), boll weight (0.02), plant height (0.01), number of
monopodia (0.0008), bolls per plant (0.008), seed index (0.003), 2.5 per
cent span length (0.003) and seed cotton yield (0.217). The trait showed
indirect negative effect through ginning out turn (-0.019), lint index (-
0.012), uniformity ratio (-0.0006) and lint color (-0.005).
Days to first boll opening showed direct negative effect on yield (-
0.05) and showed indirect negative effect on yield through days to 50 per
cent flowering (-0.034), boll weight (-0.012), number of monopodia (-
0.005), bolls per plant (-0.005), seed index (-0.002) and uniformity ratio (-
0.002). The trait showed indirect positive effect through plant height
(0.002), number of sympodia (0.008), ginning out turn (0.009), lint index
(0.006), 2.5 per cent span length (0.004), lint color (0.0004) and seed
cotton yield (0.204).
Boll weight exhibited direct positive effect on yield (0.512) and
showed indirect positive effect on yield through days to 50 per cent
flowering (0.115), days to first boll opening (0.126), plant height (0.023),
number of monopodia (0.075), bolls per plant (0.05), ginning out turn
(0.042), seed index (0.218), lint index (0.15), uniformity ratio (0.071), lint
color (0.05) and seed cotton yield (0.588). The trait showed indirect
negative effect through number of sympodia (-0.073) and 2.5 per cent span
length (-0.009).

Plant height showed direct negative effect on yield (-0.056) and
showed indirect negative effect on yield through days to 50 per cent
flowering (-0.008), boll weight (-0.003), number of sympodia (-0.02),
number of monopodia (-0.005), seed index (-0.005), lint index (-0.002), 2.5
per cent span length (-0.005) and seed cotton yield (-0.112).
The trait showed indirect positive effect through days to first boll
opening (0.002), bolls per plant (0.006), ginning out turn (0.003),
uniformity ratio (0.002) and lint color (0.004).
Number of sympodia showed direct negative effect on yield (-0.009)
and showed indirect negative effect on yield through plant height (-0.003),
bolls per plant (-0.003), ginning out turn (-0.0002), uniformity ratio (-
0.0002) and lint color (-0.001). The trait showed indirect positive effect
through days to 50 per cent flowering (0.0006), days to first boll opening
(0.0014), boll weight (0.0013), number of monopodia (0.001), seed index
(0.002), lint index (0.0006) and seed cotton yield (0.151).
Number of monopodia showed direct positive effect on yield (0.007)
and showed indirect positive effect through days to 50 per cent flowering
(0.0001), days to first boll opening (0.0007), boll weight (0.001), plant
height (0.0007), seed index (0.0007), uniformity ratio (0.0004), lint color
(0.0001) and seed cotton yield (0.06). The trait showed indirect negative
effect on yield through number of sympodia (-0.0009), bolls per plant (-
0.0002), ginning out turn (-0.002), lint index (-0.001) and 2.5 per cent span
length (-0.0002).
Bolls per plant showed direct positive effect on yield (0.76) and
showed indirect positive effect on yield through days to 50 per cent
flowering (0.076), days to first boll opening (0.073), boll weight (0.074),

number sympodia (0.25), ginning out turn (0.007), uniformity ratio (0.001)
and seed cotton yield (0.81). The trait showed indirect negative effect on
yield through plant height (-0.081), number of monopodia (-0.02), seed
index (-0.16), lint index (-0.05), 2.5 per cent span length (-0.037) and lint
color (-0.003).
Ginning out turn showed direct positive effect on yield (0.153) and
showed indirect positive effect through boll weight (0.013), number of
sympodia (0.004), bolls per plant (0.001), lint index (0.13), uniformity ratio
(0.02) and seed cotton yield (0.035). The trait showed indirect negative
effect on yield through days to 50 per cent flowering (-0.04), days to first
boll opening (-0.03), plant height (-0.007), number of monopodia
(-0.033), seed index (-0.003), 2.5 per cent span length (-0.01) and lint color
(-0.01).
Seed index showed direct positive effect on yield (0.094) and
showed indirect positive effect through days to 50 per cent flowering
(0.003), days to first boll opening (0.003), boll weight (0.04), plant height
(0.009), number of monopodia (0.009), lint index (0.04), 2.5 per cent span
length (0.018) and seed cotton yield (0.065). The trait showed indirect
negative effect on yield through number of sympodia (-0.016), bolls per
plant (-0.02), ginning out turn (-0.002) and uniformity ratio (-0.0071).
Lint index showed direct negative effect on yield (-0.183) and
showed indirect negative effect through boll weight (-0.053), plant height (-
0.006), ginning out turn (-0.16), seed index (-0.077), 2.5 per cent span
length (-0.015) and uniformity index (-0.006). The trait showed indirect
positive effect on yield through days to 50 per cent flowering (0.03), days
to first boll opening (0.022), number of sympodia (0.013), number of
monopodia (0.025), bolls per plant (0.012), lint color (0.02) and seed cotton
yield (0.072).
2.5 per cent showed direct negative effect on yield (-0.03) and
showed indirect negative effect on yield through days to 50 per cent
flowering (-0.001), plant height (-0.003), seed index (-0.006), lint index (-
0.002) and seed cotton yield (-0.06). The trait showed indirect positive
effect on yield through days to first boll opening (0.002), boll weight
(0.0005), number of sympodia (0.0001), number of monopodia (0.001),
bolls per plant (0.001), ginning out turn (0.002), uniformity ratio (0.03) and
lint color (0.02).
Uniformity ratio showed direct negative effect on yield (-0.022) and
showed indirect negative effect on yield through days to first boll opening
(-0.0008), boll weight (-0.003), number of sympodia (-0.0006), number of
monopodia (-0.001), ginning out turn (-0.003), lint index (-0.0007) and lint
color (-0.012). The trait showed indirect positive effect on yield through
days to 50 per cent flowering (0.0002), plant height (0.0007), seed index
(0.002), 2.5 per cent span length (0.02) and seed cotton yield (0.082).
Lint color showed direct negative effect on yield (-0.002) and
showed indirect negative effect on yield through boll weight (-0.0001),
number of sympodia (-0.0002), uniformity ratio (-0.0008). The trait showed
indirect positive effect on yield through days to 50 per cent flowering
(0.0001), plant height (0.0001), ginning out turn (0.0001), lint index
(0.001), 2.5 per cent span length (0.0009) and seed cotton yield (0.05).

Tab
le21
:P
ath
coef
fici
ent
anal
ysis
ofal
lco
mpo
nent
trai
tsve
rsus
seed
cott
onyi
eld
inin
tra
hirs
utum
F4
line
sof
colo
rco
tton
DF
DB
OB
W(g
)P
H(c
m)
NS
NM
BP
PG
OT
SI(g
)L
I2.
5%SL
(mm
)U
R%
Lin
tco
lor
DF
0.07
60.
052
0.02
0.01
-0.0
050.
0008
0.00
8-0
.019
0.00
3-0
.012
0.00
3-0
.000
6-0
.005
DB
O-0
.034
-0.0
5-0
.012
0.00
20.
008
-0.0
05-0
.005
0.00
9-0
.002
0.00
60.
004
-0.0
020.
0004
BW
(g)
0.11
50.
126
0.51
20.
023
-0.0
730.
075
0.05
0.04
20.
218
0.15
-0.0
090.
071
0.05
PH
(cm
)-0
.008
0.00
2-0
.003
-0.0
56-0
.02
-0.0
050.
006
0.00
3-0
.005
-0.0
02-0
.005
0.00
20.
004
NS
0.00
060.
0014
0.00
13-0
.003
-0.0
090.
001
-0.0
03-0
.000
20.
002
0.00
060.
00-0
.000
2-0
.001
NM
0.00
010.
0007
0.00
10.
0007
-0.0
009
0.00
7-0
.000
2-0
.002
0.00
07-0
.001
-0.0
002
0.00
040.
0001
BP
P0.
076
0.07
30.
074
-0.0
810.
25-0
.02
0.76
0.00
7-0
.16
-0.0
5-0
.037
0.00
1-0
.003
GO
T-0
.04
-0.0
30.
013
-0.0
070.
004
-0.0
330.
001
0.15
3-0
.003
0.13
-0.0
10.
02-0
.01
SI(g
)0.
003
0.00
30.
040.
009
-0.0
160.
009
-0.0
2-0
.002
0.09
40.
040.
018
-0.0
071
0.00
LI
0.03
0.02
2-0
.053
-0.0
060.
013
0.02
50.
012
-0.1
6-0
.077
-0.1
83-0
.015
-0.0
060.
02
2.5%
SL(m
m)
-0.0
010.
002
0.00
05-0
.003
0.00
010.
001
0.00
10.
002
-0.0
06-0
.002
-0.0
30.
030.
02
UR
%0.
0002
-0.0
008
-0.0
030.
0007
-0.0
006
-0.0
010.
00-0
.003
0.00
2-0
.000
70.
02-0
.022
-0.0
12
Lin
tcol
or0.
0001
0.00
-0.0
001
0.00
01-0
.000
20.
000.
000.
0001
0.00
0.00
10.
0009
-0.0
008
-0.0
02
SCY
(q/h
a)0.
217
0.20
4***
0.58
8***
-0.1
120.
151*
0.06
0.81
***
0.03
50.
065
0.07
2-0
.06
0.08
2***
0.05
R2
valu
e=
0.92
6
R
esid
uale
ffec
t=0.
272
DF
–D
ays
to50
%fl
ower
ing
DB
O–
Day
sto
boll
open
BW
–B
ollw
eigh
t
PH–
Plan
thei
ght
NS
–N
umbe
rof
sym
podi
a
N
M–
Num
ber
ofm
onop
odia
B
PP–
Bol
lspe
rpl
ant
G
OT
–G
inni
ngou
ttur
n
SI
–Se
edin
dex
LI
–L
inti
ndex
SCY
–Se
edco
tton
yiel
d
2.5%
SL–
2.5%
span
leng
thU
R–
Uni
form
ity
rati
o


4.2.6 Analysis of variance for yield and yield attributing traits in interspecific (HB) F4 lines of color cotton
Eighty five inter specific F4 lines along with two checks DDB-12 andDMB-225 were evaluated for eleven traits viz., days to 50% flowering, days to first boll opening, boll weight, plant height, number of sympodia, number of monopodia, bolls per plant, ginning out turn, seed index, lintindex and seed cotton yield are detailed in Table 22. From the table it isclear that all the traits studied exhibited significant mean sum of squaresindicating the presence of highly significant variation in the lines studied.
4.2.7 Mean performance of inter specific (HB) F4 lines of color cotton
The data collected on each of the characters studied in 85 interspecific F4 lines and two checks DDB-12 (Dharwad Dark Brown-12) andDMB-225 (Dharwad Medium Brown-225) are presented in Appendix- III.
4.2.7.1 Days to 50 per cent flowering
Average number of days taken for 50 per cent flowering in creamcolor (score-1), light brown lint color (Score-2), medium brown lint color(Score-3) and dark brown lint color (Score-4) cotton lines recorded 77.75, 79.75, 81.67 and 79.34 respectively. The days taken for 50 per centflowering in the checks DDB-12 and DMB-225 were 77.04 and 75.08respectively.
4.2.7.2 Days to first boll opening
Average number of days for first boll opening in different colorssuch as cream color (score-1), light brown lint color (Score-2), mediumbrown lint color (Score-3) and dark brown lint color (Score-4) cotton lineswere 136.5, 137.96, 138.88 and 137.36 respectively. The mean number ofdays for first boll opening in the checks DDB-12 and DMB-225 were 134.8and 134.08 days respectively.
4.2.7.3 Plant height (cm)
Average plant height values in all the four color classes viz., creamcolor (score-1), light brown lint color (Score-2), medium brown lint color(Score-3) and dark brown lint color (Score-4) cotton lines were 86.45,

97.11, 93.67 and 97.96 cm. respectively. The mean plant height value inthe checks DDB-12 and DMB-225 was 97.48 cm and 95.99 cmrespectively.
Range for plant height was maximum in the light brown lines (80.1-119.4) and the variation observed for plant height in respective colorclasses viz., cream color (80.4-92.5 cm), medium brown (67.5-113 cm) anddark brown (66.65-117.55 cm).
4.2.7.4 Number of monopodia
Average number of monopodia per plant observed in all the fourcolor classes cream (score-1), light brown (Score-2), medium brown(Score-3) and dark brown (Score-4) cotton lines were having 2.8, 1.79, 1.8and 1.75 respectively. The mean values in the checks DDB-12 and DMB-225 for the trait was 1.35 and 1.5 respectively. Range observed for numberof monopodia per plant in respective color classes viz., cream, light, medium and dark brown was 2.3-3.3, 1-2.5, 0.5-3.3 and 0.5-3.1respectively.

Tab
le22
:A
naly
sis
ofva
rian
cefo
ryi
eld
and
yiel
dat
trib
utin
gtr
aits
inin
ter
spec
ific
(HxB
)F
4lin
esof
colo
rco
tton
Sour
ceof
vari
atio
nd.
f.
Day
sto
50%
flow
erin
gD
ays
tobo
llop
en
Bol
l
wei
ght
(g)
Pla
nthe
ight
(cm
)
No.
of
sym
podi
a
/pla
nt
No.
of
mon
opod
ia
/pla
nt
No.
of
bolls
/
plan
t
Gin
ning
outt
urn
(%)
Seed
inde
x
(g)
Lin
t
inde
x
(g)
Seed
cott
on
yiel
d
(q/h
a)
Mea
nsu
mof
squa
res
(MSS
)
Rep
licat
ions
140
.55*
*43
.5**
0.17
**10
2.12
**0.
230.
030.
144
0.06
5*0.
0014
*0.
0006
17.0
7**
Gen
otyp
es86
54.1
6**
50.6
7**
0.26
6**
247.
73**
6.17
**0.
91**
11.9
2**
35.2
7**
1.54
**0.
685*
*43
.59*
*
Err
or86
0.57
51.
850.
018
5.44
2.15
0.02
30.
702
0.04
50.
001
0.00
071.
857
*P
<0.
05an
d**
P<
0.01
(sig
nifi
cant
at5%
and
1%le
velo
fsi
gnif
ican
cere
spec
tive
ly).
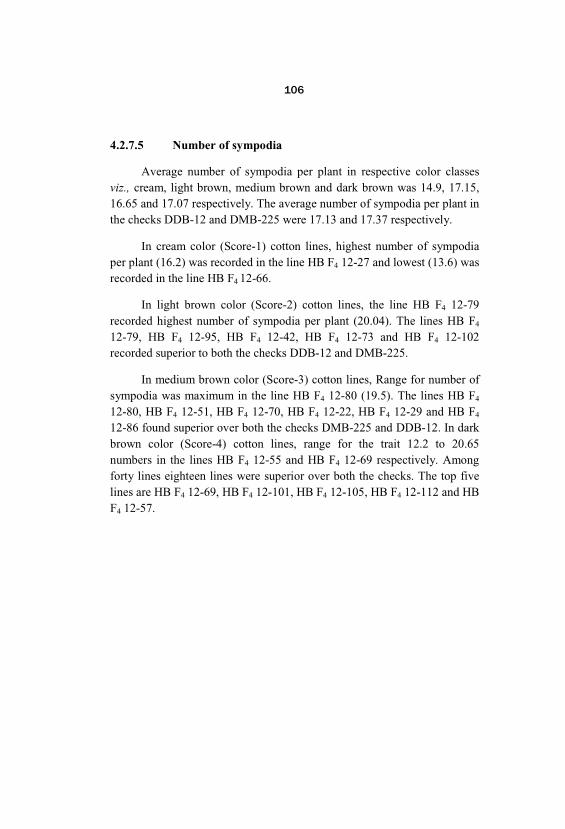
4.2.7.5 Number of sympodia
Average number of sympodia per plant in respective color classesviz., cream, light brown, medium brown and dark brown was 14.9, 17.15, 16.65 and 17.07 respectively. The average number of sympodia per plant inthe checks DDB-12 and DMB-225 were 17.13 and 17.37 respectively.
In cream color (Score-1) cotton lines, highest number of sympodiaper plant (16.2) was recorded in the line HB F4 12-27 and lowest (13.6) wasrecorded in the line HB F4 12-66.
In light brown color (Score-2) cotton lines, the line HB F4 12-79recorded highest number of sympodia per plant (20.04). The lines HB F4
12-79, HB F4 12-95, HB F4 12-42, HB F4 12-73 and HB F4 12-102recorded superior to both the checks DDB-12 and DMB-225.
In medium brown color (Score-3) cotton lines, Range for number ofsympodia was maximum in the line HB F4 12-80 (19.5). The lines HB F4
12-80, HB F4 12-51, HB F4 12-70, HB F4 12-22, HB F4 12-29 and HB F4
12-86 found superior over both the checks DMB-225 and DDB-12. In darkbrown color (Score-4) cotton lines, range for the trait 12.2 to 20.65numbers in the lines HB F4 12-55 and HB F4 12-69 respectively. Amongforty lines eighteen lines were superior over both the checks. The top fivelines are HB F4 12-69, HB F4 12-101, HB F4 12-105, HB F4 12-112 and HBF4 12-57.
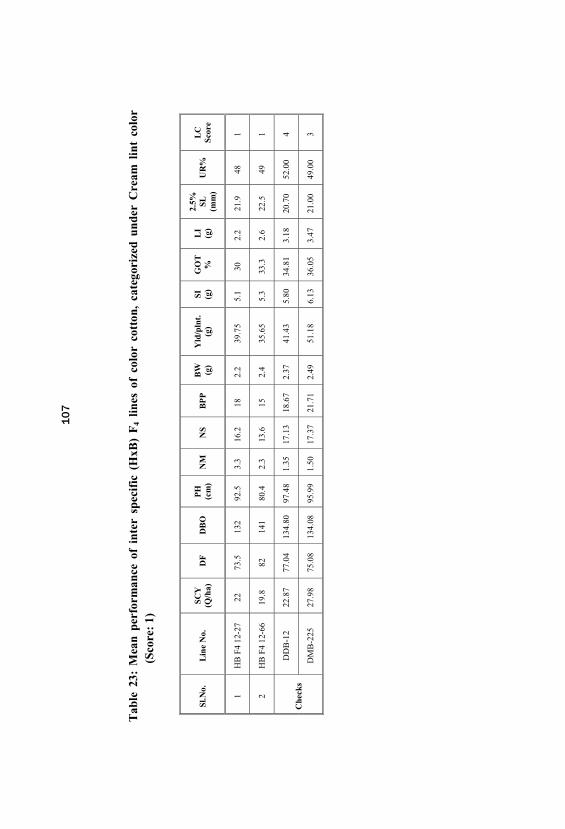
Tab
le23
:M
ean
perf
orm
ance
ofin
ter
spec
ific
(HxB
)F
4lin
esof
colo
rco
tton
, ca
tego
rize
dun
der
Cre
amlin
tco
lor
(Sco
re:
1)
Sl.N
o.
Lin
eN
o.
SCY
(Q/h
a)D
FD
BO
PH
(cm
)N
MN
SB
PP
BW (g)
Yld
/pln
t.
(g)
SI (g)
GO
T%
LI
(g)
2.5% SL (mm
)U
R%
LC
Scor
e
1H
BF4
12-2
722
73.5
132
92.5
3.3
16.2
182.
239
.75
5.1
302.
221
.948
1
2H
BF4
12-6
619
.882
141
80.4
2.3
13.6
152.
435
.65
5.3
33.3
2.6
22.5
491
Che
cks
DD
B-1
222
.87
77.0
413
4.80
97.4
81.
3517
.13
18.6
72.
3741
.43
5.80
34.8
13.
1820
.70
52.0
04
DM
B-2
2527
.98
75.0
813
4.08
95.9
91.
5017
.37
21.7
12.
4951
.18
6.13
36.0
53.
4721
.00
49.0
03

4.2.7.6 Number of bolls per plant
Average numbers of bolls per plant in cream, light, medium and darkbrown color classes were 16.5, 14.5, 15.22 and 15.79 respectively. Themean values in the checks DDB-12 and DMB-225 was 17.13 and 17.37respectively.
In cream color (Score-1) cotton lines, highest number of bolls perplant (18) was recorded in the line HB F4 12-27.
In light brown (Score-2) cotton lines, the line HB F4 12-79 recordedhighest number of bolls per plant (19) and also found superior to the checkDDB-12.
In medium brown (Score-3) cotton lines, the line HB F4 12-22 washaving highest number of bolls per plant (19.5). The lines HB F4 12-22 andHB F4 12-26 were superior to the check DDB-12.
In dark brown (Score-4) cotton lines, highest (19.5) number of bollsper plant was recorded in the line HB F4 12-19. The lines HB F4 12-19, HBF4 12-4 and HB F4 12-63 recorded superior to the check DDB-12.
4.2.7.7 Boll weight (g)
Average boll weight obtained in color classes viz., cream, light, medium and dark brown cottons were 2.3, 2.24, 2.31 and 2.39 grespectively indicating not much variation in the man values for the trait. The mean values of the checks DDB-12 and DMB-225 was 2.37 g and 2.49g respectively.
In cream color (Score-1) cotton lines, highest boll weight wasrecorded in the line HB F4 12-66 (2.4 g) which also found superior over thecheck DDB-12 and lowest was observed in the line HB F4 12-27 (2.2 g).
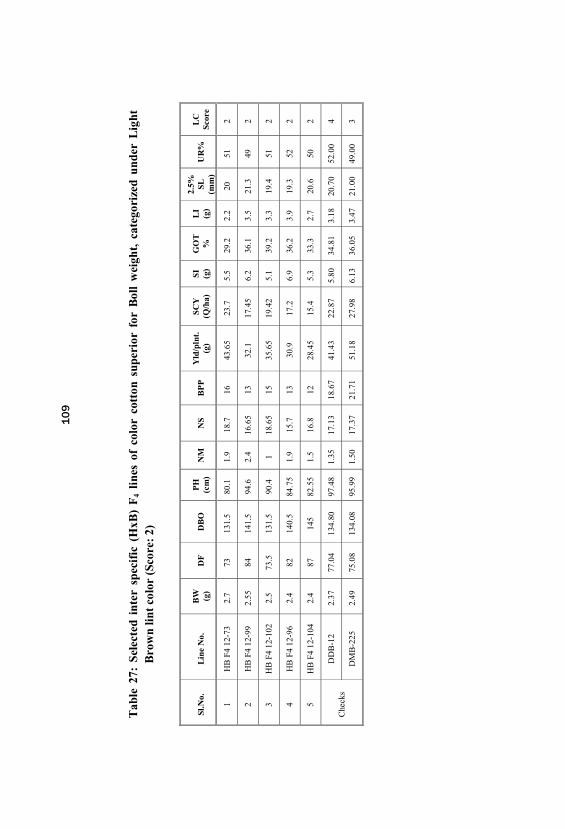
Tab
le27
:Se
lect
edin
ter
spec
ific
(HxB
)F
4li
nes
ofco
lor
cott
onsu
peri
orfo
rB
oll
wei
ght,
cat
egor
ized
unde
rL
ight
Bro
wn
lint
colo
r(S
core
:2)
Sl.N
o.
Lin
eN
o.
BW (g)
DF
DB
OP
H(c
m)
NM
NS
BP
PY
ld/p
lnt.
(g
)SC
Y(Q
/ha)
SI (g)
GO
T%
LI
(g)
2.5% SL (mm
)U
R%
LC
Scor
e
1H
BF4
12-7
32.
773
131.
580
.11.
918
.716
43.6
523
.75.
529
.22.
220
512
2H
BF4
12-9
92.
5584
141.
594
.62.
416
.65
1332
.117
.45
6.2
36.1
3.5
21.3
492
3H
BF4
12-1
022.
573
.513
1.5
90.4
118
.65
1535
.65
19.4
25.
139
.23.
319
.451
2
4H
BF4
12-9
62.
482
140.
584
.75
1.9
15.7
1330
.917
.26.
936
.23.
919
.352
2
5H
BF4
12-1
042.
487
145
82.5
51.
516
.812
28.4
515
.45.
333
.32.
720
.650
2
Che
cks
DD
B-1
22.
3777
.04
134.
8097
.48
1.35
17.1
318
.67
41.4
322
.87
5.80
34.8
13.
1820
.70
52.0
04
DM
B-2
252.
4975
.08
134.
0895
.99
1.50
17.3
721
.71
51.1
827
.98
6.13
36.0
53.
4721
.00
49.0
03

Tab
le31
:Se
lect
edIn
ter
spec
ific
(HxB
)F
4lin
esof
colo
rco
tton
supe
rior
for
Bol
lw
eigh
t, c
ateg
oriz
edun
der
Med
ium
Bro
wn
lint
colo
r(S
core
:3)
Sl.N
o.
Lin
eN
o.
BW (g)
DF
DB
OP
H(c
m)
NM
NS
BP
PY
ld/p
lnt.
(g
)SC
Y(Q
/ha)
SI(g
)G
OT
%L
I(g
)
2.5% SL (mm
)U
R%
LC
Scor
e
1H
BF4
12-4
13.
279
.513
691
.11.
716
1857
.531
.56.
636
.93.
819
.951
3
2H
BF4
12-2
52.
8583
140.
574
.15
1.1
15.6
1233
.65
18.4
5.6
35.7
3.1
19.8
513
3H
BF4
12-8
02.
7587
144.
590
.55
2.1
19.5
1747
.926
.45
6.1
31.3
2.8
19.1
513
4H
BF4
12-9
2.65
72.5
130.
591
.71.
117
14.5
37.8
215.
537
.23.
222
.547
3
5H
BF4
12-2
92.
6573
.513
2.5
102.
81.
317
.918
4625
.55
6.7
31.3
324
.546
3
6H
BF4
12-3
02.
6582
.514
1.5
96.3
52.
915
.616
43.8
23.9
10.2
273.
420
.549
3
7H
BF4
12-1
172.
6585
142.
510
0.1
3.1
17.3
1746
.55
25.4
57.
434
.73.
920
.252
3
8H
BF4
12-9
22.
683
146.
596
.51.
916
.611
26.7
518
.45
5.1
352.
719
.550
3
9H
BF4
12-3
92.
5574
.513
587
.45
115
.418
44.7
24.5
5.5
29.8
2.3
20.9
483
10H
BF4
12-8
62.
5582
140
102.
61.
917
.513
33.1
518
.15
6.3
353.
421
523
11H
BF4
12-7
02.
581
.514
072
1.3
18.4
1433
.75
17.9
57.
235
.13.
920
.451
3
Che
cks
DD
B-1
22.
3777
.04
134.
8097
.48
1.35
17.1
318
.67
41.4
322
.87
5.80
34.8
13.
1820
.70
52.0
04
DM
B-2
252.
4975
.08
134.
0895
.99
1.50
17.3
721
.71
51.1
827
.98
6.13
36.0
53.
4721
.00
49.0
03
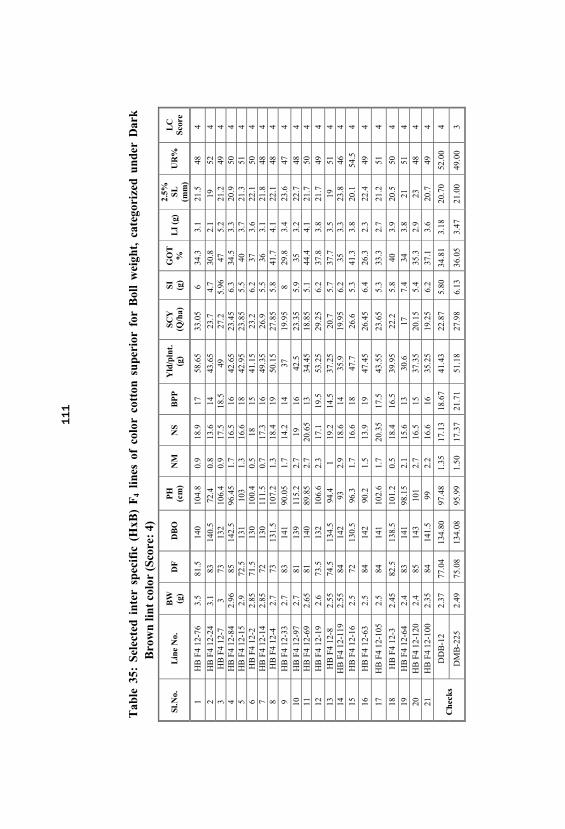
Tab
le35
:Se
lect
edin
ter
spec
ific
(HxB
)F
4lin
esof
colo
rco
tton
supe
rior
for
Bol
lw
eigh
t, c
ateg
oriz
edun
der
Dar
kB
row
nlin
tco
lor
(Sco
re:
4)
Sl.N
o.
Lin
eN
o.
BW (g)
DF
DB
OP
H(c
m)
NM
NS
BP
PY
ld/p
lnt.
(g
)SC
Y(Q
/ha)
SI (g)
GO
T%
LI
(g)
2.5% SL (mm
)U
R%
LC
Scor
e
1H
BF4
12-7
63.
581
.514
010
4.8
0.9
18.9
1758
.65
33.0
56
34.3
3.1
21.5
484
2H
BF4
12-2
43.
183
140.
572
.40.
813
.614
43.6
523
.74.
730
.82.
119
524
3H
BF4
12-7
373
132
106.
40.
917
.518
.549
27.2
5.96
475.
221
.249
44
HB
F412
-84
2.96
8514
2.5
96.4
51.
716
.516
42.6
523
.45
6.3
34.5
3.3
20.9
504
5H
BF4
12-1
52.
972
.513
110
31.
316
.618
42.9
523
.85
5.5
403.
721
.351
46
HB
F412
-22.
8571
.513
010
0.4
0.5
1815
41.1
523
.26.
237
3.6
22.1
504
7H
BF4
12-1
42.
8572
130
111.
50.
717
.316
49.3
526
.95.
536
3.1
21.8
484
8H
BF4
12-4
2.7
7313
1.5
107.
21.
318
.419
50.1
527
.85
5.8
41.7
4.1
22.1
484
9H
BF4
12-3
32.
783
141
90.0
51.
714
.214
3719
.95
829
.83.
423
.647
410
HB
F412
-97
2.7
8113
911
5.2
2.7
1916
42.5
23.3
55.
935
3.2
22.7
484
11H
BF4
12-6
92.
6581
140
89.8
52.
720
.65
1334
.45
18.8
55.
144
.44.
121
.750
412
HB
F412
-19
2.6
73.5
132
106.
62.
317
.119
.553
.25
29.2
56.
237
.83.
821
.749
413
HB
F412
-82.
5574
.513
4.5
94.4
119
.214
.537
.25
20.7
5.7
37.7
3.5
1951
414
HB
F412
-119
2.55
8414
293
2.9
18.6
1435
.919
.95
6.2
353.
323
.846
415
HB
F412
-16
2.5
7213
0.5
96.3
1.7
16.6
1847
.726
.65.
341
.33.
820
.154
.54
16H
BF4
12-6
32.
584
142
90.2
1.5
13.9
1947
.45
26.4
56.
426
.32.
322
.449
4
17H
BF4
12-1
052.
584
141
102.
61.
720
.35
17.5
43.5
523
.65
5.3
33.3
2.7
21.2
514
18H
BF4
12-3
2.45
82.5
138.
510
1.2
0.5
18.4
16.5
39.9
522
.25.
840
3.9
20.5
504
19H
BF4
12-6
42.
483
141
98.1
52.
115
.613
30.6
177.
434
3.8
2151
420
HB
F412
-120
2.4
8514
310
12.
716
.515
37.3
520
.15
5.4
35.3
2.9
2348
421
HB
F412
-100
2.35
8414
1.5
992.
216
.616
35.2
519
.25
6.2
37.1
3.6
20.7
494
Che
cks
DD
B-1
22.
3777
.04
134.
8097
.48
1.35
17.1
318
.67
41.4
322
.87
5.80
34.8
13.
1820
.70
52.0
04
DM
B-2
252.
4975
.08
134.
0895
.99
1.50
17.3
721
.71
51.1
827
.98
6.13
36.0
53.
4721
.00
49.0
03
In light brown color (Score-2) cotton lines, the line HB F4 12-73recorded highest (2.7 g) boll weight and. The lines HB F4 12-73, HB F4 12-99 and HB F4 12-102, were superior to both the checks. The lines HB F4
12-96 and HB F4 12-104 were superior over the check DDB-12 aspresented in Table 27.
In medium brown color (Score-3) cotton lines; highest (3.2 g) bollweight was recorded in the line HB F4 12-41. Eleven lines were superior toboth the checks DDB-12 and DMB-225 are presented in Table 31. The topfive lines are HB F4 12-41, HB F4 12-25, HB F4 12-80, HB F4 12-29 andHB F4 12-117.
Among forty dark brown color (Score-4) cotton lines, the line HB F4
12-76 recorded highest boll weight (3.5 g). Nineteen lines found superior toboth the checks DDB-12 and DMB- 225 are presented in Table 35. The topfive lines are HB F4 12-76, HB F4 12-24, HB F4 12-7, HB F4 12-84 and HBF4 12-15.
4.2.7.8 Seed cotton yield (q/ha)
Average yield potential of cream (Score-1), light brown (Score 2), medium brown (Score-3) and dark brown (Score-4) color cotton lines were37.70, 17.35, 19.58 and 20.26 q/ha respectively. The mean seed cottonyield of the checks DDB-12 and DMB-225 was 22.87 and 27.98 q/harespectively.
In cream color (Score-1) cotton, the highest (39.75 q/ha) seed cottonyield obtained in HB F4 12-27 and lowest (35.65 q/ha) was observed in HBF4 12-66.
In light brown color (Score-2) cotton lines, the line HB F4 12-73recorded highest (23.7 q/ha) seed cotton yield which also found superiorover the check DDB-12 is detailed in Table 25.
In medium brown color (Score-3) cotton lines, highest seed cottonyield was obtained in the line HB F4 12-41 (31.5 q/ha) and lowest wasobtained in the line HB F4 12-50 (12.05 q/ha). The line HB F4 12-41 foundsuperior over both the checks and the lines HB F4 12-80, HB F4 12-29, HB
F4 12-117, HB F4 12-39, HB F4 12-26, 22 and HB F4 12-30 were superiorover the check DDB-12 (Table 29).
In dark brown color (Score-4) cotton lines, highest (33.05 q/ha) seedcotton yield was obtained in the line HB F4 12-76 and lowest (10.4 q/ha)was obtained in the line HB F4 12-36. The lines HB F4 12-76 and HB F4
12-19 were superior to both the checks DDB-12 and DMB-225. The linesHB F4 12-4, HB F4 12-7, HB F4 12-14, HB F4 12-16, HB F4 12-15, HB F4
12-24, HB F4 12-105, HB F4 12-84, HB F4 12-97 and HB F4 12-2performed superiorly over the check DDB-12 is presented in Table 33.
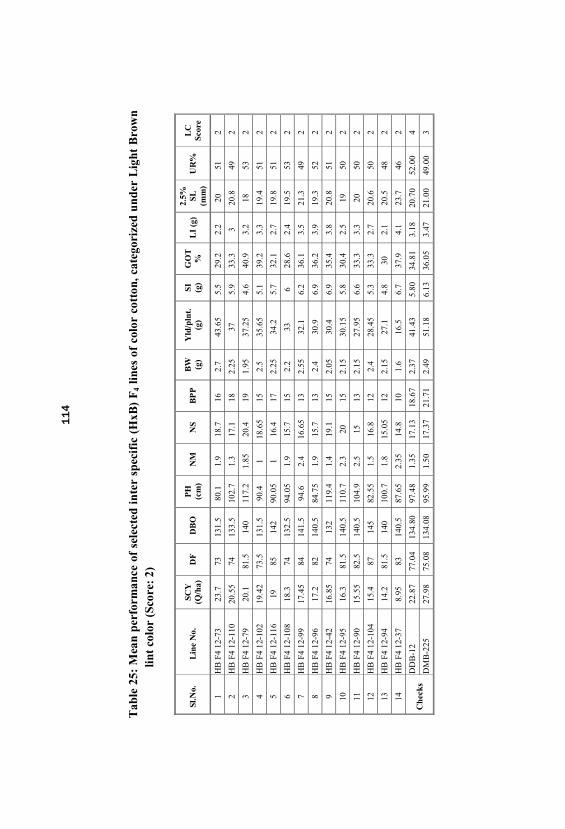
Tab
le25
:M
ean
perf
orm
ance
ofse
lect
edin
ter
spec
ific
(HxB
)F
4lin
esof
colo
rco
tton
, cat
egor
ized
unde
rL
ight
Bro
wn
lint
colo
r(S
core
:2)
Sl.N
o.
Lin
eN
o.
SCY
(Q/h
a)D
FD
BO
PH
(cm
)N
MN
SB
PP
BW (g)
Yld
/pln
t.
(g)
SI (g)
GO
T%
LI
(g)
2.5% SL (mm
)U
R%
LC
Scor
e
1H
BF4
12-7
323
.773
131.
580
.11.
918
.716
2.7
43.6
55.
529
.22.
220
512
2H
BF4
12-1
1020
.55
7413
3.5
102.
71.
317
.118
2.25
375.
933
.33
20.8
492
3H
BF4
12-7
920
.181
.514
011
7.2
1.85
20.4
191.
9537
.25
4.6
40.9
3.2
1853
2
4H
BF4
12-1
0219
.42
73.5
131.
590
.41
18.6
515
2.5
35.6
55.
139
.23.
319
.451
2
5H
BF4
12-1
1619
8514
290
.05
116
.417
2.25
34.2
5.7
32.1
2.7
19.8
512
6H
BF4
12-1
0818
.374
132.
594
.05
1.9
15.7
152.
233
628
.62.
419
.553
2
7H
BF4
12-9
917
.45
8414
1.5
94.6
2.4
16.6
513
2.55
32.1
6.2
36.1
3.5
21.3
492
8H
BF4
12-9
617
.282
140.
584
.75
1.9
15.7
132.
430
.96.
936
.23.
919
.352
2
9H
BF4
12-4
216
.85
7413
211
9.4
1.4
19.1
152.
0530
.46.
935
.43.
820
.851
2
10H
BF4
12-9
516
.381
.514
0.5
110.
72.
320
152.
1530
.15
5.8
30.4
2.5
1950
2
11H
BF4
12-9
015
.55
82.5
140.
510
4.9
2.5
1513
2.15
27.9
56.
633
.33.
320
502
12H
BF4
12-1
0415
.487
145
82.5
51.
516
.812
2.4
28.4
55.
333
.32.
720
.650
2
13H
BF4
12-9
414
.281
.514
010
0.7
1.8
15.0
512
2.15
27.1
4.8
302.
120
.548
2
14H
BF4
12-3
78.
9583
140.
587
.65
2.35
14.8
101.
616
.56.
737
.94.
123
.746
2
Che
cks
DD
B-1
222
.87
77.0
413
4.80
97.4
81.
3517
.13
18.6
72.
3741
.43
5.80
34.8
13.
1820
.70
52.0
04
DM
B-2
2527
.98
75.0
813
4.08
95.9
91.
5017
.37
21.7
12.
4951
.18
6.13
36.0
53.
4721
.00
49.0
03

Tab
le29
:M
ean
perf
orm
ance
ofse
lect
edin
ter
spec
ific
(HxB
)F
4lin
esof
colo
rco
tton
, ca
tego
rize
dun
der
Med
ium
Bro
wn
lint
colo
r(S
core
:3)
Sl.N
o.
Lin
eN
o.
SCY
(Q/h
a)D
FD
BO
PH
(cm
)N
MN
SB
PP
BW (g)
Yld
/pln
t.
(g)
SI (g)
GO
T%
LI
(g)
2.5% SL (mm
)U
R%
LC
Scor
e
1H
BF4
12-4
131
.579
.513
691
.11.
716
183.
257
.56.
636
.93.
819
.951
3
2H
BF4
12-8
026
.45
8714
4.5
90.5
52.
119
.45
172.
7547
.96.
131
.32.
819
.151
3
3H
BF4
12-2
925
.55
73.5
132.
510
2.8
1.3
17.8
518
2.65
466.
731
.33
24.5
463
4H
BF4
12-1
1725
.45
8514
2.5
100.
13.
117
.317
2.65
46.5
57.
434
.73.
920
.252
3
5H
BF4
12-3
924
.574
.513
587
.45
115
.418
2.55
44.7
5.5
29.8
2.3
20.9
483
6H
BF4
12-2
624
.15
8214
1.5
99.2
3.3
16.5
192.
343
.45
6.2
33.3
3.1
22.6
493
7H
BF4
12-2
224
.05
73.5
132.
510
3.3
1.5
18.2
19.5
2.3
45.3
7.5
35.7
4.2
21.6
493
8H
BF4
12-3
023
.982
.514
1.5
96.3
52.
915
.616
2.65
43.8
10.2
273.
420
.549
3
Che
cks
DD
B-1
222
.87
77.0
413
4.80
97.4
81.
3517
.13
18.6
72.
3741
.43
5.80
34.8
13.
1820
.70
52.0
04
DM
B-2
2527
.98
75.0
813
4.08
95.9
91.
5017
.37
21.7
12.
4951
.18
6.13
36.0
53.
4721
.00
49.0
03

4.2.7.9 Seed index (g)
Average seed index in all the four color variants viz., cream, light, medium and dark brown cottons observed was 5.20, 5.86, 6.33 and 5.85 grespectively. The mean seed index of the checks DDB-12 and DMB-225were 5.8 g and 6.13 g respectively.
In cream color (Score-1) cotton lines, highest (5.3 g) seed index wasrecorded in the line HB F4 12-66 and lowest (5.1 g) was obtained in the lineHB F4 12-27.
Among fourteen light brown color (Score-2) cotton lines, highestseed index was recorded in the line HB F4 12-42 (6.9 g) and lowest wasobtained in the line HB F4 12-79 (4.6 g). Seven lines found superior to thechecks DDB-12 and DMB-225.
Among twenty nine medium brown color (Score-3) cotton lines, thehighest seed index was recorded in the line HB F4 12-30 (10.2 g) andlowest was obtained in the line HB F4 12-74 (4.9 g). Fourteen lines foundsuperior to both the checks.
Among forty dark brown color (Score-4) cotton lines, the line HB F4
12-33 recorded highest (8 g) seed index and lowest (4.7 g) was obtained inthe line HB F4 12-57. Eleven lines were superior to both the checks DDB-12 and DMB-225. The top five lines HB F4 12-33, HB F4 12-64, HB F4 12-21, HB F4 12-55 and HB F4 12-63. However, the eleven lines were superiorto the check DDB-12.

Tab
le33
:M
ean
perf
orm
ance
ofse
lect
edin
ter-
spec
ific
(HxB
)F
4lin
esof
colo
rco
tton
, cat
egor
ized
unde
rD
ark
Bro
wn
lint
colo
r(S
core
:4)
Sl.N
o.
Lin
eN
o.
SCY
(Q/h
a)D
FD
BO
PH
(cm
)N
MN
SB
PP
BW (g)
Yld
/pln
t.
(g)
SI (g)
GO
T%
LI
(g)
2.5% SL (mm
)U
R%
LC
Scor
e
1H
BF4
12-7
633
.05
81.5
140
104.
80.
918
.917
3.5
58.6
56
34.3
3.1
21.5
484
2H
BF4
12-1
929
.25
73.5
132
106.
62.
317
.119
.52.
653
.25
6.2
37.8
3.8
21.7
494
3H
BF4
12-4
27.8
573
131.
510
7.2
1.3
18.4
192.
750
.15
5.8
41.7
4.1
22.1
484
4H
BF4
12-7
27.2
7313
210
6.4
0.9
17.5
18.5
349
5.96
475.
221
.249
4
5H
BF4
12-1
426
.972
130
111.
50.
717
.316
2.85
49.3
55.
536
3.1
21.8
484
6H
BF4
12-1
626
.672
130.
596
.31.
716
.618
2.5
47.7
5.3
41.3
3.8
20.1
54.5
4
7H
BF4
12-6
326
.45
8414
290
.21.
513
.919
2.5
47.4
56.
426
.32.
322
.449
4
8H
BF4
12-1
523
.85
72.5
131
103
1.3
16.6
182.
942
.95
5.5
403.
721
.351
4
9H
BF4
12-2
423
.783
140.
572
.40.
813
.614
3.1
43.6
54.
730
.82.
119
524
10H
BF4
12-1
0523
.65
8414
110
2.6
1.7
20.3
517
.52.
543
.55
5.3
33.3
2.7
21.2
514
11H
BF4
12-8
423
.45
8514
2.5
96.4
51.
716
.516
2.96
42.6
56.
334
.53.
320
.950
4
12H
BF4
12-9
723
.35
8113
911
5.2
2.7
1916
2.7
42.5
5.9
353.
222
.748
4
13H
BF4
12-2
23.2
71.5
130
100.
40.
518
152.
8541
.15
6.2
373.
622
.150
4
Che
cks
DD
B-1
222
.87
77.0
413
4.80
97.4
81.
3517
.13
18.6
72.
3741
.43
5.80
34.8
13.
1820
.70
52.0
04
DM
B-2
2527
.98
75.0
813
4.08
95.9
91.
5017
.37
21.7
12.
4951
.18
6.13
36.0
53.
4721
.00
49.0
03

4.2.7.10 Ginning Out Turn (%)
In cream color (Score-1) cotton lines, mean ginning out turn was31.65 per cent; the highest ginning out turn (33.3 %) was recorded in theline HB F4 12-66 and lowest (30 %) was obtained in the line HB F4 12-27. The mean ginning out turn of checks DDB-12 and DMB-225 were 34.81and 36.05 per cent respectively.
In light brown color (Score-2) cotton lines, mean GOT was 33.99 percent; the highest GOT (40.9 %) was recorded in the line HB F4 12-79 andlowest (28.6 %) was obtained in the line HB F4 12-108. The lines HB F4
12-79, HB F4 12-102, HB F4 12-37, HB F4 12-96 and HB F4 12-99 foundsuperior over both the checks. However, the line HB F4 12-42 recordedsuperior to the check DMB-225 is detailed in Table 28.
In medium brown color (Score-3) cotton lines, mean ginning out turnwas 34.1 per cent; the highest ginning out turn (42.4 %) was recorded inthe line HB F4 12-74 and lowest (27 %) was obtained in the line HB F4 12-30. The lines HB F4 12-74, HB F4 12-87, HB F4 12-12, HB F4 12-9, HB F4
12-41 and HB F4 12-85 found superior to both the checks. However, thelines HB F4 12-51, HB F4 12-22, HB F4 12-71, HB F4 12-25, HB F4 12-50, HB F4 12-70, HB F4 12-86, HB F4 12-92 and HB F4 12-87 were foundsuperior to DDB-12 is presented in Table 32.
In dark brown color (Score-4) cotton lines, mean ginning out turnwas 36.01 per cent; the highest ginning out turn was recorded in the lineHB F4 12-7 (47 %) and lowest was obtained in the line HB F4 12-63 (26.3%). Twenty lines were superior to both the checks as detailed in Table 36. Top five lines are HB F4 12-7, HB F4 12-69, HB F4 12-4, HB F4 12-49 andHB F4 12-57. However, the lines HB F4 12-14, HB F4 12-23, HB F4 12-120, HB F4 12-119 and HB F4 12-97 found superior to the check DDB-12.
4.2.7.11 Lint Index (g)
Average seed index observed in respective color classes viz., cream, light brown, medium brown and dark brown cottons recorded 2.4, 3.05, 3.28 and 3.31 g respectively. The lint index obtained in the checks DDB-12and DMB-225 were 3.18 g and 3.47 g respectively.

Tab
le28
:Se
lect
edin
ter
spec
ific
(HxB
)F
4lin
esof
colo
rco
tton
supe
rior
for
GO
T, c
ateg
oriz
edun
der
Lig
htB
row
nlin
tco
lor
(Sco
re:
2)
Sl.N
o.
Lin
eN
o.
DF
DB
OP
H(c
m)
NM
NS
BP
PB
W (g)
Yld
/pln
t.
(g)
SCY
(Q/h
a)SI
(g)
GO
T%
LI
(g)
2.5%
SL(m
m)
UR
%L
CSc
ore
1H
BF4
12-7
981
.514
011
7.15
1.85
20.4
191.
9537
.25
20.1
4.6
40.9
3.2
1853
2
2H
BF4
12-1
0273
.513
1.5
90.4
118
.65
152.
535
.65
19.4
155.
139
.23.
319
.451
2
3H
BF4
12-3
783
140.
587
.65
2.35
14.8
101.
616
.58.
956.
737
.94.
123
.746
2
4H
BF4
12-9
682
140.
584
.75
1.9
15.7
132.
430
.917
.26.
936
.23.
919
.352
2
5H
BF4
12-9
984
141.
594
.62.
416
.65
132.
5532
.117
.45
6.2
36.1
3.5
21.3
492
6H
BF4
12-4
274
132
119.
41.
419
.115
2.05
30.4
16.8
56.
935
.43.
820
.851
2
Che
cks
DD
B-1
277
.04
134.
8097
.48
1.35
17.1
318
.67
2.37
41.4
322
.87
5.80
34.8
13.
1820
.70
52.0
04
DM
B-2
2575
.08
134.
0895
.99
1.50
17.3
721
.71
2.49
51.1
827
.98
6.13
36.0
53.
4721
.00
49.0
03
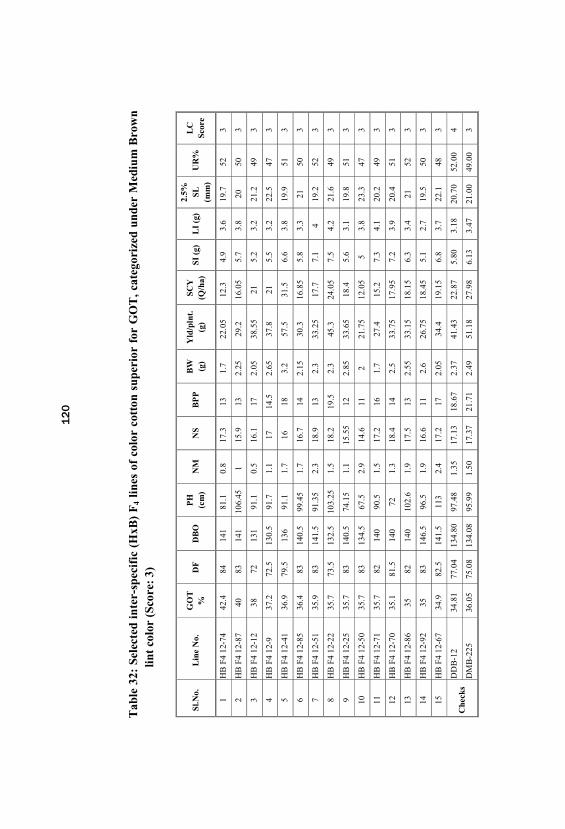
Tab
le32
:Se
lect
edin
ter-
spec
ific
(HxB
)F
4lin
esof
colo
rco
tton
supe
rior
for
GO
T, c
ateg
oriz
edun
der
Med
ium
Bro
wn
lint
colo
r(S
core
:3)
Sl.N
o.
Lin
eN
o.
GO
T%
DF
DB
OP
H(c
m)
NM
NS
BP
PB
W (g)
Yld
/pln
t.
(g)
SCY
(Q/h
a)SI
(g)
LI
(g)
2.5% SL
(mm
)U
R%
LC
Scor
e
1H
BF4
12-7
442
.484
141
81.1
0.8
17.3
131.
722
.05
12.3
4.9
3.6
19.7
523
2H
BF4
12-8
740
8314
110
6.45
115
.913
2.25
29.2
16.0
55.
73.
820
503
3H
BF4
12-1
238
7213
191
.10.
516
.117
2.05
38.5
521
5.2
3.2
21.2
493
4H
BF4
12-9
37.2
72.5
130.
591
.71.
117
14.5
2.65
37.8
215.
53.
222
.547
3
5H
BF4
12-4
136
.979
.513
691
.11.
716
183.
257
.531
.56.
63.
819
.951
3
6H
BF4
12-8
536
.483
140.
599
.45
1.7
16.7
142.
1530
.316
.85
5.8
3.3
2150
3
7H
BF4
12-5
135
.983
141.
591
.35
2.3
18.9
132.
333
.25
17.7
7.1
419
.252
3
8H
BF4
12-2
235
.773
.513
2.5
103.
251.
518
.219
.52.
345
.324
.05
7.5
4.2
21.6
493
9H
BF4
12-2
535
.783
140.
574
.15
1.1
15.5
512
2.85
33.6
518
.45.
63.
119
.851
3
10H
BF4
12-5
035
.783
134.
567
.52.
914
.611
221
.75
12.0
55
3.8
23.3
473
11H
BF4
12-7
135
.782
140
90.5
1.5
17.2
161.
727
.415
.27.
34.
120
.249
3
12H
BF4
12-7
035
.181
.514
072
1.3
18.4
142.
533
.75
17.9
57.
23.
920
.451
3
13H
BF4
12-8
635
8214
010
2.6
1.9
17.5
132.
5533
.15
18.1
56.
33.
421
523
14H
BF4
12-9
235
8314
6.5
96.5
1.9
16.6
112.
626
.75
18.4
55.
12.
719
.550
3
15H
BF4
12-6
734
.982
.514
1.5
113
2.4
17.2
172.
0534
.419
.15
6.8
3.7
22.1
483
Che
cks
DD
B-1
234
.81
77.0
413
4.80
97.4
81.
3517
.13
18.6
72.
3741
.43
22.8
75.
803.
1820
.70
52.0
04
DM
B-2
2536
.05
75.0
813
4.08
95.9
91.
5017
.37
21.7
12.
4951
.18
27.9
86.
133.
4721
.00
49.0
03
In cream color (Score-1) cotton lines, highest lint index (2.6 g) wasobserved in the line HB F4 12-66 and lowest (2.2 g) was obtained in HB F4
12-27.
In light brown color (Score-2) cotton lines, the line HB F4 12-37recorded highest (4.1 g) lint index and lowest (2.1 g) was obtained in theline HB F4 12-94. The lines HB F4 12-37, HB F4 12-96, HB F4 12-42 andHB F4 12-99 were superior over the check DMB-225. However, the linesHB F4 12-102, HB F4 12-90 and HB F4 12-79 were found superior to thecheck DDB-12.
Among twenty nine medium brown color (Score-3) cotton lines, theline HB F4 12-22 recorded highest (4.2 g) lint index and lowest (2.3 g) wasrecorded in the line HB F4 12-39. Ten lines were superior to both thechecks DDB-12 and DMB-225. Top five lines are HB F4 12-22, HB F4 12-71, HB F4 12-51, HB F4 12-70 and HB F4 12-117.
Among forty dark brown color (Score-4) cotton lines, highest lintindex (5.2 g) was recorded in the line HB F4 12-7 and lowest (2.1 g) wasobtained in the line HB F4 12-24. Seventeen lines found superior to boththe checks, Top five lines HB F4 12-7, HB F4 12-69, HB F4 12-4, HB F4
12-49 and HB F4 12-3. However, the lines HB F4 12-83, HB F4 12-112, HBF4 12-33, HB F4 12-23, HB F4 12-119, HB F4 12-84, HB F4 12-57, HB F4
12-65 and HB F4 12-97 were superior over the check DDB-12 .
4.2.7.12 2.5 per cent Span length (mm)
Average fiber length in cream color (Score-1) cotton lines was 22.20mm; the highest value of 22.5 mm was recorded in the line HB F4 12-66. The 2.5 per cent span length in the checks DDB-12 and DMB-225 were20.7 mm and 21 mm respectively as detailed in II and Table 24.
The mean 2.5 per cent span length was 20.19 mm among the lightbrown color (Score-2) cotton lines; the highest value of 23.7 mm wasobserved in the line HB F4 12-37. Two lines HB F4 12-37 and HB F4 12-99recorded superior over both the checks as presented in Table 26.

Tab
le24
:Se
lect
edin
ter
spec
ific
(HxB
)F
4lin
esof
colo
rco
tton
supe
rior
for
2.5%
SL,
cate
gori
zed
unde
rC
ream
lint
colo
r(S
core
:1)
Sl.N
o.
Lin
eN
o.
2.5% SL (mm
)D
FD
BO
PH
(cm
)N
MN
SB
PP
BW (g)
Yld
/pln
t.
(g)
SCY
(Q/h
a)SI (g
)G
OT
%L
I(g
)U
R%
LC
Scor
e
1H
BF
412
-27
21.9
73.5
132
92.5
3.3
16.2
182.
239
.75
225.
130
2.2
481
2H
BF
412
-66
22.5
8214
180
.42.
313
.615
2.4
35.6
519
.85.
333
.32.
649
1
Che
cks
DD
B-1
220
.70
77.0
413
4.80
97.4
81.
3517
.13
18.6
72.
3741
.43
22.8
75.
8034
.81
3.18
52.0
04
DM
B-2
2521
.00
75.0
813
4.08
95.9
91.
5017
.37
21.7
12.
4951
.18
27.9
86.
1336
.05
3.47
49.0
03

Tab
le26
:Se
lect
edin
ter
spec
ific
(HxB
)F
4lin
esof
colo
rco
tton
supe
rior
for
2.5%
SL, c
ateg
oriz
edun
der
Lig
htB
row
nlin
tco
lor
(Sco
re:
2)
Sl.N
o.
Lin
eN
o.
2.5% SL (mm
)D
FD
BO
PH
(cm
)N
MN
SB
PP
BW (g)
Yld
/pln
t.
(g)
SCY
(Q/h
a)SI (g
)G
OT
%L
I(g
)U
R%
LC
Scor
e
1H
BF4
12-3
723
.783
140.
587
.65
2.35
14.8
101.
616
.58.
956.
737
.94.
146
2
2H
BF4
12-9
921
.384
141.
594
.62.
416
.65
132.
5532
.117
.45
6.2
36.1
3.5
492
3H
BF4
12-4
220
.874
132
119.
41.
419
.115
2.05
30.4
16.8
56.
935
.43.
851
2
4H
BF4
12-1
1020
.874
133.
510
2.65
1.3
17.1
182.
2537
20.5
55.
933
.33
492
Che
cks
DD
B-1
220
.70
77.0
413
4.80
97.4
81.
3517
.13
18.6
72.
3741
.43
22.8
75.
8034
.81
3.18
52.0
04
DM
B-2
2521
.00
75.0
813
4.08
95.9
91.
5017
.37
21.7
12.
4951
.18
27.9
86.
1336
.05
3.47
49.0
03

Among twenty nine medium brown color (Score-3) cotton lines, mean 2.5 per cent span length was 20.84 mm; the line HB F4 12-29recorded highest value of 24.5 mm. Ten lines HB F4 12-29, HB F4 12-50, HB F4 12-26, HB F4 12-9, HB F4 12-67, HB F4 12-103, HB F4 12-22, HBF4 12-77, HB F4 12-98 and HB F4 12-12 found superior over both thechecks (Table 30).
In dark brown color (Score-4) cotton lines, mean 2.5 per cent spanlength was 21.55 mm; the lines HB F4 12-65, HB F4 12-106 and HB F4 12-119 recorded highest value of 23.8 mm. Out of forty dark brown lines, twenty eight lines found superior to both the checks DDB-12 and DMB-225. Top ten lines are HB F4 12-119, HB F4 12-65, HB F4 12-106, HB F4
12-33, HB F4 12-49, HB F4 12-120, HB F4 12-97, HB F4 12-23, HB F4 12-61 and HB F4 12-55. However, the line HB F4 12-84 found superior overthe check DDB-12 as detailed in Table 34.
4.2.7.13 Uniformity Ratio (%)
Average uniformity ratio in all the four color classes viz., cream, light brown, medium brown and dark brown color was having almostsimilar mean values 48.5, 50.29, 49.62 and 48.99 respectively. The meanuniformity ratio for the traits in the checks DDB-12 and DMB-225 were 53and 49 per cent respectively.
In cream color (Score-1) cotton lines, highest uniformity ratio (49 %)was recorded in the lines HB F4 12-66 and HB F4 12-27.
Among fourteen light brown color (Score-2) cotton lines, the line HBF4 12-108 recorded highest uniformity ratio (53 %) and lowest (46 %) wasobtained in the line HB F4 12-37. The lines HB F4 12-108 and HB F4 12-79were found superior to both the checks. However, ten lines HB F4 12- 96, HB F4 12-42, HB F4 12-73, HB F4 12-116, HB F4 12-102, HB F4 12-104, HB F4 12-90, HB F4 12-95, HB F4 12-99 and HB F4 12-110 were superiorover the check DDB-12.
Among twenty nine medium brown color (Score-3) cotton lines, highest value (56 %) for the trait recorded in the lines HB F4 12-51 and HB
F4 12-86 and lowest (46 %) was obtained in the line HB F4 12-29. Thefourteen lines found superior to the check DMB-225 are detailed in II.

Tab
le30
:Se
lect
edin
ter
spec
ific
(HxB
)F
4lin
esof
colo
rco
tton
supe
rior
for
2.5%
SL,
cate
gori
zed
unde
rM
ediu
mB
row
nlin
tco
lor
(Sco
re:
3)
Sl.N
o.
Lin
eN
o.
2.5% SL (mm
)D
FD
BO
PH
(cm
)N
MN
SB
PP
BW (g)
Yld
/pln
t.
(g)
SCY
(Q/h
a)SI (g
)G
OT
%L
I(g
)U
R%
LC
Scor
e
1H
BF4
12-2
924
.573
.513
2.5
102.
751.
317
.918
2.65
4625
.55
6.7
31.3
346
3
2H
BF4
12-5
023
.383
134.
567
.52.
914
.611
221
.75
12.0
55
35.7
3.8
473
3H
BF4
12-2
622
.682
141.
599
.23.
316
.519
2.3
43.4
524
.15
6.2
33.3
3.1
493
4H
BF4
12-9
22.5
72.5
130.
591
.71.
117
14.5
2.65
37.8
215.
537
.23.
247
3
5H
BF4
12-6
722
.182
.514
1.5
113
2.4
17.2
172.
0534
.419
.15
6.8
34.9
3.7
483
6H
BF4
12-1
0321
.887
144
92.7
1.9
14.1
182.
238
.55
21.2
55.
732
.12.
749
3
7H
BF4
12-2
221
.673
.513
2.5
103.
251.
518
.219
.52.
345
.324
.05
7.5
35.7
4.2
493
8H
BF4
12-7
721
.684
140.
583
.65
2.1
17.3
122.
0524
.813
.75
7.7
283
473
9H
BF4
12-9
821
.385
141.
510
6.55
2.1
16.6
16.5
1.9
33.3
518
.25
6.3
29.8
2.7
483
10H
BF4
12-1
221
.272
131
91.1
0.5
16.1
172.
0538
.55
215.
238
3.2
493
11H
BF4
12-8
521
8314
0.5
99.4
51.
716
.714
2.15
30.3
16.8
55.
836
.43.
350
3
12H
BF4
12-8
621
8214
010
2.6
1.9
17.5
132.
5533
.15
18.1
56.
335
3.4
523
13H
BF4
12-1
1121
8414
0.5
93.3
1.5
17.1
152.
2533
.218
.42
6.1
31.2
2.8
493
14H
BF4
12-3
920
.974
.513
587
.45
115
.418
2.55
44.7
24.5
5.5
29.8
2.3
483
15H
BF4
12-1
1520
.984
141
92.6
51.
413
.318
2.1
36.6
519
.75
5.5
33.3
2.85
493
Che
cks
DD
B-1
220
.70
77.0
413
4.80
97.4
81.
3517
.13
18.6
72.
3741
.43
22.8
75.
8034
.81
3.18
52.0
04
DM
B-2
2521
.00
75.0
813
4.08
95.9
91.
5017
.37
21.7
12.
4951
.18
27.9
86.
1336
.05
3.47
49.0
03

Tab
le34
:Se
lect
edin
ter
spec
ific
(HxB
)F
4lin
esof
colo
rco
tton
supe
rior
for
2.5%
SL, c
ateg
oriz
edun
der
Dar
kB
row
nlin
tco
lor
(Sco
re:
4)
Sl.N
o.
Lin
eN
o.
2.5% SL (mm
)D
FD
BO
PH
(cm
)N
MN
SB
PP
BW (g)
Yld
/pln
t.
(g)
SCY
(Q/h
a)SI
(g)
GO
T%
LI
(g)
UR
%L
CSc
ore
1H
BF4
12-6
523
.883
141
109.
551.
515
.813
1.95
20.0
513
.95
539
.33.
247
4
2H
BF4
12-1
0623
.885
141
97.5
52.
115
.85
162.
336
205.
133
.32.
549
4
3H
BF4
12-1
1923
.884
142
932.
918
.614
2.55
35.9
19.9
56.
235
3.3
464
4H
BF4
12-3
323
.683
141
90.0
51.
714
.214
2.7
3719
.95
829
.83.
447
4
5H
BF4
12-4
923
.283
142
85.9
53.
115
.45
141.
724
.55
13.3
55.
541
.73.
946
4
6H
BF4
12-1
2023
8514
310
0.95
2.7
16.5
152.
437
.35
20.1
55.
435
.32.
948
4
7H
BF4
12-9
722
.781
139
115.
152.
719
162.
742
.523
.35
5.9
353.
248
4
8H
BF4
12-2
322
.684
141
74.9
2.3
1513
.52.
0529
15.5
55.
935
.93.
347
4
9H
BF4
12-6
122
.585
142
92.5
51.
418
152.
334
.519
.15
626
.32.
348
4
10H
BF4
12-5
522
.482
.514
1.5
66.6
51.
912
.216
1.65
26.4
14.6
56.
730
2.9
474
11H
BF4
12-6
322
.484
142
90.2
1.5
13.9
192.
547
.45
26.4
56.
426
.32.
349
4
12H
BF4
12-2
122
.23
7313
498
.35
1.9
16.9
517
2.2
37.3
20.7
7.3
343.
849
4
13H
BF4
12-2
22.1
71.5
130
100.
350.
518
152.
8541
.15
23.2
6.2
373.
650
4
14H
BF4
12-4
22.1
7313
1.5
107.
151.
318
.419
2.7
50.1
527
.85
5.8
41.7
4.1
484
15H
BF4
12-1
1822
.183
140
902
15.8
162.
1532
.418
.05
6.3
31.8
351
4
16H
BF4
12-1
421
.872
130
111.
450.
717
.316
2.85
49.3
526
.95.
536
3.1
484
17H
BF4
12-1
921
.773
.513
210
6.55
2.3
17.1
19.5
2.6
53.2
529
.25
6.2
37.8
3.8
494
18H
BF4
12-6
921
.781
140
89.8
52.
720
.65
132.
6534
.45
18.8
55.
144
.44.
150
4
19H
BF
412
-121
.672
130.
510
4.95
0.9
1918
.52.
2535
.720
.45
5.6
38.5
3.5
504

20H
BF4
12-5
721
.681
137
117.
552
19.7
182.
0538
.75
21.1
4.6
41.4
3.2
494
21H
BF4
12-1
721
.573
131
90.4
52
16.7
182.
0536
.220
.16.
138
.13.
848
4
22H
BF4
12-6
221
.573
.513
2.5
89.9
2.55
1517
2.3
3620
5.9
39.1
3.8
364
23H
BF4
12-7
621
.581
.514
010
4.75
0.9
18.9
173.
558
.65
33.0
56
34.3
3.1
484
24H
BF4
12-1
521
.372
.513
110
2.95
1.3
16.6
182.
942
.95
23.8
55.
540
3.7
514
25H
BF4
12-7
21.2
7313
210
6.4
0.9
17.5
18.5
349
27.2
5.96
475.
249
4
26H
BF4
12-3
421
.283
140.
590
.31.
116
.513
1.9
29.7
516
.16
302.
649
4
27H
BF4
12-1
0521
.284
141
102.
551.
720
.35
17.5
2.5
43.5
523
.65
5.3
33.3
2.7
514
28H
BF4
12-1
321
.172
130
970.
917
.217
2.2
37.6
20.9
5.6
393.
651
4
29H
BF4
12-6
421
8314
198
.15
2.1
15.6
132.
430
.617
7.4
343.
851
4
30H
BF4
12-1
0121
8113
997
.62.
620
.55
141.
927
14.5
54.
736
.72.
749
4
31H
BF4
12-8
420
.985
142.
596
.45
1.7
16.5
162.
9642
.65
23.4
56.
334
.53.
350
4
32H
BF4
12-1
0020
.784
141.
599
2.2
16.6
162.
3535
.25
19.2
56.
237
.13.
649
4
Che
cks
DD
B-1
220
.70
77.0
413
4.80
97.4
81.
3517
.13
18.6
72.
3741
.43
22.8
75.
8034
.81
3.18
52.0
04
DM
B-2
2521
.00
75.0
813
4.08
95.9
91.
5017
.37
21.7
12.
4951
.18
27.9
86.
1336
.05
3.47
49.0
03
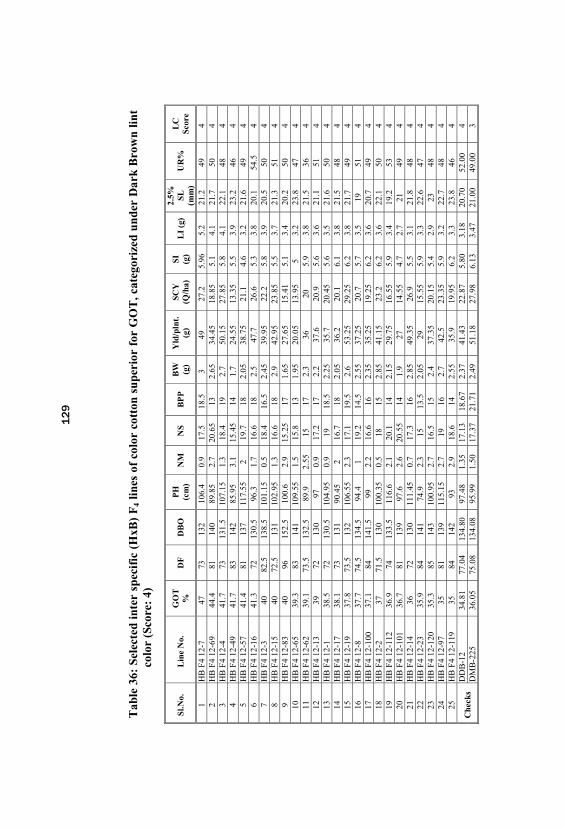
Tab
le36
:Se
lect
edin
ter
spec
ific
(HxB
)F
4lin
esof
colo
rco
tton
supe
rior
for
GO
T, c
ateg
oriz
edun
der
Dar
kB
row
nlin
tco
lor
(Sco
re:
4)
Sl.N
o.
Lin
eN
o.
GO
T%
DF
DB
OP
H(c
m)
NM
NS
BP
PB
W (g)
Yld
/pln
t.
(g)
SCY
(Q/h
a)SI (g
)L
I(g
)2.
5% SL(m
m)
UR
%L
CSc
ore
1H
BF4
12-7
4773
132
106.
40.
917
.518
.53
4927
.25.
965.
221
.249
42
HB
F412
-69
44.4
8114
089
.85
2.7
20.6
513
2.65
34.4
518
.85
5.1
4.1
21.7
504
3H
BF4
12-4
41.7
7313
1.5
107.
151.
318
.419
2.7
50.1
527
.85
5.8
4.1
22.1
484
4H
BF4
12-4
941
.783
142
85.9
53.
115
.45
141.
724
.55
13.3
55.
53.
923
.246
45
HB
F412
-57
41.4
8113
711
7.55
219
.718
2.05
38.7
521
.14.
63.
221
.649
46
HB
F412
-16
41.3
7213
0.5
96.3
1.7
16.6
182.
547
.726
.65.
33.
820
.154
.54
7H
BF4
12-3
4082
.513
8.5
101.
150.
518
.416
.52.
4539
.95
22.2
5.8
3.9
20.5
504
8H
BF4
12-1
540
72.5
131
102.
951.
316
.618
2.9
42.9
523
.85
5.5
3.7
21.3
514
9H
BF4
12-8
340
9615
2.5
100.
62.
915
.25
171.
6527
.65
15.4
15.
13.
420
.250
410
HB
F412
-65
39.3
8314
110
9.55
1.5
15.8
131.
9520
.05
13.9
55
3.2
23.8
474
11H
BF4
12-6
239
.173
.513
2.5
89.9
2.55
1517
2.3
3620
5.9
3.8
21.5
364
12H
BF
412
-13
3972
130
970.
917
.217
2.2
37.6
20.9
5.6
3.6
21.1
514
13H
BF4
12-1
38.5
7213
0.5
104.
950.
919
18.5
2.25
35.7
20.4
55.
63.
521
.650
414
HB
F412
-17
38.1
7313
190
.45
216
.718
2.05
36.2
20.1
6.1
3.8
21.5
484
15H
BF4
12-1
937
.873
.513
210
6.55
2.3
17.1
19.5
2.6
53.2
529
.25
6.2
3.8
21.7
494
16H
BF4
12-8
37.7
74.5
134.
594
.41
19.2
14.5
2.55
37.2
520
.75.
73.
519
514
17H
BF
412
-100
37.1
8414
1.5
992.
216
.616
2.35
35.2
519
.25
6.2
3.6
20.7
494
18H
BF4
12-2
3771
.513
010
0.35
0.5
1815
2.85
41.1
523
.26.
23.
622
.150
419
HB
F412
-112
36.9
7413
3.5
116.
62.
120
.114
2.15
29.7
516
.55
5.9
3.4
19.2
534
20H
BF4
12-1
0136
.781
139
97.6
2.6
20.5
514
1.9
2714
.55
4.7
2.7
2149
421
HB
F412
-14
3672
130
111.
450.
717
.316
2.85
49.3
526
.95.
53.
121
.848
422
HB
F412
-23
35.9
8414
174
.92.
315
13.5
2.05
2915
.55
5.9
3.3
22.6
474
23H
BF4
12-1
2035
.385
143
100.
952.
716
.515
2.4
37.3
520
.15
5.4
2.9
2348
424
HB
F4
12-9
735
8113
911
5.15
2.7
1916
2.7
42.5
23.3
55.
93.
222
.748
425
HB
F412
-119
3584
142
932.
918
.614
2.55
35.9
19.9
56.
23.
323
.846
4
Che
cks
DD
B-1
234
.81
77.0
413
4.80
97.4
81.
3517
.13
18.6
72.
3741
.43
22.8
75.
803.
1820
.70
52.0
04
DM
B-2
2536
.05
75.0
813
4.08
95.9
91.
5017
.37
21.7
12.
4951
.18
27.9
86.
133.
4721
.00
49.0
03
Among forty dark brown color (Score-4) cotton lines, the line HB F4
12-16 recorded highest value for uniformity ratio (54.5 %) and lowest (36%) was observed in the line HB F4 12-62. The lines HB F4 12-16 and HBF4 12-112 were superior to both the checks DDB-12 and DMB-225. Fifteenlines found superior over the check DMB-225 are presented in II.
4.2.8 Variability and heritability parameters in inter specific (HB) F4 -
lines of color cotton
Inter specific F4 lines showed significant variability for all thecharacters studied. The values of mean, range, coefficient of variation, heritability, genetic advance and genetic advance as per cent mean foreleven traits are detailed in Table 37.
4.2.8.1 Days to 50 per cent flowering
The trait recorded low GCV (6.45 %) and PCV (6.5 %). High broadsense heritability (99 %) coupled with moderate genetic advance andgenetic advance as per cent mean of the trait 10.6 and 13.25 per centrespectively.
4.2.8.2 Days to first boll opening
Low GCV (3.58 %) and PCV (3.65 %) were observed for the trait. High (96 %) broad sense heritability, genetic advance and genetic advanceas per cent mean for the trait were 9.99 and 7.25 per cent respectively.
4.2.8.3 Boll weight (g)
Boll weight recorded moderate GCV (15.06 %) and PCV (15.6 %). High (93 %) broad sense heritability coupled with low (0.70 %) to high(29.99 %) values was recorded for genetic advance and genetic advance asper cent mean respectively.
4.2.8.4 Plant height (cm)
The trait recorded moderate GCV (11.45 %) and PCV (11.58 %). High broad sense heritability (98 %) coupled with high genetic advance

and genetic advance as per cent 22.42 and 23.33 per cent were observedrespectively.
4.2.8.5 Number of sympodia
The trait recorded low to moderate GCV (8.39 %) and PCV (10.39%). Broad sense heritability noted was high (65 %). Genetic advance andgenetic advance as per cent mean for the trait were low (2.36 %) andmoderate (13.96 %) respectively.
4.2.8.6 Number of monopodia
High GCV (37.27 %) and PCV (37.76 %) were observed for the trait. High broad sense heritability 97 %, low (1.36 %) genetic advance and high(75.79 %) genetic advance as per cent mean were observed for the trait.
4.2.8.7 Number of bolls per plant
The trait exhibited moderate GCV (15.26 %) and PCV (15.74 %). High (94 %) broad sense heritability with low (4.73 %) genetic advanceand high (30.5 %) genetic advance as per cent mean were obtained for thetrait.
4.2.8.8 Ginning out turn (%)
Moderate GCV (12.03 %) and PCV (12.04 %) were observed forginning out turn. High broad sense heritability (99 %) coupled with low(8.64 %) to moderate (24.76 %) were obtained for genetic advance andgenetic advance as per cent mean for the trait respectively.
4.2.8.9 Seed index (g)
The trait recorded moderate GCV (14.59 %) and PCV (14.60 %). High broad sense heritability (99 %) which was coupled with low (1.8 %)to high (30.06 %) genetic advance and genetic advance as per cent meanfor the trait respectively.

Tab
le37
:V
aria
bilit
yan
dhe
rita
bilit
ypa
ram
eter
sin
ter
spec
ific
(HxB
)F
4lin
esof
colo
rco
tton
Par
amet
ers
Day
sto
50%
flow
erin
gD
ays
tobo
llop
en
Bol
lw
eigh
t(g
)
Pla
nthe
ight
(cm
)
No.
of
sym
podi
a/p
lant
No.
of
mon
opod
ia
/pla
nt
No.
of
boll
s/pl
ant
Gin
ning
outt
urn
(%)
Seed
inde
x(g
)L
int
inde
x(g
)
Seed
cott
onyi
eld
(q/h
a)
GC
V(%
)6.
453.
5815
.06
11.4
58.
3937
.27
15.2
612
.03
14.5
918
.12
23.0
1
PC
V(%
)6.
503.
6515
.611
.58
10.3
937
.76
15.7
412
.04
14.6
018
.13
23.5
2
h2 bs(%
)99
9693
9865
9794
9999
9996
GA
(5%
)10
.69.
990.
7022
.42
2.36
1.36
4.73
8.64
1.80
1.20
9.20
GA
M13
.25
7.25
29.9
923
.33
13.9
675
.79
30.5
24.7
630
.06
37.3
246
.38
S.E
.D0.
761.
360.
133
2.33
1.47
0.15
0.84
0.21
30.
030.
026
1.36
S.E
.M0.
530.
960.
093
1.64
1.03
0.10
0.59
0.14
90.
020.
020.
96
CV
%0.
950.
995.
672.
438.
688.
575.
40.
620.
520.
806.
87
C.D
. 5%
1.50
2.70
0.26
4.63
2.91
0.30
1.66
0.42
40.
062
0.05
12.
70
C.D
. 1%
1.99
3.58
0.35
6.14
3.86
0.40
2.20
0.56
20.
082
0.07
3.59
Mea
n80
.16
137.
962.
3496
.09
16.8
91.
815
.434
.92
6.0
3.24
19.7
6
Ran
geM
in.
71.5
124
1.6
66.6
512
.20.
59.
526
.34.
62.
18.
95
Max
9615
2.5
3.5
119.
420
.73.
319
.547
10.2
5.2
33.0
5

4.2.8.10 Lint index (g)
Moderate GCV (18.12 %) and PCV (18.13 %) were observed for thetrait. Broad sense heritability recorded was high (99 %). Genetic advanceand genetic advance as per cent mean of the trait were 1.2 and 37.32 percent respectively.
4.2.8.11 Seed cotton yield (q/ha)
High GCV (23.01 %), PCV (23.52 %), broad sense heritability (96%) was observed for the trait. Genetic advance and genetic advance as percent mean of the trait were low (9.2 %) to high (46.38 %) respectively.
4.2.9 Phenotypic correlation studies for different traits in inter specificF4 lines of color cotton
Inter specific F4 lines differed significant (P <0.05) for the traitsstudied, indicating the presence of sufficient genetic variability in thematerial. The correlation coefficients of 13 independent variables with seedcotton yield are presented in Table 38.
Days to 50 per cent flowering showed significant positive correlationwith days to first boll opening (0.88). However, the trait showed significantnegative correlation with boll weight (-0.224), plant height (-0.232), number of sympodia per plant (-0.251), ginning out turn (-0.203), lint index(-0.192) and seed cotton yield (-0.352).
Days to first boll opening exhibited significant positive correlationwith days to 50 per cent flowering (0.88), number of monopodia per plant(0.353) and negative correlation with boll weight (-0.172), plant height (-0.165), number of sympodia per plant (-0.205), bolls per plant (-0.271), ginning out turn (-0.166), lint index (-0.168) and seed cotton yield (-0.295).
Significant positive correlation was observed for boll weight withtrait components such as number of sympodia per plant (0.16), bolls perplant (0.223) and seed cotton yield (0.76). However, the trait showedsignificant negative correlation with days to 50 per cent flowering (-0.224), days to first boll opening (-0.172) and number of monopodia per plant (-0.2563).
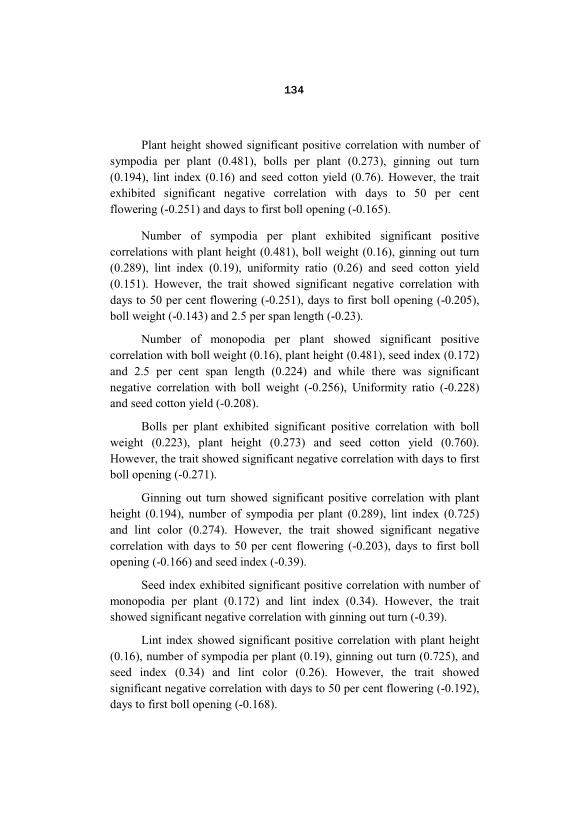
Plant height showed significant positive correlation with number ofsympodia per plant (0.481), bolls per plant (0.273), ginning out turn(0.194), lint index (0.16) and seed cotton yield (0.76). However, the traitexhibited significant negative correlation with days to 50 per centflowering (-0.251) and days to first boll opening (-0.165).
Number of sympodia per plant exhibited significant positivecorrelations with plant height (0.481), boll weight (0.16), ginning out turn(0.289), lint index (0.19), uniformity ratio (0.26) and seed cotton yield(0.151). However, the trait showed significant negative correlation withdays to 50 per cent flowering (-0.251), days to first boll opening (-0.205), boll weight (-0.143) and 2.5 per span length (-0.23).
Number of monopodia per plant showed significant positivecorrelation with boll weight (0.16), plant height (0.481), seed index (0.172)and 2.5 per cent span length (0.224) and while there was significantnegative correlation with boll weight (-0.256), Uniformity ratio (-0.228)and seed cotton yield (-0.208).
Bolls per plant exhibited significant positive correlation with bollweight (0.223), plant height (0.273) and seed cotton yield (0.760). However, the trait showed significant negative correlation with days to firstboll opening (-0.271).
Ginning out turn showed significant positive correlation with plantheight (0.194), number of sympodia per plant (0.289), lint index (0.725)and lint color (0.274). However, the trait showed significant negativecorrelation with days to 50 per cent flowering (-0.203), days to first bollopening (-0.166) and seed index (-0.39).
Seed index exhibited significant positive correlation with number ofmonopodia per plant (0.172) and lint index (0.34). However, the traitshowed significant negative correlation with ginning out turn (-0.39).
Lint index showed significant positive correlation with plant height(0.16), number of sympodia per plant (0.19), ginning out turn (0.725), andseed index (0.34) and lint color (0.26). However, the trait showedsignificant negative correlation with days to 50 per cent flowering (-0.192), days to first boll opening (-0.168).

2.5 per cent span length exhibited significant positive correlationwith number of monopodia per plant (0.224) and lint color (0.36). However, the trait showed significant negative correlation with number ofsympodia per plant (-0.23) and uniformity ratio (-0.64).
Uniformity ratio showed significant positive correlation with numberof sympodia per plant (0.026). However, the trait exhibited significantnegative correlation with number of monopodia per plant (-0.228), 2.5 percent span length (-0.64) and lint color (-0.19).
Lint color exhibited significant positive correlation with ginning outturn (0.274), lint index (0.26), 2.5 per cent span length (0.36) and seedcotton yield (0.151). However, significant negative correlation wasobserved with days to first boll opening (-0.16) and uniformity ratio (-0.19).
Seed cotton yield showed significant positive correlation with thecomponent traits such as boll weight (0.76), plant height (0.188), number ofsympodia per plant (0.177), bolls per plant (0.76) and lint color (0.151). However, negative correlation was observed with days to 50 per centflowering (-0.352), days to first boll opening (-0.295) and number ofmonopodia per plant (-0.208).

Tab
le38
:C
orre
lati
onst
udie
son
yiel
d, y
ield
attr
ibut
ing
and
fibe
rqu
alit
ytr
aits
inin
ter-
spec
ific
(HxB
)F
4lin
esof
colo
rco
tton
DF
DB
OB
W(g
)P
H(c
m)
NS
NM
BP
PG
OT
SI(g
)L
I2.
5% SL (mm
)U
R%
Lin
tco
lor
SCY
(q/h
a)
DF
1.00
00.
88**
*-0
.224
**-0
.232
**-0
.251
***
0.38
-0.3
27-0
.203
**0.
003
-0.1
92*
0.00
30.
02-0
.142
-0.3
52**
*
DB
O
1.
000
-0.1
72*
-0.1
65*
-0.2
05**
0.35
3***
-0.2
71**
*-0
.166
*0.
038
-0.1
68*
0.03
2-0
.005
-0.1
6*-0
.295
***
BW
(g)
1.00
00.
010.
16*
-0.2
56**
*0.
223*
*0.
015
0.08
30.
083
-0.0
440.
104
0.06
20.
76**
*
PH(c
m)
1.
000
0.48
1***
-0.0
260.
273*
**0.
194*
-0.0
360.
16*
-0.0
70.
120.
130.
188*
NS
1.
000
-0.0
770.
114
0.28
9***
-0.1
070.
19**
-0.2
3**
0.26
***
0.10
30.
177*
NM
1.00
0-0
.106
-0.1
140.
172*
-0.0
20.
224*
*-0
.228
**-0
.082
-0.2
08**
BPP
1.
000
0.10
8-0
.004
0.13
10.
05-0
.011
0.11
80.
760*
**
GO
T
1.
000
-0.3
9***
0.72
5***
0.00
20.
013
0.27
4***
0.05
3
SI(g
)
1.
000
0.34
***
0.07
2-0
.07
-0.0
30.
075
LI
1.
000
0.04
5-0
.033
0.26
***
0.13
2.5%
SL
1.00
0-0
.64*
**0.
36**
*0.
033
UR
%
1.
000
-0.1
9*0.
055
Lin
tcol
or
1.00
00.
151*
SCY
(q/h
a)
1.
000
DF
–D
ays
to50
%fl
ower
ing
DB
O–
Day
sto
boll
open
B
W–
Bol
lwei
ght
PH
–Pl
anth
eigh
t N
S–
Num
ber
ofsy
mpo
dia
NM
–N
umbe
rof
mon
opod
ia
BP
P–
Bol
lspe
rpl
ant
G
OT
–G
inni
ngou
ttur
n
SI
–Se
edin
dex
LI
–L
inti
ndex
SCY
–Se
edco
tton
yiel
d
2.5%
SL–
2.5%
span
leng
thU
R–
Uni
form
ity
rati
o
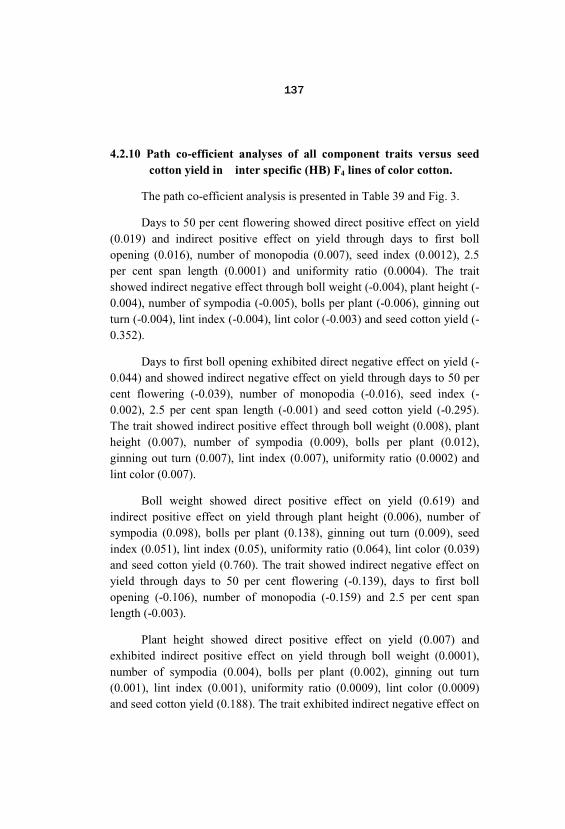
4.2.10 Path co-efficient analyses of all component traits versus seedcotton yield in inter specific (HB) F4 lines of color cotton.
The path co-efficient analysis is presented in Table 39 and Fig. 3.
Days to 50 per cent flowering showed direct positive effect on yield(0.019) and indirect positive effect on yield through days to first bollopening (0.016), number of monopodia (0.007), seed index (0.0012), 2.5per cent span length (0.0001) and uniformity ratio (0.0004). The traitshowed indirect negative effect through boll weight (-0.004), plant height (-0.004), number of sympodia (-0.005), bolls per plant (-0.006), ginning outturn (-0.004), lint index (-0.004), lint color (-0.003) and seed cotton yield (-0.352).
Days to first boll opening exhibited direct negative effect on yield (-0.044) and showed indirect negative effect on yield through days to 50 percent flowering (-0.039), number of monopodia (-0.016), seed index (-0.002), 2.5 per cent span length (-0.001) and seed cotton yield (-0.295). The trait showed indirect positive effect through boll weight (0.008), plantheight (0.007), number of sympodia (0.009), bolls per plant (0.012), ginning out turn (0.007), lint index (0.007), uniformity ratio (0.0002) andlint color (0.007).
Boll weight showed direct positive effect on yield (0.619) andindirect positive effect on yield through plant height (0.006), number ofsympodia (0.098), bolls per plant (0.138), ginning out turn (0.009), seedindex (0.051), lint index (0.05), uniformity ratio (0.064), lint color (0.039)and seed cotton yield (0.760). The trait showed indirect negative effect onyield through days to 50 per cent flowering (-0.139), days to first bollopening (-0.106), number of monopodia (-0.159) and 2.5 per cent spanlength (-0.003).
Plant height showed direct positive effect on yield (0.007) andexhibited indirect positive effect on yield through boll weight (0.0001), number of sympodia (0.004), bolls per plant (0.002), ginning out turn(0.001), lint index (0.001), uniformity ratio (0.0009), lint color (0.0009)and seed cotton yield (0.188). The trait exhibited indirect negative effect on

yield through days to 50 per cent flowering (-0.002), days to first bollopening (-0.001), number of monopodia (-0.0002), seed index (-0.0003)and 2.5 per cent span length (-0.0005).
Number of sympodia showed direct positive effect on yield (0.001)and exhibited indirect positive effect on yield through boll weight (0.002), plant height (0.005), bolls per plant (0.001), ginning out turn (0.003), lintindex (0.002), uniformity ratio (0.003), lint color (0.001), and seed cottonyield (0.177). The trait exhibited indirect negative effect on yield throughdays to 50 per cent flowering (-0.003), days to first boll opening (-0.002), number of monopodia (-0.0008), seed index (-0.001) and 2.5 per cent spanlength (-0.002).
Number of monopodia exhibited direct positive effect on yield (0.02)and showed indirect positive effect on yield through days to 50 per centflowering (0.008), days to first boll opening (0.007), seed index (0.004), 2.5 per cent span length (0.005). The trait showed indirect negative effecton yield through boll weight (-0.005), plant height (-0.0005), number ofsympodia (-0.002), ginning out turn (-0.002), lint index (-0.0004), uniformity ratio (-0.005), lint color (-0.002) and seed cottonyield (-0.208).
Bolls per plant showed direct positive effect on yield (0.615), andexhibited indirect positive effect on yield through boll weight (0.137), plantheight (0.168), number of sympodia (0.07), ginning out turn (0.067), lintindex (0.08), 2.5 per cent span length (0.031), lint color (0.072), and seedcotton yield (0.760). The trait exhibited indirect negative effect on yieldthrough days to 50 per cent flowering (-0.201), days to first boll opening (-0.167), number of monopodia (-0.065), seed index (-0.003) and uniformityratio (-0.007).
Ginning out turn exhibited direct positive effect on yield (0.013) andshowed indirect positive effect on yield through boll weight (0.0002), plantheight (0.003), number of sympodia (0.004), bolls per plant (0.001), lintindex (0.009), uniformity ratio (0.0002), lint color (0.003), and seed cottonyield (0.053). The trait exhibited indirect negative effect on yield through

days to 50 per cent flowering (-0.003), days to first boll opening (-0.167), number of monopodia (-0.065) and seed index (-0.005).
Seed index showed direct positive effect on yield (0.047) andshowed indirect positive effect on yield through days to 50 per centflowering (0.003), days to first boll opening (0.002), plant height (0.004), number of monopodia (0.008), lint index (0.02), 2.5 per cent span length(0.003), and seed cotton yield (0.075). The trait exhibited indirect negativeeffect on yield through plant height (-0.002), number of sympodia per plant(-0.005), bolls per plant (-0.0002), ginning out turn (-0.018), uniformityratio (-0.003) and lint color (-0.001).
Lint index showed direct negative effect on yield (-0.047) andexhibited indirect negative effect on yield through boll weight (-0.004), plant height (-0.008), number of sympodia per plant (-0.01), bolls per plant(-0.006), ginning out turn (-0.034), seed index (-0.02), 2.5 per cent spanlength (-0.002) and lint color (-0.012). The trait exhibited indirect positiveeffect on yield through days to 50 per cent flowering (0.009), days to firstboll opening (0.0009), number of monopodia per plant (0.0009), uniformityratio (0.002) and seed cotton yield (0.127).
2.5 per cent span length showed direct positive effect on yield (0.03)and exhibited indirect positive effect on yield through days to 50 per centflowering (0.0001), days to first boll opening (0.0009), number ofmonopodia per plant (0.007), bolls per plant (0.002), ginning out turn(0.0001), seed index (0.002), lint index (0.001), lint color (0.01) and seedcotton yield (0.033). The trait showed indirect negative effect on yieldthrough boll weight (-0.001), plant height (-0.002), number of sympodiaper plant (-0.007) and uniformity ratio (-0.019).

Tab
le39
:P
ath
coef
fici
ent
anal
ysis
ofal
lco
mpo
nent
trai
tsve
rsus
seed
cott
onyi
eld
inin
ter-
spec
ific
(HxB
)F
4lin
esof
colo
rco
tton
DF
DB
OB
W(g
)P
H(c
m)
NS
NM
BP
PG
OT
SI(g
)L
I2.
5%SL
(mm
)U
R %
Lin
tco
lor
DF
0.01
90.
016
-0.0
04-0
.004
-0.0
050.
007
-0.0
06-0
.004
0.00
12-0
.004
0.00
010.
0004
-0.0
03
DB
O-0
.039
-0.0
440.
008
0.00
70.
009
-0.0
160.
012
0.00
7-0
.002
0.00
7-0
.001
40.
0002
0.00
7
BW
(g)
-0.1
39-0
.106
0.61
90.
006
0.09
8-0
.159
0.13
80.
009
0.05
10.
05-0
.027
50.
064
0.03
9
PH
(cm
)-0
.002
-0.0
010.
0001
0.00
70.
004
-0.0
002
0.00
20.
001
-0.0
003
0.00
1-0
.000
50.
0009
0.00
09
NS
-0.0
03-0
.002
0.00
20.
005
0.00
1-0
.000
80.
001
0.00
3-0
.001
0.00
2-0
.002
30.
003
0.00
1
NM
0.00
80.
007
-0.0
05-0
.000
5-0
.002
0.02
-0.0
02-0
.002
0.00
4-0
.000
40.
0047
-0.0
05-0
.002
BP
P-0
.201
-0.1
670.
137
0.16
80.
07-0
.065
0.61
50.
067
-0.0
030.
080.
0310
-0.0
070.
072
GO
T-0
.003
-0.0
020.
0002
0.00
30.
004
-0.0
010.
001
0.01
3-0
.005
0.00
90.
000
0.00
020.
003
SI(g
)0.
003
0.00
20.
004
-0.0
02-0
.005
0.00
8-0
.000
2-0
.018
0.04
70.
020.
0033
-0.0
03-0
.001
LI
0.00
90.
0009
-0.0
04-0
.008
-0.0
10.
0009
-0.0
06-0
.034
-0.0
2-0
.047
-0.0
021
0.00
2-0
.012
2.5%
SL(m
m)
0.00
010.
0009
-0.0
01-0
.002
-0.0
070.
007
0.00
20.
0001
0.00
20.
001
0.02
95-0
.019
0.01
UR
%0.
0005
-0.0
010.
003
0.00
30.
007
-0.0
06-0
.003
0.00
03-0
.002
-0.0
008
-0.0
164
0.02
6-0
.005
Lin
tco
lor
-0.0
06-0
.006
0.00
30.
005
0.00
4-0
.003
0.00
50.
01-0
.001
0.01
0.01
43-0
.008
0.04
SCY
(q/h
a)-0
.352
***
-0.2
95**
*0.
760*
**0.
188*
0.17
7*-0
.208
**0.
760*
**0.
053
0.07
50.
127
0.03
30.
055
0.15
1*
R2
valu
e=
0.95
06
R
esid
uale
ffec
t=0.
2223
DF
–D
ays
to50
%fl
ower
ing
DB
O–
Day
sto
boll
open
B
W–
Bol
lwei
ght
PH
–Pl
anth
eigh
t N
S–
Num
ber
ofsy
mpo
dia
NM
–N
umbe
rof
mon
opod
ia
BPP
–B
olls
per
plan
t
GO
T–
Gin
ning
outt
urn
SI–
Seed
inde
x
L
I–
Lin
tind
ex
SCY
–Se
edco
tton
yiel
d
2.5%
SL–
2.5%
span
leng
thU
R–
Uni
form
ity
rati
o


Uniformity ratio showed direct positive effect on yield (0.26) andshowed indirect positive effect on yield through days to 50 per centflowering (0.0005), boll weight (0.003), plant height (0.003), number ofsympodia per plant (0.007), ginning out turn (0.0003), and seed cottonyield (0.055). The trait exhibited indirect negative effect on yield throughdays to first boll opening (-0.001), number of monopodia per plant (-0.006), bolls per plant (-0.003), seed index (-0.002), lint index (-0.0008), 2.5 per cent span length (-0.016) and lint color (-0.005).
Lint color showed direct positive effect on yield (0.04) and exhibitedindirect positive effect on yield through boll weight (0.003), plant height(0.005), number of sympodia per plant (0.004), bolls per plant (0.005), ginning out turn (0.01), lint index (0.01), 2.5 per cent span length (0.014)and seed cotton yield (0.151). The trait showed indirect negative effect onyield through days to 50 per cent flowering (-0.006), days to first bollopening (-0.006), number of monopodia per plant (-0.003), seed index (-0.001) and uniformity ratio (-0.008).
4.2.11 Phenotypic correlation studies in F4 lines of color cotton.
The F4 lines of color cotton differed significant (P <0.05) for all thetraits studied, indicating the presence of ample amount of geneticvariability existing in the material. The correlation coefficients of 13independent variables with seed cotton yield are presented in Table 40. Thecharacter wise results are presented below.
Days to 50 per cent flowering exhibited significant positivecorrelation with days to first boll opening (0.822), number of monopodiaper plant (0.33), 2.5 per cent span length (0.119) and lint color (0.121). However, the trait showed significant negative correlation with bolls perplant (-0.235), ginning out turn (-0.367), lint index (-0.29), uniformity ratio(-0.173) and seed cotton yield (-0.352).
Days to first boll opening exhibited significant positive correlationwith days to 50 per cent flowering (0.822) and number of monopodia perplant (0.331). However, significant negative correlation was observed with
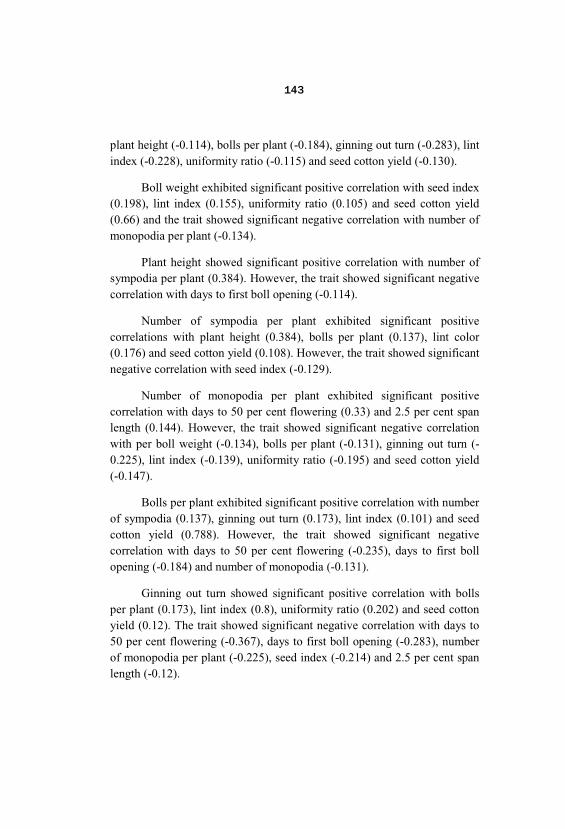
plant height (-0.114), bolls per plant (-0.184), ginning out turn (-0.283), lintindex (-0.228), uniformity ratio (-0.115) and seed cotton yield (-0.130).
Boll weight exhibited significant positive correlation with seed index(0.198), lint index (0.155), uniformity ratio (0.105) and seed cotton yield(0.66) and the trait showed significant negative correlation with number ofmonopodia per plant (-0.134).
Plant height showed significant positive correlation with number ofsympodia per plant (0.384). However, the trait showed significant negativecorrelation with days to first boll opening (-0.114).
Number of sympodia per plant exhibited significant positivecorrelations with plant height (0.384), bolls per plant (0.137), lint color(0.176) and seed cotton yield (0.108). However, the trait showed significantnegative correlation with seed index (-0.129).
Number of monopodia per plant exhibited significant positivecorrelation with days to 50 per cent flowering (0.33) and 2.5 per cent spanlength (0.144). However, the trait showed significant negative correlationwith per boll weight (-0.134), bolls per plant (-0.131), ginning out turn (-0.225), lint index (-0.139), uniformity ratio (-0.195) and seed cotton yield(-0.147).
Bolls per plant exhibited significant positive correlation with numberof sympodia (0.137), ginning out turn (0.173), lint index (0.101) and seedcotton yield (0.788). However, the trait showed significant negativecorrelation with days to 50 per cent flowering (-0.235), days to first bollopening (-0.184) and number of monopodia (-0.131).
Ginning out turn showed significant positive correlation with bollsper plant (0.173), lint index (0.8), uniformity ratio (0.202) and seed cottonyield (0.12). The trait showed significant negative correlation with days to50 per cent flowering (-0.367), days to first boll opening (-0.283), numberof monopodia per plant (-0.225), seed index (-0.214) and 2.5 per cent spanlength (-0.12).

Seed index exhibited significant positive correlation with boll weight(0.198), lint index (0.336) and 2.5 per cent span length (0.124). However, significant negative correlation was observed with number of sympodia perplant (-0.129) and ginning out turn (-0.214).

Tab
le40
:C
orre
lati
onst
udie
son
yiel
d, y
ield
attr
ibut
ing
and
fibe
rqu
alit
ytr
aits
inF
4lin
esof
colo
rco
tton
DF
DB
OB
W (g)
PH
(cm
)N
SN
MB
PP
GO
T%
SI(g
)L
I2.
5% SLU
R%
Lin
tco
lor
SCY
(q/h
a)
DF
1.00
00.
822*
**-0
.031
-0.0
68-0
.034
0.33
***
-0.2
35**
*-0
.367
***
0.04
7-0
.29*
**0.
119*
-0.1
73**
*0.
121*
-0.1
61**
DB
O
1.
000
-0.0
15-0
.114
*-0
.09
0.33
1-0
.184
***
-0.2
83**
*0.
035
-0.2
28**
*0.
046
-0.1
15*
0.07
3-0
.130
*
BW
(g)
1.00
00.
022
0.04
5-0
.134
**0.
144
0.02
90.
198*
**0.
155*
*-0
.027
0.10
5*0.
078
0.66
***
PH
(cm
)
1.00
00.
384*
**0.
005
0084
0.08
0.02
20.
087
0.01
40.
060.
003
0.04
3
NS
1.
000
-0.0
350.
137*
*0.
075
-0.1
29*
-0.0
29-0
.056
0.06
30.
176*
**0.
108*
NM
1.00
0-0
.131
*-0
.225
***
0.14
3-0
.139
***
0.14
4**
-0.1
95**
*0.
068
-0.1
47*
BPP
1.
000
0.17
3***
-0.0
90.
101*
-0.0
620.
1-0
.089
0.78
8***
GO
T%
1.00
0-0
.214
***
0.8*
**-0
.12*
0.20
2***
-0.0
50.
12*
SI(
g)
1.00
00.
336*
**0.
124*
-0.0
7-0
.006
0.07
2
LI
1.
000
0.00
0.12
2*-0
.078
0.14
9**
2.5%
SL(m
m)
1.00
0-0
.76*
**-0
.067
-0.0
61
UR
%
1.
000
-0.0
30.
143*
*
Lin
tcol
or
1.00
00.
003
SCY
(q/h
a)
1.
000

Lint index showed significant positive correlation with boll weight(0.155), bolls per plant (0.101), ginning out turn (0.8), seed index (0.336), uniformity ratio (0.122) and seed cotton yield (0.149). While with days to50 per cent flowering (-0.29), days to first boll opening (-0.228) andnumber of monopodia per plant (-0.139) significant negative correlationwas observed.
2.5 per cent span length exhibited significant positive correlationwith days to 50 per cent flowering (0.119), number of monopodia per plant(0.144) and seed index (0.124). However, the trait showed significantnegative correlation with ginning out turn (-0.12) and uniformity ratio (-0.76).
Uniformity ratio exhibited significant positive correlation with bollweight (0.105), ginning out turn (0.202), lint index (0.122) and seed cottonyield (0.143). The trait showed significant negative correlation with days to50 per cent flowering (-0.173), days to first boll opening (-0.115), numberof monopodia per plant (-0.195) and 2.5 per cent span length (-0.76).
Lint color exhibited significant positive correlation with days to 50per cent flowering and number of sympodia per plant (0.176).
Seed cotton yield showed significant positive correlation with thecomponent traits such as boll weight (0.66), number of sympodia per plant(0.108), bolls per plant (0.788), ginning out turn (0.12), lint index (0.149)and uniformity ratio (0.143). However, seed cotton yield showedsignificant negative correlation with days to 50 per cent flowering (-0.161), days to first boll opening (-0.130) and number of monopodia (-0.147).
4.3 Intergeneration correlation and regression analysis
4.3.1 Intergeneration correlation analysis
The simple correlation was worked out between parent (F3) andprogeny (F4) mean for seed cotton yield per plant and fiber length traits byconsidering both the generations the results of which are presented in Table41.

Tab
le41
:In
terg
ener
atio
nco
rrel
atio
nco
effi
cien
tsbe
twee
npa
rent
(F3)
and
prog
eny
(F4)
for
quan
tita
tive
and
qual
itat
ive
trai
tsin
intr
ahi
rsut
um(H
H)
and
inte
rsp
ecif
ic(H
B)
cros
ses
ofco
lore
dan
dw
hite
cott
ons
geno
type
s
Cro
sses
Yie
ldpe
rpl
ant
(r)
Fib
erle
ngth
(r)
Intr
ahi
rsut
um
(Gos
sypi
umhi
rsut
umx
Gos
sypi
umhi
rsut
um)
0.59
4**
0.76
4**
Inte
rsp
ecif
ic
(Gos
sypi
umhi
rsut
umx
Gos
sypi
umba
rbad
ense
)0.
056
0.50
8**
*-Si
gnif
ican
t@5
%, *
*-Si
gnif
ican
t@1%

Tab
le42
:H
erit
abili
ty(N
arro
wSe
nse)
esti
mat
esfo
rY
ield
per
plan
tan
dfi
ber
leng
thin
pare
nt(F
3)pr
ogen
y(F
4)of
intr
ahi
rsut
um(H
H)
and
inte
rsp
ecif
ic(H
B)
cros
ses
betw
een
colo
red
and
whi
teco
tton
geno
type
s
Cro
sses
Yie
ldpe
rpl
ant
(h2 N
S%
)F
iber
leng
th(h
2 NS
%)
Intr
ahi
rsut
um
(Gos
sypi
umhi
rsut
umx
Gos
sypi
umhi
rsut
um)
2338
Inte
rsp
ecif
ic
(Gos
sypi
umhi
rsut
umx
Gos
sypi
umba
rbad
ense
)0
16
Low
h2 NS
=5
–10
%
M
oder
ate
h2 NS
=10
-30
%
H
igh
h2 NS
=30
-60
%

Intergeneration correlation values revealed that, out of intra hirsutum(HH) and inter specific (HB) progenies, progenies of intra hirsutum (HH)lines exhibited significant positive correlation for both the traits. Correlation coefficients for seed cotton yield per plant and fiber lengthwere 0.594 and 0.764 respectively. However, progenies of inter specific(HB) lines exhibited significant positive correlation (0.508) only for fiberlength trait. No significant correlation was observed for yield per plant.
4.4 Inheritance study of fiber color in F2 and itsconfirmation in F3 generation derived from diversecrosses of color and white linted (Gossypium hirsutum)genotypes
To study the inheritance of fiber color two separate crosses wereattempted during 2008-09 by crossing dark brown genotype (DDB-106)and medium brown (DMB-102) genotypes with white linted genotype(Sahana). The F1 obtained had intermediate lint color. The F2 seedsobtained from selfing F1 were raised by following recommended packageof practices. The variation observed in the F2 population was very high, representing different types of lint color.
The color range observed in the 284 F2 plants of the cross darkbrown genotype (DDB-106) with white genotype (Sahana), varied fromwhite (color code W RHS 999 D) to orange brown (color code OB RHS166 C). The color variation was classified into eight different categories. Out of these eight categories one was pure white and other seven werepigmented. The pigmented categories exhibited wide variation and itranged from off white to dark brown (Plate 2 and 3).
The color range observed in the cross between medium brown lintedgenotype (DMB-102) and white linted genotype (Sahana) varied fromwhite (color code W RHS 999 D) to yellow brown (color code YB RHS167 B). The F2 population size of this cross was three hundred and twentytwo plants which could be classified into six different categories based oncolor. Out of these six categories one was pure white and other five werepigmented. The pigmented categories exhibited wide variation from offwhite to medium brown (Plate 4 and 5).

The number of plants in the cross DDB-106 with Sahana had 262pigmented and 22 non-pigmented plants and in the cross DMB-102 withSahana showed 274 pigmented and 48 non-pigmented plants are presentedin Table 43 and 44. Thus, the segregation pattern in F2 populationsindicated the presence of gene interaction which reveals that fiber colordevelopment is controlled by a pair of genes with duplicate epistasis (15:1).
Results of segregation pattern for fiber color in F3 generation, obtained in the progenies of selected F2 plants based on fiber color revealedthat, few parental F2 plants selected for darker brown lint color types bredtrue to type and some of the darker brown linted parental plants segregatedinto darker brown types as well as medium brown types. Parental F2 plantswith medium brown lint color segregated into medium brown and lightbrown color types. However, in the F2 progenies of light brown lint color, cream linted and off white types segregation was not observed in the fewlines which were advanced to F3. Parental F2 plants selected for pure whitetypes bred true to type. It was difficult to conclude on the segregation ratiosin F3 generation owing to the small population size in each F3 lines whichranged from 24-30 plants.

Tab
le43
:C
olor
clas
ses
ofF
2de
rive
dfr
omtw
ocr
osse
sD
DB
-106
xSa
hana
and
DM
B-1
02x
Saha
na
Par
ents
D
DB
-106
x
Sah
ana
(Dar
kbr
own)
(Whi
te)
Par
ents
D
MB
-102
x S
ahan
a
(M
ediu
mbr
own)
(W
hite
)
Col
orof
Par
ents
OB
RH
SN
170A
WR
HS
N99
9DC
olor
ofP
aren
tsY
BR
HS
167B
WR
HS
N99
9D
Col
orof
F1
OB
RH
S17
3D
Col
orof
F1
YB
RH
S16
7D
R
HS
Col
orC
ode
Num
ber
ofpl
ants
R
HS
Col
orC
ode
Num
ber
ofpl
ants
F2
colo
rcl
asse
s
OB
RH
S16
6C1
F2
colo
rcl
asse
s
YB
RH
S16
7B12
OB
RH
S17
3C17
YB
RH
S16
7D41
OB
RH
S17
3D49
LY
BR
HS
158A
109
LY
BR
HS
160B
40L
YB
RH
S15
8D56
LY
BR
HS1
58A
63W
RH
S15
5D56
LY
BR
HS
158D
33W
RH
SN
999D
48
WR
HS
155D
59
WR
HS
N99
9D
22
Pop
ulat
ion
size
28
4P
opul
atio
nsi
ze
322

Tab
le44
:In
heri
tanc
epa
tter
nof
fibe
rco
lor
inF
2po
pula
tion
deri
ved
from
colo
ran
dw
hite
cott
oncr
osse
s(D
DB
-106
XSa
hana
)an
d(D
MB
-102
XSa
hana
)
Cro
ssN
o.
Cro
ssP
opul
atio
nP
igm
ente
dN
on-P
igm
ente
dT
otal
Rat
ioχ χχχ2
Val
ue
1D
DB
-106
XSa
hana
F226
222
284
15:1
0.05
8
2D
MB
-102
XSa
hana
F227
448
322
15:1
1.92
5
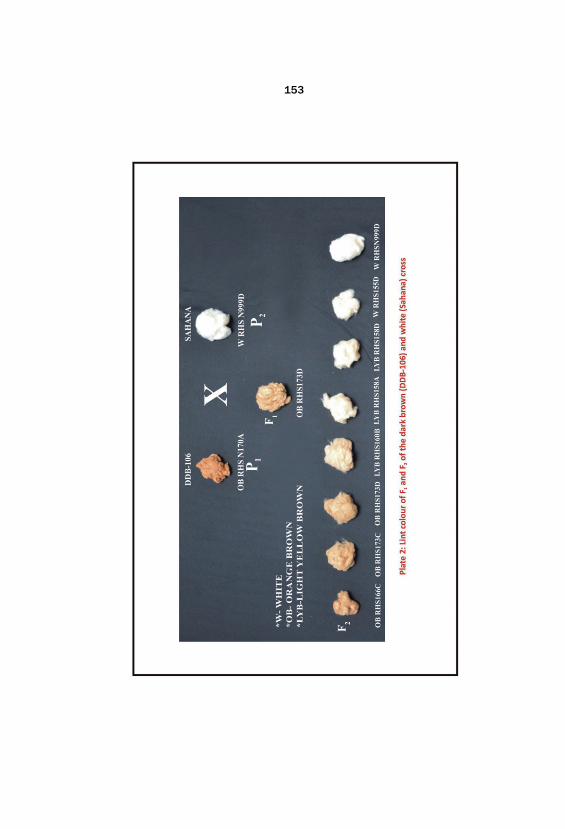
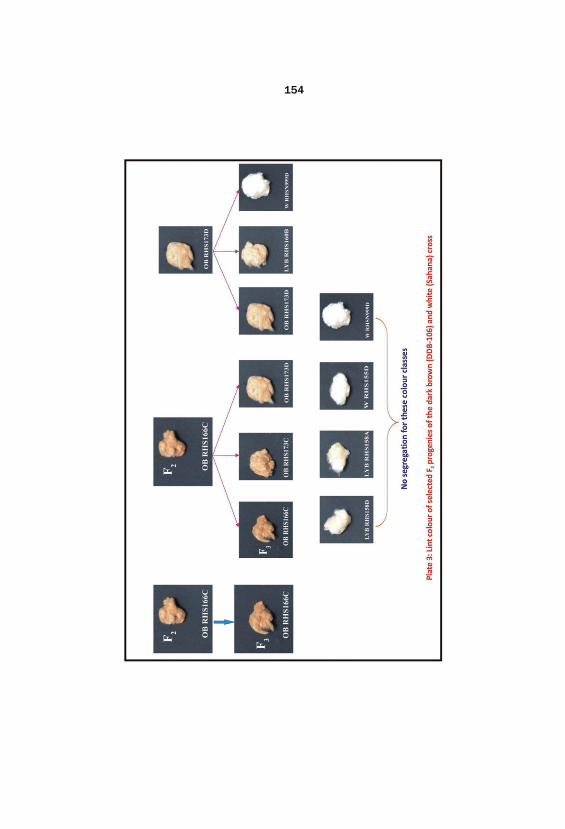


4.5 Molecular studies in one white and three color lintedcotton genotypes
A total of 181 alleles with 83% polymorphism were detected at 23SSR loci (Table 43). PAGE gel photo showing polymorphism amonggenotypes is depicted in Plate 7. The number of alleles per SSR locusranged from 2 to 20, with an average of 7.87. The polymorphic informationcontent was 0-0.13, with an average 0.04 (Table 46).
Microsatellites CIR 246 TG6, CIR 347 and JESPR-7 did not showpolymorphism in white genotype (RAH-100) while there waspolymorphism in color genotypes (DDB-12, DMB-225 and DGC-78). NAU 3654 tga had not shown polymorphism in DMB-225 and exhibitedpolymorphism in rest of the genotypes. However, SSR primer NAU 1369did not show any polymorphism in color cotton genotypes.
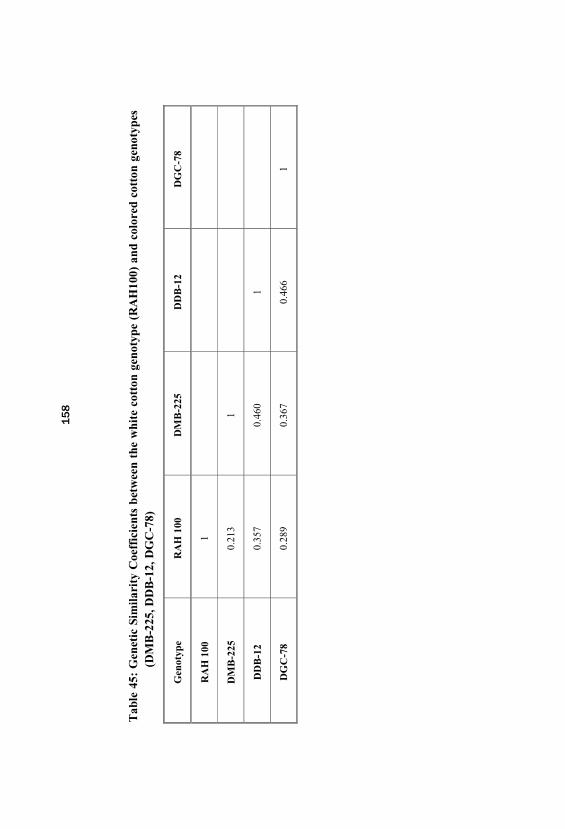
Tab
le45
:G
enet
icSi
mila
rity
Coe
ffic
ient
sbe
twee
nth
ew
hite
cott
onge
noty
pe(R
AH
100)
and
colo
red
cott
onge
noty
pes
(DM
B-2
25, D
DB
-12,
DG
C-7
8)
Gen
otyp
eR
AH
100
DM
B-2
25D
DB
-12
DG
C-7
8
RA
H10
01
DM
B-2
250.
213
1
DD
B-1
20.
357
0.46
01
DG
C-7
80.
289
0.36
70.
466
1

Table 46: Allelic variation of 23 Simple Sequence Repeats (SSR) lociamong 1 white and 3 colored cotton Gossypium hirsutumgenotypes
Sl. No. Loci No. of Alleles No. of polymorphicalleles
PIC
1 BNL3140A1 4 1 0.01
2 BNL4030A1 8 6 0.04
3 BNL2570A1 7 5 0.03
4 BNL3948A1 2 0 0.00
5 BNL3029A1 6 3 0.02
6 BNL3661A1 14 11 0.07
7 BNL1122A1 5 3 0.02
8 BNL3806A1 5 1 0.01
9 CIR070A1 5 4 0.03
10 CIR246A1 5 3 0.02
11 CIR381A1 4 4 0.03
12 CIR328A2 3 2 0.01
13 CIR148A1 2 2 0.01
14 CIR081A1 10 10 0.07
15 CIR078A1 8 6 0.04
16 NAU923A1 14 14 0.09
17 NAU1043A1 20 20 0.13
18 NAU1369A1 15 15 0.10
19 NAU3654A1 10 10 0.07
20 NAU1218A1 12 12 0.08
21 MUSS501A1 12 12 0.08
22 CIR347A1 2 0 0.00
23 JESPR-7A1 8 6 0.04
Total 181 150 1.00
Average 7.87 6.52 0.04
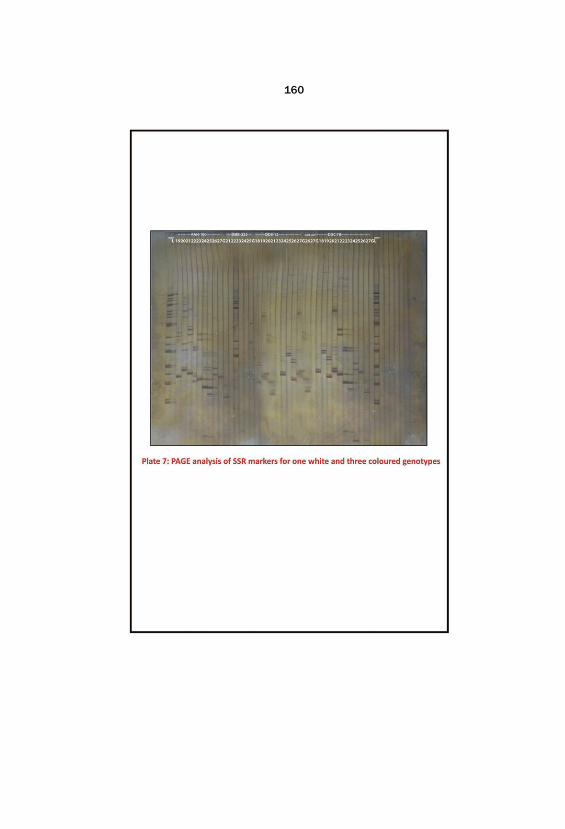

5. DISCUSSION
Color cotton has been grown and used by man since 2500 BC(Waghmare and Koranne, 1998). The research efforts during middle of thelast century being concentrated only on white cotton improvement has ledto the development of superior white linted varieties which cover themajority of the area under cotton cultivation. Cultivation of the color cottonwas discouraged and almost abandoned in the last half of the 20th centurybecause of low productivity per unit area, poor fiber characteristics andnon-uniformity of colors. Naturally color cotton, “Eco-friendly cotton” foreco-textiles without recourse to chemical dyeing has got prime importancein recent days. Dyeing processes are associated with disposal of effluentswith heavy metals into water sources leading to environmental pollution. Naturally color cottons has natural pigmentation which avoids dyeingprocesses apart from which those cottons got excellent sun protectionproperties (high UV protection factor) superior to conventional bleached orunbleached cotton (Gwendolyn and Patricia, 2005; Manjula et al., 2011). Thus with those cottons we partly minimize the adverse effects of textileindustries pollution on the ecosystem and provides healthy clothing forinfant babies to adults.
The success of any crop improvement programme depends on themagnitude of genetic variability and the extent to which the desirable traitis heritable. The estimation of variability for yield and yield contributingcharacters and their heritable components in the material is more importantin any crop breeding programme. The presence of the genetic variability inbreeding material has been emphasized by Falconer (1981), so as toexercise critical selection pressure. Variability studies provide informationabout the extent of variation present in the population where selection isactually practiced will be more meaningful and it is of immediate practicalutility. Moreover correlation and path analysis studies provide informationabout the relative contribution of various component traits and theirassociation with seed cotton yield and fiber traits with direct and indirecteffects which helps in effective identification and selection of superiorplants.

The non-white colors of cotton fiber are natural brown and green. The current status of naturally color cotton reveals poor yield potential andbelow optimum fiber traits such as fiber length, fiber strength, fiberfineness, lower elongation per cent and non-uniformity in fiber color whichare the major bottlenecks for commercialization and enabling technologistto process with ease even in specially set up small scale spinning units formaking fabric and blending with white cotton to attain desired shades ofcolor. The most feasible and immediate breeding approach to improvecolor cotton suitable for textile industries would be to utilize superior whiteGossypium hirsutum and Gossypium barbadense genotype to introgresssuperior agronomic traits into the color linted genotypes through intra andinter specific hybridization followed by selection and stabilization assupported by the research work of Manjula et al., 2011.
The degree of inter specific introgression in certain Gossypiumhybrid population is often restricted by genetic break down in the F2 andsubsequent generations (Stephens, 1949). Inter specific F1 hybrids betweenG.hirsutum and G. barbadense are often vigorous and fertile, while selective elimination ofcertain genotypes and aberrant segregation occurs in advanced generationsof selfing according to Richmond (1951). Harland (1936) indicated thepossibility of developing inter specific types with desired features of G. barbadense and G. hirsutum species. Efforts to improve G. hirsutum usingG. barbadense through introgression have been hindered by geneticbreakdown in segregating inter specific breeding populations.
Previous breeding experiences reported in Manjula et al., 2011indicates that lint color is the critical component in improving naturallycolor cotton genotypes with the color of importance and it is difficult tohave stable and uniform fiber color while maintaining high yield and goodfiber quality. At same time owing to poor understanding on genetic basis ofnatural color cotton is a necessity. Many previous studies had reported thatlint color is linked with many undesirable traits especially low yield andvery poor fiber quality traits. Hence, the present study was envisaged infour types of color cotton which are mainly brown and shades of brown, i.e. dark brown, medium brown, light brown, and cream color cotton, these

were compared for yield, yield attributing and fiber traits. The inheritanceof lint color was studied in two F2 population developed from two intrahirsutum crosses of medium and dark brown lint with white lint genotype. A preliminary effort was initiated to study the diversity of color and whitelint genotype using cotton SSR markers. Intergeneration correlationcoefficient and heritability estimates were done by parent (F3) progenyregression method. The results obtained are discussed under the followingheadings.
5.1 Per se performance of color cotton genotypes.
5.2 Comparison of variability and heritability parameters amongdifferent population of color cotton genotypes.
5.3 Character association and path analysis for various component traitsin F4 lines of color cotton genotypes.
5.4 Intergeneration correlation and regression analysis.
5.5 Genetics of fiber color in Gossypium hirsutum cottons.
5.6 Molecular characterization of white and color linted cottongenotypes.
5.1 Per se performance of color cotton genotypes
Naturally color cottons were not behind white linted standard cottonvarieties for many of the growth parameters, seed cotton yield and itscomponent traits is evident with the reports of Mustafayev et al. (1999) andManjula et al. (2011).
Fourteen stabilized genotypes comprising of medium brown anddark brown color cottons varied significantly for almost all traits studied, which is evident by the range observed for the different traits viz. days to50 per cent flowering (70-81 days), days to first boll open (133-140 days), boll weight (2.25-3 g), plant height (88.5-117.4 cm), number of sympodiaper plant (16.5-21.85), number of monopodia per plant (1.3-2.5), bolls perplant (13-26), ginning out turn (34.45-41.03 %), seed index (5.23-6.78 g), lint index (3.09-4.45 g) and seed cotton yield (9.55-18.45 q/ha) aspresented in Fig. 4. Generally it is known that fibers of naturally color

cottons are not as long and as strong as white cotton lint (Xin Mian andQui, 1999). In our findings range recorded for fiber traits viz. fiber length(18.5-25.28 mm), fiber strength (25.4-33.4 g/tex), fiber fineness (2.51-3.48µ/in), uniformity index (73.4-80.7) and elongation per cent (6.2-7.1 %).
The yield potential of different color linted genotypes indicated that, darker brown color cottons were having seed cotton yield range from 1264to 1597 kg/ha when compared the dark brown check DDB-12 i.e. 1305kg/ha, DDB-1054, DDB-1014 and DDB-1104 were superior for seedcotton yield (Plate 8). The medium brown color cottons, range for seedcotton yield observed was 955 to 1575 kg/ha when compared to
the medium brown check DMB-225 i.e. 1845 kg/ha, no genotypes foundsuperior over the check DMB-225 for the trait. However, the genotypeDMBS-1043 found significant superior for fiber length (25.28 mm) overthe check DMB-225. Thus, dark brown color genotypes recorded higherseed cotton yield when compared with medium brown color genotypes, except for the medium brown check DMB-225. However, values forgrowth parameters recorded higher in medium brown genotypes. Nogenotypes in dark brown color class were found to be superior over thecheck DDB-12 for fiber length. The genotype DDB-1034 was having finerfiber and DDB-1054 exhibited coarser fiber when compared with the checkDDB-12.
The 106 intra hirsutum (H x H) and 85 inter specific (H x B) F4 linescomprising of cream, light brown, medium brown and dark brown colorcottons exhibited high amount of variations for various traits studied isevident from range observed for different component traits in colorcategories presented in Table 47. Superior lines in HH and HB F4 lines foryield, fiber length and both for yield and fiber length under all colorcategories are presented in Fig. 5-12.
Among the intra specific F4 lines, significant superior lines for yield, fiber length and yield and fiber length under different color classes arepresented here viz. HH F4 12-19, HH F4 12-103 and HH F4 12-61 lines withlight brown lint color were significant superior to check (DMB-225) foryield; HH F4 12-63, HH F4 12-103 and HH F4 12-17 lines exhibited
significant superiority for fiber length and HH F4 12-19, HH F4 12-103, HHF4 12-61 and HH F4 12-17 were significant superior to checks DDB-12 andDMB-225 both yield and fiber length. The medium brown lint color, the F4
lines HH F4 12-24, HH F4 12-117, HH F4 12-74 and HH F4 12-26 foundsignificant superior for yield over the check (DMB-225) and HH F4 12-115, HH F4 12-57, HH F4 12-58 and HH F4 12-21 were significant superior forfiber length over medium brown check DMB-225; the lines HH F4 12- 117and HH F4 12-85 were significant superior for both yield and fiber length. The dark brown lint color only few F4 lines performed better over thecheck. Lines HH F4 12-102, HH F4 12-101 and HH F4 12-183 weresuperior for seed cotton yield and HH F4 12-113 was superior for fiberlength over the dark brown check DDB-12.

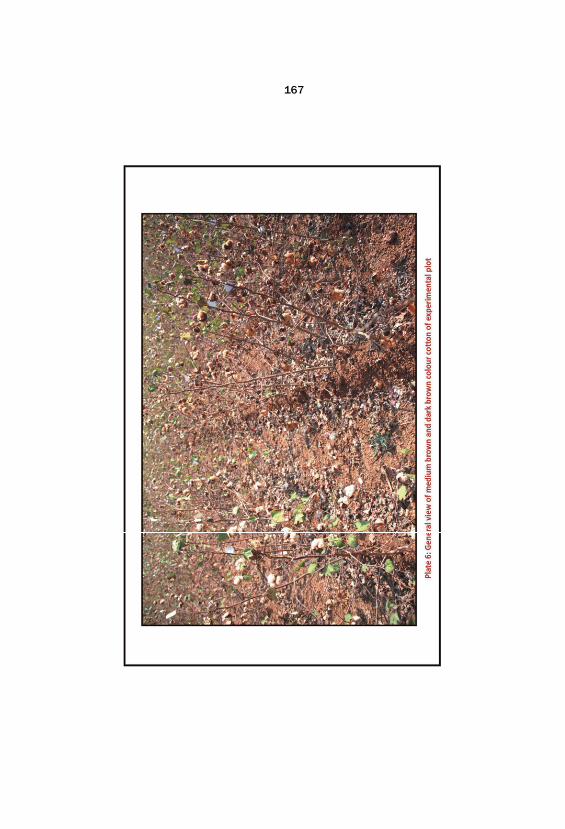
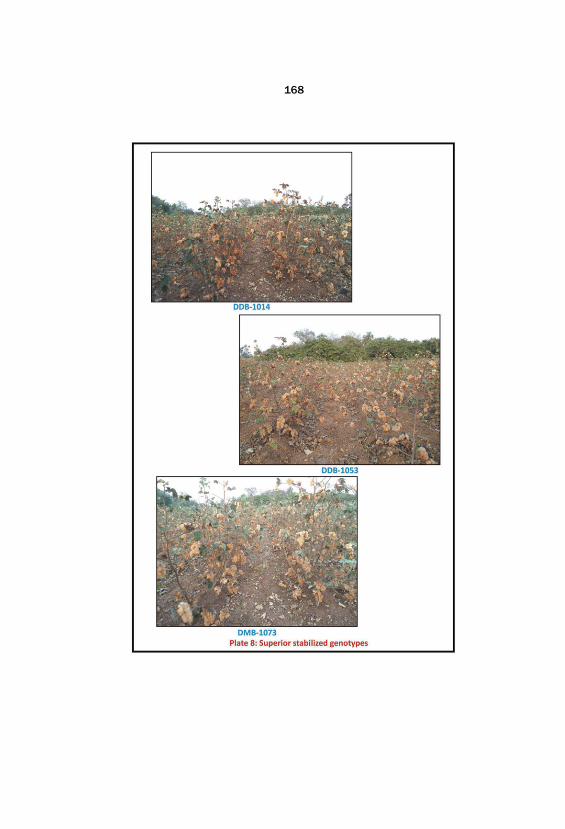

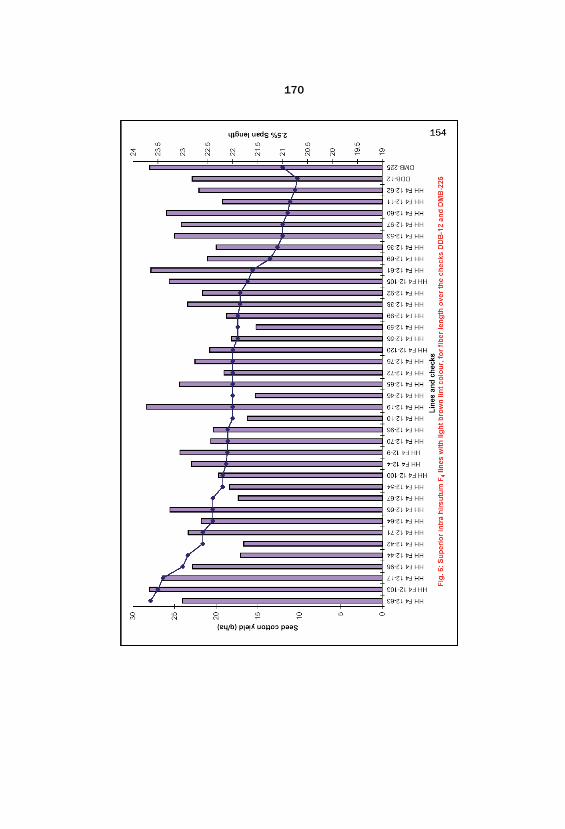


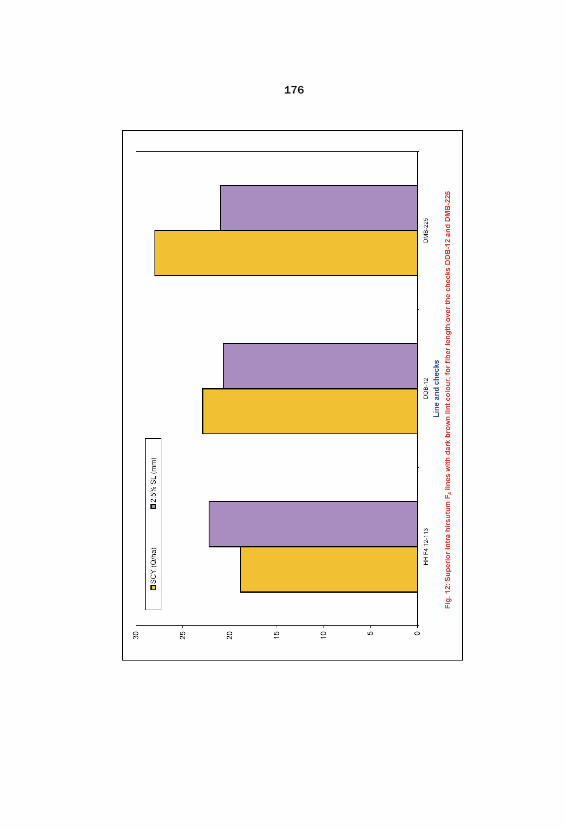

Among the inter specific (H x B) F4 lines, two lines HB F4 12-27 andHB F4 12-66 with cream color were significant superior over both thechecks DDB-12 and DMB-225 for fiber length. The light brown HB F4 12-73 was found superior for seed cotton yield and HB F4 12-37 was found tobe significant superior for fiber length. In case of medium brown HB F4 12-41 line found significant superior for seed cotton yield and HB F4 12-29, HB F4 12-50, HB F4 12-26, HB F4 12-9 and HB F4 12-67 were significantsuperior for fiber length and only line which performed significant superiorfor both seed cotton yield and fiber length was HB F4 12-29. The darkbrown color cotton lines HB F4 12-76, HB F4 12-19, HB F4 12-4, HB F4
12-7, HB F4 12-14, HB F4 12-16 and HB F4 12-63 were significant superiorfor seed cotton yield; HB F4 12-65, HB F4 12-106, HB F4 12-119, HB F4
12-33, HB F4 12-49 and HB F4 12-120 lines recorded significant superiorfor fiber length and significance for both seed cotton yield with good fiberlength was observed in the lines HB F4 12-76, HB F4 12-19, HB F4 12-4, HB F4 12-7, HB F4 12-14 and HB F4 12-63. Superior lines are depicted inFig. 13-21.
Looking to the results of intra and inter specific F4 lines, observedgrowth parameter values found better in intra hirsutum F4 lines than in interspecific (HB) F4 lines. However, intra hirsutum lines were havingacceptable fiber quality along with average yield potential and it is alsonoticed that fiber length parameter was not much significant increase ininter specific approach. Results of Manjula et al., 2011 partially supportedour findings which depicted that advanced generation selections for goodyield and fiber quality in inter specific (HB) lines end up with selectiveelimination of genotypes with desired color; this may be due to geneticbreak down caused by variation in genomes.
The findings of yield and its component traits in the present study arein agreement with research findings of Singh, et al. 1993 and 1996;Mandloi, 1996 and 1996b; Khadi et al., 1996b; Ravinderanath et al., 1996;Bijapur, et al. 1996 and Manjula et al., 2011 who reported that numberbolls per plant varied from 7 to 28, boll weight in naturally color cottonsvaried from 1.5 to 4.5 g, seed cotton yield ranged from 2600 to 2900 kg/ha. In our findings range observed for seed cotton yield varied from 895 to
3305 kg/ha. Increase or decrease in seed cotton yield may be explained bygenotypic variation, different edaphic and climatic conditions. Seed indexvaried from 5.0 to 11.0g, range for lint index was from 1.75 to 6.74 g andrange for ginning out turn recorded from 18.6 to 42.8 per cent.
Our research findings related to fiber traits were in line with those ofKrishna et al., 1996; Mandloi et al., 1996; Narayanan et al., 1996; Singh etal., 1996 and Manjula et al., 2011 who reported that fiber length in darkbrown cottons varied from 16.0 to 27 mm; range observed in mediumbrown was from 20.4-26.2 mm which supports our findings; in light brownGurel et al., 2001 reported fiber length ranging from 30.2 to 33.9 mm andin cream cotton fiber length reported was 24.1-26.6 mm. The shortest fiberswere obtained in deep brown so quality parameter indicated that darker thefiber shorter will be the fiber due to variation during fiber development forcellulose and pigment deposition synchronize leading to poor fiber quality. Few reports found to be higher than our findings the difference may beoriginated due to genotype. Fiber strength values observed in our findingswere in line with those of Singh et al. (1996); Narayanan et al. (1996); LaleEfe (2009) and Manjula et al. (2011) who reported that tenacity of variedfrom 13.1 to 19.8; 15.5 to 21.5; 26.7 and 19.0 to 27.9 g/tex in dark brown, medium brown, light brown and cream cotton respectively. The differencein the reports may be originated due to genotypes. Essentially, fiber lengthand strength can vary in different cultivation practices and differentenvironments besides of genotypes (Dutt et al., 2003). Reports of Singh etal., 1996; Narayananan et al., 1996; Mandloi et al., 1996; Lale Efe et al.,2010 and Manjula et al., 2011 on fiber fineness in dark brown cotton variedfrom 3.2-5.1 µ/in which had thickest fiber; in medium brown cottonfineness ranged from 2.4 to 4.4 µ/in and cream cotton recorded fiberfineness of 3.2-4.1 µ/in. In our findings values for fiber fineness rangedfrom 2.51 to 3.48 µ/in which reveals that in our material genotypes withfiner fibers were more.
The perusal of fiber quality traits of color cottons in our studyrevealed the following facts. Firstly, darker color cottons had shorter fiberswith less tenacity coupled with coarser fiber. Secondly, among colorcottons, medium brown fiber cotton was superior to dark brown fiber
cotton, indicating that the brown pigment might affect the fiber qualitymore adversely as compared with medium brown pigment. Richmond(1944) reported that the genes for green and brown lint inhibit thedevelopment of fibers. Reports of Singh et al., 1993; Ravinderanath et al.,1996; Anuradha and Raveendran, 1997, partially support Richmond’sobservation. Perhaps because color cotton fibers require additional energyand duration for synchronous deposition of pigment (Flavonoids) andcellulose synthesis when compared with standard white cotton genotypes. In white cotton, cellulose synthesis alone takes place making white cottonfibers stronger with good amount of cellulose without any inhibition bypigment deposition. All these studies support the view that pigmentdevelopment reduces the fiber quality of cotton.
The results of current study though indicate the low fiber propertylinked to lint color, breeding efforts will help in breaking this linkage tocertain extent. The 85 F4 lines derived from inter specific crosses with >24mm fiber length and F4 lines with >20 g/tex strength indicated thepossibility of developing color cotton genotypes suitable for textileindustry. Similarly in 106 intra specific F4 lines were identified with bothgood fiber length of > 24 mm and strength of >20 g/tex.
The overall fiber quality of color cotton lines observed in our studieswere having shorter to medium stapled coupled with good fiber strength. Thus, development and improvement of different shades of brown colorcotton with acceptable fiber quality for small to large scale textileindustries will help in the diversification of colors through naturally colorcotton fabrics, proper blending of eco-friendly cotton with white cotton formaking fabrics with color combination, apparels and furnishing materialswith soft and comfort feel will enhance the acceptability and popularizationof eco-friendly cotton. Anon. (2010) reported that naturally color cottonswhich are devoid of any harmful dyes and other chemicals for impartingcolor could be used for making products such babywear, nursery beddingsand soft toys.
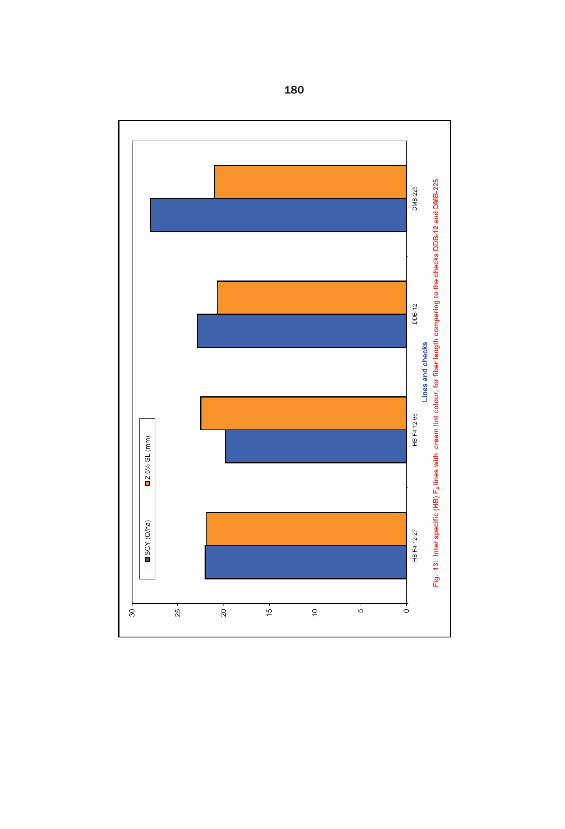


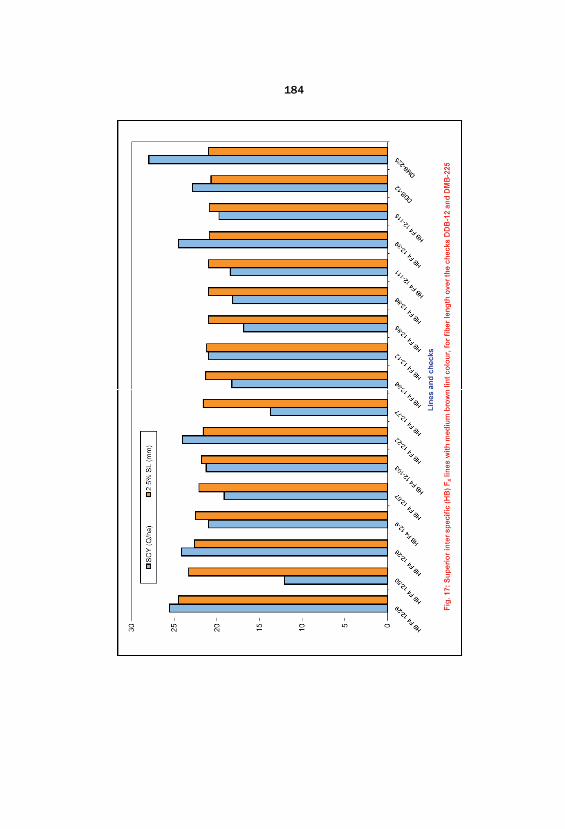
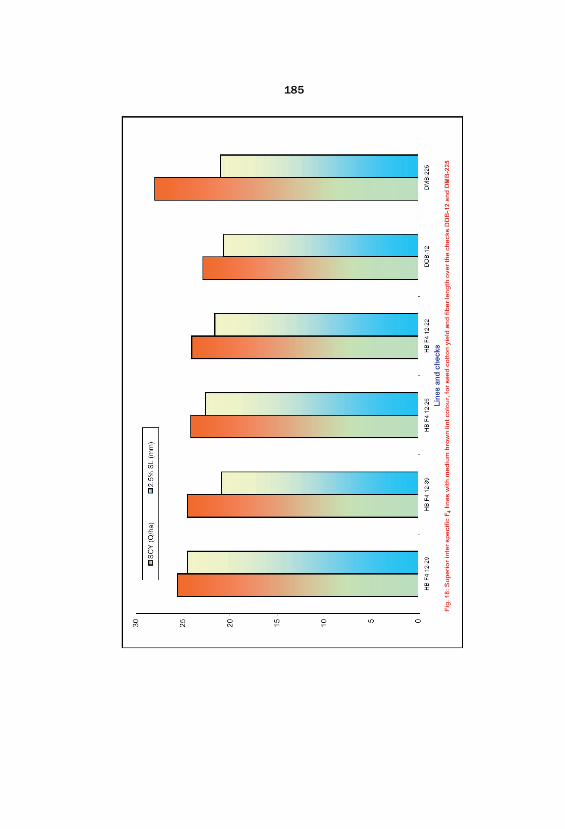


Tab
le47
:R
ange
valu
esfo
rdi
ffer
ent
trai
tco
mpo
nent
sin
diff
eren
tco
lors
ofH
Han
dH
BF
4lin
esof
colo
rco
tton
Intr
a/in
ter
spec
ific
LC
Scor
eR
ange
DF
DB
OP
H(c
m)
NM
NS
BP
PB
W (g)
SCY
(q/h
a)SI (g
)G
OT
%L
I(g
)
2.5% SL (mm
)U
R%
HB
Cre
am(1
)M
in.
7413
280
.40
2.3
13.6
015
2.20
19.8
05.
1030
2.20
21.9
048
Max
. 82
141
92.5
03.
316
.20
182.
4022
.00
5.30
33.3
2.60
22.5
049
HH
Lig
htbr
own
(2)
Min
. 70
128
73.2
50.
913
.45
121.
8515
.20
4.20
27.7
91.
8618
.23
47
Max
. 92
145
119.
002.
419
.55
232.
7028
.35
7.80
43.3
45.
0023
.65
54
HB
Lig
htbr
own
(2)
Min
. 73
132
80.1
01
14.8
010
1.60
8.95
4.60
28.6
2.10
18.0
046
Max
. 87
145
119.
402.
520
.40
192.
7023
.70
6.90
40.9
4.10
23.7
053
HH
Med
ium
brow
n(3
)M
in.
6912
871
.00
1.00
13.6
012
1.71
9.65
4.90
25.7
52.
0517
.42
47
Max
. 84
140
120.
202.
7020
.10
232.
9233
.25
7.60
44.6
04.
6623
.00
55
HB
Med
ium
brow
n(3
)M
in.
7212
467
.50
0.5
13.3
011
1.70
12.0
54.
9027
2.30
19.1
046
Max
. 87
147
113.
003.
319
.45
203.
2031
.50
10.2
042
.44.
2024
.50
52
HH
Dar
kbr
own
(4)
Min
. 72
131
70.3
01.
113
.60
142.
1218
.25
4.80
32.7
82.
9017
.80
50
Max
. 81
141
107.
652.
118
.95
212.
7228
.30
7.10
43.3
44.
9922
.20
55
HB
Dar
kbr
own
(4)
Min
. 72
130
66.6
50.
512
.20
101.
6510
.40
4.60
26.3
2.10
18.7
036
Max
. 96
153
117.
553.
120
.65
203.
5033
.05
8.00
475.
2023
.80
55
DF
–D
ays
to50
%fl
ower
ing
D
BO
–D
ays
tobo
llop
en
B
W–
Bol
lwei
ght
PH
–Pl
anth
eigh
t
N
S–
Num
ber
ofsy
mpo
dia
NM
–N
umbe
rof
mon
opod
ia
BPP
–B
olls
per
plan
t
GO
T–
Gin
ning
outtu
rnSI
–Se
edin
dex
L
I–
Lin
tind
ex
SCY
–Se
edco
tton
yiel
d
2.
5%SL
–2.
5%sp
anle
ngth
UR
-U
nifo
rmity
rati
o

5.2 Comparison of variability and heritability parametersamong different populations of color cotton genotypes
All forms of plant improvement activities through breedingcontemplate an eventual boost in genetic potential for yield. Since, yield ispolygenically controlled and highly influenced by environment, selectionbased on yield alone is not effective. The breeder hence develops intoproposition of selecting for high yield indirectly through yield associatedand highly heritable characters after eliminating environmental componentsof phenotypic variance. An attempt to improve a character by selectionwould be futile unless a major portion of variation is heritable whichdepends entirely on the magnitude of genetic variability in the sourceprogeny. In respect to yield and its components, most of genetic variabilityavailable today in plant collection is the result of spontaneous mutation, recombination and exposure to natural selection over centuries. Variouscrop plants have moulded themselves to the needs of nature through forcesof evolution. Since the beginning of human civilization man has becomeanother force for mending the trends of evolution in crop plants. Theagriculturist right from pre-historic days has chosen plants and grown themaccording to his needs. As time passed and man’s pursuit for bettergenotypes progressed, the concept of hybridization evolved as a means togenerate more variability through recombination. This variability generatedis a pre-requisite for any breeding programme aimed at improving the yieldand other characters. Thus it is imperative to have information on bothgenotypic and phenotypic coefficients of variation to get an idea regardingthe heritability of character. Information on genotypic and phenotypiccoefficient of variation, heritability together with GAM will be handy forprediction of the possible genetic advance by selection for the character. Besides the knowledge of correlation and path coefficient analysis wouldassist in setting up selection indices. The genetic parameter such asgenotypic coefficient of variation and genetic advance helps to split thetotal variability into heritable and non-heritable components.
The analysis of variance (ANOVA) presented in Table 2, 5 and 21, indicated that entire genotypes and lines in respective populations differedsignificant at p<0.05 with respect to 11 characters studied. This provided
the evidence for the significant genetic variability present among thegenotypes for the traits studied.
In all the populations, the phenotypic coefficient of variation (PCV)was higher than genotypic coefficient of variation (GCV) for all charactersunder study, except for the traits ginning out turn (GOT), seed and lintindex. The close correspondence between the estimates of GCV and PCVindicated that the environmental influence is low and hence selection forthe characters would be made based on their phenotypic performance. Lowto moderate GCV was observed in stabilized population and interspecificF4 lines. However, high GCV for most of the yield attributing traits in intrahirsutum F4 lines revealed the presence of high magnitude of geneticvariability.
Moderate magnitude of GCV and PCV was observed for seed cottonyield and its component traits like number of bolls per plant, boll weight, number of sympodia per plant, plant height and number of monopodia perplant. Similar findings were reported by Singh et al., 1996; Mandloi et al., 1996 and Bijapur, 1996 for plant height, number of sympodia per plant, number of bolls per plant. However, in intra hirsutum and stabilized lineslow GCV and PCV observed for boll weight indicating narrow genetic basefor the trait. Higher magnitude of PCV and GCV for number of monopodiaper plant in intra and inter specific lines was seen; results of our findingswere supported by the reports of Bijapur, 1996. However, few reportsindicated low to moderate variation for number of monopodia per plant, difference may be originated due to different genotypes.
Low GCV and PCV for days to 50 per cent flowering, days to bollopen, number of sympodia per plant in all the populations handled whichindicate narrow genetic base for these traits and bound to influencedenvironmental factors. Similarly, low variability for plant height, ginningout turn and seed index was observed in stabilized population of colorcotton indicating narrow genetic base for the trait. However, moderatevariability for those traits were seen in inter and intra specific lines. Similarresult of low variability for days to boll open was reported by Bijapur, 1996; results of seed index supported by the findings of Ravinderanath etal. (1996).

The high heritability with high genetic advance as per cent overmean (GAM) was observed for seed cotton yield, number of bolls perplant, boll weight, plant height, number of monopodia, ginning out turn, seed index and lint index. This indicates that there was low environmentalinfluence on the expression of these characters and hence one can practiceselection in these traits. Similar findings were reported by Bijapur (1996).
Further, selection would be more effective in intra and inter specificF4 lines which have exhibited higher magnitude of variability, heritabilityand genetic advance as per cent over mean for most of the yield and yieldcomponents compared to stabilized population, later recorded low tomoderate variability for varying characters and only for few traits like seedcotton yield and number of bolls high variability was seen. This was mainlydue to involvement of superior parents for introgression of desirable traits, which release additional variability through recombination.
5.3 Character association and path analysis for variouscomponent traits in F4 lines of color cotton genotypes
Character association or the correlation provides information onnature, magnitude and direction of the association between two traits. Correlation analysis of different traits with yield, which is regarded ashighly complex trait in which the breeder is ultimately interested. Supposetwo favourable characters are associated, selection for one character willautomatically be good enough for other. Grafiaus (1959) reported that theremay not be genes for yield as such, but operate only through its componenttraits.
Genetic correlation between different characters of plant often arisesbecause of either linkage or pleiotropy (Harland, 1939). Hence, the study ofcharacter association through correlation will help in selecting the yieldattributes. The association between two characters can be ascertained byphenotypic correlation which is determined from measurement of twocharacters in a number of individuals of the segregating generations.
Path analysis indicates the cause and effect relationship. It dissectsthe correlation coefficient into direct and indirect effects thereby providingexact picture of the relationship among different characters. Path analysis

can help in pin pointing the exact effect of characters on dependent variableand how the relation can be utilized.
In the present study phenotypic correlation for seed cotton yield andits component traits were studied in intra and inter specific F4 color cottonlines. Correlation coefficients and direct effects of 13 independent variablesagainst seed cotton yield are compared in Table 19, 37 and 39. The directand indirect effects of components traits for seed cotton yield are presentedin Table 20 and Table 38.
In our findings significant positive correlation was observed for thecomponent traits such as bolls per plant, per boll weight and number ofsympodia per plant with seed cotton yield (Fig. 22). At phenotypic level, corresponding direct effect values were positive for the traits mentionedabove with seed cotton yield. This indicated that the true relationships anddirect selection for seed cotton yield through number of bolls and per bollweight in all the populations will be effective as the correlation coefficientbetween number of bolls per plant, per boll weight and their direct effectswere almost equal. The results of direct values for those traits were high asclassified in Phundan Singh and Narayananan, 2009. However, in intrahirsutum lines significant positive correlation was observed for days to firstboll opening and uniformity ratio, corresponding direct effects werenegligibly negative which reveals that indirect effects seem to be the causeof the correlation.
In inter specific population, significant positive correlation wasobserved for lint color with seed cotton yield with negligibly positive directeffect. The relationship between seed cotton yield with its component traitsviz. days to 50 per cent flowering, days to first boll opening and number ofmonopodia per plant was negative at phenotypic level; corresponding directeffects of the traits days to 50 per cent flowering and number of monopodiaper plant were negligibly positive, indicating indirect effects seem to be thecause of negative correlation. However, corresponding direct effects of thetrait days to boll open showed negligibly negative, indicating indirecteffects seem to be the cause of positive correlation (Fig. 23 and 24).
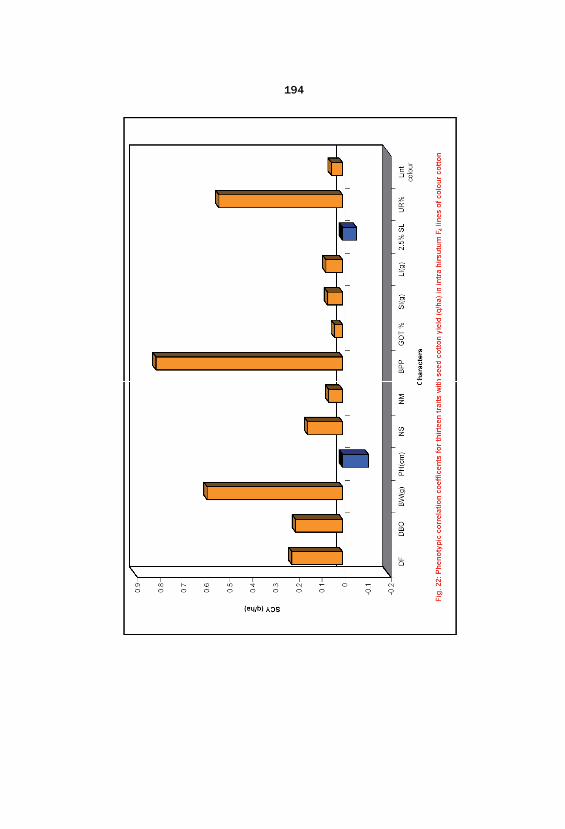
5.4 Intergeneration correlation and regression analysis
In early generation, usually single plant selection is employed toassess the response to selection. Intergeneration correlation coefficient andheritability estimates were done by parent (F3) progeny (F4) regressionmethod.
Intergeneration correlation coefficients give an idea about theeffectiveness of single plant selection and to some extent on nature of geneaction. If the correlation coefficient is high, it would mean high heritableportion and probably the additive component. Preponderance of additivegene action for yield per plant and fiber length leads to effective selectionwhich would help in developing inbreds and varieties, while preponderanceof dominance variable suggests exploitation of heterosis and hybrids maybe developed. Lush, (1945) defined heritability in broad and narrow senseand emphasized that characters are subjected to different amount of non-heritable variation. The broad sense heritability includes genotypic varianceand phenotypic variance, but genotype variance includes both dominanceand additive variance and hence not a reliable index for practicingselections. While narrow sense heritability includes additive variance andphenotypic variance, so additive variance is a reliable index of the totalgenotypic variance, and selections will be effective for forwarding the linesor genotypes to next generation. Hence a comparison was made betweennarrow sense and broad sense heritability.
In the present study in early generations of intra hirsutum F3
progenies, significant correlation was observed for yield per plant and fiberlength. Moderate heritability was observed for yield per plant indicatesboth dominance and additive variance (epistasis) for the trait. High narrowsense heritability was observed for fiber length which indicates that thecharacter is governed by additive variance. Thus, the possibility ofeffective selection for the trait in early segregating generations ofintraspecific crosses will be high.
In inter specific F3 progenies, significant correlation and moderateheritability was observed for fiber length. Indicate the presence of bothdominance and additive variance (epistasis) for the trait.


5.5 Genetics of fiber color in Gossypium hirsutum cottons
Many researchers pointed out that natural fiber color governed byone or two pairs of dominant gene and some thought fiber color governedby multiple genes. The fiber color of F1 fell between those of two parentswhen color fiber parents crossed with white fiber parent and observedsegregation resulting different shades of color and pure white fiber in F2. Thus fiber color was controlled by single dominant gene and expressedincompletely dominant. The traits of natural brown fiber and green fiberwere governed by a non-complete dominant gene. Brown color wasdominant to white and green color was dominant to brown (Qui Xin-mian, 2004).
Reports of Kohel (1985) genetic analysis of fiber color in brownlines. The dark brown lint lines tested were conditioned by alleles at theLc1 locus, except for morrilli brown lint. There was no evidence for morethan one Lc1 allele. Lousiana brown carried a second brown lint locus, theexpression of the allele at the locus was so weak that when isolated it couldnot be identified readily in segregating population. Morrilli brown (Lc1 , Lc3) lint was reported to be conditioned by dark brown lint alleles at onenew locus which was closely linked to a second new locus carrying lightbrown alleles ( Lc5). The dark brown locus was assigned the gene symbolLc3. Four light brown lines carried alleles at the Lc2 locus. Another twolines G233 and TT were reported to be independent of all other brown lintloci and were assigned to gene symbol Lc4. Thus, it is revealing that lintcolor is controlled by more number of alleles with incomplete dominanceand expression.
The results of our study indicated segregation pattern in F2
population developed from two intra hirsutum crosses of dark brown(DDB-106) and medium brown (DMB-102) color lint genotypes with whitelint genotype (Sahana) the presence of gene interaction. The F2 segregationratio 15:1 holds good if only color linted and white linted classes areconsidered irrespective of variation in lint color. It indicates that fiber colordevelopment is controlled by a pair of genes with duplicate epistasis. Thevariation observed for fiber color was not discrete and continuous. Continuous distribution could not be proved statistically using standard

normal distribution curve due to skewness observed for few results in boththe F2 populations. Thus it indicates that brown color of lint is mainlycontrolled by two incompletely dominant genes with some modifiers andintensifiers. For studying such a complex trait we need to handle largepopulation and have different stocks for color variants as studied by Kohel, 1985.
5.6 Molecular characterization of white and color lintedcotton genotypes
The use of molecular markers will help to study the geneticrelationship among white cotton, color cotton genotypes and also amongcolor cotton genotypes. For instance, Ma et al. (2003) clustered 18 coloredcotton lines into three groups on the basis of a common Genetic Similarity(GS) value of 0.700 and showed their genetic base to be narrow. Zhang etal. (2004) analyzed the diversity among 12 colored cotton lines, showingthat some colored lines that were introduced from the same location orbreeding station had high similarity. Dong-Lie et al. (2009) evaluated 61color cotton lines including 40 brown and 21 green showed that differentstrains derived from the offspring of the same combination had geneticsimilarity values of more than 0.800.


In the present molecular study, a preliminary effort was done tostudy the genetic diversity among color cotton and white cotton genotypesusing SSR technology. SSR marker data analysis revealed that fourgenotypes evaluated for 23 SSR primers grouped in three clusters. Thegenetic similarity range obtained between color and white genotypes wasfrom 0.357 to 0.213 indicating these were diverse (Table 43 and Fig. 25).
Future line of work
1. Superior stabilized lines of dark brown color DDB-1054, DDB-1014and DDB-1104 performed better than the check DDB-12. Mediumbrown genotype DMBS-1043 which found significant superior for fiberlength (25.28 mm) over the check DMB-225. These genotypes need tobe tested in replicated trials. The genotypes proven to be superior can beused as a variety and as parents in hybridization programs.
2. Superior F4 lines with yield and good fiber quality in intra specific andinter specific crosses for color variants can be further advanced to knowtheir genetic potentiality.
3. The genetics of fiber color can be reconfirmed in crosses of variouscolor cotton genotypes with white cotton by evaluating more number ofplants in F2 generation and also confirm with molecular markers.
4. Molecular markers can be used to elucidate the variation of white andcolor lint fibers which would help in lint color modification in futurestudies.
6. SUMMARY AND CONCLUSIONS
Cotton is an important cellulosic textile fiber on which half of thetextile industry depends and earns foreign exchange. Cotton lint that isproduced extensively in commercial cultivation all over the world is mostlywhite. In the journey of fiber to fabric, white cotton lint is subjected todyeing and bleaching processes with hazardous chemicals having heavymetals, which harm the human health and pollute the ecosystem. Naturallycolor cotton is having natural pigmentation of lint which does not needdying, which helps to minimize the pollution and provides healthy clothing. Systematic breeding efforts need to be done to harness these eco-friendlycottons for their yield potential and fiber quality.
In the present study, an attempt has been made to assess thevariability present among the stabilized lines, intra hirsutum (HH) and interspecific (HB) F4 lines, using parameters GCV, PCV, heritability, geneticadvance and genetic advance over mean. To understand theinterrelationship among the component traits of seed cotton yield throughcorrelation and path analysis in color cotton genotypes.
To understand the genetics of fiber color in naturally color cotton, two different F2 populations derived from diverse crosses for color werestudied. A preliminary approach of molecular study was done to study thegenetic relatedness among the three color cotton genotypes and one regularwhite cotton genotype using microsatellites specific for boll development. Intergeneration correlation and regression analysis between F3 and F4 intrahirsutum and inter specific populations was performed for yield per plantand fiber length, to know the effectiveness of single plant selection andnature of gene action in two different populations.
The results obtained in the present investigation are summarized as below.
1. The analysis of variance indicated significant variability among thegenotypes of stabilized population and F4 lines of intra hirsutum andinter specific for all the characters studied.
2. Mean performance of the traits studied in different populations of colorcotton indicated relatively higher mean performance was observed in
intra hirsutum F4 compared to stabilized population and inter specific F4
population. Also there is increase in mean value from F3 to F4
generation of intra hirsutum population.
3. Moderate to high variability was observed for most of the yieldattributing traits such as bolls per plant and boll weight in intra hirsutumF4 lines than in stabilized population and inter specific population whichrevealed the presence of high magnitude of genetic variability. However, the traits days to 50 per cent flowering, days to boll open andnumber of sympodia per plant exhibited low genetic variability in all thepopulations handled which indicates narrow genetic base.
4. Broad sense heritability estimates were high for all the charactersstudied in all the populations.
5. Results in all the populations indicated high heritability with high GAMfor number of bolls per plant, boll weight, number of monopodia perplant, ginning out turn, lint index, seed index and yield per plant. Whilehigh heritability coupled with moderate GAM was observed for numberof sympodia.
6. The phenotypic correlation studies revealed, highly significant positiveassociation of seed cotton yield with boll weight, number of sympodiaand bolls per plant and negative correlation was observed for days to 50per cent flowering, days to boll opening and number of monopodia. Particularly in inter specific F4 population lint color showed significantpositive correlation with yield.
7. Path analysis showed high positive direct effect of boll weight, numberof sympodia per plant and bolls per plant on seed cotton yield and henceemphasis may be laid on these characters for improving yield per plant.
8. The intergeneration correlation coefficients showed significant positivecorrelation observed for yield per plant and fiber length in intrahirsutum F3 progenies. However, in inter specific F3 progeniessignificant positive correlation was observed particularly for fiberlength.

9. Narrow sense heritability estimated by intergeneration correlation andparent (F3) progeny (F4) regression analysis indicated moderateheritability for yield per plant intra hirsutum F3 progeny. However, lowheritability was observed for yield per plant in inter specific F3
progenies. High heritability was observed for fiber length in both theintra and inter specific F3 progenies.
10.Inheritance study for fiber color indicated the presence of duplicateepistasis gene interaction.
11.Molecular study using SSR technology exhibited that genetic diversityamong white and color cotton genotypes indicated that they aregenetically diverse.
Conclusions
1. The present investigation clearly indicated that in intra hirsutum F4
exhibited high genetic variability.
2. This research would be more meaningful for advancing the segregatingprogenies for identification of superior segregants derived from intrahirsutum crosses.
3. Nature of gene action can be used for deciding future strategies of thesestudied progenies.
4. For further clarity in inheritance of fiber color large F2 population withdifferent color variants and their progenies could be evaluated.
5. Validation of markers linked to specific traits and color could be usedfor further selection of different color cotton genotypes.

REFERENCES
Abid, S. Y., Subhas, M. and Kharde, M. N., 2013, Association AnalysisFor yield and its component analysis for yield and its componenttraits in F3 and F4 population of Pigeonpea (Cajanus cajan L.)Mill Sp., Mol. Plant Breed., 4(23): 189-195.
Al-Jabouri, H. A., Miller, P. A. and Robinson, H. F., 1958, Genotypic andenvironmental variances and covariances in an upland cottoncross of interspecific origin. Agron. J., 50: 633-636.
Allard, R. W., 1960, Principles of plant breeding- First edition publishedby John Wiley and sons, Inc. p. 250.
Anonymous, 1992, Natural colors of cotton. ICAC Recorder, 10(4): 3-5.
Anonymous, 2010, Natural Color cotton ®, www.naturalcolorcotton.com.
Anonymous, 2012 a, All India Coordinated Cotton Improvement Project(AICCIP). Annu. Rep., 2011-12.
Anonymous, 2012 b, A brief Report on Textile Industry in India, www.asa.in New Delhi, India.
Anonymous, 2013, All India Coordinated Cotton Improvement Project(AICCIP). Ann. Rep., 2013-14.
Anuradha, K. and Raveendran, T. S., 1997, Heterosis in color linted cottonGossypium hirsutum L. J. Indian Soc. Cotton Improv., 22: 20-22.
Apodaca, J. K., 1990, Naturally color cotton: A new niche in the TexasNatural Fibers. BBR Working Paper Series 1990 – 2 Bureauof Business Research, University of Texas at Austin.
Apodaca, J. K., 1993, A brief overview of naturally color and organicallygrown niche cottons, production, marketing, processing, retailingcotton textile process, Beltwide Cotton Conference, pp. 1403-1536.

Aslam, M. M., Baig, M. A., Hassan, I., Qazi, I. A., Malik, M. and SaeedH., 2004, Textile wastewater characterization and reduction of itsCOD and BOD by oxidation. EJEAF Chem., 3: 804-811.
Balasubrahmanyan, R., Mudaliar, V. R. and Santhanam, V., 1950, Inheritance of lint color in cocanadas cotton. Indian J. Genet. Plant Breed., 10:67-71.
Balls, W. L., 1908, Mendelian studies of Egyptian Cotton. J. Agril. Sci., 2:346-379.
Basu, A. K., 1995, Organic cotton and naturally color cotton growingconsumer demand brightens export prospects. The EconomicsTimes, 29th July, 1995.
Bijapur, R. I., 1996, Genetic variability studies in naturally color cotton (G. hirsutum), M.Sc. (Agri.) Thesis, Univ. Agril. Sci., Dharwad.
Bird, J. B., 1985, Huaca Prieta Textiles: In The Preceramic Exavations atthe Huaca Prieta. Chicama Valley. Peru Anthropological Papers62 American Natural History, pp. 101-145.
Brain, S. G., 1950, Heritable relationships of brown lints in cotton. Agron. J., 42: 188-191.
Brown, M. A. and De Vito, S. C., 1993, Predicting Azo Dye Toxicity, Crit. Rev. Environ. Sci. Technol., 23: 249-324.
Cahaner, A. and Hillet, J., 1980, Estimating heritability and geneticcorrelation between traits from F2 and F3 generations of self-fertilizing species: A comparison of three methods. Theor. Appl. Genet., 58: 33-38.
Charles, D. R. and Smith, H. H., 1939, Distinguishing between two typesof gene action in quantitative inheritance. Genet., 24: 34-38.
Cochram, W. G. and Cox, G. M., 1959, Experimental designs 1st Edition, Asian Publishing House, Bombay, pp. 95-145.

Cockerham, C. C., 1963, Estimation of genetic variances. Stat. Genet. Plant Breed., National Academy of Science, Washington, p. 53.
Dabholkar, A. R., 1992, Elements of Biometrical Genetics. ConceptPublishing Company, New Delhi.
Deshpande, L. A., 1996, Naturally color cotton. Paper presented atNational Group Meeting on Color Cotton held at CICR, Nagpuron August 19, 1996.
Dong- Lei Sun, Jun- Ling Sun, Yin-Hua jia, Zhi- Ying Ma, and Xiong-Ming Du, 2009, Genetic Diversity of Color Cotton Analysed bySimple Sequence Repeat Markers, Int. J. Plant Sci., 170 (1): 76-82.
Dutt, Y., Wang, X. D., Zhu, Y. G. and Li, Y. Y., 2003, Breeding for highyield and fiber quality in color cotton. J. Leon published inwww.blackwell-synergy.com by Blackwell Verlag, Berlin, pp. 145-151.
East, E. M., 1916, Studies on seed inheritance in Nicotiana. Genet., 1:164-176
Endrizzi, J. E., Turcotte, E. L. and Kohel, R. J., 1984, Quantative geneticscytology and cytogenetics. In Kohel, R.J. and Lewis, C.F. eds., Cotton (Agronomy Monograph No. 24). Madison: AmericanSociety of Agronomy, pp. 81-120.
Falconer, D. S., 1981, Introduction to quantitative genetics 2nd editionLongman Group Ltd., Longman House, Harrow, England, p. 350.
Fisher, R. A. and Yates, F., 1963, Statistical Tables for Biological, agricultural and Medical Research, Oliver and Boyd, Edinburgh.
Fisher, R. A., Immer, F. R. and Tendino, 1932, The genetical interpretationof statistics of third degree in the study of quantitativeinheritance. Genet., 17: 107-124.
Fletcher, F., 1907, Mendelian heredity in cotton. J. Agril. Sci., 2: 281-282.

Fox, S., 1987, Naturally Color Cotton. Spin-off, December 1987, pp. 48-50.
Grafiaus, J. E., 1959, Correlation and path analysis in barley. Agron. J., 51:551-554.
Guo, J. Y., Wang, Y. Q., Wu, M. G., Zhang, L. M., Liu, F. J., Li, W. B., Liu, H. F., Zhao, T. P. and Sun, Y. R., 2004, Genetic diversityanalysis of brown cotton and green cotton. Yi Chuan., 26:63–68.
Gurel, A. H., Akdemir and Karaday, H. B., 2001. Cultivation possibilitiesof naturally color cottons under Aegean region conditions. Anadolu, 11(1): 56-70.
Gwendolyn, H. and Patricia, C. C., 2005, The ultraviolet protection factorof naturally pigmented cotton. The J. Cotton Sci., 9: 47-55.
Harland, S. C., 1929, The work of the Genetics Department of CottonResearch Station Trinidad. Empire Cotton Grower Rev., 4: 351-352.
Harland, S. C., 1932, The genetics of Gossypium. Bibilography Genet., 9:107-182.
Harland, S. C., 1935, The genetics of cotton XIV. The inheritance of brownlint in New World Cottons. J. Genet., 31: 27-37.
Harland, S. C., 1936, The genetical conception of the species. Biol. Rev., 11: 82-112.
Harland, S.C., 1939, The genetics of cotton. Published by Jonathan Cape, Ltd., pp. 119-130.
Hutchinson, J. B., 1934, The genetics of cotton part X. The inheritance ofleaf shape in Asiatic Gossypium, J. Genet., 28: 437-513.
Hutchinson, J. B., 1940, The application of genetics to plant breeding. Thegenetic interpretation of plant breeding problems. J. Genet., 40:271-282.
Hutchinson, J. B., 1946, The inheritance of brown lint in New WorldCottons. J. Genet., 47: 295-309.
Hutchinson, J. B., 1971, The changing concept in crop plant evolution. Exp. Agril., 7: 273-280.
Hutchinson, J. B. and Silow, R. A., 1939, Gene symbols for use in cottongenetics. J. Hered., 30: 461-464.
Jia, J. Z., 1996, Molecular germplasm diagnostics and molecular markerassisted breeding. Sci. Agric. Sin., 29:1–10.
Johanson, W. L., 1909, Elements Derexatclons Exblichkeitelahre, JenalGustar.
Johnson, H. W., Robinson, H. F. and Comstock, R. E., 1955, Estimates ofgenetic and environmental variability in soybean. Agron. J., 47:314-318.
Ka, Y. F., Chin, M. L. and Ka, M. Ng., 2010, Integrated DesignMethodology for Waste Water Treatment plant, Chem. Engg. Transact., 21: 703-708.
Khadi, B. M. and Kulkarni, V. N., 1996, Retrospect, prospect and problemsof naturally color cottons. The Indian Textile J., 106(11): 72-76.
Khadi, B. M., Manjula Maralappanavar and Sidharth Shirsat 1998, Potentiality of natural color cotton genotypes. Proceedings(Abstract) of First National Plant Breeding Congress, held at, TNAU, Coimbatore, July 1-3, 1998 p.147.
Khadi, B. M., Manjula Maralappanavar and Sidharth Shirsat 1999a, Variability in naturally green color cotton genotypes. Proceedings of at 4th Agricultural Sciences Congress, Jaipur, Feb. 21-24, 1999 Abstract Book, p.120.
Khadi, B. M., Manjula Maralappanavar, Sidhart Shirsat and Bijapur, R. I., 1996b, Status of Naturally Color cotton Research at UAS, Dharwad Paper presented at National Group Meeting on colorcotton on 19th August, 1996 held at CICR, Nagpur.
Khadi, B. M., Sidharth Shirsat and Manjula Maralappanavar, 1999b, Potentiality of naturally brown color genotypes. Proceedings ofat 4th Agricultural Sciences Congress, Jaipur, Feb. 21-24, p. 121.
Khadi, B. M., Sidharth, S. and Manjula, M., 1997, Naturally color cottons-Fiber properties Presented at International Syposium on TropicalCrop Research and Development, held at KAV, Trichur, 9-12Sept. 1997.
Khyadi, S. and Naik, S. D., 1999, Effect of commercial scouring andmercerization on the pigment of Dharwad desi color cotton-1(Gossypium arboreum L.) fabric. The Textile Industry and TradeJ., 37: 9-10.
Kimmel, L. B. and Day, M. P., 2001, New life for an old fiber: attributesand advantages of naturally color cotton. American Asso. Textilesand Color Cotton Rev., 1(10): 32-36.
Kohel, R. J., 1985, Genetic analysis of fiber color variants in cotton. CropSci., 25: 793-797.
Kolodny, G. M., 1989, An improved method for increasing resolution andsensitivity of silver staining of nucleic acid bands in polyacrylamide gels. Ann. Biochem., 138 (1): 66-70.
Kottur, G. L., 1923, Studies on inheritance in cotton I. history of a crossbetween Gossypium herbaceum and G. neglectum. MemoriesDept. Agri. Indian Bot., 12: 71-133.
Krishna Iyer, K. R., Bhama Iyer, P., Sundaramurthy, V. T., Mandloi, K. C. and Meshram, L. D., 1996, Characteristics of Color Cotton andAspects Requiring Improvement, J. Indian Soc. Cotton Improv.,21: 207-213.
Lale Efe, Fatih, K. and Sefer, A. Mustafayer, 2009, An evaluation ofecofriendly naturally color cottons regarding seed cotton yield, yield components and major lint quality traits under conditions ofEast Mediterranean region of Turkey, Pak. J. Biol. Sci., 12(20):1346-1352.
Lale Efe, Sefer, M. A. and Fatih, K., 2010, Agronomic, fiber and seedquality traits of naturally color cottons in East Mediterraneanregion of Turkey, Pak. J. Bot., 42(6): 3865-3873.

Lush, J. L., 1945, Animal breeding Plans, IOWA State College PressEdition, 3: 443
Ma, X. Du, X. M. and Sun, J. L., 2003, SSR fingerprinting analysis on 18colored cotton lines, J. Plant Genet. Resour., 4:305–310.
Mandloi, K. C., Iyer, K. R. K., Koutu, G.K. and Julka, R., 1996, Development of color American upland cottons. J. Indian Soc. Cotton Improv., 21:180-188.
Manjula, S. M., 2005, Cloning and expression of Flavonoid 3’ 5’Hydroxylase pigment gene for developing eco-friendly colorcotton (Gossypium spp.) Ph.D., Thesis, Univ. Agric. Sci., Dharwad, Karnataka (India).
Manjula, S. M., Patil, S. S., Vikas, V. K., Somshekhar, Madhura, C., Shoba, I., Narayananan, K. K., Sanapapamma, J. and Jyoti, V. V., 2013, Genetic improvement and registration of naturallycolor Gossypium hirsutum cotton genotypes suitable for textileindustry. J. Cotton Res. Dev., 27(2): 157-164.
Manjula, S. M., Vikas, V. K., Somshekhar, Madhura, C., Patil, S. S., Narayanan, K., Sanapapamma, K. J. and Jyoti, V. V., 2011, Development of Naturally Color Gossypium hirsutum CottonGenotypes Suitable for Textile Industry through Geneticimprovement. The Fifth World Cotton Research Conference(WCRC-5), India.
Mather, K., 1949, Biometrical genetics. Dover Publication Inc., New York.
Miller, P. A., Williams, J. C., Robinson, H. F. and Comstock, R. R., 1958, Estimates of genotypic and environmental variance andcovariance in upland cotton and their implications in selection. Agron. J., 50: 126-131.
Murty, M. S. S., 2001, Never say dye: The story of colored cotton. Resonance, December, pp. 29-35.
Mustafayev, S., Efe, L., Gokkaya, B. and Alaskerov, K., 1999, Naturallycolor cottons and their future perspectives. In Proceedings of 1st
Symposium on Cotton Production, Fiber Technology and Textile

in Turkish World. (Eds.): M. Oglakcı and B. Cicek, 28September-01 October, 1999, Kahramanmaras-Turkey, Proceedings, pp. 315-324.
Narayananan, S. S. and Sundaram, V., 1996, Basic requirements andbreeding procedures for developing color cottons in India. J. Indian Soc. Cotton Improv., 21:159- 169.
Narayananan, S. S., Singh, V. V., Patil, N. B. and Nagwekar, S. N., 1996, Fiber quality of certain color linted cotton germplasm of G. hirsutum L. J. Indian Soc. Cotton Improv., 21: 170-172.
Nelson Ehle, H., 1909, Kruezung untersuchungen and Hafer and WeizenLunds Univ. Arsster, N. F., Afel, 2: Bd5Nr. 2: 1-22.
Pal, B. P., 1989, Hand Spinning in Tripura. Indian Textile Journal, October, p. 208.
Panse, V. G., 1940, Application of genetics to plant breeding II. Theinheritance of quantitative characters and plant breeding. J. Genet., 40: 283-302.
Panse, V. G., 1957, Genetics of quantitative characters in relation to plantbreeding. Indian J. Genet. Plant Breed., 17: 318-328.
Phillip, J. W., Noelie, R. B., Alfred, D. F., Devron, P. T., Barbara, A. T., Marie-Alice, R., Wilton, R. G., Jr., Vincent, E. J., Lawrance, H., David, D. Mc. and Gary, R. G., 2006, International fiber scienceand technology, Cotton Fiber Chemistry and Technology, ThirdEdition, CRC Press by Taylor and Francis Group.
Phundan, Singh and Narayananan, S. S., 2009, Biometrical Techniques inPlant breeding, Fourth Revised Edition, Kalyani Publishers, NewDelhi, p. 62.
Pinheiro, H. M., Touraud, E. and Thomas, O., 2004, Aromatic Aminesfrom Azo Dye Reduction: Status Review with Emphasis onDirect UV Spectrophotometric Detection in Textile IndustryWastewaters, Dyes and Pigments, 61: 121-139.

Powers, L., 1942, The nature of series environmental variances and theestimation of genetic variances and the geometric means ofcrosses involving species of Lycopersicon. Genet., 27: 561-575.
Powers, L., Locke, L. F. and Gorret, J. C., 1950, Partitioning method ofgenetic analysis applied to quantitative characters of tomatocross. USDA Tech Bull., 998: 56.
Prakash Gangashetty, Shanthakumar, G, Salimath, P. M., Sridevi, O. andAjjappa Soglad, 2011, Estimation of Broad Sense and NarrowSense Heritability in Single and Double Cross F4 and F5
Progenies of Bhendi (Abelomoschus esculentus L.), J. Agric. Res. Technol., 36 (1): 160-163.
Qui Xin-mian, 2004, Research progress and prospects on naturally-coloredcotton. Cotton Sci., 16 (4): 249-254.
Rajashekaran, S., Sundarmurthy, V. T. and Basu, A. K., 1993, Development of Environment Friendly Color Cotton. In:Diversification strategies for textile industry 49th all India textileConference 16-17 Dec., 1993, The Textile AssociationCoimbatore, pp. 54-55.
Ramanathan, V. and Balasubrahamanyan, R., 1933, Lint color in AsiaticCottons. Curr. Sci., 2: 128.
Rathore, P. S., 2005, Techniques and Management of Field CropProduction, Agrobios (India) Publishers Jodhpur.
Ravinderanath, K., Mohiddin, S. B., Reddy, P. R., Balkondappa, D., Reddy, D. T., and Sudhakar, K., 1996, Development of colorcottons and priorities. J. Indian Soc. Cotton Improv. 22: 20-22.
Richmond, T. R., 1944, Inheritance of green and brown lint in uplandcotton. J. American Soc. Agron., 36: 967-975.
Richmond, T. R., 1951, Procedure and methods of cotton breeding withspecial reference to American cultivated species. Adv. Genet., 4:213-245.

Robinson, H. F., Comstock, R. E. and Harvey, P. H., 1949, Estimates ofheritability and degree of dominance in corn. Agron. J., 41: 353-359.
Ryser, U., Meier, H. and Holloway, P. J., 1999, Identification andlocalization of suberin in the cell walls of green cotton fibers. Protoplasma, 117: 196–205.
Silow, R. A., 1944, The inheritance of lint color in Asiatic cottons. J. Genet., 46: 78-115.
Silow, R. A., 1945, Further data on the inheritance of lint color in the oldworld cultivated cotton. J. Hered., 36: 62-64.
Singh, V. V., Narayananan, S. S., Kulmethe, V. M., Anap, G. R. andNagwekar, S. N., 1993, A brief review on color linted cottonsdocumenting selected genotypes of Gossypium hirsutum L. J. Indian Soc. Cotton Improv., 18(2): 91-94.
Singh, V. V., Punit Mohan, Kothandaraman, R. and kulmethe, V. N., 1996, Naturally color upland cotton genetic resources in national cottongene.
Sivasubramanian, S. and Menon, N., 1973, Heterosis and inbreedingdepression in rice. Madras Agric. J., 60: 1139-1144.
Stephens, S. G., 1949, The cytogenetics of speciation in Gossypium. I. Selective elimination of the donor parent genotype ininterspecific backcrosses. Genetics, 34: 627-637.
Stephens, S. G., 1975, A re-examination of the cotton remains fromHuaca Prieta, North Coastal Peru. American Antiquity, 40(4):406-418.
Sundaramurthy, V. T., Padmanabhan, A. R. and Janakiraman, K. P., 1994, Color fastness of naturally pigmented cotton. The IndianTextile J., 105: 126-128.

Veerland, J. M., 1993, Naturally color and organically grown cottons. Anthropological and Historical perspective. Proceedings ofBeltwide Cotton Conferences, pp.1533-1536.
Waghmare, V. N. and Koranne, K. D., 1998, Color Cotton: Present status, problems and future potentials. Indian J. Genet., 58: 1-15.
Ware, J. O., 1932, Inheritance of lint colors in upland cotton. J. AmericanSoc. Agron., 24: 550-562.
Ware, J. O. and Bennedict, L. I., 1962, Color cottons and their economicvalue. J. Hered., 53: 57-85.
Williams, J. G., Kubelik, A. R., Livak, K. J., Rafalski, J. A. and Tingey, S. V., 1990, DNA polymorphisms amplified by arbitrary primersare useful as genetic markers. Nucleic Acids Res., 18: 6531–6535.
Xie, J. Z., Cai, X. H., Liu, F. H., Li, H. L., Cao, Y. C. and Luan, 1998, Application of biotechnology on evaluation of genetic diversityof germplasm. Crops, 9: 71–76.
Xin Mian, Q. and Qui, X. M., 1999, The production and possibilities forexploration of natural color cotton in Zhejiang province, Zhejiang Nogye Kexre No. 1. pp. 31-35.
Zhang, B. X., Wang, G. X. and Zhang, B. X., 2000. A preliminarydiscussion on the development of color cotton in China. ChinaCottons, 27(12): 6-7.
Zhang, M. D., Zhan, X. J. and Zhang, X. L., 2004, Polymorphic analysis onnatural color fiber cotton by RAPD. J. Huazhong Agric. Univ., 23: 606–609.
Zhaoe, P., Donglei, S., Junling, S., Zhongli, Z., Yinhua, J., Baoyin, P., Zhiying, Ma. and Xiongming, Du., 2010, Effects of fiber waxand cellulose content on color cotton fiber quality. Euphytica, 173: 141-149.


Buy your books fast and straightforward online - at one of world’s
fastest growing online book stores! Environmentally sound due to
Print-on-Demand technologies.
Buy your books online at
www.get-morebooks.com
Kaufen Sie Ihre Bücher schnell und unkompliziert online – auf einer
der am schnellsten wachsenden Buchhandelsplattformen weltweit!
Dank Print-On-Demand umwelt- und ressourcenschonend produzi-
ert.
Bücher schneller online kaufen
www.morebooks.deVDM Verlagsservicegesellschaft mbH
Heinrich-Böcking-Str. 6-8 Telefon: +49 681 3720 174 [email protected] - 66121 Saarbrücken Telefax: +49 681 3720 1749 www.vdm-vsg.de