A kinetic approach for the estimation of intracellular ...
260
A kinetic approach for the estimation of intracellular concentrations of nitrosative species in cells challenged by nitric oxide by Vasileios Theodoros Dendroulakis B.Eng., Chemical Engineering (2004) National Technical University of Athens, Athens, Greece Submitted to the Department of Chemical Engineering in Partial Fulfillment of the Requirements for the Degree of DOCTOR OF PHILOSOPHY IN CHEMICAL ENGINEERING at the MASSACHUSETTS INSTITUTE OF TECHNOLOGY June 2013 © 2013 Massachusetts Institute of Technology All rights reserved Signature of Author………………………………………………………………………………… Department of Chemical Engineering May 1 2013 Certified by………………………………………………………………………………………… William M. Deen Carbon P. Dubbs Professor of Chemical Engineering Thesis Supervisor Certified by………………………………………………………………………………………… Peter C. Dedon Underwood-Prescott Professor of Toxicology and Biological Engineering Thesis Supervisor Accepted by……...………………………………………………………………………………… Patrick S. Doyle Singapore Research Professor of Chemical Engineering Chairman, Committee for Graduate Students
-
Upload
khangminh22 -
Category
Documents
-
view
1 -
download
0
Transcript of A kinetic approach for the estimation of intracellular ...

A kinetic approach for the estimation of intracellular concentrations
of nitrosative species in cells challenged by nitric oxide
by
Vasileios Theodoros Dendroulakis
B.Eng., Chemical Engineering (2004)
National Technical University of Athens, Athens, Greece
Submitted to the Department of Chemical Engineering
in Partial Fulfillment of the Requirements for the Degree of
DOCTOR OF PHILOSOPHY IN CHEMICAL ENGINEERING
at the
MASSACHUSETTS INSTITUTE OF TECHNOLOGY
June 2013
© 2013 Massachusetts Institute of Technology
All rights reserved
Signature of Author…………………………………………………………………………………
Department of Chemical Engineering
May 1 2013
Certified by…………………………………………………………………………………………
William M. Deen
Carbon P. Dubbs Professor of Chemical Engineering
Thesis Supervisor
Certified by…………………………………………………………………………………………
Peter C. Dedon
Underwood-Prescott Professor of Toxicology and Biological Engineering
Thesis Supervisor
Accepted by……...…………………………………………………………………………………
Patrick S. Doyle
Singapore Research Professor of Chemical Engineering
Chairman, Committee for Graduate Students

2
A kinetic approach for the estimation of intracellular concentrations
of nitrosative species in cells challenged by nitric oxide
by
Vasileios Theodoros Dendroulakis
Submitted to the Department of Chemical Engineering on May 1 2013
in Partial Fulfillment of the Requirements for the Degree of
Doctor of Philosophy in Chemical Engineering
ABSTRACT
Our understanding of how nitric oxide (NO) contributes to the initiation and progression of
diseases such as cancer may benefit from determining intracellular concentrations of its reactive
derivatives, for which experimental estimates are largely unavailable. During exposure of
inflamed tissues to NO under physiologically relevant levels of oxygen, the potent nitrosative
agent nitrous anhydride (N2O3) is formed, responsible for deamination of nucleobases in various
forms of nucleic acids – yielding xanthine (X) and oxanine (O) from guanine, hypoxanthine (I)
from adenine and uracil (U) from cytosine – and thus playing a multifaceted role in the
pathology of chronic inflammation with implications for altered genetic content. Due to its
reactivity, direct detection of the short-lived nitrosative intermediate is impossible in vitro or in
vivo but, in this study, RNA nucleoside deamination products were chosen as surrogate markers
for N2O3-induced damage based on the wider cellular distribution and solvent accessibility of
RNA compared to genomic DNA. The objective of this thesis was to estimate the steady-state
cytosolic N2O3 concentration by measuring formation rates for deamination lesions in RNA of
mammalian cells stressed by NO. To establish a frame of reference in kinetic terms, purified
total RNA from human lymphoblastoid TK6 cells was exposed to NO and O2 at constant steady-
state levels of 1.7 µM and 210 µM, respectively, in a novel NO-delivery device. Deaminated
purine nucleosides were then quantified using sensitive HPLC-coupled mass spectrometry
methods and analysis of the kinetics of nitrosative deamination of the RNA revealed that adenine
was significantly less reactive than guanine leading to concurrent formation of inosine, oxanine
and xanthosine with rate constants of 3.3 × 10⁴, 4.8 × 10
5 and 1.0 × 10
6 M
-1s
-1, respectively.
After assessing the reliability of the delivery device under conditions approximating exposure of
cell cultures to NO, similar kinetic studies were performed by exposing mammalian TK6 cells to
comparable levels of nitrosative stress. Smaller but measurable increases in deamination
products were detected in total RNA extracted from intact cells which, when applied to
expressions of the rate law in combination with the aforementioned rate constants, provided
estimates for the intracellular N2O3 concentrations ranging between 0.2 and 70 fM. Parallel sets
of experiments showed that a roughly 100-fold drug-induced depletion of glutathione (GSH)
levels in cells prior to being challenged in the delivery device did not significantly alter the
accumulation rate of rI, rX and rO, standing in contrast with previous kinetic analyses predicting
GSH to be a dominant cellular scavenger of N2O3. Further calculations point to a more
complicated protection against NO-induced deamination occurring in the cellular milieu with
multiple scavengers likely to play an important role in mitigating the damaging effects of
nitrosating species in the cytosol.

3
ACKNOWLEDGEMENTS
I would like to thank my thesis advisors, Professors Peter C. Dedon and William M.
Deen, for their generosity, their immense patience, their unending support and their phenomenal
guidance during the years of my graduate studies. They granted me the opportunity of a lifetime
to conduct research here at MIT and be involved in such unique, engaging and multidisciplinary
projects. Interacting with them was always a humbling and educating experience and their
mentorship was indispensable to overcoming the different challenges that would occasionally
arise.
I am also very grateful to my thesis committee members, Professors Kristala L. Jones
Prather and Steve R. Tannenbaum, for sharing their time and knowledge with me, for all the
stimulating discussions we had during our meetings and for reminding me to always use critical
thinking to the best of my ability to deal with the different experimental hurdles that appeared in
the course of my studies.
I would like to thank Professor Gerald N. Wogan for being a great mentor, always
welcoming me to his laboratory as well as for our collaboration on characterizing the operation
of the NO delivery device. I would also like to acknowledge Professor Wan Simon Chan for the
studies we performed together investigating the formation of abasic sites in NO-damaged RNA.
I am indebted to present and past members of the Dedon, Deen and Wogan Groups for
offering me their help, advice and scientific expertise on a great variety of issues and for
cultivating a comforting sense of camaraderie. In particular, I would like to acknowledge the
help of Dr. Michael Demott, Dr. Erin Prestwich and Brandon Russell for taking the time to
proofread parts of this thesis. I cannot forget Olga Parkin, Kristine Recchia Marzilli, Jackie

4
Goodluck-Griffith, Laura Trudel and Dr. Koli Taghizadeh to whom I am forever thankful for
their support and for somehow making everyday problems magically disappear.
Lastly, I want to mention my family in Europe – particularly my father Theodoros, my
mother Elissavet and my brother Dimitrios – and my relatives in the US – Nikos, Pelagia and
Panos – as well as my wife Ewelina for giving me all the inspiration, the love and the
encouragement I needed to complete this journey.
I would like to dedicate this thesis to the victims of the events surrounding the 2013
Boston Marathon.

5
Table of Contents
Chapter 1 ..................................................................................................................................... 17
Introduction and Background ................................................................................................... 17
1.1 Introduction .................................................................................................................... 17
1.2 Inflammation and disease ............................................................................................... 18
1.2.1 General characteristics of inflammation ............................................................. 18
1.2.2 Diseases associated with inflammation – link with cancer ................................. 21
1.3 Cellular components of the inflammatory process ......................................................... 23
1.3.1 Neutrophils .......................................................................................................... 24
1.3.2 Monocytes and macrophages .............................................................................. 26
1.4 Chemistry of inflammation ............................................................................................ 29
1.4.1 Reactive oxygen species...................................................................................... 29
1.4.2 Reactive halogen species ..................................................................................... 30
1.4.3 Reactive nitrogen species .................................................................................... 31
1.5 Damage caused by NO-mediated nitrosative chemistry ................................................ 34
1.5.1 Deamination of nucleic acids .............................................................................. 34
1.5.2 Nitrosation of thiols, biological ions and amino acids ........................................ 38
1.6 Application of kinetic models to understand inflammation chemistry .......................... 39
1.7 Research perspective ...................................................................................................... 41
1.8 References ...................................................................................................................... 44

6
Chapter 2 ..................................................................................................................................... 54
A system for exposing molecules and cells to biologically relevant and accurately controlled
steady-state concentrations of nitric oxide and oxygen ........................................................... 54
2.1 Introduction .................................................................................................................... 54
2.2 Materials and methods ................................................................................................... 56
2.2.1 Fabrication of the delivery system ...................................................................... 56
2.2.2 Dissolved NO and O2 measurement in the apparatus ......................................... 57
2.2.3 Calibration of NO and O2 probes ........................................................................ 61
2.2.4 Exposure of water, RPMI-1640 and DMEM to NO and O2 ............................... 61
2.2.5 Nitrite measurements........................................................................................... 63
2.2.6 NO aqueous oxidation reaction scheme and mass transfer model ...................... 63
2.2.7 Exposing cell cultures in the device .................................................................... 70
2.2.8 Cell viability analysis .......................................................................................... 71
2.3 Results ............................................................................................................................ 71
2.3.1 Validation of NO and O2 delivery in water ......................................................... 71
2.3.2 NO and O2 delivery in cell culture media ........................................................... 76
2.3.3 Exposure of cell cultures to NO and O2 ................................................................... 78
2.4 Discussion ...................................................................................................................... 81
2.5 References ...................................................................................................................... 88

7
Chapter 3 ..................................................................................................................................... 92
Nitric oxide-linked deamination kinetics of nucleic acids and nucleosides ........................... 92
3.1 Introduction .................................................................................................................... 92
3.2 Materials and methods ................................................................................................... 95
3.2.1 Chemicals ............................................................................................................ 95
3.2.2 Human cell cultures for total RNA and genomic DNA extraction ..................... 96
3.2.3 Synthesis of isotopically labeled internal nucleoside standards .......................... 96
3.2.4 NO delivery system ............................................................................................. 97
3.2.5 Exposing nucleosides, RNA, DNA and morpholine to NO ................................ 97
3.2.6 Enzymatic hydrolysis of DNA and RNA ............................................................ 99
3.2.7 HPLC prepurification of DNA and RNA deamination products ...................... 100
3.2.8 LC-MS/MS quantification of deamination products in DNA, RNA and
nucleosides ...................................................................................................................... 100
3.2.9 Detection of morpholine nitrosation ................................................................. 102
3.2.10 Kinetics of oxanine degradation .................................................................... 102
3.2.11 Reaction scheme for NO-induced nitrosation and deamination .................... 102
3.2.12 Kinetics of deamination and nitrosation – estimation of concentrations and rate
constants... ....................................................................................................................... 105
3.3 Results .......................................................................................................................... 109
3.3.1 Degradation of oxanine in the presence of amines ........................................... 109
3.3.2 Determination of N2O3 concentration in the NO-delivery system .................... 116
3.3.3 Deamination kinetics of nucleosides ................................................................. 118
3.3.4 Deamination kinetics in RNA and DNA ........................................................... 120
3.4 Discussion .................................................................................................................... 123
3.4.1 Formation of oxanine ........................................................................................ 126
3.4.2 Conversion of oxanine to xanthine.................................................................... 127
3.4.3 Comparison of deamination rates in nucleosides and nucleic acids ................. 131
3.5 References .................................................................................................................... 140

8
Chapter 4 ................................................................................................................................... 146
Formation of abasic sites in RNA linked to nitrosative stress .............................................. 146
4.1 Introduction .................................................................................................................. 146
4.2 Materials and Methods ................................................................................................. 152
4.2.1 Chemicals .......................................................................................................... 152
4.2.2 Human cell cultures for total RNA extraction .................................................. 152
4.2.3 NO/N2O3 delivery system ................................................................................. 153
4.2.4 Exposing RNA and morpholine to NO ............................................................. 153
4.2.5 Derivatization of RNA with aldehyde reactive probe ....................................... 154
4.2.6 Enzymatic hydrolysis of RNA .......................................................................... 155
4.2.7 LC-MS/MS quantification of derivatized abasic sites in hydrolyzed RNA ...... 155
4.2.8 Detection of morpholine nitrosation ................................................................. 156
4.2.9 Reaction scheme for NO-induced nitrosation and formation of abasic sites .... 156
4.2.10 Kinetics of nitrosation and AP formation – estimation of concentrations and
rate constant .................................................................................................................... 158
4.3 Results .......................................................................................................................... 159
4.3.1 Development of LC-MS/MS method to quantify RNA abasic sites ................. 159
4.3.2 Determination of N2O3 concentration in the NO-delivery system .................... 162
4.3.3 Kinetics of abasic site formation in RNA exposed to nitrosative conditions.... 162
4.4 Discussion .................................................................................................................... 163
4.5 References .................................................................................................................... 170

9
Chapter 5 ................................................................................................................................... 176
Estimation of cytosolic levels of N2O3 in human cells under nitrosative stress ................... 176
5.1 Introduction .................................................................................................................. 176
5.2 Materials and Methods ................................................................................................. 181
5.2.1 Chemicals .......................................................................................................... 181
5.2.2 Human cell culture ............................................................................................ 182
5.2.3 Synthesis of isotopically labeled internal nucleoside standards ........................ 182
5.2.4 NO delivery system ........................................................................................... 183
5.2.5 Exposure of cells to NO .................................................................................... 183
5.2.6 Cell viability analysis ........................................................................................ 184
5.2.7 Glutathione measurement .................................................................................. 185
5.2.8 Enzymatic hydrolysis of cellular RNA ............................................................. 185
5.2.9 HPLC prepurification of RNA deamination products....................................... 186
5.2.10 LC-MS/MS quantification of deamination products in RNA ....................... 187
5.2.11 Expression of N2O3 concentration as a function of cellular species.............. 187
5.2.12 Intracellular N2O3 concentration from in vivo deamination kinetics ............. 191
5.3 Results .......................................................................................................................... 194
5.3.1 Accumulation of deamination products in RNA of NO-exposed cells ............. 194
5.3.2 Effects of NO exposure on levels of GSH and GSSG ...................................... 198
5.3.3 Effect of NO exposure on cell viability ............................................................ 198
5.3.4 Estimation of intracellular N2O3 concentration ................................................. 204
5.4 Discussion .................................................................................................................... 207
5.4.1 Formation of inosine, xanthosine and oxanosine in cellular RNA ................... 208
5.4.2 Determination of intracellular N2O3 concentration using in vivo deamination
kinetics…. ....................................................................................................................... 209
5.4.3 Effect of GSH in scavenging N2O3-induced related damage in the cytosol ..... 211
5.5 References .................................................................................................................... 215

10
Chapter 6 ................................................................................................................................... 224
Conclusions and Future Directions ......................................................................................... 224
6.1 Conclusions .................................................................................................................. 224
6.2 Future Perspective ........................................................................................................ 227
6.3 References .................................................................................................................... 231

11
Appendix A ................................................................................................................................. 233
Parts list and assembly and operation instructions for the peripheral tubing system
complementing the NO-delivery apparatus ................................................................................ 233
A.1 Introduction .................................................................................................................. 233
A.2 Detailed assembly instructions for the peripheral tubing system ................................. 233
A.3 Operation instructions for the peripheral tubing system .............................................. 246
A.3.1 Flow adjustment through the gas lines of the peripheral tubing system ........... 246
A.3.2 Operation procedure of peripheral tubing system connected with delivery
device(s) .......................................................................................................................... 247
A.3.3 Safety with handling the NO gas....................................................................... 248
Appendix B ................................................................................................................................. 250
Parameters for the analysis of nucleobase deamination products ............................................... 250
Appendix C ................................................................................................................................. 259
Parameters for the analysis of abasic sites in RNA .................................................................... 259

12
List of Figures
Figure 1.1. Schematic of the respiratory burst in neutrophils. ..................................................... 25
Figure 1.2. Distribution of tissue-specific macrophages.............................................................. 27
Figure 1.3. Nitrosative deamination of 2-deoxyguanosine. ......................................................... 35
Figure 1.4. Products of nucleobase N-nitrosation in DNA. ......................................................... 37
Figure 2.1. Schematic of probes attached to the NO/O2 delivery apparatus. ............................... 58
Figure 2.2. Schematic of the NO/O2 delivery apparatus modified for adherent cell cultures. .... 59
Figure 2.3. Schematic of the peripheral tubing system providing NO and O2 gas mixtures to the
delivery apparatus. ........................................................................................................................ 60
Figure 2.4. Schematic of the NO/O2 delivery apparatus. ............................................................. 62
Figure 2.5. Time course of measured and predicted bulk liquid NO and O2 concentrations. ..... 73
Figure 2.6. Time course for measured and predicted nitrite (NO2─) formation. .......................... 74
Figure 2.7. Time course of measured and predicted bulk liquid NO and O2 in cell culture media.
....................................................................................................................................................... 77
Figure 2.8. Time course of NO levels in culture media with and without serum. ....................... 79
Figure 2.9. Cell viability in TK6, NH32 and HCT116 cells after exposure to NO. .................... 80
Figure 2.10. Effect of cellular consumption on predicted NO and O2 levels. ............................. 84
Figure 3.1. Degradation kinetics of 2-deoxyoxanosine (dO). .................................................... 111
Figure 3.2. Comparison of oxanosine (rO) and 2-deoxyoxanosine (dO) degradation kinetics. 112
Figure 3.3. Amine-induced ring-opening mechanism depleting oxanine nucleobases. ............. 113
Figure 3.4. Formation of 2-deoxyxanthosine (dX) from 2-deoxyoxanosine (dO) in the presence
of deferoxamine. ......................................................................................................................... 114
Figure 3.5. Formation of 2-deoxyxanthosine (dX) from 2-deoxyoxanosine (dO) in the absence of
amine. .......................................................................................................................................... 115
Figure 3.6. Time course of N-Nitrosomorpholine (NMor) formation from exposure of
Morpholine (Mor) to NO/N2O3. .................................................................................................. 117
Figure 3.7. Time course for the formation of rI, rX and rO from rA and rG exposed to NO and
O2. ............................................................................................................................................... 119
Figure 3.8. Time course for the formation of dI, dX and dO from dA and dG exposed to NO and
O2. ............................................................................................................................................... 122

13
Figure 3.9. Time course for the formation of purine deamination products in RNA and DNA
exposed to NO and O2................................................................................................................. 124
Figure 3.10. Proposed ring closing mechanism that leads to xanthine formation. .................... 129
Figure 3.11. Calculated rate constants for the formation of deamination products in free
nucleosides, RNA and DNA. ...................................................................................................... 132
Figure 3.12. Hydrogen bond formation for guanine and adenine in double stranded DNA. ..... 136
Figure 4.1. Depurination results from nitrosation of the N-7 position in 2-deoxyguanosine. ... 147
Figure 4.2. Reaction between abasic sites and biotinylated aldehyde reactive probe (ARP). ... 151
Figure 4.3. (A) Biotinylated ARP-ribose conjugate (mtotal = 463) with annotated fragments (m1 =
332, m2 = 227) and (B) linear calibration curve for the ARP-ribose standard. .......................... 157
Figure 4.4. (A) MS/MS and (B) high accuracy MS spectrum for the biotinylated ARP-ribose
conjugate. .................................................................................................................................... 160
Figure 4.5. Extracted ion chromatograms of the MRM transition at m/z 464227 derived from
representative samples. ............................................................................................................... 161
Figure 4.6. Time course for the formation of abasic sites in RNA exposed to NO and O2. ...... 164
Figure 5.1. Products of DNA nucleobase deamination. ............................................................. 178
Figure 5.2. Fold-increase in nucleoside deamination products measured in RNA of NO-
challenged TK6 cells compared to argon controls. ..................................................................... 196
Figure 5.3. Formation of nucleobase deamination products rI, rX and rO in RNA extracted from
and BSO-treated and untreated TK6 cells. ................................................................................. 197
Figure 5.4. Schematic of the glutathione reductase recycling assay. ......................................... 199
Figure 5.5. Levels of reduced glutathione monitored during exposure of TK6 cells to NO and
argon. .......................................................................................................................................... 200
Figure 5.6. Levels of oxidized glutathione (GSSG) in cells exposed to NO. ............................ 201
Figure 5.7. Inhibitory mechanism of buthionine sulfoximine (BSO). ....................................... 202
Figure 5.8. Levels of reduced glutathione (GSH) in BSO-treated cells exposed to NO and argon.
..................................................................................................................................................... 203
Figure 5.9. Cell viability determined by the trypan blue exclusion assay at various doses of NO.
..................................................................................................................................................... 205
Figure A.1. Picture of the peripheral tubing system. ................................................................. 240
Figure B.1. Composite chromatograms of ribonucleosides and 2-deoxyribonucleosides. ........ 256

14
Figure B.2. Experimental UV signature of oxanosine. .............................................................. 257
Figure B.3. HPLC resolution of nucleoside mixture derived from hydrolyzed total RNA. ...... 258

15
List of Tables
Table 1.1. Examples of inflammatory disorders. ......................................................................... 20
Table 1.2. Chronic inflammation or infection increases cancer risk. ........................................... 22
Table 1.3. Properties of chemical mediators of inflammation. .................................................... 33
Table 2.1. NO and O2 gas flow parameters for operation of the delivery system with water and
culture media. ................................................................................................................................ 64
Table 2.2. Input parameters for the mass transfer model. ............................................................ 68
Table 2.3. Predicted steady state NO and O2 concentrations in simulated exposures. ................ 69
Table 2.4. Mass transfer coefficients and boundary layer nitrite (NO2─) correction at the NO
supplying tubing for operation of the delivery system with water. .............................................. 75
Table 3.1. Reaction rate constant values. ................................................................................... 106
Table 3.2. Deamination rate constants resulting from the reaction of N2O3 with free nucleosides
at 37 oC. ....................................................................................................................................... 121
Table 3.3. Deamination rate constants derived from the reaction between N2O3 and nucleosides
in RNA and DNA at 37 oC. ......................................................................................................... 125
Table 5.1. Reaction rate constant values. ................................................................................... 192
Table 5.2. Concentrations of NO and cellular scavengers of N2O3 in the cytosol. .................... 193
Table A.1. List of items required for the assembly of the peripheral tubing system. ................ 234
Table A.2. List of items required for the assembly of the delivery apparatus. .......................... 238
Table A.3. Custom specifications for mass flow controllers installed in the peripheral tubing
system. ........................................................................................................................................ 242
Table B.1. Chromatographic conditions for HPLC prepurification of hydrolyzed RNA and DNA
samples. ....................................................................................................................................... 250
Table B.2. Isocratic chromatographic conditions employed for LC-MS/MS quantification of
RNA and DNA deamination products. ....................................................................................... 251
Table B.3. Mass spectrometry parameters for LC-MS/MS quantification of deamination
products in hydrolyzed RNA and DNA samples. ....................................................................... 252
Table B.4. Chromatographic conditions employed for LC-MS/MS quantification of deamination
products in ribonucleosides......................................................................................................... 253
Table B.5. Chromatographic conditions employed for LC-MS/MS quantification of deamination
products in 2-deoxyribonucleosides. .......................................................................................... 254

16
Table B.6. Mass spectrometry parameters for LC-MS/MS quantification of deamination
products in nucleosides. .............................................................................................................. 255
Table C.1. Chromatographic conditions employed for LC-MS/MS quantification of ARP-
derivatized AP sites in hydrolyzed RNA. ................................................................................... 259
Table C.2. Mass spectrometer parameters for LC-MS/MS quantification of ARP-derivatized AP
sites in hydrolyzed RNA. ............................................................................................................ 260

17
Chapter 1
Introduction and Background
1.1 Introduction
The goal of the research presented in this thesis is to estimate the concentration of the
potent and short-lived nitrosating agent nitrous anhydride (N2O3) in the cytosol of mammalian
cells subjected to doses of nitric oxide (NO) similar to those expected in inflamed tissues. A key
player in inflammation, NO is one among several reactive species secreted by inflammatory cells
recruited at sites of injury or infection and aimed at combating the foreign threat. Diffusion of
those chemical mediators of inflammation with subsequent reactions among them or other targets
can affect the surrounding healthy tissue while damaging cellular proteins, lipids, carbohydrates
and nucleic acids. The accumulated lesions can cause cell death or aberrant growth and
accelerate malignant transformation, especially if these pathological conditions are maintained
for extended periods. To determine levels of generated N2O3 – previously estimated only via
mathematical modeling – nucleobase deamination products in RNA were chosen as surrogate
markers for the damage inflicted in the intracellular milieu. This study aims to infer the N2O3
abundance in the cytosol by using the appropriate expression of the rate law while applying
information derived from a) kinetic analyses of NO-induced deamination in solutions of purified
RNA and b) in vivo experiments determining the formation rate of deamination lesions in RNA
extracted from intact cells under constant nitrosative stress, using the same well-defined
exposure vessel in both cases.

18
In this chapter, the general concepts describing the inflammatory process are first
introduced, while associations with different diseases, including cancer, are reviewed next. A
brief overview of specific aspects of neutrophil and macrophage biology that lead to generation
of reactive nitrogen (RNS) and oxygen species (ROS) is addressed, followed by a comprehensive
discussion of the chemistry related to key mediators of inflammation, focusing in more detail on
how NO-mediated nitrosative stress damages cellular targets. The concepts of kinetic models are
then reviewed and their role in the challenge of understanding the chemical microenvironment at
sites of inflammation is illustrated. Finally, a more detailed description of the scope of this
research is presented.
1.2 Inflammation and disease
1.2.1 General characteristics of inflammation
Starting with the biological process responsible for the nitrosative environment examined
in this work, inflammation is the response of vascular tissue to insult or injury, a way for the
body to manage challenges related to pathogenic infections, chemical irritants, physical trauma,
or other damage to host cells. More detailed studies on macroscopic manifestations associated
with inflammation, like redness, swelling and heat [1], have revealed intricate biochemical
processes that involve increased local flux of red and white blood cells, changes in permeability
of blood vessels and lymphatic flow, increased cellular metabolism and diffusion of soluble
agents [2-4], among others. This critical response orchestrated mainly by elements of the innate
immune system [5,6] is viewed as an immediate self-defense mechanism of the organism. The
inflammatory process is a rapid local reaction and remains activated for hours or days until the

19
threat has been removed, with resolution enabling damage repair and local healing with varying
mechanisms in different tissues [7-9].
The inflammatory response triggers cellular processes in components of both innate and
acquired immunity, with those in the former category predominating during the initial stages of
the insult and also being more relevant to the focus of this thesis. Once neutrophils and different
classes of macrophages – discussed in more detail below – infiltrate the microenvironment where
the stimulus is located, foreign bodies, cell debris and infectious agents are targeted by conserved
molecular patterns on their surface [10] and subsequently internalized by the leukocyte cell
membranes into phagosomes [11]. Phagocytosis ensues with degradation of the ingested material
as the final outcome. The inflammatory process is maintained as long as the injurious elements
persist, but is followed by tissue regeneration that involves cell proliferation upon resolution of
the insult [9].
Acute inflammation is a critical facet of the body’s natural defense and essential to the
organism’s survival against opportunistic infections. In certain cases, however, inflammation can
contribute to pathology when it escalates from acute to chronic (lasting for months or years) if
the source of stimulation persists [12]. Prolonged inflammation is believed to be an aberrant
condition that injures host tissues while components of the innate immune system remain
activated [13], occasionally with equally harmful effects compared to the stimulus itself [14].
Besides persistent microbes, chronic inflammation can also occur due to continuous or recurring
damage caused by autoimmune disorders [15] or undegradable foreign bodies. The list of
diseases that are linked to long-term inflammation is constantly expanding, with only a fraction
shown in Table 1.1. With this overview of inflammation, and before examining in more detail

20
Table 1.1. Examples of inflammatory disorders (adapted from [4]).
Disorders in which an important pathogenic role is assigned to inflammation
Alzheimer’s disease
Asthma
Atherosclerosis
Atopic dermatitis
Crohn’s disease
Gout
Multiple sclerosis
Osteoarthritis
Psoriasis
Rheumatoid arthritis
Systemic lupus erythematosus
Type I diabetes mellitus
Ulcerative colitis
Xenograft rejection
Diseases of infectious origin in which inflammation may contribute as much to pathology
as does microbial toxicity
Bacterial dysentery
Cystic fibrosis pneumonitis
Helicobacter pylori gastritis
Hepatitis C
Influenza virus pneumonia
Pneumococcal meningitis
Sepsis syndrome
Tuberculosis
Diseases of diverse origin in which post inflammatory fibrosis is a principal cause of
pathology
Bleomycin-induced pulmonary fibrosis
Idiopathic pulmonary fibrosis
Hepatic cirrhosis (post-viral/alcoholic)
Schistosomiasis

21
the specific cellular and chemical components of the inflammatory response, we will first shed
some light on how these features connect to human disease and specifically cancer.
1.2.2 Diseases associated with inflammation – link with cancer
When the inflammatory response transitions from physiological to pathological, a
number of outcomes that interfere with precisely regulated cell growth and function – including
damage to nucleic acids, one of the key themes of this work – seem to prompt the emergence of
disease. Cancer, for example, appears to be strongly linked to inflammation despite its apparent
heterogeneity. Epidemiological evidence suggests that inflammation contributes significantly to
the development of cancer: 15-25% of all cancers are due to chronic infection or other types of
chronic inflammation [16,17] with both endogenous (e.g. genetic diseases) and exogenous (e.g.
infections, irritants) inducers of inflammation involved, as seen in Table 1.2 [18]. For instance,
inflammatory bowel diseases, like Crohn's and ulcerative colitis, are associated with increased
rates of colon adenocarcinoma [19]. Alcohol-induced chronic pancreatitis as well as hereditary
pancreatitis contribute to a 50-fold increased risk of pancreatic cancer [20]. When it comes to
microbial, viral or parasitic infections, hepatitis B and C lead to inflammation of the liver and are
responsible for the majority of hepatocellular carcinomas worldwide [21], while colonization of
the stomach by Helicobacter pylori causes chronic gastritis and is linked to most gastric cancers
[22]. Clinical studies show the longer the inflammation persists, and the more severe it is, the
higher the risk for carcinogenesis [23]. Another indicator supporting a strong correlation between
inflammation and cancer is that certain anti-inflammatory drugs reduce the risk of developing
various cancers: long-term use of non-steroidal anti-inflammatory drugs (NSAIDS) has been
associated with reduced risk of several types of malignancies [24].

22
Table 1.2. Chronic inflammation or infection increases cancer risk (adapted from [18]).
Disease Type of cancer Increased risk
Auto-inflammatory/non-infectious
Crohn's disease Colon cancer 3
Ulcerative colitis Colon cancer 6
Chronic pancreatitis Pancreatic cancer 2–50
Endometriosis Endometrial cancer 1.4
Hemochromatosis Liver cancer 219
Thyroiditis Thyroid cancer 3
α-1-Anti-trypsin deficiency Liver cancer 20
Acquired
Viral
Hepatitis B Liver cancer 88
Hepatitis C Liver cancer 30
Epstein–Barr virus Hodkin's and Burkitt's lymphoma 4
Bacterial
Helicobacter pylori Gastric cancer 11
Pelvic inflammatory disease Ovarian cancer 3
Chronic prostatitis Prostate cancer 2–3
Parasitic
Schistosoma hematobium Bladder cancer 2–14
Schistosoma japonicum Colon cancer 2–6
Liver fluke Cholangiocarcioma and liver cancer 14
Chemical/physical/metabolic
Alcohol Liver, pancreas, head, neck cancers 2–7
Asbestos Mesothelioma >10
Obesity Multiple cancers 1.3–6.5
Tobacco smoke Lung cancer >10
Gastric reflux, Barrett's esophagus Esophageal cancer 50–100

23
Common to the spectrum of diseases mentioned above, a wide range of locally generated
mediators of inflammation including cytokines, chemokines, free radicals, growth factors,
transcription, and signaling molecules may lead to cellular conditions favorable to tumor
progression. While many of the underlying mechanism(s) and cellular targets are still unknown,
there is a growing body of evidence that reactive oxygen and nitrogen intermediates are
responsible for inducing altered cellular growth and transformation [25,26]. Elevated levels of
these intermediates sustained for extended periods can lead to direct or indirect DNA damage, as
shown in mouse models [27-29], to post-translational modification of various proteins [29], and
to increased metastatic growth potential [30]. In the following sections, more will be revealed on
the spectrum of chemical mediators of inflammation that are generated by specialized
components of the immune system and how some of those species are converted into second-
generation intermediates capable of inducing cellular damage on multiple levels.
1.3 Cellular components of the inflammatory process
Some types of cancer, among other inflammation-associated diseases, are thought to be
caused in part by the harmful conditions localized to certain tissues or organs whether the initial
stimuli are based on infection, genetics or otherwise. The observed patterns are mostly a
consequence of the selectivity that the immune response can exhibit. To not only sequester and
isolate the foreign threat but also to immerse it in an offensive chemical microenvironment
involving RNS and ROS, the inflammatory response engages both branches of the immune
system: a rapid initial response by more non-specific components and a subsequent secondary
phase orchestrated by the adapted components. More relevant to the current work, a key feature
of the early induced innate immunity is the recruitment of phagocytic cells through pathogen-
associated molecular patterns (PAMPS; conserved motifs on pathogens that are not found on

24
higher eukaryotes) binding to pattern-recognition receptors (PRR) [11,31]. The most prominent
of these phagocytic defense cells are neutrophils, eosinophils, monocytes and circulating or
resident macrophages [10], described briefly below.
1.3.1 Neutrophils
Neutrophils (also known as polymorphonuclear leukocytes, PMN) constitute more than
half of the total circulating leukocytes in the body and are considered the most immediate
defense against infectious threats or “non-self” agents entering the host organism [32]. They are
formed in the adult bone marrow from differentiated pluripotent hematopoietic precursor cells
and subsequently released into circulation under tight chemokine-related control. The human
body normally maintains a pool of cells available to be released while the number of neutrophils
drastically increases during infection and other diseases [33].
The role of neutrophils is multifaceted and involves a) release of anti-microbial peptides
and proteins from intracellular granules, b) generation of reactive oxygen species (ROS) in a
process called the respiratory burst and c) receptor-mediated processes during which particles are
internalized by the cell membrane into phagosomes. These strategies are combined to combat
microbes either inside the cytoplasm of neutrophils via internalization or in the extracellular
space [34]. During the respiratory burst, however, an abundance of reactive intermediates
derived mainly from the reduction of molecular oxygen (such as superoxide, hydrogen peroxide,
hydroxyl radicals [35] and hypohalous acids [36]; outlined in Figure 1.1 and reviewed in more
detail shortly) are thought to diffuse into the surrounding normal tissue and promote cytotoxicity,
apoptosis and necrosis in host cells while assisting in eliminating persistent pathogens. These
reactive species have been shown to damage a multitude of biomolecules, which again poses

25
Figure 1.1. Schematic of the respiratory burst in neutrophils.
Microbicidal products arise from specialized organelles in the cytoplasm of the neutrophil (BPI,
bactericidal permeability increasing protein; MMP, matrix metalloproteinase; Phox, phagocyte
oxidase; adapted from [37]).

26
the question of whether exposure to such conditions over prolonged periods could be responsible
for the pathology observed in diseases associated with inflammation.
Neutrophils circulate for only approximately 6-8 h and are among the shortest-lived cells
in the human body [33]. During their lifetime they undergo intense transcriptional activity that
results in the synthesis of various signaling molecules to attract other components of the non-
specific immune system [38]. The immediate recruitment of neutrophils at inflammatory sites is
followed by local proliferation of monocytes/macrophages, whose function is described below,
as the insult persists [37].
1.3.2 Monocytes and macrophages
Monocytes – the precursors of macrophages – are derived from hematopoietic cells in the
bone marrow, reside undifferentiated in reservoirs predominantly located at the spleen [39] and
can be mobilized by signals originating from tissues responding to injury or infection. Released
chemokines and cytokines from sites of inflammation activate the differentiation of monocytes to
form macrophages [40] and modulate their transport through the endothelium (extravasation) to
locate the source of the threat. Alternatively, circulating monocytes eventually enter lymphoid
and nonlymphoid tissue where they reside for longer periods and are believed to be involved in
homeostasis [41]. Macrophages are equipped with a broad range of pathogen-recognition
receptors that both assist in phagocytosis and induce synthesis of inflammatory cytokines [42],
similar to those in neutrophils.
Macrophages are divided into subpopulations with specialized tissue-resident cells found
in the bone, lung, gut, liver and other organs (depicted in Figure 1.2). Macrophages from lymph
nodes, for example, clear viruses and initiate antiviral humoral immune responses [43] while a

27
Figure 1.2. Distribution of tissue-specific macrophages (adapted from [44]).

28
subset of macrophages patrolling the brain and eyes are believed to ingest foreign particles and
recruit additional circulating macrophages during infection or injury [44].
The apparent heterogeneity in localization and function gives the non-specific immune
system a degree of flexibility when responding to a variety of injurious stimuli and allows
macrophages to adopt different roles. Studies have shown that macrophages switch from one
functional phenotype to another in response to the transient signals of the local
microenvironment [45]. Once the source of insult is located, macrophage activation follows the
initial monocyte recruitment to affected sites and subsequent macrophage proliferation is
initiated in the presence of interleukin IL-4 (mediated by T helper 2 lymphocytes) [46].
Interleukin IL-12 induced production of interferon-γ (IFNγ) by T helper 1 cells also stimulates
macrophages by signaling the appropriate cellular processes to initiate phagocytosis and
secretion of a battery of reactive species [47]. Following the molecular signals linked to a
physical insult or infection, activated macrophages produce inflammatory mediators such as
interleukin IL-1, tumor necrosis factor (TNF), free gaseous radicals and other oxidants [48,49].
In particular, the synthesized reactive oxygen and nitrogen intermediates – such as nitric oxide
(NO) and superoxide described in detail below – are believed to be highly toxic for
microorganisms but also disruptive to host cells adjacent to affected sites, potentially leading to
collateral tissue damage if the insult persists over prolonged periods [50]. Along with the
epithelial cells of the affected tissue, the cellular components of inflammation are responsible for
generation of reactive oxygen, halogen and nitrogen species that cause mutation and cell death as
part of the pathology of inflammation-associated disease.

29
1.4 Chemistry of inflammation
Parsing out the role of small reactive molecules from the complex array of mediators of
immunity secreted by differentiated leukocytes and examining their effects on human cells will
increase our understanding of the inflammatory response. The current work aims at contributing
toward that process. As already discussed, inflammation induces various types of immune cells
which subsequently up-regulate oxidant-generating enzymes to produce a battery of reactive
agents: reactive oxygen, halogen and nitrogen species are among the most prominent molecules
formed endogenously to combat invading pathogens and complement phagocytosis. Nitric oxide,
specifically, plays a key role in the formation of secondary reactive nitrogen intermediates,
which when combined with other species, may have a synergistic bactericidal ability by
attacking an array of targets in vivo.
1.4.1 Reactive oxygen species
During the respiratory (or oxidative) burst of neutrophils and macrophages, an increased
consumption of oxygen is observed mostly in the vicinity of the phagocytic cell membranes,
where electrons from NADPH are transferred to molecular oxygen with the help of NADPH-
oxidase, rapidly producing superoxide anion (O2). The formed O2
is then metabolized to the less
toxic hydrogen peroxide (H2O2) by superoxide dismutase (SOD) [35]. H2O2 is further broken
down to H2O and O2 by catalase enzymes or, alternatively, reacts with divalent metals (such as
Fe+2
) to form highly reactive hydroxyl radicals (HO) and HO- as predicted by Fenton chemistry
[51]. In terms of reactivity, O2 is not a strong oxidant and reacts slowly with biological targets
compared to its rate of decay in the presence of SOD (the concomitantly formed H2O2 is also a
relatively weak oxidant [52]), whereas HO is a non-selective extremely powerful oxidant [53]

30
that attacks most molecules at diffusion-controlled rates [54]. Singlet oxygen (1O2), another
excited form of molecular oxygen, is thought to be generated in stimulated phagocytes during the
respiratory burst and reacts with a wide range of biological targets including DNA, RNA,
proteins, and lipids [55].
1.4.2 Reactive halogen species
High levels of myeloperoxidase (MPO) in the primary granules of neutrophils are
responsible for enzymatically converting H2O2 – released during the respiratory burst – to
hypohalous acid in the presence of halide anions. With Cl- being the most abundant anion,
hypoclorous acid is thought to be the main product formed, however, other mammalian
peroxidases can oxidize bromide (e.g. in eosinophils) and iodide in a similar manner [56,57]. A
fraction of the produced hypochlorous acid (HOCl) reacts again with Cl- to form Cl2 gas [58].
The reactive oxidant HOCl has antiseptic properties shown to deplete energy transduction in
bacteria [59], induce apoptosis in human endothelial cells [60], and damage host proteins at sites
of inflammation in vivo [61]. In addition, activated human neutrophils have been shown to
convert nitrite (NO2-) into the inflammatory oxidant NO2Cl through an MPO-dependent
pathway, which suggests that NO2- (the end-product of NO oxidation in aqueous solutions,
discussed shortly) may also play a role in phagocyte-mediated oxidative reactions at sites of
inflammation [62]. In vivo oxidation or halogenation, resulting to the aforementioned species
may affect a spectrum of cellular components including nucleic acids, carbohydrates and
polyunsaturated fatty acids [63].

31
1.4.3 Reactive nitrogen species
Endogenous nitrate and nitrite production, extensively investigated in the early 1980’s by
Tannenbaum and coworkers [64], were associated to an intermediate derived from activated
macrophages [65] which was shown to be NO [66,67]. At the same time NO was also
independently linked to vascular smooth muscle relaxation [68] and found to be generated by a
family of enzymes called nitric oxide synthases (NOS) using L-arginine and O2 as substrates,
with NADPH as an electron donor and heme, FMN, FAD and tetrahydrobiopterin (H4B) as
cofactors [69], generating L-citrulline as a final product. At least three isoforms of NOS have
been identified: endothelial (eNOS), neuronal (nNOS) and inducible (iNOS), the first two being
soluble and the latter membrane-bound [70]. The endothelial and neuronal isoforms are generally
considered to be constitutively expressed in cells (although there is recent evidence of another
level of dynamic regulation in eNOS [71]), whereas the inducible type is activated by cytokines
or bacterial infection in a number of cells types, including endothelium, hepatocytes and
phagocytes [72], of particular interest with respect to inflammation [73]. The presence of NOS in
a spectrum of tissues supports the argument that NO is an important messenger molecule that
regulates vasodilation in multiple organs (e.g. kidneys, intestines) and a physiological
neurotransmitter [74], while dysregulation of NO signaling may be associated with several
disease states [75,76].
Besides its critical involvement in numerous signaling pathways, NO is also very
important due to its reactions with other free radicals, halides and transition metals – among
others – and it is the generation of corresponding reactive nitrogen species that is most relevant
to the work presented here. Reactions of NO expected to occur in vivo include the formation of
nitroso adducts with the metal centers of proteins such as Fe+2
in hemoglobin [74], with various

32
organic radicals [77], and oxygen to form the oxidant nitrogen dioxide (NO2) which in turn
reacts with NO to producing the nitrosative agent nitrous anhydride (N2O3) [78] to which we will
refer repeatedly in the following chapters. NO2 is thought to react with many classes of
molecules such as lipids, significant antioxidants like ascorbic acid and α-tocopherol [79], and
glutathione and urate [80]. On the other hand, evidence suggests that N2O3 is the predominant
nitrosating species in an aqueous environment [81] where it can readily nitrosate amines [82] and
thiols [83], while also being responsible for nucleobase deamination [70,84]; in the absence of
any other species N2O3 is hydrolyzed to nitrite [85]. When NO is produced simultaneously with
O2 (e.g. at the primary granules of neutrophils [62,86]), the two radicals can recombine at a near
diffusion-controlled rate to produce peroxinitrite (ONOO-) [87]. In equilibrium with its
protonated form peroxynitrous acid (ONOOH; pKa = 6.8), ONOO- reacts with CO2 to form
nitrosoperoxycarbonate ONOOCO2- [88] which then decomposes into the potent oxidant
carbonate radical (CO3) and NO2 [89]. Conversely, ONOOH can undergo homolysis to HO and
NO2 or react directly with organic moieties [90]. By attacking biomolecules in vivo, any of the
aforementioned strong oxidants is capable of giving rise to a new radical which in turn can react
with NO2 resulting in a range of nitration products [91], a possibility supported by experimental
findings of inflammation-associated protein damage [92]. Table 1.3 summarizes some of the
chemical mediators of inflammation discussed above and lists a fraction of the molecular targets
that each species may disrupt in vivo.
The reactions mentioned above – i.e. oxidation, nitration, halogenation and nitrosation –
all leading to multiple possible products, illustrate the chemical complexity inherently linked to
the inflammatory response and raises the question of which damaging pathway, if any,
predominates in vivo and forces cells towards a state of unregulated proliferation. Focusing on a

33
Table 1.3. Properties of chemical mediators of inflammation (adapted from [29]).
species reactivity Reaction cellular targets
HO oxidant OH• + H
+ + e
− → H2O
most protein functional
groups, alkenes
CO3 oxidant CO3
•− + H
+ + e
− → HCO3
−
most protein functional
groups, nucleic acids
HOCl oxidant 2HOCl + 2H+ + 2e
− → Cl2 + 2H2O
thiol, amines, nucleic
acids (guanine), alkenes
HOBr oxidant 2HOBr + 2H+ + 2e
− → Br2 + 2H2O
thiol, amines, nucleic
acids (guanine), alkenes
ONOO- oxidant ONOO
− + 2H
+ + e
− → NO2
• + H2O
sulfydryl groups,
metalloproteins
NO2 oxidant NO2• + e
− → NO2
−
sulfydryl groups,
phenols, alkenes
N2O3 electrophile Nuc-H + N2O3 → Nuc-NO + NO2− + H
+
thiols, amines, nucleic
acids

34
type of chemistry and systematically studying its effects in biological systems under controlled
conditions is the most straightforward approach to elucidate its relative significance in
inflammation-related diseases, such as cancer. Based on that strategy, the goal of the present
work is to examine aspects of NO-mediated nitrosation and deamination (last entry in Table 1.3)
occurring in vivo. A brief review of our current understanding of how N2O3 damages biological
targets is presented next.
1.5 Damage caused by NO-mediated nitrosative chemistry
1.5.1 Deamination of nucleic acids
The multitude of products derived from reactions in which NO is involved likely affect
several aspects of the cell architecture however, the most significant in terms of cancer
development is damage to nucleic acids and alteration of genetic information, an idea explored
extensively in the current work. Soon after its discovery as a free radical secreted from
phagocytic cells, a plethora of evidence showed the nitrosating effect that NO can have on
nucleic acids (in the presence of O2) and the associated mutagenic potential [93,94]. Its
genotoxicity was observed when human cells were exposed to NO [84,95] while subsequent
analysis demonstrated that the nitrosative effects are mediated by the formed intermediate N2O3
[85]. In detail, N-nitrosation of a primary amine by N2O3 creates a nitrosamine, which in an
aqueous environment is quickly transformed to a diazonium ion intermediate (Figure 1.3) and
that ion is then promptly hydrolyzed [96]. The end result is the net replacement of the attacked
amino group by an oxygen.

35
Figure 1.3. Nitrosative deamination of 2-deoxyguanosine (adapted from [97]).
The nitrosation-mediated replacement of the exocyclic amino group with a carbonyl oxygen is
demonstrated following the intermediate steps of the formation of 2-deoxyxanthosine from 2-
deoxyguanosine.

36
Any base with an exocyclic amino group can undergo deamination as a result of its
reaction with N2O3. Hence, nitrosation of exocyclic amines in DNA or RNA nucleobases result
in the conversion of guanine to xanthine and oxanine, adenine to hypoxanthine, cytosine to uracil
(or methylcytosine to thymine), as shown in Figure 1.4. Abasic sites are also thought to be direct
products of nitrosation, in particular when N2O3 attacks secondary amine groups on nucleobases
(e.g. N7 position of guanine, N
7 or N
3 position of adenine) and forms a cationic base that is
proposed to destabilize the glycosidic bond and lead to depurination [98]. The aforementioned
lesions are of major interest in this thesis and therefore their rate of formation in nucleic acids –
both in purified solutions and in cells – are explored in the next chapters.
The observation of another type of damage – single strand breaks in cellular DNA
following exposure to NO – was initially attributed to depurination of deoxyxanthosine (dX)
[95], but from subsequent analysis demonstrating the relative stability of dX in physiological pH
[99] it was deduced that a different type of chemistry was likely responsible for the detected
breaks (e.g. ONOO- oxidation). Cross-linking of adjacent guanines was also attributed to the
presence of N2O3 forming during NO exposures [100].
Formation of deamination products was observed when purified DNA was exposed to
constant steady-state levels of N2O3 in vitro [101]. However, much smaller increases of dI, dX,
and dU were measured in the genomic DNA of human cells that were subjected to similar
conditions [102]. The protective intracellular environment, including nuclear histones protecting
DNA and glutathione (GSH) scavenging N2O3 (as will be discussed shortly), coupled with
efficient DNA repair were thought to be some of the reasons why deamination appeared to have
a modest mutagenic effect in vivo, a conclusion also supported by results in mouse models of

37
Figure 1.4. Products of nucleobase N-nitrosation in DNA (adapted from [51]).

38
NO overproduction [28]. It is likely that N2O3-mediated deamination occurring at sites of
inflammation may contribute to carcinogenic processes in more ways than solely altering the
genomic content in cells, a possibility supported by findings in the recent work by Dedon and
collaborators in which higher levels of deamination products were detected in RNA compared to
DNA [103]. Information in coding or non-coding RNA altered by nitrosative deamination could
have severe implications for protein transcription and translation (e.g. cell cycle checkpoint,
differentiation and other key processes in controlled growth) while disruption of small regulatory
RNA species in many pathways could lead to cancerous phenotypes and other diseases [104].
Nitrosative chemistry affecting nucleobases in small signaling RNAs could lead to dysregulated
cellular growth, constituting one of the underlying factors that accelerate the metastatic activity
of transformed cells [105] and reinforcing the emerging link between inflammation and tumor
progression.
1.5.2 Nitrosation of thiols, biological ions and amino acids
Other nucleophiles that react with N2O3, thus potentially competing with amines as
nitrosation targets in vivo, include glutathione and sulfydryl groups of various proteins [83]
which give rise to S-nitrosothiols. S-nitrosation as a post translational protein modification
process has been implicated in controlling O2 delivery to tissues, modulating the function or
activity of transcription factors, enzymes, membrane receptors and ion channels [106]. Another
mechanism that is gaining increasingly more attention and may be affecting the steady-state
cellular levels of nitrosated thiols is the intermolecular transfer of the NO group from one protein
to another or from nitrosated glutathione to proteins (i.e. transnitrosation reactions) believed to
be linked to signal transduction cascades in cells [107]. In addition to thiols, a number of
inorganic anions such as chloride, phosphate [82]and bicarbonate [108] as well as the potent

39
antioxidant ascorbate [109] seem to react fast with N2O3, effectively acting as scavengers and
reducing the rate with which N2O3 attacks other targets in solution. The same can be stated for
certain amino acids with nucleophilic residues – tryptophan being the most thoroughly
investigated among those – that participate in N-nitrosation pathways whose in vivo significance
is not yet fully understood [110,111]. The scavenging effect of the aforementioned species has
been quantified in terms of nitrosation rate constants which can be helpful in predicting the fate
of N2O3 (among other reactive nitrogen species) in vivo by simulating the cellular or extracellular
environment via kinetic models, as addressed below.
1.6 Application of kinetic models to understand inflammation chemistry
The spectrum of nitrosative damage resulting from the generation of NO and N2O3
illustrates the complexity of the inflammation-associated chemistry and the biological
implications linked to some of the most abundant products (e.g. lesions in nucleic acids). Part of
the ongoing challenge is to determine the extent to which reaction rates observed in vitro or in
precisely controlled biological systems represent the processes occurring at inflamed tissues,
which is one of the major goals addressed in this thesis. A critical step in elucidating the role of
chemical stress in disease and carcinogenesis is isolating each underlying mechanism and
examining it individually. However, a frequent problem in this approach is that the
concentrations of most reactive species are too low and their half-lives too short to directly
measure in cells or culture media. The analysis becomes even more complicated when we
consider the microenvironment at sites of inflammation in animal models (or humans) which is
technically impossible to assess, thus making the process of validating our predictions very
challenging.

40
The difficulty in making direct measurements motivated the development of
mathematical models that take into account what is already known about the kinetic rates of the
anticipated reactions. To that end, Deen and coworkers have published detailed models
describing the spatial distributions of reactive nitrogen species generated by macrophages
attached to carrier beads in suspension [112], or by macrophages grown in plates [113,114].
Briefly, the NO concentration in the medium surrounding the cells was predicted to be constant
whereas O2 fluxes (from estimated rates of production in the cytosol and mitochondria,
competing with SOD scavenging) led to a highly localized extracellular formation of ONOO-
affecting only the immediate vicinity of RNS secreting cells. Further modeling showed that rates
of diffusion are fast enough to cause the intracellular concentrations for NO, O2 and CO2 to each
closely approximate those in the adjacent extracellular fluid: the levels of those gases within the
cell are assumed to be no different than the levels imposed by the surroundings [115]. In an
attempt to assess the microenvironment expected to form at sites of inflammation, models were
developed to simulate inflamed colonic crypts [116] taking into consideration spatial distribution
and reactive substrates for the various RNS and ROS. Predictions from that model indicated that
NO was expected to reach a maximum level of 0.3 μM which was comparable to the 1 μM value
derived from previous kinetic studies simulating the environment in the vicinity of activated
macrophage cultures [117].
After estimating levels for NO and its derivatives at the vicinity of activated
macrophages, the next challenge was to determine intracellular levels of inflammatory mediators
that develop in cells affected by nitrosative stress. To that end, comprehensive models were
proposed to investigate NO-related oxidation, nitrosation, and nitration pathways occurring in
the cytosol, describing both time-dependent responses to the sudden introduction of key reactants

41
[118] and processes in equilibrium, where rates of formation and consumption of various
chemical species are in continuous balance [80]. The most recent model predicted steady-state
concentrations for RNS including the effects of cellular antioxidants (e.g. glutathione, ascorbate),
amino acids, proteins and lipids [80]. A two-phase analysis was considered (representing the
cytosol and the cell membrane), although in retrospect membrane reactions were found to have a
negligible effect on RNS concentrations. In addition, Deen and coworkers were the first to report
order-of-magnitude estimates for the intracellular concentration of N2O3 (~1-60 fM) in algebraic
expressions. Such predictions played an important role in the work presented here and can be
ultimately tested by measuring levels of stable end products relevant to the examined chemistry,
validating or possibly expanding the network of significant reactions on which the intracellular
kinetic model is based.
1.7 Research perspective
The overarching objective of this thesis is to use nucleobase deamination products in
RNA as surrogates for the short-lived N2O3 and employ kinetic information from in vitro and in
vivo nitrosation studies to estimate intracellular levels of N2O3 forming in human cells
challenged by NO. The very low levels of N2O3 expected to form render its direct quantification
in NO-stressed cells nearly impossible, thus measuring the nitrosative damage it causes by its
interaction with other components in the cytosol is the easiest approach to assess its abundance
in biological systems.
The objective in Chapter 2 is to investigate the performance of a silicone tubing-based
system of NO delivery, initially developed by Wang and Deen [119], that is essential in
providing the necessary kinetic profiles for deamination of nucleic acids addressed in the

42
following chapters. Dissolved NO concentrations were measured to determine the effect of cell
culture media components on the function of the device and whether levels of NO can be
predicted with confidence using an established mass transfer model [119] when more
complicated fluids – rather than simple biomolecule solutions – are treated under the same
conditions.
The main aim in Chapter 3 is to quantify the rate at which purine nucleobases in purified
RNA react with N2O3 under controlled experimental conditions approximating those expected to
form at sites of inflammation. Using the delivery device mentioned above, deamination rate
constants were calculated based on a second order reaction between purines and N2O3; the
resulting values were compared to reveal differences in susceptibility towards nitrosation from
nucleobases in RNA, genomic DNA and free nucleosides. In addition, rigorous measures were
taken to avoid artifacts while examining the formation of oxanine as a naturally occurring
deamination product in nucleic acids.
Chapter 4 addresses the questions of whether N2O3-mediated RNA damage leads to
depurination (i.e. formation of abasic sites) in addition to the observed rise in deamination
products examined in Chapter 3 and how the rates of the two processes compare in magnitude.
The goal in Chapter 5 is to study the rate of RNA deamination in human cells under
nitrosative stress and combine the resulting kinetics with information derived in previous
chapters to estimate the apparent N2O3 intracellular concentration. The controlled and predictable
conditions of the NO-delivery system (Chapter 2) were employed to expose TK6 cell cultures to
increasing NO doses and measure the accumulation of deamination products in RNA extracted
from intact treated cells. The rates observed in NO-challenged cells and the rate constants

43
determined from in vitro deamination experiments (Chapter 3) were applied to an expression of
the rate law to calculate the effective total intracellular N2O3 concentration to which cell
constituents are exposed in the cytoplasm and compare the experimentally-derived value with
prior mathematical model predictions.
Finally, in Chapter 6, we conclude by summarizing the information gained from
investigating the kinetics of nitrosative RNA damage and propose future experiments that will
improve our insight on the significance of those reactions in vivo.
The results of Chapter 2 have been published [120] and two manuscripts are currently in
preparation from the work presented in Chapters 3 and 5.

44
1.8 References
[1] Rather, L. (1971) Disturbance of function (functio laesa): the legendary fifth cardinal
sign of inflammation, added by Galen to the four cardinal signs of Celsus. Bull. N.Y.
Acad. Med. 47: 303-322.
[2] Ferrero-Miliani, L., Nielsen, O. H., Andersen, P. S., and Girardin, S. E. (2007) Chronic
inflammation: importance of NOD2 and NALP3 in interleukin-1ß generation. Clin. Exp.
Immunol. 147: 227-235.
[3] Huggenberger, R., Siddiqui, S. S., Brander, D., Ullmann, S., Zimmermann, K.,
Antsiferova, M., Werner, S., Alitalo, K., and Detmar, M. (2011) An important role of
lymphatic vessel activation in limiting acute inflammation. Blood. 117: 4667-4678.
[4] Nathan, C. (2002) Points of control in inflammation. Nature. 420: 846-852.
[5] Barton, G. M. (2008) A calculated response: control of inflammation by the innate
immune system. J. Clin. Invest. 118: 413-420.
[6] Medzhitov, R. (2007) Recognition of microorganisms and activation of the immune
response. Nature. 449: 819-826.
[7] Eming, S. A., Krieg, T., and Davidson, J. M. (2007) Inflammation in wound repair:
Molecular and cellular mechanisms. J. Invest. Dermatol. 127: 514-525.
[8] Lu, H., Huang, D., Saederup, N., Charo, I. F., Ransohoff, R. M., and Zhou, L. (2010)
Macrophages recruited via CCR2 produce insulin-like growth factor-1 to repair acute
skeletal muscle injury. F.A.S.E.B. J. 25: 358-369.
[9] Serhan, C. N. and Savill, J. (2005) Resolution of inflammation: the beginning programs
the end. Nat. Immunol. 6: 1191-1197.
[10] Luster, A. D., Alon, R., and von Andrian, U. H. (2005) Immune cell migration in
inflammation: present and future therapeutic targets. Nat. Immunol. 6: 1182-1190.
[11] Aderem, A. (2003) Phagocytosis and the inflammatory response. J. Infect. Dis. 187:
S340-S345.
[12] Buckley, C. D., Pilling, D., Lord, J. M., Akbar, A. N., Scheel-Toellner, D., and Salmon,
M. (2001) Fibroblasts regulate the switch from acute resolving to chronic persistent
inflammation. Trends Immunol. 22: 199-204.
[13] Medzhitov, R. (2008) Origin and physiological roles of inflammation. Nature. 454: 428-
435.
[14] Karin, M., Lawrence, T., and Nizet, V. (2006) Innate immunity gone awry: Linking
microbial infections to chronic inflammation and cancer. Cell. 124: 823-835.

45
[15] Walsh, N. C., Crotti, T. N., Goldring, S. R., and Gravallese, E. M. (2005) Rheumatic
diseases: the effects of inflammation on bone. Immunol. Rev. 208: 228-251.
[16] Hussain, S. P. and Harris, C. C. (2007) Inflammation and cancer: An ancient link with
novel potentials. Int. J. Cancer. 121: 2373-2380.
[17] Coussens, L. M. and Werb, Z. (2002) Inflammation and cancer. Nature. 420: 860-867.
[18] Schetter, A. J., Heegaard, N. H. H., and Harris, C. C. (2010) Inflammation and cancer:
interweaving microRNA, free radical, cytokine and p53 pathways. Carcinogenesis. 31:
37-49.
[19] Gillen, C. D., Walmsley, R. S., Prior, P., Andrews, H. A., and Allan, R. N. (1994)
Ulcerative colitis and Crohn's disease: a comparison of the colorectal cancer risk in
extensive colitis. Gut. 35: 1590-1592.
[20] Lowenfels, A. B., Maisonneuve, P., DiMagno, E. P., Elitsur, Y., Gates, L. K., Perrault, J.,
and Whitcomb, D. C. (1997) Hereditary pancreatitis and the risk of pancreatic cancer. J.
Natl. Cancer Inst. 89: 442-446.
[21] Tsukuma, H., Hiyama, T., Tanaka, S., Nakao, M., Yabuuchi, T., Kitamura, T., Nakanishi,
K., Fujimoto, I., Inoue, A., Yamazaki, H., and Kawashima, T. (1993) Risk factors for
hepatocellular carcinoma among patients with chronic liver disease. N. Engl. J. Med. 328:
1797-1801.
[22] Parsonnet, J., Friedman, G. D., Vandersteen, D. P., Chang, Y., Vogelman, J. H.,
Orentreich, N., and Sibley, R. K. (1991) Helicobacter pylori infection and the risk of
gastric carcinoma. N. Engl. J. Med. 325: 1127-1131.
[23] Rutter, M., Saunders, B., Wilkinson, K., Rumbles, S., Schofield, G., Kamm, M.,
Williams, C., Price, A., Talbot, I., and Forbes, A. (2004) Severity of inflammation is a
risk factor for colorectal neoplasia in ulcerative colitis. Gastroenterology. 126: 451-459.
[24] Cuzick, J., Otto, F., Baron, J. A., Brown, P. H., Burn, J., Greenwald, P., Jankowski, J., La
Vecchia, C., Meyskens, F., Senn, H. J., and Thun, M. (2009) Aspirin and non-steroidal
anti-inflammatory drugs for cancer prevention: an international consensus statement.
Lancet Oncol. 10: 501-507.
[25] Hofseth, L. J. (2008) Nitric oxide as a target of complementary and alternative medicines
to prevent and treat inflammation and cancer. Cancer Lett. 268: 10-30.
[26] Hussain, S. P., Hofseth, L. J., and Harris, C. C. (2003) Radical causes of cancer. Nat. Rev.
Cancer. 3: 276-285.
[27] Meira, L. B., Bugni, J. M., Green, S. L., Lee, C. W., Pang, B., Borenshtein, D., Rickman,
B. H., Rogers, A. B., Moroski-Erkul, C. A., McFaline, J. L., Schauer, D. B., Dedon, P.
C., Fox, J. G., and Samson, L. D. (2008) DNA damage induced by chronic inflammation
contributes to colon carcinogenesis in mice. J. Clin. Invest. 118: 2516-2525.

46
[28] Pang, B., Zhou, X., Yu, H., Dong, M., Taghizadeh, K., Wishnok, J. S., Tannenbaum, S.
R., and Dedon, P. C. (2007) Lipid peroxidation dominates the chemistry of DNA adduct
formation in a mouse model of inflammation. Carcinogenesis. 28: 1807-1813.
[29] Marnett, L. J. (2012) Inflammation and cancer: Chemical approaches to mechanisms,
imaging, and treatment. J. Org. Chem. 77: 5224-5238.
[30] Ishikawa, K., Takenaga, K., Akimoto, M., Koshikawa, N., Yamaguchi, A., Imanishi, H.,
Nakada, K., Honma, Y., and Hayashi, J.-I. (2008) ROS-generating mitochondrial DNA
mutations can regulate tumor cell metastasis. Science. 320: 661-664.
[31] Aderem, A. and Underhill, D. M. (1999) Mechanisms of phagocytosis in macrophages.
Annu. Rev. Immunol. 17: 593-623.
[32] Smith, J. A. (1994) Neutrophils, host defense, and inflammation: a double-edged sword.
J. Leukoc. Biol. 56: 672-686.
[33] Amulic, B., Cazalet, C., Hayes, G. L., Metzler, K. D., and Zychlinsky, A. (2012)
Neutrophil function: From mechanisms to disease. Annu. Rev. Immunol. 30: 459-489.
[34] Dale, D. C., Boxer, L., and Liles, W. C. (2008) The phagocytes: neutrophils and
monocytes. Blood. 112: 935-945.
[35] Segal, B. H., Leto, T. L., Gallin, J. I., Malech, H. L., and Holland, S. M. (2000) Genetic,
biochemical, and clinical features of chronic granulomatous disease. Medicine. 79: 170-
200.
[36] Klebanoff, S. J. (2005) Myeloperoxidase: friend and foe. J. Leukoc. Biol. 77: 598-625.
[37] Nathan, C. (2006) Neutrophils and immunity: challenges and opportunities. Nat. Rev.
Immunol. 6: 173-182.
[38] Subrahmanyam, Y. V. B. K., Yamaga, S., Prashar, Y., Lee, H. H., Hoe, N. P., Kluger, Y.,
Gerstein, M., Goguen, J. D., Newburger, P. E., and Weissman, S. M. (2001) RNA
expression patterns change dramatically in human neutrophils exposed to bacteria. Blood.
97: 2457-2468.
[39] Swirski, F. K., Nahrendorf, M., Etzrodt, M., Wildgruber, M., Cortez-Retamozo, V.,
Panizzi, P., Figueiredo, J.-L., Kohler, R. H., Chudnovskiy, A., Waterman, P., Aikawa, E.,
Mempel, T. R., Libby, P., Weissleder, R., and Pittet, M. J. (2009) Identification of splenic
reservoir monocytes and their deployment to inflammatory sites. Science. 325: 612-616.
[40] Duffield, J. S. (2003) The inflammatory macrophage: a story of Jekyll and Hyde. Clin.
Sci. 104: 27-38.
[41] Geissmann, F., Manz, M. G., Jung, S., Sieweke, M. H., Merad, M., and Ley, K. (2010)
Development of monocytes, macrophages, and dendritic cells. Science. 327: 656-661.

47
[42] Gordon, S. (2002) Pattern recognition receptors: Doubling up for the innate immune
response. Cell. 111: 927-930.
[43] Iannacone, M., Moseman, E. A., Tonti, E., Bosurgi, L., Junt, T., Henrickson, S. E.,
Whelan, S. P., Guidotti, L. G., and von Andrian, U. H. (2010) Subcapsular sinus
macrophages prevent CNS invasion on peripheral infection with a neurotropic virus.
Nature. 465: 1079-1083.
[44] Murray, P. J. and Wynn, T. A. (2011) Protective and pathogenic functions of macrophage
subsets. Nat. Rev. Immunol. 11: 723-737.
[45] Mylonas, K. J., Nair, M. G., Prieto-Lafuente, L., Paape, D., and Allen, J. E. (2009)
Alternatively activated macrophages elicited by helminth infection can be reprogrammed
to enable microbial killing. J. Immunol. 182: 3084-3094.
[46] Jenkins, S. J., Ruckerl, D., Cook, P. C., Jones, L. H., Finkelman, F. D., van Rooijen, N.,
MacDonald, A. S., and Allen, J. E. (2011) Local macrophage proliferation, rather than
recruitment from the blood, is a signature of TH2 inflammation. Science. 332: 1284-
1288.
[47] Borden, E. C., Sen, G. C., Uze, G., Silverman, R. H., Ransohoff, R. M., Foster, G. R., and
Stark, G. R. (2007) Interferons at age 50: past, current and future impact on biomedicine.
Nat. Rev. Drug. Discov. 6: 975-990.
[48] MacMicking, J., Xie, Q.-w., and Nathan, C. (1997) Nitric oxide and macrophage
function. Annu. Rev. Immunol. 15: 323-350.
[49] Serbina, N. V., Salazar-Mather, T. P., Biron, C. A., Kuziel, W. A., and Pamer, E. G.
(2003) TNF/iNOS-producing dendritic cells mediate innate immune defense against
bacterial infection. Immunity. 19: 59-70.
[50] Nathan, C. and Ding, A. (2010) Nonresolving inflammation. Cell. 140: 871-882.
[51] Dedon, P. C. and Tannenbaum, S. R. (2004) Reactive nitrogen species in the chemical
biology of inflammation. Arch. Biochem. Biophys. 423: 12-22.
[52] McCord, J. M. and Fridovich, I. (1969 ) Superoxide Dismutase Journal of Biological
Chemistry 244 6049-6055
[53] McCord, J. M. and Fridovich, I. (1978) The biology and pathology of oxygen radicals.
Ann. Intern. Med. 89: 122-127.
[54] Wardman, P. and Candeias, L. P. (1996) Fenton chemistry: An introduction. Radiat. Res.
145: 523-531.
[55] Davies, M. J. (2003) Singlet oxygen-mediated damage to proteins and its consequences.
Biochem. Biophys. Res. Commun. 305: 761-770.

48
[56] Chen, Y.-R., Deterding, L. J., Sturgeon, B. E., Tomer, K. B., and Mason, R. P. (2002)
Protein oxidation of cytochrome c by reactive halogen species enhances its peroxidase
activity. J. Biol. Chem. 277: 29781-29791.
[57] Blanchard, C. and Rothenberg, M. E. (2009) Biology of the eosinophil in Advances in
Immunology (Alt, F. W., Alt, F. W.) pp. 81-121, Elsevier Academic Press, Waltham.
[58] Hazen, S. L., Hsu, F. F., Duffin, K., and Heinecke, J. W. (1996) Molecular chlorine
generated by the myeloperoxidase-hydrogen peroxide-chloride system of phagocytes
converts low density lipoprotein cholesterol into a family of chlorinated sterols. J. Biol.
Chem. 271: 23080-23088.
[59] Barrette, W. C., Hannum, D. M., Wheeler, W. D., and Hurst, J. K. (1989) General
mechanism for the bacterial toxicity of hypochlorous acid: abolition of ATP production.
Biochemistry. 28: 9172-9178.
[60] Vissers, M. C., Pullar, J. M., and Hampton, M. B. (1999) Hypochlorous acid causes
caspase activation and apoptosis or growth arrest in human endothelial cells. Biochem. J.
344: 443-449.
[61] Heinecke, J. W. (1999) Mass spectrometric quantification of amino acid oxidation
products in proteins: insights into pathways that promote LDL oxidation in the human
artery wall. F.A.S.E.B. J. 13: 1113-1120.
[62] Eiserich, J. P., Hristova, M., Cross, C. E., Jones, A. D., Freeman, B. A., Halliwell, B., and
van der Vliet, A. (1998) Formation of nitric oxide-derived inflammatory oxidants by
myeloperoxidase in neutrophils. Nature. 391: 393-397.
[63] Lonkar, P. and Dedon, P. C. (2011) Reactive species and DNA damage in chronic
inflammation: reconciling chemical mechanisms and biological fates. Int. J. Cancer. 128:
1999-2009.
[64] Green, L. C., Ruiz de Luzuriaga, K., Wagner, D. A., Rand, W., Istfan, N., Young, V. R.,
and Tannenbaum, S. R. (1981) Nitrate biosynthesis in man. Proc. Natl. Acad. Sci. U.S.A.
78: 7764-7768.
[65] Miwa, M., Stuehr, D. J., Marletta, M. A., Wishnok, J. S., and Tannenbaum, S. R. (1987)
Nitrosation of amines by stimulated macrophages. Carcinogenesis. 8: 955-958.
[66] Marletta, M. A., Yoon, P. S., Iyengar, R., Leaf, C. D., and Wishnok, J. S. (1988)
Macrophage oxidation of L-arginine to nitrite and nitrate: nitric oxide is an intermediate.
Biochemistry. 27: 8706-8711.
[67] Hibbs, J., Taintor, R., and Vavrin, Z. (1987) Macrophage cytotoxicity: role for L-arginine
deiminase and imino nitrogen oxidation to nitrite. Science. 235: 473-476.
[68] Palmer, R. M. J., Ashton, D. S., and Moncada, S. (1988) Vascular endothelial cells
synthesize nitric oxide from L-arginine. Nature. 333: 664-666.

49
[69] Stuehr, D. J. (1999) Mammalian nitric oxide synthases. Biochim. Biophys. Acta. 1411:
217-230.
[70] Liu, J., Garcia-Cardena, G., and Sessa, W. C. (1995) Biosynthesis and palmitoylation of
endothelial nitric oxide synthase: Mutagenesis of palmitoylation sites, cysteines-15
and/or -26, argues against depalmitoylation-induced translocation of the enzyme.
Biochemistry. 34: 12333-12340.
[71] Rafikov, R., Fonseca, F. V., Kumar, S., Pardo, D., Darragh, C., Elms, S., Fulton, D., and
Black, S. M. (2011) eNOS activation and NO function: Structural motifs responsible for
the posttranslational control of endothelial nitric oxide synthase activity. J. Endocrinol.
210: 271-284.
[72] Alderton, W. K., Cooper, C. E., and Knowles, R. G. (2001) Nitric oxide synthases:
structure, function and inhibition. Biochem. J. 357: 593-615.
[73] Marletta, M. A. (1988) Mammalian synthesis of nitrite, nitrate, nitric oxide, and N-
nitrosating agents. Chem. Res. Toxicol. 1: 249-257.
[74] Moncada, S., Palmer, R. M., and Higgs, E. A. (1991) Nitric oxide: physiology,
pathophysiology, and pharmacology. Pharmacol. Rev. 43: 109-142.
[75] Akinsheye, I. and Klings, E. S. (2010) Sickle cell anemia and vascular dysfunction: The
nitric oxide connection. J. Cell. Physiol. 224: 620-625.
[76] Parkinson, J. F., Mitrovic, B., and Merrill, J. E. (1997) The role of nitric oxide in multiple
sclerosis. J. Mol. Med. 75: 174-186.
[77] Goldstein, S., Czapski, G., Lind, J., and Merényi, G. (2000) Tyrosine nitration by
simultaneous generation of NO and O2 under physiological conditions. J. Biol. Chem.
275: 3031-3036.
[78] Lewis, R. S. and Deen, W. M. (1994) Kinetics of the reaction of nitric oxide with oxygen
in aqueous solutions. Chem. Res. Toxicol. 7: 568-574.
[79] Halliwell, B., Hu, M.-L., Louie, S., Duvall, T. R., Tarkington, B. K., Motchnik, P., and
Cross, C. E. (1992) Interaction of nitrogen dioxide with human plasma. Antioxidant
depletion and oxidative damage. F.E.B.S. Lett. 313: 62-66.
[80] Lim, C. H., Dedon, P. C., and Deen, W. M. (2008) Kinetic analysis of intracellular
concentrations of reactive nitrogen species. Chem. Res. Toxicol. 21: 2134-2147.
[81] Espey, M. G., Miranda, K. M., Thomas, D. D., and Wink, D. A. (2001) Distinction
between nitrosating mechanisms within human cells and aqueous solution. J. Biol. Chem.
276: 30085-30091.

50
[82] Lewis, R. S., Tannenbaum, S. R., and Deen, W. M. (1995) Kinetics of N-nitrosation in
oxygenated nitric oxide solutions at physiological pH: Role of nitrous anhydride and
effects of phosphate and chloride. J. Am. Chem. Soc. 117: 3933-3939.
[83] Keshive, M., Singh, S., Wishnok, J. S., Tannenbaum, S. R., and Deen, W. M. (1996)
Kinetics of S-nitrosation of thiols in nitric oxide solutions. Chem. Res. Toxicol. 9: 988-
993.
[84] Nguyen, T., Brunson, D., Crespi, C. L., Penman, B. W., Wishnok, J. S., and
Tannenbaum, S. R. (1992) DNA damage and mutation in human cells exposed to nitric
oxide in vitro. Proc. Natl. Acad. Sci. U.S.A. 89: 3030-3034.
[85] Lewis, R. S., Tamir, S., Tannenbaum, S. R., and Deen, W. M. (1995) Kinetic analysis of
the fate of nitric oxide synthesized by macrophages in vitro. J. Biol. Chem. 270: 29350-
29355.
[86] Evans, T. J., Buttery, L. D., Carpenter, A., Springall, D. R., Polak, J. M., and Cohen, J.
(1996) Cytokine-treated human neutrophils contain inducible nitric oxide synthase that
produces nitration of ingested bacteria. Proc. Natl. Acad. Sci. U.S.A. 93: 9553-9558.
[87] Radi, R., Beckman, J. S., Bush, K. M., and Freeman, B. A. (1991) Peroxynitrite-induced
membrane lipid peroxidation: The cytotoxic potential of superoxide and nitric oxide.
Arch. Biochem. Biophys. 288: 481-487.
[88] Lymar, S. V. and Hurst, J. K. (1995) Rapid reaction between peroxonitrite ion and carbon
dioxide: Implications for biological activity. J. Am. Chem. Soc. 117: 8867-8868.
[89] Trujillo, M., Folkes, L., Bartesaghi, S., Kalyanaraman, B., Wardman, P., and Radi, R.
(2005) Peroxynitrite-derived carbonate and nitrogen dioxide radicals readily react with
lipoic and dihydrolipoic acid. Free Radic. Biol. Med. 39: 279-288.
[90] Richeson, C. E., Mulder, P., Bowry, V. W., and Ingold, K. U. (1998) The complex
chemistry of peroxynitrite decomposition: New insights. J. Am. Chem. Soc. 120: 7211-
7219.
[91] Uppu, R. M., Squadrito, G. L., and Pryor, W. A. (1996) Acceleration of peroxynitrite
oxidations by carbon dioxide. Arch. Biochem. Biophys. 327: 335-343.
[92] Beckman, J. S. and Koppenol, W. H. (1996) Nitric oxide, superoxide, and peroxynitrite:
the good, the bad, and ugly. Am. J. Physiol. 271: C1424-C1437.
[93] Wink, D., Kasprzak, K., Maragos, C., Elespuru, R., Misra, M., Dunams, T., Cebula, T.,
Koch, W., Andrews, A., Allen, J., and Keefer, L. (1991) DNA deaminating ability and
genotoxicity of nitric oxide and its progenitors. Science. 254: 1001-1003.
[94] Caulfield, J. L., Wishnok, J. S., and Tannenbaum, S. R. (1998) Nitric oxide-induced
deamination of cytosine and guanine in deoxynucleosides and oligonucleotides. J. Biol.
Chem. 273: 12689-12695.

51
[95] deRojas-Walker, T., Tamir, S., Ji, H., Wishnok, J. S., and Tannenbaum, S. R. (1995)
Nitric oxide induces oxidative damage in addition to deamination in macrophage DNA.
Chem. Res. Toxicol. 8: 473-477.
[96] Burney, S., Caulfield, J. L., Niles, J. C., Wishnok, J. S., and Tannenbaum, S. R. (1999)
The chemistry of DNA damage from nitric oxide and peroxynitrite. Mutat. Res. Fund.
Mol. Mech. Mut. 424: 37-49.
[97] Dedon, P. C., Barth, M., Chen, B., De Mott, M., Dendroulakis, V., Dong, M., Kalinga, S.,
Elmquist, E., Margolin, Y., Pang, B., and Zhou, X. (2006) Diverse mechanisms of
endogenous nucleobase deamination in DNA and RNA in Advances in Molecular
Toxicology (Fishbein, J. C., Fishbein, J. C.) pp. 25-63, Elsevier, Amsterdam.
[98] Lucas, L. T., Gatehouse, D., Jones, G. D. D., and Shuker, D. E. G. (2001)
Characterization of DNA damage at purine residues in oligonucleotides and calf thymus
DNA induced by the mutagen 1-nitrosoindole-3-acetonitrile. Chem. Res. Toxicol. 14:
158-164.
[99] Vongchampa, V., Dong, M., Gingipalli, L., and Dedon, P. (2003) Stability of 2'-
deoxyxanthosine in DNA. Nucleic Acids Res. 31: 1045-1051.
[100] Caulfield, J. L., Wishnok, J. S., and Tannenbaum, S. R. (2003) Nitric oxide-induced
interstrand cross-links in DNA. Chem. Res. Toxicol. 16: 571-574.
[101] Dong, M., Wang, C., Deen, W. M., and Dedon, P. C. (2003) Absence of 2'-
deoxyoxanosine and presence of abasic sites in DNA exposed to nitric oxide at controlled
physiological concentrations. Chem. Res. Toxicol. 16: 1044-1055.
[102] Dong, M. and Dedon, P. C. (2006) Relatively small increases in the steady-state levels of
nucleobase deamination products in DNA from human TK6 cells exposed to toxic levels
of nitric oxide. Chem. Res. Toxicol. 19: 50-57.
[103] Mangerich, A., Knutson, C. G., Parry, N. M., Muthupalani, S., Ye, W., Prestwich, E.,
Cui, L., McFaline, J. L., Mobley, M., Ge, Z., Taghizadeh, K., Wishnok, J. S., Wogan, G.
N., Fox, J. G., Tannenbaum, S. R., and Dedon, P. C. (2012) Infection-induced colitis in
mice causes dynamic and tissue-specific changes in stress response and DNA damage
leading to colon cancer. Proc. Natl. Acad. Sci. U.S.A. 109: E1820-1829.
[104] Quinn, S. R. and O'Neill, L. A. (2011) A trio of microRNAs that control Toll-like
receptor signalling. Int. Immunol. 23: 421-425.
[105] Baltimore, D., Boldin, M. P., O'Connell, R. M., Rao, D. S., and Taganov, K. D. (2008)
MicroRNAs: new regulators of immune cell development and function. Nat. Immunol. 9:
839-845.
[106] Bryan, N. S., Rassaf, T., Maloney, R. E., Rodriguez, C. M., Saijo, F., Rodriguez, J. R.,
and Feelisch, M. (2004) Cellular targets and mechanisms of nitros(yl)ation: An insight
into their nature and kinetics in vivo. Proc. Natl. Acad. Sci. U.S.A. 101: 4308-4313.

52
[107] Barglow, K. T., Knutson, C. G., Wishnok, J. S., Tannenbaum, S. R., and Marletta, M. A.
(2011) Site-specific and redox-controlled S-nitrosation of thioredoxin. Proc. Natl. Acad.
Sci. U.S.A. 108: E600-E606.
[108] Caulfield, J. L., Singh, S. P., Wishnok, J. S., Deen, W. M., and Tannenbaum, S. R. (1996)
Bicarbonate inhibits N-nitrosation in oxygenated nitric oxide solutions. J. Biol. Chem.
271: 25859-25863.
[109] Licht, W. R., Tannenbaum, S. R., and Deen, W. M. (1988) Use of ascorbic acid to inhibit
nitrosation: kinetic and mass transfer considerations for an in vitro system.
Carcinogenesis. 9: 365-372.
[110] García-Santos, M. d. P., González-Mancebo, S., Hernández-Benito, J., Calle, E., and
Casado, J. (2002) Reactivity of amino acids in nitrosation reactions and its relation to the
alkylating potential of their products. J. Am. Chem. Soc. 124: 2177-2182.
[111] Kirsch, M., Fuchs, A., and de Groot, H. (2003) Regiospecific nitrosation of N-terminal-
blocked tryptophan derivatives by N2O3 at physiological pH. J. Biol. Chem. 278: 11931-
11936.
[112] Chen, B., Keshive, M., and Deen, W. M. (1998) Diffusion and reaction of nitric oxide in
suspension cell cultures. Biophys. J. 75: 745-754.
[113] Chen, B. and Deen, W. M. (2001) Analysis of the effects of cell spacing and liquid depth
on nitric oxide and its oxidation products in cell cultures. Chem. Res. Toxicol. 14: 135-
147.
[114] Nalwaya, N. and Deen, W. M. (2004) Peroxynitrite exposure of cells cocultured with
macrophages. Ann. Biomed. Eng. 32: 664-676.
[115] Nalwaya, N. and Deen, W. M. (2003) Analysis of cellular exposure to peroxynitrite in
suspension cultures. Chem. Res. Toxicol. 16: 920-932.
[116] Chin, M. P., Schauer, D. B., and Deen, W. M. (2008) Prediction of nitric oxide
concentrations in colonic crypts during inflammation. Nitric Oxide Biol. Chem. 19: 266-
275.
[117] Nalwaya, N. and Deen, W. M. (2004) Analysis of the effects of nitric oxide and oxygen
on nitric oxide production by macrophages. J. Theor. Biol. 226: 409-419.
[118] Lancaster, J. R. (2006) Nitroxidative, nitrosative, and nitrative stress: Kinetic predictions
of reactive nitrogen species chemistry under biological conditions. Chem. Res. Toxicol.
19: 1160-1174.
[119] Wang, C. and Deen, W. M. (2003) Nitric oxide delivery system for cell culture studies.
Ann. Biomed. Eng. 31: 65-79.

53
[120] Dendroulakis, V., Russell, B. S., Eric Elmquist, C., Trudel, L. J., Wogan, G. N., Deen,
W. M., and Dedon, P. C. (2012) A system for exposing molecules and cells to
biologically relevant and accurately controlled steady-state concentrations of nitric oxide
and oxygen. Nitric Oxide Biol. Chem. 27: 161-168.

54
Chapter 2
A system for exposing molecules and cells to biologically relevant
and accurately controlled steady-state concentrations of nitric oxide
and oxygen
2.1 Introduction
Nitric oxide (NO) is a free-radical gas involved in diverse biological processes, such as
apoptosis, neurotransmission, blood pressure control and innate immunity [1]. Of critical
importance to NO function is its steady-state concentration in tissues, with biologically relevant
concentrations ranging over three orders of magnitude. On the basis of literature estimates,
Thomas et al. proposed concentration categories for NO function, ranging from cGMP-mediated
signaling processes at ~1-30 nM, modulation of kinase and transcription factor activity at ~30-
400 nM (e.g., Akt, HIF-1α, p53) and pathological nitrosative and oxidative stresses above ~500
nM [2]. The balance between low and high concentrations may thus dictate cell decision-making
processes such as survival and proliferation as opposed to growth arrest and cell death. While the
functions of NO are controlled in part by the rate of generation by NO synthases, numerous
chemical reactions affect its concentration by consuming NO, such as reactions with superoxide
(O2) to form peroxynitrite (ONOO
─), and with molecular oxygen to form the oxidizing and S-
nitrosating nitrogen dioxide radical (NO2) and the S- and N-nitrosating species, nitrous
anhydride (N2O3). Glutathione and other cellular reductants and electrophiles further intervene in
reactions with these NO derivatives (e.g. ref. [3]). Activated macrophages are the major source
of pathologically high levels of NO [4], producing local steady-state concentrations approaching
1 M [5]. Simultaneous generation of O2 leads to ONOO
─, while reactions of NO with O2 yield

55
N2O3 and NO2.These reactive species damage all types of cellular biomolecules and thus
contribute to the mechanistic link between inflammation and cancer [5,6].
Evidence for the concentration-dependence of NO function highlights the need for
delivery of predictable and biologically relevant steady-state levels of NO and O2 in vitro to
mimic the biological environment. NO can be introduced into a solution by several methods. One
approach to NO delivery in vitro involves the use of “NONOates” that release NO with
predictable kinetics to provide transient, non-uniform levels that must be averaged over time to
define exposure [7]. Garthwaite and coworkers were able to obtain constant steady-state levels of
NO over several minutes by balancing NO release from a NONOate with consumption by a
scavenger [8]. The difficulty of controlling the steady-state concentration of NO with NONOates
over longer periods of exposure [7,9] is compounded by the unknown effects of the chemical
species generated upon release of NO [7], the generation of nitroxyl [10], and the fact that
different NO-donor compounds with different half-lives must be used to span a range of
exposure times [11]. Alternative methods of NO delivery include addition of aliquots of NO-
saturated aqueous solutions, which produce local NO “hotspots” [12], and co-culture of NO-
producing macrophages with target cells, which involves poor control of NO levels and
complicates interpretation of results with multiple cell lines [13,14].
Over the past decade, we have developed NO delivery systems for controlled steady-state
concentrations of NO (0.1-1 M) and O2 (50-200 M) to mimic biological environments such as
inflammation [15,16]. The best characterized and most widely applicable of the systems employs
NO- and O2-permeable polydimethylsiloxane (Silastic) tubing to deliver the gases at constant
and predictable levels. Mass transfer models were developed to calculate the concentrations of
NO and O2 in the bulk liquid, given any combination of tubing length and gas feed composition

56
[16], as well as rates of gas consumption by cells [17]. The device was designed primarily for
cultured cells and was used to elucidate threshold effects in NO-induced toxicity and
mutagenicity in human cells [17,18]. However, the mass transfer model was validated only for
NO and O2 delivery in phosphate buffers and was not tested with the more complex case of cell
culture media, components of which could consume NO, such as riboflavin-generated
superoxide that may react with NO [19,20]. Although partial oxidation of NO within the
permeable Silastic tubing motivated the development of a Teflon-membrane delivery apparatus
for chemical kinetic experiments [21], the Silastic tubing system has proven utility for long-term
cell culture studies [16,22].
Here we describe the fabrication of the NO/O2 delivery system from commercially
available components, and the operation and calibration of the system. We then describe an
application of the system for delivery of NO and O2 into cell culture media, with a comparison of
experimental results with a mass transfer model that predicts the steady-state levels of various
NO-derived reactive species. We also determined that photo-sensitive reactions taking place in
cell culture media, such as riboflavin-derived O2 synthesis, do not affect steady-state NO or O2
levels. Finally, we illustrate use of the delivery system with different cell types and explore the
range of cumulative NO-dosing and its effect on cell survival. This system provides critical
control of NO delivery for in vitro models of NO biology and chemistry and offers great
potential for exploring reactions between nitrogen oxides and biomolecules or cellular
components.
2.2 Materials and methods
2.2.1 Fabrication of the delivery system

57
The NO/O2 delivery system consists of three major components: a vessel for exposing
cells (the delivery apparatus), a system for delivering NO and O2 to the exposure vessel (the
peripheral tubing system) and accessories for temperature control and stirring. The delivery
apparatus is comprised of a Teflon screw-capped jar with a lid fitted with luer adapters for
connecting external gas tubing to the internal Silastic tubing for diffusion of gases into solution,
as described previously [16]. The lid can also be modified with ports for probes to monitor
solution levels of NO and O2 (Figure 2.1). An alternative configuration was conceived for
exposure of adherent cells (Figure 2.2). Gases are delivered at controlled flow rates by the
peripheral tubing system (Figure 2.3), which consists of gas tanks, tubing and flow controllers to
deliver two gas mixtures to the delivery apparatus: NO in argon (pure argon for controls) and O2
in a mixture of N2 and CO2. Tables A.1 and A.2 in Appendix A contain a complete parts list
required to fabricate the system (assembly procedure described in Appendix A). Temperature
control is achieved by immersing the vessel in a water bath mounted on a magnetic stirrer (set at
100 rpm). To avoid operator exposure to NO gas, the system must be operated in a fume hood
(see Appendix A). Gas leak alarms can be installed in the vicinity to minimize the potential for
accidental exposure (available online: http://www.certifiedairsafety.com/bw-technologies-gas-
detectors-honewell-gasalertmax-gaslaertmicro5/bw-technologies-by-honeywell-gasalert-
extreme).
2.2.2 Dissolved NO and O2 measurement in the apparatus
Levels of NO and O2 in the bulk liquid were measured using a modified apparatus where
a stainless steel fitting (Swagelok; Table A.2 in Appendix A) was threaded through a drilled hole
centered on the device’s cap to firmly suspend a dissolved O2 meter Orion 810 A-plus (Thermo

58
Figure 2.1. Schematic of probes attached to the NO/O2 delivery apparatus.
The arrangement of fittings before insertion of the NO and O2 electrodes on the modified cap is
shown. Relative positioning of additional holes on the modified screw cap required to support
the probe-bearing fittings (the 2 loops of tubing yield the same results whether arranged in a
crossover pattern or in parallel, as long as contact with the probes is avoided). All parts required
to fabricate the apparatus are listed in Table A.2 (Appendix A).

59
Figure 2.2. Schematic of the NO/O2 delivery apparatus modified for adherent cell cultures.
The arrangement of fittings, impeller assembly and impeller shaft that enable stirring in the
delivery device to expose adherent cell cultures are shown. The bottom part of the impeller
assembly (not engaged with the glass shaft) was shaved off to avoid contact with the cell dish
resting in the container while still allowing for the magnet to be attached and rotate freely.
Relative positioning of the additional hole on the screw cap required to support the impeller
assembly/shaft (the 2 loops of tubing need to be arranged in parallel to avoid contact with the
rotating impeller). All parts required to fabricate the apparatus are listed in Table A.2 (Appendix
A).

60
Figure 2.3. Schematic of the peripheral tubing system providing NO and O2 gas mixtures to the
delivery apparatus.
Upper right inset illustrates Swagelok steel fittings for connecting Teflon tubing to adapters. All
parts required to construct the peripheral tubing system are listed in Tables A.1 and A.2
(Appendix A).

61
Electron). A female luer bulkhead fitting (Cole-Parmer) with its barbed hose filed away and its
inner diameter increased to ~4 mm was threaded in a different hole drilled in the cap (Figure
2.1); appropriately sized rubber gaskets (McMaster-Carr) were placed between the fittings and
the cap to seal the connections. The 4 mm margin was large enough to allow insertion of the 2
mm ISO-NOP Nitric Oxide probe (World Precision Instruments, Inc.) without disturbing its tip
membrane. A rubber gasket that when fitted on the probe exceeded a 4 mm diameter was used to
securely immobilize it on the filed luer adapter. To minimize the risk of touching the membrane
and destabilizing the signal, the NO electrode remained semi-permanently attached; the O2 probe
on the other hand was robust enough to be inserted anew before each exposure. After sealing the
container, the tips from both electrodes were immersed in the liquid and protected from any
movement or contact with the stirring bar.
2.2.3 Calibration of NO and O2 probes
Both NO and O2 probes were pre-calibrated daily before use. NO electrode calibration
involved immersing the tip of the probe in 0.1 M potassium iodide and 0.1 M sulfuric acid while
known amounts of a potassium nitrite standard solution were added to the solution, generating an
equimolar amount of NO [23]. Linear calibration curves were obtained over the range of 0-2 μM
at both 23 and 37 oC. The calibration procedure for the O2 electrode entailed water-saturated air
according to the manufacturer’s instructions; the probe operated in a range of concentrations of
dissolved O2 between 100 and 300 μM.
2.2.4 Exposure of water, RPMI-1640 and DMEM to NO and O2
Two loops of Silastic tubing (Dow Corning; Table A.2 in Appendix A) were attached to
the female barbed hose luer fittings fixed on the modified apparatus (Figure 2.4), one for NO

62
Figure 2.4. Schematic of the NO/O2 delivery apparatus.
(A) Side view of the 120 mL Teflon container with hose-barb luer fittings threaded into holes in
the screw cap with rubber gaskets to seal the connections. (B) Top view of the screw cap
showing a typical arrangement of luer fittings and how they connect to external gas feeds. (C)
Cross-section of the cap demonstrating connection of the U-shaped loop of Silastic tubing to two
luer fittings for gas transit. All parts required to fabricate the apparatus are listed in Table A.2
(Appendix A).

63
and the other for O2 (corresponding lengths in Table 2.1). After pre-calibration, both electrodes
were attached and the apparatus was filled with ~115-120 mL of either de-ionized water, RPMI-
1640 or DMEM cell medium (BioWhittaker-Lonza). The device was sealed and placed in the
water bath at 23 or 37 (±1) oC. Simultaneous initiation of gas flows followed (procedure
described in Appendix A), employing a 10% NO in argon mixture and a 50% O2:45% N2:5%
CO2 mixture (Airgas). Exposures lasted for 40-50 min and experiments were repeated at least
three times.
2.2.5 Nitrite measurements
For exposures involving pure water, nitrite (NO2─) concentration was monitored by UV
absorbance at 210 nm ( = 5200 M-1
cm-1
) [24] in 100 μL samples withdrawn from the device at
regular intervals.
2.2.6 NO aqueous oxidation reaction scheme and mass transfer model
In aqueous media at physiological pH, NO reacts with oxygen giving rise to the stable
end product nitrite (NO2─), as illustrated by the following reactions:
k1
2ONO2 2NO2 (1)
k2
2NONO 32ON (2)
k-2
k3
OHON 232 H22NO -
2 (3)
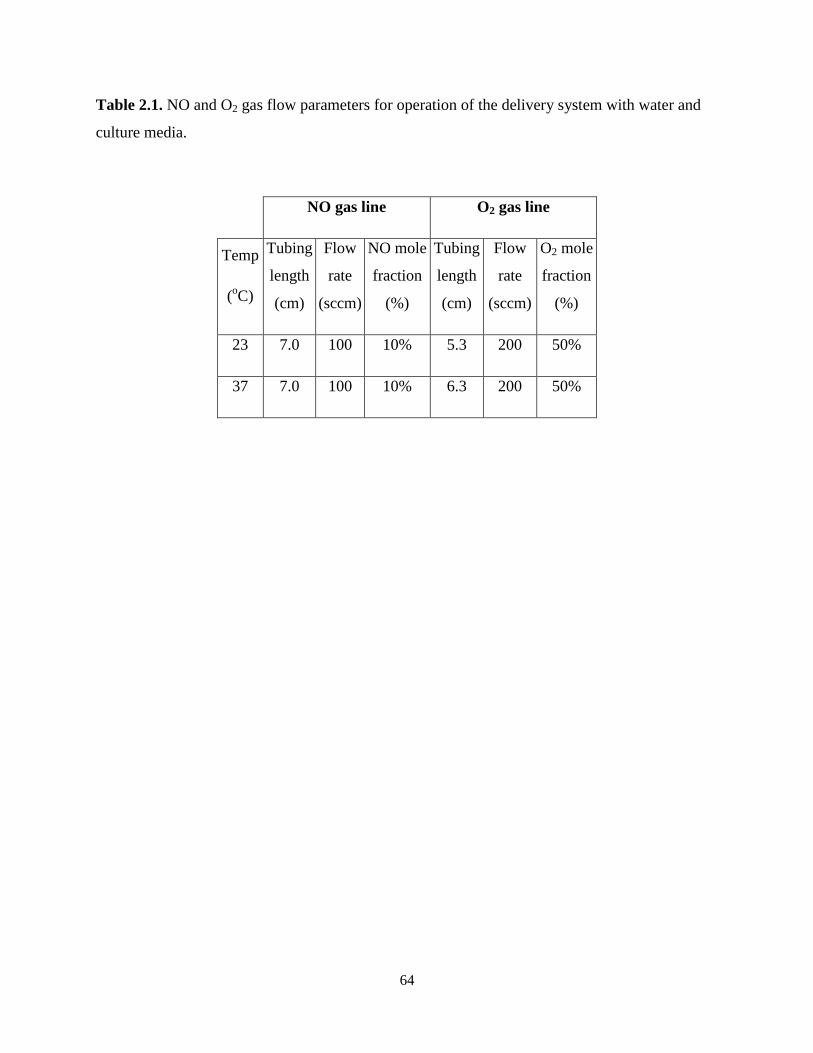
64
Table 2.1. NO and O2 gas flow parameters for operation of the delivery system with water and
culture media.
NO gas line O2 gas line
Temp
(oC)
Tubing
length
(cm)
Flow
rate
(sccm)
NO mole
fraction
(%)
Tubing
length
(cm)
Flow
rate
(sccm)
O2 mole
fraction
(%)
23 7.0 100 10% 5.3 200 50%
37 7.0 100 10% 6.3 200 50%

65
When NO is the only nitrogen oxide added to the system, intermediates NO2 and N2O3
are present only in trace quantities [25], justifying pseudo-steady state approximations for their
concentrations, while the rate-limiting step is Equation (1). In that case, Equations (1) - (3) can
simply be combined into the overall reaction:
k1
OHO4NO 22 H44NO -
2 (4)
Employing those approximations to eliminate the concentrations ( jC ) of the
intermediate species as independent variables from the volumetric rate of formation (Rj) for
species j = NO, O2 and NO2─ gives, according to Equation (4):
2O2NO1NO 4 CCkR
22 O2NO1O CCkR
2-2
O2NO1NO
4 CCkR
The mass balance equations for NO, O2 and NO2─, the dominant species during a typical
exposure, are given by the following differential equations, with the bulk solution in the delivery
device being the control volume [16]:
2
22
2
O2NO1NO
)(ONONO
O)O(
NONO
(NO)NONO
NO)NO(
NONO 4 CCkCPV
AkCP
V
Ak
dt
dC (a)
22
2
22
2
2
2
222
22O
2NO1O
)(O
OO
O)O(
OO
(NO)OO
NO)NO(
OOCCkCP
V
AkCP
V
Ak
dt
dC (b)

66
2
-2
O2NO1
NONO4 CCk
V
qA
dt
dC (c)
where jC is the time dependent concentration for species j, NOA and 2OA are the outer surface
areas of the cylindrical tubing loops through which NO and O2 are supplied, V is the total liquid
volume filling the device, k1 is the rate constant from Equation (4), j is the aqueous solubility
for gas j, )(i
jk is the liquid phase mass transfer coefficient for gas j inside the tubing supplying
gas i, )(i
jP is the partial pressure of gas j within the tubing loop supplying gas i, and q is the
extraneous flux of -
2NO , a pseudo-heterogeneous reaction taking place in a micron thick layer
next to the outer surface of the NO-supplying tubing loop (thought to be caused by
intramembrane oxidation of NO to NO2, with essentially all the produced NO2 converted to N2O3
and subsequently to NO2─ at the interface [16]). The first two terms in the right hand side of
Equations (a) and (b) represent mass transfer of the species in and out of the gas flows through
the two tubing loops, whereas the third terms describe the net volumetric rates (consumption) of
the dissolved gases in the bulk volume. The first term on the right hand side of Equation (c)
represents the extra NO2─ source term added to the mass transfer model to account for the
experimentally observed higher rate of NO2─ appearance during exposures, and the second term
shows the rate of NO2─ formation from the reaction taking place in the bulk volume.
The system of equations can be simplified taking into account the following observations:

67
1) Cross contamination of NO from O2, and vice versa, inside tubing loops can safely be
assumed to be negligible, so 0)NO(
O
)O(NO 2
2 PP
2) NO loss through the tubing loop that supplies O2, represented in Equation (a), is
insignificant, since the term NO
O
)O(
NO 2
2
CV
Ak was shown to always be much smaller compared to
the term NO
(NO)
NONONO
)NO(
NO CPV
Ak and thus can be ignored altogether, eliminating the need to
input a value for the mass transfer coefficient )O(
NO2k in Equation (a) [16].
Using the mass transfer coefficients and physicochemical parameters displayed in Table
2.2, the dimensions of the delivery apparatus (filled with approximately 115 mL of fluid) and
Silastic tubing loops (0.196 cm outer diameter), as well as experimentally determined pressure
inside the tubing based on the given flow rates (~1.0 atm; ref. [16]) and initial values for the
species concentrations at the beginning of each exposure (O2 is the only species with non-zero
initial concentration), the differential equations of the mass transfer model can be solved
numerically to predict the time course of NO, O2 and NO2─ concentrations within the device
employing MATLAB 7.11 (MathWorks, Natick, MA). Because of previous work that has shown
strong effects of O2 on the NO-related mass transfer coefficients and the conditions under which
those values were estimated [16], it is important to use the model in cases where solutions and
suspensions will be at nearly air-saturated levels to maximize the model’s accuracy on predicting
concentration profiles. To illustrate, Table 2.3 provides combinations of different tubing lengths
and NO gas composition and the resulting calculated steady-state NO and O2 levels expected to
occur in the device during simulated exposures using water or buffers. As noted below, the

68
Table 2.2. Input parameters for the mass transfer model.
23 oC 37
oC
Parameter 10% NO 99% NO 1% NO 10% NO 99% NO
)NO(NO
k (10-5
m/s) 0.40 1.07 2.06 1.11 1.84
)NO(O2
k (10-5
m/s) 2.60 4.39 3.50 3.69 5.22
q (μmol m-2
s-1
) 5.70 33.8 N.A. 6.79 39.4
1k (106 M
-2 s
-1) 2.1 2.4
)O(
O2
2k (10
-5 m s
-1) 2.01 2.65
NO (10-8
M Pa-1
) 1.8 1.5
2O (10-8
M Pa-1
) 1.2 1.0
Symbols: )NO(
NOk , liquid phase mass transfer coefficient for NO and,
)NO(O2
k , liquid phase mass
transfer coefficient for O2 at the tubing supplying NO; q, extraneous flux of -
2NO at the outer
surface of the NO-supplying tubing loop; 1k , oxidation rate constant; )O(
O2
2k , liquid phase mass
transfer coefficient for O2 at the tubing supplying O2; NO , 2O , aqueous solubility for NO,
O2, respectively. Values are reproduced from earlier studies [16,17]. No mass transfer
coefficients available in the case of delivery of 1% NO at 23 oC.

69
Table 2.3. Predicted steady state NO and O2 concentrations in simulated exposures.
Temp.
(oC)
Composition of
NO stream
NO tubing
length (cm)
O2 tubing
length (cm)
Steady-state
[NO] (μM)
Steady-state
[O2] (μM)
23
10% NO in Ar 7.0 7.4 1.1
270
99% NO 5.0 12.3 4.8
37
1% NO in Ar 6.0 5.7 0.7
210 10% NO in Ar 7.0 7.3 1.8
99% NO 5.0 11.5 6.0
Composition of the O2 stream is the same in every case (50% O2 in N2 with 5% CO2). The O2
concentration of the solution filling the apparatus before the start of every simulated exposure
was arbitrarily selected to be that of air-saturated water (270 μM at 23 oC and 210 μM at 37
oC)
and remained essentially stable during the simulation using the tubing length combinations
displayed. Model parameters were not available for predictions in the case of 1% NO at 23 oC.

70
model can also be used to validate and benchmark the operation of the system based on electrode
measurements of NO and O2.
2.2.7 Exposing cell cultures (in collaboration with L. J. Trudel and Dr. G. N. Wogan)
TK6 human lymphoblastoid cells [26,27] were obtained from ATCC, NH32 (an isogenic
derivative of TK6; ref. [28]) and HCT116 human colon carcinoma cells [29,30] were provided
by C. C. Harris (National Cancer Institute). TK6 and NH32 cells were kept in exponentially
growing suspension cultures in RPMI-1640 medium supplemented with 10% heat-inactivated
donor calf serum and HCT116 cells in McCoy’s 5A medium supplemented with 10% heat-
inactivated donor horse serum, at 37 oC in a humidified 5% CO2 atmosphere; 100 units/mL
penicillin, 100 μM/mL streptomycin and 2 mM L-glutamine were also added in both types of
media. Cell suspensions were transferred at a density of 5 x 10⁵ cells/mL in 115 mL of
supplemented RPMI-1640 medium to sterile delivery devices (autoclaved at 120 oC for 20 min,
with Silastic tubing loops of appropriate length already attached) immediately prior to treatment.
Adherent cells were plated in 60 mm dishes (106 cells per dish) 24 h prior to exposure, existing
medium was aspirated immediately before the exposure, and dishes were positioned at the
bottom of autoclaved delivery devices (Figure 2.2). The inner and outer surfaces of the dishes
carrying the HCT116 cells needed to be sterile before insertion into the device, so handling was
performed at all times with disinfected forceps within larger (150-mm) sterile dishes. Cell-
carrying dishes without their caps were anchored for stability (using a small sterilized wedge
made of Tygon tubing) to the bottom of the devices, and 110 mL of fresh supplemented
McCoy’s 5A medium were gently added immediately before the exposure begun. Tubing loops
of suitable lengths and gas tanks of appropriate compositions were selected so that a steady state
NO concentration of 0.6 μM was achieved in the case of cell suspensions and 1.8 μM in the case

71
of adherent cells, with liquid O2 levels maintained near air saturation. The total NO dose
delivered was dictated by the exposure time and was quantified in units of μM min. Parallel
exposures using Argon (instead of NO) were used as negative controls in all experiments. After
the exposure, cell suspensions were collected by centrifugation and re-suspended in fresh
supplemented RPMI-1640 medium, whereas fresh supplemented McCoy’s 5A medium was
added to adherent cell cultures after being washed once with phosphate buffered saline.
Subsequently, all cultures remained at 37 oC in a humidified 5% CO2 atmosphere until further
processing.
2.2.8 Cell viability analysis (performed by Laura J. Trudel)
TK6 and NH32 cell viability was determined 48 h after NO/O2 treatment in the delivery
device, whereas HCT116 cell viability was determined 24 h post exposure using the MTT assay
(Roche Diagnostics, Indianapolis, IN) and following the manufacturer’s instructions. Per cent
survival was expressed relative to Argon-exposed negative controls at each treatment dose.
2.3 Results
2.3.1 Validation of NO and O2 delivery in water
The basic operation of the system is illustrated with the simple scenario of NO and O2
delivery into water in the absence of other chemical species that could react with NO or its
derivatives. A modified delivery apparatus with NO and O2 electrodes inserted through the
vessel lid (Figure 2.1) was used to measure dissolved gases in air-equilibrated de-ionized water.
This allowed validation of the mass transfer model predictions of NO and O2 steady-state levels
achieved using the Silastic tubing of lengths, gas composition and gas flow conditions shown in
Table 2.1. Measured levels of NO and O2 in water agree well with model predictions at both 23

72
and 37 oC (Figure 2.5), with measured steady-state levels of 1.2 and 1.7 M for NO and 240 and
210 M for O2, respectively.
The device can also be used to deliver predictable, well-controlled concentrations of NO-
derived secondary species such as NO2 and N2O3. Though these species are too reactive to be
measured directly, their mutual degradation product, NO2─, can be easily and accurately
quantified [31]. Formation of NO2─ in the system operating with water deviated from the
model’s prediction by a factor of 1.6-2 (Figure 2.6), with correction for the model’s extra NO2─
source q, ranging from 11 to 11.5 μmol m-2
s-1
, providing a good fit of the data. (The origin of
this extra NO2─ is discussed later.) This demonstrates the empirical nature of the mass transfer
model and the need to calibrate the delivery system to account for batch-to-batch variations in
Silastic tubing, which is important since there is a significant conversion of NO to NO2 within
the tubing wall [22]. Table 2.4 summarizes optimized parameters for the model, estimated by
minimizing sums of squared differences between measured and predicted concentrations of NO,
O2 and NO2─ at all time points (relative errors of concentration difference divided by measured
concentration were used). Aside from the q values, the updated estimates of the mass transfer
coefficients were in agreement with those previously reported (Table 2.2) [16].
The formation of NO2─ demonstrates an important factor in the operation of the delivery
system. NO2─ generation is coupled with an equimolar accumulation of H
+, which necessitates
the use of buffers to maintain a uniform pH within the device. For example, we observed that a
solution of 50 mM phosphate buffer sustains a pH of 7.4 for over 12 h under the conditions
defined in Figure 2.6 (NO2─ accumulation at 160 μM hour
-1), with accurate simulation of NO
and O2 levels by the mass transfer model [16,22]. Note that nitrate (NO3─) formation was not
detected in previous studies [16] and was thus not measured here. The fact that model parameters

73
Figure 2.5. Time course of measured and predicted bulk liquid NO and O2 concentrations.
NO (circles, left axis) and O2 (squares, right axis) concentrations are shown using water at 23 °C
(A) and 37 °C (B). Data from two experiments (open and closed symbols) and predictions using
the mass transfer model (solid curves) are shown. Exposure conditions: 10% NO, 100 sccm, 7.0
cm Silastic tubing loop; 50% O2, 200 sccm, 5.3 cm tubing loop for 23 oC, or 6.3 cm tubing loop
for 37 oC.

74
Figure 2.6. Time course for measured and predicted nitrite (NO2─) formation.
Discrete symbols represent experimental data (open circles from data at 37 °C, closed circles at
23 °C, triplicate measurements). The lines were generated by the mass transfer model: dotted
line (37 oC) and solid line (23
oC) with q = 11.03 and q = 11.54 μmol m
-2 s
-1, respectively (q
values derived from recent data); dot-dashed line (37 oC) and dashed line (23
oC) with q = 6.79
and q = 5.70 μmol m-2
s-1
, respectively (values from Table 2.2). Exposure conditions: 10% NO,
100 sccm, 7.0 cm Silastic tubing loop; 50% O2, 200 sccm, 5.3 cm tubing loop for 23 oC, or 6.3
cm tubing loop for 37 oC.

75
Table 2.4. Mass transfer coefficients and boundary layer nitrite (NO2─) correction at the NO
supplying tubing for operation of the delivery system with water.
Temp
(oC)
)NO(NO
k
(10-5
m/s)
)NO(O2
k
(10-5
m/s)
q
(μmol m-2
s-1
)
23 0.44 ± 0.03 2.3 ± 0.2 11.0 ± 0.95
37 1.0 ± 0.05 3.2 ± 0.35 11.5 ± 0.91
Updated mass transfer coefficients for NO, O2 and boundary layer NO2─ source were based on
data acquired with water (Figure 2.5 and Figure 2.6). Values for )O(
O2
2k were taken from Table
2.2, assuming a negligible effect on O2 delivery through the O2 supplying tubing at the NO
concentrations used (ref. [16]).

76
describe levels of NO and O2 equally well in water and phosphate buffers indicates that the
presence of salts does not significantly affect delivery of NO or O2 in the device.
2.3.2 NO and O2 delivery in cell culture media
NO and O2 delivery into cell culture systems presents a more complex scenario, with cell
culture media typically containing nutrients and salts that could react with NO and its
derivatives. For example, riboflavin in many media preparations has been shown to cause photo-
induced generation of O2 under standard lighting conditions [19,20]. The rapid reaction of O2
and NO to form ONOO─ could thus act as a sink for NO and potentially interfere with the
predicted steady-state NO concentrations in the device. We assessed this problem with two
commonly used mammalian cell culture media: RPMI-1640 and Dulbecco’s modified Eagle’s
medium (DMEM). The apparatus was filled with medium and delivery was initiated with the
operational parameters used for water (Table 2.1). As shown in Figure 2.7A, the resulting
concentration profiles for NO and O2 in RPMI-1640 at both 23 and 37 oC were in good
agreement with predictions from the mass transfer model. To assess the effects of riboflavin and
ambient light on NO levels, the steady-state NO concentration was allowed to plateau in RPMI-
1640 medium, at which point ambient lights were turned off (arrow in Figure 2.7A) to place the
delivery device in complete darkness. As shown in Figure 2.7A, NO levels were identical in the
presence or absence of ambient light, which ruled out substantial production of O2 that would
interfere with steady-state NO levels in RPMI-1640. Identical results were obtained with DMEM
(Figure 2.7B), which contains twice the concentration of riboflavin as RPMI-1640 (1 vs. 0.5 µM,
respectively). Consistent with the conclusion that the agreement observed between experimental

77
Figure 2.7. Time course of measured and predicted bulk liquid NO and O2 in cell culture media.
NO (circles, left axis) and O2 (squares, right axis) concentrations shown in (A) RPMI-1640 and
(B) DMEM cell culture media at 23 °C (open symbols) or 37 °C (closed symbols). Data from
two sets of experiments (discrete symbols) and predictions using the mass transfer model (solid
curves) are shown. Arrows indicate the times at which ambient lighting was extinguished.
Exposure conditions: 10% NO, 100 sccm, 7.0 cm Silastic tubing loop; 50% O2, 200 sccm, 5.3 cm
tubing loop for 23 oC, or 6.3 cm tubing loop for 37
oC.

78
measurements and model-generated curves is medium-independent, we observed that
supplementation of RPMI medium with 10% heat-inactivated donor horse serum, 100 units/mL
penicillin, 100 µg/mL streptomycin, and 2 mM L-glutamine also did not have an effect on the
measured levels of NO at 37 °C, within the limits of accuracy of the electrodes (Figure 2.8). It
should be noted here that the vessel, connectors and Silastic tubing can be sterilized by
autoclaving for work with cell cultures over prolonged periods, with minimal effect on
performance. However, the system should be validated at least once following autoclaving to
ensure that the specific batch of tubing delivers NO and O2 as expected.
2.3.3 Exposure of cell cultures to NO and O2
The full potential of the NO/O2 delivery device is realized with exposure of cultured
cells. As described above, the mass transfer model was used to determine exposure parameters
(Silastic tubing lengths, gas composition) and calculate the steady-state gas levels before the
device was used to generate the survival curves shown in Figure 2.9. Cultures of human
lymphoblastoid TK6 cells and the p53-deficient derivative NH32 cells were then exposed to
calculated levels of 0.64 μM NO and ~200 μM O2 for up to 24 h, resulting in a cumulative total
NO dose of 920 μM min and a dose-dependent pattern of cell death. Also evident in Figure 2.9,
NH32 cells were more resistant to NO toxicity than TK6 cells, with an apparent threshold for
NO-induced cytotoxicity at ~300 μM min vs. 150 μM min for TK6 cells. Interestingly, when
either cell type was exposed to doses lower than its respective threshold, no significant cell death
occurred [18]. The HCT116 adherent colon tumor cell line proved to be even more resistant to
NO-induced cytotoxicity (Figure 2.9), with a threshold of ~1000 μM min. That different killing
curves were derived from widely used cell lines demonstrates the utility of the delivery device

79
Figure 2.8. Time course of NO levels in culture media with and without serum.
Profiles of measured and predicted bulk liquid NO concentration shown during exposure of
RPMI-1640 cell culture media, with and without serum, in the delivery device at 37 °C. Circles
represent an experiment with regular RPMI-1640 medium while squares and triangles represent
experiments where RPMI-1640 was supplemented with 10% heat-inactivated donor horse serum,
100 units/mL penicillin, 100 µg/mL streptomycin and 2 mM L-glutamine. Discrete symbols
represent experimental data while the solid curve was generated by the mass transfer model.
Exposures involved delivery of 10% NO at 100 sccm through a 7.0 cm long Silastic tubing loop
and 50% O2 at 200 sccm through a 6.3 cm long tubing loop at 37 oC for all data shown.

80
Figure 2.9. Cell viability in TK6, NH32 and HCT116 cells after exposure to NO.
Cell viability was determined by MTT assay, as described in Materials and Methods, for TK6
and NH32 at 48 h, and HCT116 cells at 24 h after exposure to NO and O2 or argon at 37 °C.
Data represent mean ± SD for 2-4 experiments; SD values for TK6 and NH32 cells were <8%
and are not shown.

81
for studying mechanisms of NO function and toxicity. Exposure of control cell cultures to
argon/O2 had little or no effect on cell proliferation, which indicates minimal effects of
turbulence caused by stirring in the reactor.
2.4 Discussion
There is an emerging recognition of the critical role of steady-state concentration in the
biological function of NO and the enormous range of NO concentrations that distinguish
physiological from pathological activity. However, most current NO delivery systems do not
provide precise, accurate or long-term control of NO concentration [7,9]. Recent studies have led
to interesting results, for example, on the response of an array of proteins to stratified levels of
NO, with conclusions concerning anti- or pro-growth pathways related to the tumor
microenvironment [11,32,33]. However, the means of NO delivery and estimation of total NO
dosage in those studies do not avoid the common caveats that accompany the use of NO-donor
compounds. Further, typical extant NO delivery systems rely on the relatively hyperoxic
conditions in aqueous solutions exposed to ambient air. We have overcome these limitations with
a system to deliver well-controlled and biologically relevant steady-state concentrations of NO
and O2 to biomolecules and cells. The fact that O2 is delivered separately from NO resolves the
issue of depletion of the former through cellular respiration or its reaction with the latter, a
technicality that affected previous attempts to develop a similar delivery system [25,34]. We
have presented here a detailed step-by-step assembly and operation guide for the NO/O2 delivery
system, along with the means to validate the system. This provides the inexperienced user with
sufficient information to fabricate the device from commercially available components, install it
in a typical laboratory setting, and operate it safely and effectively. The system has broad utility

82
in all types of in vitro studies of NO biology and chemistry, ranging from small molecule
damage to exposures of suspension and mono-layer cell cultures to NO and its derivatives.
Based on our results, the mathematical model of mass transfer allows for accurate
predictions of the NO and O2 levels in both simple aqueous solutions and in cell media. By
keeping steady operational parameters, such as gas flow-rates, stirring speed and temperature,
and by varying NO composition (1%, 10% or 99% NO) and Silastic tubing loop length, the
model computes the time-dependent NO, O2 and NO2─ concentrations in the apparatus, provided
that an experimental estimate of the initial O2 concentration (before gas diffusion begins) is
available. This can greatly facilitate experimental design, since changes in the configuration of
the delivery apparatus (e.g., NO gas composition, tubing length) can be translated into
predictable levels of NO, even before the actual gas delivery takes place. Further, the model
allows fine-tuning of NO delivery by varying the lengths of the gas diffusion tubing.
The mass transfer model is readily modified to account for a variety of applications of the
delivery device. For example, the initial formulation of the model assumed that cellular
consumption of NO and O2 would be negligible. Thus, all the predictions apply to cell-free
culture media (or solutions) as was the case with some of the exposures presented here.
However, recent studies revealed measurable rates of NO and O2 consumption by several cell
lines [17,20,35]. This allows a variation of the initial model in which the mass balance equation
for each gas (differential equations delineating the net rate of change of NO and O2 liquid
concentrations, described in Section 2.2.6) includes an additional term representing the net
specific cellular consumption rate for each gas multiplied by the cell density [17]. For instance,
NO and O2 consumption rates for TK6 cells (37 oC) were found to be 0.05 and 0.77 nmol min
-1
(106 cells)
-1, respectively, in a typical cell density of 5 × 10
5 cells mL
-1 (e.g. ref. [18]). By

83
incorporating these new conditions into the model, we can predict changes in NO and O2
concentrations caused by the cells (Figure 2.10). Due to the order-of-magnitude difference in
consumption rates, we observe a much less pronounced effect on NO concentration compared to
O2 levels, when computation extends from cell-free solutions to cell cultures. Consumption rates
are available for a variety of cell lines, so employing accurate estimates of those terms in the
model increases its predictive power. These kinds of customizations are relatively
straightforward and add to the precision and accuracy of NO and O2 delivery provided by the
system.
The presence of nutrients in cell culture media such as salts, vitamins, amino acids,
sugars, and glutathione did not measurably affect the diffusion of NO and O2 through the Silastic
membrane or their consumption in solution, with similar performance when gases were delivered
in water. The lack of any molecular sinks for NO under normal lighting conditions or in a dark
environment, even with serum-supplemented media, reinforces the expectation that the device
will operate as predicted by the mass transfer model during treatments of cell cultures. The lack
of any apparent NO consumption when lights are activated in the vicinity of the device comes in
contrast to previous studies [19,20] that attributed such trends to generation of O2 presumed to
originate from light-activated riboflavin in cell media. Although Keynes and coworkers did not
describe their vessel characteristics in sufficient detail, Nalwaya and Deen used what was
essentially a modified transparent polystyrene 60 mm culture dish to monitor reactions in media.
On the other hand, the current delivery system is a translucent 4 mm-thick Perfluoroalkoxy
container that may filter out wavelengths of laboratory light that could potentially excite
riboflavin. Alternatively, O2 formation inside the delivery device under the conditions

84
Figure 2.10. Effect of cellular consumption on predicted NO and O2 levels.
Model-based predictions of bulk liquid NO and O2 concentrations as a function of time during
simulated exposures of a cell-free solution (solid curves) and a TK6 cell culture (dashed curves)
in the delivery device at 37 oC. The difference between the two sets of curves represents the
effect that adding cellular consumption rates for NO and O2 have on how the model predicts gas
levels in the apparatus. For both exposures, hypothetical initial O2 concentration was arbitrarily
set at 191 μM, NO feed composition at 10% NO, Silastic tubing NO-loop length at 7.0 cm, O2
feed composition at 50% O2, O2-loop length at 6.3 cm.

85
describing the exposures may be smaller than the sensitivity of the probe that was used to
measure NO levels.
The confidence that the mass transfer model gives in terms of steady delivery of NO and
O2 motivated a series of experiments to explore cellular responses to NO exposure [17,18,36,37].
Those studies revealed the existence of NO toxicity thresholds (sub-lethal vs. lethal) as well as
repercussions in a diverse range of endpoints such as glutathione depletion, DNA damage, and
cell growth arrest. This characteristic pattern of dose-dependent survival is likely to be true for
all types of cells, offering opportunities for the device to be employed to monitor molecular
damage and killing caused by NO, and to systematically study how sub-threshold NO affects
cellular components and signaling pathways without simultaneously causing apoptosis or
disturbing their growth cycle. The NO/O2 delivery device is a versatile vessel that can
accommodate cell cultures without itself affecting their survival. It is able to provide the gases of
interest in a controllable and “clean” fashion, avoiding secondary effects that other delivery
methods may cause.
A microscopic model developed to complement the general mass transfer model predicts
that the apparatus has a 1 μm thick boundary layer adjacent to the NO tubing loop where the
concentrations of oxidation intermediates NO2 and N2O3 greatly exceed those in the bulk liquid
[22]. This “hot spot” appears to result from intramembrane oxidation of NO to NO2. The almost
complete conversion of NO2 to N2O3 very close to the tubing surface explains the unexpectedly
high rate of N2O3-derived NO2─ formation. Most molecules are small enough to enter the
boundary layer and be exposed to high concentrations of NO2 and N2O3, which complicates the
analysis when values of those concentrations are required for studies of chemical kinetics. An
approach to estimate “hot spot” contributions to the total concentration compares reaction rates

86
of target analytes to rates of another substrate with a known rate constant (e.g., morpholine
nitrosation) [22,34,38]. However, the uncertainties introduced by this methodology motivated the
development of a variation of the system in which NO is delivered through a porous Teflon
membrane, instead of a Silastic tubing loop. Another modification is that the NO gas stream is
fed through stainless steel (instead of Teflon) tubes, excluding any possible contamination by O2
before oxidation takes place in the vessel [21]. The new design avoids adventitious NO2─
formation, so it is thought to eradicate the “hot spot” phenomenon. However, because the “hot
spot” should not affect cells (10-20 m diameter) due to their inability to enter the micron-thin
boundary layer [22,39], and the Silastic-based apparatus is easier to fabricate and sterilize than
the Teflon-based one, the Silastic apparatus remains the more attractive option for exposing
cells.
As mentioned above, the extraneous NO2─ formation was postulated to be caused by
intramembrane oxidation of NO to NO2. Previous work has reported a rate constant (4.4 × 10⁵
M-2
s-1
) [16] for this conversion occurring within the Silastic tubing loop which was correlated to
the rate at which NO2─ is formed in the bulk volume. Our results show a 1.6- to 2-fold increase
in NO2─ accumulation during exposures to de-ionized water and a much smaller dependence on
temperature (Figure 2.6). In other words, if the intramembrane oxidation rate constant follows an
Arrhenius-type behavior then our recent findings would point to a greater pre-exponential factor
and lower activation energy, perhaps due to variations in the physical properties of the Silastic
tubing. Accordingly, it is advisable for a new user to validate the system and ascertain that the
NO and O2 delivery parameters are as expected. Alternatively, the observed increase of NO2─
formation could be related to incomplete exclusion of O2 from the Teflon-based NO gas line as
constructed in the current peripheral tubing system (noted by Skinn et al. [21]), which may differ

87
from the original experimental setup that was used to determine the boundary layer contribution
to NO2─ synthesis [16].

88
2.5 References
[1] Moncada, S., Palmer, R. M., and Higgs, E. A. (1991) Nitric oxide: physiology,
pathophysiology, and pharmacology. Pharmacol. Rev. 43: 109-142.
[2] Thomas, D. D., Ridnour, L. A., Isenberg, J. S., Flores-Santana, W., Switzer, C. H.,
Donzelli, S., Hussain, P., Vecoli, C., Paolocci, N., Ambs, S., Colton, C. A., Harris, C. C.,
Roberts, D. D., and Wink, D. A. (2008) The chemical biology of nitric oxide:
implications in cellular signaling. Free Radic. Biol. Med. 45: 18-31.
[3] Lim, C. H., Dedon, P. C., and Deen, W. M. (2008) Kinetic analysis of intracellular
concentrations of reactive nitrogen species. Chem. Res. Toxicol. 21: 2134-2147.
[4] Lewis, R. S., Tamir, S., Tannenbaum, S. R., and Deen, W. M. (1995) Kinetic analysis of
the fate of nitric oxide synthesized by macrophages in vitro. J. Biol. Chem. 270: 29350-
29355.
[5] Dedon, P. C. and Tannenbaum, S. R. (2004) Reactive nitrogen species in the chemical
biology of inflammation. Arch. Biochem. Biophys. 423: 12-22.
[6] Coussens, L. M. and Werb, Z. (2002) Inflammation and cancer. Nature. 420: 860-867.
[7] Keefer, L. K., Nims, R. W., Davies, K. M., and Wink, D. A. (1996) "NONOates" (1-
substituted diazen-1-ium-1,2-diolates) as nitric oxide donors: convenient nitric oxide
dosage forms. Methods Enzymol. 268: 281-293.
[8] Griffiths, C., Wykes, V., Bellamy, T. C., and Garthwaite, J. (2003) A new and simple
method for delivering clamped nitric oxide concentrations in the physiological range:
Application to activation of guanylyl cyclase-coupled nitric oxide receptors. Mol.
Pharmacol. 64: 1349-1356.
[9] Schmidt, K., Desch, W., Klatt, P., Kukovetz, W. R., and Mayer, B. (1998) Release of NO
from donor compounds: a mathematical model for calculation of NO concentrations in
the presence of oxygen in Nitric Oxide Protocols (Titheradge, M. A., Titheradge, M. A.)
pp. 281-289, Humana Press Inc., Totowa.
[10] Miranda, K. M., Katori, T., Torres de Holding, C. L., Thomas, L., Ridnour, L. A.,
McLendon, W. J., Cologna, S. M., Dutton, A. S., Champion, H. C., Mancardi, D.,
Tocchetti, C. G., Saavedra, J. E., Keefer, L. K., Houk, K. N., Fukuto, J. M., Kass, D. A.,
Paolocci, N., and Wink, D. A. (2005) Comparison of the NO and HNO donating
properties of diazeniumdiolates: primary amine adducts release HNO in vivo. J. Med.
Chem. 48: 8220-8228.
[11] Thomas, D. D., Espey, M. G., Ridnour, L. A., Hofseth, L. J., Mancardi, D., Harris, C. C.,
and Wink, D. A. (2004) Hypoxic inducible factor 1 alpha, extracellular signal-regulated
kinase, and p53 are regulated by distinct threshold concentrations of nitric oxide. Proc.
Natl. Acad. Sci. U.S.A. 101: 8894–8899.

89
[12] Liu, X., Miller, M. J., Joshi, M. S., Thomas, D. D., and Lancaster, J. R. (1998)
Accelerated reaction of nitric oxide with O2 within the hydrophobic interior of biological
membranes. Proc. Natl. Acad. Sci. U.S.A. 95: 2175-2179.
[13] Pfeiffer, S., Lass, A., Schmidt, K., and Mayer, B. (2001) Protein tyrosine nitration in
mouse peritoneal macrophages activated in vitro and in vivo: evidence against an
essential role of peroxynitrite. F.A.S.E.B. J. 15: 2355-2364.
[14] Zhuang, J. C., Lin, D., Lin, C., Jethwaney, D., and Wogan, G. N. (2002) Genotoxicity
associated with NO production in macrophages and co-cultured target cells. Free Radic.
Biol. Med. 33: 94-102.
[15] Lewis, R. S. and Deen, W. M. (1996) Stirred reactor with continuous nitric oxide
sampling for use in kinetic studies. Methods Enzymol. 268: 247-259.
[16] Wang, C. and Deen, W. M. (2003) Nitric oxide delivery system for cell culture studies.
Ann. Biomed. Eng. 31: 65-79.
[17] Wang, C., Trudel, L. J., Wogan, G. N., and Deen, W. M. (2003) Thresholds of nitric
oxide-mediated toxicity in human lymphoblastoid cells. Chem. Res. Toxicol. 16: 1004-
1013.
[18] Li, C.-Q., Pang, B., Kiziltepe, T., Trudel, L. J., Engelward, B. P., Dedon, P. C., and
Wogan, G. N. (2006) Threshold effects of nitric oxide-induced toxicity and cellular
responses in wild-type and p53-null human lymphoblastoid cells. Chem. Res. Toxicol. 19:
399-406.
[19] Keynes, R. G., Griffiths, C., and Garthwaite, J. (2003) Superoxide-dependent
consumption of nitric oxide in biological media may confound in vitro experiments.
Biochem. J. 369: 399-406.
[20] Nalwaya, N. and Deen, W. M. (2005) Nitric oxide, oxygen, and superoxide formation
and consumption in macrophage cultures. Chem. Res. Toxicol. 18: 486-493.
[21] Skinn, B. T., Lim, C. H., and Deen, W. M. (2011) Nitric oxide delivery system for
biological media. Free Radic. Biol. Med. 50: 381-388.
[22] Dong, M., Wang, C., Deen, W. M., and Dedon, P. C. (2003) Absence of 2'-
deoxyoxanosine and presence of abasic sites in DNA exposed to nitric oxide at controlled
physiological concentrations. Chem. Res. Toxicol. 16: 1044-1055.
[23] Schmidt, K. and Mayer, B. (1998) Determination of NO with a Clark-type electrode in
Nitric Oxide Protocols (Titheradge, M. A., Titheradge, M. A.) pp. 101-109, Humana
Press Inc., Totowa.
[24] Caulfield, J. L., Singh, S. P., Wishnok, J. S., Deen, W. M., and Tannenbaum, S. R. (1996)
Bicarbonate inhibits N-nitrosation in oxygenated nitric oxide solutions. J. Biol. Chem.
271: 25859-25863.

90
[25] Lewis, R. S. and Deen, W. M. (1994) Kinetics of the reaction of nitric oxide with oxygen
in aqueous solutions. Chem. Res. Toxicol. 7: 568-574.
[26] Levy, J. A., Virolain.M, and Defendi, V. (1968) Human lymphoblastoid lines from lymph
node and spleen. Cancer. 22: 517-524.
[27] Skopek, T. R., Liber, H. L., Penman, B. W., and Thilly, W. G. (1978) Isolation of a
human lymphoblastoid line heterozygous at thymidine kinase locus - Possibility for a
rapid human cell mutation assay. Biochem. Biophys. Res. Commun. 84: 411-416.
[28] Chuang, Y. Y. E., Chen, Q., and Liber, H. L. (1999) Radiation-induced mutations at the
autosomal thymidine kinase locus are not elevated in p53-null cells. Cancer Res. 59:
3073-3076.
[29] Liu, L., Taverna, P., Whitacre, C. M., Chatterjee, S., and Gerson, S. L. (1999)
Pharmacologic disruption of base excision repair sensitizes mismatch repair-deficient and
-proficient colon cancer cells to methylating agents. Clin. Cancer Res. 5: 2908-2917.
[30] Hofseth, L. J., Robles, A. I., Espey, M. G., and Harris, C. C. (2005) Nitric oxide is a
signaling molecule that regulates gene expression. Methods Enzymol. 396: 326-340.
[31] Green, L. C., Wagner, D. A., Glogowski, J., Skipper, P. L., Wishnok, J. S., and
Tannenbaum, S. R. (1982) Analysis of nitrate, nitrite, and [15
N]nitrate in biological fluids.
Anal. Biochem. 126: 131-138.
[32] Ridnour, L. A., Isenberg, J. S., Espey, M. G., Thomas, D. D., Roberts, D. D., and Wink,
D. A. (2005) Nitric oxide regulates angiogenesis through a functional switch involving
thrombospondin-1. Proc. Natl. Acad. Sci. U.S.A. 102: 13147-13152.
[33] Ridnour, L. A., Thomas, D. D., Switzer, C., Flores-Santana, W., Isenberg, J. S., Ambs,
S., Roberts, D. D., and Wink, D. A. (2008) Molecular mechanisms for discrete nitric
oxide levels in cancer. Nitric Oxide Biol. Chem. 19: 73-76.
[34] Caulfield, J. L., Wishnok, J. S., and Tannenbaum, S. R. (1998) Nitric oxide-induced
deamination of cytosine and guanine in deoxynucleosides and oligonucleotides. J. Biol.
Chem. 273: 12689-12695.
[35] Chin, M. P., Schauer, D. B., and Deen, W. M. (2010) Nitric oxide, oxygen, and
superoxide formation and consumption in macrophages and colonic epithelial cells.
Chem. Res. Toxicol. 23: 778-787.
[36] Li, C. Q., Wright, T. L., Dong, M., Dommels, Y. E. M., Trudel, L. J., Dedon, P. C.,
Tannenbaum, S. R., and Wogan, G. N. (2005) Biological role of glutathione in nitric
oxide-induced toxicity in cell culture and animal models. Free Radic. Biol. Med. 39:
1489-1498.

91
[37] Li, C. Q., Kim, M. Y., Godoy, L. C., Thiantanawat, A., Trudel, L. J., and Wogan, G. N.
(2009) Nitric oxide activation of Keap1/Nrf2 signaling in human colon carcinoma cells.
Proc. Natl. Acad. Sci. U.S.A. 106: 14547-14551.
[38] Keshive, M., Singh, S., Wishnok, J. S., Tannenbaum, S. R., and Deen, W. M. (1996)
Kinetics of S-nitrosation of thiols in nitric oxide solutions. Chem. Res. Toxicol. 9: 988-
993.
[39] Dong, M. and Dedon, P. C. (2006) Relatively small increases in the steady-state levels of
nucleobase deamination products in DNA from human TK6 cells exposed to toxic levels
of nitric oxide. Chem. Res. Toxicol. 19: 50-57.

92
Chapter 3
Nitric oxide-linked deamination kinetics of nucleic acids and
nucleosides
3.1 Introduction
In recent decades, a growing body of evidence demonstrates the multifaceted role of the
physiological radical, nitric oxide (NO), in the cardiovascular, nervous and immune systems
[1,2]. However, pathological overproduction of NO for prolonged periods at sites of
inflammation [3,4] is believed to be linked with initiation and progression of diseases such as
cancer [5,6]. The cytotoxic and cytostatic effects of NO at sufficiently high concentrations are
thought to be due to its reactive derivatives, namely peroxynitrite (ONOO─), the nitrogen dioxide
radical (NO2) and nitrous anhydride (N2O3), formed from the reaction of NO with superoxide
(O2) and molecular oxygen, respectively [7]. In particular, N2O3 is a strongly nitrosating species
that can attack the amino groups in heterocyclic bases of nucleic acids [8,9], among other
nucleophilic targets [10,11], and give rise to deaminated nucleobases, abasic sites and DNA
crosslinks (reviewed in [12]). It is likely that this type of nitrosative stress burdens host cells and
tissues with an additional level of chemical damage, one that may overwhelm cellular defense
and repair mechanisms, and eventually interfere with normal function and decision-making
processes, such as survival and proliferation versus growth arrest and cell death.
Nitrosative deamination alters the primary structure of nucleic acids by giving rise to
modified base products such as xanthine (X) and oxanine (O) derived from guanine (G),
hypoxanthine (I) from adenine (A), uracil (U) from cytosine, and thymine (T) from 5-methyl-

93
cytosine [12]. Deaminated nucleobases, detected in both nitrous acid solutions and oxygenated
NO solutions [13-15], are formed via an aryl diazonium intermediate following the reaction of
native bases with N2O3 in physiological pH [16], the end result being the replacement of the
primary amino group on the base moiety by an oxygen. A purine ring-opening and -closing
mechanism, proposed to support experimental findings of oxanine formation in acidic nitrite
environments [17], seemed consistent with results from other studies on nucleoside and DNA
deamination using the transnitrosating agent 1-nitroso-indole-3-acetonitrile [18,19]. However
this mechanism was not corroborated by previous research by Dedon and coworkers, in which 2-
deoxyoxanosine (dO) was not detected in DNA from human TK6 cells exposed to controlled
levels of NO and O2 [20] and from tissues from a mouse model of NO overproduction [21].
Based on our recent data however, we now believe the reported inability to detect dO was caused
by an artifactual reaction during sample processing and by the limited sensitivity of the analytical
instruments used in previous studies, as discussed shortly. In addition to deamination of
exocyclic amines, nitrosation is responsible for other nucleobase lesions including 2-
deoxyguanosine (dG) intrastrand cross-links [22] and depurination sites, whose formation is
attributed to the destabilization of the glycosidic bond in cationic bases formed by nitrosation of
the N7 in deoxyguanosine and N
7 or N
3 position in deoxyadenosine [18,19]. Nitrosation-
independent mechanisms leading to the accumulation of deaminated nucleobases include
hydrolysis at high temperatures [23,24], enzymatic editing of RNA and DNA [25], bisulfate
reactions with 2-deoxycytosine [26], mutations in key purine metabolism enzymes [27], or
deaminase contamination of commercial enzyme preparations [20,28].
Approximating the microenvironment of inflamed tissues in a laboratory setting with the
goal of assessing the extent of damage to nucleic acids caused by nitrosative deamination, among

94
others, has given rise to a number of NO-delivery strategies. Earlier quantitative studies showed
that activated macrophages are a source of pathologically high levels of NO [4], producing local
steady-state concentrations approaching 1 M [12,29]. This level of NO can be reached in a
solution by several means. “NONOates” release NO with predictable kinetics to provide
transient, non-uniform levels that must be averaged over time to define exposure [30]. Although
balancing NO release from NONOates with consumption by scavengers can lead to constant
steady-state levels of NO over several minutes [31], the difficulty of controlling the steady-state
concentration of NO with NONOates over longer periods of exposure [30,32] is compounded by
the unknown effects of the chemical species generated upon release of NO [30] and the fact that
different NO-donor compounds with different half-lives must be used to span a range of
exposure times [33]. Alternative methods of NO delivery include addition of aliquots of NO-
saturated aqueous solutions [34] or syringe bolus injection of NO gas into the reaction mixture
[15], which produce local NO “hotspots”, and co-culturing of NO-producing macrophages with
target cells, which involves poor control of NO levels and complicates interpretation of results
with multiple cell lines [35,36]. Perhaps the best characterized and most broadly applicable
system that mimics the nitrosative environment at sites of inflammation was developed by Deen
and coworkers using NO- and O2-permeable polydimethylsiloxane (Silastic) tubing to deliver the
gases at constant and predictable levels [28,37,38]. An accompanying mass transfer model was
developed to predict the concentrations of NO and O2 in the system given the values of certain
operational parameters [37], and a subsequent kinetic analysis estimated the levels of N2O3
formed in the solution [28], making the tubing-based delivery apparatus ideal for kinetic studies
of nitrosative deamination.

95
The effects of NO-induced deamination on DNA have been explored in numerous in
vitro studies [8,28,39]. Modest increases in deaminated DNA products reported in cells and
tissues under nitrosative stress [20,21] suggest that underlying factors (such as a reducing
environment in cells, efficient DNA repair, chromatin-associated protection, etc.) could lead to
low steady-state levels of nitrosative DNA damage in vivo. Those findings and others [40]
indicate that nucleobases in nucleic acids other than DNA may prove to be better indices of
nitrosative stress, and more particularly RNA which is less amenable to cellular repair. The
significance of surveying RNA modifications becomes even greater if one considers that N2O3-
induced changes in the sequence of coding and non-coding RNA species may have consequences
in gene expression, potentially affect the function of the translational machinery [41,42],
interfere with post-transcriptional RNA editing [25], or disrupt regulating elements strongly
correlated with the progression of different types of cancer [43-45].
The objective of the present work was to provide a rigorous estimation of the rate at
which nucleobase damage from NO-induced deamination is expected to occur in nucleic acids
and nucleosides under well controlled conditions representing the microenvironment of inflamed
tissues in vivo, especially after further limiting factors that affect the stability of accumulated
modifications. The juxtaposition of hypoxanthine, xanthine and oxanine levels measured in
purified RNA, genomic DNA and free nucleosides throughout the exposures was intended to
elucidate the susceptibility of nucleobases with varying degrees of solvent exposure to
deamination.
3.2 Materials and methods
3.2.1 Chemicals

96
Na2HPO4, NaH2PO4 and ammonium acetate were obtained from American Bioanalytical,
LC-MS grade acetonitrile from EMD, ethanol from Koptec. Glacial acetic acid, morpholine
(Mor), adenosine (rA), 2-deoxyadenosine (dA), guanosine (rG), 2-deoxyguanosine monohydrate
(dG), inosine (rI), 2-deoxyinosine (dI) and xanthosine (rX) were from Sigma (98% or higher
purity) whereas 2-deoxyxanthosine (dX) was synthesized as described in previous work [28].
Water purified through a Milli-Q system (Millipore) was used throughout the study.
3.2.2 Human cell cultures for total RNA and genomic DNA extraction
TK6 human lymphoblastoid cells obtained from ATCC were grown in large cultures for
the purpose of harvesting purified RNA and DNA. Cells were maintained in exponentially
growing suspension cultures at 37°C in a humidified atmosphere of 95% air and 5% CO2 in
RPMI-1640 medium supplemented with 10% (v/v) heat-inactivated horse serum, 100 units/mL
penicillin, 100 μg/mL streptomycin, and 2 mM L-glutamine. Stock cell cultures were routinely
passaged to maintain an optimal growth density (~1.0 × 10⁶ cells/mL) in 150 mm dishes. Cell
pellets harvested by centrifugation were washed with phosphate buffer saline (PBS) and
processed using Qiagen’s RNeasy Maxi Kits and Genomic-tip 500/G following the
manufacturer’s instructions. Extracted total RNA (2-4 mg per pellet containing ~600 × 106 cells)
and genomic DNA (0.5-0.7 mg per pellet containing ~100 × 106 cells) concentrations were
quantified by UV spectroscopy and stored at -80 oC until further use. RPMI-1640, L-glutamine,
streptomycin /penicillin and PBS were obtained from Lonza, horse serum from Atlanta
Biologicals, and trypan blue (4% in saline) for cell counting from Sigma.
3.2.3 Synthesis of isotopically labeled internal nucleoside standards

97
Uniformly 15
N-labeled internal standards of the DNA and RNA deamination products dI,
dX, dO, rI, rX and rO, were synthesized as described previously [40,46] from uniformly 15
N-
labeled deoxyribonucleosides (dA, dG) and ribonucleosides (rA, rG) as starting materials
(Cambridge Isotope Laboratories). Standards were purified by HPLC, characterized by LC-MS,
and quantified by UV absorbance using published extinction coefficients [46].
3.2.4 NO delivery system
A delivery system described in full detail in Chapter 2 [47] was employed to expose
purified nucleic acids and nucleosides to accurately controlled constant levels of NO and O2.
Briefly, two distinct gas streams (one for NO the other for O2) were fed to reactors (modified 120
mL PFA screw-top jars from Cole Parmer) containing solutions of nucleosides, DNA and RNA,
with NO and O2 diffusing separately into the liquid through gas permeable Silastic tubing loops
(6-7 cm long, 1.96 mm o.d., 1.47 mm i.d. from Dow Corning). The flow rates were 100 standard
cubic centimeters per minute (sccm) for the NO-feeding stream and 200 sccm for the O2- feeding
stream, for every reactor used. Gas flow rates were regulated via mass flow controllers obtained
from Porter Instruments, Parker-Hannifin. The contents of each reactor were kept stirred using a
magnetic stirrer plate from IKA (stirring speed at 100 rpm; stir-bar placed in every reactor) and
maintained at 37 oC within a water bath. Mixtures of 10% NO in argon, 1% NO in argon, 50%
O2 in N2 (and 5% CO2) and pure argon (for controls) were obtained from Airgas.
3.2.5 Exposing nucleosides, RNA, DNA and morpholine to NO
The delivery system described above was used to estimate the rate at which deamination
products form when individual nucleosides and nucleic acids were exposed to NO. Solutions of
rA, rG, dA and dG (6 μM each) in 50 mM sodium phosphate (Na-PO4) buffer pH 7.4 – prepared

98
from Na2HPO4, NaH2PO4 as described in ref. [48] – were separately exposed in reactors (~115
mL solution per reactor). A mass transfer model that simulates the system’s performance [37,47]
was used to determine lengths of tubing loops (in combination with a particular NO gas stream
content) necessary to achieve constant physiological levels of the dissolved gases in each reactor.
Two sets of conditions were employed leading to constant steady-state NO concentrations of: a)
~1.7 μM, by passing 10% NO in argon through a 7.0 cm Silastic tubing loop and 50% O2 in N2
(with 5% CO2) through a 6.3 cm loop, and b) ~0.7 μM, by passing 1% NO in argon through a 6.0
cm loop and 50% O2 in N2 (with 5% CO2) through another 6.0 cm loop (flow rates in both cases
were maintained as defined above). Oxygen levels were predicted to remain constant throughout
at ~210 μM in both cases. Solutions of rA, dA and dG were exposed in the former conditions (set
a) whereas rG was exposed in the latter (set b), to examine whether different NO/N2O3 levels
have an effect on deamination rate constants. At various time points after initiating gas flows, 0.5
mL aliquots were withdrawn from each reactor and replaced with an identical volume of fresh
solution.
Stock solutions of total RNA, generated as described above, were washed twice with
purified water using spin filters (NanoSep 10K Omega, Pall) before being treated in the delivery
system. Solutions of washed RNA (5 μg/mL) in 50 mM Na-PO4 buffer pH 7.4 were then
transferred to reactors (~115 mL in every reactor) with the proper combination of tubing loops to
achieve a steady-state NO concentration of ~1.7 μM (employing 10% NO; see above). All
buffers and reactors were autoclaved to completely neutralize the activity of remaining RNases
and avert RNA degradation. During exposures, 2.5 mL aliquots were withdrawn from each
reactor and replaced with an identical volume of fresh solution.

99
Exposure of genomic DNA solutions (20 μg/mL in 50 mM Na-PO4 buffer pH 7.4) were
performed similarly to RNA experiments, however stock solutions were not washed and buffer
or reactors were not autoclaved before experiments.
The rates of nucleobase deamination in nucleosides and nucleic acids were compared to
rates of Mor nitrosation for accuracy in the calculation of rate constants, discussed in more detail
below. Solutions of 2 mM Mor in 50 mM Na-PO4 buffer pH 7.4 were transferred to reactors
(~115 mL per reactor) and exposed to both set of conditions listed above (i.e. 1% NO and 10%
NO). Aliquots (0.1 mL) were withdrawn at regular intervals and subsequently replaced with an
identical volume of fresh solution.
3.2.6 Enzymatic hydrolysis of DNA and RNA
DNA samples (~50 μg) collected during NO exposures were maximally concentrated
using NanoSep 10K spin filters, resuspended in 100 μL water and quantified by UV
spectroscopy before hydrolysis to nucleosides. A combination of nuclease P1 (Sigma), DNase I
(Sigma), phosphodiesterase I (USB) and alkaline phosphatase (Sigma) were employed in the
presence of deaminase inhibitors (coformycin from DTP/NCI, tetrahydrouridine from
Calbiochem) and the antioxidant butylated hydroxytoluene (Sigma), as described previously
[46]. Deferoxamine was omitted due to its effect on oxanine stability demonstrated in the current
work. The following average amounts of internal standards were added to the digestion mixture
per sample: 11 pmol 15
N-dI, 11 pmol 15
N-dX and 9 pmol 15
N-dO.
Collected RNA samples (~13 μg) during exposures were concentrated, resuspended in
purified water and quantified similarly to DNA samples. RNA integrity was confirmed using
Bioanalyzer RNA Nano 6000 on-chip electrophoresis kits (Agilent), showing a predominance of
100
ribosomal RNA. Enzymatic hydrolysis of RNA, a variation of the method used for DNA, was
based on a recently developed protocol [40] with the only difference being the exclusion of
deferoxamine from the reaction mixture. Average amounts of internal standards added per
sample: 1.2 pmol 15
N-rI, 0.6 pmol 15
N-rX and 0.5 pmol 15
N-rO.
In both cases, enzymes were removed at the end of hydrolytic digestion processes by
NanoSep 10K spin filters and filtrates were concentrated under vacuum.
3.2.7 HPLC prepurification of DNA and RNA deamination products
Hydrolyzed DNA and RNA preparations were reconstituted with purified water to a total
volume of 100 μL and individual nucleosides were resolved and collected using a Agilent 1100
series HPLC system at empirically determined retention times adapted from previous work
[40,46]. Different chromatographic methods were used for DNA- and RNA-derived samples,
however both protocols entailed resolution of nucleosides on a Phenomenex Synergi C18
reversed-phase column (250 x 4.6 mm, 4 μm particle size, 80 Å pore size) with elutions
performed at a 0.5-1 mL/min flow rate of 8 mM ammonium acetate solvent (A) with a stepwise
increasing gradient of pure acetonitrile (B); details are given in Table B.1 (Appendix B). Elution
times for the native and target nucleosides are shown in Figure B.1 (Appendix B). Blind
collected fractions containing the target nucleosides (rI, rX, rO, dI, dX, dO) were desiccated
under vacuum, redissolved in 50 μL water and analyzed by LC-MS/MS.
3.2.8 LC-MS/MS quantification of deamination products in DNA, RNA and nucleosides
Levels of deamination products in NO-treated and enzymatically hydrolyzed DNA and
RNA samples were quantified by liquid chromatography-coupled triple quadrupole mass
spectrometry (LC-MS/MS) using an Agilent 1100 series HPLC system interfaced with an AB

101
Sciex API 3000 tandem quadrupole MS with a turbo ion spray source. Resolution of target
nucleosides was achieved on a Thermo Fisher Hypersil Gold aQ C18 reverse-phase column (150
x 2.1 mm, 3 μm particle size) using isocratic conditions of 0.1% acetic acid (A) and 0.7-3% v/v
acetonitrile (B), depending on the target nucleoside, at a 0.2 mL/min flow rate; elution times,
content of solvent B and column temperature for each of the target nucleosides are listed in Table
B.2 (Appendix B). The MS was operated in positive ion mode with the first and third
quadrupoles fixed to unit resolution. Multiple reaction monitoring (MRM) mode was used for
sample detection with dwell times set to 200 ms. Mass spectrometric parameters were optimized
for maximal sensitivity and are displayed in Table B.3 (Appendix B).
Deamination products forming in NO-treated nucleoside solutions were quantified
directly (no hydrolysis or prepurification took place) using an Agilent 6410 triple quadrupole
mass spectrometer interfaced with an Agilent 1100 series HPLC system and the Hypersil Gold
aQ column mentioned above along with the same solvents (A: 0.1% acetic acid, B: acetonitrile)
to resolve the target nucleosides. The effluent from the LC system was diverted to waste when
not detecting nucleosides to minimize contamination of the electrospray ionization source
(details of the chromatographic runs in Tables B.4 and B.5, Appendix B). The MS was operated
in positive ion MRM mode with dwell times set to 200 ms. Mass spectrometric parameters were
optimized for maximal sensitivity (displayed in Table B.6, Appendix B). The following average
amounts of internal standards were individually added immediately prior to MS analysis
depending on which deamination product was measured: 30 fmol 15
N-dI, 65 fmol 15
N-dX, 15
fmol 15
N-dO, 70 fmol 15
N-rI, 50 fmol 15
N-rX and 20 fmol 15
N-rO.
Linear calibration curves (r2 > 0.98) for the isotope-labeled and unlabeled forms of each
of the deamination products were generated for both MS systems. The two MS systems proved

102
to be equivalent since measurements of deamination products formed in RNA using both
strategies led to coinciding kinetic profiles.
3.2.9 Detection of morpholine nitrosation
In morpholine (Mor) nitrosation experiments, the formed product N-nitroso-morpholine
(NMor) was quantified by UV absorbance (ε = 5500 M-1
cm-1
at 250 nm [49]) in 0.1 mL aliquots
withdrawn from the reactors at regular intervals.
3.2.10 Kinetics of oxanine degradation
Stock solutions of dO and rO were generated by bubbling 100% NO gas through
saturated dG and rG solutions in purified water, respectively, at room temperature while
deamination products were isolated using the HPLC prepurification methods described above.
The identity of dO and rO was confirmed by their characteristic UV absorbance signature
(Figure B.2 in Appendix B; in agreement with previous reports in literature [50,51]) and elution
times based on the aforementioned LC protocols; stock solutions were quantified by UV
absorbance using published extinction coefficients [46]. Known amounts of dO and rO (6 μM) in
30 mM sodium acetate buffer pH 7.8 were incubated in 25 oC or 37
oC with varying
concentrations of deferoxamine (Sigma). The reaction mixtures were resolved via HPLC and
levels of unaffected dO, rO were monitored by quantifying their corresponding elution peaks
based on UV absorbance.
3.2.11 Reaction scheme for NO-induced nitrosation and deamination
In aqueous media at physiological pH, NO reacts with oxygen, as illustrated in the
following reactions:

103
k1
2ONO2 2NO2 (1)
k2
2NONO 32ON
(2)
k-2
k3
OHON 232
H22NO-2 (3)
When NO is the only nitrogen oxide added to the system, intermediates NO2 and N2O3
are present only in trace quantities [16], which justifies pseudo-steady state approximations for
their concentrations, and N2O3 is the principal nitrosating agent in the solution [10]. The majority
of N2O3 is directly hydrolyzed to the stable end product nitrite (NO2–) as shown in reaction 3.
However hydrolysis is accelerated in the presence of certain anions that act as ‘scavengers’,
overall decreasing N2O3 levels available to react with other targets, e.g. primary and secondary
amines. Reaction 4 represents the additional hydrolysis pathway occurring due to inorganic
phosphate (Pi):
k4
OHPON 2i32
H2P2NO i-2 (4)
In solutions of 50 mM Na-PO4 used for all exposures, reaction 4 is calculated to be ~25-
fold faster than reaction 3, illustrating the catalytic effect of phosphate buffer in hydrolyzing
N2O3 and reducing its steady-state levels.
The small fraction of N2O3 that is not consumed by (anion-assisted) hydrolysis can lead
to other reactions, depending on which substrates are added to the mixture. In experiments where

104
Mor was also present in the buffer, a reaction that takes place in addition to those listed above is
the nitrosation of Moro (unprotonated Mor) to produce NMor:
k5
o32 MorON
HNONMor -
2 (5)
Alternatively, when exposing nucleosides to NO (without any Mor present), the
following deamination reactions are considered in lieu of Mor nitrosation:
k6
rAON 32
HNOrI -2 (6)
k7
rGON 32
HNOrX -2 (7)
k8
rGON 32
HNOrO -2 (8)
k9
dAON 32
HNOdI -2 (9)
k10
dGON 32
HNOdX -2 (10)
k11
dGON 32
HNOdO -2 (11)
Each of the nucleosides rA, rG, dA and dG were individually exposed to NO (i.e. in
separate reactors), however rX and rO formed simultaneously as products of reactions 7 and 8 in
the same vessel(s) containing rG; similarly reactions 10 and 11 occurred in parallel when dG was
treated. The reaction between N2O3 and cytidine was not considered since the corresponding

105
deamination product, uridine, is a naturally abundant nucleobase in RNA, making detection of
small amounts generated by deamination very challenging (uridine and thymidine do not have
exocyclic amino groups in their nucleobase to react with N2O3).
For experiments involving nucleic acids, two sets of rate constants were defined,
mirroring reactions 6-11 displayed above: k12, k13, k14 for rI, rX and rO, respectively, forming
concurrently when N2O3 reacted with RNA and k15, k16, k17 for dI, dX and dO produced in the
case of NO-exposed DNA. Rate constants for reactions 1-5 are known (listed in Table 3.1)
whereas those for reactions 6-17 were derived from comparing observed rates for Mor
nitrosation and deamination, as will be discussed below.
3.2.12 Kinetics of deamination and nitrosation – estimation of concentrations and rate
constants
Values of reactant concentrations are essential to calculating the unknown rate constants
stated above, but there is no direct way to determine trace levels of N2O3 (as opposed to
dissolved NO and O2 by electrodes [47]). On the other hand, since the kinetics of Mor nitrosation
by N2O3 are known [10], the rate of NMor formation can be used as a measure of the N2O3
concentration achieved in Mor exposures; the same N2O3 levels are expected to form in
experiments with nucleosides and nucleic acids in which buffer and exposure conditions were
identical to those with Mor exposures. This approach is especially useful since earlier work has
shown that, besides the well-stirred bulk liquid where the aforementioned intermediates are
present only in trace levels, the exposure reactor develops a ~1 μm thick boundary layer adjacent
to the NO-feeding Silastic tubing loop where the concentrations of NO2 and N2O3 greatly exceed
those in the bulk liquid [37]. Although this boundary layer is localized virtually on the surface of

106
Table 3.1. Reaction rate constant values.
rate constant value (37 oC) units ref.
k1 2.4 × 10⁶ M
-2 s
-1 [16]
k2 1.1 × 10⁹ M
-1 s
-1 [52]
k-2 8.0 × 10⁴ s
-1 [52]
k3 2.1 × 10³ s
-1 [53]
k4 1.1 × 10⁶ M
-1 s
-1 [10]
k5 6.5 × 10⁷ M
-1 s
-1 [10]
Values for k2, k-2 reported in 20 oC; k3 estimation at 37
oC based on activation energy also
reported in ref [53]; k4, k5 calculated based on k3 values as indicated in ref [10].

107
the tubing, most molecules are small enough to enter it and consequently be exposed to its local
concentrations. Substrates in the reactor are affected not only from the bulk liquid but also from
the boundary layer region, which despite its much smaller volume was found to contribute
significantly towards nitrosation/deamination.
Focusing just on the bulk liquid region in experiments involving Mor, the quasi-steady
state approximation in kinetics is valid and applicable to both NO2 and N2O3. Combining the
corresponding expressions for both species (considering all terms of formation vs. consumption
in reactions 1-5) and solving for the N2O3 concentration yields:
][Mor]P[
]O[NO][2]O[N
o5i43
22
132
kkk
k
(12)
Given that a) [NO] and [O2] are fixed in the delivery reactor, b) the low yield of NMor
formation did not significantly affect Moro levels (up to ~5 μM vs. ~270 μM, respectively), and
c) values for the relevant rate constants are available (Table 3.1), the steady-state N2O3
concentration forming in the reactor is constant (independent of time) and can be readily
calculated. To estimate how the boundary layer contributes to nitrosation, the rate law expression
derived from reaction 5 is employed:
]ON[]O[N][Mordt
NMor][d3232
o5 k
(13)
where the apparent increment in the bulk N2O3 concentration to which Mor is exposed, denoted
as ]ON[ 32 , is attributed to the boundary layer region. Using experimentally measured rates of

108
NMor formation and calculated values of [N2O3] discussed above, equation 13 reveals the degree
to which the boundary layer adds to the overall rate of reaction.
Similar contributions to deamination from the two aforementioned liquid regions are
expected to appear also when solutions of nucleosides (or nucleic acids) are treated in the
reactor. In that case, no Mor nitrosation takes place while total hydrolysis illustrated in reactions
3 and 4 is assumed to be much faster, and thus more significant, than any deamination reaction
occurring in the system (as will be shown). Hence the quasi-steady state approximation gives the
resulting expression for the bulk N2O3 concentration, taking into account reactions 1-4:
]P[
]O[NO][2]O[N
i43
22
1D32
kk
k
(14)
The ratio of time independent bulk steady-state N2O3 concentrations shown in equations
12 and 14 is also a constant, denoted as α:
][Mor]P[
]P[
]O[N
]O[No
5i43
i43
D32
32
kkk
kk (15)
shown to be arithmetically equal to the ratio of boundary layer contributions to N2O3
concentrations in nitrosation and deamination experiments (derivation discussed in the
Supplementary material of ref [28]):
D32
32
]O[N
]O[N (16)
Applying the rate law to reaction 6 (deamination of rA), as an example, gives:
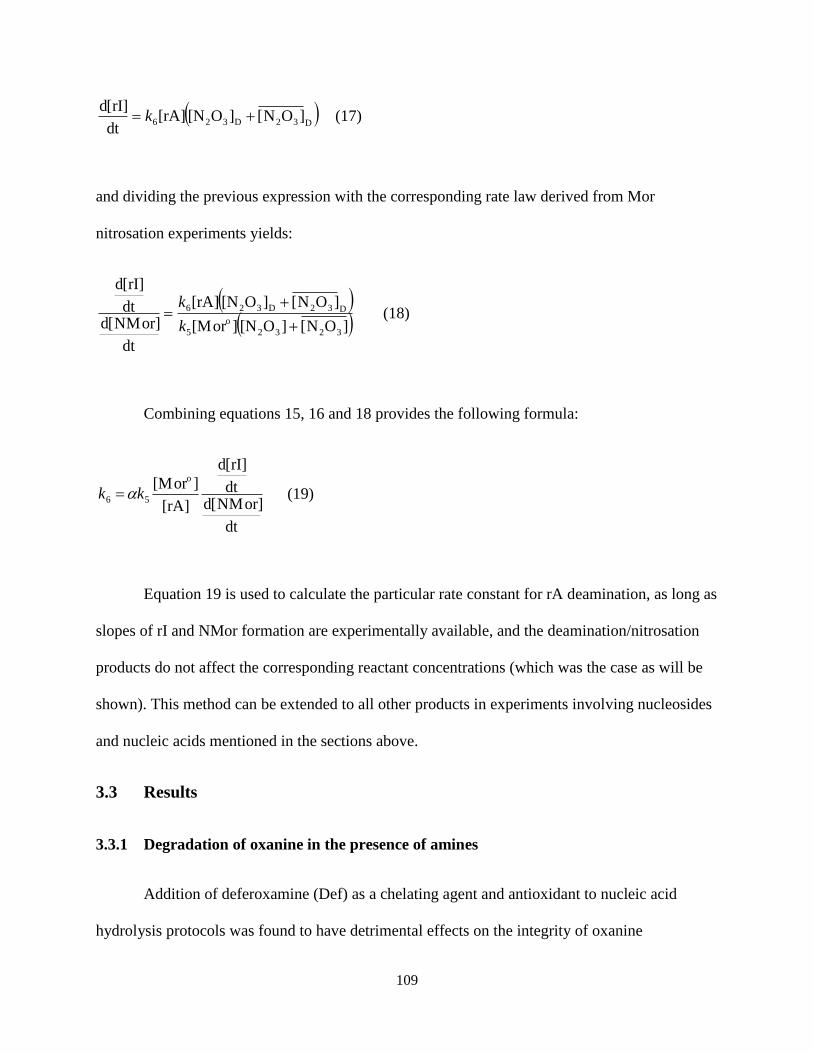
109
D32D326 ]ON[]O[N][rA
dt
rI][d k (17)
and dividing the previous expression with the corresponding rate law derived from Mor
nitrosation experiments yields:
]ON[]O[N][Mor
]ON[]O[N][rA
dt
NMor][ddt
rI][d
3232
o
5
D32D326
k
k (18)
Combining equations 15, 16 and 18 provides the following formula:
dt
NMor][ddt
rI][d
][rA
][Moro
56 kk (19)
Equation 19 is used to calculate the particular rate constant for rA deamination, as long as
slopes of rI and NMor formation are experimentally available, and the deamination/nitrosation
products do not affect the corresponding reactant concentrations (which was the case as will be
shown). This method can be extended to all other products in experiments involving nucleosides
and nucleic acids mentioned in the sections above.
3.3 Results
3.3.1 Degradation of oxanine in the presence of amines
Addition of deferoxamine (Def) as a chelating agent and antioxidant to nucleic acid
hydrolysis protocols was found to have detrimental effects on the integrity of oxanine

110
nucleosides. As shown in Figure 3.1, in the presence of 2.5 mM Def at 23 oC (30 mM sodium
acetate buffer pH 7.8) more than 99% of 6 μM dO decomposes in less than 8 h, with dO
depletion accelerated by higher Def concentrations and temperatures. After comparing these
kinetic profiles with conditions reported in a recent hydrolysis protocol [46] (incubation with
1.5-2.5 mM Def at 37 oC for at least 15 h), it becomes evident that the use of this antioxidant
during dO analysis interferes with the detection of dO that may have formed in nucleic acids.
Similar degradation kinetics were observed when the reaction was repeated with rO in 10 mM
Def at 23 oC (in 30 mM sodium acetate buffer pH 7.8) as depicted in Figure 3.2, suggesting that
the sugar on the nucleoside does not significantly affect the observed decomposition rates. The
basis for Def degradation of dO likely involves a reaction of the primary amine of Def with the
carbonyl group of dO, as observed in studies of the reaction of dO with glycine [54]. This is
illustrated in Figure 3.3.
Interestingly, we observed formation of dX under the experimental conditions that
yielded the fastest dO depletion (i.e., 10 mM Def, 37 oC in Figure 3.1) as shown in Figure 3.4,
albeit at a much slower rate than the dO decomposition. These results point to a previously
unidentified amine-catalyzed conversion of dO to dX.
The same pattern was observed when dO (~0.7 mM in 30 mM sodium acetate buffer pH
7.8) was incubated at 60 oC in the absence of Def, as shown in Figure 3.5 (incubation at 37
oC
did not show any appreciable dO degradation). In this case, it is likely that the primary exocyclic
amine of the dO nucleobase attacks the C-6 position of another dO, causing ring-opening and
conversion to dX. These results suggest that the rate of the dO decomposition and dX formation
reactions is not only affected by the concentration of total primary amine in the mixture but also
by the nature of the attacking amine itself. Def-induced dO degradation taking place at a pH ~6

111
Figure 3.1. Degradation kinetics of 2-deoxyoxanosine (dO).
Depletion of dO in varying deferoxamine concentrations and temperatures (data represent mean
± S.D. for n = 3).

112
Figure 3.2. Comparison of oxanosine (rO) and 2-deoxyoxanosine (dO) degradation kinetics.
Time course of rO and dO degradation in the presence of 10 mM deferoxamine at 23 oC (data
represent mean ± S.D. for n = 3).

113
Figure 3.3. Amine-induced ring-opening mechanism depleting oxanine nucleobases.
The ring-opened adduct is derived from the nucleophilic attack of primary amines at the
electrophilic C-6 position in oxanine.

114
Figure 3.4. Formation of 2-deoxyxanthosine (dX) from 2-deoxyoxanosine (dO) in the presence
of deferoxamine.
Time course of dX formation during degradation of 6 μM dO in the presence of 10 mM Def at 37
oC (data represent mean ± S.D. for n = 3).

115
Figure 3.5. Formation of 2-deoxyxanthosine (dX) from 2-deoxyoxanosine (dO) in the absence of
amine.
Time course of dO degradation and concurrent dX formation during incubation at 60 oC (data
represent mean ± deviation about the mean for n = 2).

116
(in 30 mM sodium acetate buffer) revealed a more than 5-fold decrease in the observed depletion
rate compared to the same buffer at a pH 7.8 (consistent with a decrease in levels of
unprotonated Def); the integrity of hypoxanthine- and xanthine-containing nucleosides was not
affected by the presence of deferoxamine (data not shown).
3.3.2 Determination of N2O3 concentration in the NO-delivery system
Reliable estimates of N2O3 levels to which nucleosides and nucleic acids are exposed in
the NO-delivery reactor are necessary to elucidate the deamination kinetics pertaining to each
species. Experiments involving exposure of Mor to NO were instrumental in determining the
relative effect of the boundary layer region discussed in the Methods section. Only the
unprotonated form of Mor (Moro) reacts with N2O3 as shown in reaction 5. Thus, in solutions of
2 mM Mor (in 50 mM phosphate buffer, pH 7.4), [Moro] is calculated to be 274 μM (pKa of Mor
is 8.2 at 37 oC [55]). Based on those values, along with the steady NO (1.7 μM) and O2 (210 μM)
levels maintained in the reactor, equation 12 predicts that [N2O3] – i.e. the steady-state
concentration in the bulk liquid region – is 39 fM. However, a production rate of N-
nitrosomorpholine (NMor) measured at 0.105 ± 0.008 μM/min (Figure 3.6; [Moro] virtually
unaffected by NMor formation) reveals a significant contribution stemming from the boundary
layer despite its much smaller volume: solving equation 13 for the apparent N2O3 concentration
increment and using the experimental and calculated values mentioned above yields ]ON[ 32 =
59 fM. In other words, the boundary layer-associated term cannot be ignored since it increases
the apparent N2O3 concentration in the reactor by ~150% (compared to the value calculated
solely in the bulk region). In experiments with nucleosides and nucleic acids – where buffer,
temperature, and exposure conditions were identical to those involving Mor – equations 14, 15

117
Figure 3.6. Time course of N-Nitrosomorpholine (NMor) formation from exposure of
Morpholine (Mor) to NO/N2O3.
Formation of NMor in 2 mM Mor solutions (50 mM Na-PO4 pH = 7.4) at 37 oC during delivery
of 1% and 10% NO gas corresponding to 0.7 μM and 1.7 μM steady-state dissolved NO levels,
respectively (data represent mean ± S.D. for n = 3).

118
and 16 can be used to calculate the corresponding N2O3 concentrations. In particular, the
calculated constant α = 0.76 indicates that relatively higher N2O3 levels form in both liquid
regions during all the deamination experiments, compared to those involving nitrosation (the
absence of millimolar levels of Mor decreases the total consumption of N2O3). For the subset of
experiments taking place at 0.7 μM NO, similar calculations led to the following values:
d[NMor]/dt = 0.016 ± 0.004 μM/min (Figure 3.6), [N2O3] = 6 fM, ]ON[ 32 = 9 fM, α = 0.76. The
steady-state NO concentrations examined in this work are comparable with those measured in
the vicinity of activated macrophages [4] or those predicted in inflamed tissues by kinetic models
[29], hence the results displayed below are expected to be relevant to the chemical
microenvironment at sites of inflammation.
3.3.3 Deamination kinetics of nucleosides
Exposing nucleosides to the well-controlled levels of NO in the delivery system provides
an effective platform for calculating deamination rate constants. Solutions of ribonucleosides rA
and rG in 50 mM Na-PO4 pH 7.4 buffer were exposed in separate reactors to 1.7 and 0.7 μM
NO, respectively, with aliquots withdrawn at regular intervals (different NO levels were used
based on early indications that rA is less susceptible to deamination than rG). The resulting
deamination products were analyzed by LC-MS/MS, as discussed in the Methods section (no
further sample processing), with the results showing time-dependent increases of rI from rA, and
both rX and rO from rG, as depicted in Figure 3.7. Although product accumulation was too small
to significantly alter initial concentrations of rA and rG, it still provided the necessary slopes –
derived from a linear least squares fit on each of the data sets displayed in Figure 3.7 – to
calculate the corresponding rate constants. Taking rI formation as an example, the fitted slope

119
Figure 3.7. Time course for the formation of rI, rX and rO from rA and rG exposed to NO and
O2.
Deamination products rI, rX and rO formed during exposure of rA (6 μM) and rG (6 μM) to 1.7
μM and 0.7 μM NO, respectively, and 210 μM O2 in both cases (data represent mean ± S.D. for n
= 3-4). Data were subjected to linear regression analysis and resulting fitted slopes were used in
rate constant calculations.

120
(d[rI]/dt) was determined to be 0.9 (± 0.3) nM/h. Based on that value and other inputs (α,
d[NMor]/dt, [Moro] calculated above; k5 listed in Table 3.1; rA remained nearly constant at 6
μM) equation 19 yields: k6 = 3.4 (± 1.0) × 105 M
-1s
-1. Extending the same strategy in the case of
rX and rO, an adapted version of equation 19 yields the following rate constants: k7 = 7.1 (± 2.0)
× 106 M
-1s
-1 and k8 = 1.7 (± 0.4) × 10
6 M
-1s
-1. This is the first time that kinetics of oxanine
accumulation were determined when rG was exposed to precisely controlled levels of NO in
vitro, and it is the first evidence for different levels of susceptibility to deamination for rA and
rG. Closely similar rate constants – shown in Table 3.2 – were derived from data obtained when
dA and dG were subsequently exposed in delivery reactors (Figure 3.8), which demonstrates that
the sugar moiety of the nucleosides does not affect the deamination rates. The terms k6[rA],
k7[rG] and k8[rG] are all much smaller than k4[Pi] which validates the simplification made in the
denominator of equation 14; the same is true for terms k9[dA], k10[dG] and k11[dG].
3.3.4 Deamination kinetics in RNA and DNA
The rate of formation of deamination products in nucleic acids exposed to accurately
defined N2O3 concentrations revealed a significant protective effect of macromolecular structure,
in comparison to free nucleosides. Employing again the predictable conditions maintained in the
NO-delivery reactor, pure RNA (5 μg/mL) and DNA (20 μg/mL) in Na-PO4 buffer were
separately exposed to constant femtomolar levels of N2O3 for several hours while 2.5 mL
aliquots were withdrawn from the reaction vessels at regular intervals. Collected samples were
subsequently hydrolyzed to mixtures of nucleosides with a combination of enzymes discussed in
the Methods section, while the target lesions – rI, rX, rO in RNA experiments and dI, dX, dO in
DNA samples – were resolved using LC pre-purification strategies followed by accurate
quantification through LC-MS/MS. The time course of deaminated nucleobases accumulating in

121
Table 3.2. Deamination rate constants resulting from the reaction of N2O3 with free nucleosides
at 37 oC. Data represent mean ± S.D. for n = 3.
rate constant Value (M-1
s-1
)
ribonucleosides
k6 (rI) 3.4 (± 1.0) × 105
k7 (rX) 7.1 (± 2.0) × 106
k8 (rO) 1.7 (± 0.4) × 106
2-deoxyribonucleosides
k9 (dI) 3.6 (± 0.8) × 105
k10 (dX) 9.7 (± 2.5) × 106
k11 (dO) 3.0 (± 0.9) × 106

122
Figure 3.8. Time course for the formation of dI, dX and dO from dA and dG exposed to NO and
O2.
Deamination products dI, dX and dO formed during exposure of dA (6 μM) and dG (6 μM) to
1.7 μM and 210 μM O2 (data represent mean ± S.D. for n = 2-3).

123
N2O3-treated RNA and DNA throughout exposures is summarized in Figure 3.9. As observed for
nucleosides, guanine is relatively more susceptible to nitrosative deamination than adenine.
Examining the fitted slopes in Figure 3.9 also indicates that the reactivity of RNA nucleobases is
comparable to those in DNA, hence the single- or double-stranded structure (i.e. differences in
the degree of base pairing) does not seem to significantly affect the rate at which nucleobases in
nucleic acids are attacked by N2O3. The rate constants for the reaction between N2O3 and purines
in RNA and DNA can be calculated from variations of equation 19. Focusing on rI formation in
RNA, for instance, the least squares fit on the product accumulation rate was estimated at 8.2 (±
0.7) × 10-7
μM/min (Figure 3.9) while the initial concentration of the parent nucleoside, [rA], at
approximately 3.7 μM based on the total amount of RNA in solution. Taking into account
measurements of Mor nitrosation performed in identical conditions discussed previously, the rate
constant for the reaction between N2O3 and adenosine in RNA was found to be k12 = 2.9 (± 0.2)
× 104 M
-1s
-1. A similar set of calculations in the case of rX and rO formed in RNA, as well as for
dI, dX and dO in DNA, led to the rate constants listed in Table 3.3 which facilitates a more
quantitative comparison of nucleobase reactivity in polymeric nucleic acids and their
corresponding monomers (see Table 3.2).
3.4 Discussion
The multitude of reactive species resulting from NO generation in vivo adds layers of
complexity to its multifaceted role as a free radical in human physiology [12,56]. In particular,
nitrosative stress expected at sites of NO overproduction (e.g. inflamed tissues) may affect a host
of cellular components, among which nucleic acids are crucial for both maintaining proper
genetic information and controlling gene expression. While nitrosative deamination of
nucleobases has been studied using plasmid DNA and oligonucleotides as model substrates,

124
Figure 3.9. Time course for the formation of purine deamination products in RNA and DNA
exposed to NO and O2.
Kinetic profile of rI, rX, rO formation in total RNA (5 μg/mL) and dI, dX, dO formation in
genomic DNA (20 μg/mL) during exposures to 1.7 μM NO and 210 μM O2 (data represent mean
± S.D. for n = 3). Data were subjected to linear regression analysis and resulting fitted slopes
(solid lines for product formation in RNA and dashed lines in DNA) were used for rate constant
calculations (k12, k13, k14 for deamination occurring in RNA and k15, k16, k17 in DNA).

125
Table 3.3. Deamination rate constants derived from the reaction between N2O3 and nucleosides
in RNA and DNA at 37 oC. Data represent mean ± S.D. for n = 3.
rate constant value (M-1
s-1
)
RNA
k12 (rI) 3.3 (± 1.0) × 104
k13 (rX) 1.0 (± 0.2) × 106
k14 (rO) 4.8 (± 1.2) × 105
DNA
k15 (dI) 3.0 (± 0.7) × 104
k16 (dX) 1.2 (± 0.3) × 106
k17 (dO) 5.9 (± 1.4) × 105

126
there has been no evidence so far as to whether this type of chemistry affects RNA differently
from DNA. Here we used a system for controlled delivery of NO (described extensively
elsewhere [37,47]) to closely simulate the microenvironment believed to occur at sites of
inflammation mainly due to activated macrophages [4] and maintain the steady conditions
necessary to study the kinetics of deamination of nucleobases in polymeric nucleic acids and
their corresponding monomers. In parallel, optimized experimental conditions permitted the
rigorous quantification of an elusive nucleobase, oxanine, thus expanding the spectrum of
observable deamination products in nucleic acids.
3.4.1 Formation of oxanine
Oxanine was initially detected as a secondary deamination product forming concurrently
with xanthine when dG and DNA were incubated with nitrous acid (pH ~4) or when buffer
solutions of dG were exposed to NO gas [14,17]. That evidence prompted a series of focused
investigations in NO-treated human cells [20] and tissues from a mouse model of inflammation
[21] aiming to measure levels of deamination products accumulated in cellular DNA due to
nitrosative stress experienced in both instances. The experimental methods employed during
those studies however were unable to detect any dO in the genome (as opposed to dX which was
quantified to reach a level of ~5 lesion per 106 nucleobases), leading the authors to the
conclusion that the double-stranded structure of DNA in neutral pH may have prevented the
formation of oxanine, a hypothesis supported by theoretical studies of guanine deamination
involving a proposed ring-opened intermediate that closes to form either of the two products
[57]. The previously noted absence of oxanine stands in direct contrast with results in the current
work that demonstrate simultaneous formation of xanthine and oxanine in solutions of free
nucleosides, RNA and DNA in neutral pH buffer when exposed to controlled levels of NO

127
(Figure 3.7, Figure 3.8, and Figure 3.9). In retrospect, this disagreement can be explained by the
fact that previous studies in cells and tissues used certain amines (spermine, spermidine in ref
[20]; deferoxamine in ref [21]) throughout their enzymatic hydrolysis protocols as antioxidants
and chelating agents. It is evident from data presented here (Figure 3.1) that millimolar levels of
deferoxamine can significantly degrade dO within a fraction of the total incubation time. Hence
it is possible that the aforementioned antioxidants had a similar effect on dO nucleosides present
in samples derived from hydrolyzed DNA. It is possible that this specific type of degradation
affected the examined samples and led to reduced amounts of intact dO, well below the limit of
detection of the quantification methodologies employed. We argue that the published protocols
employing amine-based antioxidants mentioned above, and elsewhere (e.g. [46]), may have
inadvertently and selectively hindered the accurate determination of dO in samples of NO-treated
nucleic acids (stability of dI, rI, dX and rX unaffected by deferoxamine; data not shown) whereas
the present study avoided this issue altogether by omitting deferoxamine (or any type of primary
amine antioxidant) from the hydrolysis procedure. Consequently, improved protocols need to be
applied in future iterations of experiments that will re-examine the possibility of oxanine
formation as a product of in vivo NO-associated deamination. This possibility is strongly
supported by our results indicating accumulation of rO in RNA extracted from NO-treated
human cells discussed in a later chapter.
3.4.2 Conversion of oxanine to xanthine
The current findings showing oxanine rearranging to xanthine in the presence of
deferoxamine may complicate the interpretation of results related to previous studies of guanine
deamination. As mentioned previously, nitrosation of guanine by N2O3 is proposed to yield a
ring-opened cyanoimino-oxomethylene-imidazole intermediate [57] that closes again and gives

128
rise to either xanthine and oxanine as stable end products. The electrophilic C-6 position of the
oxanine nucleobase however was found to be sensitive to a nucleophilic attack by primary
amines (e.g., by addition of glycine in previous studies [54] and deferoxamine examined above),
which leads to a different proposed ring-opened diamide derivative (Figure 3.3). This clearly
suggests that oxanine is a labile nucleobase under certain conditions or environments and it
presents significant challenges to its quantification, which might explain the contradictory
evidence from several recent studies aiming to detect its presence in nucleic acids. The stability
of the resulting diamide derivative is not yet fully explored, which raises the important question
of whether the given conditions can reversibly lead back to ring closure. Previous studies
claimed that when NH3 is added in the presence of dO (i.e. R = H in Figure 3.3) the ring-opening
reaction is expected to be irreversible [58], probably due to the inert nature of the resulting
proximal amide moieties. Conversely, our data suggest that when a larger amine (in this case
deferoxamine) reacts with dO, a ring closure reaction may occur. Due to the movement of an
oversized R-group (shown in Figure 3.10) the bond between the carbonyl and the nitrogen atom
adjacent to R is forced to rotate extensively, freeing the nitrogen’s delocalized electrons and
consequently allowing them to react with the electrophilic carbon on the opposite amide. In
general, large groups connected to the amide nitrogen have been previously shown to affect the
availability of its electron pair [59]; altered amide chemistry is also observed through steric
distortion on amide linkages [60]. Hence, we deduce that the attached deferoxamine is
responsible for enhancing the reactivity of the amide nitrogen which in turn accelerates the rate
of collisions that eventually produce the observed amounts of dX. No dO formation is predicted
by this scheme, which is consistent with our findings.
The reactions of oxanine decomposition in the presence of amines and simultaneous

129
Figure 3.10. Proposed ring closing mechanism that leads to xanthine formation.

130
formation of xanthine can take place even when oxanine is the only base present in solution, as
suggested from our data displayed in Figure 3.5. The exocyclic amine attached to the C-3
position of the oxanine nucleobase is believed to attack the C-6 position of a neighboring
oxanine molecule analogously to the amine deferoxamine, although a higher temperature is
required to compensate for the apparent lower efficiency of the oxanine exocyclic amine as a
nucleophile. Besides the obvious implications of exposing samples with oxanine nucleosides at
room temperature – or higher – in solutions that contain primary amines (e.g. at millimolar
levels), this observation also points to a potential issue with purified stock solutions of dO and
rO used as standards for rigorous MS quantitation, among other uses. In the latter case, the
composition of the standards may be affected by partial decomposition of oxanine and gradual
formation of xanthine nucleosides if the solutions maintain ambient temperature for extended
periods of time (or long term storage outside a freezer). Amine-associated degradation could
theoretically affect the oxanine content of nucleic acids even during enzymatic hydrolysis
without deferoxamine, especially since individual samples can contain up to ~2 mM of primary
amines in a mixture of native nucleosides (e.g., calculated from ~50 μg fully hydrolyzed DNA in
100 μL). However, our studies did not show any significant degradation at 37 oC, consistent with
what was observed in experiments containing solely dO, which indicates the relatively
unreactive nature of primary amines in nucleobases at that temperature. Putting what was
discussed above in perspective, there is a possibility that the challenge in detecting oxanine in
vivo may also be partly due to the local environment (e.g. the nucleophilic primary amines of
histone proteins in proximity to DNA nucleobases [61]) in addition to the analytical steps
following the extraction of nucleic acids from cells. It would be interesting to examine, for
example, whether accumulated dO in genomic DNA could be susceptible to degradation

131
catalyzed by the amine-rich nuclear microenvironment and if part of what previous studies
measured as total dX was in fact derived from the dO-to-dX conversion that we discussed above.
3.4.3 Comparison of deamination rates in nucleosides and nucleic acids
The current work is the first comprehensive study that provides insight on the kinetics of
N2O3 reacting with adenine and guanine, not only as nucleobases in RNA and DNA polymers
but also in the form of the corresponding monomeric nucleosides. The biologically relevant
conditions of the NO-delivery system (exploited in numerous recent investigations
[20,38,47,62,63]) provide steady micromolar NO levels – similar to those believed to be
generated by activated macrophages in inflamed tissues [4,29] – which in turn give rise to
femtomolar concentrations of N2O3 in oxygenated aqueous solutions, as validated by measured
rates of morpholine nitrosation observed here as well as elsewhere [28]. The controlled
environment of constant temperature and near-neutral pH achieved in the delivery reactors
throughout exposures, along with the conditions maintained during enzymatic hydrolysis of
RNA and DNA (37 oC, pH 7.4, no addition of primary amine as antioxidant), is expected to limit
depurination of xanthine nucleosides (t1/2 > 2 years; [64]) and amine-associated degradation of
oxanine nucleosides to a minimum. Since the sources of artifacts currently known to skew the
quantitation of deamination products are eliminated to the best of our knowledge, a graphical
comparison of all 2nd
order deamination rate constants listed in Tables 3.2 and 3.3, shown in
Figure 3.11, is expected to more accurately depict differences in reactivity among all the species
examined and thus lead to a number of new interesting observations. Firstly, the rate at which
N2O3 reacts with the parent purines seems only marginally affected by the type of sugar attached
to the nucleobases: isolating the case of free nucleosides, comparable rate constants were derived

132
Figure 3.11. Calculated rate constants for the formation of deamination products in free
nucleosides, RNA and DNA.
Rate constant values are reproduced from Tables 3.2 and 3.3. Data represent mean ± S.D. for n =
3.
133
when both 2-deoxyribo- and ribonucleosides of adenine and guanine were used as substrates
during experiments. Under common conditions, the reactivity of purine nucleobases in DNA
proved to be virtually indistinguishable from that observed when RNA was exposed instead.
The current data seem to suggest that such differences in the ribose structure (i.e.
presence or absence of a hydroxyl in the 2΄ position) have a minor effect on the electron
distribution of the adjacent nucleobase moiety and thus do not significantly alter the reaction rate
between N2O3 and the exocyclic amino group of the native nucleosides. This is consistent with
our findings described above in which the kinetics of the nucleophilic attack of deferoxamine on
oxanine are only modestly affected by the nature of the ribose (Figure 3.2).
Another observation stemming from the rate constant values juxtaposed in Figure 3.11 is
the difference in susceptibility to deamination between free nucleosides and nucleobases in
nucleic acids. Our results indicate that, upon exposure to N2O3, deamination products are formed
up to an order of magnitude faster when adenosine and guanosine are not constrained by the
secondary structure of RNA or DNA. Although, it is conceivable that base pairing and stacking
interactions in both types of macromolecules – to a different degree for each biopolymer – may
protect the nucleobases from exposure to the surrounding solvent and reactive species, another
factor appears to have the potential to contribute to the observed difference in reactivity: the
anionic phosphate backbone. It was established in previous studies that phosphate anions cause a
‘scavenging’ effect for N2O3 [10], in essence competing with all other nucleophiles in solution
that can react with the nitrosating agent, and lead to the rapid hydrolysis depicted in Equation 4
of the Methods section. It is possible that the extensive presence of negatively charged
phosphodiester linkages throughout the entire length of the RNA and DNA molecules and in
immediate proximity to nucleobases may be partially inhibiting deamination (i.e., through

134
intramolecular competition for N2O3) thus leading to the lower reaction rates relative to free
nucleosides – which lack the protective effect of neighboring phosphate groups – as displayed in
Figure 3.11. Our observations stand in contrast with an older study by Caulfield et al. that instead
showed free 2-deoxynucleosides to have a ~5-fold lower reactivity compared to single-stranded
oligonucleotides (yet a ~2-fold greater reactivity compared to double-stranded oligonucleotides)
when exposed to NO [9]. Those results, however, were derived from experiments involving a)
delivery systems with a headspace of air that might have affected the chemistry (allowing
formation of N2O4 in the gas phase [65]), b) acidic hydrolysis protocols and c) chemical
derivatization for detection via GC/MS. The much more controlled exposures and sensitive
quantification strategies employed here eliminate the aforementioned possible sources of bias
and establish more confidence in the interpretation of the current findings in that, under
nitrosative stress, nucleosides are indeed more reactive than nucleic acids.
Seen from a different perspective, the comparable reactivities determined above for
nucleobases in RNA and DNA also suggest that the combination of solvent exposure and base-
pairing may be less significant than initially expected in terms of affecting nitrosative
deamination in nucleic acids. Experiments performed by Caulfield et al. yielded a ~10-fold
difference in calculated rate constants between single- and double-stranded oligonucleotides,
with single-stranded oligos appearing more reactive, whereas only a ~2-fold difference was
noted when comparing the much more solvent exposed 2-deoxynucleosides with double-stranded
oligos [9]. Those conclusions, whose discrepancies can also be attributed to the biases already
listed above, contradict the findings of the current research showing that deamination proceeds in
purified double-stranded genomic DNA and single-stranded RNA (mostly comprised by
ribosomal RNA) at comparable rates despite differing degrees of base-pairing (Figure 3.11). It is

135
not known to what extent the combination of tertiary structure, base stacking and non Watson-
Crick interactions in purified single-stranded RNA promotes the formation of additional
hydrogen bonds or minimizes exposure to the surrounding solvent, and thus how its nucleobase
accessibility compares to that in DNA. Even in that case however, it is reasonable to anticipate
uninhibited diffusion of the electrophilic N2O3 to the entire macromolecular structure (steric
exclusion would be unlikely due to its small size) and its interaction with unpaired electrons in
exocyclic amine groups e.g. of adenine and guanine; the primary amines of purines engaged in
Watson-Crick base-pairing donate their hydrogens as shown in Figure 3.12 but the electron pair
in the nitrogen of those moieties is not occupied by any bond, is still exposed to the solvent and
may be prone to attack from electrophiles. In other words, the results presented here suggest that
deamination by N2O3 will occur independently of pre-existing hydrogen bonding and
consequently that nucleobases in both single- and double-stranded configurations may be equally
susceptible to that particular electrophile. In particular, guanine’s exocyclic amine can be
nitrosated even while in a base pair formation with a neighboring cytidine, presumably give rise
to the opened ring intermediate proposed elsewhere [57] which can close back to yield both
xanthine and oxanine in the confined environment of genomic DNA (or RNA), a possible
mechanism that is consistent with our experimental observations.
As already noted, the well defined conditions maintained during our in vitro
investigations allow extrapolation of recently gained insight on deamination chemistry directly to
biological systems. Based on what has been discussed above, it is reasonable to anticipate
accumulation of comparable levels of the two guanine deamination products in nucleic acids
extracted from NO-treated cells – evidence for which will be shown in a later chapter – or even
tissues from animal models of chronic inflammatory stress. From a biomarker perspective, it is

136
Figure 3.12. Hydrogen bond formation for guanine and adenine in double stranded DNA.

137
interesting to determine whether endogenous damage caused by deamination can be more readily
detected in DNA or alternatively in RNA. Since our data suggest that the reactivity of purine
nucleobases appears to be nearly equal in both types of nucleic acids (independently of their
degree of base-pairing), we deduce that additional parameters such as accessibility and repair
may be of critical importance when searching for the most efficient molecular surrogate. More
specifically, RNA is broadly distributed within the cytosol while there are no known mechanisms
for maintaining its fidelity (unlike DNA protected in the nucleus) which motivated recent studies
to quantify damaged nucleobases in RNA, including lesions expected from deamination, when
examining tissues extracted from mouse models of nitrosative stress [40]. Extending a similar
rationale to free nucleosides, the most reactive substrates in vitro according to Figure 3.11, it is
interesting to also survey the potential of nucleoside and nucleotide pools as indicators of
imbalances forming in the cytosol e.g. due to deviating enzymatic pathways [27] or chemical
challenges [66]; however efforts to quantify deamination products in free nucleosides so far have
been hampered by technical difficulties.
Lastly, an examination of deamination rate constants derived from the current studies
suggests that guanine is more reactive toward N2O3 than adenine. The difference in reactivity is
noted in all types of nucleic acids and nucleosides considered, indicating that neither the degree
of solvent exposure (associated with base pairing) nor the presence of secondary structure
(inherent to phosphodiester linkages) appear to alter it. Since the type of the sugar attached (i.e.,
ribose vs. 2-deoxyribose) is also unlikely to play a major role in the rate of reaction (as was the
case with the kinetic profiles discussed above), the observed pattern points toward the base
moiety as the source of this dichotomy. Although a direct comparison of the structures for the
two purines does not lead to an obvious contrast, the literature reveals that guanosine is

138
characterized by a proton dissociation equilibrium at the N-1 position under basic conditions
(pKa ~9) [67] whereas such a process is absent in adenosine. Hence, in the steady and constant
aqueous environment of the exposures presented here (pH = 7.4), a small but significant fraction
of guanine nucleobases remain negatively charged (0.02 -0.2% as mentioned in ref. [68]). We
hypothesize that the charge forming in those guanosine nucleobases may be responsible for
influencing the reactivity of the unpaired electrons on the exocyclic amino group (by counter-
acting its delocalization in the ring) or alternatively for contributing to an electrostatic attraction
between the negative ion and the attacking electrophile. The overall effect is the increased
susceptibility of guanosine to N2O3 – compared with adenosine – which is consistent with results
from older studies demonstrating either a higher relative yield for products of guanine
deamination or an increased mutation frequency in G-C basepairs when nucleic acids or cells
were exposed to NO through a battery of delivery strategies [8,15,19,69]. The apparent
vulnerability of guanine under nitrosative stress combined with its propensity towards oxidative
damage [70] may have severe implications for its integrity within nucleic acids of cells subjected
to overwhelming levels of chemical insult at inflamed tissues; the apparent sensitivity of guanine
could be another reason why polymerases have evolved to follow the “A-rule” during
replication. Our findings stand in contrast with a recent kinetic analysis where deamination was
calculated to proceed at identical rates (k = 1.2 × 10⁵ M
-1s
-1) for guanosine and adenosine in
purified plasmid DNA [28] where the use of a less sensitive quantitation method (LC-MS as
opposed to LC-MS/MS employed in the current studies) may have hindered the researchers from
measuring the existing difference in reactivity.
In summary, we have demonstrated a strategy that makes use of a highly reliable and
widely applicable NO delivery system to determine the susceptibility of purine nucleobases in

139
nucleosides, RNA and DNA to deamination. The well defined chemistry of the system provides
constant and predicable concentrations of NO (~1 μM), O2 (~200 μM) and N2O3 (10-100 fM) –
biologically relevant levels encountered at sites of inflammation – and enables the study of
nitrosative damage on a wide variety of biomolecules simulating reactions expected to occur in
vivo. (a) The examination of a previously unrecognized oxanine-to-xanthine rearrangement
pathway, (b) the observation that base-pairing and solvent exposure may not significantly protect
nucleobases against nitrosative agents, (c) the evidence that oxanine forms as a result of RNA
and DNA exposure to NO, (d) the conclusion that guanine reacts faster with N2O3 than adenine
and (e) that nucleic acids are not as susceptible to deamination as free nucleosides, constitute
new information derived from results in the current work.

140
3.5 References
[1] Moncada, S., Palmer, R. M., and Higgs, E. A. (1991) Nitric oxide: physiology,
pathophysiology, and pharmacology. Pharmacol. Rev. 43: 109-142.
[2] Moncada, S. (1999) Nitric oxide: discovery and impact on clinical medicine. J. R. Soc.
Med. 92: 164–169.
[3] Nussler, A. K. and Billiar, T. R. (1993) Inflammation, immunoregulation, and inducible
nitric oxide synthase. J. Leukoc. Biol. 54: 171-178.
[4] Lewis, R. S., Tamir, S., Tannenbaum, S. R., and Deen, W. M. (1995) Kinetic analysis of
the fate of nitric oxide synthesized by macrophages in vitro. J. Biol. Chem. 270: 29350-
29355.
[5] Erdman, S. E., Rao, V. P., Poutahidis, T., Rogers, A. B., Taylor, C. L., Jackson, E. A.,
Ge, Z., Lee, C. W., Schauer, D. B., Wogan, G. N., Tannenbaum, S. R., and Fox, J. G.
(2009) Nitric oxide and TNF-alpha trigger colonic inflammation and carcinogenesis in
Helicobacter hepaticus-infected, Rag2-deficient mice. Proc. Natl. Acad. Sci. U.S.A. 106:
1027-1032.
[6] Coussens, L. M. and Werb, Z. (2002) Inflammation and cancer. Nature. 420: 860-867.
[7] Burney, S., Caulfield, J. L., Niles, J. C., Wishnok, J. S., and Tannenbaum, S. R. (1999)
The chemistry of DNA damage from nitric oxide and peroxynitrite. Mutat. Res. Fund.
Mol. Mech. Mut. 424: 37-49.
[8] Wink, D., Kasprzak, K., Maragos, C., Elespuru, R., Misra, M., Dunams, T., Cebula, T.,
Koch, W., Andrews, A., Allen, J., and Keefer, L. K. (1991) DNA deaminating ability and
genotoxicity of nitric oxide and its progenitors. Science. 254: 1001-1003.
[9] Caulfield, J. L., Wishnok, J. S., and Tannenbaum, S. R. (1998) Nitric oxide-induced
deamination of cytosine and guanine in deoxynucleosides and oligonucleotides. J. Biol.
Chem. 273: 12689-12695.
[10] Lewis, R. S., Tannenbaum, S. R., and Deen, W. M. (1995) Kinetics of N-Nitrosation in
oxygenated nitric oxide solutions at physiological pH: Role of nitrous anhydride and
effects of phosphate and chloride. J. Am. Chem. Soc. 117: 3933-3939.
[11] Keshive, M., Singh, S., Wishnok, J. S., Tannenbaum, S. R., and Deen, W. M. (1996)
Kinetics of S-Nitrosation of thiols in nitric oxide solutions. Chem. Res. Toxicol. 9: 988-
993.
[12] Dedon, P. C. and Tannenbaum, S. R. (2004) Reactive nitrogen species in the chemical
biology of inflammation. Arch. Biochem. Biophys. 423: 12-22.

141
[13] Shapiro, R. and Pohl, S. H. (1968) Reaction of ribonucleosides with nitrous acid. Side
products and kinetics. Biochemistry. 7: 448-455.
[14] Suzuki, T., Yamaoka, R., Nishi, M., Ide, H., and Makino, K. (1996) Isolation and
characterization of a novel product, 2'-deoxyoxanosine, from 2'-deoxyguanosine,
oligodeoxynucleotide, and calf thymus DNA treated by nitrous acid and nitric oxide. J.
Am. Chem. Soc. 118: 2515-2516.
[15] Nguyen, T., Brunson, D., Crespi, C. L., Penman, B. W., Wishnok, J. S., and
Tannenbaum, S. R. (1992) DNA damage and mutation in human cells exposed to nitric
oxide in vitro. Proc. Natl. Acad. Sci. U.S.A. 89: 3030-3034.
[16] Lewis, R. S. and Deen, W. M. (1994) Kinetics of the reaction of nitric oxide with oxygen
in aqueous solutions. Chem. Res. Toxicol. 7: 568-574.
[17] Suzuki, T., Ide, H., Yamada, M., Endo, N., Kanaori, K., Tajima, K., Morii, T., and
Makino, K. (2000) Formation of 2'-deoxyoxanosine from 2'-deoxyguanosine and nitrous
acid: mechanism and intermediates. Nucleic Acids Res. 28: 544-551.
[18] Lucas, L. T., Gatehouse, D., and Shuker, D. E. G. (1999) Efficient nitroso group transfer
from N-nitrosoindoles to nucleotides and 2'-deoxyguanosine at physiological pH. J. Biol.
Chem. 274: 18319-18326.
[19] Lucas, L. T., Gatehouse, D., Jones, G. D. D., and Shuker, D. E. G. (2001)
Characterization of DNA damage at purine residues in oligonucleotides and calf thymus
DNA induced by the mutagen 1-nitrosoindole-3-acetonitrile. Chem. Res. Toxicol. 14:
158-164.
[20] Dong, M. and Dedon, P. C. (2006) Relatively small increases in the steady-state levels of
nucleobase deamination products in DNA from human TK6 cells exposed to toxic levels
of nitric oxide. Chem. Res. Toxicol. 19: 50-57.
[21] Pang, B., Zhou, X., Yu, H., Dong, M., Taghizadeh, K., Wishnok, J. S., Tannenbaum, S.
R., and Dedon, P. C. (2007) Lipid peroxidation dominates the chemistry of DNA adduct
formation in a mouse model of inflammation. Carcinogenesis. 28: 1807-1813.
[22] Kirchner, J. J., Sigurdsson, S. T., and Hopkins, P. B. (1992) Interstrand cross-linking of
duplex DNA by nitrous acid: covalent structure of the dG-to-dG cross-link at the
sequence 5'-CG. J. Am. Chem. Soc. 114: 4021-4027.
[23] Lindahl, T. and Nyberg, B. (1974) Heat-induced deamination of cytosine residues in
deoxyribonucleic acid. Biochemistry. 13: 3405-3410.
[24] Shapiro, R. and Klein, R. S. (1966) The deamination of cytidine and cytosine by acidic
buffer solutions. Mutagenic Implications. Biochemistry. 5: 2358-2362.
[25] Bass, B. L. (2002) RNA editing by adenosine deaminases that act on RNA. Annu. Rev.
Biochem. 71: 817-846.

142
[26] Shapiro, R., DiFate, V., and Welcher, M. (1974) Deamination of cytosine derivatives by
bisulfite. Mechanism of the reaction. J. Am. Chem. Soc. 96: 906-912.
[27] Pang, B., McFaline, J. L., Burgis, N. E., Dong, M., Taghizadeh, K., Sullivan, M. R.,
Elmquist, C. E., Cunningham, R. P., and Dedon, P. C. (2012) Defects in purine
nucleotide metabolism lead to substantial incorporation of xanthine and hypoxanthine
into DNA and RNA. Proc. Natl. Acad. Sci. U.S.A. 109: 2319-2324.
[28] Dong, M., Wang, C., Deen, W. M., and Dedon, P. C. (2003) Absence of 2'-
deoxyoxanosine and presence of abasic sites in DNA exposed to nitric oxide at controlled
physiological concentrations. Chem. Res. Toxicol. 16: 1044-1055.
[29] Chin, M. P., Schauer, D. B., and Deen, W. M. (2008) Prediction of nitric oxide
concentrations in colonic crypts during inflammation. Nitric Oxide Biol. Chem. 19: 266-
275.
[30] Keefer, L. K., Nims, R. W., Davies, K. M., and Wink, D. A. (1996) "NONOates" (1-
substituted diazen-1-ium-1,2-diolates) as nitric oxide donors: convenient nitric oxide
dosage forms. Methods Enzymol. 268: 281-293.
[31] Griffiths, C., Wykes, V., Bellamy, T. C., and Garthwaite, J. (2003) A new and simple
method for delivering clamped nitric oxide concentrations in the physiological range:
Application to activation of guanylyl cyclase-coupled nitric oxide receptors. Mol.
Pharmacol. 64: 1349-1356.
[32] Schmidt, K., Desch, W., Klatt, P., Kukovetz, W. R., and Mayer, B. (1998) Release of NO
from donor compounds: a mathematical model for calculation of NO concentrations in
the presence of oxygen in Nitric Oxide Protocols (Titheradge, M. A., Titheradge, M. A.)
pp. 281-289, Humana Press Inc., Totowa.
[33] Thomas, D. D., Espey, M. G., Ridnour, L. A., Hofseth, L. J., Mancardi, D., Harris, C. C.,
and Wink, D. A. (2004) Hypoxic inducible factor 1 alpha, extracellular signal-regulated
kinase, and p53 are regulated by distinct threshold concentrations of nitric oxide. Proc.
Natl. Acad. Sci. U.S.A. 101: 8894–8899.
[34] Liu, X., Miller, M. J., Joshi, M. S., Thomas, D. D., and Lancaster, J. R. (1998)
Accelerated reaction of nitric oxide with O2 within the hydrophobic interior of biological
membranes. Proc. Natl. Acad. Sci. U.S.A. 95: 2175-2179.
[35] Pfeiffer, S., Lass, A., Schmidt, K., and Mayer, B. (2001) Protein tyrosine nitration in
mouse peritoneal macrophages activated in vitro and in vivo: evidence against an
essential role of peroxynitrite. F.A.S.E.B. J. 15: 2355-2364.
[36] Zhuang, J. C., Lin, D., Lin, C., Jethwaney, D., and Wogan, G. N. (2002) Genotoxicity
associated with NO production in macrophages and co-cultured target cells. Free Radic.
Biol. Med. 33: 94-102.

143
[37] Wang, C. and Deen, W. M. (2003) Nitric oxide delivery system for cell culture studies.
Ann. Biomed. Eng. 31: 65-79.
[38] Wang, C., Trudel, L. J., Wogan, G. N., and Deen, W. M. (2003) Thresholds of nitric
oxide-mediated toxicity in human lymphoblastoid cells. Chem. Res. Toxicol. 16: 1004-
1013.
[39] deRojas-Walker, T., Tamir, S., Ji, H., Wishnok, J. S., and Tannenbaum, S. R. (1995)
Nitric oxide induces oxidative damage in addition to deamination in macrophage DNA.
Chem. Res. Toxicol. 8: 473-477.
[40] Mangerich, A., Knutson, C. G., Parry, N. M., Muthupalani, S., Ye, W., Prestwich, E.,
Cui, L., McFaline, J. L., Mobley, M., Ge, Z., Taghizadeh, K., Wishnok, J. S., Wogan, G.
N., Fox, J. G., Tannenbaum, S. R., and Dedon, P. C. (2012) Infection-induced colitis in
mice causes dynamic and tissue-specific changes in stress response and DNA damage
leading to colon cancer. Proc. Natl. Acad. Sci. U.S.A. 109: E1820-E1829.
[41] Chan, C. T. Y., Dyavaiah, M., DeMott, M. S., Taghizadeh, K., Dedon, P. C., and Begley,
T. J. (2010) A quantitative systems approach reveals dynamic control of tRNA
modifications during cellular stress. P.L.O.S. Genet. 6: e1001247.
[42] Chan, C. T. Y., Pang, Y. L. J., Deng, W., Babu, I. R., Dyavaiah, M., Begley, T. J., and
Dedon, P. C. (2012) Reprogramming of tRNA modifications controls the oxidative stress
response by codon-biased translation of proteins. Nat. Commun. 3: 937.
[43] Sager, R. (1997) Expression genetics in cancer: Shifting the focus from DNA to RNA.
Proc. Natl. Acad. Sci. U.S.A. 94: 952-955.
[44] Nicoloso, M. S., Spizzo, R., Shimizu, M., Rossi, S., and Calin, G. A. (2009) MicroRNAs
- the micro steering wheel of tumour metastases. Nat. Rev. Cancer. 9: 293-302.
[45] Chari, R., Thu, K., Wilson, I., Lockwood, W., Lonergan, K., Coe, B., Malloff, C.,
Gazdar, A., Lam, S., Garnis, C., MacAulay, C., Alvarez, C., and Lam, W. (2010)
Integrating the multiple dimensions of genomic and epigenomic landscapes of cancer.
Cancer Metastasis Rev. 29: 73-93.
[46] Taghizadeh, K., McFaline, J. L., Pang, B., Sullivan, M., Dong, M., Plummer, E., and
Dedon, P. C. (2008) Quantification of DNA damage products resulting from
deamination, oxidation and reaction with products of lipid peroxidation by liquid
chromatography isotope dilution tandem mass spectrometry. Nat. Protoc. 3: 1287-1298.
[47] Dendroulakis, V., Russell, B. S., Eric Elmquist, C., Trudel, L. J., Wogan, G. N., Deen,
W. M., and Dedon, P. C. (2012) A system for exposing molecules and cells to
biologically relevant and accurately controlled steady-state concentrations of nitric oxide
and oxygen. Nitric Oxide Biol. Chem. 27: 161-168.
[48] Maniatis, T., Fritsch, E. F., and Sambrook, J. (1982) Molecular Cloning: A Laboratory
Manual, Cold Spring Harbor Laboratory Press, Cold Spring Harbor.

144
[49] Caulfield, J. L., Singh, S. P., Wishnok, J. S., Deen, W. M., and Tannenbaum, S. R. (1996)
Bicarbonate inhibits N-nitrosation in oxygenated nitric oxide solutions. J. Biol. Chem.
271: 25859-25863.
[50] Suzuki, T., Yoshida, M., Yamada, M., Ide, H., Kobayashi, M., Kanaori, K., Tajima, K.,
and Makino, K. (1998) Misincorporation of 2'-deoxyoxanosine 5'-triphosphate by DNA
polymerases and its implication for mutagenesis. Biochemistry. 37: 11592-11598.
[51] Majumdar, P., Wu, H., Tipton, P., and Glaser, R. (2005) Oxanosine Is a substrate of
adenosine deaminase. Implications for the quest for a toxicological marker for nitrosation
activity. Chem. Res. Toxicol. 18: 1830-1841.
[52] Grätzel, M., Taniguchi, S., and Henglein, A. (1970) Pulse radiolytic investigation of NO
oxidation and equilibrium N2O3 = NO + NO2 in aqueous solution. Berichte der
Bunsengesellschaft für physikalische Chemie. 74: 488-492.
[53] Licht, W. R., Tannenbaum, S. R., and Deen, W. M. (1988) Use of ascorbic acid to inhibit
nitrosation: kinetic and mass transfer considerations for an in vitro system.
Carcinogenesis. 9: 365-372.
[54] Suzuki, T., Yamada, M., Ide, H., Kanaori, K., Tajima, K., Morii, T., and Makino, K.
(2000) Identification and characterization of a reaction product of 2'-deoxyoxanosine
with glycine. Chem. Res. Toxicol. 13: 227-230.
[55] Hetzer, H. B., Bates, R. G., and Robinson, R. A. (1966) Dissociation constant of
morpholinium ion and related thermodynamic quantities from 0 to 50°. J. Phys. Chem.
70: 2869-2872.
[56] Marnett, L. J. (2012) Inflammation and cancer: Chemical approaches to mechanisms,
imaging, and treatment. J. Org. Chem. 77: 5224-5238.
[57] Glaser, R., Wu, H., and Lewis, M. (2005) Cytosine catalysis of nitrosative guanine
deamination and interstrand cross-link formation. J. Am. Chem. Soc. 127: 7346-7358.
[58] Pack, S. P., Nonogawa, M., Kodaki, T., and Makino, K. (2005) Chemical synthesis and
thermodynamic characterization of oxanine-containing oligodeoxynucleotides. Nucleic
Acids Res. 33: 5771-5780.
[59] Clayden, J. (2012) Organic chemistry: Stabilizers cause instability. Nature. 481: 274-275.
[60] Szostak, M. and Aube, J. (2011) Medium-bridged lactams: a new class of non-planar
amides. Org. Biomol. Chem. 9: 27-35.
[61] Pruss, D. and Wolffe, A. P. (1993) Histone-DNA contacts in a nucleosome core
containing a Xenopus 5S rRNA gene. Biochemistry. 32: 6810-6814.
[62] Li, C.-Q., Pang, B., Kiziltepe, T., Trudel, L. J., Engelward, B. P., Dedon, P. C., and
Wogan, G. N. (2006) Threshold effects of nitric oxide-induced toxicity and cellular

145
responses in wild-type and p53-null human lymphoblastoid cells. Chem. Res. Toxicol. 19:
399-406.
[63] Li, C.-Q., Wright, T. L., Dong, M., Dommels, Y. E. M., Trudel, L. J., Dedon, P. C.,
Tannenbaum, S. R., and Wogan, G. N. (2005) Biological role of glutathione in nitric
oxide-induced toxicity in cell culture and animal models. Free Radic. Biol. Med. 39:
1489-1498.
[64] Vongchampa, V., Dong, M., Gingipalli, L., and Dedon, P. (2003) Stability of 2'-
deoxyxanthosine in DNA. Nucleic Acids Res. 31: 1045-1051.
[65] Ignarro, L. J., Fukuto, J. M., Griscavage, J. M., Rogers, N. E., and Byrns, R. E. (1993)
Oxidation of nitric oxide in aqueous solution to nitrite but not nitrate: comparison with
enzymatically formed nitric oxide from L-arginine. Proc. Natl. Acad. Sci. U.S.A. 90:
8103-8107.
[66] Foti, J. J., Devadoss, B., Winkler, J. A., Collins, J. J., and Walker, G. C. (2012) Oxidation
of the guanine nucleotide pool underlies cell death by bactericidal antibiotics. Science.
336: 315-319.
[67] Jordan, D. O. (1952) Nucleic acids, purines, and pyrimidines. Annu. Rev. Biochem. 21:
209-244.
[68] Jang, Y. H., Goddard, W. A., Noyes, K. T., Sowers, L. C., Hwang, S., and Chung, D. S.
(2003) pKa values of guanine in water: density functional theory calculations combined
with Poisson-Boltzmann continuum-solvation model. J. Phys. Chem. B. 107: 344-357.
[69] Routledge, M. N., Wink, D. A., Keefer, L. K., and Dipple, A. (1994) DNA sequence
changes induced by two nitric oxide donor drugs in the supF assay. Chem. Res. Toxicol.
7: 628-632.
[70] Margolin, Y., Cloutier, J.-F., Shafirovich, V., Geacintov, N. E., and Dedon, P. C. (2006)
Paradoxical hotspots for guanine oxidation by a chemical mediator of inflammation. Nat.
Chem. Biol. 2: 365-366.

146
Chapter 4
Formation of abasic sites in RNA linked to nitrosative stress
4.1 Introduction
As outlined in previous chapters, reactive species originating from activated macrophages
in inflamed tissues are thought to cause damage to neighboring cells by generating reactive
oxygen and nitrogen species. In particular, enzyme-dependent production of NO by activated
macrophages is likely to give rise to several other oxidants and agents of nitrosation and
halogenation [1,2], which in turn may create pathological lesions in a variety of cellular
components (nucleic acids, proteins, lipids, etc). Nitrous anhydride (N2O3) is one of the most
reactive and short-lived molecules associated with NO generation in oxygenated aqueous
environments, and it is known to react with nucleophilic amino groups in nucleobases of nucleic
acids [3,4] as well as other electron-rich compounds [5,6]. Nitrosation of exocyclic amino groups
in nucleobases by N2O3 leads to the formation of several deamination products [1], extensively
discussed in Chapter 3, and guanosine intrastrand cross-links [7], which can alter the sequence –
and possibly constrain the secondary structure – of nucleic acids. In addition to deamination,
N2O3 also causes formation of abasic (i.e., apurinic/apyridinic or AP) sites by nitrosation of the
N7 in guanosine and N
7 or N
3 in adenosine, which weakens the glycosidic bond in the resulting
cationic bases [8,9] (proposed mechanism for 2-deoxyguanosine nucleotide shown in Figure 4.1,
adapted from ref. [9]). This reaction introduces a parallel pathway by which N2O3 can modify
information preserved in nucleic acids.

147
Figure 4.1. Depurination results from nitrosation of the N-7 position in 2-deoxyguanosine.
Nucleobase nitrosation leads to weakening of the glycosidic bond and formation of an abasic
site, shown in equilibrium between its open and closed form.

148
Besides nitrosation, other conditions are known to cause formation of abasic sites mainly
from purines [10], including acidic, oxidative and alkylating environments [11-13], with rates
greater than those estimated to occur spontaneously in vivo (~104 per genome per day in
mammalian cells [14]). Abasic sites are also formed from modified or damaged nucleobases as a
result of the action of DNA N-glycosylases as intermediate products of the base excision repair
pathway [15-18]. If they remain unrepaired in DNA, abasic sites are hydrolytically unstable and
eventually lead to strand scissions (t1/2 = ~8 d; [19]). Due to their potential for DNA strand
breaks and interference with genetic information, abasic lesions are highly mutagenic [20,21]
and cytotoxic [22,23], representing a major threat to the integrity and survival of the cell, which
would explain why organisms have evolved appropriate responses to eliminate them by
employing AP-endonucleases or AP-lyases [24-26].
While DNA has been the major focus of investigation in abasic site formation, it is
reasonable to assume that they can also form in RNA. The high concentrations of coding and
non-coding RNA species in a cell, their wider cellular distribution, and the greater solvent
exposure of RNA nucleobases suggest that such lesions could form in RNA as well as DNA
under conditions of nitrosative or oxidative stress. This possibility implies that coding
information may be lost due to depurination occurring not only in critical genes but also in
various elements of the translational and transcriptional processes. The biological impact of
abasic sites forming in RNA alone is apparent if one considers that changes in the sequence of
coding and non-coding RNA species have consequences for gene expression at the level of
translation, potentially affecting the function of the translational machinery [27,28], interfering
with post-transcriptional RNA editing [29], or disrupting regulatory elements strongly correlated
with the progression of different types of cancer [30-32].

149
To investigate how nitrosative conditions arising in the microenvironment of inflamed
tissues may contribute to the formation of abasic sites, a reliable method that generates steady
and predictable N2O3 levels in a controlled laboratory setting is indispensable. Perhaps the best
characterized and most broadly applicable system that mimics the nitrosative environment at
sites of inflammation was developed by Deen and coworkers using NO- and O2-permeable
polydimethylsiloxane (Silastic) tubing to deliver the gases at constant and predictable levels
[33,34]. An accompanying mass transfer model was developed to predict the concentrations of
NO and O2 in the system given the values of certain operational parameters [33,35], and a
subsequent kinetic analysis estimated the levels of N2O3 formed in the solution [34], making the
tubing-based delivery apparatus ideal for kinetic studies of nitrosative deamination (e.g. those
described in Chapter 3 and elsewhere [34]). Experimentally measured cellular consumption rates
for NO and O2 [35] as well as recent findings demonstrating the negligible effect of cell culture
media on device performance – delineated in Chapter 2 and reported in ref. [36] – extend the
system’s application to cases that involve exposure of mammalian cells to well defined levels of
NO and N2O3. The ease of use and the fact that delivery is unaffected by the unknown (yet
potentially complicating) effects of the secondary chemical species generated upon NO release
from NO-donors [37] are additional reasons for which the system has been employed in
numerous previous studies [38-41], including the current work.
Besides well defined in vitro exposure conditions, sensitive analytical methods are also
crucial for gaining insight on the mechanisms of AP site formation in nucleic acids. While
several strategies have been employed in the past to detect strand breaks and putative AP sites in
DNA such as the 32
P-post labeling assay [42], the comet assay [43] and the plasmid nicking
assay [44], direct quantitation methods via aldehyde-reactive probes can be more informative

150
and specific. The conception and design of those probes was based on the notion that lesions
with aldehyde (or ketone) groups react with conjugated oxyamines to form stable oxime
derivatives that can be purified and measured in a variety of ways. One of the early methods
exploiting this chemistry used a 14
C-labeled methoxyamine [45] – with subsequent versions
coupling quantification of oximation products with accelerator mass spectrometry [46] or
antibodies [47] – whereas other types of strategies employed biotin conjugated probes, with
detection made possible by ELISA [48,49], or variations of fluorescent aldehyde reactive probes
[50-52]. Among several reactive probes, N-aminooxyacetyl-N'- biotinyl hydrazine has been
employed in several studies of oxidation-induced AP lesions in DNA [48,49,53,54], as well as
more recently in RNA [55,56]. The major problems limiting use of these probes is the lack of
chemical specificity, limited dynamic range of the detection system and the potential for artifacts
arising from incomplete removal of unreacted probe. To overcome these problems, we can turn
to analytical platforms involving chromatography-coupled tandem mass spectrometry, which
have emerged as attractive approaches to sensitive quantitation of AP sites generated in damaged
DNA [57]. Here we have developed a novel mass spectrometry-based approach for RNA abasic
sites that takes advantage of the predictable and stable products that arise in reactions of reactive
carbonyl species with the biotin-conjugated aldehyde reactive probe mentioned above
(mechanism depicted in Figure 4.2).
Motivated by the paucity of knowledge about RNA abasic sites as products of
inflammation, the goal of this work was to estimate the rate at which AP sites accumulate when
RNA is exposed to well-controlled steady levels of N2O3, similar to those believed to occur in
close proximity to inflamed tissues. The kinetic parameters describing the anticipated

151
Figure 4.2. Reaction between abasic sites and biotinylated aldehyde reactive probe (ARP).
A stable oxime product results from the reaction between the open form of an abasic site and the
N-aminooxyacetyl-N'- biotinyl hydrazine aldehyde reactive probe.

152
degradation of glycosidic bonds will be compared to similar information previously derived from
DNA under comparable levels of nitrosative stress. The methodology employed to measure AP
sites in RNA was developed in collaboration with Dr. Wan Chan and complements recent
sensitive and chemically specific mass spectrometry-based protocols [58] aiming to accurately
measure the same lesion in DNA as an index of exposure to endogenous sources of nitrosative or
oxidative stress.
4.2 Materials and Methods
4.2.1 Chemicals
Na2HPO4 and NaH2PO4 were obtained from American Bioanalytical, LC-MS grade
acetonitrile from EMD, ethanol from Koptec. Glacial acetic acid and morpholine (Mor) were
from Sigma (98% or higher purity). N-aminooxyacetyl-N'- biotinyl hydrazine was from Dojindo
Molecular Technologies, Inc. Water purified through a Milli-Q system (Millipore) was used
throughout the study.
4.2.2 Human cell cultures for total RNA extraction
TK6 human lymphoblastoid cells obtained from ATCC were grown in large cultures for
the purpose of harvesting purified RNA. Cells were maintained in exponentially growing
suspension cultures at 37°C in a humidified atmosphere of 95% air and 5% CO2 in RPMI-1640
medium supplemented with 10% (v/v) heat-inactivated donor horse serum, 100 units/mL
penicillin, 100 μg/mL streptomycin, and 2 mM L-glutamine. Stock cell cultures were routinely
passaged to maintain an optimal growth density (~1.0 × 10⁶ cells/mL) in 150 mm dishes. Cell
pellets harvested by centrifugation were washed with phosphate buffer saline (PBS) and
processed using Qiagen’s RNeasy Maxi Kits following the manufacturer’s instructions.

153
Extracted total RNA concentrations (2-4 mg per pellet containing ~600 × 106 cells) were
determined by UV spectroscopy and stored at -80 oC until further use. RPMI-1640, L-glutamine,
streptomycin /penicillin and PBS were obtained from Lonza, donor horse serum from Atlanta
Biologicals, and trypan blue (4% in saline) for cell counting from Sigma.
4.2.3 NO/N2O3 delivery system
A delivery system described in full detail in Chapter 2 [33,36] was employed to expose
purified RNA to accurately controlled constant levels of NO and O2 (and N2O3). Briefly, two
distinct gas streams (one for NO the other for O2) were fed to reactors (modified 120 mL PFA
screw-top jars from Cole Parmer) containing solutions of total RNA, with NO and O2 diffusing
separately into the liquid through gas permeable Silastic tubing loops (6-7 cm long, 1.96 mm
o.d., 1.47 mm i.d. from Dow Corning). The flow rates were 100 standard cubic centimeters per
minute (sccm) for the NO-feeding stream and 200 sccm for the O2- feeding stream, for every
reactor used. Gas flow rates were regulated via mass flow controllers obtained from Porter
Instruments, Parker-Hannifin. The contents of each reactor were kept stirred using a magnetic
stirrer plate from IKA (stirring speed at 100 rpm; stir-bar placed in every reactor) and maintained
at 37 oC within a water bath. Mixtures of 10% NO in argon, 50% O2 in N2 (and 5% CO2) and
pure argon (for controls) were obtained from Airgas.
4.2.4 Exposing RNA and morpholine to NO
The nitrosative conditions achieved in the delivery system described above were
exploited to induce generation of abasic sites in RNA. Stock solutions of total RNA, derived as
described above, were washed twice with purified water using spin-filters (NanoSep 10K
Omega, Pall) before being treated in the delivery system. Solutions of washed total RNA (9.5

154
μg/mL) in 50 mM sodium phosphate (Na-PO4) buffer pH 7.4 (prepared from Na2HPO4,
NaH2PO4 as described in ref. [59]) were exposed in reactors (~115 mL solution per reactor). A
mass transfer model that simulates the system’s performance [33,36] was used to determine
lengths of tubing loops necessary to achieve constant physiological levels of the dissolved gases
in each reactor: steady-state NO concentration of ~1.7 μM was reached by passing 10% NO in
argon through a 7.0 cm Silastic tubing loop and 50% O2 in N2 (with 5% CO2) through a 6.3 cm
loop led to constant oxygen levels (~210 μM) throughout the exposures. At various time points
after initiating gas flows, 2.5 mL aliquots were withdrawn from each reactor and replaced with
an identical volume of fresh solution. All buffers and reactors were autoclaved before exposures
took place to completely neutralize the activity of remaining RNases; samples were properly
handled to avert artifactual RNA degradation.
The rate of NO-induced formation of abasic sites in RNA was compared to rates of
morpholine (Mor) nitrosation for the purpose of accurately calculating the corresponding rate
constant, as shown below. The experimental procedure involving exposure of 2 mM Mor
solutions (in 50 mM Na-PO4 buffer pH 7.4) to 1.7 μM NO and 210 μM O2 in the delivery reactor
was previously described in full detail in section 3.2.5 of Chapter 3.
4.2.5 Derivatization of RNA with aldehyde reactive probe
The biotinylated aldehyde reactive probe (ARP) was employed to derivatize the abasic
sites present in RNA samples, based on a modification of a recent protocol [56] and the probe
manufacturer’s instructions. RNA aliquots collected during NO exposures (9.5 μg/mL in 50 mM
Na-PO4 pH 7.4) were concentrated ~3-fold under reduced pressure before adding N-
aminooxyacetyl-N'- biotinyl hydrazine to a final concentration of 2 mM. Samples were incubated

155
at 37 oC for 1 h and the derivatized RNA solutions were filtered through NanoSep 10K spin
filters, with the RNA (retentate residing on the filter membrane) redissolved in 60 μL water;
resuspended RNA samples were subsequently quantified by UV spectroscopy before hydrolysis
to nucleosides.
4.2.6 Enzymatic hydrolysis of RNA
Derivatized RNA samples (~20 μg) were hydrolyzed to nucleosides employing a
variation of a previously developed protocol [60]. Briefly, a combination of nuclease P1 (Sigma),
phosphodiesterase I (USB) and alkaline phosphatase (Sigma) were added in the presence of
antioxidants deferoxamine and butylated hydroxytoluene (Sigma) and deaminase inhibitors
coformycin (DTP/NCI) and tetrahydrouridine (Calbiochem), as described previously [61] (no
15N-labeled internal standards added). Enzymes were removed at the end of the hydrolytic
digestion process by NanoSep 10K spin filters and filtrates were concentrated under reduced
pressure to a final volume of 50 μL before analysis by LC-MS/MS.
4.2.7 LC-MS/MS quantification of derivatized abasic sites in hydrolyzed RNA (in
collaboration with Dr. Wan Chan)
Levels of ARP-derivatized AP sites in hydrolyzed RNA samples were measured using an
Agilent 1100 series HPLC system interfaced with an AB Sciex API 3000 tandem quadrupole MS
with a turbo ion spray source. Resolution of derivatized AP sites was achieved on a Thermo
Fisher Hypersil Gold aQ C18 reverse-phase column (150 x 2.1 mm, 3 μm particle size) using
0.1% acetic acid (solvent A) with a stepwise increasing gradient of pure acetonitrile (solvent B),
at a 0.2 mL/min flow rate; details of the chromatographic method are given in Table C.1
(Appendix C). The MS was operated in positive ion mode with the first and third quadrupoles

156
fixed to unit resolution. Multiple reaction monitoring (MRM) mode was used for sample
detection with dwell times set to 200 ms. Parameters for the mass spectrometer were optimized
for maximal sensitivity and are displayed in Table C.2 (Appendix C). High mass accuracy
experiments were performed on a AB Sciex QSTAR XL quadrupole TOF mass spectrometer
with a standard electrospray ionization interface.
A linear external calibration curve (r2 > 0.99) was generated using a synthesized standard
for the ribose-ARP conjugate (Figure 4.3). The standard was generated by reacting 1mM ribose
and 10 mM ARP in 50 mM Na-PO4 (pH 7.4) at room temperature for ~8 hours, subsequently
purified by LC (using the reverse-phase column mentioned above), based on a variation of a
previously used protocol [56].
4.2.8 Detection of morpholine nitrosation
In morpholine (Mor) nitrosation experiments, the formed product N-nitroso-morpholine
(NMor) was quantified by UV absorbance as described in section 3.2.9 of Chapter 3.
4.2.9 Reaction scheme for NO-induced nitrosation and formation of abasic sites
The reaction scheme is identical to the one defined by Equations 1-5 in section 3.2.11 of
Chapter 3. Briefly, the reactions of interest include generation of N2O3 from NO and O2 and its
consumption by inorganic phosphate in the buffer and morpholine (when present in the solution).
Alternatively, when RNA is exposed to N2O3 in the absence of Mor, the following reaction is
considered where nitrosated purine nucleosides in RNA give rise to apurinic (AP) sites (based on
the mechanism presented in Figure 4.1):

157
Figure 4.3. (A) Biotinylated ARP-ribose conjugate (mtotal = 463) with annotated fragments (m1 =
332, m2 = 227) and (B) linear calibration curve for the ARP-ribose standard.
Limit of quantification ~2.4 fmol and limit of detection ~0.8 fmol derived from the calibration
curve (data represent mean ± S.D. for n = 3).

158
kAP
purinesON 32 HNOsites AP -2 (A)
Adenosine and guanosine in RNA are lumped into the term purines of reaction A while
abasic site formation resulting from nitrosation of pyridines is assumed insignificant compared to
purines [10]. Reaction A occurs in parallel to the deamination reactions analyzed in detail in
Chapter 3, however AP site formation is much slower than deamination, as will be discussed
below.
Rate constants for reactions 1-5 are listed in Table 3.1 in section 3.2.12 of Chapter 3
whereas kAP was derived by comparing observed rates for NMor and AP formation under the
same nitrosative conditions.
4.2.10 Kinetics of nitrosation and AP formation – estimation of concentrations and rate
constant
Following the same analysis as the one delineated in section 3.2.12 of Chapter 3 and
applying the rate law to reaction A defined above (formation of AP lesions from purines in RNA
in lieu of nucleobase deamination products) yields the following equation:
dt
NMor][ddt
AP][d
][rG][rA
][Moro
5AP
kk (B)
Equation B is used to calculate the rate constant for AP accumulation (kAP), as long as
slopes of AP and NMor formation are experimentally available, and the nitrosation products do
not significantly affect the initial concentration of the reactants (which was the case in the

159
present experiments). Parameter α, i.e. the ratio of the bulk steady-state N2O3 concentration in
Mor experiments to that estimated in RNA experiments, was also previously defined in section
3.2.12 of Chapter 3.
4.3 Results
4.3.1 Development of LC-MS/MS method to quantify RNA abasic sites (by Dr. Wan
Chan)
The major fragment ions observed when the synthesized standard for the ribose-ARP
conjugate (depicted in Figure 4.3) was analyzed by collision-induced-dissociation are shown in
Figure 4.4, a typical product ion scan of the molecular ion (m/z 464) in positive ionization mode.
The predominant ion peak in Figure 4.4 (m/z 227) is likely derived from cleavage at one of the
amide bonds of the biotinylated probe (m/z 332), illustrated in Figure 4.3. Also shown in Figure
4.4 is the high-accuracy MS analysis of the ribose-ARP standard which agrees with a previously
measured m/z value (464.2) of the same conjugate [56].
Positive ionization mode with the multiple-reaction-monitoring (MRM) transition at m/z
464227 was used to measure AP sites in hydrolyzed RNA samples; the MS/MS parameters
were optimized by flow injection analysis (values shown in Table C.2 of Appendix C). Figure
4.5 shows representative ion peaks resulting from the LC-MS/MS analysis of the ribose-ARP
conjugate standard and samples from NO- and Argon-treated hydrolyzed RNA. A linear external
calibration curve was generated using the ribose-ARP standard (Figure 4.3) and the method’s
quantification limit was found to be ~2.4 fmol or ~4 lesions per 108 nucleotides (based on 20 μg
RNA).

160
Figure 4.4. (A) MS/MS and (B) high accuracy MS spectrum for the biotinylated ARP-ribose
conjugate.

161
Figure 4.5. Extracted ion chromatograms of the MRM transition at m/z 464227 derived from
representative samples.
(A) Biotinylated ARP-ribose conjugate, (B) hydrolyzed NO-treated RNA and (C) hydrolyzed
argon-treated RNA. Chromatographic conditions described in the Methods section.

162
4.3.2 Determination of N2O3 concentration in the NO-delivery system
The conditions in the delivery device (buffer composition, temperature, steady-state NO
and O2 concentrations, etc) established during experiments aiming to investigate the NO-induced
formation of abasic sites in RNA are identical to those specified in Chapter 3 regarding the
deamination of nucleic acids and nitrosation of Mor. Hence, the NMor formation data shown in
Figure 3.6 of Chapter 3 and the calculations described in section 3.3.2 of Chapter 3 can be re-
applied to calculate the N2O3 concentration in the reactor (i.e., [N2O3] = 39 fM in the bulk liquid
region with ]ON[ 32 = 59 fM an effective increase in the aforementioned value due to the
presence of the boundary layer) as well as the values for some of the parameters required in
Equation B, namely α = 0.76, d[NMor]/dt = 0.105 μM/min and [Moro] = 274 μM.
4.3.3 Kinetics of abasic site formation in RNA exposed to nitrosative conditions
Based on evidence from previous studies indicating that a nitrosative environment leads
to depurination of DNA [8,9,34], the accumulation of abasic sites was measured in RNA
exposed to well defined N2O3 concentrations. Employing the predictable conditions maintained
in the NO-delivery reactor, solutions of purified RNA (9.5 μg/mL) in Na-PO4 buffer were
exposed to steady femtomolar levels of N2O3 for several hours while 2.5 mL aliquots were
withdrawn from the reaction vessels at regular intervals. Collected RNA samples were first
treated with a biotinylated probe (Figure 4.2) that reacts with the aldehyde groups expected to
arise at sites along the macromolecule where nucleobases are lost due to nitrosation. The
derivatized samples were subsequently hydrolyzed to nucleosides with a combination of
enzymes discussed in the Methods section. Levels of probe-derivatized ribose were then
quantified using a sensitive LC-MS/MS approach and results revealed a time-dependent increase

163
of N2O3-induced apurinic lesions. The time course of AP sites accumulating in RNA throughout
the exposure is shown in Figure 4.6.
A linear least squares fit on the data set presented in Figure 4.6, which indicate a
negligible consumption of parent RNA, allowed calculation of the corresponding rate constant
(kAP). The fitted slope (d[AP]/dt) was determined to be 1.6 (± 0.3) × 10-8
μM/min while rA and
rG remained nearly constant at approximately 7 μM each, based on the total amount of RNA in
solution. Incorporating the values of parameters discussed above (α, d[NMor]/dt, [Moro]) as well
as the rate constant for Mor nitrosation (k5 = 6.5 × 10⁷ M
-1 s
-1 at 37
oC; listed in Table 3.1 in
section 3.2.12 of Chapter 3), equation B yields: kAP = 1.5 (± 0.3) × 102 M
-1s
-1.
To our knowledge, this is the first time AP site formation is observed in RNA exposed to
precisely controlled levels of NO in vitro and it is the first quantitative estimate of the rate
constant describing cleavage of glycosidic bonds in RNA due to nitrosative stress.
4.4 Discussion
Overproduction of NO in the microenvironment of inflamed tissues is believed to lead to
a battery of reactive chemical species [1,2,62] that can potentially attack many elements
controlling function and structure in host cells. Among those reactants, the nitrosating agent
N2O3 has been shown in vitro and in vivo to damage nucleic acids [4,34,38,61,63], which raises
questions about its role in interfering with storing genetic information and regulation of cell
division and growth. In particular, nitrosation of nucleobases in DNA predominantly gives rise to
deamination products (discussed in detail in Chapter 3). However, there is evidence that the same
type of chemistry results in cleaved glycosidic bonds in purines and the formation of basic sites
[9,34]. Supporting the concept that RNA is susceptible to the same types of damage as DNA, we

164
Figure 4.6. Time course for the formation of abasic sites in RNA exposed to NO and O2.
Abasic site formation in total RNA (9.5 μg/mL) during exposure to 1.7 μM NO and 210 μM O2
(data represent mean ± S.D. for n = 3). Data were subjected to a linear regression analysis and
the resulting fitted slopes were used for the rate constant calculation.

165
investigated the rate at which apurinic lesions accumulate in total RNA exposed to well-defined
levels of N2O3. To achieve this, we used a system for controlled delivery of NO (described
extensively in Chapter 2 [33,36]) to simulate the nitrosative conditions believed to occur in
proximity to sites of inflammation mainly because of activated macrophages [62] and maintain
the steady conditions necessary to study the kinetics of AP site formation in RNA.
One of the crucial components to measuring levels of AP sites was the selection of an
aldehyde-reactive probe that could efficiently capture the presence of base-free sugars along the
nitrosatively damaged RNA macromolecules. We chose N-aminooxyacetyl-N'- biotinyl
hydrazine since this particular probe was previously used to detect AP sites in DNA [48] and,
although several modified probes have since been developed exploiting the reactivity of the
aminooxy group towards aldehyde-containing open-ringed deoxyribose [64], because its
reactivity with abasic sites in RNA has been recently investigated [55,56]. Employing the
biotinylated aldehyde-reactive probe in DNA blot analyses, Tanaka et al. established that RNA
abasic sites were readily generated in vitro. This raised the possibility of glycosidic bonds being
cleaved in RNA when it is exposed to various sources and levels of oxidative stress in vivo,
similarly to what has been observed with DNA. The current work used the same probe to show
that formation of abasic sites can also be detected in RNA exposed to nitrosating agents,
consistent with experimental findings suggesting that nitrosated purines in DNA lead to the
formation of base-free deoxyribose [8,9,34]. These results (in parallel with what was presented in
Chapter 3) reinforce the notion that, despite major differences in structure and distribution in the
cellular milieu, RNA and DNA are susceptible to the same type of damaging chemistries and
these chemistries give rise to the same types of lesions or adducts (e.g. 8-OH-guanine,
deamination products, apurinic sites). Secondly, exposure to NO seems to be associated with the

166
formation of abasic sites in both types of nucleic acids, adding nitrosation to the list of chemical
stresses that likely lead to depurination in vivo [2]. This raises the question of whether a
synergistic phenomenon resulting in considerably higher levels of the particular damage could
take place in inflamed tissues, where overproduction of NO coincides with the abundance of
oxidants.
Formation of apurinic sites is considered to be a biologically important DNA damage
product [10]. It is believed that oxidative modifications on nucleobases weaken the glycosidic
bond, leading to the generation of base-free sugars that contain an aldehyde group at the 1'
position of the open ring form of 2-deoxyribose. Alternatively, base-free 2-deoxyribose is
formed by DNA glycosylases that cleave the glycosidic bond connecting the sugar to a damaged
base [15-18]. These abasic sites are eventually removed from the macromolecule by abasic site
endonucleases as part of the cellular base excision repair system [24-26]. However, abasic
lesions formed in RNA – as a result of oxidative [56] or nitrosative stress – are presumably not
subjected to the same protective mechanisms of repair and could potentially be more persistent in
the cellular environment due to their greater chemical stability, compared to those in DNA [65].
If created and maintained in the cellular environment, abasic lesions may have a significant
effect on the translation process in vivo as suggested by the impact of enzymatic mRNA and
rRNA depurination on translational activity [66,67]. The implications of damage in the form of
base-free ribose in RNA extend to inaccuracies concerning the information stored in coding and
non-coding transcripts, interference with RNA editing processes [29], the response of the
translational machinery under cellular stresses [27,28], and imbalances over regulating elements
linked to the progression of cancer [30-32].

167
We have developed a sensitive LC-MS/MS approach to quantifying RNA abasic sites.
The limit of quantification of this method is ~2 fmol or ~4 lesions per 108 nucleotides in 20 μg of
RNA (Figure 4.3), which is lower than the chemically non-specific blot quantification method of
Tanaka and coworkers, which has a limit of detection of 10 fmol (1 lesion per 105 nucleotides in
100 μg of RNA) reported in ref. [56]. This sensitivity enabled us to quantify low levels of
apurinic sites in hydrolyzed RNA damaged by controlled levels of N2O3. The data presented
above are the first indicating that RNA exposed to nitrosative conditions can generate abasic
sites, which is consistent with previous exposures of plasmid DNA in a similar experimental
setting [34]. To gain a quantitative measure of the rate at which these lesions form under the
predicted steady N2O3 levels, we employed a kinetic analysis to determine a rate constant for the
accumulation of AP sites (kAP = 1.5 × 10² M
-1s
-1). Performing the same analysis on the data
reported by Dong et al., we calculated the corresponding kinetic parameter to be approximately
50-fold greater in DNA (8 × 10³ M
-1s
-1; assuming a typical activation energy of 20 kJ/mol to
extrapolate from 23 oC to 37
oC), which is consistent with the observation that AP sites form
spontaneously in RNA more slowly than in DNA [12,68]. The well defined conditions
maintained during the in vitro investigations undertaken in the current work allow extrapolation
of recently gained insight on apurinic site formation to biological systems. Hence, assuming that
nitrosation and formation of apurinic sites are similar in vitro and in cells, it is reasonable to
anticipate at least an order of magnitude greater accumulation of abasic sites in DNA compared
to RNA extracted from e.g. NO-treated cells or tissues from animal models of chronic
inflammatory stress. From a biomarker perspective, it is not directly apparent whether AP sites
can be more readily detected in DNA or RNA. Our current data suggest that there is a difference
in how fast nitrosated nucleobases are lost from the two types of nucleic acids. However,

168
parameters such as accessibility and repair may be of critical importance when deciding on the
most efficient molecular surrogate. At any rate, depurination induced by nitrosation turns out to
be orders of magnitude slower than nitrosative deamination (rate constants determined in
Chapter 3 range between ~104 and ~10
7 M
-1s
-1), at least as measured under our experimental
settings and methods, making apurinic sites less promising as biomarkers compared to
deamination products. On the other hand, it is possible that the methodologies using aldehyde-
reactive probes underestimate the total number of base-free sugars accumulating in nucleic acids
since the majority of abasic sites exist at all times in a hemiacetal (ring-closed) form [11,69,70]
rather than the aldehyde (ring-opened), with only the latter being able to react with the
aforementioned probes.
Lastly, the protocol presented in this work can increase our understanding of the
generation and fate of abasic sites in the intracellular environment. As mentioned already, the
majority of the studies investigating formation of apurinic sites maintain their focus on DNA as a
substrate while only a subset of those have the necessary sensitivity and chemical specificity to
unequivocally quantify biologically relevant levels of the particular lesion [57,58]. An equally
effective method measuring abasic sites in RNA not only addresses the recent need to monitor
RNA species as targets of the same nitrosative or oxidative chemistries that damage the genome
[71] but also can reveal potential protective effects associated with the cytosol. If experimentally
measured levels of AP sites in DNA and RNA extracted from challenged cells reflect the
difference in reactivity established in vitro, then the cellular milieu can be assumed to be
spatially homogeneous in terms of dealing with the imposed insult. On the other hand, in the
event that formation of AP sites in RNA is determined to be faster compared to DNA, a number
of questions can be raised regarding a) the compartmentalization of the cell and how it affects

169
concentrations of antioxidants, b) the possibility of nuclear proteins limiting the exposure of
DNA to damaging agents, c) a possible synergistic effect originating from mitochondria and
amplifying the observed damage, and d) differential rates of repair linked to different types of
nucleic acids. In any case, the progress made in measuring AP sites in other species besides
DNA can assist in finding more accurate markers of exposure to endogenous sources of
nitrosative or oxidative stress.
In summary, we have developed a platform to quantify the rate at which purine
nucleobases in RNA give rise to abasic sites in a controlled nitrosative environment. The
delivery system generates constant and predicable concentrations of NO (~1 μM), O2 (~200 μM)
and N2O3 (~100 fM) – comparable to levels expected to form at sites of inflammation – that lead
to the accumulation of several lesions along the macromolecule, including the base-free ribose
presumed to result from the cleavage of nitrosated purines. Subsequently, a specialized
derivatizing agent that reacts with the aldehyde moiety of the open form of an apurinic site in
combination with a sensitive LC-MS/MS method enables the detection of the lesion in hand. The
kinetic profile of abasic site formation in RNA revealed a slow dose-response increase,
indicating that nitrosation of RNA does indeed lead to depurination, and the calculated relevant
kinetic parameter, kAP = 1.5 (± 0.3) × 102 M
-1s
-1, suggests that genesis of base-free sugars from
nitrosated purines is a slower process in RNA compared to DNA.

170
4.5 References
[1] Dedon, P. C. and Tannenbaum, S. R. (2004) Reactive nitrogen species in the chemical
biology of inflammation. Arch. Biochem. Biophys. 423: 12-22.
[2] Marnett, L. J. (2012) Inflammation and cancer: Chemical approaches to mechanisms,
imaging, and treatment. J. Org. Chem. 77: 5224-5238.
[3] Wink, D., Kasprzak, K., Maragos, C., Elespuru, R., Misra, M., Dunams, T., Cebula, T.,
Koch, W., Andrews, A., Allen, J., and Keefer, L. K. (1991) DNA deaminating ability and
genotoxicity of nitric oxide and its progenitors. Science. 254: 1001-1003.
[4] Caulfield, J. L., Wishnok, J. S., and Tannenbaum, S. R. (1998) Nitric oxide-induced
deamination of cytosine and guanine in deoxynucleosides and oligonucleotides. J. Biol.
Chem. 273: 12689-12695.
[5] Lewis, R. S., Tannenbaum, S. R., and Deen, W. M. (1995) Kinetics of N-nitrosation in
oxygenated nitric oxide solutions at physiological pH: Role of nitrous anhydride and
effects of phosphate and chloride. J. Am. Chem. Soc. 117: 3933-3939.
[6] Keshive, M., Singh, S., Wishnok, J. S., Tannenbaum, S. R., and Deen, W. M. (1996)
Kinetics of S-nitrosation of thiols in nitric oxide solutions. Chem. Res. Toxicol. 9: 988-
993.
[7] Kirchner, J. J., Sigurdsson, S. T., and Hopkins, P. B. (1992) Interstrand cross-linking of
duplex DNA by nitrous acid: covalent structure of the dG-to-dG cross-link at the
sequence 5'-CG. J. Am. Chem. Soc. 114: 4021-4027.
[8] Lucas, L. T., Gatehouse, D., and Shuker, D. E. G. (1999) Efficient nitroso group transfer
from N-nitrosoindoles to nucleotides and 2'-deoxyguanosine at physiological pH. J. Biol.
Chem. 274: 18319-18326.
[9] Lucas, L. T., Gatehouse, D., Jones, G. D. D., and Shuker, D. E. G. (2001)
Characterization of DNA damage at purine residues in oligonucleotides and calf thymus
DNA induced by the mutagen 1-nitrosoindole-3-acetonitrile. Chem. Res. Toxicol. 14:
158-164.
[10] Lindahl, T. and Karlstrom, O. (1973) Heat-induced depyrimidination of deoxyribonucleic
acid in neutral solution. Biochemistry. 12: 5151-5154.
[11] Wilson III, D. M. and Barsky, D. (2001) The major human abasic endonuclease:
formation, consequences and repair of abasic lesions in DNA. Mutat. Res. 485: 283-307.
[12] Loeb, L. A. and Preston, B. D. (1986) Mutagenesis by apurinic/apyrimidinic sites. Annu.
Rev. Genet. 20: 201-230.

171
[13] Kanazawa, A., Sawa, T., Akaik, T., and Maeda, H. (2000) Formation of abasic sites in
DNA by t-butyl peroxyl radicals: implication for potent genotoxicity of lipid peroxyl
radicals. Cancer Lett. 156: 51-55.
[14] Lindahl, T. and Nyberg, B. (1972) Rate of depurination of native deoxyribonucleic acid.
Biochemistry. 11: 3610-3618.
[15] Krokan, H. E., Standal, R., and Slupphaug, G. (1997) DNA glycosylases in the base
excision repair of DNA. Biochem. J. 325: 1-16.
[16] McCullough, A. K., Dodson, M. L., and Lloyd, R. S. (1999) Initiation of base excision
repair: glycosylase mechanisms and structures. Annu. Rev. Biochem. 68: 255-285.
[17] Rubinson, E. H., Gowda, A. S. P., Spratt, T. E., Gold, B., and Eichman, B. F. (2010) An
unprecedented nucleic acid capture mechanism for excision of DNA damage. Nature.
468: 406-411.
[18] Lindahl, T. (1993) Instability and decay of the primary structure of DNA. Nature. 362:
709-715.
[19] Lindahl, T. and Andersson, A. (1972) Rate of chain breakage at apurinic sites in double-
stranded deoxyribonucleic acid. Biochemistry. 11: 3618-3623.
[20] Lhomme, J., Constant, J.-F., and Demeunynck, M. (1999) Abasic DNA structure,
reactivity, and recognition. Biopolymers. 52: 65-83.
[21] Pourquier, P., Ueng, L.-M., Kohlhagen, G., Mazumder, A., Gupta, M., Kohn, K. W., and
Pommier, Y. (1997) Effects of uracil incorporation, DNA mismatches, and abasic sites on
cleavage and religation activities of mammalian topoisomerase I. J. Biol. Chem. 272:
7792-7796.
[22] Shearman, C. W. and Loeb, L. A. (1977) Depurination decreases fidelity of DNA
synthesis in vitro. Nature. 270: 537-538.
[23] Kingma, P. S. and Osheroff, N. (1997) Apurinic sites are position-specific topoisomerase
II poisons. J. Biol. Chem. 272: 1148-1155.
[24] Demple, B. and Harrison, L. (1994) Repair of oxidative damage to DNA: Enzymology
and biology. Annu. Rev. Biochem. 63: 915-948.
[25] Khodyreva, S. N., Prasad, R., Ilina, E. S., Sukhanova, M. V., Kutuzov, M. M., Liu, Y.,
Hou, E. W., Wilson, S. H., and Lavrik, O. I. (2010) Apurinic/apyrimidinic (AP) site
recognition by the 5'-dRP/AP lyase in poly(ADP-ribose) polymerase-1 (PARP-1). Proc.
Natl. Acad. Sci. U.S.A. 107: 22090-22095.
[26] Grösch, S., Fritz, G., and Kaina, B. (1998) Apurinic endonuclease (Ref-1) is induced in
mammalian cells by oxidative stress and involved in clastogenic adaptation. Cancer Res.
58: 4410-4416.

172
[27] Chan, C. T. Y., Dyavaiah, M., DeMott, M. S., Taghizadeh, K., Dedon, P. C., and Begley,
T. J. (2010) A quantitative systems approach reveals dynamic control of tRNA
modifications during cellular stress. P.L.O.S. Genet. 6: e1001247.
[28] Chan, C. T. Y., Pang, Y. L. J., Deng, W., Babu, I. R., Dyavaiah, M., Begley, T. J., and
Dedon, P. C. (2012) Reprogramming of tRNA modifications controls the oxidative stress
response by codon-biased translation of proteins. Nat. Commun. 3: 937.
[29] Bass, B. L. (2002) RNA editing by adenosine deaminases that act on RNA. Annu. Rev.
Biochem. 71: 817-846.
[30] Sager, R. (1997) Expression genetics in cancer: Shifting the focus from DNA to RNA.
Proc. Natl. Acad. Sci. U.S.A. 94: 952-955.
[31] Nicoloso, M. S., Spizzo, R., Shimizu, M., Rossi, S., and Calin, G. A. (2009) MicroRNAs
- the micro steering wheel of tumour metastases. Nat. Rev. Cancer. 9: 293-302.
[32] Chari, R., Thu, K., Wilson, I., Lockwood, W., Lonergan, K., Coe, B., Malloff, C.,
Gazdar, A., Lam, S., Garnis, C., MacAulay, C., Alvarez, C., and Lam, W. (2010)
Integrating the multiple dimensions of genomic and epigenomic landscapes of cancer.
Cancer Metastasis Rev. 29: 73-93.
[33] Wang, C. and Deen, W. M. (2003) Nitric oxide delivery system for cell culture studies.
Ann. Biomed. Eng. 31: 65-79.
[34] Dong, M., Wang, C., Deen, W. M., and Dedon, P. C. (2003) Absence of 2'-
deoxyoxanosine and presence of abasic sites in DNA exposed to nitric oxide at controlled
physiological concentrations. Chem. Res. Toxicol. 16: 1044-1055.
[35] Wang, C., Trudel, L. J., Wogan, G. N., and Deen, W. M. (2003) Thresholds of nitric
oxide-mediated toxicity in human lymphoblastoid cells. Chem. Res. Toxicol. 16: 1004-
1013.
[36] Dendroulakis, V., Russell, B. S., Eric Elmquist, C., Trudel, L. J., Wogan, G. N., Deen,
W. M., and Dedon, P. C. (2012) A system for exposing molecules and cells to
biologically relevant and accurately controlled steady-state concentrations of nitric oxide
and oxygen. Nitric Oxide Biol. Chem. 27: 161-168.
[37] Keefer, L. K., Nims, R. W., Davies, K. M., and Wink, D. A. (1996) "NONOates" (1-
substituted diazen-1-ium-1,2-diolates) as nitric oxide donors: convenient nitric oxide
dosage forms. Methods Enzymol. 268: 281-293.
[38] Dong, M. and Dedon, P. C. (2006) Relatively small increases in the steady-state levels of
nucleobase deamination products in DNA from human TK6 cells exposed to toxic levels
of nitric oxide. Chem. Res. Toxicol. 19: 50-57.
[39] Li, C.-Q., Wright, T. L., Dong, M., Dommels, Y. E. M., Trudel, L. J., Dedon, P. C.,
Tannenbaum, S. R., and Wogan, G. N. (2005) Biological role of glutathione in nitric

173
oxide-induced toxicity in cell culture and animal models. Free Radic. Biol. Med. 39:
1489-1498.
[40] Li, C.-Q., Pang, B., Kiziltepe, T., Trudel, L. J., Engelward, B. P., Dedon, P. C., and
Wogan, G. N. (2006) Threshold effects of nitric oxide-induced toxicity and cellular
responses in wild-type and p53-null human lymphoblastoid cells. Chem. Res. Toxicol. 19:
399-406.
[41] Li, C.-Q., Kim, M. Y., Godoy, L. C., Thiantanawat, A., Trudel, L. J., and Wogan, G. N.
(2009) Nitric oxide activation of Keap1/Nrf2 signaling in human colon carcinoma cells.
Proc. Natl. Acad. Sci. U.S.A. 106: 14547-14551.
[42] Weinfeld, M., Liuzzi, M., and Paterson, M. C. (1990) Response of phage T4
polynucleotide kinase toward dinucleotides containing apurinic sites: design of a 32
P-
postlabeling assay for apurinic sites in DNA. Biochemistry. 29: 1737-1743.
[43] Sauvaigo, S., Petec-Calin, C., Caillat, S., Odin, F., and Cadet, J. (2002) Comet assay
coupled to repair enzymes for the detection of oxidative damage to DNA induced by low
doses of -radiation: Use of YOYO-1, low-background slides, and optimized
electrophoresis conditions. Anal. Biochem. 303: 107-109.
[44] Collins, C., Awada, M. M., Zhou, X., and Dedon, P. C. (2003) Analysis of 3'-
phosphoglycolaldehyde residues in oxidized DNA by gas chromatography/negative
chemical ionization/mass spectrometry. Chem. Res. Toxicol. 16: 1560-1566.
[45] Talpaert-Borle, M. and Liuzzi, M. (1983) Reaction of apurinic/apyrimidinic sites with
[14
C]methoxyamine: A method for the quantitative assay of AP sites in DNA. Biochim.
Biophys. Acta. 740: 410-416.
[46] Zhou, X., Liberman, R. G., Skipper, P. L., Margolin, Y., Tannenbaum, S. R., and Dedon,
P. C. (2005) Quantification of DNA strand breaks and abasic sites by oxime
derivatization and accelerator mass spectrometry: Application to -radiation and
peroxynitrite. Anal. Biochem. 343: 84-92.
[47] Chen, B.-X., Kubo, K., Ide, H., Erlanger, B. F., Wallace, S. S., and Kow, Y. W. (1992)
Properties of a monoclonal antibody for the detection of abasic sites, a common DNA
lesion. Mutat. Res. 273: 253-261.
[48] Kubo, K., Ide, H., Wallace, S. S., and Kow, Y. W. (1992) A novel sensitive and specific
assay for abasic sites, the most commonly produced DNA lesion. Biochemistry. 31: 3703-
3708.
[49] Nakamura, J. and Swenberg, J. A. (1999) Endogenous apurinic/apyrimidinic sites in
genomic DNA of mammalian tissues. Cancer Res. 59: 2522-2526.
[50] Maulik, G., Botchway, S., Chakrabarti, S., Tetradis, S., Price, B., and Makrigiorgos, G.
M. (1999) Novel non-isotopic detection of MutY enzyme-recognized mismatches in
DNA via ultrasensitive detection of aldehydes. Nucleic Acids Res. 27: 1316-1322.

174
[51] Boturyn, D., Constant, J.-F., Defrancq, E., Lhomme, J., Barbin, A., and Wild, C. P.
(1999) A simple and sensitive method for in vitro quantitation of abasic sites in DNA.
Chem. Res. Toxicol. 12: 476-482.
[52] Fundador, E. and Rusling, J. (2007) Detection of labeled abasic sites in damaged DNA by
capillary electrophoresis with laser-induced fluorescence. Anal. Bioanal. Chem. 387:
1883-1890.
[53] Ide, H., Akamatsu, K., Kimura, Y., Michiue, K., Makino, K., Asaeda, A., Takamori, Y.,
and Kubo, K. (1993) Synthesis and damage specificity of a novel probe for the detection
of abasic sites in DNA. Biochemistry. 32: 8276-8283.
[54] Atamna, H., Cheung, I., and Ames, B. N. (2000) A method for detecting abasic sites in
living cells: Age-dependent changes in base excision repair. Proc. Natl. Acad. Sci. U.S.A.
97: 686-691.
[55] Tanaka, M., Han, S., Küpfer, P. A., Leumann, C. J., and Sonntag, W. E. (2011)
Quantification of oxidized levels of specific RNA species using an aldehyde reactive
probe. Anal. Biochem. 417: 142-148.
[56] Tanaka, M., Song, H., Küpfer, P. A., Leumann, C. J., and Sonntag, W. E. (2011) An
assay for RNA oxidation induced abasic sites using the aldehyde reactive probe. Free
Radic. Res. 45: 237-247.
[57] Roberts, K. P., Sobrino, J. A., Payton, J., Mason, L. B., and Turesky, R. J. (2006)
Determination of apurinic/apyrimidinic lesions in DNA with high-performance liquid
chromatography and tandem mass spectrometry. Chem. Res. Toxicol. 19: 300-309.
[58] Li, J., Leung, E. M. K., Choi, M. M. F., and Chan, W. (2013) Combination of
pentafluorophenylhydrazine derivatization and isotope dilution LC-MS/MS techniques
for the quantification of apurinic/apyrimidinic sites in cellular DNA. Anal. Bioanal.
Chem.: 1-8.
[59] Maniatis, T., Fritsch, E. F., and Sambrook, J. (1982) Molecular Cloning: A Laboratory
Manual in, Cold Spring Harbor Laboratory Press, Cold Spring Harbor, NY.
[60] Taghizadeh, K., McFaline, J. L., Pang, B., Sullivan, M., Dong, M., Plummer, E., and
Dedon, P. C. (2008) Quantification of DNA damage products resulting from
deamination, oxidation and reaction with products of lipid peroxidation by liquid
chromatography isotope dilution tandem mass spectrometry. Nat. Protoc. 3: 1287-1298.
[61] Mangerich, A., Knutson, C. G., Parry, N. M., Muthupalani, S., Ye, W., Prestwich, E.,
Cui, L., McFaline, J. L., Mobley, M., Ge, Z., Taghizadeh, K., Wishnok, J. S., Wogan, G.
N., Fox, J. G., Tannenbaum, S. R., and Dedon, P. C. (2012) Infection-induced colitis in
mice causes dynamic and tissue-specific changes in stress response and DNA damage
leading to colon cancer. Proc. Natl. Acad. Sci. U.S.A. 109: E1820-E1829.

175
[62] Lewis, R. S., Tamir, S., Tannenbaum, S. R., and Deen, W. M. (1995) Kinetic analysis of
the fate of nitric oxide synthesized by macrophages in vitro. J. Biol. Chem. 270: 29350-
29355.
[63] Pang, B., Zhou, X., Yu, H., Dong, M., Taghizadeh, K., Wishnok, J. S., Tannenbaum, S.
R., and Dedon, P. C. (2007) Lipid peroxidation dominates the chemistry of DNA adduct
formation in a mouse model of inflammation. Carcinogenesis. 28: 1807-1813.
[64] Kojima, N., Takebayashi, T., Mikami, A., Ohtsuka, E., and Komatsu, Y. (2009)
Construction of highly reactive probes for abasic site detection by introduction of an
aromatic and a guanidine residue into an aminooxy group. J. Am. Chem. Soc. 131: 13208-
13209.
[65] Küpfer, P. A. and Leumann, C. J. (2007) The chemical stability of abasic RNA compared
to abasic DNA. Nucleic Acids Res. 35: 58-68.
[66] Hudak, K. A., Wang, P., and Tumer, N. E. (2000) A novel mechanism for inhibition of
translation by pokeweed antiviral protein: depurination of the capped RNA template.
RNA. 6: 369-380.
[67] Hudak, K. A., Bauman, J. D., and Tumer, N. E. (2002) Pokeweed antiviral protein binds
to the cap structure of eukaryotic mRNA and depurinates the mRNA downstream of the
cap. RNA. 8: 1148-1159.
[68] Kotchetkov, N. K. and Budovskii, E. I. (1972) Hydrolysis of N-glycosidic bonds in
nucleosides, nucleotides and their derivatives, Plenum Publishing Co., New York.
[69] Pierce, J., Serianni, A. S., and Barker, R. (1985) Anomerization of furanose sugars and
sugar phosphates. J. Am. Chem. Soc. 107: 2448-2456.
[70] Wilde, J. A., Bolton, P. H., Mazumder, A., Manoharan, M., and Gerlt, J. A. (1989)
Characterization of the equilibrating forms of the aldehydic abasic site in duplex DNA by 17
O NMR. J. Am. Chem. Soc. 111: 1894-1896.
[71] Li, Z., Wu, J., and DeLeo, C. J. (2006) RNA damage and surveillance under oxidative
stress. I.U.B.M.B. Life. 58: 581-588.

176
Chapter 5
Estimation of cytosolic levels of N2O3 in human cells under
nitrosative stress
5.1 Introduction
Nitric oxide (NO) is a free radical with diverse physiological roles in mammals, including
regulation of vasculature, signal transmission between neurons, and pathogen killing through the
innate immune system [1-3]. In particular, micromolar NO concentrations generated at sites of
inflammation [4-7] are believed to give rise to a battery of reactive nitrogen species [8] that not
only attack foreign microorganisms but also cause damage to surrounding host cells.
Peroxynitrite (ONOO─) is formed in a reaction of NO with superoxide (O2
), whereas the
nitrogen dioxide radical (NO2) and nitrous anhydride (N2O3) are produced from NO in the
presence of molecular oxygen [9]. These reactive chemical mediators of inflammation can
damage all types of cellular components, including lipids, nucleic acids and proteins [10], while
elevated levels of these species sustained over prolonged periods of time are implicated in the
initiation and progression of diseases linked to chronic inflammation, such as cancer [11-14]. In
contrast to the oxidizing properties of ONOO─, N2O3 is a potent nitrosating agent (Table 1 in ref.
[8]) that reacts with amino groups in heterocyclic bases of free nucleosides and nucleic acids
[15,16] – among other nucleophilic targets such as inorganic anions [17] and thiols [18] – and
gives rise to nucleobase deamination products, abasic sites and DNA crosslinks [10,19].
Interestingly, nucleobase deamination in DNA and RNA can also arise by several nitrosation-
independent mechanisms, such as simple hydrolysis [20,21], reactions with bisulfite [22], and
enzymatic mechanisms [23,24], as well as a result of altered purine nucleotide metabolism [25].

177
While hydrolysis and bisulfite reactions do not present problems for nucleobase deamination
artifacts, we can control adventitious deamination by deaminase contamination arising during
cell processing and from commercial enzyme preparations using deaminase inhibitors [26,27].
The mechanism of nucleobase deamination involves reaction of electrophilic N2O3 which
arises in both weakly acidic solutions of nitrite and in oxygenated NO solutions at physiological
pH [15,28-31] with nucleophilic nitrogens in nucleobases to form an N-nitroso species that
rearranges to an aryl diazonium intermediate, with the diazonium ion undergoing nucleophilic
substitution by water to replace the original amino group by an oxygen [32]. Nitrosative
deamination leads to the formation of modified nucleobases such as xanthine (X) and oxanine
(O) derived from guanine (G), hypoxanthine (I) from adenine (A), and uracil (U) from cytosine
[10,19], as illustrated in Figure 5.1. Although nitrosation leads to other lesions such as 2-
deoxyguanosine (dG) intra-strand cross-links [33] and abasic sites [34,35], the accumulation of
nucleobase deamination products seems to be the major pathway as revealed in previous studies
[26,36] and in the kinetic analyses described in Chapters 3 and 4. Although the majority of
studies have focused on investigating the potential of DNA deamination products as indicators of
exposure to NO in vitro [15,26,37] and in vivo [27,38,39], modifications in nucleic acids other
than genomic DNA may be more efficient markers for nitrosative stress. In particular, RNA may
be more susceptible to nucleobase damage since it is more widely distributed in the cytosol, is
associated to a lesser degree with proteins and undergoes less repair compared to nuclear DNA
[40]. This is consistent with recent findings reporting higher levels of deamination products
detected in RNA versus DNA extracted from inflamed murine tissues [39]. A similar differential
reactivity in nucleic acids, albeit from the perspective of propensity to oxidative damage, has
also been established in bacteria, human cells and mice [41-43]. Assessing levels of

178
Figure 5.1. Products of DNA nucleobase deamination.
The same deamination products arise in free ribonucleosides or ribonucleosides as constituents
of polymeric RNA (adapted from ref. [19]).

179
modifications in RNA nucleosides becomes even more significant if one considers that changes
in the sequence of coding and non-coding RNA species have consequences for gene expression
by affecting the function of the translational machinery [44,45], interfering with post-
transcriptional RNA editing [46,47], or disrupting regulatory elements strongly correlated with
the progression of different types of cancer [48-50].
Determining the extent of nitrosative damage in nucleic acids during exposure to
inflammatory conditions in vivo is critical for gauging the health risks that may be associated
with chronic NO overproduction. However, measuring concentrations of reactive nitrogen
species formed at inflamed tissues is unfeasible both due to limited technology and the short
half-life of derivatives of NO such as ONOO─, NO2 and N2O3. To circumvent the impracticality
of their direct detection in vivo, levels of reactive nitrogen species can be estimated using kinetic
models that include rates of relevant reactions established in controlled studies. The accuracy of
the model-derived concentration predictions can subsequently be validated by measuring stable
end products (i.e., biomarkers) that are quantifiable in treated cells or in the extracellular space
surrounding the cells. Based on this principle, micromolar NO levels measured in activated
macrophage cultures [5] led to the development of a series of models describing concentration
profiles of reactive species in simulated cell cultures [51,52]. Incorporating elements of cellular
synthesis and consumption in the formulation of kinetic models [53] allowed for a more precise
representation of the local microenvironment at sites of inflammation [54]. To gain further
insight into the cellular fates of NO during inflammation, detailed models of intracellular
chemistry have been developed to calculate the kinetics of NO-derived species in exposed cells
[55] and to predict steady-state levels of reactive intermediates expected to arise in cells under
biologically relevant nitrosative conditions [56]. In the latter case, Deen and coworkers provided

180
the first estimates for cytosolic steady-state concentrations of NO2 (~1 pM) and N2O3 (1-50 fM)
arising at an inflammation-relevant NO concentration of 1 μM and predicted that glutathione
(GSH) acts as the main scavenger for both NO derivatives and that a 10-fold decrease in cellular
GSH levels can lead to a ~10-fold higher N2O3 abundance in the cell. These values were
calculated using kinetic data derived from in vitro studies and assuming that the effect of the
cytosolic milieu on the experimentally determined rates is negligible. As described in this
chapter, this is not the case since protein thiols may represent a more significant and relatively
constant scavenging factor for N2O3 levels.
Toward the goal of defining levels of N2O3 at sites of inflammation in humans, we have
undertaken studies to estimate N2O3 levels in human cells exposed to biologically relevant levels
of NO using RNA deamination products as a surrogate for the short-lived N2O3. A critical
feature of the studies involves controlled delivery of predictable and biologically relevant steady-
state levels of NO to cells. NO can be introduced into cell cultures by a variety of strategies. A
popular but problematic technique involves the use of “NONOates” that release NO with various
kinetics to provide transient, non-uniform levels of NO that must be averaged over time to define
the exposure level [57]. The difficulty of controlling the steady-state concentration of NO with
NONOates over longer periods of exposure [57,58] is coupled with the fact that interpretation of
data obtained from NONOates is complicated by unknown effects of non-NO free radical species
generated along with NO, generation of alternative reactive nitrogen species in addition to NO
[57], and the need for several different NO donor compounds to span the range of
physiologically relevant NO concentrations [59]. Perhaps the best characterized and most
broadly applicable system that mimics the nitrosative environment at sites of inflammation was
developed by Deen and coworkers using NO- and O2-permeable polydimethylsiloxane (Silastic)

181
tubing to deliver the gases to cell cultures at constant and predictable levels [27,60-63]. A mass
transfer model was developed to predict the concentrations of NO and O2 in the system given the
values of certain operational parameters [64], and a subsequent kinetic analysis estimated the
levels of N2O3 formed in the solution [26], making the tubing-based delivery apparatus ideal for
kinetic studies of nitrosative deamination.
The other critical feature of these studies was the choice of a surrogate for the short-lived
N2O3. Nitrosative damage products in RNA were chosen as the exposure indices given the
widespread distribution and relatively high concentration of RNA in cells, the availability of
methods for rigorous quantification of RNA deamination products, and the foundation of kinetic
data for RNA deamination from the studies of Chapter 3. By comparing the time course for the
formation of rI, rX and rO in RNA extracted from cells under NO-induced stress with in vitro
kinetic analyses involving exposure of purified RNA to similar conditions (discussed in Chapter
3), we were able to estimate the apparent intracellular levels of N2O3 (0.2-40 fM) that led to the
observed generation of deamination products in vivo. Repeating the experiments using an
inhibitor of cellular GSH synthesis revealed the modest effect of cytosolic GSH levels on
mitigating the N2O3-associated damage, suggesting that additional antioxidants or nucleophiles
may react with the nitrosating agent in the cytoplasm. Our experimentally-derived calculations
agree with estimates from recent mathematical models that predict steady-state N2O3
concentrations in cells of inflamed tissues [56].
5.2 Materials and Methods
5.2.1 Chemicals

182
Na2HPO4 NaH2PO4 and ammonium acetate were obtained from American Bioanalytical,
LC-MS grade acetonitrile from EMD, ethanol from Koptec, glacial acetic acid, inosine (rI), and
xanthosine (rX) were from Sigma (98% or higher purity) whereas oxanosine (rO) was
synthesized by bubbling pure NO gas (Airgas) through saturated guanosine (Sigma) solutions in
purified water at room temperature and subsequently isolating the product via HPLC. The
product was identified by HPLC coelution, MS and UV spectroscopy relative to published data
[65]. Water purified through a Milli-Q system (Millipore) was used throughout the study.
5.2.2 Human cell culture
TK6 human lymphoblastoid cells (ATCC) were maintained in exponentially growing
suspension cultures at 37°C in a humidified atmosphere of 95% air and 5% CO2 in RPMI-1640
medium supplemented with 10% (v/v) heat-inactivated donor horse serum, 100 units/mL
penicillin, 100 μg/mL streptomycin, and 2 mM L-glutamine. Stock cell cultures were routinely
passaged to maintain an optimal growth density (~1.0 × 10⁶ cells/mL) in 150 mm dishes. To
obtain glutathione-depleted cells, appropriate amounts of filter-sterilized solutions of buthionine
sulfoximine (BSO) in water were added to cultures at a final concentration of 125 μM 24 h prior
to NO exposure and subsequently incubated in the humidified atmosphere described above;
optimal BSO concentration for GSH depletion was selected based on previous studies which also
demonstrated negligible toxicity of BSO towards TK6 cells [66]. BSO-treated cultures were
resuspended in fresh supplemented RPMI-1640 medium immediately before the NO exposures
took place. RPMI-1640, L-glutamine, streptomycin /penicillin and PBS were obtained from
Lonza; donor horse serum from Atlanta Biologicals; buthionine sulfoximine from Sigma.
5.2.3 Synthesis of isotopically labeled internal nucleoside standards

183
Uniformly 15
N-labeled internal standards of the RNA deamination products rI, rX and rO,
were synthesized as described previously [39,65] from uniformly 15
N-labeled ribonucleosides
(rA, rG) as starting materials (Cambridge Isotope Laboratories). Standards were purified by
HPLC, characterized by high-resolution mass spectrometry, and quantified by UV absorbance
using published extinction coefficients [65].
5.2.4 NO delivery system
A delivery system described in full detail in Chapter 2 [61] was employed to expose cells
to precisely controlled levels of NO and O2. Briefly, two distinct gas streams – one for NO the
other for O2 – were fed to reactors (modified 120 mL PFA screw-top jars from Cole Parmer)
containing the cultures with NO and O2 diffusing separately into the liquid through gas
permeable Silastic tubing loops (3.5-9.5 cm long, 1.96 mm o.d., 1.47 mm i.d. from Dow
Corning). The gas flow rates were 100 standard cubic centimeters per minute (sccm) for the NO-
feeding stream and 200 sccm for the O2-feeding stream in every reactor. Flow rates were
regulated via mass flow controllers obtained from Porter Instruments, Parker-Hannifin. The
contents of each reactor were kept stirred using a magnetic stirrer plate from IKA (stirring speed
at 100 rpm; stir-bar placed in every reactor) and maintained at 37 oC within a water bath. Gas
tanks of pure NO, 50% O2 in N2 (and 5% CO2) and pure argon (for controls) were obtained from
Airgas.
5.2.5 Exposure of cells to NO
Immediately before exposures, TK6 cells were transferred in sterilized reactors at a
density of ~8.5 × 10⁵ cells/mL in ~115 mL of fresh supplemented RPMI-1640 medium. A mass
transfer model that simulates the delivery system performance (discussed extensively in Chapter

184
2 [61,64]) was used to determine the exact lengths of tubing loops needed to reach specific NO
and O2 concentrations in the reactors; the reactors with tubing loops fully attached were
autoclaved before each exposure. The model incorporated cellular gas consumption rates
discussed elsewhere [60] and assumed negligible consumption of NO from the organics in the
cell culture media as shown in recent studies [61]. According to the model, a steady-state NO
concentration of ~5 μM – with oxygen levels maintained constant at ~200 μM – was achieved by
passing NO through a 3.5 cm Silastic tubing loop and 50% O2 in N2 (with 5% CO2) through a 9.5
cm loop. For control experiments, pure argon (instead of NO) was supplied through a 3.5 cm
Silastic tubing loop and 50% O2 in N2 (with 5% CO2) through a 7.0 cm loop; oxygen
concentration was also kept constant at ~200 μM throughout the control exposures. Shorter
tubing loops were required for O2 delivery in control reactors, to compensate for the reduced rate
of O2 consumption in the absence of NO. The time for the concentrations to reach their steady-
state values in every reactor was ~10 mins and after that point aliquots (6-7 mL) were withdrawn
at regular intervals and replaced with an identical volume of fresh supplemented medium. From
every aliquot, 0.1 mL was used for determining cell survival, 1.5 mL for measuring cellular GSH
levels and the residual volume for quantifying deamination products in RNA, as described
below.
5.2.6 Cell viability analysis
Live cells were identified by trypan blue exclusion (Sigma Chemical; 4% solution in
saline), and the relative viability was calculated as the ratio of the live (unstained) cell number in
NO experiments to that in argon controls (expressed as a percentage). In a separate set of
exposures, aliquots of NO- and argon-treated cultures were withdrawn, centrifuged to remove the
supernatant, resuspended in an equal volume of fresh supplemented medium and incubated for

185
48 h in the humidified atmosphere described above; cell viability was determined after the 48 h
recovery period following the exposures as specified above. Analysis with trypan blue produces
results comparable to plating efficiency and MTT (3-[4,5-dimethylthiazol-2-yl]-2,5 diphenyl
tetrazolium bromide) assays, as demonstrated in previous work [67,68].
5.2.7 Glutathione measurement
Reduced (GSH) and oxidized glutathione (GSSG) levels were measured in NO- and
argon-exposed cells using a commercial kit (Trevigen) based on the principle of glutathione
reductase recycling assay [69,70]. Aliquots of cell cultures withdrawn during exposures (~0.6-
1.4 × 10⁶ cells) were centrifuged to remove the supernatant, washed with phosphate-buffered
saline (PBS; Lonza), centrifuged to remove the supernatant again and the resulting cell pellet
was lysed in 100 μL ice-cold 2.5% (w/v) sulfosalicylic acid (Sigma) followed by rigorous
pipetting and freeze-thaw cycles. Cell debris were precipitated by centrifugation at 4 oC and the
clarified lysates were analyzed using a microplate reader (BioTek), following the manufacturer’s
instructions. Lysates were analyzed for total GSH content without any further processing
however they were incubated (after dilution) at room temperature with 2% 4-vinylpyridine and
2% triethanolamine (v/v) before GSSG analysis. Total GSH and GSSG content in every sample
was calculated based on standard curves.
5.2.8 Enzymatic hydrolysis of cellular RNA
Total RNA extracted from NO- and argon-treated cells was hydrolyzed to
ribonucleosides for subsequent quantification of the levels of deamination products. Aliquots of
cells withdrawn from the exposure reactors (2.5-4.5 × 10⁶ cells) were centrifuged to remove the
supernatant, washed with PBS, centrifuged once more to remove the supernatant and the

186
resulting cell pellets were processed using Qiagen’s RNeasy Mini Kits following the
manufacturer’s instructions. Extracted total RNA from each sample (30-50 μg) was inspected for
its integrity using a Bioanalyzer RNA Nano 6000 on-chip electrophoresis system (Agilent) and
quantified by UV spectroscopy. RNA samples were subsequently hydrolyzed using a
combination of nuclease P1 (Sigma), phosphodiesterase I (USB) and alkaline phosphatase
(Sigma) in the presence of deaminase inhibitors (coformycin from DTP/NCI, tetrahydrouridine
from Calbiochem) and the antioxidant butylated hydroxytoluene (Sigma), as described
previously [39,65]. Antioxidant and chelating agent deferoxamine was omitted from the protocol
due to its effect on oxanine stability demonstrated in Chapter 3. The following average amounts
of internal standards were added to the digestion mixture per sample: 1.2 pmol 15
N-rI, 0.7 pmol
15N-rX and 0.5 pmol
15N-rO. Enzymes were removed at the end of hydrolytic digestion process
by spin filters (NanoSep 10K Omega, Pall) and filtrates were concentrated under vacuum.
5.2.9 HPLC prepurification of RNA deamination products
Samples of ribonucleosides were dissolved in water to a total volume of 100 μL and
individual nucleosides were resolved and collected using an Agilent 1100 series HPLC system
equipped with a Phenomenex Synergi C18 reversed-phase column (250 x 4.6 mm, 4 μm particle
size, 80 Å pore size) with elutions performed at a 0.5-1 mL/min flow rate of 8 mM ammonium
acetate solvent (A) with a stepwise increasing gradient of pure acetonitrile (B); details are given
in Table B.1 of Appendix B. Empirically determined retention times, which were defined in
previous studies [39,65], for the native and target nucleosides are shown in Figure B.1 of
Appendix B, whereas the output from a typical hydrolyzed RNA sample is depicted Figure B.3
of Appendix B. Fractions containing the target nucleosides (rI, rX, rO) were dried under vacuum,
redissolved in 50 μL of water and analyzed by LC-MS/MS.

187
5.2.10 LC-MS/MS quantification of deamination products in RNA
Levels of deamination products in RNA extracted from NO- and argon-treated cell
cultures that have been subsequently hydrolyzed were analyzed using an Agilent 1100 series
HPLC system interfaced with an AB Sciex API 3000 tandem quadrupole MS with a turbo ion
spray source. Resolution of target nucleosides was achieved on a Thermo Fisher Hypersil Gold
aQ C18 reverse-phase column (150 x 2.1 mm, 3 μm particle size) using isocratic conditions of
0.1% acetic acid (A) and 0.7-3% v/v acetonitrile (B), depending on the target nucleoside, at a 0.2
mL/min flow rate; elution times, content of solvent B and column temperature for each of the
target nucleosides are listed in Table B.2 of Appendix B. The MS was operated in positive ion
mode with the first and third quadrupoles fixed to unit resolution. Multiple reaction monitoring
(MRM) mode was used for sample detection with dwell times set to 200 ms. Mass spectrometric
parameters were optimized for maximal sensitivity and are displayed in Table B.3 of Appendix
B. Linear calibration curves were generated (r2 > 0.98) for the isotope-labeled and unlabeled
forms of each of the deamination products.
5.2.11 Expression of N2O3 concentration as a function of cellular species
To model the nitrosative chemistry arising in cells exposed to NO and better understand
in quantitative terms the damage inflicted by N2O3, the intracellular environment is
approximated as an aqueous solution at physiological pH where NO reacts with oxygen, as
illustrated in the reactions below.
k1
2ONO2 2NO2 (1)

188
k2
2NONO 32ON
(2)
k-2
k3
OHON 232
H22NO-2 (3)
When NO is the only nitrogen oxide added to the system, intermediates NO2 and N2O3
are present only in trace quantities [31], which justifies pseudo-steady state approximations for
their concentrations, and N2O3 is the principal nitrosating agent in the solution [17]. The majority
of N2O3 forming in the aqueous environment of neutral pH is directly hydrolyzed to the stable
end product nitrite (NO2-) as shown in reaction 3. However hydrolysis is effectively accelerated
in the presence of certain anions that act as ‘catalysts’ (including phosphate, chloride and
bicarbonate [16,71]), decreasing the N2O3 available to react with other targets in the solution.
Reaction 4 represents an example of the parallel hydrolysis pathways attributed to those anions,
in particular inorganic phosphate (Pi):
kP
OHPON 2i32
H2P2NO i-2 (4)
Similar reactions occur with chloride (Cl-) and bicarbonate (HCO3
-) with the
corresponding rate constants defined as kC and kB. In addition to anions, the cytosol contains
certain antioxidants that are known to react with N2O3, such as ascorbate (AH-) and glutathione
(GSH), and the kinetics of those reactions are explored elsewhere [18,72] – with assigned rate
constants kA and kG, respectively, in this scheme. The same compounds also act as ‘scavengers’
for other radicals in the cytosol including NO2 [73,74] thus influencing the N2O3 concentration in
more than one way (N2O3 is produced from NO2 according to reaction 2). The residual N2O3 that

189
is not consumed by the aforementioned species can attack other biomolecules in the cytosol,
including RNA nucleosides that are of great interest to the current study. The reactions between
N2O3 and native purines in RNA are depicted as follows.
kI
rAON 32
HNOrI -2 (5)
kX
rGON 32
HNOrX -2 (6)
kO
rGON 32
HNOrO -2 (7)
Deamination products rX and rO are expected to form simultaneously from rG, as
indicated by in vitro studies discussed in Chapter 3, assuming the same chemistry takes place in
the cells. The current scheme is limited only to purines since the reaction between N2O3 and
cytidine yields uridine, a naturally abundant nucleoside in RNA, making detection of small
amounts generated by deamination alone very challenging. As it will be discussed shortly, by
measuring the rate at which rI, rX and rO accumulate in the RNA of NO-exposed cells the
apparent steady-state intracellular N2O3 concentration that forms in the cytosol can be indirectly
estimated.
To deduce an expression for N2O3 levels in cells exposed in the NO-delivery device
while minimizing the calculations, spatial variations of the species concentrations governing the
cell environment were ignored. That simplification was in accordance with previous findings that
intracellular concentrations of reactive nitrogen intermediates remain approximately the same no
matter the distance from the center of the cell [52]. Besides having a uniform value throughout

190
the entire cytosol, the concentrations involved in the reactions shown above were also
approximated as time-independent. Namely, the major dissolved gases NO and O2 were
maintained at constant levels in the delivery system and, as shown in previous work [52], their
concentrations in the bulk culture medium could safely be equated with those in the cytosol. The
ions and antioxidants in cells were assumed to vary little during each exposure, with a duration
equal to 50% of the cell doubling time (~24 h; ref. [67]), whereas their concentrations were
specified based on values from the literature. Finally, the reactive intermediates formed in trace
levels are expected to have a slow permeation across the cell membrane relative to intracellular
reactions since the concentration driving force for diffusion is very small, hence during
exposures the various chemical species in the cytosol will be at a steady state with rates of
formation and consumption being in continuous balance within the closed system that each cell
represents. Although there is evidence that NO oxidation is accelerated in hydrophobic media
[75] the current analysis examines only aqueous chemistry, assuming that intramembrane
reactions have a negligible effect on the concentrations of interest. Simplifying the model
formulation by not including a lipid phase is also supported by the results of a recent study that
investigated concentrations of reactive nitrogen species employing similar approximations to
those stated above [56].
Applying the steady state approximation on N2O3 and including all terms of formation vs.
consumption involving the species discussed earlier and solving for the N2O3 concentration
yields:
]rG[]rA[]GSH[]AH[]HCO[]Cl[]P[
]NO[NO][]O[N
OXIG-
A-3B
-CiP32
2232
kkkkkkkkkk
k
(8)

191
Some terms in the denominator of equation 8 may be less significant than others, and thus
ignored, whereas new sinks of N2O3 can be added to more accurately represent the nitrosative
chemistry affecting the cellular environment. Rate constants for the reactions mentioned above
are listed in Table 5.1 whereas estimates for the species concentrations are shown in Table 5.2.
5.2.12 Intracellular N2O3 concentration from in vivo deamination kinetics
On the basis of recent studies that determined rate constants for in vitro RNA
deamination occurring in well-defined systems, the goal here is to employ the established kinetic
parameters and conversely calculate levels of N2O3 to which RNA is exposed in the cytosol of
NO-treated cells. As there is no direct way to measure trace levels of N2O3 forming in cells (in
contrast to NO which can be detected in vivo [76,77]) a surrogate for its effects on components
of the cellular environment is crucial for a quantitative analysis. The nitrosative damage
associated with N2O3 is likely broadly distributed and affects multiple nucleophiles in the
cytosol. However, this work focuses on nucleoside deamination lesions resulting from the
generation of N2O3 and its immediate interaction with the cellular RNA species (primarily
ribosomal RNA). NO and O2 freely diffuse through the cell membrane – their levels equaling
those in the extracellular medium – and react in the cytosol to produce N2O3, among other
species, leading to the reactions discussed above. The constant levels of N2O3, as a trace steady-
state intermediate, give rise to accumulating amounts of deamination products (rI, rX, rO) that
can be measured, depending on the sensitivity of the analytical approach employed. In that case,
expressing the rate law for reactions 5, 6 and 7 yields:
cyt32I ]O[N][rAdt
rI][dk (9)

192
Table 5.1. Reaction rate constant values.
rate constant value (37 oC) units ref.
k1 2.4 × 10⁶ M
-2 s
-1 [31]
k2 1.1 × 10⁹ M
-1 s
-1 [78]
k-2 8.0 × 10⁴ s
-1 [78]
k3 2.1 × 10³ s
-1 [72]
kP 1.1 × 10⁶ M
-1 s
-1 [17]
kC 2.2 × 10⁵ M
-1 s
-1 [17]
kB 1.8 × 10⁶ M
-1 s
-1 [71]
kA 1.2 × 10⁹ M
-1 s
-1 [72]
kG 6.6 × 10⁷ M
-1 s
-1 [18]
kI 2.9 × 10⁴ M
-1 s
-1 Chapter 3
kX 1.3 × 106 M
-1 s
-1 Chapter 3
kO 7.7 × 10⁵ M
-1 s
-1 Chapter 3
Values for k2, k-2 reported in 20 oC; k3 estimation at 37
oC based on activation energy also
reported in ref. [72]; kP, kC calculated based on k3 values as indicated in ref. [17]; kB calculated
assuming a typical activation energy of ~15 kJ/mol.

193
Table 5.2. Concentrations of NO and cellular scavengers of N2O3 in the cytosol.
species concentration ref.
NO 5 μM
Pi 80 mM [79]
Cl- 5 mM [79]
HCO3- 10 mM
AH- 0.5 mM [80]
GSH 0.5-10 mM [81]
NO levels were imposed by the delivery device; HCO3- levels were calculated based on a 5%
CO2 atmosphere at neutral pH; pKa = ~4 for ascorbic acid [82] and pKa = ~9 [83] hence at pH =
7 ascorbic acid will be mainly anions (A-) and glutathione will be in its neutral form (GSH).

194
cyt32X ]O[N][rGdt
rX][dk (10)
cyt32O ]O[N][rGdt
rO][dk (11)
A time-independent value for the cytosolic N2O3 concentration, [N2O3]cyt, combined with
unchanged levels of native RNA nucleosides (assuming the RNA content of each cell varies very
little during the entirety of the NO-exposure) result in a proportional linear increase of
deamination products in RNA, as our experimental findings show below. Rate constants for
deamination of RNA nucleosides at the examined temperature (37 oC) were determined in
Chapter 3.
5.3 Results
5.3.1 Accumulation of deamination products in RNA of NO-exposed cells
To estimate N2O3 levels at sites of inflammation, we used a model system of controlled
exposure of human cells to NO and quantification of RNA deamination products as a surrogate
for the short-lived N2O3. Cultures of TK6 cells were exposed to NO at a steady concentration of
~5 μM which is the same order of magnitude as the concentration measured in media
surrounding activated macrophages [5], while O2 was kept constant at ~200 μM. The levels of
dissolved gases in the delivery device were determined with accuracy using a mass transfer
model that simulates the reaction between the diffusing gases in the liquid while also
incorporating rates of cellular consumption [60]; the organics in cell media were recently found
not to affect the function of the delivery device thus reinforcing the predictive power of the
model [61]. During exposures, cell aliquots were withdrawn from the reactors and total RNA

195
was immediately extracted from lysed cells and subsequently hydrolyzed to nucleosides
minimizing the effect of artifactual generation or loss of deaminated nucleobases (coformycin,
tetrahydrouridine used as deaminase inhibitors; deferoxamine was omitted due to its reactivity
with oxanosine discussed extensively in Chapter 3). The target nucleosides (rI, rX, rO) were
resolved from significantly more abundant native ones in a HPLC purification step, enriched
fractions were collected and subsequently analyzed via isotope-dilution LC/MS/MS. As shown
in Figure 5.2, a dose response increase was observed for the formation of all three deamination
lesions examined relative to levels detected in control experiments (i.e. exposure to argon instead
of NO).
Using this system, we observed that controlled exposure of cells to NO and O2 for up to
12 hours led to time-dependent increases in RNA deamination products – approximately a 2-fold
increase determined for rI, 5-fold for rX and 10-fold for rO – departing from baseline levels of
20 (±6) rI per 106 nt, 2 (±0.5) rX per 10
6 nt and 4 (±2) rO per 10
7 nt.
To investigate the effect of GSH levels on N2O3-induced deamination, we incubated TK6
cells with 125 μM BSO for 24 h immediately prior to NO exposure to cause a 99% reduction in
GSH (see below) and observed that this reduction did not significantly affect the time course for
the formation of nucleobase deamination products (Figure 5.3). Only marginally higher amounts
of rI, rX and rO were measured at almost every time point in BSO-treated cells compared to cells
that remained untreated before being challenged by the same exposure conditions (Figure 5.3).
These results indicate that such a significant decrease in cellular GSH does not seem to expose
the intracellular environment to greater damage associated with nitrosative chemistry, at least as
quantified by the designated surrogate of deamination lesions in RNA.

196
Figure 5.2. Fold-increase in nucleoside deamination products measured in RNA of NO-
challenged TK6 cells compared to argon controls.
Results presented as relative fold-increase of rI, rX, rO levels in NO-treated cells over those in
argon controls. The NO dose was calculated by multiplying the steady state NO concentration
(~5 μM) with exposure time (final time point at 12 h). Data represent mean ± S.D. for n = 2-3.

197
Figure 5.3. Formation of nucleobase deamination products rI, rX and rO in RNA extracted from
and BSO-treated and untreated TK6 cells.
Cells were exposed to constant levels of NO (5 μM) in the delivery device. Data for untreated
cells represent mean ± S.D. for n = 2-3.

198
5.3.2 Effects of NO exposure on levels of GSH and GSSG
To further assess the significance of GSH as a scavenger of N2O3 in the intracellular
milieu, reduced and oxidized levels of glutathione (GSH, GSSG) were quantified during the time
course of NO exposures. Aliquots of cells were withdrawn during treatment with NO (and argon)
as described earlier, and the resulting cell pellets were lysed and the concentrations of GSH and
GSSG measured using a GSH reductase recycling assay summarized in Figure 5.4. Results
depicted in Figure 5.5 show a substantial difference in cytosolic GSH levels in cells challenged
with NO compared to argon controls, which suggests that exposure to 5 μM steady-state levels of
NO causes a net reduction in GSH levels. However, even at the highest dose during the
exposure, GSH levels in the NO exposed cells did not fall below ~5 mM. GSSG measurements,
on the other hand, showed a significant increase at 900 μM min compared to argon controls, but
were otherwise unchanged by NO exposure and represented only 0.1-2% of the total GSH
content in all cases (Figure 5.6). The latter is consistent with earlier reports [84,85].
To further gauge the role of GSH in mitigating nitrosative chemistry, GSH levels were
reduced by treatment of cells with BSO, a γ-glutamylcysteine synthetase inhibitor that efficiently
blocks the pathway of de novo GSH synthesis [86] (depicted in Figure 5.7). In cells treated with
125 μM BSO for 24 h before NO exposure, GSH levels decreased to 1% of the level in untreated
cells and did not change further when cells were challenged with NO (Figure 5.8). GSSG was
undetectable in lysates of BSO-treated cells. Previous studies showed that incubation of TK6
cultures with 125 μM BSO does not affect cell viability [66,84,85].
5.3.3 Effect of NO exposure on cell viability

199
Figure 5.4. Schematic of the glutathione reductase recycling assay.
GSH reacts with DTNB to form TNB and the GS-TNB conjugate. GS-TNB is continuously
reduced (recycled) back to GSH by glutathione reductase in the presence of NADPH, releasing
TNB once again. The rate of TNB formation – proportional to GSH concentration in the sample
– can be quantified at 412 nm. Pre-existing GSSG is also reduced to GSH in the reaction mixture
thus adding to the total TNB generation. To isolate the contribution of GSSG (usually
significantly less abundant than GSH) the lysate is first derivatized with 4-vinylpyridine which
reacts with GSH, but not GSSG, before analysis (adapted from ref. [70]).

200
Figure 5.5. Levels of reduced glutathione monitored during exposure of TK6 cells to NO and
argon.
Intracellular concentrations were calculated assuming an average cell volume of 500 fL (based
on ref. [87]). Time point at t = 12 h corresponds to a total NO dose of 3600 μM min. Data
represent mean ± S.D. for n = 3-4.

201
Figure 5.6. Levels of oxidized glutathione (GSSG) in cells exposed to NO.
Intracellular concentrations were calculated assuming an average cell volume of 500 fL (ref.
[87]). Time point at t = 12 h corresponds to a total NO dose of 3600 μM min. Data represent
mean ± S.D. for n = 2-3.

202
Figure 5.7. Inhibitory mechanism of buthionine sulfoximine (BSO).
The enzyme γ-glutamylcysteine synthetase (or γ-glutamate cysteine ligase) is the rate-limiting
enzyme in glutathione (GSH) synthesis. Adapted from ref. [86].

203
Figure 5.8. Levels of reduced glutathione (GSH) in BSO-treated cells exposed to NO and argon.
Intracellular concentrations were calculated assuming an average cell volume of 500 fL (ref.
[87]). Time point at t = 12 h corresponds to a total NO dose of 3600 μM min. Data represent
mean ± deviation about the mean for n = 2.

204
The cytotoxic effects of NO exposure were assessed by trypan blue uptake in aliquots of
cells withdrawn from the delivery device during NO exposures. Figure 5.9 shows the expected
dose-dependent decrease in cell viability at 2 days post-exposure to NO, with little apparent
cytotoxicity immediately after exposure. For argon-exposed controls, the delivery reactor was
previously reported to have little or no effect on cell proliferation [60], so the observed effects
can be attributed to the presence of NO alone. The results presented here agree with previous
studies examining NO effects on TK6 viability [27]. Although cell integrity appears to be
maintained for most cells during exposure, the substantial difference in viability measured
immediately and following a recovery period (48 h) indicates the cytotoxic effect of NO leading
to cycle arrest and apoptosis, as shown in earlier studies [88].
5.3.4 Estimation of intracellular N2O3 concentration
Using the data for NO-induced deamination of RNA nucleobases, we proceed to estimate
the cytosolic N2O3 concentration using a mathematical model. The steady-state hypothesis
entails N2O3 formation in constant (trace) amounts in the intracellular milieu during NO/O2
exposure, and the apparent linear increase of rI, rX and rO in extracted RNA over time (Figure
5.2) supports that assumption. In other words, equations 9, 10 and 11 sufficiently describe the
kinetics of nucleobase deamination occurring in the cytosol and can be solved to determine the
unknown term [N2O3]cyt. A volume of ~500 fL is calculated for a mammalian cell with a mean
diameter of ~10 μm [87] and UV measurements indicate that ~10 pg of total RNA is extracted
per cell. Combining this information leads to a calculated intracellular RNA concentration of ~60
mM; [rA] and [rG] are each expected to be a quarter of that value. Formation rates for rI, rX and
rO can be calculated from the corresponding slopes in graphs presenting the accumulation of
deamination lesions as a function of time (using information shown in Figure 5.3). The slopes

205
Figure 5.9. Cell viability determined by the trypan blue exclusion assay at various doses of NO.
Relative cell viability (expressed as a percentage) calculated as the ratio of cell number in NO
exposures to those in argon controls immediately after exposure (blue circles). Relative cell
viability was also determined after a 48 h recovery period following exposure to NO (red
squares). Data represent mean ± S.D. for n = 2-3.

206
were determined to be 2.2, 0.37 and 0.1 lesions/106 RNA nt/h for rI, rX and rO, respectively. The
formation rates – required input in equations 9, 10 and 11 – are derived from the experimental
slopes by multiplying with the cytosolic RNA concentration addressed above. Finally, the rate
constants describing the deamination chemistry of RNA nucleobases were determined from in
vitro exposures of purified RNA in the delivery device discussed in Chapter 3, and their values
are listed in Table 5.1. Using the values mentioned above, equations 9, 10 and 11 each give an
estimate for the apparent [N2O3]cyt calculated to be 73, 0.4 and 0.2 fM, respectively. The
concentration range suggested by these calculations is in reasonable agreement with estimates
from kinetic models predicting intracellular concentrations for reactive nitrogen species in
conditions simulating the environment of inflamed tissues [56].
To assess the possibility that other nucleophilic biomolecules can lower the steady-state
levels of N2O3 in the cytosol, [N2O3]cyt was expressed in terms of concentrations of cellular
constituents known to react with the nitrosating agent (equation 8). As mentioned above,
calculations based on experimental data from the current study (i.e., the experimentally derived
[N2O3]cyt = 0.2 fM) indicate that the NO-associated nitrosating species may be more extensively
depleted within cells than previously estimated. Recent mathematical models predicted GSH to
be the most important cytosolic sink for N2O3 with its levels predicted to increase by an order of
magnitude – along with the resulting nitrosative damage – from a ~10-fold reduction in GSH
concentration [56]. However, our results demonstrate that BSO-treated TK6 cells (with only
~1% of the GSH content of untreated cells) sustained virtually the same levels of deamination
products under nitrosative stress compared to cells with normal GSH levels. Equation 8, as
defined above, requires input only for the NO2 concentration, since all other parameters have
been specified in the literature, listed in Table 5.1 and Table 5.2, or alternatively derived from

207
measurements in this work ([GSH] = 5-8 mM from Figure 5.5; [RNA] = 60 mM). With the
calculations of Lim et al. providing the only available estimate of NO2 concentration in cells
under nitrosative stress, with a value of ~1 pM in a cellular environment with GSH levels higher
than 5 mM [56], equation 8 yields [N2O3] = 4-5 fM. Similar values are obtained even when
scavenging from DNA is added to the denominator of equation 8; DNA nucleobases were
assumed to follow the same deamination kinetics as those in RNA (as discussed in Chapter 3)
and a 1:1 ratio of DNA to RNA per cell was assumed as an upper limit [89,90]. Neglecting the
GSH concentration altogether in equation 8 – which simulates the cellular environment in BSO-
treated cells – led to only a 30-50% increase in N2O3 levels, indicating the abundance of other
scavenger considered and diminishing the role of GSH in depleting N2O3, consistent with our
experimental findings. Those observations combined with the sub-femtomolar levels of N2O3
forming inside cells calculated based on in vivo kinetics may be pointing toward the possibility
of other major scavenger(s) in the cytosol, such as protein thiols or other reducing species.
5.4 Discussion
To shed light on how chemical stresses implicated in the immune response affect the
intracellular environment of cells in proximity to inflamed tissues, previous studies subjected
biomolecules and cells to controlled experimental environments that closely mimic those
expected to arise at sites of inflammation [27,60,85,88]. Based on that principle, we used a
system for precise and steady delivery of NO (described extensively in Chapter 2 [60,61]) to
simulate the nitrosative conditions resulting from activated macrophages [5] and investigate the
formation of nucleobase deamination products in RNA extracted from stressed cells. In vitro
studies presented in Chapter 3 established the kinetic parameters of nitrosative deamination in
purified RNA using the same delivery device. The current work describes a novel approach to

208
estimate intracellular levels of the nitrosative agent N2O3 by quantifying the rate at which rI, rX
and rO accumulate in the RNA of NO-challenged cells while incorporating the previously
defined in vitro rate constants. An algebraic expression was also developed to reassess the degree
to which cellular GSH levels affect the damage caused by N2O3 formed in the cytoplasm.
5.4.1 Formation of inosine, xanthosine and oxanosine in cellular RNA
Exposure of TK6 cells to steady levels of nitrosative stress in the delivery device led to
quantifiable increases in all three purine deamination products. The dose-dependent rise of these
modified nucleosides in total RNA extracted from intact cells (Figure 5.2) reinforces the
observation that nitrosative deamination linked to relatively high NO levels indeed damages a
variety of nucleophiles in the cytosol, including nucleosides in RNA and DNA [27]. In
particular, measuring rO for the first time in the RNA of NO-exposed cells supports the
assumption that the chemistry occurring in the cellular milieu does not differ from the nitrosative
mechanism observed in buffered solutions (Chapter 3), yielding the same set of modified
nucleosides resulting from the reaction with locally generated N2O3. The particular lesion –
albeit as a 2-deoxynucleoside – was initially found to form concurrently with 2-deoxyxanthosine
when free 2-deoxyguanosine was exposed to NO [29]. This prompted subsequent investigations
to re-examine the spectrum of deamination products in genomic DNA extracted from NO-treated
human cells [27] and tissues from a mouse model of inflammation [38], however the
experimental techniques employed in those investigations were unable to detect the presence of
2-deoxyoxanosine. Those earlier observations stand in direct contrast with the results presented
here as well as those from Chapter 3 that show simultaneous formation of xanthine and oxanine
in solutions of free nucleosides, RNA and DNA exposed to NO. The disagreement can be
explained taking into account that previous studies in cells and tissues used primary amines

209
(spermine, spermidine in ref [27]; deferoxamine in ref [38]) as antioxidants or chelating agents
during enzymatic hydrolysis and that millimolar levels of deferoxamine can significantly
degrade (deoxy)oxanosine within a fraction of the total incubation time as discussed in Chapter
3. We propose that the aforementioned antioxidants may have exerted a similar effect in samples
derived from hydrolyzed DNA thus hindering the detection of 2-deoxyoxanosine in previous
studies. It is possible that this amine-induced loss led to greatly reduced amounts of 2-
deoxyoxanosine, well below the limit of detection of the employed method. We avoided this
problem here by omitting all types of amine-containing antioxidants during RNA hydrolysis, and
employing sensitive LC-MS/MS techniques to measure the minute amounts of rO forming
during NO exposures. Considering our results and the similarity of the deamination kinetics
between DNA and RNA (Chapter 3), one would expect similar oxanine levels to accumulate in
genomic DNA under the nitrosative conditions described above as long as a) improved protocols
are applied in future experiments that will re-assess the possibility of oxanine formation in
nucleic acids as a result of NO-induced deamination in vivo and b) the nucleophilic primary
amines of histone proteins in the nucleus do not significantly affect the fate of this particular
lesion.
5.4.2 Determination of intracellular N2O3 concentration using in vivo deamination
kinetics
The results presented in the current studies represent the first attempt to use a kinetic
approach to determine cytosolic levels of the potent nitrosating agent N2O3 in cells challenged by
NO exposure. The controlled environment of the delivery system (previously used in numerous
investigations [27,60,61,85,88]) provides constant micromolar levels of dissolved NO to which
cells are exposed over several hours, simulating the environment of tissue cells in proximity to

210
activated macrophages [5,54]. Earlier characterization of the NO delivery device revealed the
existence of a ~1 μm thick boundary layer adjacent to the NO-feed tubing loop where the
concentrations of reactive nitrogen species greatly exceed those in the well-stirred bulk liquid
[64]. TK6 cells, however, are almost fully excluded due to their larger size (~10 μm) and remain
virtually unaffected by the presence of the layer. This allows us to predict with confidence the
concentration of dissolved NO constantly surrounding the cells using the mass transfer model
already discussed in detail in Chapter 2 [61,64]. Due to its permeability in the lipid membrane
[52], the extracellular concentration of NO is expected to roughly equal that in the cytosol. Thus,
the delivery device results in predictable and constant levels of NO and O2 in the cytosol, with
the expectation of constant N2O3 intracellular concentrations, according to the kinetic scheme of
NO consumption defined in the Methods section. Since trace amounts of N2O3 are impossible to
measure directly in the cytosol, we used the well-characterized nucleobase damage cause by
N2O3 as a surrogate to gauge its abundance in the cytoplasm. A linear increase of RNA
nucleoside deamination products detected in intact cells implies that constant levels of N2O3 are
generated in the cellular milieu and validates the steady-state assumption. As mentioned above,
the data corresponding to the increase in rI (Figure 5.3) led to a calculated intracellular N2O3
concentration of ~70 fM whereas using the information from the observed increases in rX and rO
yields a mean concentration of ~0.3 fM. Cytosolic N2O3 levels in the femtomolar range (1-60
fM) were first predicted by a kinetic model developed by Lim et al., which involved ~65
reactions with reactive nitrogen and oxygen species and cellular components such as
antioxidants, amino acids and proteins [56]. However, our results are the first experimentally-
derived calculations that support the aforementioned order-of-magnitude predictions and provide
evidence derived from biological systems that confirm the accuracy of mathematical models in

211
determining the fate of reactive nitrogen intermediates in vivo. The same kinetic approach can be
readily employed to determine trace levels of other mediators of inflammation (i.e. NO2) in the
cell, as long as reliable delivery methods (e.g., the system described in ref. [91]) and sensitive
detection protocols [92] are available. Experiments aiming to measure NO2 in vivo would
complement the current work by testing the validity of some of our assumptions (i.e.,
intracellular NO2 levels expected in the range of ~1 pM) and thus reinforcing our confidence in
predicting N2O3 concentrations.
5.4.3 Effect of GSH in scavenging N2O3-induced related damage in the cytosol
To assess the role of GSH, a potent scavenger for reactive nitrogen species, in mitigating
the nitrosative stress imposed by N2O3 in vivo, we studied the formation of deamination products
in cells significantly depleted of GSH. By incorporating the established kinetics of the reaction
between GSH and N2O3 [18,93] in their recent model, Lim et al. concluded that GSH is the most
significant scavenger for the nitrosative agent in the cytosol. In particular, a roughly order-of-
magnitude increase in N2O3 levels was expected to occur if the cellular GSH concentration
dropped from 5 to 1 mM [56]. To examine whether that prediction accurately represents the
cytosolic environment, BSO-treated and untreated cells were challenged with the same NO doses
in the delivery device. The anticipated effect of the inhibitor blocking de novo GSH synthesis
was confirmed by the 100-fold reduction in GSH content of BSO-treated cells, yet little change
in RNA deamination was detected (Figure 5.3). The observation that nitrosative damage
accumulating in the cytoplasm appears to be insensitive to levels of one of the most abundant
antioxidant agrees with previous studies showing negligible changes in levels of DNA
deamination products when BSO was employed to alter the cytosolic GSH content [66,85].
These results indicate that GSH may not be the single most important sink for N2O3 in the cell,

212
as proposed by Lim et al., most likely because the authors included only the catalytic effects of
bicarbonate in the N2O3 hydrolysis pathway in addition to the reaction with GSH ignoring other
sinks such as those appearing in the denominator of equation 8. On the other hand, the current
work suggests that there is some other reducing species in the intracellular environment that
scavenges N2O3 more effectively than GSH (Tables 5.1 and 5.2). A wider array of N2O3-
consuming biomolecules is probably the main reason why only modest changes in the N2O3
levels are calculated by eliminating the term associated with GSH in equation 8. Such a dynamic
seems to be more representative of the experimental trend presented in this work.
The results shown in this work suggest that the list of cytosolic sinks for N2O3 is
incomplete, which raises the question of the identity of other N2O3 scavengers. The calculations
described above yielded a range of experimentally-derived [N2O3]cyt values, depending on which
increase in deamination product was employed. In particular, rI is a naturally occurring
nucleoside in RNA [94] and measuring modest increases over a pre-existing high background
level may lead to large errors when determining the corresponding formation rate. There is also a
possibility that cellular processes regulating rA editing in RNA [46] could become erratic while
cells are challenged by high doses of NO, hence a cytosolic N2O3 estimate based on measured
increases of rI may be less accurate compared to those calculated relying on the rX and rO
accumulation rates. In addition, rX and rO are not physiological nucleosides and their formation
in nucleic acids likely reflects the nitrosative damage occurring in the intracellular environment.
Choosing the more reliable estimate for the intracellular N2O3 concentration (~0.3 fM) returns a
value ~10-fold lower than that calculated from equation 8 (4-5 fM), suggesting that additional
terms need to be incorporated into the model to better represent the experimental findings.
Cellular protein is an ideal candidate among abundant species that can react with N2O3 in the

213
cytosol. Reported levels of 100 pg of protein per cell [95] with a mean molecular weight of 53
kDa [96] yield an intracellular concentration of ~4 mM (alternatively estimated at ~15 mM
according to ref. [97]). Assuming that each protein molecule has at least 5-6 nucleophilic
residues that can be nitrosated by N2O3 (i.e., glutamine, proline, cysteine, tryptophan and the N-
terminus among others), an effective concentration for the protein reactive sites can be defined.
Multiplying the protein concentration value determined above by the number of nucleophilic
residues gives rise to the cytosolic concentration for protein reactive sites ([Prot]), estimated in
the range of ~20-25 mM. Coupling this concentration with a rate constant value (kPr) based on
published kinetics of amino acid N-nitrosation by N2O3 (107-10
8 M
-1 s
-1 [98,99]) yields the term
kPr[Prot] which when added to the denominator of equation 8 leads to a lower N2O3 estimate (~1
fM), increasing the total number of N2O3 scavengers by one while simultaneously diminishing
the relative importance of the GSH-associated sink. If the concentration for protein reactive sites
is adjusted to include an additional contribution from the free amino acid pool (~35 mM; [100]),
the value represented by [Prot] increases to ~60 mM which subsequently leads to a sub-
femtomolar [N2O3] estimate derived from equation 8. The hypothetical class of amino acid
/protein scavengers may also include species such as thioredoxin [101] and metallothionein [102]
already known to be affected by nitrosative stress. It is interesting to consider that products of the
reaction between proteins and N2O3 could potentially be involved in the regulation of cell
function through posttranslational protein modification, however the significance of the
formation of N-nitrosated proteins in vivo still remains unclear and information on their
nitrosation kinetics is scarce.
In summary, we have demonstrated a strategy that employs a precisely controlled NO
delivery system and a sensitive LC-MS/MS analytical method to determine the degree to which

214
nitrosative deamination modifies RNA nucleosides in NO-treated cells. The well defined
conditions of the system provide constant and predictable concentrations of NO and O2 to which
cell cultures can be exposed. Measuring rates of formation for rI, rX and rO in RNA extracted
from stressed cells and applying the kinetic information to basic expressions of the rate law led
to the calculation of intracellular N2O3 concentration estimates (0.2-70 fM). Our results also
revealed that drug-induced depletion of GSH levels in cells does not significantly alter the
accumulation of deamination products in RNA, suggesting that additional scavengers are likely
mitigating the damaging effects of N2O3 in the cytosol.

215
5.5 References
[1] Moncada, S., Palmer, R. M., and Higgs, E. A. (1991) Nitric oxide: physiology,
pathophysiology, and pharmacology. Pharmacol. Rev. 43: 109-142.
[2] Schmidt, H. H. H. W. and Walter, U. (1994) NO at work. Cell. 78: 919-925.
[3] Moncada, S. (1999) Nitric oxide: discovery and impact on clinical medicine. J. R. Soc.
Med. 92: 164-169.
[4] Nussler, A. K. and Billiar, T. R. (1993) Inflammation, immunoregulation, and inducible
nitric oxide synthase. J. Leukoc. Biol. 54: 171-178.
[5] Lewis, R. S., Tamir, S., Tannenbaum, S. R., and Deen, W. M. (1995) Kinetic analysis of
the fate of nitric oxide synthesized by macrophages in vitro. J. Biol. Chem. 270: 29350-
29355.
[6] Wang, Y. and Ruby, E. G. (2011) The roles of NO in microbial symbioses. Cell
Microbiol. 13: 518-526.
[7] Fang, F. C. (2004) Antimicrobial reactive oxygen and nitrogen species: concepts and
controversies. Nat. Rev. Microbiol. 2: 820-832.
[8] Marnett, L. J. (2012) Inflammation and cancer: Chemical approaches to mechanisms,
imaging, and treatment. J. Org. Chem. 77: 5224-5238.
[9] Burney, S., Caulfield, J. L., Niles, J. C., Wishnok, J. S., and Tannenbaum, S. R. (1999)
The chemistry of DNA damage from nitric oxide and peroxynitrite. Mutat. Res. Fund.
Mol. Mech. Mut. 424: 37-49.
[10] Dedon, P. C. and Tannenbaum, S. R. (2004) Reactive nitrogen species in the chemical
biology of inflammation. Arch. Biochem. Biophys. 423: 12-22.
[11] Coussens, L. M. and Werb, Z. (2002) Inflammation and cancer. Nature. 420: 860-867.
[12] Erdman, S. E., Rao, V. P., Poutahidis, T., Rogers, A. B., Taylor, C. L., Jackson, E. A.,
Ge, Z., Lee, C. W., Schauer, D. B., Wogan, G. N., Tannenbaum, S. R., and Fox, J. G.
(2009) Nitric oxide and TNF-alpha trigger colonic inflammation and carcinogenesis in
Helicobacter hepaticus-infected, Rag2-deficient mice. Proc. Natl. Acad. Sci. U.S.A. 106:
1027-1032.
[13] Wiseman, H. and Halliwell, B. (1996) Damage to DNA by reactive oxygen and nitrogen
species: role in inflammatory disease and progression to cancer. Biochem. J. 313: 17-29.
[14] Masri, F. A., Comhair, S. A. A., Koeck, T., Xu, W., Janocha, A., Ghosh, S., Dweik, R.
A., Golish, J., Kinter, M., Stuehr, D. J., Erzurum, S. C., and Aulak, K. S. (2005)

216
Abnormalities in nitric oxide and its derivatives in lung cancer. Am. J. Respir. Crit. Care
Med. 172: 597-605.
[15] Wink, D., Kasprzak, K., Maragos, C., Elespuru, R., Misra, M., Dunams, T., Cebula, T.,
Koch, W., Andrews, A., Allen, J., and Keefer, L. K. (1991) DNA deaminating ability and
genotoxicity of nitric oxide and its progenitors. Science. 254: 1001-1003.
[16] Caulfield, J. L., Wishnok, J. S., and Tannenbaum, S. R. (1998) Nitric oxide-induced
deamination of cytosine and guanine in deoxynucleosides and oligonucleotides. Biol.
Chem. 273: 12689-12695.
[17] Lewis, R. S., Tannenbaum, S. R., and Deen, W. M. (1995) Kinetics of N-nitrosation in
oxygenated nitric oxide solutions at physiological pH: role of nitrous anhydride and
effects of phosphate and chloride. J. Am. Chem. Soc. 117: 3933-3939.
[18] Keshive, M., Singh, S., Wishnok, J. S., Tannenbaum, S. R., and Deen, W. M. (1996)
Kinetics of S-nitrosation of thiols in nitric oxide solutions. Chem. Res. Toxicol. 9: 988-
993.
[19] Lonkar, P. and Dedon, P. C. (2011) Reactive species and DNA damage in chronic
inflammation: reconciling chemical mechanisms and biological fates. Int. J. Cancer. 128:
1999-2009.
[20] Lindahl, T. and Nyberg, B. (1974) Heat-induced deamination of cytosine residues in
deoxyribonucleic acid. Biochemistry. 13: 3405-3410.
[21] Shapiro, R. and Klein, R. S. (1966) The deamination of cytidine and cytosine by acidic
buffer solutions. Mutagenic implications. Biochemistry. 5: 2358-2362.
[22] Shapiro, R., DiFate, V., and Welcher, M. (1974) Deamination of cytosine derivatives by
bisulfite. Mechanism of the reaction. J. Am. Chem. Soc. 96: 906-912.
[23] Nishikura, K. (2010) Functions and regulation of RNA editing by ADAR deaminases.
Annu. Rev. Biochem. 79: 321-349.
[24] Mechtcheriakova, D., Svoboda, M., Meshcheryakova, A., and Jensen-Jarolim, E. (2012)
Activation-induced cytidine deaminase (AID) linking immunity, chronic inflammation,
and cancer. Cancer Immunol. Immunother. 61: 1591-1598.
[25] Pang, B., McFaline, J. L., Burgis, N. E., Dong, M., Taghizadeh, K., Sullivan, M. R.,
Elmquist, C. E., Cunningham, R. P., and Dedon, P. C. (2012) Defects in purine
nucleotide metabolism lead to substantial incorporation of xanthine and hypoxanthine
into DNA and RNA. Proc. Natl. Acad. Sci. U.S.A. 109: 2319-2324.
[26] Dong, M., Wang, C., Deen, W. M., and Dedon, P. C. (2003) Absence of 2'-
deoxyoxanosine and presence of abasic sites in DNA exposed to nitric oxide at controlled
physiological concentrations. Chem. Res. Toxicol. 16: 1044-1055.

217
[27] Dong, M. and Dedon, P. C. (2006) Relatively small increases in the steady-state levels of
nucleobase deamination products in DNA from human TK6 cells exposed to toxic levels
of nitric oxide. Chem. Res. Toxicol. 19: 50-57.
[28] Shapiro, R. and Pohl, S. H. (1968) Reaction of ribonucleosides with nitrous acid. Side
products and kinetics. Biochemistry. 7: 448-455.
[29] Suzuki, T., Yamaoka, R., Nishi, M., Ide, H., and Makino, K. (1996) Isolation and
characterization of a novel product, 2'-deoxyoxanosine, from 2'-deoxyguanosine,
oligodeoxynucleotide, and calf thymus DNA treated by nitrous acid and nitric oxide. J.
Am. Chem. Soc. 118: 2515-2516.
[30] Nguyen, T., Brunson, D., Crespi, C. L., Penman, B. W., Wishnok, J. S., and
Tannenbaum, S. R. (1992) DNA damage and mutation in human cells exposed to nitric
oxide in vitro. Proc. Natl. Acad. Sci. U.S.A. 89: 3030-3034.
[31] Lewis, R. S. and Deen, W. M. (1994) Kinetics of the reaction of nitric oxide with oxygen
in aqueous solutions. Chem. Res. Toxicol. 7: 568-574.
[32] Glaser, R., Rayat, S., Lewis, M., Son, M.-S., and Meyer, S. (1999) Theoretical studies of
DNA base deamination. 2. Ab initio study of DNA base diazonium ions and of their
linear, unimolecular dediazoniation paths. J. Am. Chem. Soc. 121: 6108-6119.
[33] Kirchner, J. J., Sigurdsson, S. T., and Hopkins, P. B. (1992) Interstrand cross-linking of
duplex DNA by nitrous acid: covalent structure of the dG-to-dG cross-link at the
sequence 5'-CG. J. Am. Chem. Soc. 114: 4021-4027.
[34] Lucas, L. T., Gatehouse, D., and Shuker, D. E. G. (1999) Efficient nitroso group transfer
from N-nitrosoindoles to nucleotides and 2'-deoxyguanosine at physiological pH. J. Biol.
Chem. 274: 18319-18326.
[35] Lucas, L. T., Gatehouse, D., Jones, G. D. D., and Shuker, D. E. G. (2001)
Characterization of DNA damage at purine residues in oligonucleotides and calf thymus
DNA induced by the mutagen 1-nitrosoindole-3-acetonitrile. Chem. Res. Toxicol. 14:
158-164.
[36] Caulfield, J. L., Wishnok, J. S., and Tannenbaum, S. R. (2003) Nitric oxide-induced
interstrand cross-links in DNA. Chem. Res. Toxicol. 16: 571-574.
[37] deRojas-Walker, T., Tamir, S., Ji, H., Wishnok, J. S., and Tannenbaum, S. R. (1995)
Nitric oxide induces oxidative damage in addition to deamination in macrophage DNA.
Chem. Res. Toxicol. 8: 473-477.
[38] Pang, B., Zhou, X., Yu, H., Dong, M., Taghizadeh, K., Wishnok, J. S., Tannenbaum, S.
R., and Dedon, P. C. (2007) Lipid peroxidation dominates the chemistry of DNA adduct
formation in a mouse model of inflammation. Carcinogenesis. 28: 1807-1813.

218
[39] Mangerich, A., Knutson, C. G., Parry, N. M., Muthupalani, S., Ye, W., Prestwich, E.,
Cui, L., McFaline, J. L., Mobley, M., Ge, Z., Taghizadeh, K., Wishnok, J. S., Wogan, G.
N., Fox, J. G., Tannenbaum, S. R., and Dedon, P. C. (2012) Infection-induced colitis in
mice causes dynamic and tissue-specific changes in stress response and DNA damage
leading to colon cancer. Proc. Natl. Acad. Sci. U.S.A. 109: E1820-E1829.
[40] Li, Z., Wu, J., and DeLeo, C. J. (2006) RNA damage and surveillance under oxidative
stress. I.U.B.M.B. Life. 58: 581-588.
[41] Hofer, T., Badouard, C., Bajak, E., Ravanat, J.-L., Mattsson, Å., and Cotgreave, I. A.
(2005) Hydrogen peroxide causes greater oxidation in cellular RNA than in DNA. Biol.
Chem. 386: 333-337.
[42] Hofer, T., Seo, A. Y., Prudencio, M., and Leeuwenburgh, C. (2006) A method to
determine RNA and DNA oxidation simultaneously by HPLC-ECD: greater RNA than
DNA oxidation in rat liver after doxorubicin administration. Biol. Chem. 387: 103-111.
[43] Liu, M., Gong, X., Alluri, R. K., Wu, J., Sablo, T., and Li, Z. (2012) Characterization of
RNA damage under oxidative stress in Escherichia coli. Biol. Chem. 393: 123-132.
[44] Chan, C. T. Y., Dyavaiah, M., DeMott, M. S., Taghizadeh, K., Dedon, P. C., and Begley,
T. J. (2010) A quantitative systems approach reveals dynamic control of tRNA
modifications during cellular stress. P.L.O.S. Genet. 6: e1001247.
[45] Chan, C. T. Y., Pang, Y. L. J., Deng, W., Babu, I. R., Dyavaiah, M., Begley, T. J., and
Dedon, P. C. (2012) Reprogramming of tRNA modifications controls the oxidative stress
response by codon-biased translation of proteins. Nat. Commun. 3: 937.
[46] Levanon, E. Y., Eisenberg, E., Yelin, R., Nemzer, S., Hallegger, M., Shemesh, R.,
Fligelman, Z. Y., Shoshan, A., Pollock, S. R., Sztybel, D., Olshansky, M., Rechavi, G.,
and Jantsch, M. F. (2004) Systematic identification of abundant A-to-I editing sites in the
human transcriptome. Nat. Biotechnol. 22: 1001-1005.
[47] Li, J. B., Levanon, E. Y., Yoon, J.-K., Aach, J., Xie, B., LeProust, E., Zhang, K., Gao, Y.,
and Church, G. M. (2009) Genome-wide identification of human RNA editing sites by
parallel DNA capturing and sequencing. Science. 324: 1210-1213.
[48] Sager, R. (1997) Expression genetics in cancer: Shifting the focus from DNA to RNA.
Proc. Natl. Acad. Sci. U.S.A. 94: 952-955.
[49] Nicoloso, M. S., Spizzo, R., Shimizu, M., Rossi, S., and Calin, G. A. (2009) MicroRNAs
- the micro steering wheel of tumour metastases. Nat. Rev. Cancer. 9: 293-302.
[50] Chari, R., Thu, K., Wilson, I., Lockwood, W., Lonergan, K., Coe, B., Malloff, C.,
Gazdar, A., Lam, S., Garnis, C., MacAulay, C., Alvarez, C., and Lam, W. (2010)
Integrating the multiple dimensions of genomic and epigenomic landscapes of cancer.
Cancer Metastasis Rev. 29: 73-93.

219
[51] Chen, B., Keshive, M., and Deen, W. M. (1998) Diffusion and reaction of nitric oxide in
suspension cell cultures. Biophys. J. 75: 745-754.
[52] Nalwaya, N. and Deen, W. M. (2003) Analysis of cellular exposure to peroxynitrite in
suspension cultures. Chem. Res. Toxicol. 16: 920-932.
[53] Nalwaya, N. and Deen, W. M. (2005) Nitric oxide, oxygen, and superoxide formation
and consumption in macrophage cultures. Chem. Res. Toxicol. 18: 486-493.
[54] Chin, M. P., Schauer, D. B., and Deen, W. M. (2008) Prediction of nitric oxide
concentrations in colonic crypts during inflammation. Nitric Oxide Biol. Chem. 19: 266-
275.
[55] Lancaster, J. R. (2006) Nitroxidative, nitrosative, and nitrative stress: kinetic predictions
of reactive nitrogen species chemistry under biological conditions. Chem. Res. Toxicol.
19: 1160-1174.
[56] Lim, C. H., Dedon, P. C., and Deen, W. M. (2008) Kinetic analysis of intracellular
concentrations of reactive nitrogen species. Chem. Res. Toxicol. 21: 2134-2147.
[57] Keefer, L. K., Nims, R. W., Davies, K. M., and Wink, D. A. (1996) "NONOates" (1-
substituted diazen-1-ium-1,2-diolates) as nitric oxide donors: Convenient nitric oxide
dosage forms. Methods Enzymol. 268: 281-293.
[58] Schmidt, K., Desch, W., Klatt, P., Kukovetz, W. R., and Mayer, B. (1998) Release of NO
from donor compounds: a mathematical model for calculation of NO concentrations in
the presence of oxygen in Nitric Oxide Protocols (Titheradge, M. A., Titheradge, M. A.)
pp. 281-289, Humana Press Inc., Totowa.
[59] Thomas, D. D., Espey, M. G., Ridnour, L. A., Hofseth, L. J., Mancardi, D., Harris, C. C.,
and Wink, D. A. (2004) Hypoxic inducible factor 1 alpha, extracellular signal-regulated
kinase, and p53 are regulated by distinct threshold concentrations of nitric oxide. Proc.
Natl. Acad. Sci. U.S.A. 101: 8894–8899.
[60] Wang, C., Trudel, L. J., Wogan, G. N., and Deen, W. M. (2003) Thresholds of nitric
oxide-mediated toxicity in human lymphoblastoid cells. Chem. Res. Toxicol. 16: 1004-
1013.
[61] Dendroulakis, V., Russell, B. S., Eric Elmquist, C., Trudel, L. J., Wogan, G. N., Deen,
W. M., and Dedon, P. C. (2012) A system for exposing molecules and cells to
biologically relevant and accurately controlled steady-state concentrations of nitric oxide
and oxygen. Nitric Oxide Biol. Chem. 27: 161-168.
[62] Kim, M. Y., Lim, C. H., Trudel, L. J., Deen, W. M., and Wogan, G. N. (2012) Delivery
method, target gene structure, and growth properties of target cells impact mutagenic
responses to reactive nitrogen and oxygen species. Chem. Res. Toxicol. 25: 873-883.

220
[63] Chowdhury, R., Godoy, L. C., Thiantanawat, A., Trudel, L. J., Deen, W. M., and Wogan,
G. N. (2012) Nitric oxide produced endogenously is responsible for hypoxia-induced
HIF-1 stabilization in colon carcinoma cells. Chem. Res. Toxicol. 25: 2194-2202.
[64] Wang, C. and Deen, W. M. (2003) Nitric oxide delivery system for cell culture studies.
Ann. Biomed. Eng. 31: 65-79.
[65] Taghizadeh, K., McFaline, J. L., Pang, B., Sullivan, M., Dong, M., Plummer, E., and
Dedon, P. C. (2008) Quantification of DNA damage products resulting from
deamination, oxidation and reaction with products of lipid peroxidation by liquid
chromatography isotope dilution tandem mass spectrometry. Nat. Protoc. 3: 1287-1298.
[66] Dong, M. (2005) Nucleobase deamination as a biomarker of inflammatory processes,
Massachusetts Institute of Technology, Cambridge.
[67] Li, C.-Q., Trudel, L. J., and Wogan, G. N. (2002) Nitric oxide-induced genotoxicity,
mitochondrial damage, and apoptosis in human lymphoblastoid cells expressing wild-
type and mutant p53. Proc. Natl. Acad. Sci. U.S.A. 99: 10364-10369.
[68] Li, C.-Q., Trudel, L. J., and Wogan, G. N. (2002) Genotoxicity, mitochondrial damage,
and apoptosis in human lymphoblastoid cells exposed to peroxynitrite generated from
SIN-1. Chem. Res. Toxicol. 15: 527-535.
[69] Anderson, M. E. (1985) Determination of glutathione and glutathione disulfide in
biological samples. Methods Enzymol. 113: 548-555.
[70] Rahman, I., Kode, A., and Biswas, S. K. (2007) Assay for quantitative determination of
glutathione and glutathione disulfide levels using enzymatic recycling method. Nat.
Protoc. 1: 3159-3165.
[71] Caulfield, J. L., Singh, S. P., Wishnok, J. S., Deen, W. M., and Tannenbaum, S. R. (1996)
Bicarbonate inhibits N-nitrosation in oxygenated nitric oxide solutions. Biol. Chem. 271:
25859-25863.
[72] Licht, W. R., Tannenbaum, S. R., and Deen, W. M. (1988) Use of ascorbic acid to inhibit
nitrosation: kinetic and mass transfer considerations for an in vitro system.
Carcinogenesis. 9: 365-372.
[73] Ford, E., Hughes, M. N., and Wardman, P. (2002) Kinetics of the reactions of nitrogen
dioxide with glutathione, cysteine, and uric acid at physiological pH. Free Radic. Biol.
Med. 32: 1314-1323.
[74] Tu, B., Wallin, A., Moldéus, P., and Cotgreave, I. (1995) The cytoprotective roles of
ascorbate and glutathione against nitrogen dioxide toxicity in human endothelial cells.
Toxicology. 98: 125-136.

221
[75] Möller, M. N., Li, Q., Vitturi, D. A., Robinson, J. M., Lancaster, Jack R., and Denicola,
A. (2007) Membrane "lens" effect focusing the formation of reactive nitrogen oxides
from the NO/O2 reaction. Chem. Res. Toxicol. 20: 709-714.
[76] McQuade, L. E., Ma, J., Lowe, G., Ghatpande, A., Gelperin, A., and Lippard, S. J. (2010)
Visualization of nitric oxide production in the mouse main olfactory bulb by a cell-
trappable copper(II) fluorescent probe. Proc. Natl. Acad. Sci. U.S.A. 107: 8525-8530.
[77] Cortese-Krott, M. M., Rodriguez-Mateos, A., Kuhnle, G. G. C., Brown, G., Feelisch, M.,
and Kelm, M. (2012) A multilevel analytical approach for detection and visualization of
intracellular NO production and nitrosation events using diaminofluoresceins. Free
Radic. Biol. Med. 53: 2146-2158.
[78] Grätzel, M., Taniguchi, S., and Henglein, A. (1970) Pulse radiolytic investigation of NO
oxidation and equilibrium N2O3 = NO + NO2 in aqueous solution. Berichte der
Bunsengesellschaft für physikalische Chemie. 74: 488-492.
[79] Carola, R., Harley, J. P., and Noback, C. R. (1990) Human Anatomy & Physiology,
McGraw Hill, New York, NY.
[80] Hornig, D. (1975) Distribution of ascorbic acid, metabolites and analogues in man and
animals. Ann. N.Y. Acad. Sci. 258: 103-118.
[81] Meister, A. and Anderson, M. E. (1983) Glutathione. Annu. Rev. Biochem. 52: 711-760.
[82] Dahn, H., Loewe, L., and Bunton, C. A. (1960) Über die Oxydation von Ascorbinsäure
durch salpetrige Säure Teil VI: Übersicht und Diskussion der Ergebnisse. 18. Mitteilung
über Reduktone und 1,2,3-Tricarbonylverbindungen. Helv. Chim. Acta. 43: 320-333.
[83] Reuben, D. M. E. and Bruice, T. C. (1976) Reaction of thiol anions with benzene oxide
and malachite green. J. Am. Chem. Soc. 98: 114-121.
[84] Luperchio, S., Tamir, S., and Tannenbaum, S. R. (1996) NO-induced oxidative stress and
glutathione metabolism in rodent and human cells. Free Radic. Biol. Med. 21: 513-519.
[85] Li, C.-Q., Wright, T. L., Dong, M., Dommels, Y. E. M., Trudel, L. J., Dedon, P. C.,
Tannenbaum, S. R., and Wogan, G. N. (2005) Biological role of glutathione in nitric
oxide-induced toxicity in cell culture and animal models. Free Radic. Biol. Med. 39:
1489-1498.
[86] Anderson, M. E. (1998) Glutathione: an overview of biosynthesis and modulation. Chem.
Biol. Interact. 112: 1-14.
[87] Nibbering, P. H., Zomerdijk, T. P. L., Corsèl-Van Tilburg, A. J., and Van Furth, R.
(1990) Mean cell volume of human blood leucocytes and resident and activated murine
macrophages. J. Immunol. Methods. 129: 143-145.

222
[88] Li, C.-Q., Pang, B., Kiziltepe, T., Trudel, L. J., Engelward, B. P., Dedon, P. C., and
Wogan, G. N. (2006) Threshold effects of nitric oxide-induced toxicity and cellular
responses in wild-type and p53-null human lymphoblastoid cells. Chem. Res. Toxicol. 19:
399-406.
[89] Johnson, L. F., Abelson, H. T., Penman, S., and Green, H. (1977) The relative amounts of
the cytoplasmic RNA species in normal, transformed and senescent cultured cell lines. J.
Cell. Physiol. 90: 465-470.
[90] Traganos, F., Darzynkiewicz, Z., and Melamed, M. R. (1982) The ratio of RNA to total
nucleic acid content as a quantitative measure of unbalanced cell growth. Cytometry. 2:
212-218.
[91] Skinn, B. T. and Deen, W. M. (2013) A nitrogen dioxide delivery system for biological
media. Free Radic. Biol. Med. 56: 44-53.
[92] Nikov, G., Bhat, V., Wishnok, J. S., and Tannenbaum, S. R. (2003) Analysis of nitrated
proteins by nitrotyrosine-specific affinity probes and mass spectrometry. Anal. Biochem.
320: 214-222.
[93] Bryan, N. S., Rassaf, T., Maloney, R. E., Rodriguez, C. M., Saijo, F., Rodriguez, J. R.,
and Feelisch, M. (2004) Cellular targets and mechanisms of nitros(yl)ation: An insight
into their nature and kinetics in vivo. Proc. Natl. Acad. Sci. U.S.A. 101: 4308-4313.
[94] Bass, B. L. (2002) RNA editing by adenosine deaminases that act on RNA. Annu. Rev.
Biochem. 71: 817-846.
[95] Cheung, M. C., Evans, J. G., McKenna, B., and Ehrlich, D. J. (2011) Deep ultraviolet
mapping of intracellular protein and nucleic acid in femtograms per pixel. Cytometry
Part A. 79A: 920-932.
[96] Lodish, H., Berk, A., Zipursky, S. L., Matsudaira, P., Baltimore, D., and Darnell, J.
(2000) Molecular Cell Biology, 4th Edition, W. H. Freeman and Co, New York.
[97] Alvarez, B. and Radi, R. (2003) Peroxynitrite reactivity with amino acids and proteins.
Amino Acids. 25: 295-311.
[98] García-Santos, M. d. P., González-Mancebo, S., Hernández-Benito, J., Calle, E., and
Casado, J. (2002) Reactivity of amino acids in nitrosation reactions and its relation to the
alkylating potential of their products. J. Am. Chem. Soc. 124: 2177-2182.
[99] Kirsch, M., Fuchs, A., and de Groot, H. (2003) Regiospecific nitrosation of N-terminal-
blocked tryptophan derivatives by N2O3 at physiological pH. J. Biol. Chem. 278: 11931-
11936.
[100] Roth, E., Mühlbacher, F., Karner, J., Hamilton, G., and Funovics, J. (1987) Free amino
acid levels in muscle and liver of a patient with glucagonoma syndrome. Metabolism. 36:
7-13.

223
[101] Barglow, K. T., Knutson, C. G., Wishnok, J. S., Tannenbaum, S. R., and Marletta, M. A.
(2011) Site-specific and redox-controlled S-nitrosation of thioredoxin. Proc. Natl. Acad.
Sci. U.S.A. 108: E600-E606.
[102] St. Croix, C. M., Stitt, M. S., Leelavanichkul, K., Wasserloos, K. J., Pitt, B. R., and
Watkins, S. C. (2004) Nitric oxide-induced modification of protein thiolate clusters as
determined by spectral fluorescence resonance energy transfer in live endothelial cells.
Free Radic. Biol. Med. 37: 785-792.

224
Chapter 6
Conclusions and Future Directions
6.1 Conclusions
The overarching goal of this thesis was to estimate the concentration of nitrosating agent
N2O3 in the cytosol of mammalian cells exposed to doses of NO similar to those encountered in
proximity to inflamed tissues. To determine levels of this reactive and short-lived mediator of
inflammation – previously estimated only via mathematical modeling – nucleobase deamination
products in RNA were chosen as surrogate markers for the damage it inflicts in the intracellular
milieu. Sensitive analytical methods were developed to quantify the corresponding lesions and
the kinetics of NO-induced deamination monitored both in purified RNA in solution and RNA
extracted from intact cells under nitrosative stress were then compared.
First we investigated the function of a delivery system that simulates the nitrosative
environment at sites of inflammation and assessed its reliability under conditions approximating
exposure of cell cultures to NO [1]. To challenge biomolecules or cell suspensions with precise
doses of NO we chose to employ the Silastic tubing-based reactor developed by Deen and
coworkers [2] which had been characterized while containing buffer solutions, but not in the case
of cell culture media. Hence, we exposed different commercial culture media in the device,
measuring the dissolved NO and O2 concentrations with appropriate polarographic probes and
compared our data with predictions from an accompanying mass transfer model that describes
the gases profile generated in the system. Our findings indicated that the complicated
constitution of media – glutathione, salts, amino acids, sugars and vitamins among others – does

225
not interfere with diffusion of NO and O2 and the reaction between them while no extraneous
consumption of the radical gas was observed. In particular, the micromolar levels of riboflavin,
whose photoactivation produces superoxide – a molecular “sink” for NO in the solution – under
certain wavelengths, did not affect the system’s performance whether experiments were
performed in light or darkness. We concluded that the device will operate as expected during
treatments of cell cultures and the levels of NO can be predicted with confidence, a crucial
parameter in calculating the amount of N2O3 generated in the cytosol of stressed cells.
To establish the rate at which RNA nucleobases are damaged by N2O3, in the absence of
other cellular components that may mitigate its effect, we quantified the increase of deamination
products resulting in total RNA from exposure to a well defined regime of nitrosative stress.
Measurements of RNA treated to precise levels of NO – and a steady N2O3 concentration – in the
delivery reactor revealed differential kinetics for the formation of rI, rX and rO (calculated first
order rate constants 2.9 × 10⁴, 1.3 × 10
6 and 7.7 × 10
5 M
-1s
-1, respectively) indicating a
considerably greater susceptibility of rG to deamination compared to rA. We noticed similar
kinetics for the aforementioned deamination lesions – as well as the disparity between adenine
and guanine – when we exposed purified genomic DNA to the same controlled environment and
we observed even higher reactivities when free (deoxy)ribonucleosides were used as substrates,
suggesting that whereas a protective effect is inherent to macromolecular structure there is no
detectable difference between double- and single-stranded nucleic acids. In every case, the
generation of oxanine reinforces the conclusion that deamination of guanine leads to comparable
amounts of produced xanthine and oxanine, illustrating the complexity of the specific chemistry
and expanding the spectrum of products previously thought to occur in cells under nitrosative
stress. Specific to the fate of oxanine, our results underlined the importance of rigorously

226
controlling the conditions for the analytical methods employed as millimolar levels of amine-
containing antioxidants such as deferoxamine can affect the stability of the oxanine heterocyclic
ring (via nucleophilic attack) during sample processing and contribute to artifactual formation of
xanthine (via a previously undocumented oxanine-to-xanthine rearrangement) as shown by our
data.
Combining the recently gained confidence in defining conditions in the NO-delivery
device during cell culture exposures and kinetic information on RNA nucleobase damage caused
by N2O3 in vitro, we examined the protective effect against nitrosative stress that the cytosol of
NO-challenged cells confers. Employing our sensitive LC/MS/MS analytical platforms, small
but measurable increases in deamination products were detected in total RNA isolated from TK6
cells treated in the delivery reactor (maintained at predictable and constant concentrations of NO
and O2 comparable to those at sites of inflammation). The observed formation rates for rI, rX and
rO – together with the in vitro rate constants mentioned above – were applied to fundamental
expressions of the rate law and thus provided estimates for the intracellular N2O3 concentrations
ranging between 0.2 and 33 fM. These experimentally derived estimates compare favorably with
predictions stemming from mathematical models, supporting the accuracy of the incorporated
kinetic information and illustrating their significance in determining the fate of reactive nitrogen
species in inflamed tissues. Further experiments revealed that a roughly 100-fold drug-induced
depletion of GSH levels in cells prior to being challenged in the reactor did not alter the
accumulation rate of rI, rX and rO, which contradicts previous kinetic analyses that projected
marked increases in N2O3-related damage with a diminishing GSH cellular content [3]. Our
calculations – involving the steady-state hypothesis while including previously reported
biomolecules that consume N2O3 with known rate constants – suggested that additional sinks are

227
likely to play an important role in mitigating the damaging effects of N2O3 in the cytosol and that
would also explain the negligible contribution of GSH in protecting against nitrosative stress, as
indicated by our experiments.
Aside from examining the extent to which nitrosative deamination modifies the parent
nucleobases, we also investigated whether depurination can be the result of exposing RNA to
NO and N2O3. The study, performed in collaboration with Dr. Wan Simon Chan, focused on the
formation of abasic sites in purified RNA exposed to the well controlled and predictable
nitrosative environment maintained in the delivery reactor. Using a sensitive LC/MS/MS strategy
and derivatization of the treated RNA with a hydroxylamine-based reactive aldehyde probe we
were able to show for the first time the occurrence of such damage in RNA, albeit with very slow
rates (1.5 × 10² M
-1s
-1) that proved to be orders of magnitude less than the same reaction
observed in DNA or the formation of deamination products.
6.2 Future Perspective
The unexpected observation of oxanine formation in RNA due to nitrosative stress,
primarily resulting from the application of rectified analytical methods (i.e. omitting amine-
containing antioxidants), adds a different perspective to the argument of whether oxanine is a
biological lesion encountered in cells exposed to NO. Robust increases in rO content were
measured during in vitro exposures of pure RNA to NO whereas smaller rates of formation were
detected in RNA extracted from NO-challenged cells; both cases present strong evidence that
deamination of guanosine indeed gives rise to more than one product, as initially suggested by
previous experimental findings [4]. Our in vitro studies also indicate that there is minimal
difference in reactivity between double-stranded DNA and RNA based on values determined for

228
deamination rate constants and that the spectrum of products is the same in both types of
macromolecules. Hence, since our sensitive LC/MS/MS methods enabled the detection of rO in
total RNA of treated cells, it is likely that dO can also be measured in genomic DNA purified
from cell aliquots (exposed to the largest NO dose during exposure in the delivery reactor and
currently stored in -80 oC) by readily modifying the analytical protocols. If the nitrosative
environment in the cytosol of cells treated in the reactor led to the formation of rO in ribosomal
RNA then we would also expect dO to form in the genome, as long as cross-reaction with basic
molecules localized in the nucleus (e.g. histones and polyamines among others [5,6]) or efficient
DNA repair do not significantly decrease the levels of the particular lesion.
Based on the notion that amino acids in proteins may be competing with other targets in
the cytosol for the reaction with N2O3, it would be interesting to investigate how aspects of the
ribosomal supramolecular structure affect the deamination of nucleobases in rRNA. The RNA
molecules comprising the ribosomal units are in very close proximity to proteins in the ribosome
– proteins localized mainly on the surface of the structure – and it is conceivable that in a
nitrosative environment those proteins may act as scavengers, the same way phosphate in
solution, for example, has been shown to be for nucleobases [7]. Especially after noting that the
rate constants for deamination are orders of magnitude smaller compared to those for amino acid
N-nitrosation [8,9], it is possible that nucleobases close to the proteins decorating the rRNA
strands are relatively more protected against N2O3-induced damage rather than those found in the
core of the ribosomal units. That scenario comes in contrast to studies arguing that the
hydrophobic parts of proteins may accelerate NO auto-oxidation [10] in which case the opposite
pattern would prevail, with the protein-free core exhibiting lower levels of accumulated
deamination products. To examine whether the presence of proteins noticeably affects

229
deamination of nucleobases in the RNA ribosomal unit, intact ribosomes can be isolated and
exposed to defined levels of NO/N2O3 before measuring rI, rX and rO with our optimized
protocols. The acquired rates of formation of deaminated nucleobases can then be compared to
those observed with purified (protein-free) rRNA in an effort to detect any potential shielding
effects related to the presence of protein. Furthermore, attempting to map the deamination events
on the RNA macromolecule and search for consistent patterns that may arise due to nitrosative
stress could shed more light on the possibility of local hotspots; the preserved sequence inherent
to rRNA is expected to facilitate the detection of altered bases. The same study could potentially
reveal whether solvent accessibility of the ribosomal units (i.e. strands located in the surface vs.
the core) is another factor controlling which nucleobases become more susceptible to
modification via N2O3. In addition, comparing rates of rI, rX and rO formation between intact
ribosomes and protein-free rRNA may provide deamination rate constants that better represent
the chemistry as it occurs in the crowded cytosol and thus assist in calculating a more accurate
estimate of the intracellular N2O3 concentration.
Finally, given the potential for free amino acids and proteins to readily react with N2O3 in
vitro, we propose to further investigate the possibility of N-nitrosation being a pathway parallel
to nucleobase deamination that may damage elements of cellular function and structrure.
Exposure of thiols to a nitrosative environment has been shown to lead to products of S-
nitrosation [11] that can interfere with cellular signal transduction associated with numerous
pathologies linked to severe biological implications [12]. Thiols however are not the only protein
residues that can be nitrosated since studies have shown at least one more amine-containing side-
chain (tryptophan) to react with N2O3 at comparable rates with thiols [9]. This suggests that N-
nitrosation could be a significant reaction in vivo (especially since amino groups are in general

230
more abundant than sulfhydryls) however relevant information is scarce and other nucleophilic
residues besides tryptophan that may participate in similar pathways have not been characterized
yet. More recent studies showed that although denitrosation of nitrosated tryptophan residues is
possible in the presence of certain cellular constituents (e.g. GSH [13] or xanthine oxidase [14])
it occurs at a slow enough rate that significant amounts of nitrosated residues are hypothesized to
accumulate in vivo. In that case, it is not unreasonable to expect multiple other amine-containing
residues to contribute (in addition to thiols and tryptophan) towards lowering the steady-state
levels of N2O3 forming in the cytosol of cells overwhelmed with NO. Assuming the rate of
denitrosation in such cells is sufficiently small, products of N-nitrosation may remain in the
intracellular milieu long enough to be detected. To that end, we propose a proteomic mapping of
nitrosyl adducts in amine-containing residues of peptides isolated from the most abundant
proteins in the cytosol (e.g. listed in ref. [15]) of cells challenged with NO. This strategy will
shed some light on the significance of this pathway, if any, in terms of defining the complex
network of dysregulated pathways that may lead NO-stressed cells to aberrant growth and will
test our hypothesis that nucleophilic protein residues actively scavenge N2O3 allowing for a more
complete representation of all the relevant molecular sinks in the cell milieu.
Altogether, the proposed studies should provide new insights into the chemical basis for
endogenous nucleic acid and protein adducts that could be useful as biomarkers of exposure to
NO and assist in more fully understanding the mechanisms that lead to uncontrolled cell growth
at sites of inflammation.

231
6.3 References
[1] Dendroulakis, V., Russell, B. S., Eric Elmquist, C., Trudel, L. J., Wogan, G. N., Deen,
W. M., and Dedon, P. C. (2012) A system for exposing molecules and cells to
biologically relevant and accurately controlled steady-state concentrations of nitric oxide
and oxygen. Nitric Oxide Biol. Chem. 27: 161-168.
[2] Wang, C. and Deen, W. M. (2003) Nitric oxide delivery system for cell culture studies.
Ann. Biomed. Eng. 31: 65-79.
[3] Lim, C. H., Dedon, P. C., and Deen, W. M. (2008) Kinetic analysis of intracellular
concentrations of reactive nitrogen species. Chem. Res. Toxicol. 21: 2134-2147.
[4] Suzuki, T., Yamaoka, R., Nishi, M., Ide, H., and Makino, K. (1996) Isolation and
characterization of a novel product, 2'-deoxyoxanosine, from 2'-deoxyguanosine,
oligodeoxynucleotide, and calf thymus DNA treated by nitrous acid and nitric oxide. J.
Am. Chem. Soc. 118: 2515-2516.
[5] Suzuki, T., Yamada, M., Ide, H., Kanaori, K., Tajima, K., Morii, T., and Makino, K.
(2000) Identification and characterization of a reaction product of 2'-deoxyoxanosine
with glycine. Chem. Res. Toxicol. 13: 227-230.
[6] Nakano, T., Terato, H., Asagoshi, K., Masaoka, A., Mukuta, M., Ohyama, Y., Suzuki, T.,
Makino, K., and Ide, H. (2003) DNA-protein cross-link formation mediated by oxanine:
A novel genotoxic mechanism of nitric oxide-induced DNA damage. J. Biol. Chem. 278:
25264-25272.
[7] Lewis, R. S., Tannenbaum, S. R., and Deen, W. M. (1995) Kinetics of N-nitrosation in
oxygenated nitric oxide solutions at physiological pH: Role of nitrous anhydride and
effects of phosphate and chloride. J. Am. Chem. Soc. 117: 3933-3939.
[8] García-Santos, M. d. P., González-Mancebo, S., Hernández-Benito, J., Calle, E., and
Casado, J. (2002) Reactivity of amino acids in nitrosation reactions and its relation to the
alkylating potential of their products. J. Am. Chem. Soc. 124: 2177-2182.
[9] Kirsch, M., Fuchs, A., and de Groot, H. (2003) Regiospecific nitrosation of N-terminal-
blocked tryptophan derivatives by N2O3 at physiological pH. J. Biol. Chem. 278: 11931-
11936.
[10] Möller, M. N., Li, Q., Lancaster, J. R., and Denicola, A. (2007) Acceleration of nitric
oxide autoxidation and nitrosation by membranes. I.U.B.M.B. Life. 59: 243-248.
[11] Keshive, M., Singh, S., Wishnok, J. S., Tannenbaum, S. R., and Deen, W. M. (1996)
Kinetics of S-nitrosation of thiols in nitric oxide solutions. Chem. Res. Toxicol. 9: 988-
993.

232
[12] Foster, M. W., Hess, D. T., and Stamler, J. S. (2009) Protein S-nitrosylation in health and
disease: a current perspective. Trends Mol. Med. 15: 391-404.
[13] Jourd'heuil, F. L., Lowery, A. M., Melton, E. M., Mnaimneh, S., Bryan, N. S., Fernandez,
B. O., Park, J.-H., Ha, C.-E., Bhagavan, N. V., Feelisch, M., and Jourd'heuil, D. (2010)
Redox-sensitivity and site-specificity of S- and N-denitrosation in proteins. P.L.O.S. One.
5: e14400.
[14] Viles, K., Mathai, C., Jourd'heuil, F. L., and Jourd'heuil, D. (2013) Xanthine oxidase-
mediated denitrosation of N-nitroso-tryptophan by superoxide and uric acid. Nitric Oxide
Biol. Chem. 28: 57-64.
[15] Beck, M., Schmidt, A., Malmstroem, J., Claassen, M., Ori, A., Szymborska, A., Herzog,
F., Rinner, O., Ellenberg, J., and Aebersold, R. (2011) The quantitative proteome of a
human cell line. Mol. Syst. Biol. 7: 549.

233
Appendix A
Parts list and assembly and operation instructions for the peripheral
tubing system complementing the NO-delivery apparatus
A.1 Introduction
The detailed instructions below provide sufficient information for assembling and
operating the peripheral tubing system that delivers controlled gas flow to the NO-delivery
device while maintaining stirring speed and temperature in safety.
A.2 Detailed assembly instructions for the peripheral tubing system
The peripheral tubing system consists of three independent gas feed lines, each for every
required gas mixture, labeled ‘NO-line’, ‘Ar-line’ and ‘O2-line’. The three gas lines are
assembled independently and generally do not merge, with the only exception being a single
point where the ‘NO-’ and ‘Ar-line’ connect through a valve (Points A and B in Figure 2.3,
Chapter 2). Beginning with the assembly of the ‘NO-line’, the NO cylinder (1%, 10% or 99%
NO; Item #8 in Table A.1), is fitted to the NO-regulator (Item #11) that is compatible with all
cylinders of varying NO composition. The outlet of the regulator is fitted with 1/8'' tubing (Item
#15), via a 1/8'' stainless nut (Item #22) housing a 1/8'' back and front ferrule (Items #23 and
#24) that securely anchor the tubing within the fitting. The relative order and orientation of Items
#22, #23 and #24, through which Item #15 is threaded, just before the stainless nut is screwed on
the outlet of the regulator, is depicted in the upper right inset of Figure 2.3 (Chapter 2); the same
layout is implicitly inferred for every stainless nut (Items #22 or #25) appearing on the
schematic. The 1/8'' tubing connected to the regulator’s outlet –and every other piece of tubing

234
Table A.1. List of items required for the assembly of the peripheral tubing system.
The assembly part numbers on this list are helpful in relating each item with the schematic in
Figure 2.3 (Chapter 2), a visual guide on how to connect the components of the peripheral tubing
system (see also Figure A.1).
Assembly
Part
Number
Part Description
Company
(Catalog Number)
Quantity
1 Gas mass flow controller
Porter Instrument Company
(Model 201)
2
2 Control module
Porter Instrument Company
(Model CM2)
1
3 Cable assembly
Porter Instrument Company
(KC18043-010)
2
4 10-position magnetic stir-plate with
water-bath
IKA
(RO 10 power IKAMAG)
1
5 Immersion thermostat
IKA
(EH 4 basic)
1
6 Argon Cylinder
Airgas
(AR300)
1
7 Oxygen Mix Cylinder (50% O2, 5%
CO2, 45% N2)
Airgas
(Z03NI4532002133)
1

235
8 NO Mix Cylinder
Airgas
(NCCP200 – 99% NO)
(X02AR90C20000X6 – 10% NO)
(X02AR99C15A04Z5 – 1% NO)
1
9 Argon Regulator
VWR
(55850-626)
1
10 Oxygen Mix Regulator
Airgas
(Y11-244B500)
1
11 HP 742 Stainless Steel Regulator
Harris Specialty Gas
(742-50-660-E)
1
12 Product moisture trap
Harris Specialty Gas
(4302722)
1
13 Manifolds with luer locks, 4 ports,
180° rotation
Cole-Parmer
(EW-30600-42)
1 pack
(10/pack)
14 PVC tubing with luer ends
Cole-Parmer
(EW-30600-67)
1 pack
(20/pack)
15 PTFE tubing, 1/16"ID x 1/8"OD
Cole-Parmer
(EW-06407-42)
2
16 PTFE tubing, 3/16"ID x 1/4"OD
Cole-Parmer
(EW-06407-44)
1

236
17 Male luer with lock ring x 1/16" hose
barb
Cole-Parmer
(EW-45503-00)
2 packs
(25/pack)
18 Male luer lock plug
Cole-Parmer
(EW-45503-56)
1 pack
(25/pack)
19 Union Tee
Swagelok Fittings
(SS-200-3)
2
20 Stainless Reducer
Swagelok Fittings
(SS-200-R-4)
6
21 Ball Valve
Swagelok Fittings
(SS-41GS2)
1
22 1/8’’ Stainless Nut
Swagelok Fittings
(SS-202-1)
10
23 1/8’’ Stainless Back Ferrule
Swagelok Fittings
(SS-204-1)
10
24 1/8’’ Stainless Front Ferrule
Swagelok Fittings
(SS-203-1)
10
25 1/4’’ Stainless Nut
Swagelok Fittings
(SS-402-1)
10
26
1/4’’ Stainless Back Ferrule
Swagelok Fittings
(SS-404-1)
10

237
27 1/4’’ Stainless Front Ferrule
Swagelok Fittings
(SS-403-1)
10
28 Poppet Check Valve
Cambridge Valve & Fitting, Inc.
(SS-4C-1/3)
2
29 Female connector
Swagelok Fittings
(SS-400-7-4)
1
(Table A.1)

238
Table A.2. List of items required for the assembly of the delivery apparatus.
The 11/16″ O-rings, 9/64″ O-rings and stainless steel fitting required only for the version of the
device that houses the NO/O2 probes. Last three parts on the list required for the adherent cell
version only.
Part Description
Company
(Catalog #)
PFA Wide-Mouth Sample Jar, 120 mL
Cole-Parmer
(EW-06103-40)
Magnetic stirrer bar
Cole-Parmer
(EW-08551-00)
Viton O-Ring, 3/8" O.D.
McMaster-Carr
(9464K15)
Silastic tubing 1.47mm I.D. x 1.96 mm O.D.
Dow Corning
(508-006)
Female luer bulkhead x 1/16" hose barb
Cole-Parmer
(EW-45500-30)
Viton O-Ring, 11/16" O.D.
McMaster-Carr
(9464K21)
Viton O-Ring, 9/64" O.D.
McMaster-Carr
(9464K102)

239
(Table A.2)
Stainless Steel Fitting
Swagelok
(SS-8-UT-1-6)
Impeller assembly (50 mL)
Bellco Biotechnology
(1967-30050)
Glass impeller shaft (7mm O.D. x 155 mm)
Bellco Biotechnology
(1969-70250)
Black PP compression fitting for 7 mm O.D. glass
shafts (part 10)
Bellco Biotechnology
(A523-204)

240
Figure A.1. Picture of the peripheral tubing system.
Picture of the peripheral tubing system with elements of temperature control and stirring
assembled under a fume hood.

241
depicted– is arbitrarily long so the peripheral tubing system can fit the physical dimensions of
the fume hood within which it will be installed. Since NO is toxic, assembling the peripheral
system in a hood is imperative to protect the user(s) from exposure to the gas. The other end of
the tubing extending from the regulator’s outlet is connected to the first port (out of three) of a
union tee (Item #19). Starting from the second port of the same union tee, another piece of 1/8''
tubing leads to the inlet of a custom-made NOx impurities trap, essentially a product moisture
trap (Item #12) emptied of its initial absorbent material and refilled with soda lime which
removes traces of oxidized forms of NO. The third port of the union tee (Point A in Figure 2.3,
Chapter 2) will be connected later with the fully assembled ‘Ar-line’ via a valve, allowing for a
fraction of the Argon flow to be redirected through the ‘NO-line’ for purging purposes. From the
NOx impurities trap outlet, another piece of 1/8'' tubing extends and enters a stainless reducer
(Item #20). The reducer enables the increase of tubing dimensions (following the direction of the
flow, from 1/8'' to a 1/4'' diameter) for compatibility purposes with the NO mass flow controller
(Item #1). The larger end of the reducer is fitted with a 1/4'' nut (Item #25) –1/4'' back and front
ferrules (Items #26 and #27) included– to the inlet of a poppet check valve (Item #28). The check
valve is used to restrict airflow to a single direction, preventing backflow, and its outlet is
connected to a short piece of 1/4'' tubing (Item #16). The other end of that tubing is fitted to the
inlet of the NO mass flow controller (Item #1; see Table A.3 for custom specifications), plugged
to the flow control module (Item #2; not shown in Figure 2.3, Chapter 2) via its cable assembly
(Item #3). The control module allows the user to manually set the NO-controller’s flow from 0%
to approximately 100% of its maximum flow capacity (500 standard cubic centimeters per
minute for the NO mass flow controller). The controller’s outlet is connected to another reducer
(Item #20) and the smaller end of that reducer is attached to a piece of 1/8'' tubing. The other end

242
Table A.3. Custom specifications for mass flow controllers installed in the peripheral tubing
system.
Custom specifications for ordering the two mass flow controllers (Item #1 in Figure 2.3, Chapter
2 and Table A.1). The listed parameters describe characteristics of the (approximate) flow
conditions for which the controllers will be used.
NO mass flow controller O2 mass flow controller
Fluid 90% Ar/10% NO 21% O2/79% N2
Flow 500 sccm* 2000 sccm*
P1 40 psig 40 psig
P2 0 psig 0 psig
Temp 70F/21.1C 70F/21.1C
* sccm: standard cubic centimeter per minute

243
of the 1/8'' tubing is capped with a plastic barbed hose male luer adapter (Item #17) with its hose
barb firmly inserted into the tubing and its locking nut screwed on the inlet of a 4-port manifold
(Item #13). The outlet of the manifold is sealed with a luer plug (Item #18) allowing the entering
gas flow to be divided through its 4 ports. By default, the manifold’s stopcocks knobs are all
limited to a 180 degree rotation, but overriding (by breaking) the stops in each knob that obstruct
free 360o rotation gives a fully functional manifold where 1, 2, 3 or 4 ports can be used
simultaneously (not possible granted the manifold’s original design). As a last step in the
assembly of the ‘NO-line’, four pieces of 1/8'' tubing, equal in length, are capped at both ends
with male barbed hose luer adapters (Item #17) and the locking nut from one end of each is
screwed to one of the 4 ports on the manifold. Hence 4 equal pieces of tubing are attached to the
4 manifold ports with their unengaged ends free to fit onto 4 identical delivery devices
(connection points denoted by asterisks in Figure 2.3, Chapter 2). The manifold is firmly
suspended at an appropriate height above the 10-position magnetic stir-plate with water-bath
(item #4) so that the 4 pieces of tubing can extend freely downwards and attach to up to 4
devices, with all devices resting in the water-bath at the preset positions on the magnetic stir-
plate (allowing for proper rotation of the stirrer bars inside each device). The ‘NO-line’ connects
at a single point only with the ‘Argon-line’, whose assembly is described next.
The Argon cylinder (Item #6) is connected to the Argon regulator (Item #9) and the
regulator’s outlet is fitted with a stainless reducer (Item #20), securely tightened with a 1/4'' nut
(Item #25; 1/4'' back and front ferrules Items #26 and 27 included). The reducer is subsequently
attached to a stretch of 1/8'' tubing (Item #15) via a 1/8'' nut (Item #22) while the other end of
that tubing is inserted into the first port of a union tee (Item #19). From the second port of the
same union tee (Point B; Figure 2.3, Chapter 2), 1/8'' tubing extends to one end of a ball valve

244
(Item #21) while the other end of the valve is connected to the previously unoccupied port of the
tee in the ‘NO-line’ (Point A; Figure 2.3, Chapter 2) with another stretch of 1/8'' tubing. This
valve, uniting (when in the open position), or separating (when in the closed position), the ‘Ar-‘
and ‘NO-lines’, is labeled “purging valve” and its purpose will be discussed shortly. The third
and final port of the union tee on the ‘Ar-line’ (Point B) is connected to one end of 1/8'' tubing
while the tubing’s other end is capped with a male barbed hose luer adapter (Item #17). That luer
is fitted on the inlet of a manifold (Item #13), modified to allow independent opening of all its
ports in a similar fashion to the one in the ‘NO-line’. As before, the manifold’s outlet is sealed
with a luer plug (Item #18) and the 4 ports are connected with 4 equal pieces of 1/8'' tubing
(capped at both ends with male barbed hose luer adapters), while the manifold is suspended
above the 10-position magnetic stir-plate with water-bath. The 4 pieces of tubing extending from
the 4 ports can connect to 4 separate delivery devices situated in the water-bath (connection
points denoted by asterisks in Figure 2.3, Chapter 2). The principal purpose of the ‘Ar-line’ is to
enable negative control experiments to be performed, during which the contents of the devices
are exposed to inert Argon and O2, rather than NO and O2. With the given configuration, up to 4
independent devices can be connected to the ‘NO-line’ while 4 others can be connected to the
‘Ar-line’ in parallel, thus reaching the maximum capacity of the peripheral system (O2 delivered
to all 8 devices by the ‘O2-line’ described next). A second purpose for the ‘Ar-line’ involves
purging the mass flow controller in the ‘NO-line’ from residual NO (residues of formed nitric
acid may corrode the steel fittings of the controller): using the “purging valve” (Points A and B
in Figure 2.3, Chapter 2) in its open position allows a fraction of the Argon gas flow to travel
through the ‘NO-line’, flushing NO traces from the controller’s chamber. With “purging valve”
in the closed position (default state during typical exposures), ‘Ar-’ and ‘NO-lines’ are

245
completely separated and the two gases are delivered individually through the corresponding
manifolds.
The last part of the peripheral tubing system involves assembling the ‘O2-line’: the O2
cylinder (Item #7) is fitted with the oxygen regulator (Item #10), while a female connector (Item
#29) is attached to the regulator’s outlet. The female connector has the appropriate dimensions so
that a stainless reducer (Item #20) can be anchored to its outlet with the help of a 1/4'' nut (Item
#25). The smaller end of the reducer is connected to 1/8'' tubing (Item #15), firmly secured in
place with a 1/8'' nut (Item #22), and the other end of the tubing extends towards an arrangement
of fittings mirroring the configuration of the ‘NO-line’. Briefly, the O2 mass flow controller
(Item #1; see Table A.3 for custom specifications) is integrated into the ‘O2-line’ through the
following sequence of items connected with each other: reducer (Item #20), poppet check valve
(Item #28), 1/4'' tubing (Item #16), O2 mass flow controller, reducer, 1/8'' tubing. The O2 mass
flow controller is plugged to the control module (Item #2; not shown in Figure 2.3, Chapter 2)
via its cable assembly (Item #3). The 1/8'' tubing from the flow controller’s outlet connects, via a
male barbed hose luer adapter (Item #17), to the inlet of a 4-port manifold (item #13) whose
outlet is connected to a second identical manifold, through a short piece of 1/8'' tubing capped at
both ends with male barbed hose luer adapters; the second manifold downstream is sealed at its
outlet with a luer plug (Item #18). Both manifolds were modified to allow simultaneous opening
of up to 4 ports each (similarly to the ‘NO-’ and ‘Ar-lines’) and both are situated above the 10-
position magnetic stir-plate with water-bath (Item #4). All 8 ports combined from both
manifolds, are fitted with 8 PVC tubing with luer ends (Item #14) that extend their unoccupied
locking nuts towards the water-bath. With this arrangement, up to 8 ports can be open at any
given time, allowing O2 to be distributed to up to 8 separate delivery devices (connection points

246
denoted by asterisks in Figure 2.3, Chapter 2) which at the same time are attached to the ‘Ar-’
and ‘NO-lines’. The devices are positioned on top of the stir-plate, within the water-bath whose
water is maintained at a constant temperature by an immersion thermostat (Item #5).
A.3 Operation instructions for the peripheral tubing system
A.3.1 Flow adjustment through the gas lines of the peripheral tubing system
Both ‘NO-‘ and ‘O2-line’ have mass flow controllers (Item #1 in Figure 2.3 in Chapter 2
and Table A.1) installed in-line, communicating through cable assemblies (Item #3) with the
control module (Item #2): the NO mass flow controller is plugged to ‘Channel 1’ of the module
and the controller for O2 to ‘Channel 2’. Switching the module between ‘Channel 1’ and
‘Channel 2’ and using the corresponding dials, allows the user to manually change the flow
through each controller from 0% to approximately 100% of its maximum flow capacity (500
sccm for the NO controller and 2000 sccm for the O2 controller; Table A.3). For every delivery
device planned to be supplied with NO, the digital reading on ‘Channel 1’ (representing percent
of maximum flow for the NO controller) needs to be increased by 20.0 units. For every device
supplied with O2 (also taking into account negative controls), the digital reading of ‘Channel 2’
(percent of maximum flow for the O2 controller) needs to be increased by 10.0 units. In the
hypothetical scenario of a single delivery device exposed to NO and O2, ‘Channel 1’ should have
a reading of “20.0” and ‘Channel 2’ a reading of “10.0”. In the full capacity scenario of 4
delivery devices supplied with NO, O2 and another 4 with Argon, O2 (negative controls), the
readings should be “80.0” for ‘Channel 1’ and “80.0” for ‘Channel 2’. Due to the absence of a
mass flow controller for the ‘Ar-line’, the Argon regulator (Item #9) needs to be opened until
minimal argon flow is achieved, either for exposure or purging purposes. Audible hissing

247
coming from the outlets of the ‘Ar-line’ is an indication that the current flow is excessively high
and that it should be decreased via the Argon regulator to a minimum.
A.3.2 Operation procedure of peripheral tubing system connected with delivery device(s)
Once the desired number of devices are prepared for exposure (equipped with tubing loop
pairs of specific lengths, subsequently autoclaved if used for cell culture exposure and then filled
with the fluid of interest), they are attached using the designated gas-inlet luer adapters (female
luers) on top of their caps to connect with the luer locks (male luers) extending from the
manifolds of the ‘NO-’, ‘Ar-’ and ‘O2-line’ (connection points denoted by asterisks in Figure 2.3
in Chapter 2). The connected devices are positioned on top of the operating magnetic stir-plate
(rotating speed set at 100 rpm) while being immersed in the water-bath. To efficiently isolate the
contents of the devices from the water filling the water-bath, and vice versa, each device is
inserted in a small clear (sandwich-style) plastic bag before being immersed into the
temperature-regulated water. Once the content in the devices reaches the desired temperature and
after making sure the “purging valve” (Points A and B in Figure 2.3, Chapter 2) is closed, in
other words, properly separating the two gas lines, the regulators on the gas cylinders are opened
(digital reading of both channels on the control module should be approximately zero before any
flow is engaged). Based on how many devices are connected, the manifolds are adjusted so that
gases are channeled only through lines of tubing that connect with a device; flow is restricted for
any line of tubing extending from the manifolds that is not engaged. The control module is
adjusted so that the digital read-out of each channel is consistent with how many devices are
connected (i.e., 20.0 units on ‘Channel 1’ per device supplied with NO, 10.0 units on ‘Channel 2’
per device supplied with O2). After flow from all gas lines has been initiated, small droplets of
leak detection solution are deposited on top of the gas-outlet luer adapters on each connected

248
delivery device to determine whether proper flow is achieved: formation of bubbles indicates
unobstructed gas flow through the tubing loops attached inside the devices and thus proper
operation of the delivery device. However, if no bubbles are formed after application of the leak
detection solution it may be possible that the flexible loops of Silastic tubing are chocked due to
a kink, twist or drop of liquid, blocking the normal flow of gas and that issue needs to be
remedied immediately. Finally, when testing the flow with the leak detection solution is
complete, the gas-outlet luer adapters are wiped dry to remove any residual solution that could
potentially enter and plug the tubing. As already mentioned, the entire system needs to be located
in a fume hood, such that none of the NO waste streams that escape the devices becomes a
hazard while the exposure is taking place.
After completion of the exposure, the procedure to shut the system down begins by
choking the regulators on NO and O2 cylinders (Items #10, 11 in Figure 2.3, Chapter 2) and
removing the devices from the water-bath, keeping any disengaged lines of tubing from
accidentally dipping in the bath’s water. Once flow from the ‘NO-’and ‘O2-line’ has fully
decreased, the “purging valve” (Points A and B in Figure 2.3, Chapter 2) is opened and the ‘Ar-
line’ manifold is blocked, such that the entire Argon flow is being redirected through the NO line
to purge the NO flow controller. After 10 minutes of purging, the regulator on the Argon
cylinder is chocked and when the flow finally diminishes the “purging valve” is reset to its
default closed position.
A.3.3 Safety with handling the NO gas
NO gas is toxic so all experiments should be performed in a certified fume hood and
personal protective equipment should be used to minimize contact with or inhalation of the

249
hazardous gas. Regular tests for leaks on connections and parts of the system that are outside the
fume hood (e.g. regulators, tanks) should take place during usage.

250
Appendix B
Parameters for the analysis of nucleobase deamination products
Table B.1. Chromatographic conditions for HPLC prepurification of hydrolyzed RNA and DNA
samples.
Solvent A 8 mM ammonium acetate. Solvent B acetonitrile. Instrument Agilent 1100.
Time (min) % solvent B Flow (mL/min)
hydrolyzed RNA
0 0 0.5
23 2 0.5
28 2 0.5
29 2.6 0.5
40 7 0.5
41 7 0.5
53 7 0.5
57 100 1
65 100 1
66 0 1
73 0 1
74 0 0.5
76 0 0.5
hydrolyzed DNA
0 1 0.5
45 3.5 0.5
50 6 0.5
55 8 0.5
60 8 0.5
61 100 1
67 100 1
68 1 1
75 1 1
76 1 0.5
78 1 0.5
Column temperature at 20 oC for hydrolyzed RNA and 32
oC for hydrolyzed DNA samples.

251
Table B.2. Isocratic chromatographic conditions employed for LC-MS/MS quantification of
RNA and DNA deamination products.
Solvent A 0.1 mM acetic acid. Solvent B acetonitrile. Instrument AB Sciex API 3000. Flow rate
maintained constant at 0.2 mL/min.
nucleoside % solvent B elution time (min) column temp. (oC)
rI 0.7 ~7.5 45
rX 1 ~18 30
rO 1 ~20 30
dI 3 ~8.5 25
dX 3 ~10.5 25
dO 3 ~15.5 25

252
Table B.3. Mass spectrometry parameters for LC-MS/MS quantification of deamination
products in hydrolyzed RNA and DNA samples.
Instument AB Sciex API 3000.
rI rX/rO dI dX/dO
Nebulizer gas (psi) 10 14 9 7
Curtain gas (l/min) 6 7 6 6
Collision gas (l/min) 12 9 9 9
Ion spray voltage (V) 3500 4250 5000 3500
Gas temperature (oC) 425 425 300 300
Declustering potential (V) 19 21 15 22
Focusing potential (V) 120 130 100 90
Entrance potential (V) 9 9 5 8
Collision energy (V) 13 13 15 14
Collision cell exit potential (V) 11 11 11 11
Transition Q1Q3 (m/z) 269137 285153 253137 269153

253
Table B.4. Chromatographic conditions employed for LC-MS/MS quantification of deamination
products in ribonucleosides.
Solvent A 0.1 mM acetic acid. Solvent B acetonitrile. Instrument Agilent 6410 QQQ).
Time (min) % solvent B Flow (mL/min)
rI
0 0 0.2
16 0 0.2
19 100 0.3
21 100 0.3
24 0 0.3
36 0 0.3
38 0 0.2
40 0 0.2
rX/rO
0 0 0.2
1 0 0.3
9 0 0.3
10 0 0.3
16 0 0.3
19 100 0.3
21 100 0.3
24 0 0.3
32 0 0.3
34 0 0.2
36 0 0.2
LC flow diverted to MS only during the 9-17 min window while quantifying rI, 14-25 min
window for rX/rO; column temperature maintained constant at 23 oC in every case.

254
Table B.5. Chromatographic conditions employed for LC-MS/MS quantification of deamination
products in 2-deoxyribonucleosides.
Solvent A 0.1 mM acetic acid. Solvent B acetonitrile. Instrument Agilent 6410 QQQ.
Time (min) % solvent B Flow (mL/min)
dI
0 0 0.2
1 0 0.3
8 0 0.3
9 0 0.2
16 0 0.2
19 100 0.3
21 100 0.3
24 0 0.3
36 0 0.3
38 0 0.2
40 0 0.2
dX
0 0 0.2
1 0 0.3
20 0 0.3
21 0 0.2
44 0 0.2
47 100 0.28
49 100 0.28
52 0 0.28
60 0 0.28
62 0 0.2
64 0 0.2
dO
0 0 0.2
1 0 0.3
23 0 0.3
24 0 0.2
36 0 0.2
39 100 0.3
41 100 0.3
44 0 0.3
52 0 0.3
54 0 0.2
56 0 0.2

255
Table B.6. Mass spectrometry parameters for LC-MS/MS quantification of deamination
products in nucleosides.
Instrument Agilent 6410 QQQ.
rI rX/rO dI dX/dO
Nebulizer gas (psi) 30 30 30 30
Gas flow (l/min) 10 10 10 10
Gas temperature (oC) 350 300 250 250
Capillary potential (V) 3900 3600 3900 3900
Fragmentor potential (V) 75 75 70 50
Collision energy (V) 25 4 0 0
Transition Q1Q3 (m/z) 269137 285153 253137 269153

256
Figure B.1. Composite chromatograms of ribonucleosides and 2-deoxyribonucleosides.
Resolution and elution times of (A) ribonucleosides and (B) 2-deoxyribonucleosides standards
during the HPLC pre-purification step. Instrument Agilent 1100. Absorbance at 260 nm.

257
Figure B.2. Experimental UV signature of oxanosine.

258
Figure B.3. HPLC resolution of nucleoside mixture derived from hydrolyzed total RNA.
Elution times of native nucleosides annotated in a typical chromatographic analysis of
hydrolyzed total RNA extracted from TK6 cells. Instrument Agilent 1100. Absorbance at 260
nm.

259
Appendix C
Parameters for the analysis of abasic sites in RNA
Table C.1. Chromatographic conditions employed for LC-MS/MS quantification of ARP-
derivatized AP sites in hydrolyzed RNA.
Solvent A 0.1 mM acetic acid. Solvent B acetonitrile. Instrument AB Sciex API 3000. Flow rate
maintained constant at 0.2 mL/min.
Time (min) % solvent B
0 1
10 20
15 40
16 100
25 100
26 1
40 1
LC flow initially diverted to waste and switched to the ion source 8 min after sample injection;
column temperature maintained constant at 23 oC in every case.

260
Table C.2. Mass spectrometer parameters for LC-MS/MS quantification of ARP-derivatized AP
sites in hydrolyzed RNA.
Instrument AB Sciex API 3000.
Nebulizer gas (psi) 10
Curtain gas (l/min) 8
Collision gas (l/min) 10
Ion spray voltage (V) 3000
Gas temperature (oC) 300
Declustering potential (V) 30
Focusing potential (V) 200
Entrance potential (V) 10
Collision energy (V) 30
Collision cell exit potential (V) 15
Transitions Q1Q3 (m/z) 464227
464332