Identifying and Localizing Intracellular Nanoparticles Using Raman Spectroscopy
41
Dublin Institute of Technology ARROW@DIT Articles Radiation and Environmental Science Centre 2012-01-01 Identifying and Localizing Intracellular Nanoparticles Using Raman Spectroscopy Jennifer Dorney Dublin Institute of Technology, [email protected] Franck Bonnier Dublin Institute of Technology, [email protected] Amaya Garcia Dublin Institute of Technology Alan Casey Dublin Institute of Technology, [email protected] Gordon Chambers Dublin Institute of Technology, [email protected] See next page for additional authors Follow this and additional works at: hp://arrow.dit.ie/radart Part of the Physics Commons is Article is brought to you for free and open access by the Radiation and Environmental Science Centre at ARROW@DIT. It has been accepted for inclusion in Articles by an authorized administrator of ARROW@DIT. For more information, please contact [email protected], [email protected]. is work is licensed under a Creative Commons Aribution- Noncommercial-Share Alike 3.0 License Recommended Citation Dorney, J., Bonnier, F., Garcia, A., Casey, A., Chambers, G., Byrne, H.: Identifying and Localizing Intracellular Nanoparticles Using Raman Spectroscopy. Analyst, 2012. DOI: 10.1039/C2AN15977E
Transcript of Identifying and Localizing Intracellular Nanoparticles Using Raman Spectroscopy

Dublin Institute of TechnologyARROW@DIT
Articles Radiation and Environmental Science Centre
2012-01-01
Identifying and Localizing IntracellularNanoparticles Using Raman SpectroscopyJennifer DorneyDublin Institute of Technology, [email protected]
Franck BonnierDublin Institute of Technology, [email protected]
Amaya GarciaDublin Institute of Technology
Alan CaseyDublin Institute of Technology, [email protected]
Gordon ChambersDublin Institute of Technology, [email protected]
See next page for additional authors
Follow this and additional works at: http://arrow.dit.ie/radartPart of the Physics Commons
This Article is brought to you for free and open access by the Radiation andEnvironmental Science Centre at ARROW@DIT. It has been accepted forinclusion in Articles by an authorized administrator of ARROW@DIT. Formore information, please contact [email protected],[email protected].
This work is licensed under a Creative Commons Attribution-Noncommercial-Share Alike 3.0 License
Recommended CitationDorney, J., Bonnier, F., Garcia, A., Casey, A., Chambers, G., Byrne, H.: Identifying and Localizing Intracellular Nanoparticles UsingRaman Spectroscopy. Analyst, 2012. DOI: 10.1039/C2AN15977E

AuthorsJennifer Dorney, Franck Bonnier, Amaya Garcia, Alan Casey, Gordon Chambers, and Hugh Byrne
This article is available at ARROW@DIT: http://arrow.dit.ie/radart/35

Identifying and localizing intracellular nanoparticles using Raman Spectroscopy:
Jennifer Dorney1,2, Franck Bonnier3*, Amaya Garcia3, Alan Casey1, Gordon Chambers1,2, Hugh J. Byrne1
1. Nanolab Research Centre, Focas Research Institute, Dublin Institute of Technology (DIT), Camden Row, Dublin 8, Ireland
2. School of Physics, Dublin Institute of Technology (DIT), Kevin Street,
Dublin 8, Ireland
3. Radiation and Environmental Science Centre, Dublin Institute of Technology (DIT), Camden Row, Dublin 8, Ireland
Abstract
Raman microscopy is employed to spectroscopically image biological cells previously exposed to fluorescently labelled polystyrene nanoparticles and, in combination with K-means clustering and Principal Component Analysis (PCA), is demonstrated to be capable of localising the nanoparticles and identifying the subcellular environment based on the molecular spectroscopic signatures. The neutral nanoparticles of 50 nm or 100 nm, as characterised by dynamic light scattering, are shown to be non-toxic to a human lung adenocarcinoma cell-line (A549), according to a range of cytotoxicity assays including Neutral Red, Alamar Blue, Coomassie Blue and (3-(4,5-Dimethylthiazol-2-yl)-2,5-diphenyltetrazolium bromide (MTT). Confocal fluorescence microscopy identifies intracellular fluorescence due to the nanoparticle exposure, but the fluorescence distribution is spatially diffuse, potentially due to detachment of the dye from the nanoparticles, and the technique fails to unambiguously identify the distribution of the nanoparticles within the cells. Raman spectroscopic mapping of the cells in combination with K-means cluster analysis is used to clearly identify and localise the polystyrene nanoparticles in exposed cells, based on their characteristic spectroscopic signatures. PCA identifies the local environment as rich in lipidic signatures which are associated with localisation of the nanoparticles in the endoplasmic reticulum. The importance of optimised cell growth conditions and fixation processes is highlighted. The preliminary study demonstrates the potential of the technique to unambiguously identify and locate nonfluorescent nanoparticles in cells and to probe not only the local environment but also changes to the cell metabolism which may be associated with cytotoxic responses.

Keywords: Nanopolystyrene; Nanoparticle Internalisation; Cytotoxicity; Confocal Fluorescence; Raman Spectroscopy; Live cell imaging; K-means Cluster Analysis; Principal Component Analysis
* Corresponding author. Tel.: +353 1 4027917; Fax: +353 1 4027904;
E-mail address: [email protected] (F. Bonnier)

1. Introduction
One of the major concerns regarding the possible toxic effects of nanoparticles is the
capacity of these materials to penetrate cells and possibly translocate to other cells around
the body. Conventional in vitro cytotoxicity assays, such as Alamar Blue, Neutral Red,
MTT, etc, provide indications of impact on cell proliferation, viability, metabolic activity,
lysosomal and mitochondrial activity. However, they fail to provide a verification of
nanoparticle internalisation or elucidate intracellular trafficking mechanisms and
subcellular distribution within cells. Indeed, false positive results have been demonstrated
due to the extracellular interaction of the nanoparticles with the cell culture medium in
vitro, and with the cytotoxic assays themselves.1, 2 The underlying principles of
internalisation and distribution of nanoparticles within cells and any associated toxicity to
humans are still relatively poorly understood. However, there are numerous studies that
have demonstrated the ability of nanoparticles to cross membranes and internalise within
many different cell types.3-5 In order to assess potential risks, but also benefits in terms of
nanomedicine, a greater understanding of migration of nanoparticles intra- and inter-
cellularly and essentially from one part of the body to another, along with information on
the translocation of nanoparticles within organelles, is urgently required.
Among the main challenges faced by nanotoxicologists are the detection and
identification of nanoparticles that have crossed the cell membrane and monitoring of
their intracellular trafficking. Imaging cells exposed to fluorescently labelled
nanoparticles using confocal fluorescence microscopy is one of the most common ways
in which to ensure nanoparticles can be tracked and monitored as they enter and localise
within cells.6-8 However, not all nanoparticles can be easily fluorescently labelled.

Furthermore, there have been reports that labelled nanoparticles can release the dye into
the surrounding biological environment, and so the distribution of fluorescence within the
cell does not necessarily represent the presence or subcellular distribution of the
nanoparticles.9-11 Furthermore, it is not clear that the transport mechanisms of smaller
nanoparticles, fluorescently labelled with anionic moieties, are the same as their
unlabelled counterparts. For example, it has been reported that extrinsic labelling of
bovine serum albumin (BSA) with fluorescein-5-isothiocyanate (FITC), in a ratio of 2:1,
changes its adsorption and diffusion properties.12 Transmission Electron Microscopy can
also be employed to visualise nanoparticles within cells, but significant sample
processing (fixing and ultramicrotoming) is required and only particles with sufficient
electronic contrast to the cellular environment can be visualised.13, 14 Thus, there is a
requirement for a sensitive technique to localise and identify nanoparticles internalised in
cells, ideally based on their chemical composition, rather than fluorescence labels or
electronic contrast. Identification of their local environment (e.g. endosomes, lysosomes,
mitochondria) could aid in elucidating their intracellular trafficking and interaction
mechanisms, and the resulting changes in cellular metabolism.
Raman spectroscopy has been proposed as a potential technique for in vitro screening of
the interaction of nanoparticles with cells.15 Raman is well established for chemically
fingerprinting materials, with applications in, for example, forensics and the
pharmacological industry.16-19 More recently, it has been explored for the analysis of
disease and, when coupled with multivariate statistical analysis, has shown high
sensitivity and specificity for diagnostic applications.20, 21 Raman microspectroscopy also
presents several advantages for the study of live cells, combining molecular analysis with

optical imaging. In comparison to infrared spectroscopic analysis, the weak contribution
from water offers the possibility to study the cells in an aqueous environment,
maintaining viability for the duration of the measurement.22 The specific information
contained in the Raman spectrum of the cells or subcellular compartments provides a
signature of the sample studied which can be related to molecular content or changes to
the physiology as a result of external stimuli.23-28 In confocal microscopic mode, the
spatial resolution is of the order of ≤1 µm, depending on source wavelength, providing
access to the subcellular organisation of the cells.29, 30 Thus, Raman spectroscopy
potentially offers a label free probe of nanoparticles within cells, which can potentially
analyse their local environment, and ultimately changes in the cellular metabolism which
can be correlated with cytotoxic responses31, oxidative stress, or inflammation. Kneipp et
al. have previously demonstrated the use of Surface Enhanced Raman Scattering from
gold nanoparticles and nanoaggregates to probe the environment of the subcellular
compartments through which they are trafficked.32 33 They have also demonstrated the
use of molecular labelled nanoparticles as more specific probes of the local
environment.34-36 However, the uptake rates and mechanisms as well as the subsequent
trafficking may be specific to the nanoparticle type, size and surface chemistry.
Furthermore, the molecular specificity of the surface enhancement process is not well
understood. Therefore, a truly label free method for monitoring and characterising the
cellular uptake and subcellular localisation of nanoparticles in general is still required.
In this study, Raman spectroscopy will be evaluated for the label free detection and
localisation of nanoparticles at the subcellular level. Polystyrene nanoparticles, labelled
for parallel fluorescence uptake studies, are employed. Common cytotoxic assays show

no observed effect over the concentration range studied. Confocal fluorescence
microscopy indicates internalisation of the fluorescent label within the cells, but the
spatially diffuse distribution does not allow unambiguous localisation of the
nanoparticles. It is demonstrated that, based on spectroscopic fingerprint of polystyrene,
Raman spectroscopy, coupled with routine multivariate analyses such as K-means
clustering, is a more specific probe to detect and localise the particles. Furthermore,
Principal Component Analysis can be employed to differentiate the local environment of
the nanoparticles from the cytoplasm.
The importance of optimised cell culture conditions and fixation procedures is
highlighted, but ultimately, this work suggests the potential of Raman spectroscopy not
only to detect and identify nanoparticles within the cellular environment, but also to
identify their subcellular environment and changes to the cellular metabolism which
underlie toxic responses.
2. Materials and methods
2.1 Nanoparticles
“Fluorescent Microsphere Suspensions” of 50 nm and 100 nm polystyrene beads were
purchased from Duke Scientific Corporation, (now Thermo Scientific USA
http://www.thermoscientific.com). Particle size measurements and zeta potential
measurements were carried out in the respective media (distilled water and cell culture
medium) as described in the Supplementary Information (S.1).
2.2. A549 Cell lines
A549 cells from a human lung adenocarcinoma with the alveolar type II phenotype were
obtained from ATTC (Manassas, VA, USA). Cells were cultured in DMEM-F12 (Lonza,
Wokingham, UK) supplemented with L-glutamine and 10% foetal calf serum (FCS,
Lonza, Wokingham, UK) in a humidified atmosphere containing 5% CO2 at 37 ºC.
2.3 Cytotoxicity assays
A range of colorimetric cytotoxicity assays were conducted to establish the effects of
exposure of the A549 cells to the nanoparticles and the details are provided in the
Supplementary Information (S.2).
2.4. Sample preparation for imaging
Approximately 40,000 cells were seeded onto either 35 mm uncoated glass bottom dishes
(MatTek Corporation, USA) for confocal imaging or CaF2 windows (Crystran Ltd., UK)
for Raman acquisitions. The cells were incubated in 10% FCS DMEM-F12 media at
370C for 24 hr before observation with confocal microscopy. Media was then removed
and samples were rinsed with sterile PBS and kept in 0.2 µm sterile filtered 0.9% NaCl
saline solution for imaging.
Samples for confocal fluorescence imaging were obtained by seeding cells on 35mm
uncoated glass bottom dishes (Mat Tek Corporation, USA) , as described above. Cells
were allowed to attach for approximately 4 hrs, after which 2mls of 10% FCS RPMI
media were added, containing 1x10¹² nanoparticles per ml of media. Exposure times
before imaging ranged from 4 hrs to 24 hrs.

For Raman analysis, A549 cells were seeded on CaF2 windows as described above and
allowed to attach for approximately 4 hrs, after which 2mls of 10% FCS RPMI media
were added, containing 1x10¹² nanoparticles per ml of media. Plates were left in an
incubator over night for 24 hrs. Media was then removed and samples were rinsed with
sterile PBS and kept in sterile 0.2 µm filtered 0.9% NaCl saline solution for imaging.
As the Raman mapping of single cells can take up to a few hours using a 785 nm laser
source, the cells were fixed using formalin. Thus, the stability of the sample compared to
live cells is greatly improved, allowing the collection of spectra precisely from the
selected area. After washing the CaF2 windows using PBS, the samples were immersed in
10% formalin for 10 mins for fixation. After fixation, the samples were washed thrice in
PBS to remove any trace of the fixative and kept in NaCl for measurement.
For comparison of cellular spectra to constituent biochemical components, five different
compounds were prepared for Raman spectroscopy analysis: Raman spectra were
recorded from lyophilised DeoxyriboNucleic Acid from calf thymus deposited on CaF2
substrates. Ribonucleic acid from baker's yeast (S. cerevisiae) was first suspended in
water and deposited onto CaF2 substrates for drying before recording. Sphingomyelin
from bovine brain and L-α-Phosphatidylcholine from egg yolk were first dispersed in
chloroform and then deposited onto CaF2 substrates and left to dry before spectral
acquisition. A few micro-litres of the nanoparticles suspension were deposited on a CaF2
and air dried before recording.
2.5. Confocal Fluorescence imaging of cells

In order to compare the cell morphologies, samples were imaged using the white light
mode of an inverted Zeiss LSM510 confocal laser scanning microscope (Carl Zeiss Inc.)
equipped with an x60 oil immersion objective. For nanoparticle exposed samples,
fluorescence images were captured at room temperature using an inverted Zeiss LSM510
confocal laser scanning microscope (Carl Zeiss Inc.). The excitation wavelength used
was 488 nm, set at 4% of laser power and the fluorescence emission was detected using a
505 nm long pass filter. Images were obtained with a 60x oil immersion objective.
2.6. Confocal Fluorescence imaging of cell organelles
The CellLight® reagent, purchased from Invitrogen, was employed to image the
subcellular components of the cells. It contains a baculovirus that, upon entry into
mammalian cells, directs the expression of autofluorescent proteins that are localized to
specific subcellular compartments and organelles via a signal peptide or protein fusions.
The protein associated with autofluorescence is an endoplasmic reticulum (ER) signal
sequence of calreticulin and KDEL (ER retention signal) fused to TagRFP (Red
fluorescent protein).
A549 lung cells were seeded at a density of 1x10⁵ cells/ml, in glass bottom Petri dishes
(MatTek Corporation, USA) in 10% FBS supplemented RPMI media and were incubated
at 37 °C in 5% CO2 for 4 hrs for cell attachment before exposure to nanopolystyrene
particles of concentration 1 x 10¹² particles per ml. Following the exposure period, the
cells were washed twice with pre-warmed PBS (37 °C). A pre determined amount of
CellLight® transduction solution was administered evenly to the Petri dishes. Cells were
then incubated at 37 °C in 5% CO2 for 24 hrs. The appropriate volume of CellLight®

reagent for the number of cells exposed was calculated according to the manufacture’s
guidelines.
Intracellular localisation of polystyrene nanoparticles was visualized at room temperature
under the laser scanning confocal microscope (LSM 510 Meta, Carl Zeiss Inc.) equipped
with Argon (488 nm) and HeNe (543 nm) lasers. Images were acquired by multitracking
(505-530 nm band pass filter to collect nanoparticles fluorescence and 560 nm long pass
filter for the cell organelle kit fluorescence) to avoid bleed through between the
fluorophores, and the statistical analysis was carried out using the LSM 510 software.
2.7. Raman spectroscopic measurements
A Horiba Jobin-Yvon LabRAM HR800 spectrometer with an external 300 mW 785 nm
diode laser as source was used throughout this work. For all measurements, a x100
immersion objective (LUMPlanF1, Olympus) was employed to reduce the spectral
background.37 The confocal hole was set at 100 m for all measurements, the specified
setting for confocal operation. The system was pre-calibrated to the 520.7 cm-1 spectral
line of silicon. The Labram system is a confocal spectrometer that contains two
interchangeable gratings (300 and 900 lines/mm respectively). In the following
experiments, the 300 lines/mm grating was used, which gave a spectral dispersion of
around ~1.5 cm-1 per pixel. The detector used was a 16-bit dynamic range Peltier cooled
CCD detector. Images of the sample were acquired using a video camera within the
system.
For Raman mapping, an area corresponding to the map to be acquired was defined
around the cells on the optical image provided by the instrument video camera. The step

between two successive measurements was set to 1.5 µm or 0.75 m 38 and the
backscattered Raman signal was integrated for 10 seconds over the spectral ranges from
400 to 1800 cm-1 and accumulated twice to enable an automatic software elimination of
any spurious peaks.
2.8. Data Analysis
The different data analysis steps were performed using Matlab (Mathworks, USA).
Before statistical analysis, a Savitsky-Golay filter (5th order, 7 points) was applied to
smooth the spectra and the reference spectrum constituting the background signal was
subtracted.
K-means clustering analysis was utilised for initial analysis of the spectral maps. It is one
of the simplest unsupervised learning algorithms used for spectral image analysis. It
groups the spectra according to their similarity, forming clusters, each one representing
regions of the image with identical molecular properties.39 The distribution of chemical
similarity can then be visualised across the sample image. The number of clusters (k) has
to be determined a priori by the operator before initiation of the classification of the data
set. K centroids are defined, ideally as far as possible from each other, and then each
point belonging to a data set is associated to the nearest centroid. When all the points
have been associated with a centroid, the initial grouping is done. The second step
consists of the calculation of new centroids as barycentres of the clusters resulting from
the previous step. A new grouping is implemented based on the same data points and the
new centroids. These operations are repeated until convergence is reached and there is no
further movement of the centroids. Finally, k clusters are determined, each containing the

most similar spectra from the image. From here, colours can be attributed to each cluster
and false colours maps can be constructed to visualise the organisation of the clusters in
the original image.
As K-means cluster analysis groups and represents similar spectra by their mean,
Principal component analysis (PCA) was employed to further analyse the grouped
spectra. PCA is a method of multivariate analysis broadly used with datasets of multiple
dimensions 40. It allows the reduction of the number of variables in a multidimensional
dataset, although it retains most of the variation within the dataset. The order of the PCs
denotes their importance to the dataset. PC1 describes the highest amount of variation,
PC2 the second greatest and so on. Therefore, var (PC1) ≥ var (PC2) ≥ var (PCp), where
var (PCi) represents the variance of PCi in the considered data set. Generally, the 3 first
components represent more than 90% of the variance. This statistical method was
preferred for this study to highlight the variability existing in the spectral data set
recording during the different experiments. The other advantage of this method is the
derivation of loadings which represent the variance for each variable (wavenumber) for a
given PC. Analysis of the loadings of a PC can give information about the source of the
variability inside a data set, derived from variations in the chemical components
contributing to the spectra.
3. Results and discussion
3.1 Particle Characterisation

Full details of the results of the physico-chemical characterisation of the nanoparticle
samples are provided in the Supplementary Information (S.1). In summary, the sizes of
the nominally 50 nm and 100 nm nanoparticle samples were found to be somewhat
dependent on the suspension medium and temperature, and the zeta potentials similarly
varied, potentially consistent with interactions of the nanoparticle surface with the
molecular components of the cell culture medium.2 Despite the variation in the exact
nanoparticle sizes, for the purpose of brevity, the nanoparticles will be referred to as
50nm and 100nm particles throughout the manuscript.
3.2 Cytotoxicity of particles.
For all assays employed, at all timepoints, no significant cytotoxicity was observed over
the concentration range employed for both 50 and 100 nm polystyrene nanoparticles (see
Supplementary Information S.2). The observations are consistent with previous reports of
exposure to neutral nanoparticles 41 and indicate that the labelling of the nanoparticles
with the fluorescent moiety does not impact significantly on the toxic response.
3.3 Confocal Fluorescence Microscopy
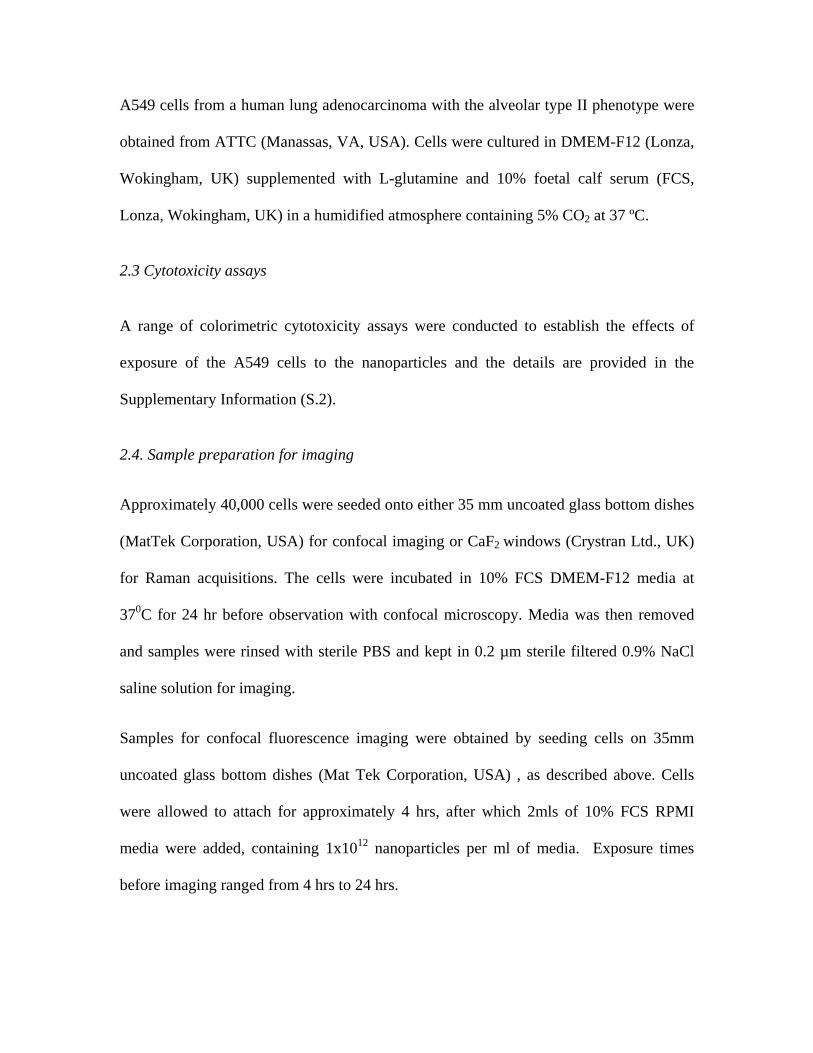
Figure 1 shows a confocal fluorescence and white light microscopic image of A549 cells
after exposure to 50 nm fluorescently labelled polystyrene nanoparticles for a time of 24
hrs at a dose of 1x10¹² particles per ml of media. The images are typical of a range of
doses and timepoints for both nanoparticle sizes. The fluorescence is observed to be
spatially diffuse throughout the subcellular environment, and no specific subcellular
localization of nanoparticles is inferred.
The observations are not consistent with the increasingly accepted mechanisms of
particle uptake by endocytosis and trafficking of nanoparticles through endosomes to
lysosomes.14, 42 Such a diffuse distribution of fluorescence in cells exposed to labelled
nanoparticles has recently been reported, however, and the phenomenon has been
attributed to the uptake of labile fluorescent moieties, which become detached from the
nanoparticles in the culture medium and are internalized in the cellular environment by
passive molecular diffusion. Thus, the spatial distribution of the fluorescence profile does
not reflect the subcellular9 distribution of the nanoparticles in the cells. The work of
Salvati et al.9 highlights the importance of a complete screening of the nanoparticles
employed for such studies in order to confirm the stability of the labeled nanoparticle and
thus the validity of such fluorescent imaging procedures. For the purpose of this work,
however, the observations of figure 1 highlight the importance of an independent
technique to verify and profile the spatial distribution of nanoparticles in cells.
Fluorescence microscopy identifies the distribution of the label, but notably is not
chemically specific, and so is ineffective in independently and unambiguously locating
the distribution of polystyrene.
Figure 1: A549 cells exposed to 50 nm polystyrene nanoparticles x20 magnification after 24 hour exposure.

3.4 Raman Spectroscopy
The literature contains many examples of works based on cell analysis using Raman
spectroscopy43-46. In general, however, many problems arise due to substrate
contributions, spectral background and poor signal to noise. Sampling in a confocal mode
can minimize contributes due to substrates, and the use of substrates, such as CaF2, which
have minimal contribution to the Raman spectra in the region of interest, improves
matters further. In tissue samples, it has been demonstrated that working in immersion
significantly reduces the spectral background37, and for the case of cell cultures on
collagen gels, measured in immersion, the background has been shown to be reduced to
that of the surrounding water 47.
Although progress has been made in the measurement techniques, little attention has been
paid to the quality of the cellular samples. The aim of this work is to detect and localize
nanoparticles within the cytoplasm of the cells without the use of a specific label. In order
to achieve this goal, it is crucial to first optimise the sample preparation techniques to
reduce as much as possible variations related to the cell handling. A full description of
the optimization of the cell culturing and fixation process is provided in the
Supplementary Information (S.3).
As the fixation process was shown to have negligible effect on the Raman spectra, A549
cells exposed to 100 nm polystyrene nanoparticles at a concentration of 1x10¹²
nanoparticles per ml of media for a period of 24 hrs were formalin fixed in CaF2
substrates and were mapped for their Raman spectral profile.

The two main factors influencing the time needed to map a full cell are the step size and
the acquisition time. Using a 785 nm laser as source, a 10 s acquisition gives a signal to
noise ratio more than acceptable for the identification of the different spectral features
present.22, 38 However, two accumulations are required by the software to remove any
spurious spikes in the spectra recorded, and thus the total acquisition time per spectrum
was 20 s (2x10 s). A mild smoothing was applied to further improve the spectral quality,
as described in Section 2.8. The instrument software allows the selection of customised
areas for mapping, as presented in figure 2A, considerably reducing the measurement
time, and a step size of 1.5 m has been used in order not to exceed ~4 hrs per cell, a
timescale which is most feasible for maintaining sample integrity and stable conditions
for spectral mapping. After completion of the spectral recording, the map was exported to
Matlab for analysis using K-means clustering. For cells exposed to nanopolysterene, it is
expected that the K-means clustering will be able to localise the nanoparticles within the
cellular environment.
Using a 100x objective, the visible image obtained from the cells is rather detailed
(Figure 2A). The nucleus is clearly identifiable and the nucleoli can also be seen. The
membrane of the cells is well defined and the cytoplasm presents different structures and
the region containing the endoplasmic reticulum can be easily recognised. Figure 2B
presents the results obtained using 10 different groups for the K-means cluster analysis.
Increasing the number of groups to 10 allows consideration of the variability existing in
the spectra recorded from the edge of the cells which have a lower intensity and therefore
a weaker signal to noise ratio. A cluster has been formed corresponding to the nuclear

area (cluster 1) but the analysis does not discriminate between the nucleus and nucleoli.
Similarly, distinct clusters are assigned to the cytoplasm and membrane.
Figure 2: Top; (A) Microscopic image of an A549 cell, showing the area identified for spectral mapping. (B) K-means cluster map of the Raman profile of the same cell. Bottom; Raman spectra of (C) cytoplasm, (D) cytoplasm showing the contribution of spectral features of (F) polystyrene nanoparticles. Grey shading is a guide to identification of characteristic Raman features of polystyrene. Spectra are offset for clarity
Notably, however, none of the 10 clusters identified by the analysis exhibits clear
signatures which can be associated with polystyrene (figure 2 bottom). It is expected that
the nanoparticles will be predominantly localised within the cytoplasmic region, but there
is no evidence of specific polystyrene peaks in the spectrum of the cytoplasm (Figure

2C). Although it overlaps with the strong and sharp phenyl group of aromatic amino
acids in cells, the best indicator of the presence of nanopolysterene in the spectra
recorded remains the intensity of the strong 1004 cm-1 peak. Based on this observation, it
has been possible to manually screen the map and identify the presence of these features
in individual Raman spectra (figure 2D). The manually identified polystyrene spectra are,
however, sparsely located throughout the cell, a strong indication that the fluorescence
map of figure 1 is not representative of the distribution of polystyrene nanoparticles
within the cell. Although Raman spectroscopy can detect the presence of nanoparticles in
the cells, the K-means clustering analysis does not group their signature as a spatially
defined cluster.
The use of a 100x objective provides maximum lateral resolution and helps to obtain
visible images which detail the cell morphology. However, the focal depth is minimised
and, in an automated map, it is difficult to optimise acquisition conditions over the spatial
extent of the cell. The visible image in figure 2A highlights this phenomenon, as,
although the focus is optimised for the nucleus, the edge of the cell remains blurry. This
difference is enough to create a loss in the Raman intensity when recording spectra on the
outer parts of the cells, reducing considerably the signal to noise ratio. For this reason, the
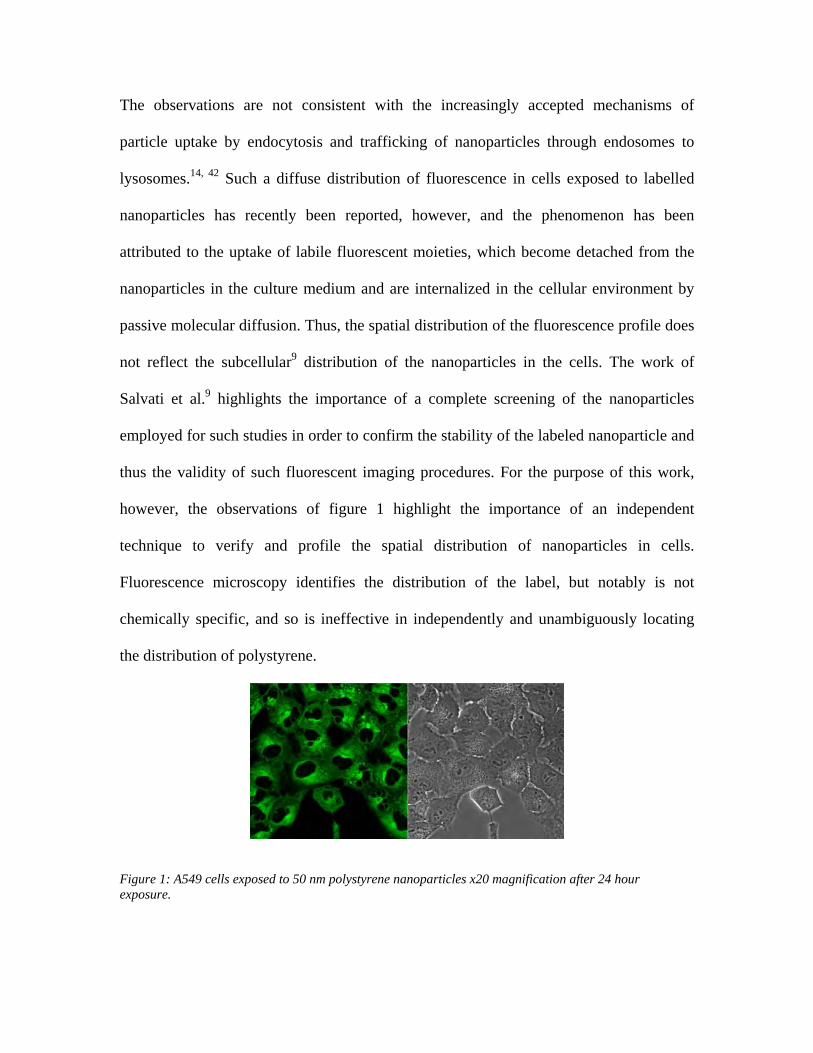
area selected for spectral mapping was reduced, as indicated in figure 3 IA. Moreover,
scanning a smaller area allows a decrease of the lateral step size to 0.75 m without
increasing the overall acquisition time. Thus, the definition of the map recorded is
improved and a more precise localisation of the nanopolysterene can be achieved.
Figure 3: I; (A) Microscopic image of an A549 cell, showing the reduced area identified for spectral mapping. (B) K-means cluster map of the Raman profile of the same reduced area. II; K-means spectra of clusters 3 (A – representing nucleoli), 6 (B – representing nucleus), 1 and 4 (C and D, both from the cytoplasm). Spectra are offset for clarity. III; K-means spectrum of Cluster 5 (A), compared to the Raman spectrum polystyrene nanoparticles (B). Spectra are offset for clarity
Under these conditions, the K-means clustering analysis run using 10 groups yields more
specific clusters, as shown in figure 3 IB. The nucleoli spectra form a specific group
(cluster 3), distinct from the nucleus (cluster 6). The corresponding mean spectra are
displayed in figure 3 II. The cytoplasm is represented by a number of different clusters
(1, 2, 4, 8, 9, 10). Notably, nanopolysterene can now be localised in the cytoplasm
according to cluster 5, the corresponding mean spectrum of which is presented in figure 3
IIIA. Although some cellular features clearly contribute to the cluster spectrum, it is
dominated by specific features originating from polystyrene. Notably, in comparison to
figure 1, figure 3 IB gives a map of the distribution of the fingerprint of the molecular
structure of polystyrene, rather than the fluorescent label.
K-means cluster analysis yields the average spectra for the identified clusters. These
average spectra can contain contributions from points on the boundaries between the
cellular regions and a direct comparison does not always easily facilitate identification of
the differences in the biochemical composition. Cluster 5 clearly identifies the presence
of polystyrene nanoparticles localised in the cytoplasm, but the averaged spectrum also
exhibits clear contributions of the biological environment. PCA can be employed to
highlight the biochemical differences between the subcellular regions.48 In figure 3 IB,
cluster 5 is predominantly surrounded by cytoplasmic regions grouped within cluster 1.

Figure 4: Top; Scatter plot of the PCA of spectra associated with clusters 1 (Blue) and 5 (Green). Bottom; (A) Loading of PC1 (B) Raman Spectrum of polystyrene nanoparticles (C) of L--Phosphatidylcholine, (D) of Sphingomyelin, (E) of DNA and (F) of RNA.
Figure 4 (top) is a scatter plot of the PCA of spectra associated with K-means clusters 1
and 5. For visualisation purposes, spectra associated with cluster 1 are coloured blue,
while those from cluster 5 are coloured green, and although the data is rather dispersed,
some differentiation between the two clusters according to PC1 is apparent. PC1 accounts

for 61% of the variance and, as shown in the loadings plot of figure 4 (bottom), it is
dominated by positive contributions of polystyrene (figure 4 B). Notably, the negative
contributions of PC1 match well with the Raman features of lipids such as L-α-
Phosphatidylcholine (figure 4 C) and also sphingomyelin (figure 4 D). For comparison,
the Raman spectra of DNA (figure 4 E) and RNA (figure 4 F) are also shown, and it is
clear that they exhibit few or no similarities with PC1. High loadings of PC1 for cluster 5
are therefore an indication of the dominance of polystyrene. Positive loadings of PC1 for
some of Cluster 1 may indicate regions of overlap between the localised nanoparticles
and the surrounding cytoplasm, which, although they have significant polystyrene
contributions, are represented in the K-means cluster analysis by the average spectrum of
cluster 1.
An established mechanism for the transport of nanoparticles in cells is via endosomes and
later lysosomes.42 A number of studies have also demonstrated that, in the later stages of
trafficking, individually endocytosed nanoparticles accumulate in larger multivescular
bodies 33 and they have also been seen to be localized in the endoplasmic reticulum and
Gogli apparatus.49 Notably, in figure 3 IA, the majority of the nanoparticles, identified in
green as cluster 5, are surrounded by cytoplasmic regions of cluster 1, which is relatively
spatially extensive, particularly compared to typical sizes of lysosomes (1-2m). In the
white light image of figure 3 IB, this region can be identified as the ER, which may be
expected to be rich in lipidic compounds, and a PCA of the different regions of the
cytoplasm, as shown in the scatter plot of figure 5 (top) and the corresponding loadings of
figure 5 (bottom), confirms this. Cluster 4, on the other hand is relatively rich in nucleic
acids, which may be due to the presence of mitochondria.

Figure 5: Top; Scatter plot of the PCA of spectra associated with clusters 1 (red) and 4 (blue). Bottom; (A) Raman Spectrum of RNA (B) Raman Spectrum of DNA (C) Loading of PC1, (D) Raman spectrum of Sphingomyelin, (E) Raman spectrum of L--Phosphatidylcholine.
Figure 6 shows an image of A549 cells exposed for 24 hrs to 50 nm fluorescently labelled
polystyrene nanoparticles, also stained for ER, as described in section 2.6. Although, as
outlined in relation to Figure 1, the fluorescence distribution is diffuse and therefore not
exclusively attributable to the presence of nanoparticles within the cell, the confocal
image indicates a strong correlation between the ER stain and the fluorescence of the
nanoparticle label, and any locally concentrated fluorescence which may be indicative of
encapsulated nanoparticles is contained within the ER, clearly visible in the white light

image of figure 6B. The analysis supports the attribution of the subcellular environment
of K-means cluster 1 as endoplasmic reticulum.
Figure 6: Confocal microscopic images obtained of 50 nm polystyrene nanoparticles within A549 cells that have also been treated with CellLight® Endoplasmic Reticulum staining kit. (A) Confocal image showing the fluorescence of the particles only, using the 505-530 nm band pass filter. (B) Optical image of the cell showing no fluorescence. (C) Confocal image of the fluorescent endoplasmic reticulum of the cell following transduction with the CellLight® kit using the 560 nm long pass filter and (D) Image of fluorescence overlap of both the 50 nm particles and the fluorescently transduced ER. The fluorescence overlap is shown in a yellow-orange colour.
4. Discussion
The work presented here represents an initial proof of concept, to demonstrate the
potential use of Raman spectroscopy to identify and locate nanoparticles in cells and to
probe their subcellular environment. No attempt has, as yet, been made to quantify the
amount of nanoparticles located or the sensitivity and detection limit of the technique.

Instrumentally, the spatial resolution can be improved by moving to lower wavelength
sources, although the excitation of any fluorescence from the nanoparticles and the cell
constituents should be avoided. However, as it scales linearly with wavelength, a move
from 785 nm to 473 nm should result in an improvement in lateral resolution by a factor
of ~1.7. Ultimately, the confocal mode of operation can provide 3D localisation of the
nanoparticles at submicron resolution.
Fixed cells were employed in this work to facilitate prolonged mapping. However, the
technique can be applied to live cells38, and the identification of a characteristic spectral
marker for the nanoparticles or a cell metabolite could ultimately facilitate real time
monitoring. The subcellular environment of the cell is complex, and differentiation of the
subcellular environments based on characteristic Raman spectra is best facilitated using
multivariate statistics, two examples of which are illustrated here. A range of other data
mining techniques are available, however, which could improve the molecular sensitivity
of the technique.
It is notable that the initial attempts to locate the nanoparticles within the cell, using a 1.5
m step size over the whole cell area proved inconclusive. The mapping conditions also
failed to identify the nucleoli within the nucleus, however. In the automated mapping
protocol, no adjustment of the focussing conditions was performed, and, using the x100
objective in a confocal geometry, the focussing conditions, optimised in the region of the
nucleus, are less well optimised over the extent of the whole cell. Therefore, the
variability of spectra from the outer part of the cell is significantly higher than the
variability which should differentiate the spectra containing polysterene from those
containing only cellular features. An increase of the number of clusters resulted only in

the creation of more clusters in the membrane region of the cells. Restricting the mapping
to the centre part of the cells provides a more consistent signal without adjustment of the
focus. In this case, both K-means clustering and PCA differentiate regions with clear
contributions of polystyrene to the spectra. Improved automated mapping protocols
which include auto-focusing could improve the routine application of the technique.
Polystyrene nanoparticles are emerging as potential standards for nanotoxicity, notably in
their aminated form. The aromatic styrene unit is a relatively strong Raman scatterer, and
thus they are particularly suitable for Raman mapping. The example of fluorescently
labelled nanoparticles which potentially lose the label, with the result that fluorescence
microscopy does not unambiguously identify the nanoparticles within the cells, highlights
the potential of the technique as a label free probe applicable to a broad range of
nanoparticles. To demonstrate the universality of the technique, the study will be
extended in the future to a broader range of both organic and inorganic nanoparticles.
5. Conclusion
This study demonstrates the ability of Raman microspectroscopy to localise nanoparticles
in the subcellular environment, based on their chemical structure. The measurements also
indicate that the technique can be employed to identify the subcellular environment.
Raman has previously been employed to monitor changes in the metabolism of cells,
particularly due to external agents, and thus this label free, non invasive tool can
potentially simultaneously, locate and identify nanoparticles, probe their local

environment and ultimately changes to the metabolism of the cell due to cell-nanoparticle
interactions.
Acknowledgements
This research was supported by the Integrated NanoScience Platform, Ireland, and the
National Biophotonics and Imaging Platform (NBIP) Ireland, both funded under the
Higher Education Authority PRTLI (Programme for Research in Third Level Institutions)
Cycle 4, co-funded by the Irish Government and the European Union Structural fund.

References
1. Berntsen P, Park CY, Rothen-Rutishauser B, Tsuda A, Sager TM, Molina RM, Donaghey TC, Alencar AM, Kasahara DI, Ericsson T, Millet EJ, Swenson J, Tschumperlin DJ, Butler JP, Brain JD, Fredberg JJ, Gehr P, Zhou EH, Journal of The Royal Society Interface, 2010, 7, S331-S340. 2. Lundqvist M, Stigler J, Elia G, Lynch I, Cedervall T, Dawson KA, Proceedings of the National Academy of Sciences, 2008, 105, 14265-14270. 3. Clift MJD, Rothen-Rutishauser B, Brown DM, Duffin R, Donaldson K, Proudfoot L, Guy K, Stone V, Toxicology and Applied Pharmacology, 2008, 232, 418-427. 4. Rejman J, Oberle V, Zuhorn IS, Hoekstra D, Biochem. J., 2004, 377, 159-169.
5. Rothen-Rutishauser B, Muhlfeld C, Blank F, Musso C, Gehr P, Particle and Fibre Toxicology, 2007, 4, 9. 6. Naha PC, Bhattacharya K, Tenuta T, Dawson KA, Lynch I, Gracia A, Lyng FM, Byrne HJ, Toxicology Letters, 2010, 198, 134-143. 7. Roy I, Ohulchanskyy TY, Bharali DJ, Pudavar HE, Mistretta RA, Kaur N, Prasad PN, Proceedings of the National Academy of Sciences of the United States of America, 2005, 102, 279-284. 8. Cang H, Xu CS, Montiel D, Yang H, Opt. Lett., 2007, 32, 2729-2731.
9. Salvati A, Aberg C, Dos Santos T, Varela J, Pinto P, Lynch I, Dawson KA, Nanomedicine, 2011, 7, 818-826. 10. Suh H, Jeong B, Liu F, Kim SW, Pharmaceutical Research, 1998, 15, 1495-1498.
11. Yin Win K, Feng S-S, Biomaterials, 2005, 26, 2713-2722.
12. Gajraj A, Ofoli RY, Langmuir, 2000, 16, 8085-8094.
13. Davoren M, Herzog E, Casey A, Cottineau B, Chambers G, Byrne HJ, Lyng FM, Toxicology in Vitro, 2007, 21, 438-448. 14. Shapero K, Fenaroli F, Lynch I, Cottell DC, Salvati A, Dawson KA, Molecular BioSystems, 2011, 7, 371-378. 15. Bouwmeester H, Lynch I, Marvin HJ, Dawson KA, Berges M, Braguer D, Byrne HJ, Casey A, Chambers G, Clift MJ, Elia G, Fernandes TF, Fjellsbo LB, Hatto P, Juillerat L, Klein C, Kreyling WG, Nickel C, Riediker M, Stone V, Nanotoxicology, 2011, 5, 1-11. 16. Hodges CM, Akhavan J, Spectrochimica Acta Part A: Molecular Spectroscopy, 1990, 46, 303-307. 17. Kneipp K, Kneipp H, Itzkan I, Dasari RR, Feld MS, Chemical Reviews, 1999, 99, 2957-2976. 18. Vankeirsbilck T, Vercauteren A, Baeyens W, Van der Weken G, Verpoort F, Vergote G, Remon JP, TrAC Trends in Analytical Chemistry, 2002, 21, 869-877. 19. Wilson AS, Edwards HGM, Farwell DW, Janaway RC, Journal of Raman Spectroscopy, 1999, 30, 367-373. 20. Lyng FM, Faoláin EÓ, Conroy J, Meade AD, Knief P, Duffy B, Hunter MB, Byrne JM, Kelehan P, Byrne HJ, Experimental and Molecular Pathology, 2007, 82, 121-129.

21. Byrne HJ, Sockalingum GD, Stone N.in Biomedical Applications of Synchrotron Infrared Microspectroscopy: A Practical Approach, David M, RSC Analytical Spectroscopy Monographs 2011,11, 105-143 22. Draux F, Jeannesson P, Beljebbar A, Tfayli A, Fourre N, Manfait M, Sule-Suso J, Sockalingum GD, Analyst, 2009, 134, 542-548. 23. Mariani MM, Day PJ, Deckert V, Integr Biol (Camb), 2010, 2, 94-101.
24. Matthaus C, Chernenko T, Newmark JA, Warner CM, Diem M, Biophys J, 2007, 93, 668-673. 25. Meister K, Schmidt DA, Brundermann E, Havenith M, Analyst, 2010, 135, 1370-1374.
26. Notingher I, Hench LL, Expert Rev Med Devices, 2006, 3, 215-234.
27. Notingher I, Verrier S, Haque S, Polak JM, Hench LL, Biopolymers, 2003, 72, 230-240.
28. Yu C, Gestl E, Eckert K, Allara D, Irudayaraj J, Cancer Detect Prev, 2006, 30, 515-522.
29. Puppels GJ, de Mul FF, Otto C, Greve J, Robert-Nicoud M, Arndt-Jovin DJ, Jovin TM, Nature, 1990, 347, 301-303. 30. Puppels GJ, Garritsen HS, Segers-Nolten GM, de Mul FF, Greve J, Biophys J, 1991, 60, 1046-1056. 31. Knief P, Clarke C, Herzog E, Davoren M, Lyng FM, Meade AD, Byrne HJ, Analyst, 2009, 134, 1182-1191. 32. Kneipp K, Haka AS, Kneipp H, Badizadegan K, Yoshizawa N, Boone C, Shafer-Peltier KE, Motz JT, Dasari RR, Feld MS, Appl. Spectrosc., 2002, 56, 150-154. 33. Kneipp J, Kneipp H, McLaughlin M, Brown D, Kneipp K, Nano Letters, 2006, 6, 2225-2231. 34. Kneipp J, Kneipp H, Rajadurai A, Redmond RW, Kneipp K, Journal of Raman Spectroscopy, 2009, 40, 1-5. 35. Kneipp J, Kneipp H, Rice WL, Kneipp K, Analytical Chemistry, 2005, 77, 2381-2385.
36. Kneipp J, Kneipp H, Wittig B, Kneipp K, The Journal of Physical Chemistry C, 2010, 114, 7421-7426. 37. Bonnier F, Mehmood A, Knief P, Meade AD, Hornebeck W, Lambkin H, Flynn K, McDonagh V, Healy C, Lee TC, Lyng FM, Byrne HJ, Journal of Raman Spectroscopy, 2011, 42, 888-896. 38. Bonnier F, Knief P, Lim B, Meade AD, Dorney J, Bhattacharya K, Lyng FM, Byrne HJ, Analyst, 2010, 135, 3169-3177. 39. MacQueen JB.in Proceedings of 5-th Berkeley Symposium on Mathematical Statistics and Probability, Berkeley, University of California Press, 1967,1, 281-297 40. Varmuza K. 2009. Introduction to multivariate statistical analysis in chemometrics. New york: CRC Press. 41. Ryman-Rasmussen JP, Riviere JE, Monteiro-Riviere NA, J Invest Dermatol, 2006, 127, 143-153. 42. Nel AE, Madler L, Velegol D, Xia T, Hoek EMV, Somasundaran P, Klaessig F, Castranova V, Thompson M, Nat Mater, 2009, 8, 543-557. 43. Draux F, Gobinet C, Sule-Suso J, Trussardi A, Manfait M, Jeannesson P, Sockalingum GD, Anal Bioanal Chem, 2010, 397, 2727-2737. 44. Mariani MM, Lampen P, Popp J, Wood BR, Deckert V, Analyst, 2009, 134, 1154-1161.
45. Miljkovic M, Chernenko T, Romeo MJ, Bird B, Matthaus C, Diem M, Analyst, 2010, 135, 2002-2013.

46. Nawaz H, Bonnier F, Knief P, Howe O, Lyng FM, Meade AD, Byrne HJ, Analyst, 2010, 135, 3070-3076. 47. Bonnier F, Meade AD, Merzha S, Knief P, Bhattacharya K, Lyng FM, Byrne HJ, Analyst, 2010, 135, 1697-1703. 48. Bonnier F, Byrne HJ, Analyst, 2012, 137, 322-332.
49. Chang MY, Shiau AL, Chen YH, Chang CJ, Chen HH, Wu CL, Cancer Sci, 2008, 99, 1479-1484.
Identifying and localizing intracellular nanoparticles using Raman Spectroscopy:
Jennifer Dorney1,2, Franck Bonnier3*, Amaya Garcia3, Alan Casey1, Gordon Chambers1,2, Hugh J. Byrne1
1. Nanolab Research Centre, Focas Research Institute, Dublin Institute of Technology (DIT), Camden Row, Dublin 8, Ireland
2. School of Physics, Dublin Institute of Technology (DIT), Kevin Street,
Dublin 8, Ireland
3. Radiation and Environmental Science Centre, Dublin Institute of Technology (DIT), Camden Row, Dublin 8, Ireland
Supplementary Information
S.1 Physico Chemical Characterisation of the Nanoparticles
Physico-chemical characterization of the particles was performed by dynamic light
scattering using a Malvern Zetasizer ZS. A HeNe laser with a wavelength of 633nm and
an avalanche photodiode detector, Q.E. >50% at 633nm at 173° (backscatter detection)
was used. Particle size measurements and zeta potential measurements were carried out
in the respective biological media at a concentration of 1x10¹² particles per ml at 37° C.
The number of particles per ml of suspension may be determined from the following
equation, as specified by the supplier:
Number of particles/ ml = 6C x 1012
ρ x π x Φ
where: C = Concentration of suspended beads in g/ml
ρ = Density of polymer in g/ml
Φ = Diameter of suspended particles in µm.

The size and zeta potential of both the nominally 50 nm and 100 nm sized particles
differed slightly according to the medium in which they were suspended, when measured
by dynamic light scattering. Nominally 50 nm particles were found to have an average
particle size in H2O at 25°C and 37°C of 52 nm and 53 nm, respectively, while 50 nm
particles in 10% FBS RPMI media at 25°C and 37°C were determined to have particle
sizes of 49 nm and 38 nm respectively. The average particle sizes for the 100 nm samples
in H2O at 25°C and 37°C were found to be 169 nm and 138 nm respectively, while
average particle sizes for 100 nm samples measured in medium at 25°C and 37°C were
found to be 149 nm and 116 nm respectively. Zeta potential measurements of the 50nm
samples revealed that particles dispersed in H2O at 25°C and 37°C were found to be -62
mV and -53 mV respectively, and in media at 25°C and 37°C to be -13 mV and -12 mV
indicating that the solution was moderately stable at the temperatures measured. 100 nm
particles were found to have zeta potential values, in H2O at 25°C and 37°C, of -18.62
mV and -15.09 mV respectively. Similarly, zeta potential measurements of 100 nm
particles in H2O at 25°C and 37°C were found to have values of -42.32 mV and -38.27
mV respectively, also indicating the solution was moderately stable at both temperatures.
Changes in zeta potential between H2O and cell culture medium are well documented and
are proposed to result from the interaction of the nanoparticle surface with the molecular
components of the cell culture medium 1. Despite the uncertainty in the exact
nanoparticle sizes, for the purpose of brevity, the nanoparticles will be referred to as
50nm and 100nm particles throughout the manuscript.
S.2 Cytotoxicity assays
The cytotoxicity assays employed during this experiment were Alamar Blue™ (AB),
Neutral Red (NR), Coomassie Blue (CB) and 3-(4,5-dimethylthiazol-2-yl)-2,5-
diphenyltetrazolium bromide (MTT). For cytotoxicity evaluation, cells were seeded in
96-well micro plates (Nunc, Denmark) in triplicate for each of the four time points
studied 24, 48, 72, 96 hr. Plates were seeded at a density of 1.5 x 10⁵ cells/ml for 24 hr, 5
x 104 cells/ml for 48 hr, 3 x 10⁴ cells/ml for 72 hr and 2 x 10⁴ cells/ml for 96 hr exposure.
These densities were found to be optimal to achieve the desired confluence at the end of
the exposure period. After an initial 24 hr of cell attachment, the media was removed and
the plates were washed with 100 μl/well phosphate buffered saline (PBS). Cells were
then treated with increasing concentrations of each nanomaterial and with a positive
control of a 10% DMSO 90% media solution. The cells were then incubated for the
desired time period and the cytotoxic effects evaluated. For each independent experiment,
six replicate wells were used for control, six replicate wells were employed for the
positive control and six replicate wells were used for each test concentration per micro
plate. For cytotoxicity evaluation, fluorescence and absorbance were all quantified using
a microplate reader (TECAN GENios, Grodig, Austria). Further details for each of the
assays performed can be found in 2.
For all assays employed, at all timepoints, no significant cytotoxicity was observed over
the concentration range employed for both 50 and 100 nm polystyrene nanoparticles. As
an example, Figure S.1 shows the MTT response to exposure of 50 nm polystyrene
nanoparticles. The observations are consistent with previous reports of exposure to

neutral nanoparticles 3 and indicate that the labelling of the nanoparticles with the
fluorescent moiety does not impact significantly on the toxic response.
Figure S.1: Cytotoxicity of 50 nm Duke Scientific Nanopolystyrene after 24, 48, 72 and 96 hour exposures determined by the MTT assay. Data are expressed as percent of control mean ± SD of three independent experiments.
S.3 Sample preparation and cell morphology
When working with A549 cells, the first observation made was the inconsistency of the
cell morphology while preparing the samples. The cells were seeded on CaF2 substrates,
left overnight in the incubator and used for Raman analysis the next day for both live cell
and fixed cell analysis. The protocols used were standard, but still the cells could exhibit
particular characteristics and “stressed” samples seemed to be regularly observed. The
main characteristic of these cells was the presence of microscopic “droplets” (~1-5 m)
in the cytoplasm. Their number was seen to vary considerably from sample to sample and
thus the ability to resolve different structures present in the cytoplasm varied

significantly. This phenomenon is independent of the cell fixation using formalin as the
features can be seen in both live cells (figure S2.A) and fixed cells (figure S2.B). The
droplets are observed to exhibit consistent Raman spectra which vary little in fixed
(figure S2.D) compared to live cells (figure S2.C), and comparison with spectra of
common lipids such as phosphatydylinositol (figure S2.E) and phosphatydyl-L-serine
(figure S2.E) confirms that they are lipidic in structure, an obvious candidate being
peroxisomes. Regardless of their origin, the main concern was the strong Raman
scattering of these droplets and therefore the probable interference with the detection of
nanoparticles in the cells. It was therefore deemed imperative to optimize the protocols
for the cell sample preparation and to reproducibly obtain cells with similar
morphologies.

Figure S2: Microscopic images of live (A) and formaline fixed (B) A549 cells with “stressed” morphologies. Raman Spectra of droplets in (C) live cells (D) fixed cells compared to (E) phosphatidylinositol and (F) Phosphatidyl-L-serine. Spectra are offset for clarity
Different parameters have to be taken into consideration during the cell culture and the
preparation of the samples. The cells are commonly split when they have reached
between 80-85% of confluency in the cell culture flasks. However, performing a splitting
when the cells were only about 60% confluent greatly diminished the number of the
droplets per cell. Under such conditions, after a few splits, almost no droplets can be seen
in cells either in the cell growth flasks or on the substrates used for confocal imaging or
Raman mapping. Subsequently, the temperature of the PBS solution used to wash the
cells has to be 37 ˚C, and it was further noted that the quality of the fixation can be
affected by the temperature of the formalin used. Although, the formalin is usually kept at
room temperature, warming to 37 ˚C before fixation showed a better conservation of the
cell morphology after fixation. Once the sample preparation procedures have been
optimised, cells of consistently “unstressed” morphology can be routinely obtained, as
shown in Figure S3. Fewer vacuoles or lipid droplets are evident, and there is a better
definition of the endoplasmic reticulum (marked with arrows in figure S3).

Figure S3: Microscopic images of cells with “stressed” (A, B) and “unstressed” morphology (C, D).
S.4Effect of the cell fixation on the Raman spectra
Mapping of single cells using Raman spectroscopy can be time consuming and,
depending on the quality of spectra required, many hours are usually needed to complete
a single map. As the viability of cells removed from an incubation environment is
compromised, fixation of cells remains a popular option for extended measurements.
Different approaches to fixation can be employed, including dry fixation, alcohol fixation
or formalin fixation. These different methods have been recently compared by Raman

spectroscopy 4-6. In order to preserve the cell morphology, dry fixation has been excluded
for this study, as the modification in the cell shape and thickness due to the drying will
make comparison with live cells difficult. Formalin fixation is the more promising
approach, as the cells are maintained in a hydrated state and, therefore, as close as
possible to the living state 4. Based on the observations made above, the protocols for cell
fixation were optimised and the sample preparation standardised. Under these conditions,
the localisation of the different subcellular organelles can be precisely visualised and
Raman spectra recorded from similar structures more accurately. Figure S4 presents
spectra recorded from the nucleus and cytoplasm from live and formalin fixed cells. The
spectra exhibit similar intensities and no contribution from the CaF2 substrate can be
seen. The spectral signatures obtained after fixation using formalin are identical to those
recorded from the live cells. Using adapted protocols for the cell culture and fixation, the
effect of the fixatives used can be greatly reduced.
Figure S4: Raman spectra of the nuclear region of fixed (A) and live (B) cells and the cytoplasmic region of fixed (C) and live (D) cells. All Spectra have been recorded using the 785 nm laser source and are the result of two accumulations of 20 seconds per spot. Spectra are offset for clarity
Bibliography:
1. Lundqvist M, Stigler J, Elia G, Lynch I, Cedervall T, Dawson KA, Proceedings of the National Academy of Sciences, 2008, 105, 14265-14270. 2. Davoren M, Herzog E, Casey A, Cottineau B, Chambers G, Byrne HJ, Lyng FM, Toxicology in Vitro, 2007, 21, 438-448. 3. Ryman-Rasmussen JP, Riviere JE, Monteiro-Riviere NA, J Invest Dermatol, 2006, 127, 143-153. 4. Meade A, Clarke C, Draux F, Sockalingum G, Manfait M, Lyng F, Byrne H, Analytical and Bioanalytical Chemistry, 2010, 396, 1781-1791. 5. Draux F, Gobinet C, Sule-Suso J, Trussardi A, Manfait M, Jeannesson P, Sockalingum GD, Anal Bioanal Chem, 2010, 397, 2727-2737. 6. Mariani MM, Lampen P, Popp J, Wood BR, Deckert V, Analyst, 2009, 134, 1154-1161.