The utility of Escherichia coli as a contamination indicator for ...
Upload
independentCategory
view
3download
0
Weaver et al. BMC Systems Biology 2014, 8:79http://www.biomedcentral.com/1752-0509/8/79
RESEARCH ARTICLE Open Access
A genome-scale metabolic flux model ofEscherichia coli K–12 derived from the EcoCycdatabaseDaniel S Weaver1*, Ingrid M Keseler1, Amanda Mackie2, Ian T Paulsen2 and Peter D Karp1
Abstract
Background: Constraint-based models of Escherichia colimetabolic flux have played a key role in computationalstudies of cellular metabolism at the genome scale. We sought to develop a next-generation constraint-based E. colimodel that achieved improved phenotypic prediction accuracy while being frequently updated and easy to use. Wealso sought to compare model predictions with experimental data to highlight open questions in E. coli biology.
Results: We present EcoCyc–18.0–GEM, a genome-scale model of the E. coli K–12 MG1655 metabolic network. Themodel is automatically generated from the current state of EcoCyc using theMetaFlux software, enabling the release ofmultiple model updates per year. EcoCyc–18.0–GEM encompasses 1445 genes, 2286 unique metabolic reactions, and1453 unique metabolites. We demonstrate a three-part validation of themodel that breaks new ground in breadth andaccuracy: (i) Comparison of simulated growth in aerobic and anaerobic glucose culture with experimental results fromchemostat culture and simulation results from the E. colimodeling literature. (ii) Essentiality prediction for the 1445genes represented in the model, in which EcoCyc–18.0–GEM achieves an improved accuracy of 95.2% in predictingthe growth phenotype of experimental gene knockouts. (iii) Nutrient utilization predictions under 431 different mediaconditions, for which the model achieves an overall accuracy of 80.7%. The model’s derivation from EcoCyc enablesquery and visualization via the EcoCyc website, facilitating model reuse and validation by inspection. We present anextensive investigation of disagreements between EcoCyc–18.0–GEM predictions and experimental data to highlightareas of interest to E. colimodelers and experimentalists, including 70 incorrect predictions of gene essentiality onglucose, 80 incorrect predictions of gene essentiality on glycerol, and 83 incorrect predictions of nutrient utilization.
Conclusion: Significant advantages can be derived from the combination of model organism databases and fluxbalance modeling represented by MetaFlux. Interpretation of the EcoCyc database as a flux balance model results in ahighly accurate metabolic model and provides a rigorous consistency check for information stored in the database.
Keywords: Escherichia coli, Flux balance analysis, Constraint-based modeling, Metabolic network reconstruction,Metabolic modeling, Genome-scale model, Gene essentiality, Systems biology, EcoCyc, Pathway Tools
BackgroundConstraint-based modeling techniques such as flux bal-ance analysis (FBA) have become central to systemsbiology [1,2], enabling a wealth of informative simula-tions of cellular metabolism. Many constraint-based mod-eling techniques have been first demonstrated for the
*Correspondence: [email protected] Research Group, SRI International, 333 Ravenswood Ave.,94025 Menlo Park, CA, USAFull list of author information is available at the end of the article
Escherichia coli K–12 MG1655 metabolic network. Aseries of E. coli constraint-based models have been pub-lished by the group of B. Palsson [3-6], extending work onstoichiometric constraint-based modeling of E. coli datingback more than twenty years [7-10]. These models consti-tute a gold standard for E. coli modeling, and have seena range of applications [11-13] including metabolic engi-neering, model-driven discovery, cellular-phenotype pre-diction, analysis of metabolic network properties, studiesof evolutionary processes, and modeling of interspeciesinteractions.
© 2014 Weaver et al.; licensee BioMed Central Ltd. This is an Open Access article distributed under the terms of the CreativeCommons Attribution License (http://creativecommons.org/licenses/by/4.0), which permits unrestricted use, distribution, andreproduction in any medium, provided the original work is properly credited. The Creative Commons Public Domain Dedicationwaiver (http://creativecommons.org/publicdomain/zero/1.0/) applies to the data made available in this article, unless otherwisestated.

Weaver et al. BMC Systems Biology 2014, 8:79 Page 2 of 24http://www.biomedcentral.com/1752-0509/8/79
Motivated by the widespread use of E. coli metabolicmodels, we aimed to illustrate the benefits of integrat-ing metabolic modeling into model organism databases bydeveloping an E. colimodel derived directly from the Eco-Cyc bioinformatics database [14]. First, we aimed to usethe extensive biochemical literature referenced in EcoCycto develop a model with improved accuracy for pheno-typic prediction, specifically for predicting the phenotypesof gene knock-outs, and for predicting growth or lackthereof under different nutrient conditions.Second, we sought to make the model easy to under-
stand and operate. Our goal was a high level of modelaccessibility and readability through (a) tight web-basedintegration of the model with extensive model query andvisualization tools, and (b) a model representation thatcaptures extensive information that enriches the modeland aids its understanding, such as metabolic pathways,chemical structures, and genetic regulatory information.Metabolic models are not just mathematical entities thatoutput predictions; they are also artifacts that scientistsinteract with in multiple ways. If a model can be quicklyand easily understood, scientists are more likely to trustits predictions, and the model is easier to reuse, to modifyand extend, to learn from, and to validate through inspec-tion. These aspects of a metabolic model depend stronglyon how the model is represented, on the software toolsavailable to interactively inspect the model, and on howtightly integrated the model is with those software tools.Third, we sought to produce a model that is frequently
updated to integrate new knowledge of E. colimetabolism.Fourth, we sought to use the EcoCyc-derived E. coli
metabolic model to identify errors in EcoCyc, and openproblems in E. coli biology, by performing in-depth inves-tigations of the disagreements between the phenotypicpredictions of the model and experimental results.We present EcoCyc–18.0–GEM, a constraint-based
genome-scale metabolic model for E. coli K–12 MG1655that is directly derived from the EcoCyc model organismdatabase (http://EcoCyc.org) built on the genomesequence of E. coli K–12 MG1655. The model is imple-mented using the MetaFlux [15] component of the Path-way Tools software [16].
Results and discussionThe EcoCyc–18.0–GEM generated from EcoCyc 18.0encompasses 1445 genes, 2286 unique cytosolic andperiplasmic reactions, and 1453 unique metabolites.Table 1 compares the statistics of EcoCyc–18.0–GEMwith previous E. coli metabolic models. EcoCyc–18.0–GEM is an advance over previous stoichiometric modelsof E. coli metabolism in four respects: in its size; in itsaccuracy; in its form, readability and accessibility; and inits update frequency. Here we summarize these results;these points will be expanded in subsequent subsections.
Table 1 Survey of recent E. coli genome-scalemodelstatistics
Statistics Feist et al. Orth et al. EcoCyc–18.0–GEM2007 [5] 2011 [6]
# Genes 1260 1366 1445
# Unique reactions 1721 1863 2286
# Unique metabolites 1039 1136 1453
Gene knockout accuracy 91.4% 91.3% 95.2%
# PM growth conditions 170 – 431
PM growth condition 75.9% – 80.7%accuracy
# biomass metabolites 65 72 108
Gene knockout prediction accuracy represents simulated growth on glucoseminimal media under aerobic conditions. Reaction and metabolite countsrepresent reactions found in the cytosol and periplasm, since EcoCyc–18.0–GEMdoes not cover porin-mediated diffusion of metabolites into the periplasmicspace.
The MetaFlux component of Pathway Tools trans-lates Pathway/Genome Database (PGDB) reactions andcompounds into constraint-based metabolic models. Ourmethodology of fusing systems-biologymodels and bioin-formatics databases has several advantages because ofstrong synergies between these approaches. Databasesand models both require extensive literature-based cura-tion and refinement. It is more efficient to perform thatcuration once in a manner that benefits a database anda model, than to duplicate curation efforts for a databaseproject and a modeling project. Furthermore, the model-ing process identifies errors, omissions, and inconsisten-cies in the description of a metabolic model, and thereforedrives correction and further curation of the database ifthe two efforts are coupled. We made more than 80 Eco-Cyc updates as a result of comparing model predictionswith experimental data and literature for this work. Inaddition, bioinformatics database curation methods suchas the use of evidence codes and citations to providedata provenance, and the incorporation of mini-reviewsummaries that describe enzymes and pathways, benefitsystems-biology models, which typically lack data prove-nance and explanations.
Advances in model size. Compared with iJO1366,EcoCyc–18.0–GEM represents a 6% increase in the num-ber of genes, a 23% increase in the number of uniquecytosolic and periplasmic reactions, and a 28% increase inthe number of unique metabolites. The size of EcoCyc–18.0–GEM is currently exceeded only by the more mathe-matically complex ME-model of O’Brien et al. [17], whichincludes simulation of gene expression, transcriptionalregulation, and protein synthesis.
Advances in model accuracy. We conducted a three-phase validation of EcoCyc–18.0–GEM to assess its

Weaver et al. BMC Systems Biology 2014, 8:79 Page 3 of 24http://www.biomedcentral.com/1752-0509/8/79
accuracy (see Table 1). In phase I we compared simulatedEcoCyc–18.0–GEM rates of nutrient uptake and prod-uct secretion in aerobic and anaerobic glucose culturewith experimental rates derived from chemostat culture;the performance of EcoCyc–18.0–GEM was equivalentto previous models. In phase II we compared essential-ity prediction for all 1445 genes involved in the modelwith experimental gene essentiality datasets; its error ratein predicting gene-knockout phenotypes decreased by46% over the best previous model. In phase III we com-pared nutrient utilization predictions of EcoCyc–18.0–GEM with 431 experimental nutrient utilization tests; itsaccuracy in predicting growth and respiration under dif-ferent nutrient conditions increased by 4.8% over previousmodels as the number of nutrient conditions expanded2.5-fold. We investigated conflicts between experimentalresults and predictions of EcoCyc–18.0–GEM in detail,and provide an extensive discussion of these conflictswithin the context of EcoCyc and the literature.Subjects of particular interest include alternative cat-
alytic routes capable of replacing genes thought to beessential; compounds with unclear routes of catabolismwhich are capable of supporting growth and/or cellularrespiration; regulatory and environmental perturbationsof the stoichiometric networkmodel; and investigations ofwhat, exactly, constitutes gene essentiality.
Advances in model form, readability, and accessibility.Another benefit of coupling systems-biology models withdatabases, and a corresponding advance of our model, isthat generating a constraint-based model from a databasethat has associated web-based visualization tools leads toa literate model (by analogy to Knuth’s notion of literateprogramming [18]). A literate model is easy to read, and ishighly accessible to and understandable by scientists.
Advances in model update frequency. Because theMetaFlux component of Pathway Tools generatesconstraint-based models directly from the EcoCycPGDBs, as the database is refined through new cura-tion, those refinements are automatically incorporatedinto newly generated versions of the model. We releasenew versions of the EcoCyc-based model three timesper year; previous models were updated every four years[4-6]. Although there are reasons to limit the frequencyof releases in order to tie them to a well-defined versionof the database and throughly test the accuracy of newversions, we believe that more frequent model updatesare useful for an organism as important as E. coli.
Validation of biomass metabolites, nutrients, andsecretionsRefinement of EcoCyc–18.0–GEM began with the vali-dation of the biomass, nutrient, and secretion metabolite
sets, which are detailed at length in Additional file 1and Additional file 2: Table S1. The biomass metaboliteset establishes requirements for growth and determinesthe growth rate of the simulation. The biomass metabo-lite set for EcoCyc–18.0–GEM was based on the iJO1366wild-type and core biomass reaction sets published byOrth et al., with several revisions stemming from differ-ences in content and functionality between EcoCyc andthe iJO1366 model. Gene essentiality in constraint-basedmodels is principally determined by the biomass demandsof the cell. Inclusion of a metabolite in the biomassmetabolite set forces the genes required for manufactureof that metabolite to become essential in the simulation.A wild-type biomass metabolite set, which is derived
from measurement of the biomolecular composition ofhealthy, growing cells, is not representative of the min-imal set of biomass metabolites required for cell sur-vival. Because biomass metabolites not truly required forcell survival will generate false simulation predictions ofessentiality in their biosynthetic pathways, the concept ofa core biomass metabolite set was developed by Feist et al.The core biomass metabolite set is a biomass metaboliteset that is defined with the aim of maintaining quanti-tative accuracy with regards to cell performance whilepredicting the observed experimental essentiality data asaccurately as possible. Because much of this work focuseson testing the minimum requirements for cell growth, wefrequently employed the core biomass metabolite set inour simulations. We use the term “expanded biomass set”to refer to our version of the wild-type biomass metabo-lite set described in Orth et al., because we do not wishto imply that the simulated cells always represented thewild-type state.The biomass metabolite sets described here underwent
several revisions reflecting differences in scope betweenEcoCyc–18.0–GEM and iJO1366. Whereas iJO1366 is apurpose-built model developed using the COBRA Tool-box with input from KEGG, EcoCyc, and other databases,EcoCyc is a database with its own schema whose entriesare programmatically transformed into an FBA model.The specific metabolites present in iJO1366 thereforecannot always be matched with the specific metabolitesgenerated from EcoCyc by MetaFlux on a one-to-onebasis. Several biomass metabolites represented as dis-tinct within iJO1366, such as phosphatidylethanolamineswith different chain lengths and saturations, are summedunder the heading of a single representative metabolitein the EcoCyc–18.0–GEM biomass set. Additionally, notall processes covered in EcoCyc–18.0–GEM are coveredin iJO1366, and the reverse is also true. As a result, thebiomass metabolite sets differ slightly. Additional file 2:Table S2 contains a complete side-by-side comparison ofthe EcoCyc–18.0–GEM and iJO1366 biomass metabolitesets, and lists the differences between them.
Weaver et al. BMC Systems Biology 2014, 8:79 Page 4 of 24http://www.biomedcentral.com/1752-0509/8/79
We constructed standard nutrient sets based on cultureconditions reflecting experiments in glucose or glycerolminimal media and on the model’s capability to use sub-strates. Those substrates include glucose or glycerol asappropriate, O2, NH+
4 , phosphate, sulfate, ferrous iron,water, CO2, minerals appropriate to the biomass objec-tive function, and MOPS buffer (usable as a sulfur source)where appropriate. Because of passive diffusion at the highconcentration of ammonium used in experimental cul-ture, NH+
4 is supplied directly in the cytosol (avoidingfalse negative essentiality predictions for the high-affinitynitrogen transporter amtB), whereas all other nutrientsare supplied in the periplasmic space.Finally, we developed a large set of secreted com-
pounds that could be supplied across all growth condi-tions explored with our model. It contains both plausibleproducts of E. coli metabolism and dead-end metabo-lites [19] within the model. The presence or absence ofmetabolites in this set should not be construed to indicatetheir presence or absence in E. coli culture media.We verified the metabolic reachability of each compo-
nent within the EcoCyc biomass metabolite set by sup-plying nutrients representing an aerobic glucose minimalmedium and setting the production of each individualmetabolite in turn as the optimization goal of MetaFlux,and repaired gaps by means of literature-based manualcuration of EcoCyc and expansion of the relevant metabo-lite sets.
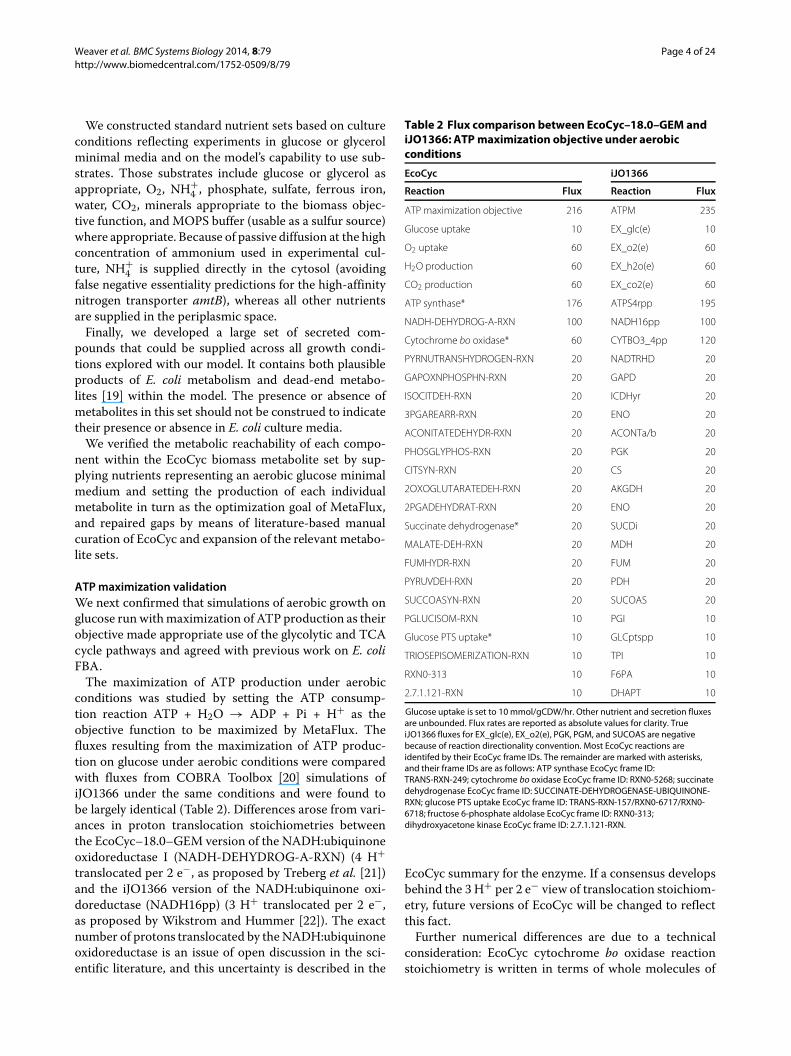
ATPmaximization validationWe next confirmed that simulations of aerobic growth onglucose run withmaximization of ATP production as theirobjective made appropriate use of the glycolytic and TCAcycle pathways and agreed with previous work on E. coliFBA.The maximization of ATP production under aerobic
conditions was studied by setting the ATP consump-tion reaction ATP + H2O → ADP + Pi + H+ as theobjective function to be maximized by MetaFlux. Thefluxes resulting from the maximization of ATP produc-tion on glucose under aerobic conditions were comparedwith fluxes from COBRA Toolbox [20] simulations ofiJO1366 under the same conditions and were found tobe largely identical (Table 2). Differences arose from vari-ances in proton translocation stoichiometries betweenthe EcoCyc–18.0–GEM version of the NADH:ubiquinoneoxidoreductase I (NADH-DEHYDROG-A-RXN) (4 H+translocated per 2 e−, as proposed by Treberg et al. [21])and the iJO1366 version of the NADH:ubiquinone oxi-doreductase (NADH16pp) (3 H+ translocated per 2 e−,as proposed by Wikstrom and Hummer [22]). The exactnumber of protons translocated by the NADH:ubiquinoneoxidoreductase is an issue of open discussion in the sci-entific literature, and this uncertainty is described in the
Table 2 Flux comparison between EcoCyc–18.0–GEM andiJO1366: ATPmaximization objective under aerobicconditions
EcoCyc iJO1366
Reaction Flux Reaction Flux
ATP maximization objective 216 ATPM 235
Glucose uptake 10 EX_glc(e) 10
O2 uptake 60 EX_o2(e) 60
H2O production 60 EX_h2o(e) 60
CO2 production 60 EX_co2(e) 60
ATP synthase* 176 ATPS4rpp 195
NADH-DEHYDROG-A-RXN 100 NADH16pp 100
Cytochrome bo oxidase* 60 CYTBO3_4pp 120
PYRNUTRANSHYDROGEN-RXN 20 NADTRHD 20
GAPOXNPHOSPHN-RXN 20 GAPD 20
ISOCITDEH-RXN 20 ICDHyr 20
3PGAREARR-RXN 20 ENO 20
ACONITATEDEHYDR-RXN 20 ACONTa/b 20
PHOSGLYPHOS-RXN 20 PGK 20
CITSYN-RXN 20 CS 20
2OXOGLUTARATEDEH-RXN 20 AKGDH 20
2PGADEHYDRAT-RXN 20 ENO 20
Succinate dehydrogenase* 20 SUCDi 20
MALATE-DEH-RXN 20 MDH 20
FUMHYDR-RXN 20 FUM 20
PYRUVDEH-RXN 20 PDH 20
SUCCOASYN-RXN 20 SUCOAS 20
PGLUCISOM-RXN 10 PGI 10
Glucose PTS uptake* 10 GLCptspp 10
TRIOSEPISOMERIZATION-RXN 10 TPI 10
RXN0-313 10 F6PA 10
2.7.1.121-RXN 10 DHAPT 10
Glucose uptake is set to 10 mmol/gCDW/hr. Other nutrient and secretion fluxesare unbounded. Flux rates are reported as absolute values for clarity. TrueiJO1366 fluxes for EX_glc(e), EX_o2(e), PGK, PGM, and SUCOAS are negativebecause of reaction directionality convention. Most EcoCyc reactions areidentifed by their EcoCyc frame IDs. The remainder are marked with asterisks,and their frame IDs are as follows: ATP synthase EcoCyc frame ID:TRANS-RXN-249; cytochrome bo oxidase EcoCyc frame ID: RXN0-5268; succinatedehydrogenase EcoCyc frame ID: SUCCINATE-DEHYDROGENASE-UBIQUINONE-RXN; glucose PTS uptake EcoCyc frame ID: TRANS-RXN-157/RXN0-6717/RXN0-6718; fructose 6-phosphate aldolase EcoCyc frame ID: RXN0-313;dihydroxyacetone kinase EcoCyc frame ID: 2.7.1.121-RXN.
EcoCyc summary for the enzyme. If a consensus developsbehind the 3 H+ per 2 e− view of translocation stoichiom-etry, future versions of EcoCyc will be changed to reflectthis fact.Further numerical differences are due to a technical
consideration: EcoCyc cytochrome bo oxidase reactionstoichiometry is written in terms of whole molecules of

Weaver et al. BMC Systems Biology 2014, 8:79 Page 5 of 24http://www.biomedcentral.com/1752-0509/8/79
oxygen, while iJO1366 CYTBO3_4pp is written in termsof half-molecules (1 O2 consumed vs. 0.5 O2).
Comparison with iJO1366 simulation and chemostat dataAfter completing our basic validation of biomass pro-duction and energy generation, we maximized the rateof EcoCyc–18.0–GEM biomass metabolite set productionunder several minimal media conditions and ensured thatwe obtained results comparable to the iJO1366 results forthe same conditions obtained using the COBRA Toolbox.Divergences were addressed by literature-based manualcuration of EcoCyc and modification of MetaFlux reac-tion sets. We further compared the extracellular fluxdistributions resulting from these simulations with theexperimental data obtained in carbon-limited chemo-stat environments under both aerobic and anaerobicconditions.Tables 3 and 4 compare extracellular metabolite flux
results derived from EcoCyc–18.0–GEM simulation,iJO1366 simulation, and experimental data [23,24] forthe canonical cases of aerobic and anaerobic growth onglucose-limited chemostat culture. In all simulations, theexperimental rate of glucose supply was the only fixedconstraint; all other nutrients and secretions were leftunconstrained.The behavior of MetaFlux/EcoCyc–18.0–GEM simula-
tions was very similar in most regards to the behaviorof COBRA/iJO1366 simulations. Respiration and fermen-tation rates scaled with nutrient uptake at comparablerates. The generally higher rates of O2 uptake observedexperimentally lend support to a lower practical efficiencyof proton translation stoichiometry in vivo, perhaps aug-mented by respiratory inefficiencies such as futile cyclingand generation of reactive oxygen species. Both mod-els secrete the expected 1:2:1 mix of acetate, formate,and ethanol during anaerobic growth on glucose thatVarma et al. [25] originally identified as stoichiometrically
Table 3 Comparison of experimental aerobic glucose-limited chemostat growth data with EcoCyc–18.0–GEMand iJO1366 constraint-basedmodel predictions
Aerobic fluxes Experimental EcoCyc iJO1366
Specific growth rate (µ) (1/hr) 0.300 0.272 0.288
Glucose uptake (mmol/gCDW/hr) 3.008 3.008 3.008
O2 uptake 7.413 6.158 5.703
NH4 uptake 2.367 2.899 3.021
Sulfate uptake 0.067 0.073
Phosphate uptake 0.260 0.267
CO2 production 7.38 6.850 6.288
H2O production 13.926 13.704
H+ production 2.454 2.552
Metabolite uptake and production rates are in units of mmol/gCDW/hr. Growthis in units of hr−1 . Experimental data from Kayser et al. [23].
Table 4 Comparison of experimental anaerobic glucose-limited chemostat growth data with EcoCyc–18.0–GEMand iJO1366 constraint-basedmodel predictions
Anaerobic fluxes Experimental EcoCyc iJO1366
Specific growth rate µ (hr−1) 0.30 0.24 0.24
Glucose uptake (mmol/gCDW/hr) 10.0 10.00 10.00
O2 uptake 0.00 0.00 0.00
NH4 uptake 2.52 0.82
Sulfate uptake 0.06 0.06
Phosphate uptake 0.23 0.22
CO2 production 0.04 -0.08
H2O production -1.92 -1.84
H+ production 27.8 27.5
Acetate production 7.5 8.29 8.23
Formate production 11.3 17.37 17.25
Succinate production 1.2 0.00 0.08
Ethanol production 8.7 8.13 8.08
Metabolite uptake and production rates are in units of mmol/gCDW/hr. Growthis in units of hr−1 . Experimental data from [24] via [25]. Formate-hydrogen lyase(FHLMULTI-RXN) was left inactive for purposes of comparison.
optimal. During the transition between purely anaerobicand aerobic domains, the competing demands of energymetabolism and redox elimination cause a characteristicpattern of mixed acid fermentation described by Varmaet al., in which ethanol, then formate, and finally acetateproduction are eliminated as the cell’s oxygen supplybecomes completely sufficient to support aerobic respira-tion. Figures 1 and 2 use the Cellular Overview and OmicsPopup visualization functionalities of Pathway Tools toillustrate this behavior in EcoCyc–18.0–GEM during atransition from anaerobicity to aerobicity.Comparisons between FBA-predicted extracellular
fluxes and experimental fluxes show that EcoCyc–18.0–GEM and iJO1366 FBA predictions agree more closelywith each other than with experimental flux results,although the correspondence between simulation andexperiment was quite close for the experimental fluxesunder consideration. This result was expected given theadaptation of the iJO1366 biomass function for use inEcoCyc–18.0–GEM, the use of iJO1366 and precedingreconstructions as benchmarks in the development ofEcoCyc–18.0–GEM, and the use of EcoCyc as a refer-ence in the construction of iJO1366 and its predecessors.The experimental measurements generally demonstratehigher fluxes of the respiratory gases O2 and CO2 thanthe simulated fluxes, suggesting a degree of respiratoryinefficiency not properly modeled by FBA. Similarly,small quantities of succinate and lactate were producedby experimental fermentation, indicating a degree ofdivergence from metabolic optimality in vivo. Broadercellular constraints such as regulation, protein crowding,

Weaver et al. BMC Systems Biology 2014, 8:79 Page 6 of 24http://www.biomedcentral.com/1752-0509/8/79
Figure 1 Pathway Tools visualization of EcoCyc–18.0–GEM flux during aerobic transition. Example visualization of EcoCyc–18.0–GEM fluxduring a transition from anaerobic to aerobic growth, created within the interactive Cellular Overview diagram in Pathway Tools. The upper boundof glucose uptake is set to 10 mmol/gCDW/hr, while the upper bound of oxygen uptake is increased from 0 to 20 mmol/gCDW/hr in 2.5mmol/gCDW/hr steps. Omics Popups are used to illustrate flux through acetaldehyde dehydrogenase, pyruvate-formate lyase, phosphoglucoseisomerase, glyceraldehyde 3-phosphate dehydrogenase, cis-aconitate hydratase, and valine biosynthesis.
pathway enzyme synthesis requirements, and pathway-throughput limits underlie these differences [17,26,27].Successive generations of evolution under constantgrowth conditions might bring the experimental resultcloser to theory, as described in Ibarra et al. [28].
Gene essentiality analysisOne of the most exciting aspects of genome-scale fluxmodeling is the ability to rapidly test computational geneknockouts (KOs) for their effects on metabolic function.Gene KO simulation is useful both for prediction and
Figure 2 Pathway Tools visualization ofmixed-acid fermentation flux during aerobic transition. Visualization of EcoCyc–18.0–GEM flux inmixed-acid fermentation during a transition from anaerobic to aerobic growth, created within the EcoCyc mixed-acid fermentation pathway pagein Pathway Tools. The upper bound of glucose uptake is set to 10 mmol/gCDW/hr, while the upper bound of oxygen uptake is increased from 0 to20 mmol/gCDW/hr in 2.5 mmol/gCDW/hr steps. Omics Popups are used to illustrate changes in flux to the mixed-acid fermentation productsformate, acetate, and ethanol as the cellular energy and redox balance evolves during the aerobic transition.
Weaver et al. BMC Systems Biology 2014, 8:79 Page 7 of 24http://www.biomedcentral.com/1752-0509/8/79
for validation: in silico FBA screens of gene KOs havebeen applied in a variety of metabolic engineering efforts[29-31], and E. coli KO library collections with well-characterized growth behavior provide an important toolfor flux model validation.FBA gene KO essentiality prediction depends on two
types of database associations between genes and chem-ical reactions: genes whose products catalyze reactions,and genes whose products are reaction substrates (e.g.,acyl-carrier protein). Simulation gene KOs are carriedout by identifying all reactions involving the gene, andthen identifying all other genes capable of catalyzingthe reactions or supplying the substrates thus identi-fied. Reactions for which no isozymes or alternative sub-strate supplies are found are removed from the FBAstoichiometric network. An FBA solution is then calcu-lated for the new model. If the simulated gene KO hascaused the deletion of one or more reactions requiredfor the synthesis of a biomass metabolite, generation ofthe full biomass metabolite set will be blocked and theFBA simulation returns a no-growth result. Such a resultrepresents a prediction of gene essentiality. If the com-plete biomass metabolite set can still be produced inspite of the simulated gene knockout, the FBA simulationreturns a growth result, indicating a prediction of genenon-essentiality.The experimental essentiality data used in our tests con-
sisted of two major datasets. The first, used to study geneessentiality on rich and glucose minimal media, was thedeletion study of Baba et al. [32] as updated by Yamamotoet al. [33], which tested the Keio collection library of4288 E. coli gene deletion strains for growth on LB richmedia and MOPS minimal media with 0.4% glucose. Weconducted our glycerol minimal media tests using thegene knockout essentiality data of Joyce et al. [34], anexpansion of the study of the Keio collection essential-ity to include growth on M9 minimal medium with 1%glycerol.Several E. coli gene deletions strongly affect growth
on various types of minimal media, but are nonessen-tial to growth on rich media. Because the FBA simulationresult is treated as a binary test (growth or no-growth),gene deletions that strongly affect growth on minimalmedia without producing a completely lethal phenotypemust be defined either as experimentally essential or asexperimentally nonessential.Two representative perspectives on this definition are
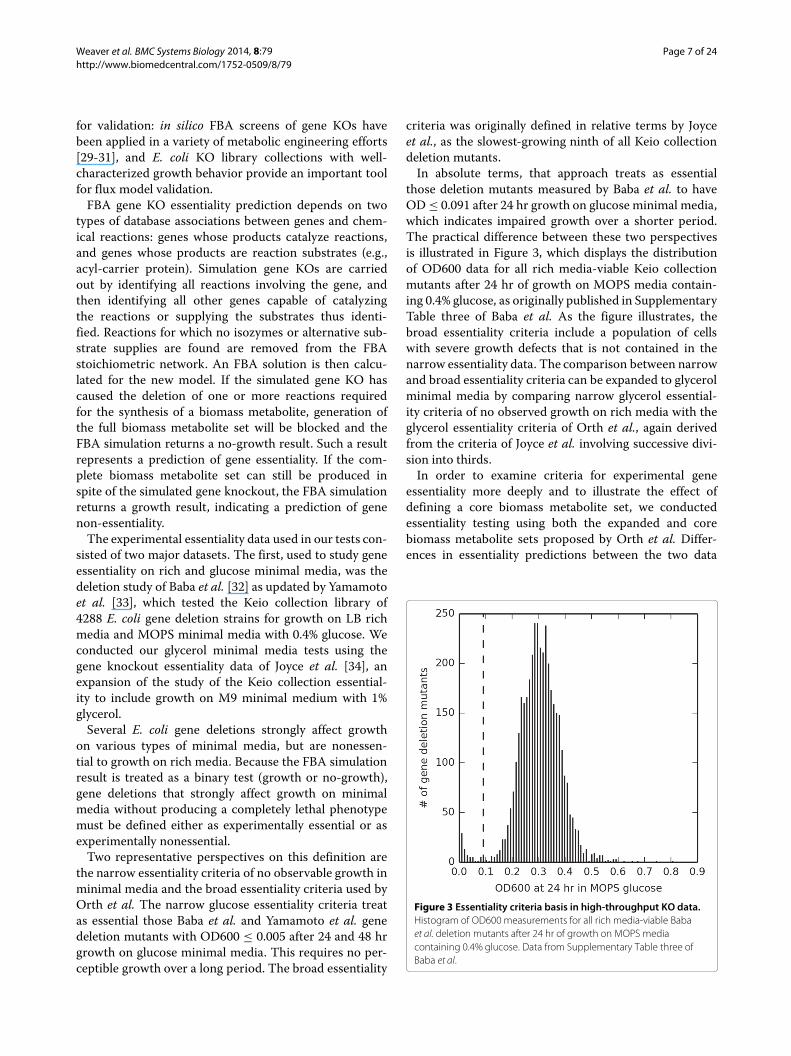
the narrow essentiality criteria of no observable growth inminimal media and the broad essentiality criteria used byOrth et al. The narrow glucose essentiality criteria treatas essential those Baba et al. and Yamamoto et al. genedeletion mutants with OD600 ≤ 0.005 after 24 and 48 hrgrowth on glucose minimal media. This requires no per-ceptible growth over a long period. The broad essentiality
criteria was originally defined in relative terms by Joyceet al., as the slowest-growing ninth of all Keio collectiondeletion mutants.In absolute terms, that approach treats as essential
those deletion mutants measured by Baba et al. to haveOD ≤ 0.091 after 24 hr growth on glucose minimal media,which indicates impaired growth over a shorter period.The practical difference between these two perspectivesis illustrated in Figure 3, which displays the distributionof OD600 data for all rich media-viable Keio collectionmutants after 24 hr of growth on MOPS media contain-ing 0.4% glucose, as originally published in SupplementaryTable three of Baba et al. As the figure illustrates, thebroad essentiality criteria include a population of cellswith severe growth defects that is not contained in thenarrow essentiality data. The comparison between narrowand broad essentiality criteria can be expanded to glycerolminimal media by comparing narrow glycerol essential-ity criteria of no observed growth on rich media with theglycerol essentiality criteria of Orth et al., again derivedfrom the criteria of Joyce et al. involving successive divi-sion into thirds.In order to examine criteria for experimental gene
essentiality more deeply and to illustrate the effect ofdefining a core biomass metabolite set, we conductedessentiality testing using both the expanded and corebiomass metabolite sets proposed by Orth et al. Differ-ences in essentiality predictions between the two data
Figure 3 Essentiality criteria basis in high-throughput KO data.Histogram of OD600 measurements for all rich media-viable Babaet al. deletion mutants after 24 hr of growth on MOPS mediacontaining 0.4% glucose. Data from Supplementary Table three ofBaba et al.
Weaver et al. BMC Systems Biology 2014, 8:79 Page 8 of 24http://www.biomedcentral.com/1752-0509/8/79
sets illustrated the differences between standard cellcomposition under nominal conditions and the minimalcomposition required for cell growth.We simulated single gene KOs on glucose and glycerol
minimal media for the 1445 genes in EcoCyc–18.0–GEMto test whether the resulting EcoCyc–18.0–GEM genedeletion mutants were capable of generating core andexpanded biomass metabolite sets from sets of nutrientsbased on the experimental culture media of Baba et al.and Joyce et al. Gene KO simulations capable of generat-ing any growth at all were scored as nonessential, whereasgene KOs blocking generation of the biomass metaboliteset were scored as essential.We compared the results of this simulated essentiality
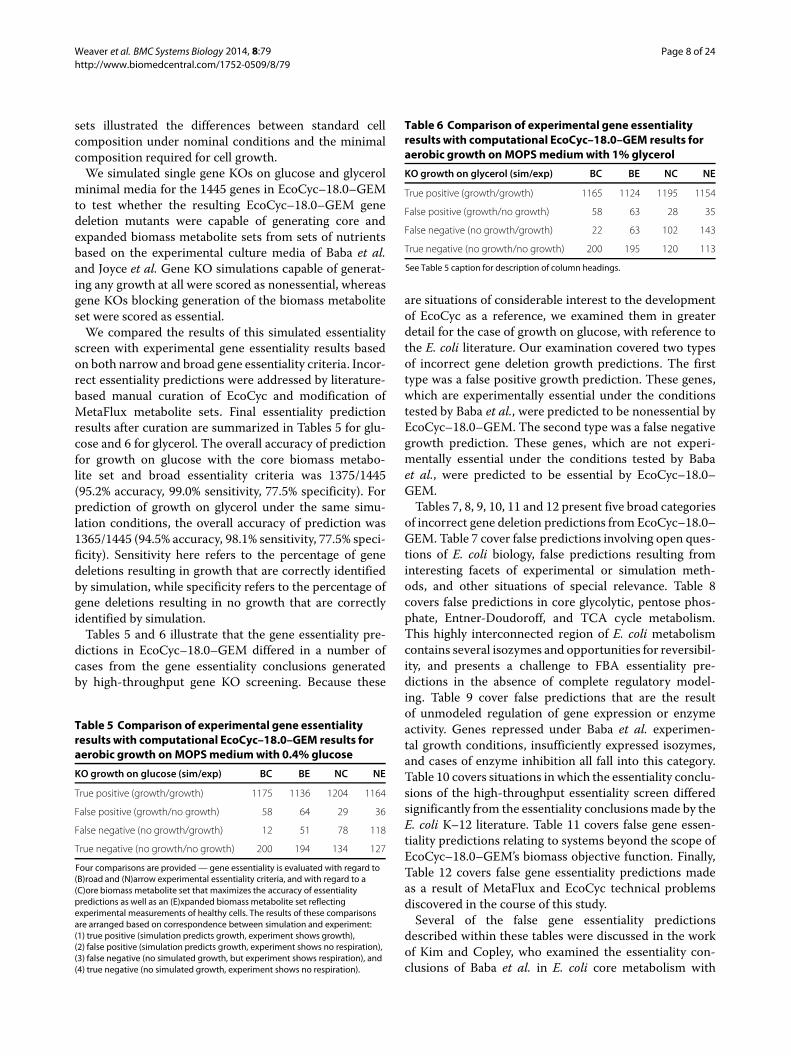
screen with experimental gene essentiality results basedon both narrow and broad gene essentiality criteria. Incor-rect essentiality predictions were addressed by literature-based manual curation of EcoCyc and modification ofMetaFlux metabolite sets. Final essentiality predictionresults after curation are summarized in Tables 5 for glu-cose and 6 for glycerol. The overall accuracy of predictionfor growth on glucose with the core biomass metabo-lite set and broad essentiality criteria was 1375/1445(95.2% accuracy, 99.0% sensitivity, 77.5% specificity). Forprediction of growth on glycerol under the same simu-lation conditions, the overall accuracy of prediction was1365/1445 (94.5% accuracy, 98.1% sensitivity, 77.5% speci-ficity). Sensitivity here refers to the percentage of genedeletions resulting in growth that are correctly identifiedby simulation, while specificity refers to the percentage ofgene deletions resulting in no growth that are correctlyidentified by simulation.Tables 5 and 6 illustrate that the gene essentiality pre-
dictions in EcoCyc–18.0–GEM differed in a number ofcases from the gene essentiality conclusions generatedby high-throughput gene KO screening. Because these
Table 5 Comparison of experimental gene essentialityresults with computational EcoCyc–18.0–GEM results foraerobic growth on MOPSmediumwith 0.4% glucose
KO growth on glucose (sim/exp) BC BE NC NE
True positive (growth/growth) 1175 1136 1204 1164
False positive (growth/no growth) 58 64 29 36
False negative (no growth/growth) 12 51 78 118
True negative (no growth/no growth) 200 194 134 127
Four comparisons are provided— gene essentiality is evaluated with regard to(B)road and (N)arrow experimental essentiality criteria, and with regard to a(C)ore biomass metabolite set that maximizes the accuracy of essentialitypredictions as well as an (E)xpanded biomass metabolite set reflectingexperimental measurements of healthy cells. The results of these comparisonsare arranged based on correspondence between simulation and experiment:(1) true positive (simulation predicts growth, experiment shows growth),(2) false positive (simulation predicts growth, experiment shows no respiration),(3) false negative (no simulated growth, but experiment shows respiration), and(4) true negative (no simulated growth, experiment shows no respiration).
Table 6 Comparison of experimental gene essentialityresults with computational EcoCyc–18.0–GEM results foraerobic growth on MOPSmediumwith 1% glycerol
KO growth on glycerol (sim/exp) BC BE NC NE
True positive (growth/growth) 1165 1124 1195 1154
False positive (growth/no growth) 58 63 28 35
False negative (no growth/growth) 22 63 102 143
True negative (no growth/no growth) 200 195 120 113
See Table 5 caption for description of column headings.
are situations of considerable interest to the developmentof EcoCyc as a reference, we examined them in greaterdetail for the case of growth on glucose, with reference tothe E. coli literature. Our examination covered two typesof incorrect gene deletion growth predictions. The firsttype was a false positive growth prediction. These genes,which are experimentally essential under the conditionstested by Baba et al., were predicted to be nonessential byEcoCyc–18.0–GEM. The second type was a false negativegrowth prediction. These genes, which are not experi-mentally essential under the conditions tested by Babaet al., were predicted to be essential by EcoCyc–18.0–GEM.Tables 7, 8, 9, 10, 11 and 12 present five broad categories
of incorrect gene deletion predictions from EcoCyc–18.0–GEM. Table 7 cover false predictions involving open ques-tions of E. coli biology, false predictions resulting frominteresting facets of experimental or simulation meth-ods, and other situations of special relevance. Table 8covers false predictions in core glycolytic, pentose phos-phate, Entner-Doudoroff, and TCA cycle metabolism.This highly interconnected region of E. coli metabolismcontains several isozymes and opportunities for reversibil-ity, and presents a challenge to FBA essentiality pre-dictions in the absence of complete regulatory model-ing. Table 9 cover false predictions that are the resultof unmodeled regulation of gene expression or enzymeactivity. Genes repressed under Baba et al. experimen-tal growth conditions, insufficiently expressed isozymes,and cases of enzyme inhibition all fall into this category.Table 10 covers situations in which the essentiality conclu-sions of the high-throughput essentiality screen differedsignificantly from the essentiality conclusionsmade by theE. coli K–12 literature. Table 11 covers false gene essen-tiality predictions relating to systems beyond the scope ofEcoCyc–18.0–GEM’s biomass objective function. Finally,Table 12 covers false gene essentiality predictions madeas a result of MetaFlux and EcoCyc technical problemsdiscovered in the course of this study.Several of the false gene essentiality predictions
described within these tables were discussed in the workof Kim and Copley, who examined the essentiality con-clusions of Baba et al. in E. coli core metabolism with

Weaver et al. BMC Systems Biology 2014, 8:79 Page 9 of 24http://www.biomedcentral.com/1752-0509/8/79
Table 7 False gene essentialitypredictions resulting from open questions in E. coli biology and gene essentiality
Gene HT Sim Conv Citations Comments
argD + – + [35,36] EcoCyc lists argD as the only enzyme capable of carrying out the N-succinyldiaminopimelateaminotransferase reaction in lysine biosynthesis. Cox and Wang [35] demonstrate that a second,thus far unidentified enzyme besides ArgD can catalyze theDapC reaction. argD is discussed in [36].
cysC – + – [5,32,34,37,38] Gene essentiality in the sulfate utilization pathway is bypassed until cysIJ in the experiments of [32],cysH – + – which were conducted in a MOPS buffer capable of being used as a sulfur source via ssuEADCBcysN – + + alkanesulfonate desulfonation to sulfite. Joyce et al. [34] use MOPS-free M9 buffer and
consequently shows cysADQUW essentiality for sulfate uptake. The MOPS desulfonationexplanation of the data of [32] is complicated by the fact that sulfite from MOPS should bypasscysNDCH within the assimilatory sulfate reduction pathway. Instead, these deletions fall within ornear the broad essentiality criteria of [5]; cysN is barely within the broad essentiality criteria (OD6000.088 at 24 hr) and cysD is just above (OD600 0.104 at 24 hr) while cysCH are deep within the cutoff.We propose an explanation based on inactivation of the ssu pathway transcriptional regulatorCbl via binding of adenosine 5’-phosphosulfate (APS), the product of the CysND sulfateadenylyltransferase [37,38]. cysND mutants express the ssu pathway well and are able to bettersupport growth via MOPS catabolism. cysCH mutants can produce APS from extracellular sulfate,leading to Cbl inactivation by APS binding, repression of ssu, and weaker growth.
dapF + – + [36,39,40] EcoCyc lists dapF as the only enzyme capable of converting LL-diaminopimelate tomeso-diaminopimelate in lysine biosynthesis, but [39] demonstrates that dapF null mutants growin unsupplemented glucose minimal media. dapF is described in [36].
dut – + – [41,42] NudI and MazG substitute for Dut activity in EcoCyc–18.0–GEM. The NudI Km for thedUTP-consuming reaction shared with Dut is in the mM range. MazG activity is 70% inhibited bythe MazEF toxin-antitoxin system; see [42]. el-Hajj et al. [41] discuss Dut at greater length.
folB + – N/A [32,34,43] folB reported as nonessential by [32], but essential by [34], despite no obvious reason fordifferential essentiality on glucose and glycerol. Haussmann et al. [43] studied the enzyme but didnot construct a deletionmutant or test it on glucoseminimalmedia; whether an attemptwasmadeis unknown. folB is found upstream of genes reported essential by [32] in the folate biosynthesispathway, including folK, folC, folA, and possibly folP (see below).
folP – – N/A [32,33,44,45] To our knowledge, there has not been a clear folP or hemE null mutant test on glucose minimalhemE – – N/A media. A folP deletion mutant grows poorly in rich media according to [45]. folP and hemE gene
duplications preventing observation of the null phenotype in [32] were identified in [33,36] andthese genes are described as of uncertain essentiality by [33]. Genes of uncertain essentiality in [33]are those with partial duplication for both isolates that are considered nonessential in [44], whichtested culture growth on rich Antibiotic Medium 3 medium containing beef extract as opposed tothe LB agar of [33]. Under the broad essentiality criteria of [6], genes with uncertain essentiality in[33] were considered nonessential. EcoCyc–18.0–GEM supports the conclusion of essentiality forfolP and hemE.
ftsW – + – [46-50] It is not clear whether FtsW, MurJ, or both carry out the lipid II flippase activity in E. coli. See themurJ – + – listed references for additional information on this topic.
kdsC – + + [51-53] kdsC is upstream of the essential genes kdsB and waaA in the CMP-KDO biosynthesis pathway.Sperandeo et al. [51] suggeststhat isozymes for KdsC’s 3-deoxy-D-manno-octulosonate8-phosphate phosphatase activity may exist. Nonspecific phosphatase activity might also carryout this reaction. See [52,53] on the subject of CMP-KDO requirements and E. coli temperaturesensitivity.
pabC + – – [32,34,36,54] Green et al. [54] report that PABA, the product of pabC, is required for growth on minimal media(although the carbon source used on this media is not described) and establishes that only onecopy of the gene exists in E. coli. PabC is upstream of enzymes reported essential by [32] in itspathway. Kim and Copley [36] hypothesize nutrient carryover from rich culture for lack ofessentiality in [32]. pabC is also nonessential in the M9 glycerol medium of [34].
Cases where EcoCyc–18.0–GEM essentiality predictions differed from experimental gene-essentiality results for aerobic growth on MOPS mediumwith 0.4% glucose,and posed open biological questions or highlight metabolic network interactions of particular interest in EcoCyc–18.0–GEM. Certain of these genes deserve furtherinvestigation by the experimental community; others highlight interesting aspects of essentiality testing. Kim and Copley [36] have discussed several of these genes,which remain open issues in the literature. See text for additional details. Column headings are as follows:HT: High-throughput experiment (loose essentiality criteriaof [6]). Sim: Simulation. Conv: Conventional experiment. Column entries are as follows: –: In the experiments, deletion mutant could not be recovered for testing, orwas tested and did not grow to more than 0.091 OD600 after 24 hr, or both isolates were found to have duplications. In the simulations, FBA biomass flux was zero.+: In the high-throughput experiments, a deletion mutant was tested and showed growth greater than 0.091 OD600 after 24 hr. In the conventional experiments,growth was observed. In the simulations, FBA biomass flux positive.N/A: Information not available for deletion mutant on glucose minimal media. For example, argDis essential in the data of [32] according to the broad essentiality criteria of [6], but EcoCyc–18.0–GEM predicts that it is nonessential.
reference to the then-current state of EcoCyc. Constraint-based model improvement and gap-filling based on geneessentiality predictions derived from the work of Baba
et al. have been examined for the COBRA family ofconstraint-based models of E. coli metabolism by Reedet al. [140], Kumar et al. [141], Kumar and Maranas

Weaver et al. BMC Systems Biology 2014, 8:79 Page 10 of 24http://www.biomedcentral.com/1752-0509/8/79
Table 8 False gene essentialitypredictionswithin glycolytic and TCA cyclemetabolism
Gene HT Sim Conv Citations Comments
aceE + + – [32,36,55-57] Baba et al. [32] observe aceE null mutant growth to OD600 0.353 (nonessential), aceF null mutantaceF – + – growth to OD600 0.091 (the line of loose essentiality), and lpd null mutant growth to OD600 0.061lpd – + – (loose essential). Langley and Guest [55] observe pyruvate dehydrogenase complex essentiality and
[56,57] discuss it in the context of poxAB; [36] suggest mutants overexpressing pyruvate oxidaseallow growth on glucose.
eno – + – [36,58,59] Hillman and Fraenkel [58] describe gapA essentiality and [59] describes eno/gapA/pgkgapA – + – essentiality. Null mutants in these enzymes suffer from glucose toxicity because of glucosepgk – + – catabolite repression of other carbon utilization pathways. See also [36].
icd – + – [32,36,60-67] EcoCyc–18.0–GEM icd deletion mutants grow via condensation of propionyl-CoA and glyoxylateto 2-hydroxyglutarate [60,61], and oxidation of 2-hydroxyglutarate to 2-oxoglutarate via LhgO [66].icd is broadly essential on minimal glucose media in [32]. icd deletion mutants require glutamate[62,63] and can grow on LB [64,65], although [67] reports growth on M9 minimal media.See also [36].
fbaA – + – [36,68-71] The class I fructose bisphosphate aldolase fbaB is listed as an isozyme for fbaA in EcoCyc, but isexpressed only under gluconeogenic conditions [68,69]. Use of the fsa/dhaK pathway [70,71] tosubstitute for fbaA appears to be blocked in the results of [32] by lowered dhaK expression in E. coliwith operational phosphotransferase systems. Other effects of fbaA deletion are discussed in [36].
gltA – + – [36,72,73] PrpC, the 2-methylcitrate synthase in the propionate utilization pathway, is an isozyme for the GltAcitrate synthase. prpC is conditionally expressed in the presence of propionate. Discussed in [36,73].
pfkA – + – [32,36,74,75] pfkA and pfkB are listed as isozymes for the 6-phosphofructokinase reaction, but PfkB activity isinsufficient to allow strong growth in vivo in the absence of pfkA according to [74]. pfkA is looselyessential (OD600 0.087) in [32]. See [36] and [75], which indicate that both pfkA and pfkB must bedeleted to block growth.
ppc – + + [32,76,77] Peng et al. [76] demonstrate growth of ppc deletion mutants without detectable Ppc activity on M9glucose minimal media. ppc grows on rich media but is narrowly essential under minimal glucoseconditions in the high-throughput assay of [32]. EcoCyc–18.0–GEM ppc deletion mutants grow viaactivation of the glyoxylate shunt, in agreement with the observations of [76]. Patrick et al. [77]identified overexpression of the osmoregulatory system regulator EcfM and the uncharacterizedprotein YccT as capable of rescuing ppc deletion mutants.
tpiA + + – [32,36,78,79] Kim and Copley [36] describe tpiA essentiality based on methylglyoxal formation in tpiA nullmutants, and the tpiA nonessentiality result of [32] as based on methylglyoxal pathway-expressingmutants [78,79].
The three available pathway options for navigating the route from glucose to the TCA cycle make up the superpathway of glycolysis, the pentose phosphate pathwayand the Entner-Doudoroff pathway. Without modeling of regulation, product inhibition, and metabolite toxicity, the multiple re-entry points in the superpathway andthe reversible nature of the pentose phosphate pathway allow carbon flux to route around deletions with weak growth. EcoCyc–18.0–GEM consequently producesseveral false positive results for these pathways. This set of genes has previously been discussed at length by [36]. The aceE and tpiA genes identified as essential inFigure two of [36] are judged nonessential by [32] and consequently by [6], and were predicted as nonessential by EcoCyc–18.0–GEM, but these nonessentialityconclusions appear incorrect based on conventional experiments described in the literature, and are thus included in this table. The converse is true for ppc,which is considered essential by high-throughput experiments, but is not essential in conventional experiment. See Table 7 caption for a description ofcolumn headings.
[142], Barua et al. [143], Orth and Palsson [73,144], andTervo and Reed [145]. Our revisions of EcoCyc–18.0–GEM included manual application of a subset of Grow-Match [142] gap-filling methods, specifically resolutionof false positive gene essentiality predictions associatedwith blocked genes and false negative results associatedwith secretion of metabolites. The essentiality predictionaccuracy resulting from our manual curation process issimilar to the accuracy resulting from applying the fullGrowMatch algorithm to the iAF1260 model.Additional file 2: Table S3 provides detailed listings
of essentiality status and model predictions, including abreakdown of gene essentiality prediction status by crite-ria used.
Nutrient utilization analysisObservation of culture growth on various nutrient sourcesis a foundation of microbiology [146]. EcoCyc 18.0 con-tains information on E. coli respiration for 428 types ofmedia, including 22 conventional types ofminimal growthmedia and 383 Biolog Phenotype Microarray (PM) wells.The 383 Biolog PM media conditions represent a high-throughput method of evaluating metabolic phenotypesin culture based on a tetrazolium dye assay of cellular res-piration. Each well in a Biolog 96-well PM plate containsa standard minimal media composition plus a nutrientsource that is varied across the PM plate, with the elementsupplied by the varying nutrient source dependent on thetype of Biolog PM plate in use [147-149].

Weaver et al. BMC Systems Biology 2014, 8:79 Page 11 of 24http://www.biomedcentral.com/1752-0509/8/79
Table 9 False gene essentialitypredictions resulting from isozymes or pathways not operational under the experimentalconditions of Baba et al.
Gene HT Sim Conv Citations Comments
aroE – + – [80,81] ydiB encodes an isozyme for the AroE shikimate dehydrogenase in EcoCyc. Johansson andLiden [81] suggest that the NAD+/NADP+ specificity of YdiB and high intracellular NAD+concentrations lead it to operate in the “reversed” shikimate dehydrogenase direction, as opposedto the biosynthetic direction toward chorismate.
can – + – [82] cynT, a carbonic anhydrase in the cyn cyanate degradation operon, encodes an isozyme for the Cancarbonic anhydrase reaction in EcoCyc. cynT is conditionally expressed in the presence of cyanate,which is absent in [32] minimal media conditions.
folA – + – [83,84] folM, a 7,8-dihydromonapterin reductase in the tetrahydromonapterin biosynthesis pathwaywith aweak 7,8-dihydrofolate reductase activity, encodes an isozyme for the FolA dihydrofolate reductasereaction in EcoCyc. folM is insufficiently expressed in vivo to supply E. coli growth requirements fortetrahydrofolate.
folD – + – [85] 10-formyl-tetrahydrafolate formation by folD can be shortcircuited in EcoCyc–18.0–GEM by purN’sreversible phosphoribosylglycinamide formyltransferase activity. PurN’s kcat is substantially higherin the forward direction than in the reverse direction in vitro, but the in vivo reversibility of theenzyme is uncertain.
glyA – + – [77,86,87] The threonine dehydrogenase Tdh and 2-amino-3-ketobutyrate CoA ligase Kbl provide anserA – + – alternate, threonine-based route to glycine synthesis from serine by the GlyA serine
hydroxymethyltransferase. tdh and kbl are under the control of the Lrp leucine repressor system,and are conditionally expressed in the presence of leucine, which is absent in [32] minimal mediaconditions. Patrick et al. [77] determined that overexpression of Tdh, the LtaE low-specificitythreonine aldolase, the YneH glutaminase, or Rsd anti-sigma factor led to rescue of glyA deletionmutants, and that YneH was also capable of rescuing serA null mutants.
guaB – + – [88] guaB is essential for growth on glucose in [32], and [88] indicates that guaBmutants requireguanine for growth. In EcoCyc, nucleotide salvage pathways allow the degradation of IMP toinosine, subsequent conversion of inosine to xanthine via XapA/DeoD and XdhA, and finallyconversion of xanthine to XMP via Gpt.
ilvA – + – [77,89] The threonine dehydratase TdcB acts as an isozyme for the IlvA threonine deaminase in EcoCyc.tdcB is expressed only under anaerobic conditions. Patrick et al. [77] identified TdcB or EmrDmultidrug efflux transporter overexpression as capable of rescuing ilvA deletion mutants.
lipB – + – [90] The lipoyl-carrier protein N6-octanoyl-L-lysine intermediate in lipoate synthesis can be producedby both LipB and LplA in EcoCyc. LplA is primarily involved in the assimilation of extracellularlysourced lipoate. See [90] for further details.
metC – + – [77,91-93] MalY’s β-cystathionine lyase activity is listed as an isozyme for MetC in EcoCyc. malY is involvedin complex regulatory interactions, and its expression is repressed by malI in WT strains. Withoutappropriate signaling, malY is not expressed. Patrick et al. [77] rescued metC deletion mutants viaMalY, Alr alanine racemase, or FimE phase-variation switch regulator overexpression.
metL – + – [36,94] E. coli’s three aspartokinases, ThrA, MetL, and LysC, are all isozymes for the aspartokinase reaction inthrA – + – EcoCyc. The end-product inhibition of each of these enzymes should prevent aspartokinase gene
KOs from being rescued by their isozymes, since adequate amino acid pools in the pathways ofthe remaining isozymes will inhibit their activity. Kim and Copley [36] suggest that metL is notexpressed on glucose.
nrdA – + – [95] The NrdDE ribonucleoside diphosphate reductase acts as an isozyme for the NrdAB ribonucleosidenrdB – + – diphosphate reductase in EcoCyc. nrdDE is expressed only under anaerobic conditions.
pdxB – + – [77,96,97] EcoCyc–18.0–GEM can overcome deletion of serC and pdxB by using the thrB/ltaE route fromserC – + – glycolaldehyde (produced by FolB and formed spontaneously from 3-hydroxypyruvate supplied
from YeaB) for production of 4-phospho-hydroxy-threonine and subsequently pyridoxal-5’-phosphate [96,97]. Replacement of serC and pdxB by these pathways requires overexpression ofthrB or yeaB/nudL, and growth after overexpression is reported only for solid media [97], whereasthe assays of [32] were conducted in liquid media. Patrick et al. [77] rescued pdxB deletion mutantswith Tdh threonine dehydrogenase or PurF amidophosphoribosyl transferase overexpression, andserC deletion mutants with YneH glutaminase overexpression.
prs – + – [32,98-100] The PRPP biosynthesis II pathway can substitute for prs deletion in EcoCyc–18.0–GEM. This pathwayis based on connection of ribose 5-phosphate through the DeoB phosphomutase to the PhnNribose 1,5 bisphosphokinase activity via a putative ribose 1-phosphokinase activity [98,99]. PhnN ispart of the phn operon, [99,101] whose expression is repressed under the 2mMphosphate glucoseminimal media conditions used by [100].

Weaver et al. BMC Systems Biology 2014, 8:79 Page 12 of 24http://www.biomedcentral.com/1752-0509/8/79
Table 9 False gene essentialitypredictions resulting from isozymes or pathways not operational under the experimentalconditions of Baba et al. (Continued)
serB – + – [77,102] EcoCyc–18.0–GEM can overcome deletion of serB by synthesizing serine from threonine via Tdhand reversible action of GlyA. Ravnikar and Somerville [102] isolated pseudorevertants containingelevated levels of Tdh from ser deletions following growth onmedia supplementedwith threonine,leucine, arginine, lysine, and methionine followed by growth on minimal media. Patrick et al. [77]additionally identified overexpression of Gph, HisB, and YtjC phosphatases as capable of rescuingserB deletion mutants.
False KO predictions caused by the presence of isozymes that are able to catalyze the reaction in the model, but are either down-regulated under the mediaconditions of [32] or are for other reasons unlikely to substitute for the knocked-out enzyme in vivo. Because MetaFlux does not model regulation, it assumes thatthese enzymes are active. See Table 7 caption for a description of column headings.
We evaluated the performance of EcoCyc–18.0–GEMin predicting growth for the following available datasets:(1) aerobic E. coli growth on the 22 common conven-tional minimal growth media; (2) consensus estimatesof respiration based on four different experimentalists’measurements of aerobic Biolog 96-well plates PM1–4,representing 313 conflict-free growth observations; and(3) an anaerobic Biolog PM1 plate assay surveying carbonsource utilization in the absence of oxygen, representing96 anaerobic growth observations. Biolog PM data storedin EcoCyc measures utilization of nutrients as sourcesof carbon (PM1–2), nitrogen (PM3), sulfur (PM4), andphosphorus (PM4).
Conventional media compositions and growth resultswere drawn from the literature. Aerobic Biolog PM nutri-ent utilization assay results were compiled from fourdifferent datasets captured in EcoCyc: (1) from our ownexperiments; (2) from a dataset obtained from B. Bochner;and from the recent publications of (3) AbuOun et al.[150] and (4) Yoon et al. [151]. Anaerobic Biolog PMnutrient utilization assay results were obtained from B.Bochner. We did not include the data of Baumler et al.in our analysis of Biolog PM results because of varia-tion in culture conditions and a high degree of conflictwith other datasets under both aerobic and anaerobicconditions [152]. See the Methods section for additionaldetails.
Table 10 Genes for which EcoCyc–18.0–GEM predictions identified likely errors in high-throughput essentialityscreening, and the EcoCyc–18.0–GEM predictionswere confirmed by conventional essentialityexperiments
Gene HT Sim Conv Citations Comments
alsK – + N/A [32,103,104] The circumstances leading to this gene’s essentiality in [32] are uncertain. Kim et al. 1997[103] and Poulsen et al. 1999 [104] demonstrate that alsK is not required for growth on allose,and demonstrate growth on glycerol minimal media. Poulsen et al. [104] constructed alsKnull mutants with transposon insertions, demonstrating that alsK was not required for allosecatabolism, and renamed the gene yjcT. alsK/yjcT is listed as essential on richmedia (LB) by [32].
aroD + – – [32,36,105,106] Baba et al. [32] suggest that an aroD null mutant can grow on glucoseminimalmedia, but [105]established that E. coli K–12 aroD mutants require all of the aromatic amino acids for growth.See also the discussion in [36] with reference to [106].
atpB – + + [73,107,108] von Meyenburg et al. [107] demonstrate growth of strains lacking intact ATP synthase onatpC – + + glucose and other fermentable carbon source minimal media, at reduced growth rates.atpE – + + Growth of atp null mutants is further discussed in [73,108].
cydA – + + [73,109-114] Green and Gennis [109] demonstrate aerobic growth of cyd mutants on glucose minimalcydC – + + media through use of cytochrome bo. See references for further discussion of redundancy in
E. coli cytochromes and operation of cytochrome bd-I. Discussed in [73].
ptsH – + + [77,115-121] Steinsiek and Bettenbrock [120] and Escalante et al. [121] review glucose uptake in E. coliptsI – + + mutant strains with glucose PTS defects. See references for additional details. Patrick et al.
[77] identified overexpression of FucP fucose transporter, XylE xylose transporter, or GalEUDP-glucose 4-epimerase as capable of rescuing ptsI deletion mutants.
spoT – + + [73,122-126] spoT− mutants grow slowly on glucose minimal media [122,123]. Absence of SpoT ppGpphydrolase activity leads to high levels of ppGpp, which are inversely correlated with growthrate [126]. See references for additional details. Discussed in [73].
ubiA – + + [127,128] Cox et al. [127] constructed ubiquinone-free mutants of K–12 capable of growth onubiD – + + fermentable substrates including glucose. Wu et al. [128] constructed ubiA null mutantsubiE – + + capable of growing on minimal media containing fermentable carbon sources.
waaU – + + [129,130] Essentiality in glucose minimal media has not been clearly determined. Klena et al. [129]constructedwaaU null mutants and demonstrated their viability in richmedia, in contradictionto the determination of essentiality in rich media in [32].
See Table 7 caption for a description of column headings.

Weaver et al. BMC Systems Biology 2014, 8:79 Page 13 of 24http://www.biomedcentral.com/1752-0509/8/79
Table 11 False gene essentialitypredictions for genes representing systems beyond the scope of the EcoCyc–18.0–GEMbiomass function
Gene HT Sim Conv Citations Comments
der – + – [131-133] Der is essential for maintenance of 50S ribosomal subunit stability. Der’s GTPase activity regulatesthe specificity of its interactions with the ribosomal subunit. Regulatory GTPase activities, such asthose of Der, are beyond the current scope of EcoCyc–18.0–GEM.
mrdA – + – [134,135] MrdA and FtsI, often referred to as penicillin-binding proteins 2 and 3, are essential for cell divisionftsI – + – and maintenance of cell shape. Ogura et al. [135] determined mrdA to be essential in K–12, while
[134] determined ftsI to be essential. Modeling of the unique roles of mrdA and ftsI is beyond thecurrent scope of EcoCyc–18.0–GEM.
suhB – + – [136] Wang et al. [136] studied suhB null mutants, which exhibit a cold-sensitive phenotype, and reportedthat they were unable to grow at 30°C, but grew well at 42°C. Growth was studied at 37°C, but notdescribed. Heat and cold sensitivity are beyond the current scope of EcoCyc–18.0–GEM.
Examples of these systems include cold response and cell envelope maintenance. The EcoCyc GEM biomass function will be expanded to incorporate the operation ofthese systems in future versions. See Table 7 caption for a description of column headings.
Table 12 False gene essentialitypredictions caused by technical issues in MetaFlux and EcoCyc
Gene HT Sim Comments
bioB – + Lipoate biosynthesis and the final step of biotin biosynthesis are not operational in EcoCyc–18.0–GEM duebirA – + to reaction mass imbalances in EcoCyc 18.0. This leads to the presence of dethiobiotin instead of biotin inlipA – + the objective function, and prevents biotinylation of biotin carboxyl carrier protein.
entD – + EntDEFG activity is active in EcoCyc–18.0–GEM without EntD because of the presence of individual EntE,EntF, and EntG activity in EcoCyc in addition to an activity describing the overall EntDEFG complex, whichleads to entD knockouts being ineffective.
entD – + EntDEFG activity is active in EcoCyc–18.0–GEM without EntD because of the presence of individual EntE,EntF, and EntG activity in EcoCyc in addition to an activity describing the overall EntDEFG complex, whichleads to entD knockouts being ineffective.
fdx – + The IspG reaction in the EcoCyc MEP pathway incorrectly requires ferredoxin (encoded by fdx) instead offlavodoxin I [137].
iscS – + The IscS cysteine desulfurase lacks chemical structure in EcoCyc, preventing its participation in thiazolethiL – + biosynthesis and iron-sulfur cluster synthesis. This affects thiL essentiality by blocking thiazole synthesis and
rendering EcoCyc–18.0–GEMunable to synthesize thiamin. Due to exogenous thiamin contamination in theexperiments of [32] (see [73]; note that thiL is apparently mislabeled as thiI therein) this omissionmanifests itself only as an incorrect prediction of thiL nonessentiality, since endogenous and exogenousthiamin pathways can substitute for knockouts in each other until the final thiamin monophosphate kinaseactivity of ThiL.
metE – + MetaFlux does not correctly model polymerization reactions, which prevents the synthesis of5-methyltetrahydropteroyl tri-L-glutamate by folate polyglutamylation. This in turn prevents MetE’scob(I)alamin-independent methionine synthase reaction from operating properly.
metH + – MetH’s cob(I)alamin-dependent methionine synthase activity does not currently require cob(I)alamincofactor in EcoCyc–18.0–GEM because cofactor requirements are not accounted for in enzymatic reactions.Because MetE is inoperational as a result of a lack of folate polyglutamylation (see above), the incorrectlyoperational MetH methionine synthase reaction becomes essential. This ambiguity will be remedied infuture versions of MetaFlux.
ndk + – ndk is falsely predicted as essential because its UDP kinase and dTDP kinase activities provide the only routesin EcoCyc to UTP and dTTP, respectively. In vivo, ndk null mutants are rescued by broad substrate specificityof adk [36,138].
pyrI + – The catalytic subunit PyrB of the aspartate transcarbamylase PyrBI is active by itself in vitro [139]. The PyrBIcomplex catalyzes the physiologically regulated reaction, and the reaction is assigned to the PyrBIcomplex in EcoCyc. This causes the pyrI gene KO simulation to block PyrBI aspartate transcarbamylationactivity entirely.
trxB + – The activity of the glutaredoxin pathway can substitute for the thioredoxin pathway in E. coli, and vice versa.This ability is not properly modeled in EcoCyc–18.0–GEM as a result of the pathways’ structure in EcoCyc.
These technical issues will be addressed in future versions of MetaFlux and EcoCyc. See Table 7 caption for a description of column headings.
Weaver et al. BMC Systems Biology 2014, 8:79 Page 14 of 24http://www.biomedcentral.com/1752-0509/8/79
Growth on a given type of media was tested by con-structing simulatedMetaFlux nutrient sets correspondingto the contents of the media in question and comparingEcoCyc–18.0–GEM growth predictions with experimen-tal growth results. Due to the absence of enterobactiniron uptake modeling in EcoCyc, Fe3+ in the medium wasreplaced with Fe2+. Anaerobic simulations were preparedidentically to those performed for aerobic growth, exceptfor the removal of oxygen from the nutrient set, inclusionof the formate-hydrogen lyase reaction, and the removalof the protoheme and pyridoxal 5’-phosphate synthesisrequirement from the biomass.Literature-based EcoCyc curation and appropriatemod-
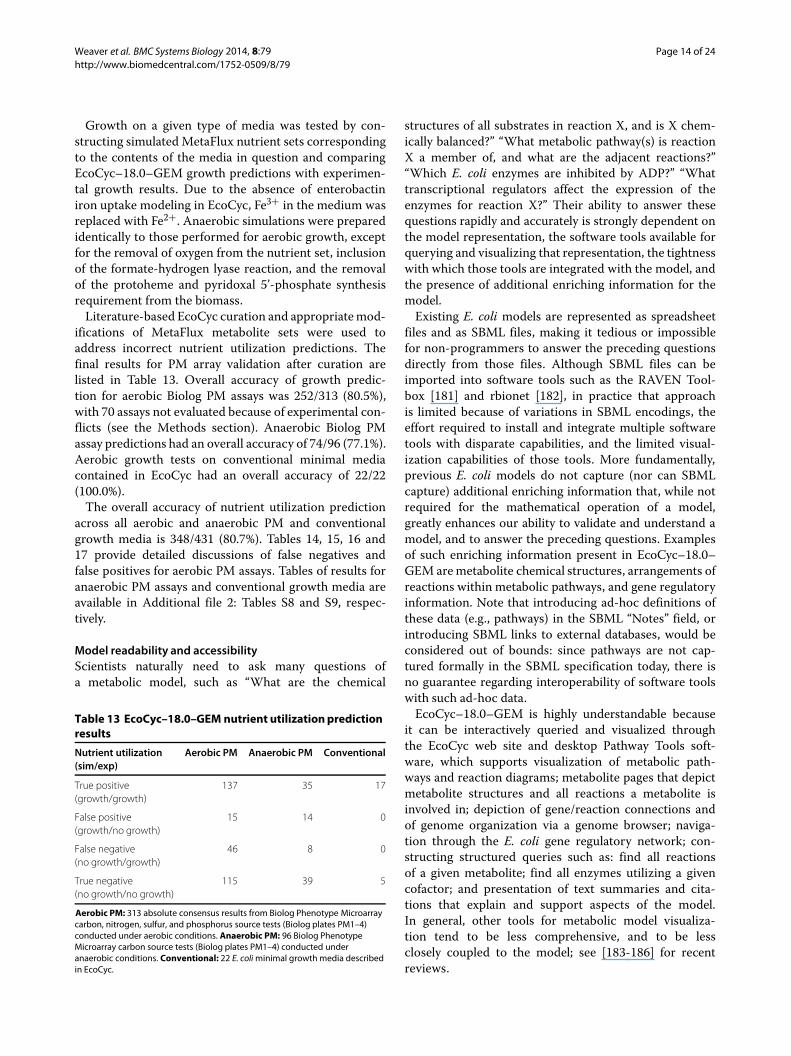
ifications of MetaFlux metabolite sets were used toaddress incorrect nutrient utilization predictions. Thefinal results for PM array validation after curation arelisted in Table 13. Overall accuracy of growth predic-tion for aerobic Biolog PM assays was 252/313 (80.5%),with 70 assays not evaluated because of experimental con-flicts (see the Methods section). Anaerobic Biolog PMassay predictions had an overall accuracy of 74/96 (77.1%).Aerobic growth tests on conventional minimal mediacontained in EcoCyc had an overall accuracy of 22/22(100.0%).The overall accuracy of nutrient utilization prediction
across all aerobic and anaerobic PM and conventionalgrowth media is 348/431 (80.7%). Tables 14, 15, 16 and17 provide detailed discussions of false negatives andfalse positives for aerobic PM assays. Tables of results foranaerobic PM assays and conventional growth media areavailable in Additional file 2: Tables S8 and S9, respec-tively.
Model readability and accessibilityScientists naturally need to ask many questions ofa metabolic model, such as “What are the chemical
Table 13 EcoCyc–18.0–GEM nutrient utilizationpredictionresults
Nutrient utilization Aerobic PM Anaerobic PM Conventional(sim/exp)
True positive 137 35 17(growth/growth)
False positive 15 14 0(growth/no growth)
False negative 46 8 0(no growth/growth)
True negative 115 39 5(no growth/no growth)
Aerobic PM: 313 absolute consensus results from Biolog Phenotype Microarraycarbon, nitrogen, sulfur, and phosphorus source tests (Biolog plates PM1–4)conducted under aerobic conditions. Anaerobic PM: 96 Biolog PhenotypeMicroarray carbon source tests (Biolog plates PM1–4) conducted underanaerobic conditions. Conventional: 22 E. coliminimal growthmedia describedin EcoCyc.
structures of all substrates in reaction X, and is X chem-ically balanced?” “What metabolic pathway(s) is reactionX a member of, and what are the adjacent reactions?”“Which E. coli enzymes are inhibited by ADP?” “Whattranscriptional regulators affect the expression of theenzymes for reaction X?” Their ability to answer thesequestions rapidly and accurately is strongly dependent onthe model representation, the software tools available forquerying and visualizing that representation, the tightnesswith which those tools are integrated with the model, andthe presence of additional enriching information for themodel.Existing E. coli models are represented as spreadsheet
files and as SBML files, making it tedious or impossiblefor non-programmers to answer the preceding questionsdirectly from those files. Although SBML files can beimported into software tools such as the RAVEN Tool-box [181] and rbionet [182], in practice that approachis limited because of variations in SBML encodings, theeffort required to install and integrate multiple softwaretools with disparate capabilities, and the limited visual-ization capabilities of those tools. More fundamentally,previous E. coli models do not capture (nor can SBMLcapture) additional enriching information that, while notrequired for the mathematical operation of a model,greatly enhances our ability to validate and understand amodel, and to answer the preceding questions. Examplesof such enriching information present in EcoCyc–18.0–GEM aremetabolite chemical structures, arrangements ofreactions within metabolic pathways, and gene regulatoryinformation. Note that introducing ad-hoc definitions ofthese data (e.g., pathways) in the SBML “Notes” field, orintroducing SBML links to external databases, would beconsidered out of bounds: since pathways are not cap-tured formally in the SBML specification today, there isno guarantee regarding interoperability of software toolswith such ad-hoc data.EcoCyc–18.0–GEM is highly understandable because
it can be interactively queried and visualized throughthe EcoCyc web site and desktop Pathway Tools soft-ware, which supports visualization of metabolic path-ways and reaction diagrams; metabolite pages that depictmetabolite structures and all reactions a metabolite isinvolved in; depiction of gene/reaction connections andof genome organization via a genome browser; naviga-tion through the E. coli gene regulatory network; con-structing structured queries such as: find all reactionsof a given metabolite; find all enzymes utilizing a givencofactor; and presentation of text summaries and cita-tions that explain and support aspects of the model.In general, other tools for metabolic model visualiza-tion tend to be less comprehensive, and to be lessclosely coupled to the model; see [183-186] for recentreviews.

Weaver et al. BMC Systems Biology 2014, 8:79 Page 15 of 24http://www.biomedcentral.com/1752-0509/8/79
Table 14 Conflicts between EcoCyc–18.0–GEM growth predictions and experimental carbon source utilization data foraerobic growth on Biolog PMplates at 37°C
Carbon source HT Sim Comments
Dextrins + – General dextrin uptake and catabolism via glg is described in EcoCyc, but the system is notapplied to the dextrins in EcoCyc–18.0–GEMbecause of MetaFlux’s current inability tomodelpolymerization reactions.
Lactulose + – Lactulose is taken up by the MelB melibiose transporter [153], although this route of uptakeis not present in EcoCyc. Lactulose is capable of inhibiting LacY transport of o-nitrophenyl-β-D-galactopyranoside [154], and can be anaerobically fermented by E. coli [155], but the routeof catabolism is unknown.
Methyl-α-D-galactopyranoside + – Methyl-α-D-galactopyranoside is taken up via the MelB melibiose transporter [153], and iscapable of inhibiting LacY transport of o-nitrophenyl-β-D-galactopyranoside [154]. The routeof catabolism is unknown.
Methyl-β-D-galactoside + – Methyl-β-D-galactoside is taken up via MglABC transporter or MelB transporter, but thecatabolic pathway is unknown. It is capable of inhibiting LacY transport of o-nitrophenyl-β-D-galactopyranoside [154], and is reported as a substrate of LacZ [156]. Inside the cell,methyl-β-D-galactoside is acetylated by LacA galactoside acetyltransferase [157], after whichits fate is unclear.
Methyl pyruvate + – Methyl pyruvate is a competitive inhibitor of the active pyruvate transport system [158]. Noroute of uptake for methyl pyruvate is present in EcoCyc, and the route of catabolism isunknown.
Melibionate + – These compounds’ route of uptake is unknown.
1-O-methyl-β-D-glucuronate + –
3-O-β-D-galactopyranosyl-D-arabinose + –
Methyl D-lactate + –
Mono-methyl hydrogen succinate + –
L-galactono-1,4-lactone + – The route of uptake is unknown; it may be catabolized via a ring opening to L-galactonate,as with D-galactono-1,4-lactone.
Meso-tartrate + – PM experiments indicate thatmeso-tartrate can be used as a carbon source by E. coli, incontradiction of the reports of [159] and [160].meso-tartrate is not associated withL/D-tartrate uptake processes in EcoCyc.
Bromosuccinate + – Bromosuccinate is described in the literature is as an irreversible inhibitor of aspartatetranscarbamylase [161] and it may be taken up via the same pathways as aspartate. No routeof uptake is present in EcoCyc.
2-hydroxybutyrate + – The route of uptake is unknown.
Citrate – + Most strains of E. coli cannot use citrate as a carbon source under aerobic conditions becauseof lack of transporter expression [162]; the citrate/succinate antiporter CitT is expressed underanaerobic conditions, although a cosubstrate is still required to generate reducing power toform succinate [163]. MetaFlux does not currently model gene regulation.
Putrescine – + These nitrogenous compounds cannot be used as carbon sources under the high-nitrogen4-aminobutyrate – + conditions of the Biolog PM carbon source assay, given the lack of Ntr-mediated expressionOrnithine – + of their catabolic pathways [164]. MetaFlux does not currently model gene regulation.
L-arginine – + Arginine cannot be used as a carbon source by E. coli K–12 because of the absence ofinduction and transport [165,166]. MetaFlux does not currently model gene regulation.
Cellobiose – + Cellobiose cannot be used as a carbon source by E. coli K–12 because of its inability to abolishrepression of the ChbABC chitobiose/cellobiose PTS permease system by NagC [167,168].MetaFlux does not currently model gene regulation.
Glycine – + Biolog PM experiments employing glycine as a carbon source return a consensus no-growthresult, but EcoCyc–18.0–GEM predicts that glycine can be used as a carbon source viaassimilation into 5,10-methyltetrahydrofolate by the glycine cleavage system. This is awasteful pathway, producing one CO2 and one molecule of 5,10-THF per glycine moleculetaken up. We found no information on conventional growth experiments assaying the abilityof E. coli K–12 to use glycine as a carbon source.

Weaver et al. BMC Systems Biology 2014, 8:79 Page 16 of 24http://www.biomedcentral.com/1752-0509/8/79
Table 14 Conflicts between EcoCyc–18.0–GEM growth predictions and experimental carbon source utilizationdata foraerobic growth on Biolog PMplates at 37°C (Continued)
D-tartrate – + D-tartrate does not support growth under aerobic conditions in the experiments of [160]. Ituses the anaerobic TtdT transporter in EcoCyc–18.0–GEM; the DcuB transporter may be thecorrect route of entry for D-tartrate under anaerobic conditions [159].
Ethanolamine – + E. coli requires a source of cob(I)alamin for catabolism of ethanolamine by theadenosylcobalamin-dependent ethanolamine ammonia-lyase [169-172]. MetaFlux does notcurrently model enzyme cofactor requirements.
Column headings are as follows:<Element> Source: Nutrient source under test. HT: High-throughput experiment. Sim: Simulation. Column entries are as follows:+: Nutrient can support growth. –: Nutrient cannot support growth. For example, D-fructose supports growth according to the consensus of experimental aerobicBiolog PM assays recorded in EcoCyc, but EcoCyc–18.0–GEM predicts that it does not support growth.
The reaction fluxes computed from EcoCyc–18.0–GEMare more understandable than those from previous E.coli models because EcoCyc–18.0–GEM fluxes can beimmediately painted onto the EcoCyc Cellular Overview,a zoomable diagram of the complete metabolic map of E.coli that allows immediate visual inspection of flux pat-terns. Although other software tools exist for visualizingflux patterns on metabolic networks, e.g., the RAVENToolbox, they are unlikely to be easily usable with previ-ous E. colimodels. For example, RAVEN Toolbox requiresthat the user manually construct the metabolic networkdiagram, which could take days or weeks of effort. In con-trast, Pathway Tools generates metabolic map diagramsalgorithmically from a PGDB.
ConclusionsEcoCyc–18.0–GEM demonstrates the advantages ofliterate modeling based on comprehensive organism
databases. It provides comprehensive genome-scale cov-erage of the E. coli metabolic network, represent-ing gene function with an unprecedented degree ofaccuracy.Integration of EcoCyc–18.0–GEM into the EcoCyc
database gives investigators working with the modelaccess to the full Pathway Tools bioinformatics and datavisualization suite. This allows construction of complexdatabase queries involving the full range of biochemicalentities within E. coli, and visualization of pathways andreactions within the model as they change throughout thecourse of construction. As part of EcoCyc, EcoCyc–18.0–GEM will receive frequent updates to remain abreast ofrecent research developments.The process of EcoCyc–18.0–GEM construction and
validation resulted in more than 80 updates to EcoCyc.These included expansion and revision of periplasmicphosphatase activities many updates to sugar transportand phosphotransferase system modeling; correction of
Table 15 Conflicts between EcoCyc–18.0–GEM growth predictions and experimental nitrogen source utilizationdata foraerobic growth on Biolog PMplates at 37°C
Nitrogen source HT Sim Comments
Guanine + – Guanine is not used as a nitrogen source by E. coli [173,174] in vivo, and its degradation does not proceed pastallantoin. EcoCyc–18.0–GEM is able to use guanine as a source of ammonia bymeans of glucose deamination andimmediate excretion of xanthine or urate.
5-aminopentanoate + – Routes of uptake and catabolism are unknown for 5-aminopentanoate and glucuronamide.
Glucuronamide + –
Ethanolamine – + E. coli requires a source of cob(I)alamin for catabolism of ethanolamine by the adenosylcobalamin-dependentethanolamine ammonia-lyase [169-172]. MetaFlux does not currently model enzyme cofactor requirements.
Allantoin – + Anaerobic conditions are required for E. coli to use allantoin as a nitrogen source [175].MetaFlux does not currentlymodel gene regulation.
Nitrate – + Nitrate and nitrite pass through nitrate and nitrite reductase pathways, which operate only under anaerobicNitrite – + conditions and do not function in an assimilatory fashion in E. coli [176-178].
L-tyrosine – + E. coli lacks a catabolic aromatic amino acid transaminase, preventing the utilization of L-tyrosine as a nitrogensource; the path of utilization in EcoCyc–18.0–GEM involves the tyrosine lyase used in thiazole biosynthesisfollowed by spontaneous dissociation of 2-iminoacetate to glyoxylate and ammonium, and is not biologicallyrealistic due to the production of large quantities of the dead-end metabolites 5’-deoxyadenosine and p-cresol.
See Table 14 caption for description of column headings.
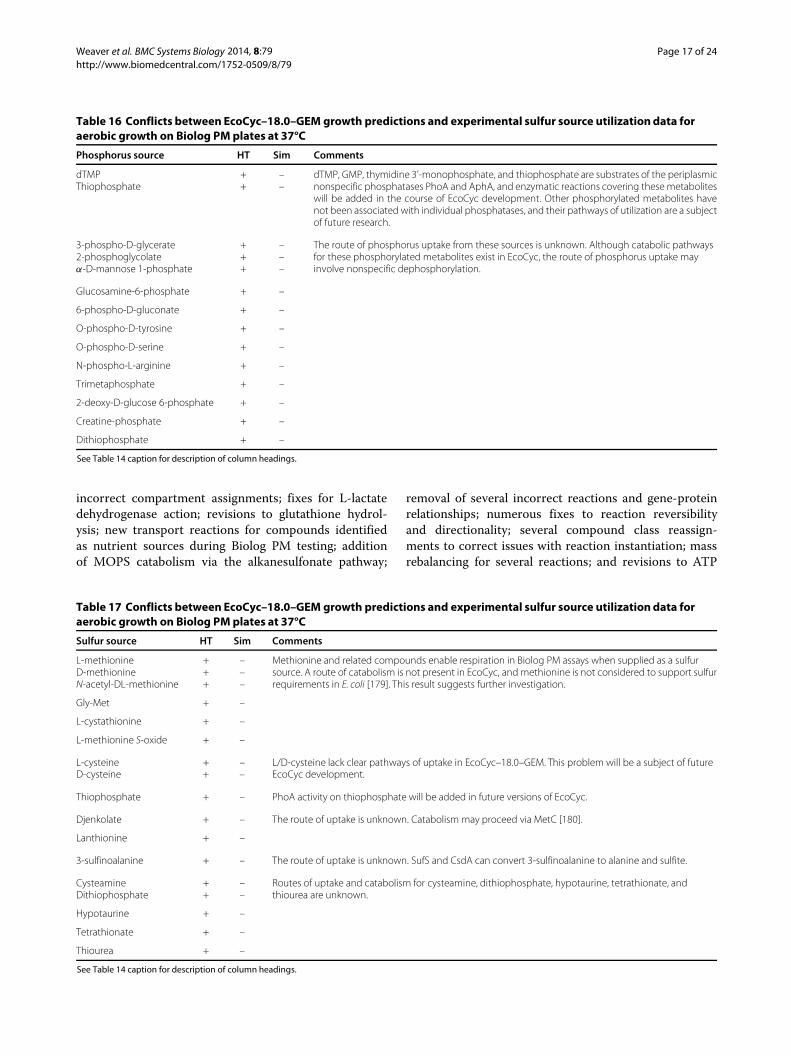
Weaver et al. BMC Systems Biology 2014, 8:79 Page 17 of 24http://www.biomedcentral.com/1752-0509/8/79
Table 16 Conflicts between EcoCyc–18.0–GEM growth predictions and experimental sulfur source utilizationdata foraerobic growth on Biolog PMplates at 37°C
Phosphorus source HT Sim Comments
dTMP + – dTMP, GMP, thymidine 3’-monophosphate, and thiophosphate are substrates of the periplasmicThiophosphate + – nonspecific phosphatases PhoA and AphA, and enzymatic reactions covering thesemetabolites
will be added in the course of EcoCyc development. Other phosphorylated metabolites havenot been associated with individual phosphatases, and their pathways of utilization are a subjectof future research.
3-phospho-D-glycerate + – The route of phosphorus uptake from these sources is unknown. Although catabolic pathways2-phosphoglycolate + – for these phosphorylated metabolites exist in EcoCyc, the route of phosphorus uptake mayα-D-mannose 1-phosphate + – involve nonspecific dephosphorylation.
Glucosamine-6-phosphate + –
6-phospho-D-gluconate + –
O-phospho-D-tyrosine + –
O-phospho-D-serine + –
N-phospho-L-arginine + –
Trimetaphosphate + –
2-deoxy-D-glucose 6-phosphate + –
Creatine-phosphate + –
Dithiophosphate + –
See Table 14 caption for description of column headings.
incorrect compartment assignments; fixes for L-lactatedehydrogenase action; revisions to glutathione hydrol-ysis; new transport reactions for compounds identifiedas nutrient sources during Biolog PM testing; additionof MOPS catabolism via the alkanesulfonate pathway;
removal of several incorrect reactions and gene-proteinrelationships; numerous fixes to reaction reversibilityand directionality; several compound class reassign-ments to correct issues with reaction instantiation; massrebalancing for several reactions; and revisions to ATP
Table 17 Conflicts between EcoCyc–18.0–GEM growth predictions and experimental sulfur source utilizationdata foraerobic growth on Biolog PMplates at 37°C
Sulfur source HT Sim Comments
L-methionine + – Methionine and related compounds enable respiration in Biolog PM assays when supplied as a sulfurD-methionine + – source. A route of catabolism is not present in EcoCyc, and methionine is not considered to support sulfurN-acetyl-DL-methionine + – requirements in E. coli [179]. This result suggests further investigation.
Gly-Met + –
L-cystathionine + –
L-methionine S-oxide + –
L-cysteine + – L/D-cysteine lack clear pathways of uptake in EcoCyc–18.0–GEM. This problem will be a subject of futureD-cysteine + – EcoCyc development.
Thiophosphate + – PhoA activity on thiophosphate will be added in future versions of EcoCyc.
Djenkolate + – The route of uptake is unknown. Catabolism may proceed via MetC [180].
Lanthionine + –
3-sulfinoalanine + – The route of uptake is unknown. SufS and CsdA can convert 3-sulfinoalanine to alanine and sulfite.
Cysteamine + – Routes of uptake and catabolism for cysteamine, dithiophosphate, hypotaurine, tetrathionate, andDithiophosphate + – thiourea are unknown.
Hypotaurine + –
Tetrathionate + –
Thiourea + –
See Table 14 caption for description of column headings.

Weaver et al. BMC Systems Biology 2014, 8:79 Page 18 of 24http://www.biomedcentral.com/1752-0509/8/79
synthase proton stoichiometry. These updates are out-lined in Additional file 2: Table S11.The MetaFlux software has also been improved as a
result of the FBA validation of EcoCyc. These improve-ments include upgrades to compartmentalization han-dling, gene deletion code, and electron transfer reac-tion handling. MetaFlux solution and log files have beenupdated to contain additional statistical information andprovide a more detailed explanation of the metabolic net-work construction process to the user. Numerous updatesand revisions to the MetaFlux model of E. coli have beenintroduced as part of this effort. Biomass metabolite setshave been revised to reflect the work of Orth et al., andadditional updates have been made on the basis of the val-idation process in order to create the most accurate finalproduct possible.Many questions of interest to E. coli modelers and
experimentalists were raised in the course of EcoCyc–18.0–GEM development. By highlighting these questionsand presenting them within the context of EcoCyc as areference database, we address the interests of the generalmetabolic modeling audience and of E. coli experimen-talists interested in using models to explore their resultsand generate new leads for research.We summarize thesequestions here.Experimental measurements of respiratory fluxes in
glucose-fed aerobic chemostat culture are higher thanthose predicted by simulation, and small quantities of suc-cinate and lactate are generated in experimental anaerobicfermentations, suggesting interesting in vivo deviationsfrom theoretical in silico optimality.A small number of metabolic byproducts must be
removed directly from the cytosol in the secretion setbecause of a lack of known salvage or excretion pathways.The fate of these metabolites is of interest.Several incorrect essentiality predictions are associ-
ated with unclear cellular biomass requirements, path-ways with potential alternate routes of catalysis, uncer-tain determinations of essentiality on glucose minimalmedia, and ambiguous or missing gene function. Sim-ilarly, nutrient utilization predictions have identified anumber of compounds that lack clear pathways of entryinto metabolism but are capable of supporting respirationand/or growth. Resolution of these uncertainties wouldimprove our understanding of E. coli function in varyingenvironments.
MethodsThe data used for this project were obtained from Eco-Cyc version 18.0, and the bioinformatics and flux analysisprocedures documented here were performed in eitherthe Web or desktop environment of the Pathway Tools18.0 software. Pathway Tools can be downloaded, alongwith documentation and example files, at http://brg.ai.
sri.com/ptools/. The simulation tests were constructedby using Lisp scripting and the Pathway Tools Lisp API,documented at http://brg.ai.sri.com/ptools/api/. Furtherdetails on the construction of EcoCyc–18.0–GEM can befound within Additional file 1.EcoCyc–18.0–GEM development employed the
MetaFlux component of Pathway Tools, documented inthe Pathway Tools User’s Guide and in [15]. All simula-tions were run in solving mode on a 2.7 GHz i7 MacBookPro with 16 GB RAM. The “minimize-fluxes: yes” optionwas used for taxicab norm minimization of fluxes. Foradditional information, see the Pathway Tools User’sGuide. AMetaFlux .fba file demonstrating simulation ofaerobic growth of E. coli BW25113 on glucose is includedas Additional file 3.We note that the choice of stoichiometric representa-
tion of equations can affect flux balance solutions whenminimization of summed flux is used as part of the objec-tive function; see [187] for further details. Stoichiometriccoefficients within EcoCyc–18.0–GEM are scaled so as toprovide minimum whole-integer stoichiometry. Applica-tion of different scaling within the flux network may leadto altered flux solutions.Briefly, MetaFlux creates a stoichiometric metabolic
flux network at run time from the metabolites andreactions contained in a Pathway Tools PGDB. Duringnetwork construction, MetaFlux removes PGDB reac-tions that are: ambiguously instantiated (see below);unbalanced or having an undetermined balance state;disconnected from the network; marked as physiologi-cally irrelevant; involved in polymerization; involved inpolymer segment or protein modification; lacking sub-strates on one side; containing substrate entities that aredescribed only by strings; possessed of variable stoichiom-etry; or have more than 10,000 permutations that mustbe checked during instantiation. MetaFlux then instanti-ates reactions containing compound classes, replacing theclass reactions with mass-balanced reactions containinginstances of the relevant compound classes. The resultingset of metabolites and reactions constitutes the metabolicflux network operated on by MetaFlux. Enzymatic reac-tion and gene-protein relationship data encoded in thePGDB are used to associate the reactions of the networkwith enzymes and genes as appropriate.COBRA [20,188] simulations of the iJO1366 E. coli
genome-scale reconstruction were employed in orderto validate the EcoCyc FBA simulations and to pro-vide a point of comparison to existing reference mod-els. The iJO1366 simulations were performed using theCOBRA Toolbox 5.0.0 within MATLAB R2010a andcobrapy 0.2 within Python 2.7.6. All iJO1366 simu-lations used taxicab norm minimization of fluxes asdescribed in the documentation for the optimizeCbModelfunction.
Weaver et al. BMC Systems Biology 2014, 8:79 Page 19 of 24http://www.biomedcentral.com/1752-0509/8/79
Biomass metabolite sets were constructed using thewild-type and core biomass sets of Orth et al. and modi-fied according to our research findings and experimentaldata on gene essentiality. The ATP turnover require-ment for growth-associated maintenance costs (GAM)was set to 53.95 mmol ATP/gCDW, while the ATPturnover requirement for non-growth-associated mainte-nance costs (NGAM) was set to 3.15 mmol ATP/gCDW,per Orth et al.All coefficients of the biomass metabolite set represent
millimoles (mmol) of each metabolite required per gramof cell dry weight (gCDW). Coefficients of the nutrientand metabolite sets represent specific uptake and outputfluxes, in millimoles of each metabolite supplied per gramof cell dry weight per hour (mmol/gCDW/hr). An overallbiomass flux of 1.0 thus represents a specific growth rateμ of 1.0 hr−1 (one new gram of cell dry weight per gramof cell dry weight per hour).Aerobic glucose chemostat data for experimental com-
parisons were obtained from [23]. Anaerobic glucosechemostat data were obtained from [24] via [25].The protocols followed in our PM experiments are
as follows: PM plates 1–4 containing 190 sole carbonsources, 95 sole nitrogen sources, 59 sole phosphatesources and 35 sole sulfur sources were used in this anal-ysis. E. coli MG1655 was obtained from the Yale ColiGenetic Stock Center, pre-grown on nutrient agar andused to inoculate the plates following Biolog instruc-tions. The data were collected and analyzed using theOmniLogH PM system, which records the color changeevery 15 min for each well in the 96 well assay plates. Allincubations were performed at 37°C over 48 hr. For thecomplete details of all PM assay conditions, please refer tothe original publications.The PM nutrient-source assay is an assay of respiration
based on the generation of NADH by carbon metabolismand the subsequent reduction of a tetrazolium redox dyeby NADH. As such, it does not directly measure eitherthe cell growth simulated by FBA biomass objectives orthe uptake of noncarbon sources. However, checkpointlinkage of carbon-source catabolism to nitrogen, phos-phorus, and sulfur source catabolism enables the tetra-zolium redox dye assay to probe the metabolism of non-carbon sources [189]. Bochner describes the phenomenonof checkpoint linkage as starvation for elemental nutri-ent source leading to arrest of cellular respiration, dueto redox imbalance or alarmone synthesis. We there-fore compared PM respiration results directly with FBAgrowth simulation.Biolog PM results are storedwithin the EcoCyc database
and are accessible via the Pathway Tools API and EcoCycwebsite. Individual Biolog PM assay scores for each wellwere compared across experimental datasets to estab-lish a consensus for comparison with EcoCyc–18.0–GEM
simulation. Because simulations of nutrient utilizationwere scored according to growth or no growth, exper-imental Biolog PM results indicating ‘normal’ and ‘low’respiration were combined into a ‘positive’ result. Themajority of Biolog PM tests (313/383) displayed a con-sensus of either respiration or no respiration across allfour experimental datasets used. In 70 of 383 cases, noclear consensus could be reached. These divergent caseswere omitted from the nutrient-utilization assay valida-tion because no reliable conclusion could be reachedregarding the results. See Additional file 2: Table S10 for alist of omitted PM data.
Additional files
Additional file 1: Supplementary information text and tabledescriptions.
Additional file 2: Supplementary tables (11 tables).
Additional file 3: MetaFlux .fba file demonstrating simulation ofaerobic growth of E. coli BW25113 on glucose.
Competing interestsDSW, IMK, and PDK receive fees from SRI International commercial licensing ofPathway Tools.
Authors’ contributionsPDK and DSW conceived and designed the experiments. DSW constructed themodel and conducted the simulations. DSW analyzed the data. IMK, AM, andDSW curated the database. DSW and PDK wrote the manuscript. AM and ITPperformed phenotype microarray experiments. All authors read and approvedthe final manuscript.
AcknowledgementsThe authors would like to thank Mario Latendresse and Markus Krummenackerfor MetaFlux development and support, and Larry Reitzer for calling ourattention to the problem of dapC essentiality. This work was supported byaward number U24GM077678 from the National Institute of General MedicalSciences. The content of this article is solely the responsibility of the authorsand does not necessarily represent the official views of the National Institute ofGeneral Medical Sciences or the National Institutes of Health.
Author details1Bioinformatics Research Group, SRI International, 333 Ravenswood Ave.,94025 Menlo Park, CA, USA. 2Department of Chemistry and BiomolecularScience, Macquarie University, Balaclava Rd, North Ryde NSW 2109, Australia.
Received: 22 March 2014 Accepted: 19 June 2014Published: 30 June 2014
References1. Orth JD, Thiele I, Palsson BØ:What is flux balance analysis? Nat
Biotechnol 2010, 28(3):245–248.2. Thiele I, Palsson BØ: A protocol for generating a high-quality
genome-scale metabolic reconstruction. Nat Protoc 2010,5(1):93–121.
3. Edwards J, Palsson BØ: The Escherichia coli MG1655 in silicometabolic genotype: its definition, characteristics, and capabilities.Proc Natl Acad Sci U S A 2000, 97:5528–5533.
4. Reed JL, Vo TD, Schilling CH, Palsson BØ: An expanded genome-scalemodel of Escherichia coli K-12 (iJR904 GSM/GPR). Genome Biol 2003,4(9):54.
5. Feist AM, Henry CS, Reed JL, Krummenacker M, Joyce AR, Karp PD,Broadbelt LJ, Hatzimanikatis V, Palsson BØ: A genome-scale metabolicreconstruction for Escherichia coli K–12 MG1655 that accounts for1260 ORFs and thermodynamic information.Mol Syst Biol 2007, 3:121.

Weaver et al. BMC Systems Biology 2014, 8:79 Page 20 of 24http://www.biomedcentral.com/1752-0509/8/79
6. Orth JD, Conrad TM, Na J, Lerman JA, Nam H, Feist AM, Palsson BØ: Acomprehensive genome-scale reconstruction of Escherichia colimetabolism—2011. Mol Syst Biol 2011, 7:535.
7. Majewski RA, Domach MM: Simple constrained-optimization view ofacetate overflow in E. coli. Biotechnol Bioeng 1990, 35(7):732–738.
8. Varma A, Boesch BW, Palsson BØ: Biochemical production capabilitiesof Escherichia coli. Biotechnol Bioeng 1993, 42(1):59–73.
9. Varma A, Palsson BØ:Metabolic capabilities of Escherichia coli: I.synthesis of biosynthetic precursors and cofactors. J Theor Biol 1993,165(4):477–502.
10. Pramanik J, Keasling JD: Stoichiometric model of Escherichia colimetabolism: incorporation of growth-rate dependent biomasscomposition andmechanistic energy requirements. BiotechnolBioeng 1997, 56(4):398–421.
11. Oberhardt MA, Palsson BØ, Papin JA: Applications of genome-scalemetabolic reconstructions. Mol Syst Biol 2009, 5:320.
12. Lewis NE, Nagarajan H, Palsson BØ: Constraining themetabolicgenotype-phenotype relationship using a phylogeny of in silicomethods. Nat Rev Microbiol 2012, 10(4):291–305.
13. McCloskey D, Palsson BØ, Feist AM: Basic and applied uses ofgenome-scale metabolic network reconstructions of Escherichiacoli.Mol Syst Biol 2013, 9:661.
14. Keseler IM, Mackie A, Peralta-Gil M, Santos-Zavaleta A, Gama-Castro S,Bonavides-Martinez C, Fulcher C, Huerta AM, Kothari A, KrummenackerM, Latendresse M, Muniz-Rascado L, Ong Q, Paley S, Schroder I, ShearerAG, Subhraveti P, Travers M, Weerasinghe D, Weiss V, Collado-Vides J,Gunsalus RP, Paulsen I, Karp PD: EcoCyc: fusingmodel organismdatabases with systems biology. Nucleic Acids Res 2013,41(Database issue):605–612.
15. Latendresse M, Krummenacker M, Trupp M, Karp PD: Construction andcompletion of flux balancemodels from pathway databases.Bioinformatics 2012, 28:388–396.
16. Karp PD, Paley SM, Krummenacker M, Latendresse M, Dale JM, Lee T,Kaipa P, Gilham F, Spaulding A, Popescu L, Altman T, Paulsen I, KeselerIM, Caspi R: Pathway Tools version 13.0: integrated software forpathway/genome informatics and systems biology. Brief Bioinform2010, 11:40–79 doi:10.1093/bib/bbp043.
17. O’Brien EJ, Lerman JA, Chang RL, Hyduke DR, Palsson BØ: Genome-scalemodels of metabolism and gene expression extend and refinegrowth phenotype prediction. Mol Syst Biol 2013, 9:693.
18. Knuth DE: Literate programming. Comput J 1984, 27(2):97–111.19. Mackie A, Keseler IM, Nolan L, Karp PD, Paulsen IT: Dead end
metabolites— defining the known unknowns of the E. colimetabolic network. PLoS One 2013, 8(9):75210.
20. Schellenberger J, Que R, Fleming RM, Thiele I, Orth JD, Feist AM, ZielinskiDC, Bordbar A, Lewis NE, Rahmanian S, Kang J, Hyduke DR, Palsson BØ:Quantitative prediction of cellular metabolism withconstraint-basedmodels: the COBRA toolbox v2.0. Nat Protoc 2011,6:1290–1307.
21. Treberg JR, Brand MD: Amodel of the proton translocationmechanism of complex I. JBC 2011, 286(20):17579–17584.
22. Wikstrom M, Hummer G: Stoichiometry of proton translocation byrespiratory complex I and its mechanistic implications. PNAS 2012,109(12):4431–4436.
23. Kayser A, Weber J, Hecht V, Rinas U:Metabolic flux analysis ofEscherichia coli in glucose-limited continuous culture. i.growth-rate-dependent metabolic efficiency at steady state.Microbiology 2005, 151:693–706.
24. Belaich A, Belaich JP:Microcalorimetric study of the anaerobicgrowth of Escherichia coli: growth thermograms in a syntheticmedium. J Bacteriol 1976, 72:497–499.
25. Varma A, Boesch BW, Palsson BØ: Stoichiometric interpretation ofEscherichia coli glucose catabolism under various oxygenationrates. Appl Environ Microbiol 1993, 59(8):2465–2473.
26. Zhuang K, Vemuri GN, Mahadevan R: Economics of membraneoccupancy and respiro-fermentation. Mol Syst Biol 2011, 7:500.
27. van Hoek MJA, Merks RMH: Redox balance is key to explaining full vs.partial switching to low-yield metabolism. BMC Syst Biol 2012, 6:22.
28. Ibarra RU, Edwards JS, Palsson BØ: Escherichia coli K-12 undergoesadaptive evolution to achieve in silico predicted optimal growth.Nature 2002, 420:186–189.
29. Milne CB, Kim PJ, Eddy JA, Price ND: Accomplishments ingenome-scale in silico modeling for industrial andmedicalbiotechnology. Biotechnol J 2009, 4(12):1653–16570.
30. Gianchandani EP, Chavali AK, Papin JA: The application of fluxbalance analysis in systems biology.WIREs Syst Biol Med 2010,2(3):372–382.
31. Lee JW, Na D, Park JM, Lee J, Choi S, Lee SY: Systems metabolicengineering of microorganisms for natural and non-naturalchemicals. Nat Chem Biol 2012, 8:536–546.
32. Baba T, Ara T, Hasegawa M, Takai Y, Okumura Y, Baba M, Datsenko KA,Tomita M, Wanner BL, Mori H: Construction of Escherichia coli K–12in-frame, single-gene knockoutmutants: The Keio collection. MolSyst Biol 2006, 2(2006):0008.
33. Yamamoto N, Nakahigashi K, Nakamichi T, Yoshino M, Takai Y, Touda Y,Furubayashi A, Kinjyo S, Dose H, Hasegawa M, Datsenko KA, NakayashikiT, Tomita M, Wanner BL, Mori H: Update on the collection ofEscherichia coli single-gene deletion mutants.Mol Syst Biol 2009,5:335.
34. Joyce AR, Reed JL, White A, Edwards R, Osterman A, Baba T, Mori H,Lesely SA, Palsson BØ, Agarwalla S: Experimental and computationalassessment of conditionally essential genes in Escherichia coli.J Bacteriol 2006, 188(23):8259–8271.
35. Cox RJ, Wang PSH: Is N-acetylornithine aminotransferase the realN-succinyl-LL-diaminopimelate aminotransferase in Escherichiacoli andMycobacterium smegmatis? J Chem Soc, Perkin Trans 2001,1:2006–2008.
36. Kim J, Copley S:Whymetabolic enzymes are essential ornonessential for growth of Escherichia coli K–12 on glucose.Biochemistry 2007, 46(44):12501–12511.
37. van der Ploeg JR, Eichhorn E, Leisinger T: Sulfonate-sulfurmetabolismand its regulation in Escherichia coli. ArchMicrobiol 2001, 176:1–8.
38. Bykowski T, van der Ploeg JR, Iwanicka-Nowicka R, Hryniewicz MM: Theswitch from inorganic to organic sulphur assimilation in Escherichiacoli: adenosine 5’-phosphosulphate (APS) as a signallingmoleculefor sulphate excess. Mol Microbiol 2002, 43(5):1347–1358.
39. Richaud C, Higgins W, Mengin-Lecruelx D, Stragier P:Molecularcloning, characterization, and chromosomal localization of dapF,the Escherichia coli gene for diaminopimelate epimerase. J Bacteriol1987, 169(4):1454–1459.
40. Mengin-Lecruelx D, Michaud C, Richaud C, Blanot D, van Heijenoort J:Incorporation of LL-diaminopimelic acid into peptidoglycan ofEscherichia colimutants lacking diaminopimelate epimeraseencoded by dapF. J Bacteriol 1988, 170(5):2031–2039.
41. el-Hajj HH, Zhang H, Weiss B: Lethality of a dut (deoxyuridinetriphosphatase) mutation in Escherichia coli. J Bacteriol 1988,170(3):1069–1075.
42. Gross M, Marianovsky I, Glaser G:MazG - a regulator of programmedcell death in Escherichia coli.Mol Microbiol 2006, 59(2):590–601.
43. Haussmann C, Rohdich F, Schmidt E, Bacher A, Richter G: Biosynthesisof pteridines in Escherichia coli. Structural andmechanisticsimilarity of dihydroneopterin-triphosphate epimerase anddihydroneopterin aldolase. J Biol Chem 1998, 273(28):17418–17424.
44. Kato J, Hashimoto M: Construction of consecutive deletions of theEscherichia coli chromosome. Mol Syst Biol 2007, 3:132.
45. Fermer C, Swedberg G: Adaptation to sulfonamide resistance inNeisseriameningitidismay have required compensatory changesto retain enzyme function: kinetic analysis of dihydropteroatesynthases from N.meningitidis expressed in a knockout mutant ofEscherichia coli. J Bacteriol 1997, 179(3):831–837.
46. Inoue A, Murata Y, Takahashi H, Tsuji N, Fujisaki S, Kato J: Involvementof an essential gene,mviN, in murein synthesis in Escherichia coli.J Bacteriol 2008, 190(21):7298–7301.
47. Ruiz N: Bioinformatics identification of MurJ (MviN) as thepeptidoglycan lipid II flippase in Escherichia coli. PNAS 2008,105(21):15553–15557.
48. Mohammadi T, van Dam V, Sijbrandi R, Vernet T, Zapun A, Bouhss A,MD-d Bruin, Nguyen-Disteche M, de Kruijff B, Breukink E: Identificationof FtsW as a transporter of lipid-linked cell wall precursors acrossthe membrane. EMBO J 2011, 30(8):1425–1432.
49. Jermy A: Bacterial physiology: flipping lipids. Nat Rev Microbiol 2011,9(5):314.
Weaver et al. BMC Systems Biology 2014, 8:79 Page 21 of 24http://www.biomedcentral.com/1752-0509/8/79
50. Butler EK, Davis RM, Bari V, Nicholson PA, Ruiz N: Structure-functionanalysis of MurJ reveals a solvent-exposed cavity containingresidues essential for peptidoglycan biogenesis in Escherichia coli.J Bacteriol 2013, 195(20):4639–4649.
51. Sperandeo P, Pozzi C, Deho G, Polissi A: Non-essential kdobiosynthesis and new essential cell envelope biogenesis genes inthe Escherichia coli yrbG-yhbG locus. Res Microbiol 2006,157(6):547–558.
52. Mamat U, Meredith TC, Aggarwal P, Kuhl A, Kirchoff P, Lindner B,Hanuszkiewicz A, Sun J, Holst O, Woodard RW: Single amino acidsubstitutions in either YhjD or MsbA confer viability to3-deoxy-d-manno-oct-2-ulosonic acid-depleted Escherichia coli.Mol Microbiol 2008, 67(3):633–648.
53. Klein G, Lindner B, Brabetz W, Brade H, Raina S: Escherichia coli, K–12suppressor-free mutants lacking early glycosyltransferases andlate acyltransferases: minimal lipopolysaccharide structure andinduction of envelope stress response. J Biol Chem 2008,284(23):15369–151389.
54. Green JM, Merkel WK, Nichols BP: Characterization and sequence ofEscherichia coli pabC, the gene encoding aminodeoxychorismatelyase, a pyridoxal phosphate-containing enzyme. J Bacteriol 1992,174(16):5317–5323.
55. Langley D, Guest JR: Biochemical genetics of the α-keto aciddehydrogenase complexes of Escherichia coli K–12: Isolation andbiochemical properties of deletion mutants. J Gen Microbiol 1977,99:263–276.
56. Chang YY, Cronan JE:Mapping nonselectable genes of Escherichiacoli by using transposon Tn10: location of a gene affectingpyruvate oxidase. J Bacteriol 1982, 151(3):1279–1289.
57. Abdel-Hamid AM, Attwood MM, Guest JR: Pyruvate oxidasecontributes to the aerobic growth efficiency of Escherichia coli.Microbiology 2001, 147:1483–1498.
58. Hillman JD, Fraenkel DG: Glyceraldehyde 3-phosphatedehydrogenase mutants of Escherichia coli. J Bacteriol 1975,122(3):1175–1179.
59. Irani M, Maitra PK: Properties of Escherichia colimutants deficient inenzymes of glycolysis. J Bacteriol 1977, 132(2):398–410.
60. Reeves HC, Ajl SJ: Alpha-hydroxyglutaric acid synthetase. J Bacteriol1962, 84:186–187.
61. Wegener WS, Reeves HC, Ajl SJ: Heterogeneity of theglyoxylate-condensing enzymes. J Bacteriol 1965, 90(3):594–598.
62. Helling RB, Kukora JS: Nalidixic acd-resistant mutants of Escherichiacoli deficient in isocitrate dehydrogenase. J Bacteriol 1971,105(3):1224–1226.
63. Lakshmi TM, Helling RB: Selection for citrate synthase deficiency inicdmutants of Escherichia coli. J Bacteriol 1976, 127(1):76–83.
64. Kabir MM, Shimizu K:Metabolic regulation analysis of icd-geneknockout Escherichia coli based on 2d electrophoresis withmaldi-tof mass spectrometry and enzyme activitymeasurements.Appl Microbiol Biotechnol 2004, 65(1):84–96.
65. Lin H, Bennett GN, San KY: Genetic reconstruction of the aerobiccentral metabolism in Escherichia coli for the absolute aerobicproduction of succinate. Biotechnol Bioeng 2005, 89(2):148–156.
66. Kalliri E, Mulrooney SB, Hausinger RP: Identification of Escherichia coliygaF as an L-2-hydroxyglutarate oxidase. J Bacteriol 2008,190(11):3793–3798.
67. Reinoso CA, Appanna VD, Vasquez CC: α-ketoglutarate accumulationis not dependent on isocitrate dehydrogenase activity duringtellurite detoxification in Escherichia coli. Biomed Res Int 2013,2013:784190.
68. Stribling D, Perham RN: Purification and characterization of twofructose diphosphate aldolases from Escherichia coli (Crookes’strain). Biochem J 1973, 131(4):833–841.
69. Scamuffa MD, Caprioli RM: Comparison of the mechanisms of twodistinct aldolases from Escherichia coli grown on gluconeogenicsubstrates. Biochim Biophys Acta 1980, 614(2):583–590.
70. Schurmann M, Sprenger GA: Fructose-6-phosphate aldolase is anovel class I aldolase from Escherichia coli and is related to a novelgroup of bacterial transaldolases. JBC 2001, 276:11055–11061.
71. Baechler C, Schneider P, Baehler P, Lustig A, Erni B: Escherichia colidihydroxyacetone kinase controls gene expression by binding totranscription factor dhaR. EMBO J 2005, 24(2):283–293.
72. Gerike U, Hough DW, Russell NJ, Dyall-Smith ML, Danson MJ: Citratesynthase and 2-methylcitrate synthase: structural, functional andevolutionary relationships. Microbiology 1998, 144(4):929–935.
73. Orth JD, Palsson B: Gap-filling analysis of the iJO1366 Escherichia colimetabolic network reconstruction for discovery of metabolicfunctions. BMC Syst Biol 2012, 6:30.
74. Kotlarz D, Garreau H, Buc H: Regulation of the amount and of theactivity of phosphofructokinases and pyruvate kinases inEscherichia coli. Biochim Biophys Acta 1975, 381(2):257–268.
75. Lovingshimer MR, Siegele D, Reinhart GD: Construction of aninducible, pfkA and pfkB deficient strain of Escherichia coli for theexpression and purification of phosphofructokinase from bacterialsources. Protein Expr Purif 2006, 46:475–482.
76. Peng L, Arauzo-Bravo MJ, Shimizu K:Metabolic flux analysis for a ppcmutant Escherichia coli based on 13C-labelling experimentstogether with enzyme activity assays and intracellular metabolitemeasurements. FEMSMicrobiol Lett 2004, 235(1):17–23.
77. Patrick WM, Quandt EM, Swartzlander DB, Matsumura I:Multicopysuppression underpinsmetabolic evolvability.Mol Biol Evol 2007,24(12):2716–2722.
78. Ferguson GP, Totemeyer S, MacLean MJ, Booth IR:Methylglyoxalproduction in bacteria: suicide or survival? ArchMicrobiol 1998,170(4):209–219.
79. Fong SS, Nanchen A, Palsson BØ, Sauer U: Latent pathway activationand increased pathway capacity enable Escherichia coli adaptationto loss of key metabolic enzymes. J Biol Chem 2006,281(12):8024–8033.
80. Michel G, Roszak AW, Sauve V, Maclean J, Matte A, Coggins JR, Cygler M,Lapthorn AJ: Structures of shikimate dehydrogenase AroE and itsparalog YdiB. a common structural framework for differentactivities. J Biol Chem 2003, 278(21):19463–19472.
81. Johansson L, Liden G: Transcriptome analysis of a shikimic acidproducing strain of Escherichia coliW3110 grown under carbon-and phosphate-limited conditions. J Biotechnol 2006, 126(4):528–545.
82. Guilloton MB, Lamblin AF, Kozliak EI, Gerami-Nejad M, Tu C, Silverman D,Anderson PM, Fuchs JA: A physiological role for cyanate-inducedcarbonic anhydrase in Escherichia coli. J Bacteriol 1993,175(5):1443–1451.
83. Howell EE, Foster PG, Foster LM: Construction of a dihydrofolatereductase-deficient mutant of Escherichia coli by genereplacement. J Bacteriol 1988, 170(7):3040–3045.
84. Pribat A, Blaby IK, Lara-Núñez A, Gregory JF3rd, de Crécy-Lagard V,Hanson AD: FolX and FolM are essential for tetrahydromonapterinsynthesis in Escherichia coli and Pseudomonas aeruginosa.J Bacteriol 2010, 192(2):475–482.
85. Shim JH, Benkovic SJ: Evaluation of the kinetic mechanism ofEscherichia coli glycinamide ribonucleotide transformylase.Biochemistry 1998, 37(24):8776–8782.
86. Newman EB, Kapoor V, Potter R: Role of L-threonine dehydrogenasein the catabolism of threonine and synthesis of glycine byEscherichia coli. J Bacteriol 1976, 126(3):1245–1249.
87. Liu JQ, Dairi T, Itoh N, Kataoka M, Shimizu S, Yamada H: Gene cloning,biochemical characterization and physiological role of athermostable low-specificity L-threonine aldolase from Escherichiacoli. Eur J Biochem 1998, 255(1):220–226.
88. Vales LD, Chase JW, Murphy JB: Orientation of the guanine operon ofEscherichia coli K–12 by utilizing strains containing guaB-xse andguaB-upp deletions. J Bacteriol 1979, 139(1):320–322.
89. Umbarger HE, Brown B: Threonine deamination in Escherichia coli. II.Evidence for two L-threonine deaminases. J Bacteriol 1957,73(1):105–112.
90. Zhao X, Miller JR, Jiang Y, Marletta MA, Cronan JE: Assembly of thecovalent linkage between lipoic acid and its cognate enzymes.Chem Biol 2003, 10(12):1293–1302.
91. Reidl J, Boos W: ThemalXmalY operon of Escherichia coli encodes anovel enzyme II of the phosphotransferase system recognizingglucose andmaltose and an enzyme abolishing the endogenousinduction of the maltose system. J Bacteriol 1991, 173(15):4862–4876.
92. Zdych E, Peist R, Reidl J, Boos W:MalY of Escherichia coli is an enzymewith the activity of a beta C-S lyase (cystathionase). J Bacteriol 1995,177(17):5035–5039.

Weaver et al. BMC Systems Biology 2014, 8:79 Page 22 of 24http://www.biomedcentral.com/1752-0509/8/79
93. Boos W, Shuman H:Maltose/maltodextrin system of Escherichia coli:transport, metabolism, and regulation.Microbiol Mol Biol Rev 1998,62(1):204–229.
94. Cohen GN, Stanier RY, Bras GL: Regulation of the biosynthesis ofamino acids of the aspartate family in coliform bacteria andpseudomonads. J Bacteriol 1969, 99(3):791–801.
95. Garriga X, Eliasson R, Torrents E, Jordan A, Barbe J, Gibert I, Reichard P:nrdD and nrdG genes are essential for strict anaerobic growth ofEscherichia coli. Biochem Biophys Res Commun 1996, 229(1):189–192.
96. Lam HM, Winkler ME:Metabolic relationships between pyridoxine(vitamin B6) and serine biosynthesis in Escherichia coli K–12.J Bacteriol 1990, 172(11):6518–6528.
97. Kim J, Kershner JP, Novikov Y, Shoemaker RK, Copley SD: Threeserendipitous pathways in E. coli can bypass a block inpyridoxal-5’-phosphate synthesis.Mol Syst Biol 2010, 6:436.
98. Hove-Jensen B, Rosenkrantz TJ, Zechel DL, Willemoes M: Accumulationof intermediates of the carbon-phosphorus lyase pathway forphosphonate degradation in phnmutants of Escherichia coli.J Bacteriol 2010, 192(1):370–374.
99. Zhang Q, van der Donk WA: Answers to the carbon-phosphoruslyase conundrum. Chembiochem 2012, 13(5):627–629.
100. Wanner BL: Gene regulation by phosphate in enteric bacteria. J CellBiochem 1993, 51(1):47–54.
101. Wanner BL, Boline JA:Mapping andmolecular cloning of the phn(psiD) locus for phosphonate utilization in Escherichia coli.J Bacteriol 1990, 172(3):1186–1196.
102. Ravnikar PD, Somerville RL: Genetic characterization of a highlyefficient alternate pathway of serine biosynthesis in Escherichiacoli. J Bacteriol 1987, 169(6):2611–2617.
103. Kim C, Song S, Park C: The D-allose operon of Escherichia coli K–12.J Bacteriol 1997, 179(24):7631–7637.
104. Poulsen TS, Chang YY, Hove-Jensen B: D-allose catabolism ofEscherichia coli: involvement of alsI and regulation of als regulonexpression by allose and ribose. J Bacteriol 1999, 181(22):7126–7130.
105. Pittard J, Wallace BJ: Distribution and function of genes concernedwith aromatic biosynthesis in Escherichia coli. J Bacteriol 1966,91(4):1494–1508.
106. Bottomley JR, Clayton CL, Chalk PA, Kleanthous C: Cloning,sequencing, expression, purification, and preliminarycharacterization of a type II dehydroquinase from Helicobacterpylori. Biochem J 1996, 319(2):559–565.
107. von Meyenburg K, Jorgensen BB, Nielsen J, Hansen FG: Promoters ofthe atp operon coding for the membrane-bound ATP synthase ofEscherichia colimapped by Tn10 insertion mutations.Mol Gen Genet1982, 188(2):240–248.
108. Jensen PR, Michelsen O: Carbon and energy metabolism of atpmutants of Escherichia coli. J Bacteriol 1992, 174(23):7635–7641.
109. Green GN, Gennis RB: Isolation and characterization of anEscherichia colimutant lacking cytochrome d terminal oxidase.J Bacteriol 1983, 154(3):1269–1275.
110. Georgiou CD, Fang H, Gennis RB: Identification of the cydC locusrequired for expression of the functional form of the cytochrome dterminal oxidase complex in Escherichia coli. J Bacteriol 1987,169(5):2107–2112.
111. Puustinen A, Finel M, Haltia T, Gennis RB, Wikstrom M: Properties of thetwo terminal oxidases of Escherichia coli. Biochemistry 1991,30(16):3936–3942.
112. Pittman MS, Robinson HC, Poole RK: A bacterial glutathionetransporter (Escherichia coli CydDC) exports reductant to theperiplasm. J Biol Chem 2005, 280(37):32254–32261.
113. Portnoy VA, Herrgard MJ, Palsson BØ: Aerobic fermentation ofd-glucose by an evolved cytochrome oxidase-deficient Escherichiacoli strain. Appl EnvironMicrobiol 2008, 74(24):7561–7569.
114. Borisov VB, Gennis RB, Hemp J, Verkhovsky MI: The cytochrome bdrespiratory oxygen reductases. Biochim Biophys Acta 2011,1807(11):1398–1413.
115. Chou CH, Bennett GN, San KY: Effect of modified glucose uptakeusing genetic engineering techniques on high-level recombinantprotein production in Escherichia coli dense cultures. BiotechnolBioeng 1994, 44(8):952–960.
116. Flores N, Xiao J, Berry A, Bolivar F, Valle F: Pathway engineering for theproduction of aromatic compounds in Escherichia coli. NatBiotechnol 1996, 14(5):620–623.
117. Chen R, Yap WM, Postma PW, Bailey JE: Comparative studies ofEscherichia coli strains using different glucose uptake systems:metabolism and energetics. Biotechnol Bioeng 1997, 56(5):583–590.
118. Zeppenfeld T, Larisch C, Lengeler JW, Jahreis K: Glucose transportermutants of Escherichia coli K-12 with changes in substraterecognition of IICB(Glc) and induction behavior of the ptsG gene.J Bacteriol 2000, 182(16):4443–4452.
119. Flores N, Flores S, Escalante A, de Anda R, Leal L, Malpica R, Georgellis D,Gosset G, Bolivar F: Adaptation for fast growth on glucose bydifferential expression of central carbonmetabolism and galregulon genes in an Escherichia coli strain lacking thephosphoenolpyruvate:carbohydrate phosphotransferase system.Metab Eng 2005, 7(2):70–87.
120. Steinsiek S, Bettenbrock K: Glucose transport in Escherichia colimutant strains with defects in sugar transport systems. J Bacteriol2012, 194(21):5897–5908.
121. Escalante A, Cervantes AS, Gosset G, Bolivar F: Current knowledge ofthe Escherichia coli phosphoenolpyruvate-carbohydratephosphotransferase system: peculiarities of regulation and impacton growth and product formation. Appl Microbiol Biotechnol 2012,94(6):1483–1494.
122. Sarubbi E, Rudd KE, Cashel M: Basal ppgpp level adjustment shownby new spoT mutants affect steady state growth rates and rrnAribosomal promoter regulation in Escherichia coli.Mol Gen Genet1988, 213(2–3):214–222.
123. Sarubbi E, Rudd KE, Xiao H, Ikehara K, Kalman M, Cashel M:Characterization of the spoT gene of Escherichia coli. J Biol Chem1989, 264(25):15074–15082.
124. Xiao H, Kalman M, Ikehara K, Zemel S, Glaser G, Cashel M: Residualguanosine 3’,5’-bispyrophosphate synthetic activity of relA nullmutants can be eliminated by spoT null mutations. J Biol Chem 1991,266(9):5980–5990.
125. Gentry DR, Cashel M:Mutational analysis of the Escherichia coli spoTgene identifies distinct but overlapping regions involved in ppgppsynthesis and degradation. Mol Microbiol 1996, 19(6):1373–1384.
126. Jin DJ, Cagliero C, Zhou YN: Growth rate regulation in Escherichiacoli. FEMSMicrobiol Rev 2012, 36(2):269–287.
127. Cox GB, Gibson F, Pittard J:Mutant strains of Escherichia coli K–12unable to form ubiquinone. J Bacteriol 1968, 95(5):1591–1598.
128. Wu G, Williams HD, Gibson F, Poole RK:Mutants of Escherichia coliaffected in respiration: the cloning and nucleotide sequence ofubiA, encoding the membrane-boundp-hydroxybenzoate:octaprenyltransferase. J Gen Microbiol 1993,139(8):1795–1805.
129. Klena JD, Ashford RS, Schnaitman CA: Role of Escherichia coli K-12 rfagenes and the rfp gene of Shigella dysenteriae 1 in generation oflipopolysaccharide core heterogeneity and attachment of oantigen. J Bacteriol 1992, 174(22):7297–7307.
130. Roncero C, Casadaban MJ: Genetic analysis of the genes involved insynthesis of the lipopolysaccharide core in Escherichia coli K–12:three operons in the rfa locus. J Bacteriol 1992, 174(10):3250–3260.
131. Hwang J, Inouye M: The tandem GTPase, der, is essential for thebiogenesis of 50S ribosomal subunits in Escherichia coli.MolMicrobiol 2006, 61(6):1660–1672.
132. Bharat A, Jiang M, Sullivan SM, Maddock JR, Brown ED: Cooperative andcritical roles for both G domains in the GTPase activity and cellularfunction of ribosome-associated Escherichia coli EngA. J Bacteriol2006, 188(22):7992–7996.
133. Tomar SK, Dhimole N, Chatterjee M, Prakash B: Distinct GDP/GTPbound states of the tandem G-domains of EngA regulate ribosomebinding. Nucleic Acids Res 2009, 37(7):2359–2370.
134. Spratt BG: Distinct penicillin binding proteins involved in thedivision, elongation, and shape of Escherichia coli K–12. PNAS 2009,72(8):2999–3003.
135. Ogura T, Bouloc P, Niki H, D’Ari R, Hiraga S, Jaffe A: Penicillin-bindingprotein 2 is essential in wild-type Escherichia coli but not in lov orcyamutants. J Bacteriol 1989, 171(6):3025–3030.

Weaver et al. BMC Systems Biology 2014, 8:79 Page 23 of 24http://www.biomedcentral.com/1752-0509/8/79
136. Wang Y, Stieglitz KA, Bubunenko M, Court DL, Stec B, Roberts MF: Thestructure of the R184A mutant of the inositol monophosphataseencoded by suhB and implications for its functional interactions inEscherichia coli. J Biol Chem 2007, 282(37):26989–26996.
137. Puan KJ, Wang H, Dairi T, Kuzuyama T, Morita CT: fldA is an essentialgene required in the 2-C-methyl-D-erythritol 4-phosphatepathwayfor isoprenoid biosynthesis. FEBS Lett 2005, 579(17):3802–3806.
138. Lu Q, Inouye M: Adenylate kinase complements nucleosidediphosphate kinase deficiency in nucleotide metabolism. PNAS1996, 93(12):5720–5725.
139. Gerhart JC, Schachman HK: Distinct subunits for the regulation andcatalytic activity of aspartate transcarbamylase. Biochemistry 1965,4(6):1054–1062.
140. Reed JL, Patel TR, Chen KH, Joyce AR, Applebee MK, Herring CD, Bui OT,Knight EM, Fong SS, Palsson BØ: Systems approach to refininggenome annotation. Proc Natl Acad Sci U S A 2006,103(46):17480–17484.
141. Kumar VS, Dasika MS, Maranas CD: Optimization based automatedcuration of metabolic reconstructions. BMC Bioinformatics 2007,8:212.
142. Kumar VS, Maranas CD: GrowMatch: An automatedmethod forreconciling in silico/in vivo growth predictions. PLoS Comput Biol2009, 5(3):1000308.
143. Barua D, Kim J, Reed JL: An automated phenotype-driven approach(geneforce) for refining metabolic and regulatory models. PLoSComput Biol 2010, 6(10):1000970.
144. Orth JD, Palsson BØ: Systematizing the generation of missingmetabolic knowledge. Biotechnol Bioeng 2010, 107(3):403–412.
145. Tervo CJ, Reed JL: BioMog: a computational framework for the denovo generation or modification of essential biomasscomponents. PLoS One 2013, 8(12):81322.
146. Monod J: The growth of bacterial cultures. Annu Rev Microbiol 1949,3:371–394.
147. Bochner BR, Gadzinski P, Panomitros E: Phenotypemicroarrays forhigh-throughput phenotypic testing and assay of gene function.Genome Res 2001, 11(7):1246–1255.
148. Shea A, Wolcott M, Daefler S, Rozak DA: Biolog phenotypemicroarrays. InMicrobial Systems Biology: Methods and Protocols. NewYork: Humana Press; 2012:331–73. Chap. 12.
149. Mackie AM, Hassan KA, Paulsen IT, Tetu SG: Biolog phenotypemicroarrays for phenotypic characterization of microbial cells.Methods Mol Biol 1096, 2014:123–301.
150. Oun MA, Suthers PF, Jones GI, Carter BR, Saunders MP, Maranas CD,Woodward MJ, Anjum MF: Genome scale reconstruction of asalmonella metabolic model: comparison of similarity anddifferences with a commensal Escherichia coli strain. J Biol Chem2009, 284(43):29480–29488.
151. Yoon SH, Han MJ, Jeong H, Lee CH, Xia XX, Lee DH, Shim JH, Lee SY, OhTK, Kim JF: Comparative multi-omics systems analysis of Escherichiacoli strains B and K–12. Genome Biol 2012, 13(5):37.
152. Mackie A, Paley S, Keseler IM, Shearer A, Paulsen IT, Karp PD: Addition ofEscherichia coli K–12 growth-observation and gene essentialitydata to the EcoCyc database. J Bacteriol 2014, 196(5):982–988.
153. Wilson DM, Wilson TH: Cation specificity for sugar substrates of themelibiose carrier in Escherichia coli. Biochim Biophys Acta 1987,904(2):191–200.
154. Sandermann H Jr: β-D-galactoside transport in Escherichia coli:substrate recognition. Eur J Biochem 1977, 80(2):507–515.
155. Sahota SS, Bramley PM, Menzies IS: The fermentation of lactulose bycolonic bacteria.Microbiology 1981, 128(2):319–325.
156. Wallenfels K, Weil R: β-galactosidase. In The Enzymes, 3rd Ed. New York:Academic Press; 1972:617–663.
157. Roderick SL: The lac operon galactoside acetyltransferase. CRBiologies 2005, 328:568–575.
158. Lang VJ, Leystra-Lantz C, Cook RA: Characterization of the specificpyruvate transport system in Escherichia coli K–12. J Bacteriol 1987,169(1):380–385.
159. Kim OB, Reimann J, Lukas H, Schumacher U, Grimpo J, Dunnwald P,Unden G: Regulation of tartrate metabolism by TtdR and relation tothe DcuS/DcuR-regulated C4-dicarboxylate metabolism ofEscherichia coli.Microbiol 2009, 155(11):3632–3640.
160. Lukas H, Reimann J, Kim OB, Grimpo J, Unden G: Regulation ofaerobic and anaerobic d-malate metabolism of Escherichia coli bythe LysR-type regulator DmlR (YeaT). J Bacteriol 2010,192(10):2503–2511.
161. Lauritzen AM, Lipscomb WN:Modification of three active site lysineresidues in the catalytic subunit of aspartate transcarbamylase byD- and L-bromosuccinate. J Biol Chem 1982, 257:1312–1319.
162. Hall BG: Chromosomal mutation for citrate utilization byEscherichia coli K–12. J Bacteriol 1982, 151(1):269–273.
163. Lutgens M, Gottschalk G:Why a co-substrate is required foranaerobic growth of Escherichia coli on citrate. J Gen Microbiol 1980,119(1):63–70.
164. Schneider BL, Ruback S, Kiupakis AK, Kasbarian H, Pybus C, Reitzer L: TheEscherichia coli gabDTPC operon: specific gamma-aminobutyratecatabolism and nonspecific induction. J Bacteriol 2002,184(24):6976–6986.
165. Cunin R, Glansdorff N, Pierard A, Stalon V: Biosynthesis andmetabolism of arginine in bacteria.Microbiol Rev 1986, 50(3):314–352.
166. Schneider BL, Kiupakis AK, Reitzer LJ: Arginine catabolism and thearginine succinyltransferase pathway in Escherichia coli. J Bacteriol1998, 180(16):4278–4286.
167. Plumbridge J, Pellegrini O: Expression of the chitobiose operon ofEscherichia coli is regulated by three transcription factors: NagC,ChbR and CAP.Mol Microbiol 2004, 52(2):437–449.
168. Kachroo AH, Kancherla AK, Singh NS, Varshney U, Mahadevan S:Mutations that alter the regulation of the chb operon ofEscherichia coli allow utilization of cellobiose. Mol Microbiol 2007,66(2):1382–1395.
169. Chang GW, Chang JT: Evidence for the B12-dependent enzymeethanolamine deaminase in Salmonella.Nature 1975,254(5496):150–151.
170. Jones PW, Turner JM: Interrelationships between the enzymes ofethanolaminemetabolism in Escherichia coli. J Gen Microbiol 1984,130(2):299–308.
171. Blackwell CM, Turner JM:Microbial metabolism of amino alcohols.formation of coenzyme B12-dependent ethanolamineammonia-lyase and its concerted induction in Escherichia coli.Biochem J 1978, 176(3):751–757.
172. Akita K, Hieda N, Baba N, Kawaguchi S, Sakamoto H, Nakanishi Y,Yamanishi M, Mori K, Toraya T: Purification and some properties ofwild-type and N-terminal-truncated ethanolamine ammonia-lyaseof Escherichia coli. J Biochem 2010, 147(1):83–93.
173. Xi H, Schneider BL, Reitzer L: Purine catabolism in Escherichia coli andfunction of xanthine dehydrogenase in purine salvage. J Bacteriol2000, 182(19):5332–5341.
174. Reitzer L: Nitrogen assimilation and global regulation in Escherichiacoli. Annu Rev Microbiol 2003, 57:155–176.
175. Cusa E, Obradors N, Baldoma L, Badia J, Aguilar J: Genetic analysis of achromosomal region containing genes required for assimilation ofallantoin nitrogen and linked glyoxylate metabolism in Escherichiacoli. J Bacteriol 1999, 181(24):7479–7484.
176. Harborne NR, Griffiths L, Busby SJ, Cole JA: Transcriptional control,translation and function of the products of the five open readingframes of the Escherichia coli nir operon. Mol Microbiol 1992,6(19):2805–2813.
177. Wang H, Tseng CP, Gunsalus RP: The napF and narG nitrate reductaseoperons in Escherichia coli are differentially expressed in responseto submicromolar concentrations of nitrate but not nitrite.J Bacteriol 1999, 181(17):5303–5308.
178. Bertero MG, Rothery RA, Palak M, Hou C, Lim D, Blasco F, Weiner JH,Strynadka NC: Insights into the respiratory electron transferpathway from the structure of nitrate reductase A. Nat Struct Biol2003, 10(9):681–687.
179. Seiflein TA, Lawrence JG:Methionine-to-cysteine recycling inKlebsiella aerogenes. J Bacteriol 2001, 183(1):336–346.
180. Delavier-Klutchko C, Flavin M: Enzymatic synthesis and cleavage ofcystathionine in fungi and bacteria. J Biol Chem 1965, 240:2537–2549.
181. Agren R, Liu L, Shoaie S, Vongsangnak W, Nookaew I, Nielsen J: TheRAVEN toolbox and its use for generating a genome-scalemetabolic model for Penicillium chrysogenum. PLoS Comput Biol2013, 9(3):1002980.
Weaver et al. BMC Systems Biology 2014, 8:79 Page 24 of 24http://www.biomedcentral.com/1752-0509/8/79
182. Thorleifsson SG, Thiele I: rBioNet: a COBRA toolbox extension forreconstructing high-quality biochemical networks. Bioinformatics2011, 27(14):2009–2010.
183. Dandekar T, Fieselmann A, Majeed S, Ahmed Z: Software applicationstoward quantitativemetabolic flux analysis andmodeling. BriefBioinform 2014, 15(1):91–107.
184. Lakshmanan M, Koh G, Chung BK, Lee DY: Software applications forflux balance analysis. Brief Bioinform 2014, 15(1):108–122.
185. Tomar N, De RK: Comparingmethods for metabolic networkanalysis and an application to metabolic engineering. Gene 2013,521(1):1–14.
186. Hamilton JJ, Reed JL: Software platforms to facilitate reconstructinggenome-scale metabolic networks. EnvironMicrobiol 2014,16(1):49–59.
187. Brochado AR, Andrejev S, Maranas CD, Patil KR: Impact ofstoichiometry representation on simulation ofgenotype-phenotype relationships in metabolic networks. PLoSComput Biol 2012, 8(11):1002758.
188. Ebrahim A, Lerman JA, Palsson BØ, Hyduke DR: COBRApy:COnstraints-Based Reconstruction and Analysis for Python. BMCSyst Biol 2013, 7:74.
189. Bochner BR: Global phenotypic characterization of bacteria. FEMSMicrobiol Rev 2009, 33(1):191–205.
doi:10.1186/1752-0509-8-79Cite this article as:Weaver et al.: A genome-scale metabolic flux model ofEscherichia coli K–12 derived from the EcoCyc database. BMC SystemsBiology 2014 8:79.
Submit your next manuscript to BioMed Centraland take full advantage of:
• Convenient online submission
• Thorough peer review
• No space constraints or color figure charges
• Immediate publication on acceptance
• Inclusion in PubMed, CAS, Scopus and Google Scholar
• Research which is freely available for redistribution
Submit your manuscript at www.biomedcentral.com/submit
Copyright © 2022 FDOKUMEN