A GDP impact evaluation of R&D investments in Romania ...
47
A GDP impact evaluation of R&D investments in Romania using the CGE model Rhomolo JRC Working Papers on Territorial Modelling and Analysis No 10/2021 Authors: Diukanova, O. Chioncel, M. Joint Research Centre 2021 JRC TECHNICAL REPORT
-
Upload
khangminh22 -
Category
Documents
-
view
3 -
download
0
Transcript of A GDP impact evaluation of R&D investments in Romania ...

A GDP impact evaluation of R&Dinvestments in Romania
using the CGE model Rhomolo
JRC Working Papers on
Territorial Modelling and Analysis
No 10/2021
Authors:Diukanova, O.Chioncel, M.
JointResearchCentre
2021
JRC TECHNICAL REPORT
This publication is a Technical report by the Joint Research Centre (JRC), the European Commission’s science and knowledge service. It
aims to provide evidence-based scientific support to the European policymaking process. The scientific output expressed does not imply a policy position of the European Commission. Neither the European Commission nor any person acting on behalf of the Commission is responsible for the use that might be made of this publication. For information on the methodology and quality underlying the data used
in this publication for which the source is neither Eurostat nor other Commission services, users should contact the referenced source. The designations employed and the presentation of material on the maps do not imply the expression of any opinion whatsoever on the part of the European Union concerning the legal status of any country, territory, city or area or of its authorities, or concerning the delimitation
of its frontiers or boundaries. Contact information
Name: Simone Salotti Address: Edificio Expo, C/Inca Garcilaso 3, 41092 Sevilla (Spain) Email: [email protected]
Tel.: +34 954488406 EU Science Hub
https://ec.europa.eu/jrc
JRC126690
Seville: European Commission, 2021
© European Union, 2021
The reuse policy of the European Commission is implemented by the Commission Decision 2011/833/EU of 12 December 2011 on the reuse of Commission documents (OJ L 330, 14.12.2011, p. 39). Except otherwise noted, the reuse of this document is authorised under the Creative Commons Attribution 4.0 International (CC BY 4.0) licence (https://creativecommons.org/licenses/by/4.0/). This means that
reuse is allowed provided appropriate credit is given and any changes are indicated. For any use or reproduction of photos or other material that is not owned by the EU, permission must be sought directly from the copyright holders.
All content © European Union, 2021 (unless otherwise specified)
How to cite this report: Diukanova, O., and Chioncel, M. (2021). A GDP impact evaluation of R&D investments in Romania using the CGE model Rhomolo. JRC Working Papers on Territorial Modelling and Analysis No. 10/2021, European Commission, Seville, JRC126690.
The JRC Working Papers on Territorial Modelling and Analysis are published under the supervision of Simone Salotti and Andrea Conte of JRC Seville, European Commission. This series mainly addresses the economic analysis related to the regional and territorial policies carried out in the European Union. The Working Papers of the series are mainly targeted to policy analysts and to the academic community and are to be considered as early-stage scientific papers containing relevant policy implications. They are meant to communicate to a broad audience preliminary research findings and to generate a debate and attract feedback for further improvements.
1
A GDP impact assessment of R&D investments
in Romania using the CGE model Rhomolo
Olga Diukanova*, Mariana Chioncel **, ***
* European Commission, Joint Research Centre Seville, ** University of Bucharest, Faculty of Chemistry ***The Executive Agency for Higher Education, Research, Development and Innovation Funding, ROMANIA (UEFISCDI)
Abstract
This study evaluates the potential economic impacts of Research & Development (R&D) investments in
Romania during the 2021-2027 policy cycle. The assessment is based on three distinct R&D investments
scenarios: (1) 2% Gross domestic Expenditure on R&D (GERD) intensity target achieved by 2029, with equal
split between public and private investment, in accordance with the R&D investment targets declared in the
national strategic documents; (2) gradual increase of GERD intensity to 2.25% by 2029, with public
investment of 1.25% of GDP (in line with the new ERA target); and (3) 0.48% of GDP, “business as usual’
scenario (following the same investment pattern as in the past years). The results of computer simulations
with the RHOMOLO model, which is a dynamic multi-regional computable general equilibrium (CGE) model
developed by the Joint Research Centre (JRC) of the European Commission, show that the most pronounced
GDP impacts in Romania would be achieved with the highest intensity of R&D policy funding. Aside from the
capital city region RO32, the less developed regions RO12, RO22, RO31 and RO41 exhibit the highest GDP
multipliers across Romanian regions, which indicates the high potential of R&D funding in these regions. The
strongest spillover effects emerge from the regions that in certain years make substantial R&D domestic
private and public investments relative to the size of their economies. Although R&D investments augment
factor productivity that depreciates gradually in the absence of continuous funding, the strength of lagged
effects of R&D funding depends on the intensity of R&D investments rather than on the source of funding.
However, in the short run, the economic cost for Romania is determined by the source of R&D investments:
despite their small size, the EU investments that are largely financed by other EU member states, produce
quite sizeable GDP multipliers in Romania compared to the national public and private investments.
2
Acknowledgments Part of this work was carried out within the financial support from the Project POCA 127557 “Increasing the capacity of the RDI system to respond to global challenges. Strengthening the anticipatory capacity for evidence-based public policy making”, funded by the European Social Fund (ESF), through the Administrative Capacity Operational Programme (POCA) 2014-2020, Romania.
The authors are very grateful to Simone Salotti (EC-JRC Seville) for the very constructive insights and comments that greatly improved this assessment and to the RHOMOLO project coordinator Andrea Conte (EC-JRC Seville) who facilitated this work. The authors also thank Adrian Curaj, Director of The Executive Agency for Higher Education, Research, Development and Innovation Funding (UEFISCDI), Romania who encouraged the idea of this study.
We thank Lavinia Tofan (expert Ministry of Economy, UEFISCDI, associate lecturer University of Bucharest), for assistance with the preliminary R&D funding data related to Cohesion Policy Funds (collected from MySMIS and the 2021-2027 Operational Programmes draft versions).
3
Executive Summary The low level of the R&D funding in Romania, significantly below the targets committed in the national R&D strategy, further aggravated by the lack of predictability, cannot have a significant positive at macroeconomic level. This study assesses the impact of distinct levels and sources of R&D funding both at the national and the NUTS2 level in Romania. Although it might be difficult to isolate the impacts of this type of policy interventions, since each policy produces direct and indirect, short-run and long-run, lagged, spillover effects and externalities, CGE models like RHOMOLO can address these issues in a consistent way. The results of computer simulations with the RHOMOLO model show that the most pronounced GDP impact in Romania would be achieved with the highest intensity of R&D policy funding. A 0.48% R&D spending over GDP would produce a GDP impact of 1.63% by 2029, which could become as high as 4.1% should the intensity of R&D expenditures per GDP be 2.25%. For all policy scenarios, the most pronounced GDP impact occurs in RO32 that receives the biggest share of R&D funding, and, therefore, benefits from the largest associated TFP improvements.
Even in the absence of continuous R&D funding after 2029, all regions would continue to record positive GDP impacts that gradually but not fully diminish by 2050. Positive impacts are long-lasting because of two reasons. First, the capital stock built up during the policy support period increases the level of productive inputs in the regions and it takes time to depreciate. Second, the long-run structural impacts associated with R&D funding keep on providing a competitive edge to the regions even after 2029 because of the gradual depreciation of factor productivity. Overall, the strengths of the lagged effects of R&D funding depends on the amounts of R&D investments and the TFP decay rate.
Overall, the GDP impact at the country level is closely correlated with the intensity of R&D policy funding, and the highest regional GDP multipliers, defined as the return on GDP per euro spent, are associated with the most pronounced GDP impacts per minimum of R&D investments. Aside from the capital city region RO32, the less developed regions RO12, RO22, RO31 and RO41 exhibit the highest GDP multipliers across Romanian regions, which indicates the high potential of R&D funding in these regions.
The analysis has uncovered the existence of substantial inter-regional spillover effects. The biggest ones are produced by investments taking place in the regions RO31, RO42 and RO12. When these regions achieve the R&D target with their own expenditures, they experience some temporary GDP losses, in result of which their market shares are taken by the neighbouring regions, which produces large spillover effects at the country level. Overall, the strengths of spillover effects largely depends on the amount and the composition of policy funding that is received by a particular region in a given year.
4
1. Introduction
This study was performed during the preparatory phase of the National Strategy for Research, Innovation
and Smart Specialisation (Strategia Nationala de Cercetare, Inovare si Specializare Inteligenta, 2021-2027)
with the aim to assess the potential impact of three distinct R&D investments scenarios in Romania in the
2021-2027 policy cycle. The reader should bear in mind that the results of this modelling exercise are just an
indicative scenario assessment, the impact heavily depending not only on the amount of funds invested, but
also on the design of the actions and their effective and efficient implementation, based on good governance
and coordination amongst relevant actors and actions.
2. Country context
According to the World Bank, Romania is an upper middle-income economy (Hamadeh et al., 2021). The
country GDP growth rate was 4.1% in 2019 driven mainly by the growth in private consumption (5.9%),
supported by wage and pensions increases (World Bank, 2020). In 2020, the recession in Romania was milder
than in other European Union (EU) economies. The GDP contraction was by 3.9% in real terms, with private
consumption collapsing during the spring lockdown. Despite the recently recorded high growth rates, the
GDP per capita of the country remains the second lowest in the EU (Chioncel, 2020).
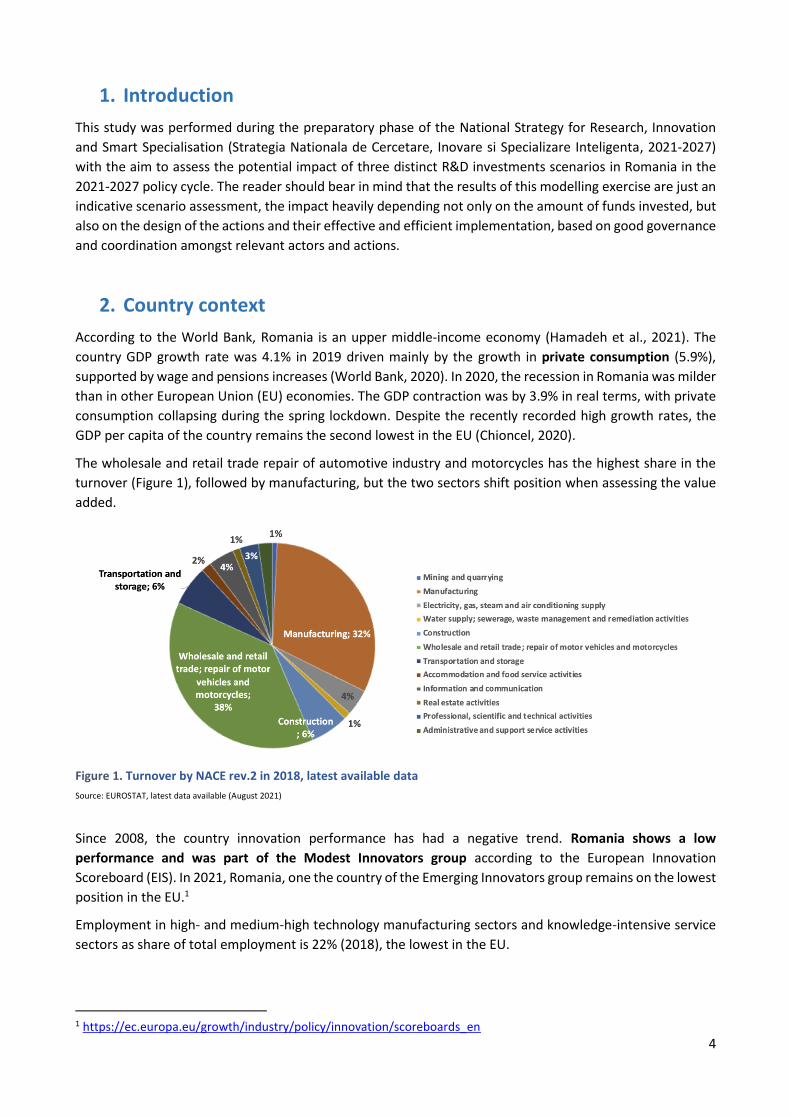
The wholesale and retail trade repair of automotive industry and motorcycles has the highest share in the
turnover (Figure 1), followed by manufacturing, but the two sectors shift position when assessing the value
added.
Figure 1. Turnover by NACE rev.2 in 2018, latest available data
Source: EUROSTAT, latest data available (August 2021)
Since 2008, the country innovation performance has had a negative trend. Romania shows a low
performance and was part of the Modest Innovators group according to the European Innovation
Scoreboard (EIS). In 2021, Romania, one the country of the Emerging Innovators group remains on the lowest
position in the EU.1
Employment in high- and medium-high technology manufacturing sectors and knowledge-intensive service
sectors as share of total employment is 22% (2018), the lowest in the EU.
1 https://ec.europa.eu/growth/industry/policy/innovation/scoreboards_en
5
R&D expenditures
Romania joined European Union in 2007. The post accession period is characterized by many political crises,
government reshuffles, which often led also to institutional reorganisation of the R&D governance and ad-
hoc RDI policy revision. The Romanian R&I system is chronically underfunded. The 2007 accession to EU had
generated a stimulus for the increase of the R&D public funding in 2007-2008, with the public investment for
R&D reaching 0.34 in 2007, respectively 0.39% of GDP in 2008. The public investment was revised downwards
to 0.24% of GDP in the following year due to the effects of the global financial crisis of 2007–2008. After
2013, the public investment showed negative fluctuations around 0.2% of GDP, reaching the minimum value
of 0.19% of GDP in 2019. The National Strategy for Research Development and Innovation (SNCDI) 2014-
2020, was based on an investment R&D target of 2% by 2020 (1% public+1% private). However, the public
funding for R&D has remained well below the targets committed, and also compared to that of other EU
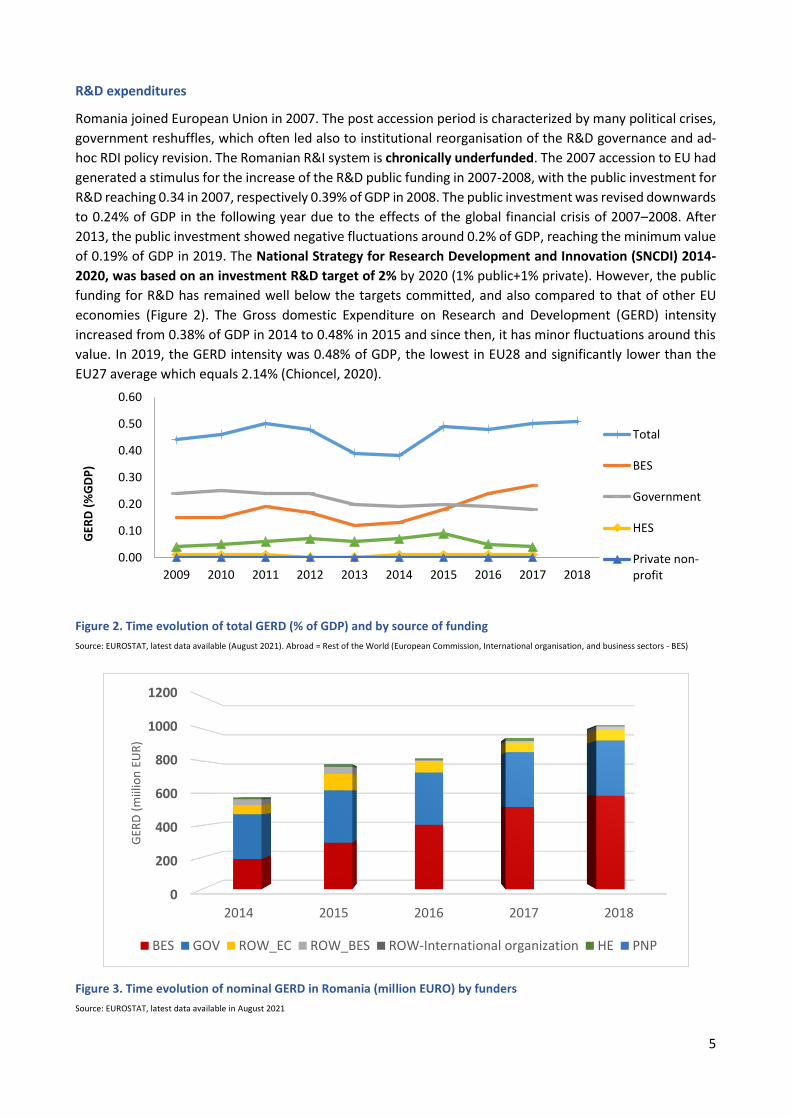
economies (Figure 2). The Gross domestic Expenditure on Research and Development (GERD) intensity
increased from 0.38% of GDP in 2014 to 0.48% in 2015 and since then, it has minor fluctuations around this
value. In 2019, the GERD intensity was 0.48% of GDP, the lowest in EU28 and significantly lower than the
EU27 average which equals 2.14% (Chioncel, 2020).
Figure 2. Time evolution of total GERD (% of GDP) and by source of funding
Source: EUROSTAT, latest data available (August 2021). Abroad = Rest of the World (European Commission, International organisation, and business sectors - BES)
Figure 3. Time evolution of nominal GERD in Romania (million EURO) by funders
Source: EUROSTAT, latest data available in August 2021
0.00
0.10
0.20
0.30
0.40
0.50
0.60
2009 2010 2011 2012 2013 2014 2015 2016 2017 2018
GER
D (
%G
DP
)
Total
BES
Government
HES
Private non-profit
0
200
400
600
800
1000
1200
2014 2015 2016 2017 2018
GER
D (
miil
ion
EU
R)
BES GOV ROW_EC ROW_BES ROW-International organization HE PNP
6
During 2014-2020 Cohesion Policy cycle, Romania has the lowest share of European Structural and
Investment funds (ESIF) allocated for the thematic objective ‘Research&innovation” in the region (Curaj,
2015). If Romania has the 6th largest European Structural and Investment funds (ESIF) budget among all the
EU countries, it drops to the 13th position for the thematic area R&I (Chioncel, 2017).
As seen in Figure 3, the nominal GERD (in EUR) had increased during 2014-2018, mainly due to the increase
of R&D investment by business sector. However, this increase is not reflected in GERD intensity (expressed
as % of GDP), due to the GDP increase during the same period. The impact of public policy on R&D private
investment can be observed from 2016, due to direct support for R&D in the private sector, and likely the
newly introduced fiscal facilities for R&D activities, which may have fuelled the visibility and the increase of
R&D by Business Enterprise Sector (BES) due to reporting rules.
The government sector (National Institutes for R&D and Romanian Academy (Academia Romana) + other
public R&D centres) accounts for the highest share of the R&D public budget allocation (around 70% of the
public GERD compared to around 32%, the EU27 average). Research performed by tertiary education counts
to around 18% of total GERD, compared to the EU average of 57% (Chioncel, 2020).
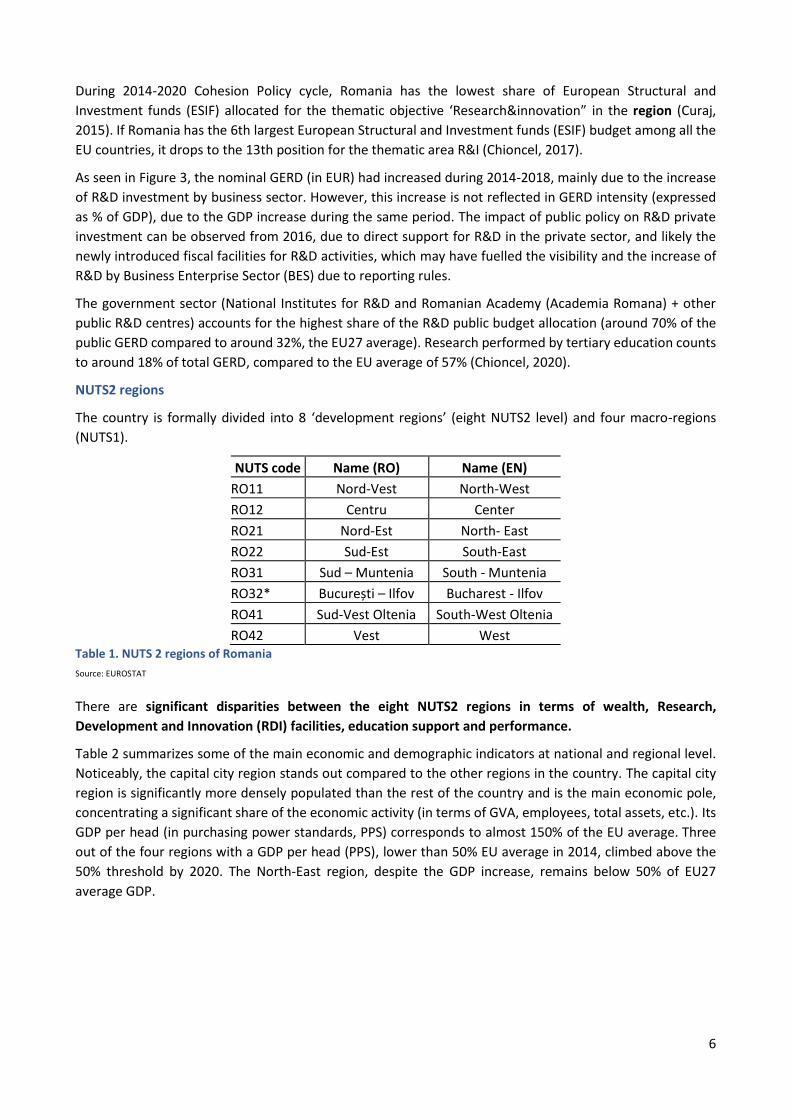
NUTS2 regions
The country is formally divided into 8 ‘development regions’ (eight NUTS2 level) and four macro‐regions
(NUTS1).
NUTS code Name (RO) Name (EN)
RO11 Nord-Vest North-West
RO12 Centru Center
RO21 Nord-Est North- East
RO22 Sud-Est South-East
RO31 Sud – Muntenia South - Muntenia
RO32* București – Ilfov Bucharest - Ilfov
RO41 Sud-Vest Oltenia South-West Oltenia
RO42 Vest West Table 1. NUTS 2 regions of Romania
Source: EUROSTAT
There are significant disparities between the eight NUTS2 regions in terms of wealth, Research,
Development and Innovation (RDI) facilities, education support and performance.
Table 2 summarizes some of the main economic and demographic indicators at national and regional level.
Noticeably, the capital city region stands out compared to the other regions in the country. The capital city
region is significantly more densely populated than the rest of the country and is the main economic pole,
concentrating a significant share of the economic activity (in terms of GVA, employees, total assets, etc.). Its
GDP per head (in purchasing power standards, PPS) corresponds to almost 150% of the EU average. Three
out of the four regions with a GDP per head (PPS), lower than 50% EU average in 2014, climbed above the
50% threshold by 2020. The North-East region, despite the GDP increase, remains below 50% of EU27
average GDP.

7
GDP per head (PPS) 2014, EU27=100
2019 GDP per head (PPS) EU27=100
Real GVA growth, 2014-2019, yearly
average2
Population 1/01/2021
Area in square
kilometer
Population density (persons
per km2)
RO 56 69 4,3 19328838 239391 81
RO11 49 64 5,9 2547429 34161 75
RO12 52 66 3,6 2314826 34100 68
RO21 34 44 0,0 3184215 36850 86
RO22 50 58 3,2 2377101 35762 66
RO31 47 54 1,5 2901376 34453 84
RO32 129 160 7,7 2322002 1821 1275
RO41 40 54 1,0 1910409 29212 65
RO42 56 71 6,0 1771480 32033 55
Table 2: Main Regional Economic and Demographic Indicators
Source: EUROSTAT, latest data available (August 2021)
During the 2014-2020, the country population decreased by 3%. The highest percentage population loss is
observed in the South-West region (6.05%), followed closely by South Muntenia and South-East. Bucharest-
Ilfov is the only region with a population gain, indicating the migration from the other regions.
There is a high level of emigration. Romanian diaspora is the fifth largest in the world and has the highest
growth rate in recent years (OECD, 2019). The demographic decline will entail also changes in the various
sub-populations (school population, population of childbearing age, working age population). This imposes
significant challenges regarding the availability of working force, particularly of the highly skilled workers,
since the demographic decline has been coupled with poor educational performance of the bulk of the pupils,
and elevated emigration of the highly educated (Chioncel, 2020).
The country capacity to perform R&D and absorb innovation depends on many factors. According to the 2021
Regional Innovation Scoreboard3, all eight regions are Emerging Innovators. The highest innovation
performance increase was recorded by Bucharest-Ilfov, followed by North-West.
There are significant regional disparities regarding unemployment, with South-West, South and South-East
showing the highest rates. According to Eurostat data, the share of people at risk of poverty or social
exclusion in North-East, South-East, and South-West Oltenia is significantly higher than in Bucharest. A
significant share of 18 years population does not reach the baccalaureate level. Low skills and early school
leaving are concentrated among young people from socio-economically disadvantaged backgrounds, with a
high share in the rural areas. In 2020, the RO share of population with tertiary education in the general
population 25-64 years (18.7%) is well below the EU27 average (32.8%). North-East, followed by South-East
and South Muntenia, has the lowest share of tertiary graduates in the 25-64 years population but also shows
a decrease over the 2014-2020 period.
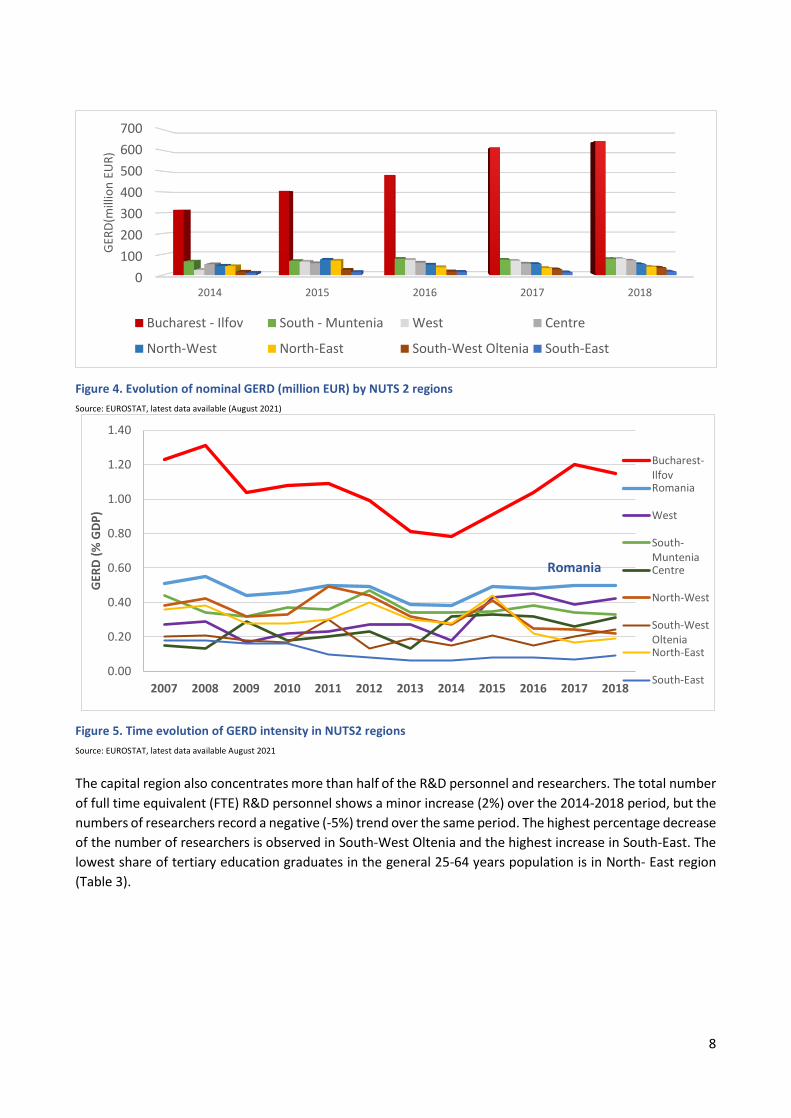
As seen in Figure 4, GERD is concentrated (more than 60%) in the region Bucharest-Ilfov, which shows a GERD
intensity higher than 1% of GDP and double compared to the national one (Figure 5).
2 https://appsso.eurostat.ec.europa.eu/nui/submitViewTableAction.do 3 https://ec.europa.eu/docsroom/documents/45960
8
Figure 4. Evolution of nominal GERD (million EUR) by NUTS 2 regions
Source: EUROSTAT, latest data available (August 2021)
Figure 5. Time evolution of GERD intensity in NUTS2 regions
Source: EUROSTAT, latest data available August 2021
The capital region also concentrates more than half of the R&D personnel and researchers. The total number
of full time equivalent (FTE) R&D personnel shows a minor increase (2%) over the 2014-2018 period, but the
numbers of researchers record a negative (-5%) trend over the same period. The highest percentage decrease
of the number of researchers is observed in South-West Oltenia and the highest increase in South-East. The
lowest share of tertiary education graduates in the general 25-64 years population is in North- East region
(Table 3).
0
100
200
300
400
500
600
700
2014 2015 2016 2017 2018
GER
D(m
illio
n E
UR
)
Bucharest - Ilfov South - Muntenia West Centre
North-West North-East South-West Oltenia South-East
Romania
0.00
0.20
0.40
0.60
0.80
1.00
1.20
1.40
2007 2008 2009 2010 2011 2012 2013 2014 2015 2016 2017 2018
GER
D (
% G
DP
)
Bucharest-IlfovRomania
West
South-MunteniaCentre
North-West
South-WestOlteniaNorth-East
South-East

9
2018, R&D personnel
and researchers
Share in the total
(%)
% Change over 2014-
2018
Researcher (FTE)2018
2018 Share in the total
Researchers (FTE), % Change over 2014-2018
2020 Share of tertiary
education graduates in population
25-64ys
RO 31.933 100,0 2 17213 100,0 -4,9 18,7
RO11 1.964 6,2 -16 1279 7,4 -12,0 20,1
RO12 3.715 11,6 19 1255 7,3 -2,3 17,1
RO21 2.296 7,2 -8 1501 8,7 -13,2 11,8
RO22 1.157 3,6 45 630 3,7 44,8 13,1
RO31 1.997 6,3 -38 966 5,6 -39,4 13,1
RO32 17.700 55,4 11 9411 54,7 3,9 40,5
RO41 712 2,2 -42 484 2,8 -48,2 16,7
RO42 2.392 7 1687 1687 9,8 4,2 17,0
Table 3. R&D personnel and researchers
Source: EUROSTAT, latest data available August 2021
3. Policy context
The EU policy context
The EU's multiannual financial framework (MFF) for 2021-2027 (adopted in December 2020) provides for a
long-term EU budget of €1074.3 billion in 2018 prices, including the integration of the European
Development Fund. Together with the Next Generation EU recovery instrument of €750 billion in grants
and loans, it will provide €1.8 trillion of funding over the coming years to support recovery from the COVID-
19 pandemic and the EU's long-term priorities across different policy areas.4
The 2021-2027 EU cohesion policy has set 5 policy objectives, with the aim to narrow the gap between
European regions:
(1) a more competitive and smarter Europe,
(2) a greener, low-carbon transitioning towards a net zero carbon economy,
(3) a more connected Europe by enhancing mobility,
(4) a more social and inclusive Europe,
(5) Europe closer to citizens by fostering the sustainable and integrated development of all types of
territories.
The EU funds allocated to Cohesion Policy for the period 2021-2027 amount to EUR 392 billion, channelled
to Member States through:
The European Regional Development Fund (ERDF) is intended to contribute to reducing disparities
between the levels of development of the various regions and the backwardness of the least-
favoured regions. It will support investments in all five policy objectives, but 1 and 2 are the main
priorities.
The European Social Fund Plus (ESF+) should provide support mainly to priority 4, promoting the
improvement of the quality, inclusiveness, effectiveness and labour market relevance of education
and training system.
4 https://www.consilium.europa.eu/en/policies/the-eu-budget/long-term-eu-budget-2021-2027/
10
The Cohesion Fund (CF) supports investments in environment and transport in the less prosperous
EU countries (policy objectives 2 and 3).
The Just Transition Fund (JTF) will help the member states to address the social, employment,
economic and environmental impacts of the transition towards the EU 2030 targets for energy and
climate and a climate-neutral economy by 2050, based on the Paris Agreement.
The Interreg programmes have two additional policy objectives (European Commission, 2021a, art.
14): “A better cooperation governance” and “A safer and more secure Europe”. (European
Commission, 2021b).
Funds from the ERDF and ESF+ are allocated to all three categories of regions (less developed, more
developed, in transition), some countries benefit from the Cohesion Fund, outermost regions and sparsely
populated receive dedicated funding, and all countries benefit from the Just Transition Fund.
In addition to these funds, the Recovery and Resilience Facility (RRF) was set at EU level with the aim to
support Member State (MS) in mitigating the economic and social impact of the coronavirus pandemic and
to prepare them for the green and digital transitions. The RRF entered into force on 19 February 2021 and
makes available €672.5 billion (in 2018 prices), in form of loans and grants to fund reforms and investments
undertaken by the member states, in line with the objectives of the Facility. The actions are to be
implemented until the end of 2026 through the National Plans for Recovery and Resilience, designed by
individual governments and agreed by EC.
In addition to the relevant Cohesion Policy Funds channelling investments for Research & Innovation (R&I)
through dedicated Operational Programmes’ priorities, other EU programmes support innovation. Among
these, Horizon Europe, the EU’s key funding programme for R&I, will allocate a budget of €95.5 billion to
the EU member states on projects based competitions.
It is very important that Member States allocate an appropriate amount of their resources and ensure
efficient and effective implementation of the planned actions. At the EU level, the European Semester
represents the framework used to identify national reform priorities and monitor their implementation,
while member states are responsible to develop their own national multiannual investment strategies in
support of those reform priorities.
The Romanian R&I policy context
2021-2027
Romania is to receive in the period of 2021-2027 a budget of EUR 100 billion, of which EUR 79.9 billion
represent non-reimbursable European funds.5 A budget of EUR 28.2 billion has been agreed for cohesion
policy. Bucharest is the only ‘more developed region’ (GDP/head in PPS terms exceeds 90% of the EU average
during the 2014-2020 period, and 100% during the 2021-2027 period). The other seven regions are less
developed regions (LDR) (GDP/head (PPS) is below 75% of the EU average). More than EUR 25 billion are
allocated to the Romanian LDR, EUR 124 million to Bucharest Ilfov, and around EUR 3.5 billion are from the
CF, and more than EUR 2 billion from JTF.
These funds are distributed through 9 Operational Programmed:6
1. Fair Transition Operational Programme (Programul Operațional, POTJ), 2. Sustainable Development Operational Programme (Programul Operațional Dezvoltare Durabilă-
PODD), 3. Transport Operational Programme (Programul Operațional Transport, POT),
5 https://coe-romact.org/article/romact-review-available-eu-funding-2021-2027 6 https://mfe.gov.ro/minister/perioade-de-programare/perioada-2021-2027/
11
4. Smart Growth, Digitalisation and Financial Instruments Operational Programme (Programul Operațional Creștere Inteligentă, Digitalizare și Instrumente Financiare, POCIDIF),
5. Health Operational Programme (Programul Operațional Sănătate, POS), 6. Education and Employment Operational Programme (Programul Operațional Educație și Ocupare, -
POEO), 7. Operational Programme for Inclusion and Social Dignity (Programul Operațional Incluziune și
Demnitate Socială, POIDS), 8. Eight Regional Operational Programmes (Programul Operațional Regional, POR; individual POR for
each of the 8 NUTS 2 regions), 9. Technical Assistance Operational Programme (Programul Operațional Asistență Tehnică, POAT).
As a novelty for 2021-2027 cycle, each NUTS2 region has its own Regional Operational Programmes (POR)
and will allocate funds based on the priorities set by the individual 2021-2027 Regional Development Plan
(PDR) and the Regional Smart Specialization Strategy (RIS3).
At the moment at which this study was conducted (June-August 2021), the Romanian Operational
Programmes and the National Plan for Recovery and Resilience (in RO, Planul National de Rezilienta si
Redresare - PNRR -), with a budget of around EUR 30 billion, were still under negotiation with the European
Commission.7
The August 2021 draft version of the National Strategy for Research, Innovation and Smart Specialisation
2021-2027 (Strategia Nationala de Cercetare, Inovare si Specializare Inteligenta, SNCISI), reaffirms the
strategic GERD target of 2%, with equal split between public and private R&D funding. The 1% public funds
for R&D target is stated also in the Government Plan 2021-2024 of the current (August 2021), centre-right
coalition, government, which entered into force in December 2020 (PROGRAM DE GUVERNARE 2020 – 2024).
The implementation of the SNCISI will be achieved through the following main R&D programmes:
The National RDI Plan 2021-2027 (PNCDI4, PN4)
Priorities with an R&D component of the following Operational Programs:
o POCIDIF, priority 1-6, 10
o POR, Priority 1
o POS, Priority 5
o POTJ, Priority 1,
o POES, Priority 4, 7
Sectoral research and development (R&D) plans, such as the: sectoral plan of the Ministry of
Agriculture and Rural Development, sectoral plan of the Ministry of Health, Ministry of Education,
Ministry of Internal Affairs, Ministry of Economy, Energy and Business Environment - Tourism,
Ministry of Labour and Social Protection etc.), the plan of the Romanian Academy etc.
2014-2020
The National Strategy for Research, Development, and Innovation (SNCDI 2014-2020) was the main RDI
strategic document setting objectives, priorities, and actions for the 2014-2020 period. It was based on a 2%
(1% public+1% private) GERD target, however with an R&D investment well below this target (around 0.2%
public and 0.28% private).
For the thematic priority area R&I, under 2014-2020 EU Cohesion Policy cycle, Romania planned to invest
around 1,174,629,463 EUR. By August 2021, 43% of the funds were spent and 60% decided according to
Cohesion Portal data.
7 Approved on 28th October 2021
12
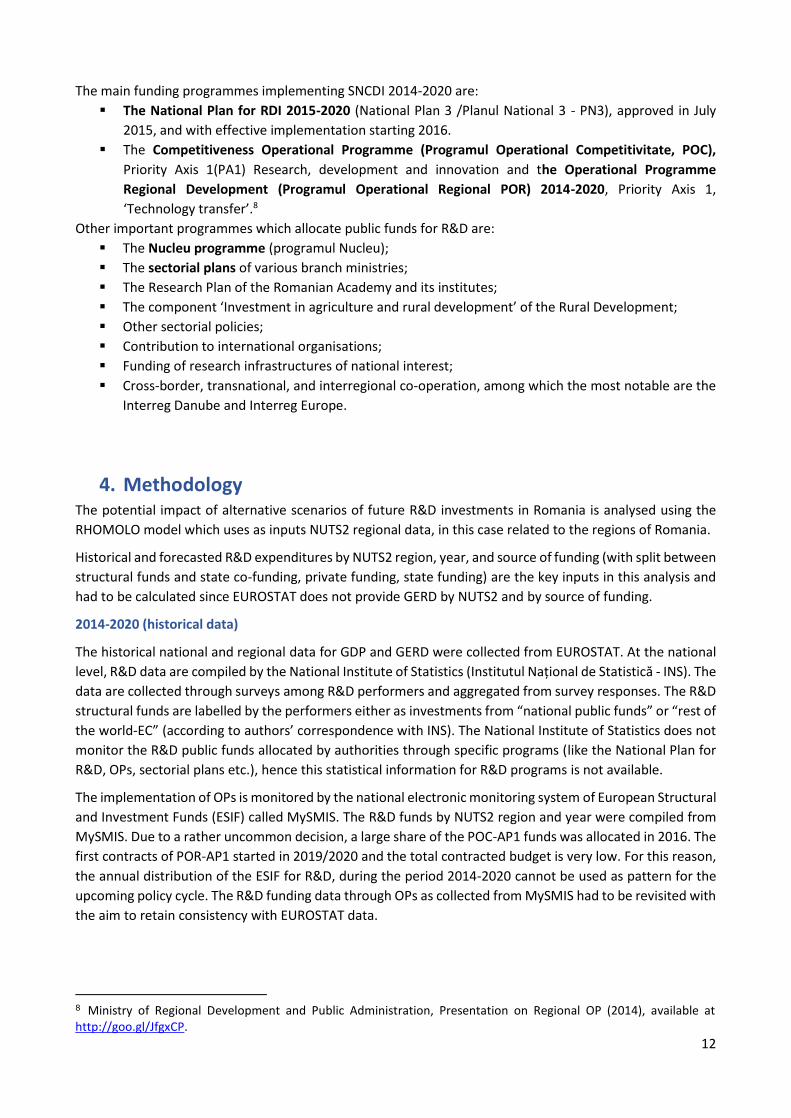
The main funding programmes implementing SNCDI 2014-2020 are:
The National Plan for RDI 2015-2020 (National Plan 3 /Planul National 3 - PN3), approved in July
2015, and with effective implementation starting 2016.
The Competitiveness Operational Programme (Programul Operational Competitivitate, POC),
Priority Axis 1(PA1) Research, development and innovation and the Operational Programme
Regional Development (Programul Operational Regional POR) 2014-2020, Priority Axis 1,
‘Technology transfer’.8
Other important programmes which allocate public funds for R&D are:
The Nucleu programme (programul Nucleu);
The sectorial plans of various branch ministries;
The Research Plan of the Romanian Academy and its institutes;
The component ‘Investment in agriculture and rural development’ of the Rural Development;
Other sectorial policies;
Contribution to international organisations;
Funding of research infrastructures of national interest;
Cross-border, transnational, and interregional co-operation, among which the most notable are the
Interreg Danube and Interreg Europe.
4. Methodology The potential impact of alternative scenarios of future R&D investments in Romania is analysed using the
RHOMOLO model which uses as inputs NUTS2 regional data, in this case related to the regions of Romania.
Historical and forecasted R&D expenditures by NUTS2 region, year, and source of funding (with split between
structural funds and state co-funding, private funding, state funding) are the key inputs in this analysis and
had to be calculated since EUROSTAT does not provide GERD by NUTS2 and by source of funding.
2014-2020 (historical data)
The historical national and regional data for GDP and GERD were collected from EUROSTAT. At the national
level, R&D data are compiled by the National Institute of Statistics (Institutul Național de Statistică - INS). The
data are collected through surveys among R&D performers and aggregated from survey responses. The R&D
structural funds are labelled by the performers either as investments from “national public funds” or “rest of
the world-EC” (according to authors’ correspondence with INS). The National Institute of Statistics does not
monitor the R&D public funds allocated by authorities through specific programs (like the National Plan for
R&D, OPs, sectorial plans etc.), hence this statistical information for R&D programs is not available.
The implementation of OPs is monitored by the national electronic monitoring system of European Structural
and Investment Funds (ESIF) called MySMIS. The R&D funds by NUTS2 region and year were compiled from
MySMIS. Due to a rather uncommon decision, a large share of the POC-AP1 funds was allocated in 2016. The
first contracts of POR-AP1 started in 2019/2020 and the total contracted budget is very low. For this reason,
the annual distribution of the ESIF for R&D, during the period 2014-2020 cannot be used as pattern for the
upcoming policy cycle. The R&D funding data through OPs as collected from MySMIS had to be revisited with
the aim to retain consistency with EUROSTAT data.
8 Ministry of Regional Development and Public Administration, Presentation on Regional OP (2014), available at http://goo.gl/JfgxCP.
13
No R&D funding targets were set at regional level, neither the relevant OPs had earmarked funds for
Research&Innovation theme at NUTS2 level. In this policy context, the absorption rate of R&D cohesion policy
funds can be calculated only at national level, and it is meaningless at regional level.
The distribution of Horizon Europe funds per NUTS2 regions over the whole programming period was
collected from the Horizon Europe online monitoring platform.
2021-2027
At the moment of writing this study, no nominal values for the R&D expenditures for the 2021-2027 policy
cycle were available. Although the National Strategies for R&D and the National Plan for R&D are in theory
multi-annual strategic documents, the public R&D budget is decided on annual basis by the State Budget law
and its subsequent revisions.
In this context, the main anchor that could be used for the estimation of R&D expenditures by year, by NUTS2
regions and by source of funding during the period 2021-2027 was the public and private R&D intensity
(expressed as % of the forecasted GDP). Two scenarios consider the gradual increase of the funding either to
2% (1% public+1% private), or to 2.25% (1.25% public + 1% private). A distinct scenario considers the
continuation of the status quo (around 0.5% GERD intensity).
It should be noted that the 1% of GDP public investment target includes all public funds allocated from the
state budget, non-reimbursable external funds allocated through relevant OPs, partners’ contributions to
projects and fiscal facilities (according to communication from Ministry of Research, Innovation and
Digitalisation - MCID).
The forecasted GDP growth rate was taken from the latest available European Commission estimates
published in the Spring Forecast of May 12, 2021. The GDP growth rates are available up to 2024; after this
year, a GDP growth rate of 3% was considered in this study. The European Commission forecast slightly differs
compared to that released by the National Institute of Statistics in April 2021, since the former also considers
the impact of the PNRR. The forecasted GDPs per NUTS2 region were compiled applying the past distribution
pattern across regions.
There is no strategic planning regarding the R&D expenditures targets at regional level. For the estimation of
total public and private R&D expenditures by NUTS2 regions, we assumed a similar distribution pattern across
regions as in the past policy cycle. No significant change is expected to occur over a single policy cycle since
R&D expenditures depends also on the availability of Human Resources in Science and Technology
(HRST)/researchers/infrastructures. Data for cohesion funds for R&D over the period 2021-2027 were
collected from the OPs with an R&D component, as far the information was available. Co-funding of EU
investments in R&D by the national government reflects the actual shares of co-funding of Cohesion policies
by the NUTS-2 regions in Romania.
For the assessment of the economic effects of R&D policies in Romania we employed the spatial Computable
General Equilibrium (CGE) model, RHOMOLO, that was developed for the purpose of territorial impact
assessment (Lecca et al. 2018).
CGE models represent a decentralised market economy where agents make optimal choices given a system
of resource constraints, behavioural preferences and technology. Producers maximize their profits while
consumers maximize the utility derived from their bundle of consumption and prices adjusting endogenously
to keep supply and demand balanced in all markets. Functional forms describe the agents' technology in
terms of converting inputs into output, featuring behavioural preferences in substitution among the inputs
in response to price changes.
In multi-regional CGE models, Social Accounted Matrices of regions (SAMs) are complemented with matrices
of bilateral trade and factor flows. A CGE model is parametrised to replicate the base year data when no
14
shocks are introduced into the model. The simulation of a policy shock leads to a new, counterfactual
equilibrium. The simulation associated with a policy shock can be defined as the "counterfactual scenario",
whereas the reproduction of the initial equilibrium in the economy can be referred to as the "baseline
scenario". Therefore, simulating a policy change with a CGE model is a “what if” comparison of two
equilibrium states of the economy.
The RHOMOLO model uses data organised in a multi-regional system of SAMs of EU NUTS 2 regions
disaggregated in ten economic sectors (Agriculture, Trade&Transport, Scientific&Technical Activities,
Manufacturing, Construction, Energy Sector, Information&Communication, Public Services,
Financial&Insurance Activities, and Other Services). All regions are inter-connected with trade and factor
flows. Trade is modelled following the Armington (1969) approach which assumes imperfect substitutability
among goods from different regions. The EU regions are treated as small open economies that accept non-
EU prices as given, consistently with the regional scope of the model. The expectations of economic agents
are assumed to be myopic, as they optimize within a one-year period, and the model is solved recursively
year by year. For this particular study, the model was run assuming perfect competition, imperfect factor
mobility, return-optimising investments, and a labour market governed by a wage curve (Blanchflower and
Oswald, 1995).9
Spatial CGE models like RHOMOLO allow for geographical disaggregation of country-wide policy impacts. Due
to a high level of spillovers among regions, and non-linearity of results (e.g. doubling of policy funding may
not necessarily double the policy impacts), the impact at regional level cannot always be directly attributed
to investments received by that region. For example, a region that receives no investments can still benefit
from investments in neighbouring regions since an overall increase in competitiveness is transmitted through
trade. The results of computer simulations can help identifying the territories where the benefits or losses
are concentrated, and permit to disaggregate policy outcomes, attributing them both to the direct effects of
policy interventions and to the spillover effects.
Similarly, the economic outcomes of investment may strongly depend on the source of funding. For
example, investments that are funded by the EU, national government and the national private sector may
have very different economic impacts. The EU Structural funds received by Romanian regions are to a large
extent supported by other MS. R&D funding by Romanian government is funded with the national taxes
revenues and have an alternative cost of being spent elsewhere in the economy. R&D activities of private
companies are financed with their retained profits. Evidently, private companies are likely to fund the most
rentable R&D activities, while public sector would target mainly the fundamental research that may not
generate revenues in the short run.
The goal of our study is to conduct assessment of the country-level and regional impacts of R&D funding in
Romania. We do not limit our research to the analysis of direct policy impacts. Instead, we broaden our focus
to the decomposition of results by the source of R&D expenditures, so that policy outcomes can be associated
with the origin of funding, and the direct effects of policy interventions can be separated from the spillover
effects.
As explained above, some features of the regional economies are key drivers of the results of the simulations.
The model is calibrated on 2013 data and the figures reported in the remaining tables of this section are
taken directly from the model database in order to accurately reflect the context of the simulations.
In Table 4, the propensity to import is proxied by the share of imports over output for each NUTS 2 region of
Romania. Table 5 reports the share of imports coming from each of the other regions in Romania with respect
to the total imports of the region.
9 For each labour type, the default wage setting relationship is represented by a wage curve , whose implication is that lower levels of unemployment increase workers' bargaining power, thereby increasing real wages.

15
Region RO11 RO12 RO21 RO22 RO31 RO32 RO41 RO42
Tot. Imports / output 34% 28% 20% 26% 42% 92% 47% 35%
Imports / output from rest of RO 9.3% 7.6% 6% 13.6% 15.5% 16.8% 25.7% 7.4%
Imports / output from EU 10% 8% 6% 14% 16% 18% 27% 8%
Imports / output from ROW 24% 20% 14% 12% 25% 75% 21% 27% Table 4. Share of imports in output
Source: Visualization of the base-year regional data of the RHOMOLO.model.
RO11 RO12 RO21 RO22 RO31 RO32 RO41 RO42 TOTAL
RO11 4.7% 2.6% 2.9% 3.8% 6.2% 2.9% 4.1% 27.4%
RO12 3.2% 2.9% 3.2% 4.3% 7.9% 2.9% 2.9% 27.1%
RO21 3.5% 4.0% 4.5% 5.0% 8.5% 2.0% 2.5% 30.0%
RO22 1.9% 2.3% 2.3% 20.8% 10.0% 13.1% 1.9% 52.3%
RO31 2.4% 4.5% 4.5% 9.5% 8.6% 2.9% 4.5% 36.9%
RO32 1.4% 2.3% 2.2% 3.3% 5.7% 1.2% 2.3% 18.3%
RO41 2.8% 6.2% 5.7% 9.8% 9.8% 4.9% 15.5% 54.7%
RO42 2.9% 3.1% 2.0% 2.3% 2.9% 5.7% 2.3% 21.1% Table 5. Regional share of total imports from the rest of the Romania regions
Source: Visualization of the base-year regional data of the RHOMOLO.model.
Though the capital city region is by far the most open to trade (with imports over output being equal to 92%,
while no other Romanian region reaches values above 50%), it mostly trades with partners outside Romania.
Only 18% of its imports come from the rest of the country. This contrasts with the less developed regions of
the country where the fraction of import coming from the rest of the country is in all cases higher than 18%,
and in some case is above 50% (RO41 and RO22, Table 5).
To have a better understanding of the industrial organization of the regions and their different technologies,
we report in Table 6, the regional labour shares of value added and the shares by skill type (the latter sum to
100%). Again, the capital city region stands out. It is much more labour intensive than the other regions,
which suggests that the predominant sector of activity of the latter regions is not constituted by services as
much as in RO32. The share of high skill labour in RO32 is the highest in the country, while the share of low
skill labour is the lowest.
Region RO11 RO12 RO21 RO22 RO31 RO32 RO41 RO42
Total Labour share 54% 46% 48% 45% 40% 66% 54% 43%
High skill 37% 35% 35% 35% 35% 39% 37% 35%
Medium skill 20% 20% 19% 18% 18% 21% 20% 19%
Low skill 43% 45% 46% 47% 47% 39% 43% 46%
Table 6. Labour share of value-added
Source: Visualization of the base-year regional data of the RHOMOLO model.
5. Description of model scenarios This section describes the data and assumptions used to construct the alternative scenarios for the
distribution of R&D investments in Romania. It constitutes the basis for the study of the alternative scenarios
used to explore the potential allocation of cohesion funding for the 2021-2027 programming periods.
16
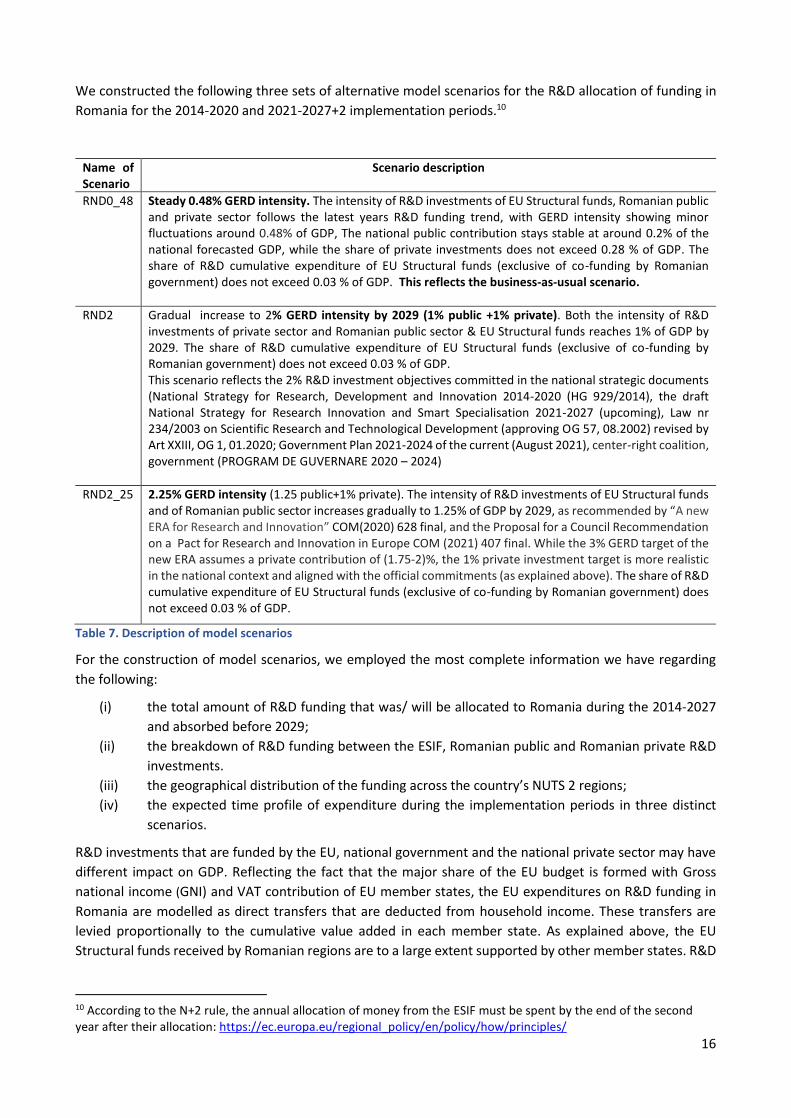
We constructed the following three sets of alternative model scenarios for the R&D allocation of funding in
Romania for the 2014-2020 and 2021-2027+2 implementation periods.10
Name of Scenario
Scenario description
RND0_48 Steady 0.48% GERD intensity. The intensity of R&D investments of EU Structural funds, Romanian public and private sector follows the latest years R&D funding trend, with GERD intensity showing minor fluctuations around 0.48% of GDP, The national public contribution stays stable at around 0.2% of the national forecasted GDP, while the share of private investments does not exceed 0.28 % of GDP. The share of R&D cumulative expenditure of EU Structural funds (exclusive of co-funding by Romanian government) does not exceed 0.03 % of GDP. This reflects the business-as-usual scenario.
RND2 Gradual increase to 2% GERD intensity by 2029 (1% public +1% private). Both the intensity of R&D investments of private sector and Romanian public sector & EU Structural funds reaches 1% of GDP by 2029. The share of R&D cumulative expenditure of EU Structural funds (exclusive of co-funding by Romanian government) does not exceed 0.03 % of GDP. This scenario reflects the 2% R&D investment objectives committed in the national strategic documents (National Strategy for Research, Development and Innovation 2014-2020 (HG 929/2014), the draft National Strategy for Research Innovation and Smart Specialisation 2021-2027 (upcoming), Law nr 234/2003 on Scientific Research and Technological Development (approving OG 57, 08.2002) revised by Art XXIII, OG 1, 01.2020; Government Plan 2021-2024 of the current (August 2021), center-right coalition, government (PROGRAM DE GUVERNARE 2020 – 2024)
RND2_25 2.25% GERD intensity (1.25 public+1% private). The intensity of R&D investments of EU Structural funds and of Romanian public sector increases gradually to 1.25% of GDP by 2029, as recommended by “A new ERA for Research and Innovation” COM(2020) 628 final, and the Proposal for a Council Recommendation on a Pact for Research and Innovation in Europe COM (2021) 407 final. While the 3% GERD target of the new ERA assumes a private contribution of (1.75-2)%, the 1% private investment target is more realistic in the national context and aligned with the official commitments (as explained above). The share of R&D cumulative expenditure of EU Structural funds (exclusive of co-funding by Romanian government) does not exceed 0.03 % of GDP.
Table 7. Description of model scenarios
For the construction of model scenarios, we employed the most complete information we have regarding
the following:
(i) the total amount of R&D funding that was/ will be allocated to Romania during the 2014-2027
and absorbed before 2029;
(ii) the breakdown of R&D funding between the ESIF, Romanian public and Romanian private R&D
investments.
(iii) the geographical distribution of the funding across the country’s NUTS 2 regions;
(iv) the expected time profile of expenditure during the implementation periods in three distinct
scenarios.
R&D investments that are funded by the EU, national government and the national private sector may have
different impact on GDP. Reflecting the fact that the major share of the EU budget is formed with Gross
national income (GNI) and VAT contribution of EU member states, the EU expenditures on R&D funding in
Romania are modelled as direct transfers that are deducted from household income. These transfers are
levied proportionally to the cumulative value added in each member state. As explained above, the EU
Structural funds received by Romanian regions are to a large extent supported by other member states. R&D
10 According to the N+2 rule, the annual allocation of money from the ESIF must be spent by the end of the second year after their allocation: https://ec.europa.eu/regional_policy/en/policy/how/principles/
17
funding by Romanian government is financed with the taxes, while the private R&D investments are financed
with the retained profits.
For this policy exercise, we employed the assumption that cumulative R&D investments were translated into
total factor productivity (TFP) improvements in all productive sectors. The calculation of TFP growth is based
on the econometric estimates of R&D-productivity relationships in Kancs and Siliverstovs (2016). R&D
investments act as a demand shock that stimulates productivity improvements (supply-side shock). This
mechanism was featured in the model as a reduction in risk premium that lowers the user cost of capital,
increasing its profitability thus stimulating private investment (demand-side shock) including productivity
enhancing effects (supply-side shock).
A possible limitation of an ex-ante impact policy assessment is the lack of information regarding the use of
policy funding by the regions over the policy implementation period. Allocation of R&D funds to the regions
may greatly vary from one year to another, and not all the investments can be converted into the TFP
improvements exactly the same year when they are allocated. A viable way of overcoming this assumption
would be to adopt for the programming period of 2021-2027 the investment consumption rates from the
past programming periods, so that R&D funding is converted to TFP improvements based on the assumption
of its consumption in a given year rather than of allocation. However, in reality, utilization rates can vary
from one programming period to another. In the absence of data that permit to make assumptions about
the future absorption rates, we used the direct approach to convert R&D investments into TFP improvements
based on allocation rates rather than assumptions about their future utilization during the policy
implementation period.
TFP improvements allow production of more output with the same amounts of labour and capital, which
gives producers a comparative advantage in terms of price setting, thus increasing regional competitiveness
with positive effects on exports. Given that the rental rate of a factor is equal to its marginal product, the
decreased demand of labour and capital per unit of output rises both wages and the rate of return of capital,
with a positive impact on household income. Overall, the strength of the direct policy impacts depends on
how ambitious the regional R&D targets are, which in turn determine the intensity of the TFP shocks. Due to
the high innovation content of the policy under scrutiny, achieved improvements in technological efficiency
and productivity of labour evidently last beyond the end of the policy funding period. In this exercise, their
effects are assumed to decline gradually over time at a 5% annual depreciation rate in the absence of
continuous R&D funding.
In this simulation, we adopted the same TFP coefficients for the ESIF, R&D investments of Romanian
government and of R&D investments of Romanian public sector. The TFP coefficients of private the public
R&D funding could be different and materialize with a different time lag. In the absence of reliable
econometric estimates that allow us to associate private and public R&D expenditures with different
coefficients of TFP improvements in Romania, it can be still investigated as sensitivity analysis.
We focus on the impact on the following three indicators: regional and national GDP deviations from the
baseline projections, and the GDP multipliers, defined as the return on GDP per euro spent.11
GDP multipliers in a year ‘n’ are calculated using the following formula (1):
𝑀𝑢𝑙𝑡𝑖𝑝𝑙𝑖𝑒𝑟𝑛𝐺𝐷𝑃 =
∑ (𝐺𝐷𝑃𝑡𝑠𝑐𝑛−𝐺𝐷𝑃𝑡
𝑏𝑎𝑢)𝑛𝑡=1
∑ 𝐼𝑛𝑣𝑒𝑠𝑡𝑚𝑒𝑛𝑡𝑠𝑡𝑛𝑡=1
(1)
Where:
𝑀𝑢𝑙𝑡𝑖𝑝𝑙𝑖𝑒𝑟𝑛𝐺𝐷𝑃 - GDP multiplier in a year n;
𝐼𝑛𝑣𝑒𝑠𝑡𝑚𝑒𝑛𝑡𝑠𝑡 - investments in a year n;
11 For instance, a multiplier of 1.5 after 10 years means that GDP has increased by €1.5 for each € spent.
18
𝐺𝐷𝑃𝑡𝑠𝑐𝑛 - after-shock GPD in a year n;
𝐺𝐷𝑃𝑡𝑏𝑎𝑢 - baseline GDP in a year n;
n - number of years. Thus, according to the formula (1), the highest GDP multipliers are obtained with the highest GDP growth per the lowest R&D investments.
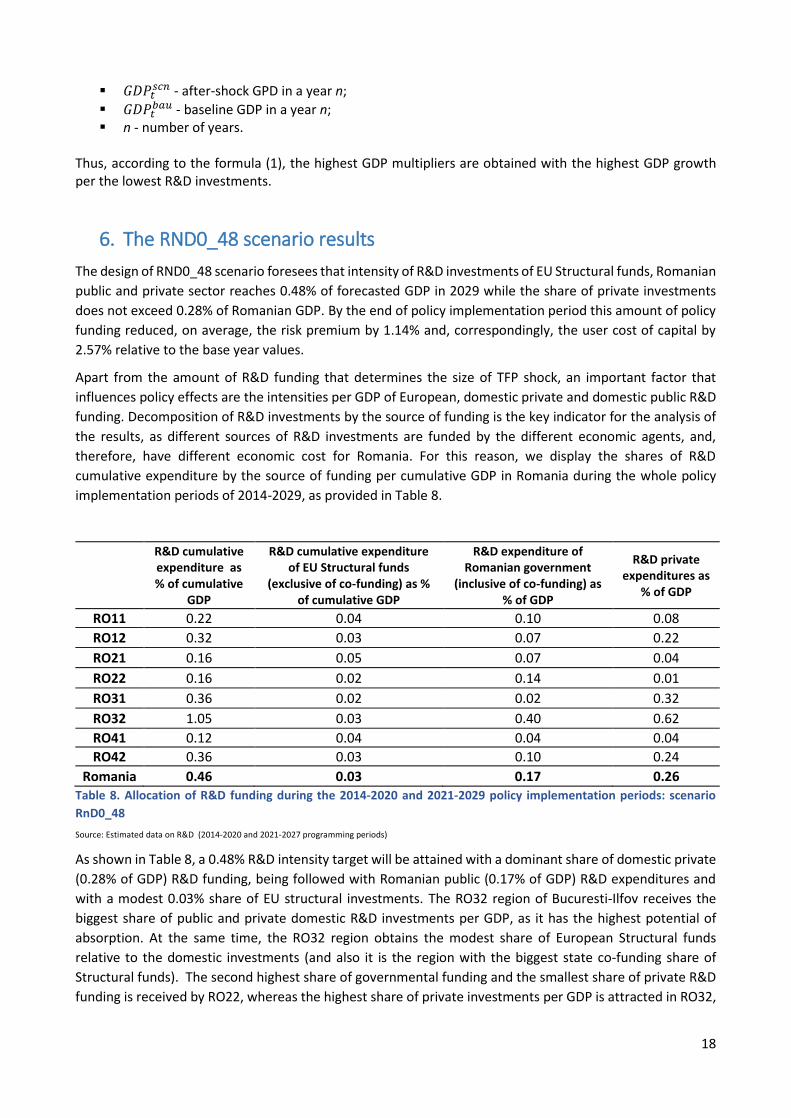
6. The RND0_48 scenario results
The design of RND0_48 scenario foresees that intensity of R&D investments of EU Structural funds, Romanian
public and private sector reaches 0.48% of forecasted GDP in 2029 while the share of private investments
does not exceed 0.28% of Romanian GDP. By the end of policy implementation period this amount of policy
funding reduced, on average, the risk premium by 1.14% and, correspondingly, the user cost of capital by
2.57% relative to the base year values.
Apart from the amount of R&D funding that determines the size of TFP shock, an important factor that
influences policy effects are the intensities per GDP of European, domestic private and domestic public R&D
funding. Decomposition of R&D investments by the source of funding is the key indicator for the analysis of
the results, as different sources of R&D investments are funded by the different economic agents, and,
therefore, have different economic cost for Romania. For this reason, we display the shares of R&D
cumulative expenditure by the source of funding per cumulative GDP in Romania during the whole policy
implementation periods of 2014-2029, as provided in Table 8.
R&D cumulative expenditure as % of cumulative
GDP
R&D cumulative expenditure of EU Structural funds
(exclusive of co-funding) as % of cumulative GDP
R&D expenditure of Romanian government
(inclusive of co-funding) as % of GDP
R&D private expenditures as
% of GDP
RO11 0.22 0.04 0.10 0.08
RO12 0.32 0.03 0.07 0.22
RO21 0.16 0.05 0.07 0.04
RO22 0.16 0.02 0.14 0.01
RO31 0.36 0.02 0.02 0.32
RO32 1.05 0.03 0.40 0.62
RO41 0.12 0.04 0.04 0.04
RO42 0.36 0.03 0.10 0.24
Romania 0.46 0.03 0.17 0.26 Table 8. Allocation of R&D funding during the 2014-2020 and 2021-2029 policy implementation periods: scenario
RnD0_48
Source: Estimated data on R&D (2014-2020 and 2021-2027 programming periods)
As shown in Table 8, a 0.48% R&D intensity target will be attained with a dominant share of domestic private
(0.28% of GDP) R&D funding, being followed with Romanian public (0.17% of GDP) R&D expenditures and
with a modest 0.03% share of EU structural investments. The RO32 region of Bucuresti-Ilfov receives the
biggest share of public and private domestic R&D investments per GDP, as it has the highest potential of
absorption. At the same time, the RO32 region obtains the modest share of European Structural funds
relative to the domestic investments (and also it is the region with the biggest state co-funding share of
Structural funds). The second highest share of governmental funding and the smallest share of private R&D
funding is received by RO22, whereas the highest share of private investments per GDP is attracted in RO32,
19
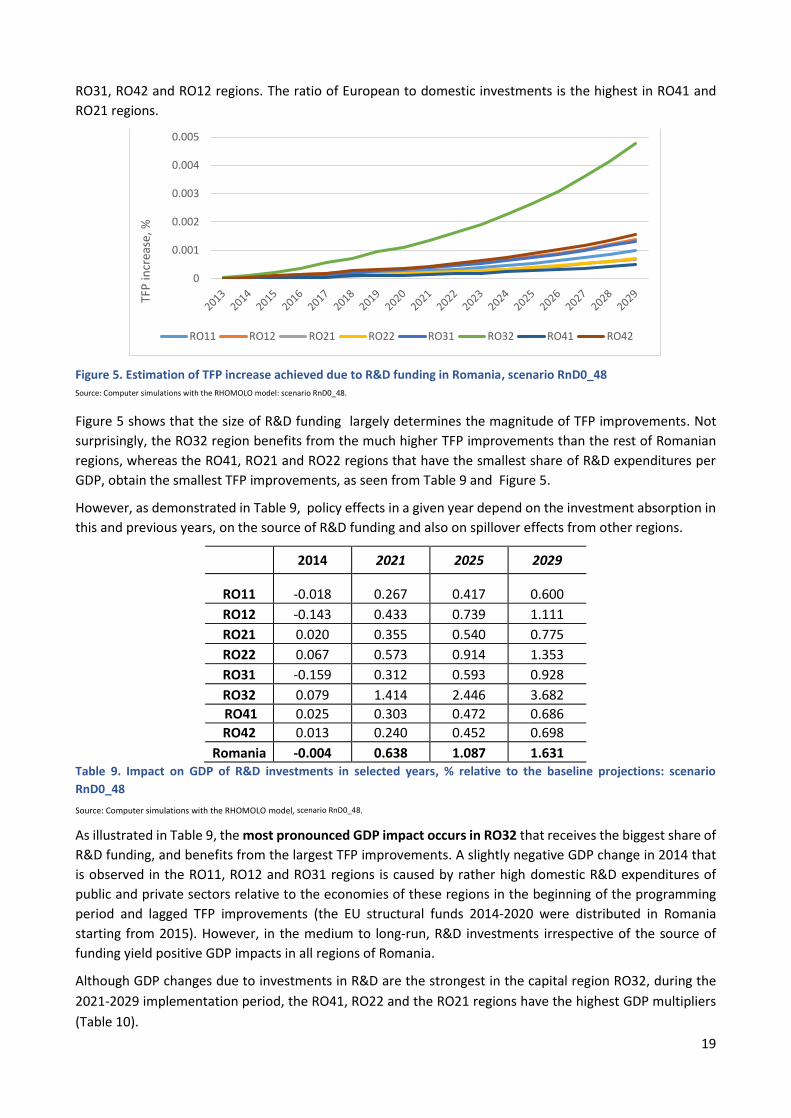
RO31, RO42 and RO12 regions. The ratio of European to domestic investments is the highest in RO41 and
RO21 regions.
Figure 5. Estimation of TFP increase achieved due to R&D funding in Romania, scenario RnD0_48
Source: Computer simulations with the RHOMOLO model: scenario RnD0_48.
Figure 5 shows that the size of R&D funding largely determines the magnitude of TFP improvements. Not
surprisingly, the RO32 region benefits from the much higher TFP improvements than the rest of Romanian
regions, whereas the RO41, RO21 and RO22 regions that have the smallest share of R&D expenditures per
GDP, obtain the smallest TFP improvements, as seen from Table 9 and Figure 5.
However, as demonstrated in Table 9, policy effects in a given year depend on the investment absorption in
this and previous years, on the source of R&D funding and also on spillover effects from other regions.
2014 2021 2025 2029
RO11 -0.018 0.267 0.417 0.600
RO12 -0.143 0.433 0.739 1.111
RO21 0.020 0.355 0.540 0.775
RO22 0.067 0.573 0.914 1.353
RO31 -0.159 0.312 0.593 0.928
RO32 0.079 1.414 2.446 3.682
RO41 0.025 0.303 0.472 0.686
RO42 0.013 0.240 0.452 0.698
Romania -0.004
0.638
1.087
1.631
Table 9. Impact on GDP of R&D investments in selected years, % relative to the baseline projections: scenario
RnD0_48
Source: Computer simulations with the RHOMOLO model, scenario RnD0_48.
As illustrated in Table 9, the most pronounced GDP impact occurs in RO32 that receives the biggest share of
R&D funding, and benefits from the largest TFP improvements. A slightly negative GDP change in 2014 that
is observed in the RO11, RO12 and RO31 regions is caused by rather high domestic R&D expenditures of
public and private sectors relative to the economies of these regions in the beginning of the programming
period and lagged TFP improvements (the EU structural funds 2014-2020 were distributed in Romania
starting from 2015). However, in the medium to long-run, R&D investments irrespective of the source of
funding yield positive GDP impacts in all regions of Romania.
Although GDP changes due to investments in R&D are the strongest in the capital region RO32, during the
2021-2029 implementation period, the RO41, RO22 and the RO21 regions have the highest GDP multipliers
(Table 10).
0
0.001
0.002
0.003
0.004
0.005TF
P in
crea
se, %
RO11 RO12 RO21 RO22 RO31 RO32 RO41 RO42
20
GDP multipliers of cumulative R&D investments in Romania
2014 2021 2025 2029
RO11 -0.161 0.333 0.490 0.588
RO12 -0.436 0.222 0.501 0.685
RO21 -0.132 0.711 0.965 1.127
RO22 0.196 1.230 1.626 1.911
RO31 -0.691 0.053 0.335 0.532
RO32 -0.028 0.375 0.594 0.742
RO41 -0.027 0.744 1.117 1.359
RO42 -0.242 -0.007 0.198 0.330
Romania -0.158
0.361
0.596
0.755
Table 10. GDP multipliers of cumulative R&D investments in Romania: scenario RnD0_48
Source: Computer simulations with the RHOMOLO model, scenario RnD0_48.
Regions like RO12, RO11, RO31 and RO4, that in some years suffered negative impacts on GDP because of
the ambitious shares of domestic R&D funding, record lower GDP multipliers than regions like RO21, RO22,
RO32 and RO41. Potential spillover effects that originate from trade may also impact the policy outcomes.
The simulations show that the short-run economic impacts of policy interventions are mainly driven by the
demand effects generated by R&D investment funding during the 2014-2020 policy cycle. However, if
continuous R&D funding stops after the termination of a programming period, the demand-driven policy
effects would dissipate, but the structural effects of investments on productivity improvements would gain
momentum and become the main drivers of the results during the investment-induced structural phase.
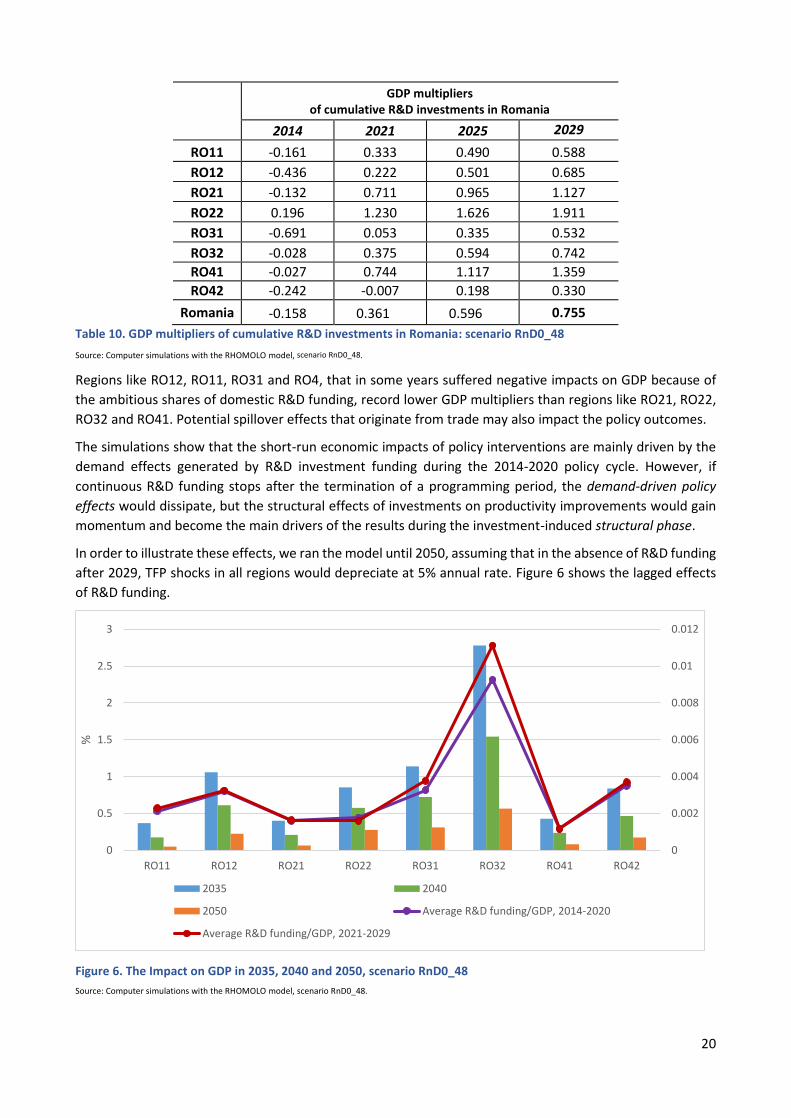
In order to illustrate these effects, we ran the model until 2050, assuming that in the absence of R&D funding
after 2029, TFP shocks in all regions would depreciate at 5% annual rate. Figure 6 shows the lagged effects
of R&D funding.
Figure 6. The Impact on GDP in 2035, 2040 and 2050, scenario RnD0_48
Source: Computer simulations with the RHOMOLO model, scenario RnD0_48.
0
0.002
0.004
0.006
0.008
0.01
0.012
0
0.5
1
1.5
2
2.5
3
RO11 RO12 RO21 RO22 RO31 RO32 RO41 RO42
%
2035 2040
2050 Average R&D funding/GDP, 2014-2020
Average R&D funding/GDP, 2021-2029

21
The impact is expressed as % differences from the no-policy-scenario GDP (lhs scale), and average R&D policy
funding per GDP during 2014-2020 and 2021-29 implementation periods (rhs scale, absolute numbers). As
shown in Figure 6, after the R&D funding is over, all regions continue to record positive GDP impacts that
gradually but not fully diminish by 2050. Positive impacts are continued due to two reasons. First, the capital
stock built up during the policy support period increases the level of productive inputs in the regions. Second,
the long-run structural impacts associated with R&D funding keep on providing a competitive edge to the
regions even after 2029 because of the gradual depreciation of factor productivity. Overall, the strengths of
the lagged effects of R&D funding depends on the amounts of R&D investments.
7. The RND2 scenario results We continue our analysis by scrutinizing the economic impacts of RND2 scenario which reflects the 2% R&D
investment target in the national GDP (equally divided between the public and the private sector) according
to the Europe 2020 Strategy and national R&D target. By the end of policy implementation period R&D policy
funding reduced, on average, the risk premium by 5.12% and, correspondingly, the user cost of capital by
10.63% relative to their base year values.
In Table 11 we display the shares of R&D cumulative expenditure by the source of funding per cumulative
GDP in Romania during the two policy implementation periods of 2014-2029.
R&D cumulative expenditure as %
of cumulative GDP
R&D cumulative expenditure of EU Structural funds (exclusive of co-funding) as % of cumulative GDP
R&D expenditure of Romanian government (inclusive of co-
funding) as % of GDP
R&D private expenditures as % of GDP
RO11 0.52 0.04 0.32 0.16
RO12 0.68 0.03 0.23 0.42
RO21 0.39 0.05 0.27 0.07
RO22 0.42 0.02 0.38 0.01
RO31 0.72 0.02 0.09 0.61
RO32 2.32 0.03 1.06 1.23
RO41 0.27 0.04 0.17 0.07
RO42 0.78 0.03 0.29 0.46
RO 1.02 0.03 0.47 0.52
Table 11. Allocation of R&D funding during the 2014-2020 and 2021-2029 policy implementation periods: scenario
RnD2
Source: Authors’ compilations based on the latest available data (including on cohesion policy (2014-2020 and 2021-2027 programming periods).
As shown in Table 11, a 2% GERD intensity target is supposed to be achieved with a dominant average share
of domestic private (0.52% of cumulative GDP) R&D funding, being followed with Romanian public (0.47% of
cumulative GDP) R&D expenditures, and with a modest 0.03% share of EU structural investments in country’s
cumulative GDP over the two implementation periods. Same as in the previous scenario, although RO32
receives the biggest share of cumulative policy funding, the RO21 and RO41 regions have the highest ratio of
ESIF expenditures on R&D relative to the domestic investments; RO22 has the second biggest in Romania
intensity of governmental funding per GDP and the smallest intensity of private R&D funding; whereas the
RO32, RO31, RO42 and RO12 regions have the most substantial intensity of private R&D funding.
Figure 7 shows that because of the largest R&D funding the RO32 region benefits from the much higher than
the rest of Romanian regions TFP improvements, whereas the RO41, RO21 and RO22 regions obtain the
smallest TFP improvements due to the smallest R&D expenditures:
22
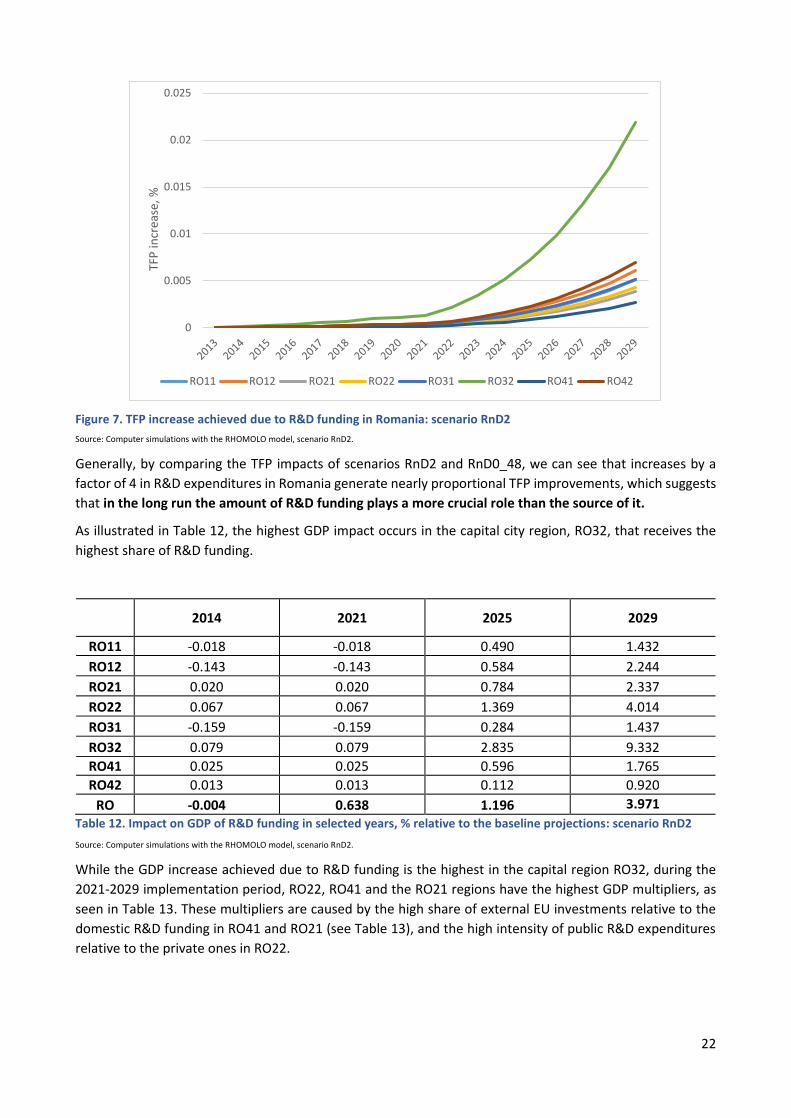
Figure 7. TFP increase achieved due to R&D funding in Romania: scenario RnD2
Source: Computer simulations with the RHOMOLO model, scenario RnD2.
Generally, by comparing the TFP impacts of scenarios RnD2 and RnD0_48, we can see that increases by a
factor of 4 in R&D expenditures in Romania generate nearly proportional TFP improvements, which suggests
that in the long run the amount of R&D funding plays a more crucial role than the source of it.
As illustrated in Table 12, the highest GDP impact occurs in the capital city region, RO32, that receives the
highest share of R&D funding.
2014 2021 2025 2029
RO11 -0.018 -0.018 0.490 1.432
RO12 -0.143 -0.143 0.584 2.244
RO21 0.020 0.020 0.784 2.337
RO22 0.067 0.067 1.369 4.014
RO31 -0.159 -0.159 0.284 1.437
RO32 0.079 0.079 2.835 9.332
RO41 0.025 0.025 0.596 1.765
RO42 0.013 0.013 0.112 0.920
RO -0.004 0.638 1.196 3.971
Table 12. Impact on GDP of R&D funding in selected years, % relative to the baseline projections: scenario RnD2
Source: Computer simulations with the RHOMOLO model, scenario RnD2.
While the GDP increase achieved due to R&D funding is the highest in the capital region RO32, during the
2021-2029 implementation period, RO22, RO41 and the RO21 regions have the highest GDP multipliers, as
seen in Table 13. These multipliers are caused by the high share of external EU investments relative to the
domestic R&D funding in RO41 and RO21 (see Table 13), and the high intensity of public R&D expenditures
relative to the private ones in RO22.
0
0.005
0.01
0.015
0.02
0.025
TFP
incr
ease
, %
RO11 RO12 RO21 RO22 RO31 RO32 RO41 RO42
23
GDP multipliers of cumulative R&D investments in Romania
2014 2021 2025 2029
RO11 -0.161 0.333 0.342 0.371
RO12 -0.436 0.222 0.310 0.387
RO21 -0.132 0.711 0.728 0.801
RO22 0.196 1.230 1.204 1.300
RO31 -0.691 0.053 0.160 0.241
RO32 -0.028 0.375 0.427 0.512
RO41 -0.027 0.744 0.808 0.893
RO42 -0.242 -0.007 0.056 0.106
Romania -0.158 0.361 0.420 0.501
Table 13. GDP multipliers of cumulative R&D investments in Romania: scenario RnD2
Source: Computer simulations with the RHOMOLO model, scenario RnD2.
Evidently, policy outcomes in a particular region largely depend on allocation and on the source of policy
funding and the economic cost of it. However, the spillover effects that to some extent impact policy
outcomes depend on a degree of trade openness and intensity of trade. Although the national GDP impact
in 2025 and 2029 is higher under the scenario RnD2 than under the scenario RnD0_48, the scenario RnD2
produces lower GDP multipliers that the scenario RnD0_48. This outcome is explained by the larger share of
R&D investments per GDP during the 2021-2029 policy implementation period, in line with equation (1) of
GDP multipliers.
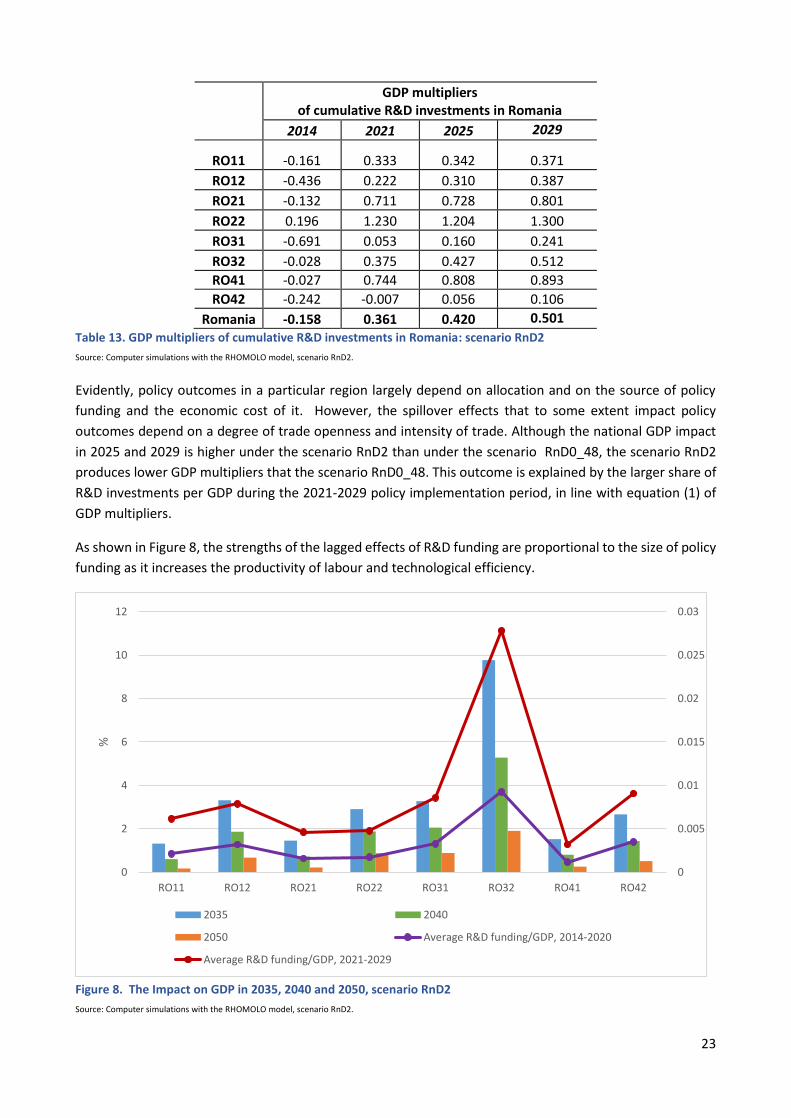
As shown in Figure 8, the strengths of the lagged effects of R&D funding are proportional to the size of policy
funding as it increases the productivity of labour and technological efficiency.
Figure 8. The Impact on GDP in 2035, 2040 and 2050, scenario RnD2
Source: Computer simulations with the RHOMOLO model, scenario RnD2.
0
0.005
0.01
0.015
0.02
0.025
0.03
0
2
4
6
8
10
12
RO11 RO12 RO21 RO22 RO31 RO32 RO41 RO42
%
2035 2040
2050 Average R&D funding/GDP, 2014-2020
Average R&D funding/GDP, 2021-2029
24
The impact is expressed as % differences from the no-policy-scenario GDP (lhs scale), and as a ratio over GDP for the average R&D policy funding during the 2014-2020 and 2021-2029 implementation periods (rhs scale).
8. The RND2_25 scenario
In this section we provide the results of computer simulations with RHOMOLO for the most ambitious
scenario RND2_25 which reflects the 2.25% R&D intensity target (in which the share of private funding attains
1% of country’s GDP by 2029). By the end of policy implementation period R&D policy funding in Romania
reduced, on average, the risk premium by 6% and, correspondingly, the user cost of capital by 11.9% below
their base year values.
The shares of R&D cumulative expenditure by the source of funding per cumulative GDP in Romania during
the policy implementation period, 2014-2029, are displayed in Table 14 .
R&D cumulative expenditure as %
of cumulative GDP
R&D cumulative expenditure of EU Structural funds (exclusive of co-funding) as % of cumulative
GDP
R&D expenditure of Romanian government
(inclusive of co-funding) as % of GDP
R&D private expenditures as % of GDP
RO11 0.58 0.04 0.38 0.16
RO12 0.72 0.03 0.27 0.42
RO21 0.45 0.05 0.33 0.07
RO22 0.49 0.02 0.46 0.01
RO31 0.74 0.02 0.11 0.61
RO32 2.52 0.03 1.26 1.23
RO41 0.31 0.04 0.21 0.07
RO42 0.83 0.03 0.35 0.46
Romania 1.11 0.03 0.56 0.52
Table 14. Allocation of R&D funding during the 2014-2020 and 2021-2029 policy implementation periods: scenario
RnD2_25
Source: Data on cohesion policy (2014-2020 and 2021-2027 programming periods).
As shown in Table 14, the 2.25% R&D intensity target is supposed to be achieved with a dominant share of
investments of Romanian government, inclusive of co-funding of EU Structural funds for R&D, a smaller share
of domestic private investments (0.52% of GDP) and a 0.03% share of EU structural investments in country’s
GDP. As in the previous scenarios, the RO21 and RO41 regions have the highest in the country ratio of EU
Structural Fund expenditures on R&D relative to the domestic investments. The biggest private R&D
expenditures per GDP are made in RO32, RO31, RO42 and RO12 regions.
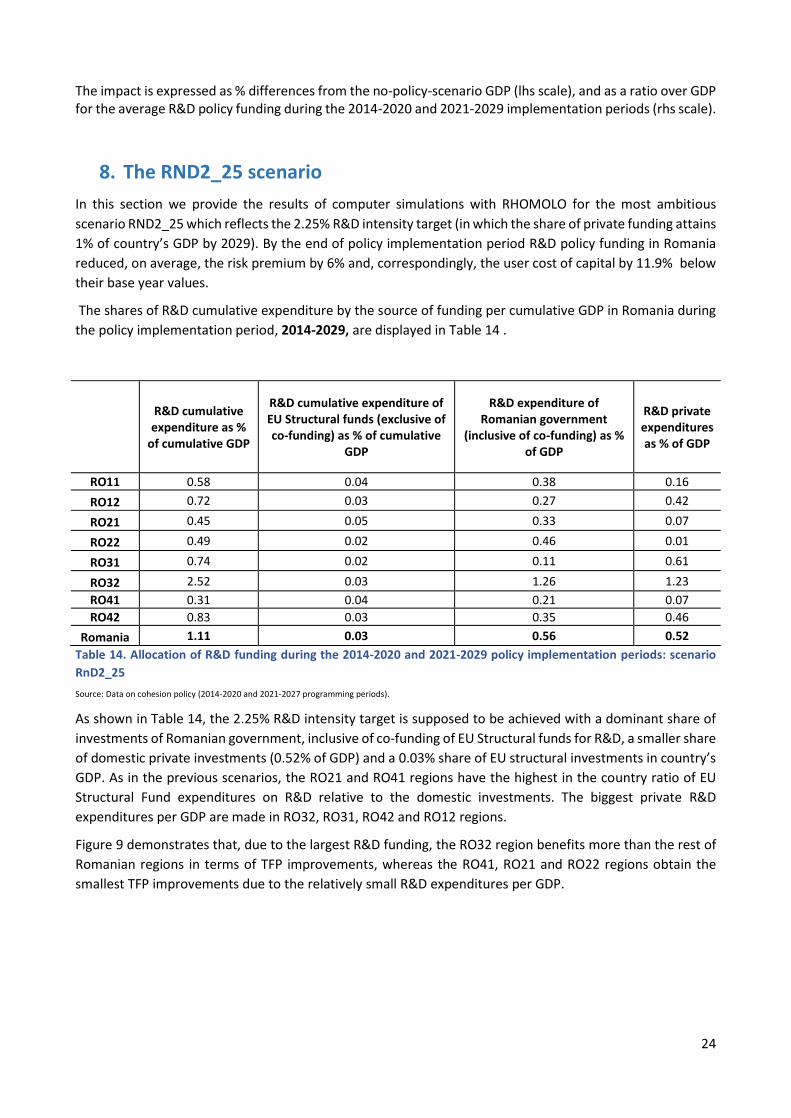
Figure 9 demonstrates that, due to the largest R&D funding, the RO32 region benefits more than the rest of
Romanian regions in terms of TFP improvements, whereas the RO41, RO21 and RO22 regions obtain the
smallest TFP improvements due to the relatively small R&D expenditures per GDP.
25
Figure 9. TFP increase achieved due to R&D funding in Romania: scenario RnD2_25
Source: Computer simulations with the RHOMOLO model, scenario RnD2_25.
As shown in Table 15, the most pronounced GDP impact occurs in RO32, RO22, RO21 and RO12 regions,
which depends on factors like the amount and the source of policy funding, its distribution in a particular
year, and propagation of spillover effects.
2014 2021 2025 2029
RO11 -0.018 0.267 0.552 1.414
RO12 -0.143 0.433 0.647 2.456
RO21 0.020 0.355 0.851 2.570
RO22 0.067 0.573 1.468 4.431
RO31 -0.159 0.312 0.327 1.536
RO32 0.079 1.414 3.175 9.413
RO41 0.025 0.303 0.638 1.791
RO42 0.013 0.240 0.159 0.973
Romania -0.004 0.638 1.331 4.106
Table 15. Impact on GDP of R&D investments in selected years, % relative to the baseline projections: scenario RnD2_25
Source: Computer simulations with the RHOMOLO model, scenario RnD2_25.
The scenario RND2_25, which assumes the most ambitious targets in terms of R&D investments from the
public sector in Romania, produces lower policy multipliers as compared with the previous scenarios, as seen
in Table 16.
GDP multipliers of cumulative R&D investments in Romania
2014 2021 2025 2029
RO11 -0.161 0.333 0.333 0.355
RO12 -0.436 0.222 0.309 0.399
RO21 -0.132 0.711 0.692 0.757
RO22 0.196 1.230 1.121 1.192
RO31 -0.691 0.053 0.165 0.262
0
0.005
0.01
0.015
0.02
0.025
TFP
incr
ease
,%
RO11 RO12 RO21 RO22
RO31 RO32 RO41 RO42

26
RO32 -0.028 0.375 0.426 0.509
RO41 -0.027 0.744 0.769 0.830
RO42 -0.242 -0.007 0.060 0.118
Romani -0.158 0.361 0.417 0.498 Table 16. GDP multipliers of cumulative R&D investments in Romania: scenario RnD2_25
Source: Computer simulations with the RHOMOLO model, scenario RND2_25.
Overall, the size of multipliers is largely determined by the size and the composition of R&D expenditures
and their annual allocation. As shown in Figure 10, the strength of the lagged effects of R&D funding
depends on the intensity of R&D investments, irrespective to the source of funding, as it contributes to the
productivity of labour and technological efficiency.
Figure 10. The Impact on GDP in 2035, 2040 and 2050: scenario RnD2_25
Source: Computer simulations with the RHOMOLO model, scenario RnD2_25.
The impact is expressed as % differences from the no-policy-scenario GDP (lhs scale), and as ratio over GDP for the average R&D policy funding during 2014-2020 and 2021-2029 implementation periods (rhs scale). Across all simulated scenarios and for all the analysed time intervals, the capital region consistently records the highest economic impact.
In the next section we conduct a series of simulations to disaggregate the effects of each funding source.
9. Decomposition of policy impacts
Considering that R&D in Romania is currently funded with the investments from the EU Cohesion Policy
funds, the Romanian government and Romanian private sector, these funding sources produce a complex
cumulative effect. The modelling framework we use permits to study each source of funding separately, in
order to understand how the policy impacts depend not only on the volume of the funding, but also on its
origin and on the alternative economic cost associated with it.
0
0.005
0.01
0.015
0.02
0.025
0.03
0.035
0
2
4
6
8
10
12
RO11 RO12 RO21 RO22 RO31 RO32 RO41 RO42
%
2035 2040
2050 Average R&D funding/GDP, 2014-2020
Average R&D funding/GDP, 2021-2029
27
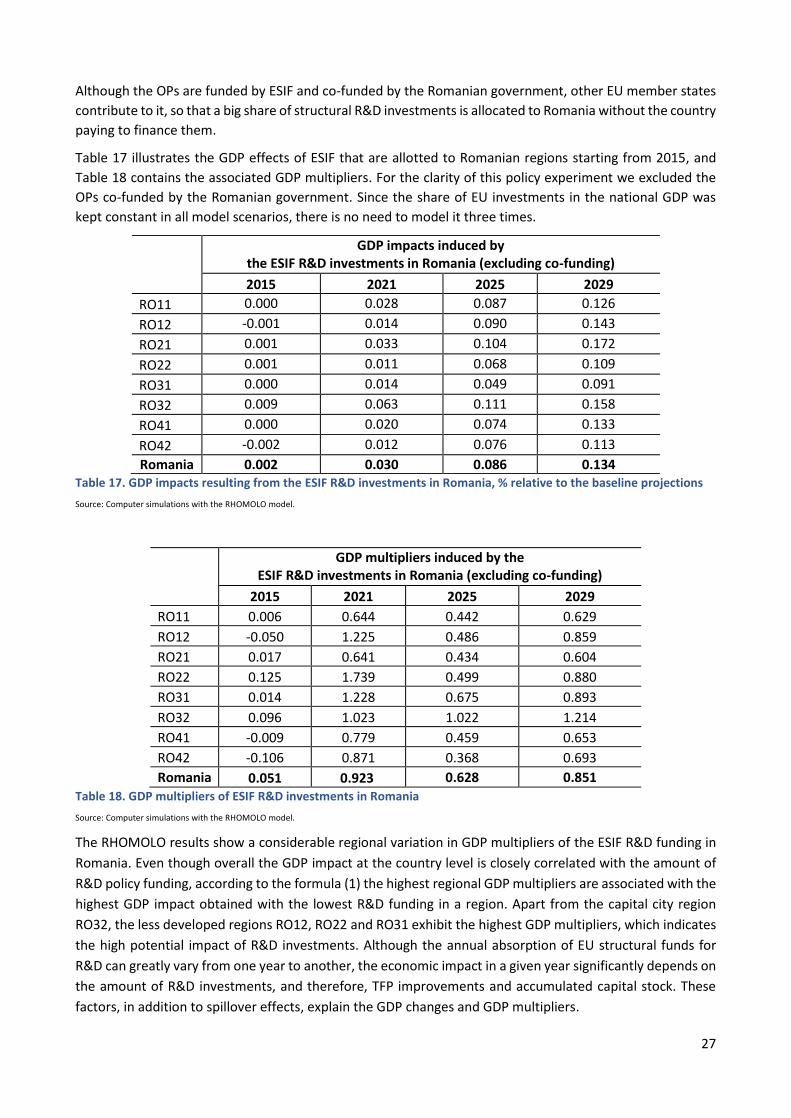
Although the OPs are funded by ESIF and co-funded by the Romanian government, other EU member states
contribute to it, so that a big share of structural R&D investments is allocated to Romania without the country
paying to finance them.
Table 17 illustrates the GDP effects of ESIF that are allotted to Romanian regions starting from 2015, and
Table 18 contains the associated GDP multipliers. For the clarity of this policy experiment we excluded the
OPs co-funded by the Romanian government. Since the share of EU investments in the national GDP was
kept constant in all model scenarios, there is no need to model it three times.
GDP impacts induced by the ESIF R&D investments in Romania (excluding co-funding)
2015 2021 2025 2029
RO11 0.000 0.028 0.087 0.126
RO12 -0.001 0.014 0.090 0.143
RO21 0.001 0.033 0.104 0.172
RO22 0.001 0.011 0.068 0.109
RO31 0.000 0.014 0.049 0.091
RO32 0.009 0.063 0.111 0.158
RO41 0.000 0.020 0.074 0.133
RO42 -0.002 0.012 0.076 0.113
Romania 0.002 0.030 0.086 0.134 Table 17. GDP impacts resulting from the ESIF R&D investments in Romania, % relative to the baseline projections
Source: Computer simulations with the RHOMOLO model.
GDP multipliers induced by the ESIF R&D investments in Romania (excluding co-funding)
2015 2021 2025 2029
RO11 0.006 0.644 0.442 0.629
RO12 -0.050 1.225 0.486 0.859
RO21 0.017 0.641 0.434 0.604
RO22 0.125 1.739 0.499 0.880
RO31 0.014 1.228 0.675 0.893
RO32 0.096 1.023 1.022 1.214
RO41 -0.009 0.779 0.459 0.653
RO42 -0.106 0.871 0.368 0.693
Romania 0.051
0.923
0.628 0.851 Table 18. GDP multipliers of ESIF R&D investments in Romania
Source: Computer simulations with the RHOMOLO model.
The RHOMOLO results show a considerable regional variation in GDP multipliers of the ESIF R&D funding in
Romania. Even though overall the GDP impact at the country level is closely correlated with the amount of
R&D policy funding, according to the formula (1) the highest regional GDP multipliers are associated with the
highest GDP impact obtained with the lowest R&D funding in a region. Apart from the capital city region
RO32, the less developed regions RO12, RO22 and RO31 exhibit the highest GDP multipliers, which indicates
the high potential impact of R&D investments. Although the annual absorption of EU structural funds for
R&D can greatly vary from one year to another, the economic impact in a given year significantly depends on
the amount of R&D investments, and therefore, TFP improvements and accumulated capital stock. These
factors, in addition to spillover effects, explain the GDP changes and GDP multipliers.
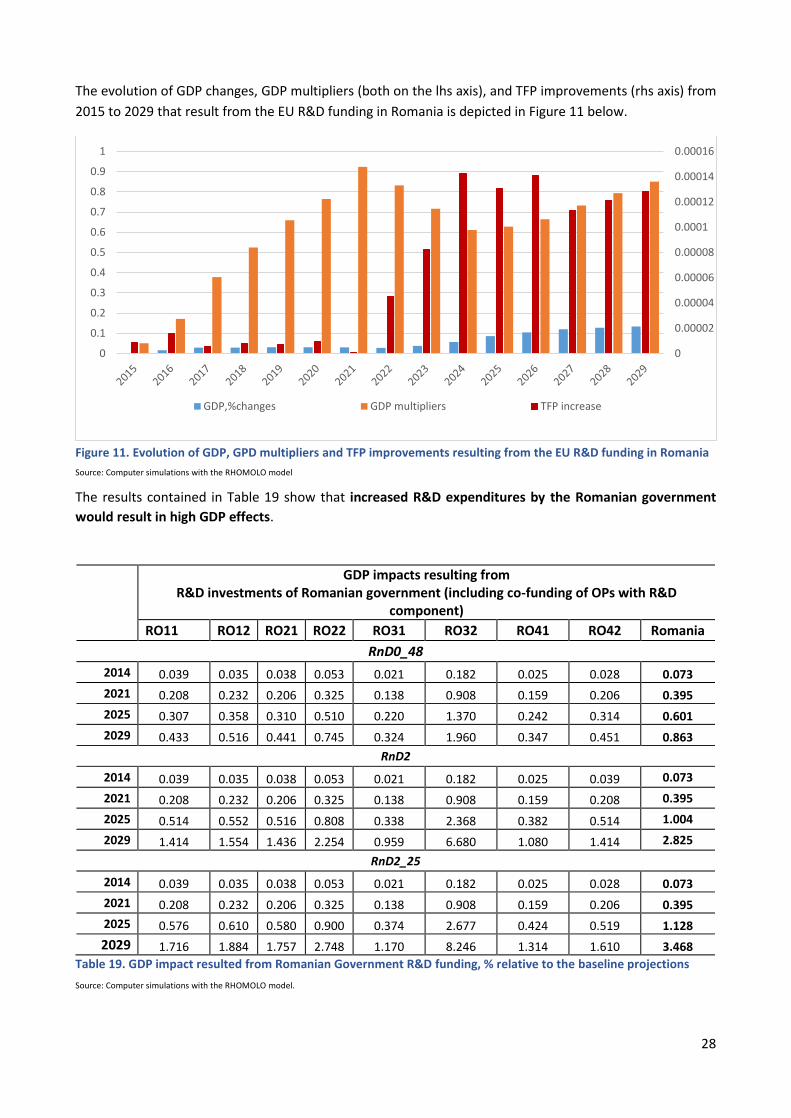
28
The evolution of GDP changes, GDP multipliers (both on the lhs axis), and TFP improvements (rhs axis) from
2015 to 2029 that result from the EU R&D funding in Romania is depicted in Figure 11 below.
Figure 11. Evolution of GDP, GPD multipliers and TFP improvements resulting from the EU R&D funding in Romania
Source: Computer simulations with the RHOMOLO model
The results contained in Table 19 show that increased R&D expenditures by the Romanian government
would result in high GDP effects.
GDP impacts resulting from R&D investments of Romanian government (including co-funding of OPs with R&D
component)
RO11 RO12 RO21 RO22 RO31 RO32 RO41 RO42 Romania
RnD0_48
2014 0.039 0.035 0.038 0.053 0.021 0.182 0.025 0.028 0.073
2021 0.208 0.232 0.206 0.325 0.138 0.908 0.159 0.206 0.395
2025 0.307 0.358 0.310 0.510 0.220 1.370 0.242 0.314 0.601
2029 0.433 0.516 0.441 0.745 0.324 1.960 0.347 0.451 0.863
RnD2
2014 0.039 0.035 0.038 0.053 0.021 0.182 0.025 0.039 0.073
2021 0.208 0.232 0.206 0.325 0.138 0.908 0.159 0.208 0.395
2025 0.514 0.552 0.516 0.808 0.338 2.368 0.382 0.514 1.004
2029 1.414 1.554 1.436 2.254 0.959 6.680 1.080 1.414 2.825
RnD2_25
2014 0.039 0.035 0.038 0.053 0.021 0.182 0.025 0.028 0.073
2021 0.208 0.232 0.206 0.325 0.138 0.908 0.159 0.206 0.395
2025 0.576 0.610 0.580 0.900 0.374 2.677 0.424 0.519 1.128
2029 1.716 1.884 1.757 2.748 1.170 8.246 1.314 1.610 3.468
Table 19. GDP impact resulted from Romanian Government R&D funding, % relative to the baseline projections
Source: Computer simulations with the RHOMOLO model.
0
0.00002
0.00004
0.00006
0.00008
0.0001
0.00012
0.00014
0.00016
0
0.1
0.2
0.3
0.4
0.5
0.6
0.7
0.8
0.9
1
GDP,%changes GDP multipliers TFP increase
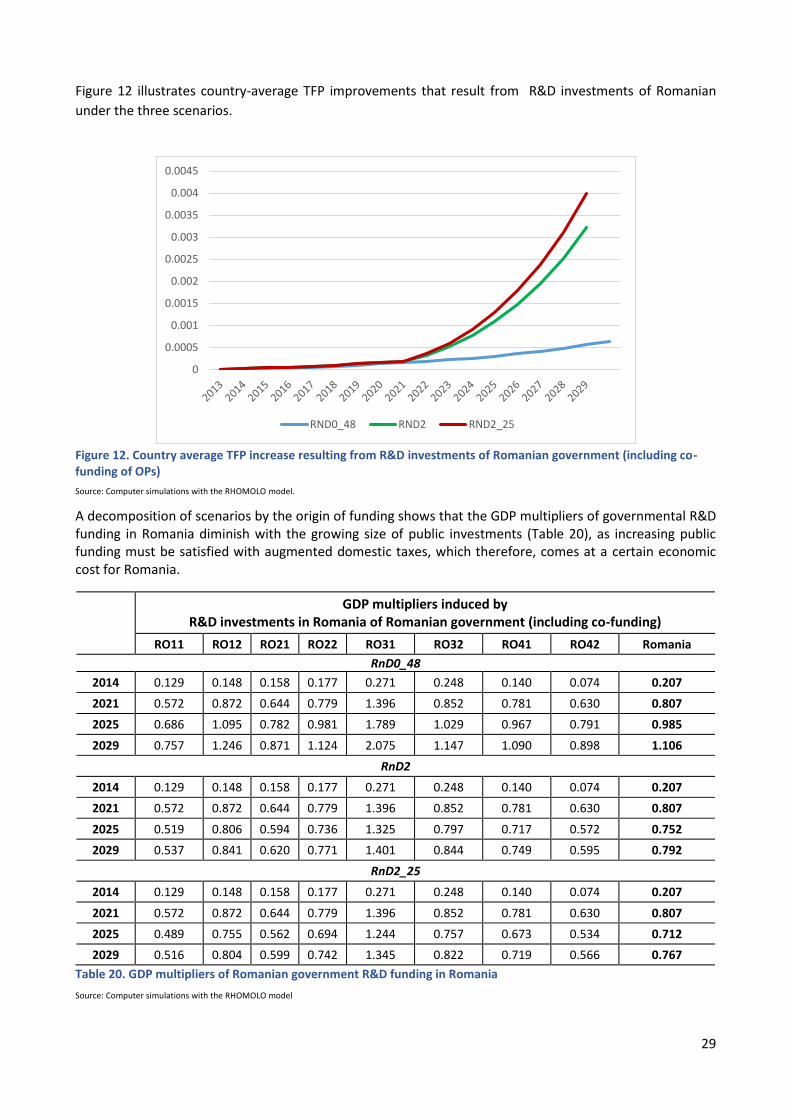
29
Figure 12 illustrates country-average TFP improvements that result from R&D investments of Romanian
under the three scenarios.
Figure 12. Country average TFP increase resulting from R&D investments of Romanian government (including co-funding of OPs)
Source: Computer simulations with the RHOMOLO model.
A decomposition of scenarios by the origin of funding shows that the GDP multipliers of governmental R&D funding in Romania diminish with the growing size of public investments (Table 20), as increasing public funding must be satisfied with augmented domestic taxes, which therefore, comes at a certain economic cost for Romania.
GDP multipliers induced by R&D investments in Romania of Romanian government (including co-funding)
RO11 RO12 RO21 RO22 RO31 RO32 RO41 RO42 Romania
RnD0_48
2014 0.129 0.148 0.158 0.177 0.271 0.248 0.140 0.074 0.207
2021 0.572 0.872 0.644 0.779 1.396 0.852 0.781 0.630 0.807
2025 0.686 1.095 0.782 0.981 1.789 1.029 0.967 0.791 0.985
2029 0.757 1.246 0.871 1.124 2.075 1.147 1.090 0.898 1.106
RnD2
2014 0.129 0.148 0.158 0.177 0.271 0.248 0.140 0.074 0.207
2021 0.572 0.872 0.644 0.779 1.396 0.852 0.781 0.630 0.807
2025 0.519 0.806 0.594 0.736 1.325 0.797 0.717 0.572 0.752
2029 0.537 0.841 0.620 0.771 1.401 0.844 0.749 0.595 0.792
RnD2_25
2014 0.129 0.148 0.158 0.177 0.271 0.248 0.140 0.074 0.207
2021 0.572 0.872 0.644 0.779 1.396 0.852 0.781 0.630 0.807
2025 0.489 0.755 0.562 0.694 1.244 0.757 0.673 0.534 0.712
2029 0.516 0.804 0.599 0.742 1.345 0.822 0.719 0.566 0.767
Table 20. GDP multipliers of Romanian government R&D funding in Romania
Source: Computer simulations with the RHOMOLO model
0
0.0005
0.001
0.0015
0.002
0.0025
0.003
0.0035
0.004
0.0045
RND0_48 RND2 RND2_25
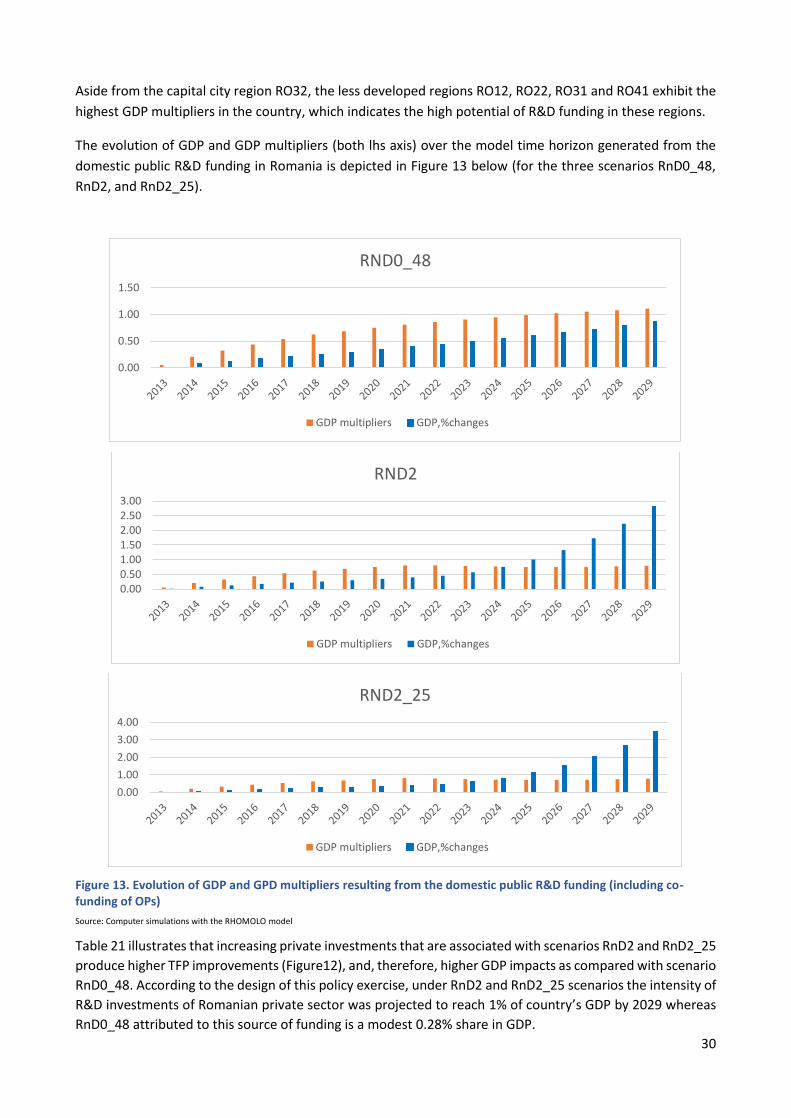
30
Aside from the capital city region RO32, the less developed regions RO12, RO22, RO31 and RO41 exhibit the
highest GDP multipliers in the country, which indicates the high potential of R&D funding in these regions.
The evolution of GDP and GDP multipliers (both lhs axis) over the model time horizon generated from the
domestic public R&D funding in Romania is depicted in Figure 13 below (for the three scenarios RnD0_48,
RnD2, and RnD2_25).
Figure 13. Evolution of GDP and GPD multipliers resulting from the domestic public R&D funding (including co-funding of OPs)
Source: Computer simulations with the RHOMOLO model
Table 21 illustrates that increasing private investments that are associated with scenarios RnD2 and RnD2_25
produce higher TFP improvements (Figure12), and, therefore, higher GDP impacts as compared with scenario
RnD0_48. According to the design of this policy exercise, under RnD2 and RnD2_25 scenarios the intensity of
R&D investments of Romanian private sector was projected to reach 1% of country’s GDP by 2029 whereas
RnD0_48 attributed to this source of funding is a modest 0.28% share in GDP.
0.00
0.50
1.00
1.50
RND0_48
GDP multipliers GDP,%changes
0.000.501.001.502.002.503.00
RND2
GDP multipliers GDP,%changes
0.00
1.00
2.00
3.00
4.00
RND2_25
GDP multipliers GDP,%changes
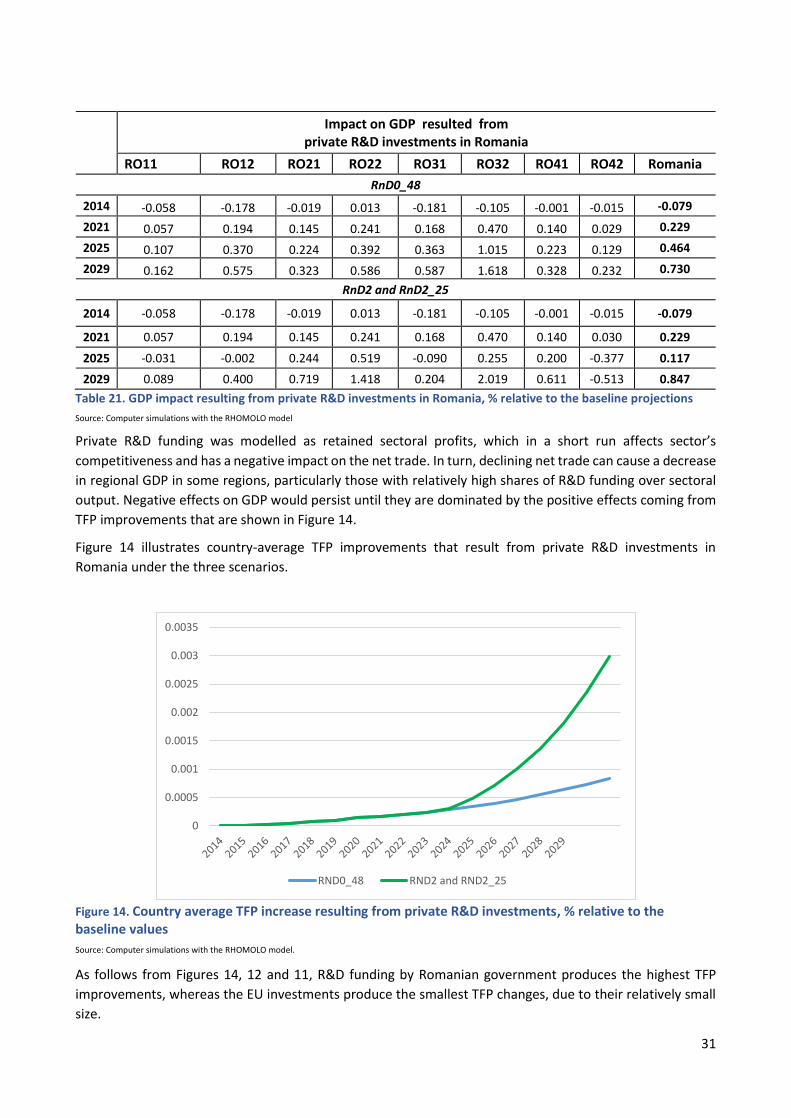
31
Impact on GDP resulted from private R&D investments in Romania
RO11 RO12 RO21 RO22 RO31 RO32 RO41 RO42 Romania
RnD0_48
2014 -0.058 -0.178 -0.019 0.013 -0.181 -0.105 -0.001 -0.015 -0.079
2021 0.057 0.194 0.145 0.241 0.168 0.470 0.140 0.029 0.229
2025 0.107 0.370 0.224 0.392 0.363 1.015 0.223 0.129 0.464
2029 0.162 0.575 0.323 0.586 0.587 1.618 0.328 0.232 0.730
RnD2 and RnD2_25
2014 -0.058 -0.178 -0.019 0.013 -0.181 -0.105 -0.001 -0.015 -0.079
2021 0.057 0.194 0.145 0.241 0.168 0.470 0.140 0.030 0.229
2025 -0.031 -0.002 0.244 0.519 -0.090 0.255 0.200 -0.377 0.117
2029 0.089 0.400 0.719 1.418 0.204 2.019 0.611 -0.513 0.847
Table 21. GDP impact resulting from private R&D investments in Romania, % relative to the baseline projections
Source: Computer simulations with the RHOMOLO model
Private R&D funding was modelled as retained sectoral profits, which in a short run affects sector’s
competitiveness and has a negative impact on the net trade. In turn, declining net trade can cause a decrease
in regional GDP in some regions, particularly those with relatively high shares of R&D funding over sectoral
output. Negative effects on GDP would persist until they are dominated by the positive effects coming from
TFP improvements that are shown in Figure 14.
Figure 14 illustrates country-average TFP improvements that result from private R&D investments in
Romania under the three scenarios.
Figure 14. Country average TFP increase resulting from private R&D investments, % relative to the baseline values
Source: Computer simulations with the RHOMOLO model.
As follows from Figures 14, 12 and 11, R&D funding by Romanian government produces the highest TFP
improvements, whereas the EU investments produce the smallest TFP changes, due to their relatively small
size.
0
0.0005
0.001
0.0015
0.002
0.0025
0.003
0.0035
RND0_48 RND2 and RND2_25
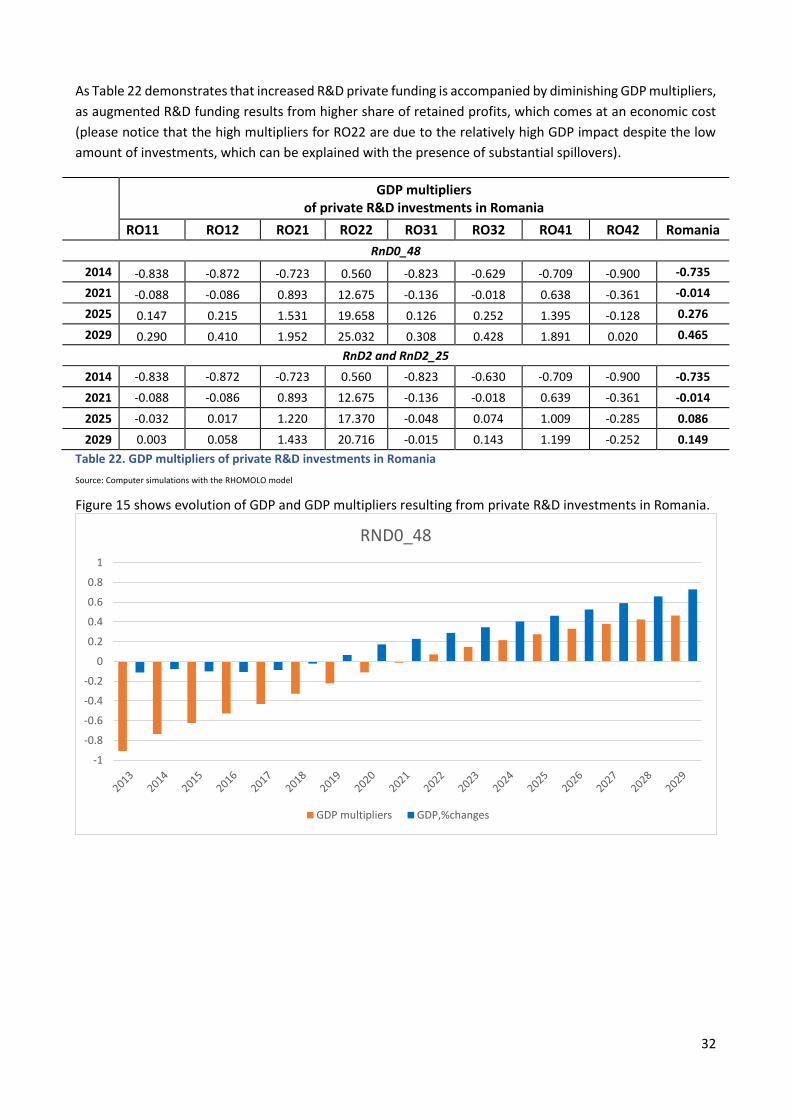
32
As Table 22 demonstrates that increased R&D private funding is accompanied by diminishing GDP multipliers,
as augmented R&D funding results from higher share of retained profits, which comes at an economic cost
(please notice that the high multipliers for RO22 are due to the relatively high GDP impact despite the low
amount of investments, which can be explained with the presence of substantial spillovers).
GDP multipliers of private R&D investments in Romania
RO11 RO12 RO21 RO22 RO31 RO32 RO41 RO42 Romania
RnD0_48
2014 -0.838 -0.872 -0.723 0.560 -0.823 -0.629 -0.709 -0.900 -0.735
2021 -0.088 -0.086 0.893 12.675 -0.136 -0.018 0.638 -0.361 -0.014
2025 0.147 0.215 1.531 19.658 0.126 0.252 1.395 -0.128 0.276
2029 0.290 0.410 1.952 25.032 0.308 0.428 1.891 0.020 0.465
RnD2 and RnD2_25
2014 -0.838 -0.872 -0.723 0.560 -0.823 -0.630 -0.709 -0.900 -0.735
2021 -0.088 -0.086 0.893 12.675 -0.136 -0.018 0.639 -0.361 -0.014
2025 -0.032 0.017 1.220 17.370 -0.048 0.074 1.009 -0.285 0.086
2029 0.003 0.058 1.433 20.716 -0.015 0.143 1.199 -0.252 0.149
Table 22. GDP multipliers of private R&D investments in Romania
Source: Computer simulations with the RHOMOLO model
Figure 15 shows evolution of GDP and GDP multipliers resulting from private R&D investments in Romania.
-1
-0.8
-0.6
-0.4
-0.2
0
0.2
0.4
0.6
0.8
1
RND0_48
GDP multipliers GDP,%changes
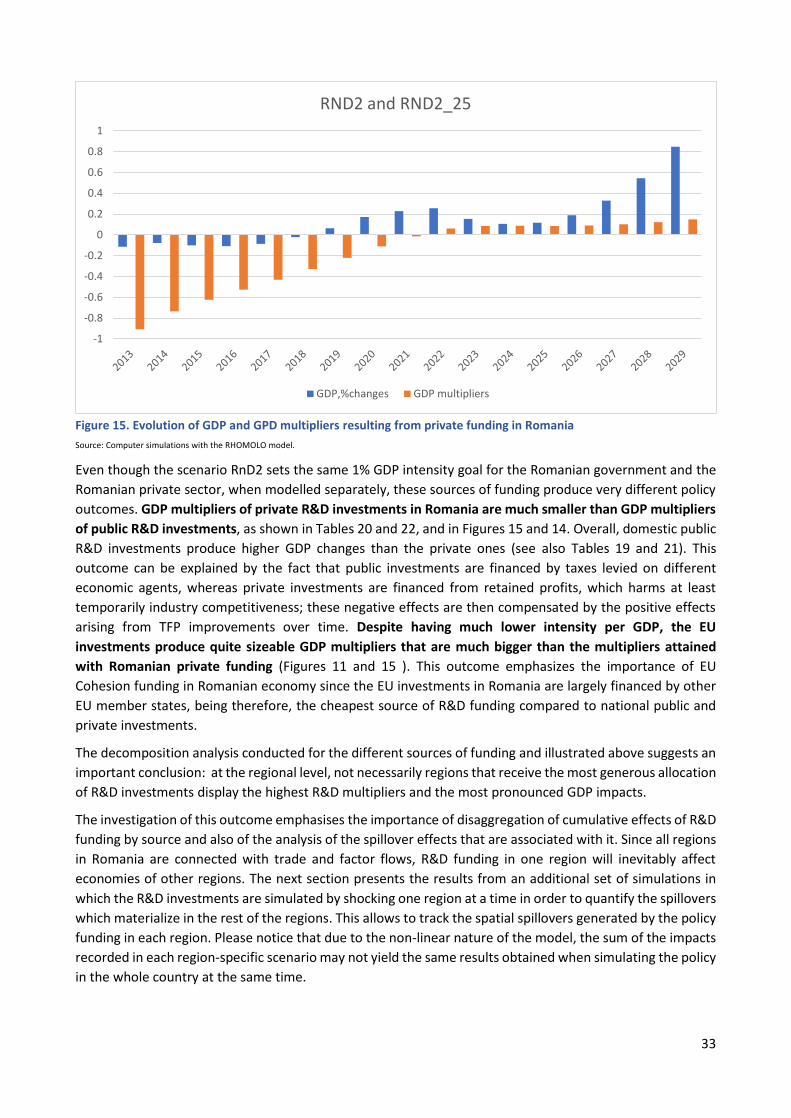
33
Figure 15. Evolution of GDP and GPD multipliers resulting from private funding in Romania
Source: Computer simulations with the RHOMOLO model.
Even though the scenario RnD2 sets the same 1% GDP intensity goal for the Romanian government and the
Romanian private sector, when modelled separately, these sources of funding produce very different policy
outcomes. GDP multipliers of private R&D investments in Romania are much smaller than GDP multipliers
of public R&D investments, as shown in Tables 20 and 22, and in Figures 15 and 14. Overall, domestic public
R&D investments produce higher GDP changes than the private ones (see also Tables 19 and 21). This
outcome can be explained by the fact that public investments are financed by taxes levied on different
economic agents, whereas private investments are financed from retained profits, which harms at least
temporarily industry competitiveness; these negative effects are then compensated by the positive effects
arising from TFP improvements over time. Despite having much lower intensity per GDP, the EU
investments produce quite sizeable GDP multipliers that are much bigger than the multipliers attained
with Romanian private funding (Figures 11 and 15 ). This outcome emphasizes the importance of EU
Cohesion funding in Romanian economy since the EU investments in Romania are largely financed by other
EU member states, being therefore, the cheapest source of R&D funding compared to national public and
private investments.
The decomposition analysis conducted for the different sources of funding and illustrated above suggests an
important conclusion: at the regional level, not necessarily regions that receive the most generous allocation
of R&D investments display the highest R&D multipliers and the most pronounced GDP impacts.
The investigation of this outcome emphasises the importance of disaggregation of cumulative effects of R&D
funding by source and also of the analysis of the spillover effects that are associated with it. Since all regions
in Romania are connected with trade and factor flows, R&D funding in one region will inevitably affect
economies of other regions. The next section presents the results from an additional set of simulations in
which the R&D investments are simulated by shocking one region at a time in order to quantify the spillovers
which materialize in the rest of the regions. This allows to track the spatial spillovers generated by the policy
funding in each region. Please notice that due to the non-linear nature of the model, the sum of the impacts
recorded in each region-specific scenario may not yield the same results obtained when simulating the policy
in the whole country at the same time.
-1
-0.8
-0.6
-0.4
-0.2
0
0.2
0.4
0.6
0.8
1
RND2 and RND2_25
GDP,%changes GDP multipliers
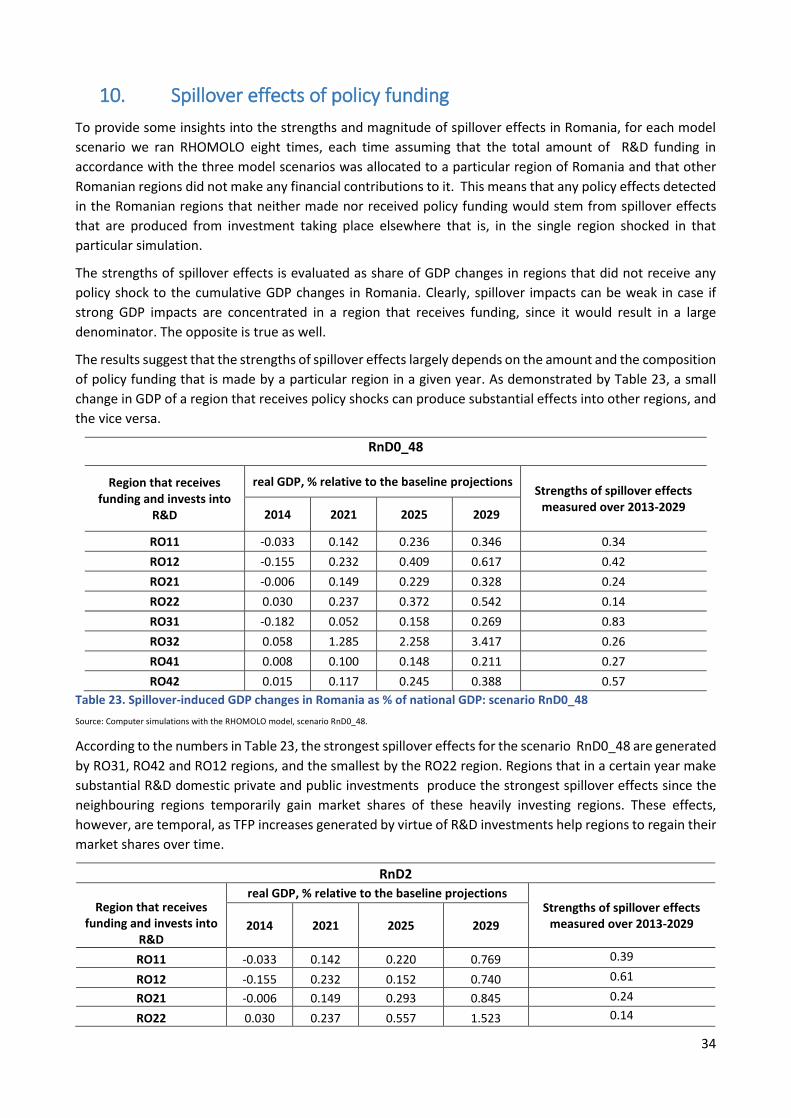
34
10. Spillover effects of policy funding
To provide some insights into the strengths and magnitude of spillover effects in Romania, for each model
scenario we ran RHOMOLO eight times, each time assuming that the total amount of R&D funding in
accordance with the three model scenarios was allocated to a particular region of Romania and that other
Romanian regions did not make any financial contributions to it. This means that any policy effects detected
in the Romanian regions that neither made nor received policy funding would stem from spillover effects
that are produced from investment taking place elsewhere that is, in the single region shocked in that
particular simulation.
The strengths of spillover effects is evaluated as share of GDP changes in regions that did not receive any
policy shock to the cumulative GDP changes in Romania. Clearly, spillover impacts can be weak in case if
strong GDP impacts are concentrated in a region that receives funding, since it would result in a large
denominator. The opposite is true as well.
The results suggest that the strengths of spillover effects largely depends on the amount and the composition
of policy funding that is made by a particular region in a given year. As demonstrated by Table 23, a small
change in GDP of a region that receives policy shocks can produce substantial effects into other regions, and
the vice versa.
RnD0_48
Region that receives funding and invests into
R&D
real GDP, % relative to the baseline projections Strengths of spillover effects
measured over 2013-2029 2014 2021 2025 2029
RO11 -0.033 0.142 0.236 0.346 0.34
RO12 -0.155 0.232 0.409 0.617 0.42
RO21 -0.006 0.149 0.229 0.328 0.24
RO22 0.030 0.237 0.372 0.542 0.14
RO31 -0.182 0.052 0.158 0.269 0.83
RO32 0.058 1.285 2.258 3.417 0.26
RO41 0.008 0.100 0.148 0.211 0.27
RO42 0.015 0.117 0.245 0.388 0.57
Table 23. Spillover-induced GDP changes in Romania as % of national GDP: scenario RnD0_48
Source: Computer simulations with the RHOMOLO model, scenario RnD0_48.
According to the numbers in Table 23, the strongest spillover effects for the scenario RnD0_48 are generated
by RO31, RO42 and RO12 regions, and the smallest by the RO22 region. Regions that in a certain year make
substantial R&D domestic private and public investments produce the strongest spillover effects since the
neighbouring regions temporarily gain market shares of these heavily investing regions. These effects,
however, are temporal, as TFP increases generated by virtue of R&D investments help regions to regain their
market shares over time.
RnD2
Region that receives funding and invests into
R&D
real GDP, % relative to the baseline projections Strengths of spillover effects
measured over 2013-2029 2014 2021 2025 2029
RO11 -0.033 0.142 0.220 0.769 0.39
RO12 -0.155 0.232 0.152 0.740 0.61
RO21 -0.006 0.149 0.293 0.845 0.24
RO22 0.030 0.237 0.557 1.523 0.14
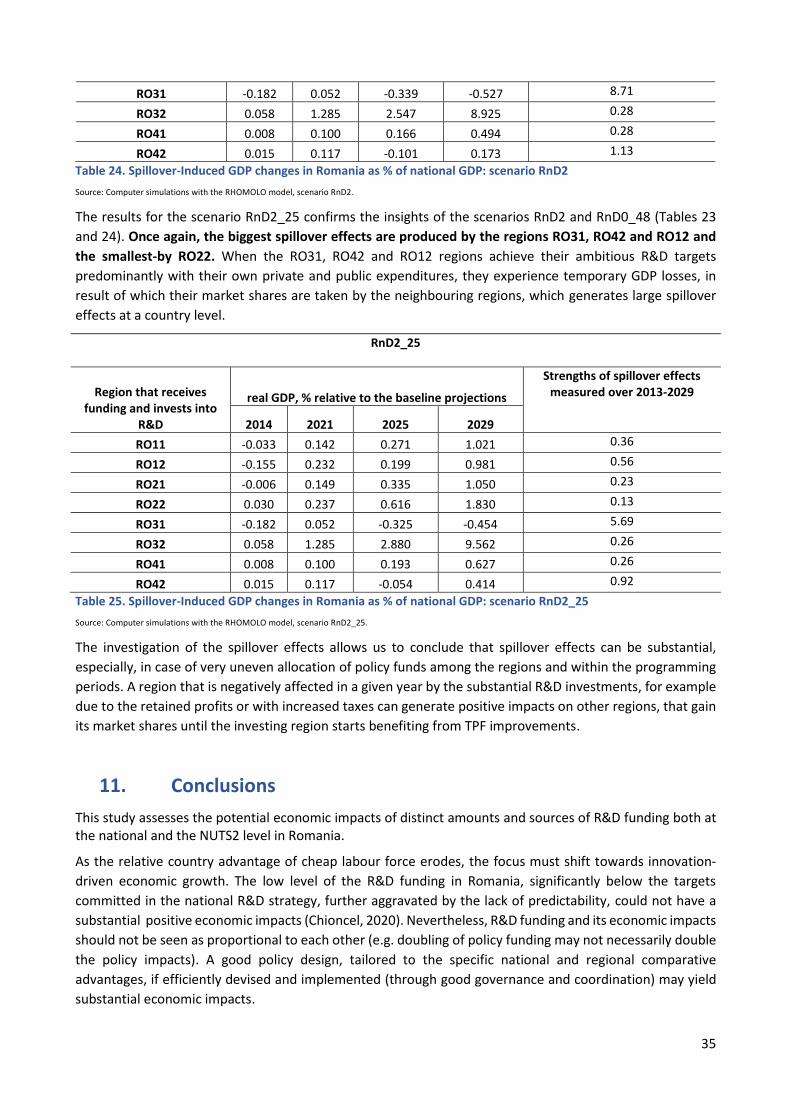
35
RO31 -0.182 0.052 -0.339 -0.527 8.71
RO32 0.058 1.285 2.547 8.925 0.28
RO41 0.008 0.100 0.166 0.494 0.28
RO42 0.015 0.117 -0.101 0.173 1.13
Table 24. Spillover-Induced GDP changes in Romania as % of national GDP: scenario RnD2
Source: Computer simulations with the RHOMOLO model, scenario RnD2.
The results for the scenario RnD2_25 confirms the insights of the scenarios RnD2 and RnD0_48 (Tables 23
and 24). Once again, the biggest spillover effects are produced by the regions RO31, RO42 and RO12 and
the smallest-by RO22. When the RO31, RO42 and RO12 regions achieve their ambitious R&D targets
predominantly with their own private and public expenditures, they experience temporary GDP losses, in
result of which their market shares are taken by the neighbouring regions, which generates large spillover
effects at a country level.
RnD2_25
Region that receives
funding and invests into R&D
real GDP, % relative to the baseline projections
Strengths of spillover effects measured over 2013-2029
2014 2021 2025 2029
RO11 -0.033 0.142 0.271 1.021 0.36
RO12 -0.155 0.232 0.199 0.981 0.56
RO21 -0.006 0.149 0.335 1.050 0.23
RO22 0.030 0.237 0.616 1.830 0.13
RO31 -0.182 0.052 -0.325 -0.454 5.69
RO32 0.058 1.285 2.880 9.562 0.26
RO41 0.008 0.100 0.193 0.627 0.26
RO42 0.015 0.117 -0.054 0.414 0.92
Table 25. Spillover-Induced GDP changes in Romania as % of national GDP: scenario RnD2_25
Source: Computer simulations with the RHOMOLO model, scenario RnD2_25.
The investigation of the spillover effects allows us to conclude that spillover effects can be substantial,
especially, in case of very uneven allocation of policy funds among the regions and within the programming
periods. A region that is negatively affected in a given year by the substantial R&D investments, for example
due to the retained profits or with increased taxes can generate positive impacts on other regions, that gain
its market shares until the investing region starts benefiting from TPF improvements.
11. Conclusions
This study assesses the potential economic impacts of distinct amounts and sources of R&D funding both at the national and the NUTS2 level in Romania.
As the relative country advantage of cheap labour force erodes, the focus must shift towards innovation-
driven economic growth. The low level of the R&D funding in Romania, significantly below the targets
committed in the national R&D strategy, further aggravated by the lack of predictability, could not have a
substantial positive economic impacts (Chioncel, 2020). Nevertheless, R&D funding and its economic impacts
should not be seen as proportional to each other (e.g. doubling of policy funding may not necessarily double
the policy impacts). A good policy design, tailored to the specific national and regional comparative
advantages, if efficiently devised and implemented (through good governance and coordination) may yield
substantial economic impacts.
36
The results of computer simulations with the RHOMOLO model show that the most pronounced GDP
impacts in Romania would be achieved with the highest intensity of R&D policy funding. A 0.48% R&D
spending over GDP would produce a GDP growth of 1.63% by 2029, which could become as high as 4.1%
should the intensity of R&D expenditures per GDP be 2.25%. For all policy scenarios, the most pronounced
GDP impact occurs in RO32 that receives the biggest share of R&D funding, and, therefore, benefits from the
most substantial TFP improvements.
Even in the absence of continuous R&D funding after 2029, all regions would continue to record positive GDP
impacts that gradually but not fully diminish by 2050. Positive impacts are long-lasting because of two
reasons. First, the capital stock built up during the policy support period increases the level of productive
inputs in the regions and it takes time for them to depreciate. Second, the long-run structural impacts
associated with R&D funding keep on providing a competitive edge to the regions even after 2029 because
of the gradual depreciation of factor productivity. Overall, the strength of the lagged effects of R&D funding
depends on the intensity of R&D investments, irrespective to the source of funding, as it increases the
productivity of labour and technological efficiency.
Model results show that GDP impacts at the country level are closely correlated with the intensity of R&D
policy funding, and the highest regional GDP multipliers, defined as the return on GDP per euro spent, are
associated with the most pronounced GDP impacts per minimum of R&D investments. Aside from the capital
city region RO32, the less developed regions RO12, RO22, RO31 and RO41 exhibit the highest GDP
multipliers across Romanian regions, which indicates the high potential of R&D funding in these regions.
R&D in Romania is funded by the Romanian government, Romanian private sector and EU Cohesion Policy
funds. These funding sources produce a complex cumulative effect. The modelling framework we use permits
to study each source of funding separately, in order to understand how the policy impacts depend not only
on the volume of the funding, but also on its origin and on the alternative economic cost associated with it.
Decomposition of the results by the source of R&D expenditures shows that when modelled separately R&D
expenditures financed by the EU Cohesion funds, private or public sector in Romania generate very different
policy outcomes. With the same intensity of R&D funding per GDP, R&D investments of Romanian
government incite higher GDP changes and higher GDP multipliers than the private ones. This outcome can
be explained by the fact that public investments are financed by taxes levied on different economic agents,
whereas private investments are financed from retained profits, which harms at least temporarily industry
competitiveness; these negative effects are then compensated by the positive effects arising from TFP
improvements over time. Despite their small size, the EU investments produce quite sizeable GDP multipliers
that are bigger than the multipliers of Romanian private funding. This outcome emphasises the importance
of EU Cohesion funding in Romanian economy since the EU investments in Romania are largely financed by
other EU member states being, therefore, the cheapest source of R&D funding compared to national public
and private investments. Nonetheless, in the long run the R&D intensity over GDP determines the strength
of the economic impacts rather than the source of funding.
The spillover analysis has uncovered the existence of substantial inter-regional spillover effects. The
strengths of spillover effects was evaluated as share of GDP changes in regions that did not receive any policy
shock to the cumulative GDP changes in Romania. For all model scenarios the strongest spillover effects are
incited by RO31, RO42 and RO12 regions. Regions that in a certain year make substantial R&D domestic
private and public investments relative to the size of their economy produce the strongest spillover effects
at the country level since the neighbouring regions temporarily gain market shares of these heavily investing
regions. These effects, however, are temporal, as TFP increases generated by virtue of R&D investments help
regions to regain their market shares over time. Overall, the strengths of spillover effects largely depends on
the amount and the composition of policy funding that is received by a particular region in a given year.

37
An important area of future research would be to investigate the potentially different effects on TFP of
private and public R&D expenditures. This may stem from public and private investors favouring different
R&D fields. For example, governments could prioritize funding of fundamental studies that may not yield
substantial revenues in the short term, whereas the private sector could favour the most profitable activities
with the shortest payback period. Therefore, the TFP coefficients of private and public R&D funding could
differ and materialize with a different time lag. In the absence of reliable econometric estimates for Romania,
the current version of the model does not take into account the differences in profitability and payback
period of private and public investments. Another important issue to be considered in future research could
be the impact of the quality of governance on the effectiveness of R&D funding.
References Armington, P.S. (1969). A theory of demand for products distinguished by place of production. Staff Papers - International Monetary Fund 16:1, 159-178. doi:10.2307/3866403.
Blanchflower, D.G., and Oswald, A.J. (1995). An introduction to the wage curve. Journal of Economic Perspectives 9(3), 153-167.
Chioncel, M., Zifciakova J. (2017). RIO Country Report 2016: Romania, available at: https://rio.jrc.ec.europa.eu/en/country-analysis/Romania/country-report
Chioncel, M. (2020). Analysis of the factors that obstruct the diffusion of innovation in Romania. Available at https://uefiscdi.gov.ro/resource-821136-analysis-of-the-factors-that-obstruct-the-diffusion-of-innovatio.pdf
Curaj, A (2015). Staiway to Excellence Country Report: ROMANIA; JRC Science and Policy Reports.
European Commission (2020), A new ERA for Research and Innovation, COM(2020) 628 final (30.09.2020), Available at https://eur-lex.europa.eu/legal-content/EN/TXT/?uri=COM%3A2020%3A628%3AFIN
European Commission (2021a). Regulation (EU) 2021/1059 of the European Parliament and of the Council of 24 June 2021 on specific provisions for the European territorial cooperation goal (Interreg) supported by the European Regional Development Fund and external financing instruments.
European Commission (2021b), Proposal for a Council Recommendation on a Pact for Research and Innovation in Europe COM (2021) 407 final, https://ec.europa.eu/info/sites/default/files/research_and_innovation/strategy_on_research_and_innovation/documents/ec_rtd_pact-for-research-and-innovation.pdf
Hamadeh, N., Van Rompaey, C., and Metreau, E. (2021). New World Bank country classifications by income level: 2021-2022. Available at https://blogs.worldbank.org/opendata/new-world-bank-country-classifications-income-level-2021-2022
Kancs, A., and Siliverstovs B., (2016). R&D and non-linear productivity growth. Research Policy 45(3), 634-646
Lecca P., Barbero, J., Christensen, M.A., Conte, A., Di Comite, F., Diaz-Lanchas, J., Diukanova, O., Mandras, G., Persyn, D., and Sakkas, S. (2018). RHOMOLO V3: A Spatial Modelling Framework, JRC Technical Reports JRC111861, EUR 29229 EN, Publications Office of the European Union, Luxembourg
OECD (2019). Talent Abroad: A Review of Romanian Emigrants. OECD Publishing, Paris, https://doi.org/10.1787/bac53150-en
Romanian Government (2003), Law nr 234/2003 on Scientific Research and Technological Development (approving OG 57, 08.2002). RO - LEGEA nr.324 din 8 iulie 2003 pentru aprobarea Ordonanţei Guvernului nr. 57/2002 privind cercetarea ştiinţifică şi dezvoltarea tehnologică), Available at http://www.cdep.ro/pls/legis/legis_pck.htp_act_text?idt=49343
38
Romanian Government (2014), National Strategy for Research, Development and Innovation, 2014-2020, Available at Strategia CDI 2014 - 2020 aproved by Government Decision HG 929/2014, https://uefiscdi.gov.ro/strategia-cdi-2014-2020
Romanian Government (2020a), Government Emergency Ordinance no. 1/2020, Available at https://mmuncii.ro/j33/images/Documente/Legislatie/OUG-1_2020.pdf
Romanian Government (2020b), PROGRAM DE GUVERNARE 2020 – 2024, Partidul Național Liberal, Alianța USR-PLUS, Uniunea Democrată Maghiară din Romania, Available at https://gov.ro/ro/obiective/programul-de-guvernare-2020-2024
Romanian Government (2021), Romania's National Recovery and Resilience Plan, Available at https://mfe.gov.ro/pnrr/
World Bank (2020). Fighting COVID-19. Europe and Central Asia Economic Update. Office of the Chief Economist, Spring. Washington DC.
39
Glossary Business enterprise expenditure on R&D (BERD) represents the component of GERD incurred by units
belonging to the Business enterprise sector. It is the measure of intramural R&D expenditures within the
Business enterprise sector during a specific reference period. (OECD, Frascatti Manual 2015)
Cohesion Fund (CF): An EU fund for reducing economic and social disparities in the EU by funding investments
in Member States where the gross national income per inhabitant is less than 90 % of the EU average.
Cohesion policy: The EU’s main investment policy, which aims to reduce economic and social disparities
between regions and Member States through promoting job creation, business competitiveness, economic
growth, sustainable development, and cross-border and interregional cooperation. It is financed through the
European Regional Development Fund (ERDF), the European Social Fund Plus (ESF+) and the Cohesion Fund
(CF).
Common provisions regulation (CPR): EU regulation governing a number of shared management funds. For
2021-2027 there is a Commission proposal, published in May 2018, for rules that will govern seven funds:
the European Regional Development Fund, the Cohesion Fund, the European Social Fund Plus, the European
Maritime and Fisheries Fund, the Asylum and Migration Fund, the Internal Security Fund, and the Border
Management and Visa Instrument. In June 2021 the regulations were approved. The new Cohesion Policy
regulation 2021-2027 was adopted on 1 July 2021.12
ESIF decided: budgets from selected projects (project pipeline)
ESIF Implemented: values from fully implemented projects
European Regional Development Fund (ERDF): A fund aiming to strengthen economic and social cohesion
throughout the European Union by correcting regional imbalances through financial support for priority
areas: innovation and research; the digital agenda; small and medium-sized enterprises and the low carbon
economy.
European Social Fund Plus (ESF+): An EU fund under the 2021-2027 budgetary period for creating
educational and employment opportunities and improving the situation of people at risk of poverty. Unlike
its predecessor the European Social Fund, ESF+ encompasses the Youth Employment Initiative and the Fund
for European Aid to the Most Deprived
Full time equivalent (FTE) of R&D personnel is defined as the ratio of working hours actually spent on R&D during a specific reference period (usually a calendar year) divided by the total number of hours conventionally worked in the same period by an individual or by a group.
Gross domestic expenditure on R&D (GERD) is total intramural expenditure on R&D performed in the national territory during a specific reference period.
Gross domestic product (GDP): A standard measure of a country's wealth: the monetary value of all the
goods and services produced in a specific period within the economy. Gross domestic product (GDP) is a
measure for the economic activity. It is defined as the value of all goods and services produced less the value
of any goods or services used in their creation. The volume index of GDP per capita in Purchasing Power
Standards (PPS) is expressed in relation to the European Union (EU28) average set to equal 100
Gross national income (GNI): A standard measure of a country's wealth, based on income from domestic
sources and abroad.
12 https://danube-region.eu/common-provisions-regulation-published/

40
Less developed region (LDR): A region where the GDP per capita is below 75 % of the EU average.
More developed region (MDR): A region where the GDP per capita exceeds 90 % (2014-2020) or 100 % (2021-
2027) of the EU average.
Multiannual Financial Framework (MFF): The EU's spending plan setting priorities (based on policy
objectives) and ceilings, generally for seven years. It provides the structure within which annual EU budgets
are set, limiting spending for each category of expenditure. The current MFF covers 2014-2020.
Nomenclature of territorial units for statistics (NUTS): Classification used in regional statistics and funding
allocation which subdivides Member States into regions of three categories according to existing national
administrative subdivisions and specific population thresholds. From larger to smaller areas, they are: NUTS
1 (3 to 7 million inhabitants), NUTS 2 (800 000 to 3 million) and NUTS 3 (150 000 to 800 000).
Purchasing power standard (PPS): An artificial currency unit used to express national account aggregates
adjusted for price level differences among Member States.
Real GDP per capita: The indicator is calculated as the ratio of real GDP to the average population of a specific
year. GDP measures the value of total final output of goods and services produced by an economy within a
certain period of time. It includes goods and services that have markets (or which could have markets) and
products which are produced by general government and non-profit institutions. It is a measure of economic
activity and is also used as a proxy for the development in a country’s material living standards. However, it
is a limited measure of economic welfare. For example, neither does GDP include most unpaid household
work nor does GDP take account of negative effects of economic activity, like environmental
degradation.(EUROSTAT)13
Total Productivity Factor (TFP): compares total outputs relative to the total inputs used in production of the
output; is usually measured as the ratio of aggregate output (e.g., GDP) to aggregate inputs. Under some
simplifying assumptions about the production technology, growth in TFP becomes the portion of growth in
output not explained by growth in traditionally measured inputs of labour and capital used in production.
Transition region (TR): A region where the GDP per capita is between 75 % and 90 % (2014-2020) or 75 %
and 100 % (2021-2027) of the EU average.
13 https://ec.europa.eu/eurostat/databrowser/view/sdg_08_10/default/table?lang=en
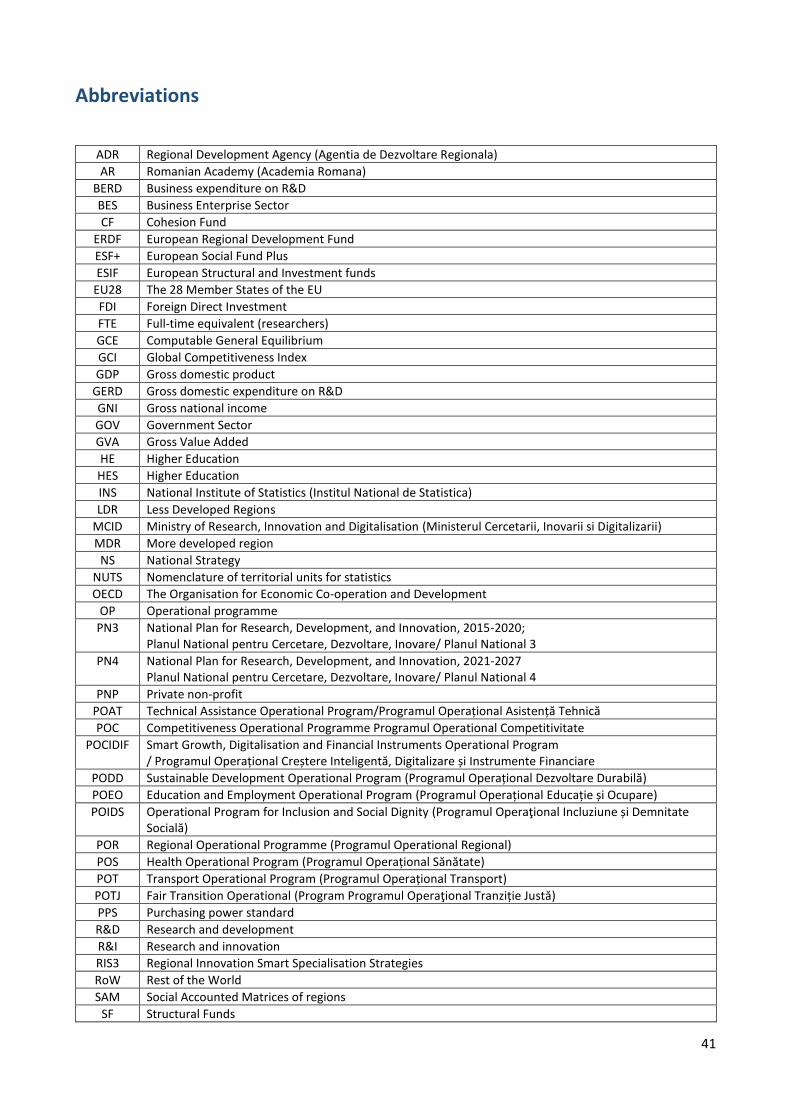
41
Abbreviations
ADR Regional Development Agency (Agentia de Dezvoltare Regionala)
AR Romanian Academy (Academia Romana)
BERD Business expenditure on R&D
BES Business Enterprise Sector
CF Cohesion Fund
ERDF European Regional Development Fund
ESF+ European Social Fund Plus
ESIF European Structural and Investment funds
EU28 The 28 Member States of the EU
FDI Foreign Direct Investment
FTE Full-time equivalent (researchers)
GCE Computable General Equilibrium
GCI Global Competitiveness Index
GDP Gross domestic product
GERD Gross domestic expenditure on R&D
GNI Gross national income
GOV Government Sector
GVA Gross Value Added
HE Higher Education
HES Higher Education
INS National Institute of Statistics (Institul National de Statistica)
LDR Less Developed Regions
MCID Ministry of Research, Innovation and Digitalisation (Ministerul Cercetarii, Inovarii si Digitalizarii)
MDR More developed region
NS National Strategy
NUTS Nomenclature of territorial units for statistics
OECD The Organisation for Economic Co-operation and Development
OP Operational programme
PN3 National Plan for Research, Development, and Innovation, 2015-2020; Planul National pentru Cercetare, Dezvoltare, Inovare/ Planul National 3
PN4 National Plan for Research, Development, and Innovation, 2021-2027 Planul National pentru Cercetare, Dezvoltare, Inovare/ Planul National 4
PNP Private non-profit
POAT Technical Assistance Operational Program/Programul Operațional Asistență Tehnică
POC Competitiveness Operational Programme Programul Operational Competitivitate
POCIDIF Smart Growth, Digitalisation and Financial Instruments Operational Program / Programul Operațional Creștere Inteligentă, Digitalizare și Instrumente Financiare
PODD Sustainable Development Operational Program (Programul Operațional Dezvoltare Durabilă)
POEO Education and Employment Operational Program (Programul Operațional Educație și Ocupare)
POIDS Operational Program for Inclusion and Social Dignity (Programul Operaţional Incluziune și Demnitate Socială)
POR Regional Operational Programme (Programul Operational Regional)
POS Health Operational Program (Programul Operațional Sănătate)
POT Transport Operational Program (Programul Operațional Transport)
POTJ Fair Transition Operational (Program Programul Operaţional Tranziție Justă)
PPS Purchasing power standard
R&D Research and development
R&I Research and innovation
RIS3 Regional Innovation Smart Specialisation Strategies
RoW Rest of the World
SAM Social Accounted Matrices of regions
SF Structural Funds
42
SNCDI National Strategy for Research, Development, and Innovation, 2014-2020 (RO: Strategia Nationala pentru CDI
SNCISI National Strategy for Research, Innovation and Smart Specialisation (Strategia Nationala de Cercetare, Inovare si Specializare Inteligenta 2021-2027)
TPF Total Productivity Factor
UEFISCDI Executive Agency for Higher Education, Research, Development and Innovation Funding (Unitatea Executiva pentru Finantarea Invatamantului Superior, a Cercetarii, Dezvoltarii si Inovarii)
VAT Value Added Tax
43
List of tables
Table 1. NUTS 2 regions of Romania ................................................................................................................................... 6
Table 2: Main Regional Economic and Demographic Indicators ........................................................................................ 7
Table 3. R&D personnel and researchers ........................................................................................................................... 9
Table 4. Share of imports in output .................................................................................................................................. 15
Table 5. Regional share of total imports from the rest of the Romania regions .............................................................. 15
Table 6. Labour share of value-added .............................................................................................................................. 15
Table 7. Description of model scenarios ........................................................................................................................... 16
Table 8. Allocation of R&D funding during the 2014-2020 and 2021-2029 policy implementation periods: scenario
RnD0_48 ........................................................................................................................................................................... 18
Table 9. Impact on GDP of R&D investments in selected years, % relative to the baseline projections: scenario
RnD0_48 ........................................................................................................................................................................... 19
Table 10. GDP multipliers of cumulative R&D investments in Romania: scenario RnD0_48 ........................................... 20
Table 11. Allocation of R&D funding during the 2014-2020 and 2021-2029 policy implementation periods: scenario
RnD2 ................................................................................................................................................................................. 21
Table 12. Impact on GDP of R&D funding in selected years, % relative to the baseline projections: scenario RnD2 ...... 22
Table 13. GDP multipliers of cumulative R&D investments in Romania: scenario RnD2 ................................................. 23
Table 14. Allocation of R&D funding during the 2014-2020 and 2021-2029 policy implementation periods: scenario
RnD2_25 ........................................................................................................................................................................... 24
Table 15. Impact on GDP of R&D investments in selected years, % relative to the baseline projections: scenario
RnD2_25 ........................................................................................................................................................................... 25
Table 16. GDP multipliers of cumulative R&D investments in Romania: scenario RnD2_25 ........................................... 26
Table 17. GDP impacts resulting from the ESIF R&D investments in Romania, % relative to the baseline projections ... 27
Table 18. GDP multipliers of ESIF R&D investments in Romania ...................................................................................... 27
Table 19. GDP impact resulted from Romanian Government R&D funding, % relative to the baseline projections ....... 28
Table 20. GDP multipliers of Romanian government R&D funding in Romania ............................................................... 29
Table 21. GDP impact resulting from private R&D investments in Romania, % relative to the baseline projections ...... 31
Table 22. GDP multipliers of private R&D investments in Romania ................................................................................. 32
Table 23. Spillover-induced GDP changes in Romania as % of national GDP: scenario RnD0_48 .................................... 34
Table 24. Spillover-Induced GDP changes in Romania as % of national GDP: scenario RnD2 .......................................... 35
Table 25. Spillover-Induced GDP changes in Romania as % of national GDP: scenario RnD2_25 .................................... 35
44
List of Figures
Figure 1. Turnover by NACE rev.2 in 2018, latest available data ........................................................................................ 4
Figure 2. Time evolution of total GERD (% of GDP) and by source of funding ................................................................... 5
Figure 3. Time evolution of nominal GERD in Romania (million EURO) by funders ........................................................... 5
Figure 4. Evolution of nominal GERD (million EUR) by NUTS 2 regions .............................................................................. 8
Figure 5. Estimation of TFP increase achieved due to R&D funding in Romania, scenario RnD0_48 ............................... 19
Figure 6. The Impact on GDP in 2035, 2040 and 2050, scenario RnD0_48 ...................................................................... 20
Figure 7. TFP increase achieved due to R&D funding in Romania: scenario RnD2 ........................................................... 22
Figure 8. The Impact on GDP in 2035, 2040 and 2050, scenario RnD2............................................................................ 23
Figure 9. TFP increase achieved due to R&D funding in Romania: scenario RnD2_25 ..................................................... 25
Figure 10. The Impact on GDP in 2035, 2040 and 2050: scenario RnD2_25 .................................................................... 26
Figure 11. Evolution of GDP, GPD multipliers and TFP improvements resulting from the EU R&D funding in Romania . 28
Figure 12. Country average TFP increase resulting from R&D investments of Romanian government (including co-
funding of OPs) ................................................................................................................................................................. 29
Figure 13. Evolution of GDP and GPD multipliers resulting from the domestic public R&D funding (including co-funding
of OPs) .............................................................................................................................................................................. 30
Figure 14. Country average TFP increase resulting from private R&D investments, % relative to the baseline values ... 31
Figure 15. Evolution of GDP and GPD multipliers resulting from private funding in Romania ......................................... 33