Beyond-GDP indicators: to what end? - | IDDRI
30
Institut du développement durable et des relations internationales 27, rue Saint-Guillaume 75337 Paris cedex 07 France Beyond-GDP indicators: to what end? Lessons learnt from six national experiences Lucas Chancel (Iddri), Géraldine Thiry (FMSH-CEM), Damien Demailly (Iddri) STUDY N°04/14 SEPTEMBER 2014 | NEW PROSPERITY www.iddri.org BEYOND-GDP INDICATORS, AN OPPORTUNITY FOR POLICY MAKERS Beyond-GDP indicators, which are intended to complement or replace GDP, are attracting growing interest at local, national and international levels. Given the many limitations of GDP as well as the environmental and social crises, the uptake of Beyond-GDP indicators opens the way for constructing an innovative narrative and giving fresh impetus to the democratic debate. Beyond-GDP indicators thus constitute a window of opportunity for policy makers able to seize it. ALTHOUGH RECENTLY PROACTIVE ON THE NEW INDICATORS FRONT, FRANCE IS NOW LAGGING BEHIND Official authorities in several countries and regions have adopted Beyond-GDP indicators: in Australia, the United-Kingdom, Wales, Bel- gium, Wallonia and Germany, initiatives for Beyond-GDP indicators have sprung up with top-level support from executive or legislative bodies or administrations. France, a pioneer in thinking on new indicators (Méda, 1999; Gadrey & Jany-Catrice, 2004), proactive at regional level and more recently internationally known for the work of the Stiglitz Commission (2008), is today struggling to have these new indicators officially recog- nised and effectively used. BEYOND-GDP INDICATORS ARE INCREASINGLY EMBEDDED IN POLICYMAKING It is useful to consider how the Beyond-GDP indicators are put to practical use in countries other than France. Giving Beyond-GDP indicators official status makes no sense if they are not actually used. Today, these indicators have been mobilised to represent new forms of prosperity (symbolic role) and they are beginning to be used in the political arena (political role). In some countries, they appear in a growing number of reports that are amply discussed in the media and regularly commented on in parliament to evaluate governmental actions. DOES THE INSTRUMENTAL USE OF BEYOND-GDP INDICATORS NEED DEVELOPPING? Unlike GDP, Beyond-GDP indicators are not yet used instrumentally (to evaluate specific public policies). Today, there are ongoing debates between those who advocate the symbolic role of Beyond-GDP indicators and those who would like to use them to implement public policy. The role now played by Beyond-GDP indicators should be seen through the historical perspective of GDP, which did not impose itself as a yardstick overnight.
-
Upload
khangminh22 -
Category
Documents
-
view
4 -
download
0
Transcript of Beyond-GDP indicators: to what end? - | IDDRI

Institut du développement durable et des relations internationales 27, rue Saint-Guillaume 75337 Paris cedex 07 France
Beyond-GDP indicators: to what end?Lessons learnt from six national experiences
Lucas Chancel (Iddri), Géraldine Thiry (FMSH-CEM), Damien Demailly (Iddri)
StuDyN°04/14 SEPTEMBEr 2014 | NEw ProSPEriTy
www.
iddr
i.org
BEyOND-GDP INDICAtORS, AN OPPORtuNIty FOR POLICy MAKERS Beyond-GDP indicators, which are intended to complement or replace GDP, are attracting growing interest at local, national and international levels. Given the many limitations of GDP as well as the environmental and social crises, the uptake of Beyond-GDP indicators opens the way for constructing an innovative narrative and giving fresh impetus to the democratic debate. Beyond-GDP indicators thus constitute a window of opportunity for policy makers able to seize it.
ALtHOuGH RECENtLy PROACtIVE ON tHE NEW INDICAtORS FRONt, FRANCE IS NOW LAGGING BEHIND Official authorities in several countries and regions have adopted Beyond-GDP indicators: in Australia, the United-Kingdom, Wales, Bel-gium, Wallonia and Germany, initiatives for Beyond-GDP indicators have sprung up with top-level support from executive or legislative bodies or administrations. France, a pioneer in thinking on new indicators (Méda, 1999; Gadrey & Jany-Catrice, 2004), proactive at regional level and more recently internationally known for the work of the Stiglitz Commission (2008), is today struggling to have these new indicators officially recog-nised and effectively used.
BEyOND-GDP INDICAtORS ARE INCREASINGLy EMBEDDED IN POLICyMAKINGIt is useful to consider how the Beyond-GDP indicators are put to practical use in countries other than France. Giving Beyond-GDP indicators official status makes no sense if they are not actually used. Today, these indicators have been mobilised to represent new forms of prosperity (symbolic role) and they are beginning to be used in the political arena (political role). In some countries, they appear in a growing number of reports that are amply discussed in the media and regularly commented on in parliament to evaluate governmental actions.
DOES tHE INStRuMENtAL uSE OF BEyOND-GDP INDICAtORS NEED DEVELOPPING?Unlike GDP, Beyond-GDP indicators are not yet used instrumentally (to evaluate specific public policies). Today, there are ongoing debates between those who advocate the symbolic role of Beyond-GDP indicators and those who would like to use them to implement public policy. The role now played by Beyond-GDP indicators should be seen through the historical perspective of GDP, which did not impose itself as a yardstick overnight.

Copyright © 2014 IDDRI
As a foundation of public utility, IDDRI encour-ages reproduction and communication of its copy-righted materials to the public, with proper credit (bibliographical reference and/or corresponding URL), for personal, corporate or public policy research, or educational purposes. However, IDDRI’s copyrighted materials are not for commer-cial use or dissemination (print or electronic).Unless expressly stated otherwise, the findings, interpretations, and conclusions expressed in the materials are those of the various authors and are not necessarily those of IDDRI’s Board.
Citation: Chancel L., Thiry G., Demailly D. (2014), Beyond-GDP indicators: to what end?, Study N°04/14, IDDRI, Paris, France, 30 p.
◖◖◖
This research was funded by the French Govern-ment as part of the “Investissements d’avenir” programme under the reference ANR-10-LABX-01.
Géraldine Thiry received a Fernand Braudel-IFER post-doctoral grant supported by the European Commission (COFUND programme).
◖◖◖
We give special thanks to Pierre Barthélemy, Romina Boarini, Aurélien Boutaud, Michel Colom-bier, Lucien Chabason, Delphine Donger, Fabrice Flipo, Jean Gadrey, Florian Guyot, Claude Henry, Florence Jany-Catrice, Dominique Méda, Marco Mira d’Ercole. The usual disclaimer applies: the views expressed in this study reflect solely those of their authors.
◖◖◖
For more information about this document, please contact the authors:Lucas Chancel - [email protected] Géraldine Thiry - [email protected] Demailly - [email protected]
ISSN 2258-7071

3
EXECUTVE SUMMAry 5
1. iNTroDUCTioN 9
2. BEyoND-GDP iNDiCATorS: STUDy oF SiX NATioNAL iNiTiATiVES 102.1. Australia: Measuring Australia’s Progress 112.2. United Kingdom: the Measuring National Well-being Programme 122.3. Wales: One Wales, One Planet 142.4. Wallonia: Five composite indicators for Wallonia 162.5. Federal Belgium: the “complementary indicators” Act 172.6. Germany—W3-Indikatoren (W3 Indicators) 182.7 Beyond-GDP indicators in France 18
3. TEN LESSoNS LEArNT FroM NATioNAL EXPEriENCES 203.1 Beyond-GDP indicators complement rather than replace GDP 203.2. Beyond-GDP indicators are no longer the preserve of any particular political party… 213.3. … but this does not mean that Beyond-GDP indicators are disconnected from political strategy 213.4. Parliaments and governments have triggered the formalisation of Beyond-GDP indicators in many countries 223.5. Statistics institutes have a strategic role 223.6. A dashboard with a limited number of indicators combines communicability and statistical robustness 233.7. A drive to embed Beyond-GDP indicators more firmly in political life 243.8. A consultation process with civil society heightens the symbolic and political power of Beyond-GDP indicators 253.9. A more deeply rooted “instrumental” role to be invented? 253.10. Beyond-GDP indicators’ slow advance in political spheres needs to be viewed in the light of GDP history 26
4. CoNCLUSioN 27
rEFErENCES 28
APPENDiX 29
Beyond-GDP indicators: to what end?Lessons learnt from six national experiences
Lucas Chancel (Iddri), Géraldine Thiry (FMSH-CEM), Damien Demailly (Iddri)


Beyond-GDP indicators: to what end? Lessons learnt from six national experiences
stuDy 04/2014 5IddrI
EXECUTVE SUMMAry
Six initiatives from abroad to inform the national debates on Beyond-GDP indicatorsThe development of Beyond-GDP indicators is attracting growing interest. In this study, we selected six initiatives by applying two filters. First, we limited our scope to Beyond-GDP indi-cators with a societal dimension, i.e. indicators or dashboards with multiple dimensions—economic, environmental and social mainly—and not simply sector-based. Second, we studied the initia-tives supported by national and regional public authorities (administrations, executive or legisla-tive branches of government). We do not address therefore initiatives supported by local authorities, non-governmental organisations and territories.
The four countries selected are Australia, the United Kingdom, Belgium and Germany. Two initi-atives are supported by large regional authorities: Wallonia and Wales. m Australia set up Beyond-GDP indicators as early
as 2002, developed and supported by the Aus-tralian Bureau of Statistics. The dashboard com-prises 26 dimensions grouped around four head-line themes: society, economy, environment and governance. The dashboard has been published frequently and holds particular interest for the media and the general public. Although not ini-tially designed to evaluate government actions, its indicators are regularly used by political staff.m The United Kingdom has produced a compre-
hensive dashboard of Beyond-GDP indicators since 2011 under a national programme for measuring wellbeing. The Prime Minister Da-vid Cameron is behind this initiative. Monthly reports are published to comment on how the country is performing on different dimensions of wellbeing. Some indicators have been used to inform decision-making.
m Wales has had Beyond-GDP indicators since 2000. Today, they form a 29-indicator dash-board grouped around five headline indicators that inform on the evolution of resources, the environment, the economy, society and wellbe-ing. The setting up of these indicators is written into the 2006 Government of Wales Act (akin to a written constitution). The indicators are pub-lished in an annual report. Yet, they are hardly taken up in the media and political spheres. m Wallonia adopted five headline indicators in
2013, addressing the social dimension (the so-cial situation index and wellbeing index), envi-ronmental dimension (ecological footprint and environmental situation index) and economic capital. The initiative was supported at ministe-rial level. In May 2014, the Walloon Institute for Evaluation, Prospective and Statistics (IWEPS) published a report on these headline indicators, but so far this has not roused much interest from the media.m Belgium ratified a law, early 2014, aimed at de-
veloping indicators to complement GDP. These indicators are being developed by the Belgian Federal Planning Agency. It is planned to in-clude the results of these indicators in the an-nual report of the Banque nationale de Belgique and to submit them to parliamentary debate each year.m In Germany, the “W3 Indicators” have been
defined by a parliamentary Study Commission, along with proposals for their use. The set of ten indicators (GDP and nine complementary indicators) covers three dimensions: economy, ecology and quality of life. For each of these in-dicators, “warning lights” have been defined to show if critical thresholds have been exceeded. The Study Commission proposed that the Fed-eral Government publish an annual report on wellbeing, with governmental expert groups

study 04/20146 IddrI
Beyond-GdP indicators: to what end? Lessons learnt from six national experiences
being mandated to officially comment on the indicators.
Ten lessons learnt from these experiences in other countriesThe study of national and regional experiences led us to formulate ten lessons learnt that could help to inform and enrich the debates on the formali-sation of Beyond-GDP indicators, particularly in France:
1. The Beyond-GDP indicators adopted by the frontrunner countries are complementary to GDP and not a substitute for it. The choice not to “re-place” GDP should not however overshadow the fact that GDP is by no means an ideal economic indicator given that it disregards economic issues such as the question of inequality or changes in national assets.
2. Promoting indicators to complement GDP is no longer the preserve of any specific political par-ty. Yet, parties do not all advocate the same types of indicators.
3. Associating Beyond-GDP indicators with a political agenda increases the likelihood that they will be effectively used in policy making, by the media and by the public at large, but the longevity of Beyond-GDP indicators that have “political lea-nings” remains in question.
4. Beyond-GDP indicators have been supported at the highest levels of state (executive and legis-lative) in several countries. Support from the exe-cutive branch makes it much easier to launch the initiative and ensures backing from statistics insti-tutes, at least in the short run.
5. Support from statistical bodies and their in-volvement in the initial phase of formalising the indicators, as well as in monitoring and calculating the Beyond-GDP indicators is important and ne-cessary. Setting up exchange platforms that bring together both experts and laypeople can help to increase the legitimacy of the indicators.
6. A dashboard with a limited number of indi-cators is perceived as a compromise between the media impact that Beyond-GDP indicators can have (the need to have a reduced number of in-dicators) and their statistical robustness (the dif-ficulty of aggregating several dimensions into a single indicator).
7. Three types of use can be distinguished for Beyond-GDP indicators: symbolic, when the indi-cator is used to represent the progress of a society; political, when it is used in the political arena to evaluate governmental action; and finally, instru-mental, when Beyond-GDP indicators play a role in implementing or monitoring specific public po-licies. Today, Beyond-GDP indicators are above all used symbolically and—increasingly—politically.
8. A consultation process with civil society in-creases the symbolic power of Beyond-GDP indi-cators, establishes their legitimacy and visibility, while also acting as a catalyst for democratic de-bate and their political use.
9. Whereas GDP is used instrumentally (mainly to assess the impact of public policies upstream and downstream), Beyond-GDP indicators have not yet been mobilised in this way. One difficulty stems from the absence of a theoretical basis un-derpinning the links between these indicators and policy measures.
10. The progress made by Beyond-GDP indi-cators in political life should be seen in the light off GDP history. The symbolic, political and ins-trumental grounding of GDP did not come about in a day. To embed Beyond-GDP indicators more swiftly into policy making, their advocates need mainly to think about what use they wish to make of Beyond-GDP indicators so as to propose practi-cal avenues to guide public policy.
ConclusionThe Stiglitz-Sen-Fitoussi Commission, by the synthesis it made of the numerous dispersed pre-existing works in the field, helped to estab-lish France as an international reference in the area of Beyond-GDP indicators thanks to its synthesis report on the numerous studies already undertaken but which had until then remained dispersed. Whereas several countries have already officially adopted Beyond-GDP indica-tors, France—although proactive at a subnational level—is struggling to step this up to a national level.
What lessons can France glean from the expe-rience of other countries? The Beyond-GDP indi-cators are moving forward. Specifically, official Beyond-GDP indicators are slowly becoming more deeply embedded in political life—a dimension whose importance is often underestimated. The Belgian House of Representatives could soon be holding annual discussions on Beyond-GDP indi-cators, and a commission of experts will comment regularly on the German Beyond-GDP indicators. These European initiatives echo the French bill on Beyond-GDP indicators.
France can catch up its nascent lag at national level by adopting new indicators—note the many advantages of a dashboard with a limited number of “headline indicators” representing the social, environmental and economic dimensions—and by embedding them in French political life. If the bar-riers are to be lifted, other countries’ experiences clearly show that: m Statistics institutes hold a key position, which
can either impede or, on the contrary, drive

Beyond-GDP indicators: to what end? Lessons learnt from six national experiences
stuDy 04/2014 7IddrI
Beyond-GDP indicators, as in the case of Aus-tralia. In France, one way forward could be to create a dedicated innovation department with-in the INSEE (French national statistics body), specifically tasked with steering this work.
m Political support at the highest level is clearly a decisive advantage, as evidenced by Prime Min-ister David Cameron in the United Kingdom. An interministerial commission could be set up to provide statisticians with guidelines, but also to specify how Beyond-GDP indicators will be used (e.g. parliamentary debates, quarterly publica-tion alongside or in the same document as GDP, etc.)
Although the current economic and social crisis is sometimes presented as an opportunity to dis-seminate Beyond-GDP indicators, it is often sparks apprehension. If the crisis lingers on, it may en-courage a retreat into the safe haven of the “cur-rent model” and its headline indicators such as GDP. It may also discourage policy makers from taking Beyond-GDP indicators on board for fear of
this being perceived as an attempt to switch indi-cators so as to camouflage weak GDP recovery and high levels of unemployment.
Yet surely, Beyond-GDP indicators constitute an important tool for managing the economic and so-cial crisis. This crisis is apparent not only in short-term GDP growth but also in its impacts on ine-quality, the health of the most vulnerable, malaise at work, etc. The Beyond-GDP indicators not only enable very long-term projection, but can also, as of now, help us to better understand the present crisis in all its social, economic and environmen-tal dimensions. They restore meaning to political action by legitimising new discourses, and making it possible to avoid underestimating dimensions of prosperity that have so far been neglected. If the promises of Beyond-GDP indicators are to be ful-filled, all the stakeholders now need to reflect on the type of use that should be made of them. On this count, the experiences of other countries are beginning to provide us with some inspiring exam-ples. ❚


Beyond-GDP indicators: to what end? Lessons learnt from six national experiences
stuDy 04/2014 9IddrI
1. iNTroDUCTioN
In 2009, the Stiglitz-Sen-Fitoussi Commission submitted a report to the French President on the new measures of societal progress. Against a backdrop of financial crisis and the ques-tioning of an unsustainable and unequal growth model, the critiques that for many years had been levelled against the gross domestic product (GDP) resonated anew (Meadows, 1972; Daly, 1977; Méda, 1999; Gadrey & Jany-Catrice, 2005). These critiques underline the inability of this key economic indicator to capture worrying devel-opments such as widening income and wealth inequality or the degradation of the environment and public health.
Five years later, Beyond-GDP indicators have been adopted by the highest levels of state in sev-eral European countries, such as the United King-dom and Belgium. France, on the other hand, whilst it managed to implement new indicators at regional level (Association des Régions de France, 2012; Laurent, 2013), is struggling to make head-way on the national front. Certainly, sustainable development indicators exist and are written an-nually into reports such as the Appendix to the Rapport économique, social et financier de la France published by the French Ministry of Economy. However, they are not “presented” as an easy-to-understand Beyond-GDP indicator. They receive little coverage in the media and political debate and are not mobilised in any concrete way to eval-uate public policy.
Yet, Beyond-GDP indicators represent an op-portunity on several counts for policy makers that know how to seize it. The current abundance of new indicators is helping to reshuffle the cards of
political discourse, thus making it possible to le-gitimise new issues (Cassiers et al. 2014; Méda et al., 2011; Röckstrom et al. 2013). Beyond-GDP in-dicators in fact offer political actors the possibil-ity of constructing an innovative narrative: faced with the exhaustion of our current growth model (Demailly et al., 2013), they can help to open up a new space for public action and breathe life back into the democratic debate in a context of in-depth reconsideration of political action and discourse.
Developing new indicators, however, is not enough in itself. The indicators also need to be put to use. However, effectively integrating the many initiatives underway into policy making still faces several obstacles. The discussions and efforts often focus on fine-tuning indicator methodology. The prerequisites for their effective use in policy mak-ing have received lesser attention, except in some recent studies.1 These two aspects of the question are nonetheless complementary and mutually necessary: what sense would there be in having “good” (methodologically robust) indicators if they do not have an uptake in society? Converse-ly, how can indicators be mobilised—even if they have a high media profile—if they are not under-pinned by a sound methodology?
Several countries have adopted Beyond-GDP indicators. By drawing on these national experi-ences, this study aims to provide lessons and rec-ommendations to inform the debate on new indi-cators and on effectively embedding them at the national level, particularly in France. This work is a continuation of the BRAINPOol European re-search project. Our conclusions have also been
1. BRAINPOoL (2014), Shift Project (2013), Carnegie Trust (2012).

study 04/20141 0 IddrI
Beyond-GdP indicators: to what end? Lessons learnt from six national experiences
enriched by the findings of a research seminar on the use of Beyond-GDP indicators2 and a series of new interviews with key players (politicians, ad-ministrations or civil society) that participate in implementing Beyond-GDP indicators in the coun-tries studied (see the Appendix on methodology).
We first present the six initiatives on Beyond-GDP indicators launched in countries other than France, focusing on five questions: i) what types of indicators have been adopted? ii) which key of-ficial actor initiated these new indicators? iii) what reasons were highlighted as compelling arguments for their uptake? iv) what process was used to de-velop the indicators? and v) what practical uses are made of the indicators today? Secondly, we set out the lessons learnt and recommendations likely to trigger and/or expand the political uses of Beyond-GDP indicators in France and other countries.
2. BEyoND-GDP iNDiCATorS: STUDy oF SiX NATioNAL iNiTiATiVES Over the past few years, there has been an unprec-edented rise in the development of Beyond-GDP indicators, one that has mobilised diverse actors at all scales: international institutions (Euro-pean Union, OECD, World Bank, United Nations Development Programme (UNDP)), the United Nations Environment Programme (UNEP), central governments (United Kingdom) and regional governments (Wallonia and Wales), parliaments (Belgian and German), national statistics insti-tutes (Australian Bureau of Statistics, INSEE in France), civil society representatives (community indicators in the United States, New Economics Foundation in the United Kingdom or the Global Footprint Network at international level) and academics. In 2008, the Stiglitz-Sen-Fitoussi Commission (“Stiglitz Commission”) synthe-sised the many studies carried out but which had remained dispersed until then—giving them a fresh visibility. More recently, the BRAINPOoL study (2014), aimed at identifying the factors underlying the institutionalisation of Beyond-GDP indicators, has given a fresh overview of new indi-cators in different European countries, regions and municipalities.3
2. Speakers at the seminar organised on 14 January 2014 at Sciences Po Paris included Martine Durand, Director of Statistics and Chief Statistician at the OECD, Eloi Laurent, a senior economist at OFCE and Florence Jany-Catrice, economist at the University of Lille and member of the FAIR network.
3. See: http://www.brainpoolproject.eu/indicators-and-initiatives/
In this study, we selected the initiatives by ap-plying two filters. First, we limited the scope of the study to Beyond-GDP indicators with a societal di-mension, which cover economic, environmental and social aspects and are considered as possible functional complements to GDP. We excluded from this category isolated sectoral indicators such as the obesity rate or wellbeing at work, each of which could nonetheless constitute a dimension for a new Beyond-GDP indicator. Second, we were interested in studying initiatives supported by national-level public authorities or large regions—and not there-fore limited to the civil society or the academic community.
These two filters led us to select six initiatives undertaken in four countries: Germany, Australia, Belgium and the United Kingdom. Four were con-ducted at national level and two at regional level. In many respects, the two regional experiences, in Wallonia and Wales, can be viewed as being of the same vein as national experiences, given that both are highly empowered and enjoyed consider-able political autonomy. We also present the case of France.4
Note that our choice of initiatives does not pre-judge the format of the indicators. Often, four types of indicators are distinguished: synthetic indicators, composite indicators, indicators built from subjec-tive data and dashboards. A composite indicator is a single-number indicator which uses weightings to aggregate different variables that do not necessarily have a common unit of account, as for example, the Human Development Index (HDI5). A synthetic in-dicator aggregates variables that have the same unit of account, such as the “green” GDP (see Nordhaus & Tobin, 1973). A subjective indicator is built on the basis of what survey respondents feel (“Generally, do you feel satisfied with your life?”). A dashboard presents a set of indicators covering major societal issues, and may be very detailed (e.g., the obesity rate), but also composite, synthetic or subjective.
Below, we present the six experiences with Be-yond-GDP indicators separately, structuring these overviews as answers to the five questions men-tioned in the introduction:
i) WHAT?: What types of indicators have been adopted?
ii) WHO?: which key official actor initiated these new indicators?
iii) WHY?: what reasons were highlighted as com-pelling arguments for their uptake? What is the stat-ed position of Beyond-GDP indicators with respect to GDP?
4. For an overview of the initiatives in other OECD Member States, see OECD (2013).
5. See UNDP (1990).

Beyond-GDP indicators: to what end? Lessons learnt from six national experiences
stuDy 04/2014 1 1IddrI
iv) HOW?: what process was used to develop the indicators?
v) TO DO WHAT?: What were uses were initially planned for the indicators? What practical uses are made of the indicators today?
2.1. Australia: Measuring Australia’s Progress
What? Each year since 2002, the Australian Bureau of Statistics (ABS) has produced a set of statistics in dashboard-form with 26 themes6 divided into 4 areas: society, economy, environment and govern-ance. This initiative is designed to answer the ques-tion “Is life in Australia getting better?” Each of the 26 themes has indicators representing the evolution of the theme’s different dimensions, as shown in Figure 1. For instance, the economic opportunities indicator reflects the trends of four sub-indicators: employment (employment rate), business (new business entry rate), living standards (net national disposable income per capita) and “capabilities” (% people having attained or exceeded a given level of education). A further example, the “Close relation-ships” indicator, synthesises the trends of four indi-cators: positive relationships (% people who feel able to talk about important issues with their family and/or friends), caring (% people who can count on support from people outside the household in times of crisis), children (% children who are devel-opmentally vulnerable due to their physical health and wellbeing), time (% people who are pressed for time). For each theme, the Australian dashboard publishes the yearly changes based on three classifi-cations: progress, regress or no great change.7
6. In 2013.7. For a more detailed view of each dimension, visit:
http://www.abs.gov.au/ausstats/[email protected]/mf/1370.0
Who? The initial impetus for the Measuring Aus-tralia’s Progress (MAP) project came from the for-mer ABS chief statistician, Dennis Trewin,8 who wished to integrate national progress measure-ments into the official statistics.
The first step in this initiative was put in place at a major conference, “Measuring Progress: Is Life Getting Better?” (Eckersley, 1998) which attracted many leading Australian figures. To carry out his project, Trewin teamed up with collaborators and engaged a dialogue with three groups of stake-holders: statisticians, politicians and civil society. It seems that the dialogue with statisticians was the most complicated.
In the dialogue with civil society, the ABS initial-ly encountered resistance from some civil society members, notably in a media debate sparked by an intellectual who was highly critical of the statistical methods used. Moreover, detractors widely dissemi-nated the message that the ABS had no mandate to measure social progress.
Dialogue with political spheres also met with some difficulty. At the time consultation with ABS was in train, the Ministry of the Environment was launching its own sustainable development pro-gramme involving the development of its own in-dicators. The Treasury was in favour of the project. Most members of the administration and a govern-ment fringe that the project initiators had met with were also favourable to the project quite simply for the sake of “doing things better”. Yet the govern-ment’s enthusiasm for this initiative was apparently directed above all to indicators that were not likely to risk putting the government in a difficult position, which excluded those that foregrounded failures in dealing with poverty or wellbeing, for example.
8. Chief statistician of ABS between 2000–2007.
Figure 1. Australia’s Beyond-GDP indicators
Source: Australian Bureau of Statistics, 2013, p.5.
Society
✔ Health Close relationships Home Safety✔ Learning and knowledge Community connections and
diversity❓ A fair go❓ Enriched lives
Economy
✔ Opportunities✔ Jobs✔ Prosperity❎ A resilient economy✔ Enhancing living standards Fair outcomes✔ International economic engagement
Environment
❓ Healthy natural environment Appreciating the environment❓ Protecting the environment❎ Sustaining the environment✔ Healthy built environments❓ Working together for a healthy environment
Governance
Trust❓ Effective governance✔ Participation❓ Informed public debate❓ People’s rights and responsibilities
Legend✔ The headline progress indicator for this theme has shown progress.❎ The headline progress indicator for this theme has shown regress.
The headline progress indicator for this theme has not changed greatly.❓ There is data gap for this theme as there is currently no headline progress indicator.
study 04/20141 2 IddrI
Beyond-GdP indicators: to what end? Lessons learnt from six national experiences
Why? The reasons presented on the MAP plat-form relate to the growing interest of civil society, governments and the international community in the nexus between the economic, social, environ-mental and governance dimensions.9
How? The MAP design process involved several phases. As a first step, the authors discussed the choice of approach. From among single-number indicators, extensions to national accounts and stand-alone indicator dashboards, they chose the third option. Secondly, they had to choose which dimensions the dashboard was to include. Accord-ing to Trewin, this step is the most delicate one. To integrate a broad spectrum of worldviews when defining the programme’s dimensions, various stakeholders were consulted using a Reference Group.10 Once the target audience, the method and the dimensions had been defined, the choice of how to calculate these dimensions was made.
To what end? Among policy makers, experts and general public, the MAP developers chose the general public as its main audience: “Whether life is getting better” is a question in which everyone is potentially interested…Measuring Australia’s Pro-gress was targeted at the general public” (Trewin & Hall, 2004).
MAP has been the subject of many reports and publications. It has also been presented and made available to users and the general public.11
The authors recognise that the reports produced by the ABS have also sparked keen interest from the political and academic communities. Impor-tantly, Trewin states that: “we were careful to en-sure that the publication looked at the nation’s, not the government’s progress and so avoided looking at indicators tied to certain policies” (Ibid.).
In terms of influence, as Trewin himself rec-ognises: “It is fair to say the report has had more
9. http://www.abs.gov.au/ausstats/[email protected]/Lookup/1370.0main+features672013: “This interest in presenting a more complete picture of progress (combining GDP with other economic, social and environmental measures), is the prime reason the ABS originally developed MAP and has continued to publish data in this format”.
10. “Giving stakeholders some ownership in the publication was almost as valuable a determinant of the publication’s success as the advice they gave. A Reference Group of experts was established to help us develop MAP but there was also extensive public consultation” (Trewin & Hall, 2004).
11. “The progress indicators provide the building blocks to which readers can apply their own evaluations to assess whether a nation is on balance progressing and at what rate. Readers can use a publication in three ways to assess progress: first, by examining the data and reading comments about each indicator’s historical movements; second, by reading the discussion of links between indicators; and third, by reading the comments about factors that influence change and the national assets that may support future progress” (Trewin & Hall, 2004)
influence on public debate rather than policy de-bate” (Ibid.).
For MAP’s initiator, Dennis Trewin, there is no question of imposing what a “good life” should be. Instead, each person looks at the indicators and applies their own values and preferences, and thus makes their own assessment of national progress.12
According to Trewin, the initiative received an enthusiastic welcome from the media.13
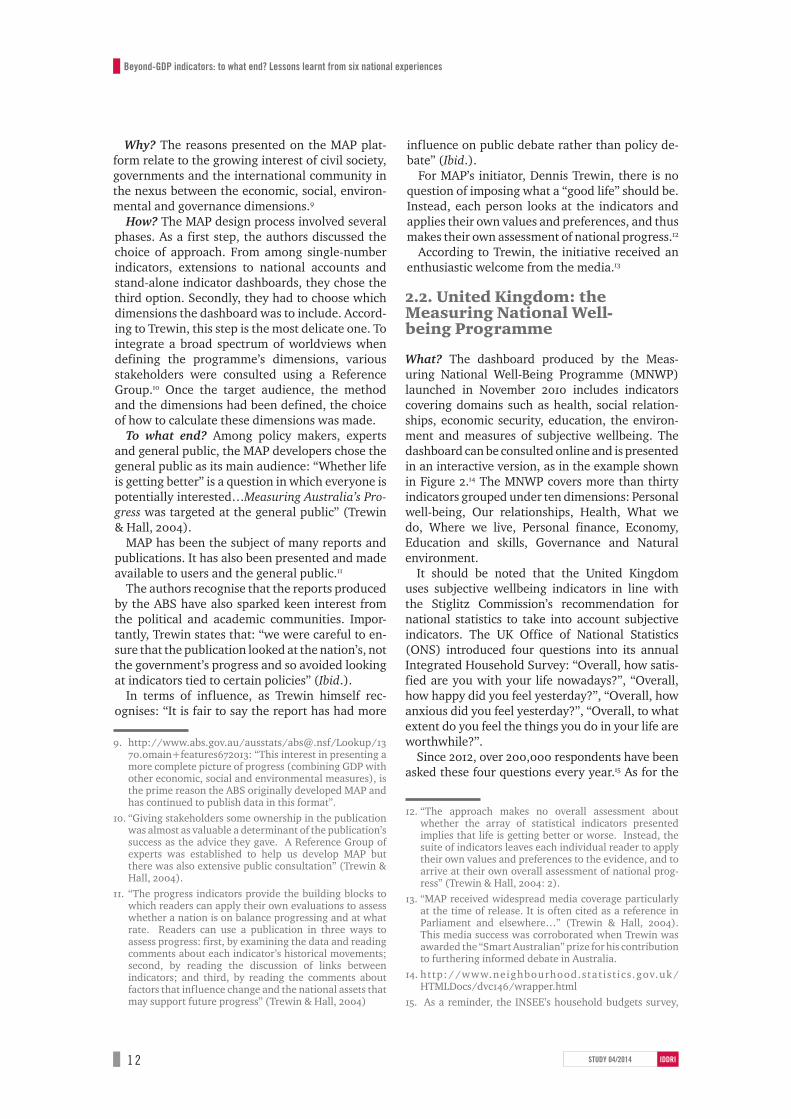
2.2. United Kingdom: the Measuring National Well-being Programme
What? The dashboard produced by the Meas-uring National Well-Being Programme (MNWP) launched in November 2010 includes indicators covering domains such as health, social relation-ships, economic security, education, the environ-ment and measures of subjective wellbeing. The dashboard can be consulted online and is presented in an interactive version, as in the example shown in Figure 2.14 The MNWP covers more than thirty indicators grouped under ten dimensions: Personal well-being, Our relationships, Health, What we do, Where we live, Personal finance, Economy, Education and skills, Governance and Natural environment.
It should be noted that the United Kingdom uses subjective wellbeing indicators in line with the Stiglitz Commission’s recommendation for national statistics to take into account subjective indicators. The UK Office of National Statistics (ONS) introduced four questions into its annual Integrated Household Survey: “Overall, how satis-fied are you with your life nowadays?”, “Overall, how happy did you feel yesterday?”, “Overall, how anxious did you feel yesterday?”, “Overall, to what extent do you feel the things you do in your life are worthwhile?”.
Since 2012, over 200,000 respondents have been asked these four questions every year.15 As for the
12. “The approach makes no overall assessment about whether the array of statistical indicators presented implies that life is getting better or worse. Instead, the suite of indicators leaves each individual reader to apply their own values and preferences to the evidence, and to arrive at their own overall assessment of national prog-ress” (Trewin & Hall, 2004: 2).
13. “MAP received widespread media coverage particularly at the time of release. It is often cited as a reference in Parliament and elsewhere…” (Trewin & Hall, 2004). This media success was corroborated when Trewin was awarded the “Smart Australian” prize for his contribution to furthering informed debate in Australia.
14. http://www.neighbourhood.stat ist ics .gov.uk/HTMLDocs/dvc146/wrapper.html
15. As a reminder, the INSEE’s household budgets survey,

Beyond-GDP indicators: to what end? Lessons learnt from six national experiences
stuDy 04/2014 1 3IddrI
objective dimensions, the programme integrates measures of economic wellbeing: median house-hold income, consumption and wealth. On the oth-er hand, there is no income- or wealth- inequality indicator in the British MNWP. Concerning the en-vironment, the Department for Environment, Food and Rural Affairs (Defra) is now developing a new dashboard of sustainable development indicators that completes the MNWP.
Who? The MNWP was initiated by Prime Min-ister David Cameron and is headed by the ONS. Cameron’s interest in the question of wellbeing dates to before his becoming Prime Minister, but when he took up this office he gave it fresh visibility in the British debate on statistics. In order to drive and supervise the programme policy-wise, a Well-being unit was set up within the Cabinet Office. It should be said that the ONS has been interested in wellbeing data and indicators for many years.
which gathers information on all the economic activities of French families, is conducted every four years with around 15 000 households.
Why? David Cameron’s speech on 25 November 201016 explicitly highlights the importance of tak-ing wellbeing into account.17 The programme was established in response to a growing demand, both in the United Kingdom and internationally, for new measures that stretched beyond the tradition-al measures of economic activity such as GDP. The Stiglitz Commission is, moreover, regularly cited as one of the sources that inspired this initiative.
How? The first phase of this project involved a large-scale public debate that ran from 25 Novem-ber 2010 to 15 April 2011. The main purpose of this phase was to gather a solid base of information on what mattered to British people. The debate, conducted both online and at events across the
16. h t t p s : / / w w w. g ov. u k / g ove r n m e n t / s p e e c h e s /pm-speech-on-wellbeing
17. “Today the government is asking the Office of National Statistics to devise a new way of measuring wellbeing in Britain. And so from April next year, we’ll start measur-ing our progress as a country, not just by how our econ-omy is growing, but by how our lives are improving; not just by our standard of living, but by our quality of life.”
Figure 2. New Beyond-GDP indicators in the United Kingdom
Source: http://www.neighbourhood.statistics.gov.uk/HTMLDocs/dvc146/wrapper.html

study 04/20141 4 IddrI
Beyond-GdP indicators: to what end? Lessons learnt from six national experiences
country, was based on a consultation paper that asked five overarching questions: “What things in life matter to you?”, “Of the things that matter to you, which should be reflected in measures of national well-being?”, “Which of the following sets of information do you think help measure national well-being and life in the UK is changing over time?”, “Which of the following ways would be best to give a picture of national well-being?” and “How would you use measures of national well-being?”. The ONS received some 7,900 re-plies to these questions, including 50 from organi-sations. The Office also launched a website where people could express their opinions on measuring national wellbeing. Around 1,200 opinions were given through this channel. There was also col-laboration with online communities and a dedi-cated telephone line was set up to answer people’s questions.18 What was clear from this public debate was that subjective wellbeing was one of the key dimensions that mattered to people.
After this consultation phase, the ONS developed new measures of wellbeing that integrated but also went beyond measures of economic perfor-mance. On 20th November 2012 the programmes first annual report, Life in the UK, was published. At the same time, the measuring well-being wheel (cf. Figure 2) was put online and updated (last update in September 2013). Since then, statistical bulletins are published regularly. The second Life in the UK report was published in March 2014.19
To what end? The programme’s stated objec-tive is to develop an accepted and trusted set of National Statistics that people can refer to as a primary source of information to assess the UK’s state of wellbeing. The ONS reports on the MWNP are published monthly, each one focusing on a specific dimension of wellbeing. In terms of their utilisation, it transpired from our interview with a member of the Cabinet Office that the MNWP in-dicators are widely used to broaden policy makers’ views of social problems. According to several of the people we interviewed, the notion of wellbeing has been factored into policy issues—so much so, that the sustainable development strategy has now been absorbed by the MNW Programme.
The Cabinet Office’s Civil Service Quarterly department has dedicated one of its services to wellbeing issues and the MNWP. Interestingly, the MWNP indicators are also called on to inform policy decisions. In June 2013, the Government
18. ONS (2011), National Statician’s Reflection on the National Debate on Measuring National Well-being.
19. http://www.ons.gov.uk/ons/guide-method/user-guidance/well-being/about-the-programme/index.html
published a document resuming the main policy experiences that had referred to MNWP. This is notably the case for matters relating to the public health system, the organisation of local councils and neighbourhoods, the wellbeing of civil ser-vice workers, transport schemes and jobs seekers’ wellbeing.20 For the moment, however, each public policy area uses the indicator directly related to it and the rest of the MNW indicators are not called on to evaluate the social or systemic impacts of a given policy—as is sometimes the case with GDP, cf. Box 1.
2.3. Wales: One Wales, One Planet
What? Since 2000, Wales has been using Beyond-GDP indicators. Since 2009, these have taken the form of a 29-indicator dashboard (Sustain-able Development Indicators, SDIs) that helps to monitor the region’s third sustainable devel-opment plan, One Wales, One Planet. Here, the concept of sustainable development is to be understood in its broadest sense, and extends beyond environmental issues: the five headline indicators include resource use, the environment, the economy, society and wellbeing. A detailed account of the indicators included in each of these dimensions in given in Figure 3.
Who? The Welsh Assembly Government is the executive body to which the UK government has devolved competence for twenty policy areas in Wales. The question of assessing progress in the area of sustainable development was written into the Government of Wales Act (a functional equiva-lent to a constitution) in 1998. The Welsh adminis-tration, prompted by the Welsh Government, thus developed a suite of indicators to monitor changes in this domain, in compliance with the Act.
Why? The reasons why Wales adopted indica-tors relate to its commitment to sustainable de-velopment. This commitment has been operative for many years and is driven by the Welsh Govern-ment’s determination to innovate in this area.
How? The development of sustainable develop-ment indicators is not a recent process. As early as 2000, the Welsh Government submitted a public consultation paper with a set of 81 possible indica-tors. This consultation led to a reduced set of 12 indicators, which were adopted in 2001. In 2006, various modifications were recommended by the SD Indicators Working Group (set up by the Welsh Government) and adopted in 2007. This set
20. For a complete picture of the MNWP’s areas of use see: https://www.gov.uk/government/uploads/ system/uploads/attachmentdata/f i le/224910/WellbeingPolicyandAnalysisFINAL.PDF

Beyond-GDP indicators: to what end? Lessons learnt from six national experiences
stuDy 04/2014 1 5IddrI
of indicators forms the basic structure of the cur-rent set of indicators. In 2009, the One Wales, One Planet scheme endorsed these headline indicators and added one more on the Well-being of Wales, grouping them into five main dimensions: sustain-able resource use, sustaining the environment, a sustainable economy, a sustainable society and the wellbeing of Wales.
To what end? The indicators are published an-nually in a sustainable development report (whose publication is a statutory duty under the sustain-able development scheme21), and hosted on the Welsh Government’s website. Moreover, since 2012, the Sustainable Development Indicators for Wales booklet has been published annually giv-ing the results for the sustainable development indicators. This booklet is a National Statistics publication and forms the basis on which the sus-tainable development plan must be evaluated and
21. In Wales, the promotion of sustainable development is a statutory duty: “We remain one of the few administrations in the world to have such a statutory duty.” (Welsh Assembly Governement, 2009: 4)
readjusted if necessary in order to ensure its effec-tiveness and longevity.
Yet according to BRAINPOoL (2014), it would seem that while the indicators are integrated into a sustainable development strategy and calculated regularly, they are not effectively used for deci-sion-making.22 The main reason appears to be that decision-makers do not perceive the salience of us-ing such indicators. Seemingly, for most of them, the sustainable development strategy is not em-bedded in their area of policy action and cannot be directly used or constitute a priority in their policy processes. What remains high priority for them are the questions of growth, employment and poverty (Michaelson, 2013).
Moreover, concerning the responsiveness of the general public, the BRAINPOoL study identifies several barriers. One of these is the lack of effec-tive communication on these indicators: “Com-munication around SDIs had failed to connect
22. In the terminology described in Lesson 7 (cf. infra), we refer to the “instrumental” use of indicators, which is a use that is much in need of developement.
Figure 3. Beyond-GDP indicators in WalesSustainable Development indicators
Theme resource use Environment Economy Society well-beingHeadline
indicator(s)Ecological footprint Priority species status
Priority habitat statusGross added value
(GVA)% population in relative low-income households
Mental and physical functioning—‘health status’
Life satisfaction
Supporting indicators
Greenhouse gas emissions
Biodiversity:short-term changes in bird
populationslong-term changes in bird
populations
Employment Health inequality:infant mortality
life expectancy at birth
Education:% adults 19–21 qualified to
NVQ L2% working age adults
qualified to NVQ L4
Waste by sectorWaste by disposal
Ecological impacts of air pollution:
sensitive habitat areas exceeding critical loads
Resource efficiency:CO2 emissions to
GVA ratio
Benefit dependency: % working-age people claiming out of work
benefits
Child poverty:% children in low-income
households
Household waste Air quality:air pollution in urban sites air pollution in rural sites
% electricity from renewable sources
Housing:energy efficiency ratings
of dwellings
Pensioner poverty: % pensioners in low-income
households
Mobility: no. of trips by main
mode% of people
travelling to work by mode
River quality Accessibility: % households where facilities reachable in
under 15 minutes by foot or public transport
Worklessness: % children and adults to 64 living in workless households
Soil quality Crime: recorded serious acquisitive crime
Active participation: % volunteering formally or informally at least once a
month
Sustainable water resources: % of areas with target
deficits
Welsh language:% pupils (aged 5–14) assessed in Welsh First
Language
Source: BRAINPOoL, 2014.

study 04/20141 6 IddrI
Beyond-GdP indicators: to what end? Lessons learnt from six national experiences
with the public, perhaps partly because there was nothing emotionally charged, that resonated, with the public in the Sustainable Indicator Set and no strong accompanying narrative” (BRAINPOoL, 2014: 23). A second barrier to using the indicators involves the practical difficulty of handling the nu-merous indicators that make up the dashboard.
More generally, the barriers to using sustainable development indicators in Wales that BRAINPOoL identified are of four kinds: the lack of salience for key audiences; a disconnect between the indica-tors and policy priorities and actions; the percep-tion that the indicators distorted priorities of the Welsh Government and, finally, political pressures affecting the use of indicators.
2.4. Wallonia: Five composite indicators for Wallonia
What? The Walloon region adopted five key indi-cators in May 2013:23
i) Social situation index (ISS—Indice de situa-tion sociale): based primarily on the French social health indicator,24 adapted to the Walloon con-text. This index is based on two components: an indicator for the state of the society (social and human capital) and an indicator for the state of socio-economic imbalances and inequality.
ii) Wellbeing index (ICBE—Indice des condi-tions de bien-être): this index is based on a par-ticipative methodology established by the Walloon Institute for Statistics (IWEPS).
iii) Ecological footprint and biocapacity (EE—Eempreinte écologique): these indices, which measure the limits of the planet relative to the con-sumption of resources and absorption of wastes, will be calculated according to internationally rec-ognised norms but using more accurate national and regional data.
iv) Environmental situation index (ISE - Indice de situation environnementale): This index meas-ures the quality of the environment and is based on two indicators: an indicator for the state of the environmental components and one for the impact of these components on human health.
v) Indicator for economic capital, distinct from GDP, still to be defined.
23. http://nollet.wallonie.be/la-wallonie-met-en-place-ses-cinq-indicateurs-phares-compl-mentaires-au-pib (in French).
24. The index of social health is a composite index developed in France in 2009 by Zotti and Jany-Catrice using a participative approach. Its methodology is based on an earlier research project, the BIP-40 (barometer of inequality and poverty). It has eight components: income, labour and employment, education, health, housing, security, social relationships, interpersonal relationships.
Who? Conditions in Wallonia were relatively conducive to the uptake of new indicators, as this issue had, from the outset, been incorporated in the Regional Policy Statement (RPS). The impetus came from the Minister of Sustainable Develop-ment, Jean-Marc Nollet (green), serving within a coalition of Ecologists (Ecolo), Socialists (PS) and Humanist Democrats (Cdh). It is clear from our interviews that Minister Nollet’s political commit-ment was key in instigating the discussion on new indicators, as well as in selecting the indicators and mandating the Walloon Institute for Statistics (IWEPS) to systematically calculate them.
Another factor that expedited the implementa-tion of these indicators is the influence of WWF’s work in support of composite indicators. Former WWF programme director Geoffroy de Schutter was appointed by the minister to ensure the im-plementation of the Walloon indicators. His role of lobbying and social innovation was thus trans-formed into an institutionalised function within the Minister’s office, which helped to endorse and legitimise the implementation of the new indicators.
Why? Several reasons were mentioned by the in-terviewees. The first relates to the shortcomings of gross domestic product (GDP), which is a key in-dicator for measuring economic growth but which takes little account of issues of wellbeing and no account of environmental issues. Reference was also made to various initiatives developed outside of Belgium (OECD, G20, European Parliament, United Nations, United Kingdom, Germany and the French Nord-Pas-de-Calais region).
How? The five key indicators for the Walloon re-gion were selected after several consultations with experts and civil society.25 The selected indicators were submitted to “advisory councils” with repre-sentatives from social partners, associations and civil society groups. They were called upon to ex-press an opinion that, while not binding, was very important in justifying the Government’s choices. Once this choice was approved by the Govern-ment, financing was arranged to provide the budget required for IWEPS to manage these indi-cators.26 The economic capital indicator will soon be developed by IWEPS and subject to an opinion
25. The steps involved: 1) producing an inventory of indicators (compiled by IWEPS); 2) organising a panel of experts and users to clearly identify the general public’s priorities; and 3) on the basis of these consultations, coming up with a selection of indicators.
26. Interestingly, in Wallonia’s case, there was resistance to the way funds were channelled to IWEPS: the funds were disbursed to IWEPS, but their allocation had no conditions attached requiring that IWEPS regularly calculate the indicators selected to complement GDP.
Beyond-GDP indicators: to what end? Lessons learnt from six national experiences
stuDy 04/2014 1 7IddrI
from the Walloon Economic and Social Council and the Walloon Environmental Council for Sus-tainable Development.
To what end? It is worth remembering that the draft RPS clearly states the Government’s wish “to develop, in consultation with social partners, other regions, the federal authorities and relevant international bodies, indicators that can measure human development and the ecological footprint, in addition to GDP, so as to guide and evaluate the Government’s actions” (Walloon Regional Policy Statement, 2009–2014, p.43).
In May 2014, the first computation of three of the five indicators mentioned above was released by IWEPS in three separate reports.27 IWEPS has in fact been commissioned by the government to provide annual data on the five indicators. Since not all of them have yet been calculated, they have not been put to any effective use for the moment.
It is noteworthy that the publication of the first three indicators has not yet attracted much media attention. The indicators are only available on the institute’s website. Moreover, the change in power following the elections, coupled with the statisti-cians’ reluctance to calculate composite indicators, calls into question the sustainability of the project and its real political impact.
2.5. Federal Belgium: the “complementary indicators” Act28
What? The indicators in addition to GDP are very recent in Belgium. In fact, an Act of 23 January 2014 sets the goal of developing indica-tors to complement GDP “to measure quality of life, human development, social progress and the sustainability of our economy”. As the ecologist Federal Deputy Thérèse Snoy states, these indica-tors will be consolidated into “as small a number as possible” and “will be developed with the participa-tion of relevant government agencies and Belgian civil society”.29
Who? The Act is an initiative of the Belgian Sen-ate and was voted in by the Chamber, following the Senate’s vote, on 23 January 2014. Thérèse Snoy from the Ecolo party commented: “this Act is the result of a parliamentary majority. Ecolo-Groen
27. http://www.iweps.be/indicateurs-complementaires-au-pib28. The Act of 23 January 2014 supplementing the Act of 21
December 1994 pertaining to social and other provisions through a series of complementary indicators to measure quality of life, human development, social progress and the sustainability of the economy (3234/1-4).
29. http://www.tsnoy.be/2014/01/30/de-nouveaux-indicateurs-complementaires-au-pib-la-belgique-pionniere/
had submitted proposals to the same end but these were ‘covered’ by the majority’s proposal. [The op-position] thus supported this Act, whilst stressing the need to rigorously apply it and give these new indicators the importance they deserve”.
Why? There are multiple reasons for the 2012 creation of a Senate working group on “new indi-cators for economic performance, social progress, quality of life and happiness” and they seem to sug-gest that all the members of parliament involved, whatever their political persuasion, have some-thing to gain. They mention that this Act provides an opportunity to propose a different perspective on societal goals and development models and to define “new kinds”30 of policy objectives. Note that the ecologists’ intention is to “take a step closer to a paradigm shift” (ibid.), and one way of creating this shift would be to counter the prevailing GDP-centric discourse by “referring as much as possi-ble, when providing interpretations, to indicators that consider wellbeing as an issue distinct from economic growth and from a productivist view of wellbeing” (ibid.). There should also be more ex-plicit focus on ecological issues linked to the physi-cal limits of the planet.
How? As a practical move, a Senate working group was set up in 2012. Various hearings were organised with national and international experts. The working group was initially chaired by a Mem-ber of Parliament who fully supported the uptake of new indicators and was keen to adapt a regional experiment using these to the federal level. For political reasons, the Member of Parliament had to relinquish the working group chair. The arrival of his successor dampened the group’s momentum and finally led not to a text produced by the (mul-tiparty) working group but to a proposal support-ed by the majority alone and defined outside the context of the working group. The working group tasked the Belgian Federal Planning Bureau with developing indicators to complement GDP.
To what end? It seems that the primary objective of Ecolo—which was the first party to launch the initiative—was to shift policy focus by introducing new indicators that would reformulate and reframe the political discussions and wrangling on well-being issue. The motives of the project initiators hinge on the fact that wellbeing indicators would likely prompt debate between the general public and politicians. Moreover, the results of these indi-cators are due to be included in the Banque nation-ale de Belgique’s annual report and submitted for annual debate in the Chamber of Representatives.
30. Speech by Thérèse Snoy to the Belgian Chamber of Representatives, 23 January 2014.
http://www.tsnoy.be/2014/01/30/de-nouveaux-indicateurs-complementaires-au-pib-la-belgique-pionniere/

study 04/20141 8 IddrI
Beyond-GdP indicators: to what end? Lessons learnt from six national experiences
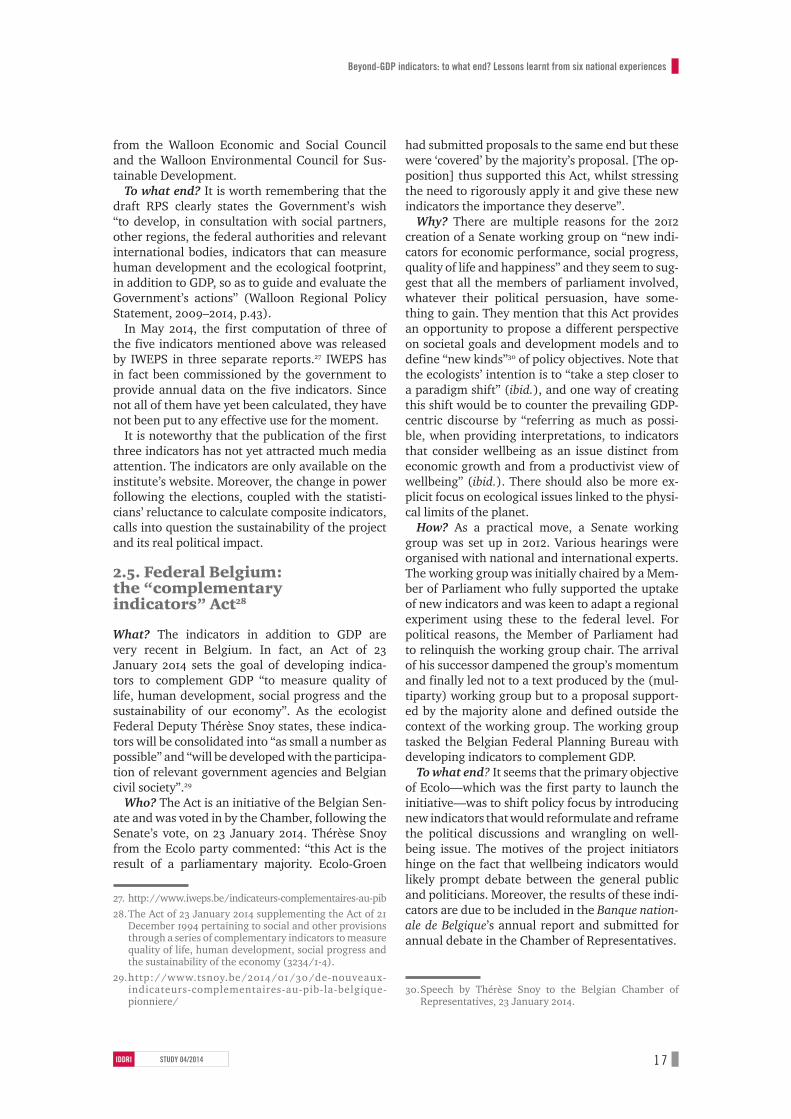
2.6. Germany—W3-Indikatoren (W3 Indicators)
What? The W3 indicators include nine indicators that complement GDP, encompassing (along with GDP) three dimensions: the economy, ecology and wellbeing. For each of these three areas, in addi-tion to the 10 indicators (GDP + 9 complementa-ry indicators), there are nine “warning lights” to show whether critical limits have been exceeded in given areas. The set of indicators is illustrated in Figure 4.Who? The W3 indicators derive from the work of the “Study Commission on growth, wealth and quality of life” (“Enkete-Kommission Wachstum, Wohlstand, Lebensqualität”), set up by the Bun-destag in December 2010. The commission was transpartisan.Why? The main reason for setting up this commis-sion was that GDP did not adequately reflect the prosperity of a society. The aim of the Commission was thus to put the role of traditional indicators—first and foremost GDP—into perspective in the public and political debate.How? The Study Commission began its work in January 2011 and concluded in June 2013. It comprised seventeen Bundestag members from five parties (CDU/CSU, SPD, FDP, Bündnis 90/Die Grünen and Die Linke), split into five work-ing groups, each chaired by one of the five par-ties. Each group dealt with one topic. Seventeen experts from academic, economic and trade un-ion backgrounds were appointed to complete the Commission. The topics addressed the potential and limits of growth, employment, consumer be-haviour and lifestyles, in view of shaping the out-lines of sustainable economic management for Germany. One of the working groups specifically tackled the search for a Beyond-GDP indicator.To what end? For the time being, the indicators are still at the proposal stage and not yet used ef-fectively. The German Institute for Economic Re-search (DIW Berlin) acknowledges that simply computing and publishing the indicators will not ensure their political effectiveness (Giesselmann et al., 2013). A culture of discussion that recognises the relevance of adopting new indicators needs be fostered. This is why the Commission has proposed that the Federal Government take an official stance at regular intervals on how the indicators are pro-gressing. This could be in the form of an annual report endorsed by all government departments. The Commission further suggested that groups of government experts be tasked to officially com-ment on the W3 indicators on a regular basis. The setting-up of an expert committee for a “sustain-able quality of life” has also been proposed.
2.7 Beyond-GDP indicators in France
What? Following the Stiglitz Commission’s work (from 2008 to 2009), the INSEE published a dashboard of sustainable development indicators comprising a set of twenty indicators that can be grouped into six dimensions: health, demograph-ics, economy, social, environment and govern-ance. Fifteen of these indicators match the themes set out in the French authorities’ sustainable de-velopment strategy and five others cover economic and social questions. Who? In 2007, spearheaded by President Nicolas Sarkozy, a commission with some forty members and led by three economists (two of them Nobel prize winners), was set up and tasked with draft-ing a report on the measures of economic and so-cial progress. The Commission brought in numer-ous French and international researchers (mostly economists, along with sociologists, psychologists and political scientists) and members of public ad-ministrations. It submitted its report in September 2009. Although the French executive had been highly proactive in setting up the Stiglitz Commis-sion, follow-up support subsequently waned and the executive did not officially implement these new Beyond-GDP indicators. A notable example of this is the bill tabled in 2009 by the ecologist parliamentary group,31 and rejected by Nicholas Sarkozy’s majority. The bill aimed to establish the ecological footprint as a headline indicator and put in place public policies to reduce this footprint. The French Conseil d’Analyse Economique (Coun-cil of Economic Analysis) together with its German counterpart, the German Council of Economic Ex-perts, also published a joint report that aimed to “define a set of regularly published indicators on the key themes of economic performance, quality of life and sustainability” (CAE-CGEE, 2010: 5). However, this proposal failed to garner political backing. The French Commission on Sustainable Development, for its own part, developed indica-tors for the green economy but these are more sector-based than the Beyond-GDP indicators that we analyse in this paper.
Why? In the context of the financial crisis, the French president has criticised GDP on several oc-casions for its inability to reflect the progress of our societies and to accurately capture not only purely economic changes but also social and environmen-tal changes. The main purpose of the Stiglitz Com-mission was to “reflect on ways of escaping purely
31. http://www.assemblee-nationale.fr/13/propositions/pion1369.asp

Beyond-GDP indicators: to what end? Lessons learnt from six national experiences
stuDy 04/2014 1 9IddrI
quantitative book-keeping measures of national performance”. How? The development of a French indicator dashboard followed on from the Stiglitz Com-mission’s work. The Interministerial Committee for Sustainable Development, together with the INSEE and the statistics service of the Ministry of the Environment (SoES) identified twenty indica-tors—expanding the list of indicators identified in 2003, but not including as many economic and so-cial indicators. To what end? Despite these multiple French (re-gional and district) initiatives and the annual pub-lication of the sustainable development indicator dashboard, the effective use of Beyond-GDP in-dicators remains extremely limited. Interestingly, the dashboard for the sustainable development strategy is published in Appendix 11 of the second volume of the Economic, Social and Financial Re-port of the French Finance Law. Very few politi-cians are aware of these indicators and the dash-board receives virtually no media coverage. As one member of the Stiglitz Commission admits, the work did not focus on the practical use of Be-yond-GDP indicators, but rather on the form that these should take. This contributes to explain that, today, no effective use is made of Beyond-GDP in-dicators in political spheres. To increase the effective use of the new indicators in French decision-making processes, on 23 January 2014, a group of green MPs presented a draft organ-ic law on the “programming and… governance of public finance to take into account the new wealth
indicators”. After amendment,32 the French Govern-ment committed to publishing the new indicators at the same time as the Finance Law and to evaluat-ing major government reforms in light of these new indicators. For the moment, these commitments do not seem to have translated into action. It thus appears that the Beyond-GDP indicators de-signed to address the inadequacy of GDP and other conventional economic indicators to capture social progress are beginning to be implemented in sev-eral countries that have similar characteristics to France. These initiatives are not limited to civil
32. “Faced with our bill, the Government expressed reservations concerning the form: it was in fact a draft organic law aimed at modifying the LOLF (organic law on Finance Laws), by introducing these new indicators into the explanatory statement of the Finance Law. However, the Government does not wish to change the LOLF…. We thus continued the dialogue with the Government to achieve our basic objective, whilst modifying the form of our bill. As a result, the Minister of the Budget, through Bernard Cazeneuve, committed at the session to support a bill on the new wealth indicators in the first quarter 2014, in which we will repeat our main objectives, principally the objective of publishing the alternative indicators at the same time as the draft Finance Law is presented and an evaluation of the main reforms proposed by the government in the light of the quality-of-life and sustainable development indicators. The Government moreover committed to try out these new indicators for the 2015 budget, which is thus before the law which would be finally adopted by Parliament (the law is then voted by the Senate, and subsequently returned to the Assembly, which often means more than one year of parliamentary procedure” (See Eva Sas’ website for the original French: http://evasas.eelv.fr/nouveaux-indicateurs-de-richesse-une-loi-au-premier-semestre-2014/).
Source: Giesselmann et al. 2013, p.13.
Figure 4. Beyond-GDP indicators in Germany
warming lightsDimensionsLeadinf indicators
Material
Ecological
Social
Biodiversity
Nitrogen surplus
Greenhouse gas emissions
Life expectancy
Education rate
Employment rate
Democracy
Income distribution
Public debt ratio
Gross domestic product
Biodiversity (global)
Nitrogen surplus (global)
Greenhouse gas emissions (global)
Healthy life years
Further training rate
Underemployment rate
Financial sustainability
Wealth distribution
Net rate of investisment

study 04/20142 0 IddrI
Beyond-GdP indicators: to what end? Lessons learnt from six national experiences
society but supported at the highest government and administrative levels. The years when comple-mentary indicators were presented as marginal in-itiatives are past and these now appear in a grow-ing number of concrete forms, either in regular reports and public consultations or in political de-bates in order to assess government performance.France, however, has not officially adopted any Beyond-GDP indicators and their practical imple-mentation is not currently on the agenda. What needs to be better understood, therefore, is how the “forerunner countries” have managed to move from the discussion stage and civil society projects to the stage of officialising their dashboards and introducing them into their national legislation. What lessons are to be learnt from these national experiences? What differences and similarities ex-ist between these countries? The second part of this report presents the lessons learnt and recom-mendations to inform the debate in France and elsewhere.
3. TEN LESSoNS LEArNT FroM NATioNAL EXPEriENCES
3.1 Beyond-GDP indicators complement rather than replace GDP
All of the initiatives studied here chose to use indi-cators to complement GDP. Today, for the reasons mentioned in the previous section, GDP is still a widely used and useful indicator as it is statisti-cally robust and able to represent what can be shared among the different economic actors of a country. The other arguments for keeping GDP relate to methodology (the fact that a single “GDP substitute” indicator cannot feasibly capture all the complexity of the issues involved) and norma-tive considerations (doubts as to the ability of a single indicator to reflect a plurality of values). For instance, despite the German Study Commission’s internal disagreements, there was nonetheless consensus that replacing GDP by a single alter-native indicator was not an appropriate solution from a methodological point of view and neither would it reflect a plurality of values (Giesselmann et al., 2013).
This preference for complementarity is corrobo-rated by BRAINPOol (2014), as two-thirds of the initiatives it studied are complementary to GDP. The study considers that, since the 2000s, institu-tional initiatives backing the new indicators have insisted on the need for complementary indica-tors. This shift in position is illustrated by the fact
that the name “Beyond GDP” given to the Euro-pean Commission’s 2007 conference was changed two years later to “GDP and Beyond”. The Stiglitz Commission also bolstered this trend as its title combines the notions of economic performance and societal progress (BRAINPOol, 2013a: 80). The impact of the economic crisis is certainly not unrelated to this refocusing on GDP.
If the notion of complementing GDP is a form of pragmatism, it is nonetheless important to bear in mind the normative implications of this stance. Although some view the “Beyond GDP” move-ment as a cultural revolution that can lead to a far-reaching overhaul of our economic and social systems, others consider that GDP is still a highly robust indicator—perhaps even the best one to use for international comparisons. For them, GDP thus needs to be complemented by more precise indicators that inform dimensions not covered by national accounts (BRAINPOol, 2013a: 74).
This stance in favour of complementarity should not prevent GDP from being challenged as the ide-al economic indicator. In fact, GDP itself has blind
Box 1. French Beyond-GDP indicators at regional and district level Although the headway made by Beyond-GDP indicators in France has lagged behind that of other countries, myriad initiatives have emerged at regional and district level. The French regions, partnered by INSEE, have developed the dashboard for the Association of French Regions (ARF). This dashboard includes three (synthetic) headline indicators: the ecological footprint, a human development indicator and a social health indicator, as well as twenty-two more detailed indicators (ARF, 2012). The data needed to measure these indicators are made available to the Regions by the INSEE under an agreement signed by the institute and the ARF. These indicators were used to inform the public debate on various regional development choices (e.g. transport networks and housing, as in the case of the Nord-Pas de Calais region, where a public conference was held). Many studies and regional reports, such as the regional Agenda 21 and annual sustainable development reports, include these indicators (see Laurent, 2012, for a description of the different regional approaches).At district or inter-district level, the use of Beyond-GDP indicators has also progressed over recent years. Two examples of this are the Arras district council and the greater district council of Artois, which have both used the human development indicator to represent living conditions within their jurisdictions. These regional and district initiatives are often based on sub-stantive work by civil society and research networks.1 They do not however enter into the scope of the present study (cf. supra).
1. In parallel to the Stiglitz Commission, and to ensure that the Commission’s work could be followed by the general public, the Forum pour d’Autres Indicateurs de Richesse (Forum for Alternative Wealth Indicators - FAIR) was launched by academics from different disciplines, trades union representatives and members of civil society. In March 2011, FAIR published a book written by diverse contributors, La richesse autrement (FAIR 2011).
Beyond-GDP indicators: to what end? Lessons learnt from six national experiences
stuDy 04/2014 2 1IddrI
spots concerning a good many economic changes (income and wealth distribution or changes to capital stocks for example). m The Beyond-GDP indicators adopted by the fore-
runner countries are positioned as complements to GDP rather than replacements. The choice not to replace GDP must not, however, hide the fact that GDP is far from being the ideal economic indicator, since it does not capture some key eco-nomic issues.
3.2. Beyond-GDP indicators are no longer the preserve of any particular political party…
Although historically it has been the green parties that have voiced the need for alternative indica-tors to complement GDP, the political spectrum of Beyond-GDP advocates is visibly widening. In Wallonia, the initiators of the composite indicator project belonged to the green left, whereas in the United Kingdom the driving force was David Cameron’s conservative right.
Political parties are, however, far from see-ing eye to eye on the nature of indicators. David Cameron’s Conservatives have set great store on subjective indicators based on individual surveys about the quality of life, whereas Wallonia and Wales have adopted dashboards built on more ob-jective indices. These differences may reflect con-trasting conceptions of public action, with more or less importance given to individual assessments (e.g. “Are you happy?) as opposed to collectively defined objective criteria (e.g. infant mortality rate, youth unemployment rate). It should be not-ed that, although the United Kingdom has intro-duced the question “Are you satisfied with your in-come?”, no income or wealth inequality indicator is included in the British Beyond-GDP indicators. On the contrary, the Walloon Beyond-GDP indica-tors backed by the ecologist left and those foreseen by the German Study Commission integrate an ob-jective economic inequality indicator. m The promotion of indicators to complement GDP
is no longer the preserve of any particular politi-cal party. However, political parties do not all ad-vocate the same types of indicators.
3.3. … but this does not mean that Beyond-GDP indicators are disconnected from political strategy
When Beyond-GDP indicators are linked with a political agenda or strategy (i.e. a series of objectives and the means of achieving these), this increases the chances of them being used
effectively. Sustainable development strategies are used by the forerunner countries to justify the implementation of Beyond-GDP indicators. In Wales, Beyond-GDP indicators have been devel-oped to assess progress made in the area of sustain-able development. In Germany, Stefan Bergheim, the director of the Zentrum für gesellschaftlichen Fortschritt (Centre for Societal Progress), insisted on the opportunity offered by the European strategy for sustainable development, “Europe 2020”, to justify the interest of developing Beyond-GDP indicators to be used to evaluate progress made under this strategy.
In other countries, Beyond-GDP indicators have been associated with a specific policy agenda. In the United Kingdom, David Cameron’s liberal-leaning project, “The Big Society”, and the MNWP indicators can be seen as two complementary di-mensions. The Big Society advocates a weaker State, public authorities that are closer to citizens and—in theory—increased resources for local communities. The MNWP indicators with their strong emphasis on individuals and neighbour-hood relationships thus make it possible to follow the progress of the British prime minister’s politi-cal project. The political agenda and the indicators are thus in harmony.
When indicators are associated—be it tightly or loosely—to a particular policy agenda, the ques-tion of their longevity arises. What will happen to the MNWP initiative when David Cameron is no longer in power? Will the Beyond-GDP indicators be abandoned by his successors, who have another vision of society? Evidently, the more consensual agendas or visions (e.g. sustainable development strategies) have more chance of withstanding changes in government, as do the indicators asso-ciated with these visions. This point is highlighted by BRAINPOol, which believes that the main ad-vantage of such strategies would be to make Be-yond-GDP indicators less dependent on political (short-termist) cycles, which are often driven by the legislatures. Yet, the more indicators are tied to consensual visions of the future, the less they disturb our representations of the world and our practices. m Associating Beyond-GDP indicators with a politi-
cal agenda increases the chances of them being used effectively. However, this poses the question of the longevity of such initiatives.

study 04/20142 2 IddrI
Beyond-GdP indicators: to what end? Lessons learnt from six national experiences
3.4. Parliaments and governments have triggered the formalisation of Beyond-GDP indicators in many countries
The ownership of an initiative seems to be a deter-mining factor regarding the ease with which an indicator or specific set of indicators is officially calculated for a country or region. If the initiator of a project for Beyond-GDP indicators is the execu-tive, then it logically has a great deal more power to get the project off the ground.
In the United Kingdom, it was easy for David Cameron, as prime minister, to ensure the imple-mentation of his Measuring National Well-Being programme by the Office for National Statis-tics (ONS), as the latter is the executive office of the UK Statistics Authority, which is itself depend-ent on the government. The fact that the prime minister has referred to the MNWP indicators in several of his speeches has also given them a de-gree of legitimacy.
In the Walloon case, the Minister for Sustain-able Development took advantage of his executive status to introduce the creation of indicators for Wallonia into the Regional Policy Statement. The Government was thus given a real mandate and funds dedicated to the collaborative and consulta-tive research carried out within the Government in partnership with the statistics institute, IWEPS, which has undertaken to publish annually the five indicators chosen for Wallonia.
However, even if the executive is a driving force in implementing the official calculation of Beyond-GDP indicators, the longevity of such initiatives re-lies heavily on statistics institutes in the long run. In Wallonia, for example, the change of majority following the regional elections could impact the funds allocated to the IWEPS for the calculation of these indicators. We should also bear in mind that the executive’s support is not in itself enough to es-tablish the legitimacy of Beyond-GDP indicators. This can only be given a firm footing if the opposi-tion and civil society use the indicators to call the executive to account.
National parliaments have also supported Be-yond-GDP indicators, as in the case of Belgium and Germany. The debates then came up against political constraints. In Belgium, the consensus in the pluralist commission on the indicators un-ravelled as the discussions advanced. In Germany, disagreements within the pluralist Study Com-mission prevented the indicators from being offi-cially adopted. These setbacks have not however put a end to the projects for Beyond-GDP indica-tors: in Belgium, the political majority voted its bill through without support from the opposition
and, in Germany, the indicators have already been developed, even though they have not yet been of-ficially adopted. m The Beyond-GDP indicators have received support
from the highest levels of state in several coun-tries. Support from the executive significantly helps to get the initiative off the ground and en-sure backing from statistics institutes, at least in the short run.
3.5. Statistics institutes have a strategic role
Through their different uses, indicators have considerable political and normative influence. But they are above all statistical tools. This tech-nical aspect means that statistics institutes neces-sarily have a key role in implementing Beyond-GDP indicators and statisticians play an important part in the success or failure of Beyond-GDP indi-cators at two levels.
First, statisticians enjoy a strong power of ini-tiative, as is clearly shown by the Australian case. In the early 2000s, the chief statistician33 of ABS (from 2000 to 2007) set up, alone, a process to integrate measures of progress into Australia’s official statistics. At the time, his position carried sufficient clout to impose this initiative and ensure that it was followed through in practice.
Second, statisticians also play an important role in following up Beyond-GDP initiatives that they have not themselves launched. The British Gov-ernment receives support from the ONS in imple-menting and monitoring the Measuring National Well-being Programme. In Wallonia, on the other hand, even though the IWEPS has been mandated to calculate and publish the five composite indica-tors that complement GDP, some commentators consider that the first publication of the figures re-veals a certain reticence on the part of the Institute towards this type of indicator, indicating potential-ly weak support from the IWEPS for this initiative.
The statisticians’ reticence towards some types of indicators (particularly composite ones) is symptomatic of the specific nature of the Beyond-GDP debate. The main reasons for the reticence towards composite indicators are methodological (lack of robustness, precision, etc.), whereas the reasons why politicians show an interest in them often relate to their symbolic dimension. As a re-sult, two registers of arguments come to clash in the search for new indicators.
In addition, the search for Beyond-GDP in-dicators affords statisticians a prominent role
33. Dennis Trewin

Beyond-GDP indicators: to what end? Lessons learnt from six national experiences
stuDy 04/2014 2 3IddrI
in discussions. Their expertise gives them the necessary credibility for choosing the indica-tors (based on technical arguments), while the choices of methodology underlying the indicator (what it does or does not take into account, the way of counting, the indicator’s accessibility and transparency, etc.) have considerable normative implications.
Discussion platforms bringing together statisti-cians, civil society and elected representatives are often portrayed as necessary to ensure the trans-parency of methodological choices. Such plat-forms were organized in Wallonia or in the United Kingdom (see lesson 8). An open dialogue tends to make it easier for users to subsequently take Beyond-GDP indicators on board. Moreover, in France, a real Innovation department could be cre-ated at INSEE, not only to develop a better match between the statistics produced by institutes and the general public’s expectations, but also to dove-tail the work of INSEE’s different departments more effectively. m The statisticians’ support and involvement in the
start-up phase and in the follow-up and calcula-tion of Beyond-GDP indicators is both important and necessary. Their participation in discussion platforms that bring together experts and lay-men helps to strengthen the legitimacy of the indicators.
3.6. A dashboard with a limited number of indicators combines communicability and statistical robustness
Generally speaking, dashboards are preferable to single-number indicators (synthetic or composite). The major reticence towards using a single-number indicator stems from methodological considera-tions and their normative implications and often come from the statistics institutes themselves, as mentioned in the previous section.
It seems that there is a consensus on using dash-boards as far as balancing ease of communication and statistical robustness is concerned. “One rela-tively consensual position, also favoured in the Stiglitz report, consists of creating a dashboard including a limited number of indicators, which can be easily disaggregated” (BRAINPOoL, 2013a: 8). Thus, in Belgium, the Act of 23 January 2014 underlines the salience of creating a dashboard with as few dimensions as possible. This is also the case for Germany’s W3 indicators. In Wales and Germany, the chosen format was a dashboard with “headline indicators” that synthesise chang-es by broad domain. In the United Kingdom, the dashboard is much more detailed. Australia made
a middle-of-the-road choice involving some thirty synthetic indicators. From the point of view of me-dia uptake, a detailed dashboard cannot compete with GDP. Yet, unlike GDP, it does fulfil a role in evaluating sectoral changes (health, wellbeing, etc.).
However, dashboards do raise a major chal-lenge: what relative importance should users give to the different dimensions represented? How can it be guaranteed that the different dashboard in-dicators receive equal treatment from the media and political spheres? How can a dashboard be interpreted when it translates both positive and negative changes? When the choice is made not to aggregate the different indicators into a single one, public debate will be what determines the rel-ative importance given to each of the dashboard’s dimensions, and the eventuality of one dimension cannibalising the others is not to be ruled out.
It should be noted that in dashboards, subjective indicators are not sidelined. It seems that despite the reluctance observed in the early 2000s towards these indicators, especially in Australia, the im-portance of taking various subjective data into ac-count is increasingly recognised. Thus, in Germa-ny, Belgium and the United Kingdom, subjective dimensions are integrated into the Beyond-GDP indicators. In the UK, the explicit drive behind the MNWP stems from Cameron’s commitment to closer contact with the general public. Subjective indicators are the most appropriate for achieving this objective.
Australia, on the other hand, only takes objective indicators into account. According to the main de-velopers of the Australian Beyond-GDP indicators, there is risk that a subjective wellbeing indicator could monopolise the political debate. Certainly, the assessment of a subjective wellbeing indica-tor could mask deteriorating results for important objective indicators—such as the increase in CO2 emissions—that have no automatic link with sub-jective wellbeing.34 m The dashboard with a limited number of indica-
tors is perceived as a compromise between the
34. “MAP broke the world into dimensions of progress, that, although linked to one another, are discrete: health is conceptually distinguishable from education which is distinguishable from biodiversity, etc. But in this context, happiness is not a separate entity. On the one hand, happiness may be seen as a summation or integrating concept - it depends (to a degree at least) on all the other progress dimensions taken together. On the other hand, happiness may be seen as a superdominant concept - if we were able to judge that happiness had indeed increased, then we might be tempted to assert that there had been progress almost regardless of what had happened in the other dimensions. Thus happiness appears to occupy a different part of the semantic space from our headline dimensions. “ (Trewin & Hall, 2004: 13)

study 04/20142 4 IddrI
Beyond-GdP indicators: to what end? Lessons learnt from six national experiences
potential media role of Beyond-GDP indicators and their statistical robustness. The difficulty is then to guarantee some kind of equality of use be-tween the different dimensions represented.
3.7. A drive to embed Beyond-GDP indicators more firmly in political life
Prosperity indicators, whether new or tradi-tional (like GDP) can be used at different levels in debates and collective decision-making: general public debates, the political arena and administra-tive spheres. Box 2 applies this framework to the case of GDP. m For society as a whole, an indicator makes it pos-
sible to represent the progress made in that soci-ety: it reflects a vision of the world or wealth. For example, when someone refers to the growth experienced by France and other western Eu-ropean countries in the post-war boom years to illustrate what he or she sees as a time of excep-tional progress, we speak of a symbolic use.
m In the political arena, a prosperity indicator makes it possible to propose a strategy for ac-tion, perhaps set objectives and justify policy decisions in light of their effect on this indicator. Prosperity indicators also enable evaluations of government performance. For example, should the media challenge a political figure regard-ing the monthly variations in unemployment or GDP and he or she needs to justify himself or herself on the subject, we refer to a political use of the indicator.
m Finally, the indicators can be used both to craft precise sectoral policies ex-ante (study of how a measure impacts the prosperity indicator, for example) and to implement these policies (use of GDP components to identify which sector must be targeted for action) and evaluate them ex-post. For example, when the French General Directorate of the Treasury evaluates the prob-able impact of a public policy on GDP, we refer to an instrumental use of GDP.
The first thing to point out is that there has been little discussion on the uptake of Beyond-GDP in-dicators by political spheres and on the use that can be made of them. As a member of the Stiglitz Commission admitted, there has been virtually no discussion on the use of these indicators in work-ing groups, which have mainly focused on what form these indicators should take.
However, the forerunner countries have not completely sidelined this fundamental question. The longest-standing official experiences involv-ing Beyond-GDP indicators—in Australia and
Wales—insist on their symbolic power and thus try to reach the general public via reports that enjoy varying degrees of media coverage.
On the other hand, the most recent experiences aim to give Beyond-GDP indicators a more pro-nounced political role. In Belgium, it is planned that the Chamber of Representatives discuss these indicators annually in order to evaluate govern-ment action. In Germany, there are plans to man-date governmental expert groups to officially comment on the indicators on a regular basis. In both countries, not only are Beyond-GDP indica-tors presented as tools for evaluating government performance, but also concrete proposals are now being made to maximise the power of these indi-cators. In the United Kingdom, a team from the Prime Minster’s cabinet is dedicated to monitoring the dashboard indicators and providing a political stepping-stone for ONS-produced statistics.
The intended role (or use) set for Beyond-GDP indicators helps to guide choices of a statistical nature. In this respect, the timescale of the data used to construct an indicator is enlightening. For example, if a “Beyond GDP” indicator showed a change in a country’s average income with a three-year delay, it would be of limited use in the political debate. It could, on the other hand, be mobilised symbolically to show long-term trends. Today, GDP and unemployment data are released each quarter, which means that political staff and the media have up-to-date figures available. Many of the dimensions represented by Beyond-GDP in-dicators (e.g. wellbeing and the environment) do not have such a fine-tuned statistical system as that used for GDP or employment, which means that it is not easy to produce up-to-date indicators. It should be remembered, however, that GDP itself is partly estimated and then corrected after publica-tion, over a period of several years. The same could be done for new indicators: produce estimates that are subsequently duly revised and corrected.
Finally, it could be assumed that the use of Beyond-GDP indicators in the political sphere will only be effective and lasting if they acquire a genuine symbolic power. Along the same line of reasoning, it is conceivable that the instrumental use of Beyond-GDP indicators will develop once they have penetrated the political arena. The three uses should then be seen as complementary and mutually reinforcing. Note that GDP, despite its methodological limitations and inability to cap-ture changes of a purely economic nature, is not dethroned as it retains a relatively strong symbolic legitimacy that gives its political and instrumental use a firm footing. m Three types of uses can be distinguished for Be-
yond-GDP indicators: a symbolic use, when the

Beyond-GDP indicators: to what end? Lessons learnt from six national experiences
stuDy 04/2014 2 5IddrI
indicator is used to represent national progress; a political use, when it is used in the political arena to evaluate government action; and finally an in-strumental use, when the indicators informs the implementation or monitoring of specific public policies. Today, Beyond-GDP indicators are above all used in a symbolic and—increasingly often—political way.
3.8. A consultation process with civil society heightens the symbolic and political power of Beyond-GDP indicators
In the United Kingdom, the NMWP was from the outset built (i.e. the step of choosing the indica-tors) on the basis of a large-scale iterative consul-tation process. In Wallonia, the public were also consulted to help guide the choice of indicators to be taken into account. The Australian Bureau of Statistics also consulted civil society—but at a later stage, as a preselected set of indicators was submitted for assessment by the political sphere, the statistics community and civil society.
These experiences show that consultation and deliberation processes regarding indicators enable a large number of people to think about and inte-grate new (or newly formulated) social questions. They also give greater visibility to the initiatives being debated, showing that indicators are not the exclusive preserve of experts.
In public consultations, indicators may be per-ceived as a catalyst for democracy. Developing the indicators justifies introducing new societal ques-tions into the debate and, if necessary, reframing existing ones. In this respect, indicators are as much an end as a means. Supporters of consulta-tions argue that indicators (and the process of de-veloping them) are a way of opening up the debate and democratising a society’s ultimate goals. Indi-cators can indeed also be seen as an end in them-selves: what is at stake is to develop “good” indi-cators that are likely to best meet the objectives, aspirations and goals under debate. m A consultation process with civil society increases
the symbolic power of Beyond-GDP indicators, strengthens their legitimacy and visibility, while serving as a catalyst for democratic debate.
3.9. A more deeply rooted “instrumental” role to be invented?
To better understand all the possible roles for Beyond-GDP indicators, it is worth recalling the functions now fulfilled by GDP. Beyond its symbolic or political usage, GDP is regularly used
to assess different public policy options ex-ante and ex-post—although this is probably less frequent than one might think (see below). GDP is regularly mobilised to assess the economic impact of budget scenarios, build investment forecasts35 and retrospectively evaluate a given public policy. These types of uses are what we have termed instrumental use.
Beyond-GDP indicators are not used in this way, or at least very rarely: in the UK, the MNWP indi-cators are used to identify problems and develop sectoral policies (on obesity, transport),36 but as yet not to forecast upstream the impact of differ-ent public policy scenarios.
The lack of any theoretical basis for assessing ex ante the impact of a specific public policy on Beyond-GDP indicators represents a significant challenge. According to many analysts, the oppo-site is true for GDP, given that it is based not only on an established accounting system, but also on numerous theoretical and empirical studies de-signed to predict how different policies will affect GDP. O’Donnell et al. (2014) advocate “a new form of cost benefit analysis for public policies”, based not only on monetary gains and losses but also on the impact it has on people’s subjective wellbe-ing, by developing new theoretical frameworks. The OECD is currently developing analyses to gain deeper insights into the impact of public policy on various complementary indicators (OECD, 2013).
It is particularly difficult to firmly embed the in-strumental use of Beyond-GDP indicators as many of these are aggregated indicators. Yet, decompos-ing them may detract from their communicability. Is it possible then to ensure that a given Beyond-GDP indicator has the necessary degree of com-municability to fulfil its symbolic and political role and, at the same time, try to ensure that it plays an instrumental role? Dashboards “with headline indicators” are one response to this problem, as perhaps are “Russian doll” indicators (with multi-ple sub-indicators that are finally aggregated into a single composite indicator).
Finally, it is worth considering the benefits of an instrumental use for Beyond-GDP indicators. For some, these indicators need to fulfil a largely sym-bolic or political role: changing conceptual frame-works and lending credibility to new challenges, without necessarily being used to develop spe-cific policies. The instrumental use of GDP in pol-icy making also needs to be put into perspective:
35. In fact, GDP remains a very effective indicator for preparing budgets or establishing tax revenue forecasts.
36. https://www.gov.uk/government/uploads/system/uploads/attachment_data/file/224910/Wellbeing_Policy_and_Analysis_FINAL.PDF

study 04/20142 6 IddrI
Beyond-GdP indicators: to what end? Lessons learnt from six national experiences
political decisions are often the result of power struggles, communication stunts or compromises between social partners rather than a commitment to optimising GDP growth. Seen from this angle, abandoning an instrumental use for Beyond-GDP indicators does not necessarily mean abandoning their influence on policy trade-offs. m Whereas GDP is used in an instrumental way (es-
pecially for ex ante and ex post evaluation of pub-lic policy impacts), this is not yet the case for Be-yond-GDP indicators. One problem is the lack of a theoretical basis showing the linkages between these indicators and policy measures.
3.10. Beyond-GDP indicators’ slow advance in political spheres needs to be viewed in the light of GDP history
After several decades of work on Beyond-GDP indicators, these indicators are now present at the highest levels of State. But it is clear from this study that these indicators still have a long road ahead and, if they are to integrate a “systemic” theoretical framework, they will need to elbow their way not only into political spheres, but also into the academic world.
It must be remembered that GDP has not always been around and that it also took time to become accepted. It first emerged in a very particular his-torical setting—a specific point in time, when a lobby of academic and political actors considered that developing its use would be highly beneficial. In fact, the current importance of GDP is the result of a long-term dynamic: historically speaking, this indicator became the hub of a system operating during and after the Second World War.
Administering a war economy—followed by the need to steer reconstruction efforts—required a sound knowledge of the different economic sec-tors and changes in their output. But governments at the time did not have a consistent accounting framework to inform them. It was therefore cru-cial for the United States and Europe to design an accounting framework modelled on business accounting (Cassiers & Thiry, 2011)—and which served as the underpinning for GDP.
The focus on GDP as an indicator did not happen overnight. The symbolic and political uses of GDP only gained momentum after the war (Lepenies, 2013). Following the 1930s crisis and the war that plunged populations into deprivation, people as-pired to greater material wellbeing, and this is relatively well reflected by the production index in the form of GDP. During these years, numerous social pacts were agreed on in line with the princi-ple of redistributing the fruits of growth between
employers and workers. It was thus in the interest of all to contribute to GDP growth, since this was what guaranteed social peace. Moreover, during the Cold War, GDP enabled States to compare their economic power—it became an ultimate illustra-tion of a country’s wealth.
So GDP has not always been around. It is a rela-tively recent construct, created in a specific con-text, initially to serve a clearly defined purpose: increase national output to support the war effort and national reconstruction. Moreover, the GDP indicator is constantly evolving, as meetings are held for national accountants to plan how it can be improved. This calls to mind two points. First, our national accounting system is not cast in stone and, second, it is quite normal that Beyond-GDP indicators need time to become embedded in political spheres. It has also been argued that it would be useful to provide statisticians with mul-tidisciplinary training and foster openness to sta-tistics in training for public administrations or the
Box 2. the use of prosperity indicatorsthree levels of representation In Lesson 7, we identified three types of use for Beyond-GDP indicators: symbolic, political and instrumental. Here, we apply these categories to GDP.Despite the many critiques levelled at GDP, many decisions are made on the basis of GDP growth forecasts: structural investments, social secu-rity funding, private investment, individual savings decisions. Economic growth is also still associated in people’s minds with economic stability and employment: although GDP growth no longer adequately reflects posi-tive changes in living conditions, a drop in GDP in the short run correlates relatively well with a rise in the individual’s feeling of malaise (Stevenson & Wolfers, 2008).
Type of use Symbolic Political instrumentalAs applied to
GDPRepresent a
country’s power, wealth, progress
Give credibility/discredit to initiatives
depending on whether they
strengthen/weaken GDP
Evaluation of government
performance by general public
Set precise objectivesEvaluation
of government performance
by the media and political
parties.
Prepare the national budget,
financial forecasts of major
companiesAssess public policy options
using GDP resultsDefine the
contribution of States to
supranational budgets
Calculate the level of public debt
and deficit
Source: Authors of the Lachaize et Morel (2013), Point (2011) and BRAIN-POol (2014).

Beyond-GDP indicators: to what end? Lessons learnt from six national experiences
stuDy 04/2014 2 7IddrI
press industry, as this would facilitate the devel-opment of political and instrumental uses for new indicators.37
m Beyond-GDP indicators’ slow advance in political spheres needs to be viewed in the light of GDP his-tory. Embedding GDP as a symbolic, political and instrumental indicator did not happen in a day. If Beyond-GDP indicators are to become embed-ded in political life, their advocates need to think more about the practical uses they wish to make of them.
4. CoNCLUSioN
The synthesis offered by the Stiglitz-Sen-Fitoussi Commission helped to establish France as an inter-national reference on Beyond-GDP indicators. However, whereas several countries have already officially adopted Beyond-GDP indicators, France is still struggling to hoist this up to a national level. This illustrates the difficult move of Beyond-GDP indicators from research to policy-making.
What lessons can glean countries which did not yet develop Beyond-GDP indicators from experi-ences studied in this report? Beyond-GDP indi-cators are progressing, slowly for sure—after all, GDP was not built in a day—but they are nonethe-less progressing. In particular, efforts are being made to more firmly embed official Beyond-GDP indicators in political life, a dimension whose im-portance is often underestimated. The Belgian Chamber of Representatives may soon be discuss-ing Beyond-GDP indicators on an annual basis, while in Germany a committee of experts will regularly comment on their progress. These Euro-pean initiatives echo the French bill on new wealth indicators.
France can catch up its lag if it adopts a Beyond-GDP indicator (note the many advantages of a dashboard with a limited number of “headline in-dicators” representing social, environmental and economic dimensions) and embeds it into French political life. If the barriers are to be lifted, other countries’ experiences clearly show that: m Statistics institutes hold a key position that can
either impede or, on the contrary, drive Beyond-GDP indicators, as in Australia. In France, one way forward could be to create a real Innovation Department at INSEE, specifically tasked with steering this work.
m Political support at the highest level is clear-ly a major advantage, as evidenced by David
37. For the importance of a multidisciplinary approach in the training curriculum for statisticians, see especially Desrosières (2008).
Cameron in the UK. An interministerial com-mission could be set up not only to provide guidelines for statisticians but also to specify how Beyond-GDP indicators will be used (e.g. parliamentary debates, quarterly publication of Beyond-GDP indicators alongside or in the same document as GDP, etc.).
m Consultation with civil society helps to increase the symbolic and political power of Beyond-GDP indicators by increasing their legitimacy in the eyes of citizens, experts, media and political leaders themselves.
It should be borne in mind that leaders from all political persuasions in other countries have offi-cially adopted Beyond-GDP indicators. Indicators that complement GDP are no longer the preserve of any one political group, although each political group obviously does not envisage the same indi-cators; moreover, the nature of the Beyond-GDP indicators largely determines how they are used and their potential to transform current practices. Developing Beyond-GDP indicators that are asso-ciated with a particular policy agenda also increas-es their chances of being used.
Although the current economic and social crisis is sometimes presented as an opportunity to dis-seminate Beyond-GDP indicators, it often sparks apprehension. If the crisis lingers on, it may en-courage a retreat into the safe haven of the current model and its headline indicators such as GDP. It may also discourage policy makers from taking Beyond-GDP indicators on board for fear of this being perceived as an attempt to switch indicators so as to camouflage weak GDP recovery and high levels of unemployment.
Yet surely, Beyond-GDP indicators constitute an important tool for managing a crisis that is not only economic but also socioeconomic. This cri-sis is visible not only in the short-term changes in GDP growth but also in its impacts on inequality, the health of the most vulnerable, malaise at work, etc. Beyond-GDP indicators not only enable very long-term projections but can also, as of now, help us to better understand the current crisis in all its social, economic and environmental dimensions. They restore meaning to political action by legiti-mising new discourses.
To conclude, we wish to stress the key message of this report. Based on the experiences studied, it is still too early to single out the “best” Beyond-GDP indicator. But one thing is certain: if the promises of Beyond-GDP indicators are to be fulfilled, all stakeholders must now consider how these indi-cators should be used. On this count, pioneering countries are starting to provide us with inspiring examples. ❚

study 04/20142 8 IddrI
Beyond-GdP indicators: to what end? Lessons learnt from six national experiences
REFERENCESAssociation des Régions de France (2012). Développement durable : la révolution des nouveaux indicateurs. Working group report on sustainable development indicators. January 2012, 102p.
Australian Bureau of Statistics (2013). Measuring Australia’s Progress 2013. Is Australia Getting Better?. http://www.abs.gov.au/ausstats/[email protected]/mf/1370.0
BRAINPOoL (2012): Hak Tomas, Janouskova Svatava, Abdallah Saamah, Seaford Charles and Mahony Sorcha (2012). Review report on Beyond GDP indicators: categorisation, intentions and impacts. Brainpool Project (FP7). Deliverable 1.1 October.
BRAINPOoL (2013a): Thiry Géraldine, Bauler Tom, Sébastien Léa, Lacroix Valérie, Paris Sébastien (2013). Indicators Beyond GDP. Characterising Demand: Institutional Analyses and Actors’ Consultation by “Road Show”. Brainpool Project (FP7). Deliverable 1.2. February.
BRAINPOoL (2013b): Seaford, C. (New Economics Foundation), Report on results on action research: barriers to the use of alternative (‘beyond-GDP’) indicators in policy making and how they are being overcome and can be overcome. BRAINPOoL deliverable 3.1. A collaborative project funded by the European Commission under the FP7 programme (Contract no. 283024). New Economics Foundation, 15 November 2013.
BRAINPOol (2014) Final report of the Brainpool project, www.brainpoolproject.eu
CAE-CGEE (2010), Evaluer la performance économique, le bien-être et la soutenabilité, Analysis report by the French Conseil d’Analyse Economique and the German Council of Economic Experts, Franco-German Ministerial Council, December 2010, 230p.
Cassiers, I. (ed.) (2014). Redefining Prosperity. Routledge: London.
Daly, H. (1977). Steady-State Economics, W.H. Freeman and Company: San Francisco.
Demailly, D., Chancel, L., Waisman, H. and Guivarch, C. (2013). “A post-growth society for the 21st century. Does prosperity have to wait for the return of economic growth?”. Study No. 08/13. Iddri: Paris.
Desrosières, A. (2008). L’argument statistique I : Pour une sociologie historique de la quantification. Presses de l’Ecole des Mines, Coll. Sciences Sociales.
Durand, M. (2014). Presentation by Martine Durand at the Iddri Conference “Des indicateurs alternatifs au PIB, pour quoi faire ?”. 14 October 2014.
Eckersley, R. (ed.) (1998). Measuring Progress: Is life getting better?. CSIRO Publishing: Collingwood, Victoria.
FAIR (2011). La richesse autrement. Alternatives Economiques, Hors-Série Poche, No. 48, March 2011.
Gadrey, J. and Jany-Catrice, F. (2005). Les nouveaux indicateurs de richesse, La Découverte: Paris.
Giesselmann, M., Himer, R., Siegel, N.A., and Wagner, G. (2013). Measuring Well-being: W3 Indicators to Complement GDP, DIW Economic Bulletin, May 2013, 11p.
Lachaize, P. and Morel, J. (2013). Les usages du PIB, Vol. 1, Shift Project report, 52p.
Laurent, E. (2012), Vers l’égalité des territoires. Dynamiques, mesures, politiques. Report for the French Ministry of Housing. La documentation Française. http://www.ladocumentationfrancaise.fr/var/storage/rapports-publics/134000131/0000.pdf
Lepenies, P., 2013, Die Macht der Einen Zahl, Berlin: Suhrkamp
Meadows, D., Meadows, D., Randers, J., Behrens, W. (1972). The Limits to Growth. Universe Books: New York.
Méda, D. (1999). Qu’est-ce que la richesse ?, Aubier, Coll. Alto: Paris.
Méda, D., Coutrot, Th. Et Flacher, D. (ed.) (2011). Pour en finir avec ce vieux monde, Utopia: Paris. 276p.
Michaelson, J. (2013). The Use of Sustainable Development Indicators in the Welsh Government, BRAINPOoL Case Study. http://www.brainpoolproject.eu/wp-content/uploads/2014/01/WP3-case-study-Wales.pdf .
Nordhaus, W., Tobin, J. (1973). “Is Growth Obsolete?”, The Measurement of Economics and Social Performance, Studies in Income and Wealth, Vol.38, NBER.
O’Donnell, G., Deaton, A., Durand, M., Halpern, D., Layard, R. (2014). Wellbeing and Policy. Legatum Institute Report.
OECD (2013). National and international initiatives on measuring well-being, progress and sustainable development. OECD Statistics Directorate, April 2013.
Röckstrom, J. and Wikkman, A. (2012). Bankrupting Nature: Denying our Planetary Boundaries, Routledge: New York. 224p.
Stiglitz, J., Sen, A., Fitoussi, J.-P. (2009). Report of the Commission on the Measurement of Economic performance and Social Progress. Commission on the Measurement of Economic performance and Social Progress: France, 292p.
Stevenson B. et J. Wolfers (2008). “Economic Growth and Subjective Well-Being: Reassessing the Easterlin Paradox”. Brookings Papers on Economic Activity, Economic Studies Program, The Brookings Institution, vol. 391 (Spring), pp. 1-102.
Trewin, D. and Hall, J. (2004). Measures of Australia’s Progress. A case Study of a National Report based on Key Economic, Social and Environmental Indicator. Mimeo. www.oecd.org/site/worldforum/33817632.doc
UNDP (1990). Human Development Reoprt. Concept and measurement of human development, Oxford University Presse: New York, Oxford, 189p.
Wallace, J., Schmuecker, K. (2013). Shifting the Dial: From wellbeing measures to policy practices, Carnegie Trust Report, 49p.
Beyond-GDP indicators: to what end? Lessons learnt from six national experiences
stuDy 04/2014 2 9IddrI
APPENDiX
Methodology
Study following on from the BRAINPOoL researchThe substantive contributions of the BRAINPOoL study led us to drill down further into an important question: the extent to which social progress indi-cators are effectively embedded in political action. This is the dimension to which we aim to make a fresh intellectual contribution. Moreover, unlike BRAINPOoL, which covered a broad set of indi-cators, we focus on initiatives that have received official support. We also take into account two countries not covered by the BRAINPOoL study but which seem worthwhile for the French experi-ence: Belgium and Australia.
Five questions for key actorsFor each initiative studied (except Wales), in addition to an analysis of policy, academic and media documents, we also interviewed key actors, government representatives, members of civil society organisations, members of parliament and statisticians:
Germany—Stefan Bergheim, director of the Zentrum für gesellschaftlichen Fortschritt (Centre for Societal Progress), a relatively young think-tank (2009) working on ways to improve the qual-ity of life in Germany.
Australia—Jon Hall: currently head of the UN-DP’s National Human Development Reports Unit, Jon Hall was one of the linchpins of “MAP”, hav-ing served seven years as a statistician with the Australian Bureau of Statistics. Between these two posts, he worked as a statistician for the OECD, where he played a key role, as of 2005, in imple-menting the Global Project on Measuring the Pro-gress of Societies.
Belgium—Cécile Thibaut: senator in the Bel-gian Federal Parliament since 2009 and member of the Senate working group on the new wealth indicators.
Belgium, Wallonia—Geoffroy de Schutter: currently campaign director for Inter-Environne-ment Wallonie, he served as programme director at WWF Belgique, before working for the office of the minister of Sustainable Development for the Walloon region.
United Kingdom—Paul Allin: currently visiting professor at Imperial College London, Paul Allin was director of the Measuring National Well-Being Programme in the ONS. Since his retirement, he is a member of the NMWP advisory committee.
Lisa Ollerhead: Policy adviser to the Cabinet Of-fice, she heads the Well-being Programme’s Analy-sis and Insight team.
We asked our interviewees the following five questions:
1. What types of indicators have been implemented?
2. What are the political conditions that led gov-ernments or national administrations to adopt new indicators?
3. What reasons are advanced for their uptake? More specifically, are these initiatives in opposi-tion to GDP or not?
4. What political and/or technical processes have been used to develop and/or select the indicators?
5. In practical terms, what are administrations or governments doing with the new indicators? What about the role of the media? Are the indica-tors concretely integrated into the policy-making process? (At micro level, for example by systemati-cally integrating them into studies on public policy impacts? At macro level, possibly by releasing GDP figures and a social progress indicator jointly?)

Beyond-GDP indicators: to what end?Lessons learnt from six national experiences
Lucas Chancel (Iddri), Géraldine Thiry (FMSH), Damien Demailly (Iddri)
The Institute for Sustainable Development and International Relations (IDDRI) is a Paris based non-profit policy research institute. Its objective is to develop and share key knowledge and tools for analysing and shedding light on the strategic issues of sustainable development from a global perspective.
Given the rising stakes of the issues posed by climate change and biodiversity loss, IDDRI provides stakeholders with input for their reflection on global governance, and also participates in work on reframing development pathways. A special effort has been made to develop a partnership network with emerging countries to better understand and share various perspectives on sustainable development issues and governance.
For more effective action, IDDRI operates with a network of partners from the private sector, academia, civil society and the public sector, not only in France and Europe but also internationally. As an independent policy research institute, IDDRI mobilises resources and expertise to disseminate the most relevant scientific ideas and research ahead of negotiations and decision-making processes. It applies a crosscutting approach to its work, which focuses on five threads: global governance, climate change, biodiversity, urban fabric, and agriculture.
IDDRI issues a range of own publications. With its Working Papers collection, it quickly circulates texts which are the responsibility of their authors; Policy Briefs summarize the ideas of scientific debates or issues under discussion in international forums and examine controversies; Studies go deeper into a specific topic. IDDRI also develops scientific and editorial partnerships: among others, A Planet for Life. Sustainable Development in Action is the result of collaboration with the French Development Agency (AFD) and The Energy and Resources Institute (TERI), and editorial partnership with Armand Colin for the French edition, Regards sur la Terre.
To learn more on IDDRI’s publications and activities, visit www.iddri.org
Publications available online at: www.iddri.org
m Demailly D., Chancel L., Waisman H., A post-growth society for the 21st century - Does prosperity have to wait for the return of economic growth?, IDDRI, Studies, N°08/13
m Chancel L., Demailly D., Les politiques de l’emploi face à la croissance faible, Iddri, Working papers, N°02/14
m Chancel L., Demailly D., Quels enjeux pour une la protection sociale dans une économie post-croissance, Iddri, Working papers, N°17/13
iDD
ri'
S P
UB
LiC
ATio
NS