End-to-end adaptation scheme for ubiquitous remote experimentation
16
ORIGINAL ARTICLE End-to-end adaptation scheme for ubiquitous remote experimentation Christophe Salzmann Denis Gillet Philippe Mullhaupt Received: 4 December 2006 / Accepted: 8 May 2007 / Published online: 30 October 2007 Ó Springer-Verlag London Limited 2007 Abstract Remote experimentation is an effective e-learning paradigm for supporting hands-on education using laboratory equipment at distance. The current trend is to enable remote experimentation in mobile and ubiquitous learning. In such a context, the remote experimentation software should enable effective telemonitoring and tele- operation, no matter the kind of device used to access the equipment. It should also be sufficiently lenient so as to handle the rapidly evolving wireless and mobile commu- nication environment. While the current Internet bandwidth allows remote experimentation to work flawlessly on fixed connections such as LANs, mobile users suffer from both the versatile nature of wireless communications and the limitation of the mobile devices. These conditions impose that the remote experimentation software should integrate adaptation features. For effective ubiquitous remote experimentation, it should ideally be guaranteed that the information representing the state of the remote equipment is rendered (to the end user) at the same pace at which it has been acquired, yet possibly at the cost of a somewhat minimal time delay between the acquisition and rendering phases. In this respect, an end-to-end adaptation scheme is proposed that explicitly handles the inherent variability of the connection and the versatility of the mobile devices considered in ubiquitous remote experimentation. Instead of relying on a stochastic approach, the proposed adapta- tion scheme relies on a deterministic mass-balance equivalence model. The effectiveness of the proposed adaptation scheme is demonstrated in critical conditions corresponding to remote experimentation carried out using a PDA over a Bluetooth link. Keywords End-to-end adaptation Remote experimentation Wireless communication 1 Introduction and context Remote experimentation is a specific case of real-time interaction for which the interaction is not carried out between two human beings (as it is the case in Video- conferencing or Voice-over-IP) but between a human being (at the client side) and a physical equipment (at the server side, see Fig. 1). Remote experimentation is typically introduced to complement hands-on laboratory sessions in higher edu- cation [1] and to avoid traveling to training centers in distance learning. Robotic and mechatronic systems are often remotely controlled through the Internet [2–5] as they exhibit visually observable dynamical behaviors. In addition, comparison between simulation and actual implementation results is an important element of the educational methodology in robotics, mechatronics and control [6]. As a consequence and without loss of gener- ality, this paper focuses on ubiquitous remote exp- erimentation on mechatronics systems in control education. The different control design and implementation steps taught to students in control courses (system identification, controller design, performance validation, etc.) can be effi- ciently carried out remotely on mechatronic systems provided that special care is taken on key issues. The most challenging issue with mechatronic systems is the pace at which the information needs to be updated so that the distant C. Salzmann (&) D. Gillet P. Mullhaupt Laboratoire d’automatique, Ecole Polytechnique Fe ´de ´rale de Lausanne, Lausanne, Switzerland e-mail: christophe.salzmann@epfl.ch 123 Pers Ubiquit Comput (2009) 13:181–196 DOI 10.1007/s00779-007-0184-x
-
Upload
independent -
Category
Documents
-
view
1 -
download
0
Transcript of End-to-end adaptation scheme for ubiquitous remote experimentation

ORIGINAL ARTICLE
End-to-end adaptation scheme for ubiquitous remoteexperimentation
Christophe Salzmann Æ Denis Gillet ÆPhilippe Mullhaupt
Received: 4 December 2006 / Accepted: 8 May 2007 / Published online: 30 October 2007
� Springer-Verlag London Limited 2007
Abstract Remote experimentation is an effective
e-learning paradigm for supporting hands-on education
using laboratory equipment at distance. The current trend is
to enable remote experimentation in mobile and ubiquitous
learning. In such a context, the remote experimentation
software should enable effective telemonitoring and tele-
operation, no matter the kind of device used to access the
equipment. It should also be sufficiently lenient so as to
handle the rapidly evolving wireless and mobile commu-
nication environment. While the current Internet bandwidth
allows remote experimentation to work flawlessly on fixed
connections such as LANs, mobile users suffer from both
the versatile nature of wireless communications and the
limitation of the mobile devices. These conditions impose
that the remote experimentation software should integrate
adaptation features. For effective ubiquitous remote
experimentation, it should ideally be guaranteed that the
information representing the state of the remote equipment
is rendered (to the end user) at the same pace at which it
has been acquired, yet possibly at the cost of a somewhat
minimal time delay between the acquisition and rendering
phases. In this respect, an end-to-end adaptation scheme is
proposed that explicitly handles the inherent variability of
the connection and the versatility of the mobile devices
considered in ubiquitous remote experimentation. Instead
of relying on a stochastic approach, the proposed adapta-
tion scheme relies on a deterministic mass-balance
equivalence model. The effectiveness of the proposed
adaptation scheme is demonstrated in critical conditions
corresponding to remote experimentation carried out using
a PDA over a Bluetooth link.
Keywords End-to-end adaptation �Remote experimentation � Wireless communication
1 Introduction and context
Remote experimentation is a specific case of real-time
interaction for which the interaction is not carried out
between two human beings (as it is the case in Video-
conferencing or Voice-over-IP) but between a human being
(at the client side) and a physical equipment (at the server
side, see Fig. 1).
Remote experimentation is typically introduced to
complement hands-on laboratory sessions in higher edu-
cation [1] and to avoid traveling to training centers in
distance learning. Robotic and mechatronic systems are
often remotely controlled through the Internet [2–5] as
they exhibit visually observable dynamical behaviors.
In addition, comparison between simulation and actual
implementation results is an important element of the
educational methodology in robotics, mechatronics and
control [6]. As a consequence and without loss of gener-
ality, this paper focuses on ubiquitous remote exp-
erimentation on mechatronics systems in control education.
The different control design and implementation steps
taught to students in control courses (system identification,
controller design, performance validation, etc.) can be effi-
ciently carried out remotely on mechatronic systems
provided that special care is taken on key issues. The most
challenging issue with mechatronic systems is the pace at
which the information needs to be updated so that the distant
C. Salzmann (&) � D. Gillet � P. Mullhaupt
Laboratoire d’automatique,
Ecole Polytechnique
Federale de Lausanne, Lausanne, Switzerland
e-mail: [email protected]
123
Pers Ubiquit Comput (2009) 13:181–196
DOI 10.1007/s00779-007-0184-x

user perceives correctly the dynamics of the equipment (i.e.
the displacement of the moving parts). Compared to other
systems that may require offline analysis such as chemical
systems, many real-time measurements (such as position,
speed, acceleration, etc.) are easily available on mechatronic
systems. This information is to be played back at the client
side in a timely manner so as to help the student to soundly
perceive the physical equipment and its dynamics. The
information representing the state of the distant equipment is
generally available in the form of a video stream and an
oscilloscope window displaying the measurement data
acquired on the equipment. Additional synthetic represen-
tation combining two sources of information such as an
augmented reality can also be provided. It implies tight time
synchronization between the different streams of informa-
tion. Measurement data acquired on the equipment can also
be interpreted and rendered using other means, for instance
force feedback or audio signal. Notice that the most chal-
lenging aspect of mechatronic systems is the intrinsic time
constant of the phenomenon to be observed that is generally
of the same order of magnitude as the transmission time in
remote experimentation. The particular nature of the physi-
cal equipment, as opposed to a human being, imposes
specific constrains and requires dedicated solutions [7, 8].
This paper focuses on ubiquitous remote experimentation
solutions that have strong real-time constraints due to both
the transmission channel characteristics and versatility, as
well as the physical equipment dynamics.
The objective of a ubiquitous remote experimentation
solution is to make the student interaction with the distant
system as close as possible to the actual work on the real
equipment. In other words, the best possible feedback to a
user action has to be provided such that it limits the
inherent drawbacks stemming from the distance separating
a user at the client side from the operated physical equip-
ment at the server side (Fig. 1).
This distance generates two undesirable effects, namely
(1) the transmission delay for the information to travel
from one end to the other and back, and (2) the difficulty to
reproduce (at the client side) the state of the distant
equipment together with its dynamics and operating
conditions.
An efficient remote experimentation solution should not
only maximize the user experience, but also adapt, in real-
time, to the underlying end-to-end infrastructure. This
should be undertaken by adapting the information trans-
mission to the characteristics of the various components
found along the information path, including not only the
end-to-end transmission link but also the client and the
server considered at the application level.
Working at the application level allows taking advan-
tage of the knowledge concerning the semantic content of
the transmitted information. The underlying levels such as
the transmission one (i.e. TCP) only deal with bytes of data
and thus may not behave appropriately when, for example,
some information has to be discarded.
In order to be available on a wide range of applications
and platforms, ubiquitous remote experimentation solu-
tions should be implemented using available technologies.
They should also adapt and take advantage of new stan-
dards while following the Internet best practice [9, 10].
While it can be assumed that the server application/
equipment is known before hand, this is not true for the
client application/device. Thus, relevant technology and
protocols that are available at the client side are to be
selected to transmit information. As a consequence, the
adaptation scheme has to be independent of the underlying
protocols and infrastructure used to acquire, transfer and
play back the information.
Therefore, a novel end-to-end adaptation scheme is
proposed that satisfy the above ubiquitous remote-experi-
mentation requirements to ensure that the distant user gets
the best possible feedback given both the available infra-
structure and the working conditions.
The paper is organized as follows. First, in Sect. 2, the user
requirements in ubiquitous remote experimentation are
asserted through a dedicated definition of Quality of Service
(QoS). Then, in Sect. 3, the end-to-end abstractions of the
considered infrastructure observed at the application level is
presented. It includes the communication link together with
both the server and the client devices. Section 4 describes the
metrics used to compensate the lack of a direct sensor for
estimating the defined QoS. Section 5 presents the end-to-
end adaptation scheme used to enforce the given QoS. The
validation of this scheme is finally presented in Sect. 6
together with a real-world mobile setup introduced for
hands-on experimentation in engineering education.
2 Quality of Service for remote experimentation
The QoS defines the level of satisfaction, usability or
efficiency for a given service, requirement or solution. The
Client
User
Server
Physicalsystem
Information
Interaction loop
path
Fig. 1 Typical remote experimentation configuration for the control
of phyiscal system
182 Pers Ubiquit Comput (2009) 13:181–196
123

QoS is highly dependent on the application context it is
defined for. Different applications have different require-
ments that translate into different definitions for the QoS
[11, 12]. For example, at the network transmission level,
throughput and latency would define the QoS for Web
surfing, while the packet jitter and packet delay would be
relevant for voice (VoIP) transmission [13].
The QoS can be defined at various levels [14]. For
example, at the end-user level the QoS maps some sub-
jective features like immersion, presence and comfort to
measurable values. At the physical layer level, the QoS
describes characteristics such as the bit error rate for a
transmission link [15]. At the application level, the Web
service QoS requirements define availability, accessibility,
integrity, performance (measured in terms of throughput
and latency), reliability, regularity and security [16]. This
differs from the above QoS defined for Web performances
at the network level. Network-centric and end-system
centric QoS definitions for video delivery over wireless
Internet are presented in [17].
The QoS is often confused or amalgamated with the
QoS enforcement mechanisms. The QoS enforcement
mechanisms are numerous. Each QoS specification may
lead to many enforcement mechanisms.
Remote experimentation requires a specific QoS to
characterize the suitability of the feedback provided to the
distant user. Three key conditions that need to be satisfied
at the application level so as to provide a suitable user
experience in the context of hands-on engineering educa-
tion were identified through laboratory sessions analysis
and users surveys [18–20]. These conditions are: (1) the
level of interaction which represents how quickly a feed-
back is provided to the user should be high enough; (2) the
system dynamic rendering which represents how accurately
in time the behavior of the remote system is perceived
should be accurate enough; (3) the amount of semantic
content that represents how well the distant equipment state
and conditions of operation can be perceived by the client
should be rich enough. The three conditions are now
detailed.
The level of interaction can be characterized by the
delay observed between the time at which an action is
performed and the time at which its effect can be perceived
by the user. The delay represents the information round-trip
time measured at the application level. This delay is a
function of many factors, especially buffers that are found
along the path taken by the information. For a valuable user
experience, this delay should be as small as possible; small
being defined in accordance with the dynamics of the
distant equipment. This constraint is one of the main dif-
ferences between remote experimentation and other real-
time applications such as video-streaming. Human eyes
will notice a delay larger than 50 ms [21], similarly a delay
larger than 200 ms is noticeable in audio transmission [22].
While these values express minimum values, a delay
smaller than a second is noticeable by the user, albeit
acceptable since it is short enough to avoid any inappro-
priate sensorimotor reaction from the user [23].
The dynamics of the distant system needs to be per-
ceived at the client side. This implies that both the
acquisition and the rendering paces should be adequate and
equal. If the pace at which the server acquires the infor-
mation is not adequate, the user might get a biased or
wrong perception of the actual dynamical behavior of the
distant system. Similarly, the pace at which the information
is perceived by the user at the client side should be ade-
quate (a wheel rotation at a constant speed should be
perceived as such remotely). The rendering pace can be
altered by the jitter introduced by the non-deterministic
nature of the transmitting channel (i.e. the wired or wireless
Internet). In multimedia applications, buffering techniques
are traditionally used at the client side to smooth the jitter
when playing the information back [24]. Such buffers add
delay to the transmission and therefore should not be
considered since they depreciate the user perception level
necessary for effective remote experimentation.
The semantic content has to be rich enough to allow the
perception of the state and the conditions of operation.
There are various sources of information that can be used
to provide this information. Video streams, images, sounds,
force-feedback, virtual-reality representation or data his-
tory displayed in an oscilloscope-like window can be used
for that purpose. For a given type of representation, how-
ever, the higher the quality of the sent information, the
better the perception of the state is. For instance, a good
quality color picture, bigger in size, is more informative
than a low quality, black and white image, smaller in size.
Measuring the quality of the perception automatically is a
very challenging operation [25–27]. Therefore, we assume
from now on that the quantity (size) of transmitted infor-
mation reflects the quality of the semantic content that
needs to be maximized.
3 End-to-end model
The objective of the end-to-end model is to describe the
remote-experimentation underlying infrastructure in a
suitable manner. It should be sufficiently accurate for
implementing the end-to-end adaptation scheme. Tradi-
tionally, end-to-end (E2E) approaches used to ensure
fairness in the transmission by only considering the net-
work path between the two hosts [28]. The end-to-end
infrastructure, which includes (to some extent) the client
and the server applications, has also been considered by
others [29]. An end-to-end infrastructure that incorporates
Pers Ubiquit Comput (2009) 13:181–196 183
123
both the coder/decoder (for video streaming) and an end-
to-end buffer-management mechanism is presented in [30].
Similarly, [31] proposed a variable frame-rate encoding for
video streaming. The authors in [17] consider the end-to-
end structure over wireless link for video transmission.
Our proposed adaptation scheme for remote experi-
mentation considers the infrastructure as a whole. It
encompasses both the client and the server applications/
devices. This guarantees that the QoS characterization
correctly reflects the whole infrastructure ability (or
inability) to handle the flow of transmitted information.
Nowadays and especially in an ubiquitous context, the
client application/device may be the limiting factor in the
information transmission chain. Therefore, it needs to be
properly considered [32]. For example, a PDA device
may not be able to handle (decode/render) more than 4
images per second, while the server may deliver 10
frames per second over the connection link. Also, on the
same device, it is possible to consider two applications
performing similar tasks but written in different lan-
guages, one compiled and the other interpreted, which
results in a significant difference when comparing the
execution time. Similarly, at the server side, the infor-
mation encoding using temporal compression such as in
MPEG, where more than one sample of information is
required, may add delay that needs to be considered [33].
For example, the encoding of a 15 frame per second
video stream with a temporal compression that needs to
process 5 frames at a time adds a delay of 1/3 of a
second, which is in the same order of magnitude as the
transport delay for a transatlantic Internet connection
(ping typically shows about 20 hops).
The proposed representation of the E2E information
transmission path includes three components abstracted
from the various elements found at the client, the server
and the network levels. The transmitted information is also
abstracted in semantic units called blocks as defined in
Sect. 3.2. The abstraction is necessary to build a model
which is independent of the actual implementation of the
various elements but which capture the relevant features of
the underlying versatile infrastructure.
3.1 Components abstraction
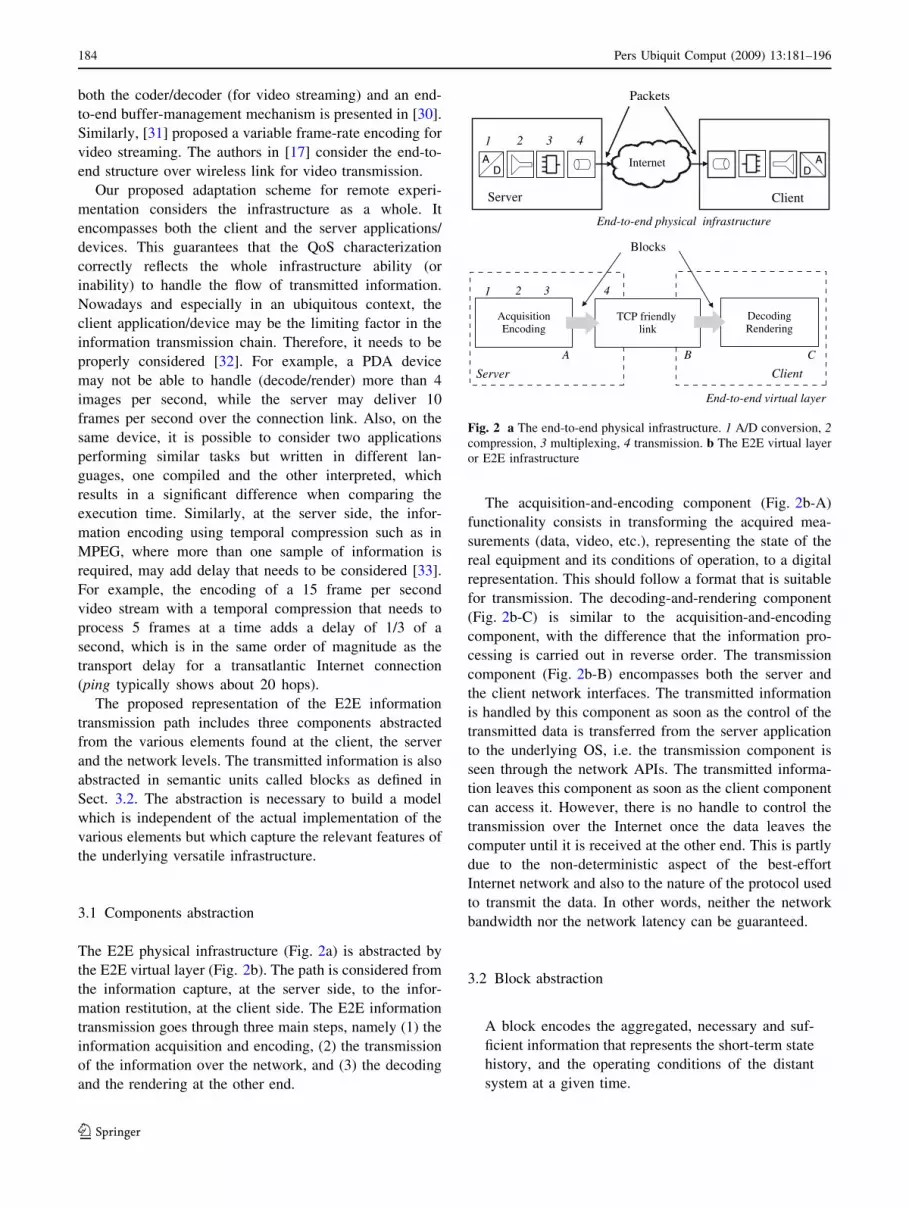
The E2E physical infrastructure (Fig. 2a) is abstracted by
the E2E virtual layer (Fig. 2b). The path is considered from
the information capture, at the server side, to the infor-
mation restitution, at the client side. The E2E information
transmission goes through three main steps, namely (1) the
information acquisition and encoding, (2) the transmission
of the information over the network, and (3) the decoding
and the rendering at the other end.
The acquisition-and-encoding component (Fig. 2b-A)
functionality consists in transforming the acquired mea-
surements (data, video, etc.), representing the state of the
real equipment and its conditions of operation, to a digital
representation. This should follow a format that is suitable
for transmission. The decoding-and-rendering component
(Fig. 2b-C) is similar to the acquisition-and-encoding
component, with the difference that the information pro-
cessing is carried out in reverse order. The transmission
component (Fig. 2b-B) encompasses both the server and
the client network interfaces. The transmitted information
is handled by this component as soon as the control of the
transmitted data is transferred from the server application
to the underlying OS, i.e. the transmission component is
seen through the network APIs. The transmitted informa-
tion leaves this component as soon as the client component
can access it. However, there is no handle to control the
transmission over the Internet once the data leaves the
computer until it is received at the other end. This is partly
due to the non-deterministic aspect of the best-effort
Internet network and also to the nature of the protocol used
to transmit the data. In other words, neither the network
bandwidth nor the network latency can be guaranteed.
3.2 Block abstraction
A block encodes the aggregated, necessary and suf-
ficient information that represents the short-term state
history, and the operating conditions of the distant
system at a given time.
InternetAD
AD
Server Client
Internet
Packets
1 432
End-to-end physical infrastructure
DecodingRendering
AcquisitionEncoding
End-to-end virtual layer
Server Client
Blocks
TCP friendly link
1 43
A B C
2
Fig. 2 a The end-to-end physical infrastructure. 1 A/D conversion, 2compression, 3 multiplexing, 4 transmission. b The E2E virtual layer
or E2E infrastructure
184 Pers Ubiquit Comput (2009) 13:181–196
123

A block of index k is similar to a snapshot that captures
the information regarding the physical system at a given
time TS(k) (Fig. 3). A block is the basic unit of information
of size S(k) and duration D(k) having a semantic meaning
for the user. For example, a block could be made of a video
image combined with measurements acquired concur-
rently. The successive blocks form the information stream.
A block is not to be confused with packets, which are
smaller data units transmitted over the network and han-
dled by the network devices (routers) and by the
communication protocols.
Once created, the block is processed (encoded) and
passed on to the transmission component for its transfer
to the client component. The block transmission, from
the server to the client, is performed within the trans-
mission component. At time TB(k), the block k starts to
be processed (decoded and rendered) by the client
component. Then, at time TC(k), the block k is presented
to the user. At the same time TC(k), the user perception
measurements of the block k-1 are performed and sent
back to the server. This acknowledgment is processed by
the server at the time TA(k). The block round-trip time
measured at the application level d(k) is the time dif-
ference between TA(k) and TS(k). The information
contained in the block k is perceived by the user from
the time TC(k) for a duration P(k). The time interval in-
between block perception at the client side P(k) should
be equal to the time interval in-between block creation at
the server side D(k). If this is not the case, either the
client component or the sever component (or even both)
should modify their behavior so as to compensate for
this variation.
During the transmission over the Internet, the block
might be split into packets.
4 Metrics for measuring the QoS for remote
experimentation
There is no direct sensor for the proposed QoS. Thus,
metrics need to be defined to measure the QoS using the
available information. Measurements relative to blocks
performed at both the client and the server sides provide
the needed information to define metrics that reflect the
E2E infrastructure ability to handle the flow of information.
Metrics are estimated at the application level in order to
capture the characteristics of the whole E2E infrastructure.
The three proposed metrics detailed in the next sections
are:
(1) s(k) for the block periods ratio
(2) e(k) for the block sizes ratio
(3) d(k) for the E2E round-trip time
4.1 Block round-trip time, d metrics
The block round-trip time d(k) (related to the block k)
represents the time taken for this block to be suc-
cessfully acquired, transmitted, rendered at the client
side, and then acknowledged at the server side. The
user perception time P(k) for the block k is not part of
the block round-trip time (Fig. 3).
The block round-trip time can be written as
dðkÞ ¼ TAðkÞ � TSðkÞ ð1Þ
The d metrics ranges from 0 to infinity, d should be as
small as possible. Values smaller than 1 s provide an
adequate feedback to the user and can be expected from
today’s remote experimentation solutions. With d [ 1 s,
the delay becomes annoying from a sensorimotor point of
view. Users may consider that their request has not been
properly handled and repeat their initial action.
The level of interaction can be directly measured by the
block round-trip time d. This measurement takes into
account not only the time for the block to transit from the
server to the client but also the processing time at both the
client and the server applications. Many factors can
increase the block round-trip time. Some are controllable,
such as the buffers at the server and the client side; some
others, like the intrinsic Internet connection round-trip
time, cannot be controlled.
Block acknowledgments, measured at the application
level, are different from network packets acknowledg-
ments, measured at the network layer level.
In the forthcoming definitions, processing and trans-
mission times are referenced as durations instead of periods
information stream
server side
client side
block k
acknowlegment
block k
block k-1
D(k)
P(k-1) P(k)
decodingrendering
Ts(k)Ts(k-1) TA(k)
d(k)
t
t
Tc(k)
TB (k)
Tc(k+1)
acquisition
perception
encoding
transmission
Fig. 3 Block time instants definitions
Pers Ubiquit Comput (2009) 13:181–196 185
123

(periods usually mean regularity) as they are supposed to be
modified continuously through the adaptation mechanism.
4.2 Block duration ratio, s metrics
The block-duration ratio s(k) related to the block k is
the ratio between the duration of the block perception
P(k) measured at the client side and the block dura-
tion D(k) defined at the server side (Fig. 3).
The block duration ratio can be written as
sðkÞ ¼ DðkÞPðkÞ ð2Þ
The s metrics indicates whether the pace (at which the
blocks are created) can be successfully handled by the E2E
layer. The expected value is 1, indicating that the E2E layer
can successfully handle the chosen block pace.
A value for s[ 1 indicates that the duration of the user
perception P(k) measured at the client side is greater than
the block duration D(k). Thus, the block duration defined
during the acquisition cannot be handled by the E2E layer.
The case where s\ 1 indicates that the blocks are per-
ceived by the user at a pace higher than the one at which
they have been produced. This is only possible when the
blocks are first hindered or stored for some amount of time
and then sent at a faster pace.
4.2.1 Block size ratio, e metrics
The block size ratio e(k) related to the block k is the
ratio between the successfully rendered block size
SC(k) and the original block size S(k) (Fig. 3).
The block size ratio can be written as
eðkÞ ¼ SCðkÞSðkÞ ð3Þ
The e metrics indicates if the E2E layer can successfully
handle the chosen block size. If e \ 1 part of the block was
lost along the E2E transmission path either during the net-
work transmission or at the client side if the client application
cannot handle the incoming flow. The underlying network
protocol can guarantee whether or not the packets are
delivered. In the former case, such as in TCP, it can be
assumed that the block size ratio is always 1 provided that the
client communication component waits long enough to
receive the complete block and that the client application has
enough resources to process the received block. In the latter
case, without guaranteed delivery, such as in UDP, infor-
mation can be lost during the transmission. An information
loss can either be due to a transmission problem, a lack of
resource in the client application, or a client application
deadline enforcing mechanism that stops the current block
rendering when a new block becomes available.
Various measures can be taken by the client application
when the current block cannot be fully handled by the E2E
infrastructure. On client devices with limited resources
such as PDA, the metrics are simply sent back to the server.
The server takes care of adapting the block characteristics
without the help of the client component to compensate for
the deficient block handling, thus compensating the lack of
resource/feature on the client device. This adaptation
scheme is described in the next section.
The above metrics definitions used to estimate the
remote experimentation QoS are somehow analogous to
the measurements defining the QoS in the context of net-
work transmission that is generally defined by a
combination of bandwidth, throughput, packets jitter,
packet delays and packet loss. Besides working at different
abstraction level, the main difference lies in the implicit
relation to the E2E infrastructure ability to sustain the
incoming flow of information. The packet jitter could be
compared to the block period ratio, the former giving an
absolute measurement and the latter informing about the
relative adequation between the generated and the per-
ceived block pace. The block size ratio is analogous to the
packet loss, the former being relative to the original block
size. The quotient of the block size by the block duration
defines a throughput at the application level that is analo-
gous to the throughput at the network level. This
comparison only holds if the E2E infrastructure is insen-
sitive to the fact that the throughput is a ratio. This means
that, any of the block size/duration pairs giving identical
throughput would be handled similarly by the E2E infra-
structure. While this conjecture can be assumed true in the
case of network transmission, at the application level, the
E2E infrastructure is nevertheless sensitive to the block
size and duration, and therefore this would not hold.
The proposed metrics combined with the block defini-
tion are sufficient to fully characterize the E2E
infrastructure, this independently of the chosen transmis-
sion protocol or transmission infrastructure.
5 End-to-end adaptation
The end-to-end adaptation scheme is meant to permit the
user to appropriately perceive at distance the dynamics and
the state of the physical equipment in a timely manner by
providing the user with a QoS suitable for remote
experimentation.
The end-to-end adaptation scheme is devised in two
steps. First an equivalent mathematical representation for
186 Pers Ubiquit Comput (2009) 13:181–196
123

the E2E infrastructure and a model for the end-to-end block
round-trip time are defined. Then, based on this model, a
adaptation scheme is developed to track a given reference
value for the block round-trip time and to adapt, in real-
time, to the E2E infrastructure and to its variations.
The proposed adaptation scheme is developed to effi-
ciently enforce the desired QoS and to maximize the use of
the E2E infrastructure. The model is deterministic and
based on a mass-balance conservation equivalence, which
is also widely used in the process control community.
Stochastic models are avoided, even though they are
extensively studied in the network communication com-
munity. These models generally consider the E2E
transmission at the network level without capturing the
client and server behaviors at the application level [34, 35].
Moreover, they generally rely on measurements (TCP stack
info, sshtresh, rtt, etc.) that are not ubiquitously available at
the application level [36, 37].
By considering block as described previously, it is
possible to work at a higher abstraction level. This allows
the construction of a model for E2E adaptation. The pro-
posed metrics are used to identify the model parameters
and to adapt, in real-time, the sending behavior.
5.1 E2E equivalent mathematical representations
End-to-end equivalent mathematical representations that
characterize the E2E layer at a macroscopic level are used
to build an E2E model suitable for adaptation. This
equivalent mathematical model is defined by three com-
ponents, namely an equivalent buffer, an equivalent delay,
and an equivalent bandwidth.
The equivalent E2E buffer emulates all the buffers
located along the E2E path. It includes buffers found in the
following three components—transmission, client, and
server. The transmission-component equivalent buffer is
made of the routers found along network links. Since the
transmission link is perceived by the transmission com-
ponent through the network APIs, a buffer related to the
chosen transmission protocol might also be present (i.e. for
TCP [38]). Buffers found in the client and the server
components can be the result of synchronization mecha-
nisms [22], or due to internal queues (i.e. routers queues
policy). Whilst the client and server component buffers can
easily be controlled or even cancelled, the equivalent
buffers for the protocol and network are out of the E2E
applications direct control. The only alternative is to refrain
from sending additional blocks in order not to increase the
buffer content. The FIFO policy observed by buffers
enforces that all the remaining blocks, or part of them,
found in the equivalent E2E buffer are to be emptied before
the current block can be processed. The resulting effect is
an added delay that degrades the interaction and should
therefore be avoided. Ideally, this equivalent E2E buffer is
empty, so that no time is spent to send the remaining
information found in the buffer prior to the current data.
The E2E equivalent bandwidth encompasses the overall
infrastructure. This is different from the network available
bandwidth [39, 40] that considers only the transmission
links. The E2E bandwidth Be(k) that can be used is the
minimum of the bandwidth of the various components
including the server bandwidth (BS), the client bandwidth
(BC), and the network bandwidth (BN).
Be ¼ minðBS; BC; BNÞ ð4Þ
The block E2E equivalent propagation delay C(k) repre-
sents the time for the block k to actually transit from one
end to the other. It is the sum of all the propagation delays
found in the E2E transmission. It cannot be avoided, thus
every block, whatever its size, has to undergo a duration of
C(k).
The propagation delays found in the server and in the
client components are also included within C(k). The
delays representing the steady state value of the time spent
within the buffers are also incorporated in C(k). Also
included in C(k) is the time for the block acknowledgment
to go from the client back to the server (see Fig. 3).
The longer the propagation delay C(k), the bigger the
number of blocks in transit. Similarly to the propagation
delay C(k), the larger the E2E bandwidth Be(k), the bigger
the number of blocks in transit.
5.2 Model for the E2E round-trip time
Based on the above equivalent E2E representations, a
model for the end-to-end block round-trip time d is pro-
posed. This model is used for two purposes. First, it permits
to develop an adaptation scheme, that efficiently tracks the
block round-trip d and that handles, in real-time, the E2E
infrastructure variations. Second, the model is used to find
a reference value that maximizes the use of the E2E
infrastructure.
The model for the round-trip time is composed of a fixed
part, the equivalent E2E propagation delay and a variable
part represented by the time spent in the equivalent E2E
buffer.
The following assumptions are made.
• The equivalent propagation delay C(k) is constant.1
• The equivalent bandwidth Be(k) is constant,1 i.e. the
blocks are ‘‘traveling’’ within the E2E infrastructure
using the same constant bandwidth Be.
1 Otherwise varies slowly comparing to the adaptation time scale.
Pers Ubiquit Comput (2009) 13:181–196 187
123

• The TCP protocol is used for the transmission, thus there is
no loss during the E2E transmission. In other words, blocks
are fully received and perceived by the user, i.e. e = 1.
• The capacity of the equivalent buffer is unlimited, but it
cannot be negative.
• We consider that the equipment dynamics will not
change during the time of the experiment. As a
consequence, the pace at which the state of the distant
equipment should be and is captured remains constant.
In other words, the block duration D remains constant.
Hence, only the block size S(k) is to be modified by the
adaptation mechanism.
Figure 4 represents a snapshot of the E2E infrastructure
used to describe the model for block round-trip time using
the mass-balance equivalence. On the left, the server pro-
cess generates blocks that are passed to the E2E buffer. The
server throughput is chosen such that the quantity of
information S(k) is fed into the equivalent buffer during a
time D. If this is not the case, a block can be partially
stored in the E2E buffer. Then, the E2E process extracts
blocks from the buffer and transfers them to the other end
of the equivalent pipe. The block exits the infrastructure
when the server has processed the acknowledgment. The
length of the pipe represents the propagation delay and
the time for the last block to exit the E2E infrastructure.
The time spent in the buffer has to be added to the time
spent in the pipe to get the block round-trip time.
On the right of the pipe, the block k - r exits the E2E
infrastructure. The number of blocks in transit in the E2E
infrastructure is represented by r. It takes a time T(k - r)
for the block k - r (of size S(k - r)) to fully exit the E2E
infrastructure using the available bandwidth Be. T(k - r) is
defined by
Tðk � rÞ ¼ Sðk � rÞBe
ð5Þ
During its transit within the E2E infrastructure, the block
k - r spends time in three locations, namely, the time
spent in the equivalent E2E buffer, the block propagation
delay, and the time T(k - r) for the block to exit the E2E
infrastructure.
The time spent in the E2E buffer is function of the
amount of data R(k - r) that was previously stored in this
buffer. If the E2E buffer is empty, i.e. R(k - r) = 0, no
time is spent in the buffer. If there are remaining data in the
buffer, i.e. R(k - r) [ 0, the time spent in the buffer is
given by the ratio between the buffer size R(k - r) and the
constant bandwidth Be. This bandwidth is identical to the
bandwidth used by the E2E block extracting process.
The block propagation delay C is constant. As stated
earlier, the time for the acknowledgment to come back to
the server is included within the propagation delay.
Therefore, the block round-trip time d(k - r), which is
equivalent to the time for the block k-r to transit within the
E2E infrastructure, is given by
dðk � rÞ ¼ Rðk � rÞBe
þ C þ Tðk � rÞ ð6Þ
The dynamics of the E2E buffer are given by the previous
buffer state and by the balance between the amount of data
that exits the buffer and enters the buffer during the same
period. The buffer is considered during the period T(k - r)
defined by the time for the block k-r to exit the E2E
infrastructure. According to the definition (4), the amount
of data that exits the buffer during the time T(k - r) is
S(k - r).
During the same time T(k - r), blocks or a fraction of a
block enter the E2E buffer (see the right part of Fig. 4).
Given the bandwidth Be, the fraction of a block that enters
the E2E infrastructure during the time T(k - r) is defined
by the time ratio between T(k - r) and the constant block
duration D. The state evolution of the E2E buffer without
the buffer saturation, R*(k), is given by
R�ðk þ 1Þ|fflfflfflfflfflffl{zfflfflfflfflfflffl}
newstate
¼ R�ðkÞ|fflffl{zfflffl}
oldstate
þ SðkÞTðk � rÞD
|fflfflfflfflfflfflfflfflffl{zfflfflfflfflfflfflfflfflffl}
enter
� Sðk � rÞ|fflfflfflffl{zfflfflfflffl}
exit
ð7Þ
Shifting everything by r and replacing T(k - r) in (7) by its
definition (4) gives
R�ðk�r + 1Þ¼R�ðk�rÞþSðk�rÞSðk�2rÞBeD
�Sðk�2rÞ
ð8Þ
The E2E buffer obviously cannot have a negative value,
thus (8) becomes
Rðk � r þ 1Þ ¼ max 0;R�ðk � r þ 1)½ � ð9Þ
The state of the equivalent E2E buffer is expressed in
bytes. This is the consequence of two factors. First, the
S(k+1)D
Ack(k-r)
R(k)Τ(k-r)
d(k-r)
C
S(k-r)Be D
blk*(k) ...blk(k-1) blk(k-r)
Client
Buffer
Server
Τ(k+1)
T(k) D
S(k) - S(k-r)
Fig. 4 Snapshot of the equivalent model for the block round-trip time
considered when the block k - r exits the E2E infrastructure
188 Pers Ubiquit Comput (2009) 13:181–196
123

balance between the amount of data that enters the buffer
and the amount of data that exits the buffer may be fraction
of a block. Second, the size of the blocks varies over time.
Consequently, expressing the buffer state in blocks would
require the complete block size history that is not available.
5.3 E2E adaptation scheme
The main objective of the E2E adaptation scheme is to
maximize the QoS in terms of the defined metrics [29].
According to the assumptions previously made, the block
round-trip time is the chosen value to be controlled and the
block size is the value that is adapted (actuator). The other
objectives specify that the block should be fully perceived
at the same pace at which it has been acquired.
The E2E adaptation scheme relies on the values of the
E2E bandwidth Be and the propagation delay C that can be
estimated using the model and the metrics defined previ-
ously. The block duration D and the estimated values of Be
and C are necessary to compute the reference value for the
block round-trip time dr that maximizes the use of the E2E
infrastructure (see Sect. 5.4 for details).
The E2E adaptation scheme can be implemented as a
cascade structure with an inner loop handling a TCP-
friendly network transmission and an outer loop handling
the application level adaptation that controls the block
round-trip time (Fig. 5). The benefit of such a cascade
structure is to accommodate for any inner-loop policy, i.e.
transmission protocol. TCP-friendly transmissions ensure
that the Internet best practices are respected [41, 42].
5.4 Operating condition
The reference value for the round-trip time dr is either
defined manually by the user or computed using the block
duration D and the estimated values of Be and C. Reference
values defined by the user may lead to instability or non-
optimal usage of the available E2E bandwidth. Hence, this
option is not considered thereafter. The best-suited dr to be
computed is defined as the one that permits to fully utilize
the available E2E bandwidth Be without filling up the
equivalent E2E buffer. The block size S(k) is chosen
accordingly. Thus, the equation for the block round-trip
time d(k) is given by setting the buffer size R(k) to 0 in (6)
and by replacing T(k) by its definition (5). This finally gives
dðkÞ ¼ C þ SðkÞBe
ð10Þ
Figure 6 represents a snapshot of the model for the block
round-trip time considered when the equivalent buffer
R(k) = 0. The two black arrows on the left of Fig. 6
illustrates the adaptation of the block size S(k + 1).
By definition, the maximum block size Smax that can be
handled by the E2E bandwidth Be during a period equiv-
alent to the block duration D is given by
Smax ¼ Be D ð11Þ
Sending, at a pace equivalent to the constant block duration
D, a block of size bigger than Smax would either result in a
partial block loss (e \ 1) or partial block buffering (R [ 0,
s[ 1), the effects of which should be avoided.
The reference round-trip time dr represents the round-
trip time for a block of size Smax. It is given by setting S(k)
to Smax in (10).
This gives
dr ¼ C þ Smax
Be
ð12Þ
By definition (11), D is equal to Smax/Be. Therefore, the
above equation (12) can be rewritten as
dr ¼ C þ D ð13Þ
The reference round-trip time dr is equivalent to the block
duration D plus the E2E propagation delay C. This reflects
Servercomponent
End-to-End
adaptation
Clientcomponent
Transmissioncomponent
E2E structure
TCP-friendlylink Internet
ACK
packets
Blocks
User settings
metrics
Fig. 5 The cascade structure of the E2E adaptation scheme
Be D
Smax =
R(k) = 0
Server
Buffer
Be D
Ack(k-r)
T(k-r)
d(k-r)
C
S(k-r)
blk(k) ...blk(k-1) blk(k-r)
Client
S(k+1)
Fig. 6 E2E infrastructure representation when the E2E buffer is
empty R(k) = 0
Pers Ubiquit Comput (2009) 13:181–196 189
123

the objective of choosing a Smax that maximizes the use the
E2E transmission path. In other words, dr specifies the
block size that would fill the portion of the pipe (as por-
trayed in Fig. 6) which represents the block duration D.
Note that the above chosen dr implies that there is at least
one block in transit.
For any dr smaller than the one defined above, the pipe
(Fig. 6) will only be partially filled up. To the contrary,
with dr larger than the one defined above, part of the block
will remain in the equivalent E2E buffer and triggers
oscillations in the block round-trip time, something that has
to be avoided.
The above discussion clearly shows the advantage of
having an equivalent model for the block round-trip time. It
allows to directly choosing the appropriate value for the
block round-trip time reference. Also, it avoids selecting a
value that either under-utilizes or over-utilizes the E2E
resource.
5.5 The controller
The role of the adaptation scheme is threefold. First, the
controller tracks the block round-trip time. Second, using
the model defined previously, it estimates the E2E band-
width Be and the propagation delay C. Third, based on the
block duration D and the estimated Be and C, it computes
according to the operating condition (O.C.) the reference
value for the block round-trip time dr that maximizes the
use of the E2E infrastructure (Fig. 7).
The controller that tracks the reference block round-trip
time dr by rejecting the fast disturbances in the underlying
E2E infrastructure. These disturbances may be the result of
transmission link variation such as the increase of distance
between the access point and the client device in a wireless
network or due to an increase in the transmission link cross
traffic. Disturbances may also be the result of a temporary
lack of resource at the client side. In this last case, the E2E
buffer will fill-up.
The normal operating condition defines that the E2E
buffer is empty and sees non-empty buffer as a disturbance.
Thus, the dynamics of the E2E infrastructure is given by
the first mode of the block round-trip time model when
R(k) = 0. The chosen controller is an integral controller.
The integral controller has the advantage of approaching
smoothly the reference value according to its integral gain.
Another benefit is the low-pass filtering effect that
smoothes the potential noise added to the block round-trip
time measurement. An anti-reset windup ARW mechanism
should be added to limit the internal dynamics of the
controller [43].
The values C and Be are estimated by using linear least-
square method. To guarantee that the least-square estima-
tion is correct, it is primordial to guarantee that S(k) and
d(k) are measured when the equivalent E2E buffer is
empty. Otherwise (10), used for the least-square estima-
tion, is incorrect and the estimation returns erroneous
results. The E2E bandwidth Be and the E2E propagation
delay C are estimated continuously but the values used to
compute dr should be updated only when a significant
variation is detected.
6 Application
This section presents an example of ubiquitous remote
experimentation, where the physical equipment to be
remotely controlled corresponds to the one used by stu-
dents at the Ecole Polytechnique Federale de Lausanne
(EPFL). The whole framework is used to carry out remote
hands-on laboratory assignments in automatic control [44].
The standard client and server application (written in
LabVIEW), does not have a real-time E2E adaptation
mechanism. As a consequence, the server, which uses the
UDP protocol, tends to saturate the available bandwidth.
Also, the client application has a simple built-in mecha-
nism that drops information whenever it cannot properly
process it, which results in a waste of both server and
transmission resources. Therefore, the current server set-
ting has been modified to implement the proposed
adaptation scheme and a light PDA client has been written
accordingly. Moreover, the UDP protocol has also been
replaced by the TCP protocol so as to ensure friendliness
among transmissions.
The real-world results presented hereafter show how the
adaptation scheme adjusts itself to the E2E infrastructure
characteristics, especially those of the network and client.
To convincingly illustrate the benefit of the proposed E2E
adaptation scheme, the E2E infrastructure has been selec-
ted such that it can easily be saturated by the amount of
transmitted information and can also be externally
perturbed.
E2E layer
Estimator
ControllerO.C.
d,(ε,τ)
dr
D
C, Be
d,ε,τS+
-
E2E adaptation
Fig. 7 The E2E adaptation scheme
190 Pers Ubiquit Comput (2009) 13:181–196
123

Figure 8 depicts the chosen E2E infrastructure. It con-
sists of a palm handheld device (PDA) with limited
resources (the client) connected to a desktop computer (the
server). The information transits wirelessly (Bluetooth)
from the handheld device to the server using the TCP
protocol, thus the e(k) metrics (block size ratio) is always
equal to 1.
The chosen equipment to be remotely controlled is a
laboratory-scale electrical drive with a rotating load. It is
connected to the server through a data acquisition board.
The experimentation protocol for the students consists in
choosing the right set of parameters to dynamically posi-
tion the rotating load while fulfilling some specifications
(overshot, settling time, etc.). This is a typical example
used in many textbooks to illustrate automatic control
theory. The load motion is captured by a video camera.
Remote experimentation of such mechatronic devices has
strong real-time constraints due to the fast dynamical
behavior of the equipment to be observed and controlled.
In such a case, blocks should be updated at least 4 times per
second to adequately capture the state of the distant
equipment, i.e. the load motion. This gives a block duration
of D = 250 ms.
As proposed previously, a pure integral controller is
implemented at the server side to track the block round-trip
time dr. To achieve this specification, the integral controller
(I) adjusts in real-time the block size S(k + 1) based on the
measured d(k) and the reference block round-trip time dr
(Fig. 9). An anti-reset windup mechanism is also
implemented.
The values for Be and C are estimated using a least-
square technique based on the measured d(k) and S(k) of
the first few blocks sent. These blocks are specially crafted
to ensure a valid estimation, i.e. the equivalent E2E buffer
remains empty. Based on the identified Be (15.8 kB/s) and
C (110 ms) and using the defined block period D (250 ms),
the reference value for the block round-trip time is dr =
360 ms. This value of dr maximizes the usage of the
considered E2E infrastructure.
Figure 10 shows the impact of the adaptation scheme
with the controller activated after about 100 blocks of
minimal size data have been sent. At that time, the block
round-trip time d(k) (Fig. 10 left) increases until the
computed set point dr is reached. As a result, the block size
S(k) increases until Smax is reached (Fig. 10 right) upon
which the E2E infrastructure is fully utilized for the given
block duration D.
Figures 11 and 12 show the cases where a non-optimal
reference value dr2 has been chosen for the block round-trip
time. In Fig. 11, the chosen reference value dr2 is smaller
than the optimal one dr1. To reach dr2, the controller
reduces the block size S(k) to a value smaller than the
ServerInternet
Electrical drive
routers
Bluetoothaccess point
Client
Fig. 8 The chosen E2E infrastructure includes a PDA connected
wirelessly to the remote server
E2E structureIS(k), Ddr +
d(k-r), { τ(k-r), ε(k-r) = 1 }
Fig. 9 E2E adaptation scheme for tracking d
]setyB[ S(k)Smax
Smin
block ID
10000
3000
2000 200
]ces[
d(k)
dr
block IDcontroller activated
controller activated
0
1.0
0
0.36
200
Fig. 10 Evolution of the block round-trip times and sizes before and
after the activation of the controller
Pers Ubiquit Comput (2009) 13:181–196 191
123

optimal Smax. As a result, the E2E infrastructure usage is
not maximized.
The block size cannot be smaller than Smin, which
correspond to the smallest possible packet containing only
the information needed for the metrics estimation. Also, dr2
should obviously not be set smaller than the E2E propa-
gation delay C.
In Fig. 12, the chosen reference value for the block
round-trip time dr2 is larger than the computed value dr1.
The E2E controller tracks this new value by increasing the
block size S(k) until it reaches dr2. Since the E2E band-
width Be remains unchanged, the E2E infrastructure cannot
accept a block bigger than Smax. Thus, blocks are stored in
the E2E buffers R(k). Consequently, the block round-trip
time d(k) increases. To compensate for this increase the
controller reduce the block size causing unwanted oscilla-
tions in both block sizes and block round-trip times.
These results clearly show the importance of having a
valid model to define the reference value for the block
round-trip time dr. A reference value smaller than the
optimal one does not use all the available E2E capacity, so
as to maintain the system stable. On the other hand, a
reference value larger than the optimal value leads to
unwanted oscillations in both block sizes and block round-
trip time, which should definitely be avoided through
automatically rejecting these values.
The next results illustrate the ability of the proposed
E2E adaptation scheme of rejecting disturbances. These
disturbances are generated by rapidly changing the char-
acteristics of the E2E infrastructure. This is done by
moving the PDA away from the access point, hence pro-
ducing a large bandwidth variation. Similar disturbances
could also be produced either by generating a large amount
of cross-traffic or by limiting resources at the client side.
Figure 13 shows the block round-trip time d(k) varia-
tions resulting from the PDA displacement. Before time t1,
the PDA is close to the access point. Then, at time t1, the
PDA is rapidly placed at a distance of about 10 m from the
access point and it stays there until time t2. At time t2, the
PDA is brought back to its original position.
The disturbances applied to the E2E infrastructure is
significant. At the application level, the largest measured
block round-trip time is about 5 s, more than ten times the
initial block round-trip time. To reject this disturbance, the
controller quickly reduces the block size S(k) in order not
to worsen the situation. Since the controller cannot send
blocks of a negative size, so as to empty the E2E buffer, it
sends blocks of a minimal size Smin until d(k) crosses dr
(remember that blocks must be sent to estimate metrics). At
that time, the controller starts to increase the block size
until a new equilibrium point resulting from the new
infrastructure characteristics is reached. This new value is
smaller than the original Smax.
At time t2, the PDA is brought back to its original
position. The controller increases the block size so as to
compensate the E2E characteristic variation. Note that the
]setyB[
S(k)Smax
block ID0
10000
3000
0200
]ces[ d(k)
dr1 dr2
block ID0
1.0
0.36
0.25
0200
Fig. 11 Measured d(k) (left) and block sizes evolution (right) when
where the reference changes from the optimal value dr1 to the non-
optimal one dr2
]setyB[
S(k)
Smax
block ID0
10000
4000
0180
]ces[
d(k)
dr1
dr2
block ID0
2.0
0.4
1.0
0180
Fig. 12 The measured d(k) (left) and lock sizes evolution (right)when the reference value changes from the computed dr1 to the flawed
dr2
192 Pers Ubiquit Comput (2009) 13:181–196
123

buffer is not needed, and therefore there is no buffer delay
in the controller response, but only a slight undershoot in
d(k).
Figure 14 shows the evolution of the s(k) metrics. When
the disturbance occurs at time t1, the blocks are available to
the user with some delay due to the buffering effect. This
results resulting s(k) [ 1. Then, when the buffer drains, the
blocks arrive at a pace faster than the block duration, so
that s(k) \ 1. Due to the limited resources on the PDA, no
mechanism is implemented so as to compensate for the
jitter introduced by the disturbance; the blocks are played
as they arrive.
The above experiments show that the proposed E2E
adaptation scheme can successfully adapt to the available
E2E infrastructure and reject disturbances while relying
only measurements made at the application level. It does
not depend specifically on the underlying type of connec-
tion, be it the protocol or the client device. Only the E2E
metrics are estimated and used by the controller.
The effect of the above disturbance applied to the E2E
infrastructure has also been observed at the network level.
To achieve this, a packet capture program (tcpdump) is
used to record packets (not blocks) as they leave the
computer. In parallel, the server application has been
instrumented to record the block information S(k) and
TS(k). The server generates blocks at a regular pace D.
Then, within the transmission component, the chosen
protocol, TCP, splits blocks into packets and sends theses
packets according to its own set of rules [45, 46]. Each
TCP packet carries a unique identifier called the sequence
ID. When packets leave the computer, the TCP increments
the packet sequence ID by a value corresponding to the
packet size. The packet capture program records these
sequences of ID values. Block sizes are recorded, and
therefore block sequence IDs representing the accumulated
block size can be computed and compared to the TCP
packet sequence IDs. By comparing the two recorded ID
sequences, it is possible to determine whenever a given
block (split into packets) has left entirely the computer. A
block has left the computer whenever the TCP sequence ID
is the same as the block sequence ID (i.e. the same
y-coordinate). TCP has a built-in mechanism that adapts to
the available network bandwidth [47]. This internal
mechanism buffers data that cannot be immediately sent.
At the considered application level, there are no direct
means to measure the state of a TCP connection.
The upper part of Fig. 15 shows two curves; one cor-
responds to the TCP sequence IDs vs. time; the other
corresponds to the accumulated blocks size versus time.
Prior to the time t1, the server generates blocks of similar
sizes at a fixed pace D. Consequently, the block slope is
constant. The corresponding TCP sequence-ID curves
closely follow the block curves indicating that TCP packets
leave the computer without further delay. The curves
overlay shows that the controller successfully sets the
block size to a value that matches the E2E infrastructure
characteristics. When the user moves away (time t1), the
slope of the TCP curve flattens considerably indicating that
the TCP adapts to the new network condition. At that
instant of time, the server has not reduced the block size,
and therefore blocks (that cannot be sent) are delayed
(buffered) by TCP. This delay can be measured on the y-
axis. The controller reacts to this increase in the block
round-trip time by quickly reducing the block size to its
minimal value. As a result, the block curves flatten con-
siderably. The block curve remains almost horizontal until
the TCP curve rejoins the block curve indicating that
blocks are no longer delayed nor buffered. Then, the
]setyB[
S(k)Smax
Smin
block ID0
10000
4000
200
180
]ces[ d(k)
dr
block IDt1 t2
t1 t2
0
5.0
0.40
180
Fig. 13 The measured block round-trip time d(k) and block size S(k)subject to disturbances. At time t1, the PDA is rapidly placed at a
distance; at time t2 it is brought back to its original position
τ(k)
block ID
00
1.0
1.82.0
180t1 t2
Fig. 14 The s metrics variation resulting from the applied
disturbance
Pers Ubiquit Comput (2009) 13:181–196 193
123

controller increases the block size until the second steady
state value is reached. When the user comes back to its
original position (time t2), the controller adapts to the new
E2E characteristics by increasing the block size. As a
consequence, the slope of both the block and the TCP
curves increase back to their initial value.
The lower part of Fig. 15 shows the time spent in the
TCP internal buffer that corresponds to the difference
between the block and the TCP curves along the x-axis.
Note that the TCP buffer delay curve is similar to the block
round-trip time d(k) in Fig. 13 which indicates that, for this
disturbance, the TCP buffering effect is the main contrib-
utor to the E2E delay.
The controller is able to successfully track the reference
value dr when the E2E characteristics are significantly
modified. After the transient phase, the controller rejects
the remaining constant disturbance. In other words, the
E2E adaptation scheme successfully guarantees the QoS,
i.e. the interaction, when a disturbance is applied to the
E2E infrastructure, this occurs independently of either the
underlying infrastructure or the transmission protocol or
the client device.
7 Conclusion and future work
Remote experimentation over the Internet is nowadays
common for users and especially students working over
wired networks. This is not the case for mobile users using
lightweight devices with limited resources. The rapid
variations of the wireless communications characteristics
and the reduced performance of the client devices may
severely degrade the user experience if the proposed
remote experimentation solution does not adapt to these
new constraints.
This paper presents a new end-to-end adaptation scheme
to provide the user with the best possible interacting
experience, while considering imposed constraints in the
ubiquity of the solution, the adaptability to the E2E infra-
structure, and the respect of the Internet best practice. It is
applied in flexible engineering education to promote and
develop ubiquitous and mobile learning opportunities.
The proposed scheme first specifies the objective of
providing an adequate user experience in terms of QoS
from usability and educational points of view. It offers a
responsive feedback to a user action while guaranteeing
that the drawbacks inherent to the distance between the
user and the physical equipment are minimized.
This objective has been formalized by three properties
that need to be satisfied in order to provide a suitable user
experience, namely the level of interaction which repre-
sents how quickly a feedback is provided to the user, the
system dynamics rendering which represents how accu-
rately in time the behavior of the remote system is
perceived and the amount of semantic content that repre-
sents how well the distant equipment state and conditions
of operation can be perceived by the client. These three
properties define the quality of service for ubiquitous
remote experimentation.
There is no sensor that can directly measure the pro-
posed QoS. Therefore, three metrics are proposed to
estimate the QoS. The definition of the metrics relies on
two abstractions. The first one defines a block as a unit of
information that fully describes the state and the conditions
of operation of the remote equipment at a given time. The
second abstraction defines an end-to-end infrastructure that
includes the communication link and both the server and
the client devices at the application level. The estimated
metrics are the block end-to-end round-trip time, the block-
period ratio and the block-size ratio. The proposed metrics
combined with the block definition are sufficient to char-
acterize the capabilities of the end-to-end infrastructure.
To guarantee a given QoS to the distant user, an adap-
tation scheme is proposed. This scheme is implemented as
a cascade structure, where the outer loop controls the block
round-trip time and the inner one ensures a TCP-friendly
transmission. Thanks to this cascade structure, the adap-
tation scheme is independent of the chosen inner-loop
policy.
The end-to-end infrastructure can be represented as an
equivalent buffer, an equivalent propagation delay and an
equivalent bandwidth. The main objective for ubiquitous
remote experimentation is level of interaction that can be
measured by the block round-trip time. A model for the
block round-trip time has been derived from the equiva-
lent representations. This model allows not only the
design of an adaptation scheme that successfully tracks
the block round-trip time, but also enables to reject, in
DIecneuqes
TCP buffer delays
Time [s]
45t1t20
0
s [yale d
]
4.0
0
Blocks write calls
TCP packets leaves
750000
Fig. 15 Effect of the disturbance applied to the E2E infrastructure
observed at the network level
194 Pers Ubiquit Comput (2009) 13:181–196
123

real-time, disturbances due to the variations of the E2E
infrastructure characteristics. Based on this model, it is
also possible to specify a reference value for the block
round-trip time that ensures the full utilization of the E2E
infrastructure.
The proposed scheme has been successfully imple-
mented to control a laboratory-scale electrical drive from a
PDA handheld computer. The chosen transmission media
was a Bluetooth connection that could easily be disturbed.
The end-to-end adaptation scheme implemented on the top
of TCP connection successfully adapted to the end-to-end
infrastructure and the induced disturbances were success-
fully rejected.
The illustrative application clearly shows that it is
possible to successfully control, at the application level, the
E2E round-trip time even if the chosen transmission
protocol is TCP. This allows for effective remote
experimentation.
Using this adaptation scheme, ubiquitous remote
experimentation activities are now possible in engineering
education as a complement to common remote experi-
mentation activities. This new paradigm will be proposed
to students at the EPFL starting from 2008 [48].
This paper proposes a broad albeit consistent foundation
for studying real-time interaction in the context of remote
experimentation. It is built around two main contributions.
First, based on the identified objectives of a successful
interaction, the quality of service for remote experimenta-
tion is defined. The associated metrics and abstractions,
which allow working at the right level of abstraction, are
also defined. Second, using the provided metrics and
abstractions, an adaptation scheme that enforces the QoS
provided to the user is proposed and successfully validated.
This scheme can be extended to consider the multivariable
case where not only the block size is modified but also the
block pace. This QoS can also be extended to consider the
user quality of perception of the block content. This
extended scheme would require a model of the user per-
ception; this is a difficult task that requires offline
identification.
References
1. Gillet D, Nguyen AV, Rekik Y (2005) Collaborative web-based
experimentation in flexible engineering education. IEEE Trans
Educ Spec Issue Web-based Instr 48(4):696–704
2. Ko CC, Chen BM, Chen J, Zhuang Y, Tan KC (2001) Devel-
opment of a web-based laboratory for control experiments on a
coupled tank apparatus. IEEE Trans Educ 44(1)
3. Schmid C (2003) Remote experimentation in control engineering.
In: Proceedings of the 11th Mediterranean conference on control
and automation MED’03, Rhodos, Paper IV12–01
4. Dabney JB, McCune J, Ghorbel FH (2003) Web-based control of
the rice SPENDULAP, Int J Eng Educ 19:478–486
5. Salzmann C, Gillet D, Huguenin P (2000) Introduction to real-
time control using LabVIEWTM with an application to distance
learning. Int J Eng Educ Spec Issue: LabVIEW Appl Eng Educ
16(3):255–272
6. Tzafestas CS, Palaiologou N, Alifragis M (2006) Virtual and
remote robotic laboratory: comparative experimental evaluation.
IEEE Trans Educ 49(3):360–369
7. Callaghan MJ, Harkin J, McGinnity TM, Maguire LP (2003)
Adaptive intelligent environment for remote experimentation. In:
Proceedings of the IEEE/WIC international conference on web
intelligence (WI’03), p. 680
8. Cooper M (2005) Remote laboratories in teaching and learning—
issues impinging on widespread adoption in science and engi-
neering education. Int J Online Eng, 1.1. http://www.i-joe.org_/
ojs_/viewarticle.php?id=11. Accessed 26 Jun 2005
9. Floyd S (2000) Congestion control principles, RFC 2914,
September
10. Various authors, Internet best current practices index, online
reference at: http://www.faqs.org_/rfcs_/bcp-index.html
11. Bouch A, Sasse MA, DeMeer H (2000) Of packets and people: a
user-centered approach to quality of service. In: Proceedings of
the IWQoS2000, pp. 189–197
12. Chalmers D, Sloman M (1999) A survey of quality of service in
mobile computing environments. IEEE Communications Sur-
veys, 2nd Quarter, IEEE CS
13. Cole RG, Rosenbluth JH (2001) Voice over IP performance
monitoring. ACM SIGCOMM Comput Commun Rev 31(2)
14. Aurrecoechea C, Campbell AT, Hauw L (1998) A survey of QoS
architectures. ACM/Springer Verlag Multimedia Syst J Spec
Issue QoS Arch 6(3):138–151
15. Gracanin D, Zhou Y, DaSilva LA (2004) Quality of service for
networked virtual environments. Commun Mag IEEE 42(4):42–
48
16. Anbazhagan M, Nagarajan A, Understanding quality of service
for Web services. ftp://www6.software.ibm.com/software/
developer/library/ws-quality.pdf. Accessed Jan 2002
17. Zhang Q, Zhu W, Zhang Y-Q (2005) End-to-end QoS for video
delivery over wireless internet. Proc IEEE 93(1)
18. Nguyen AV, Rekik Y, Gillet D (2007) Iterative design and
evaluation of a web-based experimentation environment. In:
Lambropoulos N, Zaphiris P (eds) The book user-centered design
of online learning communities. IDEA Group Inc., Hershey, pp
286–313
19. Khamis AM, Rodriguez FJ, Salichs MA (2003) Remote interac-
tion with mobile robots, autonomous robots, vol 15–3. Springer,
The Netherlands, pp 267–281
20. MacKenzie IS, Ware C (1993) Lag as a determinant of human
performance in interactive systems. In: Proceedings of the SIG-
CHI conference on human factors in computing systems. ACM
Press, New York, pp 488–493
21. Borkowski S, Letessier J, Berard F, Crowley JL (2006) User-
centric design of a vision system for interactive applications. In:
Proceedings of ICVS ‘06, IEEE international conference on
computer vision systems
22. ITU Standard G.114. Audio delay recommendations.
http://www.itu.ch
23. Ando N, Lee J, Hashimoto H (1999) A study on influence of time
delay in teleoperation. In: Proceeding of the 1999 IEEE/ASME
international conference on advanced intelligent mechatronics,
Atlanta, USA, pp 317–322
24. Nguyen T, Zakhor A (2002) Distributed video streaming with
forward error correction. In: Proceedings of the packet video
workshop, Pittsburgh, USA
25. Gulliver SR, Ghinea G (2004) Changing frame rate, changing
satisfaction? IEEE international conference on multimedia and
expo, Taipei, Taiwan, vol 1, pp 177–180
Pers Ubiquit Comput (2009) 13:181–196 195
123

26. Ghinea G, Chen SY (2006) Perceived quality of multimedia
educational content: a cognitive style approach. In: Multimedia
systems, vol 11–3. Springer, Berlin, pp 271–279
27. Verscheure O, Frossard P, Hamdi M (1999) User-oriented QoS
analysis in MPEG-2 video delivery. J Real-Time Imaging Spec
Issue Real-Time Digit Video Multimedia Netw 5(5):305–314
28. Floyd S, Fall K (1999) Promoting the use of end-to-end congestion
control in the internet. IEEE/ACM Trans Netw 7–4:458–472
29. Abdelzaher TF, Stankovic JA, Lu C, Zhang R, Lu Y (2003)
Feedback performance control in software services. IEEE Control
Syst 23(3), 74–90
30. Bajic IV, Tickoo O, Balan A, Kalyanaraman S, Woods JW (2003)
Integrated end-to-end buffer management and congestion control
for scalable video communications. In: Proceedings of IEEE
international conference on image processing (ICIP), Barcelona,
Spain, vol 3, pp III-257–III-260
31. Kim J, Kim Y-G, Song H, Kuo T-Y, Chung YJ, Jay Kuo C-C
(2000) TCP-friendly Internet video streaming employing variable
frame-rate encoding and interpolation. IEEE Trans Circuits Syst
Video Technol 10(7):1164–1177
32. Gurtov A, Floyd S (2004) Modeling wireless links for transport
protocols. ACM CCR 34–2:85–96
33. Legall D (1992) The MPEG video compression algorithm. Image
Commun 4:129–140
34. Padhye J, Firoiu V, Towsley D, Kurose J (2000) ModelingTCP
reno performance: a simple model and its imperical validation.
IEEE/ACM Trans Netw 8(2):133–145
35. Khalifa I, Trajkovic L (2004) An overview and comparison of
analytical TCP models. In: IEEE International Symposium Cir-
cuits and Systems, Vancouver, vol V, pp 469–472
36. Yang M, Li XR, Chen H, Rao NSV (2004) Predicting internet
end-to-end delay: an overview. In: Proceedings of the 36th IEEE
southeastern symposium on systems theory, Atlanta, GA, pp 210–
214
37. Jaiswal S, Iannaccone G, Diot C, Kurose J, Towsley D (2004)
Inferring TCP connection characteristics through passive mea-
surements. In: Infocom ’04, vol 3, pp 1582–1592
38. Stevens WR (1994) TCP/IP illustrated, vol 1. Addison-Wesley,
Reading
39. Prasad R, Dovrolis C, Murray M, Claffy K (2003) Bandwidth
estimation: metrics, measurement techniques, and tools. Netw
IEEE 17–6:27–35
40. Jain M, Dovrolis C, End-to-end available bandwidth: measure-
ment methodology, dynamics, and relation with TCP throughput.
In: Proceedings of ACM SIGCOMM, Pittsburg, PA, USA
41. Mahdavi J, Floyd S (1997) TCP-friendly unicast rate-based flow
control. Technical note sent to the end2end-interest mailing list.
http://www.psc.edu_/networking_/papers_/tcp_friendly.htm.
Accessed 8 Jan 1997
42. Widmer J, Denda R, Mauve M (2001) A survey on TCP-friendly
congestion control. IEEE Netw 15–3:28–37
43. Astrom KJ, Hagglund T (1995) PID controllers: theory, design
and tuning. Instrument Society of America, New York
44. Gillet D, Fakas G (2001) eMersion: a new paradigm for web-
based training in mechanical engineering education. In: Interna-
tional conference on engineering education, Oslo, Norway, vol
8B4, pp 10–14
45. Allman M, Paxson V, Stevens W (1999) TCP congestion control,
RFC 2581, proposed standard. ftp://ftp.isi.edu/in-notes/
rfc2581.txt
46. Chiu D-M, Jain R (1989) Analysis of the increase and decrease
algorithms for congestion avoidance in computer networks.
Comput Netw ISDN Syst 17
47. Jacobson V (1988) Congestion avoidance and control. In: ACM
SIGCOMM ‘88, pp 314–329
48. eMersion portal. http://emersion.epfl.ch
196 Pers Ubiquit Comput (2009) 13:181–196
123