
A fast and simple model for a quick scan of airport performance
23
- 1 - A Fast and Simple Model for a Quick Scan of Airport Performance J.H. Kwakkel, R.A.A. Wijnen, W.E. Walker, and V.A.W.J. Marchau Faculty of Technology, Policy and Management Delft University of Technology P.O. Box 5015, 2600 GA, Delft, the Netherlands Tel: +31-15-2788487 Fax: +31-15-278 6233 [email protected] Uncertainty about future developments (e.g. demand, airline behavior) and the way these will affect an airport is a growing concern in Airport Strategic Planning. Currently, the ability to explore a variety of alternative futures, their consequences for airport performance, and possible strategies for ensuring that the airport meets its business objectives, is limited. One of the reasons for this is that the existing tools and techniques for quantifying airport performance are not integrated, require significant detailed data, and do not readily produce the information relevant to decisionmakers. Therefore, a fast and simple computational model is needed that provides insight into the key performance indicators of an airport for different strategies across different futures. This paper presents the conceptual design, implementation, and test of such a fast and simple model. The design is based on a modular approach that allows for the integration of several existing third party tools that are currently available for partial analyses (e.g. noise, third party risk, capacity). The model is implemented using the object oriented programming language PYTHON. The model is validated against the results of previous studies that used more detailed tools and techniques, with Amsterdam Airport Schiphol as a case study. Keywords: airport strategic planning, uncertainty, adaptive airport strategic planning
Transcript of A fast and simple model for a quick scan of airport performance
- 1 -
A Fast and Simple Model for a Quick Scan of Airport
Performance
J.H. Kwakkel, R.A.A. Wijnen, W.E. Walker, and V.A.W.J. Marchau
Faculty of Technology, Policy and Management
Delft University of Technology
P.O. Box 5015, 2600 GA, Delft, the Netherlands
Tel: +31-15-2788487
Fax: +31-15-278 6233
Uncertainty about future developments (e.g. demand, airline behavior) and the way these will
affect an airport is a growing concern in Airport Strategic Planning. Currently, the ability to
explore a variety of alternative futures, their consequences for airport performance, and possible
strategies for ensuring that the airport meets its business objectives, is limited. One of the reasons
for this is that the existing tools and techniques for quantifying airport performance are not
integrated, require significant detailed data, and do not readily produce the information relevant
to decisionmakers. Therefore, a fast and simple computational model is needed that provides
insight into the key performance indicators of an airport for different strategies across different
futures. This paper presents the conceptual design, implementation, and test of such a fast and
simple model. The design is based on a modular approach that allows for the integration of
several existing third party tools that are currently available for partial analyses (e.g. noise, third
party risk, capacity). The model is implemented using the object oriented programming language
PYTHON. The model is validated against the results of previous studies that used more detailed
tools and techniques, with Amsterdam Airport Schiphol as a case study.
Keywords: airport strategic planning, uncertainty, adaptive airport strategic planning
- 2 -
1 Introduction
In light of the ongoing financial crisis, the aviation industry has become more aware of the
fundamental challenges uncertainty poses in planning for long term development. With respect to
Airport Strategic Planning (ASP), this translates into growing concerns about how to adequately
address uncertainty about future developments (e.g. demand, airline behavior) when making
strategic investment decisions. In response to these concerns, different answers are possible. One
direction is to advocate flexibility and adaptability.(de Neufville, 1991; de Neufville, 2000;
Burghouwt, 2007; Kwakkel et al., 2008a). However, in order to plan adaptively, decisionsmakers
need a class of models that allows for a quick scan of a variety of futures and alternative
strategies.
Currently, the ability to explore a variety of alternative futures, their consequences for airport
performance, and possible strategies for ensuring that the airport meets its business objectives, are
limited. There is a wide variety of tools available. However, these tools focus on only a single
airport performance metric (capacity, noise, emissions, external safety). An integrated systematic
analysis of airport performance is therefore already a significant challenge, let alone the
systematic exploration of a variety of futures and strategies. In addition, the current tools do not
readily produce information relevant to decisionmakers.
In response to the growing concerns in ASP and the call for adaptive planning, there is a need for
fast and simple models that allow for quick integrated analysis of key airport performance
indicators. Given such a model, airport planners can quickly explore different futures, different
strategies, and focus the analysis on the most troubling futures and the most promising strategies.
This paper presents the conceptual design, implementation, and preliminary validation of such a
fast and simple model.
In Section 2, the problem of uncertainty in ASP and the problems associated with the currently
available tools is elaborated. Section 3 present the requirements for the fast and simple model, a
conceptual design that can meet these requirements, and the most important aspects of the
implementation of this design. In Section 4, we present the results of a case study of Amsterdam
Airport Schiphol. We compare the performance of the fast and simple model with other modeling
studies across a number of airport performance indicators in order to assess the validity of the fast
- 3 -
and simple model for airport performance analysis.. Section 5 presents our main conclusions and
directions for further research.
2 Problem Description
Uncertainty about future developments (e.g. demand, airline behavior) and the way these will
affect an airport is a growing concern in Airport Strategic Planning (ASP). The current dominant
approach for the long-term development of an airport is Airport Master Planning (AMP). AMP is
a formalized, structured planning process that results in a Master Plan that ‘presents the planner’s
conception of the ultimate development of a specific airport’ (ICAO, 1987; de Neufville and
Odoni, 2003; IATA, 2004). The goal of a Master Plan is to provide a blueprint that will determine
the future development of the airport (Dempsey et al., 1997; Burghouwt and Huys, 2003). The
Master Plan is based on one or more aviation demand forecasts (de Neufville and Odoni, 2003).
The forecasts, however, are practically always wrong (Ascher, 1978; Flyvbjerg et al., 2003). As a
result, the Master Plan performs poorly.
Currently, the ability to explore a variety of alternative futures, their consequences for airport
performance, and possible strategies for ensuring that the airport meets its business objectives, is
limited (Wijnen et al., 2008). First, in ASP, most of the data and information that is used is
generated by disparate and incompatible analytic tools, typically related to capacity and delay,
environmental impacts (noise, emissions, and third party risk), and financial performance.
Second, all this data and information needs to be managed and kept consistent. Third, a large
number of people from different stakeholders are involved. These different people have different
objectives, perceptions, tools, data, and information, further complicating the overall coordination
of an ASP project. As a result of these three facts, airport strategic planning is a cumbersome
endeavor that rarely considers a wide range of alternative plans and different plausible futures.
A second problem is the willingness to accept new approaches to ASP (de Neufville, 2000; de
Neufville and Odoni, 2003; Burghouwt, 2007; Kwakkel et al., 2008b). Given the importance of
airport planning to the future performance of the airports, airport operators have been reluctant to
adapt new planning approaches. To overcome this reluctance, the validation of new planning
approaches is of great importance (Hansman et al., 2006). One technique that could be employed
for this validation is exploratory modeling (Bankes, 1993). The performance of plans based on
new planning approaches can then be compared with master plans across a large ensemble of
- 4 -
possible futures. However, this requires significant computational effort. The current disparity of
tools, techniques, data, and information prevents such a model-based validation of new airport
strategic planning approaches.
To summarize, there is a clear need for an integrated suite of tools for airport performance
analysis. Different researchers, along different lines are working towards this (e.g. Visser et al.,
2003; Zografos and Madas, 2007; Wijnen et al., 2008). However, most of these researches focus
on the tools that are used throughout the ASP process. As a result, these are in general tools that
require significant amounts of input data and produce detailed output data. In light of the second
problem, however, there is also a need for a fast and simple model that allows for the fast
exploration of the expected impact of different options on key airport performance metrics across
an ensemble of plausible futures. Such a model would also allow for a quick exploration,
focusing the main effort in ASP on the most promising options and the most threatening possible
futures. These options and futures could subsequently be analyzed in more detailed using more
sophisticated tools and techniques.
3 A Fast and Simple Model for Airport Performance Analysis
Given the complexity of ASP, the significant investment in time and resources needed for
developing airport Strategic Plans, and the established need for model-based validation of new
approaches to ASP, there is a need for a Fast and Simple Model for Airport Performance Analysis
(FASMAPA). A single model that can quickly calculate key airport performance metrics can help
in exploring the space of plausible futures and alternative strategies, thus allowing the airport
planners to quickly zoom in on the most promising strategies and most problematic futures.
Significant effort can then be invested in exploring these strategies and futures in more detail. A
fast and simple model can also be used in the context of exploratory modeling for evaluating new
approaches to ASP, since such a model will overcome the hurdle of computational resources that
arises out of the current detailed tools and techniques.
- 5 -
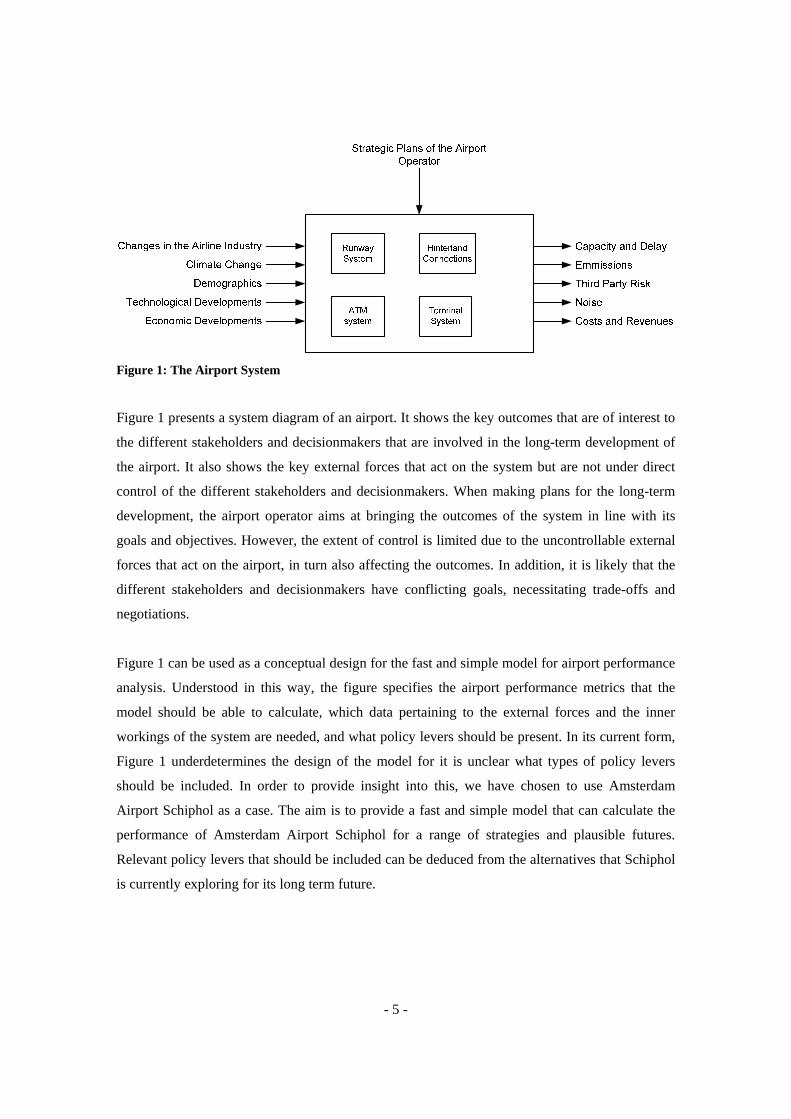
Figure 1: The Airport System
Figure 1 presents a system diagram of an airport. It shows the key outcomes that are of interest to
the different stakeholders and decisionmakers that are involved in the long-term development of
the airport. It also shows the key external forces that act on the system but are not under direct
control of the different stakeholders and decisionmakers. When making plans for the long-term
development, the airport operator aims at bringing the outcomes of the system in line with its
goals and objectives. However, the extent of control is limited due to the uncontrollable external
forces that act on the airport, in turn also affecting the outcomes. In addition, it is likely that the
different stakeholders and decisionmakers have conflicting goals, necessitating trade-offs and
negotiations.
Figure 1 can be used as a conceptual design for the fast and simple model for airport performance
analysis. Understood in this way, the figure specifies the airport performance metrics that the
model should be able to calculate, which data pertaining to the external forces and the inner
workings of the system are needed, and what policy levers should be present. In its current form,
Figure 1 underdetermines the design of the model for it is unclear what types of policy levers
should be included. In order to provide insight into this, we have chosen to use Amsterdam
Airport Schiphol as a case. The aim is to provide a fast and simple model that can calculate the
performance of Amsterdam Airport Schiphol for a range of strategies and plausible futures.
Relevant policy levers that should be included can be deduced from the alternatives that Schiphol
is currently exploring for its long term future.
- 6 -
3.1 Policy Options for Schiphol
Fuelled by privatization and liberalization of the aviation industry, aviation demand in Europe has
undergone unprecedented growth since the early 1990’s. Schiphol benefited from this growth and
evolved into a major hub in Europe. However, Schiphol’s position as a hub within Europe is now
under pressure. Schiphol was surpassed by Madrid in 2006 and now ranks as Europe’s fifth
airport in terms of air transport movements. The merger of Air France and KLM has resulted in
the threat that KLM, the hub carrier of Schiphol and responsible for 52% of the scheduled
movements, might move a significant portion of its operations to Charles de Gaulle airport. The
other major airports in Europe are planning on expanding their capacities or developing into dual
airport systems. In addition, resistance from key stakeholders to the further growth of Schiphol is
ever increasing.
In its current long-term planning, the main goals of the Schiphol Group are to create room for the
further development of the network of KLM and its Skyteam partners, and to minimize and where
possible reduce the negative effects of aviation in the region (Schiphol Group and LVNL, 2007).
The Schiphol Group is primarily interested in medium- to long-term developments until 2020.
Policy options that are being considered by the Schiphol Group include the further development
of the current operational plan, a new operational concept, moving charter operations out of
Schiphol, and a proposal by inhabitants of the region (Schiphol Group and LVNL, 2007). The
current operational plan is based on a hub-and-spoke network and a Preferential Runway
Advisory System (PRAS), similar to Boston’s Logan Airport, for the usage of the runway system
in order to minimize noise impact. In order to handle the arrival and departure peaks, a 2+2
runway configuration will be required. The new operational concept is based on the continuous
usage of four runways, combined with a concentration of arrival and departure traffic flows. The
proposal of the inhabitants is based on a cap on the maximum number of operations, combined
with a 2+1 runway system. An additional runway might be used under strict conditions and only
for a short period during the day.
In order to realize these plans, several types of changes could be necessary. Schiphol can expand
its capacity by using its existing capacity more efficiently and/or building new capacity. It can
also expand its capacity or use its existing capacity in a way that mitigates the negative effects of
aviation. More explicitly, among the policy options that Schiphol might consider are
(combinations of):
1. Add a new runway

- 7 -
2. Add a new terminal
3. Use the existing runway system in a more efficient way, in order to improve capacity
4. Use the existing runway system in a way that minimizes noise impacts
5. Move charter operations out of Schiphol (e.g., to Lelystad)
6. Move Schiphol operations to a new airport (e.g., in the North Sea)
7. Invest in noise insulation
3.2 Structure of the Fast and Simple Model
Early on in the design of the Fast and Simple Model, a decision was made to design the model in
such a way that it uses existing tools and techniques where possible. In addition, the design of the
model should allow for adding additional tools, and for swapping one tool for another. In this
respect the design follows some of the key principles for airport decision support outlined by
Wijnen et al. (2008). In response to these requirements, the model has a modular design as
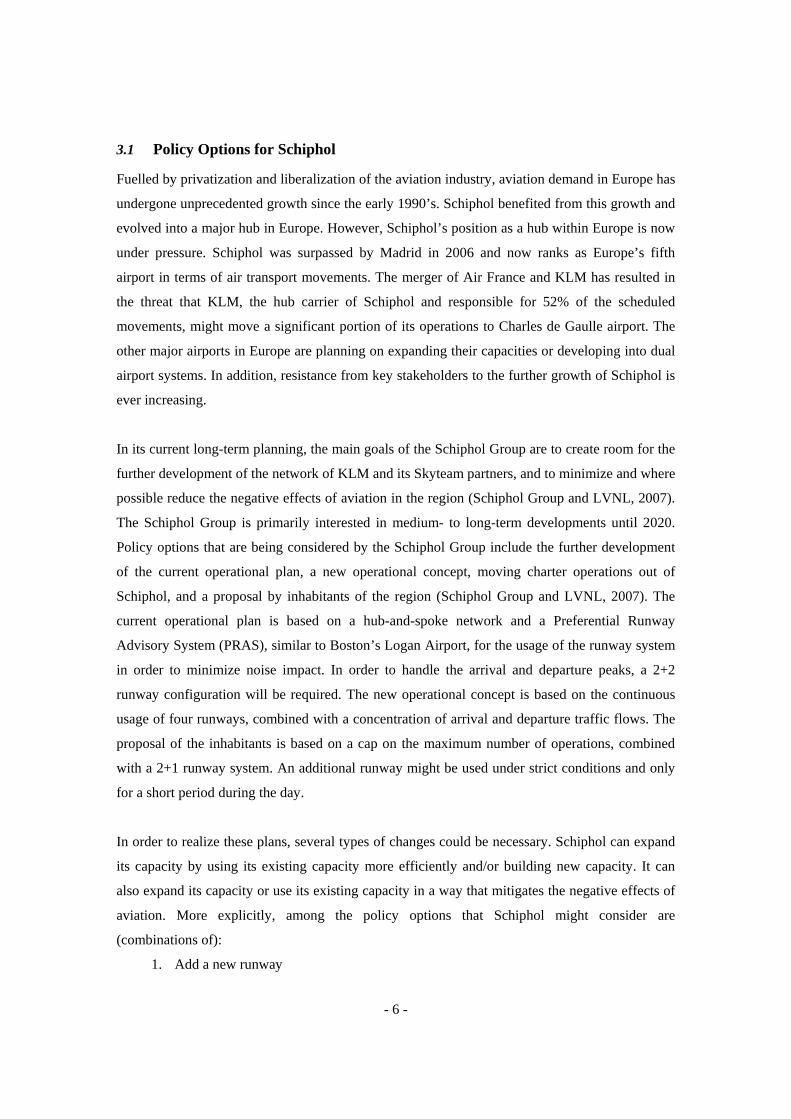
outlined in Figure 2. The domain module contains the logic and data that described the inner
workings of the airport system, the external forces, and the different policies. The analysis
module contains the logic for calculating the different airport performance metrics. The elements
in this module will gather the required input data and process the results; however, the actual
calculations are delegated to these specific tools in the tools module. The tools module contains
the logic for running the tools. In some cases, a tool specific wrapper is needed, in other cases the
tool is implemented in the programming language of choice directly. Below, we briefly discuss
the different tools that have been used.
- 8 -
Figure 2: Modular Design of the Model
3.2.1 Capacity
There are a number of tools available for airport capacity and delay analysis. At the level of
macroscopic tools, there is not a single tool that covers both the runway system and terminal
system. There are attempts to integrate several tools into a single tool for integrated airport
capacity analysis. However, these integrated tools are not yet readily available. Given availability
and prior experience, we have chosen to use the FAA Airfield Capacity Model (FCM) (Tse,
2006).
FCM calculates the maximum throughput capacity of a runway system, based on an extended
version of the classic Blumstein model (de Neufville and Odoni, 2003). In order to calculate
capacity for the entire runway system, first, the capacity of the different runway configurations
needs to be calculated. The maximum throughput capacity of a runway configuration depends on
the maximum throughput capacity of the sets that make up the runway configuration. In addition,
data that describe the traffic stream, data pertaining to the ATM system, and some additional
characteristics of the runways are needed. FCM is a FORTRAN model. In order to interface with
it, input text files of a specific format need to be generated (FAA, 1981). Next the model is run
and an output text file is generated. This output text file needs to be parsed to extract the relevant
outputs (Tse, 2006)
- 9 -
3.2.2 Emissions
Analysis of the emissions generated by an airport starts with an emission inventory. If necessary,
this can be used for dispersion analysis. Currently, a tool for emission inventory analysis has been
integrated into the model. Dispersion analysis is currently left out. There are several tools
available for emission inventory analysis.. EDMS is the FAA required tool for emission analysis
in the United States. Given the availability and prior experience with this tool, we have chosen to
use EDMS in the model (Vreeswijk, 2007).
In order to calculate emissions, first a choice of emission types and sources of emissions needs to
be made. Next, for each emission source, the number of sources needs to be determined.
Similarly, for each source, the rate of emission of a specific type needs to be determined. By
multiplying the number of a given source, with the emission rate, and the duration of the
emission, the total emission of a specific type for a specific source can be calculated (Vreeswijk,
2007). For aircraft emissions, calculating emissions it is slightly more complex. The emission rate
of a specific emission type depends on the power setting of the engines, which in turn depend on
the Landing Take Off (LTO) cycle of an aircraft. Similarly the duration of an emission is the time
that an aircraft is in a specific part of the LTO cycle. To further complicate calculations, for each
source, there can be multiple different emitters each with its own characteristics. For example, the
emissions for aircraft (a source) depend on the engines. Each engine has its own emission
characteristics. In order to calculate the overall emissions of an airport, the total emissions from a
specific source need to be determined. Next, these can be summed up across the different sources
in order to determine the total emissions. Currently, only the emissions from aircraft are
calculated. The types of emissions that are considered include CO, NOx, Hydro Carbons (HC),
and SOx.
3.2.3 Third Party Risk
There are a number of tools available for estimating the risks of aircraft crashes. We choose the
tool developed by the National Air Traffic Services (NATS) for several reasons. Most
importantly, a comparison of several different tools showed that the NATS model was the most
promising (Heblij, 2004). In addition, the tool was available, and there was prior experience with
it. Given the modular nature of the fast and simple model, it is always possible to replace the
NATS model with an alternative if this is deemed necessary.
- 10 -
The NATS tool estimates the risk contours and the fatality rate around an airport. First, the risk of
a crash of an individual flight is calculated. For this, aircraft are categorized into different classes,
depending on among others engine type and payload type. The probability of a crash is
empirically derived from a dataset containing crash data from 1979-2000. Next, the probabilities
of a crash are divided into four separate categories: landing crash from flight, landing overrun
crash, take-off overrun crash, and take-off crash from flight. Third, each of these types of crashes
has a distinct area where the crash can occur. This is described using a probability density
function that gives the probability of a crash on a specific location. The final step is to determine
the consequences of a crash in terms of the external fatality rate. In this calculation a distinction is
made between the destroyed area and the debris area. The respective size of these areas depends
on the Maximum Take-Off Weight Authorized. By combining this with data on the population
density, expected fatality rates and the number of people within a given risk contour can be
calculated (Heblij, 2004).
In order to determine the risk contours for an airport, the location of the runways and the
evaluation area are needed. Based on this, a 2-D grid can be generated. For each point in the grid,
the different calculations are carried out. So, the probability of each type of crash is calculated for
each point, resulting in a crash distribution. By combining the crash distribution with data about
the operations on the airport and how these operations are distributed over the different runways,
a risk distribution can be generated. In its current implementation, it is assumed that all runways
serve the same traffic mix. In the case of Schiphol, this is a reasonable assumption. However,
policy option 4 introduced in section 3 (Use the existing runway system in a way that minimizes
noise impacts) cannot be considered, for such an approach could result in changing the mix of
aircraft across runways.
3.2.4 Noise
Arguably, the de-facto standard tool for noise analysis is the Integrated Noise Model (INM). It
was developed by the FAA and is widely used around the world. INM calculates noise contours
by first computing the arrival and departure flights paths. Next, the acoustics are determined, and
the noise from a single operation on a specific location is calculated. INM will produce detailed
noise contours; however it requires significant input data in order to do so (Heblij, 2004). In
response to this, the FAA has developed a simple screening tool, the Area Equivalent Method
(AEM) (FAA, 2008). This tool can estimate the size of noise contours as a function of aircraft
operations. Underneath, it uses the same logic as INM, but it does not take the flight paths into
- 11 -
consideration. According to the FAA, AEM can be used to asses whether a detailed INM study is
needed, assuming that the main factor that changes is the aircraft mix (FAA, 2008). Given the
explicit purpose of the fast and simple model to explore a wide variety of futures, calculation
speed is important. In addition, it is assumed that the model is used to explore a range of futures
and strategies, allowing a richer exploration of specific futures and strategies. As such, we believe
that AEM is adequate for this purpose.
3.3 Limitations of the Current Implementation
The model has been implemented using the object oriented programming language Python.
Python was chosen for several reasons. First, it is a flexible high level programming language that
allows for mixing different programming paradigms (e.g. object orientation, procedural). Next,
Python has a good track record with respect to the ease of integrating software written in other
programming languages. It is often used as glue between different applications. Third, EDMS and
NATS were already implemented in Python and there also was a Python wrapper available for
FCM. Finally, functionality needed in the domain module was also available in Python through
earlier projects (Heblij, 2004; Tse, 2006; Vreeswijk, 2007; Wijnen et al., 2008).
During the implementation, several simplifications were made. First, with respect to emissions,
we focused for now on only calculating aircraft emissions, which is the most important source of
emissions at airports. Next, a very important element is the distribution of aircraft over the
different runway configurations. In practice, this distribution is the result of an operation plan on
the one hand and weather conditions on the other. We simply use the percentage, and do not
specify how this percentage emerges from the interaction between an operational plan and the
weather conditions. Third, we analyzed the Official Airline Guide (OAG) data for Amsterdam
Airport Schiphol, and tried to minimize the number of different aircraft-engine combinations. In
general, we used the aircraft-engine combination of KLM as default for each IATA aircraft
classification. In other words, we assumed that each IATA aircraft classification maps one to one
to a specific aircraft-engine combination. Furthermore, we minimized the variation of different
types of the same aircraft. For example, we only use a single type of Boeing 737. In principle, a
richer description of the fleet operating on Amsterdam Airport Schiphol could be generated if this
is deemed necessary.
If we compare the current implementation with both Figure 1 and the list of policy options from
Section 3.1, the following limitations emerge. First, with respect to the airport system, we only
- 12 -
consider the runway system and the ATM system. The terminal system and system of hinterland
connections are currently left out. The main reason for this is that FCM, the tool for capacity
analysis, does not consider terminal capacity. Next, we compute only capacity and do not
consider delays. Again, this limitation is the result of the chosen tool. Third, to no tool is
currently included for calculating costs and revenues. To our knowledge, there is currently no
generic tool to calculate these. Cost and revenues are airport specific and dependent highly on
local accounting rules and practices. However, it might be worthwhile to explore costs and
revenues a bit more and perhaps include some high level rules of thumb, such as return on
investment (ROI), in a future version of the model. Fourth, by choosing AEM for noise
calculations, the impact of changes in the tracks leading from and to the airport on noise cannot
be considered. Related to this, currently only the area of a noise contour is calculated. No attempt
is made to translate this to hindrance (e.g. annoyance, disturbance, awakenings etc.) for the
population. As such, an analysis of policy option 7 (invest in noise insulation) is beyond the scope
of the model. Sixth, for all performance indicators, the value on a yearly basis is estimated.
Finally, although there are ways in which to model the impact of the different external forces on
the system, a clear mapping is currently missing. For example, climate change can result in
changes in the wind conditions, in turn affecting the usage of the different runway configurations.
Currently, there is no logic that will make the translation from climate change to the usage
percentage.
4 Preliminary Model Validation
The model has been validated against the results of previous studies that used more detailed tools
and techniques, with Amsterdam Airport Schiphol as a case study. A separate validation of the
respective tools that are integrated in the model is not necessary, since these third party tools have
each been validated separately. The focus of our validation was thus on validating the integration
of the separate tools. Amsterdam Airport Schiphol was chosen for several reasons. It is a
relatively large airport with multiple runways and a diversity of aircraft that serve the airport. If
the model produces adequate results for such an airport it is plausible that the results for smaller
or larger airports, with the respective differences in demand and complexity of the runway system
etc., will also be valid. In addition, the necessary data for performing this analysis was readily
available. Finally, extensive case studies of Amsterdam Airport Schiphol using the different tools
that are integrated have been carried out in the past. The results of these studies are available.
These can thus be used as a benchmark against which the performance of the model can be
validated.
- 13 -
4.1 Amsterdam Airport Schiphol
Before going into the detailed analysis and comparison of results, we first introduce the most
important data that are used by the model. Where possible, we used the same data that were used
in the original study. However, not all of these data were available, and it was also not always
clear from the reports of the studies what data had been used. It would be beyond the scope of this
paper to provide all the data that are used. However, we briefly discuss the most important data
below.
4.1.1 Input Data
The Airport System
Data describing the airport system is relevant for all tools apart from AEM. Of specific relevance
are the lay-out of the airfield, the runway configurations, and how these configurations are used
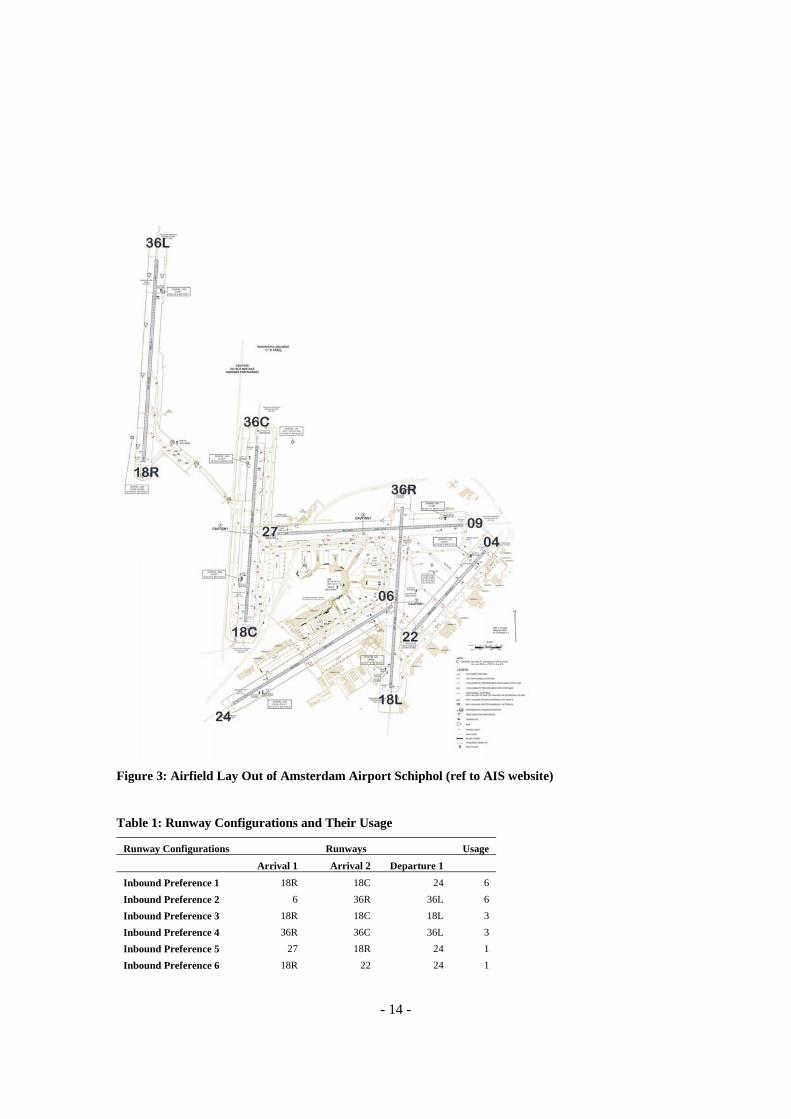
across the year. Figure 3 shows the airfield lay-out, including the names of the runway ends. For
the NATS tool, the latitude and longitude of these runway-ends are needed in order to generate
the grid that is used in its calculations. Table 1 gives an overview of how the different runways
are combined into runway configurations and what the actual usage of these configurations was in
2006 (Tse, 2006). Admittedly, the impact of the actual wind conditions, an external factor, is
already factored into these figures.
- 14 -
Figure 3: Airfield Lay Out of Amsterdam Airport Schiphol (ref to AIS website)
Table 1: Runway Configurations and Their Usage
Runway Configurations Runways Usage
Arrival 1 Arrival 2 Departure 1
Inbound Preference 1 18R 18C 24 6
Inbound Preference 2 6 36R 36L 6
Inbound Preference 3 18R 18C 18L 3
Inbound Preference 4 36R 36C 36L 3
Inbound Preference 5 27 18R 24 1
Inbound Preference 6 18R 22 24 1
- 15 -
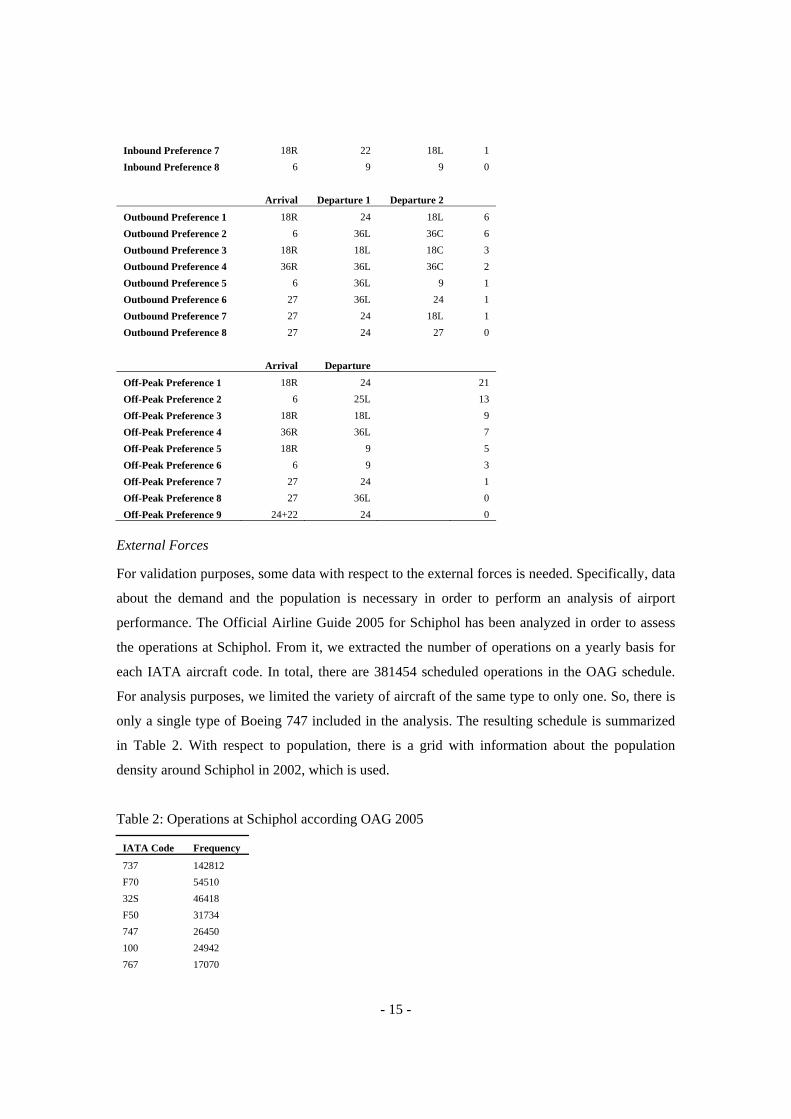
Inbound Preference 7 18R 22 18L 1
Inbound Preference 8 6 9 9 0
Arrival Departure 1 Departure 2
Outbound Preference 1 18R 24 18L 6
Outbound Preference 2 6 36L 36C 6
Outbound Preference 3 18R 18L 18C 3
Outbound Preference 4 36R 36L 36C 2
Outbound Preference 5 6 36L 9 1
Outbound Preference 6 27 36L 24 1
Outbound Preference 7 27 24 18L 1
Outbound Preference 8 27 24 27 0
Arrival Departure
Off-Peak Preference 1 18R 24 21
Off-Peak Preference 2 6 25L 13
Off-Peak Preference 3 18R 18L 9
Off-Peak Preference 4 36R 36L 7
Off-Peak Preference 5 18R 9 5
Off-Peak Preference 6 6 9 3
Off-Peak Preference 7 27 24 1
Off-Peak Preference 8 27 36L 0
Off-Peak Preference 9 24+22 24 0
External Forces
For validation purposes, some data with respect to the external forces is needed. Specifically, data
about the demand and the population is necessary in order to perform an analysis of airport
performance. The Official Airline Guide 2005 for Schiphol has been analyzed in order to assess
the operations at Schiphol. From it, we extracted the number of operations on a yearly basis for
each IATA aircraft code. In total, there are 381454 scheduled operations in the OAG schedule.
For analysis purposes, we limited the variety of aircraft of the same type to only one. So, there is
only a single type of Boeing 747 included in the analysis. The resulting schedule is summarized
in Table 2. With respect to population, there is a grid with information about the population
density around Schiphol in 2002, which is used.
Table 2: Operations at Schiphol according OAG 2005
IATA Code Frequency
737 142812
F70 54510
32S 46418
F50 31734
747 26450
100 24942
767 17070
- 16 -
M11 9388
777 8390
M80 5684
330 4502
D10 4466
757 2918
AB3 1110
340 644
310 416
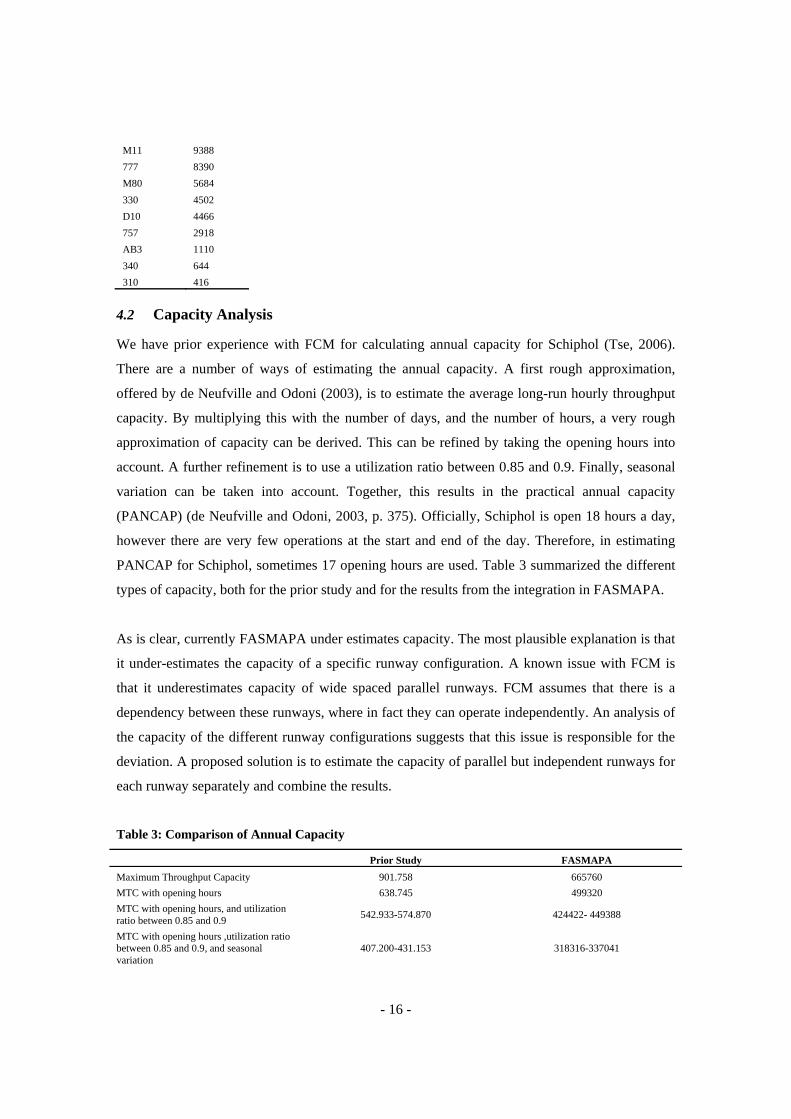
4.2 Capacity Analysis
We have prior experience with FCM for calculating annual capacity for Schiphol (Tse, 2006).
There are a number of ways of estimating the annual capacity. A first rough approximation,
offered by de Neufville and Odoni (2003), is to estimate the average long-run hourly throughput
capacity. By multiplying this with the number of days, and the number of hours, a very rough
approximation of capacity can be derived. This can be refined by taking the opening hours into
account. A further refinement is to use a utilization ratio between 0.85 and 0.9. Finally, seasonal
variation can be taken into account. Together, this results in the practical annual capacity
(PANCAP) (de Neufville and Odoni, 2003, p. 375). Officially, Schiphol is open 18 hours a day,
however there are very few operations at the start and end of the day. Therefore, in estimating
PANCAP for Schiphol, sometimes 17 opening hours are used. Table 3 summarized the different
types of capacity, both for the prior study and for the results from the integration in FASMAPA.
As is clear, currently FASMAPA under estimates capacity. The most plausible explanation is that
it under-estimates the capacity of a specific runway configuration. A known issue with FCM is
that it underestimates capacity of wide spaced parallel runways. FCM assumes that there is a
dependency between these runways, where in fact they can operate independently. An analysis of
the capacity of the different runway configurations suggests that this issue is responsible for the
deviation. A proposed solution is to estimate the capacity of parallel but independent runways for
each runway separately and combine the results.
Table 3: Comparison of Annual Capacity
Prior Study FASMAPA
Maximum Throughput Capacity 901.758 665760
MTC with opening hours 638.745 499320
MTC with opening hours, and utilization ratio between 0.85 and 0.9
542.933-574.870 424422- 449388
MTC with opening hours ,utilization ratio between 0.85 and 0.9, and seasonal variation
407.200-431.153 318316-337041
- 17 -
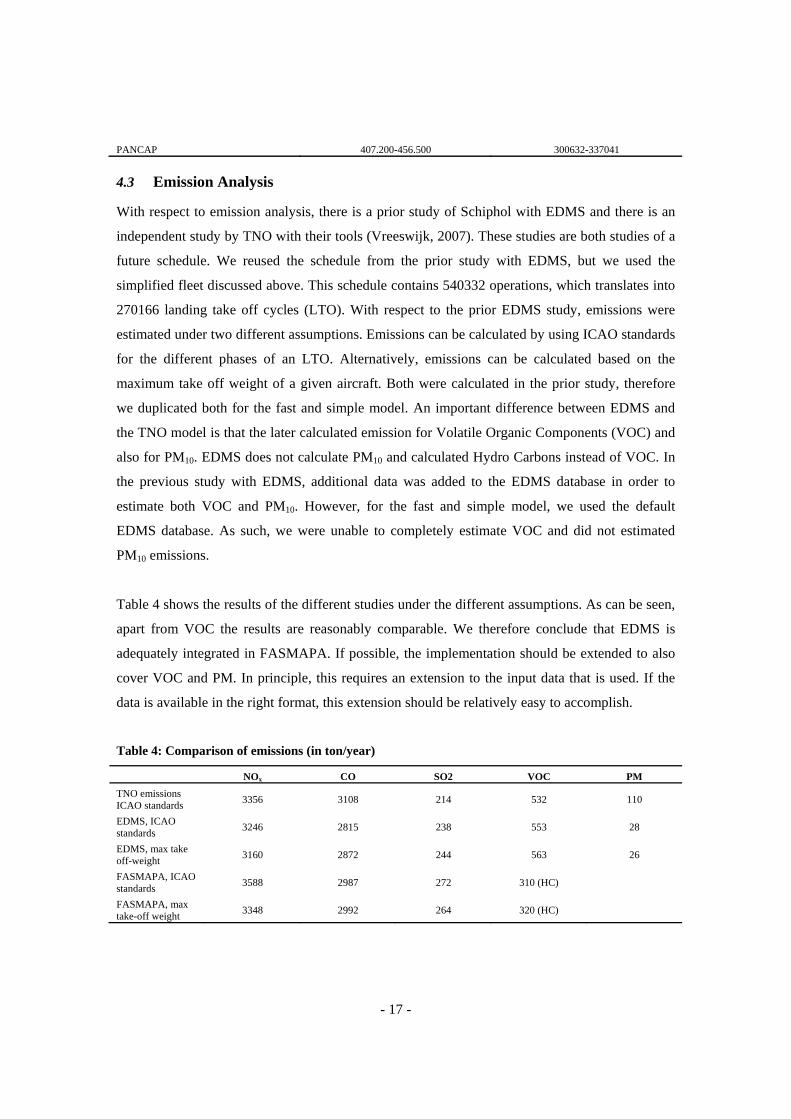
PANCAP 407.200-456.500 300632-337041
4.3 Emission Analysis
With respect to emission analysis, there is a prior study of Schiphol with EDMS and there is an
independent study by TNO with their tools (Vreeswijk, 2007). These studies are both studies of a
future schedule. We reused the schedule from the prior study with EDMS, but we used the
simplified fleet discussed above. This schedule contains 540332 operations, which translates into
270166 landing take off cycles (LTO). With respect to the prior EDMS study, emissions were
estimated under two different assumptions. Emissions can be calculated by using ICAO standards
for the different phases of an LTO. Alternatively, emissions can be calculated based on the
maximum take off weight of a given aircraft. Both were calculated in the prior study, therefore
we duplicated both for the fast and simple model. An important difference between EDMS and
the TNO model is that the later calculated emission for Volatile Organic Components (VOC) and
also for PM10. EDMS does not calculate PM10 and calculated Hydro Carbons instead of VOC. In
the previous study with EDMS, additional data was added to the EDMS database in order to
estimate both VOC and PM10. However, for the fast and simple model, we used the default
EDMS database. As such, we were unable to completely estimate VOC and did not estimated
PM10 emissions.
Table 4 shows the results of the different studies under the different assumptions. As can be seen,
apart from VOC the results are reasonably comparable. We therefore conclude that EDMS is
adequately integrated in FASMAPA. If possible, the implementation should be extended to also
cover VOC and PM. In principle, this requires an extension to the input data that is used. If the
data is available in the right format, this extension should be relatively easy to accomplish.
Table 4: Comparison of emissions (in ton/year)
NOx CO SO2 VOC PM
TNO emissions ICAO standards
3356 3108 214 532 110
EDMS, ICAO standards
3246 2815 238 553 28
EDMS, max take off-weight
3160 2872 244 563 26
FASMAPA, ICAO standards
3588 2987 272 310 (HC)
FASMAPA, max take-off weight
3348 2992 264 320 (HC)
- 18 -
4.4 Third Party Risk Analysis
There have been prior studies using NATS for Schiphol (Heblij, 2004). In addition, there has
been a study by the Dutch Aviation Laboratory (NLR) using their tools. The difference between
the NATS results and the NLR results is in part due to the fact that NLR uses the population data
from 1990, while the NATS results use the population data from 2002 (Table 5). Currently, we
are unable to obtain population counts for the reimplementation of NATS within FASMAPA,
because of problems with the population data. However, for comparison we have included the
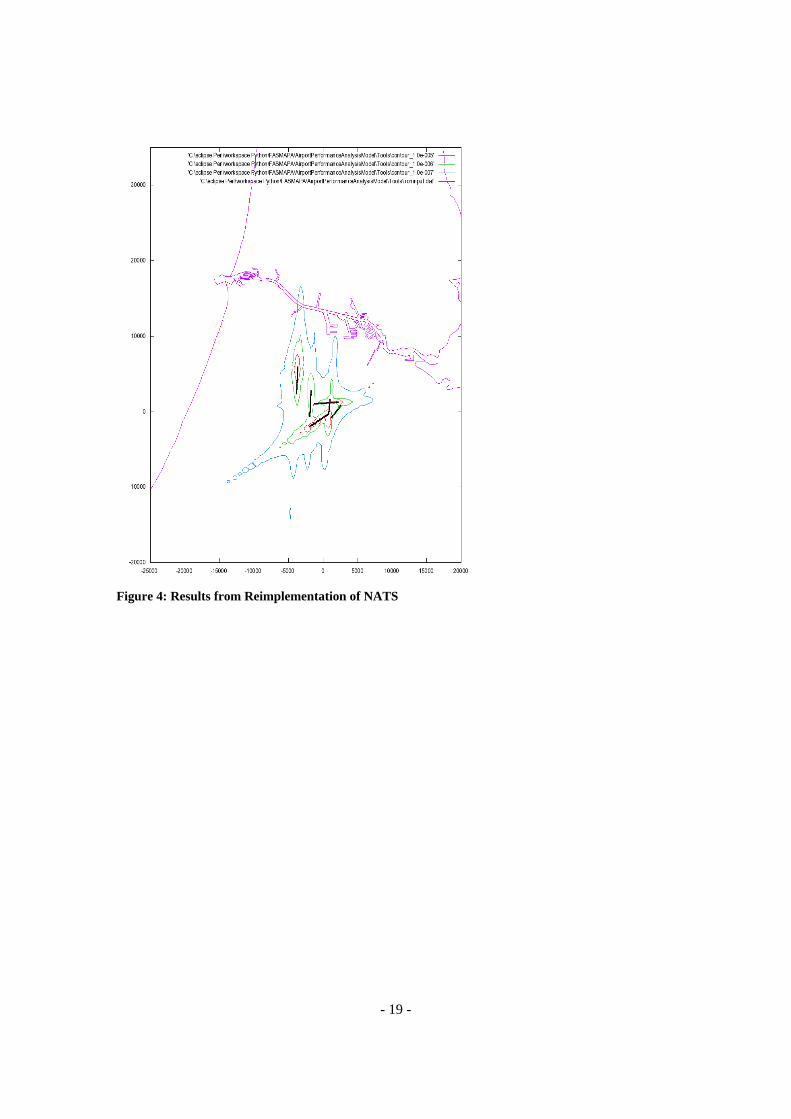
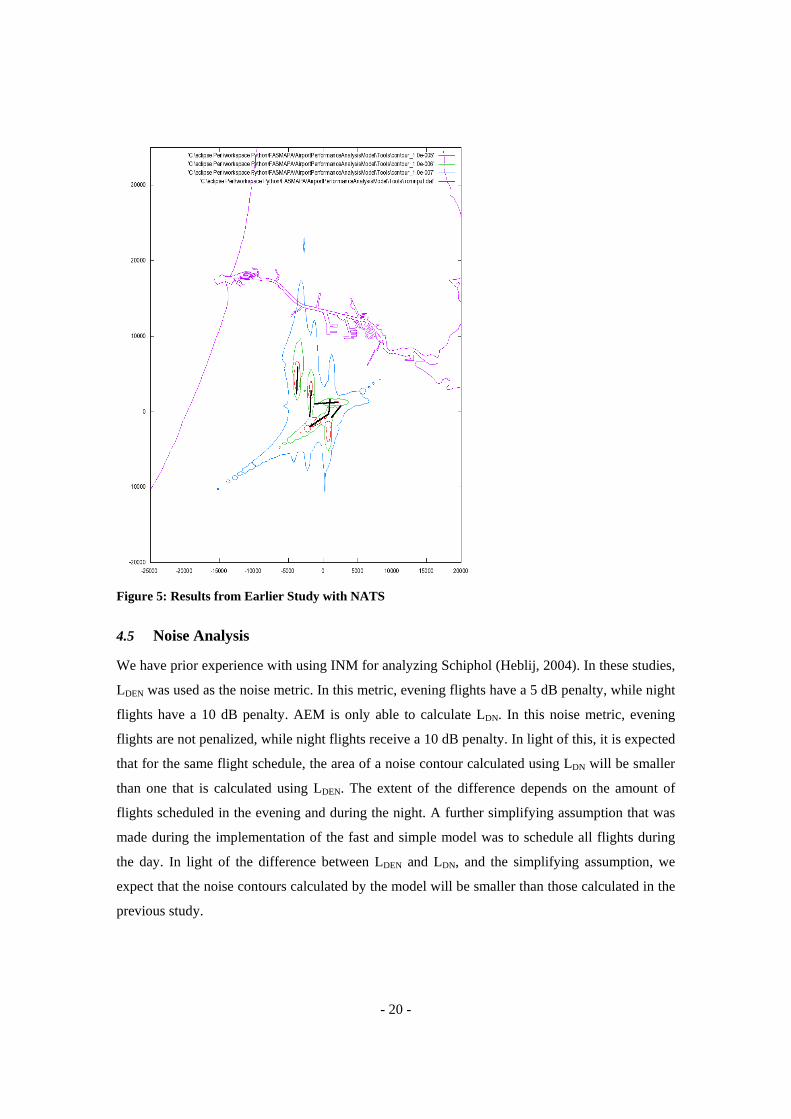
contour plots of both the earlier study carried out with NATS, and the results from a
reimplementation. Figure 4 shows the contour plots from the reimplementation, while Figure 5
shows results from the original implementation. As can be seen, the contour plots are very
similar. The minor differences are due to minor differences in the distribution of flights over the
runways. The schedules that were used were identical.
Table 5: Comparison of Third Party Risk
10-6 contour 10-5 contour
NLR (household count) 36 536
NATS (people) 1410 460
- 19 -
Figure 4: Results from Reimplementation of NATS
- 20 -
Figure 5: Results from Earlier Study with NATS
4.5 Noise Analysis
We have prior experience with using INM for analyzing Schiphol (Heblij, 2004). In these studies,
LDEN was used as the noise metric. In this metric, evening flights have a 5 dB penalty, while night
flights have a 10 dB penalty. AEM is only able to calculate LDN. In this noise metric, evening
flights are not penalized, while night flights receive a 10 dB penalty. In light of this, it is expected
that for the same flight schedule, the area of a noise contour calculated using LDN will be smaller
than one that is calculated using LDEN. The extent of the difference depends on the amount of
flights scheduled in the evening and during the night. A further simplifying assumption that was
made during the implementation of the fast and simple model was to schedule all flights during
the day. In light of the difference between LDEN and LDN, and the simplifying assumption, we
expect that the noise contours calculated by the model will be smaller than those calculated in the
previous study.
- 21 -
Table 6 shows the results from both the previous study and the results from FASMAPA. These
results are in line with our expectations. However, to increase our confidence in the adequacy of
the results, the simplifying assumption should be dropped, and the size of the contours should be
compared again.
Table 6: Comparison of Noise contours
Area (KM2) of the 50 db(A) contour
Area (KM2) of the 60 db(A) contour
Area (KM2) of the 70 db(A) contour
Previous study using INM (Lden contour)
287.8 55.0 9.8
FASMAPA AEM (LDN) 180.3 28.0 4.4
5 Conclusions and Further Research
We started from the observation that uncertainty is a growing concern in ASP. Currently, the
tools and techniques that are used in ASP to estimate airport performance limit the range of
futures and strategies that can be explored. The different tools only focus on a single airport
performance metric, use inconsistent input data, and are generally dispersed across the different
actors involved in ASP. As a result, in ASP only a limited number of strategies and futures can be
considered.
To cope with the many and profound uncertainties that airports face in ASP there is a clear need
for a fast and simple model to explore a wide range of futures and strategies and their impacts and
key airport performance metrics. By integrating different tools into a single model, the problems
of inconsistent input data, and dispersion across actors is overcome, and a quick exploration of a
wide variety of futures and strategies becomes possible. Such a model will allow planners to
explore a range of futures and strategies and focus in the subsequent detailed analysis on the most
promising strategies and the most problematic futures.
Such a fast and simple model can also be used to conduct computational experiments in order to
assess the efficacy of new adaptive airport strategic planning approaches. In response to the
growing concerns about uncertainty, adaptive planning approaches have been suggested.
However, these have seen limited use until now, in part because the efficacy of these approaches
is put into question. In order to increase the wiliness of airport operators to accept these new
approaches, computational experiments can be conduced. In these experiments, adaptive
strategies are compared with traditional master plans across a range of futures. If the adaptive
- 22 -
strategies produce preferred over traditional master plans, this offers supportive evidence for the
efficacy of these new approaches.
We presented a fast and simple model for airport performance analysis. In this model tools for
analyzing capacity, emissions, external safety, and noise have been integrated. The model is
based on a modular design. Therefore, it is possible to replace a specific tool for calculating a
specific airport performance metric with other tools if necessary. Currently, the model integrated
tools for calculating capacity, emissions, external safety and noise. We validated the model by
comparing it with prior studies of Schiphol and conclude that the results look promising.
Although a number of possible improvements have been identified, the results of the fast and
simple model match the results of previous studies of Schiphol reasonably well.
References
ASCHER, W. (1978) Forecasting: An Appraisal for Policy Makers and Planners, Baltimore,
Johns Hopkins University Press.
BANKES, S. (1993) Exploratory Modeling for Policy Analysis. Operations Research, vol. 4, no.
3, pp.
BURGHOUWT, G. (2007) Airline Network Development in Europe and its Implications for
Airport Planning, Burlington, USA, Ashgate Publishing Company.
BURGHOUWT, G. & HUYS, M. (2003) Deregulation and the Consequences for Airport
Planning in Europe. DISP, vol. 154, no., pp. 37-45.
DE NEUFVILLE, R. (1991) Strategic Planning for Airport Capacity: An Appreciation of
Australia's Process for Sydney. Australian Planner, vol. 4, no. 29, pp. 174-180.
DE NEUFVILLE, R. (2000) Dynamic Strategic Planning for Technology Policy. International
Journal of Technology Management, vol. 19, no. 3-5, pp. 225-245.
DE NEUFVILLE, R. & ODONI, A. (2003) Airport Systems: Planning, Design, and
Management, New York, McGraw-Hill.
DEMPSEY, P. S., GOETZ, A. R. & SZYLIOWICZ, J. S. (1997) Denver International Airport:
Lessons Learned, New York, McGraw-Hill.
FAA (1981) Upgraded FAA Airfield Capacity Model. Washington D.C., Federal Aviation
Administration.
FAA (2008) AEM User's Guide. Washington D.C., Federal Aviation Administration.
FLYVBJERG, B., BRUZELIUS, N. & ROTHENGATTER, W. (2003) Megaprojects and Risk:
An Anatomy of Ambition, Cambridge, Cambridge University Press.
- 23 -
HANSMAN, R. J., MAGEE, C., DE NEUFVILLE, R., ROBINS, R. & ROOS, D. (2006)
Research agenda for an integrated approach to infrastructure planning, design, and
management. International Journal of Critical Infrastructures, vol. 2, no. 2-3, pp. 146-
159.
HEBLIJ, S. J. (2004) Development of a Runway Allocation Optimisation Model. Faculty of
Aerospace Engineering. Delft, Delft University of Technology.
IATA (2004) Airport Development Reference Manual. Montreal, IATA.
ICAO (1987) Airport Planning Manual, Part 1, Master Planning. Montreal, Canada, ICAO.
KWAKKEL, J. H., WALKER, W. E. & MARCHAU, V. A. W. J. (2008a) Adaptive Airport
Strategic Planning. IN ZUYLEN, H. J. V. & BINSBERGEN, A. J. V. (Eds.) 10th
International Trail Congress. Rotterdam, The Netherlands.
KWAKKEL, J. H., WALKER, W. E. & MARCHAU, V. A. W. J. (2008b) Adaptive Airport
Strategic Planning. IN ZUYLEN, H. J. V. & BINSBERGEN, A. J. V. (Eds.) Proceedings
2008, 10th International Trail Congress, Selected Papers. Rotterdam, The Netherlands.
SCHIPHOL GROUP & LVNL (2007) Verder Werken aan de toekomst van Schiphol en de regio
[continue working on the future of Schiphol and the region]. Schiphol Group, Air Traffic
Control the Netherlands.
TSE, T. C. (2006) Airfield Capacity Analysis for Strategic Airport Planning. Faculty of
Aerospace Engineering. Delft, Delft University of Technology.
VISSER, H. G., WIJNEN, R. A. A., CHIN, R. T. H., WALKER, W. E., LANG, N. A., KEUR, J.,
KOHSE, U., VELDHUIS, J. & DE HAAN, A. R. C. (2003) The Airport Business Suite: a
decision support system for airport strategic exploration. 3rd AIAA Aviation Technology,
Integration and Operations Forum. Denver.
VREESWIJK, P. D. (2007) Emission Analysis for Strategic Airport Planning. Faculty of
Aerospace Engineering. Delft, Delft University of Technology.
WIJNEN, R. A. A., WALKER, W. E. & KWAKKEL, J. H. (2008) Decision Support for Airport
Strategic Planning. Transportation Planning and Technology, vol. 31, no. 1, pp. 11-34.
ZOGRAFOS, K. G. & MADAS, M. A. (2007) Advanced Modeling Capabilities for Airport
Performance Assessment and Capacity Management. Transportation Research Record
2007, vol., no., pp. 60-69.