Research in Airport Pavements
123
Research in Airport Pavements SPECIAL REPORT 175 NATIONAL ACADEMY OF SCIENCES
-
Upload
khangminh22 -
Category
Documents
-
view
6 -
download
0
Transcript of Research in Airport Pavements

Research in Airport Pavements SPECIAL REPORT 175
NATIONAL ACADEMY OF SCIENCES

TRANSPORTATION RESEARCH BOARD 1978
Officers
SCHEFFER LANG, Chairman PETER G. KOLTNOW, Vice Chairman W. N. CAREY, JR., Executive Director
Executive Corn mittee
KARL S. BOWERS, Federal Highway Administrator, U.S. Department of Transportation (ex officio) HARVEY BROOKS, Chairman, Commission on Sociotechnical Systems, National Research Council (ex officio) HOWARD L. GAUTHIER, Department of Geography, Ohio State University (ex officio, MTRB) ROBERT N. HUNTER, Chief Engineer, Missouri State Highway Department (ex officio, Past Chairman, 1977) HAROLD L. MICHAEL, Head, Civil Engineering Department, School of Civil Engineering, Purdue University (ex officio, Past Chairman, 1976) RICHARD S. PAGE, Urban Mass Transportation Administrator, U.S. Department of Transportation (ex officio) HENRIK E. STAFSETH, Executive Director, American Association of State Highway and Transportation Officials (ex officio) JOHN McGRATH SULLIVAN, Federal Railroad Administrator, U.S. Department of Transportation (ex officio)
KURT W. BAUER, Executive Director, Southeastern Wisconsin Regional Planning Commission LAWRENCE D. DAHMS, Executive Director, Metropolitan Transportation Commission for the San Francisco Bay Area
L. DeBERRY, Engineer-Director, Texas State Department of Highways and Public Transportation ARTHUR C. FORD, Assistant Vice President—Long Range Planning, Delta Air Lines, Inc. FRANK C. HERRINGER, General Manager, San Francisco Bay Area Rapid Transit District ARTHUR J. HOLLAND, Mayor, city of Trenton, New Jersey ANN R. HULL, Speaker Pro Tern, Maryland House of Delegates ROBERT R. KILEY, Chairman, Massachusetts Bay Transportation Authority PETER G. KOLTNOW, President, Highway Users Federation for Safety and Mobility THOMAS J. LAMPHIER, President—Transportation Division, Burlington Northern, Inc. A. SCHEFFER LANG, Assistant to the President—Staff Studies Group, Association ofAmeri can Railroads ROGER L. MALLAR, Commissioner, Maine Department of Transportation MAR YIN L. MANHEIM, Profearor, Department of Civil Engineering, Massachusetts Institute of Technology DARRELL V MANNING, Director, Idaho Transportation Department ROBERT S. MICHAEL, Director ofA viation, city and county of Denver THOMAS D. MORELAND, Commissioner and State Highway Engineer, Georgia Department of Transportation GEORGE E. PAKE, Vice President, Xerox Corporation, and Manager, Palo Alto Research Center DOUGLAS N. SCHNEIDER, JR., Director, District of Columbia Department of Transportation WILLIAM K. SMITH, Vice President— Transportation, General Mills, Inc. JOHNR. TABB, Director, Mississippi State Highway Department JOHN P. WOODFORD, Director, Michigan Department of State Highways and Transportation
The Transportation Research Board is an agency of the National Re-search Council, which serves the National Academy of Sciences and the National Academy of Engineering. The Board's purpose is to stimulate research concerning the nature and performance of trans-portation systems, to disseminate information that the research pro-duces, and to encourage the application of appropriate research find-ings. The Board's program is carried out by more than 150 commit-tees and task forces composed of more than 1800 administrators, engineers, social scientists, and educators who serve without compen-sation. The program is supported by state transportation and high-way departments, the major administrations of the U.S. Department of Transportation, the Association of American Railroads, and other organizations interested in the development of transportation.
The Transportation Research Board operates within the Commis-sion on Sociotechnical Systems of the National Research Council. The Council was organized in 1916 at the request of President Wood-row Wilson as an agency of the National Academy of Sciences to en-able the broad community of scientists and engineers to associate their efforts with those of the Academy membership. Members of the Council are appointed by the president of the Academy and are drawn from academic, industrial, and governmental organizations throughout the United States.
The National Academy of Sciences was established by a congres-sional act of incorporation signed by President Abraham Lincoln on March 3, 1863, to further science and its use for the general welfare by bringing together the most qualified individuals to deal with sci-entific and technological problems of broad significance. It is a pri-vate, honorary organization of more than 1000 scientists elected on the basis of outstanding contributions to knowledge and is supported by private and public funds. Under the terms of its congressional charter, the Academy is called upon to act as an official—yet inde-pendent—advisor to the federal government in any matter of science and technology, although it is not a government agency and its activ-ities are not limited to those on behalf of the government.
To share in the task of furthering science and engineering and of advising the federal government, the National Academy of Engineer-ing was established on December 5, 1964, under the authority of the act of incorporation of the National Academy of Sciences. Its ad-visory activities are closely coordinated with those of the National Academy of Sciences, but it is independent and autonomous in its organization and election of members.

Research in.:. Airport Pavements SPECIAL REPORT 175
Proceedings of a conference sponsored by the Federal Aviation Administration, U.S.
Department of Transportation, conducted by the Transportation Research Board in
conjunction with the Georgia Institute of Technology; and held November 15-17,1976,
in Atlanta, Georgia.
TRANSPORTATION RESEARCH BOARD
COMMISSION ON SOCIOTECHNICAL SYSTEMS
NATIONAL RESEARCH COUNCIL
National Academy of Sciences 1978

Transportation Research Board Special Report 175 Price $9.20 Edited for TRB by Frances R. Zwanzig
subject areas 04 air transport 25 pavement design 26 pavement performance 33 construction 34 general materials 63 mechanics (earth mass) 64 soil science
Transportation Research Board publications are available by order-ing directly from the board. They may also be obtained on a regular basis through organizational or individual supporting membership in the board; members or library subscribers are eligible for substantial discounts. For further information, write to the Transportation Re-search Board, National Academy of Sciences, 2101 Constitution Avenue, N.W., Washington, D.C. 20418.
Notice The project that is the subject of this report was approved by the Governing Board of the National Research Council, whose membcs are drawn from the councils of the National Academy of Sciences, the National Academy of Engineering, and the Institute of Medicine. The members of the committee responsible for the report were cho-sen for their special competence and with regard for appropriate balance.
This report has been reviewed by a group other than the authors according to procedures approved by a Report Review Committee consisting of members of the National Academy of Sciences, the National Academy of Engineering, and the Institute of Medicine.
The views expressed in this report are those of the authors and do not necessarily reflect the view of the committee, the Transportation Research Board, the National Academy of Sciences, or the sponsors of the project.
Library of Congress Cataloging in Publication Data Conference on Research in Airport Pavements, Atlanta, 1976.
Research in airport pavements.
(Special report - Transportation Research Board, National Research Council; 175)
1. Pavements—Congresses. 2. Airports—Runways. I. United States. Federal Aviation Administration. II. National Research Council. Transportation Research Board. III. Georgia. Institute of Technology, Atlanta. IV. Title. V. Series: National Research Council. Transportation Research Board. Special report - Trans-portation Research Board, National Research Council; 175. TL725.3.P35C66 1976 629.136'34 78-10924 ISBN 0-309-02800-0
Sponsorship of the Papers in This Special Report
GROUP 2—DESIGN AND CONSTRUCTION OF TRANSPORTA-TION FACILITIES Eldon J. Yoder, Purdue University, chairman
Program Committee on Research in Airport Pavements Carl L. Monismith, University of California, Berkeley, chairman Donald M. Arntzen, Ernest J. Baren berg, Richard D. Barksdale, Leo F. Duggan, Ronald L. Hutchinson, Richard B. Kaiser, CariL. Schulten, Matthew W. Witczak
Lawrence F. Spaine, Transportation Research Board staff
The organizational units and officers and members are as of December 31, 1976.
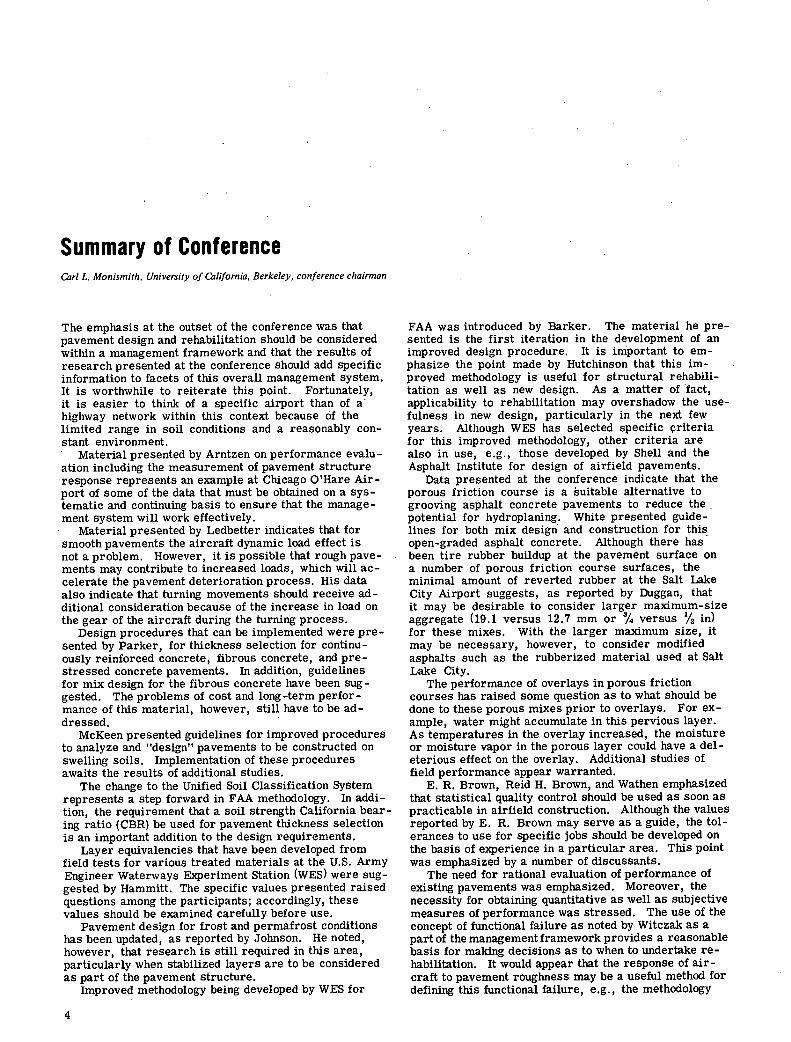
Contents
INTRODUCTION .................................................................1
SUMMARY OF SESSIONS ...........................................................2
SUMMARY OF CONFERENCE .........................................................4
RESEARCH RECOMMENDATIONS .....................................................6
CONFERENCE PAPERS AND PRESENTATIONS ............................................9
Pavement Management Systems
CONSIDERATIONS IN AIRPORT PAVEMENT MANAGEMENT C. L. Mon ismith ..................................................................10
PROCEDURES FOR AIRPORT PAVEMENT MANAGEMENT DonaldM. Arntzen ................................................................. 34
AIRCRAFT- PAVEMENT COMPATIBILITY STUDY F. H. Griffis, Jr., and M. A. Gamon ........................................................ 38
Pavement Design
DESIGN OF PAVEMENT WITH HIGH-QUALITY STRUCTURAL LAYERS (Abridgment) George M. Hammitt ................................................................. 43
STRUCTURAL DESIGN PROCEDURE FOR FLEXIBLE AIRPORT PAVEMENTS (Abridgment) Walter A. Barker .................................................................. 45
PAVEMENT DESIGN: PRESTRESSED, STEEL FIBROUS, AND CONTINUOUSLY REINFORCED CONCRETE FrazierParker,Jr. ................................................................. 46
DESIGN OF. CIVIL AIRFIELD PAVEMENTS FOR SEASONAL FROST AND PERMAFROST CONDITIONS
Thaddeus C. Johnson ............................................................... 53 DESIGN AND CONSTRUCTION OF AIRPORT PAVEMENTS ON EXPANSIVE SOILS (Abridgment)
R. Gordon McKeen ................................................................ 57 SOIL CLASSIFICATION SYSTEMS (Abridgment)
Frederick Horn ................................................................... 60
Materials: Mix Design, Performance, and Quality Control
STATISTICAL QUALITY CONTROL PROCEDURES (Abridgment) E. R. Brown .................................................................... 62
FIELD PERFORMANCE OF POROUS FRICTION SURFACE COURSES (Abridgment) ThomasD. White................................................................... 63
EFFECTIVENESS, SKID RESISTANCE, AND ANTIHYDROPLANING POTENTIAL OF POROUS FRICTION COURSES
LeoF. Duggan .................................................................... 64 FIBROUS CONCRETE CONSTRUCTION AT RENO AND LAS VEGAS AIRPORTS (Abridgment)
RobertA. Lowe ................................................................... 67
Pavement Evaluation and Performance
FRAMEWORK FOR EVALUATION AND PERFORMANCE OF AIRPORT PAVEMENTS M. W. Witczak ................................................................... 69
UI.

iv
AIRCRAFT PAVEMENT LOADING: STATIC AND DYNAMIC R. C. O'Massey .................................................................... 75
FIELD SURVEY AND ANALYSIS OF AIRCRAFT DISTRIBUTION ON AIRPORT PAVEMENTS VictorA. HoSang .................................................................... 84
EFFECTS OF DYNAMIC LOADS ON AIRPORT PAVEMENTS Richard H. Ledbetter ............................................................... 87
DYNAMIC RESPONSE OF AIRCRAFT TO PAVEMENT UNEVENNESS Anthony G. Gerardi ................................................................ 91
ANALYSIS OF AIRPORT RUNWAY ROUGHNESS CRITERIA (Abridgment) Paul N. Sonnenburg ................................................................ 96
NONDESTRUCTIVE TESTING OF AIRPORT PAVEMENTS JamesW. Hall, Jr. ......................... ........................................ 97
NONDESTRUCTIVE TESTING: FREQUENCY SWEEP (Abridgment) NaiC. Yang ...................................................................... 100
NONDESTRUCTIVE TESTING OF FLEXIBLE PAVEMENTS BY USING PROTOTYPE LOADS (Abridgment)
M. E. Harr ...................................................................... 100 PAVEMENT EVALUATION WITH THE FALLING-WEIGHT DEFLECTOMETER (Abridgment)
W. Visser ...................................................................... 103 COMPARISON AND EVALUATION OF NONDESTRUCTIVE TESTING METHODS OF AIRPORT PAVEMENT EVALUATION
ErnestJ. Baren berg ................................................................ 105
CONFERENCE PARTICIPANTS ........................................................113

Introduction
At the request of the Federal Aviation Administration (FAA), the Transportation Research Board of the Na-tional Academy of Sciences planned and conducted the Conference on Research in Airport Pavements. The re-sults of recent research by FAA to update and revise its methodology for airport pavement design and rehabilita-.tionwere presented, comments on the conclusions from the findings were invited, and areas of future research needs were indicated.
The conference was held November 15-17, 1976, in Atlanta, Georgia. Included in the 227 participants from 40 states and 14 foreign countries were representatives of nearly all aspects of the profession—federal, state, and municipal governmental agencies, airport manage-ment and airport engineering agencies, aircraft manu-facturing companies, educational institutions, and con-sulting firms.
Conference sessions were on the following topics:
Pavement Management Systems; Pavement Design Considerations; Pavement Materials—Mix Design, Performance, and
Quality Control; Pavement Evaluation and Performance; Performance Procedures and Summary of Federal
Aviation Administration Research Program
At each half-day session, several papers were presented and open discussions were conducted. Before the ses-sions began, each participant received a copy of FAA
Report FAA-RD-74-35, Criteria for Airport Pavements. Based on presentations and discussions at the con-
ference, the research results that can be implemented now and require no further immediate research effort are those in the following areas:
L. Pavement-aircraft compatibility, Aircraft distribution on airport pavements, Fibrous concrete mix design and construction
procedures, Porous friction courses, Measurement of pavement unevenness, and Statistical quality control and quality assurance
procedures.
Those areas that were considered to be in need of fur-ther study are
Documentation of pavement performance, espe-cially the establishment of a framework and methodology for the systematic and continual monitoring of pavement systems;
Establishment of procedures for nondestructive testing and pavement evaluation; and
Data for improved pavement design procedures including criteria for pavement unevenness for new sur-face construction, effects of frost, on pavement perfor-mance, soil strength evaluation procedures, equivalency values for paving, materials, and design criteria for con-tinuously reinforced and prestressed concrete pavements.

Summary of Sessions Program Committee for the Conference on Research in Airport Pavements
PAVEMENT MANAGEMENT SYSTEMS
Primary discussions during this session centered on the deyelopment of pavement inspection and evaluation pro-cedures and the incorporation of the results into pave-ment management systems. Particular interest was shown in developing pavement inspection programs and correlating observed distress to performance. Several questions were asked of speaker Arntzen regarding the cost of his inspection and pavement evaluation programs. He suggested that periodic (twice yearly) inspection and yearly nondestructive testing (NDT) and evaluation for six runways could be done for $25 000 to $30 000/year.
Questions submitted to speaker Hutchinson after the session indicated some confusion regarding the impor-tance and implementation of the Aircraft-Pavement Com-patibility Study. The discussion indicated that the intro-duction of the 680.4 to 907.2-Mg (1.5 to 2.0 million-lb) aircraft is not expected in the near future.
Several participants asked about runway grooving, particularly its effectiveness, performance, and dura - bility. The ability to regroove or resurface over grooved concrete and asphalt-surfaced pavements was also discussed. None of the participants presented ob-jective data on these subjects, but the consensus seemed to be that grooving is effective and relatively long lasting especially in concrete runways. No particular problems were reported to have occurred during the re-grooving or resurfacing of grooved pavements (either asphalt or concrete surfaced).
PAVEMENT DESIGN CONSIDERATIONS
Many questions and considerable discussion were di-rected to the equivalency factors presented for the var-ious paving materials. Several participants stated that the equivalency values should not be constant and unique quantifiers of a material, but should reflect the influence of the pavement system and especially the properties of the subgrade soil on how various materials affect pave-ment performance. The effect of the frost design pro-cedures on the relative equivalency values was ques-tioned, but it was apparent that no objective information defining this relation is available. The thrust of these concerns and questions seemed to be that, if valid de-sign procedures were developed, they should incorporate actual material properties so that the material proper-ties would not need to be expressed in terms of the equivalency values. -
With regard to the revised design procedures for flex-ible pavements that are under development and were summarized by Barker, questions were added concern-ing validation procedures and methods of evaluating pav-
ing material and subgrade properties for inclusion therein. Most questions related to implementation and use of the procedure rather than to the basic approach, although concern was expressed that the procedure seemed somewhat oversimplified for a comprehensive rational design. The point that the proposed procedure was a first iteration of a possible multiple iterative ap-proach seemed to be missed by most participants.
The number of comments and questions about fibrous concrete indicated a high degree of interest in this sub-ject. The questions or comments did not seem to ques-tion fibrous concrete as a potential paving material, but indicated a need to develop performance history for the material under realistic service conditions.
Several questions about the effects of frost and perma-frost on design and performance went unanswered, sug-gesting a need for further studies in this area.
There were several comments and questions concern-ing FAA's change to the Unified Soil Classification Sys-tem. An essential point made by Horn was that the uni-fied system is intended to classify soils only insofar as their susceptibility to frost and moisture, but that the actual pavement design would be based on an evaluation of the strength of the subgrade soil.
PAVEMENT MATERIALS—MIX DESIGN, PERFORMANCE, AND QUALITY CONTROL
The major discussion in this session centered on the statistical quality control procedures and especially the typical values developed for limiting the variability of the materials. Great concern was expressed over the assignment of penalties for inferior quality material. A question was posed as to whether the suggested penalties were reflective of the potential loss in performance of the total pavement system or were arbitrary values. It was pointed out that there is a basic difference between quality control and quality assurance testing and that these concepts should be kept separate. The thrust of the discussion was that the concept of statistical proce-dures for quality assurance is good, but the participants were not willing to accept either the levels of variability indicated in the presentations or the penalties suggested. More data are obviously needed to justify the suggested values before these procedures can be applied.
There were several questions and some discussion about the effectiveness of the porous friction course (PFC) and the problems of tire rubber buildup and re-moval. The performance and cost-effectiveness of the PFC have been reported to be generally good, but further study is needed of rubber removal and procedures for overlaying pavements having PFC surfaces.

The edge curling of fibrous concrete slabs was dis-cussed and, although the phenomenon was never fully ex-plained, it appears there may be a need to observe and analyze curling in thin fibrous concrete overlays and the effect of curling on the performance of these systems.
PAVEMENT EVALUATION AND PERFORMANCE
The discussion in this session included questions related to the framework for evaluation and performance of pave-ments presented by Witczak. These questions focused on the effect of subgrade properties on the evaluation procedure and the relative importance of sampling ver-sus nondestructive testing. Witczak believes that some sampling tests will always be needed to complement NDT evaluation.
The discussion of commercial aircraft gear loads brought out two facts: (a) Dynamic wheel loads in excess of the static wheel loads can occur during takeoff and landing, and (b) mostaircraft operations are concen-trated nearer the centerline of the pavements than was previously believed. This suggests the use of keel (thickened center) sections as a practical approach to new pavement design. It was brought out that thicker overlays near the center of the pavements would be over the areas with the most frequent traffic loading. It was noted, however, that with some pavements there would have to be a waiver of the maximum transverse slope in order to use a nonuniform overlay.
The lack of a criterion for tolerable runway uneven-ness was discussed, but no consensus was reached re-garding the need for such a criterion. Some suggested that pavement unevenness may lead to fatigue failure of aircraft components, but this was disputed by repre-sentatives of aircraft manufacturers, who pointed out that, since aircraft spend so much more time in mo-tion in the air than on the ground, any cumulative structural damage during ground operations is insig-nificant.
PERFORMANCE PROCEDURES AND SUMMARY OF FEDERAL AVIATION ADMINISTRATION RESEARCH PROGRAM
In this session, and to some extent in the preceding one, there were some lively discussions on the merits and validity of nondestructive testing and evaluating of pave-ments
ave-ments and the procedures for doing so. The questions centered on two main topics: (a) Can results from NDT be used to determine pavement rehabilitation require-ments? and (b) Which of the NDT procedures and cor-responding methods of pavement evaluation is best? Cor-relative questions dealt with whether NDT procedures can stand alone in evaluating pavements or whether other forms of sampling and tests are also required. The con-sensus was that much can be done to improve the nonde-structive testing and evaluation procedures to make them more self-sufficient but that some form of sampling and testing is necessary to define critical properties of pav-ing materials and pavement sections. Much interest was shown in the development of validation procedures for NDT and pavement evaluation. It was noted that at this time all validation is made strictly on the basis of corre-lation with results from earlier pavement evaluation pro-cedures. There were several suggestions that NDT and evaluation procedures should be on a more fundamental basis.
Another point of discussion dealt with whether a method of NDT and pavement evaluation should be selected from the two presented at the conference and currently being applied on an experimental basis or whether the develop-ment of more techniques should be encouraged. This question was not satisfactorily resolved: The "funda-mentalists" appeared to favor development of more and improved procedures, and the operational people ap-peared to favor selecting one or two procedures and ap-proving them for application and implementation. It is apparent that more research is needed on the NDT pro-cedures and the concomitant pavement evaluation.
Summary of Conference Carl L. Monismith, University of California, Berkeley, conference chairman
The emphasis at the outset of the conference was that pavement design and rehabilitation should be considered within a management framework and that the results of research presented at the conference should add specific information to facets of this overall management system. It is worthwhile to reiterate this point. Fortunately, it is easier to think of a specific airport than of a highway network within this context because of the limited range in soil conditions and a reasonably con-stant environment.
Material presented by Arntzen on performance evalu-ation including the measurement of pavement structure response represents an example at Chicago O'Hare Air-port of some of the data that must be obtained on a sys-tematic and continuing basis to ensure that the manage-ment system will work effectively.
Material presented by Ledbetter indicates that for smooth pavements the aircraft dynamic load effect is not a problem. However, it is possible that rough pave-ments may contribute to increased loads, which will ac-celerate the pavement deterioration process. His data also indicate that turning movements should receive ad - ditional consideration because of the increase in load on the gear of the aircraft during the turning process.
Design procedures that can be implemented were pre-sented by Parker, for thickness selection for continu-ously reinforced concrete, fibrous concrete, and pre-stressed concrete pavements. In addition, guidelines for mix design for the fibrous concrete have been sug-gested. The problems of cost and long-term perfor-mance of this material, however, still have to be ad-dressed.
McKeen presented guidelines for improved procedures to analyze and "design" pavements to be constructed on swelling soils. Implementation of these procedures awaits the results of additional studies.
The change to the Unified Soil Classification System represents a step forward in FAA methodology. In addi-tion, the requirement that a soil strength California bear-ing ratio (CBR) be used for pavement thickness selection is an important addition to the design requirements.
Layer equivalencies that have been developed from field tests for various treated materials at the U.S. Army Engineer Waterways Experiment Station (WES) were sug-gested by Hammitt. The specific values presented raised questions among the participants; accordingly, these values should be examined carefully before use.
Pavement design for frost and permafrost conditions has been updated, as reported by Johnson. He noted, however, that research is still required in this area, particularly when stabilized layers are to be considered as part of the pavement structure.
Improved methodology being developed by WES for
FAA was introduced by Barker. The material he pre-sented is the first iteration in the development of an improved design procedure. It is important to em-phasize the point made by Hutchinson that this im-proved methodology is useful for structural rehabili-tation as well as new design. As a matter of fact, applicability to rehabilitation may overshadow the use-fulness in new design, particularly in the next few years. Although WES has selected specific criteria for this improved methodology, other criteria are also in use, e.g., those developed by Shell and the Asphalt Institute for design of airfield pavements.
Data presented at the conference indicate that the porous friction course is a uitable alternative to grooving asphalt concrete pavements to reduce the potential for hydroplaning. White presented guide-lines for both mix design and construction for this open-graded asphalt concrete. Although there has been tire rubber buildup at the pavement surface on a number of porous friction course surfaces, the minimal amount of reverted rubber at the Salt Lake City Airport suggests, as reported by Duggan, that it may be desirable to consider larger maximum-size aggregate (19.1 versus 12.7 mm or 3/4 versus 1/2 in) for these mixes. With the larger maximum size, it may be necessary, however, to consider modified asphalts such as the rubberized material used at Salt Lake City.
The performance of overlays in porous friction courses has raised some question as to what should be done to these porous mixes prior to overlays. For ex-ample, water might accumulate in this pervious layer. As temperatures in the overlay increased, the moisture or moisture vapor in the porous layer could have a del-eterious effect on the overlay. Additional studies of field performance appear warranted.
E. R. Brown, Reid H. Brown, and Wathen emphasized that statistical quality control should be used as soon as practicable in airfield construction. Although the values reported by E. R. Brown may serve as a guide, the tol-erances to use for specific jobs should be developed on the basis of experience in a particular area. This point was emphasized by a number of discussants.
The need for rational evaluation of performance of existing pavements was emphasized. Moreover, the necessity for obtaining quantitative as well as subjective measures of performance was stressed. The use of the concept of functional failure as noted by Witczak as a part of the management framework provides a reasonable basis for making decisions as to when to undertake re-habilitation. It would appear that the response of air-craft to pavement roughness may be a useful method for defining this functional failure, e.g., the methodology

described by Gerardi. Specific criteria have not been defined as yet, according to Sonnenburg. The laser pro-filometer provides a quick tool for determination of run-way profile and should prove to be useful in the evalua-tion process.
Nondestructive testing provides an improved proce-dure for evaluating structural performance. Although the procedures developed by Hall and Yang and presented at this meeting have received support from FAA, it must be recognized that there are other procedures, e.g., those discussed by Barenberg. A number of groups have been using such procedures for several years.
As noted at the outset of this summary, it is impera-tive that performance data be developed on a systematic and continuing basis. Data feedback to the design and rehabilitation process is absolutely essential. Fortu-nately, the management system concept provides a framework within which this can be accomplished.
It is strongly recommended that airport engineering staffs conduct performance evaluations now even though
FAA guidelines are not yet available. Sufficient experi-ence is available to permit such evaluations. The indi-cations from those who have already undertaken such evaluations are that the procedures are cost effective. As a part of this process, it is important to verify the performance of overlays as well. When airfields are evaluated, it may be desirable, as Witczak noted, to establish different rehabilitation criteria for runways and taxiways.
All conference speakers emphasized that engineering judgment is required. One must be careful to heed this advice and not expect everything to be written in simple statements. Inefféct, FAA circulars must be viewed as advisory guides that, when used with judgment, will permit effective use of resources for airfield pavements. The research and development effort sponsored by FAA and presented at this conference provides engineers con-cerned with the design and rehabilitation of airfield pave-ment systems a way to improve their capabilities for better engineered structures.

Research Recommendations Program Committee for the Conference on Research in Airport Pavements
The Program Committee evaluated the conference pre-sentations and discussions, giving special attention to those research results presented that were acceptable by conference participants as requiring no immediate further research and to those that were not altogether in accord with the views of the participants. If these differences could not be reconciled by available infor-mation, then the committee concluded that more re-search is needed.
RESEARCH RESULTS THAT CAN BE IMPLEMENTED
Pavement -Aircraft Compatibility
Results of the Aircraft-Pavement Compatibility Study provide a basis for trade -offs between aircraft and pave-ment design. It is now apparent that aircraft in the 680 to 900-Mg (1.5 to 2.0 million-ib) category, the possi-bility of which led to this Federal Aviation Administra-tion (FAA) study, will not be introduced in the foresee-able future. Thus, any further effort along these lines would have little immediate return.
Aircraft Distribution on Airport Pavements
Results from the study of aircraft distribution on airport pavements were well accepted, and these findings should be incorporated into the design methodology. To take full advantage of the findings in pavement overlay design will require a review of the limiting criteria for transverse slopes for airfield pavements. In the design of new or replacement sections, the results of this research should also permit thickness changes in the transverse direction of runway pavements.
Fibrous Concrete
Mix design and construction procedures for fibrous con-crete appear adequate, and only long-term performance data are needed before design and construction standards are established for the material.
Porous Friction Courses
Mix design, construction procedures, and performance data on porous friction courses appear adequate to jus-tify implementation of this technology. Sëãdditial
gradatic'n and on maintenanceancLrehabilitation procedures is i eeded,but it is believed that
- thiscanbestbe obtamed frortiln-service installations of this material.
Pavement Unevenness
Procedures for measuring pavement unevenness appear well advanced, and relating runway profile data to an aircraft response model appears to provide a meaning-ful way to evaluate pavement unevenness. Acceptable pavement unevenness criteria for aircraft operations are not available, and there are some serious questions as to whether such criteria are needed or desirable. For construction accep ç,fitiiifor new pavement anthpavemeiitöVrlays appear to be desirable and should
suedfurt!r
Statistical Quality Control and Quality Assurance
Application of statistical procedures for quality control and quality assurance testing is well accepted by the profession. Typical values indicating levels of material variability and limiting values for acceptability and pen-alties are functions of inspection and construction pro-cedures. It is recommended that the statistical control and assurance procedures be implemented but that the basis and criteria for assigning penalties be reviewed before implementation.
FURTHER RESEARCH REQUIRED
Three areas appear to require additional investigations: documentation of pavement performance, validation of nondestructive test procedures, and improved pavement design. Some of the studies listed in one area will over-lap into other areas.
Documentation of Pavement Performance
The most critical need in the area of documenting pave - ment performance is the establishment of a framework and a methodology for systematic and continual mon-itoring of pavement systems. Among the items that must be established are
In addition, studies should be initiated to

1. Incorporate the findings from the traffic distribu-tion study into the pavement design and' evaluation pro-'
cer reinforced'oncrete, and— ,-3. Documenttheperformance-of-porous4riction_' courses(-PFC)and establish procedures for mamtenanQe and
Validation of Nondestructive Teting Procedures
Evaluation of the structural response of pavements by nondestructive testing procedures has the potential to provide important data to assist paving engineers in the management of airport pavement systems. Currently there are a number of NDT methods and associated pro-cedures for pavement evaluation.
The U.S. Army Engineer Waterways Experiment Station (WES) 71-kN (16 000-lbf) vibrator operated in the load sweep mode (a static load superimposed by a sinu-soidal dynamic load of varying amplitude at a constant frequency);
WES 71-kN vibrator operated in the frequency sweep mode (a static load superimposed by a sinusoidal dynamic load of constant amplitude but at varying frequency);
Air Force 40-kN (9000 lbf) vibrator, which has loading capabilities similar to those of the WES 71-kN vibrator but with a lower static load and a smaller max-imum capacity;
Road rater, which can be custom-made with a wide range of load and frequency capacities that even ap-proachthosef the WES vibrator;
(pyjfiect test machines; WES heavy-load vibrator, which is a nonmobile
tester with the potential for high load amplitudes; Cox vibrator, which is van mounted, applies a
sinusoidal dynamic load to the pavement with a range of load amplitudes and frequencies, and differs from the WES, Air Force, road rater, and Dynaflect equipment in that it does not apply a static load on the pavement being tested but uses a trailer-mounted, remotely sup-ported mass as a reaction for the applied loads;
Falling -weight deflectometer (introduced by the French and further developed by the Royal Dutch Shell Company), which applies a load most nearly approximat-ing a moving aircraft load;
Wave-propagation techniques, which involve the use of vibratory equipment at the pavement surface to generate waves and the measurement of the rate of wave propagation in the pavement components rather than the measurement of pavement response to load as with the other test procedures;
10_Benknlman beam, which is a well-known method formeasiring'pavement surface deflections under slow-moving vehicles and is highiy developed for use on high-way pavements; and
11. Pavement deflection signature equipment, which is an expansion of the Benkelman beam in that the deflection-measuring equipment is mounted on the test vehicle and claims to measure the pavement surface de-flection throughout the deflection basin under loads moving at low speeds.
At this conference only the procedures associated with the WES 71-kN vibratory load were discussed since this equipment has been developed with support from FAA. The Program Committee recognizes that many techniques are available and agrees with the conference comments that NDT should not be limited by FAA to non-
destructive vibratory testing with the 71-kN equipment. Thus, because of the diversity of equipment and pro-
cedures available' and the potential new NDT procedures not yet put forth, the question arises as to whether vali-dation procedures should be developed for one or two of the more advanced tests and evaluation procedures or guidelines developed' for. validation procedures that might be applicable to'a broad range of NDT equipment and pavement evaluation methodologies. The committee rec-ommends that the latter course be followed.
Since the procedures and criteria would have broad implications for and'impacton the management of air-port pavement systems, the committee recommends that an advisory panel be,appointed to establish recom-mended procedures and criteria and to evaluate the re-sults of validation studies using the various equipment. In the development of the validation procedures the com-mittee recommends that the' advisory panel consider the following:
Definition of the role and limitations of NDT, Testing of existing pavements rather than spe-
cially instrumented test sections, and Incorporation of climatic and environmental fac-
tors as part of the evaluation process.
To validate any of the NDT procedures will require performance data for existing pavements including those with overlays, and obtaining those data will require time. Therefore, so that the process may begin as soon as possible, the committee recommends that the procedures provide a measure of the stiffness characteristics of the various pavement components, particularly for subgrade materials, to permit comparisons to be obtained.
The burden of defining the potential usefulness of any new methods that are proposed lies with the developer. Promising procedures, after review by the advisory panel, could receive additional support for further de-velopment.
Improved Pavement Design
Before additional iterations for improvement in the de-sign procedures can be developed, additional studies are needed in the following areas.
Pavement Unevenness
Some unevenness criteria are needed as a basis for con-trol over construction operations. The current straight-edge criterion is not consistent with the functional re-quirements of airport pavements. Thus, for unevenness of new pavement surfaces, new criteria are needed that can be related to the pavement functional requirements and to the latest technology for measuring runway rough-ness.
Design for Frost Effects
New design criteria have recently been developed for pavements in areas of frost penetration. Questions raised at the conference regarding the effect of stabi-lized layers on the frost design criteria could not be resolved within the current state of the art. Further studies are needed to fully understand the effects of frost action on pavement systems with stabilized ma-terials.
Soil Classification and Soil Strength Measurement
The discussion on soil classification and its relation to

pavement design indicated some confusion about the relative roles of soil classification versus soil strength evaluation. The Program Committee believes that the Unified Soil Classification System is an effective scheme for classification of soils for moisture and frost suscep-tibility. Needed for evaluating the soil strength parame-ters are improved procedures that can be incorporated into the pavement design procedure. Ideally, soil strength measurement procedures should provide soil strength parameters that are consistent with pavement design pro-cedure and pavement evaluation when NDT procedures are used. This requirement suggests that the soil evaluation test procedures should include dynamic testing, since most soils have significantly different properties under static and dynamic loads. Studies to develop procedures for measuring soil strength parameters for pavement de-sign and evaluation are strongly recommended and should be given a high priority in any future research program.
Equivalency Values
Equivalency values for paving materials have great ap-peal because of the manner in which such parameters simplify the design procedure when one deals with a num-ber of different paving materials. However, because the physical characteristics of many of these materials are different, the modes and causes for pavement distress are often different. Consequently, some severe con-straints must be placed on the use of any equivalency value assigned to any paving material.
The equivalency values presented at the conference raised many questions. A number of participants pointed out that a different equivalency ratio between any two ma-
terials must exist for almost every significant change in subgrade support, loading, environment, use in the pave-ment system, and even time of loading. With this many variables, either a range of equivalency values must be given for each material or the conditions for which the equivalency values are valid must be carefully speUed out.
A question was raised as to whether equivalency values are even necessary. If procedures are developed to incorporate real properties of component paving ma-terials into the design process, there should be no need to develop equivalency values for the various materials. If it is determined that such parameters are necessary, studies must be undertaken to carefully delineate appro-priate equivalency values for each paving material and the constraints under which such values are valid.
Continuously Reinforced and Prestressed Concrete Pavements
Both continuously reinforced and prestressed concrete pavements appear to have potential for excellent perfor-mance at reasonable costs. Design criteria are lacking, however, and it is impossible to optimize the design of these pavement systems. Additional design criteria, based on parameters such as allowable stresses and strains in the pavement components, allowable deflec-tions, and allowable subgrade strains, are needed be-fore the designs can be optimized. The committee rec-ommends that further studies to develop the additional information needed to establish realistic design criteria be given high priority.

CONFERENCE PAPERS AND PRESENTATIONS

PAVEMENT MANAGEMENT SYSTEMS
Considerations in Airport Pavement Management C. L. Monismith, Department of Civil Engineering and Institute of
Transportation Studies, University of California, Berkeley
The state of the art of airport pavement management systems is dis-cussed. Flow diagrams of several complementary management subsys-tems are presented. The input of information needed for these subsys-tems includes traffic (load), environmental effects, available materials and layer thicknesses, construction effects, and maintenance and reha-bilitation considerations. A physical description of a pavement system (i.e., materials characteristics and dimensions of the various layers—such as those of the procedures developed at Shell, the Asphalt Institute, and the U.S. Army Engineer Waterways Experiment Station) serves as an in-troduction to a discussion of the various pavement models available (i.e., the experimental—such as the California bearing ratio—and the mathema-tical—such as multilayer elastic and viscoelastic systems). The forms of distress (fatigue, distortion, and fracture) are analyzed, and the Struc-tural design procedures (conventional and based on elastic layer the-ory) that can be used to minimize it are evaluated. The relations among performance evaluation, pavement overlay design, and maintenance man-agement are considered.
The design and rehabilitation of airport pavement sys-tems can be considered within a general framework such as that shown in Figure 1 (1). This paper will briefly outline the various elements of the process and provide a perspective for viewing the results of the research that is summarized in this Special Report.
There are no workable systems that completely de-scribe the airport pavement management process shown in Figure 1, but there are a number of subsystems that can be used in conjunction with one another to provide engineers concerned with pavement design and rehabili-tation a framework within which to make reasonable de-cisions. It is these subsystems that will be addressed here.
In Figure 1, the management process includes design, maintenance, and rehabilitation. In this discussion, maintenance is considered to include crack filling, patch-ing, and minor repairing, but not such tasks as keeping runways and taxiways free of debris or grass cut. Re-habilitation includes the reconstruction and overlays necessitated by reductions in ride quality (e.g., in-creased roughness that influences the aircraft, reduction in skid resistance, or increased tendency toward hydro-planing).
rNPuT
In the pavement system shown in Figure 1, various in-put data are required for both initial design and subse-quent rehabilitation. The general categories of input in-clude (a) traffic (load), (b) environmental effects, (c) available materials and layer thicknesses, (d) construc-tion effects, and (e) maintenance and rehabilitation con-siderations.
Traffic (Load)
The types of traffic information required for reasonable
estimates of performance are summarized below:
Gear configurations of representative aircraft using the facility,
Contact (or tire) pressures of representative aircraft, Aircraft masses as affected by length of flight and
takeoff and landing operations, Daily and seasonal variations in aircraft movements, Lateral distributions of loads on taxiways and run-
ways and longitudinal distribution of loads on runways, Aircraft velocities, and Special loading considerations (e.g., braking and
turning movements).
Some simplifications of these types can be made. Deacon (2) and Witczak (3) have suggested the use of equivalent loads; Witczak, for example, has defined the repetitions of all aircraft in terms of the repetitions of a fully loaded DC-8- 63 F.
The effects of the lateral distribution of aircraft gears on both taxiways and runways must be included to ensure economical designs; Witczak (4) has shown how this might be accomplished. HoSang, in a paper in this Special Re-port, has developed data that permits the use of simpli-fied procedures to include these effects.
That turning effects can be important, particularly in high-speed exit-taxiway designs, has been shown by Witczak in an analysis of pavement sections at Baltimore-Washington International Airport (5), and the results of studies by Ledbetter, discussed in a paper in this Special Report, confirm these findings. Ledbetter's studies also indicate that the current practice of building taxiways and runways with end sections that are thicker than their in-terior portions is reasonable.
The effects of braking forces should also be evalu-ated; their inclusion may require thicker layers of asphalt-bound materials over untreated aggregate bases to preclude slippage failures.
Environmental Effects
The response of a pavement is affected by the environ-mental conditions such as temperature and moisture in which it is situated. The design considerations associ-ated with these factors are summarized below.
Environmental Design Factor Consideration
Temperature Material stiffness Thermal stress Frost heave
Moisture Material stiffness Warping stresses Frost heave Suction Volume changes
10

Figure 'I. Airport pavement system. Tota! Load
I Weeel Load Tire P,egsu,e Gear COnfiguration No Apphcation, Load Placement Load /Static or type \Dynamic Speed Frequency
I Etraironmental L_ Variables
° (Seasonal
Temp.( .... h
Saii (t ype
Cttarrge IMO.stwe
Freeze-Than Cycle Blast Heat Fuel Soillaoe
<ck
(Rough. Pavement Increases Dynamic Load)
I MECHANICAL STATE
Deflection Rapture Stress-Strain Patfrroserrt Deformation Distortion Deteriorohon Disieteorahc
It Surface
Properties Surface Friction Tire Wear Glare Light Reflection
IRoughness Toction
Load
Applications
Carried
11
Panement
Structural
Model
SYSTEM OUTPUT FUNCTION
I Load Appn
-Out Function
Layer
J (Cracked Pavement Rece,ves Moist.)
Cost (Maintenance 'user
Anaitobility of Funds' /Skiddisg
Safety \!kfe Control
Temperature
The response of asphalt-treated materials is tempera-ture dependent, which influences, their behavior in pave-ment sections. Temperature changes cause thermal stresses in both asphalt concrete (Ac) and portland ce-ment concrete (Pcc); one of the necessary and sufficient conditions for frost heave is a prolonged period of freez-ing. Updated procedures for frost design are given in the summary presented by Johnson in this Special Report
The distribution of temperatures in pavement layers can be estimated from weather data (i.e., average air temperatures and their daily ranges, average wind ve-locities, solar insolation, and sky cover) by using vari-ous solutions of the heat-conduction equation (6,7):
a2 c1/az2 = (7c/k)(a4Iat) (1)
where
It = temperature field, z = depth below pavement surface, c = specific heat of material, k = thermal conductivity,
v = density of material, and t = temperature.
[For AC, c is approximately 800 J/kg.K(0.2 Btu/lb.°F), and kis approximately 10.12 W/m'.K (0.7 Btuoft/h.ft2.°F).]
Moisture
One of the most important environmental effects is that of water, both because it affects the response of mate-rials in pavement sections to load and because it may cause undesirable volume changes (e.g;, frost heave or the expansion of clay).
For design purposes, the effect of water can be eval-uated by measuring the properties of untreated materials in the saturated condition [e.g., the soaked California bearing ratio (CBR)] (8). In some instances, however,
such procedures may actually be evaluating soil condi-tions that are not representative of those in the field (9), and thus it is desirable to have alternative procedures that provide estimates of expected in situ moisture con-ditions and an indication of how these conditions might develop, e.g., measures of the rate of increase (or de-crease) in water content of the subgrade soil with time.
Where little or no freezing of the subgrade occurs, the soil-moisture suction may provide a useful (and prac-tical) approach to the estimation of equilibrium moisture conditions in fine-grained soils underlying thick AC sec-tions or sections containing other treated layers resting directly on the subgrade. McKeen's paper in this Special Report addresses this point.
Richard's (10) suggestions for suction estimates appear to be the mosfilseful available at this time: For areas having shallow water tables [e.g., 6 m (20 ft) in clay, 3 m (10 ft) in sandy clays and silts, and 1 m (3 ft) in sand], regardless of climate, the equilibrium suction profile can be estimated from
matrix suction, = depth to ground water table - z (2)
where z = depth measured from bottom of impervious surface at which suction is desired. The total suction is equal to the sum of the matrix (or soil-water) suction and the osmotic suction. In the absence of dissolved salts, the osmotic suction is zero; for uniform salt con-centrations, the osmotic suction can be neglected. Under these circumstances, therefore, the total suction can be considered equal to the matrix suction. For areas having deep water tables, the suction profile is controlled by the moisture balance between rainfall and evapotranspiration. In areas where there is no permanent surface desiccation, the profile can be expressed approximately by the re-lation
Suction, at depth z = suction at depth greater than depth of
seasonal variation + z0 - z (3)
where z0 = depth greater than depth of seasonal variation

12
and z = depth at which suction is desired. Alternatively, the total suction (and therefore the
matrix suction) under covered areas can be related ap-proximately to climate by Thornthwaite's moisture in-dex (I) (ii).
I=(1O0D-6Od)/E (4)
where
D = soil drainage, d = soil moisture deficit, and
= potential evapotranspiration.
Local environmental factors can cause large departures from this relation; however, it may be useful for pre-liminary estimates of suction.
For locations where freezing and thawing can occur, updated procedures for predicting the depth of frost penetration and the effect of subsequent thaw are dis-cussed by Johnson in a paper in this Special Report. Studies by Bergan (12) provide a way of defining the stiffness characteristics of fine-grained subgrade soils for use in design for these conditions.
Moisture differentials contribute to warping stresses in concrete slabs. The available evidence suggests that the effect of moisture -induced stresses is to reduce the magnitude of the warping stresses caused by temperature differentials. Pretorius (7) has shown that humidity gradients can lead to large tensile stresses in cement-treated bases. For a particular situation, therefore, the designer must satisfy himself that these factors are at least considered.
Available Materials and Layer Thicknesses
A variety of materials are available for the construction of structural pavement sections that have different sur-face requirements (e.g., improved skid resistance) and different maintenance characteristics. The proper se-lection of the particular combination of materials is de-pendent on economics; it is the role of the engineer to construct a pavement system that has the minimum cost for some prescribed time period by considering not only the initial design but also maintenance and rehabilitation.
Figure 2 illustrates the range of materials that can be used in a pavement section and the layers in which they are arranged. Figure 2 does not show the materials used for maintenance; these include (a) asphalts for spray ap-plications (e.g., fog seals) and crack filling, (b) jointfillers, (c) rejuvenating agents for asphalt surfaces, and (d) spe-cial protective coatings for both AC and PCC layers.
Information about continuously reinforced concrete (CRC), fibrous concrete, and prestressed concrete and about porous asphalt friction courses is discussed by Parker and by White and Duggan respectively in papers in this Special Report.
The thicknesses of the layers are also variables, in part controlled by structural considerations, but there are some minimum thicknesses that should be main-tained. Normally, layers of untreated materials should be placed in minimum thicknesses of 150 mm (6 in). Treated layers (with the exception of AC) should be placed with minimum thicknesses of 100 mm (4 in) and preferably of 150 mm. Portland cement concrete layers should not be less than 200 mm (8 in) thick for heavy-duty pavements, while AC layers should not be less than 50 mm (2 in) thick (when AC is used for overlays on PCC pavements, a minimum thickness of 100 mm is recom-mended).
Construction Effects
The inherent variability attendant in the construction process must also be included. Kennedy and others (13) have summarized some of the available literature. They provide guidelines so that the designer can at least qual-itatively consider such variability as a part of the design and rehabilitation process. In this Special Report, R. Brown discusses material variability and E. Brown dis-cusses statistical quality-control requirements.
Maintenance and Rehabilitation Considerations
As shown in Figure 1, both maintenance and rehabilita-tion must be considered in the pavement- management process.
Maintenance will affect pavement performance. It is possible, for example, that the sealing of cracks may prevent water infiltration to underlying layers and thereby reduce the potential for pavement deterioration due to reduced stiffnesses in these layers.
For AC pavements, the placement of overlays before actual cracking (programmed stage construction) may provide longer service lives than the placement of over-lays after cracking is visible on the pavement surface. This planning must, however, be incorporated in the overall pavement-management process.
PHYSICAL DCRIPTION OF PAVEMENT SYSTEM
To design new structures and to estimate the load-carrying capacity of or plan rehabilitation for existing structures require definitions of the materials charac-teristics and the dimensions of the various layers that are being considered for or actually comprise a pave-ment structure.
Materials Characteristics
The selection of appropriate materials characteristics depends on the design or rehabilitation methodology that is being used. In this section, a brief summary of the characteristics associated with some of the design pro-cedures that have been used for a number of years and of the characteristics required for a few of the new pro-cedures will be presented.
Characteristics in Current Use
For flexible pavements, the most widely used design pro-cedure is that in which the California bearing ratio (CBR) test defines the requisite load-carrying characteristics of the pavement components (8). For fine-grained soils, the CBR is usually determined after the material has been soaked for 4 d. If it can be demonstrated that the subgrade will not become saturated, the test can be con-ducted at the expected condition in situ. Figure 3 illus-trates the effects of compaction conditions on the soaked CBR of a lean clay soil. Analysis of data in this form assists in selecting the field-compaction conditions to ensure a reasonable strength after soaking.
For untreated granular materials and treated fine-grained soils and granular materials, CBR values gen-erally are assigned on bases of other test characteristics, such as gradation and plasticity.
In the design of PCC pavements, it is necessary to define the modulus of subgrade reaction (k) for the lay-ered structure on which the slab is to be placed (14). This modulus can be determined by plate-load tests (e.g., ASTM D1195-64 or D1196-64) or estimated from

SORIASEI TREATED INCLUDING ASPHALT, PORTLAND CEIIENT,
(ORE 00 NODE) LIME, LIIIE-FLYASR ENTREATED AGGREGATE INSULATING LAYER
SORCRADEI COIIPACTEDI TREATED (E.G.. WITH LOSE) UNTREATED
SATUR.AL
Figure 3. Relation between initial composition and soaked CBR
for samples of lean clay.
BArn: Swdn,p. .4,54 kg (1011) .aklngsndpt,rtlndWl. All gpcImenowMS top and ROtH,,, 10,44. AOw.cln,.fo compnodln layvv 4.54 kg (1011) R900nW. 4S6cn, (tO in) drop In COO 0,014.
O 55OJ000p.,1oya. U drAl0049e,(ayW a tOhlo,o,pe,lw.,
Obon conItnI. lop 2.6400,11/Il.
Wolf, ConIcal fl,CC0l011 .0941
Molded Ery Eenslty-k9/013
20
1. .,16 kOAtlEOko(
qILf- 0100 AU IX ISO
Mo1dp4Or o4y-ldop.okft
1840
005 __0n . .—.-------.----t------ 1680
10 7
lC00,oNo•oN0000Je
600 10
M0105n9 WOIC, COnANII -percent'
13
other soil parameters (14).
Stiffness (Modulus) Characteristics
In the Shell (15) and Asphalt institute (Al) (16) methods of airfield -pavement design, the stiffness or elastic characteristics of the materials comprising the pavement sections are required; similarly, in the procedures being developed at the Waterways Experiment Station (wEs) for the Federal Aviation Administration (FAA), stiffness values have been used. This methodology is discussed by Barker in a paper 'in this Special Report.
Stiffness characteristics can be used to evaluate the performances of existing pavements and in the design of overlays (5, 17,18), as well as in the design of new pave-' ments.
Modulus values for PCC are necessary for the widely used analysis procedures that estimate the stresses in the concrete slabs that result from loading and environ-mental influences.
Untreated Soils
For untreated materials, a measure of stiffness termed the resilient modulus (MR) and determined from repeated-
Figure 2. Materials for pavement sections.
SPECIAL SURFACINGS - E.G.. POROUS FRICTION COURSE, SPECIAL SEAL COAT
ASPHALT CONCRETE
PORTLAND CD4EHT CONCRETE URREINFORCED CONTINUOUSLY REINFORCED POENTRESSEIS FIRROUS
load triaxial compression tests is suitable for use in the various elastic analyses that examine the effects of mov-ing wheel loads on pavement structures. This modulus is defined by the following relation
MR = repeated axial stress/recoverable axial strain (5)
For fine-grained (cohesive)' soils MR is dependent on the applied axial stress; i.e., MR = f(1 1), which emphasizes that this modulus should be determined for the range of stresses that can be expected to occur in situ. The M6 is also dependent on the water content or suction (Fig-ure 4).
For untreated granular (cohesionless) materials, the modulus is also dependent on stress; for these materials the form of the relation is
MR = K® (6)
where S = o + o + O (sum of principal, stresses) and K = constant. Figure 5 illustrates data obtained for an untreated base material used in a state highway pave-ment in California. The relation is also dependent on water content (or degree of saturation), with the modulus decreasing with increase in water content.
Poisson's ratio for fine-grained soils is also depen-dent on suction, ranging from,about 0.3 at a high suction to 0.5 at zero suction. For granular materials, Poisson's ratio is somewhat dependent on the ratio of al to o'.
Asphalt-Bound Materials
The stiffness characteristics of asphalt-bound materials using asphalt cements can be defined by the relation
BASE: ASPHALT TREATED (ASPHALT CONCRETE)
S(t,T) = a/c
(7) CHIEOT TREATED LIME-FLY ASH TREATED ONTREATED AGGREGATE
where MIMBRANE ENCAPSULATED NOEL LATED
s(t, T) = mixture stiffness at a particular time of load-ing and temperature,
a = stress, and = strain.
The stiffness can be measured by one of the following procedures (a) creep, (b) vibration, or (c) repeated axial or flexural loading [triaxial compression, third-point flexure, or diametral (split tension)]. Alternatively, stiffness can be estimated from knowledge of (a) the pen-etration of asphalt cement at 25°C (77°F), (b) the tem-perature corresponding to a penetration value of 800, (c) the volume concentration of the aggregate in the mix, or (d) the air-void content of the mix by using the pro-cedure developed at Shell (19). Figure 6 shows a com-parison of measured and estimated stiffness values.
For asphalt-emulsion-treated materials in the par-tially cured state, an expression similar to Equation 6 is applicable.
SchmIdt and Graf (20) have presented data illustrating the effects of water on mix stiffness, in which stiffness was measured with the diametral device (Figure 7). They have also shown that asphalt hardness and the addition of slurry lime improve the retention of mixture stiffness in the presence of water.
Poisson's ratio is dependent on both time of loading and temperature and ranges from 0.3 at low temperatures and short loading times to 0.5 at high temperatures and long loading times.
Lime- and Cement-Stabilized Materials
Stiffness data for lime-treated materials have been given

14
Figure 4. Relations among water content, dry density, and resilient modulus for subgrade soil.
,\ /if -MR=345M
\ /
216
I— \) 1,
(4o_ I I
,I
O7—
' _ /81- N - 13 I ,I
__ I , I,
'it
ko i1., I
/2 I Note: Deviates stress 13.8 kPa (2 lb//in2), cell prure =20.7 (cPa (3 lbf/in2(, and
MA corresponding to 1000 stress applications of 0.1 -S duration at 20 repetitions/cain frequency.
9 to Water Content, %
2240
I W80
980
Figure 5. Individual test results—modulus versus sum of principal stresses—for base-course aggregate.
First Stress Invarienl, 0 • k P.
69 690 690
69 to '00
F,,gi SI,.,, /ceoionl, 8, pci
by Thompson (21) and by Mitchell and others (22). Thompson's data indicate that the modulus of these ma-terials is directly related to the unconfined compressive strength and that modular ratios for lime-treated to un-treated soils are in the range of 3 to 25. The results of both studies indicate that after a reasonable curing period, lime-treated materials have essentially elastic responses.
Stiffness data for cement-stabilized materials have been summarized by Mitchell (23). Stiffness values may range from 70 MPa (10 000 lbf7 2) to about 28 GPa (4 000 000 lbf/in2) depending on type of soil, treatment level, curing time, water content, and test conditions. Treated-fine-grained soils have stiffness values near
the lower end of the range whereas granular materials have higher values. For stress levels in the working range, Poisson's ratio varies from 0.1 to 0.35, depend-ing on the same conditions that affect stiffness.
Portland Cement 4Concrete
In the existing design procedures, a modulus value of 28 GPa and a Poisson's ratio of 0.15 are used. Packard (14) has shown that changes from these values have only a slight effect on design thicknesses.
Thermal Characteristics
To determine temperatures in pavement structures re-quires knowledge of the specific heat (capacity) (c) and the thermal conductivity W. The values for asphalt mix-tures are given above. For cement-stabilized soils, k ranges from 0.05 to 0.12 W/m.K (0.3 to 0.7 Btu 'ft/h. ft2 .°F); an average value of 0.08 W/ni.K (0.5 Btu .ft/h. ft 2.°F) appears reasonable for use. The specific heat of cement-stabilized materials is about 800 J/kg.K (0.2 Btu/lb.°F)—i.e., the same as that of AC. Both c and k for PCC are approximately the same as for AC. The thermal properties of untreated materials have been tabulated by Berg (24) and are summarized in this Spe-cial Report by Johnson.
Volume- Change Characteristics
The change in pavement surface elevation that will result from a volume change in an underlying clayey subgrade soil can be estimated if the water content (or void ratio) versus suction relation is measured for the subgrade

15
Figure 6. Stiffness modulus of asphalt concrete at various temperatures.
Temperature, °C
69000 alt
L1..1.I. 69ou !
-
'O '20 0 20 CC 60 8: 690
Temperature,
Figure 7. Effect of moisture on mixture stiffness (measured in diametral repeated-loading unit).
ConditionS
T] jAMbient
ae Vacuum
Exposure, Days
material. Various procedures are available for such determinations and are summarized in this Special Re-port by McKeen.
Materials Variability
The variability in materials characteristics must be in-cluded in the design and rehabilitation management pro-cess to ensure that the specific requirements for pave-ment serviceability will be obtained. Kennedy and others (13) have summarized' the existing information on the variational characteristics of pavement materials for those currently used in pavement design. Table 1 (mod-ified from their report) indicates the type of data re-quired; in this case, variations in the values in resilient moduli for the subgrade soil.
Structural Section Geometry
In AC pavements, layer thicknesses are controlled by load considerations. However, construction require-ments may also govern minimum thicknesses. Similarly, for PCC pavements, there are minimum recommended thicknesses for both the slab and the underlying layers. In addition, for PCC pavements requiring joints (although both CRC and prestressed concrete pavements require at least a few joints, these types of pavements are not included in this description), joint spacing will range from 3.8 to 7.6 m (12.5 to 25 it) for longitudinal joints
and from 3.8 to 15 m (12.5 to 50 ft) for transverse joints, depending on the construction equipment available, slab thickness, and whether or not reinforcing is used.
For CRC pavements, special attention must be given to the ends of the pavement (termina,l design); these de-sign considerations and joint design in prestressed con-crete pavements are discussed by Parker in a paper in this Special Report.
PAVEMENT MODELS
The process of selecting the thickness of a pavement usually involves a procedure in which the designer uses the relations between load and a series of parameters representative of the various materials in the section. These relations can be based on either experimental studies or mathematical models and are usually modified by observations of pavement performance. Both types of relations are used in the thickness -selection process for design of new sections and for overlays.
Experimental
The most widely used procedure for airport pavements in this category is that using the CBR developed at WES. The expression relating CBR to thickness (25) is
T=.[(ESWL/8.1 CBR) -(A/r)] (8)
where
oil = load repetition factor, ESWL = equivalent single wheel load, and
A = contact area.
depends on the number of wheels for each main landing gear used to compute ESWL. ESWL is determined by assuming the pavement to behave as a homogeneous iso-tropic elastic solid and defined as the load on a single wheel having the same contact area and producing the same maximum deflection as the wheel assembly.
This relation has been developed from performance data, but also incorporates the use of a mathematical model—a homogeneous isotropic elastic solid—to esti-mate ESWL. As illustrated in Figure 8, materials vari-ability is inherent in the design procedure represented by Equation 8.
Mthm2tia1
For the design of concrete pavements, solutions origi-nally developed by Westergaard (26) for a plate on a dense liquid have been used in both the Portland Cement Asso-ciation (PCA) (14) and the Corps of Engineers (CE) pro-cedures (27). More recently, the Shell (15) and Asphalt Institute (Al) (16) procedures for AC pavements have as-sumed the pavement to respond as a multilayer elastic solid with full continuity (friction) at each of the interfaces.
For AC pavements, the assumption that pavements respond as multilayer elastic systems is reasonable. There are a number of computer solutions available using integral-transform procedures to estimate stresses and deformations; these include CHEV 5L, BISAR, ELSYM, and GCP-1. In the BISAR and GCP-1 programs, both horizontal and vertical loads can be included, which per-mits the inclusion of braking forces at the pavement sur-face. When using such an analysis with pavements con-taining asphalt-bound layers, both time of loading and temperature 'effects on the stiffness of the materials must be considered. Portland cement concrete pave-ments have also been treated within the same general framework (28).

15
29
16
Table 1. Values of MR for subgrade soils from airport pavements.
Deviator Stress (kPa)
55 41 69 Project No. of
Airport Location Identification Tests Value CV' Value CV' - Value Cv'
Palmdale California Runway 7-25 4 69 000 52 69 000 47 58 000 26 10 165 600 26 207 000 29 262 200 34
OHare Chicago. Runway 9R-276 8 54 500 48 - - - - International 3 43 500 21 60 000 12 69 000 13
Runway 4R-226 4 39 300 17 48 000 5.3 58 000 16
Midway Chicago Runways 4R-22L 4 16 600 10 27 600 7.9 37 300 6.6 and 1311-311,
Byrd Richmond Taxiways S74 and 3 59 300 8.3 82 800 20 75 900 18 International D and runway 2
Note 1 kPa 0145 lbf/n2. 'CV = coefficient of variation
Figure 8. CBR criteria: results of Equation 8 versus behavior data.
can
0.01 003 003 004 0.05 004 TIC Pl(S5u(
0.2 0.3 04 0* 04 04 0
. S.. • •
S • . . t p N8.I I. *
o 0
• .. * S *
0
0 o 0 *
S —' S • 0
0 0 0
0 +
0 0 * 0 * v0o 0 * + 0
S
0 *4.
—1 —.
0
- /
0
00 0 0
/ I
0
00
0 0
o 0 NONCAILuR*3 2000 C(SAGIS MaO 800vL NO'WAILURCS iOOo TO 2000 COV(**G(* * NONF*ILUR(3 OCLOW 1000 C0*C*ACLS FJULUNES
I 50P0(SLIN(
An alternative to the use of multilayer elastic theory is the use of viscoelastic layer theory (29), but at this time, this approach does not provide the versatility em-bodied in the elastic layer theory. Viscoelastic analysis can be used, however, to examine the effects of long-term static vertical loads (e.g., in parking areas or at container-transfer facilities).
To determine the potential for low-temperature frac-ture in an asphalt-bound layer, the asphalt mixture can be represented as a viscoelastic slab (30), and other elastic solutions are also available (317 Other pro-cedures have been developed for specific situations—e.g., the finite element method has been used to ascertain the stresses associated with traffic load (32, 33), and both finite element and finite difference methods have been used to estimate pavement temperatures (7,34).
FORMS OF DISTRESS
As shown in Figure 1, the performance—i.e., the ability to carry out its intended function—of a pavement is di-rectly related to distress; accordingly, estimates of the potential for distress and its effect on performance
should be defined as a part of the design and rehabilita-tion process. Some of the types of distress that may oc-cur in airport pavements are summarized in Tables 2 and 3. There are many forms, and it would seem appro-priate, as in the highway field, to define those that are most widespread and to develop methods of preventing or minimizing their effects on performance for some prescribed period.
For asphalt type pavements, the three important modes are
Fracture from repeated loading, Distortion (rutting) from repeated trafficking, and Fracture from non-traffic-load-associated factors
(e.g., temperature changes) and at times from braking stresses.
For PCC pavements, fracture from repeated loading and the effects of volume changes that result from vari-ous causes, particularly as they influence joint design to minimize the deleterious effects of fracture, are the two most important modes.
In this section,, a brief summary of recent develop-

17
Table 2. Categories of distress for asphalt Mode of concrete pavements. Distress' General Cause Specific Cause
Fracture or Traffic-load associated Repeated loading (fatigue), which includes few as well as many cracking repetitions of load applications
Slippage, which results from braking stresses Reflection cracking, which may be accelerated by traffic loading
- Non-traffic-load associated Thermal changes Moisture changes Shrinkage of underlying materials (i.e., reflection cracking)
Distortion Traffic-load associated Rutting, which results from repetitive loading Plastic flow or creep, which results from single or comparatively
few excessive loads Non- t raffic- load associated Heave, which results from swelling clays or frost
Consolidation settlement
Disintegrotion, which is associated more with material than with structural design considerations, will not be considered in the initial design phase.
Table 3. Categories of distress for portland cement concrete pavements.
Mode of Distress Manifestation General Cause Specific Cause Examples of Distress
Fracture Cracking Traffic-load associated Excessive loading Repeated loading
Non-traffic-load associated Thermal changes Moisture changes Shrinkage
Spalling Traffic-load associated Repeated loading
Non- t raffic- load associated Thermal changes
Moisture changes
Distortion Permanent deformation' Traffic-load associated Repeated loading (warping)
Non-traffic-load associated Expansive subgrade soil Frost- susceptible materials
Faulting' Traffic-load associated Repeated loading
Non-traffic-load associated Expansive subgrade soil
Frost-susceptible materials
Disintegration Scaling Non- t raffic- load associated Action of delcing chemicals' Freeze-thaw action Chemical reactivity of aggregate
(alkali aggregate reaction) Raveling Traffic-load associated Repeated application of chains
and studded tires D- cracking' Non-traffic- load associated Freeze-thaw action
Longitudinal or corner cracking Longitudinal, corner, or map cracking Transverse cracks Transverse cracks Transverse cracks Dislodgment of portions of pavement at
joint edges Dislodgment of portions of pavement at
joint edges Dislodgment of portions of pavement at
joint edges
Changes in slab elevations from pumping' or densification of underlying materials
Swell Differential heave Differences in elevation between leave and
approach slabs Differences in elevation between leave and
approach slabs Differences in elevation between leave and
approach slabs
Erosion of surface Erosion of surface Erosion of surface
Erosion of surface
Cracking to complete disintegration
Dlow-ups can lead to excessive displacements at joints (caused generally by high temperatures and lock of movemest in the joint because of ingress of foreign materials). °Pumping leads to longitudinal and transverse load-associated cracking that in turn results in perenunent deformation in the slab. 'D.cracking could also be included in the fracture section becuuse this type of distress first appears as cracks near slab corners.
ments is presented that permits estimation of the various forms of distress for both AC and PCC pavements. Spe-cific distress modes and appropriate procedures to esti-mate these modes for both types of pavements are de-scribed.
These developments are included to provide back-ground for some of the new methodologies that use them and to emphasize how they can be used with the e,asting methodology to make reasonable design and rehabilita-tion decisions.
Fatigue
A specific format with which to estimate the potential for fatigue cracking is shown in Figure 9. In this dia-gram, the-materia.l for which fatigue is to be considered is asphalt concrete, but any treated pavement layer can be analyzed in this manner. This section describes the various steps by which a structural pavement section can be analyzed according to this format. Christison (34) and Packard (14) describe in detail such approaches for AC and PCC respectively.
Materials Characterization
The magnitude of the tensile stress or strain repeatedly applied is a reasonable damage determinant for the van-
ous materials used in pavement sections. These stresses and strains can be estimated by using one of the methods of analysis described above (e.g., multilayer elastic theory). All of these procedures require the stiffness characteristics of the various materials; methods for their estimation and expected ranges in value have been described above.
Structural Analysis
The tensile stresses or strains resulting from wheel loads can be estimated for AC by using multilayer elastic, viscoelastic, or finite element analyses. For PCC, ten-sile stresses can be estimated by using the assumption of a plate resting on a dense liquid or by multilayer elastic or finite element analyses.
The effect of distributions such as those shown by HoSang in a paper in this Special Report can be readily evaluated by using multilayer elastic theory; the efficacy of such an approach has already been demonstrated in the Al design procedure (16).
Fatigue Characteristics
For asphalt-bound materials, the available data indicate that fatigue response can be defined by relations of the following form (36, 37, 38): -

Figure 10. Initial bending strain versus /400
applications to failure for controlled-stress fatigue tests on asphalt concrete.
18
Figure 9. Block diagram of fatigue subsystem.
CONST*UCY ION NIQUIIEMINTS UFICTS
TNAF?IC
SECTION
t.T.1.
AVAILABLE MAT(RIALS
HALT DCNT
CD
ENVIRONMENT
LIFE ANAL'S I S (STINATION
CDJ I DCTCRMINT ASPHALT JFATISuC CONCI(T( I PNOPCNTIC
TCST OTHER PAVEMENT ATERIALS
N,.
• N, 2.e,.0-°(f)'°7 40
--
lQ I0• C' Sl,ns App/icolions. N,
Figure 11. Fatigue life of flexural specimens.
Log N • 9.110 - cosra fl4l/g j)' (iog-og
..• - _______ ' of /04
I., Nm,bg, Of Lood Rgp/l/lIøs P1
N, =
and
N, = C(1/ay'
where
a = tensile stress repeatedly applied, oE = tensile strain repeatedly applied,
A, b, C, and d = material coefficients, and N,. = number of applications to failure.
Typical data obtained from simple loading tests on a dense-graded asphalt concrete are shown in Figure 10. The relations drawn through the data are mean curves; there is also evidence that the distribution of fatigue lives at a particular stress level is log normal (37).
Some adjustment must be made in fatigue curves de-veloped from laboratory data to include the effects of crack-propagation when the material is used in a pave-ment structure. Generally, this adjustment involves displacing the laboratory curves horizontally (i.e., on the Ni scale) by some factor [e.g., three to five (39)].
Asphalt content and degree of compaction (as mea-sured by air-void content) affect fatigue response. These effects can be considered by adjusting the fatigue data determined for specific vOid and asphalt contents accord-ing to the relation (40)
Nr — [VB/(VV+VB)J" (11)
where
V8 = asphalt volume, V, = air-void volume, and x = coefficient (approximately 5).

19
For cement-treated materials also, the tensile strain repeatedly applied is a reasonable damage determinant (Figure ii). For soil cement, PCA has defined a gen-era.lized fatigue relation in terms of a critical radius of curvature (41) that has been validated by other investiga-tors (7);
Figure 12. Comparison of coverage and fatigue strength relations.
oa
07
0
0$
Booing 747 0a
740-KN (167,000_Ib) Gee'-
0
0.7 •%,_
Recently, Raad and others (42) have suggested a tech-nique that uses Griffith's theory to define the fatigue characteristics of cement-treated materials. Their cri-teria may provide generalized data that in turn may mini-mize the laboratory testing required for such materials.
Some fatigue data are available for lime-stabilized materials (43), although these data are not as extensive as those for cement-stabilized materials.
The PCA has suggested that the fatigue response of PCC can be defined in terms of the ratio of the applied stress to the modulus of rupture (at 28 d). When this ratio is 0.5 or less, the concrete is assumed to have an unlimited fatigue life. However, other investigators have suggested different approaches—e.g., in the CE proce-dure, a relation between a stress ratio termed the design factor (44) and the number of coverages is used. A corn-parisonètween this approach and that used by PCA is shown in Figure 12 (45). Other investigations have sug-gested an equation without an endurance limit (46).
Estimation of Fatigue Life
The estimation of, the effects of a range in loading condi-tions requires a cumulative-damage hypothesis. One reasonable hypothesis is the linear summation of cycle ratios (35,47):
I I J I I IJ I I •l I
Boeng 707
kPa 630-4(11 (142000-I6) G.a
ADJUSTED FATIGUE CURVE FOR & 2! 73.5 cPa/c,,.
1 (12)
0$
where
Boeing 727 267-1(11 (60,000_Ib) Gee'
(Max. Load Shown)
n1 = number of applications at strain load i and N1 = number of applications to cause failure in sample
loading at strain level i.
Note: 1 kPa/cn 0.367 (Ibf/in2)/in.
Figure 13. Effects io
of asphalt and void :. :::t jill34kN -. contents on fatigue . -- 010nce (RA 0)FACING 7020 MW,
behavior of dense -- - 2c0=' 0814 BASE VASIES -
bituminous - 0)Oew, SUB BASE 75MWn
macadam. - - SURA CBR 3
IIPOO . moo FULL-LOAD PASU$
This equation indicates that fatigue-life prediction for the range in loads anticipated becomes a determination of the time when this sum reaches unity. This equation is cur-rently used in the Al design procedure for airfield pave-ments (7) and is suggested for use for concrete pavement design (14).
Fatigue relations such as those shown in Figure 10 are based on some chance of survival; e.g., the relations shown in Figure 10 are mean curves that represent a 50 percent probability of fatigue cracking. If a design is to
Figure 14. Effects of asphalt and void contents on
fatigue behavior of hot.rolled asphalt surfacing.
105
EIIEEEE
11
ION — -- - BINDER CONTENT 0 --
_1% 0 - -- -
10 101211
lAid content 14
410kN . 102mm HRA SUWACING VASIES -
r_ 2,,c,. GRANUAR BASE 500
- 150mm 508 BASE 175 MWm2
-- SUROE CBR7
L_IL -- -4-- 8% BINR CONTENT A
2 4 6 8 10 12 14 Void centont %

w
0.01
0.001- 100
20
Figure 15. Effect of stiffness modulus
ASPHALT CONCRETE. MODULUS, 6 Pc
on fatigue behavior of asphalt concrete. 6cc 340 . 690C . ID 300 10.0 ,-
STRUCTURAL SECTION
10 cn (4) Acpholt Ccnc,cte 0 25 cm (14') UnI,oatcd Aggregotn 1)
FOUNDATION MODULUS 4
31 000k Pc (4500 psi)
UNI900SITO OF CALIFORNIA 4
I. EINCHAN
4 0
— HEUXELOM and ELOMP
100 1000 1500 ASPRALT CONCRETE MODULUS. KS!
be based on a lower possibility of cracking (e.g., 10 per-cent) it will be necessary to adjust the relation by as-suming the distribution of fatigue lives to be log normal as noted above.
Other Considerations
Fatigue data can also be used to assess the effects of construction procedures on performance (e.g., the ef-fect of field compaction on the fatigue performance of AC). This represents an important illustration of how available data together with theory can assist the engi-neer in assessing the consequences of design decisions and construction procedures.
Figure 13 (48) illustrates the results of an analysis of a pavement containing a dense bituminous-macadam base. Both the asphalt and the void contents of the mac-adam base were varied and the stiffness was computed by the Shell procedure 19). The maximum tensile strains were computed at the underside of the asphalt-bound layer, and the nomograph recently developed by Pell and Cooper (40) was used to estimate the fatigue life. Pell notes tHt in this situation, the effect of void content is extremely important. However, the effect of asphalt content may be more important than shown be-cause the procedure used to estimate stiffness may over-estimate somewhat the effect of void content. The data do, however, stress the importance of good compaction.
Figure 14 (48) illustrates the results of an analysis of a pavement containing a comparatively thin asphalt-bound layer—hot-rolled asphalt. In this case, the effect of void content is not as significant because stiffness is not as important as for the pavement analyzed in Figure 13. The importance of higher asphalt contents at higher
void contents is emphasized. In general, these data indicate how one can analyze
the effects of construction variables on performance. Moreover, they emphasize that such variables must be ex-amined in the context of a particular pavement structure.
Finally, the importance of using proper criteria must be emphasized. Finn and others (49) have illustrated how criteria developed by different techniques can lead to different conclusions relative to the effects of mixture characteristics on fatigue performance of asphalt con-crete. In the example shown in Figure 15, increased stiffness of AC leads to a reduction in fatigue life, but the other criteria lead to the opposite result.
Distortion
Distortion (or permanent deformation) can result from both traffic-load-associated and non-traffic-load-associated causes as seen in Table 2. A framework similar to Figure 9 to predict this mode of distress can be developed, but different materials -characterization procedures, methods of analysis, and distress criteria may be required.
Traffic-Load Associated
For asphalt- surfaced pavements, two approaches are available for the estimation of rutting from repeated traffic loading. In one method, the vertical compres-sive strain in the subgrade surface is limited to some tolerable amount associated with a specific number of load repetitions [e.g., the Shell method (is)]. Control-ling the characteristics of the materials in the pavement section through materials design and proper construction
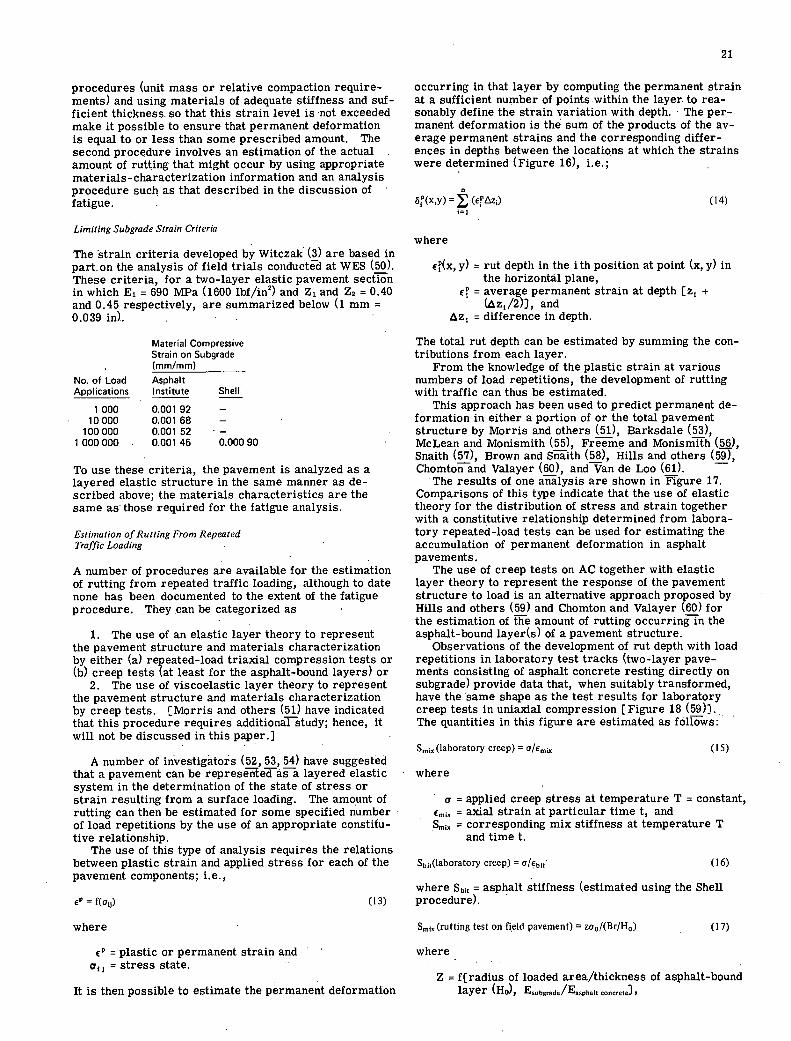
21
procedures (unit mass or relative compaction require-ments) and using materials of adequate stiffness and suf-ficient thickness. so that this strain level is not exceeded make it possible to ensure that permanent deformation is equal to or less than some prescribed amount. The second procedure involves an estimation of the actual amount of rutting that might occur by using appropriate materials-characterization information and an analysis procedure such as that described in the discussion of fatigue.
Limiting Subgrade Strain Criteria
The strain criteria developed by Witczak (3) are based in part. on the analysis of field trials conduct1 at WES (50). These criteria, for a two-layer elastic pavement section in which E1 = 690 Ivrpa (1600 lbf/in2) and Z1 and Z2 = 0.40 and 0.45 respectively, are summarized below (1 mm = 0.039 in).
Material Compressive Strain on Subgrade (mm/mm)
No. of Load Asphalt Applications Institute Shell
1 000 0.001 92 - 10000 0.001 68 -
100000 0.001 52 - 1 000 000 .. 0.001 46 0.00090
To use these criteria, the pavement is analyzed as a layered elastic structure in the same manner as de-scribed above; the materials characteristics are the same as those required for the fatigue analysis.
Estimation of Rutting From Repeated Traffic Loading
A number of procedures are available for the estimation of rutting from repeated traffic loading, although to date none has been documented to the extent of the fatigue procedure. They can be categorized as
The use of an elastic layer theory to represent the pavement structure and materials characterization by either (a) repeated-load triaxial compression tests or (b) creep tests at least for the asphalt-bound layers) or
The use of viscoelastic layer theory to represent the pavement structure and materials characterization by creep tests. [Morris and others (si) have indicated that this procedure requires additional study; hence, it will not be discussed in this paper.]
A number of investigators (52, 53, 54) have suggested that a pavement can be represteTai layered elastic system in the determination of the state of stress or strain resulting from a surface loading. The amount of rutting can then be estimated for some specified number of load repetitions by the use of an appropriate constitu-tive relationship.
The use of this type of analysis requires the relations between plastic strain and applied stress for each of the pavement components; i.e.,
(13)
where
cP = plastic or permanent strain and = stress state.
It is then possible to estimate the permanent deformation
occurring in that layer by computing the permanent strain at a sufficient number of points within the layer to rea-sonably define the strain variation with depth. The per-manent deformation is the sum of the products of the av-erage permanent strains and the corresponding differ-ences in depths between the locations at which the strains were determined (Figure 16), i.e.;
â'(x,y) (e"Az) (14)
where
E(x, y) = rut depth in the i th position at point (x, y) in the horizontal plane,
ell = average permanent strain at depth [z1 +
(z1/2)3, and = difference in depth.
The total rut depth can be estimated by summing the con-tributions from each layer.
From the knowledge of the plastic strain at various numbers of load repetitions, the development of rutting with traffic can thus be estimated.
This approach has been used to predict permanent de-formation in either a portion of or the total pavement structure by Morris and others (51), Barksdale (53), McLean and Monismith (55), Freeme and Monismith (), Snaith (57), Brown and Snaith (58), Hills and others (59), Chointon and Valayer (60), and Van de Loo (61).
The results of one analysis are shown in Figure 17. Comparisons of this type indicate that the use of elastic theory for the distribution of stress and strain together with a constitutive relationship determined from labora-tory repeated-load tests can be used for estimating the accumulation of permanent deformation in asphalt pavements.
The use of creep tests on AC together with elastic layer theory to represent the response of the pavement structure to load is an alternative approach proposed by Hills and others (59) and Chomton and Valayer (60) for the estimation of the amount of rutting occurring in the asphalt-bound layer(s) of a pavement structure.
Observations of the development of rut depth with load repetitions in laboratory test tracks (two-layer pave-ments consisting of asphalt concrete resting directly on subgrade) provide data that, when suitably transformed, have the same shape as the test results for laboratory creep tests in uniaxial compression [Figure 18 (59)1. The quantities in this figure are estimated as follows:
Smix (laboratory creep) = a/c,,,,, (15)
where
a = applied creep stress at temperature T = constant, = axial strain at particular timet, and
S,,,,, = corresponding mix stiffness at temperature T and time t.
Sb ,(1aboratory creep) = o/ebt (16)
where Sbjt = asphalt stiffness (estimated using the Shell procedure).
Sm,,, (rutting test on field pavement) = za0 /(Br/H0) (17)
where
Z = f[radius of loaded area/thickness of asphalt-bound layer (H0), Es,,bgrade/EsphIt conc,ete]

22
cro = tire contact pressure, r = total rut depth at pavement surface, and B = proportion of total rut depth in asphalt-bound
layer.
For the Sbt (rutting test), only the viscous component, (Sbjt), is estimated.
= t/377 (18)
and
37 = Urn (tSbjt) (19)
For the time of loading in the rutting test,
= nt (20)
where
n = number of wheel passes and t. = time of loading for one-wheel passage.
For different temperature conditions, this becomes
Figure 16. Schematic representation of pavement system used to estimate permanent deformation.
(Sbjt). = 3/t 2 (/77)T (21)
The use of this methodology requires the measurement of Smx in the laboratory and the estimation of Sbt by the Shell procedure and of (Sbjt) from a knowledge of the traffic and temperature conditions and the nomographic procedure to give the rut depth (r) from Zoo/(Br/H) for the specific pavement conditions. Comparisons between estimated and computed values are shown in Figure 19. While the estimation procedure appears to be applicable to all materials, the computational one has been used only for asphalt-bound materials. However, this should not be considered a limitation, since, as suggested by van de Loo (61), the creep test may become a useful mix-design test to differentiate between different mixtures.
Cumulative Loading Conditions
In the laboratory, it is convenient to apply stresses of a single magnitude to the specific material under investi-gation.
Because the actual stress sequence in the field is not known, it is desirable to be able to predict the results of cumulative loading from the results of simple loading tests. Monismith and others (62) have suggested such a procedure.
At present, at least two methods are available for this: a time-hardening procedure and a strain-hardening pro-cedure; both are illustrated schematically in Figure 20.
In the time-hardening method, if the specimen is loaded for N1 repetitions of stress state , the resulting permanent strain will be E(n). The equivalent number of repetitions (N) at stress 152 that would have given the same permanent strain is obtained as shown in Figure 20, and if a further N2 applications of F72 are applied, the total strain will continue to follow the path.
The strain-hardening procedure requires the deter-mination of d after N1 repetitions of stress . The number of repetitions at stress &2 is then taken equal to Ni', and further N2 repetitions are applied. The total permanent strain is the sum of c.1 and 6
Both approaches have been used to predict measured responses in cumulative loading from test data at single stress levels and compared with the experimental re-sults by Monismith and others (62). In general, neither method gives a solution that agrees quantitatively with the experimental results. However, the predicted re-
Figure 17. Estimated rutting in experimental test road.
46
SPIGLE *HEEL. APPLIED LOADS • 40N TYRE PRES.0SSMPo
ASPHALTIC 1100 I I1 (1 U SURFACING
IU 0.4 GRANULAR 3ooI BASE Ii , IoL'. LIME I I STABILIZED Ib0I BSMPN. 1.1.0.4 SUBBASE I INFINITE I420MPb. L/.0.4 SOIL I
N 10 10, IO o to'
MPO G40 560 440 350 310 4.20.25 .29 26.
10 to IO
NO OF APPLICATIONS, N

S07 . N.5"
Figure 19. Rut depth observed on tracking machine versus rut depth calculated from creep tests.
Rut Depth CO/Cu/OteC ('ma C.,eep rests. mm
Figure 20. Procedures for the prediction of cumulative loading from simple tests.
23
bound layer can result from braking (decelerating) traffic or from occasional overloaded axles. For PCC, only the latter will lead to fracture.
Pavement structures are also subjected to environ-. mental influences. Such factors, acting by themselves or in combination with load, can also lead to distress. Potential contributing factors to non-traffic-load-associated cracking include volume changes in the PCC on asphalt-bound layer because of temperature changes (or differentials), moisture changes, and (for asphalt pavements) volume changes .in the underlying materials, e.g., resulting from curing of cement-treated materials.
For asphalt-bound materials, the tensile strength is dependent on the time of loading and the temperature (which are related to asphalt stiffness as shown in Figure 21). Ivlix variables, including void content, aggregate gradation, and asphalt content also affect tensile strength.
Heukelom (63) has suggested the following useful pro-cedure for the estimation of the ultimate tensile strength and strain at break of asphalt mixtures that is based on a knowledge of the stiffness of the asphalt in the mix:
0mix = MT x 083P (22)
where
Cmjx = tensile strength of mix,. = tensile strength of asphalt in mix, and
M1 = mix factor, i.e., f(asphalt content, type and grading of aggregate, mix density or void con-tent).
The breaking strength of the asphalt is a function of its stiffness, which is related to its penetration at 25°C (77°F) and the temperature corresponding to a penetra-tion value of 800 (19). This relation is illustrated in Figure 21. Salam (64) has shown that it will be neces-. sary to determine the mix factor for each mix because the mix characteristics (in addition to asphalt stiffness) permit the development of a range in mixture strengths. However, in the absence of actual test data, the curves shown in Figure 21 can be used for engineering estimates for specific conditions: The curve labeled type 1 is that for conventional dense-graded mixes with void contents in the 4 to 6 percent range and asphalt contents associated with conventional mix design procedures.
The direct tensile strength of PCC may be of interest at early ages of the pavement (65) because it will affect the spacing of cracks during the initial curing. Generally, however, design is based on flexural strength even when the combined effects of traffic-load- and non-traffic-load-associated stresses are being considered.
For cement-stabilized materials, the tensile strength is dependent on type of soil and the curing conditions. Raad and others (66) have shown that values for these ma-terials can reasonably be deduced from the split tensile test. The failure envelope shown in Figure 22 appears to be a reasonable representation for both uniaxial and biaxial stresses.
Fracture Analysis
Fracture: Single Load Application
The fracture potential in an asphalt-bound layer under braking stresses can be analyzed by using multilayer elastic theory (BISAR) and fracture data of the type given here. As with fatigue, stresses can be estimated for specific loading and temperature conditions and com-pared with data such as that shown in Figure 21.
suits are in qualitative agreement and bracket the actual data. The time-hardening procedure gives better agree-ment if the stress levels are successively increased, whereas the strain-hardening method gives closer agree-ment if the loads are successively decreased.
Non- Traffic-Load Associated
There are a number of causes of non-traffic-load-associated distortion including (a) volume changes in clays due to changes in suction (or water content); (b) frost heave, which is discussed in a paper in this Special Report by Johnson; and (c) consolidation of soft, com-pressible underlying layers,, but only that due to changes in suction will be discussed here. The resulting heave (or settlement) can be estimated (10) from the profile determined at the time of construction, the equilibrium suction profile, and a relation between water content (or void ratio) and suction for the subgrade soil. If an ex-pansive soil were to be encountered, such an analysis performed in advance of construction could be used to guide the engineer in the selection of compaction condi-tions to minimize heave.
McKeen has proposed amethodology whereby such estimates can be made. His procedure, as noted earlier, requires additional research.
Fracture (Other Than Fatigue)
A subsystem similar to that shown in Figure 9 can be formulated to examine fracture other than fatigue; Tables 2 and 3 summarize a number of possible causes.
For asphalt pavements, overstress in the asphalt-
Figure 18. Creep and ) ., rutting tests on A9 test ° track.
o
d 9QjOS 0jh.' ...

24
Non- TrafficLoad -Associated Fracture
The fracture potential in both AC and PCC due to tem-perature changes can be estimated.
For PCC, plate theory (67) or the finite element method can be used to estimate these stresses.
For asphalt-bound layers, Christison and others (31) have developed a simplified, yet realistic, method for
Figure 21. Tensile strength of asphalt mixes as function of asphalt stiffness, air-void content, and type of mix.
Stiffness modulus of asphalt, psi - 1450 aocm ldcflnn
140'
2OC 14'C -711C -23'C so VI __,___ iron -or tee?)
000
- • ,u.,.43 .a
ant, IV IV Ski IV
Stiffness modulus of asphalt, MPa
Figure 22. Failure envelope 36i
for cement-treated soils. I MOdihOil
the -estimation of tensile stresses due to temperature changes at low temperatures. This procedure—pseudo-elastic beam analysis—estimates the stresses in the upper part of the asphalt layer where cracking will-first develop by using the expressiOn -
U. (t)=ft.
S(t,T)a(T)dT(t) - (23)
where
a(t) = thermal stress, - - S(At, T) = time- and temperature-dependent stiffness
modulus, and - oi(T) = coefficient of thermal expansion. - - -
In the analysis, the time increment was set at 2 h. The results of a set of stress computations are shown in -Fig-ure 23 for a depth of 13 mm (0.5 in) below the-pavement surface. Figure 23 also shows the average tensile - strength as measured in the split tension test for the. corresponding temperature. Cracking is assumed to oc-cur when the computed stress at the 13-mm depth exceeds the fracture strength of the material. Other factors that may contribute to fracture in asphalt pavements include (a) volume changes in the asphalt mixture due to temper-ature changes and absorptive aggregates and (b) volume changes in the underlying materials due to moisture changes or the curing of cement and lime-stabilized ma-terials. Pretorius (7) has developed a procedure that in-cludes the effects of shrinkage in a cement-stabilized ma-terial, but this cannot be implemented as readily as the procedure for the determination of thermal stress.
9650,
6 0
6900 6
a,
4110
/ STRUCTURAL DESIGN
-u 'Ib 20 •/.
/ • In this section, design procedures that have been used for a number of years will be briefly described; the latest
im methodology associated with each will serve as the basis 20 for the discussion. The recent use of layered elastic
theory to develop improved design procedures will also
U 1.6 be discussed.
/2 Abhntd 1(19731 Conventional Design Procedures
a P,ela,.iss (/970)
00 o Nash elM. (/965) W,sso eio/(N65) There are a number of existing design procedures for
A WissO 8/01(19641 -04 9 eop,a,- airfield pavements [e.g., those discussed by Yoder and
Witczak (68) and by Horonjeff (69)], but only a few repre- I sentativees will be considera here. These include
0 0.2 0.4 06 0.8 /0 Mian,sro,po/St,ess
1/scosf,sed Csopesvee sti'eIrn
12 the CE procedures for, asphalt surfaced and PCC pave- ments, which have been adapted for use by the FAA,
Figure 23. Thermally induced stress at 13-mm (0.5-in) 24 1 2 N 12 24 '2 24 12 24 12 24 1 2 24
depth of LV 150-200 AC pavement surface of structure D. 680
Lost boa v.ce,isoc dab 0 IesNflgth 5-. 4830 .
We
0*1 3450 -o
4) Do
-o C
4. 2070 - o .
V.
0 E
690 I -c - I—
D.c 30,67 1 Dec 31,67 1 Jan 1,68 I Jan 2,68 1 Jan 3.68 1 J. 4,68

25
and the PCA procedure for PCC pavements.
Asphalt Concrete (Flexible) Pavements
The CBR method of design (25), developed originally by the California Division of Highways, was. adopted for military airport use by CE shortly alter the outbreak of World War II (70). The method has been modified over the years and is currently used for the design of civilian as well as military airports and for the design of pave-ments subjected to highway loading conditions. The es-sential elements of the most recent procedure are sum-marized below.
The principal design consideration is that the pave-ment thickness required above a specific layer is related directly to the strength of that layer (as measured by its CBR) and to the applied loading (which includes the ef-fects of magnitude of load, tire pressure, number and spacing of tires, and load repetitions). This is ex-pressed mathematically by Equation 8
T=[(ESWL/8.1 CBR) -(A/7r)P (8)
in which, for airfield pavements, CBR :5 15. The materials property needed for this method is the
CBR. It is measured for a series of water contents and dry densities for both the soaked and the unsoaked con-dition. The compactive effort used in preparing the test specimens ranges from that of the standard to that of the modified American Association of State Highway and Transportation Officials tests.
Portland Cement Concrete (Rigid) Pavements
Both CE (27) and PCA (14) use the Westergaard analysis as the basis for their design procedures. The CE uses an edge-loading condition and, in the PCA procedure, the load is assumed to be applied to the interior of the slab.
In the Westergaard analysis, the modulus of the, sub-grade reaction can be determined from plate load tests (CE and PCA use different criteria to define k) or es-timated from other test parameters (14). In the CE procedure, fatigue in concrete is considered through a design factor (44) that is applied in the same manner as the safety factor in the PCA procedure (14), with both procedures selecting a pavement thickness for a particu-lar design aircraft. Figure 12 illustrates a comparison of the fatigue relations in both design procedures.
The PCA procedure can also incorporate the effects of mixed traffic. Stresses associated with different aircraft can be estimated and their effects combined by the linear summation of cycle ratios.
The essential elements of both procedures are sum-niarized below.
The principal design considerations of the CE pro-cedure are that
The pavement thickness is a function of the modu-lus of rupture of the PCC, the applied load, and the stiffness of the underlying subgrade (as measured by the modulus of subgrade reaction, i.e., k);
The Westergaard analysis (a plate on a dense liq-uid subgrade) for an edge-loading condition is used, and a 25 percent load transfer to the adjacent slab is as-sumed; and
To allow for fatigue, a design factor is introduced that is defined as concrete flexural strength/edge stress and is dependent on the number of coverages.
k, which is determined from plate-loading tests, and the 90-d modulus of rupture of the concrete, which is de-termined from a third-part flexural test.
The principal design considerations of the PCA pro-cedure are that
The pavement thickness is a function of the modu-lus of rupture of the PCC, the applied load, and the stiffness of the underlying subgrade (as measured by k);
The Westergaard analysis for an interior loading condition, which is available in computerized form, is used; and
The effects of fatigue are considered by the use of either a safety factor (e.g., 1.7 to 2.0 for critical areas) or a linear summation of cycle ratios (when mixed traffic loading can be applied).
The materials properties needed for this method are
k, which is determined from plate-loading tests; Ninety-d modulus of rupture of concrete, which is
determined from a third-part flexural test; and General fatigue curve, in which the ratio of the
applied stress to the modulus of rupture is related to the number of stress applications.
Some modifications, as discussed by Parker in a paper in this Special Report, are required for CRC and fibrous concrete pavements. When CRC pavements are used as overlays, elastic layer theory is used to estimate stresses. Parker also discusses a tentative design pro-cedure that is available for prestressed concrete pave-ments, based on a procedure originally presented in 1961 (71), but the joint problems have not been completely resolved.
Design Procedures Based on Elastic Layer Theory
Some of the subsystems discussed above have been com-bined into design procedures for both highway and airport pavements. Three such procedures developed by Shell, Al, and WES for FAA are discussed below.
Shell Procedure
This method of pavement design was originally developed for highway pavements and later adapted to airport pave-ments (is). It is applicable to pavements having AC resting on granular materials that in turn rest on sub-grade soils whose stiffness (modulus) can be defined ap-proximately by an estimated or measured CBR value. The procedure is also applicable to the selection of the thickness of asphalt pavements resting directly on sub-grade. The procedure is summarized below [1 MPa = 145 lbf/in2 and °C = (°F - 32)/1.81.
The principal design considerations are that
The pavement structure is represented by a three-layer elastic system (full friction at layer interface) for which the critical design conditions are (a) the hori-zontal tensile strain (€) on the underside of the asphalt-bound layer (if this is excessive, cracking may occur in the asphalt layer) and (b) the vertical compressive strain on the surface of the subgrade (if this is excessive, per-manent deformation at the pavement surface will occur) and
For design aircraft at 1 000 000 applications, = 0.023 percent (0.000 23 in/in) and €, = 0.09 percent
(0.000 9 in/in); design charts have been developed for in-dividual aircraft (i.e., mixed traffic is not considered).
The materials properties needed for this method are , The materials in each of the three layers are assumed

Figure 24. Design curves for B747. Thickness of Dense Asphalt Layers (ml
l.0'
0.5
i NEW
-I ____
__ ----- ---- I E E E ON
I___ I au•uiuuuiu.
.—.-..........
26
to be homogeneous, isotropic, and elastic. Their prop- ulus and the thickness of the base layer; and erties needed for this method are 3. For the subgrade soil—an approximate relation
between modulus and CBR that has been established by For the AC—(a) time -of -loading and temperature in situ vibratory testing (e.g., ESUb,Od. = 10 CBR (MPa)
dependence; (b) tensile strains, which are determined for [1500 CBR (lbf/in2)]). Figure 24 (15) illustrates a typical an assumed stiffness of 6.2 GPa (900 000 lbf/in2) that cor- design chart associated with this procedure. responds to a temperature of 10°C (50°F) and a time of loading of 0.02; and (c) subgrade strain, which is deter- Asphalt Institute Procedure mined by assuming an air temperature of 35°C (9 5°F) and an effective stiffness modulus in the range of 1.1 to 1.4 This procedure (16) is limited to AC resting direétly on GPa (150 000 to 200 000 lbf/in2), depending on the asphalt a prepared subgrade (two-layer system). It is illustrated layer thickness selected; in Figure 25. The design considerations are that
For the untreated aggregate base—modulus of the granular base, which is dependent on the subgrade mod- 1. The pavement structure is represented as a two-
0.5
1.0 1.5
Thickness of Unbound Layers (m)
Figure 25. Flow chart for design of airport pavement thickness.
Airport Ponenrent Thickness (TA Design Snlvt.nn
Design to Limit Ma.lmvm Design to Limit Masimum Asphalt Sobg,oda Vertical Compresaie. Strain Concrete Horizontal T.nsiln Strain
Allowable Traffic Valve. No Analysis
SUBGRAOE ENVIRONMENT Determine Design Determine Mean Subgrade Modulus I Annual Air
of Elasticity Temporotuve
Determine Allowable Traffic Value, No
Construct Pavement Thickness vs. No Curve
Predicted Traffic I Alloweble T,olT,c Value. Np, Anolysis L Volvo. N0, Anolysis
TRAFFIC SUEGRADE ENVIRONMENT
Determine Airurolt Determine Design Determine Mean
Troffic Porecoct Subgrode Modulus Anneal Air of Elasticity Temperature
Predicted Troffic Value, Np, Analysis
TRAFFIC Determine Aircrolt
Traffic Forecast
Determine Predicted Traffic Value, Np
Construct Ponement Thickness vs. Np Curve
Determine Predicted
Determine Allowable
Traffic Vain., Np Traffic Value, N0
Construct Panement Construct Pavement Thick. Thickness us.Np Curve nessrs. Na Curne
Determine FolI.Dapth Asphalt Thickness, TA. far Svbgrad.
V.rtiozl Cantpra.cin. Strain by Graphical Salatias
Determine Full.Depth Asphalt Thickness. TA, for Asphalt
Concrete Horizontal Tensile Strain by Graphical Salution
S.i.at Maoiteose TA a. lelfial Design Thickness
Determine Final Design TA for Specific Ponement Area

27
layer system consisting of AC resting directly on a pre-pared subgrade, for which the critical design conditions are that (a) the horizontal tensile strain on the underside of the asphalt-bound layer is limited to prevent fatigue cracking and (b) the vertical compressive strain at the subgrade surface is limited to minimize the potential for surface rutting, and
2. Traffic is determined in terms of estimated DC-8-63 F repetitions.
The materials in each of the layers are assumed to be elastic in response. Their properties needed for this method are
Time-of-loading and temperature dependence, which affect AC stiffness;
Fatigue characteristics of the AC, which are ex-pressed in terms of strain versus applications to failure for a range in mixture stiffnesses; and
Modulus of subgrade, which can be estimated, measured from field tests, or measured from laboratory tests.
This method contains a number of innovative design
concepts. For example, it permits an airport pavement to be designed for mixed traffic, the condition repre-sentative of most large civilian airports. Environmental effects are included in that the effect of temperature on AC stiffness is recognized.
U.S. Army Engineer Waterways Experiment Station Procedure
This procedure is similar in format to the Shell and Al procedures in that the vertical strain at the subgrade surface and the tensile strain on the underside of the treated layer are the principal design criteria. A flow diagram of one phase is illustrated in Figure 26 (72); it is discussed by Barker in a paper in this Special Report. The principal design considerations are that
The pavement structure is represented as a multi-layer elastic system with an AC surface and either treated or untreated base and subbase materials,
Criteria for limiting subgrade and limiting tensile strain in treated layers are included, and
Traffic is expressed in terms of equivalent oper-ations of a design aircraft.
Figure 26. Flow chart of DIVIDE TRAffIC INTO
important events for asphalt ["<1k MflLy iscnE,n
concrete pavement.
OET(DRND (,c FOR DADE VONT14 RAIDS ON AVERAGE DAILY RIM
AIR TEMPERATURE
ASSES DADE MONTH A VALUE FOR E
OEORIIIE E,c FOR (AOl INTh SUBGRADE DRIED ON 0(0GM AIR ~ECO~KPU TE
TEMPERATURE CRITERIA
ETART rim T(EATUR( DATA FINAL I ODDER DJ5GRADEBXAJLUS FUR NOONAL TRAFfiC PARAMETERS LT1YG STRAIN CAIRTA TE INCREASE
TVICKNEO (SIONATEO IRITIAL IDIDIJESS
Figure 27. Research framework for pavement rehabilitation.
Network Monitorjng Data Analysis Compare and Decide Diagnostic Investigation Data Analysis
-Condition Surveys -Performance Predictions Decision Criteria: Detailed look at Structural -Measurement Systems -Maintenance Cost Performance Standards Physical conditions: Requirements -Coats Predictions Costs Strength measurements Operaiional -Operational and -Socio-economic Socio-econonic factors Surface Requirements
Environmental Predictions p Environmental factors ride Conditions Cost Optimization skid resistance -traffic Sampling and Testing -climate Drainage -geography Special Problems -pollution blow ups -urban/rural thermal cracking
Do_, Nothing
Selection of Development of Data Bank Implementation Oehabilitation Strategy Design Alternative
Measurements Construction Techniques Optimization Models Restoration or Replacement Coats Traffic Control Performance -Base restoration Quality Equipment Utilization Coats -Patching
Material Handling -Sealing, injection. p Storage Environmental Protection rejuvenation Retrieval noiae -Surface restoration Analysis air pollution grooving, texturing Peedback water pollution grinding
erosion Overlay Design runoff -Component Analysis
-In-situ strength -Experience and judgement
'U Do J Nothing
Note: Sub-items in each of the nine elements are not implied to be complete, but are indicative of the type of factors or conditions involved.
INCREASE T1IICKNEID
OOMPUTE

28
Figure 28. Average Benkelman beam .050
deflections under 40-kN (9000 lbf/in2) dual wheel load; Salt Lake City instrument runway.
- - S .030
.020
z 0
'a
B
.011.
JET,: • + T F]" - .L 1LPAE NT
ENT - - -
Wheelpoth deflection for opholt
concrete pavement corrected to temperature
10
E 0
7.5
0
5.0
0
.2.5
1 2 3 4 2 6 70 9 10 11 12 13 1.412 1.617 1.0
TEST S(CTIO# P.
Figure 29. Method for pavement evaluation.
CONDITION (L) SURVEY
DEFLECTION 1.7) MEASUREMENTS
------------ PERFORMANCE-
iol RELATED CRITERIA I ANALYSIS DRILLING SAMPLING I SECTIONS
LABORATORY
I I I COMPUTE I I DEFLECTIONS
CHARACTERIZATION I I FAILURE MODES
COMPARE NO ADJUST I MODULI
YES I TRAFFIC ----
. I
PAST -- COMPUTE
PROJECTE . STRESSES $ STRAINS I
DEVELOP I FAILURE CRITERIA I
LOAD-CARRYING CAPACITY
ALLOWABLE LOADINGS OVERLAY REQUIREMENTS
The materials in each of the layers are assumed to be elastic in response. Their properties needed for this method are
The effect of temperature on the stiffness char-acteristics of the AC;
The subgrade modulus, which is determined by a resilient modulus test (changes in subgrade stiffness due, e.g., to frost action can be included); and
Modulus characteristics of untreated granular materials, which are defined in terms of the subgrade thickness and layer thickness.
PAVEMENT PERFORMANCE EVALUATION AND STRUCTURAL REHABILITATION
The rehabilitation of airport pavements is assuming in-
creased significance and requiring an increased propor-tion of the funds allocated to these facilities. It is im-portant then to consider the problems involved. Figure 27 (73) provides a concise framework within which re-habilitation can be viewed.
Performance Evaluation
It is important, as noted by Witczak, to consider both the functional and the structural performance of a pave-ment system. Functional performance is related to how well the pavement serves the user—i.e., the aircraft and its occupants. If the pavement becomes too rough, it will be difficult to operate the aircraft, and the skid and hydroplaning characteristics may be affected. While the functional and structural characteristics are related, no well-defined relation between structural distress (of the type discussed above) and functional performance has yet been established. It is necessary to measure both the functional performance and the structural perfor-mance on a systematic and continuing basis and use judgment to decide when structural deterioration will lead to a level of functional performance below that con-sidered reasonable.
Techniques are now available to measure the longi-tudinal profile and to relate this to the vertical acceler-ations in the aircraft as it traverses the runway. In this Special Report, this is discussed by Gerardi, and Son-nenburg presents an alternative procedure. Skid resis-tance can also be physically measured, and hydroplan-ing potential can be assessed primarily on the basis of visual examination. When (a) the pavement becomes ex-cessively rough, (b) its skid resistance decreases to below some tolerable level, or (c) the potential for hy-droplaning increases, some form of rehabilitation must be accomplished—e.g., grooving of the existing surface or the application of a porous friction course or an overlay.
The major reason for measuring the structural per-formance of a pavement is to attempt to anticipate when rehabilitation should be accomplished so that its func-tional performance will be maintained at a reasonable level. This is a difficult problem requiring considerable judgment. Fortunately, however, many of the concepts discussed above can be used to assist the engineer in making the necessary decisions if the proper structural measurements have been obtained.
Until recently, the structural evaluation of airport pavements required time-consuming destructive test pro-cedures (8). However, nondestructive procedures are now being developed, although sole reliance should not
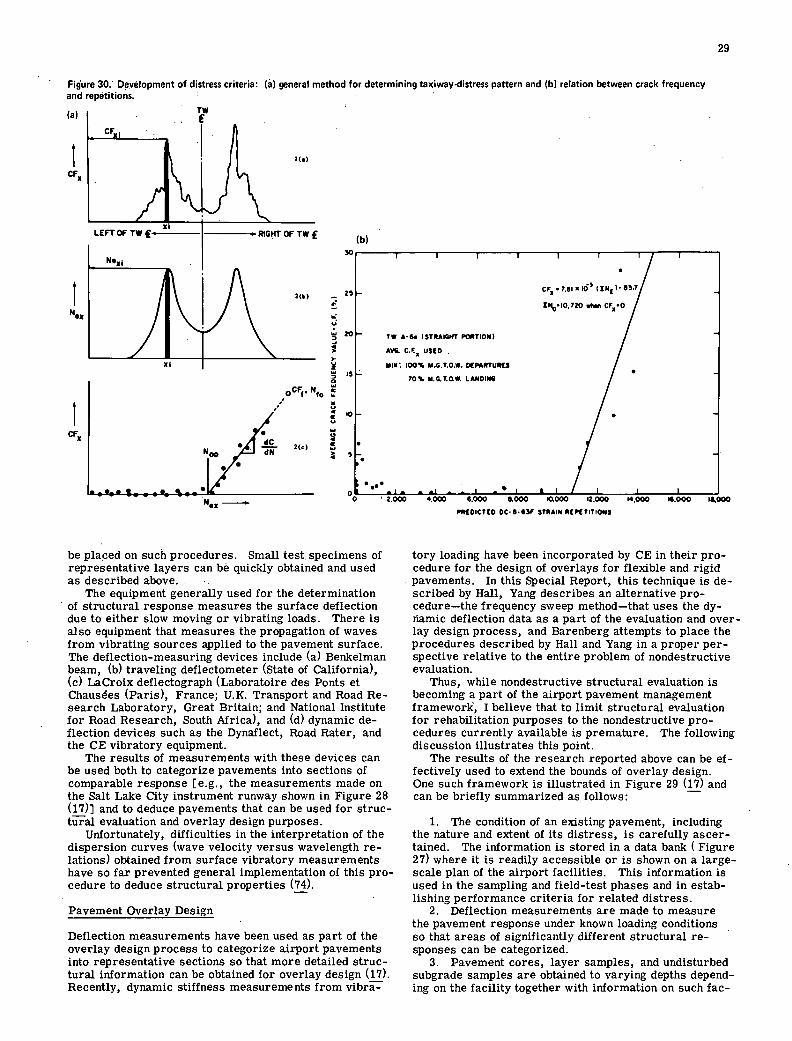
Figure 30: Development of distress criteria: (a) general method for determining taxiway-distress pattern and (b) relation between crack frequency and repetitions.
(a) 1*
0
CFi
29
CF5
LEFTOFTW€ I RIG)ft0FTWf
N45
(b)
I I I I I
5 - CF.7.tIIO3
1N0.I0,720 ~ C.0
- 716 A-6. (STRAIGHT PORTION)
ave. cr.1 USED
IX 00% .G.1.0.L O€PANUR(3 IS. S
70% M.G.T.0.W. LANOIN6
0•
S
0 I o 2.000 4000 6.000 6.000 1000 2.000 4.000 16.000 1&000
PACOIC1CO OC-S-SSF STRAIN RCPtTIIIONS
be placed on such procedures. Small test, specimens of representative layers can be quickly obtained and used as described above.
The equipment generally used for the determination of structural response measures the surface deflection due to either slow moving or vibrating loads. There is also equipment that measures the propagation of waves from vibrating sources applied to the pavement surface. The deflection- measuring devices include (a) Benkelman beam, (b) traveling deflectometer (State of California), (c) LaCroix deflectograph (Laboratoire des Ponts et Chausées (Paris), France; U.K. Transport and Road Re-search Laboratory, Great Britain; and National Institute for Road Research, South Africa), and (d) dynamic de-flection devices such as the Dynaflect, Road Rater, and the CE vibratory equipment.
The results of measurements with these devices can be used both to categorize pavements into sections of comparable response [e.g., the measurements made on the Salt Lake City instrument runway shown in Figure 28 (17)] and to deduce pavements that can be used for struc-tiiFal evaluation and overlay design purposes.
Unfortunately, difficulties in the interpretation of the dispersion curves (wave velocity versus wavelength re-lations) obtained from surface vibratory measurements have so far prevented general implementation of this pro-cedure to deduce structural properties (74).
Pavement Overlay Design
Deflection measurements have been used as part of the overlay design process to categorize airport pavements into representative sections so that more detailed struc-tural information can be obtained for overlay design (17). Recently, dynamic stiffness measurements from vibra-
tory loading have been incorporated by CE in their pro-cedure for the design of overlays for flexible and rigid pavements. In this Special Report, this technique is de-scribed by Hall, Yang describes an alternative pro-cedure—the frequency sweep method—that uses the dy-namic deflection data as a part of the evaluation and over-lay design process, and Barenberg attempts to place the procedures described by Hall and Yang in a proper per-spective relative to the entire problem of nondestructive evaluation.
Thus, while nondestructive structural evaluation is becoming a part of the airport pavement management framework, I believe that to limit structural evaluation for rehabilitation purposes to the nondestructive pro-cedures currently available is premature. The following discussion illustrates this point.
The results of the research reported above can be ef-fectively used to extend the bounds of overlay design. One such framework is illustrated in Figure 29 (17) and can be briefly summarized as follows:
The condition of an existing pavement, including the nature and extent of its distress, is carefully ascer-talned. The information is stored in a data bank (Figure 27) where it is readily accessible or is shown on a large-scale plan of the airport facilities. This information is used in the sampling and field-test phases and in estab-lishing performance criteria for related distress.
Deflection measurements are made to measure the pavement response under known loading conditions so that areas of significantly different structural re-sponses can be categorized.
Pavement cores, layer samples, and undisturbed subgrade samples are obtained to varying depths depend-ing on the facility together with information on such fac-

a
200
30
tors as layer thicknesses. (This process need not cause much delay to air traffic because the sampling holes are small.)
Laboratory testing is carried out to determine representative stiffnesses (moduli) by a form of dynamic or repeated-load testing and to establish failure (distress) criteria where appropriate.
Detailed examination of past traffic, anticipated traffic projections, and assignments to specific taxiways are made. [The equivalency concept (4) can be useful in this analysis.]
From the information established in the previous steps, performance-related criteria are established (5, 17). [Figure 30 illustrates an application to the Baltimore-Washington International Airport (5).3 For example, by using the laboratory properties measured
in step 4 as the initial input, deflections under the known loadings can be estimated, and by comparing these val-ues to those measured in step 2, adjustments in the laboratory-determined stiffness values can be made until the predicted and the measured deflections are in reason-able agreement. The critical performance parameters for the vehicle or vehicles in question are then deter-mined by suitableanalysis (e.g., elastic layer theory) and related to acceptable and not acceptable performance areas determined in the condition survey (step 1) and to the laboratory-determined failure criteria (step 4).
Either the load-carrying capacity of the existing pavement or the projected overlay requirements for future traffic are thus estimated. If load-associated cracking is the distress mode under consideration, remaining-life estimates in the existing pavement can
Figure 31. Calculated overlay
a 40
t0o
Subgrade modulus of resilience (M,)-MPa 41.3 62.0
PAucn -
CRITCORIA
I- - -
—e• *C
SI
I Q, Nil YMJL
- I
1 — c y 4.5 4.0 7.5 0.0 10.5
41.3 620
'MMMMMMM MMMMMMM
—- - -
__
'TI11I
0 05M.
4.3 4.0 7.5 0.0 10.5
SIDOM OMILUS OF tr&ioa (Ne) - 1000 PSI
requirements for Boeing 747: (a) 20.7 (a) based on strain in asphalt soO concrete and (b) based on vertical strain on subgrade.
0 0 1.5 3.0
is (b) 20.7 —
0 0 1.5 3.0

31
be acertained by using the concepts described above. [Witczak (5) has successfully applied this concept in his analysis of the Baltimore-Washington International Air-port; his recommendations are given in Tables 4 and 5. The results of an analysis for overlay requirements for the Salt Lake City Airport are shown in Figure 31 (17).]
Maintenance Management
Recently, a number of management systems for pave-ment maintenance have been developed (75, 76) that de-fine and evaluate optimal overlay maintenance strategies for in-service AC pavements.
The framework developed by Smith (76) is illustrated in Figure 32. In this system a Markov decision model was developed to define optim
;al overlay maintenance
strategies. This model was initially quantified by using the subjective opinions of e,perienced highway engineers, and provisions were made to update the initial estimates with field data by using Bayesian statistics. Optimal maintenance strategies were determined by minimizing the e,qected present value of total costs associated with a pavement and were considered to consist of the highway department maintenance costs plus the excess-user costs In this procedure, alternatives were considered to be thin, medium, and thick overlays. The results indicated that when overlay maintenance was required, medium or thick overlays representative of 10- and 20-year design periods respectively were optimal.
pavement- maintenance management systems of this , type provide a systematic and reasonable way to define overlay maintenance policies and develop long-range plans for future maintenance as well as a way to deter-mine the optimal utilization of available funds.
Similar systems could be developed for airport pave-ments and would probably be much simpler because of the limited area as compared to highway pavements.
CONCLUDING REMARKS
I hope this introduction to airport pavement management will place the materials presented at the conference in a proper perspective. Much information has been de-veloped in recent years that permits an increase in the scope of pavement design and rehabilitation and will (a)
Table 4. Overlay requirements for Baltimore-Washington International Airport.
Taxiway Section
Overlay Thickness Required Now to Provide Service to Future Year (mm)
1976 1981 1986 1991 1996
A-i - - 15.2 30.5 53.3 A-2 12.7 33.0 66.0 96.5 132.1 A-3 55.9 101.6 137.2 172.7 203.2 A-4 53.3 91.4 124.5 157.4 190.5 A-5 38.1 73.7 106.7 137.2 172.7 A-6a 76.2 114.3 150.0 182.9 210.8 A-6b 109.2 ' 157.5 195.6 231.1 271.8 B-2 - 12.7 25.4 45.7 78.7 c-1 50.8 91.4 127.0 157.5 200.7 C-2 63.5 104.1 139.7 170.2 213.4 0-1 30.5 68.6 104.1 139.7 172.7 D-2 - - 10.2 17.8 25.4 D-3 20.3 40.6 68.6 99.1 132.1 0-4 20.3 40.6 68.6 99.1 132.1 E-i - - 15.2 30.5 53.3 E-2 - 15.2 30.5 53.3 83.8 E-3 35.6 68.6 101.6 134.6 165.1 E-4 81.3 124.5, 160.0 193.0 226.1 F-1 111.8 160.0 198.1 236.2 274.3 F-2 81:3 124.5 154.9 195.6 233.7 F-3 76.2 121.9 154.9 193.0 231.1 C-i - 10.2 22.9 40.6 66.0 H-i - - - - - Note: 1 mm = 0.039 in
Figure 32. Schematic diagram of pavement-maintenance management system.
Table 5. Recommended overlay design Recommended Overlay Thickness (mm) program.
Year to Provide Overlay Priority Description 1975 1975-1978 1978-1980 1980-1983 1983-1985 1985-1988
Runway RW 10-28 127 - - - 101 - RW 15-33 101 - - - 76 -
2 RW4-22 '- - - 76 - - Tadway
TW F-i 127 76 - - - 76 1 TW A-6b 127 76 - - - 76 2 TW F-2 127 - - 101 - - 2 TW F-3 127 - - 101 - - 2 TW E-4 127 - - 101 - - 3 TW C-2 101 - 101 - - - 3 TW A-6a 101 - 101 - - - 3 TWA-3 101 - ioi - - - 4 TWC-1 101 - - - 101 - 4 TWA-4 101 - - - 101 - 5 TWA-S - 101 - - 76 - 5 TWD-1 - lOi - - 76 - 5 TWE-3 - 101 - - 76 - 6 TWA-2 - - 76 - - 76 6 TWD-3 - - 76 - - 76 6 TWD-4 - - 76 - - 76 7 TWE-2 - - - 101 - - 8 TWB-2 - - - 76 - - 8 TWG-i - - - 76 - - 9 TWA-i - - - - 76 - 9 TWE-i - - - - 76 - 9 TWD-.2 - - - - 76 -
10 TWit-i - - - - - - Note: 1 mm 0.039 in

32
Table 6. Summary of conference materials.
System Phase Category Specific Item Presenter FAA Report and Date
Input Traffic Lateral distribution on runway V. HoSang FAA-RD-74-36, Feb. 1975 Dynamic load effects R. Ledbetter FAA-RD-74-39-III, June 1976 Aircraft gear loads R. C. O'Massey -
Environment Frost T. Johnson FAA-RD-74-30, Oct. 1974 Volume change R. G. McKeen FAA-RD-76-66, Jan. 1976
Materials Portland cement concrete: F. Parker FAA-RD-74-37; FAA-RD-74-31, Nov. 1974; continuously reinforced concrete, and FAA-RD-74-34-1I, Nov. 1974 fibrous concrete, and prestressed concrete
Porous friction course T. White FAA-RD-73- 197, Feb. 1975 L. Duggan -
Soil classification F. Horn FAA-RD-73- 169, May 1974 Materials variability R. H. Brown -
E. H. Brown FAA-RD-73- 199, Oct. 1975 Load transmission capabilities (layer G. M. Hammitt FAA-RD-73- 198-11
equivalencies) Construction Quality control H. Brown FAA-RD-73-199, Oct. 1975
R. H. Brown - T. R. Wathen -
Materials consideration Fibrous concrete R. Lowe - Porous friction course T. White FAA-RD-73-197, Feb. 1975
Parker FAA-RD-74-37; FAA-RD-74-31, Nov. 1974; and FAA-RD-74-34-II, Nov. 1974
Pavement Thickness selection Portland cement concrete F. Parker FAA-RD-74-37; FAA-RD-74-31, Nov. 1974; structural and FAA-RD-74-34-11, Nov. 1974 model and Improved methodology W. Barker FAA-RD-74-199, Sept. 1975 mechanical Design for frost T. Johnson FAA-RD-74-30, Oct. 1974 state Design for swelling soils R. G. McKeen FAA-RD-76-66, Jan. 1976
Decision Pavement and aircraft Airport pavement compatibility study R. Hutchinson FAA-RD-73-206, Sept. 1974 criteria costs
Performance General considerations Framework M. Witczak - Functional evaluation Aircraft response to pavement
unevenness A. Gerardi FAA-RD-76-64
Unevenness measurement and P. N. Sonnenburg FAA-RD-74-188, April 1975; and criteria FAA-RD-75-110
Structural evaluation Nondestructive evaluation V. W. Hall FAA-RD-73-205-I, Sept. 1975 N. Yang - E. Barenberg -
Example O'Hare Airport D. M. Arntzen -
ensure effective use of marginal or new materials, (b) ascertain the effects of changing mixes in aircraft or of increased operations of specific aircraft, and (c) more effectively engineer large or unusual projects.
Table 6 summarizes the materials presented at the conference in aframework such as that shown in Figure 1.
Some concern might be expressed regarding the time and cost associated with the use of some of these con-cepts. I believe that we should recognize that pavement design and rehabilitation should not necessarily be ex-pressed in the form of simple charts or tables (i specify "not necessarily" because, under some circumstances, it may be worthwhile and expeditious to do so. for reasons of cost and convenience; however, under other circum-stances, such simplification is undesirable and the best engineering approach should be used).
Should not the cost of design of an airport runway be comparable to that of other engineering structures of comparable value? I believe that it should; one can en-vision more effort than the selection of thicknesses or other characteristics with the assistance of a few charts.
It is extremely important to follow through the pave-ment design process for the construction and maintenance of the resulting facility. If, for example, care is not ex-ercised in the control of the construction process, no matter how good the design, the pavement structure will not perform as expected. Thus, design and construction must be considered together as the design process.
The results of this research also provide a basis for the study of pavement rehabilitation. Fortunately, we have this theory to assist in developing sound rehabilita-tion practices! Many of the decision-making processes that have been developed in other areas provide us with the methodology with which to develop reasonable main-tenance strategies that will effectively use our limited monetary resources.
Much of this methodology is not as well developed as would seem desirable, but let us begin to use it as quickly as possible. For example, in performance and evaluation, we should be using existing technology now on a systematic and continuing basis to develop perfor-mance data rather than walting for the universal pro-cedure. As improved techniques are developed, they can be incorporated into the system.
REFERENCES
W. R. Hudson and T. W. Kennedy. Parameters of Rational Airfield Pavement Design System. Trans-portation Engineering Journal, Proc., ASCE, Vol. 99, No. TE 2, May 1973, pp. 235-254. J. A. Deacon. Equivalent Passages of Aircraft With Respect to Fatigue Distress of Flexible Air-field Pavements. Proc., AAPT, Vol. 40, 1971, pp. 194-226. M. W. Witczak. Design of Full-Depth Asphalt Air-field Pavements. Proc., 3rd International Confer-ence on the Structural Design of Asphalt Pavements, Univ. of Michigan, Ann Arbor, Vol. 1, 1972, pp. 550- 567. M. W. Witczak. Prediction of Equivalent Damage Repetitions for Aircraft Traffic Mixtures for Full-Depth Asphalt Airfield Pavements. Proc., AAPT, Vol. 42, 1973, pp. 277-299. M. W. Witczak. Asphalt Pavement Performance at Baltimore-Washington International Airport. As-phalt Institute, College Park, MD, Res. Rept. 74-2, 1974. E. S. Barber. Calculation of Maximum Pavement Temperatures From Weather Reports. HRB, Bull. 168, 1957, pp. 1-8. P. C. Pretorius. Design Considerations for Pave-

33
25
ment Containing Soil-Cement Bases. Univ. of 26. H. M. Westergaard. New Formulas for Stresses California, Berkeley, PhD thesis, 1969. in Concrete Pavements of Airfields. Trans., ASCE, Flexible Airfield Pavements. U.S. Army Corps Vol. 113, 1948, pp. 425-444. of Engineers, EM 1110-45-302, 1958, pt. 12. 27. Engineering and Design, Rigid Airfield Pavements. G. L. Dehlen. The Effect of Nonlinear Materials U.S. Army Corps of Engineers, Technical Memo- Response on the Behavior of Pavements Subjected randum 5-824-3, 1958. to Traffic Loads. Univ. of California, Berkeley, 28. B. F. McCullough. A Pavement-Overlay Design PhD thesis, 1969. System Considering Wheel Loads, Temperature B. G. Richard. Moisture Flow and Equilibria in Changes, and Performance. Univ. of California, Unsaturated Soils for Shallow Foundations. In Berkeley, DEng thesis, 1969. Permeability and Capillarity of Soils, ASTM, 29. W. J. Kenis. Response Behavior of Flexible Pave- STP 417, 1967. ments. Proc., AAPT, Vol. 42, 1973, pp. 542-563. K. Russam and J. C. Coleman. The Effect 30. C. L. Monismith, G. A. Secor, and K. E. Secor. of Climatic Factors on Subgrade Moisture Temperature-Induced Stresses and Deformation in Conditions. Geotechnique, Vol. 11, No. 1, Asphalt Concrete Pavements. Proc., AAPT, Vol. 1961, p. 22. 35, 1965, pp. 248-285. A. T. Bergan. Some Considerations in the Design 31. J. T. Christison, D. W. Murray, and K. 0. Ander- of Asphalt Pavements for Cold Regions. Univ. of son. Stress Prediction and Low-Temperature Frac- California, Berkeley, PhD thesis, 1972. ture Susceptibility of Asphalt Concrete Pavements. T. W. Kennedy, W. R. Hudson, and B. F. Mc- Proc., AAPT, Vol. 41, 1972, pp. 494-523. Cüllough. State of the Art in Variability of Ma- 32. J. M. Duncan, C. L. Monismith, and E. L. Wilson. terial Properties for Airport Pavement Systems. Finite Element Analysis of Pavements. HRB, High- Federal Aviation Administration, Rept. FAA-RD- way Research Record 228, 1968, pp. 18-33. 75-209, 1975. 33. R. Pichumani. Application of Computer Code to the R. G. Packard. Design of Concrete Airport Pave- Analysis of Flexible Pavements. Proc., 3rd Inter- ment. Portland Cement Association, Skokie, IL, national Conference on the Structural Design of As- 1973. phalt Pavements, Univ. of Michigan, Ann Arbor, J. M. Edwards and C. P. Valkering. Structural Vol. 1, 1972, pp. 506-520. Design of Asphalt Pavements for Heavy Aircraft. 34. J. T. Christison and K. 0. Anderson. The Re- Shell International Petroleum Co., London, 1970. sponse of Asphalt Pavements to Low-Temperature Full-Depth Asphalt Pavements for Air Carriers. Climatic Environments. Proc., 3rd International Asphalt Institute, College Park, MD, Manual Conference on the Structural Design of Asphalt Pave- Series 11, 1973. ments, Univ. of Michigan, Ann Arbor, Vol. 1, 1972, B. A. Vallerga and B. F. McCullough. Pavement pp. 41-52. Evaluation and Design for Jumbo Jets. Transpor- 35. J. A. Deacon. Fatigue Life Prediction. HRB, tation Engineering Journal, Proc., ASCE, Vol. 95, Special Rept. 140, 1973, pp. 78-92. No. TE 4, Nov. 1969, pp. 639-658. 36. C. L. Monismith and others. Asphalt Mixture Be- M. W. Witczak. Asphalt Concrete Overlay Re- havior in Repeated Flexure. Univ. of California, quirements for Runway 18-36, Washington National Berkeley, Rept. TE 70-5, Dec. 1970. Airport. Asphalt Institute, College Park, MD, 37. P. S. Pell. Characterization of Fatigue Behavior. Res. Rept. 72-4, 1972. HRB, Special Rept. 140, 1973, pp. 49-64. W. Heukelom. An Improved Method of Character- 38. J. Verstraeten. Moduli and Critical Strains in Re- izing Asphaltic Bitumens With the Aid of Their peated Bending of Bituminous Mixes: Application Mechanical Properties. Proc., AAPT, Vol. 42, to Pavement Design. Proc., 3rd International Con- 1973, pp. 67-98. ference on the Structural Design of Asphalt Pave- R. J. Schmidt and P. E. Graf. The Effects of ments, Univ. of Michigan, Ann Arbor, Vol. 1, Water in the Resilient Modulus of Asphalt-Treated 1972, pp. 729-738. Mixes. Proc., AAPT, Vol. 41, 1972, pp. 118-162. 39. W. van Dijk. Practical Fatigue Characterization M. R. Thompson. Shear Strength and Elastic of Bituminous Mixes. Proc., AAPT, Vol. 44, 1975, Properties of Lime-Soil Mixtures. HRB, Highway pp. 38-74. Research Record 139, 1966, pp. 1-14. 40. P. S. Pell and K. E. Cooper. The Effect of Testing J. K. Mitchell, P. E. Fossberg, and C. L. Moni- and Mix Variables on the Fatigue Performance of smith. Behavior of Stabilized Soils Under Repeated Bituminous Materials. Proc., AAPT, Vol. 44, Loading—Repeated Compression and Flexure Tests 1975, pp. 1-37. on Cement- and Lime-Treated Buckshot Clay, Con- 41. T. J. Larsen and P. J. Nussbaum. Fatigue of fining Pressure Effects in Repeated Compression Soil-Cement. Journal of the Portland Cement Asso- for Cement-Treated Clay. U.S. Army Engineer ciation Research and Development Laboratory, Waterways Experiment Station, Vicksburg, MS, Vol. 9, No. 2, May1967, pp. 37-59. Contract Rept. 3-145, May 1966. 42. L. Raad, C. L. Monismith, and J. K. Mitchell. J. K. Mitchell. The Properties of Cement Stabi- Fatigue Behavior of Cement-Treated Materials. lized Soils. In Materials and Methods for Low-Cost TRB, Transportation Research Record 641, 1977, Road, Rail, and Reclamation Works, Univ. of New pp. 7-11. South Wales, Sydney, Australia, Sept. 1976, pp. 43. T. E. Swanson and M. R. Thompson. Flexural 365-404. Fatigue Strength of Lime-Soil Mixtures. Univ. of R. L. Berg. Design of Civil Airfield Pavements fllinois, 1967. for Seasonal Frost and Permafrost Conditions. 44. R. L. Hutchinson. Basis for Rigid Pavement De- Federal Aviation Administration, Rept. FAA-RD- sign for Military Airfields. Ohio River Division 74-30, 1974. Laboratories, Cincinnati, Miscellaneous Paper R. G. Ahlvin and others. Multiple-Wheel Heavy- 5-7, 1966. Gear-Load Pavement Tests. Vol. 1. Kirtland Air 45. R. G. Packard. Fatigue Concepts for Concrete Force Base, NM, Basic Rept., Technical Rept. Airport Pavement Design. Transportation Engi- AFWL-TR-70-113, Nov. 1971. néering Journal, Proc., ASCE. Vol. 100, No.

34
TE 3, Aug. 1974, pp. 567-582. A. S. Vesic and S. K. Sa.xena. Analysis of Struc-tural Behavior of AASHO Road Test Rigid Pave-ments, NCHRP, Rept. 97, 1970. J. McElvaney. Fatigue of a Bituminous Mixture Under Compound Loading. Univ. of Nottingham, England, PhD thesis, 1972. P. S. Pell. Discussion of paper, Base Compaction, by N. W. Lister and W. D. Powell. Proc., AAPT, Vol. 44, 19759 pp. 111-114. F. N. Finn, K. Nair, and J. Hilliard. Minimizing Premature Cracking of Asphalt Concrete Pave-ments. NCHRP, Project 9-4, Final Rept., June 1973. R. H. Ledbetter, H. Ulery, Jr., and R. G. Ahlvin. Traffic Tests of Airfield Pavements for the Jumbo Jet. Proc., 3rd International Conference on the Structural Design of Asphalt Pavements, Univ. of Michigan, Ann Arbor, Vol. 1, 1972, pp. 876-902. J. Morris and others. Permanent Deformation in Asphalt Pavements Can Be Predicted. Proc., AAPT, Vol. 43, 1974, pp. 41-76. W. Heukelom and A. J. G. Kiomp. Consideration of Calculated Strains at Various Depths in Connec-tion With the Stability of Asphalt Pavements. Proc., 2nd International Conference on the Structural De-sign of Asphalt Pavements, Univ. of Michigan, Ann Arbor, 1967, pp. 155-168. R. D. Barksdale. Laboratory Evaluation of Rutting in Base Course Materials. Proc., 3rd International Conference on the Structural Design of Asphalt Pavements, Univ. of Michigan, Ann Arbor, Vol. 1, 1972, pp. 161-172. J. E. Romain. Rut-Depth Prediction in Asphalt Pavements. Proc., 3rd International Conference on the Structural Design of Asphalt Pavements, Univ. of Michigan, Ann Arbor, Vol. 1, 1972, pp. 70 5-710. D. B. McLean and C. L. Monismith. Estimation of Permanent Deformation in Asphalt Concrete Layers Due to Repeated Traffic Loading. TRB, Trans-portation Research Record 510, 1975; pp. 14-30. C. R. Freeme and C. L. Monismith. The Analy-sis of Permanent Deformation in Asphalt-Concrete Pavement Structures. Proc., 2nd Conference on Asphalt Pavements for Southern Africa, 1974. M. S. Snaith. Deformation Characteristics of Dense Bitumen Macadam Subjected to Dynamic Loading. Univ. of Nottingham, England, PhD thesis, 1973. S. F. Brown and M. S. Snaith. The Permanent Deformation Characteristics of a Dense Bitumen Macadam Subjected to Repeated Loading. Proc., AAPT, Vol. 43, 1974, pp. 224-252. J. F. Hills, D. Brien, and P. J. van de Loo. The Correlation of Rutting and Creep Tests in Asphalt
Mixes. Institute of Petroleum, London, Paper IP-74-001, Jan. 1974. C. Chomton and P. J. Valayer. Applied Rheology of Asphalt Mixes: Practical Application. Proc., 3rd International Conference on the Structural De-sign of Asphalt Pavements, Univ. of Michigan, Ann Arbor, Vol. 1, 1972, pp. 214-255. P. J. van de Loo. Creep Testing, a Simple Tool to Judge Asphalt-Mix Stability. Proc., AAPT, Vol. 43, 1974, pp. 253-284. C. L. Monismith, N. Ogawa, and C. R. Freeme. Permanent Deformation Characteristics of Sub-grade Soils in Repeated Loading. TRB, Transpor-tation Research Record 537, 1975, pp. 1-17. W. Heukelom. Observations on the Rheology and Fracture of Bitumens and Asphalt Mixes. Proc., AAPT, Vol. 35, pp. 358-399, 1966. Y. M. Salam. Characterization of Deformation and Fracture of Asphalt Concrete. Univ. of California, Berkeley, PhD thesis, 1971. P. Fordyce and W. A. Yrjanson. Modern Design of Concrete Pavements. Transportation Engineer-ing Journal, Proc., ASCE, Vol. 95, No. TE 3, Aug. 1969, pp. 407-438. L. Raad, C. L. Monismith, and J. K. Mitchell. Tensile Strength Determinations of Cement-Treated Materials. TRB, Transportation Re-search Record 641, 1977, pp. 48-52. R. D. Bradbury. Reinforced Concrete Pavements. Wire Reinforcement Institute, Washington, D.C., 1938. E. J. Yoder and M. W. Witczak. Principles of Pavement Design. Wiley, New York, 2nd Ed., 1975. R. Horonjeff. Planning and Design of Airports. McGraw-Hill, New York, 2nd Ed., 1975. Development of CBR Flexible Pavement Design Methods for Airfields: A Symposium. Trans., ASCE, Vol. 115, Paper 2406, 1950, pp. 453-554. J. P. Sale, R. L. Hutchinson, and D. F. Canton. Development of a Procedure for Designing Pre-stressed Airfield Pavements. Proc., HRB, Vol. 40 9 1961, pp. 205-234. L. G. Byrd and F. N. Finn. Proposed Research Framework. In Pavement Rehabilitation, Proc., TRB Workshop, Sept. 19-22, 1973, TRB, June 1974. D. Watkins, J. Lysmer, and C. L. Monismith. Nondestructive Pavement Evaluation by the Wave Propagation Method. California Department of Transportation Laboratory, Rept. TE 74-2, 1974. F. Finn, R. Kulkarni, and K. Nair. Pavement Management System: Feasibility Study. Washing-ton State Highway Commission, Rept., 1974. W. S. Smith. A Flexible Pavement Maintenance Management System. Univ. of California, Berkeley, PhD thesis, 1974.
Procedures for Airport Pavement Management Donald M. Arntzen, Bureau of Engineering, Chicago Department of
Public Works
The results of runway surveys at Chicago-O'Hare International Airport One of the goals of airport pavement management pro- are summarized, and the causes of the deterioration of these runways are cedures is economy. This encompasses all costs—loss evaluated. Procedures for their rehabilitation and reconstruction are de- of revenue, delays to aircraft and passengers, aircraft scribed. maintenance, pavement maintenance, pavement
strengthening, and reconstruction or new construction.

Figure 1. Pavements atOHare Internationar Airport.
35
The cost of operational delays to aircraft are fairly easy to determine, but the option of some airlines to shift connecting points to other cities and thereby de-crease the landing fees at an airport where delays are ecessive is not as obvious.
The cost of delays to passengers, although not di-rectly included in maintenance costs, can also ultimately result in loss of revenue to the airlines and municipality. There are a number of options available to passengers, such as canceling travel, holding conventions in other cities, or using other modes of travel. Aircraft main-tenance costs are difficult to assess, but tire damage is one visible effect.
Consequently, it is necessary to ascertain the main-tenance required for the life of a pavement and establish a maintenance program. From this program, schedules can be arranged to minimize disruptions and prepare budgets for financing.
The deterioration of an airport pavement can be di-rectly correlated to the traffic using it. Although run-ways are not as traveled as highways are, the number of load repetitions is as important as their magnitude. For example, in 1975, there were 694 000 operations at Chicago-O'Hare International Airport, which distributed among the six primary runways is more than 100 000 operations/runway.
On March 22, 1946, the United States, under pro-visions of the Surplus Property Act of 1944, conveyed to the city of Chicago the area known as Orchard Place Airport (Figure 1). In 1949, the city of Chicago began development of the Chicago-O'Hare International Airport with what is now the International Terminal. Runway 14R-32L was constructed, runways 9L-27R and 4L-22R were lengthened, and various taxiways and aprons were built. The typical pavement section was 178-mm (7-in) thick portland concrete cement (PCC) with 254-mm (10-in) thick edges and 381-mm (15-in) gravel on a min-imally prepared subgrade.
In 1955, runway 14R-32L was rebuilt, and in 1958 and
1959, it was extended to 3540 m (ii 600 ft) in length..' The width has remained constant at 60.1 m (200 it), and the shoulders are 1.2 m (4 it) wide. In 1968, the center 30.5 m (100 it) of the northern 2350 m (7200 it) (between stations 98 and 175) was removed and replaced with 305 mm (12 in) of continuously reinforced concrete pavement (CRCP) on a 762-mm (30-in) thick granular subbase. Therefore, this runway consisted of either 178 mm of PCC on 381 mm granular material or 305 mm (12 in) CRCP on 762 mm (30 in) granular material. This was the runway rebuilt to handle jets when O'Hare opened.
Runway 14L-32R was one of the original runways. It was 1676 m (5500 it) long and consisted of 178 mm of PCC with 254-mm-thick edges on 381 mm of gravel base on a minimally prepared subgrade. It was extended to 2286 m (7500 ft) in 1951 and to its present length of 3048 m (10 000 it) in 1965. The types of sections are described below (1 m = 3.28 it):
Length (m) Description
457 76 mm asphalt on 305 mm PCC and 381 mm base 1402 279mm asphalt on 178 mm PCC and 381 mm base 365 76 mm asphalt on 305 mm PCC and 381 mm base 822 305 mm CRCP on 305 mm base
Runway 9L-27R was another of the original runways. It was 1676 m long and consisted of 178 mm of PCC with 254-mm7thick edges on 381 mm of gravel base on a minimally prepared subgrade. It was extended in 1957 to its present length of 2260 m (7410 ft). The types of sections are described below (1 m = 3.28 it):
Length (m) Description
548 381 mm PCC on 305 mm base 1716 178 mm PCC on 381 mm base
Runway 4L-22R was the third of the original runways and consisted of 178 mm of PCC with 254-mm-thick edges on 381 mm of gravel base on a minimally prepared
36
subgrade. This runway was extended to 2290 m (7515 it) in 1965, which is its present length. The types of sec-tions are described below (1 in = 3.28 It):
Length (m) Description
264 305 mm PCC on 305 mm base 1766 178mm PCC on 381 mm base 274 305 mm PCC on 305 mm base
Runway 9R-27L was built in 1967 and consisted of 305 mm of CRCP in the critical areas and 254 mm of CRCP in the noncritical areas on 914 mm (36 in) or 457 mm (18 in) of base course. This design was limited to 305 mm by standards in use at that time. In addition, the reduction to 254 mm (10 in) was in accordance with design theory on CRCP at that time.
Runway 4R-22L was built in 1970 and consists of 427 mm (14 in) of CRCP on 152 mm (6 in) of cement aggre-gate mixture on a prepared subgrade from which unsuit-able material had been removed. This runway was not placed into unrestricted use until 1975 when obstructions in the nearby railroad yard were removed.
In 1973, a meeting of the Chicago Department of Avia-tion, Chicago Department of Public Works, Federal Avi-ation Administration, and airline representatives was convened to analyze and develop a program of pavement-strengthening construction, repairs, and maintenance. The various options available were investigated, although a number of restraints had to be considered. The first was that because of increased environmental pressures, it would be impossible to construct a new runway in the foreseeable future. The second was that traffic would continue at its present rate even though wide-bodied jets are now being used. Consequently, repairs requiring long shutdowns could not be tolerated. It is estimated that normal delays at O'Hare cost $44 300 000 without runway shutdowns in 1976 (1).
PCC construction necessitates longer shutdowns than do asphalt concrete overlays, and reconstruction in the intersections can be accomplished on weekends with as-phalt concrete but not with PCC. Thus, asphalt con-crete was chosen for the strengthening, which would be staged over a period of years. (Because asphalt con-crete oxidizes with age and the surface grooving wears down, periodic rejuvenation and regrooving are nec-essary.)
The first step was a detailed inspection of the run-ways to locate all failures, including hairline cracks. These were then plotted on runway plans in colors de-picting various levels of severity. Normally, a runway inspection is carried out by six men and a supervisor, who can survey two 2430-m (8000-It) runways in average condition in 1 d.
This detailed inspection of the pavement sections and failures demonstrated some important facts. First, the airport pavement was generally below strength for the imposed loading. This was not caused by original under-design, but by increases in loading above the design. Also, financial constraints have sometimes been im-posed that limited the pavement sections.
Second, the failures occurred in all types of pave-ment similarly loaded. In the case of runway 14R-32L, both the 381-mm-thick conventional PCC and the 305-mm-thick CRCP failed in the center half.
Third, the various runways have multiple types of pavement sections, which precludes uniform overlays or repair procedures. The conditions found by the sur-veys are summarized below:
1. Runway 14R-32L—(a) centerline keyway failures in center half of runway, (b) CRCP failures in center half of runway, and (c) failures in the 381-mm plain
concrete in center half of runway; Runway 9R-27L—(a) centerline keyway failures in
eastern half of runway, (b) CRCP failures in eastern half of runway, but (c) no failures in portions of runway over-laid with 51-mm (2-in) asphalt concrete;
Runway 14L-32R—(a) centerline keyway failures in CRCP in center half of runway, (b) CRCP failures in center half of runway, (c) reflective cracks in asphalt concrete overlay (indicating insufficient strength of pave-ment), and (d) rutting in asphalt concrete on 32R end;
Runway 4L-22R—(a) excellent condition of PCC concrete on 22R end but (b) failures in asphalt concrete throughout (indicating insufficient pavement strength);
Runway 9L-27R—deterioration of asphalt concrete overlay from intersection with runway 14L-32R to high-speed turnoff with grooving worn down to 1.6 mm ('/ie in); and
Runway 4R-22L: unused in 1973.
Because the patterns of failures on the runways seemed inconsistent, further observations and tests were made. Runway 9R-27L parallels Lake O'Hare, which could cause a higher water table under the runway, but tests did not indicate this. However, observations of traffic made from the tower unlocked the puzzle. For example,
On runway 14R-32L, (a) aircraft landing 14R land long and roll down to the terminal; (b) aircraft landing 32L land normally and turn off at the terminal; (c) air-craft taking off 32L start at taxiway T-1 (except for heavies); (d) aircraft taking off 14R are airborne before reaching the terminal; and (e) these operations result in an overlap of traffic in the center half by the landing air-craft and takeoffs in the 32L direction and
On runway 9R-27L, (a) aircraft landing 27L land normally or short and attempt to turn into the terminal be-fore crossing runway 14R-32L; (b) aircraft taking off 27L are normally airborne before reaching runway 14R-32L; (c) aircraft landing 9R land long and cross runway 14R-3aL before turning into the terminal; (d) aircraft taking off 9R are normally airborne before reaching the north-south taxiway; and (e) the predominant use of this run-way, which carries about 28 percent of the total traffic, is in the 27L direction so that the failures on the east end can be explained by overlapping of takeoffs and land-ings and the resulting heavy usage.
Similar analyses of traffic on the other runways con-firmed the correlation of traffic and pavement failures.
The inspections indicated that runways 14L-32R, 14R-32L, and 9R-27L needed base repairs before over-lays. At that time, these three were the primary run-ways because runways 9L-27R and 4L-22R needed major repairs and overlays and were restricted in use because of their lack of shoulders. Thus, it was operationally necessary to keep the primary runways unrestricted in use, and repairs would have to be made before major failures occurred. It was thus decided that base repairs would be made in 1973, and overlays would be made in 1974.
A contract was bid and awarded in the fall of 1973. The pavements were restored to their original strengths, and the keyway in the distressed areas was sawed.
In 1974, the primary runways were strengthened at a cost of $5 053 910. Runways 14R-32L and 9R-27L were overlaid with 152 mm of asphalt concrete, and run-way 14L-32R was overlaid with 152 mm of asphalt con-crete on the CRCP portion. The overlay design on the CRCP was based on studies by the British (2).
The overlay between the intersections of runways 4L-22R and 9L-27R was held to 76 mm (3 in) to minimize

37
the transitions and await the final overlay design for those runways.
Because shoving was observed on 3211, it was decided not to overlay the PCC on the ends of the runways, which was also consistent with theobserved traffic. For uni-formity of marking, a slurry seal that tapered from 152 to 19 mm (6 to in) was applied from the end of the runway to the beginning of the asphalt overlay.
In 1973, the U.S. Army Corps of Engineers conducted nondestructive tests on the CRCP runways at O'Hare Airport, and in 1974, a regular program of such testing was begun. The purpose of these tests was twofold: First, because stage construction was being used, it was necessary to monitor the conditions of the runways very closely. Conventional condition surveys were being made each spring and fall to determine when the next pavement strengthening would be required, but these surveys record events only and do not predict failures accurately. It was hoped that the nondestructive tests would indicate degradation of the pavement before the occurrence of surface defects so that orderly repairs could be scheduled.
Second, because these tests can be made so easily on a pavement, it is advantageous to use them for design and checking construction.
It is fortunate that this program was begun before the overlays on the CRCP runways were constructed be-cause this permitted a comparison of strengths. Since then, tests have been run in 1975 and 1976 (Figure 2).
In 1975, the overlays of runways 4L-22R and 9L-27R were completed at a cost of $6 850 000. This was not according to the original proposal, which had called for building new runways parallel to 4L and 9L and convert-ing the present 4L-9L to taxiways, but environmental and financial constraints precluded this. By 1968, passenger traffic had ceased to grow at an annual rate of 10 percent, and many e?qansion plans were canceled. Consequently, pavements designed in 1942 to handle bombers from the Chicago Aircraft Assembly Plant were upgraded to handle fan jets, including the Boeing 747.
A very careful investigation, including a complete soils testing analysis, was made. The soils tests were made by a consultant who also prepared the plans and
Figure 2. Dynamic stiffness modulus (DSM) 892.90
profiles of runway 14L-32R. (5000)
432 r
(40001 . \
74
357.16
2000L
.Z'3 l 8.58 U,
(0.00)
892.90 (5000)
i 714.32 ' (400ct
n-i 535.74 (3000)
357.16 (2000) J
specifications for runway 4L-22R. The plans and speci-fications for runway 9L-27R were prepared in-house. The records for the original construction were not avail-able, nor had a soil profile been taken. Therefore, the first step was to take 41 cores at selected locations and prepare subsurface profiles. After analysis of the sam-ples and examination of the profiles, test pits for plate-load tests were located. There were eight test pits on runway 4L and seven test pits on runway 9L. High-early-strength concrete was used to repave the test pit openings, and suitable strengths were obtained in 16 h. Based on these results, full-depth pavement repairs near the intersections were made during the weekends under the runway overlay projects. Several methods of de-sign—Federal Aviation Administration (FAA), Army, Navy, Air Force, Asphalt Institute, Portland Cement Association, and limiting subgrade deflection—were in-vestigated; the FAA method, which resulted in the most conservative overlay requirements, was chosen.
In conjunction with the annual nondestructive testing program being implemented at O'Hare, the Corps of Engineers was also requested to make design recom-mendations for runways 4L-22R and 9L-27R. To achieve compatibility with the FAA procedures, the tests were made adjacent to the test pits on both runways. The re-sults were correlated, and design recommendations were prepared.
These design recommendations are shown in Figure 3. The actual overlays were less than the design be-cause stage construction is being used, and additional overlays estimated to be 76 mm (3 in) in thickness at approximately 5-year intervals are planned.
The repeat tests showed the stiffness of the pavements very clearly, but it became apparent in the 1976 tests that temperature corrections would be necessary to make the various yearly tests compatible. Curves for design overlays and allowable loads were also prepared by the Corps of Engineers (3).
As more information and records are accumulated, it should be possible to compare the various types of pavements and empirically determine their load-carrying capacities. From these observations, standards for future construction at O'Hare could be developed. It may
LEGEND
5.79 M..—o(19 FT)EAST OF CENTER LINE (1975) 5.79 M...__.(19 FT)EAST OF CENTER LINE (1976)
9.14.64 12.19.52 15*24.40 18*29.28 21*34.16 24.39.04 27*43.90
\V/
\ ,/ LEGEND 5.79).o—o (19 FT)WEST OF CENTER LINE (1975) 5.79 M. ---. (19 FT)WEST OF CENTER LINE (1978)
15.24.40 18.29.28 21*34.16 24.39.04 27..91
(0*00) (10*00) (20.00) (30.00) (40.00) (50+00) (60.00) STATION • N. (FT.)

38
Figure 3. Overlay design for runways 9L-27R and 4L-22R.
2 FA 10,90. Ui - R
(0)'73J7 48*178.05 5l..2.93 54.40780 57.49268 60.49756 64.402.41. 674)7.32 70 .112 20 73.11707 (150.00) (160.00) (170,00) 0e0..00) (190.00) (200.00) (210.00) (220.00) (230.00) (240.00)
STAT ION,M.(FT.) 22R 4L
(01 0.00 3 04.88 6.0.76 9,11.64 12.1 9.52 15.7 .40 18.' 1.28 4.16 24. 04 (0.00) (104) (20.00) (30.00) (40.00) (50.00)
STATION. M. (FT.) LEGEND
- DESION OVERLAY BASED ON DSU TEST RESULTS
PROPOSED OVERLAY TO BE CONSTRUCTED
(60.00) (70.00) (00.00) 7. ISO (90.00)
be possible to develop a minimum strength for various types of pavements in terms of the dynamic stiffness modulus, which ranges from 1000 to 6000. However, these programs will take time, and correlation through FAA and the Corps of Engineers on pavements at other airports should be studied.
Decisions about the construction and maintenance of runways are also affected by operational and environ-mental considerations. Consequently, the rehabilitation of existing pavements, rather than the construction of new, may be necessary. This requires that all the available information be obtained about such factors as traffic, existing pavements, and soils. New methodol-ogies such as nondestructive testing should be investi-gated to supplement present technologies, so that ra-tional decisions supported by facts about how to most
economically maintain airport pavements can be made.
REFERENCES
Delay Task Force Study: Chicago-O'Hare Inter-national Airport. Federal Aviation Administration, Rept. FAA AGL-76-1, Vol. 1, Executive Summary, 1976. F. R. Martin and A. R. Macrae. Current British Pavement Design. Institute of Civil Engineers, Nov. 12, 1970, pp. 47-58. J. W. Hall, Jr., and Robert T. Sullivan. Nonde-structive Structural Evaluation: O'Hare International Airport. U.S. Army Engineer Waterways Experi-ment Station, Vlcksburg, MS, Nov. 1976.
Aircraft-Pavement Compatibility Study F. H. Griffis, Jr., U.S. Army Engineer Waterways Experiment
Station, Vicksburg, Mississippi M. A. Gamon, Lockheed- California Company, Burbank,
California
An economic analysis is summarized that was performed to relate the cost of upgrading airport pavements to the penalty cost associated with adding gears and wheels to aircraft to provide adequate flotation for present-day pavement design criteria. A basic assumption was made that the wide-body jets and a 680-Mg (1.5-million Ib) aircraft (categories 1 and 2 aircraft respectively) would use the 26 projected major hub airports by 1985. Three types of gear were designed for categories 1 and 2 air-craft: (a) current; i.e., flotation that is compatible with present pavement criteria; (b) median, a compromise design that considers both present pavement criteria and the optimal gear for aircraft structure; and (c) opti-mal, a gear optimized for the aircraft structure with no regard for the pavement flotation requirements. Costs were based on each type of gear for both categories of aircraft. Pavement data were surveyed for all 26 projected 1985 major hub airports. Thicknesses for rigid and flexible pavements were determined for categories 1 and 2 aircraft for both new construction and for overlay of selected pavement areas where the air-craft might operate. Aircraft costs were developed as associated with carrying landing-gear masses and volumes in excess of the optimal gear. Pavement.upgrading costs were determined, and cost comparisons were made. Recommendations were presented relative to policy decisions on pavement criteria.
An economic analysis relating the cost of pavement up-grading to the penalty cost associated with adding gears and wheels to aircraft to provide adequate flotation for present-day pavement design criteria has been per-formed. Adequate flotation as used here implies distrib-uting the total mass of the aircraft over a larger area to keep pavement stresses within acceptable limits. Spe-cifically, the question to be answered was, Should the Federal Aviation Administration (FAA) policy on pavement strength—i.e., that the maximum pavement strength for which Federal-Aid Airport . Program (FAAP) [which has been superseded by the Airport Development Aid Program (ADAP)] funds may be ap-plied at any airport may not exceed that required for a 1560 kN (350 000 lbf) dual tandem gear airplane—be changed due to the advent of wide-body jets (the B-747, DC-b, and L-bO11) and the possible addition of an, air-craftweighing up to 680 Mg (1.5 million lb) to air carrier

Table 1. Gear designs for categories 1 and 2 aircraft.
Item
Category 1 Aircraft
Current Median Optimal
Category 2 Aircraft
Current Median Optimal
Gear configuration Six-wheel bogie Four-wheel bogie Four-wheel bogie Five six-wheel Four six-wheel Three six-wheel bogies bogies bogies
Tire vertical load, kN 172.3 285.7 258.7 211.4 264.2 352.3
Tire pressure, kPa 1380 1380 1480 1035 1380 1725
Tire diameter. cm 122 143 136 143 145 148
Bogie size, cm a 107 113 108 133 134 138
b 248 152 145 306 310 318
c 143 - - 177 179 183
39
Note: 1 kN = 224 Ibi, 1 kPa = 0,145 lbt/io', and 1 cm = 0.39 in
Figure 1. Bogie configurations (a) (b)
for categories land 2 aircraft: a a six wheel and (b) four
wheel.
I.
Figure 2. Gear locations for category 2 aircraft: (a) current. median, and (c) optimal.
(a) 54 rn (b) v.44rn
I
(c)
4.34 1 14.34 rn L434
15.57rn 15.57 rn 15.57m
FUSELAGE FUSELAGE FUSELAGE
Note: 1 in 3.28 ft.
fleets by 1985? The basis for the answer was purely economic; environmental, sociopolitical, and energy factors did not enter into the trade-off criteria. The basic assumption that wide-body jets and the 680-Mg aircraft would be using all 26 projected major hub air-ports in 1985 was not challenged.
AIRCRAFT COSTS
To conduct the study, a contract was let to a commercial aircraft company to develop two hypothetical aircraft types. The category 1 aircraft corresponds to the pres-ent wide-body jets, and the category 2 aircraft corre-sponds to the projected 680-Mg aircraft. Three types of gear were designed for both categories of aircraft. Type 1, referred to as the current gear, has a flotation' compatible with the present FAAP-ADAP maximum de-sign criteria. Type 2, referred to as the median gear, is a compromise that was designed by considering both the present FAAP-ADAP pavement criteria and the optimal gear designed with respect to the aircraft struc-ture and, ideally, lies midway between the two with re-spect to flotation requirements. Type 3, referred to as the optimal gear, is optimized with respect to the air-craft structure with no regard to pavement flotation re-quirements.
In this portion of the study, the gear types were op-timized with respect to cost rather than to mass.
'The optimization procedures minimize acquisition, maintenance, and flight-operation costs of wheels and tires with'respect to total mass, vertical load, and tire pressure; brakes with respect to total mass, rejected takeoff, landing kinetic energy, service energy, and number of brakes; bogie beam with respect to total mass, vertical load size, and labor as a function of total num-ber of gears; gear strut, braces, and actuators with re-spect to total mass, takeoff gross mass, number of gears, and material as a function of gear mass; and gear-support structure with respect to total mass, takeoff gross mass, number'of gears, and gear location. The gear designs for the categories 1 and 2 aircraft are given in Table 1; the bogie configurations of both are shown in Figure 1; and the gear locations of category 2 aircraft are shown in Figure 2.
Pavement data for the 26 airports that are projected to be major hub airports in 1985—a major hub airport is defined as one that enpianes more than 1 percent of the domestic enplaned passengers—were surveyed. This survey provided a basis for designing the overlay thick-nesses required for the pavement-cost section and a central source of pavement data.
Finally, the aircraft cost was developed associated with carrying landing-gear masses and volumes in excess of those optimized with respect to the aircraft structure and with no regard to the pavement strength. These costs arise from four sources—acquisition, maintenance, flight, and lost revenue.
The first three costs were included in the landing-gear design because it was based on the least cost design. The lost-revenue cost was based on the lost payload of the aircraft. Several assumptions were made to determine this payload. Figure 3 illustrates the probability as-sumptions, which include an average weekly payload (), a normal distribution of payload mass about X, and a coefficient of variation of 60 percent. The lost revenue was calculated by the following procedure:
The total revenue is calculated based on the sum of the products of the number of passengers carried, the distances they traveled, and the yield per passenger per unit distance traveled and of the amounts of cargo car-ried, the distances they are carried, and the yield per unit amount of a cargo per unit distance carried.
The total mass carried is calculated based on the sum of the products of the passenger distances traveled and. an average mass [91 kg (200 lb)] per passenger and of the cargo distances traveled, both divided by the flight distances.
The average yield is calculated by dividing the total revenue by the total mass.
The annual expected lost revenue by type of air-craft by distance block under various landing gear and operational empty mass assumptions is calculated by multiplying the average yield by 52 weeks/year.

40
Figure 3. Determination of lost payload. OPERATING
WEIGHT _______
EMPTY MAXIMIJM ALLOWABLE GROSS WEIGHT (~MAX TOGW FUNCTION
STRUCTURE FUEL PAYLOAD 1 OF RUNWAY LENGTH AND si ELEVATION)
AIRPLANE WEIGHT
- X MAX TOGW (AIRPLANE
X STRUCTURAL LIMIT)
STATISTICAL DISTRIBUTION OF PAYLOAD WEIGHT DEMAND -_
LOST PAYLOAD WEIGHT X = PAYLOAD AT MAXIMUM ALLOWABLE
GROSS WEIGHT
X =MEAN VALUE OF STATISTICAL DISTRI-BUTION OF PAYLOAD WEIGHT DEMAND
5. The total annual lost revenue from operations out of the 26 airports is calculated by summing the annual expected lost revenues over all the distance blocks analyzed.
The total acquisition, operation, maintenance, and lost revenue costs in 1985 dollars for the categories 1 and 2 aircrafts relative to the optimal gear configura-tions are given below.
Cost ($)
Aircraft Current Gear Median Gear
Category 1 6 673 397 1 929 880 Category2 68777864 35160820
Total 75451 261 37090700
PAVEMENT COSTS
Because of spatial and temporal variables, a statistical approach was used to develop the total pavement-upgrading costs. (The Dallas-Fort Worth Regional Air-port, which has been designed for a 680-Mg aircraft, was excluded from the analysis.) It was assumed that two major runways, the associated taxiway systems, and the entire apron area at the remaining 25 airports would be overlayed with either a rigid or a flexible pavement; the type of pavement was determined from historical records. Land-acquisition costs were not included in this analysis.
The initial step in developing the unit price for each pavement-upgrading project was to determine the rela-tion between the pavement cost and the total upgrading cost. Bid tabulations for 14 major airport paving proj-ects published in 1971/1972 were analyzed. The upgrad-ing costs were subdivided into seven categories, and the mean percentages of category cost to total upgrading cost and their standard deviations (as) were computed by using small sample statistics. These values are given below.
Category X a
Excavation 13.10 11.08 Pavement 72.79 9.81 Subsurface structures 7.13 5.70 Wiring 1.74 2.27 Lighting 2.21 4.47 Painting 0.37 0.67 Miscellaneous 2.66 4.92
Although there are some rather large variances in the categories other than pavements, this is inconsequentia). The average price of pavement as a percentage of the total contract price is 72.79 percent with a coefficient of variation of 14 percent.
An analysis of variance showed that there was no sig-
nificant difference between the percentages of rigid and of flexible pavement prices to total contract price. Thus, a grouped analysis was used to determine the ratios of pavement price to total price. These parameters are given below.
Type of -
Pavement X . a
Rigid ' 77.51 8.03 Flexible 68.06 9.60
The pavement unit prices were developed, insofar as possible, on the basis of the price per unit area per unit depth. Bid tabulations for numerous projects, which were listed on a price per unit area basis, and FAA forms 5100-1, which record the depth of each pavement layer, were collected on a regional basis. Prices were assumed to decrease hyperbolically with increased thick-ness within an acceptable range.
The unit prices were calculated by dividing the price per unit area by the thickness. Some national average prices for pavement products are given in Table 2.
The prices used for each of the 25 airports were derived in order of priority according to the following sources:
Project bid data at the particular airport if two or more tabulations were available (this requirement was for some statistical credibility),
Regional averaged bid data for those regions sup-plying adequate data, and
The nationwide averages given in Table 2.
The third step in developing the pavement cost was to design the pavement cross sections required for the cate-gories 1 and 2 aircraft. FAA design criteria were used for the design at a standard 100 000 aircraft-pass level. Only those areas assumed required for operations were considered for design.
Pavement areas for costing purposes were selected subjectively-. These areas were scaled from sketch drawings where possible. For those that were not scaled, suitable assumptions were made with respect to the areas involved. From a macro point of view, this was adequate.
Because the total cost varies linearly with the surface area, a sensitivity analysis with respect to area and other parameters was performed. Only two types of overlays were considered: full-depth bituminous overlays and portland cement concrete overlays. The total expected area is 25 029 452 m2 (29 939 536 yd2), of which 32.2 per-cent is runway area, 23.4 percent is taxiway area, and 44.4 percent is apron area.
A comparison between the total aircraft and the total pavement costs was made in terms of the equivalent an-nual costs in 1985 dollars. The total pavement-upgrading cost was developed by summing the products of the price'

41
Table 2. Average prices for pavement products. - Number of Mean Standard.
Pavement Product Cost Units Observations PriceS Deviation
Portland cement concrete S/unit area/unit depth 46 0.94 0.34
Bituminous surface course S/unit area/unit depth 21 0.54 0.14
Crushed aggregate base S/unit area/unit depth 8 0.19 0.03
Bituminous base S/unit area/unit depth 13 0.59 0.22
prime coat S/unit area 9 0.07 0.02
Tack coat S/unit area 23 0.03 0.02
Prices are for unit area in square yards and unit depth in inches; SI units are not glees because these prices were derived for U.S. customary units only.
per unit area per unit depth and the designed thicknesses for each pavement section of each of the 25 airports di-vided by the ratio of the pavement cost to the total up-grading cost. The total pavement cost in 1972 dollars was obtained by multiplying the unit price for each pave-ment section by the area of that section and summing over 25 airports. These prices were calculated for each category of aircraft and each type of gear relative to a zero cost for not upgrading.
The basic equation for determining the equivalent an-nual pavement cost in 1985 dollars can be expressed as
x = p xA x(1 +j)" (i(1 +i)m/[(1 +j)m - i]) (1)
where
x = equivalent annual cost of pavement upgrading (1985 dollars),
p = average total cost of upgrading per unit area, A =.pavement area to be upgraded,
= interest rate, n = number of years to construction (or bond issu-
ance), and m = amortization period of pavement structure.
Some basic value assumptions were necessary to make comparisons by using this five-space function. Expected values for p of $7.36, $7.77, $7.45, and $12.82 in 1972 dollars were computed for the category 1 median and optimal gears and the category 2 median and optimal gears respectively. The remaining independent variables were assumed to be i = 5 percent, n = 13 years (since construction must be concluded in 1985 for the compar-ison to be valid), and m = 20 years.
Because these assumptions will most certainly be challenged, a thorough sensitivity analysis was per-formed for each assumption and procedures were de-veloped for recomputing x by using the challenger's own assumptions. The total costs calculated from Equation 1 by using the above assumptions are given below.
Cost ($)
Aircraft Median Gear Optimal Gear
Category 1 33328803 35 218 395 Category 2 33 749 362 58 097 736
Because of the difficulty of predicting future construc-tion costs, three separate costs were developed for each type of gear. It was assumed that the probable coeffi-cient of variation in both the unit-price and area-to-be-paved calculations was 20 percent. A lowest probable cost of pavement upgrading was computed by assuming a 20 percent low-side calculation in both p and A, and a highest probable cost was computed by assuming a 20 percent high-side calculation in both p and A. However, the original assumptions for i, n, and m were not changed.
While a variety of analyses were performed for the pavement-upgrading cost, only a single point estimate
of the aircraft penalty cost has been made. This should be considered in examining conflicting alternatives.
COST COMPARISONS
This section presents the economic justifications for either modifying or not modifying the current FAA stan-dards for pavement strength.
Category 1 Aircraft
Based on the equivalent annual cost analysis using the median probable cost for pavement upgrading, the total equivalent annual costs are
Gear Cost ($)
Current 6 673 379 Median 35 258 683 Optimal 35218395
Thus, the optimal alternative is to not modify the present policy if one considers only the category 1 aircraft. The total equivalent annual costs based on the equivalent an-nual cost analysis using the lowest probable cost for pavement upgrading are given below and lead to the same decision.
Gear Cost 1$)
Current 6673379 Median 13943790 Optimal 12666 249
Categories 1 and 2 Aircraft
A basic assumption inherent in the following analysis is that a pavement structure upgraded for the category 2 aircraft would be adequate for the, additional category 1 aircraft occurring concurrently. The state of the art in pavement analysis does not yet adequately predict the ef-fects of mixed traffic on pavement deterioration. Based on the equivalent annual cost analysis using the median probable cost for pavement upgrading, the total equiva-lent annual costs are
Gear Cost ($)
Current 75 451 243 Median 70 840 062 Optimal 58 097 736
These costs indicate that the present policy should be changed to permit the optimization of the gear to the category 2 aircraft. However, if one assumes the high-est probable cost for pavement upgrading, a conflicting alternative arises as shown below.
Gear Cost ($)
Current 75451 261 Median 103 239.690 Optimal 113842221

42
Figure 4. Effects of variations in pavement life and inflation factor.
Afz 20 V
00
80
25
30
40 50
0 40 Z . I-
h.
20 50
Ii- 0
0 I.I..
I.. 20
'a,-U_j
ia a. • I-
40 I.
PAVEMENT UPGRADING COST EXCEEDS AIRCRAFT PENALTY COST
/////AIIXRCRAF:r
LINEOF(QLMLCOST
9 (0 INTEREST RATES 0/0
PENALTY COST CEEDS PAVEMENT GRADING COST
Note: A 25 029 452 m2 (29 939 536 yd2), n 13 y, and p $1 2.82.
It is reasonable to assume that the median prob-able cost will be exceeded in the pavement upgrading for the category 2 aircraft. In all probability, the area to be paved will exceed that computed here. The unit price differential may or may not increase. Thus, it is critical to the decision maker that a proper de-termination be made as to whether the category 2 air-craft will be operational in 1985, whether it will operate at all 26 projected major hub airports or perhaps at only 7 to 10 regional airports, and other operational assump-tions.
Other Variable Considerations
The assumptions and parameters used in Equation 1 can be varied to permit the development of other policy deri-vations. Figure 4 presents a convenient method for changing the assumptions for i and m, but retaining the assumptions of median probable cost for pavement up-grading and that n = 13.
RECOMMENDATIONS
The following recommendations based on the calculations
and assumptions given here resulted from this study.
If only the category 1 aircraft will be in operation at the 26 projected major hub airports in 1985, the cur-rent FAAP-ADAP criteria should not be changed.
If both the categories 1 and 2 aircraft (implied also is the category 2 aircraft alone) will be in operation at the 26 projected major hub airports in 1985, the current FAAP-ADAP criteria should be changed to permit the gear to.be 'optimized to the aircraft. The possibility of operating the category 2 aircraft at only 7 to 10 regional airports should also be investigated.
ACKNOWLEDGMENT
This paper is a summary of a report to FAA (!).
REFERENCE -
1. F. H. Griffis, Jr., and M. A. Gamon. Aircraft-Pavement Compatibility Study. Federal Aviation Administration, Rept. FAA-RD- 73-206, Sept. 1974; NTIS, Springfield, VA, ADA-001-408.

PAVEMENT DESIGN
Abridgment
Design of Pavement With High-Quality Structural Layers George M. Hammitt, U.S. Army Engineer Waterways Experiment Station, Vicksburg,
Mississippi
It is generally recognized and field observations have verified that the performance of a pavement is related to the quality and thickness of the layers making up its structure. Present criteria generally require minimum thicknesses based on the use of specified materials (hereafter referred to as conventional materials or con-ventional pavements) that have been shown by experience to give satisfactory performance. However, experience in accelerated testing of full-scale pavement sections has shown that the use of materials more durable and stronger than conventional materials permits a reduc-tion in the thicknesses required for equal performance. The quality of the materials used can be improved by either selective use of existing materials or chemical or bituminous stabilization (hereafter simply referred to as stabilization) of them. Stabilization can be used to trans-form locally available materials of either specified or marginal quality into acceptable or high-quality ma-terials, thereby reducing the required thickness of the locally available material. These reductions in thick-ness requirements often offset the additional expense of stabilization. The performances and possible economic advantages of stabilization have therefore been fairly well defined. The basic problem underlying further ad-vancement of the state of the art is that of developing a method for incorporating the increase in performance into design considerations.
The purpose of this study was to develop design cri-teria and construction procedures for airport pavements incorporating structural layers of high-quality materials.
The study was accomplished as follows:
Two specially designed test sections of pavement composed of items representing a range of stabilization efforts were constructed and trafficked to failure under controlled, accelerated conditions.
Data from the specially designed test sections and from previous studies of test sections composed of sta-bilized and high-quality materials were compiled and used as input to an analysis of construction and perfor-mance characteristics of pavements incorporating high-quality materials.
The results of the analysis were used to formulate design criteria and construction procedures.
SUMMARY OF WORK ACCOMPLISHED
Two specially designed test sections, including four items surfaced with asphalt concrete (Ac) and two items surfaced with portland cement concrete (cc), were evaluated; Simulated aircraft traffic was applied with 890 and 1070-kN (200 000 and 240 000 lbf) dual-tandem assemblies. Visual observations of the behavior of the items were recorded throughout the traffic period and supplemented by photographs and rod and level readings. After completion of the trafficking, additional tests were
conducted by excavating trenches across the traffic lanes. Data from previous studies that incorporated stabi-
lized and high-quality unbound materials (15 AC-surfaced items and one PCC-surfaced item) were also used in this study. Single-wheel loadings of 220 and 330 kN (50 000 and 75 000 lbf), dual-tandem loadings of 710 and 890 kN (160 000 and 200 000 ibf), and a 12-wheel loading of 1600 kN (360 000 lbf) were used in trafficking these items. The general approaches and methods of testing were nearly identical for all test sections.
FLEXIBLE PAVEMENT ANALYSIS N
Two methods of analysis were applied to the data from the AC-surfaced items, one based on elastic layer theory and the other on comparisons of performance. . The theo-retical method involved the use of computerized models• to predict the performance of each item. The response parameters used as input to the models included the re-silient modulus as determined from resilient triaxial tests, the average modulus as determined from uncon-fined compression tests, and the tensile modulus as de-termined from indirect tensile tests. The performanc predictions were made based on computed subgrade stresses and surface deflections and on limiting subgrade strain criteria. The results of the analysis showed that the stiffness of the stabilized materials in the various items was considerably lower than the resilient stiffness of the laboratory\specimens. It was not possible to de-velop a corretionbehen the labortory material - characterization and the
Al a theoetically based design procedure-could notbQp-fected.
The comratirformance method involved a comparison of the results from the various items with conventional flexible pavement criteria. The subgrade strength, environmental conditions, and loading condi-tions were held relatively constant in the items, while the quality of the material in the items was varied, which made a direct comparison of material quality and pave-ment performance possible. To account for the differ-ences in performance of the items, equivalency factors were developed that consist of the ratio of the required thickness of a conventional base or subbase layer to that of a layer of the high-quality material.
The approach used in developing the equivalency fac-tors was to compute the thickness of conventional flexible pavement that would perform in the same manner as the test item with the high-quality layer. The conventional flexible pavement was then assumed to have the minimum requirements of 7.6 cm (3 in) of AC and 15.2 cm (6 in) of base with the remainder of the structure being subbase, and the ratio of the thickness of the high-quality material to that of the conventional base or subbase calculated. After the equivalency factors were calculated for all the test items, values were selected to represent several
43

86.4
91,3
76.2
71,1
56.0
61.0
E
55.9
50.8 U I-U
IS 45.7 U z 0 U
40.6
35.6
30.5
25.4
20.3
(5,2
44
types of soil, depending on the type of material or sta- Equivalency Factor bilizing agent. In all cases, the resulting high-quality Material Base Subbase material must meet specified strength and durability re- - quirements before the equivalency factor can be used in ML, MH, CL, and CH soils - 1.70 design. The equivalency factors are shown below. SC and SM soils - 1.50
Lime stabilized
Equivalency Factor ML, MH, CL, and CH soils - 1.00 SC, SM, GC, and GM soils - 1.10 Material Base Subbase Lime, cement, and fly-ash stabilized
Asphalt stabilized ML, MH, CL, and CH soils - 1.30 All-bituminous concrete 1.15 2.30 SC, SM, GC, and GM soils - 1.40 GW, GP, GM, and GC soils 1.00 2.00 Unbound crushed stone '' 1.00 2.00 SW, SP, SM, and SC soils - 1.50
Cement stabilized GW, GP, SW, and SPsoils 1.15 2.30 GC and GM soils 1.00 2.00
Table 1. Examples of design procedure using equivalency factors for stabilized layers.
Procedure . Conventional Design Equivalency Factors Stabilized Design
Using cement-stabilized gravelly soil for. 7.6 cm AC. 15.2 cm base, and 1.0 for base and 2.0 for sub- 7.6cm AC. 15.2 cm base, and 22.9 base and subbase 45.7 cm subbase base cm base Using cement- stabilized gravel for base 7.6 cm AC. 15.2 cm base, and 1.15 for base 7.6 cm AC. 17.8 cm base, and 50.8 only 45.7 cm subbase cm subbase Using surface mix for base and subbase 10.2 cm AC. 20.3 cm base, and 1.15 for base and 2.30 for 10.2 cm AC. 17.8 cm base, and 16.5
38.1 cm subbase subbase cm subbase Using cement- stabilized silty sand for 10.2 cm AC. 25.4 cm base, and 1.5 for subbase 10.2 cm AC. 25.4 cm base, and 34.3 subbase only 50.8 cm subbase . cm subbase
Note: 1 cm = 0.39 in
Figure 1. Design criteria for rigid pavement. 15.2
20.3
25.4
30.5 \
w \
\ 35.6 '
(6
\
40.6 'ç\\ - II, o U 45.7 -
U
\\ \\ 2 J
50.8 -- U
55.9 in U z u 61.0 I- U I-
66.0
U J
z I I
U I 71,1
76.2
81.3
Note: 1cm 0.39 in and 1 SPa 0.145 bum 2
\ \\\
LEGEND \ E = 6,894,000 kPa_
- - £ = 689,400 k Pa \
E 0 344,700 ka \

45
Some examples of use are illustrated in Table 1
Rigid Pavement Analysis
The basic analysis of the PCC-surfaced items consisted of a comparison of performance with present criteria that involved the use of the Westergaard analysis to de-termiñe the benefit derived from the stabilized layers.: [This analysis was not concerned with high-quality un-bound (nonstabilized) materials because the modulus of foundation reaction (k) is used to assess the strength of these types of materials in rigid pavement design.] This was accomplished by calculating the thickness of PCC - pavement required to support the test traffic on non-stabilized material and comparing this thickness to the actual thickness of PCC used in the test items, thereby showing that the stabilized soil layer was equivalent to a particular thickness of PCC pavement.
The design criteria were developed by using Wester-gaard and elastic layer analyses. By using the Wester-gaard analysis, the stresses at the bottoms of the slabs in the test section were computed. These stresses were then used as input to the multilayered elastic analysis, and an equivalent thickness of PCC on a nonstabilized subgrade was computed. Finally, the elastic layer pro-gram was used to extend the data to other slab thick-nesses, moduli of elasticity of the stabilized layers, and thicknesses of stabilized layers. The design criteria developed for rigid pavements are shown in Figure t
SUMMARY OF FINDINGS AND CONCLUSIONS
In the theoretical analysis of the AC-surfaced, high-
quality structural layer items, a transfer from labora-tory material characterization to field material proper-ties was not accomplished; therefore, the design procedure developed was based on a comparison of per-formance with that of conventional flexible pavements. Eerience gained during this portion of the study did show, however, the applicability of using elastic layer theory to establish correlations between computed pavement-response parameters and pavement perfor-mance.
The comparative-performance analysis of the flexible pavement items resulted in the development of equiva-lency factors that can be used to compute thickness re-quirements for pavements having high-quality layers. These equivalency factors together with existing conven-tional flexible pavement criteria constitute the design criteria for incorporation of high-quality structural layers in flexible airport pavements.
The comparative-performance analysis of the PCC-surfaced items also resulted in the development of a thickness design procedure. In this procedure, the thickness of PCC required without an underlying stabi-lized layer is reduced as the thickness and quality of the stabilized layer is increased. Construction techniques were developed for stabilized soil layers.
It is emphasized that the reductions in thickness for both flexible and rigid pavements apply only to quality stabilization that meets certain requirements for strength and durability.
Abridgment
Structural Design Procedure for Flexible Airport Pavements Walter A. Barker, U.S. Army Engineer Waterways Experiment Station, Vicksburg, Mississippi
The structural deterioration of a flexible pavement is normally associated with cracking of the bituminous sur-face course and development of ruts in the wheel paths. The design procedure presented by Barker and Brabston (1) treats these two modes of deterioration through lim-iting values of certain response parameters or through accounting for cumulative damage according to Miner's hypothesis. The required response parameters, the subgrade strain and the tensile strains in the structural layers, are computed by using a layered elastic com-puter program; thus, the procedure can handle in a ra-tional manner the possible variations in the properties of different pavement materials. The use of the cumulative-damage concept also permits including in a rational manner the variations in the bituminous-concrete properties and the subgrade strengths caused by cyclic climatic conditions.
The design system has subsystems of initial thick-ness, climate, traffic, material properties, perfor-mance, pavement response, and thickness modification. Each of the subsystems uses specific input and generates output that is used by the other subsystems. At present, the subsystems are simple, but the entire de-sign system has been developed so that all the necessary information is available for the design of three types of flexible pavement: conventional, bituminous concrete, and chemically stabilized. These represent nearly all flexible pavements being constructed at this time.
CONCLUSIONS AND RECOMMENDATIONS
The Barker and Brabston procedure demonstrates that it is possible to handle in a rational manner a number of design parameters that are not now considered in the present Corps of Engineers and Federal Aviation Ad-ministration (FAA) design procedures.
The following recommendations are offered:
Existing test data should be used for a more ex-tensive verification of the design procedure, and a sensi-tivity study should be conducted to identify the most crit-ical variables.
The design procedure should be put into use on an experimental basis. During this experimental use, em-phasis should be placed on obtaining feedback for its verification or modification.
Work should continue on the extension of the pro-cedure to more realistically consider the traffic vari-ables. The veriables thus far identified are wander, load, type and speed of aircraft, and time of operation.
The ongoing FAA state-of-the-art review should be used to begin a study of environmental effects on pave-ments. Initial efforts in this area should be toward the prediction of moisture conditions under pavement sys-tems. Other areas of effort should be cold weather cracking, the effects of temperature on the modulus of bituminous concrete, and long-term deterioration of

46
bituminous- concrete surface courses.
ACKNOWLEDGMENT
This paper is a summary of a report to the Federal Aviation Administration (1).
REFERENCE
1. W. R. Barker and W. N. Brabston. Development of
Structural Design Procedure for Flexible Airport Pavements. Federal Aviation Administration, Rept. FAA-RD-74-199, Sept. 1975; NTIS, Springfield, VA, ADA-019-205.
Pavement Design: Prestressed, Steel Fibrous, and Continuously Reinforced Concrete Frazier Parker, Jr., U.S. Army Engineer Waterways Experiment Station,
Vicksburg, Mississippi
Three Federal Aviation Administration reports on the use of pre-stressed, steel fibrous, and Continuously reinforced concrete for airport pavements are summarized. The technical literature describing the con-struction, testing, and performance of prestressed concrete was reviewed, and the design criteria that have been best validated by experimental evidence selected. A design procedure based on the selected criteria was formulated, the recommended construction procedures described, and load-deflection measurements made on an instrumented highway test road at Dulles International Airport in Virginia to further develop or verify the design criteria. Four full-scale test sections of steel fibrous concrete were constructed and tested under controlled, accelerated traf-fic conditions, two field placements of this material were planned and constructed, and the efforts of other agencies with this material were monitored. A field study of a continuously reinforced concrete pave-ment at O'Hare International Airport in Chicago was made. This study involved (a) evaluation of existing pavements and overlays, (b) synthesis of data and methods for design of these pavements, (c) formulation of design procedures and construction specifications, (d) collections of re-sponse and performance data for an actual pavement subjected to actual aircraft loadings, and finally, (e) the development of a design procedure that can be implemented now and is compatible with Federal Aviation Administration procedures for other types of pavement.
PRESTRESSED CONCRETE PAVEMENTS
Prestressing to strengthen concrete has been used widely and successfully for bridges, buildings, storage tanks, and pressure pipes for the past 25 years; however, only a modest interest and a limited investment of research funds have been directed at prestressed concrete for pavements, particularly for airports. As a result, the current state of the art in the design and construction of such pavements is not highly developed. Since the con-struction of the first prestressed concrete pavement on record on a bridge approach at Luzancy, France, in 1946, only about 100 prestressed pavement test sections and test slabs are known to have been built. These have been about evenly divided between airports and highways. The most recently constructed sections of prestressed pavement are one on an access road to Dulles Inter-national Airport in Virginia and one in Pennsylvania that were designed and constructed by the Federal Highway Administration (FHWA) and the Pennsylvania Department of Transportation respectively.
The gross masses of current and proposed commer-cial aircraft have reached such proportions and the flight operations such intensities that as much as 40.6 cm (16 in) or more of plain concrete may be required to provide an adequate pavement. In view of the increased concern for more effective use of resources, there is a basis for
renewed interest in the search for resource-saving methods of constructing pavements. The desire to thoroughly evaluate a possibly expanded role for pre-stressed pavements stems primarily from the three basic advantages such pavements offer over conventional rigid pavements.
First, it has been demonstrated, both analytically and by testing, that prestressed pavements permit a sub-stantial reduction in pavement thickness (50 percent or more), with corresponding savings in construction ma-terials and possibly in costs. Second, prestressed pave-ments can be designed with fewer joints, a characteristic that results in quieter and smoother rides and eliminates the need for costly sealing and resealing programs. Third, the smaller number of joints and the lower proba-bility of crack formation (both load and nonload associ-ated) can be projected into the likelihood of extended pavement life and reduced maintenance requirements.
There are, however, potential disadvantages associ-ated with prestressed pavements that must also be con-sidered. First, there is an increase in the complexity of construction that leads to higher costs, which offsets the savings of materials, although there are strong indi-cations that improved construction techniques, which would result from increased use of prestressed pave-ments, will help to minimize these costs. Second, the joints that are required in a prestressed pavement are expensive to construct and, due to the large horizontal movements, difficult to maintain. However, through the use of improved materials and construction techniques, more durable joint systems will probably be developed.
There are data from only a relatively few full-scale test pavements, laboratory tests on small-scale models, and observations of the performance of a limited number of operational airport pavements available for use in ex-tending and refining the design and construction pro-cedures. A review of the approaches to design used in the construction of the various prestressed pavement test sections showed that few attempts have been made to develop these designs by analytical techniques. Gen-erally, pavement thicknesses and amounts of prestress have been selected on an arbitrary basis. Most highway pavement test sections have been 15 cm (6 in) thick with only longitudinal prestressing, while airport pavements have been up to 22.8 cm (9 in) thick, with both longitudinal and transverse prestressing. Frequently, such empiri-cal designs have been subjected to static load tests after completion of construction to evaluate the load-carrying capability of the pavement. Also, frequent attempts have

47
been made to quantify such design parameters as (a) the effects of hygrothermal stresses, (b) the effects of sub-grade restraint, and (c) prestress losses associated with the stressing tendons and anchorage systems. Other than the studies conducted by the Corps of Engineers (CE), there is little evidence to indicate that the effect of frequency of load applications has been considered in design.
Purpose
The purpose of this study was to develop suitable pro- cedures based on available data for the design and con-struction of prestressed pavements at airports serving the civil aviation community.
Scope
The study included (a) review of the technical literature describing the construction, testing1 and performance of prestressed concrete pavements; (b) selection of the de-sign criteria that have been best validated by experi-mental evidence; (c) formulation of a design procedure based on the selected criteria; and (d) description of recommended construction procedures. In addition, load-deflection measurements were made on the prestressed-concrete highway test road to Dulles Inter-national Airport to further develop or verify the design criteria.
Summary of Work Accomplished
In the review of previous research, studies pertaining to both highway and airport pavements were included. How-ever, because of the differences in design requirements for highway and airport pavements, primary considera-tion was given to the research pertaining to airport pave-ments. In the mid 1950s, CE at its Ohio River Division Laboratories (ORDL) conducted a program of theoretical studies, model studies, and full-scale test sections that resulted in the design and construction of a prestressed concrete pavement for a heavy-load taxiway at Biggs Air Force Base, Texas, in 1959. This pavement has per-formed well except for some problems at the joints, which are spaced on 152-m (500-ft) centers. The design procedure developed at ORDL was selected as the basis for the design procedure developed in this study.
One component of the ORDL design procedure involved predicting load-stress relations based on small-scale tests by using the gear configurations of specific mili-tary aircraft. However, present-day commercial air-craft have gear configurations that are different from those used in developing the ORDL procedure. Thus, it was necessary to develop load-stress relations for present-day commercial aircraft. This was accom-plished by using a computer program based on a discrete-element procedure for plates and slabs. The data ob-tained from previous small-scale models were used to establish the necessary input parameters for the com-puter model. With this modification, the design pro-cedure was adapted for the standard dual and dual-tandem gear aircraft now operating at civil airports and also for the newer wide-body jet aircraft. The final Federal Aviation Administration (FAA) design procedure permits interrelating magnitude of loading, load repetitions, flexural strength, subgrade conditions, pavement thick-ness, slab dimensions, and amount of prestress; and the effects of elastic shortening, creep, shrinkage of concrete, relaxation in steel tendons, anchorage sys-tems, tendon friction, subgrade restraint, and temper-ature changes can also be included.
In an effort to further validate and refine the design
criteria, full-scale static and moving load tests were conducted on the prestressed concrete test road near Dulles airport. This highway pavement was constructed by FHWA as part of the airport road network serving the 1972 International Exposition (Transpo 72). Strain gauges and pressure cells were installed within the pavement structure during construction in two separate prestressed concrete slabs. Tests were conducted on the instru-mented slabs by using a truck to represent highway loads and a load cart equipped with one dual-tandem component of a B-747 aircraft to represent aircraft loadings. These tests consisted of measurements of stress and strain in the prestressed concrete pavement structure under var-ious loading conditions.
The load tests showed a good correlation between the measured subgrade behavior directly beneath the loads and that determined by using linear elastic layer theory. For the subgrade conditions, pavement-slab conditions, and load conditions at Dulles, this correlation indicates that the subgrade can be modeled by elastic layer theory. The load tests were deliberately held within the initial prefailure behavior of the pavements so that no cracks or failures would occur. The results of these tests showed that the initial maximum elastic deflections and stresses of the pavement slab can be closely approxi-mated by linear elastic layer theory and that the maxi-mum subgrade deflections or deformations determined by using layer theory can be used to calculate the slab bending moments and stresses by the various slab-behavior models. The results of the layer theory model can also be used with Westergaard's analysis and his correction factors based on measured deflections. Layer theory deflections could be specifically incorporated in Westergaard's subgrade reaction corrections. (This discussion applies only to the Dulles test pavements; future work should further investigate modeling the sub-grade by linear elastic layer theory.)
Construction techniques and alternatives were based on an examination of prototype test pavements and oper-ational prestressed facilities constructed in this country and abroad. Special emphasis was given to developing an expansion joint that could withstand the relatively large daily and seasonal movements of the slab ends that occur because of the increased length of prestressed slabs as compared to that of conventional slabs. After investigations of existing projects and discussions with manufacturers, several alternative types of joints and joint materials were selected for inclusion in the con-struction procedure. Other construction features as-sessed were the relative merits of prestressing with and without tendons, pretensioning versus posttensioning, types of stressing tendons and conduits, friction-reducing layers, and amounts of prestressing.
FIBROUS CONCRETE PAVEMENTS
Fibrous concrete is a composite material consisting of a concrete matrix containing a random dispersion of small fibers. Numerous types of fibrous materials have been investigated—e.g., steel, fiberglass, nylon, asbes-tos, polypropylene, and polyethylene. The introduction of fibers into the concrete matrix imparts to the concrete certain characteristics such as increased tensile strength, increased toughness, increased impact and dynamic strength, increased resistance to spalling, resistance to propagation of cracks, and the ability to sustain load and to keep cracks tightly closed after cracking.
For pavement applications, steel fibers have been used almost exclusively. Although the term fibrous con-crete generally implies the use of any of a number of fibers, in this chapter, it will be synonymous with con-

48
crete containing steel fibers. For comparable design loadings, the required thick-
ness of fibrous concrete pavement is less than that of plain or conventionally reinforced pavement. In situa-tions in which a thin pavement is necessary because of factors such as vertical grade or drainage considera-tions or in areas where there is a shortage of quality ag-gregate or other material, it may be advantageous and become economically feasible to use fibrous concrete.
Purpose
The purpose of this study was to develop a design pro-cedure for fibrous concrete airport pavements based on known properties of fibrous concrete mixtures and to provide guidance for mix proportioning and construction of such pavements.
Scope
The study included (a) construction and testing of four full-scale pavement sections under controlled, acceler-ated traffic conditions; (b) planning and construction of two field placements; and (c) monitoring efforts of other agencies. The design criteria developed and the con-struction practices recommended reflect the findings from these tests and observations.
Because only four pavement sections were tested, it was necessary to extrapolate performance from that of three slab-on-grade sections to that of all other founda-tion conditions and from that of a partial bond overlay to that of all other overlay conditions. It was also neces-sary to assume that long-term field performance would be comparable to performance under accelerated test conditions. The construction practices recommended were developed from experience gained during the con-struction of relatively small quantities of pavement.
Summary of Work Accomplished
The pavement sections constructed included the follow-ing: (a) a 15-cm slab over a 10.2-cm (4-in) sand filter on a clay subgrade; (b) a 17.8-cm (7-in) slab over a 50.8-cm (20-in) membrane-encapsulated layer of lean clay on a clay subgrade; (c) a 10.27cm slab over a 43.2-cm (17-in) cement-treated clay gravel base on a clay subgrade; and (d) a 10.2-cm partially bonded overlay of a failed 25.4-cm (10-in) plain concrete pavement. The applied traffic consisted of simulated C-5A and B-747 loadings. Figure 1 illustrates the deterioration of the 10.2-cm-thick slabs as simulated B-747 traffic was ap-plied. From the results of these tests, the design cri-teria were developed.
The field installations investigated included the fol-lowing: (a) 10.2- and 15.2-cm overlay sections con-structed on a taxiway at Tampa International Airport and (b) a 10.2-cm-thick roadway constructed at the U.S. Army Engineer Waterways Experiment Station (WES). The Tampa overlays were constructed with conventional pav-ing equipment to determine the feasibility of constructing fibrous concrete pavements with this type of equipment. Figures 2 and 3 illustrate the construction techniques used. Figure 4 illustrates the crack pattern in the base pavement and those that developed in the overlay after 6 and 28 months in service. The roadway was constructed at WES to study joint requirements for fibrous concrete pavement. A 300-rn (1000-ft) long section was con-structed without provisions for joints. Seven cracks formed in the pavement resulting in slabs 44.3, 19.1, 26.4, 46.4, 47.3, 21.2, 27.3, and 72.6 m (146, 63, 87, 153, 161, 70, 90, and 240 ft) in length. The average slab length was 38.2 m (126 ft), indicating that joints on
about 30.3-m (100-ft) spacings should be used. An effort has been made to stay abreast of work being
conducted by other agencies on material characteristics of fibrous concrete and on its use as a paving material. Most of the recent work has been on mix design and fa-tigue and durability characteristics. Other agencies have concentrated their efforts toward the use of fibrous concrete for overlays, particularly of highway pavements. In the past several years there have been a number of trial placements of thin overlays on highway pavements.
CONTINUOUSLY REINFORCED CONCRETE PAVEMENTS
Continuously reinforced concrete (CRC) pavement is de-fined as portland cement concrete pavement having longi-tudinal reinforcing steel continuous for its length and no transverse joints other than the construction joints. Transverse cracks develop in CRC, but are held tightly closed by the steel reinforcement. The resulting riding surface is generally smoother, and the problems asso-ciated with sealing and maintenance of transverse joints are eliminated. Thus, it may be advantageous and eco-nomical to use CRC for airport pavements.
CRC pavements and overlays have been used on high-ways for a number of years. They have also been used at a few airports. The most extensive use of CRC has been at O'Hare International and Midway airports in Chicago, illinois, and at U.S. Air Force Plant 42, Palmdale, California. For highway pavements, the var-ious state highway departments have developed design and construction procedures tailored to their particular conditions. These procedures have been used exten-sively in the development of the design and construction procedures for airport pavements.
Purpose
The purpose of this study was to develop design pro-cedures for CRC airport pavements and overlays. The procedures include methods for selecting slab thickness, for designing the reinforcing steel, and for controlling slab end movements. In addition, guidance for the con-struction of CRC pavements and overlays was to be provided.
Scope
This study was accomplished both in-house by WES per-sonnel and through a joint U.S. Air Force-WES contract with a private engineering firm. The city of Chicago, through its Bureau of Engineering, provided support for a field study at O'Hare International Airport. The study involved (a) evaluation of existing CRC airport pavements and overlays; (b) synthesis of data and methods for de-sign of CRC pavements and overlays; (c) formulation of design procedures and construction specifications for CRC airport pavements and overlays based on the evalu-ations of the existing pavements and existing design methodology; (d) collection of response and performance data for a CRC pavement subjected to actual aircraft loadings and environmental conditions; and (e) from the results of the entire study, development of a design pro-cedure for CRC pavements and overlays that can be im-plemented now and is compatible with FAA procedures for other types of pavement.
Summary of Work Accomplished
The evaluation of existing CRC airport pavements and overlays involved data collection at the following loca-tions:

49
U.S. Air Force Plant 42, Palmdale, California; O'Hare International Airport, Chicago; Midway Airport, Chicago; and Byrd International Airport, Richmond.
The data collected at all four locations consisted of dy-namic load versus deflection response measurements, characterization of the materials composing the pave-ments, and pavement conditions. An example of the load-deflection data collected is illustrated in Figure 5,
Figure 1. Condition of 10.2-cm (4-in) thick fibrous concrete slab on 43.2-cm (17-in) thick cement-treated base (a) before traffic, (b) after 1000 coverages of simulated B-747 traffic, and (c) after 3000 coverages of simulated 8-747 traffic.
(a)
•/ : .\
which shows the deflection obtained along runway 9R-27L at O'Hare by using a Dynaflect vibrator and the WES 71,4-kN (16 000-lbf) vibrator. The material characteri-zation portion of the study involved the collection of sam-pies of the pavement material (disturbed and undisturbed), and laboratory testing to determine their strength and load-deflection properties. Data from the condition sur-veys included crack spacings, crack widths, percentage and condition of spalled cracks, longitudinal cracking, and joint condition.
The data from the study of existing CRC airport pave-ments and overlays were combined with data and design methods from other sources, and tentative design pro-cedures were formulated. In addition, specifications for construction of these pavements were proposed.
The proposed design procedures consider stochastic variations in material properties and load location. The variability of material properties is translated into a reliability that can be attached to the resulting pavement. The variability in the loading is directly included by as-suming that the loads will be normally distributed trans-versely across the pavement so that the number of loads applied to any transverse pavement segment can be de-termined. The proposed design procedure considers the total mixture of aircraft operating on the facility by the determination of the pavement damage caused by each different type of aircraft, or conversely by the deter-mination of the thickness required by each different type of aircraft. The effects of each aircraft and the vari-ability of their locations are then combined and added
Figure 2. Introduction of fibers during batching of materials for fibrous concrete.
Figure 3. Placement of fibrous concrete with slip-form paving equipment.
-F - •---• - - •- - -• - • -
\ :

rx
to determine a total thickness requirement that varies trai-isversely across the pavement.
There are separate procedures for the design of over-lays and of slabs on grade. The elastic layered model is used as the response model for the development of the overlay design procedure, while a slab on a denseliquid
foundation is used as the basic response model for the pavement design proáedure. The use of different re-sponse models requires different procedures for defining the input for characterizing the response of the under-lying material. For overlay design, the material in each layer is characterized by two constants (the modulus of
— - ---- --Y__ —
I
re ,- -- '--
' -- —4--
._t__ ..-
STA lO2, 00
a. JOIN1 AND CRACK PATTERN IN BASE PAVEMENT
Figure 4. Joint and crack patterns in base pavement and overlays at Tampa International Airport.
- - CRACKING AND SPALLSNG ALONG EDGE
STA 9I,50 S1A95,00 lIN. OVERLAY
ST k I00 .75 STA IO2.W
6-IN. OVERLAY
b. CRACK PATTERN IN OVERIAYS-6 MONTHS
STA 9I,5O STA 9S.00
.IN OVERLAY
I I I I I ,1
I --I
I I I I 4---:
/ ±rt CIA I00.25 STA 10200
6.IN.OVERLAY
C. CRACK PATTERN IN OVERLAYS-28 MONTHS
Figure 5. Measured dynamic deflections along runway 9R-27L at O'Hare International Airport.
0.2
0.20
Deflection measured at sensor 1 with dynaflect [4.45 kN (1000 lbf) load]
O Deflection measured at sensor 1 (divided by 10) with WES vibrator [44.5 kN (10 000 lbf( load)
0.15 E E
S 0
0.10
/ /
/ /
/ /
0.05
01 30+00
40+00 50+00 60+00 70+00 80+00 90+00 100+00 110+00 Station Along Runway

Figure 6. Comparison of predicted and observed deflections for B-727 load.
E 0 C 0
C
0
0.30
Longitudinal a
- Predicted a
Observed
0.45" Adjacent to crack
o Between crack
51
2 0
Offset Distance From Gauge (m)
Figure 7. Design procedure for1 SITE INVESTIGATION
continuously reinforced I . SOIL SAMPLING concrete pavement.
f 2. LABORATORY TESTING ON SOILS
SOIL CLASSIFICATION PLATE LOAD TESTS
COMPOSITE SUPPORT DESIGN
TREATED SUBGRADE CONSIDERATION k-VALUE ON NATURAL SUGGRADE SUBBASE DESIGN SELECTION OF COMPOSITE DESIGN k-VALUE
THICKNESS DESIGN ANALYSIS
AIRCRAFT TRAFFIC CONSIDERATIONS PREDICTION OF ALLOWABLE STRESSES THICKNESS DESIGN CURVES
[PECIAL PROVISIONS
I. TERMINAL TREATMENT DESIGN REINFORCEMENT DESIGN CONSTRUCTION JOINTS
FINAL DESIGN I PLANS, SPECS, ESTIMATES
[QNTRACT I I CONSTRUCTION I
elasticity and Poisson's ratio). For pavement design, the response of all layers below the slab is defined by one constant referred to as the composite foundation modulus or k-value. The procedures for characterizing the load-deflection response and the strength of the port-land cement concrete are the same, as are the other procedures for the determination of the required overlay slab thickness.
The design of the steel reinforcement is accomplished by procedures relatively well established and widely used, and recommendations concerning jointing and ter-minal treatment system designs are provided.
Gauges—Bison coils for measuring the strain in the various layers and linear variable differential trans-formers (LVDTs)for measuring the total deflection of
the pavement when loaded—were installed at four loca-tions on runway 4R-22L at O'Hare International Airport to determine the load-deflection responses of the pave-ment. Also, thermistors were installed to measure slab temperatures, and reference plugs were installed for use with a Whitmore strain gauge for measuring the opening and closing of transverse cracks with temperature changes.
The initial load-deflection response measurements were made in June 1973. The pavement deflection was measured with the loads [a B-727-100 aircraft and a 556-kN (125 000-lbf) aircraft tug] located at various po-sitions with respect to the gauge. The magnitudes of the deflections thus obtained were compatible with those of the deflections obtained previously when the pavement was loaded with the Dynaflect and the WES 71.4-kN (16 000 lbf) vibrator. Strain measurements within the individual layers (Bison coils) could not be obtained be-cause the masses of the tug and the B-727-100 aircraft were insufficient to cause measurable strains in the var-ious layers. Collection of traffic data, environmental data, and temperature- crack width data was initiated at this time by the Chicago Bureau of Engineering.
Additional load-deflection response measurements were made in May 1975. These included pavement de-flections measured with the LVDT gauges with a plate load device that simulated the load of a B-727 aircraft and dynamic load-deflection measurements made with the WES 71.4-kN vibrator. Material sampling was ac-complished at the sites where the LVDT gauges were lo-cated and pavement condition surveys made.
An analysis of all the data collected, both from the evaluation of existing CRC pavements and from the load-deflection tests on runway 4R-22L, was accom-plished by the private engineering firm. The analy-ses included a comparison of the measured load-deflection response with the predicted response (Figure 6), a de-termination of the relation between crack spacing and crack width, and an evaluation of the performance of the pavement. The performance analysis was limited be-cause, since construction of the pavements in 1971, they have experienced low use and showed no signs of struc-tural deterioration.
The results of the entire study were drawn together, and a design procedure for CRC airport pavements and overlays that can be implemented was developed. This procedure is compatible with the procedures currently used for the design of plain and reinforced jointed pave-ments. Guidance for handling construction problems that are unique to CRC pavements was formulated.
52
Modifications to the first procedures developed were made as indicated appropriate by the O'Hare study and as needed to preclude requirements for estimating traffic, characterizing materials, and computing thickness re-quirements that are different from those used for other types of pavement. The procedure, as illustrated by the flow chart in Figure 7, includes recommended methods for selecting design parameters (traffic estimates and material characteristics), determining slab thickness, and determining amount and size of reinforcing steel, de-tails for terminal treatment systems, and details for re-quired construction joints.
As shown in Figure 7, the site investigation is identi-fied with those used for other types of pavement. The procedure for selection of a composite support value provides a method for evaluating the increase in support provided by subbase and treated subgrade layers. The methods for considering traffic are compatible with FAA procedures for selecting the critical design aircraft and relating all other traffic to equivalent traffic with the critical aircraft. The methods for selecting the design thickness have the same basis as current methods, but the charts and nomographs are of different format than the design charts used for plain and reinforced jointed pavement. However, they are rather simple and straight-forward and should present no problems in use. And this format may offer the designer more flexibility to consider variations in the design parameters. The pro-visions for design of end-anchorage systems, reinforc-ing steel and construction joints, and construction guid-ance include recommended details that are unique for CRC (e.g., details for laps at splices in reinforcing bars, details for transverse construction joints, steel place-ment, and end anchorage systems). Procedures are provided for determination of the amount of both longi-tudinal and transverse steel.
CONCLUSIONS AND RECOMMENDATIONS
Prestressed concrete pavements can be designed for airport pavements with a reasonable degree of accuracy with respect to load-carrying capability and number of load repetitions that can be sustained.
Construction of airport pavements with prestressed concrete rather than with conventional concrete will re-sult in a saving of concrete because of the smaller thick-nesses required. Also, the long prestressed slabs will have fewer joints to be maintained and provide a smoother operating surface.
The design criteria and construction procedures are conservative in some areas because of the uncertain state of the art in these areas. All recommendations are subject to refinement after further study.
The following experimental work is recommended to refine the design procedure for prestressed concrete and improve its reliability:
The relation between the ratio of the loaded area to the pavement radius of relative stiffness and the per-cent single-wheel failure load (the ratio, expressed as a percentage, of the load on a single tire to the load on a multiple-wheel gear that would cause cracking in the prestressed pavement) plays an important role in the selection of prestress level and pavement thickness and should be verified before widespread use of the criteria is made. This verification should be by model tests using procedures similar to those used in the earlier tests by ORDL.
Sections of instrumented, prestressed pavement should be constructed for a range of types of foundations and tested to verify the design criteria presented and to modify them as necessary.
Fibrous concrete pavements and overlays will per-form better than plain concrete pavements of comparable thickness and strength. This means that, for compar-able design conditions, the required thickness of fibrous concrete would be less than that of plain concrete. The reduced thickness requirements for fibrous concrete will result in increased vertical deflection of the pavement and increased induced stresses in the underlying ma-terial. Provisions are made in the design procedure to limit the deflection of the pavement to minimize this effect.
Fibrous concrete can be produced and placed with conventional batching, mixing, and paving equipment and techniques. Bulk handling of fibers and a mechanical sys-tem for introducing the fibers during batching operations will be required to produce fibrous concrete in sufficient quantities for large airport paving jobs.
To improve the reliability of the proposed design criteria and construction techniques for fibrous con-crete pavements, the following areas should receive further study:
Additional performance data, in particular for overlays of flexible pavement and unbonded and par-tially bonded overlays, are needed. Additional obser-vations of pavement performance and deflection are needed to improve the correlation between the two.
Long-term observations of fibrous concrete pave-ments under in-service conditions are needed to assess the effects of environmental factors on the performance of these pavements.
Mix design studies are needed to establish more specific guidelines for selecting a workable mixture that will produce the desired properties in the hardened concrete.
CRC offers the designer an additional alternative to consider when designing a pavement system. The pro-cedures presented, although based on limited experience with CRC airport pavements, provide a way to design and construct CRC airport pavements and overlays that will be adequate to prevent load-induced cracking during the pavement design life. This is the type of distress that is most detrimental to the structural performance of the pavement. The procedures, however, do not con-sider nor make allowances for load-induced spalling or distress due to environmental factors or construction conditions. These types of distress are usually not catastrophic, in the sense that the pavement becomes structurally unsound, but they may require mainte-nance and minor rehabilitation to maintain its function adequacy.
The use of CRC should not be postponed until all the answers are available, because many of the problems can only be solved through experience. The following area are recommended for further study to improve the reliability of the design of CRC pavements and over-lays:
Additional data for improving the performance criteria should be collected.
Failure modes (in addition to cracking of the slab) should be identified and described, and the feasibility of developing design criteria to account for these failure modes should be determined.
The effects of environmental factors (temperature and moisture regimes) and construction conditions on the performance should be identified and quantified.
ACKNOWLEDGMENT
This paper summarizes material presented in a series

53
of FAA reports on airport pavements (1, 2, 3, 4, 5, 6)
REFERENCES
E. C. Odem and R. H. Ledbetter. Prestressed Concrete Pavements: Dulles Road Instrumentation and Load Tests. Federal Aviation Administration, Rept. FAA-RD-74-34, Vol. 1, Oct. 1974; NTIS, Springfield, VA, ADA-000-456.
C. Odem and P. F. Canton. Prestressed Con-crete Pavements: Design and Construction Pro-cedures for Civil Airports. Federal Aviation Ad-ministration, Rept. FAA-RD-74-34, Vol. 2, Nov. 1974; NTIS, Springfield, VA, ADA-003-477.
Parker, Jr. Construction of Fibrous Concrete Overlay Test Slabs, Tampa International Airport, Florida. Federal Aviation Administration, Rept. FAA-RD-72-119, Oct. 1972; NTIS, Springfield, VA, AD-760-638.
F. Parker, Jr. Steel Fibrous Concrete for Airport. Pavement Applications. Federal Aviation Admin-istration, Rept. FAA-RD-74-31, Nov. 1974; NTIS, Springfield, VA, ADA-003-123. H. J. Treybig, B. F. McCullough, and W. R. Hudson. Continuously Reinforced Concrete Airfield Pavement: Tests on Existing Pavement and Synthe-sis of Design Manuals, Design Manual for Continu-ously Reinforced Concrete Overlay Pavements, De-sign Manual for Continuously Reinforced Concrete Pavements, and Guide Specification.. Federal Avia-tion Administration, Rept. FAA-RD-73-33, Vols. 1, 2, 3, and 4, May 1974; NTIS, Springfield, VA, AD-780-511, AD-779-953, AD-780-512, and AD-780-513. G. G. Harvey. Design and Construction of Continu-ously Reinforced Airport Pavements. Federal Avia-tion Administration, Rept. FAA-RD-74-37, Aug. 1977.
Design of Civil Airfield Pavements for Seasonal Frost and Permafrost Conditions Thaddeus C. Johnson, U.S. Army Engineer Cold Regions Research and Engineering
Laboratory, Hanover, New Hampshire
The principal adverse effects of frost action on pavements are roughness and cracking, which are caused by the upheaval of the pavement during freezing and the weakening of the subgrade and base course and loss of supporting capacity during thaw. Design procedures for pavement sec-tion thicknesses to minimize these effects in both flexible and rigid pave-ments in areas of seasonal frost and permafrost conditions have been de-veloped for the Federal Aviation Administration. The design charts are based on a classification of frost-susceptible soils and the depths to which freezing and thawing will occur for the specific location. Design proce-dures for pavements incorporating extruded polystyrene insulation have also been developed.
In the United States, only the more southerly states have climatic conditions that provide relative freedom from effects of seasonal frost action. Yet the current Federal Aviation Administration (FAA) criteria for airport pave-ment design do not account adequately for the detrimen-tal effects of frost action on pavements. These criteria do not provide design alternatives based on degree of roughness, proposed use, or funding available, and they often result in unsatisfactory performance or excessive life-cycle cost of pavements. In addition, these criteria do not recognize parameters known to affect the depth of frost penetration, which has a major influence on the severity of some of the detrimental effects of seasonal frost conditions.
Permafrost is widespread in Alaska and affects pave-ment design in most of that state, but the current FAA standards provide no criteria or guidance applicable to the design and construction of pavements in areas of permafrost. This is a subject for which existing tech-nology needs further 'development; however, available information could be adapted for incorporation into FAA design criteria.
Recognizing the need for updating their criteria, the FAA requested that a study be carried, out that would draw on existing technology and provide the needed ad-aptation of currently available guidelines and design.pro-cedures for application to airports that serve civil air-craft. The primary objects of the study, the results of
which are summarized here, were to
Delineate the frost susceptibility of the various FAA soil groups;
Provide a methodology for the determination of frost-penetration depths;
Develop methods of engineering design based on various levels of frost protection;
Prepare design curves for flexible and rigid pave-ments for various levels of frost protection;
Provide guidance on construction control, new ma-terials, and construction techniques to reduce the detri-mental effects of frost on pavement performance;
Present appropriate testing procedures necessary for the use of the design methods; and
Provide methods for engineering design of pave-ments in permafrost areas.
EFFECTS OF FROST ACTION ON PAVEMENTS
The principal adverse effects of frost action are rough-ness and cracking, caused by the upheaval of the pave-ment surface during freezing and by the weakening of the subgrade and base course and loss of supporting capacity during thaw. Frost heave, the raising of the pavement in winter, is caused by the freezing of the soil moisture. In its most damaging form, it is associated with ice seg-regation, the formation of lenses of ice in the subgrade or base course or both. Frost heave may not be detri-mental if adjacent areas of a pavement are heaved by equal amounts, but nonuniform heave can result in ex-tremely severe roughness and in the cracking of both flexible and rigid pavements. Small structures inserted in paved areas, such as fueling hydrants and light bases, may be progressively heaved to levels significantly above the surrounding pavement. The degree of uniformity of pavement heave is enhanced by horizontally uniform soil characteristics and moisture conditions, uniform surface eqosure to sun and wind, and uniformity of pavement

54
color and of the thickness and types of materials in ad-jacent pavement cross sections. Thaw weakening, which causes a loss in pavement supporting capacity, is ex-perienced when frozen soil containing a significant amount of ice thaws. The extreme acceleration in the rate of pavement damnge under traffic during the spring is shown in Figure 1 (1) by the deterioration in the ser-viceability of the flexible pavements in the AASHO Road Test. Pavement roughness and cracking can be caused by severe nonuniform frost heave or by inability of the pavement to support traffic during the thawing season. Cracking of asphalt pavements can also be caused by thermal contraction. As the temperature decreases to low levels, the pavement is partially restrained by fric-tion at the contact with the base course; consequently, the asphalt mixture, embrittled by the low temperature, fails in tension.
SOIL CLASSIFICATION FOR PAVEMENT DESIGN IN FROST AREAS
Because the method of design for pavements recom-mended here is based on the method used in frost areas by the U.S. Army Corps of Engineers, the classification of frost-susceptible soils on which the Corps' design method is based should be adapted to the FAA soil clas-sification system also. However, no problems are fore-seen in the use of the frost design soil classification (Table 1) with the FAA system of classifying soils; both rely on grain-size distribution and Atterberg limits for the division of soils into the four frost groups, FG1 through FG4, by which the soils are ranked approxi-mately in order of increasing severity of frost effects.
DEPTH OF FREEZING AND THAWING
While the depth to which a pavement section will freeze, or (in permafrost areas) to which thawing will take place, can be calculated by several methods, it is recommended that the FAA use the modified Berggren equations (2), which can be expressed as
X=X(173 000knF/L) (1)
or
X=A(173 000knI/L) (2)
where
X = depth of freeze or thaw (m), k = thermal conductivity of soil (W/mK), L = volumetric latent heat of fusion (J/m3), n = conversion factor for air index to surface index
(dimensionless), F = air-freezing index [degree-days (C)], I = air-thawing index [degree-days (C)], and X = coefficient that takes into consideration the effect
of temperature changes in the soil mass.
The use of Equations 1 and 2 requires the calculation of the design air-freezing and thawing indexes respectively, the cumulative number of degree-days below (or above) freezing for one season. The solution of Equation 1 is shown in Figure 2 (3), which gives the depth of freezing of pavement and granular base as a function of the freez-ing index and the moisture content and dry unit weight of the base.
THICKNESS OF PAVEMENT SECTION: SEASONAL FROST AREAS
In seasonal frost areas, the design process seeks to de-termine the minimum combined thickness of pavement surfacing material, freeze -thaw -durable stabilized base, and clean granular non-frost-susceptible base that will adequately control heave-related surface roughness and prevent premature pavement failure caused by thaw weakening of the subgrade. Two approaches are avail-able to meet this object. The principle of the first is to limit the advance of the freezing front into the frost-susceptible subgrade to a small amount and thereby re-strict differential pavement heave to small acceptable values. By experience, it has been found that this ob-ject will be achieved if the depth of subgrade freezing does not exceed about one-fourth the base thickness. The design thickness of base needed to thus limit subgrade freezing is shown in Figure 3 (3) and can be calculated as follows:
ca - p (3)
where
a = combined thickness of pavement and non-frost-susceptible base for zero frost penetration into subgrade and
p = pavement thickness, and
r = W,/Wb (4)
where
W, = water content of base and Wb = water content of subgrade
and r 15 3. For example, if c = 160 cm (5.2 ft) and r = 2.0, then the design base thickness (b) = 106 cm (3.51 ft) and s = 26 cm (10 in). Experience has shown that this thickness of base will also adequately control subgrade thaw weakening, which may be neglected in the propor-tioning of pavement section elements by other design criteria.
In cold areas with high freezing indexes, the thickness required by use of Figure 3 may be impractically great, but if the subgrade soils are uniform in properties and moisture contents throughout a paved area, a second method of design may be feasible. This method relies on uniformity of soil conditions to reasonably restrict differential heave and only determines the minimum com-bined thickness of pavement and base for adequate sup-port of aircraft loads during the period when the subgrade is weakened by thawing. From traffic tests on airport pavements in the 1940s and experience with pavements since that time, equivalent-design California bearing ratio values applicable to the design of flexible pave-ments for year-round use can be inferred for subgrade soils subject to freezing and thawing. These inferred values have been used to develop design charts for vari-ous civil aircraft currently in use. Figure 4 shows typ-ical design charts, applicable to B-747 aircraft, for flexible pavement. For proportioning rigid pavements, the modulus of reaction necessary for the design equa-tion can be obtained from Figure 5 (3).
A third method of design [Figure (4)] can also be used that proportions the base to restrit freezing of the subgrade under conditions less severe than the design freezing index that is usually used for Figures 4 and 5. If more roughness can be tolerated in an occasional colder winter, this method, which provides an inter-

55
Figure 1. Typical performance data of two test sections of AASHO Road Test.
Figure'2. Depth of freezing into granular, non-frost-susceptible soil beneath pavements kept free of snow and ice.
Air Frneaing Indn,, Oegrne('C)day$
0 1000 2000 0 1000 2000 I I
y .1602 kg/n, y.l842 kq/& Do-
- 7~~ %
200
1:::
:_________________
4001
W, /100 MillionS of Applications
Nic:i.8°Fay
and 1 cm = 0.39 in.
Table 1. Soil classification for frost design.
Typical Soil Types
Frost Group Description
Percentage Finer Than 0.02 mm by Mass
Unified Soil Classification System
FG1 Gravelly soils 3 to 10 GW, GP, GW-GM, and GP-GM
FG2 Gravelly soils 10 to 20 GM, GW-GM, and GP-GM Sands 3 to 15 SW, SP, and SM
SW-SM, and SP-SM
FG3 Gravelly soils >20 GM and GC Sands, except very
fine silty sands >15 SM and SC Clays having P1 > 12 - CL and CH
FG4 All silts - ML and MH Very fine silty sands >15 SM Clays having P3<12 - CL and CL-ML Varved clays and other - CL and ML
fine-grained, banded CL, ML, and SM sediments CL, CH, and ML
CL, CH, ML, and SM
FAA Soil Classification System
E-1, E-2, E-4, and E-5
E-1, E-2, E-4, and E-5 E-1 through E-5
E-2, E-4, and E-5
E-2 through E-5 E-7, E-8, E-10, E-11, and E-12
E-6 through E-12 E-2 through E-5 E-6 and E-7 E-7 and E-6
E-?, and E-2 through E-5 E-8, E-10, E-11, E-12, and E-6
E-6, E-7, E-8, E-10, E-11, E-12, and E-2 through E-5
.10'
Figure 3. Design depth of non-frost-susceptible base for limited subgrade frost penetration.
E
c. Boa. ThIckness for Zero Frost Penetrallan Into Sabgrade (cr)
Figure 4. Reduced-subgrade-strength design charts for flexible pavements used by B-747 aircraft.
200
FG-3 - ISO
100 - FG-2
90
so -
70
60 -
Mg 2200 lb and
50 1cm0.39in.
40,
147
I I 2 3 4 5 Cr03, Aircrsft Weight (Mg)
Figure 5. Modulus of reaction for reduced-subgrade-strength design of rigid airport pavements.
so -
so-
Min
FG
rn
I I I I I I (' 20 40 60 50 100 120
Case ThickneSs (ce,)

56
Figure 6. Nomogram for determining indexes forreduced subgrade frost-protection method.
4000
3000
2000
'000
600 B
400
300
200
[150
tOO
®Select appropriate lone from map )SJuse for oil zones
Mean hi, Freezing Inde,
40 20 0 Add to Mean tnde,
Design Year (oppra.)
© I in5 © I in 10 Probability that selected mdl, iII be e,ceeded
E,pecled Life, Years
C
0
Figure 7. Depth of thaw in granular, non-f rost-susceptible soil beneath pavements.
-400
1600 2.4
'7 ]2400
4.0 26h) (7%) 1842 2600
Note: 1 rn/s 2.24 mph. lcCday 1 .8'F day, 1 kg/in3 - 0.062 lb/ft3. and 1 m 3.3 ft.
Figure 8. Total depth of frost penetration through 7.5-cm (3-in) asphalt pavement, base, insulation, and subbase,
So,Iace Erecting mdc,. Degreel'Ct days Sorfoce Freezing Indea, Degree ('Cl days 1100 , 2000 300
Insulation
::
:::
rlies
- s1842 :
Mais tsity
,reDen
\s
-
2162
a 5cm Base C. 84cm Base
1000 200.0 3000 ,
200— 5.6
5.
400
i.Jngreel Llaa 0 1000 2000 30:
Sortace Freezing rndes. Degree ('C)doys 1000 2000 3000
mediate degree of protection against differential heave, may be adopted.
THICKNESS OF PAVEMENT SECTION: PERMAFROST AREAS
In permafrost areas, the upper layers of soil thaw in summer and refreeze in winter, and hence pavements must be designed to minimize the adverse effects of both frost heave and thaw weakening. In arctic areas with low thawing indexes, the design requirements may be met by making the base thick enough to prevent seasonal thawing of the subgrade.[ Figure 7 (5)]. However, as the thawing index increases, the thickness needed becomes excessive, although synthetic insulation can be used to decrease the requirements for the granular base. If, however, subgrade thawing is expected, the minimum base thickness should be that given by design charts such as Figure 4.
The most difficult problem facing the designer is found in subarctic areas where not only is the depth of seasonal freezing very great, but the depth of thawing beneath a pavement may exceed the depth of refreezing. In this case, progressive lowering of the top of the per-mafrost may be inevitable and lead to large cumulative settlements as the high-ice-content permafrost thaws. However, degradation of the permafrost may be slowed or even prevented by the following measures: (a) use of high- moisture- retaining material such as sand in the
2.5 2.5
b. 53cm Bose d 114cm Bose
Notes: laCdOV 1 •8cp day, 1 cm -0.39 in, and 1 kg/in3 0.062 lb/ft3.
Base density -2162 kg/in3 (135 (b/It3) and moistsro content - 59L
base course, (b) painting the pavement white to control surface reflectance, or (c) use of polystyrene insulation (which cannot prevent permafrost degradation, but can beneficially retard it).
DESIGN OF PAVEMENTS INCORPORATING EXTRUDED POLYSTYRENE INSULATION
An insulated pavement system is composed of conven-tional surfacing, base, and subbase layers above an in-sulating material of suitable properties and thickness to restrict or prevent the advance of subfreezing tempera-tures into a frost-susceptible subgrade (or, in perma-

57
frost areas, to retard subgrade thawing). Unless the thickness of insulation and overlaying layers is sufficient to prevent subgrade freezing, additional layers of gran-ular materials are placed between the insulation and the subgrade to partially contain the portion of the frost zone that extends below the insulation. Considering only the thermal efficiency of the insulated pavement system, a given thickness of granular material placed below the insulating layer is much more effective than the same thickness of the material placed above the insulation. Hence, the thickness of the pavement and base above the insulation should be the minimum that meets structural requirements, and the thickness of the insulation and ad-ditional granular material should be based on the place-ment of the latter beneath the insulation.
Alternative combinations of thicknesses of insulation and underlying granular material required to completely contain the zone of freezing can be determined from Fig-ure 8, which shows the total depth of frost for various freezing indexes and thicknesses of insulation; the thick-ness of granular material needed to contain the zone of freezing is the total depth of frost less the total thickness of cover material and insulation. For pavements in sea-sonal frost areas, experience has shown, however, that limited subgrade freezing may not have detrimental consequences. Accordingly, the total depth of frost given by Figure 8 may be taken as the value a in Figure 3 and a new combined thickness of pavement, base, in-sulation, and subbase determined. The thickness of the granular material needed beneath the insulation is ob-tained by subtracting the previously established thick-nesses of upper base and insulation.
ACKNOWLEDGMENT
This paper is a summary of a report by Berg to FAA (6).
REFERENCES
L. J. Painter. Analysis of AASHO Road Test As-phalt Pavement Data by the Asphalt Institute. HRB, Highway Research Record 71, 1965, pp. 15-38. Calculation Methods for Determination of Depths of Freeze and Thaw in Soils. U.S. Department of the Army, Technical Manual TM 5-852-6, 1966, and U.S. Air Force, Manual AFM 88-19, 1966, Chap. 6. Pavement Design for Frost Conditions. U.S. De-partment of the Army, Technical Manual TM 5-818-2, 1965. P. H. Berube. Standard Deviation of Air Freezing and Air Thawing Indexes at Selected Stations in North America. U.S. Army Engineer Cold Regions Re-search and Engineering Laboratory, Hanover, NH, Technical Note, 1967. F. B. Hennion and E. F. Lobacz. Corps of Engi-neers Technology Related to Design of Pavements in Areas of Permafrost. Proc., 2nd International Con-ference on Permafrost, Yakutsk, USSR, National Academy of Sciences, 1973, pp. 658-664. R. L. Berg. Design of Civil Airfield Pavements for Seasonal Frost and Permafrost Conditions. Federal Aviation Administration, Rept. FAA-RD-7430, Oct. 1974; NTIS, Springfield, VA, ADA-284-006.
Abridgment
Design and Construction of Airport Pavements on Expansive Soils R. Gordon McKeen, Civil Engineering Research Facility, University of New Mexico, Albuquerque
The pavements of airports (e.g., runways, taxiways, ramps, parking aprons, and such) are a vital part of the overall facility, and therefore pavement construction and maintenance costs are important in the planning and operation of airports. Premature failure of these pave-ments (manifested as surface roughness) affects opera-tional limitations, accelerates aircraft fatigue, and re-duces safety; on the other hand, initial construction and material costs prohibit deliberate overdesign.
A major cause of premature pavement failure is un-derlying expansive soils that by shrinking and swelling cause surface roughness. Although current Federal Aviation Administration (FAA) design procedures (1) do not adequately treat the design of pavements over ex-pansive soils, recognition that these soils are a signifi-cant engineering problem took place many years ago, and a concentrated effort to solve this problem was be-gun in 1965.
OBJECTS AND SCOPE
This investigation reviewed the current engineering lit-erature and synthesized from it a design procedure for stabilizing expansive soils beneath airport pavements. To do this, the study was divided into specific areas:
Methods of identifying and classifying the types of soil that are considered expansive and cause early pave-ment distress;
Laboratory and field test methods to determine
the level of expansion and shrinkage, i.e., prediction of heave; and
The design of stabilized soil layers including (a) selection of the type and amount of stabilizing agent (such as lime, cement, or asphalt), (b) test methods to de-termine the physical properties of stabilized soil, (c) test methbds to determine the durability of stabilized soil, and (d) field construction criteria and procedures.
The conclusions and recommendations are based on the current literature, without laboratory verification. Soil-volume changes caused by factors such as frost heave and salt heave were not studied.
CONCLUSIONS AND RECOMMENDATIONS
Expansive Soil Design
Engineering problems associated with expansive soils are significant and warrant the implementation of special design procedures to supplement those normally used. Expansive soils may be detected by observing the per-formance of structures, but when such observations are impossible or inconclusive, other means are needed. An economical and fast test is desirable to provide an early indication that special testing and design are needed. The current identification and classification systems are based on correlations of simple index properties—the plasticity index and the linear shrinkage—with values of swell measured in the laboratory. In the initial investi-

58
gation, the soil should be rated as follows:
Soil Expansion Potential (%)
Soil Property Low Medium High
Plasticity index 10 >10, <20 >20 Linear shrinkage Q 8 >8, <12 >12
Soils in the low-expansion-potential category require no special provisions to account for swell in the design of airport pavements; soils in the high-expansion-potential category require evaluation of potential heave. The medium-expansion-potential category serves as an alert to the designer, and in this case, similar structures at least 5 years of age in the area should be evaluated. The designer must determine whether further tests to place the soil in the high- or low-expansion-potential category are justified. Soils in the high-expansion-potential cate-gory are studied by the swell test described by Holtz (2). The test samples should represent each significant soil layer being evaluated. Representative samples of com-pacted or undisturbed layers to a depth beyond which no significant change in the soil condition is anticipated are required. In thick clay soil deposits, this depth may be 15 m (50 ft) or more. The percentage of swell estimated by the test and the layer thickness of which the sample is representative are used to compute the heave. The subgrade surface heave is the sum of the heaves of all underlying soil layers.
The application of laboratory-measured swell values such as those based on consolidation tests to prediction of field rates of heave is extremely difficult. The ef-fects of layer thickness, water-table depth, initial load and suction, final load and suction, seasonal variations in the soil structure, and soil volume change behavior must be considered. There are currently no widely ac-cepted methods for applying these factors to swell data. The Holtz procedure is the best that can be implemented among those found in the literature for evaluating swell and predicting subgrade heave; however, it has limita-tions: The moisture conditions of the test are signif i-cantly different from those in situ, and no conclusions regarding the rate of swell can be made from the test results. Caution must be exercised in preserving the in situ moisture condition and structure of the undis-turbed samples. Because the test assumes that the soil under a pavement will gain moisture after construction, initial and final estimated moisture conditions should be evaluated to determine the validity of the final moisture content before using the test data for design. The de-formation and inconsistencies of the measuring apparatus and loading frame must be evaluated, and corrections must be made in the data analysis. The time required for the test is excessive (up to 6 weeks/test).
The variation in heave from one area to another is called differential heave. The differential heave of sub-grade soils is the cause of pavement failure. The nor-mal procedure for designing on expansive soils is to as-sume that the heave measured in the swell test is the differential heave, but this is an assumption, and its validity should be evaluated in each case. A study of heave values, soil variation, and drainage is needed to select a design value for differential heave.
The design differential heave must be compared to an allowable differential heave, but there is no procedure available for computing this allowable differential heave. A structural analysis of the pavement section to be built must be made. The analysis consists of placing a mound of soil equal to the height of the predicted swell and com-puting the effects—stress and strain and surface rough-ness—on the pavement section. Surface roughness is one of the first indications of differential movement in
the subgrade soil, but adequate procedures for dealing with that induced by expansive soil are not reported in the technical literature. Thus, at this time, the allow-able differential heave must be determined by struc-tural analysis techniques.
A stabilization objective is established as the differ-ence between the design heave and the allowable heave. When the design differential heave exceeds the allowable, some action must be taken to reduce it. This reduction may be accomplished in many ways, but every effort to reduce the design differential heave must be quantita-tively evaluated. Additional swell tests are required to evaluate the swell of the stabilized soil (e.g., lime treated). The addition of lime or cement admixtures to a soil reduces, but does not eliminate swell. All layers affected by treatment must be tested after treat-ment to determine the final heave for comparison with the allowable heave. A stabilization system must not only adequately reduce the heave to below the allowable, but must also meet the conventional strength and dura-bility requirements. The procedures given by FAA (3) are satisfactory for designing lime- and cement-stabilized layers. These procedures have been developed from thorough laboratory studies, and they are sound ones that can be implemented.
Research Needs
The expansive soil design method described above has specific limitations. However, the technology required to overcome these limitations is available. Research is required to transform what are now research tools into useful design tools. Simple expansive-soil tests have evolved over many years on a piecemeal basis; no com-prehensive, large-scale research effort has been di-rected toward improving the procedures for evaluating swell potential. In two programs funded by the Federal Highway Administration, various simple test procedures are being compared in an attempt to develop a procedure that will have a better correlation than 0.6 (the best avail-able today) between predicted and measured swell poten-tial. A reliable simple test is required to determine the need for detalled heave prediction.
No simple procedure to accurately predict in situ heave will be developed. The initial load and soil suction and the final load and soil suction are the critical factors that determine soil behavior (4, 5). The data needed to predict in situ soil behavior are thus the initial and final conditions and the response of the soil to the change. Structural design of pavements requires consideration of loads before and after construction; therefore, the load data are routinely available. Soil suction, however, is a relatively new concept to engineers. It is a measure of the energy balance of the soil water, and until recently, measurement of high in situ soil-water suction (i.e., low water content) was not practical. However, in the last 10 years, thermocouple psychrometers for measuring suction in the field have been developed and can be used together with conventional hydraulic tensiometers to cover the full range of soil suction encountered in natural soils. The Thornthwaite Index, an indicator of the mois-ture balance between the atmosphere and the soil, has been correlated with equilibrium soil suction (6, 7, 8). Drier soils can be tested in the laboratory under con-trolled conditions by using undisturbed samples, but the relation between moisture content and disturbance for various soils should also be determined. A test program in which currently available equipment could be used is needed to develop a procedures manual for the use of thermocouple psychrometers and hydraulic tensiometers in establishing the initial soil suction in expansive soils.
The final equilibrium soil suction under pavements has

59
been studied extensively. Recent developments with mathematical models for predicting moisture movement are promising, but cannot yet be implemented (9, 10). However, the suction at a depth below seasonal influ-ences can be measured, and the values for the remainder of the soil can be estimated (ii, 12). It is important to recognize that after the initial and final design conditions are selected, they must be maintained through proper at-tention to surface drainage, water-table fluctuations, and other sources of change.
To complete the data required for expansive soil de-sign, the response of the soil to the change from initial to final conditions must be characterized. Data for this purpose can be obtained with an oedometer that provides for independent load and soil-suction control. From the slope of the linear strain versus suction curve, compu-tations are made to predict swell. Because of its com-plexity, however, the oedometer is not an instrument that can be used for routine design testing. The correla-tion of the slope of the linear strain versus suction curve with simple soil properties promises to be a useful tech-nique, but a wide range of soils must be tested first. The design of stabilized soil layers would be facilitated by developing similar data for stabilized materials. The present methods, based on strength and durability, pro-vide nothing for the designer to use in estimating the heave reduction attained through stabilization.
The remaining weakness of the current state of the art is in establishing the allowable differential subgrade heave below a pavement; structural analysis is cumber-some for routine design work. It seems reasonable that categories for pavement sections could be established in terms of allowable heave. Recent studies of pavement-surface roughness have demonstrated the capability of present technology for describing allowable pavement roughness (13). It remains to establish the relations among pavement characteristics, subgrade properties, and roughness that would permit defining acceptable lev-els of roughness in terms of subgrade differential heave.
IMPLEMENTATION
The procedure presented here offers no marked im-provement over currently used techniques. The swell test has been used to predict heave for many years. The improvement of this procedure is dependent on further research. The method presented here for stabilization of expansive soils is derived directly from the U.S. Air Force system. Current criteria are based on strength and durability, and no provision is made to determine the swell reduction associated with the use of stabilizers.
All the tests recommended by McKeen (3) can be im-plemented. Their use, however, will not provide a marked improvement over the procedures currently used. The procedures are not new and have changed little in the last 10 years. The sequence of tests for stabilization design is new. It was recently developed for the U.S. Air Force and provides a well-based system that uses the strength and durability of the stabilized materials as the design criteria. Implementation of the recommenda-tions offers little progress in dealing with expansive
soils, but the procedure for soil stabilization is a sig-nificant improvement.
ACKNOWLEDGMENT
This paper is a summary of a report presented to FAA (3).
REFERENCES
Airport Pavement Design and Evaluation. Federal Aviation Administration, Advisory Circular AC 150/5320-6B, May 28, 1974. W. G. Holtz. Suggested Method of Test for One-Dimensional Expansion and Uplift Pressure of Clay Soils. ASTM, Special Technical PubI. 479, 5th Ed., June 1970. R. G. McKeen. Design and Construction of Airport Pavements on Expansive Soils. Federal Aviation Administration, Rept. FAA-RD- 76-66, June 1976. Pore Pressure and Suction in Soils. Proc., Con-ference of the British National Society of the Inter-national Society on Soil Mechanics and Foundation Engineering, Butterworth and Co., London, 1961. Moisture Equilibria and Moisture Changes in Soils Beneath Covered Areas; a Symposium in Print. G. D. Aitchison, Ed., Butterworth and Co., Sydney, Australia, 1965. K. Russam and J. D. Coleman. The Effect of Cli-matic Factors on Subgrade Moisture Conditions. Geotechnique, Vol. 11, No. 1, 1961, pp. 22-28. B. G. Richards. Moisture Flow and Equilibria in Unsaturated Soils for Shallow Foundations. AS TM, Special Technical Publ. 417, 1967. C. W. Thornthwaite. An Approach to a Rational Classification of Climate. Geographical Review, Vol. 38, No. 1, 1948, pp. 55-94. A. Elzeftawy and B. J. Dempsey. Unsaturated Transient and Steady-State Flow of Moisture Move-ment in Pavement Systems. TRB, Transportation Research Record 612, 1976, pp. 56-61. B. J. Dempsey and A. Elzeftawy. Mathematical Model for Predicting Moisture Movement in Pave-ment Systems. TRB, Transportation Research Record 612, 1976, pp. 48-55. T. Y. Chu, K. W. Humphries, R. L. Stewart, S. S. Guram, and S. N. Chen. Soil Moisture as a Factor in Subgrade Evaluation. Proc., ASCE, Specialty Conference on Pavement Design for Prac-ticing Engineers, Atlanta, June 1975, pp. 4-84 to 4-10 5. R. L. Lytton. Analysis for Design of Foundations on Expansive Clay. Geomechanics Journal, 1970, pp. 21-28. P. N. Sonnenburg. Analysis of Airfield Runway Roughness Criteria. Civil Engineering Research Facility, Univ. of New Mexico, Albuquerque, Rept. in preparation; U.S. Air Force Weapons Laboratory, Kirtland Air Force Base, NM, Rept. AFWL-TR-75-124, Nov. 1976; and Federal Aviation Administration, Rept. FAA-RD-75-110 (in preparation).

60
Abridgment
Soil Classification Systems Frederick Horn, Federal Aviation
Administration
Soil scientists and engineers have established several classification systems for soils and rock materials. The intended use of a classification usually determines which system is used. Various groups of scientists and engi-neers have established classification methods that are tailored to provide information consistent with the re-quirements of their particular fields of interest.
Pavement engineers are interested in in situ or re-molded strength, drainability, swell potential, pumping susceptibility, frost susceptibility, and other factors that affect the design of a pavement structure. Thus, they are interested in a soil classification system that conveys this type of information and permits individual engineers to communicate in a common language concerning soil properties. The system should also enable relatively uniform interpretations of the resulting classifications. Nevertheless, more than one soil classification system is in use, which makes communication among pavement engineers difficult.
Soil classification is such a useful tool that it has be-come routine. It permits an estimation of the expected behavior of the soil at a given location—a factor of ut-most importance in pavement design and construction.
PURPOSE AND SCOPE
The purpose of this study was to determine whether the Federal Aviation Administration (FAA) should retain its present soil classification system or change to another system.
The study consisted of
A critical review of the American Association of State Highway and Transportation Officials (AASHTO), FAA, and Unified Soil Classification (USC) systems;
A comparison of the merits of the FAA system with those of the other two systems; and
An analysis of the possible impact on the airport pavement industry of any changes in the FAA system.
SUMMARY OF WORK ACCOMPLISHED
The first phase of the study consisted of sending a ques-tionnaire to persons involved in the paving industry. However, the replies to the questionnaire were set aside during the analysis phase of the project, and the tech-nical analyses and comparisons were performed without reference to the questionnaire replies.
The second phase of the study consisted of technical analyses and comparisons that involved (a) the definition and evaluation of each of the three classification sys-tems and (b) statistical comparisons of the systems on the basis of their ability to predict the behavior of both fine- and coarse-grained soils. The accuracy with which the various soil properties are defined by the different systems was also compared statistically.
SUMMARY OF FINDINGS
For the comparisons made in this study, the major re-quirements of a soil classification system were de-fined as
1. Soil strength,
Drainability, Swell potential, Susceptibility to pumping, Frost susceptibility, and Compactibility.
For adequate classification, the system used should also satisfy the following criteria:
It should account for the macroproperties (areal) as well as the microproperties of a soil.
It should permit prediction of the probable be-havior of a soil under a variety of climatic, moisture, and loading conditions.
It should be simple enough to be used routinely, but at the same time be rational and soundly based.
It should permit the estimation of a variety of soil properties, but should not require extensive and complicated tests for the classification.
It should not define soil properties so broadly that a wide variety of values are permitted within a given classification group.
It should be capable of being well understood by engineers.
The soil properties or characteristics that are most significant in predicting the robab1e behavior of a given soil are the plasticity index (P1), liquid limit (LL), grain size, and grain-size distribution, but the moisture-density relation, grain texture, grain shape, and other related factors are also important, especially for pre-diction of strength.
Drainabiity is a direct function of the grain-size dis-tribution (particularly the amount of fines) and the plas-ticity of the fines. Prediction of swell potential is based on the value of the P1.
Soil plasticity is the major indicator of the suscepti-bility to pumping.
The percentage of fines smaller than 0.02 mm (a value obtained from the determination of the grain-size distri-bution) and the P1 are the major indicators of frost sus-ceptibility.
Soil compactibility is dependent on several factors, of which the P1 is the most significant.
CONCLUSIONS
The comparison of the three classification systems (AASHTO, FAA, and USC) and the analysis of the ques-tionnaires (almost 100 percent were returned) led to the following conclusions:
The AASHTO and USC systems use both the liquid and the plastic limits and thus are better descriptors of soil behavior than is the FAA system, which uses only the liquid limit.
The AASHTO and USC systems describe the prob-able strength of the soil more accurately than does the FAA system; the USC system is the best predictor of strength.
The USC system is the best predictor of the frost susceptibility of the soil.
The USC system permits a closer estimation of the susceptibility to pumping of soils than do the other

61
two systems; however, all three are deficient in this respect.
The USC system approaches being an adequate predictor of soil permeability whereas the other two systems are inadequate in this respect.
The AASHTO and USC systems predict the vari-ances that might be expected in a given soil deposit with greater precision than does the FAA system; the USC system is the best of the three systems in this respect.
Consultants, representatives of the materials in-dustry, and airline personnel prefer the USC system over the other two systems. FAA regional offices give almost equal preference to the FAA and USC systems.
A majority of those questioned indicate that the USC system is more satisfactory in its present form than either the AASHTO or FAA systems.
The majority of respondents feel that pavement design and evaluation should be based on soil testing rather than on soil classification.
RECOMMENDATIONS
Based on the analyses of the data, particularly the demonstrated levels of sensitivity of the three classifi-cation methods and the variability that exists in the field, it was recommended that the FAA adopt the USC system for the classification of soils.
Pavement design based on soil classification has the
disadvantages of not accounting for soil strength, com-pactibility, moisture content, and several other factors. This fact and the replies to the questionnaires lead to the recommendation that FAA develop new design procedures based on strength criteria. Classification would thus be-come a secondary, rather than a primary, factor in the design procedure.
The implementation required for adopting the USC system should present no problems to FAA. The USC system has been in widespread use by engineers since the mid-1940s. Engineering colleges with accredited courses in soil mechanics teach the method routinely. Soils and paving engineers have been using the method for more than 20 years, and there should be no diffi-culty in adapting to it. In fact, the replies to the ques-tionnaires suggest that many engineers are looking for-ward to the change, should it be made.
ACKNOWLEDGMENT
This paper is a summary of a report to FAA (1).
REFERENCE
1. E. J. Yoder. Review of Soil Classification Systems Applicable to Airport Pavement Design. Federal Aviation Administration, Rept. FAA-RD- 73-169, May 1974; NTIS, Springfield, VA, AD-783-190.

MATERIALS: MIX DESIGN, PERFORMANCE, AND QUALITY CONTROL
Abridgment
Statistical Quality Control Procedures E. R. Brown, U.S. Army Engineer Waterways Experiment
Station, Vicksburg, Mississippi
Material variability that results in quality or strength lower than that used in design—whether caused by im-proper material selection, improper handling and mix-ing, or improper construction—can nullify the advan-tages of a rigorous airport pavement design. Therefore, reasonable material specifications and quality control procedures that recognize that material variability ex-ists are essential in pavement construction to ensure that the in-place pavement will perform as intended by its design.
In general, current specifications and control pro-cedures do not realistically consider material variability. In many instances, they are unrealistic in that they do not provide the quality, strength, and uniformity re-quired by the design, and in some cases, they are not enforceable. Examples of these are specifications that. use average, minimum, or maximum values without also giving reasonable, acceptable limits based on practical experience and sound engineering judgment.
Statistics represents a tool that, when used with prac-tical experience and sound engineering judgment, can provide more reasonable and more enforceable specifi-cations for materials and construction. Statistics, properly applied, can also result in improved control of material properties and construction procedures. Statistical analyses of data can assist the engineer in making better decisions about needed changes and better assessments of the quality of the product produced. In general, statistical procedures can assist in the pro-duction of an improved final product and may provide greater confidence that the final product will or will not achieve its intended purpose.
PURPOSE
The purpose of the study was to recommend changes in materials specifications and construction control pro-cedures based on improved statistical procedures.
SCOPE
The study consisted of
The collection of material and construction con-trol test results from a number of Federal Aviation Ad-ministration (FAA) and Corps of Engineers (CE) paving projects;
The performance of a statistical analysis to de-termine the typical distributions of the various material-property and construction-control parameters;
The development of recommended standard devi-ations and maximum allowable deviations from averages for pertinent pavement material and construction pa-rameters for inclusion in applicable specifications based on the statistical analysis of available data; and
The development of a recommended quality control plan having greater emphasis on the use of statistical procedures, to ensure that specification requirements are being met.
SUMMARY OF WORK ACCOMPLISHED AND CONCLUSIONS
The results of construction-control tests were obtained from 30 airport construction projects and analyzed to de-termine the typical distributions of the data. Criteria used in selection of the project data were that the con-tractor be reputable and capable and that the completed job be considered satisfactory. For this, the recom-mendations of FAA and CE personnel associated with the construction were used. The data collected included pertinent properties of subgrade, lime-treated subgrade, subbase, base, asphalt concrete, and portland cement concrete; however, data on all of these materials were not available at every construction site. The data were analyzed to determine the average and standard devia-tions of each parameter, and these were, in turn, used to recommend allowable maximum deviations from the average for inclusion in the applicable specifications. The requirements for the recommended specifications were determined with two primary considerations: (a) that a quality pavement be constructed and (b) that the specifications be realistic.
The statistical quality control procedures were de-veloped for the various types of construction to include the most pertinent parameters pertaining to the quality of pavement.
RECOMMENDATIONS
It has been recommended that the specification require-ments and quality control procedures be implemented on a trial basis before incorporation into the standard FAA specifications and that all field control data from these trial projects be kept for future analysis. The data should be analyzed and used to evaluate the suggested specification requirements and to make changes as in-dicated.
ACKNOWLEDGMENT
This paper is a summary of a report to FAA (1).
REFERENCE
1. E. R. Brown. Statistical Quality Control Procedures for Airport Pavements. Federal Aviation Adminis-tration, Rept. FAA-RD-73-199, Oct. 1975; NTIS, Springfield, VA, ADA-017-594.
62
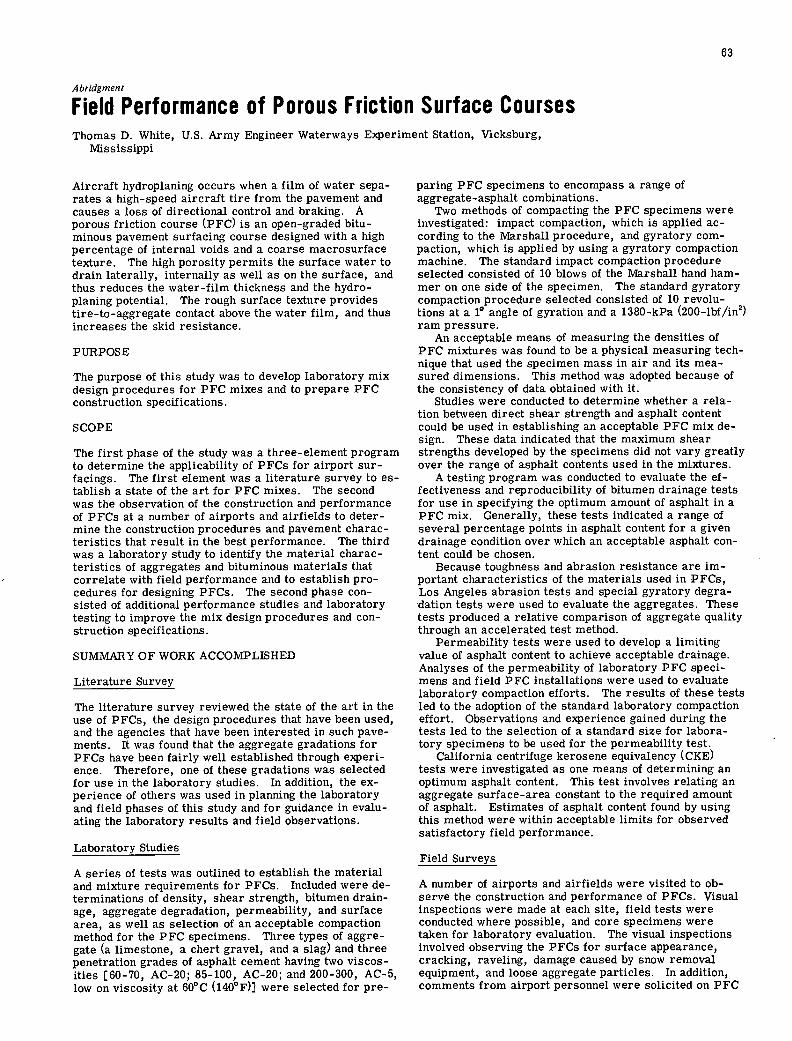
Abridgment
Field Performance of Porous Friction Surface Courses Thomas D. White, U.S. Army Engineer Waterways Experiment Station, Vicksburg,
Mississippi
63
Aircraft hydroplaning occurs when a film of water sepa-rates a high-speed aircraft tire from the pavement and causes a loss of directional control and braking. A porous friction course (PFC) is an open-graded bitu-minous pavement surfacing course designed with a high percentage of internal voids and a coarse macrosurface texture. The high porosity permits the surface water to drain laterally, internally as well as on the surface, and thus reduces the water-film thickness and the hydro-planing potential. The rough surface texture provides tire -to -aggregate contact above the water film, and thus increases the skid resistance.
PURPOSE
The purpose of this study was to develop laboratory mix design procedures for PFC mixes and to prepare PFC construction specifications.
SCOPE
The first phase of the study was a three-element program to determine the applicability of PFCs for airport sur-facings. The first element was a literature survey to es-tablish a state of the art for PFC mixes. The second was the observation of the construction and performance of PFCs at a number of airports and airfields to deter-mine the construction procedures and pavement charac-teristics that result in the best performance. The third was a laboratory study to identify the material charac-teristics of aggregates and bituminous materials that correlate with field performance and to establish pro-cedures for designing PFCs. The second phase con-sisted of additional performance studies and laboratory testing to improve the mix design procedures and con-struction specifications.
SUMMARY OF WORK ACCOMPLISHED
Literature Survey
The literature survey reviewed the state of the art in the use of PFCs, the design procedures that have been used, and the agencies that have been interested in such pave-ments. It was found that the aggregate gradations for PFCs have been fairly well established through experi-ence. Therefore, one of these gradations was selected for use in the laboratory studies. In addition, the ex-perience of others was used in planning the laboratory and field phases of this study and for guidance in evalu-ating the laboratory results and field observations.
Laboratory Studies
A series of tests was outlined to establish the material and mixture requirements for PFCs. Included were de-terminations of density, shear strength, bitumen drain-age, aggregate degradation, permeability, and surface area, as well as selection of an acceptable compaction method for the PFC specimens. Three types of aggre-gate (a limestone, a chert gravel, and a slag) and three penetration grades of asphalt cement having two viscos-ities [60-70, AC-20; 85-100, AC-20; and 200-300, AC-5, low on viscosity at 60°C (140°F)] were selected for pre-
paring PFC specimens to encompass a range of aggregate-asphalt combinations.
Two methods of compacting the PFC specimens were investigated: impact compaction, which is applied ac-cording to the Marshall procedure, and gyratory com-paction, which is applied by using a gyratory compaction machine. The standard impact compaction procedure selected consisted of 10 blows of the Marshall hand ham-mer on one side of the specimen. The standard gyratory compaction procedure selected consisted of 10 revolu-tions at a 10 angle of gyration and a 1380-kPa (200-lbf/in2) ram pressure.
An acceptable means of measuring the densities of PFC mixtures was found to be a physical measuring tech-nique that used the specimen mass in air and its mea-sured dimensions. This method was adopted because of the consistency of data obtained with it.
Studies were conducted to determine whether a rela-tion between direct shear strength and asphalt content could be used in establishing an acceptable PFC mix de-sign. These data indicated that the maximum shear strengths developed by the specimens did not vary greatly over the range of asphalt contents used in the mixtures.
A testing program was conducted to evaluate the ef-fectiveness and reproducibility of bitumen drainage tests for use in specifying the optimum amount of asphalt in a PFC mix. Generally, these tests indicated a range of several percentage points in asphalt content for a given drainage condition over which an acceptable asphalt con-tent could be chosen.
Because toughness and abrasion resistance are im-portant characteristics of the materials used in PFCs, Los Angeles abrasion tests and special gyratory degra- dation tests were used to evaluate the aggregates. These tests produced a relative comparison of aggregate quality through an accelerated test method.
Permeability tests were used to develop a limiting value of asphalt content to achieve acceptable drainage. Analyses of the permeability of laboratory PFC speci-mens and field PFC installations were used to evaluate laboratory compaction efforts. The results of these tests led to the adoption of the standard laboratory compaction effort. Observations and experience gained during the tests led to the selection of a standard size for labora-tory specimens to be used for the permeability test.
California centrifuge kerosene equivalency (CKE) tests were investigated as one means of determining an optimum asphalt content. This test involves relating an aggregate surface-area constant to the required amount of asphalt. Estimates of asphalt content found by using this method were within acceptable limits for observed satisfactory field performance.
Field Surveys
A number of airports and airfields were visited to ob-serve the construction and performance of PFCs. Visual inspections were made at each site, field tests were conducted where possible, and core specimens were taken for laboratory evaluation. The visual inspections involved observing the PFCs for surface appearance, cracking, raveling, damage caused by snow removal equipment, and loose aggregate particles. In addition, comments from airport personnel were solicited on PFC

64
performance. Permeability and skid-resistance mea-surements were made on pavements that were accessible.
From construction data collected in the field surveys, the relation between the binder temperature and the vis-cosity was identified as a primary factor in obtaining satisfactory construction and maintaining the permea-bility characteristics of PFCs. With a reasonable given volume of binder and a uniform gradation, excessive binder drainage is eliminated and adequate permeability of the PFC maintained.
Field evaluations conducted in 1973, 1974, and 1975 provided significant data by which to evaluate longer term performance of PFC. The field evaluations de-termined skid.resistance, permeability, density, voids, binder content, binder penetration, binder viscosity, ag-gregate gradation, and pavement condition at the time of the evaluation. These data were used to validate a PFC design method and recommended specifications. As a result, a PFC mixing viscosity and a modified 1.25-cm (0.5-in) maximum-size aggregate gradation were adopted.
SUMMARY OF FINDINGS AND CONCLUSIONS
PFCs should be considered for use only on structurally sound flexible pavements because cracks in base pave-ments will reflect through the PFC in a short period of time and subsequently ravel.
Although there is a tendency for the harder penetration-grade asphalt cement (i.e., the 60-70) used as a binder material to stabilize sooner than the softer penetration-grade asphalt cement (i.e., the 200-300), the harder penetration-grade asphalt cement gen-erally has lower values of wet skid resistance. An 85-100 penetration-grade asphalt cement could be used to counteract these effects. The best performances will probably be obtained from PFC mixes designed by using the same types of aggregate and asphalt as used in con-struction of the base pavement.
Neither laboratory test results nor field observations of PFC mixes showed any correlation between perfor-mance and Los Angeles abrasion values that could be used as a basis for changing the Los Angeles abrasion criteria used in the specification. The lack of differ-ences in the performance of PFC pavements that is at-tributed to aggregate quality could also be a result of using high-quality aggregate in all the PFCs studied.
A recommended gradation for PFCs is shown below (i mm = 0.039 in).
Sieve Size Percent Passing (mm) by Weight
12.5 100 9.5 80to 100 4.75 25to40 2.36 12to20 0.75 3to5 -
Based on this gradation of aggregate, the permeability of PFC mixes, and the field performances, it was de-termined that the minimum thickness of PFCs should be 19 mm (0.75 in) and the maximum should be 25.4 mm (1 in). This thickness of properly designed PFC will provide the necessary porosity, but the thickness should be kept to a minimum to reduce any tendency of the PFC to densify under traffic.
The design procedure for PFC mixes is based on meeting various material requirements of the asphalt and aggregate. The asphalt content can be estimated by using the relation 2K, + 4.0, where K. is determined from the CKE test. The temperature of mixing should be established by using a viscosity-temperature relation for the job asphalt. Validation of the mix design can in-clude the permeability test. The design procedure for PFC mixes should consist of the following:
Determine K,, and estimate the asphalt content by using the relation 2K, + 4.0.
Develop the viscosity versus temperature relation for the job asphalt for use in establishing the field mix-ing temperature and select the mixing temperature at a viscosity of 0.000 275 ± 0.000 025 m2/s (275 ± 25 centi-stokes).
If desired, conduct a laboratory permeability test to establish that the PFC mix design will have acceptable permeability.
NEEDED STUDIES
It has been proposed that a 19-mm (0.75-in) maximum-size aggregate gradation be used for PFCs. However, some problems with raveling have been observed with this gradation, and it is suggested that a more detailed study be made. Elastomeric-modified asphalt in the form of neoprene-modified asphalt has performed very well, and the use of other elastomers as asphalt modi-fiers should be studied.
ACKNOWLEDGMENT
This paper is a summary of a report to the Federal Aviation Administration (1).
REFERENCE
1. T. D. White. Field Performance of Porous Friction Surface Course. Federal Aviation Administration, Rept. FAA-RD-74-38, April 1976; NTIS, Springfield, VA, ADA-009-012.
Effectiveness, Skid Resistance, and Antihydroplaning Potential of 'Porous Friction Courses Leo F. Duggan, Airport Operators Council International, Washington, D.C.
The Airport Operators Council International survey has provided an Airport operators that have applied porous friction courses are pleased operational assessment of the effectiveness of the porous friction course with their performances, both as to friction characteristics and wearabil- as an alternative to grooving to reduce hydroplaning at airport facilities. ity. The Federal Aviation Administration has evaluated these courses for

65
airport pavements and presented data on their design, construction, and performance. This technical evaluation essentially supports the consensus of the operational survey that performance has been good. On the as-sumption that asphalt concrete grooving and porous friction courses are equally effective, airport operators are encouraged to explore the cost of each in their geographic areas to determine which is less costly. If the aggregates necessary to meet specification requirements must be hauled in, grooving may be the better choice. In the airport operators' opinion, design specifications and acceptable cleaning methods have not been fully explored. The success of porous friction courses that use larger size ag-gregates with a more open textured course suggests that design may be the key to rubber buildup. The use of a high-pressure water blast with a rotating spray bar for removing rubber deposits seems to have potential.
The Airport Operators Council International (AOCI) has
fathered data on grooved and porous -friction-course PFC) treatments of runway surfaces. The intent of the
survey was twofold:
To make available to airport authorities, engi-neering staffs, and the Federal Aviation Administration (FAA) information as to cost, life cycle, effectiveness, maintenance needs, and other issues associated with runway-surface treatment to reduce the incidence of air-craft hydroplaning and
To make available to the FAA Systems Research and Development Service the reasons why only 100 of the 5000 runways in the United States that serve air-carrier aircraft have had surface treatment.
The seeming reluctance of airport authorities to use pavement- surface techniques more widely has intrigued FAA because grooving and PFCs are eligible for federal funding, although PFCs are approved only on a case-by-case basis. Specific survey questions were therefore developed to determine whether cost was a significant factor in the decision as to whether a runway should or should not be treated.
Because hydroplaning is a phenomenon experienced worldwide, the survey was conducted of the entire AOCI membership to ensure that the data provided and the views reflected in the replies represented all geographic areas, climatic conditions, product specifications, and application techniques.
The response to the survey was excellent; the analy-sis is based on replies from 114 airports in Austria, Australia, Great Britain, Canada, France, Germany, New Zealand, and the United States.
GENERAL ANALYSIS
Cost of Application
Based on the average of cost data received, the grooving of portland cement concrete (PCC) is the most expensive technique, the grooving of asphalt is the least expensive, and the use of PFCs is intermediate.
However, cost data based on averages can be mislead-ing, and such comparisons should be used with caution. For example, in some areas of the United States, the costs of PFCs are about the same as those of grooving, but in other areas, PFCs are cheaper. Local factors such as labor and material costs vary among different geographic areas. Airport operators should explore the costs locally before making a decision as to which tech-nique to apply. This will apply more particularly to the use of a PFC versus the grooving of asphalt because the grooving of PCC is consistently more costly. At three airports, operators reported satisfaction with a PCC wire-comb application in the plastic state at minimal or no extra cost. Cost data of United States and non-United States airports were kept separate because costs were
appreciably higher at non-United States airports, except in New Zealand.
Methodology
The most commonly used groove configuration in the United States is 6 by 6 by 38 mm (0.25 by 0.25 by 1.5 in), although at many United States and most non- United States airports, a 6 by 6 by 32-mm (0.25 by 0.25 by 1.25-in) configuration is favored. Only 12 percent of the air-ports have the 6 by 6 by 50-mm (0.25 by 0.25 by 2-in) configuration, but it is significant that the 50-mm spacing reduced the cost of grooving a bit more than 9 /m2 (1 / ft2) on asphalt concrete. On PCC, the 6 by 6 by 32-mm grooving configuration costs about 50 percent more than the same configuration on asphalt concrete.
The full length of the runway is treated at all but four United States airports that have treated runways. [Some authoritiep would question this practice on asphalt con-crete because deterioration from fuel spillage and locked-wheel turns occurs most often in the first 91 m (300 ft), so that the first hundred or so meters need not be treated, but others would counter that the ad-ditional cost is minimal for an added safety feature.] At almost half of the non-United States airports, grooving does not extend full length. Cumulatively, among both United States and non-United States airports, 80 percent are treated (grooving or PFC) full length and 42 percent full width. Of those grooved runways that are not grooved full width, the majority are to within 3 m (10 ft) of the edge on each side, which provides for ease of maneuver-ing cutting equipment.
Performance
At all airports the grooves are continuing in good condi-tion and closing has occurred only in isolated areas such as turnouts. The first airport at which grooving was done was John F. Kennedy International in 1965. At the ma-jority of airports, grooving was begun in the early 1970s. Consequently, the survey results are based in large part on experience during the last 5 years.
At all airports at which PFCs have been applied, their effectiveness and durability are satisfactory although data on PFCs are not as extensive as data on grooving.
Rubber deposits and other contaminants do not build up more quickly on grooved or PFC surfaces. At the majority of airports, the runways do not have to be cleaned any more than before, and at many, less clean-ing is required. Although at some airports it is too early to tell, at most there is no expectation that groov-ing or the use of a PFC -will affect the life of the runway, nor increase its maintenance.
There has been a prevailing thought that an asphalt runway should not be grooved until it has matured about 2 years, but the responses to the survey dispute this. At many airports, grooving has been carried out within 6 months of overlay and at a few, as early as 30 d after overlay. At one airport, grooving was done within 8 d.
To the question of whether grooving or PFCs enhance the coefficient of friction of the pavement surface, the replies from a few airports indicated that this question should be asked of the pilots, but the majority were un-hesitant in stating that surface treatment increased trac-tion on wet runways and reduced or eliminated hydro-planing.
Nontreated Runways
A major interest of the survey was to learn why so few airport authorities have chosen to treat their runways.

66
Because complete replies were not received from all airports, it is not possible to give a precise figure as to the percentage of each hub classification that treats runways; however, the replies do indicate that within the United States, the busier the airport, the more likely it is that at least one runway has been treated. The replies from 41 airports gave reasons for not treating runways: 46 percent indicated that it was not needed, 30 percent believed that they did not have adequate information, and 28 percent believed that it is too expensive. The replies from non-United States airports tended not to answer this question. Thus, a rationale for not treating runways could not be developed. At several airports, runways are not now treated, but contracts are being let, or treatment is being planned.
POROUS FRICTION COURSES
The reaction of airport authorities to the use of a PFC as an alternative method of pavement-surface treatment was a significant part of the survey. This is a relatively new method for improving pavement skid resistance and, unlike grooving, data were not available to the AOCI technical staff to provide affirmative support to its ap-plication. Although FAA had developed and issued in-terim specifications for PFCs by mid-1975, funding was not available for a wide-scale research and development program. FAA was approving Airport Development Aid Program (ADAP) funding on a case-by-case basis, but airport operators who chose to apply PFCs over groov-ing were essentially embarking on their own research and development programs.
Acceptance Worldwide
FAA concern that only a small percentage of the 5000 air-carrier runways in the United States have some type of surface treatment may be valid, but such concern does not seem to be reflected worldwide. Airport op-erators in western Europe, except the British, do not seem particularly interested in pavement-surface treat-ment. The Ministry of Transport, Canada, has only two grooved runways throughout its entire airport system.
The British are the most experienced in the use of PFCs. The first was laid at a British military airfield in 1960, and since then, 20 runways at military airfields in the United Kingdom and West Germany have been re-surfaced with PFCs. There are also 12 civil runways in the United Kingdom, including Heathrow and other airports under the British Airport Authority, that have PFCs. The British have experienced no maintenance or operational problems and are so pleased with these run-ways that two previously grooved runways at Manchester and Farnborough have now been overlaid with PFCs.
Aside from their wide use in the United Kingdom and increasing use in the United States, PFCs are also being evaluated by the. Australian Department of Transport. Testing was begun in Australia because of engineering considerations and pressure from the Federation of Air Pilots. Australian airline pilots are strongly in favor of PFCs and the Department of Transport is considering their use on all major runways that present wet, slippery problems.
The first test strip was laid at Sydney in 1973, and additional strips were laid at Brisbane and Sydney in 1975. The porous surfaces have proven quite stable under Aus-tralian conditions, although slight densification has oc-curred in the wheel tracks. Some minor damage has been caused at Australian airports by aircraft turning sharply, but this problem was resolved by restricting turns of all aircraft heavier than 5682 kg (12 500 ib) to the runway ends. The original damage has not worsened, and
no specific treatments have been undertaken or are contemplated.
The densification has not noticeably affected the fric-tion and drainage capabilities of the courses. The sur-faces appear dry when wet and pilot comment has been favorable on both friction characteristics and the visi-bility improvements that a PFC offers over dense as-phalt concrete.
Tests have shown that the course provides consis-tently good friction in wet conditions. It is notable, according to the Australians, that friction is almost constant over the whole surface and that paint and rubber contamination, unless severe, have little effect on the friction.
At present, there are 27 full-length PFCs in the United States. One additional project is under grant, 8 more are in the ADAP preapplication stage, and several other locations have been proposed under the new ADAP pro-gram. The majority of these airports are concentrated in the FAA Rocky Mountain Region where 13 air-carrier airports and 1 general-aviation airport have successfully used PFCs. Costs in the Rocky Mountain Region have varied from $0.47 to $2.14/rn2 ($0.05 to $0.23/ft2), which were at one time about one-third to one-half the cost of grooving.
Specification
An FAA Advisory Circular (1) describes a PFC as a thin asphalt concrete overlay that varies in thickness from 19 to 25 mm (0.75 to 1 in) and consists of an open-graded, bituminous surface course composed of mineral aggre-gates and bituminous material. It should be constructed only on existing asphalt concrete pavements that are in excellent condition, which means they should have good, watertight surfaces and proper longitudinal and trans-verse grades. Contaminants should be removed before laying the PFC. The addition of rubber to the mix im-proves the adhesion so that a better bond is achieved. The addition of a small amount of rubber should also improve the basic asphalt properties through increased resistance to aging, increased long-term elasticity; added strength, tenacity, and toughness; low- and high-temperature stability; increased resistance to flow and runoff; and application consistency.
The P-402 porous course specification recommended by FAA has two gradations, one with a 19-mm (0.75-in) maximum size aggregate and the other with a 13-mm (0.5-in) maximum size aggregate. Experience in the FAA Rocky Mountain Region suggests that the selection of aggregate size may be of critical importance to the pavement designer, particularly as it relates to rubber buildup.
A PFC overlay is not a load-bearing course. The open-graded texture permits water to permeate the course to the runway beneath and run off. It continues to have a dry look even in a downpour.
Freeze-Thaw Cycle
The British have experienced success with open-graded courses for years. The FAA, in its initial effort to de-velop specifications for application in the United States, believed it necessary to modify the British specifications because of the extremes of hot and cold experienced in this country. This was done in collaboration with the U.S. Air Force and the U.S. Army Corps of Engineers at the Waterways Experiment Station, and interim spec-ifications were approved.
The British Civil Aviation Authority reports that their friction courses have been subjected to a large number of freeze-thaw cycles without losing their integrity. The

67
reason for this is believed to be that the voids in the course are interlinked, so that if any water is retained within the course, which ideally it should not be, it is free to expand on freezing.
The experience in the United States has been essen-tially the same as in the United Kingdom. White (2) con-cludes that no problems have developed from freezing and thawing cycles, but that a future problem may develop where heavy buildup of rubber occurs.
Some engineers believe that freeze-thaw damage can be avoided by ensuring that the open course is laid on a surface in excellent condition. The need for a good sur-face is specified by FAA. The main east-west runway at Stapleton International Airport, Denver, was not over-laid before applying the PFC, and freeze-thaw damage has occurred where reflective cracking has come through.
Tire Wear
The airlines report there is no significant increase in tire wear due to operations at airports having PFCs.
Rubber Contamination and Removal
Experience with rubber buildup and removal vary within Australia, the United Kingdom, and the United States. It is not known whether this is caused by climatic condi-tions, course design specifications, or some unknown cause.
The British have never found it necessary to remove rubber from PFCs. Although rubber deposits in the touchdown zone build up during the warm months, they largely powder away during the winter. No studies have been specifically aimed at determining whether rubber deposits clog the voids; however, no reduction in the ef-fectiveness of PFCs from this cause has been observed.
However, the Australians report that the main prob-lem with porous surfaces is the buildup of rubber in the touchdown zones, although rubber buildup is not as fast on porous surfaces as on dense bituminous concrete. They have had no success in removing rubber by chem-ical means. In the one trial carried out at Sydney, the porous surface broke down because a chemical reaction weakened the bitumen bond. Rubber removal by the use of diamond saw blades was initially successful, but the area has since been recovered with rubber and some of the advantage of the nature of the PFC texture has been lost.
There has been concern in the United States as to whether the cleaning of PFCs is a problem. Although the survey would indicate that rubber buildup on PFCs is neither more nor less than on other surfaces, and many believe that less cleaning is required, the use of PFCs in the United States has been limited, and reliable data are still not available.
A study of the main east-west runway at Stapleton Airport may offer a solution to the removal of contami-nants. In 1972, a method for prolonging the use of the runway for 3 or 4 years became necessary. A PFC was applied after a preparatory heater scarification of the
surface. Several design mixes were discussed, and a mixture of 13-mm (0.5-in) aggregate with 7 percent as-phalt concrete and 1.5 percent neoprene synthetic rubber was selected. The course performed well for 4 years without cleaning.
In early summer 1976, Stapleton Airport authorities contracted with a commercial firm to remove the rubber. This firm used a high-pressure water blast with a rotat-ing bar, a technique that has been evaluated by the Na-tional Aeronautics and Space Administration (3).
The rubber on the runway was 3 to 6 mm (0.13 to 0.25 in) thick, which necessitated the use of a biodegradable chemical to soften it. Water pressure of 48.3 to 55.2 MPa (7000 to 8000 lbf/in2) was applied. There is no evidence of harm to the runway from either the chemical or the high water pressure, and no harm was caused because the solid state of rubber protected the open course.
A second cleaning was completed in mid-October. The rotating bar was used with the water pressure reduced to 34.5 MPa (5000 lbf/in2). It is estimated that 90 percent of the rubber was removed at the edge where the buildup was light and 85 percent was removed where the -buildup was heavy. Where the bar was stationary, aggregate was removed at a pressure of 27.6 MPa (4000 lbf/in2).
In the view of the airport authorities and the contrac-tor, high-pressure water can be used successfully to clean a PFC. It appears necessary, however, to use an actuating bar, preferably a rotating bar that strikes from 3600. A stationary bar provides too much dwell time and will cause damage.
The removal of contaminants remains a problem to be further studied, but it is appropriate to consider the fol-lowing. On the basis of the rubber deposits at Salt Lake City Airport, it might have been concluded that Stapleton Airport would have been less susceptible to reverted rub-ber because it has a larger size aggregate with a more open-textured surface. However, considering the dif-ference in traffic use, it is difficult to make an absolute conclusion. Very little reverted rubber has been ob-served at Salt Lake City. Apparently, once the rubber starts to bridge across the projected aggregate particles, it flakes off rather than completing the bridge.
REFERENCES
Methods for the Design, Construction, and Mainte-nance of Skid-Resistant Airport Pavement Surfaces. Federal Aviation Administration, Advisory Circular 150/5320-12, July 30, 1975. T. D. White. Field Performance of Porous Friction Surface Course. Federal Aviation Administration, Rept. FAA-RD-74-38, April 1976; NTIS, Springfield, VA, ADA-009-012. W. B. Home and G. D. Griswold. Evaluation of High-Pres sure Water Blast With Rotating Spray Bar for Removing Paint and Rubber Deposits From Airport Runways, and Review of Runway Slipperiness Prob-lems Created by Rubber Contamination. National Aeronautics and Space Administration, Technical Memorandum, TM X72797, Nov. 1975.
Abridgment
Fibrous Concrete Construction at Reno and Las Vegas Airports Robert A. Lowe, McCarran International Airport, Las Vegas
Construction projects using fibrous concrete at Reno projects included the use of steel fibers in the mix, but International Airport, Reno, Nevada, and McCarran otherwise varied significantly in methods and size. International Airport, Las Vegas, are discussed. Both The project at Reno had an area of approximately

68
19 100 m2 (23 000 yd2) and was bonded over an existing portland cement apron. The project at McCarran had an area ofapproximately 52 000 m2 (63 000 yd2) and was laid over an existing bituminous surface course with no attempt to bond. The major portion of the Reno project was 10.2 cm (4 in) thick, and the Las Vegas project was 15.2 cm (6 in) thick.
At Reno, the concrete was formed and employed the use of transit mixers, while at Las Vegas, it was central-plant mixed, slip formed, and hauled in standard dump trucks.
The work at Reno was on the apron adjacent to the terminal building and required some stage construction to allow continued aircraft movements. The work at Las Vegas was on the transient terminal apron, which was completely closed to aircraft so that it required no stage work.
Probably the biggest problem in handling fibrous con-crete is that of introducing the fibers into the mix. It is a time-consuming process, and if it is not done prop-erly, the fibers will have a tendency to ball in the mix. The fibers used at Las Vegas were delivered in forty 7.3-kg (16-1b) boxes, and when dumped out of the boxes, were found compacted and required separation. Through experience, it has beefound that any change in direction of the fibers after separation on the shaker will create a tendency for them to ball up again.
The Las Vegas project used a single-drum central-plant mixer having a 4.6-rn3 (6-yd3) capacity, but only 2.3 m3 (3 yd3) were mixed in each batch. Mixing time
was 75 s. It was attempted to reduce the mixing time to 60 s, but the laborers were unable to handle the fibers rapidly enough. If a method could be devised that would allow more rapid introduction of the fibers, mixing times could be shortened.
One advantage of using a central plant and a slip-form paver rather than transit-mix trucks is that a bet-ter finished product is obtained because of consistency in the mix. Another advantage is that the use of a cen-tral plant and a slip-form paver appreciably redices the labor force by eliminating the forming crew laborers re-quirecl to set the forms and remove them and by approxi-mately halving the number of finishers. Also, this method allows a lower slump [5 to 6 cm (2to 2.5 in)], whicft is almost impossible to achieve from a transit mixer, that naturally upgrades the cement to water ratio.
The benefits of fibrous concrete override its prob lerns Reflective cracking is reduced appreciably in the thicker sections. The effect of adding fibers is to in-crease the flexural strength almost twofold. To meet Federal Aviation Administration criteria, the project at McCarran Airport would have required a 40.6-cm (16-in) mat of regular concrete, but with the use of fibers, a 15-cm (6-in) mat was acceptable.
However, these pavements should not be underde-signed, and the possibility of curling should be con-sidered.
The additional flexural strength should also increase the life of the pavement section.

PAVEMENT EVALUATION AND PERFORMANCE
Framework for Evaluation and Performance of Airport Pavements M. W. Witczak, University of Maryland, College Park
Some general, but fundamental, concepts relative to airport pavement evaluation and performance are discussed. Current pavement design methodologies can be grouped into structurally (load) or functionally (safety and smoothness) oriented designs, depending on the selection of the failure criteria. Most present airport pavement design methods are structurally oriented, but it has been suggested that they should be func-tionally oriented and that different sets of functional criteria should be developed and applied for each pavement area (apron, taxiway, or run-way). Pavement performance studies are commonly grouped into two major categories: structural evaluation and condition surveys. Each has a different set of desirable objects. The concept of a management type of approach to airport pavements is advocated in a systems frame. work proposed by the U.S. Army Corps of Engineers for the Federal Aviation Administration, but for this type of system or management framework to be effective, continuous feedback and verification studies of several key elements are mandatory. The key elements requiring veri-fication are those relative to (a) the as-built pavement structure, (b) the design input variables, and (c) the performance output model. The two most important areas requiring accurate data collection relate to the in situ (equilibrium) response (i.e., the.strength or modulus) of the subgrade soil and the actual aircraft traffic-mix information that is recommended to be used in a mixed traffic analysis. This information is vital if one is to be able to make reliable and meaningful decisions relative to the pave-ment management scheme. The feedback-verification part of the sys-tem is mandatory because it will provide (a) information about the exact in situ (operational) state of the pavement components, thus bridging the gap between what the designer has assumed relative to what actually exists; (b) a common procedure leading to the earliest recognition of im-pending major pavement distress; (c) a common basis for accurate deci-sions and efficient plans for corrective measures when necessary; (d) the required input for developing a major rehabilitation scheme; (e) a reliable methodology for assessing the remaining life of a pavement; and (f) an adequate and rational procedure for evaluating the load-carrying capacity of a pavement.
The general object of this report is to provide a frame-work for the evaluation and performance of airport pave-ments. To begin, several key words and concepts used in pavement technology will be defined to provide a mu-tual basis for discussion and understanding.
The pavement design procedures used today can be broadly grouped into two major categories: structural and functional. The main distinction between these cat-egories is the way in which pavement failure is defined. The structural designs pertain to a study of either a por-tion (layer or layers) or of the entire pavement. Until recently, such designs have been the primary basis for use in both rigid and flexible pavement systems. The design philosophy centers on structural considerations such as limiting stresses, strains, or deflections in one or more critical pavement layers. In addition, these de-sign systems are intimately tied together by (a) the type of theory used, (b) the specific method of material(s) characterizations, and (c) the distress or failure criteria used.
Using the current state of the art as a standard, many of the earlier pavement design procedures are empirical inthat the prediction of the relevant distress parameter (e.g., stress) is related to a somewhat arbitrary or em-
pirical state of failure. These approaches have now been upgraded, and several recent design procedures have been introduced that recognize that more than one struc-tural distress mechanism may lead to pavement failure.
Although a universally accepted design method is not currently available, several organizations have imple-mented improved design systems. These include the Shell Oil Company (1), the Kentucky Highway Depart-ment (2, 3), and the U.S. Army Corps of Engineers (4), all of iWhom have developed design methods for flexible highways, and the Asphalt Institute (5) and Shell Oil Company (6), who have developed design procedures for flexible airport pavements. In addition, a National Co-operative Highway Research Project has recently been completed that develops a completely rational design method for flexible highway pavements (7). Such de-velopments have improved the state of the art for struc-tural design of flexible pavement systems to a level of rationality approaching that of the structural design methodologies for rigid pavements that have existed for some time.
The recent advances in design methodology (i.e., theory, material characterization, and failure criteria) are frequently described in the literature as rational, improved, fundamental, or mechanistic. The ultimate object is a true mechanistic solution; i.e., the develop-ment of a precise model to explain in a physical manner how any particular pavement defect or distress is pro-duced. One final, but important, connotation of struc-tural designs is the implicit assumption of load-associated distress manifestations. Regardless of the degree of sophistication of the method, structural design is based on structural distress and hence on structural failure.
Functional, as defined by Webster, means "designed or adopted primarily to perform some operation or duty." When applied to pavements, the term implies that pave-ment engineers assess the function of the pavement it-sell in ascertaining the failure criteria to be adopted. As a broad generalization, the function of an airport pavement is to safely and smoothly transfer aircraft be-tween the terminal complex and the air by the most eco-nomical means. Thus, implicit with functional consider-ations are functional failure criteria relating to safety (e.g., skidding), smoothness (e.g., pavement roughness or unevenness), and economy.
At present, there are a wide variety of procedures used to quantify roughness as a measure of functional distress. One such approach is the use of a subjective qualitative rating by the user of the smoothness (rough-ness) of the pavement. In highway pavement analysis, such a rating is termed the serviceability and represents the ability of the pavement to serve its intended function at a specific time. Some examples are the present ser-viceability index or rating and the present performance rating, which has recently been changed to the road com-
69

70
fort index by the Roads and Transportation Association of Canada. Another common way of determining rough-ness levels is by physical measurements of the longi-tudinal roughness or profile of the pavement system by using such devices as profilometers and roadmeters. These devices measure either cumulative displacements per unit of length of pavement or some parameter re-ferring to the statistical variance-of-elevation differences of two closely spaced points. One such parameter is the slope variance, which has been found through correlation studies to be the major factor affecting the serviceability value of a pavement.
The other techniques used to measure the functional level of pavements are considered to be more rational or mechanistic in their development and applicability. One such procedure is the power spectral density analysis, which is discussed by Yang in a paper in this Special Re-port. Another promising technique is the development of a mathematical model to predict aircraft response to a specific longitudinal airfield profile. This procedure is discussed by Gerardiin a paper in this Special Report. In essence, the output of this model is the vertical ac-celeration levels at various points within a moving air-craft generated by the interaction between the vehicle and the pavement roughness. The use of acceleration as a functional criterion is promising because such a variable can be viewed relative to subjective criteria such as thresholds of passenger discomfort or readabil-ity of instrumentation in the cockpit, or it can provide a meaningful parameter for a fatigue analysis of the air-craft frame itself.
Another important difference between structural and functional considerations relates to the fact that while structural conditions imply load-induced distress mani-festations only, functional conditions encompass both load- and non-load-induced roughness (e.g., frost effects, differential settlements, high-volume-change soils, and material-variability effects). When structural designs are used, it is an a priori assumption that the non-load-associated distress mechanisms have been or will be ac-counted for in the design phase.
A functional distress or failure philosophy should be the ultimate goal for design of airport pavement systems. However, unlike highway pavements, an airport should logically possess different sets of functional criteria for each specific pavement area (e.g., runway, taxiway, and apron). In particular, a runway is a unique pavement area and differs from other pavement areas (highway and airport). On a highway pavement or an airport taxiway, the driver or pilot has a viable alternative or option to a rough pavement system, i.e., a reduction in speed. However, this option is not available for runway opera-tions because a threshold velocity must be obtained for both takeoff and landing. It is also logical to surmise that the need for skid-resistant surfaces (another func-tional parameter) is greater on a runway facility than on other airport pavement areas.
Thus, there should be a major change in the design philosophy for runways to viewing functional require-ments as more important than other types of criteria. The use of structural design methodologies have for years led engineers to the mistaken belief that the taxi-way facility is the critical area of the airport pavement. This is undoubtedly true of structural distress consider-ations due to the critical combination of static loads and slow aircraft speeds, but the same failure criteria should not be used for runways.
It should be apparent that from a structural viewpoint, the ability to accurately and mechanistically evaluate various individual distress modes is an extremely im-portant factor. However, the present evaluation lacks the true ability to transform the individual dis-
tress parameters into a functionally oriented design sys-tem. Additionally, such procedures do not directly con-sider roughness associated with nonload factors such as initial construction capabilities, frost effects, variable compaction, and high-volume-change soils. Thus, the ideal design procedure must eventually be based on func-tional failure considerations. However, the major dis-tress modes must be evaluated mechanistically, and per-formance should be monitored directly from the specific material characteristics used in the pavement system. Continued research will be necessary to develop a pro-cedure that combines both distress- and performance-oriented parameters into an integrated package based on functional criteria.
STRUCTURAL AND PERFORMANCE EVALUATION
Historically, pavement engineers have used various techniques to evaluate in situ pavements during the op-erational phase. Generally, these methods can be grouped into two basic types of procedures, each having important, but different, objects. These are (a) struc-tural evaluation and (b) performance or condition sur-veys. Evaluation, in the strict definition of the term, implies a careful appraisal or ascertaining of a specific value or values. Performance, on the other hand, im-plies fulfilling or carrying out.
Thus, the major object of a structural evaluation of an airport pavement is to obtain specific quantitative measures of relevant in situ structural properties of the system (either the entire pavement or individual layers). The variables to be measured are directly dependent on the design model being used. Typical variables that may be measured are layer thickness, strength (such as Cal-ifornia bearing ratio, k, or modulus of rupture), layer material response (elastic modulus), or perhaps some response of the total pavement system (such as surface deflection or dynamic stiffness modulus).
For airport pavements, a structural evaluation is im-portant because it provides the input necessary for the following:
Determination of the allowable load that can use a specific pavement for a predetermined life,
Estimation of the remaining life of a pavement at a given time and aircraft -traffic history,
Assessment of the strength of existing pavements when strengthening or rehabilitation programs are being considered, and
Assessment of future overlay requirements to in-crease the strength of an existing pavement.
In structural evaluation studies, it is imperative that the in situ properties of all component pavement layers be ascertained. One obvious way of obtaining this in-formation is to perform direct sampling or destructive testing of the pavement system. However, recent re-search has focused considerable attention on the use of nondestructive testing (NDT). Such methods have ob-vious potential advantages over destructive testing that include both direct (the testing itself) and indirect (user and delay) cost savings, simplicity, and speed. The in-direct advantages are particularly important because they allow more extensive test coverage of the pavement and increase the reliability of the data obtained.
At present, NDT research is focused on two major areas. They are
Evaluation of the total pavement system response to dynamic loads and
Evaluation of the elastic-layer properties

SetSory LMieIVeri,tNes Trr&n 2 Ce,SMertl U4igM SAil 3 5wAi mA.Me lIAiSe
4 TAaflie SerieSes
tRtliability (AiSITIAAS
Me — Other
AMA P.gmA.AA, I InpT
mcclificdlieff
ReSMe opersiorw
Traift MTA.Ai DAid
0 oirioS,, AlIArbç FISCAL STATUS Mo Tyson)
MACMo Re0MM
MOUIIIO&AZ
F. IS0n ie
Figure 1. Pavement system framework.
Phaw I Phase 2 PhaSe 3 Phase 4 Phase 5 Iea Melseis UriAANQ DAçMe (Deg (imgelio
FM-Cc.Ur.Ct haseS. Nsip (1 MMe -
71
C,UrooT MOMeMA ReAi SSAiA4uU
LOST ESSeU0
- RAsSAd IRLTP SIC. ASIAN SeTS
SSroroI Ro. h rneknsL
ha MWTTI0SAT A As) oUTyST
A.°
IUSUI CUSS
150, 1(RIOAAIIOT UNCTION ANSI.
CO3S0TI4IiAIS
2, lIsUliI CATs (tRAmA-JIon - ) TOAAI,USOI AT SooT MoSTele5S
hais). StrI - Slnt. Cop.Obllily SIog,sg Sirs - TIspAr000n Alfrrn, Kim— Other PdwnwnS
[R4Meo.
oiAr.SiysS No Tej
Yo dons
hrfcnnUSU,
SOS PAWSOOST
- --------- FU -------------------MP— TI r SUVEPIANT RESCARCH
Tr
1
i32E25 of the component layers.
Included in the first category are.vibratory tests that measure either the dynamic deflection basin of the pave-ment surface at a given load (i.e., constant-load devices) or variable-load vibrators that characterize the total be-havior of the pavement system. In dynamic evaluation, the plate load is proportional to the dynamic deflection. The slope of this load-pavement deflection response (i.e., the dynamic stiffness modulus) is conceptually identical to the static k term used in rigid pavement analysis (i.e., the modulus of reaction). This topic is discussed in de-tail in a paper by Hall in this Special Report.
Nondestructive evaluation techniques used to deter-mine the elastic modulus of component layers have pro-gressed on two fronts. One approach is the use of dy-namic deflections obtained from testing in combination with theoretical elastic-layer models. The method is a trial-and-error procedure that evaluates an unknown modulus of one layer (i.e., the subgrade or base) so that the predicted (theoretical) deflection matches the ob-served dynamic deflection. The other type of approach uses widely known techniques of wave propagation through an assumed elastic medium. This concept uses the math-ematical relation between wave velocity and shear (elas-tic) modulus. Both of these approaches are promising, but the important role of the known nonlinear (stress-dependent) characteristics of both fine-grained and gran-ular materials must not be neglected in the interpretation of the results obtained. Thus, even when NDT techniques become truly refined, the concurrent use of at least lim-ited destructive testing should be continued.
In contrast to structural evaluation, condition or per-
H Hi
formance surveys have as their major object the moni-toring of the state of deterioration of the pavement at a specific time. Periodic surveys provide a time history of the pavement deterioration function (i.e., the perfor-mance of the system). In condition surveys, the vari-ables measured are similarly dependent on the ultimate use and design model employed. In general, the param-eters measured reflect only surface conditions; gener-ally, no attempt is made to explain the occurrence of any deterioration.
To be effective, routine condition surveys should in-clude both structural and functional measurements. To be most effective, the survey should
Determine the presence, location, and, if pos-sible, quantitative density (occurrences per unit length or area) of all noticeable pavement defects or types of distress present—both load and nonload associated,
Measure the pavement unevenness (roughness) by either profiling or other procedures, and
Measure the skid-resistance of the pavement system.
Many pavement agencies also regularly monitor pave-ment deflections as a routine part of the conditions sur-vey, and this parameter may be very useful in assessing relative changes (i.e., determination) with time. Be-cause the runway is a unique pavement area whose per-formance history must be evaluated primarily on func-tional characteristics, the importance of items 2 and 3 above should be obvious.

iT.... ::.........
.T ...
777r—
Legend . . . . . . . . - Averàgd(Ist dfS). :
_.: Avera8é(2ed
:i..
oat of s8........................ . -
Figure 3. Resilient modulus of San Diego 100
test road. 80 60
40
20
10 .: 8
o 6
V 4
690
552 416
276
138
69.0 X
55.2 41.4
27.6°
13.8
72
AIRPORT PAVEMENT SYSTEM
To place the problem of airport pavement design and per-formance in a better overall perspective, various systems-oriented frameworks for pavements have been developed One such procedure, developed by the U.S. Army Corps of Engineers for the Federal Aviation Ad-ministration, is shown in Figure 1 (8). The detailed procedure and philosophy of this particular system will not be discussed here, but several comments regarding its application are relevant. The overall system ap-proach is divided into five phases:
Phase Description
1 Input analysis 2 Variable development 3 Design 4 Construction 5 Operation
Of especial relevance is that both evaluation and per-formance surveys are included as integral parts of the operation phase (phase 5). Also, the system provides feedback from the pavement performance phase (5) back to the design phase (3). This feedback is the most vital, but also the weakest, link in the overall pavement man-agement scheme as generally practiced today. In par-ticular, there are three important elements that are necessary for a successful systems approach. These are
Verification that the as-built pavement (phase 4) is indeed the final (optimum) pavement design shown in phase 3 (design),
Verification that the design values selected for input from phase 2 (variable development) into the de-sign methodology used in phase 3 are indeed the actual levels the pavement in the operation phase (5) is being exposed to, and
Verification that the predicted performance output (phase 3) is indeed the actual pavement performance ob-tained in the operation phase.
Unless these feedback loops become an integral part of the overall pavement design and management scheme, the operation phase will simply act completely indepen-dent of the other four phases.
Verification: As-Built Pavement Structure
It can be stated with a high degree of confidence that the first verification procedure—that the as-built pavement structure is in accordance with the final recommended design structure—is indeed the case in most civil and military construction. In fact, by far the greatest ef-fort in construction control is exerted on this facet by frequent inspection, quality control, and acceptance testing for thickness and material-quality effects of the pavement layers above the subgrades. Also, the intro-
Figure 2. Types of potential deviation of design value from actual value.
Sd
Random Variation
eesign\
\h17 evel
I time -.
Rote, UnIte o 27.6(4) a 0 (0) o 27.6(4) , 55.2(8) 4i.4(6) ..82.8(12) ..82.8(]2) 82.8(12)

Figure 4. Comparison of load equivalency methods as function of gross load percentage.
10.0
4.0
y 2a
0.1
0.0!
0.00! -
0.000! -
0.0000! -
73
Note: See Table 1 for Legend
000000! 20 30 40 50 60 70 80 90 100 110 120 130 140
X, Pe,cent g'oss load (%)
Table 1. Legend for Figure 4.
Type of Approach
Reference to Figure 4 Method Base Load
Empirical 1 California 22.2-kN single wheel equivalency 2 Kentucky 44.5-kN single axle
3 Kentucky-American Association of State Highway Officials 80.0-kN single axle 4 Kentucky (44.5-kN single axle/16) 80.0-kN single axle 5 Painter 80.0-kN single axle or 143-kN tandem axle 6 Corps of Engineers . 80.0-kN single axle or 111-kN tandem axle 7 Shook and Finn . 80.0-kN single axle or 143-kN tandem axle 8 Asphalt Institute (MS-1) 80.0-kN single axle or 143-kN tandem axle 9 American Association of State Highway Officials (p, = 2.0) 80.0-kN single axle or 143-kN tandem axle
10 American Association of State Highway Officials (p = 2.5) 80.0-kN single axle or 143-kN tandem axle Theoretical ii Deacon 80.0-kN single axle or 143-kN tandem axle
equivalency F1 limits Asphalt Institute (MS-li) 72 different aircraft having range of 286 to 3840 kN
Note: 1 kN = 225 Ibi
duction of statistically based concepts in recognizing the inevitable variability associated with construction and inherent material properties, a topic that is discussed in detail in papers in this Special Report by E. Brown, R. Brown, and Wathen, is an improvement over previ-ous control methodologies.
Verification: Design Input Variables
The design of an airport pavement structure, like that of any other pavement facility, must consider the effects of (a) subgrade soil, (b) traffic, (c) environmental con-ditions, (d) construction materials (above subgrade), and (e) economics. The evaluation of these parameters by using the concepts of the type of failure conditions se-lected constitute the design analysis. Obviously, all de-sign procedures will provide a design pavement thickness given the design input values, such as subgrade response, traffic level, or design period. Although such a process may be termed design, the success or failure of the
pavement design depends wholly on the engineering ef-fort and qualitative engineering assessment that go into the selection of the design values.
Unfortunately, although almost all current design pro-cedures treat each of the design parameters in a deter-ministic or constant sense, each input parameter has some degree of variation associated with its value. Thus, recent design improvements have begun to incorporate this variability as another input factor, which results in design procedures based on stochastic or statistical re-liability concepts.
Without question, the underlying principle for verifi-cation of the design system is that the input variables used in the design process must be those occurring in the operational phase of the pavement system although deviations between design and actual conditions will al-ways exist. These deviations may be categorized as
1. Random variations associated with construction or inherent in the materials;

74
Figure 5. Suggested performance-evaluation framework.
I I I I I I I
Layer Response)
STRUCTURAL
EVALUATION C Pavement Response
—S • S 5—
I I 1 I I I I I I I I I
AIRCRAFT Aircraft Traffic Survey
- o_o__o_o__O_O_O_O—O—O—O-- OO TRAFFIC SURVEY
Defect Survey
—A A C Skid Resistance
CONDITION
SURVEY Roughness C
—A A A
A Regular Interval
a As Necessary
I I
time -
Time-dependent deviations that may be due to aging, environmental effects, or combinations of the two;
Deviations due to load-induced responses; and Deviations or predictive errors between the as-
sumed design level and that actually occurring.
To assist in visualizing these deviations, Figure 2 il-lustrates schematically a potential variation of subgrade response (i.e., strength or modulus) as a function of time. In this example, all possible types of deviations are present, but for other variables, one or more types of deviation may not be. Of particular interest relative to design and performance is the deviation between the design value and the actual mean response at any given time. In this example, the deviation in load response may be due, for example, to differences in the stress-dependent responses. To illustrate the possible magni-tudes of some of these expected deviations, Figure 3 shows the actual variability found in resilient modulus tests of undisturbed samples of a supposedly uniform clay material under a variety of stress conditions after 7 years of traffic (13).
If a unique value of a parameter is used in the design model, conservative designs can be obtained by a judi-cious selection by the engineer who has evaluated all known considerations. However, increased accuracy, in this example, can be obtained by using predictions of the time-dependent response and stochastic concepts within the framework of a cumulative-damage analysis. Obviously, the overall verification must include (a) layer thicknesses, (b) material qualities, (c) environmental considerations, (d) subgrade conditions, and (e) traffic conditions.
As stated above, the first two are controlled in the construction procedure and hence are verified. The verification of environmental factors is developed from a study of previous climatic conditions and the knowl-
edge of their effect on performance. The subgrade var-iable can be only indirectly verified during the construc-tion process, i.e., by enforcement of the compaction specifications. However, even with compaction control, there may be potentially large differences between the actual and the design strength. The final factor, that relating to the effect of traffic, is seldom if ever veri-fied for airport pavement design. It is unfortunate that among those variables affecting design and performance, the two most critical factors (subgrade and traffic) gen-erally have the least degree of verification.
In the majority of airport pavement design methods, the effect of traffic is treated in a very cursory manner, usually by some estimate of the critical aircraft passes anticipated to use the facility. Generally, the effects of the traffic mixture are not even considered.
It is well established that pavements deteriorate pro-gressively under traffic and that each load increases the finite distress and progressive damage to the pavement system. Highway pavement design methodologies have treated the combined destructive effects of the vehicle mixture by the use of equivalent-damage factors for over 20 years, and there is no potential reason for not intro-ducing this technique of traffic analysis into airportpave-ment methodologies.
In addition to the factors considered in the analysis of highway traffic mixtures, the following input information is required for the development of a predictive airport traffic model:
The specific types of aircraft in the mixture, The anticipated traffic volume of each aircraft
within an analysis period, The actual distributions of percentages of gross
mass of given aircraft types, The lateral distances between the aircraft center-
lines and the centers of their main gears, and The specific degree of lateral wander usually as-
sociated with a specific pavement area.
The incorporation of all these considerations into a predictive traffic-mixture model is given in several de-sign procedures for full-depth asphalt pavements (17, 18, 19). These procedures are based on theoretical con-siderations of the equivalent-damage factor. Figure 4 and Table 1 (20, p. 154) show that there is good agree-ment betweeriihe theoretical concept and the empirically derived equivalency factors for loads common to both highway and airport pavements (20). The latest model, developed for the U.S. Navy, is a computerized version that gives as output the lateral distribution of equivalent F-14 aircraft strain repetitions laterally across a taxi-way or runway pavement (19). The input variables are up to 300 combinations of types of aircraft [variable load, tire pressure, spacing, aircraft-to-maln-gear center -to- center distance, and degree of wander (which is characterized by the standard deviation of the assumed wander of each specific aircraft type)].
Although there is no similar model for rigid pavement analysis, similar concepts can be applied to the develop-ment of solution techniques. The procedure is directly applicable to rigid pavements having wide slab widths or where the pavement can be analyzed without major vio-lation of the assumption of a semi-infinite continuous layer. However, for small slabs (joint spacing), where the tensile-stress magnitude is a function of the dis-tance from a joint or pavement edge, an added difficulty will arise.

75
Verification: Predicted Performance
A general schematic illustrating these concepts is Output shown in Figure 5.
The verification of the predicted performance output to the actual performance observed during the operation phase is the most difficult but most important verifica-tion step. In addition to the deviations of the as-built structure (probably minor) and of the selection of the de-sign input variables (probably major), this verification analysis results in another deviation, i.e., the error in-troduced by the performance or design model itself. Thus, this verification should concern itself not only with structural performance, but also with functional criteria. In addition, it is possible that deviations in the design input variables will cancel each other out (e.g., a conservative estimate of strength could be balanced by an unconservative estimate of traffic).
The importance of obtaining a predicted-performance history similar to that observed is that it directly affects the economics, rehabilitation planning, existing load ca-pacity, and, remaining-life considerations.
SUGGESTED FRAMEWORK
A general conceptual framework for airport pavement evaluation is presented. The evaluation procedure should include surveys of (a) structural evaluation, (b) aircraft traffic, and (c) pavement conditions.
Each of these should be done at regular (periodic) in-tervals to obtain the optimum use of the data collection system. The structural-evaluation survey should have as its ultimate object the evaluation of layer and pave-ment response (i.e., strength, modulus, and deflection). The evaluation of the layer responses could be done at longer intervals, but at least the initial evaluation should use both destructive tests and field or laboratory tests. Deflection measurements (preferably dynamic) should be obtained at the same intervals as those recommended for the traffic and condition surveys.
The aircraft-traffic surveys can be made at any con-venient time interval. Because this information is gen-erally avallable from the airport administration, the major effort of this phase is the reduction of the informa-tion to a format that will be usable by the pavement en-gineer.
The condition surveys should be conducted at frequent intervals; the object of this operation should be to obtain information about the type and severity of visual pave-ment defects, the skid resistance of the pavement (run-way), and either the profiling or measurement of the pavement roughness.
REFERENCES
Design Charts for Flexible Pavements. Shell Inter-national Petroleum Co., London, 1963. J. H. Havens, R. C. Deen, and H. F. Southgate. Pavement Design Schema. HRB, Special Report 140, 1973, pp. 130-142. R. C. Deen, H. F. Southgate, and J. H. Havens. Structural Analysis of Bituminous Concrete. HRB, Highway Research Record 407, 1972, pp. 22-35. W. N. Brabston, W. R. Barker, and C. G. Harvey. Development of a Structural Design Procedure for All-Bituminous Concrete Pavements for Military Roads. USACE-WES, Technical Rept. S-75-10, Vicksburg, IvIS, July 1975. Full-Depth Asphalt Pavements for Air Carrier Air-ports. Asphalt Institute, College Park, MD, Man-ual Series 11, Jan. 1973. J. M. Edwards and C. P. Valkering. Structural Design of Asphalt Pavements for Heavy Aircraft. Koninklijke-Shell, Amsterdam, Construction Ser-vice Publication, 1971. F. Finn, C. L. Saraf, and W. Smith. Development of Pavement Structural Subsystems. NCHRP, Project 1-10B; Final Rept., Materials Research and Development Corp., July 1976. Federal Aviation Administration: New Pavement Design and Evaluation Methodology: Engineering and Development Plan. U.S. Army Engineer Water-ways Experiment Station, Vicksburg, MS, Aug. 1975. M. P. Jones. Analysis of the Subgrade Modulus and Pavement Fatigue on the San Diego Test Road. Univ. of Maryland, MSCE thesis, 1975. M. W. Witczak. Full-Depth Asphalt Pavement for Dallas-Fort Worth Regional Airport. Asphalt In-stitute, College Park, MD, Res. Rept. 70-3, 1970. M. W. Witczak. Prediction of Equivalent Damage, Repetitions From Aircraft Traffic Mixtures for Full-Depth Asphalt Airfield Pavements. Proc., AAPT, Vol. 42, 1973, pp. 277-299. M. W. Witczak. Development of a Full-Depth De-sign Procedure for Naval Air Stations. Naval Fa-cilities Engineering Command, N00025-75-C-00022 1976. E. J. Yoder and M. W. Witczak. Principles of Pavement Design. Wiley, New York, 1975.
Aircraft Pavement Loading: Static and Dynamic R. C. O'Massey, Douglas Aircraft Company, McDonnell Douglas Corporation,
Long Beach, California
The subject of pavement loading by aircraft is treated by presenting a series of tables and figures designed to cover the essentials of pavement loading through the various phases of aircraft operation. The phases in-clude static, slow taxi, steady-state turnsat various speeds and turn radii, takeoff roll, roughness, landing impact, and braking. Figures and tables that present DC-8 responses at a number of international airports are also included.
This paper presents information of two kinds: The first is that concerning pavement loading such as is published
in National Aircraft Standard 3601 documents (1, 2, 3) and widely disseminated by all major aircraft companies, and the second is an attempt to show by selected tables and charts the answers to a wide range of questions that have been discussed over the years.
Aircraft overall performance, strength, and perfor-mance of functional components (such as landing gear, tires, and brakes) are subject to federal regulation, which leads to a natural tendency to present information by using aeronautical terminology [e.g., the airplane

76
Figure 1. DC-9 series 30: %MAC versus station relations. GEAR LOCATION IN % MAX
( 733.9 7-:5L53!) 100 52.3% MAC.
01 MAC 0 0% MAC
liii III _. TITACE OF A
TARUSI ALlOW C.G TRAVEL _j I IES'IMUIEOI
STA 650.556
STA 97.956 STA
MAC
STA 005.938
Table 1. Categorized summary of airport pavement loading.
Aircraft Operational
Item Title Phase(s)
Figure 1 4MAC versus station relations All
Figure 2 Landing-gear loading on pavement Static
Figure 3 Minimum tarn radius versus taxi speed .. Steady-state turns
Figure 4 Takeoff of DC-10-40 Takeoff roll Figure 5 Gear configurations and centers of gravity - Table 2 Maximum pavement loads Static and steady
braking Table 3 Sources of vibration All Table 4 Aircraft operational phase and accompany - . All
ing vibration sources Table 5 Pavement unevenness for design, analysis, Taxiing, takeoff
and evaluation roll, landing roll, and rollout
Figure 6 Discrete 1 - cosine bump height versus Takeoff and land- wavelength ing rolls
Figure 7 Runway roughness for aircraft design Takeoff and land- ing rolls
Figure 8 Condition at touchdown Touchdown Figure 9 Cross section of typical shock strut - Figure 10 Strut at half stroke; tire one-third de- -
flected Figure 11 Computerized landing program - Figure 12 Load versus stroke Touchdown Figure 13 Load versus time Touchdown Figure 14 Main landing-gear load Landing impact Figure 15 Acceleration power spectra: DC-10-30/40 Takeoff
Table 6 Landing-gear characteristics Static at max takeoff load
Table 7 Airport pavement requirements Static at max takeoff load
Purpose
To show envelope of aircraft center of gravity and mass (usually specified as 4MAC)
To relate 4MAC to percentage of mass to landing gear; to show Federal Aviation Administration certification center -of-gravity envelopes
To show centrifugal forces on turns and max g for passenger comfort and for landing gear and tire design limits
To show time history as nose lifts off (computer run) To locate loads given in Table 2 To show max static pavement loading at main gear, max nose gear loading
for Steady braking, and max possible main gear drag loads To present data for passenger comfort considerations To present data for passenger comfort considerations -
To present data for passenger comfort considerations
To present pavement bump criteria
To present pavement bump criteria for aircraft design
To show touchdown conditions at max design Sink speed To show mechanism of shock strut To show airplane vertical displacement as function of strut stroke and tire
deflection To present structure of computerized landing program To show load variation as a function of sink speed To show strut load as a function of time from touchdown To show that landing-impact loads rarely exceed max Static loads To show variation in acceleration power spectral density on smooth and
rough pavements To present required tire pressure, contact area, and wheel spacing of
aircraft To present required airport pavement thicknesses
center of gravity as percentage of the mean aerodynamic chord (%MAC)]. This is because the envelope of the air-craft mass and center of gravity, which concerns the al-lowable limits for aerodynamic flight control, and the aerodynamic, flight-test, and certification data (e.g., legal limits) are all in terms of %MAC. Figure 1 pre-sents the relation between %MAC and aircraft stationing, which is similar to civil engineering practice. Another aeronautical-industry communication problem, again arising from certification needs, is the wide distribution of maximum-critical cases that are necessary for air-craft safety, but obviously occur extremely rarely How-ever, for this reason, the paragraphs describing a num-ber of the figuresuse the more typical day-in-and-day-out values of parameters.
Table 1 summarizes the figures and tables to orient
the reader to the primary messages that they contain. The paper follows the organization of Table 1 with brief descriptive paragraphs as necessary to amplify the in-formation given there.
BASIC AIRCRAFT DIMENSIONS
Figure 1 givesthe information needed to relate the %MAC to the aircraft stations and dimensions (i.e., the stations corresponding to the leading edge and trailing edge and the length of the MAC [374.4 cm (147.4 in)]). The MAC length may be different for different aircraft series; e.g., that of the DC- 10-30/40 is different from that of the DC-10-10 because the former has a larger wing.

80 90
% MAC 0 5 10 IS 20 25 30
(d)-
Figure 2. Landing gear loading on pavement: (a) DC-863, (b) DC-9-51, (c) DC-10-10, and (d) DC-10-30140.
(b SMAC
77
130
AIRPLANE AIRPLANE
Note: Unshaded areas represent op erational limits. GROSS WEIGHT
GROSS WEIGHT
11000 (1Q00 POUNOS1 KILOSI
(a) 328 140
3201
............
XS 55.err 320
- lao
- :::.:: 280 TOTAL .:::9 : :9 . :..:::9:9 WEIGHT .. . : 17 ::7i 120 ONOSO
MAIN LANDING
TOTAL 249 :: . :.::.:: ____ :jjj:o.. 240 GEARS
WEIGHT 11080 .....-j POUNDSI
MAIN 128 GEAR
IIDDO POUNDSI 228 ._._-.-_-
...: 80
................ :.:.. lao
120 - 4,9::;;::. : 120
4(5
80 ... •• .:. _ 80
80 90 100
% MAC
05I0
1
52025 3035 (c) I I I I I
AIRPLANE AIRPLANE 480 1 GROSS GROSS
WEIGHT WEIGHT 1000 LB) 110281(01
1t: 197 M: 440 440 - 200
OMINA C -H OCF
M 200 Mq
ISO
360 460 160
- -- MAIN GEAR
320 GROUP LOAC TOTAL -' -.---- __._ -- --------- 1000 LW WEIGHT - ------- - 140 TWO MAIN
228 228
120
740 -- -- 240
____-• ' 230
- 128
200 200
120
110 50
lea 45
AIRPLANE AIRPLANE GROSS IGROSS
90 WEIGHT WEIGHT 11028 40 11000
POUNDSI KILOSI
00
35.
70
00
lea so
AIRPLANE AIRPLANE GROSS GROSS WEIGHT WEIGHT Il LBI 11000 1(01
260
240
220-
180
160
140
120
PERCENT WEIGHT ON MAIN GEAR PERCENT WEIGHT ON MAIN GEAR GROUP i ioo
MASS AND CENTER-OF-GRAVITY gravity varies less and is approximately 92 percent for ENVELOPES a general average-of contemporary jet aircraft.
Figure 2 (1, 2, 3) shows the allowable mass and center- STEADY TURNS of-gravity envelopes for the DC-8-63, DC-9-51, DC-10- 10, series 10 and 10CF, and DC-10-30, 30CF, 40, and Figure 3 relates lateral accelerations to turn radii and 40CF: Figure 2d also shows the nominal center of gray- speed and shows that 0.5 g is not only a landing-gear-and ity variation with mass. Although the %MAC values vary tire design limit, but also requires friction coefficients greatly among airplanes, the percentage of the maximum exceeding 0.8 (very high). The 0.25 g curve represents gross mass to the landing gear for a nominal center of a lateral maximum for passenger , comfort.

78
CONTA
VVIET
DRY
60 80
30 35
Id
Figure 3. Minimum turn radius versus taxi speed: DC-10.
METERS FT ICE
6 2C--
ic
4 TURN 12
RADIUS
(100)
2
0 0
0 20 40 TAXI SPEED (KTS)
0 5 IX 15 20 25 TAXI SPEED (MIS)
Figure 4. Takeoff of DC-10-40.
10001.6
MESA 60 _URL SPEC. - NEWTONS
.25
50
.20
40
CENTER GEAR I.l5
30
NOSE GEAR
.10 20
.05 l0 '
Notes: JT913-59A engines.
Altitude see level: temperature 25°C (77°F). Elevator and time history
input: variable angle of attack, flat runway m ,and extreely hard rotation.
Dashed line shows tire test qualification.
Figure 5. Gear configurations and centers of gravity
/77
4 4 H
VNG V
I 4H
VNG VMG
IVN
Table 2. Maximum pavement loads.
Main Gear Wing Gear Center Gear
Vu or V (kN) V. per Strut (kN) Vu (kN) V (kN) H per Strut (kN) H (kN) He (kN) Max Gross Steady Steady (instantaneous Steady (instantaneous Steady (instantaneous Model Mass (Mg) Static Braking Static Braking braking) Static Braking braking) Static Braking braking)
DC -8 -43 145 144.81 223.79 658.72 619.24 208.99 - - - - - - -55 149 151.40 232.87 690.39. 650.04 219.15 - - - - - - -55F 149 161.90 243.38 691.12 650.25 219.22 - - - - - - -61 149 122.07 183.97 701.34 670.05 229.32 - - - - - - -61F 151 114.00 247.87 707.01 670.08 229.43 - - - - - - -62 154 156.72 323.52 733.24 692.42 234.68 - - - - - - -62F 154 160.82 327.14 746.89 706.07 226.68 - - - - - - -63 158 135.49 287.18 765.71 720.70 245.99 - - - - - - -63F 158 136.43 288.06 765.71 720.70 245.99 - - - - - -
DC-9 -15 41.6 39.356 69.905 18.805 175.58 129.36 - - - - - - -21 45.9 50.921 80.225 21.203 197.38 145.23 - - - - - - -32 49.5 51.072 77.043 22.410 211.12 157.52 - - - - - - -41 52.3 50.690 76.629 23.949 226.52 169.38 - - - - - - -51 55.5 52.390 73.643 25.500 244.38 185.32 - - - - - -
DC-b -10 196 186.90 318.63 - - - - 905.62 839.76 616.01 - - - -10F 201 190.42 325.99 - - - 926.53 859.15 630.24 - - - -30 253 307.90 217.00 - - - 936.87 866.80 636.86 405.74 375.41 275.82
Note: 1 Mg = 2200 It, and 1 kN 224 lbf

Figure 6. Discrete 1 - cojne bump height versus wavelength.
(CM) (IN)
L - 50.00
120
40.00 100
10.0( 201-
80 30.00
0 0.00 a 3 4 5 6 765 2 3 4 5 S 76 9 2 3 4 a s 7 •a 1 (Fr) 100 01
I • I I I I I I I I I I I
0 a5 1 2 3 4 5 10 20 30 40 50 100 200 300 (M
WAVELENGTH 14
_434JLW ..........
iàiirnoiiuiituiw4iIIlli
ion=
111111111
___auuiuun _ _
iiuiiiivauuuiuuui
____ulinlil uiuuuii _ uuuuuuI
11111111 IIIUPH ___ululifli _ UII!il1iIIIIIII ___•niiiii__
79
Table 3. Sources of vibration. . - Most Frequency Significant Range Frequency
Source. Character (Hz) (Hz)
Landing impact Pulse ito 10 ito 5 Runway roughness Random 0.5 to 30 0.5 to 5 Atmospheric turbulence Random 0 to 20 0 to 10 Buffet and osciUatory
shocks Random ito 50 ito 20 - Table 4. Aircraft operational Approximate Boundary- Engine- phase and accompanying Time Duration Rough Jet Atmospheric Layer Induced Landing vibration sources. Operational Phase (mm) Runway Exhaust Turbulence Turbulence Buffet Impact
Warm-up 1 to iS - x - - - - Taxi 5to15 x x - - - - Run-up 2 to 20 - x - - x - Taieoff 1 to 5 x x x - x - Climb 3to30 - x x x x - Cruise night maneuver 60 to 480 - x x x x - Descent 5 to 15 - - x x x - Extend flaps and gear ito 15 - - x - x - Landing 0.08 x - - - x x Roilout 1 to 2 x -
Figure 7. Runway roughness - CM IN
for aircraft design. 25 10
C
20 8
C = Is 6
a. 10 4
C
2
nt..f. 4 6 8 10 20 40 60
1 2 345 10 20 WAVELENGTH 01
200 4001600 FT
50 180 200 N

80
Table 5. Pavement unevenness for design, analysis, and evaluation. Figure 8. Condition at touchdown.
Estimated BEGIN
Type of Percentage No. or FLARE
Unevenness of Airports Duration Dominant Response TOUCHDOWN
Design grade LARE
runway over- crossings 100 2 to 5/flight Rigid body modes VIE 200 FT/ SEC
Slab faulting and 161
4 spalling 5 to 10 - Flexural modes; noise Settling of slab 5 to 10 Length of Rigid body modes; flexural
centers runway or modes; noise a 10 taxiway Washboarding - . - Rigid body modes; flexural
modes; noise Runway rough.. 50 to 70 - Rigid and flexural modes;
ness spectra to 90 noise Note: Maximum landing force 356 kN(80 000 Ibf), 1.2 a V stall Va 61 M/S (200 ft/u), and maximum design sink speed V 3M/sI10 ft/SI.
Figure 9. Cross section of typical shock strut. Figure 10. Strut at half stroke; tire one-third deflected.
TRAPPED UPPER FILL AIR VOLUME PORT AND STARTING HEIGHT BEFORE
INFLATION T.D.
HOLES IN VALVE ATIRE PLUS
1/2 STROKE ORIFICE 9JI'PORT TUBE FOR INTER F LOW OF OIL REBOUND CHECK
VALVE
HEIGHT OF STROKli
- -
OIL ABOVE ORIFICE -
REBOUND CHECK ATIC SEAL ORIFICE, ALSO
FORSERVICING (AIR BLEED AND OIL FILL) INTO ANNUL US
- LOWER FILL PORT
RE
MATERIAL REMOVED ON PISTON 00
LANII GEOMETRY
TIME AND MASS
HISTORIES PARAMETERS
Re L
TIME ISICI
FLOATING
AIR LOxO
STROM
EBOUND - G VERTICAL CHECK 1 ACCELERATION
RUT LATION
ESSURE =LAG
TROEI
PACT TIRE .J- MPING
- LOADS
AIRPLANE I OYNAMC LANDING
AFT MODEL
UDE AND J PRESSURE IGURATION
TR
UT I LOADS AND
HDOWN DISPLACEMENT
ILSR LECTION AERODYNAMIC
E PARAMETERS FILE
DYNAMIC ETERS TV CONSOLE
IME RY STUDY
AND TAPE I
Figure 11. Computerized landing program.
REARING
FREE FLOW ROLE—...,
FI.RPPGI VALYCI
RESOuND ORIFICE7

0.00,
300
200
OEM _ -
- , -,--.-=---- -I
0 0.05 0.1 0.2 0.3 TIME (SEC)
0.00/
I 17
O.000J a
0.01
., 00J
0 0 a STATIC LOAD AT 440,000 LB
hORSED ElI - TAKEOFF MASS Sn
0.11004,
CENTER MAIN GEAR
(b)
tO FPS LANDING 13.0 M/S)
Figure 15. Acceleration power spectra: DC-8-63 at (a)cockpit, (b) center of gravity, and (c) pylon no. 3.
(A) 0.!
0.01
a Sn
0 0
Figure 12. Load versus stroke.
IKILON OR TO NO I 11000 LRI
350 80
co 70
60
50
40
ISO 30
100 20
50 10
a 0 2 - 4 6 8 10 12 14 16 18 I"I
5 10 15 20 25 30 35 40 45 ILMI
STROIIE
Figure 13. Load versus time.
II 110 N OW I ON SI 1000 LRI
..,25 350 80
60 250
40
150
100 20
50
S/SEC ,I-io 95/SEC
Figure 14. Main landing-gear load: DC-10-30/40 with (a) center gear extended and (b) center gear retracted.
MEGA NEWTONS
I LB 1.4
300f (a)
1.2 I / STATIC LOAD AT 555,000 LB
250 f 1251,744 ElI ID PS LANDING 13 N/SI IAUOFF lASS
0.8
OUTER MAIN GEAR
0.4
0.2 50
0 1.4
300
1.2 250
1.0
200
0.8
150 0.6
100
0 .05 .10 .15 .20 .25 .30 .35 .40 .45
TIME FROM TOUCHDOWN (5)
U. I
L1i' I i(
T
pIV1 fT I IN
TI1lli 1I:ii1ui1iTj
H
) 1:.'
IL Lpi1Itiii1 - -
:4 1j IiJIIThI
4IL I iL Lr' L
I R4-fi I i ,,,
1i717 iiLF1.ri J?j
'ILL
[
r4' J LLII!.LJ:1LL. t:.tj:T.! , 01
- I I
I
[[41)1111) II))
flh1Th
I TrI4
'Iii ht ftd itthtit ffiuT FreqARncy, HE
81
LI 250 IIIIIIIIIIIIIII10-
200

82
Table 6. Landing-gear characteristics.
Characteristic DC-9-41 8-727-200 B-707-320 DC-8-55 DC-8-63 DC-b-10. DC-b- 20/30 8-747 B-7478
Mass Max ramp, kg 52 163 78 472 152 407 148 779 162 386 200 942 253 105 323 412 352 895 Max takeoff, kg 51 710 78018 151 934 147 418 161 026 199 581 251 744 322 051 351 535 Max landing, kg 42 266 72 575 112 037 . 98 430 124 738 157 397 182 798 255 826 255 826
Landing gear con- 00 00 00 00 00 00 00 00 - 00 figuratioti
00 00 00 00 00 00 00 00
00 00 00 00 00 00 00 00 000000 00 00 00 00 00 00 00 00 00 00 00 00 00 00 00 00 00 00 00 00 00 00
Wing landing gear Tire size, men 1041 by 381 1245 by 432 1168 by 406 1118 by 406 1130 by 419 1270 by 508 1321 by 521 1168 by 406 1245 by 432 Tire contact
area, cm0 1097 1529 1355 1348 1419 1781 2065 1355 1529 Tire pressure,
kPa 114 116 124 130 134 121 114 141 128 Twin spacing, cm 66.0 86.4 87.9 76.2 81.3 137.2 137.2 111.8 111.8 Tandem spacing,
cm - - - 142.2 139.7 139.7 162.6 162.6 147.3 147.3 Center landing gear
Tire size, mm - - - - - - 1321 by 521 - - Tire contact
area, cm2 - - - - - - 2065 - - Tire pressure,
kPa - - - - - - 97 - Twin spacing, cm - - - - - - 95.3 - -
Note: 1 kg = 2.2 lb. 1 mm = 0.039 in, 1 cm2 = 0.155 in2, and 1 kPa = 0.145 1bf/in2
Table 7. Airport pavement requirements at maximum takeoff mass.
Procedure DC-9-41 B-727-200 B-707-320 DC-8-55 DC-8-63 DC-b-10 DC-10-20/30 B-747 B-747B
Airplane load classification number (LCN) Rigid pavement
L = 75 cm 59 78 70 74 80 73 73 73 74 L = 100cm 61 81 82 86 92 84 84 85 86 L = 125 cm - 62 84 91 94 102 94 94 94 96
Fle,dble pavement H = 50cm 56 72 79 85 90 74 75 77 79 H = 75 cm 63 81 94 100 107 91 91 94 96 H = 100cm 68 88 106 112 120 105 105 107 109
Pavement thickness (cm) Concrete 25.9 29.0 31.2 31.8 32.3 31.5 31.8 30.5 31.8 Flexible
CBR = 10 53.3 64.0 77.0 77.7 81.8 - 81.8 83.8 75.7 81.0 CBR = 15 39.4 48.3 56.1 57.4 60.7 60.5 60.5 55.1 58.4
Note: t cm = 0.39 in. 275 Pa and k = 80 Pa/cm
TAKEOFF
Figure 4 depicts an unusual computer-study takeoff of a DC-10-40 aircraft in which the aircraft rotation for lift-off is so severe that the tail strikes the ground. It is in-cluded here to show the amount of peaking that can occur under extreme conditions. However, the rotation-bump magnitude was less than 10 percent above the load with- out a bump. -
MAXIMUM PAVEMENT LOADING
Figure 5 shows the gear configurations and centers of gravity of the DC-8, DC-9, and DC-10 aircraft, and Table 2 shows their maximum pavement loads at a steady deceleration (braking) of 3.05 m/s2 (10 ft/s2) and an in-stantaneous braking coefficient of friction of 0.8. [These conditions are close to the aircraft maximum decelera-tion and the brake and tire design specifications; more typical day-in-and-day-out values are 1.8 m/s2 (6 ft/s2) and 0.35.]
The following notation is used:
V55 = V5 = max vertical nose-gear ground load at most forward center of gravity,
VMS = max vertical main-gear ground load at most aft center of gravity,
H = max horizontal ground load from braking, V = max vertical wing-gear ground load per strut
at most aft center of gravity, Vc = max vertical center-gear ground load per strut
from braking, H = max horizontal wing-gear ground load per strut
from braking, and H5 = max horizontal center-gear ground load per
strut from braking
AU loads are calculated by using max aircraft ramp force.
PASS ENGER- COMFORT CONSIDERATIONS -
Tables 3, 4, and 5 give general information about im-portant vibration sources, exposure-time durations, frequencies of interest, and categories of pavement un-evenness that are considered in aircraft design, usually
83
for passenger comfort rather than for aircraft-fatigue loading for which the ground -air -ground cycles of load-ing are more demanding.
PAVEMENT-BUMP CRITERIA
Figures 8 and 9 (4) show the discrete 1 - cosine bump heights that are used to define loads for the structural design of aircraft. Bump heights exceeding these cri-teria [e.g., 11.4 cm (4.5 in) in 30.5 m (100 ft)J may ex-ceed the aircraft design loads. Special studies (which are expensive) are required to depart from these cri-teria, but have been done for special cases (e.g., to de-fine allowable overlay tapers).
COMPUTER LANDING STUDY
The sequence of Figures 8 through 13 shows the inputs and results of a computer landing study. Figure 8 shows touchdown conditions at the maximum design sink speed of 3.05 m/s (10 ft/s) at the maximum landing force of 356 kN (80 000 lbf) and a horizontal speed of 1.2 times the airplane stall speed. Because the aircraft has flying speed, a lift equal to the landing force is acting through-out the landing impact so that the landing gear absorbs only the vertical kinetic energy.
Figure 9 shows that in the struts, the trapped oil is forced through an orifice whose annulus area is varied by a metering pin as a function of the stroke. This pro-duces a reaction proportional to the strut stroking (col-lapsing) velocity squared and the amount of stroke. Fig-ure 10 shows that the aircraft vertical displacement is a function of the strut stroke plus the tire deflection.
Figure 11 shows a block diagram chart of the inputs and outputs of the computerized landing-dynamics pro-gram. In this program, the engineer can work inter-actively with the computer via a cathode -ray -tube console.
Figure 12 shows the load variation as a function of aircraft sink speed at touchdown. In this figure, the impact is ended (i.e., the aircraft sink speed equals zero) when the load line crosses the air curve. For a typical airline landing [at a sink speed of approximately 1 m/s (3 ft/s)], the peak load is a fraction of the design sink-speed load and less than half the available stroke is used.
Figure 13 shows thF strut load as a function of time. The impact time duration varies from 0.1 to less than 0.3 s.
Figure 14 shows comparisons between the maximum landing loads and the maximum static takeoff loading. For the landing with the centerline gear extended, the maximum landing load is less than the static takeoff load For the landing with the centerline gear retracted, the load is less than 10 percent above the static takeoff load.
RUNWAY ROUGHNESS RESPONSE AT FOUR INTERNATIONAL AIRFIELDS
Figure 15 shows the acceleration response of the DC-8-63 aircraft at four international airports. Power spectral density as a function of frequency was measured at (a)
the cockpit floor, (b) the aircraft center of gravity, and (c) engine pylon no. 3. The upper solid lines show the responses at the roughest airport, and the lower solid lines show the responses at the smoothest airport. Root-mean-square values for each of the curves provide a clear response index from rough to smooth. The primary message contained in these data is based on the following heuristic discussion.
The study was conducted to identify a pavement roughness problem at a particular airport that pilots had complained about for three years because of a number of engine acceleration warning light occurrences on takeoff.
Except for minor local landing-gear failures that had been repaired by parts replacement, there was no structural fatigue damage attributable to the rough run-way operation.
Therefore, a highly objectionable ride due to runway roughness is tolerated by the aircraft without incurring fatigue damage. This statement is not an endorsement for rough runways; it only places the problem in perspec-tive. Rough runways are still highly objectionable because they damage aircraft instruments and sensitive electronic equipment and disturb pilot and passenger sense of safety.
COMPARATIVE LANDING-GEAR AND AIRPORT CHARACTERISTICS
Table 6 gives typical, frequently requested data about aircraft loading and landing-gear characteristics, and Table 7 gives pavement requirements by international (5) and United States procedures (i.e., the Portland Ce-ment Association PDILB computer program for concrete thicknesses and the U.S. Air Force SEFL 165A program for flexible pavement thicknesses). The data are based on takeoff mass and assume a constant distribution of the mass of 92 percent to the main landing gear.
ACKNOWLEDGMENT
I wish to thank the Scandinavian Airlines System (SAS) for permission to use the data contained in Figure 15 and acknowledge the assistance of Ole Riis-Hansen and Sig Jonasson of SAS and Edmond Zwiback of Douglas Air-craft Company. It was a pleasure to work with them on a program with such excellent instrumentation, record-ing, and processing of the data.
REFERENCES
DC-8 Airplane Characteristics: Airport Planning. Douglas Aircraft Company, Rept. 67492, March 1969. DC-9 Airplane Characteristics: Airport Planning. Douglas Aircraft Company, Rept. 67264, June 1975. DC-10 Airplane Characteristics: Airport Planning. Douglas Aircraft Company, Rept. 67803, Nov. 1973. Airplane Strength and Rigidity, Landing, and Ground-Handling Loads. U.S. Air Force, Military Specifica-tion IvllL-A-008862A, March 31, 1971. Aerodrome Manual, International Civil Aviation Organization, 1965.

84
Field Survey and Analysis of Aircraft Distribution on Airport Pavements Victor A. HoSang, Howard, Needles, Tammen and Bergendoff, Alexandria,
Virginia
In the current Federal Aviation Administration design criteria for runway and taxiway pavements, load repetitions are expressed in terms of cover-ages that represent the number of times a particular point on the pave-ment is expected to be stressed as a result of a given number of aircraft operations (passes). The coverages resulting from operations of a partic-ular type'of aircraft are a function of the number of aircraft passes, the number and spacing of wheels on the aircraft landing gear, the tire-contact area, and the lateral distribution of the aircraft wheel-paths relative to the pavement centerline or guideline markings. The collective effect of these factors is usually expressed in terms of derived pass-to-coverage ratios, based on the observed lateral distribution patterns of aircraft wheel-paths. Funda-mental to the current procedure for converting aircraft passes to cover-ages is the assumption that aircraft wheel-paths for 75 percent of opera-tions are practically uniformly distributed over a certain pavement width. In this study, this procedure was reexamined on the a priori assumption that aircraft wheel-paths conform more nearly to a normal (bell-shaped) than to a uniform distribution. Theoretical normal distribution curves were fitted to the limited number of actual wheel-path distribution data available and found to be much more representative of the actual distri-butions than are the distribution curves based on the uniform distribu-tion assumption. Aircraft pass-to-coverage ratios based on the normal curves were calculated for both military and civil aircraft, although no measured traffic distribution data were available to verify the procedure for civil aircraft.
One of the parameters in the design criteria for airport pavements is the number of load repetitions that the pavement will receive during its design life. However, the incremental detriment to a pavement that will be caused by a particular wheel at a particular location is affected by factors such as the number of wheels, wheel configuration, load on each wheel, tire-contact area, and location of the aircraft on the pavement. In the develop-ment of the current Federal Aviation Administration (FAA) design criteria, the collective effect of these fac-tors was evaluated in terms of the concept described as the coverage. The definition of a coverage differs for flexible and rigid pavements. For flexible pavements, a coverage occurs when each point of the pavement within the traffic lane has been subjected to a tire-contact point; for rigid pavements, a coverage occurs when each point of the pavement within the limits of the traffic lane has been subjected to a maximum stress.
The current procedure for converting aircraft passes to coverages uses a traffic width that is based on infor-mation developed several years ago by the U.S. Army Corps of Engineers when aircraft traffic flow and volume were considerably different than at present. The current and projected traffic conditions require that this proce-dure be verified or modified, as a function of the type of runway and the primary aircraft using it, by the use of lateral and longitudinal traffic-distribution measure-ments.
PURPOSE
The purpose of this study was to develop a simple and effective method of predicting the lateral and longitudinal traffic distributions of aircraft on civil airport runways and taxiways. The study included a selection of particu-lar types of aircraft from among those commonly used for commercial air transportation. Field data were col-lected and analyzed for specific airports selected to represent reasonable variations in the operating environ-ment. Data on aircraft ground speeds and weather con-
ditions were correlated with observed measured lateral and longitudinal distributions -
SCOPE
Two phases—data collection and data analysis—of the study are summarized here.
The first part of the data-collection phase consisted of the development, assembly, and testing of the neces-sary instrumentation system for the determination of
The lateral and longitudinal distribution of air-craft on runways,
The lateral distribution of aircraft at particular points on taxiways,
The aircraft ground speeds on runways and run-way exits, and
The type of aircraft (by automatic identification or observation and manual recording).
The second part of this phase consisted of the use of the instrumentation system to collect pertinent data at nine selected airports. Data about other factors that might affect the distribution of the traffic were also ob-tained. These data included descriptions of displaced thresholds, obstructions, abnormal operating conditions, signal and instrument landing aids, pavement widths, weather and temperature, altitude, and time of day.
The data analysis consisted of a statistical analysis of the field data to identify and isolate those factors that appear to affect or characterize the distribution of air-craft traffic on runways and taxiways. The current FAA method for determining aircraft traffic distribution was examined by comparison with the results of the statisti-cal analysis of the field data.
SUMMARY OF WORK ACCOMPLISHED
A system of infrared photoelectric sensors was installed in N-shaped and I-shaped arrays on runways and taxi-ways at selected civil airports to determine aircraft ve-locities, lateral locations, and longitudinal locations during takeoff, landing, and taxiing operations. Figure 1 shows a schematic diagram of the instrumentation sys-tem and a typical arrangement of the light beam arrays. All data were recorded on magnetic tape. The data in-cluded such factors as the date, time of day, system parameters, mode (takeoff, landing, or taxiing), and results of calculations (position and velocity).
Aircraft identification was accomplished by measuring the aircraft footprint, as each aircraft of interest had a unique combination of wheelbase, tread, and configuration.
The accuracy of the data-collection system was veri-fied by a photographic technique. Two synchronized 100-mm, high-speed, high-precision cameras were used to obtain sequenced overlapping pairs of photographs of aircraft passing through an N-array. Several aircraft operations were recorded by both the photographic equip-ment and the data-collection system. The maximum dif-ference between the offset distances determined by the data-collection system and those determined by the pho-tographic method was 9.1 cm (0.3 ft). Therefore, it was concluded that the data-collection system was adequate
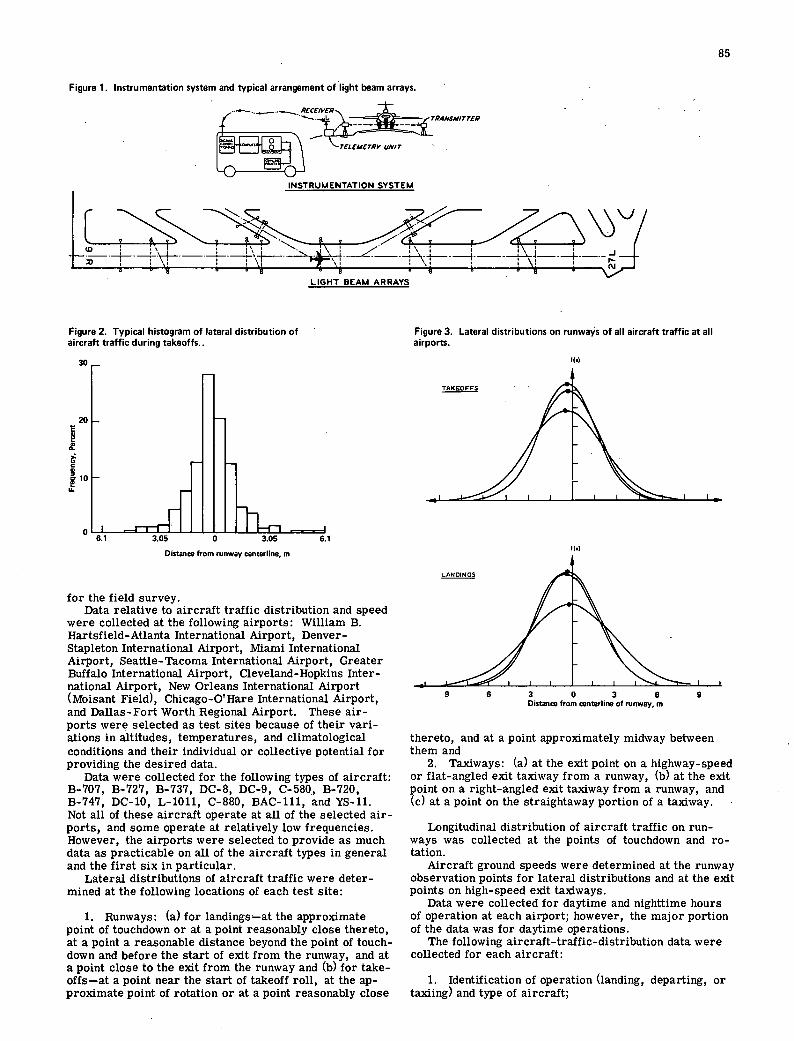
Figure 1. Instrumentation system and typical arrangement of light beam arrays.
EC
INSTRUMENTATION SYSTEM
LIGHT BEAM ARRAYS
85
Figure 2. Typical histogram of lateral distribution of aircraft traffic during takeoffs..
30
20
C
10
U.
Distance from runway centerline, m
for the field survey. Data relative to aircraft traffic distribution and speed
were collected at the following airports: William B. Hartsfield-Atlanta International Airport, Denver-Stapleton International Airport, Miami International Airport, Seattle-Tacoma International Airport, Greater Buffalo International Airport, Cleveland-Hopkins Inter-national Airport, New Orleans International Airport (Moisant Field), Chicago-O'Hare International Airport, and Dallas-Fort Worth Regional Airport. These air-ports were selected as test sites because of their van-ations in altitudes, temperatures, and climatological conditions and their individual or collective potential for providing the desired data.
Data were collected for the following types of aircraft: B-707, B-727, B-737, DC-8, DC-9, C-580, B-720, B-747, DC-b, L-1011, C-880, BAC-lil, and YS-li. Not all of these aircraft operate at all of the selected air-ports, and some operate at relatively low frequencies. However, the airports were selected to provide as much data as practicable on all of the aircraft types in general and the first six in particular.
Lateral distributions of aircraft traffic were deter-mined at the following locations of each test site:
1. Runways: (a) for landings—at the approximate point of touchdown or at a point reasonably close thereto, at a point a reasonable distance beyond the point of touch-down and before the start of exit from the runway, and at a point close to the exit from the runway and (b) for take-offs—at a point near the start of takeoff roll, at the ap-proximate point of rotation or at a point reasonably close
Figure 3. Lateral distributions on runways of all aircraft traffic at all airports.
'('I
9 6 3 0 3 6 9 Distance from centerline of runway, m
thereto, and at a point approximately midway between them and
2. Taxiways: (a) at the exit point on a highway-speed or flat-angled exit taxiway from a runway, (b) at the exit point on a right-angled exit taxiway from a runway, and (c) at a point on the straightaway portion of a taxiway.
Longitudinal distribution of aircraft traffic on run-ways was collected at the points of touchdown and ro-tation.
Aircraft ground speeds were determined at the runway observation points for lateral distributions and at the exit points on high-speed exit taxiways.
Data were collected for daytime and nighttime hours of operation at each airport; however, the major portion of the data was for daytime operations.
The following aircraft-traffic-distribution data were collected for each aircraft:
1. Identification of operation (landing, departing, or taxiing) and type of aircraft;

86
Longitudinal location of the point of touchdown relative to the landing end of the runway or displaced-landing threshold for landing aircraft;
Longitudinal location of the point of rotation rela-tive to the takeoff end of the runway for takeoff aircraft;
Lateral position relative to the runway centerline at the locations described above for both landing and take-off aircraft;
Lateral position relative to the taxiway centerline at the specified taxiway points for taxiing aircraft;
Ground speeds at those points for which lateral traffic -distribution data were collected for landing, de-parting, and taxiing aircraft; and
Date and time of day of each event.
Data on the prevailing weather conditions during the collection of the field data were obtained and recorded each hour or whenever significant changes occurred. Data on other conditions that might affect the traffic-distribution characteristics were also observed and re-corded.
One runway at each of the nine airports was instru-mented such that data could be collected for both oper-ating directions. Two of the runways were 61 m (200 ft) wide; the others were 45.7 m (150 ft) wide. A total of 4359 takeoffs and 5200 landings were recorded. Eight high-speed exits were instrumented, and a total of 697 operations at these exits were recorded. Seven locations on straight taxiways [a 30.5-m (100-ft) wide one and six 22.8-m (75-ft) wide ones] were instrumented, and 590 operations at these locations were recorded.
Procedures based on generally accepted methods of statistical analysis were used to analyze the field survey data. The mean and standard deviations of the lateral distributions and ground operating speeds for each sample-i.e., individual or combined types of aircraft at individual or combined airports-were the two pri-mary statistical parameters used in describing and com-paring samples. Frequency distributions (histograms) of the observed aircraft to centerline offsets were plotted in terms of the proportionate occurrences in 0.61-m (2-ft) intervals on either side of the pavement centerline or guideline markings.
Inspection of the histograms, such as the one shown in Figure 2, showed that the lateral distribution of air-craft traffic on runways, runway exits, and taxiways would be much more accurately represented by a theo-retical normal distribution function, such as is currently used to derive pass-per-coverage ratios (1), rather than by the modified uniform distribution functin that was previously used. This observation was also verified sta-tistically by using the X2 goodness-of-fit test.
In general, the aircraft centerline offsets were (a) to the left of the pavement centerline stripe on runways; (b) to the right of the pavement centerline stripe on straight taxiways; and (c) to the left or right of the guide-line on high-speed exits, depending on aircraft opera-tional flow pattern and exit configuration. The computed offset mean on runways, for both landings and takeoffs, generally ranged from 0.15 to 0.48 m (0.5 to 1.5 ft) left of the centerline on 47.5-rn-wide pavements and from 0.24 m (0.8 ft) right to 0.76 m (2.5 ft) left of the center-line on 61-rn-wide pavements. Wide-body and four-engine aircraft tended to be slightly farther left than two-and three-engine aircraft, but the difference was neither large nor consistent enough to make a distinction among such aircraft groupings.
The shapes of the lateral distribution patterns for takeoffs were generally narrower than those for landings. The computed standard deviations for individual types of aircraft, compared at the various airports, generally varied from 0.91 to 2.4 m (3 to 8 ft) for takeoffs and from
1.2 to 2.7 rn (4 to 9 ft) for landings. There was no con-sistent correlation of the standard deviation with respect to type or size of aircraft.
The standard deviations for takeoffs, for all the air-ports combined, varied among the individual types of air-craft generally from 1.8 to 2.7 m (6 to 9 ft) in the vicinity of lift-off and from 1.7 to 2.1 m (5.5 to 7 ft) in earlier portions of the takeoff roll. On 61-rn-wide runways, the standard deviations in the vicinity of lift-off were about the same as those in the same area on 47.5-rn-wide run-ways, but they were about 47.5 cm wider in earlier por-tions of the takeoff roll. The normal distribution curves for takeoff operations of all aircraft at all airports are shown in Figure 3.
The standard deviations for landings, for all airports combined, varied among the individual types of aircraft generally from 2.1 to 2.6 m (7 to 8.5 ft), except near the end of landing rolls where, as expected, exit effects in-truded. The normal distribution curves for landing op-erations of all aircraft at all airports are also shown in Figure 3.
Factors such as night operations, crosswinds, and wet pavements had apparent effects on aircraft lateral distributions on runways, but their overall impacts were not significant because these effects were (a) relatively small or generally not consistent, (b) infrequent in oc-currence, or (c) compensated for or nullified by other factors in the overall operating conditions.
In general, 90 to 95 percent of touchdowns occurred in the first 0.91 km (3000 ft) from the threshold, 70 to 85 percent occurred in the first 0.61 km (2000 ft), and 15 to 25 percent occurred in the first 0.31 km (1000 ft). A higher percentage of two-engine aircraft touchdowns oc-curred closer to the threshold in comparison with those of the wide-body and four- and three-engine narrow-body aircraft.
The standard deviations of the observed lateral dis-tributions on high-speed exits were generally greater than those on runways and were affected by aircraft op-erational flow pattern and exit configuration. The stan-dard deviations ranged from approximately 2.4 to 3.2 m (8 to 10.5 ft), with the upper limit probably more rep-resentative of typical exit configurations and their nor-mal use.
The computed offset mean of the lateral distributions on straight taxiway sections was approximately 0.61 m right of the centerline on the 22.8-ni-wide taxiways and approximately 0.91 m right of the centerline on the 30.5-rn-wide taxiway. The standard deviations of these dis-tributions were much smaller than those on runways, ranging from approximately 0.98 to 1.2 m on the 22.8-m wide taxiways and averaging about 1.8 m on the 30.5-ni-wide taxiway. The average taxiing speeds were between 10.6 and 13.7 m/s (35 and 45 ft/s) on both the 22.8 and 30.5-rn-wide taxiways.
The analysis of the field survey data leads to the fol-lowing conclusions:
The lateral distribution of aircraft on runways, runway exits, and taxiways is much more nearly repre-sented by a theoretical normal distribution function than by a uniform distribution function;
The properties of the aircraft wheel-path distribu-tion (i.e., the aircraft to centerline offset measured rel-ative to the centerline or guideline markings) are as summarized below (1 m = 3.28 ft):

87
Width of Average Offset (m)
Pavement Standard Type of Pavement (m) Value and Direction Deviation
Runway Landings 45.7 0.27 to 0.48 left 2.1 to 3.1
61.0 0.24 right to 0.70 left 2.7 to 3.4 Takeoffs 45.7 0.15 to 0.37 left 1.8 to 2.5
61 0.70 to 0.76 left 2.3 to 2.5
Straight taxiway 22.8 0.64 right 0.76 to 1.2 30.5 0.97 right 1.8
High-speed runway exit Variable - 2.4 to 32-
3. The overall impact of such factors as night opera-tions, crosswinds, and wet pavements is not a significant influence on the distribution of aircraft traffic.
ACKNOWLEDGMENT .
This paper is a summary of a report to FAA (2).
REFERENCES
D. N. Brown and 0. 0. Thompson. Lateral Distri-bution of Aircraft Traffic. U.S. Army Engineer Waterways Experiment Station, Vicksburg, MS, Miscellaneous Paper S-73-56, July 1973. V. A. HoSang. Field Survey and Analysis of Air-craft Distribution on Airport Pavements. Federal Aviation Administration, Rept. FAA-RD-74-36, Feb. 1975; NTIS, Springfield, VA, ADA-011-488.
Effects of Dynamic Loads on Airport Pavements Richard H. Ledbetter, U.S. Army Engineer Waterways Experiment Station,
Vicksburg, Mississippi
A study of the responses of typical flexible and rigid airport pavements to static and dynamic loading is summarized. Two series of full-scale tests using instrumented aircraft and runways were made. Among the results were that (a) both types of pavements exhibited both elastic and inelastic responses; (b) these types of responses must be separated to in-terpret the data; (c) two different types of displacement responses (in-ertial and noninertial) are present; (d) bow waves and elastic vertical expansions about the wheels occur in both types of pavements; (e) the vertical pressures in both types of pavements are totally recoverable and elastic; (f) no basic aircraft ground operating mode induces pavement re-sponses greater than those occurring for static load conditions, although under unusual conditions, such responses might occur; (g) pavement thicknesses can be reduced in the interiors of runways, but the pavement in exit areas of flexible runways should be stronger than that of main runways; (h) inelastic behavior is highly dependent on temperature, rate of load application, and load history; (i) in the velocity range of static load to low-speed taxi, inelastic displacements can be larger than elastic ones; and (j) the elastic behavior of stiff pavements is almost constant. Because the elastic and inelastic displacement behavior of pavements correlates to the behavior of the Waterways Experiment Station pavements test sections under simulated aircraft loads and wheel configurations and distributed traffic to the behavior of actual pavements under actual air-craft operations, further investigations of dynamic load effects can prob-ably be conducted on pavement test sections of limited size.
Because of reports of pavement distress resulting from current commercial aircraft loads and growing concern over the possibility of further detrimental aircraft dynamic-load effects on airport pavements, the Federal Aviation Administration has sponsored a study of this problem. The study consisted of a literature survey, computer analyses to determine aircraft-loads and pave-ment responses, scaled pavement tests, and correlations between experimental and analytical data. In general, it was concluded that aircraft dynamic wheel loads have had a significant effect on portions of airport pavements. Specifically, the study showed that the primary effects that influence pavement response to dynamic loads are
The increased magnitudes of aircraft wheel loads that result from aircraft modes of operation, pavement unevenness, and aircraft structural characteristics dur-ing moving ground operations and
The dynamic load phenomena associated with the materials used in the construction of both rigid and flex-ible pavements.
For a given aircraft and level of pavement unevenness, the loads imposed on a runway can be accurately defined for various ground operations. On the other hand, there has been a serious lack of the information necessary to obtain an accurate description of pavement response to dynamic loads.
PURPOSE
The study was undertaken to provide experimental pavement-response data so that the significance of dy-namic loads on airport pavements could be evaluated. Specifically, the basic purpose of the study was to de-termine the relations between the responses of typical flexible and rigid runway pavements and static and dy-namic loads. The magnitudes of the dynamic loads and the depths to which pavement structures are affected by both static and dynamic loads were determined, and the relation between aircraft ground speeds and dynamic loads were investigated.
SCOPE
Two series of full-scale tests using instrumented air-craft and both flexible and rigid instrumented runways were conducted to proyide the data needed. One series of tests was conducted during the winter of 1972 when the average temperature of the top pavement layer was between 1.7 and 12.8°C (35 to 550 F), while the second series was conducted (on the flexible pavement only) during the summer of 1974 when the average tempera-ture of the top pavement layer was between 28.9 and 46.3°C (84 to 1160 F). Instrumentation systems were installed aboard aircraft to measure and record the three components of force of each of the main-gear assemblies, Instrumentation systems were also in-stalled at various elevations in the pavements to mea-sure the pavement responses to aircraft loads as rela-tive displacements and pressures.. The key element in this experimental approach was the recording of a common time base for the aircraft-load and the pavement-response measurements. This control provided a means of correlating the responses of the aircraft and pavement structures to within 1 ms. The locations of the instrumented pavement test sites were

88
Figure 1. Test sites at NAFEC Airport.
E
Figure 2. Arrangement of flexible pavement instrumentation.
ROWI ROW2
ROW 3
STA8S+20 65+50 ee+oo
9.1m 15.2m E
0 0 to
Row of Gauges -'--ó PLAN
LEGEND
- Bison Coil (All Gauge Rows) Bison Coil (65 + 50 Only)
• WES Soil-Pressure Cell
O SE Soil-Pressure Cell
0 WES Deflection Gauge £ Inductive Probe (All Gauge Rows) o Inductive Probe (65 + 50 Only) 8 Velocity Gauge
BITUMd.JOUS SURFACE COURSE BITUMINOUS BASE COURSE z BASE COURSE
SUBBASE COURSE
COMPACTED SUBORADE
Note: 1 m = 3.28 ft.
4.7 m
120.3 115.2 O.73m_1
1cm cm
0 0 - -
t = e 0 a 0 UL
1 0 0 - E - 0 - 0 S
I = o - - o - E
I:I: :

20.3 1 15.2
cm cm
PCC PAVEMENT 0 --0 - S
SUBBASE COURSE
COMPACTED SUBCRADE
0
- 0
0
E '6
a a a
Figure 3. Arrangement of rigid pavement instrumentation.
ROW I ROW 2 ROW 3
STA26+48 26+85 27+20 I I
11.8m 10.7m E
0
Row of Gauges
PLAN c.
89
4.7 m LEGEND
- Bison CoIl (All Gauge Rows)
Bison CoIl (26 + 85 Only)
WES Soil-Pressure Cell
O SE Soil-Pressure Cell
WES Deflection Gauge
£ Inductive Probe (All Gauge Rows)
Inductive Probe (26 + 85 Only)
Velocity Gauge
Velore Strain Gauge
,,
z
Note: 1 m = 3.28 ft.
selected so that all possible modes of aircraft ground operation could be investigated.
TEST PROGRAM
The instrumentation packages were installed in the pave-ment structures of runways 04-22 and 13-31 at the Na-tional Aviation Facilities Experimental Center (NAFEC) Airport, Atlantic City, New Jersey, at the sites indi-cated in Figure 1.
A 24.4-rn (80-ft) long segment of runway 13-31 located at its intersection with runway 8-26 was selected as the flexible pavement test site. This test site allowed the collection of typical response measurements during land-ing and at the point of rotation for takeoff as well as dur-ing low- and high-speed taxiing, braking, and turning operations. This particular site was in a portion of the runway that was being reconstructed, which was of great advantage for the installation of the instrumentation. After the reconstruction, the flexible pavement in this area consisted of 7.6 cm (3 in) of bituminous surface course, 15.2 cm (6 in) of bituminous base course, 22.9 cm (9 in) of base course consisting of the crushed and mixed original pavement surface and base courses, and 30.5 cm (12 in) of subbase course constructed from the original subbase course over a compacted subgrade.
A typical experimental arrangement of the flexible-pavement instrumentation system is shown in Figure 2. The arrangement included Bison coils, SE soil-pressure cells, waterways experiment station (WES) deflection gauges and soil-pressure cells, inductive probes, and velocity gauges. In addition, thermistors were in-
stalled on the pavement surface and at depths of 7.6, 15.2, and 22.9 cm (3, 6, and 9 in) within the pavement structure.
A 22-m (72-ft) long segment of runway 04-22 was in-strumented at its intersection with runway 17-3 5 to form the rigid pavement test site. The pavement structure in this area consisted of 17.8 cm (7 in) of portland cement concrete pavement and 20.3 cm (8 in) of subbase course over the compacted subgrade. The concrete was re-moved, and the gauges were installed in holes cored through the underlying material.
The instrumentation system installed in the rigid pavement test site was similar to that in the flexible pavement test site. Figure 3 shows a typical arrange-ment, which included Bison coils, inductive probes, de-flection gauges, Valore strain gauges, SE and WES soil-pressure cells, and velocity gauges. Thermistors were installed on the surface of, at the bottom of, and at a depth of 8.9 cm (3.5 in) in two slabs of the pavement.
A system of laser sources and detectors was installed along the edges of the runways such that a beam was pro-jected directly above and parallel to each instrumentation gauge row. An electrical impulse was generated when the wheels of the instrumented aircraft passed between the source and the detector, thereby signaling the instant at which the wheels were directly over the gauge row. The lateral position of the aircraft was determined by visual inspection of a stripe of flour and water solution painted on the surface of the runways adjacent and paral-lel to each gauge row.
A synchronized common time signal was recorded on both aircraft and ground-data tapes. This provided the

90
means by which the pavement response could be corre-lated with the corresponding aircraft load. With the ex-ception of the thermistors, all the instruments were re-corded simultaneously on magnetic tapes, and all ground-data tapes contained the time code and laser signals. Temperatures were recorded on paper tape.
An instrumented B-727 was used for the cold weather testing in 1972, and a similar B-727 and a C-880 were used for the warm weather testing in 1974. The aircraft were instrumented to measure the force transmitted to the pavement structure. On-board instrumentation for all three aircraft included signal conditioning equipment, a time-code generator (synchronized with the ground time-code generator for correlation of the test results), and a 14-track analog magnetic tape recorder.
Data were collected for 408 aircraft operations during the cold weather tests. Of this total, 203 operations were on the flexible pavement test site, and the remaining 205 were on the rigid pavement test site. During the warm weather tests, data were collected for 281 aircraft op-erations on the flexible pavement test site.
The following types of tests were performed during both cold and warm weather tests:
Static load tests—The aircraft was positioned over each gauge row and data collected to provide a base for comparison with the data from the dynamic load tests and a verification of the capability of the instrumentation system.
Dynamic load tests—Various aircraft ground op-erations were conducted on the test sites, and the pave-ment responses and aircraft dynamic loads were deter-mined for the following aircraft operating modes: (a) creep-speed taxi at 5.6 to 14.8 km/h (3 to 8 knots), (b) low-speed taxi at 27.8 to 55.6 km/h (15 to 30 knots), (c) medium-speed taxi at 83.4 to 148.2 km/h (45 to 80 knots), (d) high-speed taxi at 157.5 to 240.9 km/h (85 to 130 knots), (e) high-speed braking at 240.9 to 83.4 km/h (130 to 45 knots), (f) takeoff rotation at 157.5 to 240.9 km/h (85 to 130 knots), (g) touchdown, (h) high-speed braking with reverse thrust, and (i) turning at 7.4 to 55.6 km/h (4 to 30 knots).
ANALYSIS OF DATA AND RESULTS
In general, all instrumentation performed satisfactorily. The instrumentation responses were reduced by auto-matic data processing (digital) techniques and showed the following results:
Both flexible and rigid nonconditioned pavements exhibit both elastic (including viscoelastic) and inelastic behavior. (Conditioning is a test procedure in which a pavement point is loaded repeatedly before recording its responses. By this procedure, inelastic response, which can be erratic, is made to approach zero; there-fore, measured response then appears to be stable. However, while this type of conditioning temporarily eliminates the inelastic movements, it is not really representative of behavior under actual traffic loading because traffic is randomly distributed and approaches a normal distribution with time.) The magnitudes and directions of movement of the inelastic responses were controlled by the gear-to-gauge offset distance. There were changes in direction of the inelastic response and upward movement at the various offsets and in the im-mediate gauge vicinity, but generally the elastic and in-elastic responses exhibit symmetry and repetition.
To be able to fully interpret and analyze the re-sponse data of the nonconditioned pavement, the elastic and inelastic responses have to be separated (they occur simultaneously) and treated independently. The mea-
sured responses could not be completely analyzed unless the inelastic behavior was fully accounted for.
Two different types of displacement responses—that of the total pavement structure as assumed to be referenced to infinity (inertial reference) and that of the individual pavement-structure element referenced in-ternally to each element (noninertial reference)—act in both flexible and rigid pavements. Each type of response exhibits both elastic and inelastic behavior.
Bow waves in front of and elastic vertical expan-sions behind and adjacent to the wheels occur within the structural elements (noninertial reference) of both types of pavement structures under moving aircraft operations.
The vertical pressures of both flexible and rigid pavements are totally recoverable and elastic. On re-moval or passage of a load, no residual pressures ap-peared to be acting; therefore, the inelastic behavior did not seem to induce residual vertical pressures. The pressure cells appeared to be carried with or ride within the pulsating structures.
The investigation of the relations between the pave-ment response and the aircraft dynamic loads found the following results:
1.' The B-727 aircraft dynamic load tests in 1972 (cold weather) and 1974 (warm weather) on the noncondi-tioned flexible pavement structure and in 1972 on the nonconditioned rigid pavement structure showed that none of the basic aircraft ground operating modes in-duced pavement responses (elastic plus inelastic) greater than those occurring for static load conditions, even though the aircraft dynamic loads were as much as 1.2 times the static load. The elastic response alone also generally indicates this to be true. The pavement sur-faces were relatively smooth in the test site areas.
However, extrapolation of the test results indi-cated that for stiff pavement structures, such as the rigid pavement at all times and the flexible pavement in cold weather, unusual conditions of large dynamic load-ing that could result from such conditions as rougher surfaces than that at NAFEC or holes or bumps could possibly cause responses larger than those that occur under static loading. This is possible because the in-elastic response of the stiff pavements is low, but their elastic response is essentially of a constant magnitude with rate of load applications. The larger-than-static-load response that could occur should be entirely elastic and not detrimental to the pavement structure except by contributing to an increase in elastic fatigue damage.
The gradually reduced elastic response and the reduced inelastic response at high speeds indicated that pavement thickness can be reduced in the interiors of runways.
The measured aircraft loads showed that high horizontal loads were applied to the pavement surfaces during turns. Because of these high loads and to pre-vent excessive deterioration in turn areas, the pavement in exit areas of flexible pavement runways should be strengthened or be stronger than the main runway.
The tests showed that inelastic behavior is highly dependent on temperature, rate of load application, and load history (magnitude of load and lateral position of aircraft).
Inelastic displacements measured within the ve-locity range of static load to low-speed taxi were larger than the elastic displacements.
The tests showed elastic behavior to be almost constant for stiff pavement structures (rigid and low-temperature bituminous pavements) and the probable viscoelastic effects to be more pronounced at high tem-peratures in bituminous materials.
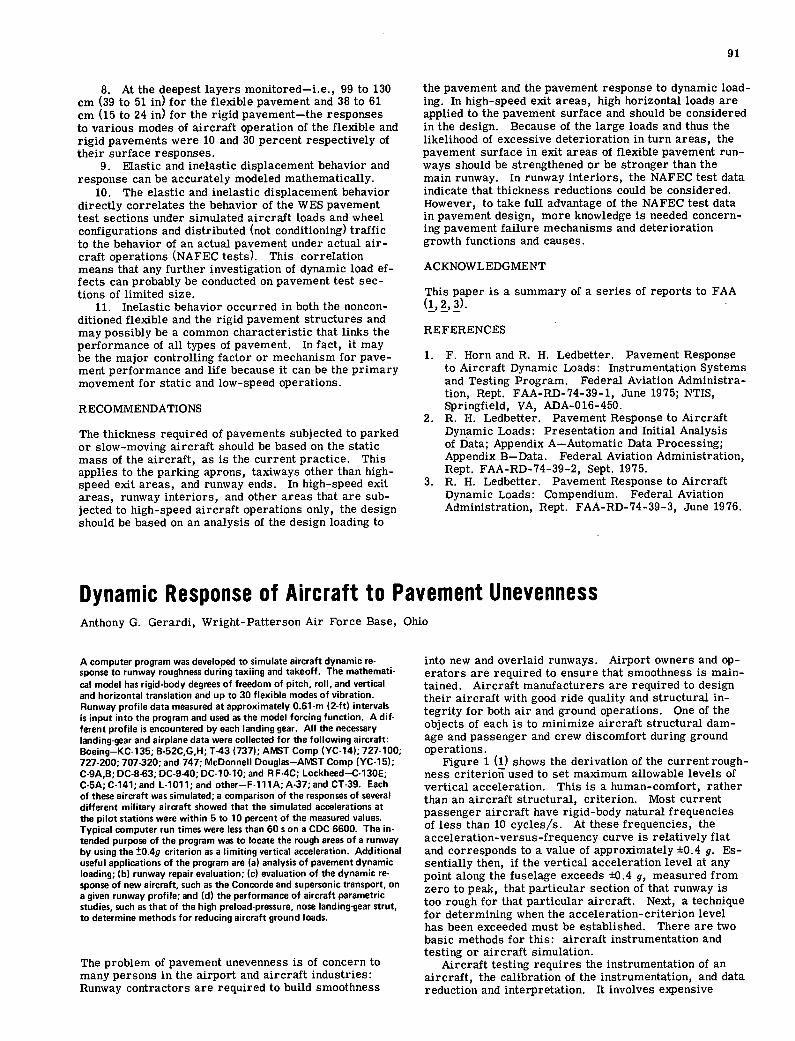
91
At the deepest layers monitored—i.e., 99 to 130 cm (39 to 51 in) for the flexible pavement and 38 to 61 cm (15 to 24 in) for the rigid pavement—the responses to various modes of aircraft operation of the flexible and rigid pavements were 10 and 30 percent respectively of their surface responses.
Elastic and inelastic displacement behavior and response can be accurately modeled mathematically.
The elastic and inelastic displacement behavior directly correlates the behavior of the WES pavement test sections under simulated aircraft loads and wheel configurations and distributed (not conditioning) traffic to the behavior of an actual pavement under actual air-craft operations (NAFEC tests). This correlation means that any further investigation of dynamic load ef-fects can probably be conducted on pavement test sec-tions of limited size.
Inelastic behavior occurred in both the noncon-ditioned flexible and the rigid pavement structures and may possibly be a common characteristic that links the performance of all types of pavement. In fact, it may be the major controlling factor or mechanism for pave-ment performance and life because it can be the primary movement for static and low-speed operations.
RECOMMENDATIONS
The thickness required of pavements subjected to parked or slow-moving aircraft should be based on the static mass of the aircraft, as is the current practice. This applies to the parking aprons, taxiways other than high-speed exit areas, and runway ends. In high-speed exit areas, runway interiors, and other areas that are sub-jected to high-speed aircraft operations only, the design should be based on an analysis of the design loading to
the pavement and the pavement response to dynamic load-ing. In high-speed exit areas, high horizontal loads are applied to the pavement surface and should be considered in the design. Because of the large loads and thus the likelihood of excessive deterioration in turn areas, the pavement surface in exit areas of flexible pavement run-ways should be strengthened or be stronger than the main runway. In runway interiors, the NAFEC test data indicate that thickness reductions could be considered. However, to take full advantage of the NAFEC test data in pavement design, more knowledge is needed concern-ing pavement failure mechanisms and deterioration growth functions and causes.
ACKNOWLEDGMENT
This paper is a summary of a series of reports to FAA (1,2,3).
REFERENCES
F. Horn and R. H. Ledbetter. Pavement Response to Aircraft Dynamic Loads: Instrumentation Systems and Testing Program. Federal Aviation Administra-tion, Rept. FAA-RD-74-39-1, June 1975; NTIS, Springfield, VA, ADA-016-450. R. H. Ledbetter. Pavement Response to Aircraft Dynamic Loads: Presentation and Initial Analysis of Data; Appendix A—Automatic Data Processing; Appendix B—Data. Federal Aviation Administration, Rept. FAA-RD-74-39-2, Sept. 1975. R. H. Ledbetter. Pavement Response to Aircraft Dynamic Loads: Compendium. Federal Aviation Administration, Rept. FAA-RD- 74-39-3, June 1976.
Dynamic Response of Aircraft to Pavement Unevenness Anthony G. Gerardi, Wright- Patterson Air Force Base, Ohio
A computer program was developed to simulate aircraft dynamic re-sponse to runway roughness during taxiing and takeoff. The mathemati-cal model has rigid-body degrees of freedom of pitch, roll, and vertical and horizontal translation and up to 30 flexible modes of vibration. Runway profile data measured at approximately 0.61-rn (2-ft) intervals is input into the program and used as the model forcing function. A dif-ferent profile is encountered by each landing gear. All the necessary landing-gear and airplane data were collected for the following aircraft: Boeing—KC-135; B-52C,G,H; T-43 (737); AMST Comp (YC-14); 727-100; 727-200; 707-320; and 747; McDonnell Douglas—AMST Comp (YC-15); C-9A,13; DC-8-63; DC-9-40; DC-10-10; and RF-4C; Lockheed —C-1 30E; C-5A; C-141; and L-1011; and other—F-1ilA; A-37; and CT-39. Each of these aircraft was simulated; a comparison of the responses of several different military aircraft showed that the simulated accelerations at the pilot stations were within 5 to 10 percent of the measured values. Typical computer run times were less than 60 s on a CDC 6600. The in-tended purpose of the program was to locate the rough areas of a runway by using the ±0.49 criterion as a limiting vertical acceleration. Additional useful applications of the program are (a) analysis of pavement dynamic loading; (b) runway repair evaluation; (c) evaluation of the dynamic re-sponse of new aircraft, such as the Concorde and supersonic transport, on a given runway profile; and (d) the performance of aircraft parametric studies, such as that of the high preload-pressure, nose landing-gear strut, to determine methods for reducing aircraft ground loads.
The problem of pavement unevenness is of concern to many persons in the airport and aircraft industries: Runway contractors are required to build smoothness
into new and overlaid runways. Airport owners and op-erators are required to ensure that smoothness is main-tained. Aircraft manufacturers are required to design their aircraft with good ride quality and structural in-tegrity for both air and ground operations. One of the objects of each is to minimize aircraft structural dam-age and passenger and crew discomfort during ground operations.
Figure 1 (1) shows the derivation of the current rough-ness criterion used to set maximum allowable levels of vertical acceleration. This is a human-comfort, rather than an aircraft structural, criterion. Most current passenger aircraft have rigid-body natural frequencies of less than 10 cycles/s. At these frequencies, the acceleration-versus-frequency curve is relatively flat and corresponds to a value of approximately ±0.4 g. Es-sentially then, if the vertical acceleration level at any point along the fuselage exceeds ±0.4 g, measured from zero to peak, that particular section of that runway is too rough for that particular aircraft. Next, a technique for determining when the acceleration-criterion level has been exceeded must be established. There are two basic methods for this: aircraft instrumentation and testing or aircraft simulation.
Aircraft testing requires the instrumentation of an aircraft, the calibration of the instrumentation, and data reduction and interpretation. It involves expensive

92
equipment and skiUed operators and is time-consuming. Also, when a given runway that is suspected of being ex-cessively rough is being evaluated in this manner, each of the types of aircraft that operate on it must be tested because each type of aircraft will respond differently.
The second method, aircraft simulation, requires detailed aircraft and runway-profile data and mathe-matically simulates an aircraft traversing a runway by using a digital computer.
This paper describes the formulation of one such com-puter program and how it can be used to help solve pavement-unevenness problems.
GENERAL. AIRPLANE AND RUNWAY MODEL
The general mathematical model is represented as an asymmetrical body with a nose and a right and a left main landing gear. Each landing-gear strut is assumed to have point contact with the profile, and it is assumed that each landing gear traverses a different profile. The model has aerodynamic lift and drag and thrust applied at the center of gravity of the aircraft.
The aircraft is free to roll, pitch, plunge, and trans-late horizontally down the runway, and each landing-gear unsprung mass is free to translate vertically. In addition to these rigid-body degrees of freedom, there are up to 30 flexible modes of vibration. This aircraft motion is controlled by the landing-gear strut forces and the lift, drag, thrust, and resisting parameters of aircraft mass and inertia.
The landing-gear struts are nonlinear, single- or double-acting, oleopneumatic energy-absorbing devices (Figure 2) and are represented in the model as the sum of the three forces—pneumatic, hydraulic, and strut bearing friction. The pneumatic force (F,), which is the largest of the three, is given for a single-chambered strut by Equation 1.
FA =PV/[(V/A)-S) (1)
where
P = pressure of fully extended strut, V = volume of fully extended strut, A = pneumatic-piston area, and S = strut stroke.
The hydraulic or damping force (F1) is given by Equa-tion 2.
F,, -PhAtSISV2(CdAO)2 (2)
where
p,, = density of hydraulic fluid, Ah = hydraulic-piston area, A. = effective orifice area (constant orifice minus
metering-pin area), Cd = orifice coefficient (usually 0.9), and S = strut-piston velocity.
The strut bearing-friction force (Fe ) is given by Equa-tion 3.
and
F, = F,X,/(Xb + S) (4)
and
F,=1.0-[X,/(X,,+S)J (5)
where
F. = total wheel-drag force, X0 = strut-piston length, and Yb = minimum bearing separation.
The force F, can be large during landing spin-up or braking. During taxiing, however, it is very small com-pared to the total strut static force for symmetrically loaded struts and, for this reason, is usually neglected in the simulation.
The tire force (F11) is given by Equation 6.
FTI = kT0 (6)
where T. = tire deflection and k = linear tire-spring con-stant.
The runway elevation data (Figure 3) are input into the model in 0.61-m (2-ft) long increments. The profile is made continuous by fitting the following polynomial through three points and the slope at the end of the pre-vious profile segment:
y(x) = a1 + 22 x + a 3x2 + a4x3 (7)
where a1, a2, a3, and a4 = coefficients derived from elevation and slope data. This is done for each of the three lines of runway-profile data.
Rigid-Body Equations of Motion
The differential equations of motion for the mathematical model were derived by Lagrange's method. The general form is given by Equations 8 through 14nd corresponds to the notation shown in Figure 4; i.e., Z, , 0, and X = center-of-gravity vertical, and pitching, rolling, and horizontal accelerations respectively.
+ F,2 +F,3 +L-W)/M0, (8)
(The subscripts 1, 2, and 3 correspond to the nose and right and left main landing gears respectively.)
i. = (F,, - F,, -W,)/M,
= (1712 - F,2 - W2 )/M2
Z3 =(F,3 -F,3 -W3)/M3
0 = (F,A + F,213 + FTD€1 - F,3C)/111
= (170 - F12)C/I,,
X = (FT - FTD - FAD)/(MC,)
where
F,1, F,2, and F,3 = total landing-gear strut forces, FF =(pIF,,I +p IF,I)x S/ISI
(3) F 1, Ff2, and F 3 = tire forces,
M. and W = aircraft mass and deadweight, where
I and It,, = aircraft pitch and roll inertias,
= sliding coefficient of friction (usually 0.1), F and F, = upper and lower bearing forces required
to balance lateral loading,
Wi, W2, and W3 = unsprung landing-gear masses, A, B, C, and € = moment arms,
F1 = thrust, and F10 and F,, = tire and aerodynamic drag forces.

Figure 1. Accepted li military criterion for human tolerance of vertical vibration.
LLO
FQUENCY. HZ
(F1 and FAD act through the center of gravity.)
Flexibility Equations of Motion
The modal analysis technique is used to describe the flexible motion of the aircraft, as shown by Equation 15.
Miqi = + t 3F52 + ti3FS3 - - wM1q1 (for i th mode) (15)
where
Sign Motion
Z Vertical displacement 0 Pitch
Roll q Deflection due to bending X Horizontal iranslation
Convention
+ = up + = nose down + = roll right + = up + = forward
93
M1 = generalized mass; ~11, 12, and t,3 = modal deflections at gear locations
1, 2, and 3; = modal frequency;
C = damping factor; and q1, 4, and j1 = generalized coordinates and their
time derivatives.
The sign convention is as follows:
Figure 4. Asymmetrical 9- PITCH ANGLE, + NOSE DOWN mathematical model.
Z - VERTICAL TRANSLATION, + UP
4-R0LL ANGLE. + RIGHT GEAR DOWN
Figure 2. Single-acting oleopneumatic landing-gear Strut.
DRIFICE
LOWER BEARING AlTERING lUBE
INNER CYLINDER
Figure 3. Runway profile representation.
~TAXI WAY ~LINIS OF MEASUREMENT
RUNWAY
(s) TYPICAL RUNWAY NOT TO SCALEI
RUNWAY SURFACE
DATUM
Noe inC 3.28 ii. IbI TYPICAL RUNWAY ELEVATION PROFILE
ZPMR 909'
CARRVTHROUGH
IUTER CYLINDER
1IFICE SUPPORT TUBE
HYDRAULIC FLUID
UPPER BEARING
ZPN
CML

94
Figure 5. Typical Calcomp-plotted output.
8
BOEING 727-100 146000 POUNDS
0 Cr
0 0
0
0 ccc
L)
a 0
u12rurll_t ,J 6E0 125
0.00 5.00
C C
Iiib 2000 2b25 3250 375 4500 5125 5150 6375 125 125 125 125 125 125 125 125 125
10.00 15.00 20.00 25.00 • 30.00 35.00 40.00 45.00 50.00 • 55.00 TIME (SEC.)
Figure 6. Simulated and 1.00
measured time histories of SIMUTED center-of-gravity
acceleration of C-41 0.00 - -, traversing bump.
SI
.00 DISTANcE2O 40 60 80
SPEED 20 20 20 28 Note: I cot bump wave. 20 It and amplitudes 4in.
0.00 1.00 2.00 3.00 4.00
TIME I SEC I
Solution Technique
The coupled nonlinear differential equations of motion that describe the simulated aircraft were solved by using a three-term Taylor series technique. For example, for the general equation
x= -cx - kx' (16)
the three-term Taylor series representation can be written as
where I = varies between 1 and N. The values of i, i, and x from one step are substituted into Equation 17 and a new value of x is obtained. Then, differentiating Equa-tion 17 gives the velocity fc; i.e.,
= X(1) + X(j)(Lbt) (18)
The values of * and k from the previous equation are substituted into Equation 18 and a new value of * is found. This entire process is repeated with the new values of x and c to obtain the next point in the solution.
RESULTS
The results of the computer program are provided as both a printed output and a time-history plot. The printed output lists the following parameters at time intervals of 0.01 s.
Parameter Description
XMAINL Left main-landing-gear strut deflection (in) XMAINR Right main-landing-gear strut deflection (in) ZPML Left main-landing-gear runway elevation (in) ZPMR Right main-landing-gear runway elevation (in) ZPN Nose-landing-gear runway elevation (in)
X(l*I) = X(1) + X(I)(At) + (I)(At)2 / 2 (17) BETADD Rolling acceleration () (rad/s)

8.0 0 C.) w L0
6.0
bC/in2
2.0
0.0 . 0.3 0.4 0.5 0.6 1.0
12.0
10.0
12.
10.
95
Figure 7. Effect of nose-strut preload pressure: (a) 813.5 kPa and (b) 2068.2 kPa.
Parameter Description
THETADD Pitching acceleration (ë) (rad/s2) BETA Roll angle (0) (rad) THETA Pitch angle (0) (rad) SPEED Aircraft velocity (ft/s) DISTANCE Distance traveled down runway (ft) TIME Real time (s) CGACC Center-of-gravity vertical acceleration (g) PSA Pilot's station vertical acceleration (g)
(This model was designed for U.S. customary units only; therefore, values in Figure 5 and the following discussion are not given in SI units.)
Figure 5 shows a reduction of a typical Calcomp-plotted time history that depicts a Boeing 727-100 taxiing at 125 ft/s over the runway 36 profile at Washington Na-tional Airport. The plotted output includes titles showing the airplane simulated, its gross mass, the runway num-ber, and its location. The abscissa is the time axis an-notated every second. At every time annotation, the cur-rent value of the aircraft speed and the current aircraft position on the runway are printed out. The runway markers are also plotted on the time scale to aid in air-craft positioning. In this figure, the nose-gear track is a time history of the runway profile as it is encountered by the nose gear of the aircraft. The actual runway profile is preceded by 100 ft of smooth surface to allow any model transients to damp out before encountering the actual profile. There are two aircraft-acceleration time histories—that at the pilot's station (PSA) and that at the center of gravity (CGA) of the aircraft. Each time his-tory is banded by the human tolerance criterion of ±0.4g. To minimize the amount of core required to store the acceleration time histories, the higher frequency com-ponents were effectively filtered out by limiting the sampling interval. All of the acceleration peaks, how-ever, are shown. The PSA time history is not always within the band of the accepted human-tolerance criteria. Thus, the plot is useful in that it provides a graphical record of the level of acceleration and shows which bumps in the runway profile caused the high acceleration response.
The following comparisons of simulated to measured response were made with four different aircraft. (In these simulations, a computer program was used that differed from the one described above in that it did not
have a roll degree of freedom and used only one set of runway profile data.)
The simulated response of a 273 000-lb KC-135 aircraft taking off from runway 05 at Torrejon Air Force Base in Spain easily identified the rough section of the runway.
The simulated response of a B-52 heavy (400 000-lb) bomber at a constant 40-knot taxi speed on runway 18 at U-TAPAO Air Force Base in Thailand identified the rough section of the runway; the peak acceleration levels were within 6 percent of the measured levels.
The simulated response of a 37 636-lb F-4C air-craft operating at a constant 29-knot taxi speed over a bomb repair patch 4.6 m (15.5 ft) long and having a max-imum amplitude of .3.8 cm (1.5 in) at Wright- Patterson Air Force Base in Ohio had peak acceleration levels at the center of gravity of the aircraft that were within 9 percent of the measured levels.
The simulated response of a 304 000-lb C-141 aircraft operating at a constant 12-knot taxi speed had peak acceleration levels that were within 11 percent of the measured levels; this is shown in Figure 6.
For most cases, the simpler program is sufficient for simulating an aircraft operating from paved surfaces. However, the advent of the advanced medium STOL transport (AMST), where operations from rough or totally unprepared fields are required, made it neces-sary to add the roll degree of freedom and use the three sets of runway profile data.
Comparisons of the improved version of the computer program with measured data have not yet been made, but it is expected that the added sophistication of the program will improve its accuracy.
The detailed airplane data required to accurately de-scribe the aircraft being simulated are summarized below:
General airplane data—thrust, weight, inertia, center of gravity, and landing-gear locations;
Airplane flexibility data— generalized mass and frequencies and modal deflections at each gear, the cen-ter of gravity, the tail, and the pilot's station; and
Landing-gear data—weight of unsprung mass, strut and tire pressures, piston areas, strut volumes and strokes, and detailed description of fluid metering device.
These data have been collected and simulations have been made for the following aircraft:
Boeing McDonnell Douglas Lockheed Other
KC-135 AMSTComp (YC-15) C-130E F-lilA B-52C,G,H C.9A.B C-5A A-37 1-43 (737) DC-8-63 C.141 CT-39 AMSTC0mp )YC-14) DC-9-40 L-1011 B-i 727-100 DC-10-10 727-200 RF-4C 707-320 747
The final information required for the simulation is the three lines of runway profile data. An elevation point is required every 0.61 m (2 ft) for each line of sur-vey. The Air Force Weapons Laboratory has developed and is using a device known as a laser profilometer that measures runway profiles quickly and accurately and in a form compatible with the computer simulation re-quirements.

96
CONCLUSIONS
A computer program has been developed that can analyt-ically determine whether the dynamic response of an air-craft to a given runway profile exceeds the established roughness criteria of 0.4g and locate these rough areas on the runway.
Use: The program is general and will simulate most current commercial and military aircraft. The necessary data have already been assembled for many of these aircraft.
Efficiency: A C-9A takeoff simulation requires 70 s of central processing unit time on a CDC 6600 digi-tal computer. This is just 30 s over real time and a number that is typical for all simulations.
Loads incurred on pavement: It would be easy to plot time histories of pavement loading rather than of aircraft vertical accelerations.
Aircraft parametric studies: The program can be used to perform parametric studies on aircraft to de-termine methods of reducing ground loads by modifica-tion of the aircraft.
One good example of a parametric study is the soft
nose strut study, which found that by increasing the strut preload pressure of the nose landing gear, the vertical acceleration levels at the pilot's station were reduced significantly. This idea was tested with a Boeing 727-100 at Oklahoma City. The peak acceleration at the pilot's station was cut from 2g peak to peak to 1g.
Figure 7 shows a histogram of the data from the taxi runs made at Oklahoma City; the overall aircraft re-sponse was significantly reduced throughout the entire test.
Accuracy: The comparison of the computed to the measured peak-vertical-acceleration levels was very good for all aircraft.
In addition to the identification of rough areas on runways, the program has other potential uses: i.e., runway repair evaluation—the program can be used to determine the minimum amount of repair required to bring the runway to acceptable standards from an aircraft-response standpoint—and prediction of response of other aircraft—the program can be used to predict the dynamic response of aircraft that will operate from a given runway in the future (e.g., a runway that is mar-ginal for a Boeing 727 or a DC-8 may be unacceptable for the Concorde or a supersonic transport).
Abridgment
Analysis of Airport Runway Roughness Criteria Paul N. Sonnenburg, Civil Engineering Research Facility, University of
New Mexico
In this work, attention is focused on runway surface roughness and its effect on aircraft vibrational responses that, in turn, affect passenger comfort. The basic prob-lem is to develop a method for determining quantitatively when and precisely where a runway is too rough. The object is to be able to provide airport operators with sufficiently detailed information for the authorization of adequate repairs at minimum costs.
RECOMMENDED PROCEDURE
The recommended procedure is that a statistical analysis of profile data be used to establish a roughness criterion. This implies that aircraft -vibration- response data need not be considered in establishing roughness criteria, even though these data can provide supporting evidence of the degree of roughness. Hence, the aircraft itself is not a factor in the recommended approach. The statis-tical analysis of prof ile-elevation data is possible if the data are filtered to remove the elevation trends that are formed by long wavelengths. A profile can then be rated according to its overall and its detailed roughness prop-erties. The standard deviation of displacement () is recommended as an overall index, and the standard de-viations of the slopes and the slope changes might be considered as detailed indexes (extremai analysis). The detailed roughness properties are necessary because a profile may be generally smooth, yet have a few severe bumps. The statistical approach discussed here ad-dresses only the determination of the standard deviation of displacement as an overall index; additional work is recommended. Finally, when all known indexes are ex-tracted from the profile data, each should be correlated with subjective pilot ratings, and those showing the strongest agreement should be emphasized.
APPROACHES
The first indications of runway surface roughness are often verbal complaints by pilots. For this reason, the first roughness criterion investigated was human vibra-tion. Human-response curves indicate that a peak vibration- acceleration level of about 0.4g from about 2.0 to 20.0 Hz can be tolerated for at least 5 mm, with a broad band of statistical scatter about this level. There are some theoretical and experimental data that show a few isolated peaks that reach or exceed 0.49 on runways claimed to be rough by pilots. However, the existence of peaks only implies intermittent, rather than continu-ous, exposure, and it was therefore concluded that other sources of human-response data would be needed to es-tablish a criterion.
In a second effort, an absorbed-power approach was investigated. A human can absorb 6 W of vibrational power for extended periods of time (1 or more mm). However, for taxiing aircraft, the absorbed power ex-ceeds 6 W for one or two approximately 5-s intervals during an entire run and, again, this occurs occasionally rather than continuously. Furthermore, the peak power is a function of the time interval over which the power is averaged. For example, if a 20-W peak for 1 s is averaged over 1 mm, the resulting power level is neg-ligible so that a rationale for establishing a power-averaging approach does not exist. The absorbed-power approach is more useful in locating rough regions than is the 0.4 g approach, but it still cannot be used to locate rough points precisely.
The third approach, using human criteria, was sug-gested by data from the Aerospace Medical Research Laboratory (AIVmL) at Wright- Patterson Air Force Base, Ohio. These data were in disagreement with the absorbed-power results, and the 0.4 g criterion was con-

97
sidered obsolete. The vibrational levels observed in taxiing aircraft are well below the comfort levels shown in the AIVIRL criteria, and conservative results are in-dicated. However, there is no other information avaiL-able about human response to shock or psychologically alarming effects at such low levels of vibration.
The effects of runway roughness on aircraft struc-tural fatigue and avionics failure were investigated briefly. However, criteria based on these subjects, in addition to human response, rely on aircraft vibration response. The use of aircraft response as a primary tool for establishing roughness criteria is subject to question, since it is an indirect approach to the problem. Thus, the more direct approach of analyzing the profiles rather than the responses was pursued.
RESULTS
The overall displacement roughnesses of 21 available profiles are given below (i mm = 0.039 in).
Airport
Runway o(mm)
Clovis, New Mexico 03 2.8994 Palmdale, California 07 3.1316 Dallas-Ft. Worth 17R 3.6947 Duties International, Virginia 01 3.821 9 Edwards Air Force Base, California 04 4.0505 Grand Forks, North Dakota 35 4.2774 Chicago-O'Hare 32L 4.4293 Chicago-O'Hare 27L 5.4300 Oklahoma City TE 5.6459 Charleston, South Carolina 15 6.6304 Oklahoma City 12 6.7536 Albuquerque 17 6.951 5 Baltimore-Washington International 28 7.0670 Newark, New Jersey 22L 7.2327 Offutt Air Force Base, Omaha, Nebraska 12 7.4102 Chicago-O'Hare 22L 7.4148 John F. Kennedy, New York 13R 7.6741 Buffalo 05 9.2187 Washington National 18 9.4602 Albany 19 11.2725 Thule 16 13.4000
Avg. 7.0820
The following general conclusions and observations have been made.
Runway 03 at Clovis is the smoothest runway. Runway 16 at Thule is the roughest runway. Runway 28 at Baltimore-Washington represents
the average runway. Although runway TE at Oklahoma City has an
above average overall index, there is one severe bump that is probably in need of local repair, but only a sta-tistical analysis can determine this quantitatively.
SUMMARY OF CONCLUSIONS AND RECOMMENDATIONS
Runway-roughness-ratihg methods based on aircraft-response properties are not recommended. These methods consider structural, component, or human-failure mechanisms and cannot be correlated precisely with local bumps that need repair. Knowledge of aircraft responses can be useful for evaluating the effectiveness of a repair plan, but cannot be used in constructing the repair plan. The response data can also be analyzed statistically to obtain information about amplitude and frequency content for studying aircraft vibration. The collection of such data is recommended, but not as the primary information on which to base a repair plan.
The statistical analysis of filtered profile data is recommended as a direct method of assessing runway profile roughness. The approach described here is only a beginning, as only the displacement standard deviation has been extracted as a primary index of roughness. The overall properties should be expanded to consider slope and slope-change information, and these properties are only hail of the necessary criteria; the statistical analy-sis of the peaks will be necessary before the information is complete. Finally, the statistical information must be correlated with subjective pilot ratings.
Nondestructive Testing of Airport Pavements James W. Hall, Jr., U.S. Army Engineer Waterways Experiment Station,
Viçksburg, Mississippi
A study of nondestructive testing techniques for the evaluation of airport pavements is summarized. The report includes (a) the selection and prep-aration of specifications for nondestructive testing of airport pavement systems, (b) the development of a methodology for evaluating the load-carrying capacity of airport pavement systems by using the equipment selected, (c) the development of an evaluation procedure based on this methodology, and (d) the development of a mathematical model that describes pavement response to dynamic loading.
The current methods for evaluating the load-carrying capacity of airport pavements require direct sampling techniques that are both costly and time-consuming. Often, these methods require the closing of the pavement fadllity to traffic operations, which necessitates the re-routing or rescheduling or both of aircraft. With the number of traffic operations increasing rapidly, even. the brief closing of a pavement facility can result in in-convenience to the traveler and higher costs to the air carrier. Also, the increasing gross masses and in-
creasing numbers of operations of aircraft make the need for accurate and frequent evaluations of pavement systems extremely important to the airport owner be-cause many facilities will need strengthening or rehabil-itation to meet these increased demands. Given these considerations, the need for a procedure that permits rapid evaluation with a minimum of disturbance to nor-mal traffic operations is evident. The use of nonde-structive testing techniques to determine the pertinent characteristics of pavement systems offers the best promise of serving this need.
PURPOSES
The purposes of this study were to
1. Select and prepare specifications for equipment to be used for nondestructive testing of airport pavement systems,

2 0
0.002
z 0
98
Figurel. DSM curve and calculation.
LOAD, RN
0 8.89 1.79 26.68 3556 44.48 53.37 62.27 7117
0.254
f 0.191
. 0.316
19MAR73
FACILITY: HOUSTON
TEST NO.: 127. DO
- 15
LOCATION: RWY 8-26 PROFILE
STATION: 102 +82.5 12.5 I3.81m1 N I TYPE PAVEMENT: PCC THICKNESS:
75 - OSM = 4550 l(IPS/IN. 796.6 KN/mml
TEMPERATURE: - REMARKS:
- -
5
KIPS(O.80 kN)
/ 77.82 KIPS (52.58 kN)
:
0.0026.066
0.063
8 10 12 14
16 LOAD, KIPS
Figure 2. WES nondestructive testing equipment.
VIBRATOR INSTRUMENT
Develop a methodology for evaluating the load-carrying capacity of airport pavement systems by using the selected equipment,
Develop an evaluation procedure based on this methodology, and
Develop a mathematical model that describes pavement response to dynamic loading.
SCOPE
Various types of nondestructive testing equipment were studied through comparison tests on a wide range of pavement systems. The features evaluated included vi-brator static masses, peak vibratory loads, methods of application of the vibratory load to the pavement (types and sizes of load plates), frequencies of loading, and mobility and ease of operation.
The tests were performed at nine airports and on test sections at the U.S. Army Engineer Waterways Experi-ment Station (WES). The data collected by nondestruc-tive methods included dynamic stiffness modulus (DSM) values, deflections for frequency sweeps from 5 to 100 Hz, deflection-basin measurements, and wave propaga-tion. (The DSM is the inverse of the slope of a load-versus-deflection curve. An example curve and calcu-lation is shown in Figure 1.) The data collected by the direct sampling tests included the thicknesses of all layers of the materials composing the pavement sections, foundation strength values [California bearing ratios or
modulus of subgrade reaction (k) values], concrete flex-ural strengths, and material classifications. The en-vironmental factors considered included temperature and frost effects. Both rigid and flexible pavements were studied.
SUMMARY OF WORK ACCOMPLISHED
Selection of Equipment
Five vibratory testing devices were evaluated: the WES 71-kN (16 000-lbf) vibrator (Figure 2), the Civil Engi-neering Research Facility nondestructive pavement test van, the WES 40-kN (9000-lbf) vibrator, the Dynaflect, and the model 505 Road Rater. The results of the com-parison tests were plotted in the form of DSMs obtained with the WES 71-kN vibrator versus DSMs obtained with each of the others, and the standard error of estimate was computed for each plot.
The effects of the vibrator static mass on the load-deflection measurements were studied by using a WES variable static-mass 222-kN (50 000-lbf) vibrator. Data taken on four different pavement items showed that the DSM increased significantly as the static mass applied to the pavement increased.
The effects of the vibrator dynamic load on the load-deflection measurements were studied with the WES 71-kN vibrator. Generally, the load -versus -deflection plots obtained with this equipment tended to curve at the lower force levels and become linear at the higher force levels [44.5 to 67 kN (10 000 to 15 000 lbf)], especially on weak flexible pavements.
The tests with the 71-kN vibrator also showed that the deflection responses of rigid and flexible pavements var-ied appreciably with changes in frequency. Earlier studies by WES had indicated that 15 Hz is the optimum frequency for deflection tests because the variations of the stress and deflection measurements with depth are greater at 15 Hz than at any other frequency within the capability of the vibrator.
Tests with the WES 71-kN vibrator using 30.5-, 45.7-, and 76-cm (12-, 18-, and 30-in) diameter load plates on

99
flexible pavement test sections showed that the effect of changes in load-plate diameter onDSM values is signifi-cant.
Accuracy and reproducibility tests with the WES 71-kN vibrator indicated that it is a reliable measuring device.
Development of Methodology
Tests for the development of the evaluation methodology were conducted at the following facilities: (a) National Aviation Facilities Experimental Center, Atlantic City, New Jersey; (b) Houston Intercontinental Airport; (c) Baltimore-Washington International Airport; (d) Greater Wilmington Airport, Wilmington, Delaware; (e) Phila-delphia International Airport; (f) Jackson Municipal Air-port, Jackson, Mississippi; (g) Nashville Metropolitan Airport; (h) Weir-Cook Municipal Airport, Indianapolis; and (i) WES. The pavements were characterized by direct-sampling techniques and conventional testing methods alter the nondestructive tests had been per-formed.
The effects of temperature on DSM measurements of flexible pavements were observed on a temperature test section constructed at WES, and temperature-adjustment-factor curves that allow adjustment of the DSM values to a constant mean temperature of 21°C (70°F) were de-veloped.
The effects of freeze-thaw cycles on DSM measure-ments were observed at Truax Field in Madison, Wis-consin. Core holes were drilled at test sites to deter-mine pavement thicknesses and pavement and subgrade materials, and a graph of DSM values versus time was developed that showed an increase in deflection alter the beginning of thaw. However, the development of a cor-rection factor to reduce loads as determined by evalua-tion when pavements are not affected by thaw was ham-pered by the complicated testing conditions and the poor dralnage properties of the subgrade materials.
The tests on rigid pavements showed that their DSM values could vary significantly from slab edges to cen-ters. Therefore, the DSM tests were performed at slab centers to obtain consistent results. Variations in DSM values on trafficked and untrafficked areas of flexible pavements indicated that tests on these pavements also should be carefully located to accurately reflect the con-dition of the area to be evaluated.
The basic elements of the nondestructive evaluation methodology are described below:
Flexible pavements: The nondestructive evaluation procedure for flexible pavements uses a measurement of the rigidity of the total pavement system (the DSM) and does not consider the individual parameters that affect pavement response. The methodology is based on es-tablishing correlations between the DSM and an allowable single-wheel load. These correlations were developed for a single wheel having a tire-contact area of 0.164 m 2 (254 in2), 1200 annual aircraft departures, and a 20-year life. After the DSM versus allowable -single -wheel-load relation was developed, the methodology was based on existing interrelations among pavement thickness, load, load repetitions, soil strength, and landing-gear characteristics.
Rigid pavements: As for flexible pavements, the nondestructive evaluation procedure for rigid pavements uses a measurement of the overall rigidity of the total pavement system (the DSM). The DSM of a rigid pave-ment is a function of the pavement thickness and the con-crete and foundation load -deformation characteristics. Again, the methodology is based on a correlation of DSM with an allowable single-wheel load. The relation be-tween the single-wheel load and gears of different geom-
etries is based on the equivalency of maximum bending stress in the concrete slab.
Nondestructive Evaluation Procedure
Determinations of allowable multiple-wheel aircraft loads using DSM values require that the pavement thick-ness (t) be known for flexible pavements and that a foundation-strength factor (FF ) and the pavement thick-ness (h) be known for rigid pavements. These parame-ters can be determined from the information given in construction drawings or from tests in small core holes. Only one core hole is necessary for determining the pa-rameter for a feature that has uniform properties. Pavements that contain chemically or bituminous-stabilized layers can be evaluated by using equivalency factors that convert the thicknesses of stabilized pave-ments to thicknesses of conventional pavement sections.
Because of the ease with which the measurements are made, at least 30 DSM values should be determined in each paved area. A representative DSM value for each area is the arithmetic mean of the DSMs measured for the area minus one standard deviation.
A correction for the effects of freeze-thaw cycles on DSM data has not been developed, and so DSM measure-ments should not be made when pavements are frozen. A correction for temperature effects on flexible pave-ments, however, has been developed. Mean pavement temperatures for use in calculating the correction can be determined by measuring the pavement temperatures at points 2.5 cm (1 in) below the surface, 2.5 cm above the bottom of the surfacing layer, and midway between and taking the mean of the three readins.
The data used in developing the correlations of DSM and gross aircraft mass were collected from areas of pavements that were free of surface defects. Therefore, data collected for evaluation purposes should also be from areas in good condition. For a pavement where defects exist, the allowable load should be reduced by a judgment factor.
Mathematical Model
A mathematical model was developed based on nonlinear oscillator theory of the response of pavements subjected to dynamic loading. In this model, the dynamic stiffness is described by the following characteristics: dynamic load, static load, frequency, load-plate radius, and elas-tic modulus of each pavement layer. The elastic restor-ing force of the pavement is described by linear, cubic, and fifth-order terms in the displacement of the surface, so that three basic parameters are required by the model. These three parameters are determined from the dynamic load-deflection characteristics. The model uses a finite depth of influence that depends on the static load and the area of contact of the vibrator load plate with the pavement surface. The nonlinear behavior of the dynamic load-deflection curves is due to the finite depth of influence. With increasing load-plate sizes, the depth of influence increases and passes through the successive pavement layers.
SUMMARY OF FINDINGS AND CONCLUSIONS
A nondestructive evaluation procedure for flexible and rigid airport pavements and equipment specifications for a nondestructive testing device were developed. It was concluded that additional studies are warranted of vibra-tors, deflection measurements on composite pavements, theoretical relations between vibrator data and allowable loads, relations between deflection data and the proper-

100
ties of rigid pavement slabs, relations between deflection data and temperature, wave-velocity techniques for the determination of elastic properties, relations between deflection data and pavement performance, and effects of pavement overlays on vibrator results.
The mathematical model describing the nonlinear re-sponse of pavements can be used to predict the dynamic stiffness of a pavement given the loading conditions on the pavement directly under an aircraft wheel, to cor-relate the different values of dynamic stiffness measured by different vibrators at the same pavement location, and to predict the thickness and elastic moduli of each pavement layer in terms of the measured values of the dynamic stiffness for a series of load-plate sizes.
ACKNOWLEDGMENT
This paper is a summary of material prepared for the
Federal Aviation Administration (1, 2, 3).
REFERENCES
J. L. Green and J. W. Hall, Jr. Nondestructive Vibratory Testing of Airport Pavements: Experi-mental Test Results and Development of Evaluation Methodology and Procedures. Federal Aviation Ad-ministration, Rept. FAA-RD-73-205-1, Sept. 1975. R. A. Weiss. Nondestructive Vibratory Testing of Airport Pavements: Theoretical Study of the Dy-namic Stiffness and Its Application to the Nondestruc-tive Method of Testing Pavement. Federal Aviation Administration, Rept. FAA-RD- 73-205-2, April 1975; NTIS, Springfield, VA, ADA-013-681. Nondestructive Testing Evaluation of Airport Pave-ments. Federal Aviation Administration, Bull. FAA-74-1, Sept. 1974.
Abridgment
Nondestructive Testing: Frequency Sweep Nai C. Yang, Consultant, Katonah, New York
A nondestructive testing (NDT) system was used to de-termine the physical conditions of existing pavement systems. The characteristics of the test were a static load of 71 kN (16 000 lbf) superimposed with a constant sinusoidal dynamic load and frequencies ranging from 5 to 80 Hz (the frequency sweep). For testing, a dynamic load of 17.8 to 53.4 kN (4000 to 12 000 lbf) could be se-lected. Each such test requires approximately 10 mm and costs approximately $30 (a conventional plate-bearing test requires approximately 1.5 d and costs ap-proximately $1500). The nondestructive nature and the rapidity of NDT minimize interference by the testing to aircraft operations, provide a better indication of the variations in the pavement support condition, and reduce the cost of testing.
The NDT procedures were standardized, the data were analyzed, and the results were used in pavement evalu-ation and functional design. Three subsystems in a
computer system are used for the analysis, evaluation, and design. In the first subsystem, aircraft response is related to pavement smoothness, and the capacity of a pavement to withstand repeated aircraft loading is re-lated to the user's requirements and demand forecast and to the need for maintenance. In the second subsys-tem, the required pavement thicknesses and composition are determined that meet the current and future require-ments. In the third subsystem, the cost/benefit aspects of alternative pavement designs are evaluated to provide airport operators with realistic criteria for planning fu-ture pavement needs.
Before final adoption of the entire system of frequency-sweep NDT and its associated pavement eval-uation and functional design procedures, a recommenda-tion is made to conduct a validation program at four air-ports.
ondestructive Testing of Flexible Pavements y Using Prototype Loads
A major problem confronting persons concerned with the operation of airport pavements is that of evaluating ex-isting systems. The requirements imposed by the rapid advance of air transportation and aircraft developments have outstripped evaluation techniques borrowed from highway engineers. The policy of closing traffic lanes to permit repairs on highways may have significant con-sequences when transferred to even a single runway of a major airport. The rate and magnitude of loadings imposed on airport pavements today have markedly in-creased failures and the consequent, closing of runways (1) for repairs.
Technology must provide the hardware and method-ology for evaluating existing pavements, for forecasting
future situations and requirements, and for directing remedial measures. Operational restrictions require that procedures be developed that reduce to a minimum the closing of runways and their appurtenances, which thus precludes the use of destructive testing techniques such as test pits. Of additional importance is that de-structive techniques are necessarily confined to rela-tively small areas of pavements, so that at best, they can provide diagnostics of only limited sample points and these at considerable cost and time.
The volume changes that can occur in response to am-bient conditions can cause pavement surfaces to curl and warp. Hence, portions of the surface may not be in con-tact with the underlying mate:ial when subjected to im-

Figure 1. LED beam.
.r).
Figure 2. Mobile EDGE OF
deflection measuring WHEEL. I 8Mrnmum
device.
I _1 INITIAL_PAVEMENT SURFACE
/77777 EFL ?AE4T SURFACE
101
COUNT ER-WEIGHT
TO POWER AND RECORDING
LED MODULE
DETECTOR
AM
Dr
T?AL PAVEMENT RFACE
PLC.II
PLECTED VEMENI.
SURFACE
LVDT DETAIL
LENS- \ / 0 7( INITiAL V / PAVEMEN_J \ / DEFLECTED PA YE/lENT SURFACE SURFA CE
Note: 1 m3.3f1. LED DETAIL
Figure 3. LVDT beam and P-2 fire truck.
p
- -'-
posed aircraft loadings. Consequently, any apparatus used to evaluate a pavement system should not alter the conditions prevailing before loading. The devices in use today, such as the Benkelman beam and vibrators, all suffer from this limitation. Briefly, the test procedure for the Benkelman beam involves positioning the beam next to a stationary load vehicle and then measuring the rebound of the pavement as the vehicle moves away. Vi-brators, of necessity, must seat the pavement before in-troducing safety-state vibrations, and the nature of their loading (magnitude and frequency) has little resemblance to the transient input of actual aircraft. Although Ben-kelman beams treat vehicular loads, they monitor only residual deflections after the pavement surface has been seated and for vehicles at creep speeds.
Needless to say, to gain widespread acceptance and use, new hardware must be (a) inexpensive; (b) operable with minimal (or no) training on the part of the user; (c) lightweight, self-contained, and mobile; and (d) able to ac-commodate the vehicles (or aircraft) on hand at facilities.

102
DISCUSSION OF RESEARCH
In November 1970, a research project at the School of Civil Engineering at Purdue University was begun that sought to exploit the concept of transfer functions to pre-dict pavement deflections caused by moving aircraft, and in October 1971, it was extended to the examination of the time-dependent relations between the energy imparted to a pavement by aircraft and the condition of the pave-ment system. The field investigations were conducted at Kirtland Air Force Base, Albuquerque. Time-dependent deflection-response functions were measured with specially designed deflection gauges using linear variable differential transformer (LVDT) displacement transducers. The overall system was designed to simul-taneously monitor the vertical movement of a pavement at six different locations on a line normal to an aircraft's path. The prototype investigations were conducted at three different cross sections. Four prime movers were used at each test site—the C-135, C-131, and C-130 military aircraft and a specially designed (F-4) load cart. The following results were obtained:
The state of the art was advanced by the develop-ment and field verification of a procedure using transfer functions by which the surface deflections of a pavement after the passage of a vehicle at a particular site can be predicted from a knowledge of the response of the pave-ment at that location to a different vehicle (2).
By using energy methods and the transfer func-tions developed, a measure was obtained of the work done to the pavement by the passage of a stream of ve-hicles. Procedures were developed for the estimation of the amount of useful life still available to the system and of the remedial measures, such as overlays, that should be taken (3).
It was concluded that the use of transfer functions offers a new and reliable approach to the solution of pave-ment problems that incorporates a far greater degree of versatility to the description of component materials than does current practice. Rather than determining point-wise attributes and making subsequent assumptions of homogeneity and isotropy as required in the classical theories, transfer -function concepts have a global ap-proach to the response of pavement materials to actual aircraft loadings.
The analyses indicated that there is a threshold cumulative total peak deflection at which distress de-velops in asphalt concrete pavements and that it is not unreasonable to assume that the condition of a pavement can be correlated with the deflection that it has under-gone. The field testing provided insight into the effect of the thickness of overlays on the energy imparted to a pavement and has led to the development of a procedure for the determination of the thickness of an overlay so that the pavement will perform satisfactorily under an anticipated traffic volume.
After the concepts of transfer functions and an energy-related distress criterion had been verified at the three LVDT installations, the next phase of the research was directed toward developing a breadboard model on a mobile pavement-deflection measuring system. This type of system obviates the need for the installation of difficult and expensive built-in LVDTs. In addition, it extends the evaluation to an entire runway-taxiway (global) system from the single transverse line of em-bedded gauges (local). The concept of the measuring system was to move the length of the pavement and in transit compile the inherent transfer functions and their characteristics. A secondary object was to provide the capability of rapidly defining the time history of the
loaded pavement under moving aircraft. The develop-ment of the equipment for measuring the pavement de-flection was based on a study of runway-deformation contouring by using holographic techniques. The devel-opment of the mobile device was based on the observa-tion that a point on the surface of a pavement 1.8 m (6 ft) lateral from the edge of an aircraft wheel showed no measurable deflection. Consequently, attention was di-rected toward the construction of a cantilever beam that would span this distance and provide a horizontal datum from which vertical deflections could be measured. The following procedures were used:
A beam was constructed that uses light-emitting diodes (LED) to reflect coherent light from the pavement onto detectors (Figure 1). Then as the pavement de-flects, the reflected light will register differently on the detector (as shown in Figure 2). The calibration of the beam provides a scale that relates the differences ob-tained on the detector to the vertical displacements. No physical contact is required between the beam and the pavement at points of measurement. The data were stored on a magnetic tape recording system.
Early difficulties with the electronics of the LED system prompted the development of a secondary (fail-safe) device. This consisted of a cantilever beam sim-ilar to the LED beam, but with a series of LVDTs spaced at regular intervals along its length, whose plungers made contact with the surface of the pavement (Figure 3). Unlike the LED beam, the deflection measurements were displayed immediately on a light-beam recorder. The LVDT beam made physical contact with the pavement, but proved to be a rapid and extremely reliable device.
The capability of the LED beam to provide re-liable quantitative output was verified in laboratory and field tests. Because of a malfunction of the magnetic tape recorder, the output from the LED beam had to be obtained by using the light-beam recorder. The results conformed to the patterns obtained by using the LVDT beam and with those registered at the LVDT gauges.
In March 1976, the LED beam was mounted on an F-4 load cart, and the pavement deflections were mea-sured. This is the first measurement of pavement de-flections under a moving load, obtained by a vehicle that both applied the load and transported the measuring de-vice. In addition, the beam did not make contact with the pavement.
After these tests, the magnetic tape recorder was repaired, and preparations were made for obtaining the time history of the loaded profile of a pavement under a moving aircraft loading. This was accomplished in June 1976. The LED beam was mounted on the F-4 load cart, and deflection measurements were obtained for more than 605 m (2000 ft) of taxiway and 2000 m (1.25 miles) of runway—all in less than 3 h (including the time taken because of damage to a gauge that then required extra calibrations).
SUMMARY AND CONCLUSION
5Abreadboardndél of a nondestructive, noncontact; (rapid, mobile, global device for measuring the response
of pavements to moving aircraft has been developedând tested under field conditions. - --
ACKNOWLEDGMENT
This research was undertaken by the School of Civil Engineering at Purdue University under contract with the Civil Engineering Research Division of the U.S. Air Force Weapons Laboratory. The LED beam was con-

103
structed by Science Applications, Incorporated, Albuquerque.
REFERENCES
1. C. L. Blake. FAA Role in Pavement Evaluation. Paper presented at Symposium on Nondestructive Test and Evaluation of Airport Pavement, May 1976.
R. E. Boyer and M. E. Harr. Predicting Pavement Performance. Proc., ASCE, Transportation Engi-neering Journal, Vol. 100, No. TE2, May 1974, pp. 43 1-442. W. H. Highter and M. E. Harr. Cumulative Deflec-tion and Pavement Performance. Proc., ASCE, Transportation Engineering Journal, Vol.. 101, No. TE3, Aug. 1975, pp. 537-552.
Abridgment
Pavement Evaluation With the Falling-Weight Deflectometer W. Visser, Koninklijke/Shell Laboratorium, Amsterdam
The falling-weight deflectometer (FWD) is a reliable, simple, and yet effective tool to determine the struc-tural properties of pavements for roads and runways. Its characteristics of level of force (up to 60 kN) and loading time (approximately 30 ms) are more represen-tative of heavy traffic than are those of most other de-flection equipment. The deflection of the pavement and the deflection bowl are determined by geophones (velocity transducers) in the center of the loaded area and at cer-tain distances from the center. The deflection levels are not affected adversely by the configuration of loading or the recording system, nor by possible influences of unstable reference points such as are encountered with some alternative systems.
A comprehensive description of the method has been published elsewhere (1). The principles are as follows:
The pavement structure is represented by a multi-layer linear elastic system in which the materials are homogeneous and isotropic and are characterized by Young's modulus of elasticity (E) and Poisson's ratio W. In most cases, the structure can be regarded as a three-layer system (Figure 1) consisting of a bound top layer (E1, .i, and thickness h1), an unbound or cemented base layer (E2, v2, and h2), and a subgrade (E3, V3, and infinite thickness). To simplify the system, fixed values are adopted for v for all layers. The test load is as-sumed to be uniformly distributed over one or more cir-cular areas.
The response of the pavement to a test load is char-acterized by the maximum deflection and the shape of the deflection bowl. The latter parameter is characterized by the ratio (Q) of the deflection at a distance r from the load () to the deflection under the center of the test load
(on); i.e., Q, = The ratio Qr was chosen rather than the radius of curvature because Q, can be measured more easily with existing equipment and provides equivalent in-formation. The distance r can be fixed depending on the type of structure and is preferably such that Q, is ap-proximately 0.5 (2).
By using the BISAR program, graphs have been pre-pared giving the relations among E1, 60, Q, and h1 for predetermined values of E2, h2, E3, and r for a given test load. From such graphs, with 50 and Q, measured, two unknown structural parameters of the pavement can be determined if the other variables are known or can be estimated.
The pulse load is applied by a mass falling onto a set of springs that are mounted on a rigid circular plate resting on the pavement surface. Extensive tests with a prototype have shown the suitability of the method for determining the shape of the deflection bowl (1).
For routine measurements, a commercially available FWD was used. This FWD is mounted on a small trailer that can be tOwed by an automobile. The falling mass
weighs 150 kg, and the maximum force developed is 60 kN at a drop height of 400 mm and a pulse width of 28 ms. These values were almost independent of type of pave-ment structure. The diameter of the foot plate is 300 mm.
The deflection of the pavement is measured by velocity transducers (geophones), one in the center of the loaded area and one or two at a fixed distance from the load. The transducers (so mm in diameter and 55 mm in height) operate over a frequency range of 1 to 300 Hz. They are very rugged, which is advantageous in field conditions.
The FWD and the trailer were modified to permit quick operation with remote control from the towing car to en-able measurements to be made in or between the wheel tracks without changing the line of drive. The trailer accommodates the power supply, and the recording in-struments are in the automobile.
By using this equipment, surface deflections can be measured accurately and easily without the problems (such as the measuring reference points being located in the deflection bowl) that are encountered with some al-ternatives. The FWD is shown in Figure 2.
The transducer signals used to record the deflections are displayed on a screen to permit the operator to quickly verify the correct operation of the equipment and instruments. The maximum values of the deflections are digitized and stored on a tape recorder via a data unit or can be tabulated by a printer. The location of the points at which deflections are measured is recorded both lon-gitudinally and transversely (in or between the wheel tracks or other position) with respect to the geometry of the road. A desk calculator facilitates the introduction of temperature data and is also used to calculate deflec-tion ratios, mean values, variances, and other statistical data. A chart recorder is used to display the readings and calculated results.
Most pavement structures exhibit nonlinear behavior, particularly at low force levels, but generally, at force levels >30 kN, there is a straight line relation between deflection and force (Figure 3) (2). Thus, extrapola-tion of the deflection values to very heavy loads such as those under aircraft can be made with reasonable ac-curacy from measurements at, for example, 30 and 60 kN.
The residual life is the difference between the original design life of the pavement and the life already used. Be-cause the initial decrease in asphalt modulus is relatively small, the design life of a pavement can be determined from the layer thicknesses and moduli derived from de-flection measurements by using a Shell design chart (such as Figure 4) for the relevant subgrade modulus, weighted mean annual air temperature, and type of as-phalt mix (3) (the same type of mix, of course, as an-ticipated with the interpretation) and deriving the number of standard axle-load applications for the given values of h1 and h2. Depending on the difference between the de-

104
Figure 1. Schematic representation of pavement
Figure 3. Deflection as function of load. structure under test load.
11 F MODULUS E1 mix
ASPHALT LAYERS POISSON S RATIO v
UNBOUND OR CEMENTITIOUS
BASE LAYERS E2, 02 h5
E
0
z 0 I- U, -j U-U, 0
0 10 20 30 40 50 60 70 FORCE, kN
SUBGRADE E 31 v3
Figure 2. Falling-weight deflector.
sign life found and the traffic carried to date, it can be decided whether or not strengthening is required.
The Shell design charts can also be used to determine the overlay thicknesses required for estimated future load applications. However, in many cases, the maxi-mum asphalt strain occurs in the underside of the as-phalt layer; thus after the strengthening of the pavement with an additional asphalt layer, strain will still be pres-ent in the original layer, although at a lower magnitude. In an overlay thickness design, this reduction in fatigue life of the original asphalt mix must be taken into account. When the asphalt mix used for the overlay is essentially the same as that of the original asphalt, the overlay thickness required for the design number (NO2) can be derived directly from the design chart used to determine the present design life (N01), i.e., Figure 4.
The pavement evaluation and overlay design method described is regarded as a complete method that pro-vides the engineer with structural pavement properties
Figure 4. Use of Shell design chart to derive overlay thickness.
Nola We,çfltad ,man annual ni perature • 12 C. dame bitumen macadam (penetoation 80/100). and wbgrade modulus (E,( 50 MPa,
200 - 5RLAY N
LIFE THVELAY H0 J - -
°° ORICINAL DESIGN LIFE T -
I I I I I I
0 200 400 600 800 THICOIESS 01 UNBOUNO BASE LAYER, nn
that can be used directly in a structural design method in which all relevant aspects (e.g., loading, climate, and use of materials) are incorporated.
The development of new design charts to replace the Shell design charts for flexible pavements published in 1963 and the pavement evaluation and overlay design procedures outlined above are described in detail else-where (3, 4).
Evaluation with the FWD has been used effectively on many roads and at three major airports (Zurich, Am-sterdam, and Brussels) in Europe.
REFERENCES
A. I. M. Claessen, C. P. Valkering, and R. Dit-marsch. Pavement Evaluation With the Falling Weight Deflectometer. Proc., AAPT, Vol. 45, 1976, pp. 123-157. J. L. Green and J. W. Hall, Jr. Nondestructive Vibratory Testing of Airport Pavements. U.S. Army Engineer Waterways Eqeriment Station, Vicksburg, MS, Technical Rept. S-75-14, Vol. 1, Sept. 1975. A. I. M. Claessen, J. M. Edwards, P. Sommer, and P. Ug. Asphalt Pavement Design: The Shell Method. Proc., 4th International Conference on the Structural Design of Asphalt Pavements, Univ. of Michigan, Ann Arbor, 1977, pp. 39-74. A. I. M. Claessen and R. Ditmarsch. Pavement Evaluation and Overlay Design: The Shell Method. Proc., 4th International Conference on the Struc-tural Design of Asphalt Pavements, Univ. of M.ich-igan, Ann Arbor, 1977, pp. 649-662.

Comparison and Evaluation of Nondestructive Testing Methods of Airport Pavement Evaluation Ernest J. Barenberg, Department of Civil Engineering, University of flhinois, Urbana-Champaign
105
Four methods of nondestructive testing for airport pavements —steady-state vibratory, both load-sweep and frequency-sweep procedures, wave propagation, falling weight deflectometer, and deflection profile—are compared. Their advantages, especially in terms of costs and ease of operation, and their limitations, especially in terms of the required cor-relations between pavement property measured and pavement perfor-mance, are summarized. The steady-state vibratory methods are recom-mended, and a program for their use is suggested.
There is strong and rapidly growing interest in the de-velopment of nondestructive methods for evaluating the load-carrying capacities and potential performances of airport pavements. This interest in nondestructive testing (NDT) has been spurred by advances in equip-ment and technology that have made NDT a realistic goal and the need for testing procedures for use in pave-ment evaluation that cause a minimum of disruption to normal airport operations. The pressure for nondis-ruptive test procedures will increase with increasing air traffic.
To be of value to the airport pavement engineer, NDT methods must meet the following criteria:
They must be rapid, They must be simple enough so that they do not
require highly trained engineers to conduct the tests, The costs of conducting the tests and interpreting
the results must not be excessive, and The results of the tests must be interpretable in
terms of the potential performance of the pavement and the effects of pavement rehabilitation on the performance trends (Figure 1),
If the NDT methods cannot meet these criteria, they will either not be used or be of little value to airport engi-neers and managers.
At present, there are several NDT methods either under development or being applied on a limited basis. These include (a) steady-state vibrators, (b) wave-propagation procedures, (c) the falling weight deflectom-eter, and (d) measurement of the deflection basin under moving loads. The steady-state vibrators are the most highly developed in terms of application to airport pave-ment systems. This paper will focus on the practical implications of these test methods.
In recent years, two separate methods of testing and interpreting the results obtained by using steady-state vibrators have been developed. Both methods have been used on a number of airport pavements, and both use the same equipment for the testing, but there are variations in the test procedures. For simplicity in comparison of these two methodologies, it will be assumed that the 71-kN (16 000-lbf) vibrator developed at the U.S. Army En-gineer Waterways Experiment Station (wES) (1) is used for both. However, it is possible to use other equipment, provided that it is capable of testing pavements under both an adequate range of vibratory-force amplitudes and over an adequate range of frequencies. Single-load and single -frequency equipment cannot be used.
STEADY-STATE VIBRATORY METHODS
One method of testing and evaluation that has been de-veloped at WES (1) is to select a specific test frequency
and conduct tests over a range of loads at this preselected frequency. This is referred to as the load-sweep method of NDT. The other method of testing and evaluation, de-veloped by Yang (2, 3), is to preselect a load range and test the pavement by using a range of frequencies. This is referred to as the frequency-sweep method of NDT. Because the two methods of testing produce different out-puts, it follows that the interpretations of the findings will also be different. The two methods are summarized below, and the implications of each are discussed.
The basic concept of the load-sweep approach is that there exists a correlation between pavement deflection and performance as indicated in Figure 2. Thus, if the deflection of a pavement under dynamic load is deter-mined, the resistance to deflection can be expressed as a dynamic stiffness modulus (DSM) as follows:
DSM =F/8 (I)
where
F = amplitude of the dynamic force applied at the pre-selected frequency (usually 15 Hz) and
= deflection of the dynamically loaded pavement.
The steps involved in the procedure are summarized below:
Conduct tests over a range of dynamic loads at a frequency of 15 Hz and a sufficient number of locations to identify the critical pavement segments,
Determine the DSM values for the critical pave-ment segments,
Determine the pavement capacity by correlating the DSM values with previously established curves re-lating DSM to capacity for various types of pavements,
Establish total pavement section requirements for proposed traffic conditions, and
Establish pavement rehabilitation and overlay needs from the differences between the answers to steps 3 and 4.
If the pavement and subgrade systems were linear with respect to F and ô, it would be necessary to test the pavement under a fixed force amplitude. However, most pavement and subgrade systems are not linear, but have load-versus-deflection plots, such as that shown in Figure 3. The DSM value for the pavement is deter-mined by taking the inverse of the slope of the linear portion of the load-deflection curve as illustrated in Figure 3.
The DSM is a measure of the resistance of the pavement-subgrade system to deflection under dynamic loads. In itself, the DSM is of little value in predicting pavement performance. It becomes significant only when the values for typical pavement sections are correlated (Figure 4) with allowable load capacities determined in the conventional manner by using destructive test meth-ods. In this approach, the accuracy of the NDT and pavement-evaluation procedure is dependent on the va-lidity of the conventional procedure used, with some pos-sible loss of accuracy because of the errors inherent in any correlation procedure.
One of the criticisms of the DSM as a method of pave-

V 8 8 ILl IV 14 IS
FORCE klps
Figure 5. Effect of frequency of dynamic load on pavement deflection over range of amplitudes.
FORCE , NEWTONS IBlOI
0 8.9 17.8 26.7 35,6 44.5 53.4 62.3 71.2 0.01001 0.25
XI
V__ P 0-59
MEN
ILii"9)JllhI I
PREMN Moog.
E B z 0 I- '3
l.A a
FREQUENCY, Hz
106
Figure 1. Use of NDT for pavement management.
20 0 I- 0 20 0 4-)
H-2 w 2 LU
iG AFTER - ROBABLE
REHABILITATION_/fl P
- _____J\ -.. TRENDS WITH PRESENT
C CONDITION J REHABIUTATION
F \
- PERFORMANCE TRENDS WITHOUT
P REHABILITATION
- NOTE: PERFORMANCE TRENDS BASED ON
P STRUCTURAL EVALUATION WITH NDT '
TIME OR TRAFFIC SCALE
Figure 2. Correlation between pavement deflection and performance.
I Y4 IIUIIIIflJ•IIuI...l.Il
fill
1U11111111111111$1U1111B1111111 iu.IIIIft-HfflIIflIflIIflhIII 0' 0' 10' 0'
NUMBER OF COVERAGES TO FAILURE
Figure 3. Deflection versus amplitude of force for typical pavement system.
FORCE . hN
VIBRATORY LOAD 1661 DSM
0.0150 - 1V8068d 4.450 17237 0.38
I0d4011,CflO.. bet,.,., lolA,. 21:SOS8000000__040f0000, 3•
382 to 885 7237 2755
0.0125 - 11514 0.32 8067
E Y68klp, 0 30246N
-
0.13
:::f i _
0 2 4 6 B 10 12 14 16 18 2
FORCE kips
ment evaluation is the need to preselect the testing fre-quency (which is normally 15 Hz). The arbitrary selection of this particular frequency is based on the relatively constant ratio observed between the pavement deflection at that value and at other frequencies for a wide range of dynamic load amplitudes as shown in Figure 5.
Different pavement systems have different natural frequencies. Figure 6 shows the effect of testing fre- quency on pavement deflection for a number of pavement systems at a given dynamic force. A study of these curves indicates that the first or primary mode for the resonant frequency is generally >5, but <10 Hz, although several of the pavements had an apparent resonance at a significantly higher frequency. There is considerable speculation as to the significance of the findings at test frequencies near, but not at, the first resonant fre-quency, but this point has not yet been fully investigated.
Because the load-sweep method of NDT relies ex-clusively on the correlation between the DSM and allow-able loads, strict limitations must be placed on the test procedure and the methods for interpreting the results. The constraints on the method (1) are shown below:
The DSM must be determined by using a vibrator with a static mass of 71 kN and a load-plate diameter of 45.7 cm (18 in).
The DSM must be computed using the slope of the linear portion of the deflection-versus-load curve.
The DSM must be measured at 15 Hz. A temperature adjustment must be applied to the
DSM on flexible pavements. The DSM for rigid pavements mut be measured
at the slab center. The inoduli of elasticity of the respective pave-
ment layers under investigation must decrease with depth.
The basic concept of the frequency-sweep approach is
Figure 4. Correlation between DSM and allowable load as determined by conventional test and evaluation procedure.
WHEEL LOAD Mg Figure 6. Effect of loading frequency on pavement 0 4.5 9.1 13.6 16.2 22.7 27.2 3I.8 36.3 409 deflection.
500G
4000
300-)
0.
.2000
1000
10 20 20 40 50 60 70 80 90
ALLOWABLE SINGLE -WHEEL LOAD, KIPS
I I .440 - NOTE: DATA ARE BASED ON 1200 DEPARTURES
• - 13 VIBRATOR FREQUENCY OF IS 110 AND 254-50-IN, TIRE CONTRACT AREA.
HII N16 Is
13 H? I ,. SIll .I7j
NIDN) NI5
Is 9N7
5122
-
N9 .. , • B TANOA1O CR600 OF
NI7 NII7
ESTIMATE Ii 5.31 Mg or 11.7 KIPSI .1 ALLOWABLE SINGLE-WHEEL
LOAD .GOI78IDSMI I I I
34.4
27.6
2O.7 .E
z z 0 13.82
- I-
3.9

107
also based on the resistance of a pavement to deforma-tion under a dynamic force. However, rather than mea-suring the resistance to deformation and using this value directly, Yang calculates an equivalent modulus (E) for the pavement-subgrade system. The procedure for de-termining E involves testing the pavement at a fixed am-plitude of dynamic force over a range of frequencies from well below the first resonance to approximately 10 times the primary resonance and then using the following equation:
E = (F/2a) x 1/[ô(u)/u] (2)
where
F = amplitude of the dynamic force, a = radius of the loaxiing plate, u = evaluation frequency as a multiple of the first
resonant frequency, and 8(u) = pavement deflection at frequency u.
The steps involved in the procedure are summarized below:
Test at a sufficient number of locations to define the critical pavement segments.
Calculate the E-values of the critical pavement sections.
Determine the load and traffic capacities of the existing pavement (Yang uses a combination of elastic-layer system theory and experience).
Establish the pavement needs for the proposed traffic.
Determine the pavement rehabilitation or overlay-thickness requirements for the proposed traffic.
Project the pavement performance and make an economic analysis of the alternatives.
Make engineering decisions.
Figure 7 shows the effect of frequency on pavement deflection for a given pavement. The first resonant frequency for this pavement was approximately 8 Hz. Thus, the deflection values are read at frequencies that are multiples of 8 (i.e., 8, 16, 24, 32 . .. ). Each de-flection is then divided by the appropriate multiple of the resonant frequency (i.e., 1, 2, 3, 4 ...), and these ratios are summed.
Although the frequency-sweep method for quantifying the resistance to deformation of a pavement is based in part on random vibration theory, the procedure in fact relies heavily on correlations between E-values deter-mined by NDT and E-values determined by using con-ventional plate-load tests on the pavement. Here two problems arise: The first is that different methods of conducting plate-load tests produce different E-values, and the second is that, because of the nonlinearity be-tween pavement deflection and the amplitude of the dy-namic force, it is necessary to arbitrarily select an amplitude of the force for the test procedure. The latter problem is illustrated in Figure 8.
Both of the procedures for NDT and evaluation dis-cussed above have been used to successfully determine pavement load capacity and to develop realistic pave-ment rehabilitation plans. Both, however, have some obvious limitations and their successful application is due more to the sound engineering judgment and ingenuity of the persons involved in the evaluations and rehabilita-tion designs than in the fundamental correctness of the procedures. Some of the limitations, some necessary steps for improvement, and some needed research are discussed below.
The primary use of the NDT procedures is to allow
the pavement engineer to predict pavement performance under specified traffic conditions, schedule necessary rehabilitation procedures, and make plans for the future. Both procedures attack this problem by measuring the resistance of the pavement-subgrade system under dy-namic loads and using this information to predict pave-ment performance. The two procedures provide different measures of this resistance to deformation, but each pro-vides essentially a single value to quantify this property.
Most of the deflection in pavement-subgrade systems is due to deformation in the subgrade. It has been esti-mated that more than 80 percent of the deflection in flex-ible pavements and nearly 100 percent of the deflection in rigid pavements occurs in the subgrade soil. Thus, significant improvement can be made in the NDT and evaluation procedures if some of the critical properties of the subgrade soil are known.
The left side of Figure 9 shows a representation of a typical flexible pavement system, and the right side shows a representation of what is simulated by a single-valued property of the pavement-subgrade system. In predicting the pavement deflection under a specified load, the single-valued property of the system is just as valid as is a multiple-valued designation. A problem arises, however, when one tries to evaluate the effect of an overlay or other rehabilitation with a single-valued system.
Figure 10 shows representations of a typical flexible pavement system and of its simulation by a single-valued system, both with an overlay. It is apparent that an overlay on the single-valued pavement system will have a significantly different effect on the theoretical behavior of the system than will the same overlay on the typical pavement section. Because of this deficiency, it is prob-able that neither NDT procedure described will provide a meaningful estimate of pavement behavior after over-lay and that both in their present stage of development are not valid tools for predicting performance after re-habilitation. Fortunately, this limitation is not as dif-ficult to correct as might be anticipated.
Because most of the deformation of a pavement is due to deformation in the subgrade, the theory for pre-dicting pavement behavior can be improved substantially if the resistance to deformation of the subgrade is known. If the subgrade modulus is known or can be estimated to a reasonable level of accuracy, equivalent thicknesses and moduli can be calculated from elastic-layer theory (4) or the application of the Odemark theory for equiva-lent pavement sections (5). Also, because most of the deformation occurs in the subgrade, the equivalent thick-nesses and moduli of the pavement itself need not be known to a high level of precision.
There are several ways to determine modulus values for subgrade soils. In evaluating these methods, it is well to remember that very few soils exhibit true elastic properties, but rather are highly stress -dependent and exhibit both permanent and recoverable strain character-istics. Figure 11 shows a typical load-versus-deformation curve for fine-grained soils. The ratio of the permanent deformation to the recoverable or re-silient deformation depends on many factors, including the level of stress in the soil. If the stress level is high enough to cause significant permanent deformation in the subgrade soil after a number of load applications, then any type of pavement will give poor. performance. Thus, most engineers rely on the recoverable or resilient de-formation to predict pavement behavior.
The resilient modulus of a soil is defined as the ap-plied deviatoric stress divided by the resilient strain in the soil specimen and is a function of the stress level (6, 7). Figure 12 shows the effect of stress level on the ñsllient moduli for several soils. These moduli are
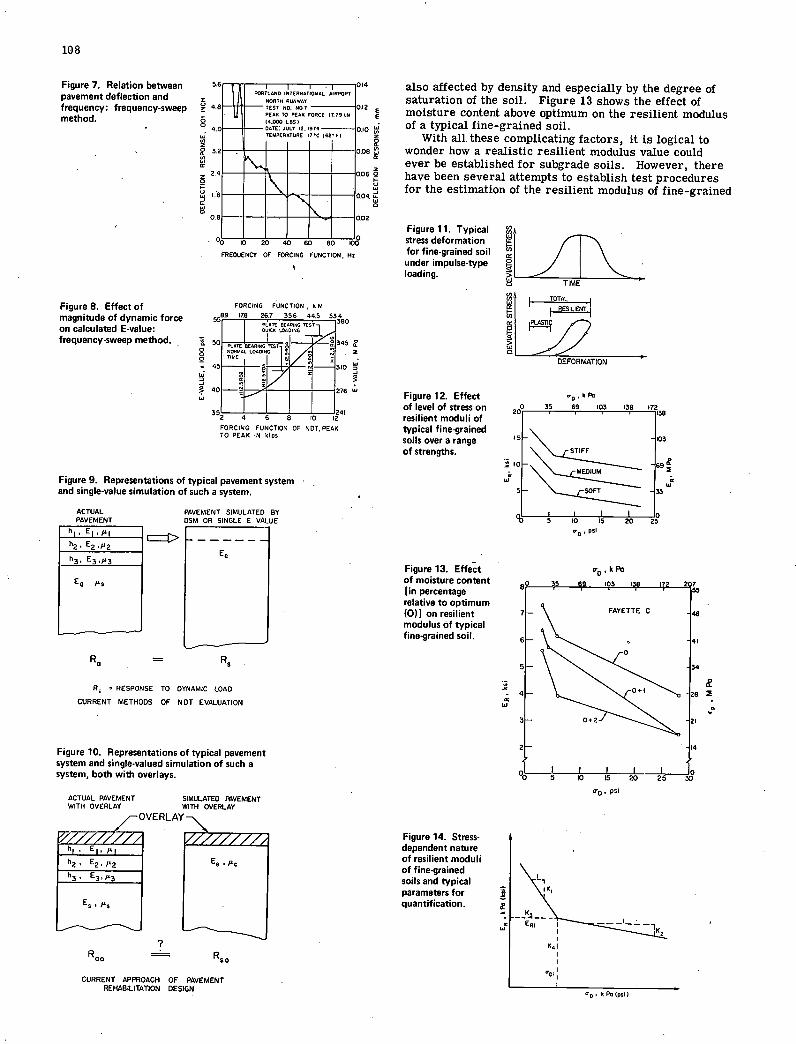
5
FORCING FUNCTION N lB g7 NNG ad N 5589 53.4
.180
50 0 0 0
45
0
4C
35
45 ,
110
76 '
2 4 6 8 10 12
FORCING FUNCTION OF NOT, PEAK TO PEAK IN kips
QQC BEARING RKS QUICK LOADING
PLATE BEARING TOT - NORMAL LOADING
- 41
Figure 12. Effect of level of stress on resilient moduli of typical fine-grained soils over a range of strengths.
108
Figure 7. Relation between pavement deflection and frequency: frequency-sweep method.
Figure 8. Effect of magnitude of dynamic force on calculated E-value: frequency-sweep method.
LI .. ., OR
• MENNEN
MEN hi
-E
>14 also affected by density and especially by the degree of saturation of the soil. Figure 13 shows the effect of
1.12 moisture content above optimum on the resilient modulus
1.0 of a typical fine-grained soil. With all. these complicating factors, it is logical to
108 2 wonder how a realistic resilient modulus value could OC ever be established for subgrade soils. However, there
106 have been several attempts to establish test procedures
104 for the estimation of the resilient modulus of fine-grained
102
Figure 11. Typical stress deformation for fine-grained soil under impulse-type loading.
01; 10 2 40 60 80
FREQUENCY OF FORCING FUNCTION, Hz
Figure 9. Representations of typical pavement system and single-value simulation of such a system.
K,
Cx
152 L J TIME
TOTOL Cr LRESG.IENT
7P 0,
0 DEFORMATION
k Pa
STIFF
EDIUM
SOFT
ACTUAL PAVEMENT SIMULATED BY PAVEMENT OSM OR SINGLE E VALUE
N1 , EI,iI - E
N3, E3013
E9 Ps
R. = R5
R > RESPONSE TO DYNAMIC LOAD
CURRENT METHODS OF NOT EVALUATION
Figure 13. Effect of moisture content [in percentage relative to optimum (0)] on resilient modulus of typical fine-grained soil.
PSI
k Pa
<FAYE
TTE c +I
0+
Figure 10. Representations of typical pavement system and single-valued simulation of such a system, both with overlays.
ACTUAL PAVEMENT SIMULATED PAVEMENT WITH OVERLAY WITH OVERLAY
VERLAY
rh, , E, j I
h2 , E2/A2 I
LL N3 , E33
R 0 Rso
CURRENT APPROACH OF PAVEMENT REHABILITATION DESIGN
Figure 14. Stress-dependent nature of resilient moduli of fine-grained soils and typical parameters for quantification.
°o• PSi

Figure 15. Wave-propagation equipment.
109
lope Deck I
/3 Chonnels I of I Carrier
Amplifiers I I Ceneroti
Figure 16. Typical dispersion curves from field data.
Soft Control /1 ,re
Phase _J Phase I Display Rocord'r
pona
mputer H Anolog
l.
Sweep I Oscillator I
F Power I
Amplifier]
_
H' 1 t1-lo 01. r---r -i- I Figure 18. Comparison of pavement surface deflections
produced by rolling truck wheel load and falling weight Ret Relco, Air-a? L38r- deflectometer.
Co Poi,ement C,,i,eaR H 6Jc. Section
TRUCK WHEEL
00 FALLING WEIG HT - Sib OH,H 70 STRAIN
70
70 A ASPHALT - Ocm --
FALLING WEIGHT
70 TRUCK WHEEL
70 GRAVEL -10cm
- - 70 200 M Po
STRESS
TRUCK WHEEL
FALLING WEIGHT
OO I29ksiI - SAND -40cm
o I I I J I I 0 / 5 3 4 5 6 7 I TRUCK WHEEL
V/oi,e Length, m yl ,-FALLING WEIGHT
soils that have excellent chances for success. In the late 1950s, workers at the University of Cali-
fornia, Berkeley, developed test procedures to measure resilient moduli (6) that have been refined and improved until it is now possible to measure the resilient modulus of an undisturbed soil sample quickly and accurately (7). The undisturbed soil samples for these tests can be taken through small [5.1 to 10.8-cm (2.5 to 4-in) diameter] core holes in the pavement with a tube sampler. The tube samples can then be shipped to a laboratory and
-100cm -100 -50 1 *0 +1
Note: lc,n0.39in. DURATION OF LOAD AND STRESS • in
quickly processed to determine the resilient modulus values for the subgrade.
If it is not possible to obtain the necessary undisturbed samples and test them, it is possible to obtain a good es-timate of the resilient modulus values from key indicator values for the subgrade soil. Thompson and Robnett (7) have shown, based on tests on approximately 50 illinois soils, that the resilient modulus of a soil can be esti-mated by the following equation:
= 6.37 + 0.034C + 0.45P1 - 1.640C- 0.0038S - 0.244G1 - 0.344M (3)
where
En = resilient modulus in kips per square inch as il-lustrated in Figure 14,
C = percentage of clay in soil (less than 2 microns), P1 = plasticity index of soil,
OC = percentage of organic carbon in soil, S = percentage of silt in soil (-200 sieve to 2
microns), GI = group index of soil (determined by AASHO Soil
Figure 17. Relative strains and stresses E
in flexible E
pavement system caused by rolling truck wheel load and falling weight deflectometer.
K
WHEEL DEFLECTION nut

110
Classification procedure), and M = moisture content (percentage) above optimum.
(The operation of this equation requires that the variables be given in U.S. customary units.)
For the 50 soils tested, this equation has a correlation coefficient (R) of 0.80, with a standard error of the mean of 2.18 kips per square inch. Of all the factors listed, the resilient modulus is most sensitive to the moisture content of the soil. Thompson and Robnett (7) show, for example, that there is a high degree of correlation be-tween En and the degree of saturation for the 50 fine-grained soils tested, taken collectively. The more in-formation that is known about a soil, however, the more reliable the prediction of the En . Thus, if the type of subgrade soil is generally known, so that such factors as the clay content, silt content and P1 can be estimated or if the moisture content of the soil can be determined, either by sampling or with a nuclear probe, then it will be possible to make reasonable estimates of the resilient moduli for subgrade soils with a minimum of destructive testing.
These procedures for the characterization of subgrade soil are not necessarily recommended, but are given to illustrate the current state of the art and what might be done with a little imagination and engineering judgment. A good estimate of the soil dynamic properties and some knowledge of the composition and thicknesses of the pave-ment layers will permit substantial advances in pavement NDT and evaluation without additional advances in tech-nology or significantly increased costs.
WAVE-PROPAGATION METHOD
Another NDT method that has received considerable at-tention and research funding is wave propagation. This method has been under development since the mid-1930s, but has not yet been used to any significant degree for pavement evaluation.
The basic concept of the approach is that there is a relation between the speed of surface wave propagation and the shear modulus, density, and Poisson's ratio of the pavement material that can be expressed as follows:
7=n(G)½/p (4)
where
y = propagation velocity of the Rayleigh wave, G = shear modulus, p = mass density, and n = function that depends on Poisson's ratio.
Watkins and others (8) have shown that there are other types of surface waves generated, but the primary wave form used for this analysis is the Rayleigh wave.
The testing procedure for wave propagation is repre-sented in Figure 15 (8,9). A vibrator is used to excite the pavement system, and sensors that can be moved relative to the vibrating source are used to record the phase velocity and wavelength of the surface wave.
The depth to which the waves penetrate the pavement system is a function of the wavelength, which is inversely related to the frequency. That is, a low-frequency vi-bration will have a long wavelength, and a high-frequency vibration will have a short wavelength. Thus, by mea-suring the wave-propagation velocity and the wavelength, it is possible to establish the values of the shear modu-lus at various depths in the pavement. Dispersion curves of the types shown in Figure 16 are thus generated from the data collected. Computer programs have been de-veloped to calculate representative shear moduli for each
of the pavement layers (8). Watkins and others (8) list the following advantages
for this method:
The method is nondestructive. The materials are tested in situ. This eliminates
the need to account for a number of variables that are difficult to reproduce with precision in the laboratory (e.g., the confining pressure resulting from a complex stress field).
The properties of the materials are determined over a wide area, rather than from a localized test sample.
The properties of the materials are determined in the form of their various moduli. This allows their use in rational analyses of the response of the structure to loading.
There is a minimum of disruption to site activity, which is of major importance in testing highway pave-ments and airport runways.
There are also some substantial disadvantages of limitations on the use of wave-propagation methods. These are summarized by Watkins and others as follows:
The stress levels induced in the layered structure are generally much lower than those produced by work-ing loads. As many natural materials have nonlinear stress -versus -strain characteristics, moduli determined by testing cannot be used directly in the analyses of structure under traffic loading, but must be modified to incorporate the effects of stress level.
The equipment is relatively expensive. The complexity of the equipment and the need for
a rather sophisticated interpretation of the data require an operator with some knowledge of electronics, an un-derstanding of the nature of wave propagation in layered media, and considerable experience with the technique. This may reduce the number of routine applications for which the method is useful.
The interpretation of the data is based on the abil-ity of theoretical analyses to correctly predict the nature of wave propagation in layered media. At present, these methods are insufficiently advanced to allow full advan-tage to be taken of data available from testing programs. Reliable information is available for only the simplest of structures, such as a single stiff layer over a soft half-space, and.in many cases, simplifications and idealiza-tions are used whose practical implications are not fully understood.
This last limitation is probably the greatest single obstacle to the widespread use of the wave-propagation method. Its solution requires advances in the quality of the theoretical models used to represent practical struc-tures and the full exploitation of existing analytic tools. The foundations of these analytic methods are based on a mathematical representation of the basic phenomena of wave propagation.
FALLING-WEIGHT DEFLECTOMETER METHOD
A recent advance in NDT has been the development of the falling-weight deflectometer (FwD) (10, ii). The test equipment and procedure includes a mass of 150 kg (330 lb) that is lifted to a predetermined height [usually 40 cm (15.7 in)], and released. The mass falls free, guided by a vertical rod, and impacts on a spring-shock system resting on the pavement. The magnitude of force and duration of impulse on the pavement can be controlled by changing the height of drop and the rate of decelera-

111
tion (spring-shock system). A 76-cm (30-in) diameter plate transmits the load
caused by the decelerating mass to the pavement, and the deflection of the pavement is recorded. Figure 17 shows the magnitude and duration of force transmitted to the pavement in a typical test. Figure 18 shows a cor-relation between pavement deflections under a conven-tional truckwheel load and the FWD (ii).
The data obtained with the FWD is essentially the same as that obtained by using a Benkelman beam and a loaded truck; i.e., the value of a deflection under a speci-fied load. These data are useful in projecting potential pavement performance only insofar as the pavement de-flection can be correlated with pavement performance. All the comments made concerning the steady-state vi-bratory test methods and pavement performance apply equally to the FWD method of testing and evaluation.
There are several advantages of the FWD method of NDT over the steady-state vibratory method. These in-clude that the equipment is inexpensive compared to the waterways experiment station vibrator and that it is rel-atively small and so can be transported by truck, rail, or aircraft. Another advantage is that the type of load applied to the pavement is more compatible with the load pattern applied by moving aircraft gear, especially if the aircraft is moving at a significant speed.
The major disadvantage of this type of NDT procedure is that its results can be interpreted only through corre-lations of pavement behavior and performance, and such correlations do not always lead to precise evaluations of pavement performance. At present, there are very little background data to use in the correlation process, so that this method cannot be used with confidence. Also, there is little or no theoretical basis to use in developing the necessary deflection-performance relations other than that obtained from the study-state vibratory tests.
DEFLECTION-PROFILE METHOD
Another method of NDT is that proposed by Harr and dis-cussed in a paper in this Special Report in which the pavement deflection and the deflection profile, called a signature, are continuously measured by a moving ref-erence beam attached to a moving vehicle that, in turn, loads the pavement with the moving load. Because the pavement deflection is measured by light sources and sensors, no part of the pavement-deflection measuring system actually touches the pavement. Thus, the system can be moved along the pavement while recording the de-flections under the moving wheel load.
While this system may have the potential to be de-veloped into a useful procedure, it has not yet been used in an actual evaluation of any pavement system other than experimentally. Also, because the evaluation is based solely on pavement deflection and pavement-deflection profiles, the results can be related to pavement-performance evaluation only through a correlation of deflections and performance. Thus, the procedure is subject to the same limitations and correlation problems as the vibratory and FWD procedures. Also, the corre-lation procedures for the moving deflectometer may be the same as those of the other NDT procedures, but the actual correlations may be different because of the dif-ferent loading procedures.
CONCLUSIONS AND COMMENTS
Practical NDT procedures have been developed for the evaluation of airport pavements. At least two of these procedures have been used for the evaluation of civil air-ports in operation and their results used to develop prac-tical pavement rehabilitation plans. Because NDT pro-
cedures permit pavement evaluation-with a minimum dis-ruption to normal airport operations, their use will probably be greatly expanded as air traffic increases at major airports.
While the current NDT procedures have been effective in providing realistic pavement evaluation and rehabilita-tion plans, this has been due in large measure to the ex-perience and good judgment of those engineers who have beenassociated with the testing and evaluation programs. At present, these procedures have not been developed to the degree that definitive guidelines for testing and evalu-ation can be provided for general use. The technology has been developed, however, so that with minor changes in these procedures, substantial improvement can be made in the evaluation process.
Before discussing some recommended changes in the NDT procedures, it is well to review some of the poten-tials and limitations of NDT. For example, NDT pro-vides data on the behavior of pavements, but to relate behavior to performance, transfer functions are needed that correlate measured individual responses (primarily deflections, in this case) to performance. The performance-evaluation phase of NDT can never be better than the correlation between behaviorial response and performance. Conversely, it is important that the test procedure define the pavement behavior as ac-curately as possible to decrease the correlation error. It is also important that the pavement behavior be de-fined in terms that will permit a realistic estimate of pavement response after some specified rehabilitation action, such as an overlay. If it is not possible to pre-dict the behavior of a pavement system after rehabilita-tion from its properties measured before rehabilitation, then the procedures will be of little value in developing realistic pavement management systems.
With these thoughts as background, the following pro-cedures are recommended for immediate implementation of NDT and evaluation of airport pavements:
Conduct NDT of pavements by using both the frequency-sweep and the load-sweep procedures. When using the load-sweep procedure, conduct tests over the load range at both the standard 15-Hz frequency used in the calculation of the DSM and the first resonant fre-quency.
Determine the composition of the existing pave-ment system through study of the as-built plans and by taking small-diameter [10.2-cm (4-in)] core samples.
Determine the resilient moduli of the subgrade by either (a) laboratory tests on undisturbed spoon samples or (b) correlation with soil-classification parameters or degree of saturation of the soils.
Calculate a value of effective structural stiffness for the composite structural layers by using the pave-ment composition and appropriate theory, such as elas-tic layer or Odemark's.
Determine the existing pavement capacity through some or all of the following pavement responses: (a) de-flection, (b) critical stresses, or (c) critical strains.
Establish the necessary pavement structural sys-tem so that the critical responses will be at a level for satisfactory performance under the projected traffic.
This procedure requires expert knowledge of pave-ment behavior and the factors that influence pavement performance. To use NDT and evaluation at this time without this expert knowledge of pavements is an open invitation to wrong conclusions and expensive failures. To allow such failures at this stage of de-velopment may result in loss in credibility for the approach. It is most important to remember that NDT is a tool, not an end in itself, and that tools

112
are more effective when used by experts.
REFERENCES
J. L. Green and J. W. Han, Jr. Nondestructive Vibratory Testing of Airport Pavements: Experi-mental Test Results and Development of Evaluation Methodology and Procedure. Federal Aviation Ad-ministration, Rept. FAA-RD- 73-205-1, Sept. 1975. N. C. Yang. Design of Functional Pavements. McGraw-Hill, New York, 1972. N. C. Yang. Nondestructive Evaluation of Civil Airport Pavements. Federal Aviation Administra-tion, Rept. FAA-RD-76-83, 1976. D. M. Burmister. The Theory of Stresses and Displacements and Layered Systems and Applica-tions to the Design of Airport Runways. Proc., HRB, Vol. 23, 1943, pp. 126-148. N. Odemark. Investigations as to the Elastic Prop-erties of Soils and Design of Pavements According to the Theory of Elasticity. Statens Vginstitute, Stockholm, 1949. H. B. Seed, C. K. Chan, and C. E. Lee. Resil-ience Characteristics of Subgrade Soils and Their Relation to Fatigue Failure in Asphalt Pavements.
Proc., 1st International Conference on the Struc-turalDesign of Asphalt Pavements, Univ. of Michi-gas, Ann Arbor, 1962, pp. 611-636. M. R. Thompson and Q. L. Robnett. Resilient Properties of Subgrade Soils. Civil Engineering Studies, Transportation Engineering Series No. 14, Illinois Cooperative Highway Research Project Series No. 160, Univ. of flhinois, Urbana-Champaign, 1976. D. J. Watkins, J. Lysmer, and C. L. Monismith. Nondestructive Pavement Evaluation by the Wave-Propagation Method. Office of Research Services, Univ. of California, Berkeley, Rept. TE-74-2, 1974. H. A. B. Rao. Results of Nondestructive Tests at Nellis Air Force Base. Civil Engineering Research Facility, Univ. of New Mexico, Albuquerque, July 1973. S. Bretonniere. Etude d'un Déflectomètre A Boulte. Bulletin de Liaison des Laboratoires Routiers, No. 2, 1963. A. Bohn, P. Ullidtx, R. Stubstad, and A. S$rensen. Danish Experiments With the French Falling-Weight Deflectometer. Proc., 3rd International Conference on Structural Design of Asphalt Pavements, Univ. of Michigan, Ann Arbor, 1972.

CONFERENCE PARTICIPANTS

114
Aikman, Edward, Construction Standards Branch, Fed-eral Aviation Administration
Anderson, Robert L., Division of Aeronautics, Wisconsin Department of Transportation, Madison
Argue, Glen H., Airside Surfaces Section, Transport Canada, Ottawa
Arntzen, Donald M., Airport Programs Section, Chicago Bureau of Engineering
Barenberg, Ernest J., University of Illinois at Urbana-Champaign
Barker, Walter R., Waterways Experiment Station, U.S. Army Corps of Engineers, Vicksburg, Mississippi
Barksdale, Richard D., School of Civil Engineering, Georgia Institute of Technology, Atlanta
Barnett, Carl J., Airports Authority of Jamaica, Kingston Beale, Edward L., Washington Airports District Office,
Falls Church, Virginia Bellanca, Joseph P., Tippetts -Abbett-McCarthy -Stratton,
Washington, D.C. Berge, C. Frederick, Kansas City Aviation Department,
Missouri Blake, Charles L., Airport Division, Federal Aviation
Administration Boothroyd, James D., Hoyle Tanner and Associates,
Inc., Manchester, New Hampshire Boyer, Robert A., Toltz, King, Duvall, Anderson and
Associates, Inc., St. Paul, Minnesota Boyett, Verney, Bureau of Aeronautics, Tennessee De-
partment of Transportation, Nashville Breihan, Erwin R., Homer and Shifrin, Inc., St. Louis Briggs, Robert C., Civil Engineer (Instruction), Federal
Aviation Administration Academy, Aeronautical Cen- ter, Oklahoma City
Brown, E. R., Waterways Experiment Station, U.S. Army Corps of Engineers, Vicksburg, Mississippi
Brown, W. J., Project Management Branch, Transport Canada, Ottawa
Brown, James L., Texas State Department of Highways and Public Transportation, Austin
Brown, Reid H., Vulcan Materials Company, Birming - ham, Alabama
Buchanan, R. H., Canada Department of National De-fence, Ottawa
Bufford, John, Bureau of Aeronautics, Tennessee De-partment of Transportation, Nashville
Bushee, James W., Airports Engineering Division, Federal Aviation Administration
Carstens, Clifford W., Federal Aviation Administration, Des Plaines, Illinois
Carter, Archie F., Southern Roadbuilders, Inc., Augusta, Georgia
Cawley, Martin L., CRC Group, Associated Reinforcing Bar Producers, Chicago
Chambers, Charles F., Piedmont Engineers, Green-ville, South Carolina
Chen, Hsien Lin, Construction Department, Taoyuan International Airport, Taipei, Taiwan
Childs, Walter R., Bristol, Childs, Crowder and. Asso-ciates, Inc., Coral Gables, Florida
Chiu, Chang-Hsien, Construction Department, Taoyuan International Airport, Taipei, Taiwan
Clemens, David E., Planning and Design Branch, Southern Region, Federal Aviation Administration
Colony, David C., University of Toledo Coppens, M. H. M., Fugro-Cesco Consultants, Arnhem,
Netherlands Cote, Michael, Civil Engineering Service, Paris Air-
port, France Cram, Milton B., Federal Aviation Administration,
Burlington, Massachusetts
Danielski, Jeff, Engineers Testing Laboratories, Inc., Phoenix
Davidson, Cram M., Engineering Section, Federal Avia-tion Administration, Los Angeles
Davis, John R., Massachusetts Port Authority, East Boston
Dehn, Ervin N., Jr., Sverdrup and Parcel and Associ-ates, Inc., Silver Spring, Maryland
Denayer, Joseph R., Regie Des Voies Ariennes, Brussels
Desmarais, Michel, Ciment Independant Inc., Montreal Devasenapathy, C., International Civil Aviation Organi-
zation, Montreal• . . . .. 0
DiRenzo, John P., Production andTechnical Services, Highway Materials, Inc., King of Prussia, Pennsyl-vania
Dixon, Donald E., Law Engineering Testing Company, Atlanta
Douglas, Charlie, CMI Corporation, Oklahoma City Dray, Frank L., Potter's Industries, Inc., Apex, North
Carolina Drechsel, Ralph H., Howard, Needles, Tammen and
Bergendoff, Milwaukee Dresser, J. D., Jacksonville Port Authority, Florida Drobny, Dennis P., Portland Cement Association,
Atlanta Duggan, Leo F., Airport Operators Council International,
Washington, D.C. Dykes, J. W., Phillips Fibers Corporation, Greenville,
South Carolina
Eck, Carl F., Air Line Pilots Association, Washington, D.C.
Edelen, William F., Jr., Law Engineering Testing Com-pany, Jacksonville, Florida
Emery, Donald K., Jr., Georgia Department of Trans-portation, Atlanta
Finn, Fred N., Ben Lomond, California Flosdorf, Herbert W., MCA Engineering Corporation,
Newark, Delaware Foster, Charles R., National Asphalt Pavement Associa-
tion, Riverdale, Maryland Franidin, Albert, KZF Environmental Design Consul-
tants, Inc., Cincinnati Frauenshuh, Ray R., G. J. Paving Company, St. Paul Fripp, John L., Georgia Department of Transportation,
Atlanta
Gillespie, Samuel S., Office of Chief of Engineers, U.S. Department of the Army
Goetz, W. H., Purdue University, West Lafayette, Indiana
Gomez, Ernest, Jr., Federal Aviation Administration, Seattle
Greene, James L., Federal Aviation Administration, College Park, Georgia
Greer, Wilbur Charles, Jr., Law Engineering Testing Company, Atlanta
Grice, Bobby R., Florida Department of Transportation, Chipley
Griffith, Richard W., Airports Division, Federal Avia-tion Administration, Anchorage, Alaska
Grimaldi, Alfred, Port Authority of New York and New Jersey, New York
Grossell, Armin J., Metropolitan Airport Authority, Moline, Illinois
Guinnee, John W., Transportation Research Board, Washington, D.C.
Guth, Herbert J., Transportation Research Board, Wash-ington, D.C.

115
Hall, James W., Jr., Waterways Experiment Station, U.S. Army Corps of Engineers, Vicksburg, Missis-sippi
Hammitt, George M., Waterways Experiment Station, U.S. Army Corps of Engineers, Vicksburg, Mississippi
Harr, Milton E., School of Civil Engineering, Purdue University, West Lafayette, Indiana
Harvey, Walter Blair, Airports Division, Federal Avia-tion Administration, Fort Worth
Hayman, Donald M., Australia Department of Transport, Melbourne
Hewett, Ronald N., Airports Authority of Jamaica, Kingston
Higgins, James L., Airports District Office, Federal Aviation Administration, Memphis
Hokanson, Lawrence D., Institute of Technology, U.S. Air Force, Wright Patterson Air Force Base, Ohio
Horn, Fred, Federal Aviation Administration HoSang, Victor A., Howard, Needles, Tammen and
Bergendoff, Alexandria, Virginia Huntzinger, Harold S., Salt Lake City International Air-
port Hutchinson, Ronald L., Waterways Experiment Station,
U.S. Army Corps of Engineers, Vicksburg, Missis-sippi
Jay, Elton E., Airports District Office, Federal Avia- tion Administration, Jackson, Mississippi
Jaycox, Claude E., Municipal Testing Laboratory, Hicksville, New York
Johnson, Thaddeus C., U.S. Army Cold Regions Re-search and Engineering Laboratory, Hanover, New Hampshire
Jonas, Ernest, Tippetts -Abbett -McCarthy -Stratton, New York
Jones, Dennis, Amax Resource Recovery Systems, Inc., Smyrna, Georgia
Jones, Michael P., Naval Facilities Engineering Com-mand, Alexandria, Virginia
Jordan, Jerry M., City of Birmingham, Alabama
Kaiser, Richard B., United Air Lines, Chicago Keckler, A. R., Burns and McDonnell Engineering Com-
pany, Kansas City, Missouri Kemahli, Ali S., Louisiana Department of Highways,
Baton Rouge Kerlin, T. R., Atlanta Airport Engineers, College Park,
Georgia Kimbrough, Duke S., Florida Department'of Transpor-
tation, Fort Lauderdale Kienk, Richard F., Plant and Structures Division, Port
Authority of New York and New Jersey, Jamaica, New York
Knoblock, George C., WNKBS-Envirodyne, Chicago Knop, Carl 0., Professional Engineering Consultants,
Wichita Korzeniowski, Bohdan N., Philadelphia Division of Avia-
tion
Lacroix, Didier, Service Techniques des Bases Ariennes, Paris
Lamb, D. W., Acres American, Inc., Buffalo Land, Frederic A., Pavement Systems, Inc., Landen-
berg, Pennsylvania Larson, Rick E., W. J. Reese and Associates, Inc.,
Rock Island, fllinois Ledbetter, Richard H., Waterways Experiment Station,
U.S. Army Corps of Engineers, Vicksburg, Missis-sippi
Lednak, John J., Federal Aviation Administration Leo, Nick, Airports District Office, Federal Aviation
Administration, Miami, Florida
Lesage, Maurice, Ciment Independent Inc., Montreal Lowe, Robert A., McCarran International Airport, Las
Vegas Lynch, Edward T., G. J. Payne, Carson, California
Madison, Dan 0., City of Tuscaloosa, Alabama Magid, Lou, Federal Aviation Administration, Miami,
Florida Maguire, Robert B., Hillsborough County Aviation
Authority, Tampa Mahns, Henry L., Metropolitan Washington Airports,
Federal Aviation Administration, Gravelly Point, Virginia
Martinez, Fernando, Restrepo y Uribe, Ltda., Bogota Matsumoto, Daniel S., Airports Division, Pacific Asia
Region, Federal Aviation Administration, Honolulu McAleese, Thomas L., Milwaukee County Airport Plan-
ning and Construction McDowell, Thomas H., Raleigh-Durham Airport Author-
ity, North Carolina McGill, William J., Airports Division, Southern Region,
Federal Aviation Administration, Atlanta McKeen, Gordon, Civil Engineering Research Facility,
University of New Mexico, Albuquerque McKeogh, C. A., Southern Region, Federal Aviation
Administration, Atlanta McLeod, Norman W., McAsphalt Engineering Services,
Toronto McMahon, T. F., Office of Research, Federal Highway
Administration McQueen, Roy D., Federal Aviation Administration,
Jamaica, New York Medico, Chris, Porous Concrete, Inc., Sarasota,
Florida Medico, John J., Jr., John J. Medico, Jr., Inc., Sara-
sota, Florida Melendez, Edgar C., Costa Rica Ministry of Public
Works and Transportation, San Jose Melick, David E., Ohio Department of Transportation,
Columbus Melville, Phillip L., Federal Aviation Administration Metternick, Larry, Williams and Works, Inc., Grand
Rapids, Michigan Michaluk, Ernest E., Transport Canada, Winnipeg,
Manitoba Mills, William H., William H. Mills and Associates,
Atlanta Mitronovas, F., Acres American, Inc., Buffalo Monismith, Carl L., Department of Civil Engineering,
University of California, Berkeley Moore, Raymond K., Department of Civil Engineering,
Auburn University, Alabama Morin, W. J., Lyon Associates, Inc., McLean, Virginia
Parker, Frazier, Jr., Waterways Experiment Station, U.S. Army Corps of Engineers, Vicksburg, Missis-sippi
Parr, Lloyd B., Missouri Department of Transportation, Jefferson City
Paschina, Ricardo, Rome Airport, Italy Patteson, William T., Sr., Louisville and Jefferson
County Air Board, Kentucky Pavlovich, R. D., Asphalt Institute, College Park,
Maryland Perko, Lawrence, Port of Portland, Oregon Petit, Richard G., Port of Seattle, Pfister, Richard Hofmann, U.S. Steel Corporation,
Pittsburgh Plentl, Willard G., Jr., Division of Aeronautics, North
Carolina Department of Transportation, Raleigh Pulera, Vito Anthony, Federal Aviation Administration,
Valley Stream, New York

116
Pumphrey, Robert L., Metropolitan Washington Airports, Federal Aviation Administration, Gravelly Point, Virginia
Roedell, Floyd J., Wichita Airport Authority, Kansas Rath, John, Glasgow Quarry, Inc., King of Prussia,
Pennsylvania Raymond, Richard P., Federal Aviation Administration Reese, John F., W. J. Reese and Associates, Inc.,
Rock Island, Illinois Richards, Robert W., Howard, Needles, Tammen and
Bergendoff, Atlanta Rixman, A. Edward, CMI Corporation, Oklahoma City Robinson, Howard M., Airports District Office, Federal
Aviation Administration, College Park, Georgia Rowan, Ronald E., Ralph H. Burke, Inc., Park Ridge,
Illinois
Sanborn, Albert F., SITE Engineers, Inc., Cherry Hill, New Jersey
Sanders, Carroll R., Williams, Hatfield and Stoner, Inc., Fort Lauderdale, Florida
Saxena, Surendra K., Civil Engineering Department, Illinois Institute of Technology, Chicago
Schulten, Carl L., Airport Pavement Branch, Federal Aviation Administration
Selvik, Rolf, Aerodrome Division, Norway Directorate of Civil Aviation, Oslo
Sharma, Jatinder, Florida Department of Transporta- tion, Tallahassee
Sheftel, David J., Systems Research and Development Services, Federal Aviation Administration
Shuler, Scott, Engineers Testing Laboratories, Inc., Phoenix
Slatten, J. L., Sahuaro Petroleum and Asphalt Company, Phoenix
Smith, Cecil B., Delta Air Lines, Inc., Atlanta Smith, L. Beale, Ill, Howard, Needles, Tammen and
Bergendoff, Miami, Florida Smith, Larry E., HTB, Inc., Oklahoma City Smith, Lawrence L., Tampa International Airport Spaine, L. F., Transportation Research Board, Wash-
ington, D.C. Sparks, Craig A., Rocky Mountain Region, Federal
Aviation Administration, Aurora, Colorado Spencer, Herbert G., Ama.x, Inc., Avondale Estates,
Georgia Springett, R. E., British Airways, Hounslow, Middle-
sex, England Stoner, E. W., Williams, Hatfield and Stoner, Inc.,
Fort Lauderdale, Florida Strandberg, Roy A., Boeing Commercial Airplane Com-
pany, Seattle Studebaker, Robert, Laserplane Corporation, Dayton Styron, Robert 1W., Amax Resource Recovery Systems;
Inc., Atlanta Sweetapple, Gordon J., Manchester International Airport
Authority, England
Takeshi, Jotani, All Nippon Airways, Burbank, Califor-nia
Tatro, Leo F., Jr., Florida Department of Transporta-tion, DeLand District Office, DeLand
Taverner, G. G., Defence Construction, Ltd., Ottawa Taylor, Marvin B., Division of Aeronautics, Illinois
Department of Transportation, Springfield
Tenneson, H. Gunnar, San Francisco Airports District Office, Federal Aviation Administration, Burlingame, California
Thompson, Marshall R., University of Illinois at Urbana-Champaign
Tomita, H., Federal Aviation Administration Truax, Dan A., CMI Corporation, Oklahoma City Tuccillo, S., U.S. Naval Civil Engineering Laboratory,
Port Hueneme, California Turner, Elonza T., Federal Aviation Administration,
Beckley, West Virginia Tveter, Asle, A/S Sigurd Hesselberg, Kongensgate 1,
Oslo, Norway
Van Den Broeck, Frans A., Regi Des Voies Mriennes, Brussels, Belgium
Van der Laarse, J. D., Aircraft Engineering, Fokker VFW and AECMA, Schipol-Oost, Netherlands
Van Noortwijk, H., Civil Engineering Service Bureau, Engineering Department, Schiphol Airport Authority, Amsterdam, Netherlands
Visser, W., Shell Research Amsterdam, Koninklijke/ Shell Laboratorium, Amsterdam, Netherlands
Vitale, William V., Office of Airports Programs, Fed- eral Aviation Administration
Vittas, George P., Airport Planning, American Airlines, Inc., New York
Wadlington, V. B., Civil Engineering Department, Bovay Engineers, Inc., Spokane
Waldner, Frederick A., Airports District Office, Fed- eral Aviation Administration, Camp Hill, Pennsylvania
Ward, William T., Airports District Office, Federal Aviation Administration, College Park, Georgia
Wathen, T. R., Engineering Division, U.S. Department of the Army, San Francisco
Weder, C. J., Schiphol Airport Authority, Amsterdam, Netherlands
Weisz, C. Phillip, Air Transport Association, Washing-ton, D.C.
Wester, K., Study Center for Road Construction, Arnhem, Netherlands
White, Thomas D., Waterways Experiment Station, U.S. Army Corps of Engineers, Vicksburg, Mississippi
Will, Kenneth J., Bureau of Aviation, Florida Depart- ment of Transportation, Tallahassee
Williams, George A., Florida Department of Transpor-tation, Barton
Wilk, Willy, Betonstrassen AG, Wildegg, Switzerland Wilson, Barrett J., Port Authority of New York and New
Jersey, New York Wilson, James A., City of Birmingham, Alabama Wilson, John G., Pullman Swindell Ceramic Division,
Pittsburgh Wilson, T. E., In, Southern Roadbuilders, Inc., Augusta,
Georgia Witczak, Matthew W., Department of Civil Engineering,
University of Maryland, College Park Witteveen, Norman D., Watson and Company, Tampa Worch, Richard J., Federal Aviation Administration
Yang, Nai C., Yang, Stevens, Fabian Engineers, New York City
Yoder, Eldon J., Purdue University, West Lafayette, Indiana

~20JIC6nstiYutionYA—venue,L
RSPOJ1ON aESERCHIBORD ilcademy of Sciences
TWRi ngt onD!C'2 04T8
[N.PROF U.S. POSTAGE
PAID
WASHINGTON. EQC. PERMIT NO. 42970
0
>- m
0 U. — 0
>
I—
w 0
_41
-I
V)N Z-
0= <N 0
0 - 0uJ ow r.v
0< 00 0 —CLCQ