Update on FHWA’s ALF tests of modified binder pavements
42
Update on FHWA ALF Tests of Modified Binder Pavements By Xicheng Qi, Pavement Engineer, SES / TFHRC 6300 Georgetown Pike McLean, VA 22101 USA [email protected] Tel. (202) 493-3472, Fax (202) 493-3161 Aroon Shenoy, Rheology Consultant, SES / TFHRC 6300 Georgetown Pike McLean, VA 22101 USA [email protected] Tel. (202) 493-3105, Fax (202) 493-3161 Emin Kutay, Asphalt Mixture Scientist, SES / TFHRC 6300 Georgetown Pike McLean, VA 22101 USA Muhammed[email protected] Tel. (202) 493-3098, Fax (202) 493-3161 Nelson Gibson, Research Highway Engineer, FHWA 6300 Georgetown Pike McLean, VA 22101 USA [email protected] Tel. (202) 493-3073, Fax (202) 493-3161 Jack Youtcheff, Materials and Construction Team Leader, TFHRC, FHWA 6300 Georgetown Pike McLean, VA 22101 USA [email protected] Tel. (202) 493-3090, Fax (202) 493-3161 Tom Harman, Pavement and Materials Technical Service Team Leader, Resource Center, FHWA 10 South Howard Street, Suite 4000 Baltimore, MD 21201USA [email protected] Tel. (410) 962-0134, Fax (410) 962-3655 Prepared for 3 rd International Conference on Accelerated Pavement Testing
-
Upload
independent -
Category
Documents
-
view
1 -
download
0
Transcript of Update on FHWA’s ALF tests of modified binder pavements
Update on FHWA ALF Tests of Modified Binder Pavements
By
Xicheng Qi, Pavement Engineer, SES / TFHRC 6300 Georgetown Pike
McLean, VA 22101 USA [email protected]
Tel. (202) 493-3472, Fax (202) 493-3161
Aroon Shenoy, Rheology Consultant, SES / TFHRC 6300 Georgetown Pike
McLean, VA 22101 USA [email protected]
Tel. (202) 493-3105, Fax (202) 493-3161
Emin Kutay, Asphalt Mixture Scientist, SES / TFHRC 6300 Georgetown Pike
McLean, VA 22101 USA [email protected]
Tel. (202) 493-3098, Fax (202) 493-3161
Nelson Gibson, Research Highway Engineer, FHWA 6300 Georgetown Pike
McLean, VA 22101 USA [email protected]
Tel. (202) 493-3073, Fax (202) 493-3161
Jack Youtcheff, Materials and Construction Team Leader, TFHRC, FHWA 6300 Georgetown Pike
McLean, VA 22101 USA [email protected]
Tel. (202) 493-3090, Fax (202) 493-3161
Tom Harman, Pavement and Materials Technical Service Team Leader, Resource Center, FHWA
10 South Howard Street, Suite 4000 Baltimore, MD 21201USA
[email protected] Tel. (410) 962-0134, Fax (410) 962-3655
Prepared for 3rd International Conference on Accelerated Pavement Testing
Qi, Shenoy, Kutay, Gibson, Youtcheff, and Harman
1
Update on FHWA ALF Tests of Modified Binder Pavements
Prepared for
3rd International Conference on Accelerated Pavement Testing
Xicheng Qi1, Pavement Engineer, SES / TFHRC
Aroon Shenoy, Rheology Consultant, SES / TFHRC Emin Kutay, Asphalt Mixture Scientist, SES / TFHRC Nelson Gibson, Research Highway Engineer, FHWA
Jack Youtcheff, Materials and Construction Team Leader, FHWA Tom Harman, Pavement and Materials Technical Service Team Leader, FHWA
ABSTRACT
In the summer of 2002, under a new transportation pooled fund study TPF-5(019), 12 full-scale lanes of pavements with various modified asphalts were constructed at the Federal Highway Administration’s (FHWA) Pavement Testing Facility (PTF) in McLean, Virginia. The primary goal of the study was to use FHWA’s two Accelerated Loading Facility (ALF) machines to validate and refine changes being proposed in the Superpave binder specification to properly grade modified asphalt binders. The initial rutting test results at 64oC and strain measurements right after construction have been reported in the last IAPT conference. Since then, additional rutting tests at 74 oC and 45 oC have been conducted; fatigue testing at 19 oC has just been completed for all 12 pavement lanes. The ALF pavement performance results are linked to a comprehensive laboratory binder and mixture characterization study. This paper updates the ALF testing results from both rutting and fatigue experiments and makes comparisons between ALF and laboratory test results obtained to date. Coefficients of correlation between ALF rutting at 64 and 74 oC and Superpave as well as potential refinement of binder specification parameters will be shown with and without outliers. Similarly, the ALF fatigue data at 19 oC and Superpave as well as potential refinement fatigue parameters will also be compared to determine the coefficient of correlations and the trends obtained. Comparisons are also included between ALF and an array of lab mixture tests (flow number tests with and without confinement, push-pull tests in both stress and strain controlled modes with continuum damage mechanics analysis).
1 Corresponding author, 202-493-3472 (voice), 202-493-3161 (fax), [email protected], 6300, Georgetown Pike, TFHRC, HRDI-11, McLean, VA 22101.

Qi, Shenoy, Kutay, Gibson, Youtcheff, and Harman
2
INTRODUCTION
In the Summer of 2001, the Federal Highway Administration (FHWA) initiated a new transportation pooled fund study, TPF-5(019), “Full-Scale Accelerated Performance Testing for Superpave and Structural Validation.” The primary goal of the study was to validate and refine changes being proposed in the Superpave binder specification with the FHWA full-scale Pavement Testing Facility (PTF), which has twelve pavement test lanes and two Accelerated Loading Facility (ALF) machines. In November 2001, a Technical Working Group (TWG) workshop was conducted for the pooled fund study at the Turner-Fairbank Highway Research Center (TFHRC) in Virginia. Representatives from ten State Highway Agencies (SHAs), the asphalt industry, and FHWA participated in the workshop and formulated the objectives, research approach, and the main design of the experiment for the study.
The main objective of this study was to evaluate and validate the proposed recommendations to the Superpave binder specification and to provide AASHTO with a binder purchase specification that is “blind” to the type of modification. This experiment can also provide valuable data for the Mechanistic-Empirical Pavement Design Guide, Crumb Rubber Modified (CRM) asphalt pavement design, Superpave Simple Performance Test (SPT) for asphalt mixtures and Falling Weight Deflectometer (FWD) technique.
To achieve these objectives, twelve lanes of pavements with various modified asphalts have been constructed at the FHWA PTF site during the summer of 2002. The pavements have been loaded by two ALF machines approximately one month after the construction.
The initial rutting test results at 64oC and strain measurements right after construction have been reported in the last IAPT conference (1, 2). Since then, additional rutting tests at 74 oC have been conducted; fatigue testing at 19oC has just been completed for all 12 pavement lanes. The ALF pavement performance results are linked to a comprehensive laboratory binder and mixture characterization study. This paper updates the ALF testing results from both rutting and fatigue experiments and makes comparisons between ALF and laboratory test results obtained to date.
ALF PAVEMENT TESTING
Experiment
ALF Machine FHWA’s PTF consists of two ALF machines (Figure1) on about 3420 m2 of grounds that provide space for 12 pavement test lanes. The ALF machines simulate traffic loading at controlled loading and pavement temperatures and are 29-m long frames with rails to direct rolling wheel loads. Each machine is capable of applying an average of 35,000 wheel passes per week from a half-axle load ranging from 33 to 84 kN. For the current experiment, both machines are equipped with super-single (425/65R22.5 wide base) tires. An infrared heating system and thermocouples in the pavements provide the required pavement temperature.
Pavement Test Lanes
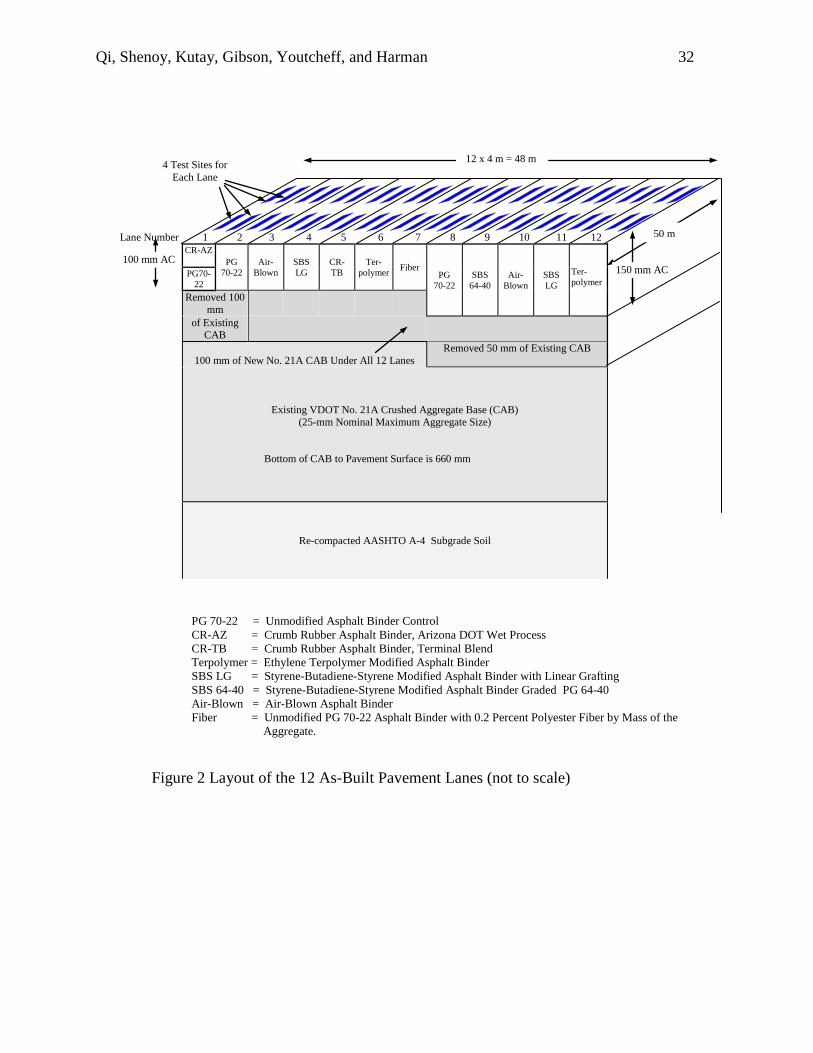
The current layout of the 12 as-built pavement lanes is presented in Figure 2. Each pavement lane is 4 m wide and 50 m long, and is divided into four test sites. All pavement lanes consist of a hot-mix asphalt (HMA) layer and a dense-graded, crushed aggregate base (CAB) course over a
Qi, Shenoy, Kutay, Gibson, Youtcheff, and Harman
3
uniformly prepared, AASHTO A-4 subgrade soil (silty clay). The total thickness of the HMA and CAB layers is 660 mm. Lanes 1 through 7 were constructed with a 100-mm thick layer of HMA, while lanes 8 though 12 were constructed with 150 mm of HMA. The HMA is a dense graded mixture with a 12.5mm maximum nominal aggregate size. The binders used in each lane are also listed in Figure 2. Note that the control binder (PG 70-22) and three modified binders (Air-Blown, SBS-LG, and Terpolymer) are used in both 100-mm and 150-mm thick lanes. Binder Selection Evaluating the effects of binder modification on mixture performance required the use of binders with identical Superpave performance grades. A single base asphalt (a Venezuelan blend) was used for as many of the binders as possible, to ensure that observed changes could be attributed to the mode of modification. Polymers classified as elastomers and elasto-plastics were investigated. Several of the polymers were incorporated via blending, while others were grafted to or reacted with the asphalt binder.
Most of the binders chosen for the ALF field study were modified to have the same high temperature Superpave performance grade (PG 74-xx), and, as such, their pavement rutting performances should be similar. The target continuous PG for the air blown, SBS LG (styrene-butadiene-styrene modified asphalt binder with linear grafting), CR-TB (crumb rubber asphalt binder, terminal blend), and terpolymer modified binders was 74-28, while the target for the unmodified control binder was 74-22 (referred to as the PG 70-22 binder in this report). The performance grades of the CR-AZ (crumb rubber asphalt binder, Arizona DOT wet process) and the fiber (PG 70-22 with fiber added) binders were not characterized for shear stiffness and phase angle in the dynamic shear rheometer because of the challeng associated with keeping the particles and fibers uniformly distributed within the binder between the plate. The CR-AZ binder consisted of 17 per cent (by volume) crumb rubber (1.4-mm scrap tire rubber) and 83 percent unmodified PG 58-22 asphalt. The SBS 64-40 has a significantly different performance grade than the primary group of binders, but was included in this study to address an important asphalt paving industry question: does the Superpave binder specification correctly capture the relative high-temperature performances of asphalt binders with high polymer contents but soft base contents?
During construction, samples of all of the binders were collected; the six that could be evaluated with the standard suite of Superpave tests were tested. Results of the testing showed the following continuous PG values for the binders: PG 70-22 (continuous PG 72-23); air-blown (PG 74-28); SBS LG (PG 74-28); CR-TB (PG 79-28); terpolymer (PG 74-31); and SBS 64-40 (PG 71-38). With the exception of the CR-TB, which missed the PG target, the high temperature grades of all of the binders are nearly the same, allowing the desired comparison of rutting performance. The intermediate grade temperatures (TIS) of the binders differ significantly: PG 70-22 (TIS=26.1 oC); air-blown (TIS=22.6 oC); SBS LG (TIS=18.1 oC); CR-TB (TIS=17.9 oC); terpolymer (TIS=14.3 oC); and SBS 64-40 (TIS=8.6 oC). Therefore, the experiment thus should be a good test for the ability of the current binder specification to rate asphalt binders according to fatigue cracking performance. Pavement Construction

Qi, Shenoy, Kutay, Gibson, Youtcheff, and Harman
4
The pavement test lanes were constructed in the summer and fall of 2002. The mixtures were produced in a counter flow drum plant located in Sterling, Virginia, 27 km (17 mi) from the PTF site. After transport, trucks unloaded the HMA into a material transfer device (MTD), which fed a Blaw-Knox PF3200 rubber tire paver. Use of an infrared camera during construction indicated the MTD was improved the uniformity of the mixture during lay down.
All of the test lanes were constructed in two lifts, each 50-mm (2-in.) or 75-mm (3-in.) thick, as appropriate. A 12.3-Mg (13.5-ton) vibratory roller was used for the breakdown, followed by a 9.1-Mg (10-ton) static steel roller for the finish rolling.
An extensive quality control/quality assurance (QA/QC) test program was conducted during the construction of both the crushed aggregate base and the HMA. The detailed testing results have been reported elsewhere (3, 4).
Hydrated lime was added to the No. 10 diabase fine aggregate stockpile to produce each asphalt mixture by the paving contractor. The lime and No. 10 aggregate were mixed together in the hot-mix drum plant without asphalt. The lime-treated aggregate was then stockpiled. This method of lime addition resulted in the formation of some lime nuggets as observed during the pavement construction. The actual lime contents distributed in the pavement test lanes are now under investigation.
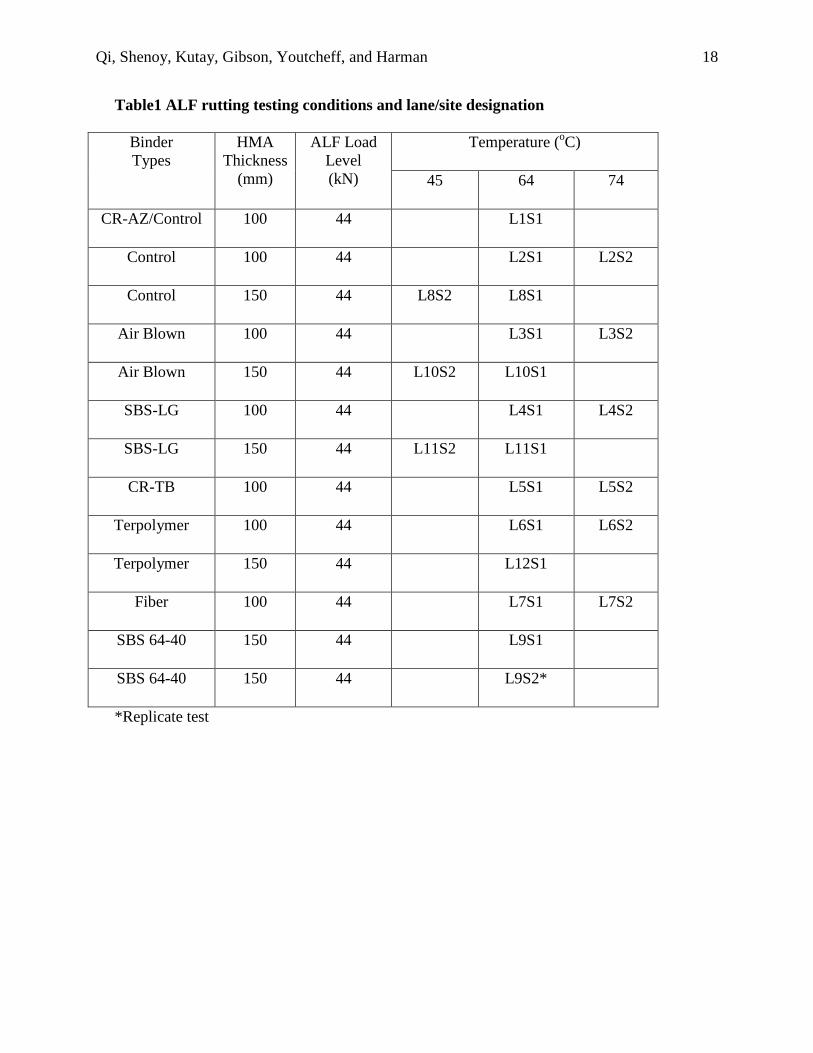
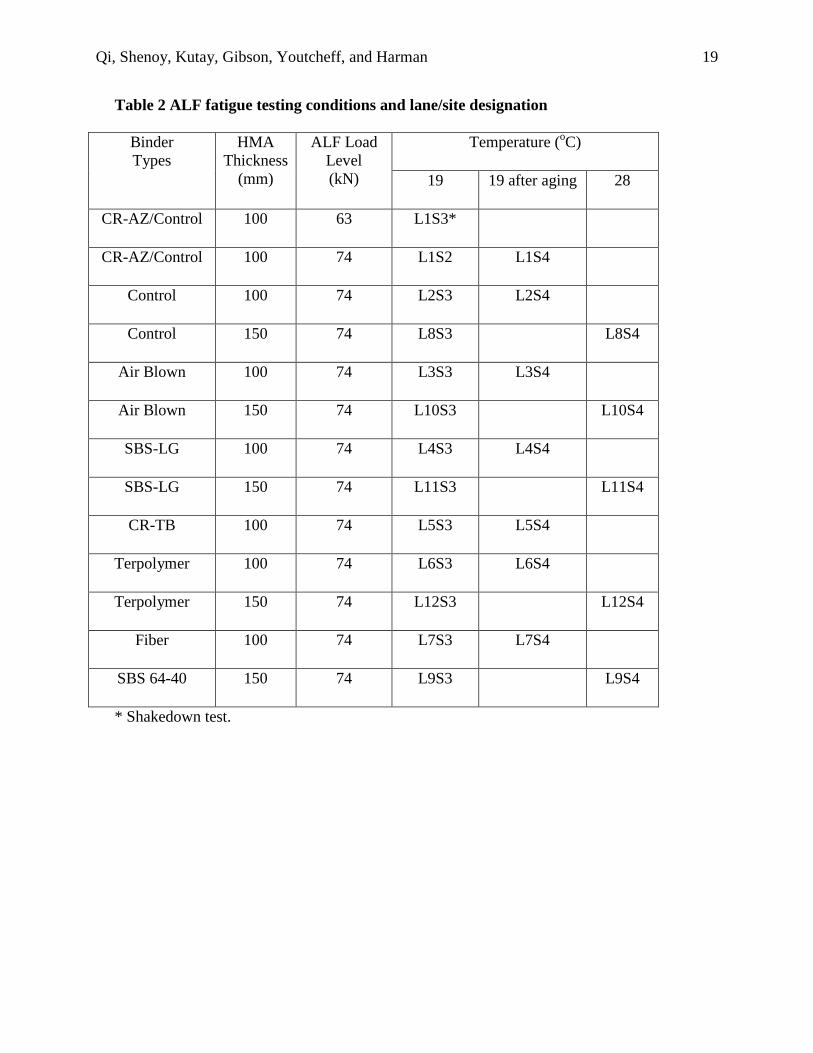
A blender was delivered to the hot mix plant for the CR-AZ production, whereas the CR-TB was trucked to the hot mix plant from an asphalt terminal in Texas. The recommended mixing temperature for the CR-AZ was slightly higher than that of the CR-TB; these were 157-163 °C (315-325 ºF) and 154-157 °C (310-315 ºF), respectively. The recommended compaction temperatures were the same for the two materials, 135 °C (275 ºF). ALF Loading Conditions Since each pavement lane has four test sites available, full-scale pavement testing has been conducted at two failure modes, rutting tests (sites 1 and 2) at 45, 64 and 74 oC (selected lanes), and fatigue cracking tests (sites 3 and 4) at 19 and 28 oC. According to the results of trial shakedown rutting and fatigue cracking tests early in 2003, it was decided that all rutting tests use a wheel load of 44 kN (10,000 lb) without transverse wander while all fatigue tests use a wheel load of 74 kN (16,600 lb) with transverse wander in order to fit the project schedule and provide results in a reasonable length of time. Tables 1 and 2 summarize the ALF loading conditions for rutting and fatigue tests respectively. Data Collection During loading, pavement layer rutting data are collected through differential rod and level surveys on eight sets of reference plates installed at the time of construction along the centerline of the test section. The plates are located at the surface of the pavement and on top of the aggregate base in order to measure permanent displacement at these two locations at predetermined ALF loading passes. The difference between these two measurements yields the permanent vertical deformation (rutting) in the asphalt layer.
For fatigue test sections, cracks were manually traced onto clear plastic Mylar sheets as they formed at the surface of the pavements. Different color pens were used to correspond to the number of load repetitions. Two approaches were used to process the data. One was to measure the total crack length and the other was to measure the percentage of area cracked in the loaded area.
Qi, Shenoy, Kutay, Gibson, Youtcheff, and Harman
5
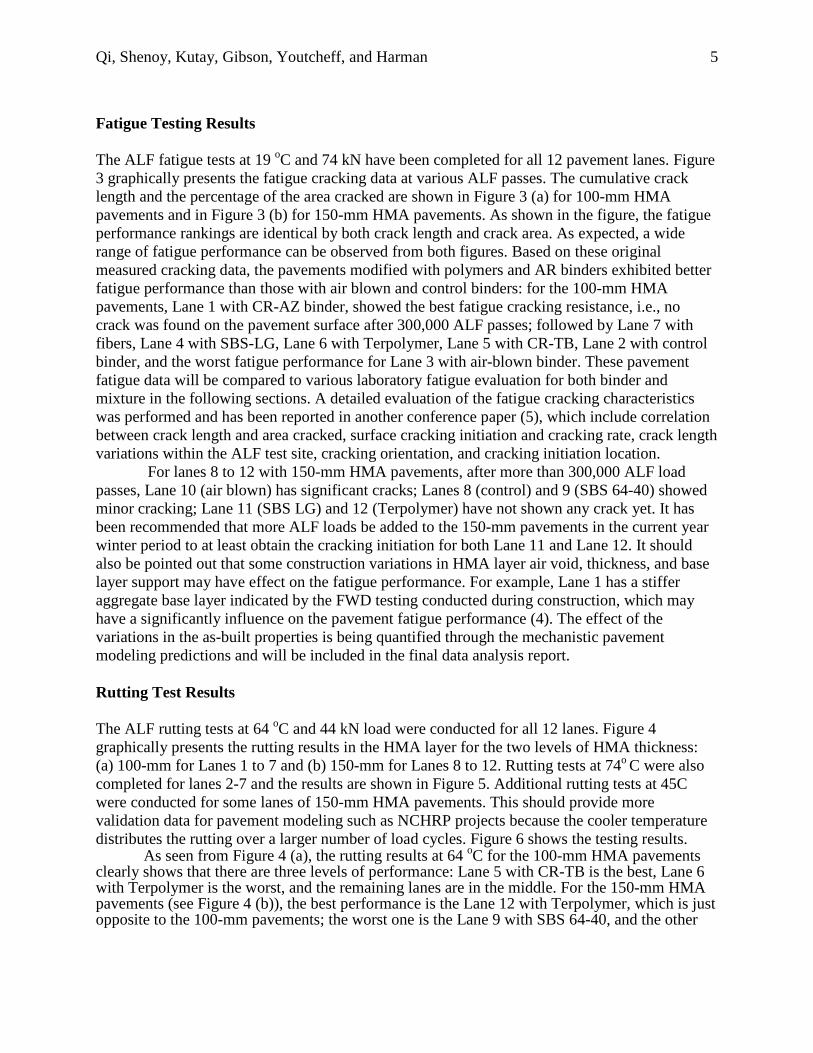
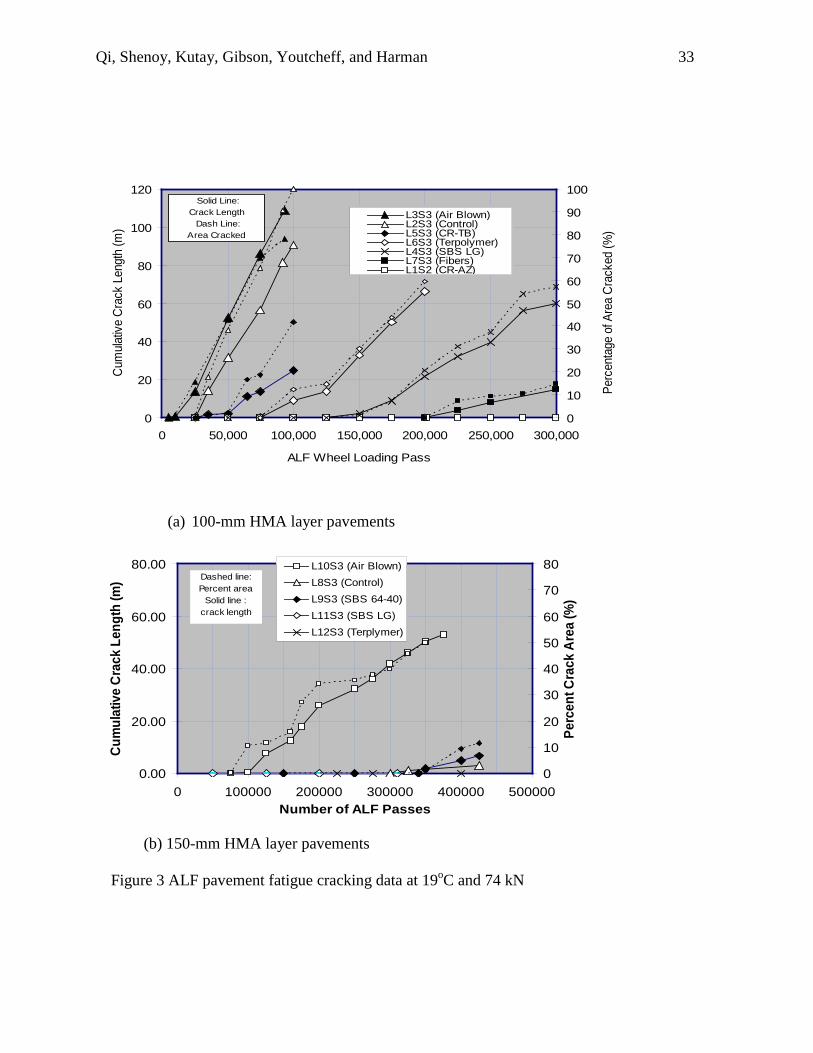
Fatigue Testing Results The ALF fatigue tests at 19 oC and 74 kN have been completed for all 12 pavement lanes. Figure 3 graphically presents the fatigue cracking data at various ALF passes. The cumulative crack length and the percentage of the area cracked are shown in Figure 3 (a) for 100-mm HMA pavements and in Figure 3 (b) for 150-mm HMA pavements. As shown in the figure, the fatigue performance rankings are identical by both crack length and crack area. As expected, a wide range of fatigue performance can be observed from both figures. Based on these original measured cracking data, the pavements modified with polymers and AR binders exhibited better fatigue performance than those with air blown and control binders: for the 100-mm HMA pavements, Lane 1 with CR-AZ binder, showed the best fatigue cracking resistance, i.e., no crack was found on the pavement surface after 300,000 ALF passes; followed by Lane 7 with fibers, Lane 4 with SBS-LG, Lane 6 with Terpolymer, Lane 5 with CR-TB, Lane 2 with control binder, and the worst fatigue performance for Lane 3 with air-blown binder. These pavement fatigue data will be compared to various laboratory fatigue evaluation for both binder and mixture in the following sections. A detailed evaluation of the fatigue cracking characteristics was performed and has been reported in another conference paper (5), which include correlation between crack length and area cracked, surface cracking initiation and cracking rate, crack length variations within the ALF test site, cracking orientation, and cracking initiation location.
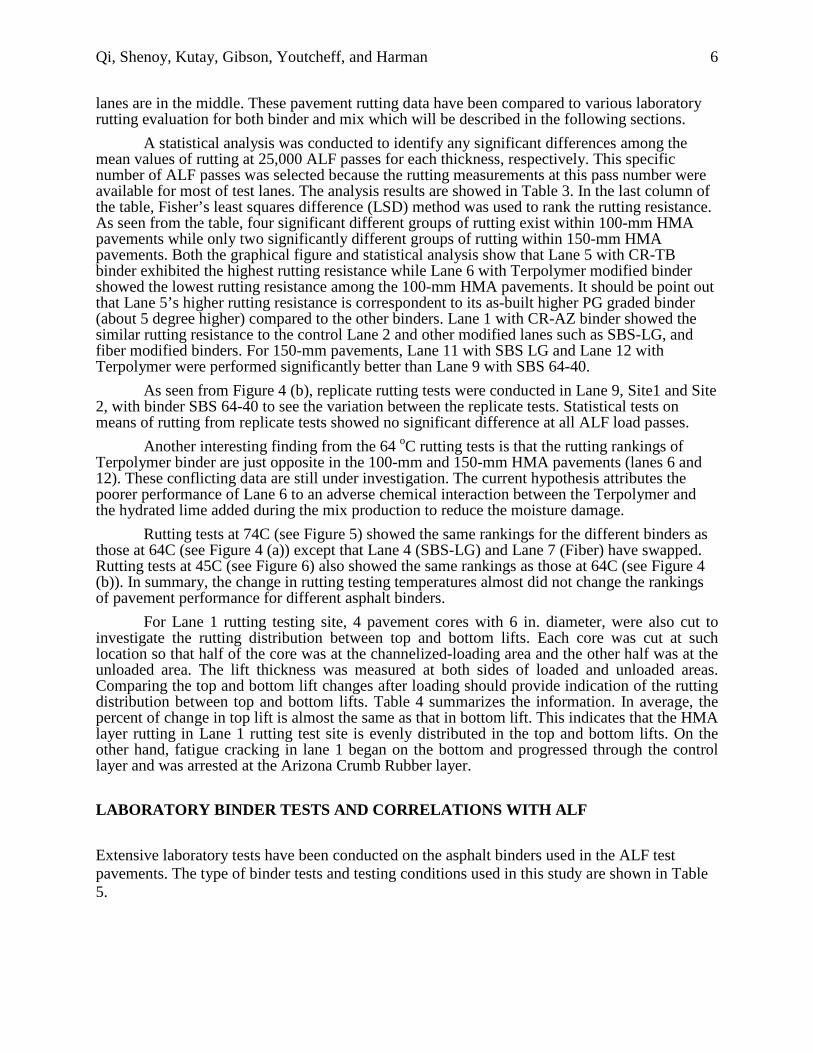
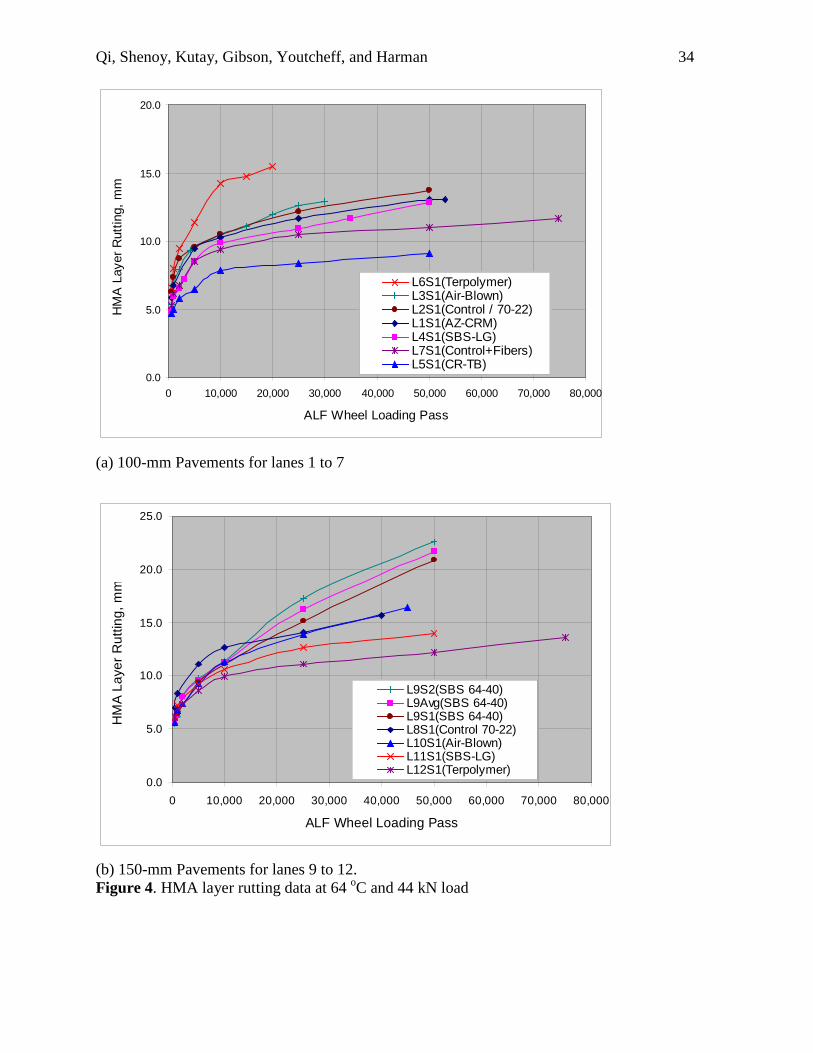
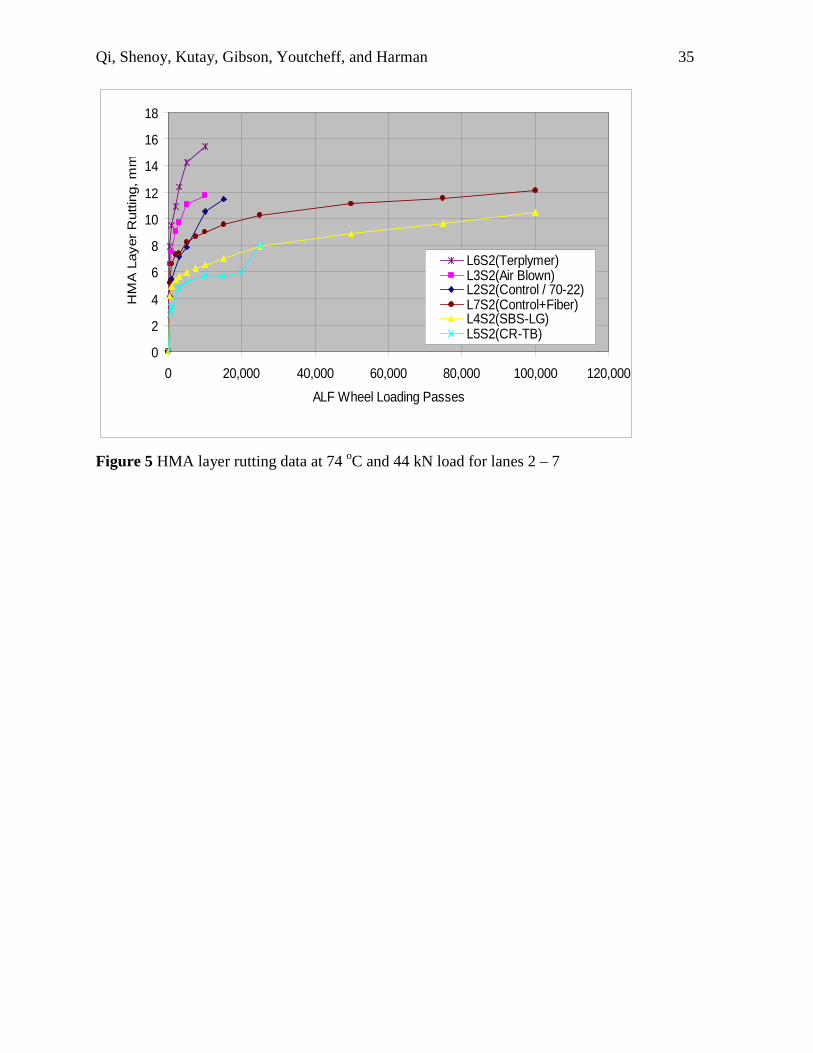
For lanes 8 to 12 with 150-mm HMA pavements, after more than 300,000 ALF load passes, Lane 10 (air blown) has significant cracks; Lanes 8 (control) and 9 (SBS 64-40) showed minor cracking; Lane 11 (SBS LG) and 12 (Terpolymer) have not shown any crack yet. It has been recommended that more ALF loads be added to the 150-mm pavements in the current year winter period to at least obtain the cracking initiation for both Lane 11 and Lane 12. It should also be pointed out that some construction variations in HMA layer air void, thickness, and base layer support may have effect on the fatigue performance. For example, Lane 1 has a stiffer aggregate base layer indicated by the FWD testing conducted during construction, which may have a significantly influence on the pavement fatigue performance (4). The effect of the variations in the as-built properties is being quantified through the mechanistic pavement modeling predictions and will be included in the final data analysis report. Rutting Test Results The ALF rutting tests at 64 oC and 44 kN load were conducted for all 12 lanes. Figure 4 graphically presents the rutting results in the HMA layer for the two levels of HMA thickness: (a) 100-mm for Lanes 1 to 7 and (b) 150-mm for Lanes 8 to 12. Rutting tests at 74o C were also completed for lanes 2-7 and the results are shown in Figure 5. Additional rutting tests at 45C were conducted for some lanes of 150-mm HMA pavements. This should provide more validation data for pavement modeling such as NCHRP projects because the cooler temperature distributes the rutting over a larger number of load cycles. Figure 6 shows the testing results.
As seen from Figure 4 (a), the rutting results at 64 oC for the 100-mm HMA pavements clearly shows that there are three levels of performance: Lane 5 with CR-TB is the best, Lane 6 with Terpolymer is the worst, and the remaining lanes are in the middle. For the 150-mm HMA pavements (see Figure 4 (b)), the best performance is the Lane 12 with Terpolymer, which is just opposite to the 100-mm pavements; the worst one is the Lane 9 with SBS 64-40, and the other
Qi, Shenoy, Kutay, Gibson, Youtcheff, and Harman
6
lanes are in the middle. These pavement rutting data have been compared to various laboratory rutting evaluation for both binder and mix which will be described in the following sections.
A statistical analysis was conducted to identify any significant differences among the mean values of rutting at 25,000 ALF passes for each thickness, respectively. This specific number of ALF passes was selected because the rutting measurements at this pass number were available for most of test lanes. The analysis results are showed in Table 3. In the last column of the table, Fisher’s least squares difference (LSD) method was used to rank the rutting resistance. As seen from the table, four significant different groups of rutting exist within 100-mm HMA pavements while only two significantly different groups of rutting within 150-mm HMA pavements. Both the graphical figure and statistical analysis show that Lane 5 with CR-TB binder exhibited the highest rutting resistance while Lane 6 with Terpolymer modified binder showed the lowest rutting resistance among the 100-mm HMA pavements. It should be point out that Lane 5’s higher rutting resistance is correspondent to its as-built higher PG graded binder (about 5 degree higher) compared to the other binders. Lane 1 with CR-AZ binder showed the similar rutting resistance to the control Lane 2 and other modified lanes such as SBS-LG, and fiber modified binders. For 150-mm pavements, Lane 11 with SBS LG and Lane 12 with Terpolymer were performed significantly better than Lane 9 with SBS 64-40.
As seen from Figure 4 (b), replicate rutting tests were conducted in Lane 9, Site1 and Site 2, with binder SBS 64-40 to see the variation between the replicate tests. Statistical tests on means of rutting from replicate tests showed no significant difference at all ALF load passes.
Another interesting finding from the 64 oC rutting tests is that the rutting rankings of Terpolymer binder are just opposite in the 100-mm and 150-mm HMA pavements (lanes 6 and 12). These conflicting data are still under investigation. The current hypothesis attributes the poorer performance of Lane 6 to an adverse chemical interaction between the Terpolymer and the hydrated lime added during the mix production to reduce the moisture damage.
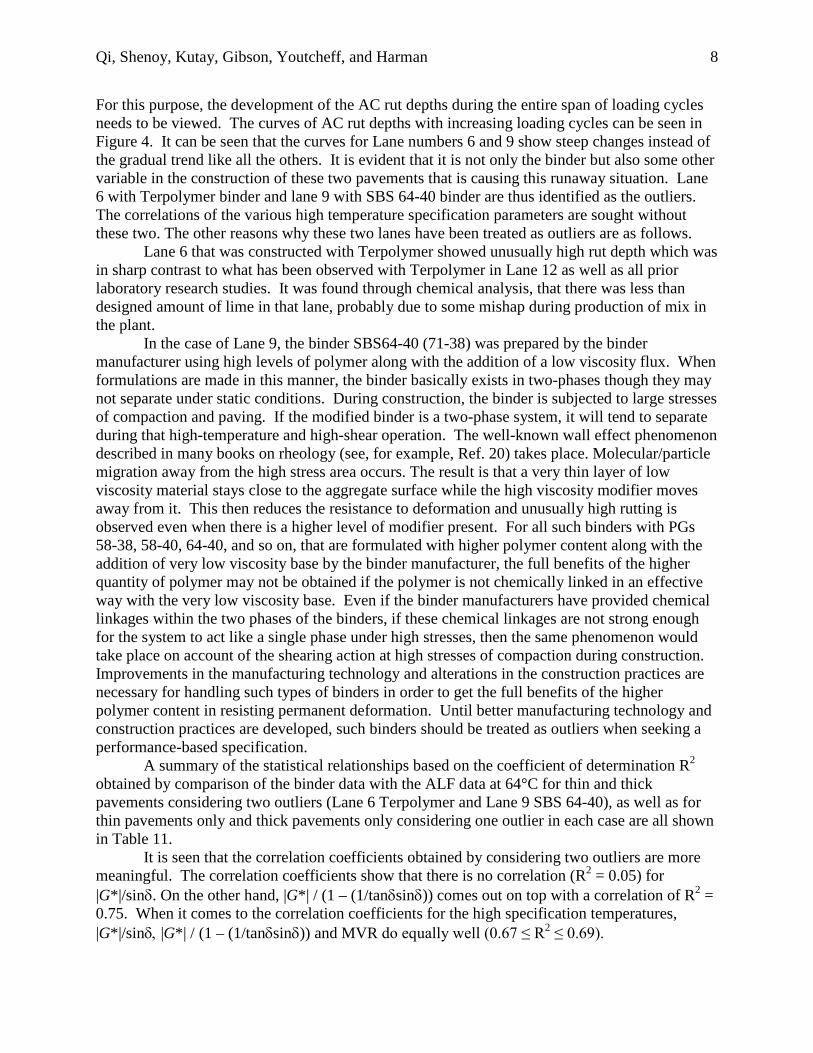
Rutting tests at 74C (see Figure 5) showed the same rankings for the different binders as those at 64C (see Figure 4 (a)) except that Lane 4 (SBS-LG) and Lane 7 (Fiber) have swapped. Rutting tests at 45C (see Figure 6) also showed the same rankings as those at 64C (see Figure 4 (b)). In summary, the change in rutting testing temperatures almost did not change the rankings of pavement performance for different asphalt binders.
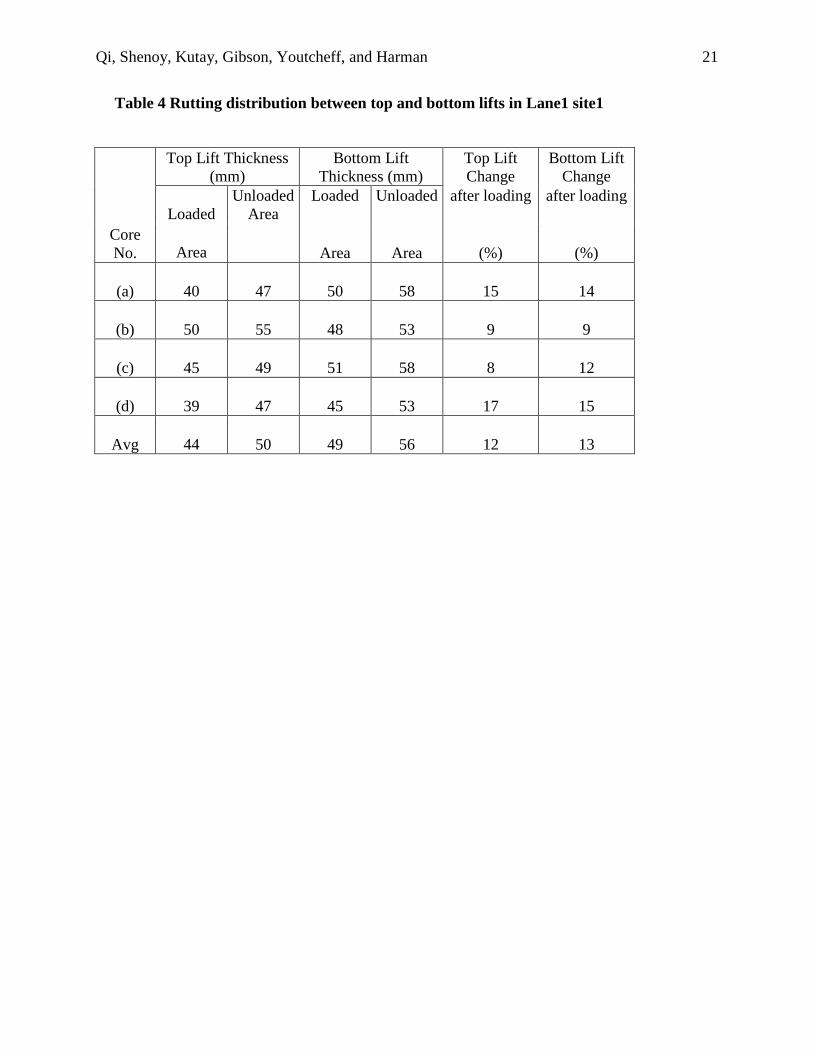
For Lane 1 rutting testing site, 4 pavement cores with 6 in. diameter, were also cut to investigate the rutting distribution between top and bottom lifts. Each core was cut at such location so that half of the core was at the channelized-loading area and the other half was at the unloaded area. The lift thickness was measured at both sides of loaded and unloaded areas. Comparing the top and bottom lift changes after loading should provide indication of the rutting distribution between top and bottom lifts. Table 4 summarizes the information. In average, the percent of change in top lift is almost the same as that in bottom lift. This indicates that the HMA layer rutting in Lane 1 rutting test site is evenly distributed in the top and bottom lifts. On the other hand, fatigue cracking in lane 1 began on the bottom and progressed through the control layer and was arrested at the Arizona Crumb Rubber layer. LABORATORY BINDER TESTS AND CORRELATIONS WITH ALF
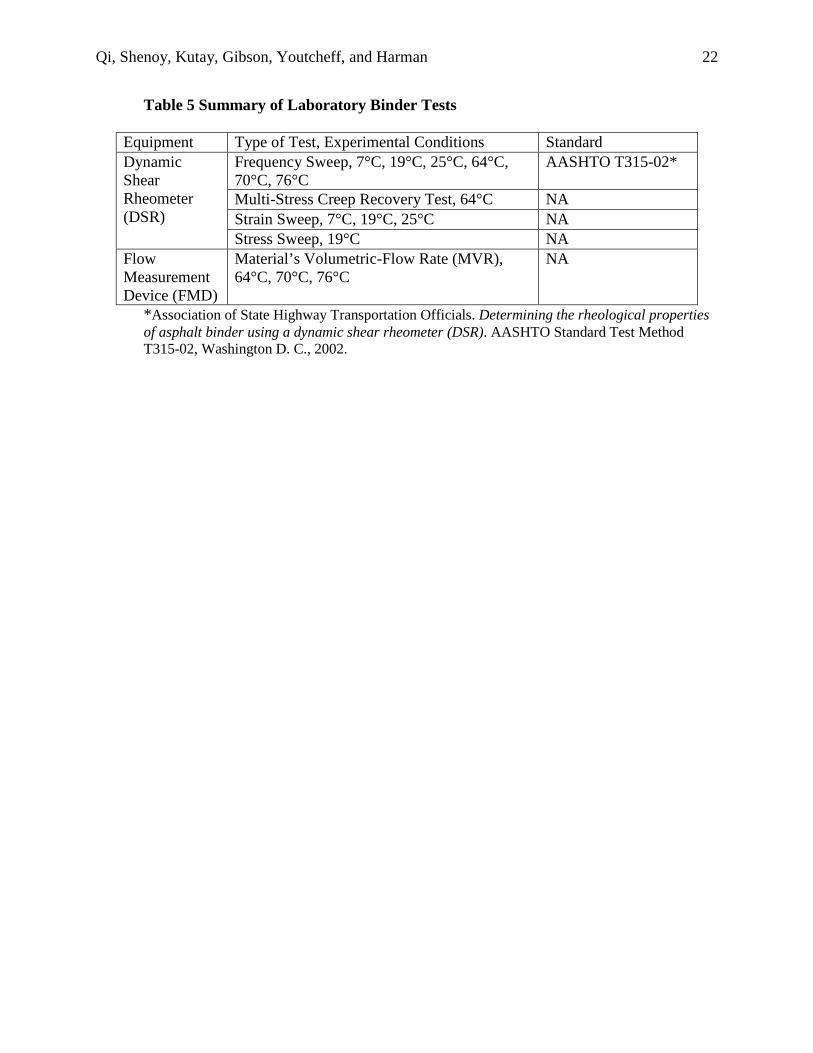
Extensive laboratory tests have been conducted on the asphalt binders used in the ALF test pavements. The type of binder tests and testing conditions used in this study are shown in Table 5.

Qi, Shenoy, Kutay, Gibson, Youtcheff, and Harman
7
Binder Fatigue Tests
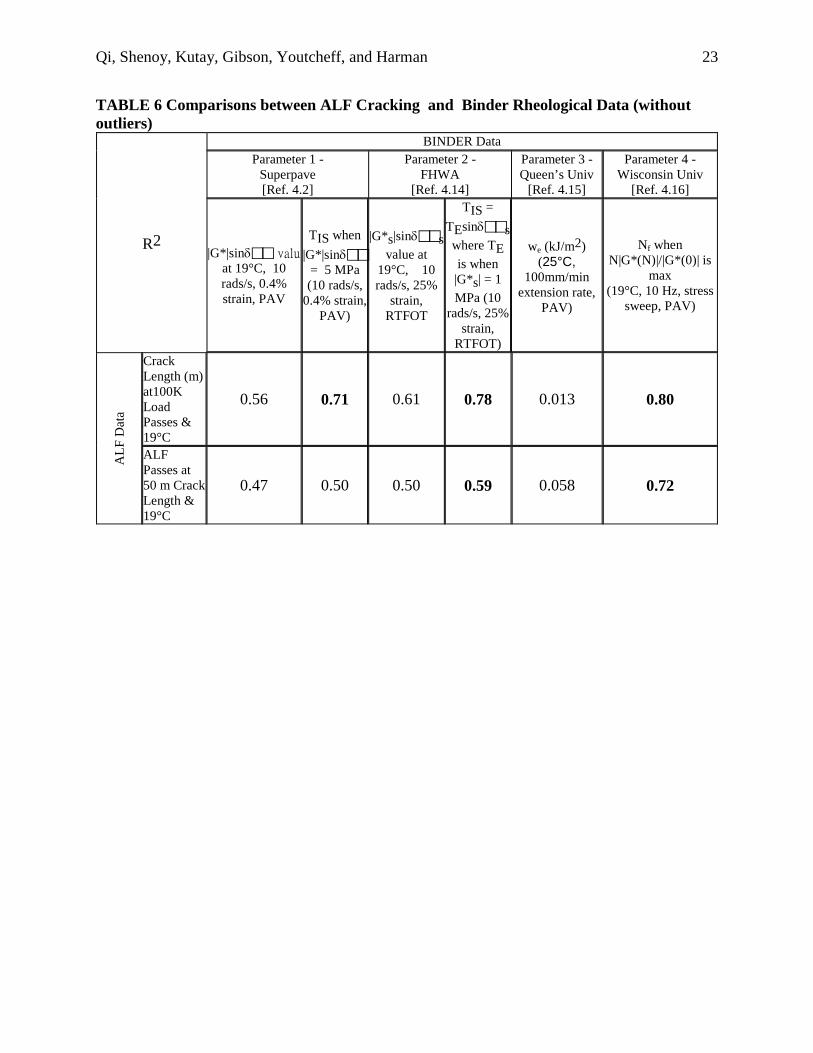
In seeking a correlation of ALF fatigue cracking performance to binder data, four parameters were evaluated – (1) The conventional |G*|sinδ (6) obtained from the time or frequency sweep at low strains, (2) |G*S|sinδS (7) obtained from DSR strain sweep at high strains, (3) EWF (8), which is the essential work of fracture, and (4) Nf which is the number of cycles to fatigue failure obtained from a stress sweep (9). The comparisons were made with crack lengths (m) at 100K loads and ALF passes at 50m and 20m crack lengths, and statistical relationships based on the coefficient of determination R2 obtained for a linear fit are shown in Table 6.
It is seen that while the Essential Work of Fracture (we) proposed by the Queen’s University (8) did not show a good correlation, the Superpave current specification and the proposed refinement by Shenoy (7) showed reasonably good correlations. The method proposed by Wisconsin University (9) that uses a stress-controlled experiment to determine the cycles to failure showed a better correlation; however, the trend was reversed based on the ranking as can be seen from comparison of the results shown in Tables 7-8. The number of cycles to failure for the worse material is higher while that for the better material is lower, which is the wrong trend.
Binder Rutting Tests In seeking a correlation of ALF rutting performance to binder data, four parameters were evaluated – (1) The conventional |G*|/sinδ (6), which is the inverse of the loss compliance obtained from the time or frequency sweep, (2) JNR (10,11), which is the non-recovered compliance obtained from DSR multi-stress creep recovery tests (MSCR), (3) |G*|/(1-1/tanδsinδ) (12, 13, 14, 15), which is the inverse of the non-recovered compliance obtained from DSR time or frequency sweep, and (4) MVR (16, 17), which is the material’s volumetric-flow rate obtained from the flow measuring device (FMD).
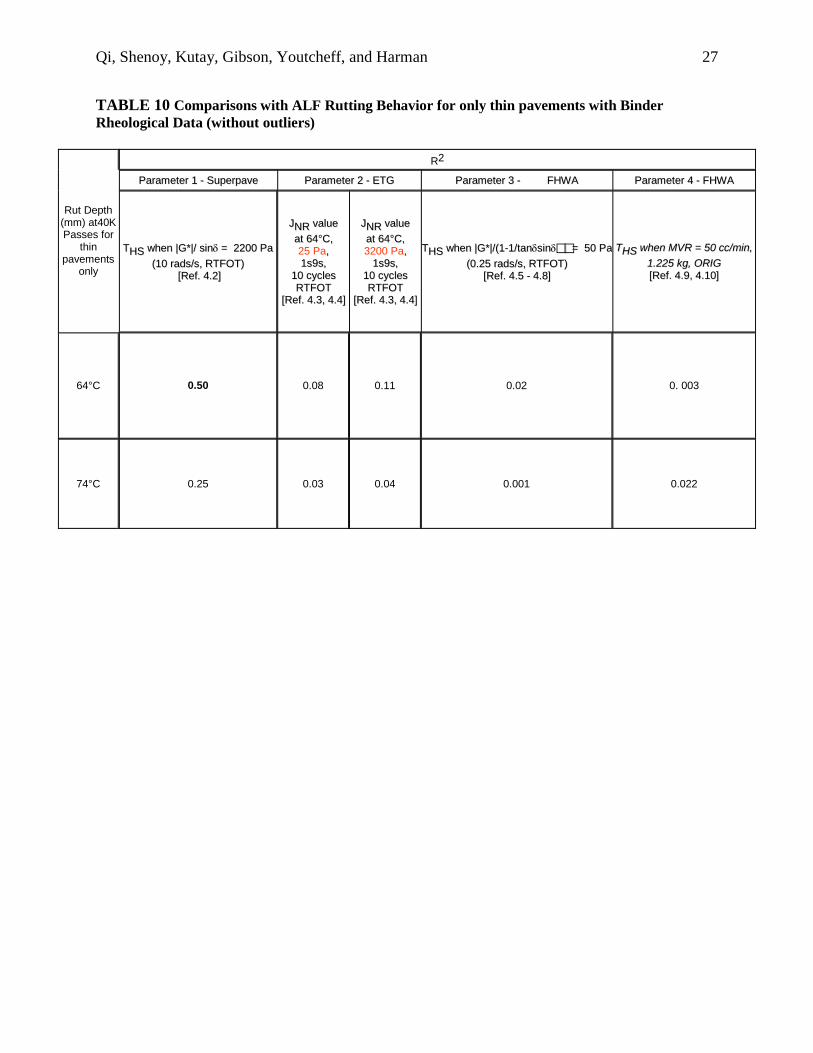
The comparisons were made with rut depth after 40,000 ALF passes for 64°C pavements considering no outliers. Statistical relationships based on the coefficient of determination R2 obtained for a linear fit are shown in Table 9. Similar trends were obtained when comparisons were made with rut depth after 40,000 ALF passes for 74°C pavements considering no outliers. Note that the 74°C ALF data was generated for thin pavements only. Comparison for the two temperatures of 64°C and 74°C are shown in Table 10
Based on Tables 9 and 10, the existing specification parameter |G*|/sinδ does reasonably well and is among the top of the list in the correlation while most of the proposed parameters fail to show any correlation with the AC rut depths. This cannot be true given the fact that it has been shown through earlier research (18, 19) that |G*|/sinδ fails to capture the rutting behavior of polymer-modified binders. It is thus obvious that such spurious correlations are the result of outliers that are offsetting the actual trends. An attempt was thus made to identify the possible outliers. In all fairness, in order to show differences in the rutting behavior of pavements constructed with binders that are rheologically different, it is important that all variations are minimized except for the binder rheological property. From a practical viewpoint, this is almost impossible to achieve. The aggregate type and mix design are the same and utmost care wais taken during construction to maintain uniformity. However, there are certain construction issues that could lead to some degree of variability between pavements that were intended to be constructed the same. It is important to identify pavements that have an abnormal response and could be termed as outliers.
Qi, Shenoy, Kutay, Gibson, Youtcheff, and Harman
8
For this purpose, the development of the AC rut depths during the entire span of loading cycles needs to be viewed. The curves of AC rut depths with increasing loading cycles can be seen in Figure 4. It can be seen that the curves for Lane numbers 6 and 9 show steep changes instead of the gradual trend like all the others. It is evident that it is not only the binder but also some other variable in the construction of these two pavements that is causing this runaway situation. Lane 6 with Terpolymer binder and lane 9 with SBS 64-40 binder are thus identified as the outliers. The correlations of the various high temperature specification parameters are sought without these two. The other reasons why these two lanes have been treated as outliers are as follows.
Lane 6 that was constructed with Terpolymer showed unusually high rut depth which was in sharp contrast to what has been observed with Terpolymer in Lane 12 as well as all prior laboratory research studies. It was found through chemical analysis, that there was less than designed amount of lime in that lane, probably due to some mishap during production of mix in the plant.
In the case of Lane 9, the binder SBS64-40 (71-38) was prepared by the binder manufacturer using high levels of polymer along with the addition of a low viscosity flux. When formulations are made in this manner, the binder basically exists in two-phases though they may not separate under static conditions. During construction, the binder is subjected to large stresses of compaction and paving. If the modified binder is a two-phase system, it will tend to separate during that high-temperature and high-shear operation. The well-known wall effect phenomenon described in many books on rheology (see, for example, Ref. 20) takes place. Molecular/particle migration away from the high stress area occurs. The result is that a very thin layer of low viscosity material stays close to the aggregate surface while the high viscosity modifier moves away from it. This then reduces the resistance to deformation and unusually high rutting is observed even when there is a higher level of modifier present. For all such binders with PGs 58-38, 58-40, 64-40, and so on, that are formulated with higher polymer content along with the addition of very low viscosity base by the binder manufacturer, the full benefits of the higher quantity of polymer may not be obtained if the polymer is not chemically linked in an effective way with the very low viscosity base. Even if the binder manufacturers have provided chemical linkages within the two phases of the binders, if these chemical linkages are not strong enough for the system to act like a single phase under high stresses, then the same phenomenon would take place on account of the shearing action at high stresses of compaction during construction. Improvements in the manufacturing technology and alterations in the construction practices are necessary for handling such types of binders in order to get the full benefits of the higher polymer content in resisting permanent deformation. Until better manufacturing technology and construction practices are developed, such binders should be treated as outliers when seeking a performance-based specification.
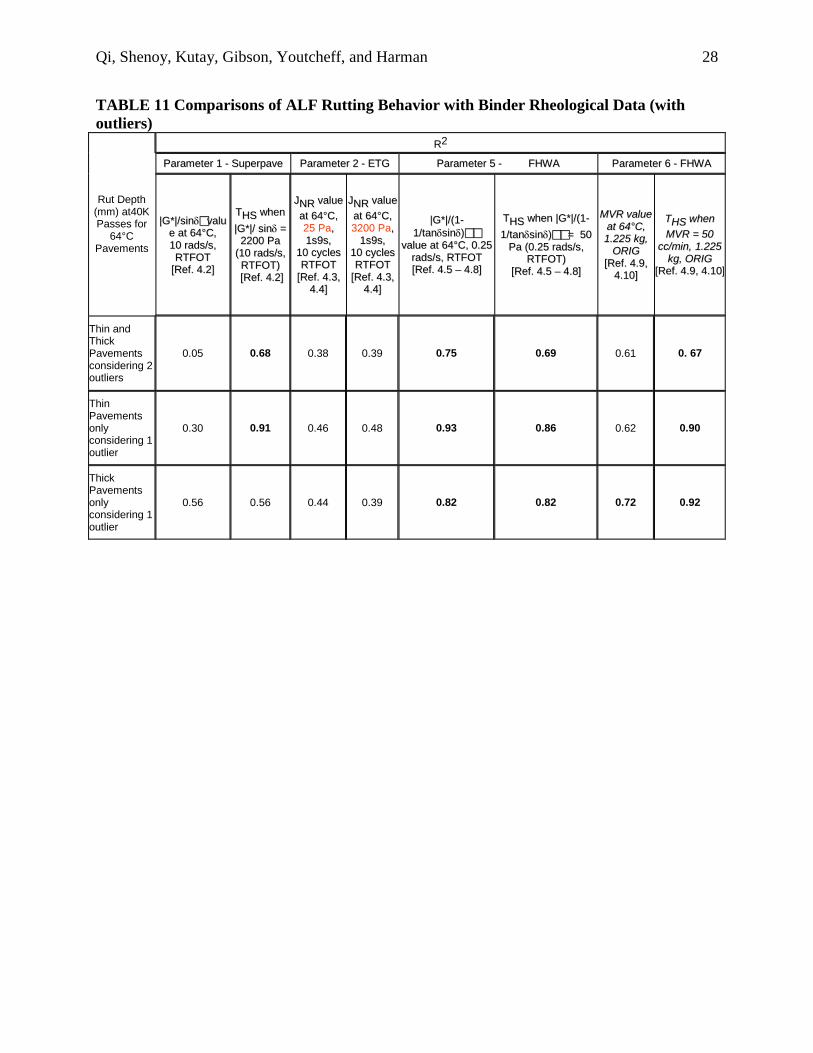
A summary of the statistical relationships based on the coefficient of determination R2 obtained by comparison of the binder data with the ALF data at 64°C for thin and thick pavements considering two outliers (Lane 6 Terpolymer and Lane 9 SBS 64-40), as well as for thin pavements only and thick pavements only considering one outlier in each case are all shown in Table 11.
It is seen that the correlation coefficients obtained by considering two outliers are more meaningful. The correlation coefficients show that there is no correlation (R2 = 0.05) for |G*|/sinδ. On the other hand, |G*| / (1 – (1/tanδsinδ)) comes out on top with a correlation of R2 = 0.75. When it comes to the correlation coefficients for the high specification temperatures, |G*|/sinδ, |G*| / (1 – (1/tanδsinδ)) and MVR do equally well (0.67 ≤ R2 ≤ 0.69).

Qi, Shenoy, Kutay, Gibson, Youtcheff, and Harman
9
When only thin pavements are considered with 1 outlier, the correlation coefficients show that there is a poor correlation (R2 = 0.30) for |G*|/sinδ, but again |G*| / (1 – (1/tanδsinδ)) comes out on top with a correlation of R2 = 0.93. When it comes to the correlation coefficients for the high specification temperatures, |G*|/sinδ, |G*| / (1 – (1/tanδsinδ)) and MVR do equally well (0.86 ≤ R2 ≤ 0.91).
Similarly, when only thin pavements are considered with 1 outlier, the correlation coefficients show that there is a reasonable correlation (R2 = 0.56) for |G*|/sinδ, and once again |G*| / (1 – (1/tanδsinδ)) comes out on top with a correlation of R2 = 0.82. When it comes to the correlation coefficients for the high specification temperatures, while for |G*|/sinδ, the correlation is reasonable (R2 = 0.56), |G*| / (1 – (1/tanδsinδ)) and MVR have much higher correlation coefficients (R2 = 0.82 and 92, respectively).
In summary, it is seen that in all cases, the parameter |G*| / (1 – (1/tanδsinδ)) tops the list as the best performer, and has the highest potential to replace the current specification parameter |G*|/sinδ. As noted earlier, |G*| / (1 – (1/tanδsinδ)) is the inverse of the nonrecovered compliance and is seen to show a much better representation of the rutting behavior of the pavements than |G*| / sinδ which is the inverse of the loss compliance. While this measure of the nonrecovered compliance is obtained from the dynamic oscillatory test, the other method of obtaining the nonrecovered compliance is from the creep and recovery test. The two methods are very different in the way data gets generated and handled and, also, in the level of ease or difficulty in data generation. The multiple stress creep recovery (MSCR) test was pursued with the idea of getting the nonrecovered compliance using that route. When there are two tests being proposed that can supposedly give the same outcome, it is only fair that a one-on-one comparison of the merits and demerits is done between the two in order to ascertain which of the two is more reliable, more fundamental, easier to use, and better to implement. This was precisely done in Ref.15 which presents a comparison of the nonrecovered compliance from the dynamic oscillatory test vis-à-vis the nonrecovered compliance from the multiple stress creep recovery test. There are a number of concerns with respect to the use of the MSCR test. These have been addressed in details in Ref. 15 which may be referred for a complete understanding as to why the nonrecovered compliance from the dynamic oscillatory test should be preferred to the nonrecovered compliance from the MSCR test.
The specification temperature based on the parameter MVR also has an excellent potential for determination of the high temperature specification. Being the simplest of the rheological parameters, it is recommended for performance grading of polymer-modified asphalts on a routine basis for quality control and quality assurance purposes as outlined in Ref. 16, 17.
LABORATORY MIXTURE TESTS AND CORELATIONS WITH ALF
Mixture Fatigue Tests
A battery of cyclic laboratory push-pull (tension-compression) tests was conducted in both stress and strain controlled testing modes. Specimens were prepared in a Superpave gyratory compactor to a height of approximately 180 mm and then cut and cored to a cylindrical sample 71.4 mm in diameter and 150 mm tall. The mix designs of the laboratory specimens were the same as the field ALF sections. Three replicates from each ALF mixture were tested. For both stress and strain controlled tests, the testing frequency and temperature were 10Hz and 19oC,

Qi, Shenoy, Kutay, Gibson, Youtcheff, and Harman
10
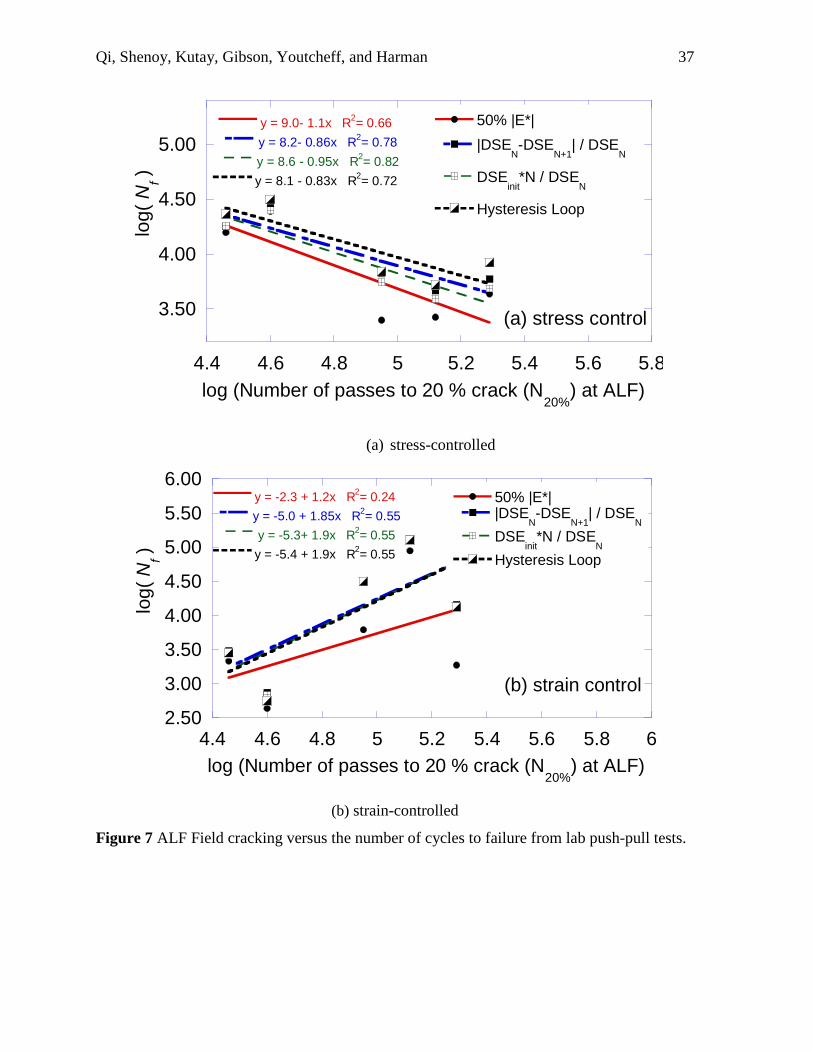
respectively. For the stress controlled tests, the magnitude of the applied peak stress (in both tension and compression states) was 610 kPa or peak-to-peak 1220 kPa. The average predicted bottom-of-the-asphalt tensile stresses were 2153 kPa and 1437 kPa for the 100 mm and 150 mm ALF lanes respectively (21). It may be inferred that the actual tensile stresses were larger. However, the applied stress level in the laboratory provided reasonable test duration and was of a relevant order of magnitude. During strain controlled tests, the strain at the actuator LVDT (not on-specimen mounted LVDT) was controlled. This was primarily due to possible problems associated with on-specimen mounted LVDT strain controlled tests. For example, if a problem occurs on the LVDT for which closed loop feedback test is controlled (such as the detachment of the LVDT holder pins from the specimen), the actuator may easily become unstable and apply a very high load for a fraction of a second damaging the specimen and other LVDTs. A disadvantage of actuator LVDT strain controlled test is that the actuator strain is usually 1.1 to 3 times greater than the on-specimen mounted LVDT strain during tests run at high frequencies (e.g., 10Hz). This was more than likely due to the end effects. The strain level at the actuator strain gauge was selected such that the initial LVDT strain on the specimen was about 300 microstrains. As a result of actuator strain controlled tests, the LVDT strain typically do not remain constant during testing. Therefore, the tests should not be considered a truly strain controlled test. While this may seem problematic when a parameter such as the number of cycles to failure is used to compare different mixtures, this did not pose any problem when the test results were analyzed using the viscoelastic continuum damage (VECD) concept. The VECD method normalizes (or reduces) all the effects of loading mode, frequency and testing temperature into a single damage characteristic relationship (22). Conventional Analysis of Laboratory Fatigue Data In order to compare the ALF fatigue data with the laboratory tests, the number of ALF wheel passes to 20 % crack length (N20%) was plotted against the Nf in Figures 7(a) and 7(b) for the stress and strain controlled tests, respectively. The trend in Figure 7(a) was somehow unexpected where there seems to be an inverse relationship between the stress controlled Nf and N20%. This phenomenon was attributed to the mode of loading (i.e. the stress control) where the failure occurs abruptly once a macro crack initiates during stress controlled tests. Therefore, any information on crack propagation after initiation cannot be gained in stress controlled tests whereas field fatigue behavior under the ALF includes a combination of crack initiation and propagation to the surface. The trend between Nf in strain controlled tests and the N20% was more meaningful (i.e., as Nf increases N20% increases) as shown in Figure 7(b). However, the degrees of correlation are relatively low. Therefore, there is a need for better interpretation of fatigue test data through utilization of advanced mathematical theories to unify stress and strain control as well as temperature and loading frequency effects into a single framework. Analysis of Mixtures using Viscoelastic Continuum Damage (VECD) Theory The viscoelastic continuum damage (VECD) concept has been successfully utilized by numerous researchers to study the fatigue response of asphalt mixtures (23-28). The VECD theory is based on Shapery’s elastic-viscoelastic correspondence principle and the work potential theory (29). According to the theory, one can simplify the time dependent viscoelastic problem into a linearly

Qi, Shenoy, Kutay, Gibson, Youtcheff, and Harman
11
elastic solution by use of the concept of the pseudostrain. Nonlinear behavior caused by distributed microcracks are accounted by use of the so-called internal state variables which define the damage growth within the specimen (29).
For the general case, the VECD theory often requires solving a complex set of equations to compute the internal state variables which define the damage growth within the specimen. However, the equations can be simplified into an analytical form if the testing is performed at a constant frequency. As part of the ALF fatigue characterization, a practical (simplified) equation to calculate the continuum damage parameter (S) was derived for the specific case of cyclic tests at a fixed frequency. Details of the derivations can be found in Reference (22) and similar approach from Christensen and Bonaquist (30). Simplified damage equations were successfully validated using laboratory tests performed under different temperature, frequency and load conditions from which the damage characteristic curves were calibrated. In order to compare the performance of the different ALF mixtures, a (true) strain-controlled push-pull test at T=19oC and f=10 Hz for an applied peak to peak strain of εo = 150x10-6 was simulated using the practical VECD equations. Figures 8(a) and 8(b) show the decrease in dynamic modulus (|E*|) and pseudostiffness (C) over the cycles for different specimens.
Figure 8(a) indicates that stiff mixtures such as Air Blown and Control 70-22 have a sharper decrease in |E*| with increasing cycles than soft polymer modified mixtures such as CR-TB, SBS-LG and Terpolymer. This agrees very well with the observations seen at ALF sections. In order to perform a direct comparison with ALF field data, the number of cycles to failure (Nf) was needed. Using Figure 8(b), the Nf was determined based on the 50 % reduction in pseudostiffness (i.e., C=0.5. Based on Nf, the ranking of the mixtures from best to worst are as follows: Terpolymer, SBS-LG, CR-TB, Fiber, Control and AB. Excluding Terpolymer and Fiber, this is the same ranking as the field. The Terpolymer mixture was reported in the field as the third best performer (after Fiber and SBS-LG) in the 100mm thick pavement lanes. However, this mixture was expected to perform the best based on historical experience and numerous laboratory binder and mixture tests. In fact, Terpolymer mixture performed among the best among the 150 mm pavement lanes at the ALF. During the construction of the ALF lanes, several problems have been reported for the Terpolymer lane with inadequate hydrated lime distribution being the primary culprit. Therefore, slightly worse performance of the Terpolymer (in 100mm lane) was attributed to construction related reasons. On the other hand, the apparent good performance of Fiber mixture in the field may be due to its cracking pattern obscuring existing greater damage. It was observed that even though many small (micro) cracks developed on the surface of the Fiber lane, they did not coalesce and lead to a large alligator type cracks which was seen in other lanes. In other words, the fiber provided the benefit it was intended. It should be noted that the Fiber mixture is the same as Control 70-22 mixture except that it has 0.2 % polyester fiber by mass of the aggregate. Therefore, it was thought that even though the damage occurred earlier in Fiber lane in the form of small cracks, they did not propagate to form large cracks due to the reinforcing effect of the fibers in the mixture. Therefore, crack mapping at the surface of Fiber lane may not be representative of damage occurred within the pavement. Due to aforementioned reasons, field data (at 100 mm lanes) for the Fiber and Terpolymer mixtures should be interpreted cautiously. Figure 9 shows the VECD modeled number of cycles to failure (Nf) versus the number of ALF wheel passes to 20% crack length (i.e., N20%) in the field. Excluding outliers Terpolymer and Fiber, the rest of the mixtures exhibited an excellent relationship between the VECD modeled Nf and the field cracking data.

Qi, Shenoy, Kutay, Gibson, Youtcheff, and Harman
12
Mixture Rutting Tests Unconfined High Stress Ratio Flow Number Tests High stress ratio flow number (FN) tests were run on ALF mixtures at a temperature of 64oC, deviatoric stress (σd) of 850 kPa, and confining stress (σ3) of 35 kPa. The specimens included plant produced laboratory compacted (PPLC) mixtures as well as several laboratory produced laboratory compacted (LPLC) specimens for comparison purposes. Table 12 shows mean, standard deviation and coefficient of variation (COV) values of FN, cycles to 2% strain (N2%), and Microstrain (µε) at 986 cycles (εN=986). Table 12 indicates that the COV values (i.e., the variability) for the FN is significantly higher than those of N2% and εN=986. This is possibly due to the difficulties associated with determination of the third inflection point in strain versus cycles graph. On the other hand COV of εN=986 was the lowest. Furthermore, amongst the parameters obtained from the FN test shown in Table 12 (i.e., FN, N2%, and εN=986), εN=986 exhibited the best relationship with the field data. Therefore, this variable is used for comparison as shown in Figure 10. Figures 10(a) and 10(b) show the laboratory high stress ratio FN number test data versus ALF field rut depth for 150 mm and 100 mm lanes, respectively. The comparisons of other variables are not shown here for brevity. Figure 10 indicates that the relationship between the field and the FN data is very low for both 150 mm and 100 mm ALF lanes. This was attributed partly to the air void differences observed in the field cores and partly to the stress level differences between the laboratory and field conditions. It should be noted that FN tests on ALF mixtures were conducted at the as-designed air void level of 7%. Confined Low Stress Ratio Flow Number Tests Low stress ratio (confined) flow number (FN) tests were run on ALF LPLC mixtures at a temperature of 64oC, deviatoric stress (σd) of 523 kPa, and confining stress (σ3) of 69 kPa. At this stress state, none of the specimens exhibited a tertiary flow and all went to 20000 cycles, which is the maximum number of cycles that the SPT can record. Table 13 shows mean, standard deviation and coefficient of variation (COV) values of cycles to 2% strain (N2%), and microstrain (µε) at 20000 cycles (εN=20000). Table 13 does not include the FN since a tertiary flow was not observed in any of the specimens. Figures 11(a) and 11(b) show the laboratory low stress ratio (confined) FN number test data versus ALF field rut depth graphs for 150 mm and 100 mm lanes, respectively. Figure 11(a) indicates that confined FN test seems to have captured the rutting behavior of thick (150 mm) pavement lanes, where the coefficient of correlation (R2) is 0.81. However, this R2 should be cautiously interpreted since the ALF rutting data is not significantly different for different binders as manifested by the vertical error bars. But the trend is successfully captured by the FN tests. On the other hand, there is no relationship between the field data for 100 mm lanes and the confined FN test results, Figure 11(b). SUMMARY AND CONCLUSIONS 1. A wide range of fatigue performance has been observed from the 12 lanes of FHWA’s ALF
pavements constructed with various modified binders. For lanes 1 to 7 with 100-mm HMA
Qi, Shenoy, Kutay, Gibson, Youtcheff, and Harman
13
pavements, the pavements modified with polymers and AR binders exhibited better fatigue performance than those with air blown and control binders: Lane 1 with CR-AZ binder showed the best fatigue cracking resistance, i.e., no crack was found on the pavement surface after 300,000 ALF passes; followed by Lane 7 with fibers, Lane 4 with SBS-LG, Lane 6 with Terpolymer, Lane 5 with CR-TB, Lane 2 with control binder, and the worst fatigue performance for Lane 3 with air-blown binder. For lanes 8 to 12 with 150-mm HMA pavements, after more than 300,000 ALF load passes, Lane 10 with air blown has significant cracks; Lanes 8 (control) and 9 with SBS 64-40 showed minor cracking; Lane 11 with SBS LG and 12 with Terpolymer have not shown any crack yet.
2. ALF rutting results at 64 oC for the 100-mm HMA pavements show that there are different levels of rutting resistant performance: Lane 5 with CR-TB is the best, Lane 6 with Terpolymer is the worst, and the remaining lanes are in the middle. For the 150-mm HMA pavements, the best performance is the Lane 12 with Terpolymer, which is just opposite to the 100-mm pavements; the worst one is the Lane 9 with SBS 64-40, and the other lanes are in the middle.
3. ALF Rutting tests at 74C showed the same rankings for the different binders as those at 64C except that Lane 4 with SBS-LG and Lane 7 with Fiber have swapped. Rutting tests at 45C also showed the same rankings as those at 64C. In summary, the change in rutting testing temperatures almost did not change the rankings of pavement performance for different asphalt binders.
4. Replicate rutting tests were conducted in Lane 9, Site1 and Site 2, with binder SBS 64-40 to see the variation between the replicate tests. Statistical tests on means of rutting from replicate tests showed no significant difference at all ALF load passes.
5. Pavement cores have been cut and indicate that the HMA layer rutting in Lane 1 rutting test site is evenly distributed in the top lift (CR-AZ) and bottom lift (control).
6. ALF fatigue cracking performance data have been compared to four binder parameters: (1) the conventional |G*|sinδ obtained from the time or frequency sweep at low strains, (2) |G*S|sinδS obtained from DSR strain sweep at high strains, (3) the essential work of fracture (EWF), and (4) the number of cycles to fatigue failure (Nf,) obtained from a stress sweep. The Essential Work of Fracture did not show a good correlation with ALF data. The Superpave current specification and the proposed refinement by Shenoy showed reasonably good correlations. The number of cycles to fatigue failure from a stress sweep showed a better correlation, however, the trend was reversed: the number of cycles to failure for the worse material is higher while that for the better material is lower, which is the wrong trend.
7. ALF rutting performance data has been compared to four binder parameters – (1) The conventional |G*|/sinδ, (2) JNR obtained from DSR multi-stress creep recovery tests (MSCR), (3) |G*|/(1-1/tanδsinδ) obtained from DSR time or frequency sweep, and (4) MVR obtained from the flow measuring device (FMD). It was found that without considering outliers, the conventional |G*|/sinδ showed the best correlation. However, since past research has shown the ineffectiveness of |G*|/sinδ in evaluating the rutting performance of polymer-modified asphalts, correlations were sought by considering possible outliers. It was seen that the term |G*|/(1-1/tanδsinδ) obtained from DSR time or frequency sweep showed the best correlation from among the considered binder parameters in all cases for the thin and thick pavements evaluated together and separately when outliers were kept out of the correlations.
8. In stress controlled push-pull tests on mixtures, Nf versus field number of wheel passes to 20 % crack length (N20%) revealed an inverse relationship, i.e., good performing mixtures in the
Qi, Shenoy, Kutay, Gibson, Youtcheff, and Harman
14
field performed poorly in the lab. This was attributed to the testing mode where it was observed that the soft mixtures performed worse in stress controlled tests whereas they performed well in the field. Once a small crack developed in the mixtures in stress controlled tests, the specimens quickly failed without providing information on crack propagation. However, crack propagation is very important in the field where small cracks may never appear at the surface if the crack propagation rate of the mixture is small. Therefore, Nf based on stress controlled push-pull tests are not recommended for fatigue characterization.
9. Strain controlled Nf in mixture testing generally exhibited similar trends when compared to the field. However, due to the nature of the testing where the strain was controlled at the actuator, which was not a true strain controlled test, the field ranking was not strongly captured. Therefore, Nf based on actuator strain controlled tests (not on-specimen LVDT strain controlled) may not be sufficient to understand the field fatigue behavior.
10. Analysis of laboratory (mixture) fatigue data using the Viscoelastic Continuum Damage theory has the ability to accommodate stress control and strain control laboratory behavior in a single framework and may be very useful to understand field behavior. Once the damage characteristic curves, i.e., pseudostiffness (C) versus damage parameter (S) relationships are established from laboratory tests, more accurate characterization of the mixtures can be performed through simple analytical modeling. Ranking based on simple analytical modeling of a strain controlled test captured the field behavior very well.
11. The different ALF mixtures and structures with very different polymer modified binders (but approximately same binder grade) are actually quite similar. Similarity in rutting among the ALF lanes may be interpreted as successful experimental design around similar high temperature PG Grades. Laboratory SPT Flow Number experiments also reflect similarity of mixtures performance when considering variability.
12. Choice of stress level seems to have influence on the correlation with the rutting of the pavements with different thicknesses. High stress ratio (unconfined) FN tests seemed to have provided better relationship with rutting in thin (100 mm) pavements than rutting in thick (150mm) pavements. However, low stress ratio (confined) FN tests provided very good relationship with rutting in thick (150 mm) pavements, and no relationship with thin (100 mm) pavements. Therefore, it is suggested that the thickness of the pavement should be considered when running laboratory FN tests. Unconfined (high stress ratio) FN seems to be best suited for thin pavements, whereas, confined (low stress ratio) FN test may be better for thick pavements.
ACKNOWLEDGMENTS The work presented here was conducted as part of national pooled fund study TPF-5(019), which is partially funded by 15 State highway agencies (CT, FL, IL, IN, KS, MD, MI, MS, MT, NE, NV, NJ, NM, NY, and TX) with materials provided by the asphalt industry; funds are also provided by the FHWA, and the study is staffed by FHWA and its contractors. REFERENCE:
1. Mitchell, T., Stuart, K., Qi, X., AL-Khateeb, G., Youtcheff, J., Harman, T. “ALF Testing for Development of Improved Superpave Binder Specification,” Proceedings CD-ROM

Qi, Shenoy, Kutay, Gibson, Youtcheff, and Harman
15
of 2004 2nd International Conference on Accelerated Pavement Testing, Minneapolis, Minnesota, September 2004.
2. Qi, X., Mitchell, T., Stuart, K., Youtcheff, J., Petros, K., Harman, T., Al-Khateeb, G. “Strain Responses in ALF Modified-Binder Pavement Study” Proceedings CD-ROM of 2004 2nd International Conference on Accelerated Pavement Testing, Minneapolis, Minnesota, September 2004.
3. Qi, X., Al-Khateeb, G., Mitchell, T., Stuart, K. and Youtcheff, J. “Determining Modified Asphalt Binder Properties for the Superpave Specification”, Report on the construction of pavements with modified asphalt binders, Pooled Fund study TPF-5 (019), Internal Report, January 2004.
4. Qi, X., Mitchell, T. and Harman, T. “Evaluation of Aggregate Base Course for the FHWA’s New Pooled. Fund Accelerated Testing Pavements.” Proceedings of the 5th International Conference of Transportation Professionals, Xian, China, 2005
5. Qi, X., Gibson, N., and Youtcheff, J., “Fatigue cracking characteristics of accelerated testing pavements with modified binders,” paper accepted for presentation and publication in the 6th RILEM International Conference on Cracking in Pavements, Chicago, Illinois, June 16-18, 2008.
6. Anderson, D. A., et al. (1994) “Binder characterization and evaluation, Vol. 3: Physical characterization.” Report SHRP-A-369, Strategic Highway Program, National Research Council, Washington, DC.
7. Shenoy, Aroon (2002), “Fatigue testing and evaluation of asphalt binders using the dynamic shear rheometer”, ASTM - Journal of Testing and Evaluation, 30(4), 303-312.
8. Andriescu, A., Hesp, S. A. M. and Youtcheff, J. S. (2004). “On the Essential and Plastic Works of Ductile Fracture in Asphalt Binders.” Presented at 83rd Annual Meeting of the Transportation Research Board, Washington DC. Published in Transportation Research Record 1875, pp. 1-8.
9. Martono Wilfung, Eyad Masad, Hussain U. Bahia and John D’Angelo, “Using stress sweep to estimate fatigue performance of asphalt binders”, submitted for possible publication.
10. D’Angelo, John and Dongré, Raj. (2004). “Multi-stress creep recovery: A new approach to the refinement of high temperature binder specification.” 41st Annual Meeting of the Petersen Asphalt Research Conference, Cheyenne, WY.
11. Dongré, Raj N., and D’Angelo, John A. (2006). “Development of a high temperature performance-based specification in the United States.” 10th International Conference on Asphalt Pavements, Quebec, Canada.
12. Shenoy, Aroon (2001). “Refinement of the Superpave specification parameter for performance grading of asphalt.” J. Transportation Engineering, 127(5), 357-362.
13. Shenoy, Aroon (2004). “High temperature performance grading of asphalts through a specification criterion that could capture field performance.” J. Transportation Engineering, 130(1), 132-137.
14. Shenoy, Aroon (2004). “A comprehensive treatise of the high temperature specification parameter, 14 (6), 303-314.
15. Shenoy, Aroon (2008). “Nonrecovered compliance from dynamic oscillatory test vis-a-vis nonrecovered compliance from multiple stress creep recovery test in the dynamic shear rheometer.” International Journal of Pavement Engineering, 9(4)
16. Shenoy, Aroon (2001). “High temperature performance grade specification of asphalt binder from the material’s volumetric-flow rate.” Materials and Structures, 34, 629-635.
Qi, Shenoy, Kutay, Gibson, Youtcheff, and Harman
16
17. Shenoy, Aroon (2000). “Material’s volumetric-flow rate (MVR) as a unification parameter in asphalt rheology and quality control / quality assurance tool for high temperature performance grading.” Applied Rheology, 10(6), 288-306.
18. Bahia, H. U., Zeng, M., Zhai, H. and Khatri, A. (1999). “Superpave protocols for modified asphalt binders.” 15th Quarterly Progress Rep. for NCHRP Proj. 9-10, National Cooperative Highway Research Program, Washington D.C.
19. Bahia, H. U., Hanson, D. I., Zeng, M., Zhai, H., Khatri, M. A. and Anderson, M. A. (2001). “Characterization of modified asphalt binders in Superpave mix design.” National Cooperative Highway Research Program NCHRP Report 459, Transportation Research Board - National Research Council, National Academy Press, Washington D.C.
20. Shenoy, Aroon (1999). “Rheology of Filled Polymer Systems” Kluwer Academic Publishers, Netherlands.
21. G. Al-Khateeb, N. H. Gibson, and X. Qi “Mechanistic analyses of the FHWA's accelerated loading facility pavements: primary response”, Transportation Research Board Annual Meeting CD ROM. January 2007, Washington, D.C.
22. M. Emin Kutay, Nelson Gibson and Jack Youtcheff “Conventional and Viscoelastic Continuum Damage (VECD) based Fatigue Analysis of Polymer Modified Asphalt Pavements”, accepted for presentation 2008 Annual Meeting of Association of Asphalt Paving Technologists and publication at the Journal of the Association of Asphalt Paving Technologists.
23. Christensen, D. W. and Bonaquist, R. F. (2005). “Practical application of continuum damage theory to fatigue phenomena in asphalt concrete mixtures.” J. Assn. of Asphalt Paving Technologists, Vol.74, pp. 963-1002.
24. Y. R. Kim, H. J. Lee and D. N. Little, “Fatigue characterization of asphalt concrete using viscoelasticity and continuum damage theory.”, J. Assn. of Asphalt Paving Technologists, Vol. 66, pp. 520-569, 1997.
25. H. J. Lee, J. S. Daniel, and Y. R. Kim, ‘‘Continuum damage mechanics–based fatigue model of asphalt concrete.’’ J. Mater. Civ. Eng., 12(2), 105–112, 2000.
26. G. R. Chehab, “Characterization of asphalt concrete in tension using a viscoelastoplastic model.”, PhD dissertation, North Carolina State University, Raleigh, NC, 2002.
27. J.S. Daniel, “Development of a simplified fatigue test and analysis procedure using a viscoelastic, continuum damage model and its implementation to westrack mixtures.”, Ph.D. Dissertation, North Carolina State University, Raleigh, NC, 2001.
28. R. Lundstrom, and U. Isacsson, “Asphalt Fatigue Modelling using Viscoelastic Continuum Damage Theory”, Road Materials and Pavement Design, Vol. 4, No. 1, 2003.
29. R. A. Schapery, “Correspondence principles and a generalized J-integral for large deformation and fracture analysis of viscoelastic media.” Int. J. Fract., 25, 195-223, 1984.
30. Christensen, D.W. and Bonaquist, R., “Practical Application of Continuum Damage Theory to Fatigue Phenomena in Asphalt Concrete Mixtures,” Journal of the Association of Asphalt Paving Technologists, Vol. 74, pp 963-1002, 2005.
Qi, Shenoy, Kutay, Gibson, Youtcheff, and Harman
17
LIST OF TABLES 1. ALF rutting testing conditions and lane/site designation 2. ALF fatigue testing conditions and lane/site designation 3. Statistical summary of HMA layer rutting at 64C and 25,000 ALF pass 4. Rutting distribution between top and bottom lifts in Lane1 site1 5. Summary of Laboratory Binder Tests 6. Comparisons between ALF Cracking and Binder Rheological Data (without outliers) 7. Comparisons of ALF Crack Length (m) at 100K Loads with dissipated energy 8. Comparisons of ALF Passes at 50 m Crack Length with dissipated energy 9. Comparisons of ALF Rutting Behavior with Binder Rheological Data (without outliers) 10. Comparisons with ALF Rutting Behavior for only thin pavements with Binder Rheological Data
(without outliers) 11. Comparisons of ALF Rutting Behavior with Binder Rheological Data (with outliers) 12. High stress ratio (unconfined) flow number test summary 13. Low stress ratio (confined) flow number test summary
LIST OF FIGURES 1. FHWA two ALF machines loading pavements at PTF site 2. Layout of the 12 As-Built Pavement Lanes 3. ALF pavement fatigue cracking data at 19oC and 74 kN 4. HMA layer rutting data at 64 oC and 44 kN load 5. HMA layer rutting data at 74 oC and 44 kN load for lanes 2 – 7 6. HMA layer rutting data at 45 oC and 44 kN load for lanes 8, 10, and 11. 7. ALF Field cracking versus the number of cycles to failure from lab push-pull tests 8. Dynamic modulus (|E*|) and pseudostiffness (C) versus the number of cycles (N) plots
of the strain controlled test simulations based on VECD theory. 9. VECD modeled number of cycles to failure (Nf) versus the number of ALF wheel passes
to 20% crack length (i.e., N20%) in the field. 10. Laboratory high stress ratio (unconfined) FN number test data versus ALF pavement rut
depth 11. Laboratory low stress ratio (confined) FN number test data versus ALF pavement rut
depth
Qi, Shenoy, Kutay, Gibson, Youtcheff, and Harman
18
Table1 ALF rutting testing conditions and lane/site designation
Binder Types
HMA Thickness
(mm)
ALF Load Level (kN)
Temperature (oC)
45 64 74
CR-AZ/Control 100 44 L1S1
Control 100 44 L2S1 L2S2
Control 150 44 L8S2 L8S1
Air Blown 100 44 L3S1 L3S2
Air Blown 150 44 L10S2 L10S1
SBS-LG 100 44 L4S1 L4S2
SBS-LG 150 44 L11S2 L11S1
CR-TB 100 44 L5S1 L5S2
Terpolymer 100 44 L6S1 L6S2
Terpolymer 150 44 L12S1
Fiber 100 44 L7S1 L7S2
SBS 64-40 150 44 L9S1
SBS 64-40 150 44 L9S2*
*Replicate test
Qi, Shenoy, Kutay, Gibson, Youtcheff, and Harman
19
Table 2 ALF fatigue testing conditions and lane/site designation
Binder Types
HMA Thickness
(mm)
ALF Load Level (kN)
Temperature (oC)
19 19 after aging 28
CR-AZ/Control 100 63 L1S3*
CR-AZ/Control 100 74 L1S2 L1S4
Control 100 74 L2S3 L2S4
Control 150 74 L8S3 L8S4
Air Blown 100 74 L3S3 L3S4
Air Blown 150 74 L10S3 L10S4
SBS-LG 100 74 L4S3 L4S4
SBS-LG 150 74 L11S3 L11S4
CR-TB 100 74 L5S3 L5S4
Terpolymer 100 74 L6S3 L6S4
Terpolymer 150 74 L12S3 L12S4
Fiber 100 74 L7S3 L7S4
SBS 64-40 150 74 L9S3 L9S4
* Shakedown test.

Qi, Shenoy, Kutay, Gibson, Youtcheff, and Harman
20
Table 3 Statistical summary of HMA layer rutting at 64C and 25,000 ALF pass
HMA Thickness Lane/Site Binder Mean Std. Dev. CV LSD Test
(mm) Designation Type (mm) (mm) (%) Ranking
100 L5S1 CR-TB 8.4 0.7 9 A
L7S1 Fiber 10.5 1.7 16 B
L4S1 SBS LG 10.9 0.8 7 BC
L1S1 CR-AZ 11.6 1.5 13 BC
L2S1 PG 70-22 12.2 1.8 15 BC
L3S1 Air-Blown 12.6 1.8 14 C
L6S1 Terpolymer 16.5 3.4 20 D
150 L12S1 Terpolymer 11.1 2.8 25 A
L11S1 SBS LG 12.6 1.2 10 A
L10S1 Air-Blown 13.8 2.3 17 AB
L8S1 PG 70-22 14.1 2.1 15 AB
L9S1 SBS 64-40 15.1 3.8 25 AB
L9S2 SBS 64-40 17.3 8.0 46 B Note: all the rutting data at 25,000 passes are measured values except for Lane 6 Site 1 where predicted values were used.
Qi, Shenoy, Kutay, Gibson, Youtcheff, and Harman
21
Table 4 Rutting distribution between top and bottom lifts in Lane1 site1
Core No.
Top Lift Thickness (mm)
Bottom Lift Thickness (mm)
Top Lift Change
Bottom Lift Change
Loaded
Unloaded Area
Loaded Unloaded after loading after loading
Area Area Area (%) (%)
(a) 40 47 50 58 15 14
(b) 50 55 48 53 9 9
(c) 45 49 51 58 8 12
(d) 39 47 45 53 17 15
Avg 44 50 49 56 12 13
Qi, Shenoy, Kutay, Gibson, Youtcheff, and Harman
22
Table 5 Summary of Laboratory Binder Tests
Equipment Type of Test, Experimental Conditions Standard Dynamic Shear Rheometer (DSR)
Frequency Sweep, 7°C, 19°C, 25°C, 64°C, 70°C, 76°C
AASHTO T315-02*
Multi-Stress Creep Recovery Test, 64°C NA Strain Sweep, 7°C, 19°C, 25°C NA Stress Sweep, 19°C NA
Flow Measurement Device (FMD)
Material’s Volumetric-Flow Rate (MVR), 64°C, 70°C, 76°C
NA
*Association of State Highway Transportation Officials. Determining the rheological properties of asphalt binder using a dynamic shear rheometer (DSR). AASHTO Standard Test Method T315-02, Washington D. C., 2002.
Qi, Shenoy, Kutay, Gibson, Youtcheff, and Harman
23
TABLE 6 Comparisons between ALF Cracking and Binder Rheological Data (without outliers)
R2
BINDER Data Parameter 1 -
Superpave [Ref. 4.2]
Parameter 2 - FHWA
[Ref. 4.14]
Parameter 3 - Queen’s Univ
[Ref. 4.15]
Parameter 4 - Wisconsin Univ
[Ref. 4.16]
|G*|sinδ value at 19°C, 10 rads/s, 0.4% strain, PAV
TIS when |G*|sinδ
= 5 MPa (10 rads/s,
0.4% strain, PAV)
|G*s|sinδs value at
19°C, 10 rads/s, 25%
strain, RTFOT
TIS = TEsinδs where TE is when |G*s| = 1 MPa (10
rads/s, 25% strain,
RTFOT)
we (kJ/m2) (25°C,
100mm/min extension rate,
PAV)
Nf when N|G*(N)|/|G*(0)| is
max (19°C, 10 Hz, stress
sweep, PAV)
ALF
Dat
a
Crack Length (m) at100K Load Passes & 19°C
0.56 0.71 0.61 0.78 0.013 0.80
ALF Passes at 50 m Crack Length & 19°C
0.47 0.50 0.50 0.59 0.058 0.72

Qi, Shenoy, Kutay, Gibson, Youtcheff, and Harman
24
TABLE 7 Comparisons of ALF Crack Length (m) at 100K Loads with dissipated energy
Lane/Binder
ALF Data Superpave [Ref. 4.2]
Shenoy [Ref. 4.14]
Wisconsin [Ref. 4.16]
Crack Length (m) at 100K Loads
Ran
k
|G*|sinδ value at 19°C, 10 rads/s, 0.4% strain, PAV
Ran
k
|G*s|sinδs (Pa) at 19°C, 10 rads/s, 25%
strain, RTFOT
Ran
k
Nf when N|G*(N)|/|G*(0)|
is max (10 Hz, stress
sweep, RTFOT)
Ran
k
L2/70-22 90.6 D 12100000 D 3940000 D 810 A
L3/Air Blown 115 E 6810000 C 2390000 C 760 B
L4/SBS LG 0 A 4060000 B 1360000 B 670 C
L5/CR-TB 24.9 C 4210000 B 1280000 B 690 C
L6/Terpolymer
9 B 2610000 A 910000 A 670 C
R2= 0.56
0.61
0.80

Qi, Shenoy, Kutay, Gibson, Youtcheff, and Harman
25
TABLE 8 Comparisons of ALF Passes at 50 m Crack Length with dissipated energy
Lane/Binder
ALF Data Superpave [Ref. 4.2]
Shenoy [Ref. 4.14]
Wisconsin [Ref. 4.16]
ALF Passes at 50 m Crack Length
Ran
k
|G*|sinδ value at 19°C, 10 rads/s, 0.4% strain, PAV
Ran
k
|G*s|sinδs (Pa) at
19°C, 10 rads/s, 25%
strain, RTFOT
Ran
k
Nf when N|G*(N)|/|G*(0
)| is max (10 Hz, stress
sweep, RTFOT)
Ran
k
L2/70-22 66279 D 12100000 D 3940000 D 810 A
L3/Air Blown 47973 E 6810000 C 2390000 C 760 B
L4/SBS LG 270029 A 4060000 B 1360000 B 670 C
L5/CR-TB 154651 C 4210000 B 1280000 B 690 C
L6/Terpolymer
175171 B 2610000 A 910000 A 670 C
R2= 0.47
0.50
0.72

Qi, Shenoy, Kutay, Gibson, Youtcheff, and Harman
26
TABLE 9 Comparisons of ALF Rutting Behavior with Binder Rheological Data (without outliers)
Rut Depth (mm) at40K Passes for
64°C Pavements
R2
PPaarraammeetteerr 11 -- SSuuppeerrppaavvee PPaarraammeetteerr 22 -- EETTGG PPaarraammeetteerr 33 -- FFHHWWAA PPaarraammeetteerr 44 -- FFHHWWAA
||GG**||//ssiinnδδvvaalluuee aatt 6644°°CC,, 1100 rraaddss//ss,, RRTTFFOOTT
[[RReeff.. 44..22]]
TTHHSS wwhheenn ||GG**||// ssiinnδδ == 22220000 PPaa ((1100 rraaddss//ss,,
RRTTFFOOTT)) [[RReeff.. 44..22]]
JJNNRR vvaalluuee aatt 6644°°CC,, 25 Pa,, 11ss99ss,,
1100 ccyycclleess RRTTFFOOTT
[[RReeff.. 44..33,, 44..44]]
JJNNRR vvaalluuee
aatt 6644°°CC,, 3200 Pa,,
11ss99ss,, 1100 ccyycclleess RRTTFFOOTT
[[RReeff.. 44..33,, 44..44]]
||GG**||//((11-- 11//ttaannδδssiinnδδ vvaalluuee aatt 6644°°CC,, 00..2255 rraaddss//ss,,
RRTTFFOOTT [[RReeff.. 44..55 -- 44..88]]
TTHHSS wwhheenn ||GG**||//((11--
11//ttaannδδssiinnδδ== 5500 PPaa ((00..2255
rraaddss//ss,, RRTTFFOOTT)) [[RReeff.. 44..55 -- 44..88]]
MMVVRR vvaalluuee aatt 6644°°CC,, 11..222255 kkgg,,
OORRIIGG [[RReeff.. 44..99,,
44..1100]]
TTHHSS wwhheenn
MMVVRR == 5500 cccc//mmiinn,,
11..222255 kkgg,, OORRIIGG
[[RReeff.. 44..99,, 44..1100]]
Thin and Thick Pavements considering no outliers
0.23 0.55 0.002 0.001 0.016 0.04 0.38 0. 05
Thin Pavements only considering no outliers
0.51 0.50 0.08 0.11 0.36 0.02 0.06 0.003
Thick Pavements only considering no outliers
0.002 0.85 0.03 0.07 0.35 0.05 0.69 0.23
Qi, Shenoy, Kutay, Gibson, Youtcheff, and Harman
27
TABLE 10 Comparisons with ALF Rutting Behavior for only thin pavements with Binder Rheological Data (without outliers)
Rut Depth (mm) at40K Passes for
thin pavements
only
R2
PPaarraammeetteerr 11 -- SSuuppeerrppaavvee PPaarraammeetteerr 22 -- EETTGG PPaarraammeetteerr 33 -- FFHHWWAA PPaarraammeetteerr 44 -- FFHHWWAA
TTHHSS wwhheenn ||GG**||// ssiinnδδ == 22220000 PPaa ((1100 rraaddss//ss,, RRTTFFOOTT))
[[RReeff.. 44..22]]
JJNNRR vvaalluuee aatt 6644°°CC,, 25 Pa,, 11ss99ss,,
1100 ccyycclleess RRTTFFOOTT
[[RReeff.. 44..33,, 44..44]]
JJNNRR vvaalluuee aatt 6644°°CC,, 3200 Pa,,
11ss99ss,, 1100 ccyycclleess RRTTFFOOTT
[[RReeff.. 44..33,, 44..44]]
TTHHSS wwhheenn ||GG**||//((11--11//ttaannδδssiinnδδ== 5500 PPaa ((00..2255 rraaddss//ss,, RRTTFFOOTT))
[[RReeff.. 44..55 -- 44..88]]
TTHHSS wwhheenn MMVVRR == 5500 cccc//mmiinn,, 11..222255 kkgg,, OORRIIGG [[RReeff.. 44..99,, 44..1100]]
64°C 0.50 0.08 0.11 0.02 0. 003
74°C 0.25 0.03 0.04 0.001 0.022
Qi, Shenoy, Kutay, Gibson, Youtcheff, and Harman
28
TABLE 11 Comparisons of ALF Rutting Behavior with Binder Rheological Data (with outliers)
Rut Depth (mm) at40K Passes for
64°C Pavements
R2
PPaarraammeetteerr 11 -- SSuuppeerrppaavvee PPaarraammeetteerr 22 -- EETTGG PPaarraammeetteerr 55 -- FFHHWWAA PPaarraammeetteerr 66 -- FFHHWWAA
||GG**||//ssiinnδδvvaalluuee aatt 6644°°CC,, 1100 rraaddss//ss,, RRTTFFOOTT
[[RReeff.. 44..22]]
TTHHSS wwhheenn ||GG**||// ssiinnδδ ==
22220000 PPaa ((1100 rraaddss//ss,, RRTTFFOOTT))
[[RReeff.. 44..22]]
JJNNRR vvaalluuee aatt 6644°°CC,, 25 Pa,, 11ss99ss,,
1100 ccyycclleess RRTTFFOOTT
[[RReeff.. 44..33,, 44..44]]
JJNNRR vvaalluuee aatt 6644°°CC,, 3200 Pa,,
11ss99ss,, 1100 ccyycclleess RRTTFFOOTT
[[RReeff.. 44..33,, 44..44]]
||GG**||//((11-- 11//ttaannδδssiinnδδ))
vvaalluuee aatt 6644°°CC,, 00..2255 rraaddss//ss,, RRTTFFOOTT [[RReeff.. 44..55 –– 44..88]]
TTHHSS wwhheenn ||GG**||//((11--11//ttaannδδssiinnδδ))== 5500
PPaa ((00..2255 rraaddss//ss,, RRTTFFOOTT))
[[RReeff.. 44..55 –– 44..88]]
MMVVRR vvaalluuee aatt 6644°°CC,, 11..222255 kkgg,,
OORRIIGG [[RReeff.. 44..99,,
44..1100]]
TTHHSS wwhheenn MMVVRR == 5500
cccc//mmiinn,, 11..222255 kkgg,, OORRIIGG
[[RReeff.. 44..99,, 44..1100]]
Thin and Thick Pavements considering 2 outliers
0.05 0.68 0.38 0.39 0.75 0.69 0.61 0. 67
Thin Pavements only considering 1 outlier
0.30 0.91 0.46 0.48 0.93 0.86 0.62 0.90
Thick Pavements only considering 1 outlier
0.56 0.56 0.44 0.39 0.82 0.82 0.72 0.92

Qi, Shenoy, Kutay, Gibson, Youtcheff, and Harman
29
Table 12 High stress ratio (unconfined) flow number test summary
Flow Number (FN) Cycles to 2% Strain(1)
(N2%) Microstrain (µε) at 986 cycles (εN=986)
Mean Stdev. COV Mean Stdev. COV Mean Stdev. COV CR-TB (PPLC) 5957 3377 57% 279 32 11% 29345 755 3%
SBS LG (PPLC) 3996 1703 43% 236 39 17% 29984 1778 6% Terpolymer (PPLC) 1574 741 47% 121 15 12% 42597 1846 4%
Control (PPLC) 1197 353 29% 121 9 7% 44061 1716 4% Air Blown (PPLC) 2037 193 9% 108 6 6% 45185 1475 3%
SBS 64-40 (PPLC) 972 363 37% 76 17 22% 47186 2201 5% SBS LG (LPLC) 1651 544 33% 91 10 11% 45558 3176 7%
Terpolymer (LPLC) 1597 913 57% 183 32 17% 35115 2717 8% Control (LPLC) 512 144 28% 74 14 19% 68989 2459 4%
Note: (1) 2% strain is equivalent to 20000 µε .

Qi, Shenoy, Kutay, Gibson, Youtcheff, and Harman
30
Table 13 Low stress ratio (confined) flow number test summary
Cycles to 2% Strain(1) (N2%) Microstrain at 20000 cycles (εN=20000) Mean Stdev. COV Mean Stdev. COV Air Blown 1725 101 5.9% 33741 3681 11.2% Control 70-22 713 335 46.9% 49303 6279 13.1% CR-AZ 20008 7063 35.3% 31169 10064 32.3% CR-TB 1017 2209 217.2% 38420 12325 33.0% Fiber 1340 218 16.3% 34061 1713 5.0% SBS LG 1833 1225 66.8% 30421 3786 12.8% SBS64-40 465 112 24.0% 46210 3385 7.5% Terpolymer 9529 7960 83.5% 22154 2668 12.4%

Qi, Shenoy, Kutay, Gibson, Youtcheff, and Harman
31
Figure1. FHWA two ALF machines loading pavements at PTF site.
Qi, Shenoy, Kutay, Gibson, Youtcheff, and Harman
32
Lane Number 1 2 3 4 5 6 7 8 9 10 11 12 CR-AZ
PG 70-22
Air-Blown
SBS LG
CR- TB
Ter-polymer Fiber
PG 70-22
SBS 64-40
Air-Blown
SBS LG
Ter- polymer
PG70-22
Removed 100 mm
of Existing CAB
100 mm of New No. 21A CAB Under All 12 Lanes
Removed 50 mm of Existing CAB
Existing VDOT No. 21A Crushed Aggregate Base (CAB) (25-mm Nominal Maximum Aggregate Size)
Bottom of CAB to Pavement Surface is 660 mm
Re-compacted AASHTO A-4 Subgrade Soil
PG 70-22 = Unmodified Asphalt Binder Control CR-AZ = Crumb Rubber Asphalt Binder, Arizona DOT Wet Process CR-TB = Crumb Rubber Asphalt Binder, Terminal Blend Terpolymer = Ethylene Terpolymer Modified Asphalt Binder SBS LG = Styrene-Butadiene-Styrene Modified Asphalt Binder with Linear Grafting SBS 64-40 = Styrene-Butadiene-Styrene Modified Asphalt Binder Graded PG 64-40 Air-Blown = Air-Blown Asphalt Binder
Fiber = Unmodified PG 70-22 Asphalt Binder with 0.2 Percent Polyester Fiber by Mass of the Aggregate.
Figure 2 Layout of the 12 As-Built Pavement Lanes (not to scale)
12 x 4 m = 48 m
50 m
4 Test Sites for Each Lane
150 mm AC 100 mm AC
Qi, Shenoy, Kutay, Gibson, Youtcheff, and Harman
33
0
20
40
60
80
100
120
0 50,000 100,000 150,000 200,000 250,000 300,000
ALF Wheel Loading Pass
Cum
ulativ
e Cr
ack
Leng
th (m
)
0
10
20
30
40
50
60
70
80
90
100
Perc
enta
ge o
f Are
a Cr
acke
d (%
)
L3S3 (Air Blown)L2S3 (Control)L5S3 (CR-TB)L6S3 (Terpolymer)L4S3 (SBS LG)L7S3 (Fibers)L1S2 (CR-AZ)
Solid Line: Crack Length Dash Line:
Area Cracked
(a) 100-mm HMA layer pavements
0.00
20.00
40.00
60.00
80.00
0 100000 200000 300000 400000 500000Number of ALF Passes
Cum
ulat
ive
Crac
k Le
ngth
(m)
0
10
20
30
40
50
60
70
80Pe
rcen
t Cra
ck A
rea
(%)
L10S3 (Air Blown)L8S3 (Control)L9S3 (SBS 64-40)L11S3 (SBS LG)L12S3 (Terplymer)
Dashed line: Percent area
Solid line : crack length
(b) 150-mm HMA layer pavements
Figure 3 ALF pavement fatigue cracking data at 19oC and 74 kN
Qi, Shenoy, Kutay, Gibson, Youtcheff, and Harman
34
0.0
5.0
10.0
15.0
20.0
0 10,000 20,000 30,000 40,000 50,000 60,000 70,000 80,000
ALF Wheel Loading Pass
HM
A L
ayer
Rut
ting,
mm
L6S1(Terpolymer)L3S1(Air-Blown)L2S1(Control / 70-22)L1S1(AZ-CRM)L4S1(SBS-LG)L7S1(Control+Fibers)L5S1(CR-TB)
(a) 100-mm Pavements for lanes 1 to 7
0.0
5.0
10.0
15.0
20.0
25.0
0 10,000 20,000 30,000 40,000 50,000 60,000 70,000 80,000
ALF Wheel Loading Pass
HM
A La
yer R
uttin
g, m
m
L9S2(SBS 64-40)L9Avg(SBS 64-40)L9S1(SBS 64-40)L8S1(Control 70-22)L10S1(Air-Blown)L11S1(SBS-LG)L12S1(Terpolymer)
(b) 150-mm Pavements for lanes 9 to 12. Figure 4. HMA layer rutting data at 64 oC and 44 kN load
Qi, Shenoy, Kutay, Gibson, Youtcheff, and Harman
35
0
2
4
6
8
10
12
14
16
18
0 20,000 40,000 60,000 80,000 100,000 120,000
ALF Wheel Loading Passes
HM
A L
ayer
Rut
ting,
mm
L6S2(Terplymer)L3S2(Air Blown)L2S2(Control / 70-22)L7S2(Control+Fiber)L4S2(SBS-LG)L5S2(CR-TB)
Figure 5 HMA layer rutting data at 74 oC and 44 kN load for lanes 2 – 7

Qi, Shenoy, Kutay, Gibson, Youtcheff, and Harman
36
0
2
4
6
8
10
0 50,000 100,000 150,000 200,000 250,000 300,000 350,000
ALF Wheel Loading Passes
HM
A L
ayer
Rut
ting,
mm
L10S2(Air-Blown)
L8S2(Control 72-22)
L11S2(SBS-LG)
Figure 6 HMA layer rutting data at 45 oC and 44 kN load for lanes 8, 10, and 11.
Qi, Shenoy, Kutay, Gibson, Youtcheff, and Harman
37
3.50
4.00
4.50
5.00
4.4 4.6 4.8 5 5.2 5.4 5.6 5.8
50% |E*||DSE
N-DSE
N+1| / DSE
N
DSEinit
*N / DSEN
Hysteresis Loop
y = 9.0- 1.1x R2= 0.66 y = 8.2- 0.86x R2= 0.78y = 8.6 - 0.95x R2= 0.82y = 8.1 - 0.83x R2= 0.72
log(
Nf )
log (Number of passes to 20 % crack (N20%
) at ALF)
(a) stress control
(a) stress-controlled
2.50
3.00
3.50
4.00
4.50
5.00
5.50
6.00
4.4 4.6 4.8 5 5.2 5.4 5.6 5.8 6
50% |E*||DSE
N-DSE
N+1| / DSE
NDSE
init*N / DSE
NHysteresis Loop
y = -2.3 + 1.2x R2= 0.24 y = -5.0 + 1.85x R2= 0.55y = -5.3+ 1.9x R2= 0.55y = -5.4 + 1.9x R2= 0.55
log(
Nf )
log (Number of passes to 20 % crack (N20%
) at ALF)
(b) strain control
(b) strain-controlled
Figure 7 ALF Field cracking versus the number of cycles to failure from lab push-pull tests.
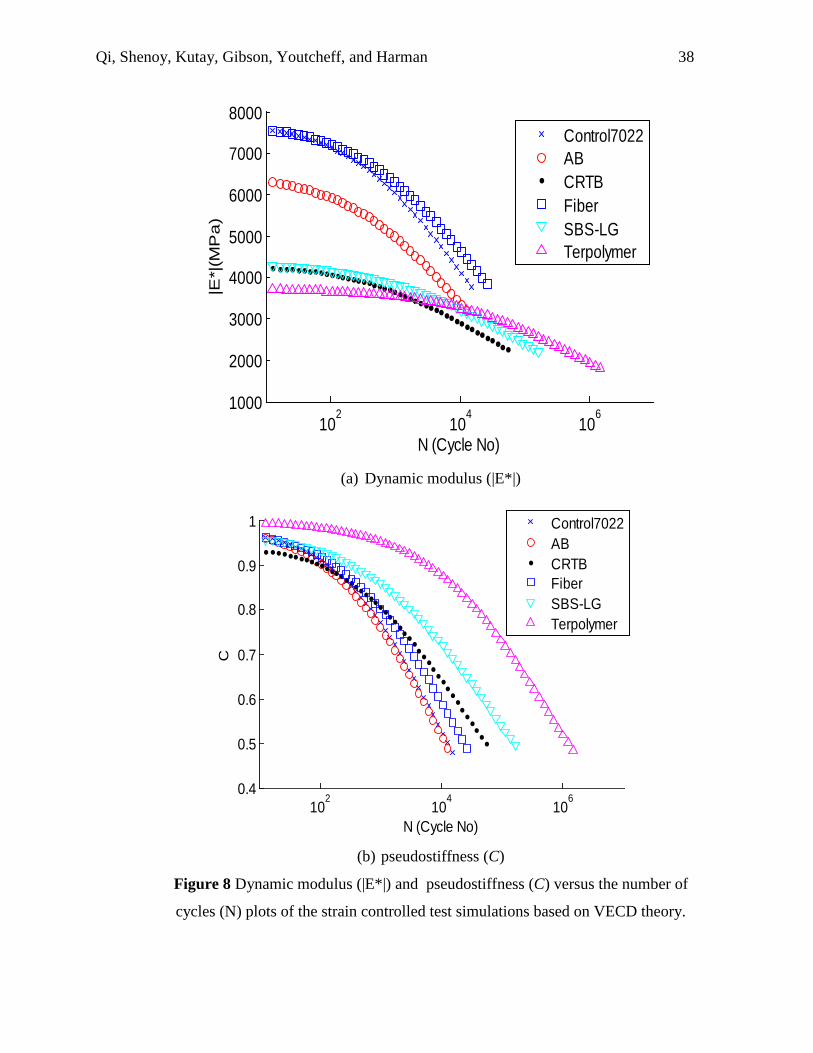
Qi, Shenoy, Kutay, Gibson, Youtcheff, and Harman
38
102
104
106
1000
2000
3000
4000
5000
6000
7000
8000
N (Cycle No)
|E*|
(MP
a)
Control7022ABCRTBFiberSBS-LGTerpolymer
(a) Dynamic modulus (|E*|)
102
104
106
0.4
0.5
0.6
0.7
0.8
0.9
1
N (Cycle No)
C
Control7022ABCRTBFiberSBS-LGTerpolymer
(b) pseudostiffness (C)
Figure 8 Dynamic modulus (|E*|) and pseudostiffness (C) versus the number of
cycles (N) plots of the strain controlled test simulations based on VECD theory.

Qi, Shenoy, Kutay, Gibson, Youtcheff, and Harman
39
4.0
4.5
5.0
5.5
6.0
6.5
4.4 4.6 4.8 5 5.2 5.4 5.6
log
(Nf) -
VEC
D m
odel
ed
log (N20%
) at ALF
AB Control 70-22
CRTB
SBS-LG
Terpolymer
Fiber
Figure 9 VECD modeled number of cycles to failure (Nf) versus the number of
ALF wheel passes to 20% crack length (i.e., N20%) in the field.
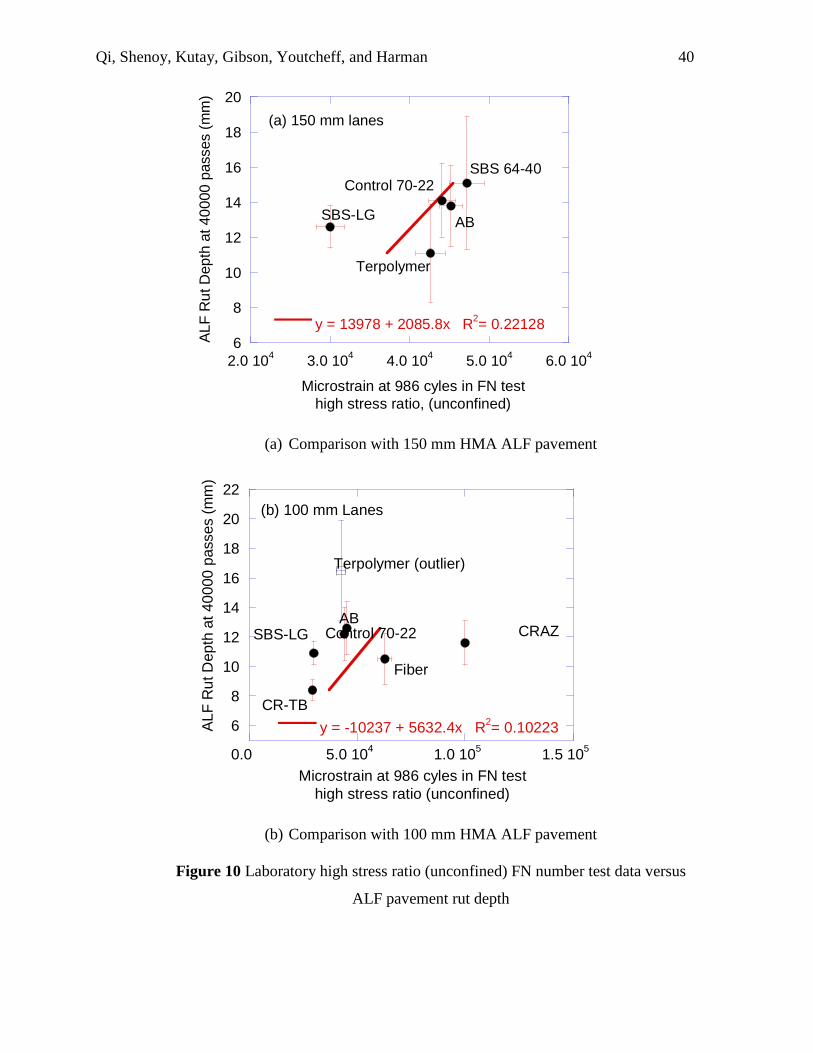
Qi, Shenoy, Kutay, Gibson, Youtcheff, and Harman
40
2.0 104 3.0 104 4.0 104 5.0 104 6.0 1046
8
10
12
14
16
18
20
y = 13978 + 2085.8x R2= 0.22128
Microstrain at 986 cyles in FN testhigh stress ratio, (unconfined)
ALF
Rut
Dep
th a
t 400
00 p
asse
s (m
m)
AB
Control 70-22SBS 64-40
SBS-LG
Terpolymer
(a) 150 mm lanes
(a) Comparison with 150 mm HMA ALF pavement
0.0 5.0 104 1.0 105 1.5 105
6
8
10
12
14
16
18
20
22
y = -10237 + 5632.4x R2= 0.10223
Microstrain at 986 cyles in FN testhigh stress ratio (unconfined)
ALF
Rut
Dep
th a
t 400
00 p
asse
s (m
m)
ABControl 70-22
CR-TB
SBS-LG
(b) 100 mm Lanes
Terpolymer (outlier)
Fiber
CRAZ
(b) Comparison with 100 mm HMA ALF pavement
Figure 10 Laboratory high stress ratio (unconfined) FN number test data versus
ALF pavement rut depth
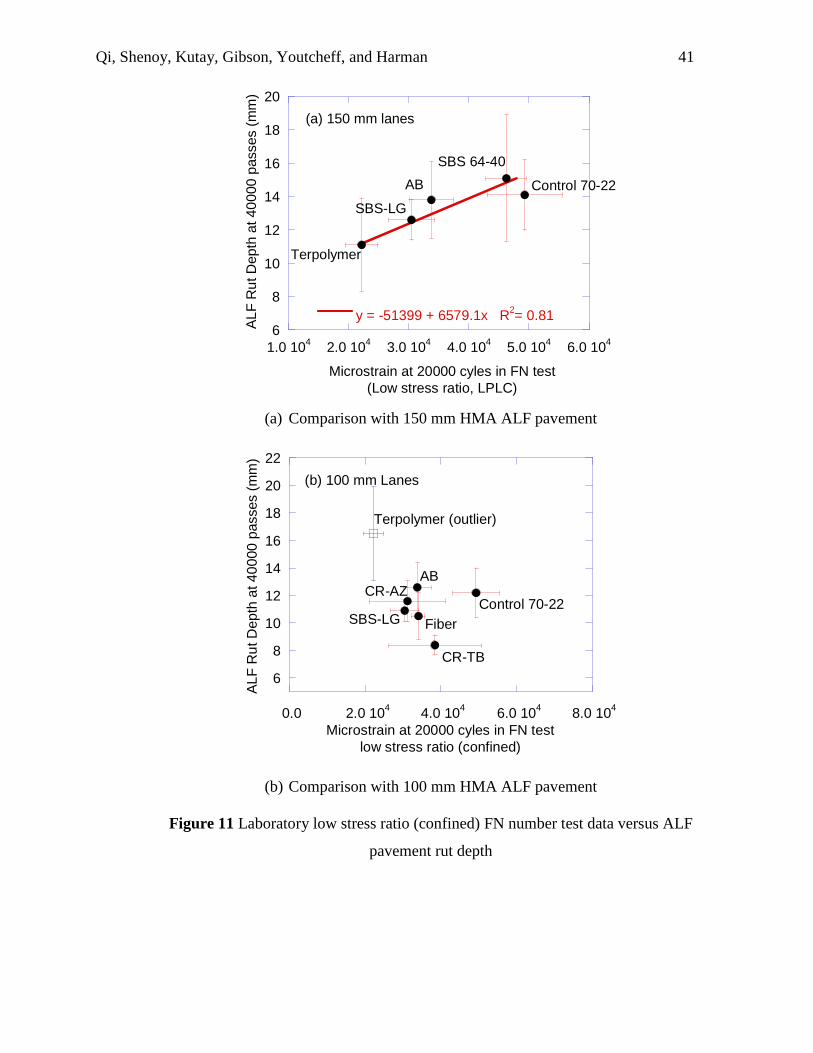
Qi, Shenoy, Kutay, Gibson, Youtcheff, and Harman
41
1.0 104 2.0 104 3.0 104 4.0 104 5.0 104 6.0 1046
8
10
12
14
16
18
20
y = -51399 + 6579.1x R2= 0.81
Microstrain at 20000 cyles in FN test(Low stress ratio, LPLC)
ALF
Rut
Dep
th a
t 400
00 p
asse
s (m
m)
AB Control 70-22
SBS 64-40
SBS-LG
Terpolymer
(a) 150 mm lanes
(a) Comparison with 150 mm HMA ALF pavement
0.0 2.0 104 4.0 104 6.0 104 8.0 104
6
8
10
12
14
16
18
20
22
Microstrain at 20000 cyles in FN testlow stress ratio (confined)
ALF
Rut
Dep
th a
t 400
00 p
asse
s (m
m)
AB
Control 70-22
CR-TB
SBS-LG
(b) 100 mm Lanes
Terpolymer (outlier)
Fiber
CR-AZ
(b) Comparison with 100 mm HMA ALF pavement Figure 11 Laboratory low stress ratio (confined) FN number test data versus ALF
pavement rut depth


![Binder 216, Terminology [Trematoda Taxon Notebooks]](https://static.fdokumen.com/doc/165x107/63338ab23108fad7760f19c8/binder-216-terminology-trematoda-taxon-notebooks.jpg)
![Binder 200, Small families [Trematoda Taxon Notebooks]](https://static.fdokumen.com/doc/165x107/6324444cb104cba27a091035/binder-200-small-families-trematoda-taxon-notebooks.jpg)