The Role of Asphalt Binder Fracture Properties in Thermal Cracking Performance of Mixtures and...
17
The final version of this paper was presented and published in: Proceeding of the 57th Annual Conference of the Canadian Technical Asphalt Association (CTAA) Vancouver, British Columbia, November 2012 https://www.ctaa.ca/wp-content/uploads/2012/02/CTAA-2012-Proceedings-Order-Brochure-rev-Oct-15.pdf The Role of Asphalt Binder Fracture Properties in Thermal Cracking Performance of Mixtures and Pavements Hussain Bahia, Ph.D. Professor University of Wisconsin-Madison Madison, Wisconsin Raul Velasquez, Ph.D. Research Associate University of Wisconsin-Madison Madison, Wisconsin Hassan Tabatabaee, Ph.D. Research Associate University of Wisconsin-Madison Madison, Wisconsin Sebastian Puchalski Research Assistant University of Wisconsin-Madison Madison, Wisconsin Acknowledgements The authors would like to thank Professor Mihai Marasteanu and Mr. Zhijun Li for their contributions. This research was sponsored by the Asphalt Research Consortium (ARC), which is managed by the Federal Highway Administration (FHWA) and the Western Research Institute (WRI) and by the National Pooled Fund Study TPF-5(132): “Investigation of Low Temperature Cracking in Asphalt Pavements Phase-II”. This support is gratefully acknowledged. The results and opinions presented are those of the authors and do not necessarily reflect those of the sponsoring agencies.
Transcript of The Role of Asphalt Binder Fracture Properties in Thermal Cracking Performance of Mixtures and...
The final version of this paper was presented and published in:
Proceeding of the 57th Annual Conference of the Canadian Technical Asphalt Association (CTAA)
Vancouver, British Columbia, November 2012
https://www.ctaa.ca/wp-content/uploads/2012/02/CTAA-2012-Proceedings-Order-Brochure-rev-Oct-15.pdf
The Role of Asphalt Binder Fracture Properties in Thermal Cracking
Performance of Mixtures and Pavements
Hussain Bahia, Ph.D.
Professor
University of Wisconsin-Madison
Madison, Wisconsin
Raul Velasquez, Ph.D.
Research Associate
University of Wisconsin-Madison
Madison, Wisconsin
Hassan Tabatabaee, Ph.D.
Research Associate
University of Wisconsin-Madison
Madison, Wisconsin
Sebastian Puchalski
Research Assistant
University of Wisconsin-Madison
Madison, Wisconsin
Acknowledgements
The authors would like to thank Professor Mihai Marasteanu and Mr. Zhijun Li for their contributions.
This research was sponsored by the Asphalt Research Consortium (ARC), which is managed by the
Federal Highway Administration (FHWA) and the Western Research Institute (WRI) and by the National
Pooled Fund Study TPF-5(132): “Investigation of Low Temperature Cracking in Asphalt Pavements
Phase-II”. This support is gratefully acknowledged. The results and opinions presented are those of the
authors and do not necessarily reflect those of the sponsoring agencies.
The final version of this paper was presented and published in:
Proceeding of the 57th Annual Conference of the Canadian Technical Asphalt Association (CTAA)
Vancouver, British Columbia, November 2012
https://www.ctaa.ca/wp-content/uploads/2012/02/CTAA-2012-Proceedings-Order-Brochure-rev-Oct-15.pdf
2 THE ROLE OF BINDER FRACTURE PROPERTIES IN THERMAL CRACKING
ABSTRACT
Significant progress in controlling low temperature cracking has been achieved by introducing the
Bending Beam Rheometer (BBR) and placing appropriate limits on stiffness and relaxation rate (i.e., S
and m-value). However, with the increase in types of modifiers and extender oils used to achieve special
low temperature grades (e.g., PG xx-28 and PG xx-34), concerns about the effects of these additives on the
fracture properties of binders have been raised. The need for a testing system that is simple and effective
in measuring these properties is clearly realized. A Single-Edge Notched Bending Test based on a
modification of the standard BBR device (BBR-SENB), was developed and used to measure fracture
properties of asphalt binders.
Comparison of BBR-SENB results with fracture properties of asphalt mixtures and field performance
indicates the need to compliment current practice of using stiffness and relaxation properties measured in
the BBR with binder fracture properties to evaluate thermal cracking of pavements. It is observed that
binders of the same low temperature PG grade can have significantly different fracture energy (Gf) and
deflection at fracture (uf), measured at the grade temperature. For example, binders graded as PG (xx-22)
showed Gf values ranging between 1 and 30 J/m2 measured at -12°C.
RÉSUMÉ
Abstracts provided in English will be translated to French.
The final version of this paper was presented and published in:
Proceeding of the 57th Annual Conference of the Canadian Technical Asphalt Association (CTAA)
Vancouver, British Columbia, November 2012
https://www.ctaa.ca/wp-content/uploads/2012/02/CTAA-2012-Proceedings-Order-Brochure-rev-Oct-15.pdf
BAHIA, VELASQUEZ, TABATABAEE & PUCHALSKI 3
1.0 INTRODUCTION
It is recognized that a better approach for thermal cracking characterization of asphalt materials is to use
fracture mechanics principles rather than to use a linear viscoelastic continuum mechanics approach.
Current test methods to address low temperature cracking, such as the Bending Beam Rheometer (BBR)
[1], characterize the material in the linear viscoelastic domain at small strain levels and, therefore, do not
provide the complete picture for thermal cracking characterization.
Previous research by Hoare and Hesp [2], Hesp [3], Chailleux and Mouillet [4], Chailleux et al. [5],
among others, have used the Single-Edge Notched Bending (SENB) test, which is a fracture mechanics-
based test commonly used in metals and other materials, to obtain the fracture properties of asphalt binders
at low temperatures. These researchers succeeded in grading a broad range of materials with different
levels of polymer modification. The BBR-SENB test follows the ASTM E399 standard [6] and assumes
that Linear Elastic Fracture Mechanics (LEFM) conditions hold for the analysis of test measurements.
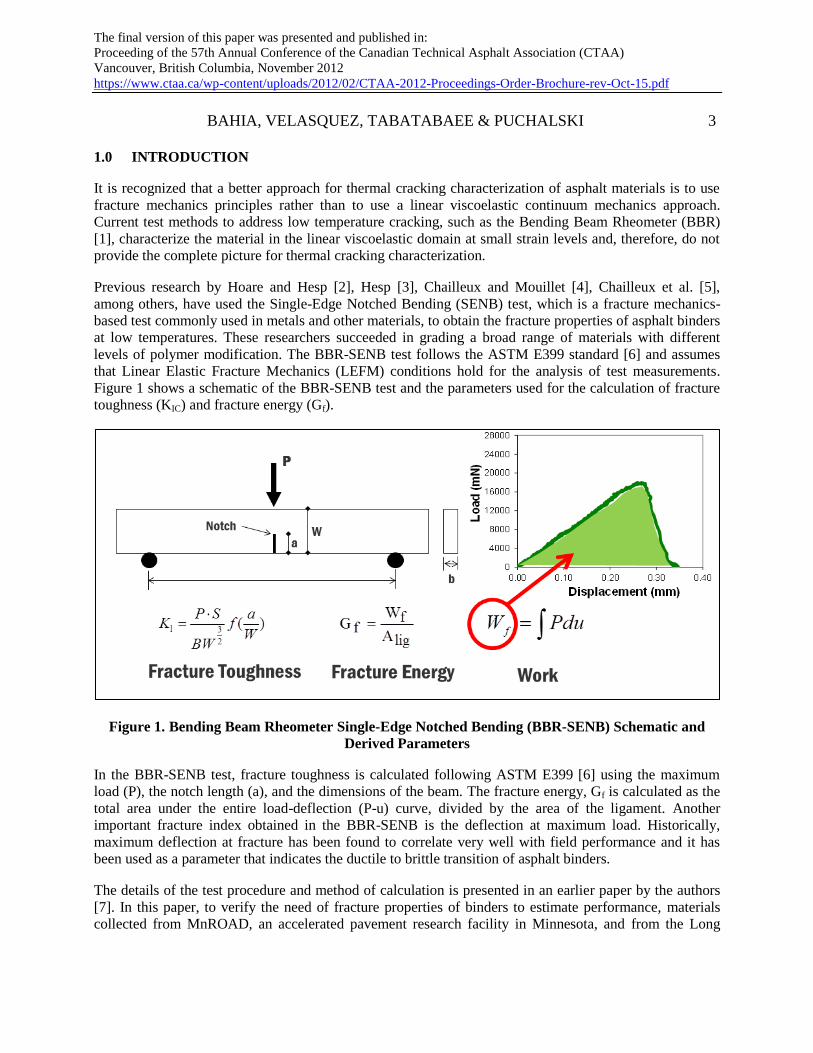
Figure 1 shows a schematic of the BBR-SENB test and the parameters used for the calculation of fracture
toughness (KIC) and fracture energy (Gf).
Figure 1. Bending Beam Rheometer Single-Edge Notched Bending (BBR-SENB) Schematic and
Derived Parameters
In the BBR-SENB test, fracture toughness is calculated following ASTM E399 [6] using the maximum
load (P), the notch length (a), and the dimensions of the beam. The fracture energy, Gf is calculated as the
total area under the entire load-deflection (P-u) curve, divided by the area of the ligament. Another
important fracture index obtained in the BBR-SENB is the deflection at maximum load. Historically,
maximum deflection at fracture has been found to correlate very well with field performance and it has
been used as a parameter that indicates the ductile to brittle transition of asphalt binders.
The details of the test procedure and method of calculation is presented in an earlier paper by the authors
[7]. In this paper, to verify the need of fracture properties of binders to estimate performance, materials
collected from MnROAD, an accelerated pavement research facility in Minnesota, and from the Long
The final version of this paper was presented and published in:
Proceeding of the 57th Annual Conference of the Canadian Technical Asphalt Association (CTAA)
Vancouver, British Columbia, November 2012
https://www.ctaa.ca/wp-content/uploads/2012/02/CTAA-2012-Proceedings-Order-Brochure-rev-Oct-15.pdf
4 THE ROLE OF BINDER FRACTURE PROPERTIES IN THERMAL CRACKING
Term Pavement Performance (LTPP) sections in the United States, were characterized using the
aforementioned fracture parameters. Binder fracture properties were compared with current BBR
parameters (e.g., stiffness at 60 sec and m-value), with fracture properties of asphalt mixtures, and with
thermal cracking field performance. Experimental and field performance data was used to establish the
importance of measuring asphalt binder fracture properties and the conditions at which the BBR-SENB
are most relevant.
The need for measuring fracture properties of binders is not new and the most recent attempts to measure
such properties are seen in the development and implementation of the Direct Tension Test (DTT)
AASHTO T 314 [8] in the late 1990s and the early 2000s. Also, recently the Ontario Ministry of
Transportation considered implementing the Double Edge Notch Test (DENT) [3]. In contrast to the DTT
and the DENT, the BBR-SENB is a flexural test that utilizes a fixture-free prismatic beam specimen
consistent with the design of the sample used in the BBR standard procedure. The selection of this
geometry and loading pattern was motivated by the following challenges:
The persistent problems with repeatability and consistency faced using the simple elongation test
in the DTT;
The need for a test sample with no constraints to allow stress-free shrinkage of binders that will
prevent volume restrictions and stress build up at end pieces; and
The success of the BBR test procedure in controlling temperature, loading, and displacement
measurements. The BBR-SENB requires a relatively simple modification of the loading
mechanism of the BBR which allows for reliable measurements of both fracture properties and
standard BBR parameters (i.e., S and m).
2.0 THE BBR - SINGLE EDGE NOTCHED BENDING TEST
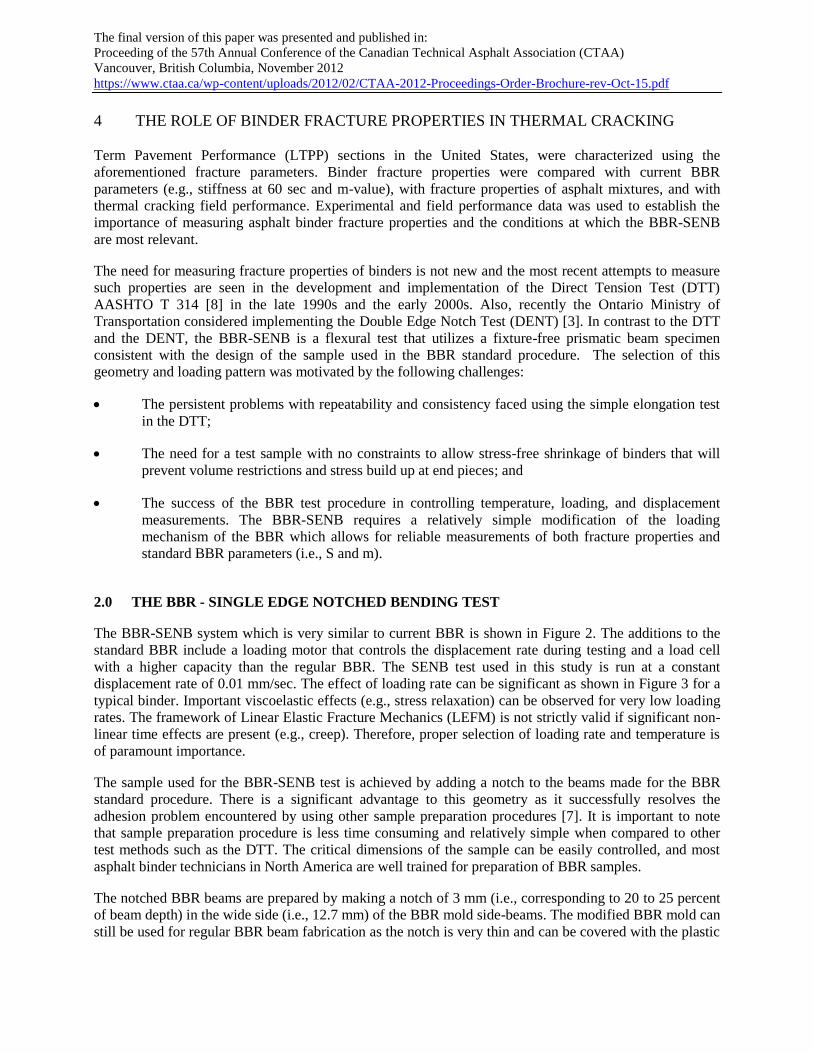
The BBR-SENB system which is very similar to current BBR is shown in Figure 2. The additions to the
standard BBR include a loading motor that controls the displacement rate during testing and a load cell
with a higher capacity than the regular BBR. The SENB test used in this study is run at a constant
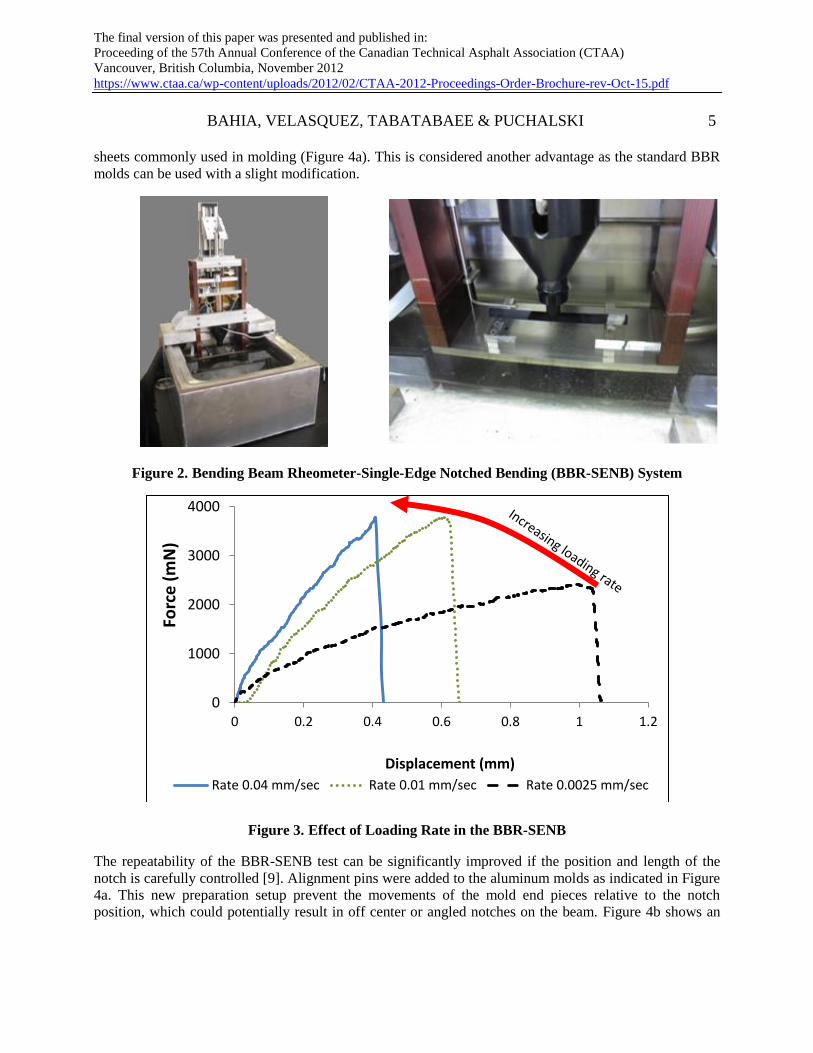
displacement rate of 0.01 mm/sec. The effect of loading rate can be significant as shown in Figure 3 for a
typical binder. Important viscoelastic effects (e.g., stress relaxation) can be observed for very low loading
rates. The framework of Linear Elastic Fracture Mechanics (LEFM) is not strictly valid if significant non-
linear time effects are present (e.g., creep). Therefore, proper selection of loading rate and temperature is
of paramount importance.
The sample used for the BBR-SENB test is achieved by adding a notch to the beams made for the BBR
standard procedure. There is a significant advantage to this geometry as it successfully resolves the
adhesion problem encountered by using other sample preparation procedures [7]. It is important to note
that sample preparation procedure is less time consuming and relatively simple when compared to other
test methods such as the DTT. The critical dimensions of the sample can be easily controlled, and most
asphalt binder technicians in North America are well trained for preparation of BBR samples.
The notched BBR beams are prepared by making a notch of 3 mm (i.e., corresponding to 20 to 25 percent
of beam depth) in the wide side (i.e., 12.7 mm) of the BBR mold side-beams. The modified BBR mold can
still be used for regular BBR beam fabrication as the notch is very thin and can be covered with the plastic
The final version of this paper was presented and published in:
Proceeding of the 57th Annual Conference of the Canadian Technical Asphalt Association (CTAA)
Vancouver, British Columbia, November 2012
https://www.ctaa.ca/wp-content/uploads/2012/02/CTAA-2012-Proceedings-Order-Brochure-rev-Oct-15.pdf
BAHIA, VELASQUEZ, TABATABAEE & PUCHALSKI 5
sheets commonly used in molding (Figure 4a). This is considered another advantage as the standard BBR
molds can be used with a slight modification.
Figure 2. Bending Beam Rheometer-Single-Edge Notched Bending (BBR-SENB) System
Figure 3. Effect of Loading Rate in the BBR-SENB
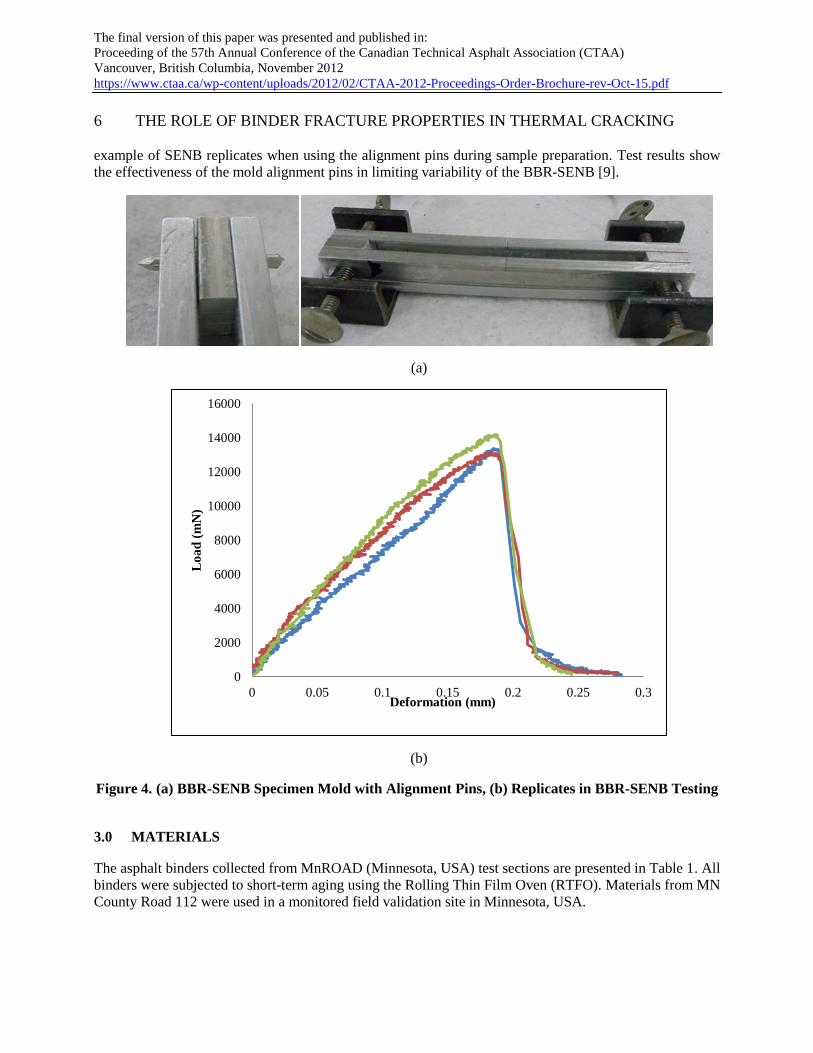
The repeatability of the BBR-SENB test can be significantly improved if the position and length of the
notch is carefully controlled [9]. Alignment pins were added to the aluminum molds as indicated in Figure
4a. This new preparation setup prevent the movements of the mold end pieces relative to the notch
position, which could potentially result in off center or angled notches on the beam. Figure 4b shows an
0
1000
2000
3000
4000
0 0.2 0.4 0.6 0.8 1 1.2
Forc
e (
mN
)
Displacement (mm)
Rate 0.04 mm/sec Rate 0.01 mm/sec Rate 0.0025 mm/sec
The final version of this paper was presented and published in:
Proceeding of the 57th Annual Conference of the Canadian Technical Asphalt Association (CTAA)
Vancouver, British Columbia, November 2012
https://www.ctaa.ca/wp-content/uploads/2012/02/CTAA-2012-Proceedings-Order-Brochure-rev-Oct-15.pdf
6 THE ROLE OF BINDER FRACTURE PROPERTIES IN THERMAL CRACKING
example of SENB replicates when using the alignment pins during sample preparation. Test results show
the effectiveness of the mold alignment pins in limiting variability of the BBR-SENB [9].
(a)
(b)
Figure 4. (a) BBR-SENB Specimen Mold with Alignment Pins, (b) Replicates in BBR-SENB Testing
3.0 MATERIALS
The asphalt binders collected from MnROAD (Minnesota, USA) test sections are presented in Table 1. All
binders were subjected to short-term aging using the Rolling Thin Film Oven (RTFO). Materials from MN
County Road 112 were used in a monitored field validation site in Minnesota, USA.
0
2000
4000
6000
8000
10000
12000
14000
16000
0 0.05 0.1 0.15 0.2 0.25 0.3
Lo
ad
(m
N)
Deformation (mm)
The final version of this paper was presented and published in:
Proceeding of the 57th Annual Conference of the Canadian Technical Asphalt Association (CTAA)
Vancouver, British Columbia, November 2012
https://www.ctaa.ca/wp-content/uploads/2012/02/CTAA-2012-Proceedings-Order-Brochure-rev-Oct-15.pdf
BAHIA, VELASQUEZ, TABATABAEE & PUCHALSKI 7
In addition to the binders listed in Table 1, a large set of modified and unmodified binders from the
Asphalt Research Consortium (ARC) project, as well as binders from selected LTPP sections were
included in this study.
Table 1. MnROAD and County Road 112 Binders Tested in the BBR-SENB
Binder Location Description
PG 58-34 PPA MnROAD 33 Modified with Polyphosphoric Acid (PPA)
PG 58-34 SBS+PPA MnROAD 34 Modified with Styrene-Butadiene Styrene (SBS) + PPA
PG 58-34 SBS MnROAD 35 Modified with SBS
PG 58-34 Elvaloy
+Acid MnROAD 77 Modified with PPA + Elvaloy
PG 58-28 MnROAD 20 Neat
PG 58-34 MnROAD 22 Unknown Modification
PG 64-22 Wisconsin Binder used in construction of SMA pavement in
Wisconsin
PG 58-28 MN CR 112 Source “V”
PG 58-28 MN CR 112 Source “C”
PG 58-28 MN CR 112 Source “M”
PG 58-34 Elvaloy MN CR 112 Source “E” modified with Elvaloy
4.0 RESULTS AND DISCUSSION
4.1 Comparison of BBR-SENB to the BBR
To verify that the current results of the BBR test (i.e., S and m) are not sufficient to indicate fracture
properties of modified binders, the BBR-SENB and BBR measurements were compared for an extensive
set of binders, which included materials in Table 1 and binders used in the Asphalt Research Consortium
(ARC). In these tests, the S(60) and m-value of the asphalt binders were measured after 1 hr of
conditioning at the same temperatures used for the BBR-SENB testing.
The BBR-SENB parameters (i.e., Gf, KIC, and deflection at fracture) are plotted against the m-value and
S(60) in Figures 5 and 6, respectively. It should be noted that all correlations made in subsequent sections
are meant to compare the ranking capability of different low temperature performance indices and are not
for the purpose of deriving direct relationships between the indices. Although no specification for
determining pavement performance based on fracture parameters exists, intuitively one would expect
higher KIC, Gf and deflection at fracture to indicate better performance.
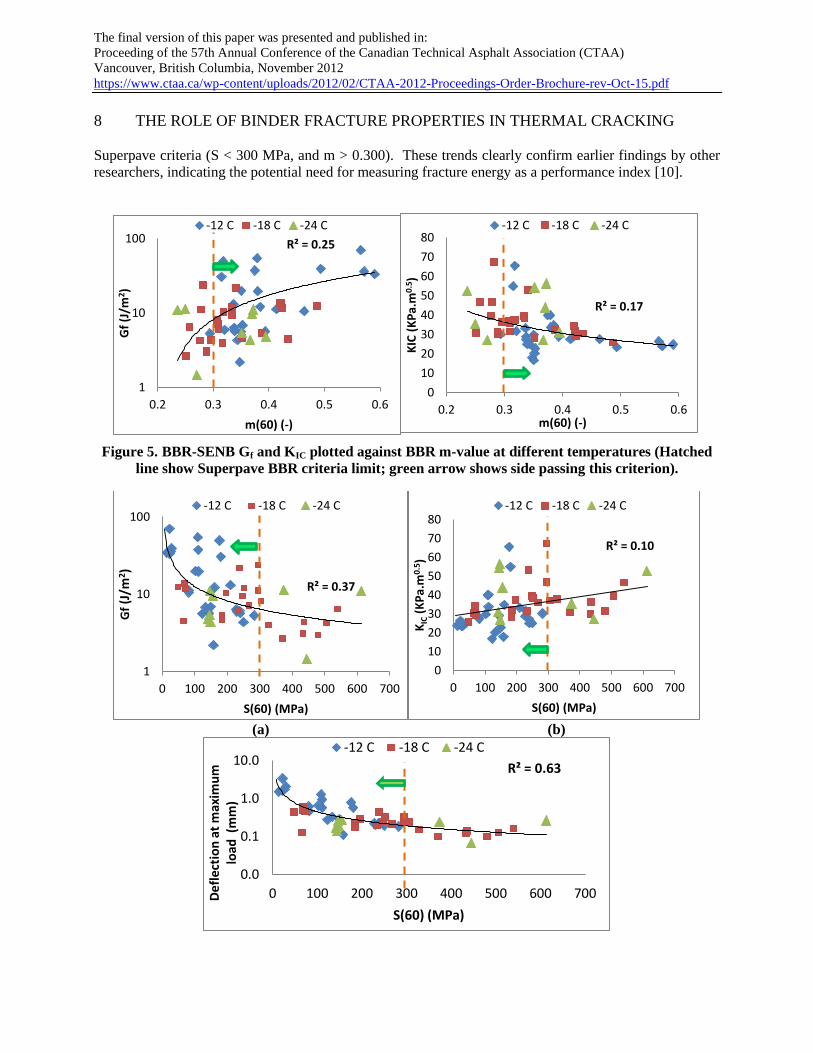
The trends in Figures 5 and 6 show that the m-value (m(60)) and creep stiffness (S(60)) have very poor
correlation with the fracture parameters obtained in the BBR-SENB test. It can also be seen that the BBR
m-value and creep stiffness limits fail to distinguish between binders demonstrating low values of fracture
energy and those with superior (higher) fracture energy values, especially for the range passing the
The final version of this paper was presented and published in:
Proceeding of the 57th Annual Conference of the Canadian Technical Asphalt Association (CTAA)
Vancouver, British Columbia, November 2012
https://www.ctaa.ca/wp-content/uploads/2012/02/CTAA-2012-Proceedings-Order-Brochure-rev-Oct-15.pdf
8 THE ROLE OF BINDER FRACTURE PROPERTIES IN THERMAL CRACKING
Superpave criteria (S < 300 MPa, and m > 0.300). These trends clearly confirm earlier findings by other
researchers, indicating the potential need for measuring fracture energy as a performance index [10].
Figure 5. BBR-SENB Gf and KIC plotted against BBR m-value at different temperatures (Hatched
line show Superpave BBR criteria limit; green arrow shows side passing this criterion).
(a) (b)
R² = 0.25
1
10
100
0.2 0.3 0.4 0.5 0.6
Gf
(J/m
2 )
m(60) (-)
-12 C -18 C -24 C
R² = 0.17
0
10
20
30
40
50
60
70
80
0.2 0.3 0.4 0.5 0.6K
IC (
KP
a.m
0.5)
m(60) (-)
-12 C -18 C -24 C
R² = 0.37
1
10
100
0 100 200 300 400 500 600 700
Gf
(J/m
2 )
S(60) (MPa)
-12 C -18 C -24 C
R² = 0.10
0
10
20
30
40
50
60
70
80
0 100 200 300 400 500 600 700
KIC
(K
Pa.
m0
.5)
S(60) (MPa)
-12 C -18 C -24 C
R² = 0.63
0.0
0.1
1.0
10.0
0 100 200 300 400 500 600 700Def
lect
ion
at
max
imu
m
load
(m
m)
S(60) (MPa)
-12 C -18 C -24 C
The final version of this paper was presented and published in:
Proceeding of the 57th Annual Conference of the Canadian Technical Asphalt Association (CTAA)
Vancouver, British Columbia, November 2012
https://www.ctaa.ca/wp-content/uploads/2012/02/CTAA-2012-Proceedings-Order-Brochure-rev-Oct-15.pdf
BAHIA, VELASQUEZ, TABATABAEE & PUCHALSKI 9
(c)
Figure 6. BBR-SENB (a) Gf, (b) KIC, and (c) Deflection at maximum load plotted against BBR creep
stiffness at different temperatures (Hatched line show Superpave BBR criteria limit; green arrow
shows side passing this criterion).
4.2 Selection of Performance Parameters for the BBR-SENB
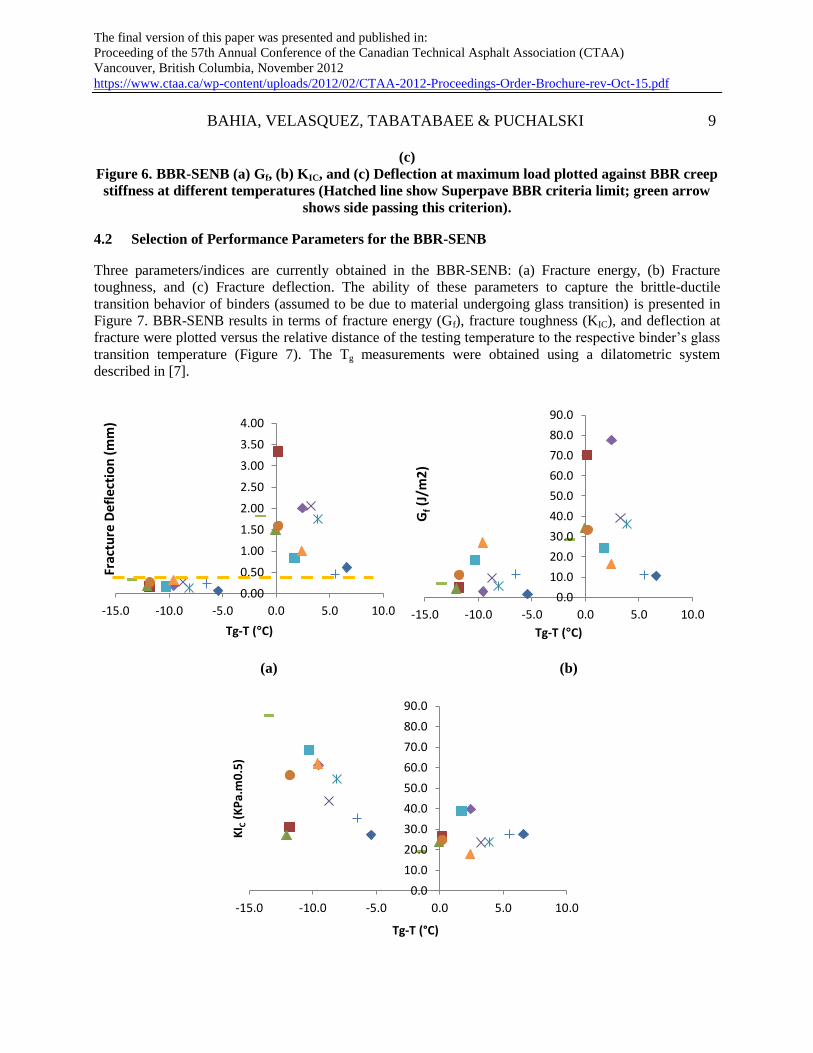
Three parameters/indices are currently obtained in the BBR-SENB: (a) Fracture energy, (b) Fracture
toughness, and (c) Fracture deflection. The ability of these parameters to capture the brittle-ductile
transition behavior of binders (assumed to be due to material undergoing glass transition) is presented in
Figure 7. BBR-SENB results in terms of fracture energy (Gf), fracture toughness (KIC), and deflection at
fracture were plotted versus the relative distance of the testing temperature to the respective binder’s glass
transition temperature (Figure 7). The Tg measurements were obtained using a dilatometric system
described in [7].
(a) (b)
0.00
0.50
1.00
1.50
2.00
2.50
3.00
3.50
4.00
-15.0 -10.0 -5.0 0.0 5.0 10.0
Frac
ture
De
fle
ctio
n (
mm
)
Tg-T (°C)
0.0
10.0
20.0
30.0
40.0
50.0
60.0
70.0
80.0
90.0
-15.0 -10.0 -5.0 0.0 5.0 10.0
Gf (
J/m
2)
Tg-T (°C)
0.0
10.0
20.0
30.0
40.0
50.0
60.0
70.0
80.0
90.0
-15.0 -10.0 -5.0 0.0 5.0 10.0
KI C
(K
Pa.
m0
.5)
Tg-T (°C)
The final version of this paper was presented and published in:
Proceeding of the 57th Annual Conference of the Canadian Technical Asphalt Association (CTAA)
Vancouver, British Columbia, November 2012
https://www.ctaa.ca/wp-content/uploads/2012/02/CTAA-2012-Proceedings-Order-Brochure-rev-Oct-15.pdf
10 THE ROLE OF BINDER FRACTURE PROPERTIES IN THERMAL CRACKING
(c)
Figure 7. Brittle-ductile transition behaviour using BBR-SENB parameters (a) Fracture deflection,
(b) Fracture energy, (c) Fracture toughness.
The results shown in Figure 7(a) indicate that binders tested at temperatures below their glass transition
temperature (Tg) show fracture deformation/deflection consistently at or below 0.35 mm, which could be
considered as the limit for the brittle to ductile transition. The ductile to brittle cut-off value is harder to
discern when using fracture energy (Gf), which is influenced by both fracture load as well as the fracture
deflection. Although 90 percent of the binders tested in the brittle temperatures fractured at energies at or
below 10.0 J/m2, a few binders in the ductile zone also fractured at energies below this value. Figure 7(c)
clearly shows that fracture toughness is not a good indicator of the ductile to brittle transition of asphalt
binders as the magnitude of fracture toughness for several binders are in the same range when tested below
and above their glass transition. Therefore, this index is not recommended for specifications or material
selection purposes.
4.3 Effect of Physical Hardening on BBR-SENB Parameters
In the last few years the importance of considering physical hardening has been highlighted in a few
studies [11-14]. Therefore in this study the effect of isothermal conditioning on fracture properties of
binders was also investigated. Figure 8 shows the typical trend resulting from conditioning for 72 hours.
Figure 9 depicts results of testing selected binders from Table 1 after 72 hours of conditioning at their Tg.
The results are shown in terms of normalized values (ratio of value after 72 hours of conditioning divided
by the value after 0.5 hours). Figure 9 indicates significant changes in the overall fracture response of the
selected binders after isothermal conditioning. It can be seen that the slope of the load-deflection (P-u)
curve increases significantly after conditioning. The fracture toughness also increased for all binders tested
after conditioning, however, a varying trend was observed for Gf. Fracture energy increased or was
constant for the two unmodified binders (i.e., MnROAD Cell 20 and New York, NY), while decreasing for
the three modified binders. This reduction is explained by the relative loss of strain tolerance with
conditioning time. In other words, the increase in load at fracture is offset by reduction in deflection at
break for the modified binders. The observed trend is clearly shown for the deflection parameter (uf) in
Figure 9d, in which the normalized value of failure deflection are all below one when normalized relative
to their respective values measured after 0.5 hr of isothermal conditioning.

The final version of this paper was presented and published in:
Proceeding of the 57th Annual Conference of the Canadian Technical Asphalt Association (CTAA)
Vancouver, British Columbia, November 2012
https://www.ctaa.ca/wp-content/uploads/2012/02/CTAA-2012-Proceedings-Order-Brochure-rev-Oct-15.pdf
BAHIA, VELASQUEZ, TABATABAEE & PUCHALSKI 11
Figure 8. Typical change in load (P) - deformation (u) curve before and after isothermal
conditioning at the glass transition temperature (Tg).
(a) (b)
0.0
0.2
0.4
0.6
0.8
1.0
1.2
1.4
1.6
1.8
C20 C22 C34 C77 NY
No
rmal
ize
d G
f
0.0
0.2
0.4
0.6
0.8
1.0
1.2
1.4
1.6
1.8
C20 C22 C34 C77 NY
No
rmal
ize
d K
IC
0.0
0.2
0.4
0.6
0.8
1.0
1.2
1.4
1.6
1.8
C20 C22 C34 C77 NY
No
rmal
ize
d P
-u S
lop
e
0.0
0.2
0.4
0.6
0.8
1.0
1.2
1.4
1.6
1.8
C20 C22 C34 C77 NY
No
rmal
ize
d u
f
The final version of this paper was presented and published in:
Proceeding of the 57th Annual Conference of the Canadian Technical Asphalt Association (CTAA)
Vancouver, British Columbia, November 2012
https://www.ctaa.ca/wp-content/uploads/2012/02/CTAA-2012-Proceedings-Order-Brochure-rev-Oct-15.pdf
12 THE ROLE OF BINDER FRACTURE PROPERTIES IN THERMAL CRACKING
(c) (d)
Figure 9. BBR-SENB parameters after 72 hours of isothermal conditioning normalized to results
after 0.5 hours of conditioning, (a) Gf, (b) KIC, (c) slope of P-u curve, and (d) deflection at fracture
(uf).
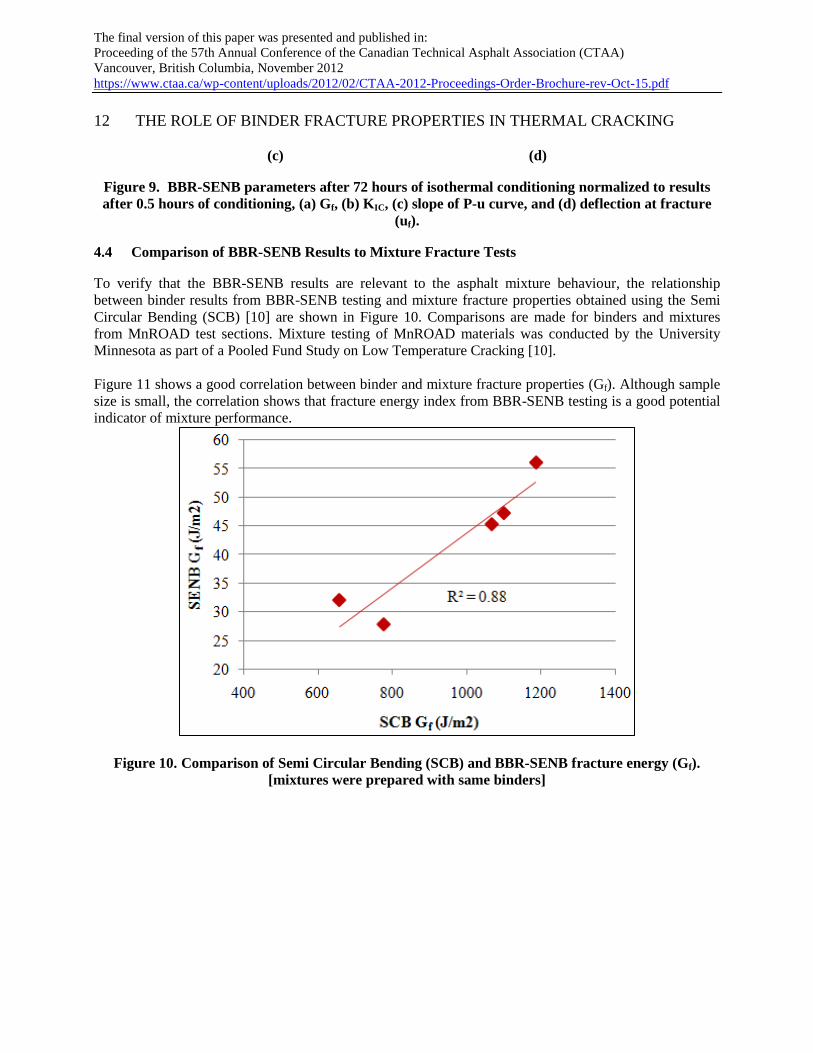
4.4 Comparison of BBR-SENB Results to Mixture Fracture Tests
To verify that the BBR-SENB results are relevant to the asphalt mixture behaviour, the relationship
between binder results from BBR-SENB testing and mixture fracture properties obtained using the Semi
Circular Bending (SCB) [10] are shown in Figure 10. Comparisons are made for binders and mixtures
from MnROAD test sections. Mixture testing of MnROAD materials was conducted by the University
Minnesota as part of a Pooled Fund Study on Low Temperature Cracking [10].
Figure 11 shows a good correlation between binder and mixture fracture properties (Gf). Although sample
size is small, the correlation shows that fracture energy index from BBR-SENB testing is a good potential
indicator of mixture performance.
Figure 10. Comparison of Semi Circular Bending (SCB) and BBR-SENB fracture energy (Gf).
[mixtures were prepared with same binders]
The final version of this paper was presented and published in:
Proceeding of the 57th Annual Conference of the Canadian Technical Asphalt Association (CTAA)
Vancouver, British Columbia, November 2012
https://www.ctaa.ca/wp-content/uploads/2012/02/CTAA-2012-Proceedings-Order-Brochure-rev-Oct-15.pdf
BAHIA, VELASQUEZ, TABATABAEE & PUCHALSKI 13
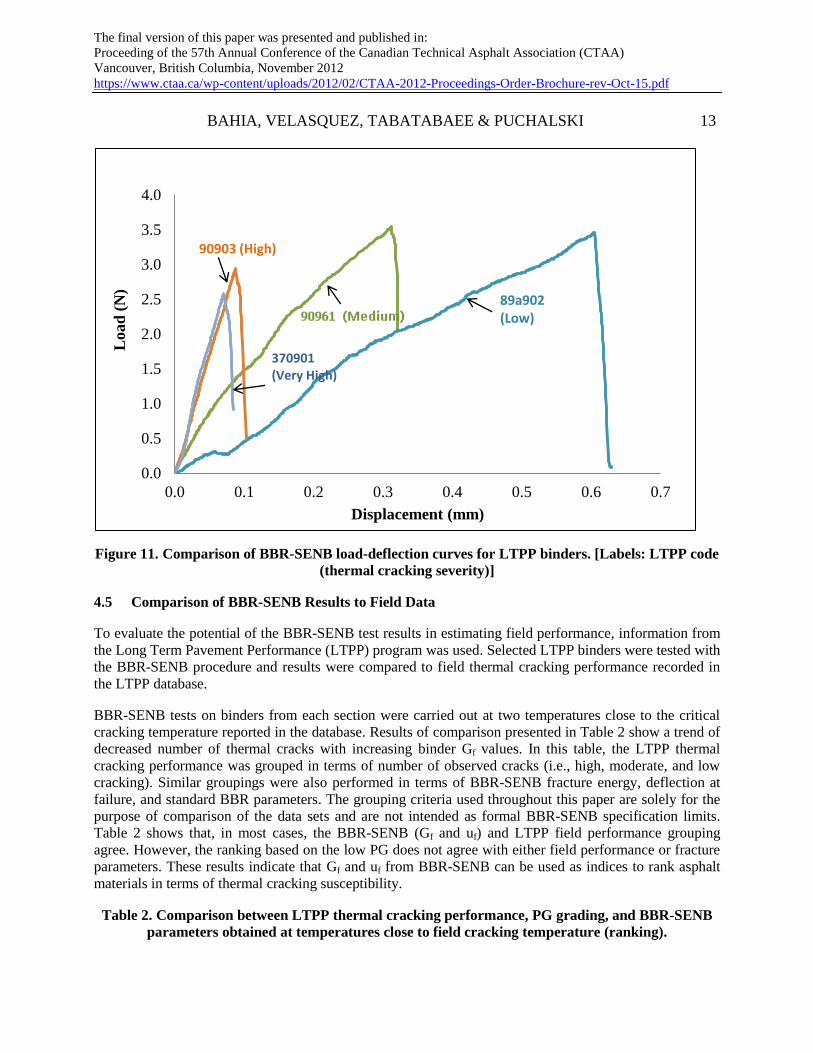
Figure 11. Comparison of BBR-SENB load-deflection curves for LTPP binders. [Labels: LTPP code
(thermal cracking severity)]
4.5 Comparison of BBR-SENB Results to Field Data
To evaluate the potential of the BBR-SENB test results in estimating field performance, information from
the Long Term Pavement Performance (LTPP) program was used. Selected LTPP binders were tested with
the BBR-SENB procedure and results were compared to field thermal cracking performance recorded in
the LTPP database.
BBR-SENB tests on binders from each section were carried out at two temperatures close to the critical
cracking temperature reported in the database. Results of comparison presented in Table 2 show a trend of
decreased number of thermal cracks with increasing binder Gf values. In this table, the LTPP thermal
cracking performance was grouped in terms of number of observed cracks (i.e., high, moderate, and low
cracking). Similar groupings were also performed in terms of BBR-SENB fracture energy, deflection at
failure, and standard BBR parameters. The grouping criteria used throughout this paper are solely for the
purpose of comparison of the data sets and are not intended as formal BBR-SENB specification limits.
Table 2 shows that, in most cases, the BBR-SENB (Gf and uf) and LTPP field performance grouping
agree. However, the ranking based on the low PG does not agree with either field performance or fracture
parameters. These results indicate that Gf and uf from BBR-SENB can be used as indices to rank asphalt
materials in terms of thermal cracking susceptibility.
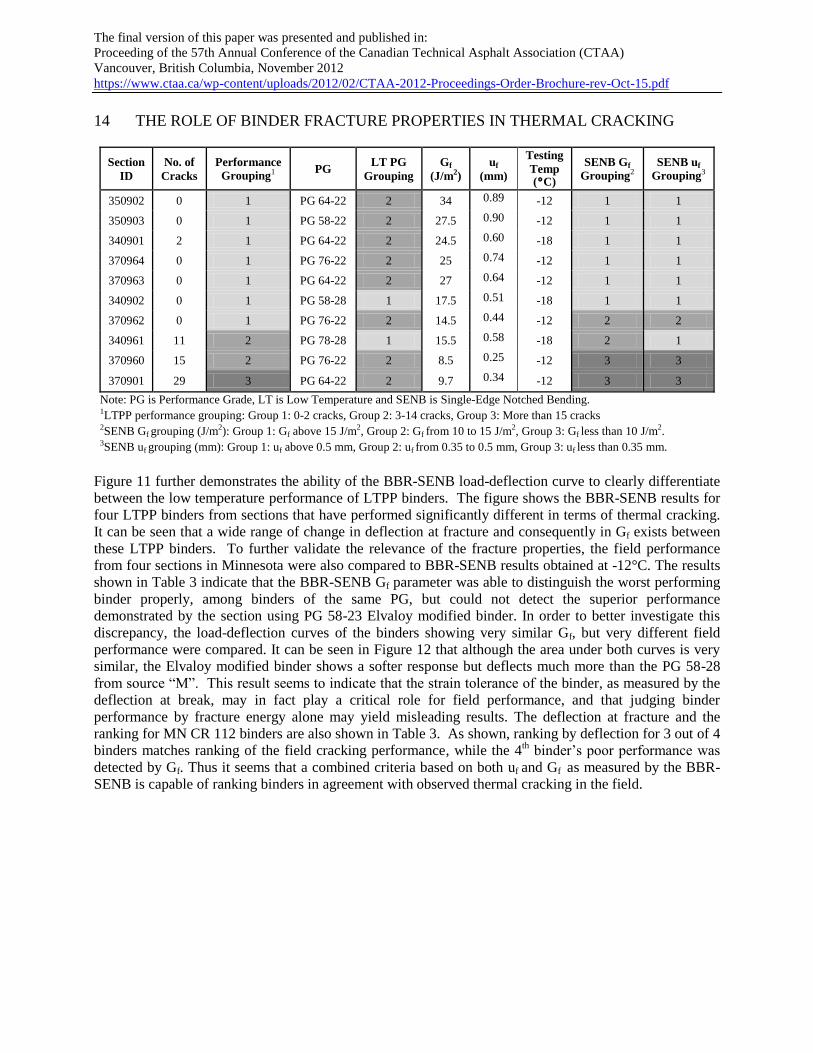
Table 2. Comparison between LTPP thermal cracking performance, PG grading, and BBR-SENB
parameters obtained at temperatures close to field cracking temperature (ranking).
0.0
0.5
1.0
1.5
2.0
2.5
3.0
3.5
4.0
0.0 0.1 0.2 0.3 0.4 0.5 0.6 0.7
Load
(N
)
Displacement (mm)
89a902 (Low)
90903 (High)
370901 (Very High)
The final version of this paper was presented and published in:
Proceeding of the 57th Annual Conference of the Canadian Technical Asphalt Association (CTAA)
Vancouver, British Columbia, November 2012
https://www.ctaa.ca/wp-content/uploads/2012/02/CTAA-2012-Proceedings-Order-Brochure-rev-Oct-15.pdf
14 THE ROLE OF BINDER FRACTURE PROPERTIES IN THERMAL CRACKING
Section
ID
No. of
Cracks
Performance
Grouping1 PG
LT PG
Grouping
Gf
(J/m2)
uf
(mm)
Testing
Temp (°C)
SENB Gf
Grouping2
SENB uf
Grouping3
350902 0 1 PG 64-22 2 34 0.89 -12 1 1
350903 0 1 PG 58-22 2 27.5 0.90 -12 1 1
340901 2 1 PG 64-22 2 24.5 0.60 -18 1 1
370964 0 1 PG 76-22 2 25 0.74 -12 1 1
370963 0 1 PG 64-22 2 27 0.64 -12 1 1
340902 0 1 PG 58-28 1 17.5 0.51 -18 1 1
370962 0 1 PG 76-22 2 14.5 0.44 -12 2 2
340961 11 2 PG 78-28 1 15.5 0.58 -18 2 1
370960 15 2 PG 76-22 2 8.5 0.25 -12 3 3
370901 29 3 PG 64-22 2 9.7 0.34 -12 3 3
Note: PG is Performance Grade, LT is Low Temperature and SENB is Single-Edge Notched Bending. 1LTPP performance grouping: Group 1: 0-2 cracks, Group 2: 3-14 cracks, Group 3: More than 15 cracks 2SENB Gf grouping (J/m2): Group 1: Gf above 15 J/m2, Group 2: Gf from 10 to 15 J/m2, Group 3: Gf less than 10 J/m2. 3SENB uf grouping (mm): Group 1: uf above 0.5 mm, Group 2: uf from 0.35 to 0.5 mm, Group 3: uf less than 0.35 mm.
Figure 11 further demonstrates the ability of the BBR-SENB load-deflection curve to clearly differentiate
between the low temperature performance of LTPP binders. The figure shows the BBR-SENB results for
four LTPP binders from sections that have performed significantly different in terms of thermal cracking.
It can be seen that a wide range of change in deflection at fracture and consequently in Gf exists between
these LTPP binders. To further validate the relevance of the fracture properties, the field performance
from four sections in Minnesota were also compared to BBR-SENB results obtained at -12°C. The results
shown in Table 3 indicate that the BBR-SENB Gf parameter was able to distinguish the worst performing
binder properly, among binders of the same PG, but could not detect the superior performance
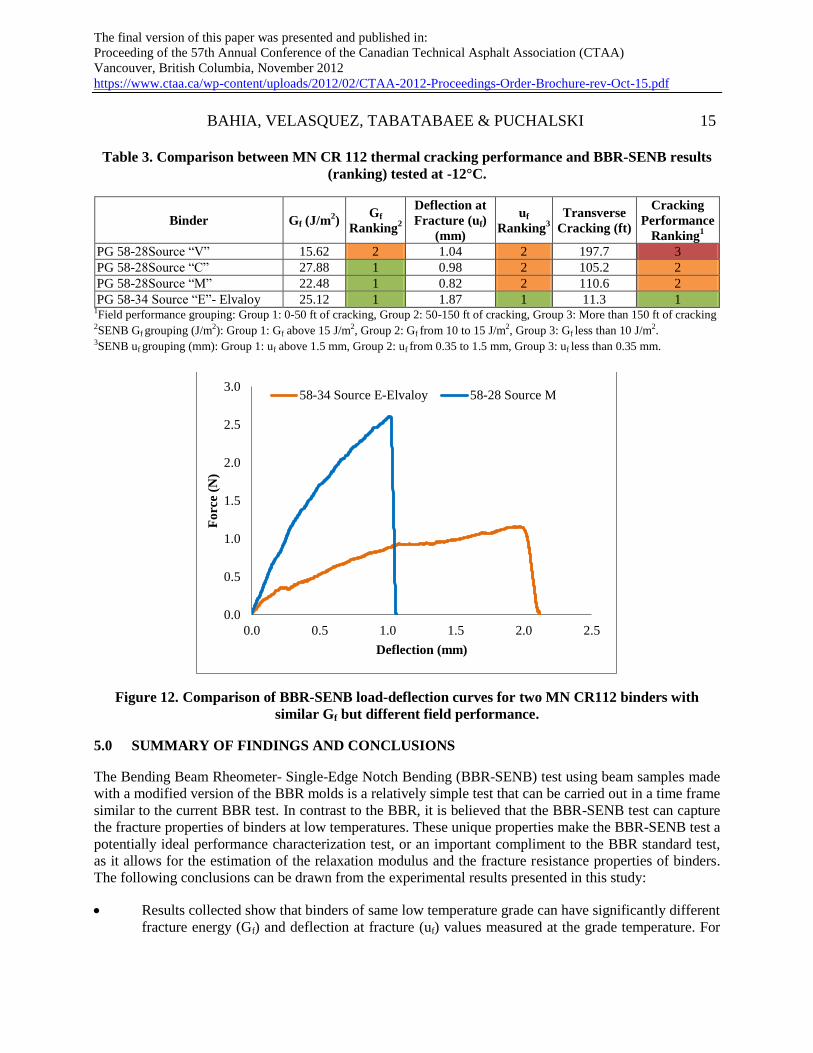
demonstrated by the section using PG 58-23 Elvaloy modified binder. In order to better investigate this
discrepancy, the load-deflection curves of the binders showing very similar Gf, but very different field
performance were compared. It can be seen in Figure 12 that although the area under both curves is very
similar, the Elvaloy modified binder shows a softer response but deflects much more than the PG 58-28
from source “M”. This result seems to indicate that the strain tolerance of the binder, as measured by the
deflection at break, may in fact play a critical role for field performance, and that judging binder
performance by fracture energy alone may yield misleading results. The deflection at fracture and the
ranking for MN CR 112 binders are also shown in Table 3. As shown, ranking by deflection for 3 out of 4
binders matches ranking of the field cracking performance, while the 4th binder’s poor performance was
detected by Gf. Thus it seems that a combined criteria based on both uf and Gf as measured by the BBR-
SENB is capable of ranking binders in agreement with observed thermal cracking in the field.
The final version of this paper was presented and published in:
Proceeding of the 57th Annual Conference of the Canadian Technical Asphalt Association (CTAA)
Vancouver, British Columbia, November 2012
https://www.ctaa.ca/wp-content/uploads/2012/02/CTAA-2012-Proceedings-Order-Brochure-rev-Oct-15.pdf
BAHIA, VELASQUEZ, TABATABAEE & PUCHALSKI 15
Table 3. Comparison between MN CR 112 thermal cracking performance and BBR-SENB results
(ranking) tested at -12°C.
Binder Gf (J/m2)
Gf
Ranking2
Deflection at
Fracture (uf)
(mm)
uf
Ranking3
Transverse
Cracking (ft)
Cracking
Performance
Ranking1
PG 58-28Source “V” 15.62 2 1.04 2 197.7 3
PG 58-28Source “C” 27.88 1 0.98 2 105.2 2
PG 58-28Source “M” 22.48 1 0.82 2 110.6 2
PG 58-34 Source “E”- Elvaloy 25.12 1 1.87 1 11.3 1 1Field performance grouping: Group 1: 0-50 ft of cracking, Group 2: 50-150 ft of cracking, Group 3: More than 150 ft of cracking 2SENB Gf grouping (J/m2): Group 1: Gf above 15 J/m2, Group 2: Gf from 10 to 15 J/m2, Group 3: Gf less than 10 J/m2. 3SENB uf grouping (mm): Group 1: uf above 1.5 mm, Group 2: uf from 0.35 to 1.5 mm, Group 3: uf less than 0.35 mm.
Figure 12. Comparison of BBR-SENB load-deflection curves for two MN CR112 binders with
similar Gf but different field performance.
5.0 SUMMARY OF FINDINGS AND CONCLUSIONS
The Bending Beam Rheometer- Single-Edge Notch Bending (BBR-SENB) test using beam samples made
with a modified version of the BBR molds is a relatively simple test that can be carried out in a time frame
similar to the current BBR test. In contrast to the BBR, it is believed that the BBR-SENB test can capture
the fracture properties of binders at low temperatures. These unique properties make the BBR-SENB test a
potentially ideal performance characterization test, or an important compliment to the BBR standard test,
as it allows for the estimation of the relaxation modulus and the fracture resistance properties of binders.
The following conclusions can be drawn from the experimental results presented in this study:
Results collected show that binders of same low temperature grade can have significantly different
fracture energy (Gf) and deflection at fracture (uf) values measured at the grade temperature. For
0.0
0.5
1.0
1.5
2.0
2.5
3.0
0.0 0.5 1.0 1.5 2.0 2.5
Fo
rce
(N)
Deflection (mm)
58-34 Source E-Elvaloy 58-28 Source M
The final version of this paper was presented and published in:
Proceeding of the 57th Annual Conference of the Canadian Technical Asphalt Association (CTAA)
Vancouver, British Columbia, November 2012
https://www.ctaa.ca/wp-content/uploads/2012/02/CTAA-2012-Proceedings-Order-Brochure-rev-Oct-15.pdf
16 THE ROLE OF BINDER FRACTURE PROPERTIES IN THERMAL CRACKING
example, binders graded as PG (xx-28) showed a range of 5 to 80 J/m2
measured at -12°C. This
finding indicates that performance grading at low temperature is not sufficient to rank binder
properly with respect to their fracture resistance.
Analysis of field performance data from LTPP sections and a County Road (MN CR 112) in
Minnesota indicates the potential of using Gf and deflection at maximum load (uf) to rank binders
according to field cracking significantly better than current PG grade system.
Selection of a performance indicator from the BBR-SENB results is also complex. From a
fundamental point of view, the fracture energy (Gf) is a technically sound parameter. However, in
this study it appears that strain tolerance, as measured by the deflection at fracture, is also a very
important index that correlates better to field performance. It is also clear that deflection at
fracture is a good indicator of brittleness in the glassy stage (i.e., performance below glass
transition temperature). It is therefore recommended to use both parameters by specifying a
minimum allowable value of Gf and a minimum value of deflection at fracture (uf).
Although, the fracture indices obtained in the BBR-SENB test appear to be good indicators of the
fracture resistance of binders, the complexity of the viscoelastic behavior in terms of time
dependency should be recognized. It is expected that results of the BBR-SENB will vary
significantly at different temperatures and displacement rates.
Future studies on the use of the BBR-SENB and low temperature characterization are encouraged
to focus on determination of representative testing conditions. With special emphasis on the effect
of different loading rates and temperatures on the fracture response of viscoelastic materials. For
development of a reliable prediction model, it may be necessary to characterize the materials over
a range of loading rates and temperatures rather than using only one loading rate and few selected
temperatures as done in this study.
REFERENCES
[1] American Association of State Highway and Transportation Officials (AASHTO) Standard T313-
05, "Standard method of test for determining the flexural creep stiffness of asphalt binder using the
Bending Beam Rheometer (BBR)," Standard Specifications for Transportation Materials and
Methods of Sampling and Testing, 25th Edition, (2005).
[2] T. Hoare and S. Hesp, “Low-Temperature Fracture Testing of Asphalt Binders: Regular and
Modified Systems.” Transportation Research Record 1728, pp. 36-42, (2000).
[3] S. Hesp, “An improved low-temperature asphalt binder specification method.” Final report,
NCHRP-IDEA contract 84 and Ministry of Transportation Ontario Contract 9015-A-000190,
(2003).
[4] E. Chailleux, and V. Mouillet, “Determination of the low temperature bitumen cracking properties:
fracture mechanics principle applied to a three points bending test using a non-homogeneous
geometry,” ICAP Proceedings, Quebec, (2006).
The final version of this paper was presented and published in:
Proceeding of the 57th Annual Conference of the Canadian Technical Asphalt Association (CTAA)
Vancouver, British Columbia, November 2012
https://www.ctaa.ca/wp-content/uploads/2012/02/CTAA-2012-Proceedings-Order-Brochure-rev-Oct-15.pdf
BAHIA, VELASQUEZ, TABATABAEE & PUCHALSKI 17
[5] E. Chailleux, V. Mouillet, L. Gaillet, D. Hamon, “Towards a Better Understanding of the Three
Point Bending Test Performed on Bituminous Binders. Advanced Characterization of Pavement and
Soil Engineering Materials.” Taylor & Francis Group, ISBN 978-0-415-44882-6, 1075-1084,
London, (2007).
[6] ASTM Standard E399, “Standard Test Method for Linear-Elastic Plane-Strain Fracture Toughness
KIC of Metallic Materials”, West Conshohocken, PA, DOI: 10.1520/E0399-09E01, (2006).
[7] Velasquez R., Tabatabaee, H.A. and Bahia, H.U., “Low Temperature Cracking Characterization of
Asphalt Binders by Means of the Single-Edge Notch Bending (SENB) Test.” Journal of the
Association of Asphalt Paving Technologists, Vol. 80, (2011), pp. 583-614.
[8] American Association of State Highway and Transportation Officials (AASHTO) Designation
T314-02, "Standard Method of Test for Determining the Fracture Properties of Asphalt Binder in
Direct Tension (DT)", Standard Specifications for Transportation Materials and Methods of
Sampling and Testing, Part 2B: Tests, 22nd Edition, Washington, D.C., (2002).
[9] Second Quarterly Report, Asphalt Research Consortium (ARC), Work Element E2d, (2011),
www.arc.unr.edu.
[10] Marasteanu, M., Zofka, A., Turos, M., Li, X., Velasquez, R., Li, X., Buttler, W., Paulino, G.,
Braham, A., Dave, E., Ojo, J., Bahia, H., Williams, C., Bausano, J., Gallistel, A., McGraw, J.,
“Investigation of Low Temperature Cracking in Asphalt: Pavements National pooled Fund Study
776,” Minnesota Department of Transportation, MN/RC 2007-43, (2007).
[11] Hesp, S., and Subramani S. “Another Look at the Bending Beam Rheometer for Specification
Grading of Asphalt Cements”, Proceedings of 6th MAIREPAV Conference, Torino, Italy, (2009).
[12] Evans M, Marchildon R, Hesp, S. “Effects of Physical Hardening on Stress Relaxation in Asphalt
Cements - Implications for Pavement performance.”, Transportation Research Record: Journal of
the Transportation Research Board, (2011); 2207: 34-42.
[13] Bahia, H.U., and Velasquez, R., “Understanding the Mechanism of Low Temperature Physical
Hardening of Asphalt Binders.” Proceedings of the 55th Annual Meeting of the Canadian Technical
Asphalt Association, (2010).
[14] Tabatabaee, H.A., Velasquez R., Bahia, H.U., “Predicting low temperature physical hardening in
asphalt binders.” Construction and Building Materials, Elsevier, Vol. 34, pp. 162–169, (2012).

![Binder 216, Terminology [Trematoda Taxon Notebooks]](https://static.fdokumen.com/doc/165x107/63338ab23108fad7760f19c8/binder-216-terminology-trematoda-taxon-notebooks.jpg)


![Binder 200, Small families [Trematoda Taxon Notebooks]](https://static.fdokumen.com/doc/165x107/6324444cb104cba27a091035/binder-200-small-families-trematoda-taxon-notebooks.jpg)