QUICK SCAN HEALTH BENEFITS AND COSTS OF WATER SUPPLYAND SANITATION
47
QUICK SCAN HEALTH BENEFITS AND COSTS OF WATER SUPPLY AND SANITATION J.J. Bos 1 , H.J. Gijzen 1 , H.B.M. Hilderink 2 , M. Moussa 1 , L.W. Niessen 3 , E.D. de Ruyter van Steveninck 1 1 UNESCO-IHE 2 RIVM-MNP 3 EUR – iBMG / iMTA In consultation with WHO
-
Upload
independent -
Category
Documents
-
view
1 -
download
0
Transcript of QUICK SCAN HEALTH BENEFITS AND COSTS OF WATER SUPPLYAND SANITATION
QQUUIICCKK SSCCAANN HHEEAALLTTHH BBEENNEEFFIITTSS AANNDD
CCOOSSTTSS OOFF WWAATTEERR SSUUPPPPLLYY AANNDD
SSAANNIITTAATTIIOONN
J.J. Bos1, H.J. Gijzen1, H.B.M. Hilderink2, M. Moussa1, L.W. Niessen3, E.D. de Ruyter
van Steveninck1
1 UNESCO-IHE
2 RIVM-MNP
3 EUR – iBMG / iMTA
In consultation with WHO

PAGE 2 OF 47 QUICK SCAN WATER, SANITATION
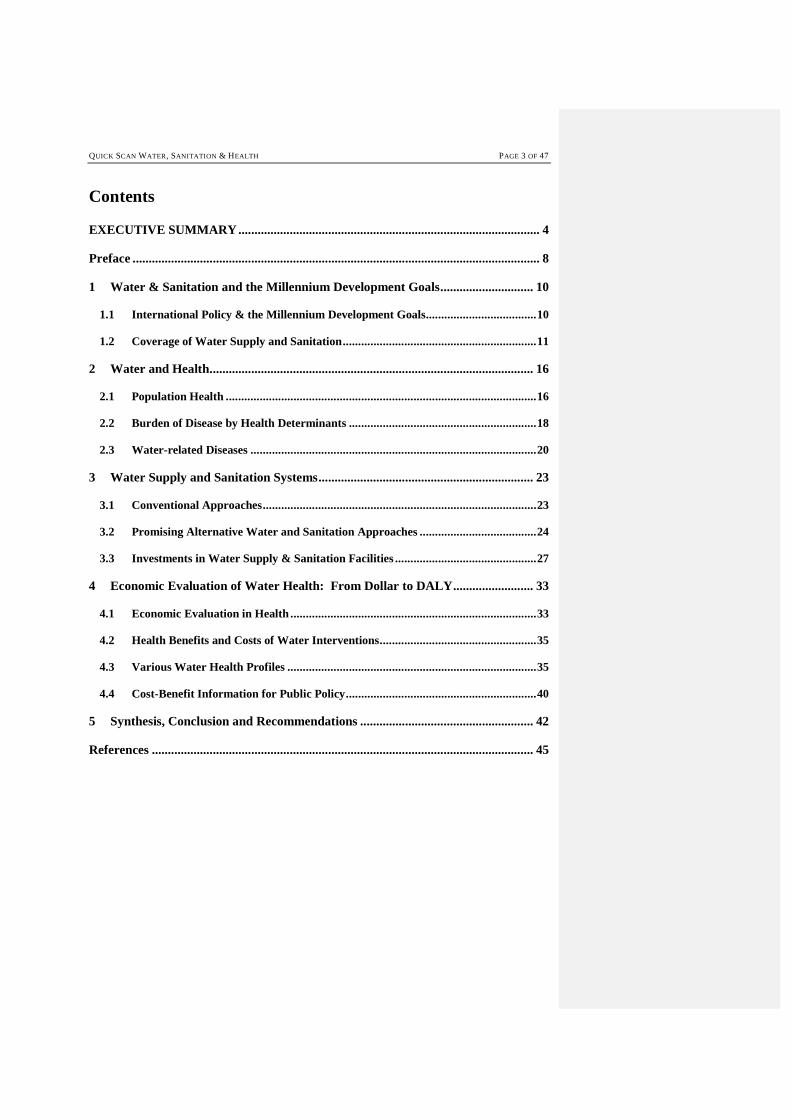
QUICK SCAN WATER, SANITATION & HEALTH PAGE 3 OF 47
Contents
EXECUTIVE SUMMARY .............................................................................................. 4
Preface ............................................................................................................................... 8
1 Water & Sanitation and the Millennium Development Goals ............................. 10
1.1 International Policy & the Millennium Development Goals .................................... 10
1.2 Coverage of Water Supply and Sanitation ............................................................... 11
2 Water and Health ..................................................................................................... 16
2.1 Population Health ..................................................................................................... 16
2.2 Burden of Disease by Health Determinants ............................................................. 18
2.3 Water-related Diseases ............................................................................................. 20
3 Water Supply and Sanitation Systems ................................................................... 23
3.1 Conventional Approaches ......................................................................................... 23
3.2 Promising Alternative Water and Sanitation Approaches ...................................... 24
3.3 Investments in Water Supply & Sanitation Facilities .............................................. 27
4 Economic Evaluation of Water Health: From Dollar to DALY ......................... 33
4.1 Economic Evaluation in Health ................................................................................ 33
4.2 Health Benefits and Costs of Water Interventions ................................................... 35
4.3 Various Water Health Profiles ................................................................................. 35
4.4 Cost-Benefit Information for Public Policy .............................................................. 40
5 Synthesis, Conclusion and Recommendations ...................................................... 42
References ....................................................................................................................... 45
PAGE 4 OF 47 QUICK SCAN WATER, SANITATION
EXECUTIVE SUMMARY
• Aim and scope of the study. The objective of this report is to provide a preliminary assessment (quick-scan) of
costs of water and sanitation services (WSS) in relation to population health, and to identify possible options to
reduce the water-related burden of disease in a more cost-effective way. Although WSS interventions also
generate substantial benefits in terms of environmental sustainability and economic activities (e.g. fish exports,
tourism), this report focuses only on the public health benefits of improved WSS.
• Coverage of water supply and sanitation services. Global coverage of water supply and sanitation services is
estimated at 82% and 60%, respectively. This means that total, 1.1 billion people still do not have access to safe
water and 2.4 billion people lack access to improved sanitation services. The majority of these people live in Asia
and Africa, and most of those underserved in rural areas. Global coverage for wastewater treatment is much lower
than that for sanitation. It is estimated that less than 15% of all generated wastewater receives primary or
secondary treatment, while less than 2% receives tertiary treatment. Improved water supply coverage will worsen
the already dramatic effects of wastewater discharges on fresh water resources, if this is not accompanied by
adequate wastewater treatment.
• Millennium Development Goals. During the 2000 World Summit on Sustainable Development, world leaders
confirmed the so-called Millennium Development Goals (MDG). The Millennium Development Goals emphasise
a strong water and sanitation component in both development and health policy objectives. One of the MDGs,
Goal 7 ‘Ensure Environmental Sustainability’, aims to halve, by 2015, the proportion of people without
sustainable access to safe drinking water and basic sanitation, both rural and urban. Since this target is defined
under the Goals ‘Environmental Sustainability’, the interventions also include the effective management of the
larger volumes of wastewater that will be produced. The challenge will be to provide these services at reasonable
costs.
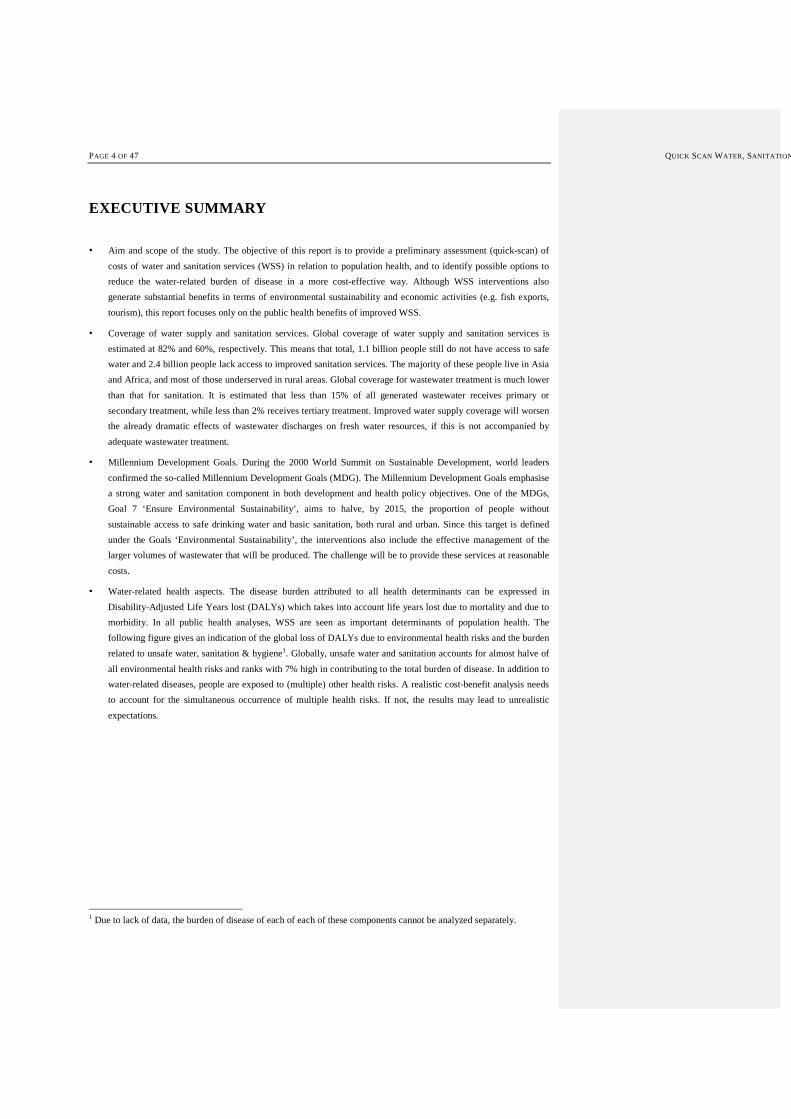
• Water-related health aspects. The disease burden attributed to all health determinants can be expressed in
Disability-Adjusted Life Years lost (DALYs) which takes into account life years lost due to mortality and due to
morbidity. In all public health analyses, WSS are seen as important determinants of population health. The
following figure gives an indication of the global loss of DALYs due to environmental health risks and the burden
related to unsafe water, sanitation & hygiene1. Globally, unsafe water and sanitation accounts for almost halve of
all environmental health risks and ranks with 7% high in contributing to the total burden of disease. In addition to
water-related diseases, people are exposed to (multiple) other health risks. A realistic cost-benefit analysis needs
to account for the simultaneous occurrence of multiple health risks. If not, the results may lead to unrealistic
expectations.
1 Due to lack of data, the burden of disease of each of each of these components cannot be analyzed separately.
QUICK SCAN WATER, SANITATION & HEALTH PAGE 5 OF 47
World
Environmental Risk
Urban air pollution
(1%)
Non-Enviromental Risk
(85%)
Unsafe water, sanitation and
hygiene(7%)
Indoor smoke from solid fuels
(1%)
Lead exposure(5%)
Climate change(2%)
Distribution of global environmental health determinants to disease burden
• Cost of conventional approaches to WSS. The cost of conventional water supply, sanitation and wastewater
management services is prohibitive for low-income regions. Especially the cost of full wastewater management is
phenomenal and will be beyond the reach of most developing nations. The World Bank estimates that spending
3% of GDP on environment is reasonable of which half could be devoted to water problems; Poor countries
would need about a thousand years to meet the MDG goals at this level of spending; for countries in transition this
is about a hundred years. Various sources have estimated the costs to achieve worldwide coverage of water supply
and sanitation in 2025 at between 75 and 132 billion US$ per year. This report estimates a required per capita
investment of 34 US$ per year. This investment covers only water supply and basic sanitation and does not
include any wastewater treatment. Including the cost of conventional wastewater treatment will result in a
substantial rise of the costs to 104-124 US$/capita/year. Such high investments are inaccessible especially within
the developing regions which urges to find better alternatives.
• Alternatives: the 3-Step Strategic Approach (3-SSA). This report suggests a 3-Step Strategic Approach for the
cost-effective management of the urban water cycle. This approach applies cleaner production principles to the
urban water cycle and consists of three steps: 1) prevention and minimisation of use, 2) treatment for reuse, and 3)
planned discharge with stimulation of self-purification capacity of the receiving water body. The systematic
application of this approach is expected to yield substantial cost reductions.
• Health benefits. Annually an estimated 1.5 billion cases of diarrhoea and 3.3 million deaths of children under 5
years are reported due to faecal oral infections. The total number of death cases due to faecal oral infections is
estimated at about 5 million per year. Another 1.3 billion infections per year are caused by Ascariasis
(roundworm). Improvement of water treatment, sanitation, wastewater treatment and hygiene is likely to have
most effect on the reduction of faecal-oral diseases, and in doing so, reduce the health burden. The main focus in
this report is on the reduction of diarrhoeal diseases. Secondary benefits include an improved nutritional status,
due to reduced losses of nutrients via diarrhoea, improved productivity and income generation.
• From dollar to DALY. Outcomes of the WHO-Choice model have been used to relate cost of water supply and
sanitation interventions with health benefits. The results show rather reasonable cost per DALY, varying between
200 and 2000 US$ / DALY depending on the population density, the degree of urbanization and the technology
applied. Applying the systematic application of alternative strategies such as the 3-SSA could substantially reduce
cost levels. These alternatives could lead to substantial cost reductions or higher health gains per dollar, both
improving efficiency (US$/DALY). More insights in the health economics of low tech, sustainable options in
water supply and sanitation are needed.
PAGE 6 OF 47 QUICK SCAN WATER, SANITATION
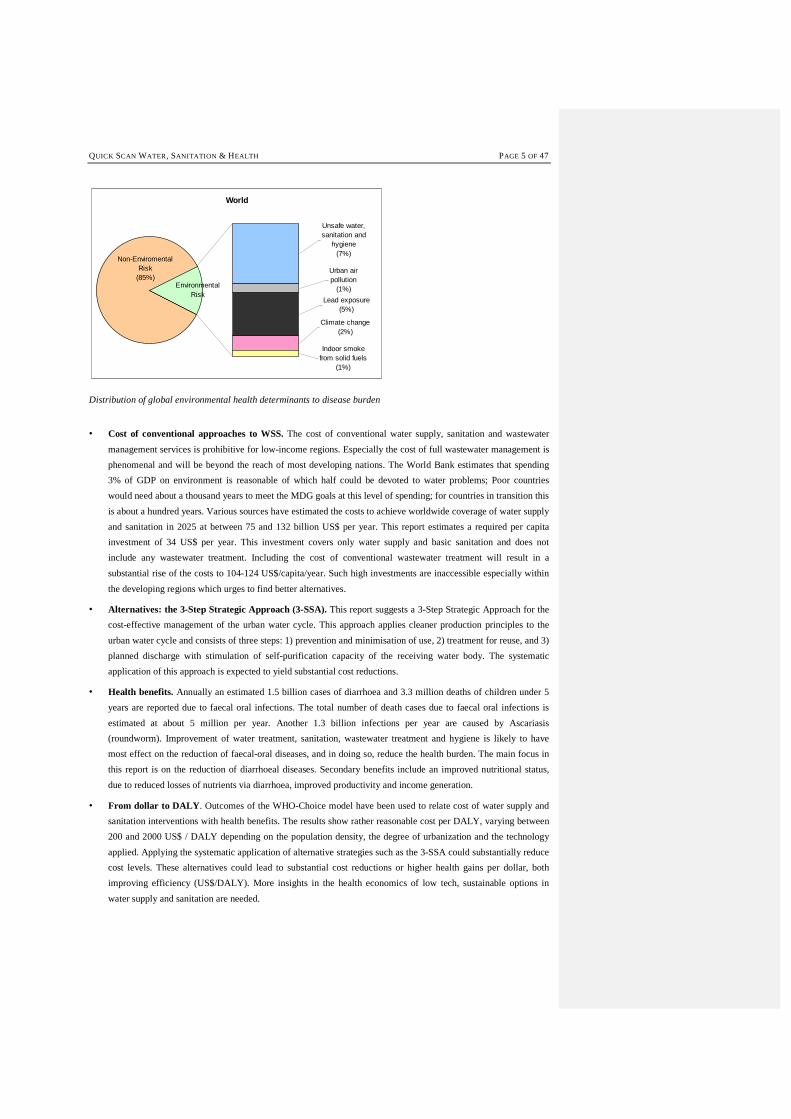
• Various water-health profiles. This paper reports first results of a cost-benefit analysis of the more promising
options in water and sanitation. The results for a hypothetical high-density population in rural South-Asia are
shown in the table below. The assumption underneath these calculations has been that the alternative, more low-
tech solutions are just as effective as conventional approaches in gaining health benefits.
Intervention options
Total DALYs averted
per year
Average cost per
DALY retrieved
Incremental cost per
DALY retrieved
Improved water supply & sanitation
disinfect ion (98%) – WHO 1.887 557 NA
Piped water supply and sewage with
treatment (98%)- WHO 2.851 1.032 3.053
Sanitation intervention I (rural, low tech) 2.851 622 More efficient
Sanitation intervention II (urban, high
tech) 2.851 2.873 8.497
Sanitation intervention III (urban 3 SSA) 2.851 1.106 Same level efficiency
Health benefits and cost-benefit ratio (cost/DALY) in a hypothetical rural population in Asia of 100.000 using
promising alternative, low technology water & sanitation interventions in rural, densely populated areas.
• Promising alternatives? The table above summarises that promising rural low-tech options (Intervention I) in a
hypothetical population show a higher amount of DALYs averted (2.851) with relatively low cost-benefits ratios
compared to the two WHO options. This is mainly due to the low costs of the interventions and the longer
functional lifetime of the intervention techniques. The results for the second alternative intervention (II) shows
that high coverage of population with conventional treatment, like in Western countries, lead to very costly, cost-
ineffective policies. The last option (III) shows that the alternative three-step approach as outlined in section 2.4
also may lead to more cost-effective policy choice, assuming similar high health gains. This shows the possibility
of cost-minimisation. These kinds of scenarios and many more additional strategies need to be studied in terms of
acceptability, effectiveness, affordability, compliance, cost-effectiveness and sustainability as compared to more
conventional approaches.
• Policy options. The selection of optimal policy options depends on the complicated relations between water
supply & sanitation, socio-economic factors, cultural factors and health risks and disease occurrence. A thorough
understanding of costs versus benefits is crucial in the process of policy development and planning. This quick
scan has shown that costs in the range of 200 - 2000 US$ per DALY saved will incur, considering conventional
approaches for WSS. Incremental cost-effective and innovative approaches lead to higher efficiency, by
increasing health gains and reducing costs, at similar levels of efficiency i.e. 500-600 US$ per DALY saved.

QUICK SCAN WATER, SANITATION & HEALTH PAGE 7 OF 47
PAGE 8 OF 47 QUICK SCAN WATER, SANITATION
Preface
The objective of this report is to outline the development issues in the interaction of water & sanitation and population
health in general, and to summarise possible solutions to reduce the water-related burden of disease. This health impact
study also describes the financial investments needed to reach full coverage of deprived populations as stated in the
Millennium Development Goals. Subsequently it describes the essence of a health economic approach to water and
sanitation intervention. Three case profiles are described, each with a specific water and sanitation profile. For each of
these profiles specific conventional solutions and related health benefits and costs are reported. These will show that
conventional approaches, although proven effective in the industrialised countries, are too costly for developing
regions. Hence, these interventions are not realistic and cost-effective options, given the tremendous scarcity of
resources in many of the very poor developing countries. Considering the financial constraints the Millennium
Development Goals cannot be reached within the given time framework for the populations involved. The report
identifies promising options in the implementation of water and sanitation interventions to enhance health and
recommends the next steps in the integrated assessment of health benefits and costs of water and sanitation
interventions.
Besides health impacts, a poor water, sanitation and hygiene situation also has strong impacts on water resources, the
environment, and economic activities such as fisheries and tourism. This report will not deal with the environmental
and economic impacts but will focus on the public health benefits to be obtained from water and sanitation
interventions.
This report intends to clarify the link between health benefits and the cost of water and sanitation interventions from a
health, technological and financial point of view. As this draws professionals from rather diverse backgrounds, the
authors have chosen to provide an extensive background to the related topics.

QUICK SCAN WATER, SANITATION & HEALTH PAGE 9 OF 47
PAGE 10 OF 47 QUICK SCAN WATER, SANITATION
1 Water & Sanitation and the Millennium Development Goals
The current coverage for water supply and sanitation services is estimated at around 82% and 60%, respectively.
Although remarkable progress could be noticed in the last decades, the targets that have been set at the World Summit
on Sustainable Development in Johannesburg can be marked as ambitious. In order to achieve these targets, the water
and sanitation sector is faced with enormous challenges and limited resources. In this chapter, the context of water
supply and sanitation issues are described and related to health outcomes.
1.1 International Policy & the Millennium Development Goals
The last decades, water has become intrinsically related to sustainable development issues. The importance of
sustainable use and provision of water was endorsed by Agenda21 in Rio, 1991. More recently the World Summit on
Sustainable Development (WSSD) in Johannesburg in September 2001, identified a series of priority goals with
concrete targets as formulated in the Millennium Development Goals (MDG). By identifying eight ambitious goals, the
sustainable development policy targets for the coming 15 years were set out. These goals are:
1. Eradicate extreme poverty and hunger;
2. Achieve universal primary education;
3. Promote gender equality and empower women;
4. Reduce child mortality;
5. Improve maternal health;
6. Combat HIV/AIDS, malaria and other diseases;
7. Ensure environmental sustainability;
8. Develop a global partnership for development.
The strength of this list is the broad support it enjoys, with 191 nations adopting the Millennium Declaration.
Sanitation and water aspects are included in Goal 7 ‘ensure environmental sustainability’, target number 10. The
targets for this goal are a/o:
• Halve by 2015 the proportion of people without sustainable access to safe drinking water, both rural and urban.
• Have achieved by 2020 a significant improvement in the lives of at least 100 million slum dwellers. Expressed in
the proportion of urban population with access to improved sanitation and the proportion of households with
access to secure tenure.
In a way the above target 10 is not fully coherent with Goal 7, because:
a) An immediate consequence of any success on the water supply front will mean that the volume of sewage
produced will proportionally increase. Today sewage already presents the main point source water pollutant
on a global scale. Achieving target 10 will exacerbate the quality of water resources world wide due to
increased effluent discharge. Therefore, in itself, this target is not in line with the principle objective under
which it is defined (environmental sustainability).
b) A 50% reduction of the number of people without appropriate sanitation may have very positive
consequences for the public health situation of these people, but it does not immediately provide benefits for
the environment as such. In fact, considering that probably a substantial part of the (appropriate) sanitation
solutions will involve flush toilets and sewer connections, without proper treatment, the water quality
situation of both surface and groundwater resources may further deteriorate.
QUICK SCAN WATER, SANITATION & HEALTH PAGE 11 OF 47
In conclusion, true environmental sustainability can only be achieved if the mentioned targets are accompanied by a
specific programme, which considers (the increased volumes of) wastewater to be managed appropriately. Wastewater
needs to be addressed as besides health impacts there are also strong impacts on water resources and the environment,
and on economic activities such as fisheries and tourism. The lack of safe water supply and sanitation has much wider
impacts then on health only. The economic impact due to, for example, loss of tourism and export can be dramatic as is
illustrated in Box 1, which describes the case of the cholera outbreak in Peru in 1991. At the WSSD, water and
sanitation were recognized as being inextricably interlinked with poverty. Water and sanitation, and Health were
identified by the Secretary General as two of the five so-called WEHAB themes (Water-Energy-Health-Agriculture-
Biodiversity). This paper does not focus on relations between biodiversity, energy and agriculture but the relationship
Water - Sanitation - Health forms the central focus point for this study by analyzing the public health benefits obtained
from water and sanitation interventions.
1.2 Coverage of Water Supply and Sanitation
Over the past decades, the water supply and sanitation sector has been both an example of remarkable progress and a
source of continued frustration. Progress, in the sense that over the past 20 years an additional 2.4 billion people have
gained access to water and 600 million more people obtained access to sanitation services. There is, however,
continued frustration, because some 1.1 billion people still do not have access to safe water and 2.4 billion lack access
to improved sanitation services (see Box 2 for definition of improved sanitation). The existing frustration is worsened
by the fact that much of the gains in service coverage have been offset by population growth and rapid urbanisation. In
2000, 47% of the world’s population were urban dwellers, as opposed to 43.5% in 1990 (WHO/UNICEF, 2000). The
majority of these people live in Asia and Africa (Figure 1), but also within countries services are distributed unevenly,
with service provisions in rural areas generally lacking far behind those in urban areas (WHO, 2000).
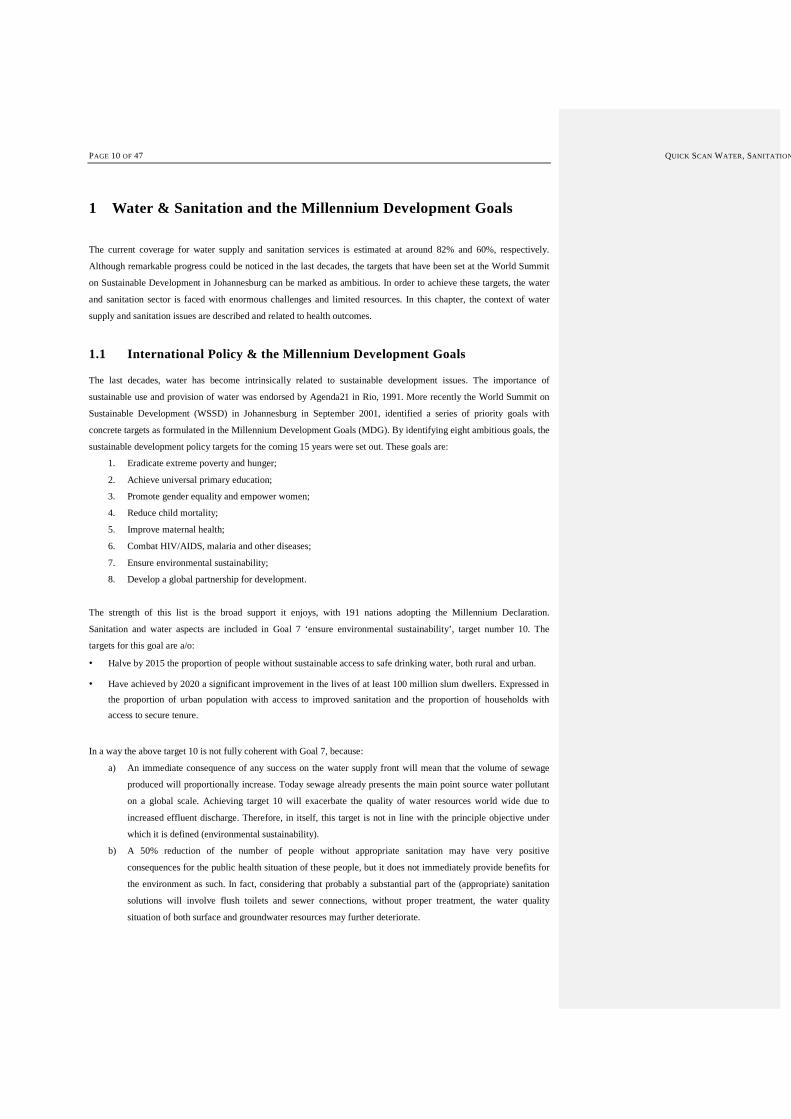
Box 1 Cholera outbreak Peru 1991.
Early 1991 a number of cases of Cholera were reported in coastal areas of Peru. Within a few weeks the disease spread throughout Peru and subsequently into numerous countries in the region. The appearance of Cholera along the Peruvian coast in 1991 represented the first time in the 20th century that epidemic Cholera was identified in South America. The suspected origin of the 1991-1992 cholera epidemic was from the bilge water of a Chinese freighter in Lima, Peru. From there the following statistics were recorded:
�• First cases reported near fish processing plant in the harbour of Lima �• 12,000 cases reported in Peru within 2 weeks �• Rate of new cases reported increased to 2500 per day within 12 weeks �• Cholera extended to all neighbouring countries within 6 months �• Later also spread to Central America The public health and economic impacts of the cholera epidemic were dramatic:
�• 506,000 cholera cases reported (942,000 in Latin America) �• 2900 deaths (8622 in Latin America) �• US$ 1 billion lost in (fish and shrimp) exports and tourism This represents about 3 times the investment in water supply and sanitation infrastructure in Peru during the previous 10 years.
Formatted: Bullets and Numbering
Formatted: Bullets and Numbering
Formatted: Bullets and Numbering
PAGE 12 OF 47 QUICK SCAN WATER, SANITATION
Total unserved: 1.1 billion
63%
7%
2%
28%
Asia
Africa
LA&Car.
Europe
Total unserved: 2.4 billion
80%
13%
5%
2%
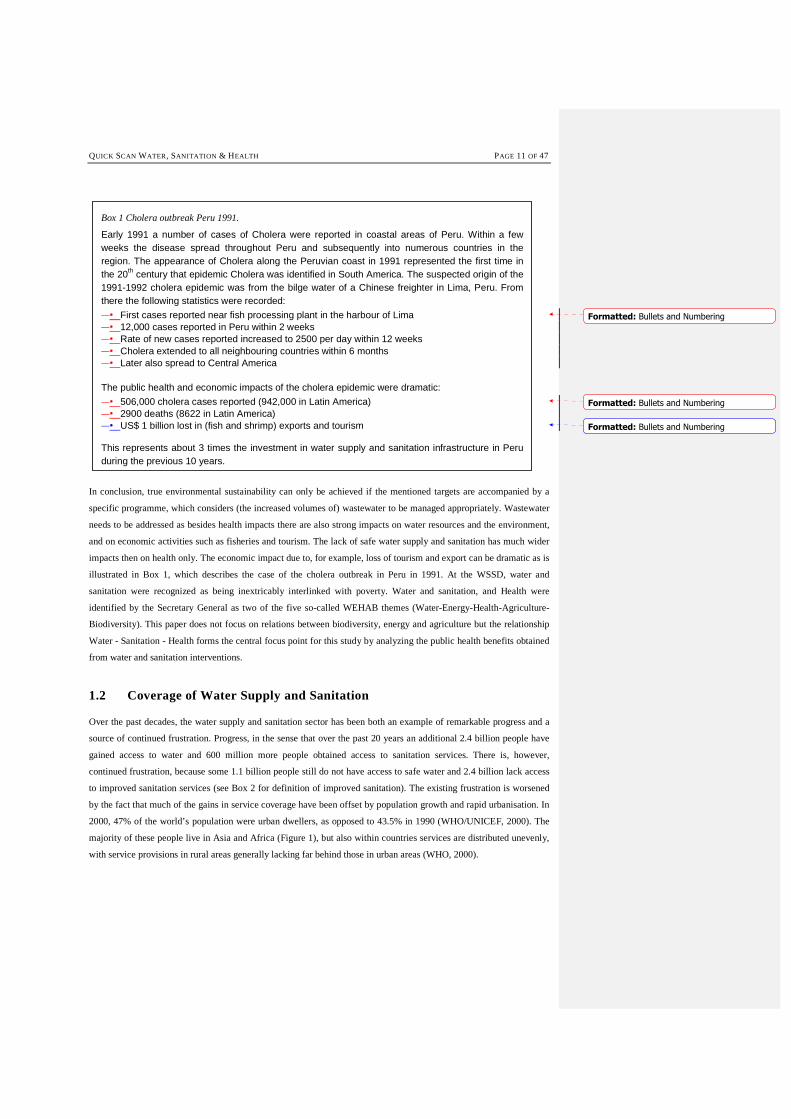
Figure 1 Distribution of the global population not served with improved water supply (left) and improved sanitation
(right).
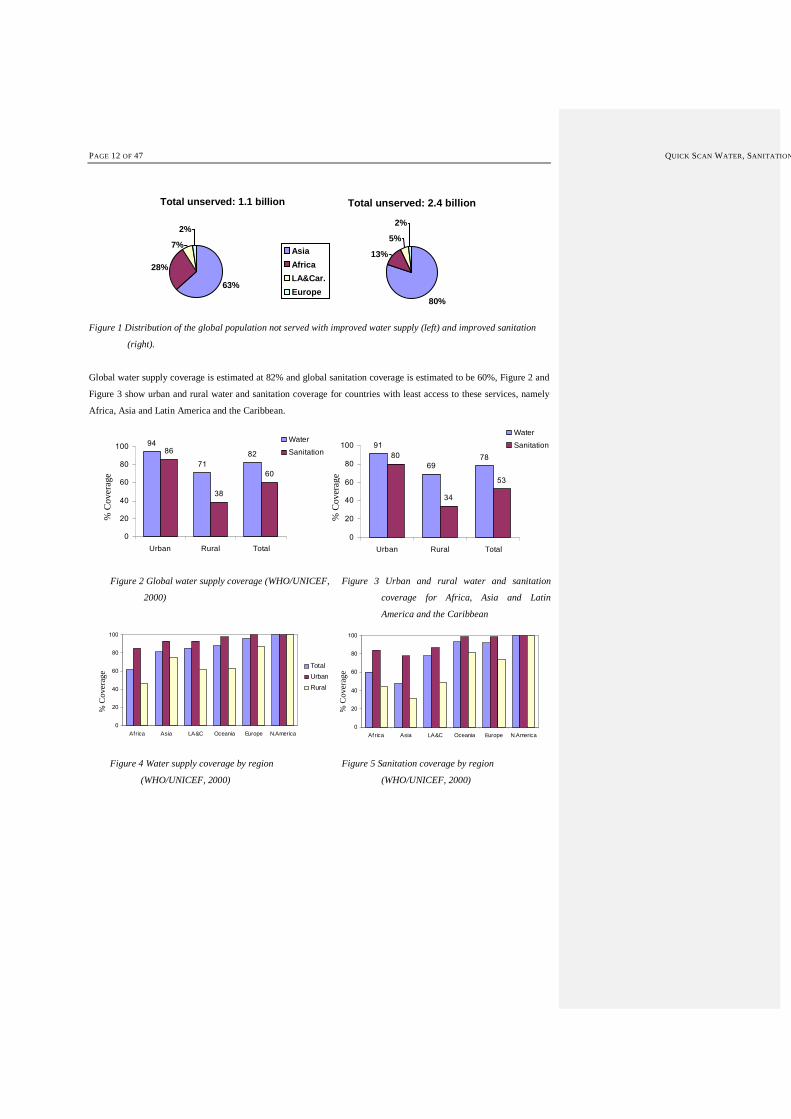
Global water supply coverage is estimated at 82% and global sanitation coverage is estimated to be 60%, Figure 2 and
Figure 3 show urban and rural water and sanitation coverage for countries with least access to these services, namely
Africa, Asia and Latin America and the Caribbean.
94
71
8286
38
60
0
20
40
60
80
100
Urban Rural Total
Water
Sanitation91
69
7880
34
53
0
20
40
60
80
100
Urban Rural Total
Water
Sanitation
% C
ove
rage
% C
over
age
Figure 2 Global water supply coverage (WHO/UNICEF,
2000)
Figure 3 Urban and rural water and sanitation
coverage for Africa, Asia and Latin
America and the Caribbean
0
20
40
60
80
100
Africa Asia LA&C Oceania Europe N.America
Total
Urban
Rural
0
20
40
60
80
100
Africa Asia LA&C Oceania Europe N.America
% C
ove
rag
e
% C
ove
rag
e
Figure 4 Water supply coverage by region
(WHO/UNICEF, 2000)
Figure 5 Sanitation coverage by region
(WHO/UNICEF, 2000)
QUICK SCAN WATER, SANITATION & HEALTH PAGE 13 OF 47
Africa Asia LA&C Total
Household connection Other Access No Access
Africa Asia LA&C Total
Sewerage Connection Other Access No Access
Cov
erag
e %
Cov
erag
e %
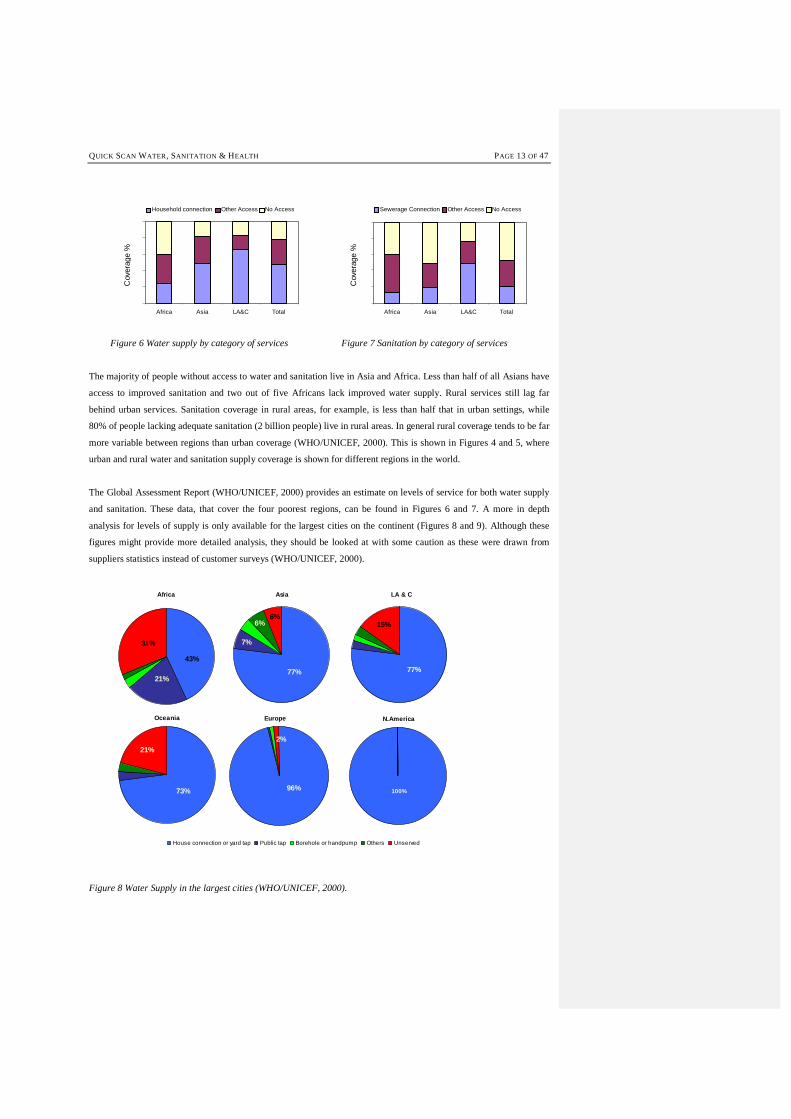
Figure 6 Water supply by category of services Figure 7 Sanitation by category of services
The majority of people without access to water and sanitation live in Asia and Africa. Less than half of all Asians have
access to improved sanitation and two out of five Africans lack improved water supply. Rural services still lag far
behind urban services. Sanitation coverage in rural areas, for example, is less than half that in urban settings, while
80% of people lacking adequate sanitation (2 billion people) live in rural areas. In general rural coverage tends to be far
more variable between regions than urban coverage (WHO/UNICEF, 2000). This is shown in Figures 4 and 5, where
urban and rural water and sanitation supply coverage is shown for different regions in the world.
The Global Assessment Report (WHO/UNICEF, 2000) provides an estimate on levels of service for both water supply
and sanitation. These data, that cover the four poorest regions, can be found in Figures 6 and 7. A more in depth
analysis for levels of supply is only available for the largest cities on the continent (Figures 8 and 9). Although these
figures might provide more detailed analysis, they should be looked at with some caution as these were drawn from
suppliers statistics instead of customer surveys (WHO/UNICEF, 2000).
Asia
77%
6%6%
7%
Africa
31%
43%
21%
LA & C
15%
77%
Oceania
21%
73%
Europe
96%
2%
House connection or yard tap Public tap Borehole or handpump Others Unserved
N.America
100%
Figure 8 Water Supply in the largest cities (WHO/UNICEF, 2000).
PAGE 14 OF 47 QUICK SCAN WATER, SANITATION
Africa
29%
19% 18%
Asia
28%
18%
46%
4%
LA&C
20%
34%
25%
Oceania
45%
10%
15%17%
Europe
92%
7%
Sewer Small bore Septic tank Pour-flush VIP latrine Simple Pit Other Unserved
N. America
96%
4%
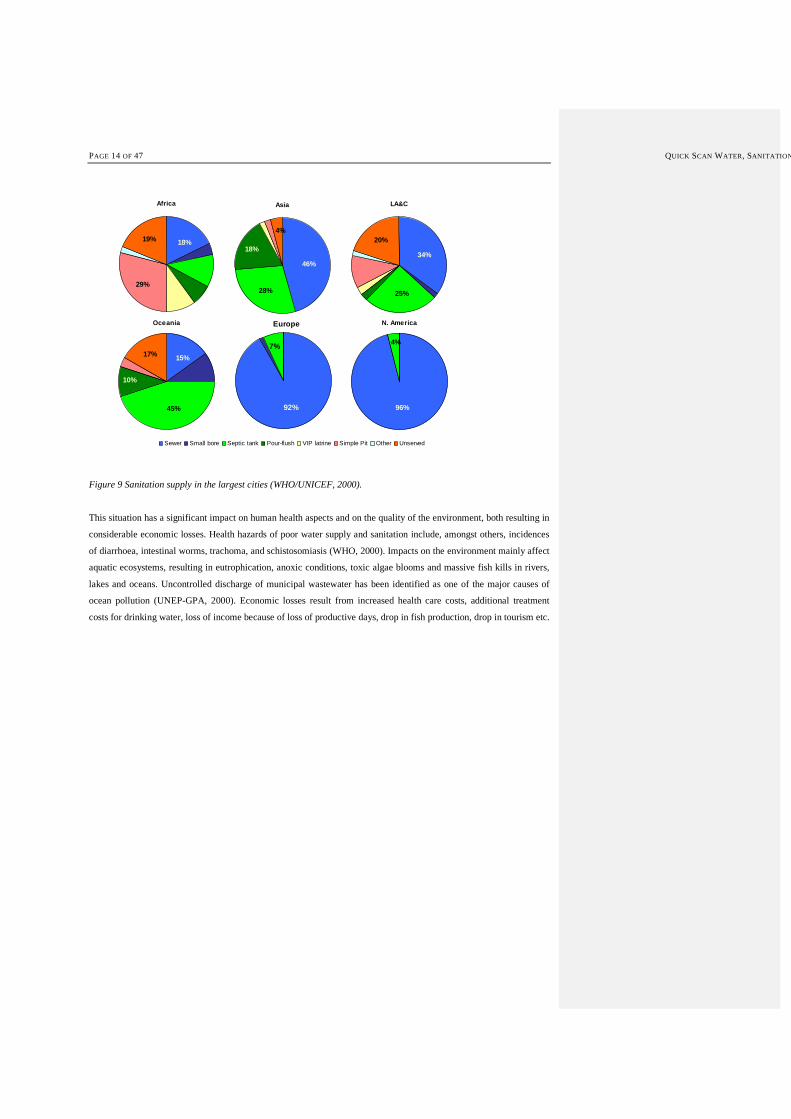
Figure 9 Sanitation supply in the largest cities (WHO/UNICEF, 2000).
This situation has a significant impact on human health aspects and on the quality of the environment, both resulting in
considerable economic losses. Health hazards of poor water supply and sanitation include, amongst others, incidences
of diarrhoea, intestinal worms, trachoma, and schistosomiasis (WHO, 2000). Impacts on the environment mainly affect
aquatic ecosystems, resulting in eutrophication, anoxic conditions, toxic algae blooms and massive fish kills in rivers,
lakes and oceans. Uncontrolled discharge of municipal wastewater has been identified as one of the major causes of
ocean pollution (UNEP-GPA, 2000). Economic losses result from increased health care costs, additional treatment
costs for drinking water, loss of income because of loss of productive days, drop in fish production, drop in tourism etc.
QUICK SCAN WATER, SANITATION & HEALTH PAGE 15 OF 47
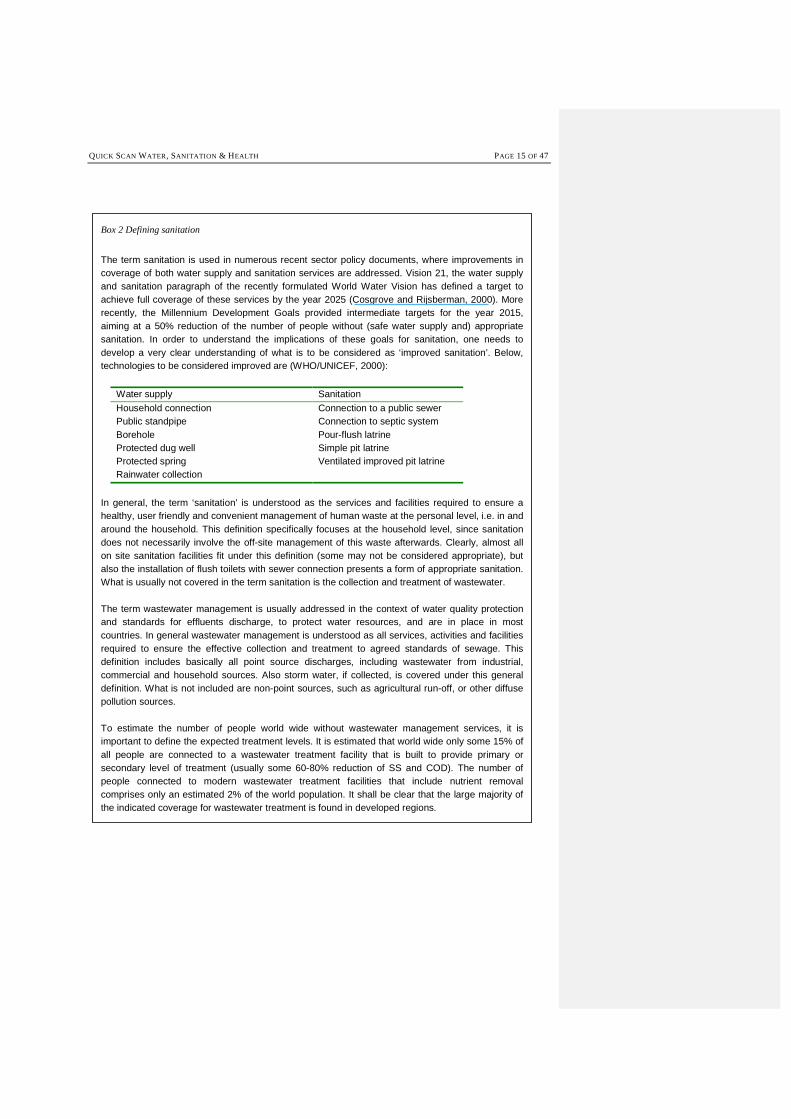
Box 2 Defining sanitation
The term sanitation is used in numerous recent sector policy documents, where improvements in coverage of both water supply and sanitation services are addressed. Vision 21, the water supply and sanitation paragraph of the recently formulated World Water Vision has defined a target to achieve full coverage of these services by the year 2025 (Cosgrove and Rijsberman, 2000). More recently, the Millennium Development Goals provided intermediate targets for the year 2015, aiming at a 50% reduction of the number of people without (safe water supply and) appropriate sanitation. In order to understand the implications of these goals for sanitation, one needs to develop a very clear understanding of what is to be considered as ‘improved sanitation’. Below, technologies to be considered improved are (WHO/UNICEF, 2000):
Water supply Sanitation
Household connection Public standpipe Borehole Protected dug well Protected spring Rainwater collection
Connection to a public sewer Connection to septic system Pour-flush latrine Simple pit latrine Ventilated improved pit latrine
In general, the term ‘sanitation’ is understood as the services and facilities required to ensure a healthy, user friendly and convenient management of human waste at the personal level, i.e. in and around the household. This definition specifically focuses at the household level, since sanitation does not necessarily involve the off-site management of this waste afterwards. Clearly, almost all on site sanitation facilities fit under this definition (some may not be considered appropriate), but also the installation of flush toilets with sewer connection presents a form of appropriate sanitation. What is usually not covered in the term sanitation is the collection and treatment of wastewater. The term wastewater management is usually addressed in the context of water quality protection and standards for effluents discharge, to protect water resources, and are in place in most countries. In general wastewater management is understood as all services, activities and facilities required to ensure the effective collection and treatment to agreed standards of sewage. This definition includes basically all point source discharges, including wastewater from industrial, commercial and household sources. Also storm water, if collected, is covered under this general definition. What is not included are non-point sources, such as agricultural run-off, or other diffuse pollution sources. To estimate the number of people world wide without wastewater management services, it is important to define the expected treatment levels. It is estimated that world wide only some 15% of all people are connected to a wastewater treatment facility that is built to provide primary or secondary level of treatment (usually some 60-80% reduction of SS and COD). The number of people connected to modern wastewater treatment facilities that include nutrient removal comprises only an estimated 2% of the world population. It shall be clear that the large majority of the indicated coverage for wastewater treatment is found in developed regions.
PAGE 16 OF 47 QUICK SCAN WATER, SANITATION
1.32 Water and Health
Chapter 1 has outlined the Millennium Development Goals in relation to water supply and sanitation. It has reported
the present status of water supply and sanitation in the world and the present contribution of unsafe water and
sanitation to the burden of disease. This chapter will describe the relationship with the occurrence of diseases in
relation to health determinants. In all public health analysis, water and sanitation are seen as important determinants of
population health. This section explains the concepts and outlines the main determinants of health and how one can
deal with the notion of multiple determinants of health, especially in the context of developing countries.
2.1 Population Health
There are various ways of expressing population health, depending on the intended use (Murray et al., 2002). These
health measures range roughly from more static measures for monitoring the health status of a population or comparing
different (sub) populations to providing more insights into underlying dynamics and causes of death. The most
commonly used measure of the mortality levels is life expectancy. The life expectancy reflects the mean number of
years a newborn may expect to live if current levels of mortality prevail. Not only mortality is important to indicate
population health, the disease burden should also be taken into account in indicating population health.
The disease burden attributed to a specific health determinant is calculated as life years lost due to mortality and due to
morbidity, expressed in severity weighed years i.e. disability-adjusted life years lost (DALYs) or disability-adjusted
life expectancy (DALE, see Box 3 for definitions). Additional outcomes can be calculated by attributing an economic
impact to a specific disease burden, like direct and indirect costs of illness (Drummond, 1986; Gold, 1987). The disease
burden may influence the availability of health resources needed for other health problems or the occurrence of other
diseases. The population health framework simulates the number of persons suffering from diseases and the number of
deaths related to these diseases. It accounts for the competition and substitution of health risks and health resources.
The framework is the basis for integrated health modelling approaches used in various settings. (UNEP, 1997;
Hilderink, 1999; Niessen, 2002; Murray, 2003)
Box 3 Disability-adjusted Life Years (DALY) or disability-adjusted life expectancy (DALE).
To indicate population health, life expectancy is most commonly known and understood. It can be calculated for all ages. The combination of the age at which death occurs, and a given life expectancy a person has at age of death, result in the number of potential years of life lost (YLL). The summation of YLLs over all annual deaths in a population results in the total number of years lost due to premature mortality. Recently, years of life lived with a disease (YLD) have also been quantified by multiplying the annual number of diseased persons with a disease severity weight (Worldbank, 1993). The result is disability-adjusted estimate of years lost due to disease. The latter estimate, hence, is a function of disease incidence, prevalence, duration of a disease episode, and disease severity. The sum of the YLL and YLD results in Disability-Adjusted Life Years (DALYs) (Murray and Lopez, 1994) and disability-adjusted life expectancy (UNEP, 1997; Niessen, 2002). These measures express a summary measure of total burden of disease from both death and disease. Other weights can be applied to years lost such as discounts for years in the future, giving preference to years lived in the present, an age weight for the age at which disease or death occurs, giving preference to those economically productive in the present etc.
Formatted: Bullets and Numbering
QUICK SCAN WATER, SANITATION & HEALTH PAGE 17 OF 47
Population health can be defined and described by the presence of a specific pattern of health determinants and also
distinguish slower and quicker roads to health, depending on the stage of socio-economic development, public services,
life style and health technology. This implies that the observed empirical pattern of population change and burden of
disease can be attributed to the levels and interactions of population and it’s health determinants. This approach is used
to assess populations on various geographical scales, for different time periods, and with different degrees of
differentiation of determinants, age groups, disease classes, and health services. It also implies that there is not a single
one way to promote health, like modern development but that there are many ways to improve health, as can be noted
in many low-income counties that nevertheless reach high levels of health, like Kerala, India.
The population macro-determinants of health represent those factors that influence the proximate health determinants.
The selection of determinant categories is based on the evidence regarding their supposed quantitative importance
throughout the health transition as reported in literature. They can be categorised in two groups: socio-economic
determinants and environmental determinants. The two main environmental determinants listed are 1) water supply &
sanitation and 2) food supply. Safe water and sanitation access is defined as the fraction of the population with proper
access to safe drinking water and having sanitation, that falls under the low socio-economic status categories. In case of
large discrepancies between the two parameters the safe drinking water coverage is usually chosen because this
determinant is most dominating of the two (Esrey et al., 1985, 1991).
Macro-level health determinants determine the specific health risks people are exposed to. These health risks or micro-
level health determinants partly exist in combination with macro-level determinants. These can be analysed accounting
for multiple health determinants, which can be related to the occurrence of specific diseases. Criteria for identifying
determinant types are 1) the availability of empirical evidence of a quantifiable relation with the occurrence of disease
in societies and 2) the availability of epidemiological data on disease and statistical demographic data on a population
basis. Selecting the relevant combinations of the health determinants results in a clustering of higher absolute risks of
one particular disease as well as higher risks of other relevant diseases especially among children and the aged.
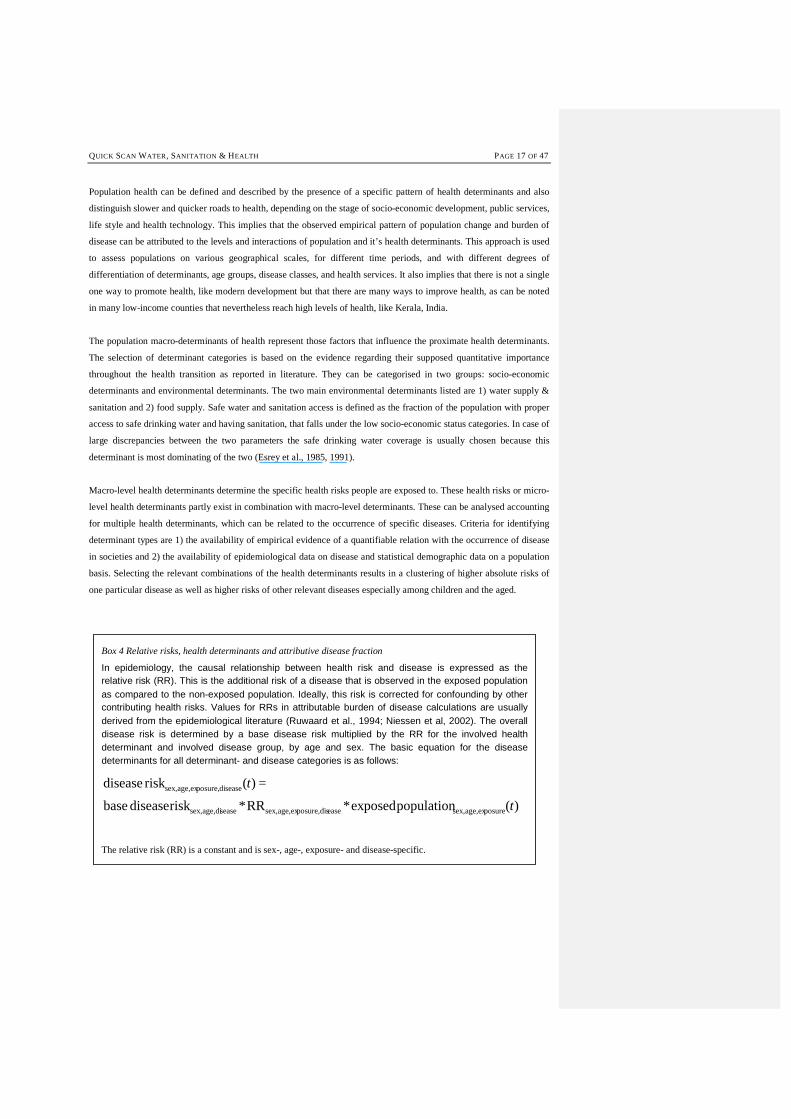
Box 4 Relative risks, health determinants and attributive disease fraction
In epidemiology, the causal relationship between health risk and disease is expressed as the relative risk (RR). This is the additional risk of a disease that is observed in the exposed population as compared to the non-exposed population. Ideally, this risk is corrected for confounding by other contributing health risks. Values for RRs in attributable burden of disease calculations are usually derived from the epidemiological literature (Ruwaard et al., 1994; Niessen et al, 2002). The overall disease risk is determined by a base disease risk multiplied by the RR for the involved health determinant and involved disease group, by age and sex. The basic equation for the disease determinants for all determinant- and disease categories is as follows:
)(populationexposed*RR*risk diseasebase
=)(riskdisease
posuresex,age,exeaseposure,dissex,age,exseasesex,age,di
disease posure,sex,age,ex
t
t
The relative risk (RR) is a constant and is sex-, age-, exposure- and disease-specific.
PAGE 18 OF 47 QUICK SCAN WATER, SANITATION
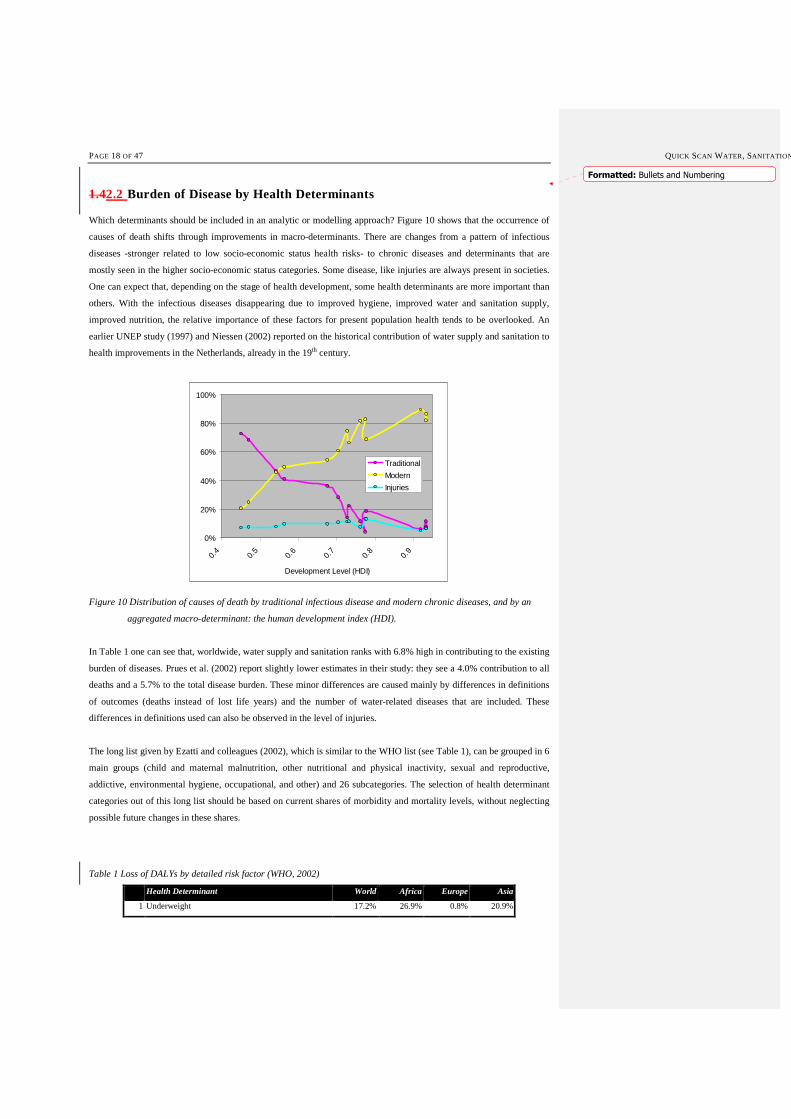
1.42.2 Burden of Disease by Health Determinants
Which determinants should be included in an analytic or modelling approach? Figure 10 shows that the occurrence of
causes of death shifts through improvements in macro-determinants. There are changes from a pattern of infectious
diseases -stronger related to low socio-economic status health risks- to chronic diseases and determinants that are
mostly seen in the higher socio-economic status categories. Some disease, like injuries are always present in societies.
One can expect that, depending on the stage of health development, some health determinants are more important than
others. With the infectious diseases disappearing due to improved hygiene, improved water and sanitation supply,
improved nutrition, the relative importance of these factors for present population health tends to be overlooked. An
earlier UNEP study (1997) and Niessen (2002) reported on the historical contribution of water supply and sanitation to
health improvements in the Netherlands, already in the 19th century.
0%
20%
40%
60%
80%
100%
0.4
0.5
0.6
0.7
0.8
0.9
Development Level (HDI)
Traditional
Modern
Injuries
Figure 10 Distribution of causes of death by traditional infectious disease and modern chronic diseases, and by an
aggregated macro-determinant: the human development index (HDI).
In Table 1 one can see that, worldwide, water supply and sanitation ranks with 6.8% high in contributing to the existing
burden of diseases. Prues et al. (2002) report slightly lower estimates in their study: they see a 4.0% contribution to all
deaths and a 5.7% to the total disease burden. These minor differences are caused mainly by differences in definitions
of outcomes (deaths instead of lost life years) and the number of water-related diseases that are included. These
differences in definitions used can also be observed in the level of injuries.
The long list given by Ezatti and colleagues (2002), which is similar to the WHO list (see Table 1), can be grouped in 6
main groups (child and maternal malnutrition, other nutritional and physical inactivity, sexual and reproductive,
addictive, environmental hygiene, occupational, and other) and 26 subcategories. The selection of health determinant
categories out of this long list should be based on current shares of morbidity and mortality levels, without neglecting
possible future changes in these shares.
Table 1 Loss of DALYs by detailed risk factor (WHO, 2002)
Health Determinant World Africa Europe Asia
1 Underweight 17.2% 26.9% 0.8% 20.9%
Formatted: Bullets and Numbering

QUICK SCAN WATER, SANITATION & HEALTH PAGE 19 OF 47
2 Unsafe sex 11.5% 28.9% 1.0% 6.8%
3 Blood pressure 8.0% 1.9% 18.9% 6.7%
4 Tobacco 7.4% 1.0% 18.2% 6.7%
5 Alcohol 7.3% 2.7% 14.9% 3.4%
6 Unsafe water, sanitation and hygiene 6.8% 8.0% 0.7% 8.8%
7 Cholesterol 5.0% 0.9% 12.9% 5.5%
8 Indoor smoke from solid fuels 4.8% 5.3% 0.5% 6.8%
9 Iron deficiency 4.4% 4.3% 1.0% 6.2%
10 Overweight 4.2% 0.6% 11.5% 1.8%
11 Zinc deficiency 3.5% 5.9% 0.1% 4.4%
12 Low fruit and vegetable intake 3.3% 0.6% 6.4% 3.9%
13 Vitamin A deficiency 3.3% 7.0% 0.0% 2.9%
14 Physical inactivity 2.4% 0.5% 5.2% 2.4%
15 Risk factors for injury 1.6% 0.7% 1.0% 2.0%
16 Lead exposure 1.6% 0.8% 1.2% 1.5%
17 Illicit drugs 1.4% 0.6% 2.3% 0.9%
18 Unsafe health care injections 1.3% 0.8% 0.2% 2.1%
19 Lack of contraception 1.1% 1.2% 0.1% 1.7%
20 Childhood sexual abuse 1.0% 0.2% 0.8% 1.6%
21 Urban air pollution 1.0% 0.2% 0.8% 0.8%
22 Climate change 0.7% 0.8% 0.0% 1.1%
23 Noise 0.5% 0.1% 0.5% 0.7%
24 Airborne particulates 0.4% 0.0% 0.4% 0.2%
25 Carcinogens 0.2% 0.0% 0.4% 0.1%
26 Ergonomic stressors 0.1% 0.0% 0.1% 0.1%
0%
10%
20%
30%
40%
50%
60%
70%
80%
90%
100%
Africa Asia LatinAmerica
WesternEurope
Other diet-related risks andphysical inactivity
Other selected risks tohealth
Sexual and reproductivehealth risks
Childhood and maternalundernutrition
Environmental risks
Addictive substances
Occupational risks
Figure 11 Loss of DALY by health determinant category, various world regions, 2000 (WHO, 2002).
Figure 11 shows that in the world regions, the environmental risks, including unsafe water supply and sanitation,
contribute a lot to ill-health. The contribution is about the same, in spite of differences in socio-economic development.
Also childhood and maternal undernutrition, other representatives of low SES-related health risks, cause a relatively
high loss of DALYs at lower levels of development Only at high levels of development, environmental risks and
undernutrition are almost completely eliminated. Focusing on only the environment, Figure 12 illustrates that for the all
regions, among the environmental risks, unsafe water supply and sanitation is the largest single health determinant.

PAGE 20 OF 47 QUICK SCAN WATER, SANITATION
World
Climate change(1.6%)
Lead exposure(4.8%)
Indoor smoke from solid fuels
(0.7%)
Unsafe w ater, sanitation and
hygiene(6.8%)
Non-Enviromental
Risk(85%)
Urban air pollution(1.0%)
Environmental Risk
Asia
Environmental Risk
Urban air pollution(0.3%)
Non-Enviromental
Risk(93%)
Unsafe w ater, sanitation and
hygiene(3.6%)
Indoor smoke from solid fuels
(1.9%)
Lead exposure(0.9%)
Climate change(0.4%)
Africa
Environmental Risk
Urban air pollution(0.2%)Non-
Enviromental Risk
(85%)
Unsafe w ater, sanitation and
hygiene(8.0%)
Indoor smoke from solid fuels
(5.3%)
Lead exposure(0.8%)
Climate change(0.8%)
Latin America
Environmental Risk
Urban air pollution(0.9%)
Non-Enviromental
Risk(87%)
Unsafe w ater, sanitation and
hygiene(4.9%)
Indoor smoke from solid fuels
(0.2%)
Lead exposure(1.9%)
Climate change(4.7%)
Figure 12 Contribution of environmental health determinants to disease burden (WHO, 2002).
2.22.3 Water-related Diseases
Every year millions of people in developing countries, most of them children, die from diseases associated with lack of
access to safe drinking water, inadequate sanitation, and poor hygiene (see Table 3). Some 6,000 children die every day
from diseases associated with lack of access to safe drinking water, inadequate sanitation and poor hygiene (WSSCC,
2003). The links between water, sanitation, and health are extensive. This results in a large number of diseases relating
to the lack of access to safe drinking water, inadequate sanitation and poor hygiene. The largest single contribution to
this burden of diseases is infectious diarrhoea (WHO, 2002). Diseases related to water, sanitation and poor hygiene can
be classified in several ways, e.g. causative agent (pathogenic or chemical); the way in which the agent enters the body
(skin, mouth, nose or mucous membranes); symptoms of diseases, etc. The transmission routes of diseases can be
classified as follows (see Table 2). An additional important transmission route of diseases relating to lack of access to
safe drinking water, inadequate sanitation and poor hygiene, which is not portrayed in Table 3, can be caused by poor
personal, domestic, or agricultural hygiene. Although water borne diseases may be spread through water supplies, the
majority of infectious disease is spread in other ways. This includes person-to-person transmission of faecal-oral
pathogens (for example by hands, clothes, utensils), food-borne transmission of faecal oral pathogens, or the use of
contaminated water for irrigation or cleaning. In most developing countries the cases and deaths attributing to the
infectious faecal-oral diseases far outnumber those that are non-infectious, excluding malnutrition (WHO/UNICEF,
2000). This is shown in Table 3, which provides a brief overview on the number of people affected by diseases related
to water, sanitation and hygiene.
Table 2 Classification of diseases (based on Ince, 1999 and Pruss et al., 2002).
Classification Transmissions Diseases
Water-borne Through intake of water, and to some extend bathing. -Faecal oral diseases such as cholera, typhoid,
Formatted: Bullets and Numbering
Formatted: Bullets and Numbering
QUICK SCAN WATER, SANITATION & HEALTH PAGE 21 OF 47
Present in water and spread through water (water
quality)
etc.
-Toxic chemical diseases such as fluorosis,
aresincosis, etc
Water-washed Caused by lack of water (water quantity) and linked to
inadequate hygiene
Scabies, trachoma, athletes foot
Water-based Through contact with water via aquatic invertebrate
intermediate hosts
Schistosomiasis, guinea worm infection
Water-related
insect vector
To certain extend transmission through vectors
proliferating in water reservoirs, other stagnant water,
and through certain agricultural practices.
Malaria, dengue, lymphatic filariasis
Soil-based Through skin, disease organism present in soil Hookworm infection
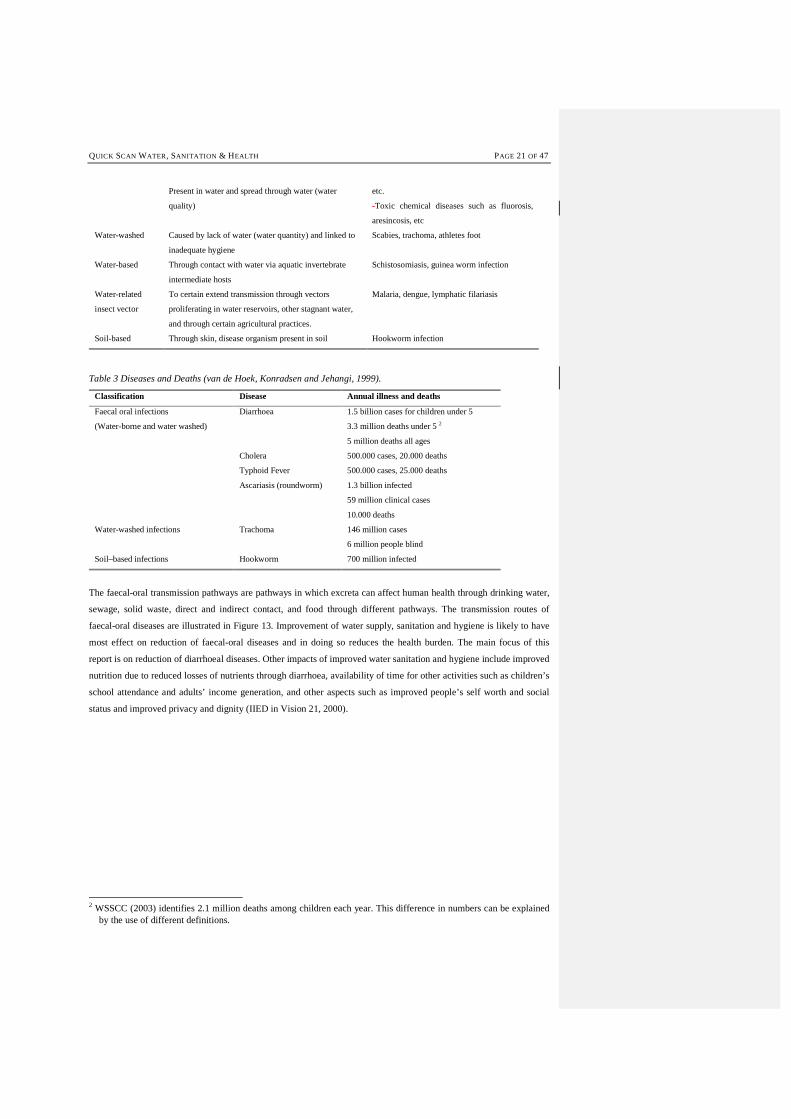
Table 3 Diseases and Deaths (van de Hoek, Konradsen and Jehangi, 1999).
Classification Disease Annual illness and deaths
Faecal oral infections
(Water-borne and water washed)
Diarrhoea 1.5 billion cases for children under 5
3.3 million deaths under 5 2
5 million deaths all ages
Cholera 500.000 cases, 20.000 deaths
Typhoid Fever 500.000 cases, 25.000 deaths
Ascariasis (roundworm) 1.3 billion infected
59 million clinical cases
10.000 deaths
Water-washed infections Trachoma 146 million cases
6 million people blind
Soil–based infections Hookworm 700 million infected
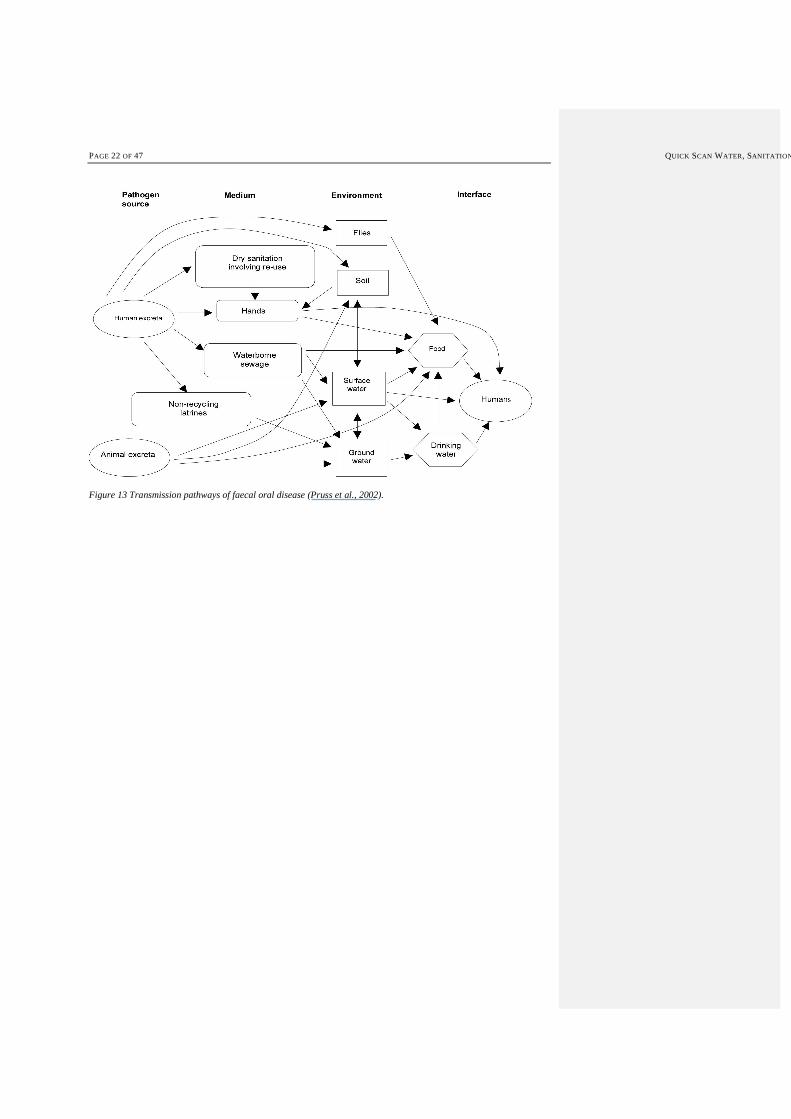
The faecal-oral transmission pathways are pathways in which excreta can affect human health through drinking water,
sewage, solid waste, direct and indirect contact, and food through different pathways. The transmission routes of
faecal-oral diseases are illustrated in Figure 13. Improvement of water supply, sanitation and hygiene is likely to have
most effect on reduction of faecal-oral diseases and in doing so reduces the health burden. The main focus of this
report is on reduction of diarrhoeal diseases. Other impacts of improved water sanitation and hygiene include improved
nutrition due to reduced losses of nutrients through diarrhoea, availability of time for other activities such as children’s
school attendance and adults’ income generation, and other aspects such as improved people’s self worth and social
status and improved privacy and dignity (IIED in Vision 21, 2000).
2 WSSCC (2003) identifies 2.1 million deaths among children each year. This difference in numbers can be explained
by the use of different definitions.
PAGE 22 OF 47 QUICK SCAN WATER, SANITATION
Figure 13 Transmission pathways of faecal oral disease (Pruss et al., 2002).
QUICK SCAN WATER, SANITATION & HEALTH PAGE 23 OF 47
3 Water Supply and Sanitation Systems
Water supply, hygiene and treatment of wastewater cannot be dealt with in isolation. Increasing access to safe water
may result in increased production of wastewater. Unless alternatives (e.g. dry sanitation) are considered, this
wastewater will be diluted and therefore difficult to treat in a cost-effective way. Without simultaneously taking care of
proper wastewater treatment, environmental and health impacts will continue to exist. These impacts can be on-site,
e.g. when pit latrines pollute local wells, as well as off-site, when wastewater is transported by a sewerage system into
a nearby river. Thus, untreated sewage will continue to pollute valuable water resources. This vicious cycle will push
up the costs for the treatment and production of drinking water. On the other hand, the availability of clean water can
significantly improve hygienic behaviour as washing hands with soap and water can reduce diarrhoeal disease
transmission by one third (WHO/UNICEF, 2000). This chapter assesses the needed investments in the water and
sanitation sector in order to meet the millennium development goals and it offers a promising alternative to improve
access to safe drinking water and to adequate provision of sanitation in a more cost effective way.
3.1 Conventional Approaches
The standard ‘Western’ service level of water supply comprises high quality piped water with multiple connections per
household. This concept results in high water consumption and produces large volumes of rather dilute wastewater that
needs to be collected via an extensive sewer system and is finally treated in modern centralised treatment works. The
major features of water infrastructure in the industrialised world are listed in Table 4. The trend in the industrialised
world is towards further development and improvement of these conventional systems. This requires highly skilled
labour, large amounts of capital and steady socio-economic conditions concerning finance and chemical supplies, etc.
Despite the evident success, this concept needs to be reconsidered from a sustainability point of view. Although this
conventional approach is the standard in the industrialised countries, its application as standard solution for developing
countries seems not to be feasible. This is especially true for the collection and treatment of wastewater. There is at
present hardly any infrastructure for the effective treatment of sewage in developing countries. Municipal sewerage and
the extent of domestic and industrial wastewater treatment are inadequate in most urban situations. When there is a
municipal sewerage network in place, the coverage is usually incomplete and the treatment level is insufficient. In
Latin America, for example, only 14% of collected sewage receives treatment (WHO/UNICEF, 2000). Even when
treatment facilities exist, poor maintenance and operation often results in failing treatment processes, causing pollution
of the effluent receiving surface waters. In Mexico, more than 90% of the wastewater treatment plants are non-
functional (World Bank, 1991).
Table 4 Major features and disadvantages of water and sanitation infrastructure in the industrialised world. After van
Lier and Lettinga (1999) and Varis and Somlyody (1997).

PAGE 24 OF 47 QUICK SCAN WATER, SANITATION
Water supply High coverage required, safety is a major concern; part of living standard; willingness to pay;
inherited systems from past decades: no separation (high quality water is used for all the
purposes); limited flexibility: infrastructure is given, a change would need 15-20 years
(reconstruction period)
Sewerage The concept originates from 19th century; public health and waterborne/transmitted diseases
original driving force; long planning horizon and life time – difficult planning due to uncertainties
in future flow estimates; very expensive, investment and money driven; functions: transport of
pollutants (liquids), originally domestic wastewater, industrial ones at a later stage, storm water;
linkage to road construction; requirement of relatively high tap water consumption to prevent
sewer clogging resulting in large volumes of contaminated water; high dependency on supply of
power for pumping stations
Treatment Central plants dominate; mostly activated sludge and its advanced versions; increasing
sophistication (operation); sludge management; high dependency on supply of power and
chemicals, and on skilled O & M and management staff
The cost of conventional wastewater infrastructure is prohibitive for the majority of the developing countries.
According to the World Bank, up to 3% of a country’s GNP can be realistically spent on environmental protection
(including wastewater treatment). Grau (1994) and Gijzen and Ikramullah (1999) estimated the time needed to meet the
European effluent standards for low and middle income countries, assuming that 1.5% of the GNP could be invested in
sewers and treatment facilities (Table 5). The table shows that this period exceeds by far the economic lifetime of the
treatment plant (20–30 years) and in many cases even that of sewers (50-60 years). The implementation of
conventional wastewater collection and treatment in developing countries to reach EU standards is therefore
unrealistic, except maybe in densely populated urban centres where the average income is much higher.
Table 5 Time needed to meet EU effluent standards at 1.5% of the GNP (Gijzen and Ikramullah, 1999).
Country Population
(Million)
GNP pc
(US $)
Cost to meet EU standards
(US $ pc)
Time needed
at 1.5% GNP y-1 (years)
Bulgaria 8.5 2210 3755 113
Egypt 60 1030 4000 259
India 935 335 3750 746
Kenya 29.2 290 4500 1034
Mexico 92.1 2705 3750 92
Poland 38.3 1700 1230 48
Romania 23.2 1640 1422 58
2.43.2 Promising Alternative Water and Sanitation Approaches
The cost of conventional water supply, sanitation and wastewater management services is prohibitive for low-income
regions. Especially the cost of full waste-water management is phenomenal and will be beyond the reach of most
developing regions. Globally these conventional approaches strain our vulnerable and finite water resources. Therefore
feasible, effective and cheaper alternatives can be and have been developed to improve equitable access to safe
drinking water and to adequate provision of sanitation. An example of an alternative approach is described in this
chapter.
Formatted: Bullets and Numbering
QUICK SCAN WATER, SANITATION & HEALTH PAGE 25 OF 47
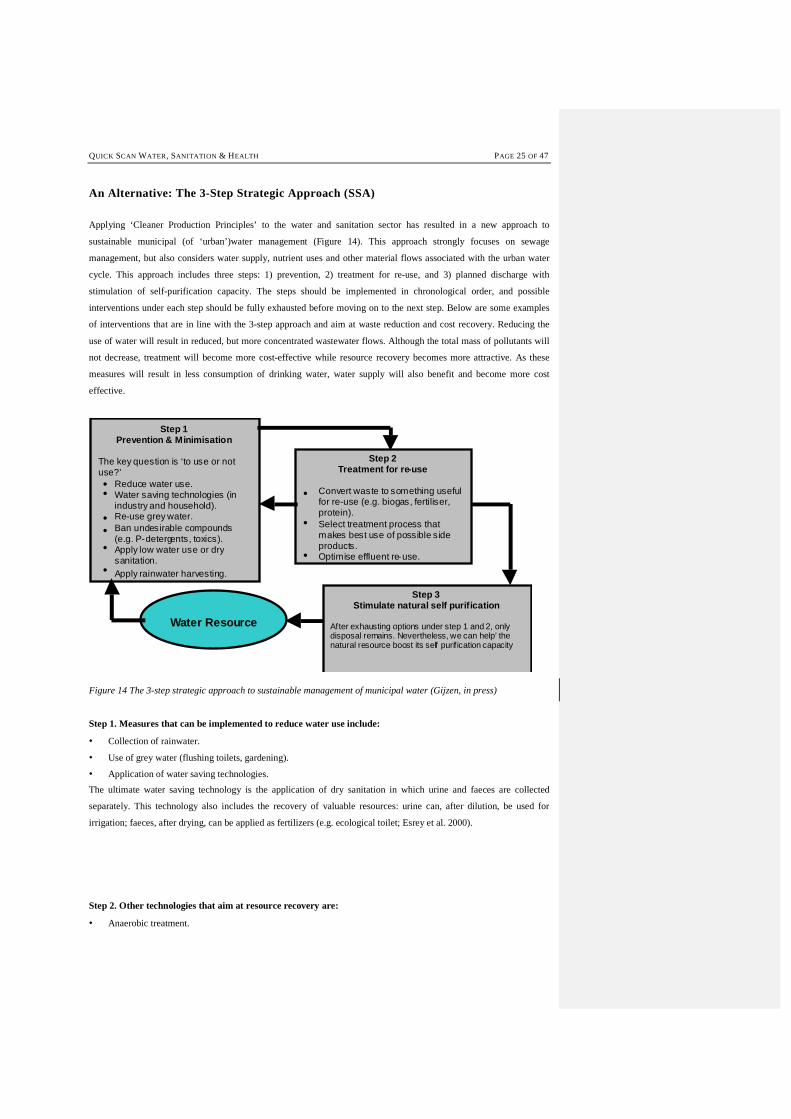
An Alternative: The 3-Step Strategic Approach (SSA)
Applying ‘Cleaner Production Principles’ to the water and sanitation sector has resulted in a new approach to
sustainable municipal (of ‘urban’)water management (Figure 14). This approach strongly focuses on sewage
management, but also considers water supply, nutrient uses and other material flows associated with the urban water
cycle. This approach includes three steps: 1) prevention, 2) treatment for re-use, and 3) planned discharge with
stimulation of self-purification capacity. The steps should be implemented in chronological order, and possible
interventions under each step should be fully exhausted before moving on to the next step. Below are some examples
of interventions that are in line with the 3-step approach and aim at waste reduction and cost recovery. Reducing the
use of water will result in reduced, but more concentrated wastewater flows. Although the total mass of pollutants will
not decrease, treatment will become more cost-effective while resource recovery becomes more attractive. As these
measures will result in less consumption of drinking water, water supply will also benefit and become more cost
effective.
Step 1Prevention & Minimisation
The key question is ‘to use or notuse?’
Reduce water use.Water saving technologies (inindustry and household).Re-use grey water.Ban undesirable compounds(e.g. P-detergents, toxics).Apply low water use or drysanitation.Apply rainwater harvesting.
Step 2Treatment for re-use
Convert waste to something usefulfor re-use (e.g. biogas, fertiliser,protein).Select treatment process thatmakes best use of possible sideproducts.
•
Optimise effluent re-use.
Step 3Stimulate natural self purification
After exhausting options under step 1 and 2, onlydisposal remains. Nevertheless, we can help’ thenatural resource boost its self purif ication capacity
Water Resource
•
• • •
•
•
•
•
Figure 14 The 3-step strategic approach to sustainable management of municipal water (Gijzen, in press)
Step 1. Measures that can be implemented to reduce water use include:
• Collection of rainwater.
• Use of grey water (flushing toilets, gardening).
• Application of water saving technologies.
The ultimate water saving technology is the application of dry sanitation in which urine and faeces are collected
separately. This technology also includes the recovery of valuable resources: urine can, after dilution, be used for
irrigation; faeces, after drying, can be applied as fertilizers (e.g. ecological toilet; Esrey et al. 2000).
Step 2. Other technologies that aim at resource recovery are:
• Anaerobic treatment.
PAGE 26 OF 47 QUICK SCAN WATER, SANITATION
• Macrophyte ponds.
• Aquaculture.
• (Constructed) wetlands.
Anaerobic treatment of concentrated wastewater generates biogas, but does not sufficiently remove nutrients and
pathogens. In macrophyte ponds, pathogens are removed, which makes their effluents suitable for irrigation of valuable
crops. Certain macrophytes (e.g. duckweeds) can be used as food for fish in aquaculture. Thus proteins are produced,
while effluents still can be applied in agriculture. Wetlands are mainly used for post-treatment of effluents, where
available vegetation takes up nutrients.
Step 3. Stimulate natural self-purification
Boosting the natural purification capacity of receiving water bodies could for instance be achieved by allowing rivers
to flow outside their often times artificial embankments. The so generated wetland surface area will contribute in terms
of self-purification of the water body, mainly due to prolonged retention time and improved aeration by algae and
wetland plants. Other options include the construction of small dams to cause rapids and turbulence in streams for
improved aeration of the river water. This will boost the aerobic heterotrophic activity of bacteria in the water. Also the
introduction or stimulation of controlled algal development to stimulate oxygenation could be considered.
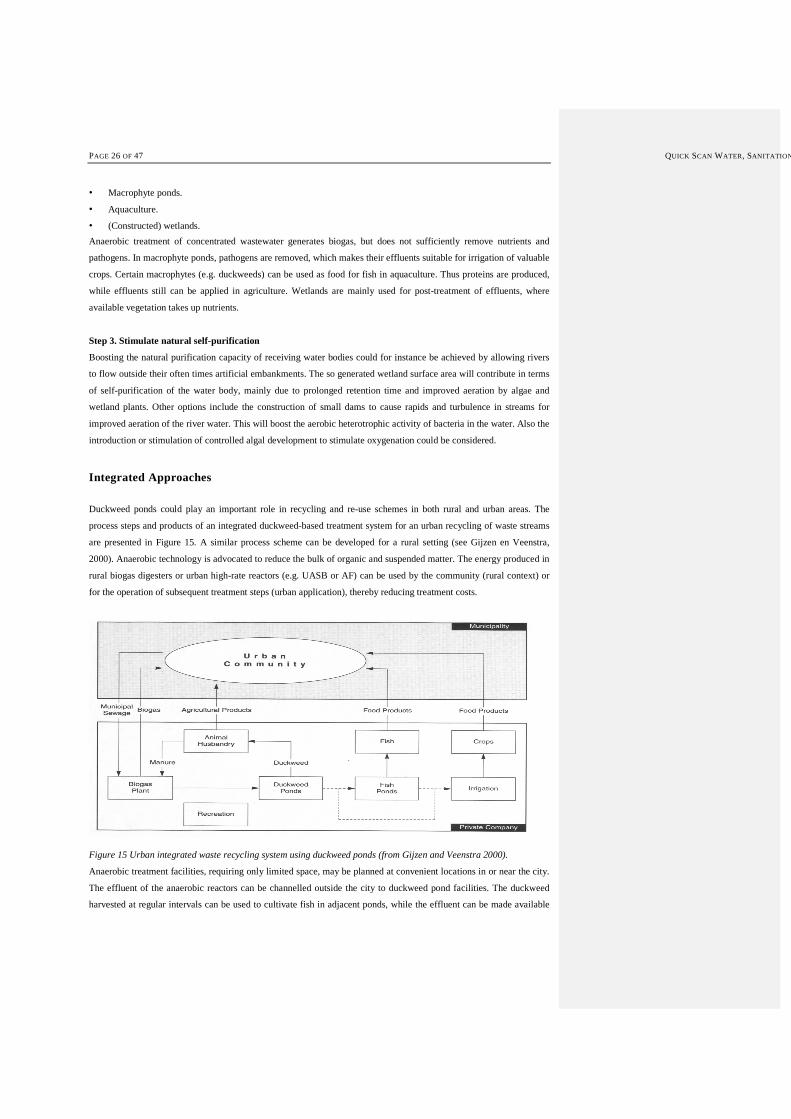
Integrated Approaches
Duckweed ponds could play an important role in recycling and re-use schemes in both rural and urban areas. The
process steps and products of an integrated duckweed-based treatment system for an urban recycling of waste streams
are presented in Figure 15. A similar process scheme can be developed for a rural setting (see Gijzen en Veenstra,
2000). Anaerobic technology is advocated to reduce the bulk of organic and suspended matter. The energy produced in
rural biogas digesters or urban high-rate reactors (e.g. UASB or AF) can be used by the community (rural context) or
for the operation of subsequent treatment steps (urban application), thereby reducing treatment costs.
Figure 15 Urban integrated waste recycling system using duckweed ponds (from Gijzen and Veenstra 2000).
Anaerobic treatment facilities, requiring only limited space, may be planned at convenient locations in or near the city.
The effluent of the anaerobic reactors can be channelled outside the city to duckweed pond facilities. The duckweed
harvested at regular intervals can be used to cultivate fish in adjacent ponds, while the effluent can be made available
QUICK SCAN WATER, SANITATION & HEALTH PAGE 27 OF 47
for irrigation. With the income from the products generated (energy, fish, irrigation water), the proposed integrated
system has the potential to become a commercial enterprise generating substantial revenues.
2.53.3 Investments in Water Supply & Sanitation Facilities
Current global total investment level in the water sector is estimated at US$ 70 to 80 billion per year. The biggest
share, some US$ 50 billion comes from government via public water services delivery. Private sector (US$ 15 billion)
and international donors (US$ 9 billion) share the remaining contribution. The international private sector is relatively
new, but growing rapidly at current investment levels of US$ 4 billion. Although worldwide investments in the wider
water sector show astronomic figures, present investment level is by far insufficient to reverse the growing water crisis.
The World Water Vision document states that the annual investment level should be raised to US$180 billion with
immediate effect for the described Vision to become reality in 2025 (Table 6).
Table 6 Annual investment requirement to achieve the World Water Vision by 2025.
Use Investment/y (Billions US$) Share (%)
1995 Vision 2025 1995 Vision 2025
Agriculture 30-35 30 43-50 17
Environment and industry 10-15 75 13-21 41
Water supply & Sanitation 30 75 38-43 42
Total 70-80 180 100 100
It is unclear from the vision document how the figure on water and sanitation was composed. Cosgrove and
Rijsberman (2000) made an estimation of 1.8 t1012 US$ to be invested for supplying 3.5 billion capita with water
supply and sanitation over 30 year or a 75 US$ billion per year for 1995-2025. This led to a conservative estimate of
500 US$ a person for urban water supply and sanitation. However, this estimated cost does not clearly identify what is
meant by sanitation. It seems that their estimates do not relate to the costs for wastewater treatment. Therefore it is
important to validate the data of the unit cost. Based on cost for construction identified by WHO/UNICEF (2000) the
validation has been carried out. Considering the variation in the construction costs for different service levels in
different regions, an average of 300 US $ per capita could be estimated (Table 7). The variation between regions is to
some extent the result of differing water resources, differing unit costs for construction in general and the different
service levels being offered. Figures should be considered as rough estimates and may vary widely because the costs
will be significantly affected by factors such as population density and easy access to water sources (WHO/UNICEF,
2000). The unit costs calculated in Table 7 are based on the following assumptions:
• Lifetime: water supply system = 25 years; urban sewer connection = 50 years; rural on-site = 15 years; average
for water vision calculation = 30 years.
• Operation and Maintenance (O&M): (percentage of construction cost): water supply system = 10%; urban sewer
connection = 5%; rural on-site = 9%; average for water vision calculation = 8% (Loetscher, 1999).
• Water consumption/capita: water supply system = 50 m3/year; urban sewer connection = 50 m3/year; rural on-site
= 25 m3/year; average for water vision calculation = 40 m3/year (WHO/UNEP, 1997).
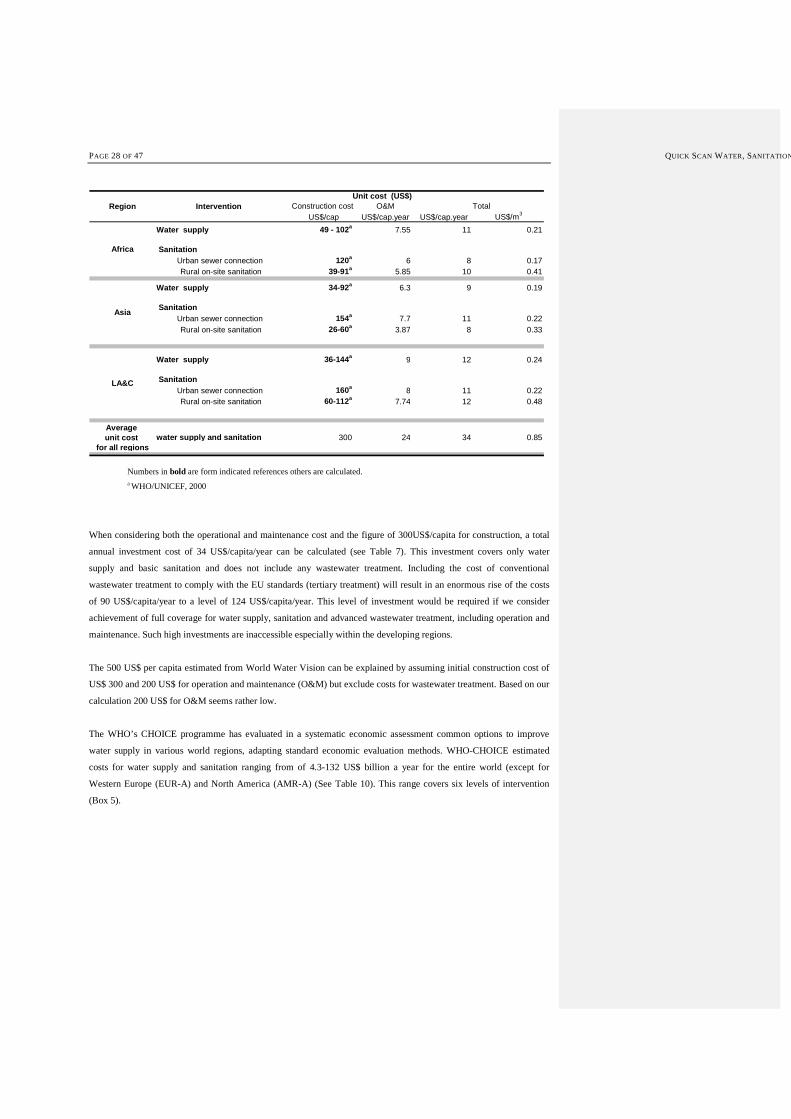
Table 7. Costs assessment of water supply and sanitation.
Formatted: Bullets and Numbering
PAGE 28 OF 47 QUICK SCAN WATER, SANITATION
Construction cost O&M US$/cap US$/cap.year US$/cap.year US$/m3
Water supply 49 - 102a 7.55 11 0.21
SanitationUrban sewer connection 120a 6 8 0.17 Rural on-site sanitation 39-91a 5.85 10 0.41
Water supply 34-92a 6.3 9 0.19
SanitationUrban sewer connection 154a 7.7 11 0.22 Rural on-site sanitation 26-60a 3.87 8 0.33
Water supply 36-144a 9 12 0.24
SanitationUrban sewer connection 160a 8 11 0.22 Rural on-site sanitation 60-112a 7.74 12 0.48
Average unit cost water supply and sanitation 300 24 34 0.85
for all regions
Africa
Asia
LA&C
Region Intervention Unit cost (US$)
Total
Numbers in bold are form indicated references others are calculated. a WHO/UNICEF, 2000
When considering both the operational and maintenance cost and the figure of 300US$/capita for construction, a total
annual investment cost of 34 US$/capita/year can be calculated (see Table 7). This investment covers only water
supply and basic sanitation and does not include any wastewater treatment. Including the cost of conventional
wastewater treatment to comply with the EU standards (tertiary treatment) will result in an enormous rise of the costs
of 90 US$/capita/year to a level of 124 US$/capita/year. This level of investment would be required if we consider
achievement of full coverage for water supply, sanitation and advanced wastewater treatment, including operation and
maintenance. Such high investments are inaccessible especially within the developing regions.
The 500 US$ per capita estimated from World Water Vision can be explained by assuming initial construction cost of
US$ 300 and 200 US$ for operation and maintenance (O&M) but exclude costs for wastewater treatment. Based on our
calculation 200 US$ for O&M seems rather low.
The WHO’s CHOICE programme has evaluated in a systematic economic assessment common options to improve
water supply in various world regions, adapting standard economic evaluation methods. WHO-CHOICE estimated
costs for water supply and sanitation ranging from of 4.3-132 US$ billion a year for the entire world (except for
Western Europe (EUR-A) and North America (AMR-A) (See Table 10). This range covers six levels of intervention
(Box 5).
QUICK SCAN WATER, SANITATION & HEALTH PAGE 29 OF 47
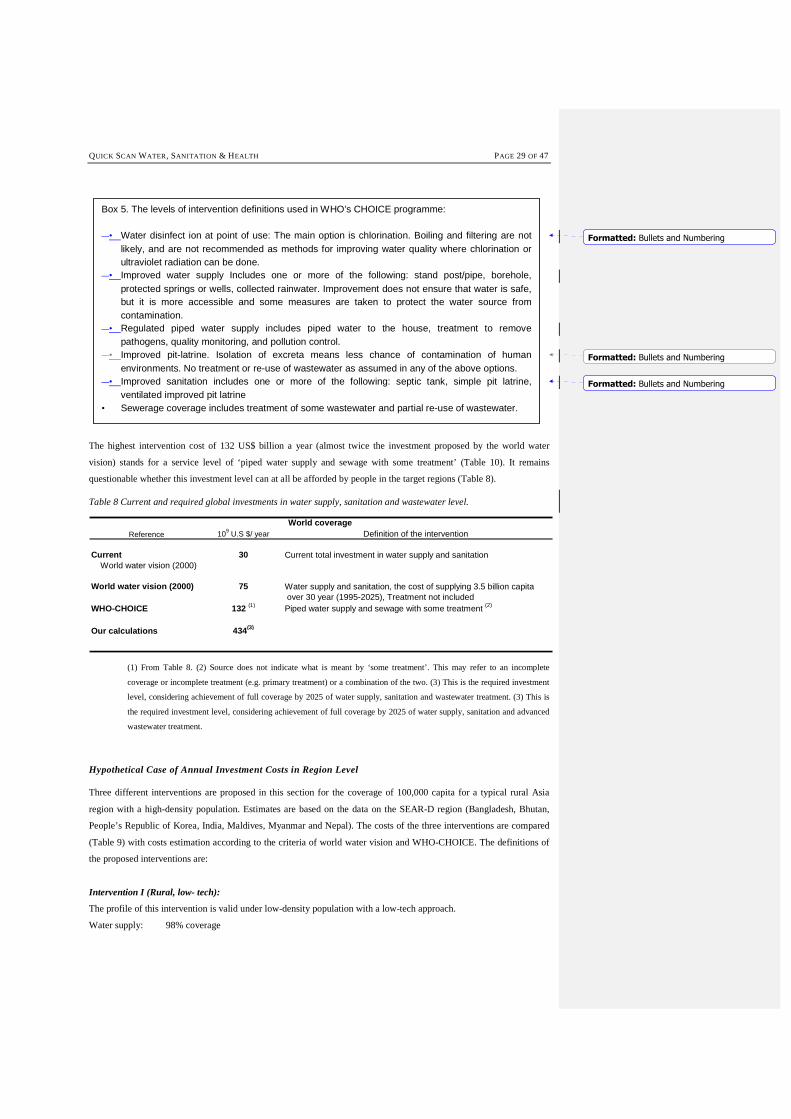
The highest intervention cost of 132 US$ billion a year (almost twice the investment proposed by the world water
vision) stands for a service level of ‘piped water supply and sewage with some treatment’ (Table 10). It remains
questionable whether this investment level can at all be afforded by people in the target regions (Table 8).
Table 8 Current and required global investments in water supply, sanitation and wastewater level.
Reference 109 U.S $/ year Definition of the intervention
Current 30 Current total investment in water supply and sanitation World water vision (2000)
World water vision (2000) 75 Water supply and sanitation, the cost of supplying 3.5 billion capita over 30 year (1995-2025), Treatment not included
WHO-CHOICE 132 (1) Piped water supply and sewage with some treatment (2)
Our calculations 434(3)
World coverage
(1) From Table 8. (2) Source does not indicate what is meant by ‘some treatment’. This may refer to an incomplete
coverage or incomplete treatment (e.g. primary treatment) or a combination of the two. (3) This is the required investment
level, considering achievement of full coverage by 2025 of water supply, sanitation and wastewater treatment. (3) This is
the required investment level, considering achievement of full coverage by 2025 of water supply, sanitation and advanced
wastewater treatment.
Hypothetical Case of Annual Investment Costs in Region Level
Three different interventions are proposed in this section for the coverage of 100,000 capita for a typical rural Asia
region with a high-density population. Estimates are based on the data on the SEAR-D region (Bangladesh, Bhutan,
People’s Republic of Korea, India, Maldives, Myanmar and Nepal). The costs of the three interventions are compared
(Table 9) with costs estimation according to the criteria of world water vision and WHO-CHOICE. The definitions of
the proposed interventions are:
Intervention I (Rural, low- tech):
The profile of this intervention is valid under low-density population with a low-tech approach.
Water supply: 98% coverage
Box 5. The levels of intervention definitions used in WHO’s CHOICE programme: �• Water disinfect ion at point of use: The main option is chlorination. Boiling and filtering are not
likely, and are not recommended as methods for improving water quality where chlorination or ultraviolet radiation can be done.
�• Improved water supply Includes one or more of the following: stand post/pipe, borehole, protected springs or wells, collected rainwater. Improvement does not ensure that water is safe, but it is more accessible and some measures are taken to protect the water source from contamination.
�• Regulated piped water supply includes piped water to the house, treatment to remove pathogens, quality monitoring, and pollution control.
�• Improved pit-latrine. Isolation of excreta means less chance of contamination of human environments. No treatment or re-use of wastewater as assumed in any of the above options.
�• Improved sanitation includes one or more of the following: septic tank, simple pit latrine, ventilated improved pit latrine
• Sewerage coverage includes treatment of some wastewater and partial re-use of wastewater.
Formatted: Bullets and Numbering
Formatted: Bullets and Numbering
Formatted: Bullets and Numbering
PAGE 30 OF 47 QUICK SCAN WATER, SANITATION
Sanitation: 70% rural area with low tech (on-sit sanitation), 30 % urban area with high tech (sewer connection,
off-site sanitation) and no wastewater treatment. Since the produced wastewater in this profile
(mainly rural area) is assumed to be produced in small amounts it could be handled within the self-
purification capacity of the water body. Contamination from the 30% urban population, however, is
expected. This profile will therefore not lead to a full reduction of the burden of disease related to
water supply and sanitation.
Intervention II (Urban, high tech):
This intervention represents a high-density population and applies a western high-tech approach for interventions
(sewerage plus centralized conventional wastewater water treatment). The demand of this approach was observed to be
growing for the last decades.
Water supply: 98% coverage
Sanitation: 30% rural area with low tech (on-site sanitation), 70 % urban area with high tech (sewer
connection, off-site sanitation) and with costly conventional wastewater treatment.
Intervention III (Urban, 3 Step Strategic Approach):
This intervention was proposed for high-density population, assuming optimal measures for cost and resource
recovery.
Water supply: 98% coverage
Sanitation: 30% rural area with low tech (on-site sanitation), 70 % urban area with high tech (sewer
connection, off-site sanitation) and with wastewater treatment and resource recovery. 80% cost
reduction is achieved by application of the ‘3 Step Strategic Approach’ (reduction in water
consumption, reduction in sewage volume, optimal resource recovery). The proposed cost
reduction of 80% seems high, but may be realistic considering experiences with a wastewater
treatment and aquaculture system in Bangladesh (see Box 6).
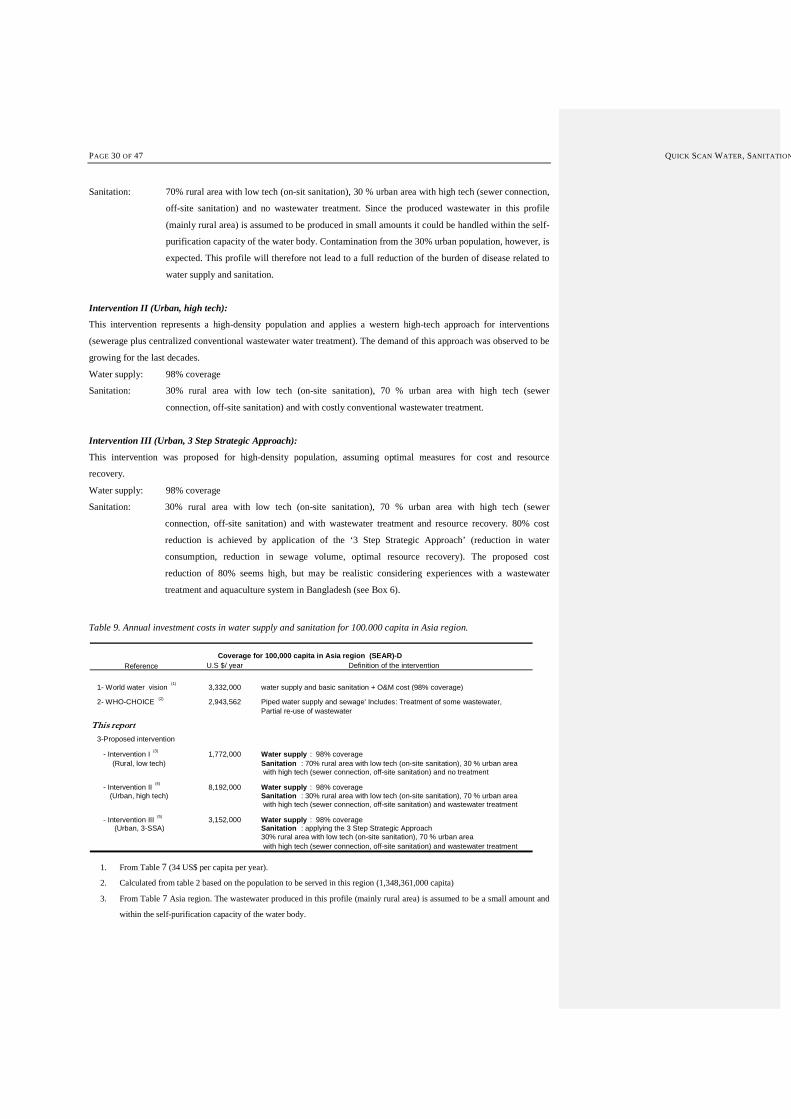
Table 9. Annual investment costs in water supply and sanitation for 100.000 capita in Asia region.
Reference U.S $/ year Definition of the intervention
1- World water vision(1)
3,332,000 water supply and basic sanitation + O&M cost (98% coverage)
2- WHO-CHOICE (2) 2,943,562 Piped water supply and sewage' Includes: Treatment of some wastewater,Partial re-use of wastewater
This report
3-Proposed intervention
- Intervention I(3)
1,772,000 Water supply : 98% coverage(Rural, low tech) Sanitation : 70% rural area with low tech (on-site sanitation), 30 % urban area
with high tech (sewer connection, off-site sanitation) and no treatment
- Intervention II(4)
8,192,000 Water supply : 98% coverage(Urban, high tech) Sanitation : 30% rural area with low tech (on-site sanitation), 70 % urban area
with high tech (sewer connection, off-site sanitation) and wastewater treatment
- Intervention III(5)
3,152,000 Water supply : 98% coverage(Urban, 3-SSA) Sanitation : applying the 3 Step Strategic Approach
30% rural area with low tech (on-site sanitation), 70 % urban area with high tech (sewer connection, off-site sanitation) and wastewater treatment
Coverage for 100,000 capita in Asia region (SEAR)-D
1. From Table 7 (34 US$ per capita per year).
2. Calculated from table 2 based on the population to be served in this region (1,348,361,000 capita)
3. From Table 7 Asia region. The wastewater produced in this profile (mainly rural area) is assumed to be a small amount and
within the self-purification capacity of the water body.

QUICK SCAN WATER, SANITATION & HEALTH PAGE 31 OF 47
4. Cost data Asia region plus additional cost of tertiary treatment (90 US$ per capita). The amount of wastewater produced is
high, and exceeds the self-purification capacity of the water body; therefore treatment is needed
5. Similar as (4) but now with a reduction of about 80% in the treatment cost; cost reduction achieved by application of the ‘3
Step Strategic Approach’ (reduction in water consumption, reduction in sewage volume, resource recovery).
The WHO-CHOICE estimates will be used in order to be able to make an estimate about investment needs against the
expected health benefits for these hypothetical cases. The benefits taken into account are only the health-related
improvements in terms of retrieved disability-adjusted life years lost. Intervention III is, however, expected to generate
additional benefits such as employment, and improved food security. This is reported in the following chapter.
Box 6. Duckweed based sewage treatment and resource recovery in Bangladesh
Stabilisation ponds for the treatment of wastewater can be modified by the use of aquatic macrophytes such as Pistia, water hyacinth, or duckweed (Lemnaceae). Duckweed wastewater treatment has been successfully introduced in a number of countries. In Bangladesh a local NGO, PRISM-Bangladesh, has operated a small-scale duckweed based pond for the treatment of domestic sewage for more than 12 years now. The protein-rich duckweed biomass is harvested daily and fed to adjacent fish ponds which yield an annual fish production of 12 to 16 tons per ha. The results over 5 years of operation demonstrate that the system generates a net profit of almost US$ 2000 per ha/y. For comparison, the maximum net profit for rice production in Bangladesh can be estimated at $ 1000 to 1400/ha.y. The financial performance of the system would translate into a net income generation from wastewater treatment and aquaculture of about US$ 120,000/year per 100,000 population. The wastewater treatment and aquaculture plant operated by PRISM Bangladesh probably represents the first system that is able to generate a net profit from the treatment of domestic sewage. This is possible because the cost intensive treatment is combined with revenue generating aquaculture.

PAGE 32 OF 47 QUICK SCAN WATER, SANITATION & HEALTH
Table 10. Costs assessment of different levels of water supply and sanitation interventions in different regions (WHO-CHOICE).
Disinfection at Halving the population Halving the population without Improved water supply and sanitation
point of use with education without improved water supply improved water supply and sanitation (98%)
Africa (AFR)-D 665,604,490 453,571,441 1,304,143,215 2,556,120,701
Africa (AFR)-E 826,324,525 563,092,965 1,527,910,726 2,994,705,024
Mediterranean (EMR)-B 43,660,441 48,903,410 169,422,968 332,069,017
Mediterranean (EMR)-D 93,284,868 63,568,309 224,715,517 440,442,413
European Region (EUR)-A
European Region (EUR)-B 172,542,372 94,922,501 297,867,787 583,820,863
European Region (EUR)-C 27,239,186 14,985,372 112,064,807 219,647,021
Americas (AMR)-A
Americas (AMR)-B 338,233,433 186,075,821 759,308,480 1,488,244,621
Americas (AMR)-D 90,823,462 49,965,641 178,473,954 349,808,950
Asia region (SEAR) -B 246,239,941 275,809,691 854,102,120 1,674,040,155
Asia region (SEAR) -D 523,019,455 585,826,305 5,907,522,335 11,578,743,777
Western Pacific Region (WPR)-A 44,779,487 50,156,837 304,948,113 597,698,301
Western Pacific Region (WPR)-B 1,213,870,896 1,359,638,717 6,860,725,582 13,447,022,141
Total 4,285,622,556 3,746,517,010 18,501,205,604 36,262,362,984
RegionIntervention
Improved water supply and sanitation Piped water supply and sewage
with disinfection (98%) with treatment (98%)
3,328,909,908 11,996,894,842
3,967,801,683 13,160,732,747
407,870,636 2,704,104,917
574,818,761 3,408,154,743
816,838,571 2,880,480,863
311,965,251 1,635,837,188
2,017,169,340 5,817,275,080
464,454,026 1,264,233,503
1,988,972,090 12,542,611,877
14,184,319,328 39,689,844,066
722,596,315 1,520,322,160
16,186,514,742 34,475,617,498
44,972,230,651 131,096,109,484
QUICK SCAN WATER, SANITATION & HEALTH PAGE 33 OF 47
34 Economic Evaluation of Water Health:
From Dollar to DALY
This chapter will first give an introduction to the health economics approach to measure both costs and health
benefits of health-related interventions. Next it will give the results of a cost-effectiveness evaluation of conventional
approach in relation to water health and first estimates of promising alternative approaches. In the end, the
importance of this kind of health impact information is sketched for international and national public policy making
like the Millennium Development Goals.
4.1 Economic Evaluation in Health
Over the past decade interest in the economic evaluation of health care interventions, including in health impact
assessment, has risen. In 1995 the British Medical Journal set up a working party of leading health economists, that
nowadays is most frequently quoted to set quality standards of economic evaluation. This section summarises its
recommendations and gives definitions of important terms. Table 11 provides an overview of the different economic
evaluations in health.
Firstly, the research question is important. The question should be formulated important (in terms of its resource
implications of an intervention) and hence, it should be relevant to the choices faced by the decision-makers. The
question ‘Is health education worthwhile?’ does not meet this criterion because it fails to specify alternatives--
worthwhile compared with what? This is the first type of question. Furthermore, alternative choices need to be
realistic. Secondly, the question should consider both costs and health outcomes. The question ‘Is intervention X
more costly than existing interventions?’ provides incomplete information because the decision-maker needs also to
consider comparative effectiveness of both alternatives.
Table 11 Different forms of economic evaluation in health (Drummond et al, 1987)
Study type Measurement of benefits Question posed
Cost minimisation analysis
Cost effectiveness analysis
Cost-utility analysis
Cost-benefit analysis
Benefits found to be equivalent
Natural units (e.g. life years gained)
Healthy years (e.g. quality- or disability-
adjusted life years, healthy years
equivalents)
Monetary terms
Which is the most efficient way of achieving a
given goal (or objective)?
or
What is the most efficient way of spending a
given budget?
Should a given goal (or objective) be pursued to
a greater or lesser extent?
The question also needs to states the perspective of the economic evaluation. Possible viewpoints include those of
the provider institution, a professional organization, patient groups, the purchaser of the intervention, the general
public or society itself. The viewpoint chosen influences both the selection of which costs and which benefits are to
be evaluated. In practice, the comparator is usually the most-widely used alternative, cost-effective or not, treatment.
The second type of question is: ‘Given that a goal is to be achieved, what is the most efficient way of doing so?’ or
‘What is the most efficient way of spending a given budget?’ Such questions are addressed by cost-effectiveness
analysis, which can take two forms. In the first question the health effects of the alternatives are known to be equal,
Formatted: Bullets and Numbering
PAGE 34 OF47 QUICK SCAN WATER, SANITATION & HEALTH
so only the costs need to be analyzed, and the least costly alternative is the most efficient. This is often referred to as
cost minimization. Secondly, alternatives may differ in both cost and effect, and a cost effectiveness ratio (cost per
unit of health effect) is calculated for each alternative. For example, given a fixed budget, the modality with the
lowest cost per life year saved would, if implemented, maximize the amount of life years produced by the
transplantation programme. In practice, however, the selection of the most efficient mix of programs, given a budget
constraint, is more complicated: it depends on whether alternatives are mutually exclusive.
The concept ‘within a given budget’ is crucial. Often studies produce a ratio of extra costs per extra unit of health
effect for one intervention over another and argue that a low cost effectiveness ratio, relative to other existing health
care programs, implies that a given intervention should be provided. However, judgement is required, as the
resources to meet such extra costs would inevitably come from another programme, from within or outside health
care. The third category of evaluation, cost-utility analysis, lies between cost effectiveness and cost-benefit analysis.
It can be used to decide the best way of spending a given budget. The basic outcome of cost-utility analysis is
‘healthy years’. Years of life in states less than full health are converted to healthy years by the use of health state
preference values, resulting in generic units of health gain, such as DALYs, QALYs, or other healthy years
equivalents.
These outcome measures for the economic evaluation should be clearly stated, for example cases detected, life years,
QALYs and DALYs, or willingness to pay in monetary terms. If health benefits have been valued details should be
given of the methods used, for example time trade off, standard gamble, contingent valuation, and of the subjects
from whom valuations were obtained, for example patients, members of the general public, health care professionals.
If changes in productivity (indirect benefits) are included they should be reported separately and their relevance to
the study question discussed. In cost effectiveness analysis benefits are usually measured in natural units. For
programs whose main effect is to extend life, decrease mortal diseases, the usual measure is life years gained. When
the main effect is on quality of life a disease specific or generic quality of life index is used. Two years of life in a
health state judged to be halfway between death and full health would be equivalent to one year in full health.
Incremental health gain is given by the difference in quality adjusted life years produced by one intervention as
compared to another. For example, using a time trade off a respondent is asked how many years of life in a health
state he or she would be prepared to give up to be in full health. Using a ‘standard gamble’ the respondent is asked to
choose between a certain health state and a gamble with two possible outcomes (one worse and the other better than
the health state being valued). The responses from population groups to a simple questionnaire can then be expressed
as a health state preference value by reference to pre-scaled responses (obtained by standard gamble or time trade
off) from a relevant reference group. A population group may provide or sample of groups with a condition for
which the treatment is being evaluated. The choice depends on the perspective of the study.
In the last type of economic evaluation, in cost-benefit analysis, benefits of health care are traditionally valued in
money terms by using either the human capital approach or the willingness to pay approach. The former values a
health improvement on the basis of the future value of a member of society in terms of economic production i.e. of
being able to return to work. Values have to be imputed for activities such as home making, so the human capital
approach suffers from problems of how to value health improvements for retired and unemployed people. This fairly
narrow view of the value of improved health is rarely used within the health sector. When the impact on society is
large like in the case of aids or big epidemics this approach is much more attractive to convince policy makers.
Debate continues about whether productivity gains from improved health (‘indirect benefits’) should be included
alongside other measures of the value of improved health. Some analysts argue that it introduces inequalities
between those interventions that are aimed at individuals who for the present could return to productive activity and
QUICK SCAN WATER, SANITATION & HEALTH PAGE 35 OF 47
those that are not. Researchers are concerned about the standard method of measuring productivity gains, which
values work days lost by gross earnings. Koopmanschap et al. (reference) have proposed an approach for measuring
temporarily productivity changes, called the friction cost method, which recognizes that the amount of production
lost due to disease depends on the time an organization needs to restore initial production. Whatever estimation
method is used, indirect benefits should be reported separately so that readers can decide to include them in the
overall study result.
Quantities of resources should be reported separately from the prices (unit costs) of those resources. Methods for the
estimation of both quantities and prices (unit costs) should be given. The currency and price date should be recorded
and details of any adjustment for inflation, or currency conversion, given. Costing involves estimating the resources
used--for example, days in hospital--and their prices (unit costs). These estimates must be reported separately to help
the reader judge their relevance to his or her setting. The time horizon should be long enough to capture all the
differential effects of the options. It should often extend to the whole life of the treated individuals and even beyond.
Most analysts agree that costs should be discounted in any study having a time horizon longer than one year. At
present, most recommendations seem to vary between 3 and 6%.
Economic evaluation and its analysis of uncertainties should pay particular attention to whether the important
question is the precision of the quantitative results or the robustness of the conclusions drawn from them. The last
decades major progress has been made by using methods from epidemiology and statistics in a systematic way. Firm
conclusions may be shown to hold despite considerable uncertainties; on the other hand, relatively narrow estimates
of parameters may still leave substantial uncertainty about the policy implications.
3.24.2 Health Benefits and Costs of Water Interventions
The WHO’s CHOICE programme has evaluated in an systematic economic assessment common options to improve
water supply in various world regions, adapting standard economic evaluation methods. This effort, together with the
Swiss Tropical Institute, takes the (often hypothetical) situation of no established home water supply as the referent,
or comparator, situation. The benefits taken into account are only the health-related improvements in terms of
retrieved disability-adjusted life years lost. Other societal benefits are ignored.
The analyses have been done for 17 world regions and are for three types of interventions in various combinations
and for varying coverage levels as listed in Box 5. The outcomes for three world regions are given in the next
section.
3.34.3 Various Water Health Profiles
The sections below sketch the three cost-health benefit analyses for profiles performed by the WHO CHOICE
programme and analyses one hypothetical example in Asian Region in which 3 alternative options are compared.
The different profiles chosen are to illustrate the differences and common characteristic in the approaches to water
health improvements. The three profile chosen are:
1. rural, low tech, high population density (e.g. India, WHO: SEAR-D)
2. urban, low tech, high population density (e.g. Peru, WHO: AMRO-D)
3. rural, low tech, low population density (e.g. South Africa, WHO: AFRO E)
Formatted: Bullets and Numbering
Formatted: Bullets and Numbering
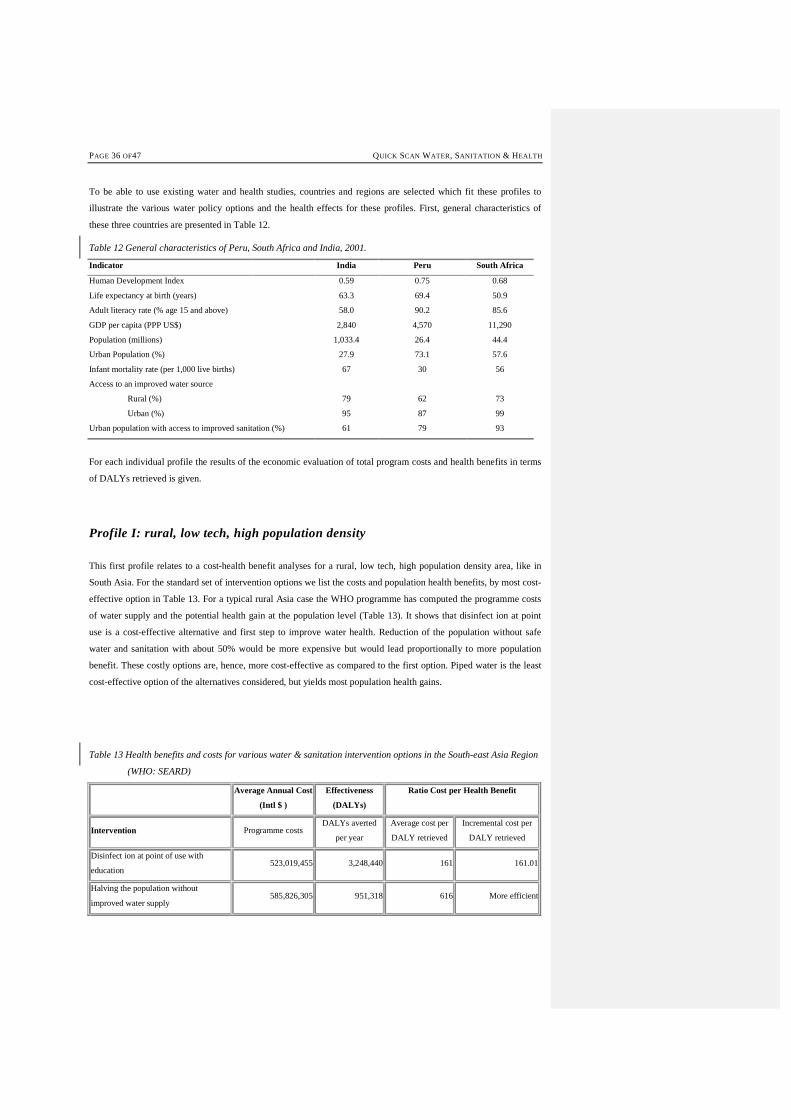
PAGE 36 OF47 QUICK SCAN WATER, SANITATION & HEALTH
To be able to use existing water and health studies, countries and regions are selected which fit these profiles to
illustrate the various water policy options and the health effects for these profiles. First, general characteristics of
these three countries are presented in Table 12.
Table 12 General characteristics of Peru, South Africa and India, 2001.
Indicator India Peru South Africa
Human Development Index 0.59 0.75 0.68
Life expectancy at birth (years) 63.3 69.4 50.9
Adult literacy rate (% age 15 and above) 58.0 90.2 85.6
GDP per capita (PPP US$) 2,840 4,570 11,290
Population (millions) 1,033.4 26.4 44.4
Urban Population (%) 27.9 73.1 57.6
Infant mortality rate (per 1,000 live births) 67 30 56
Access to an improved water source
Rural (%)
79
62
73
Urban (%) 95 87 99
Urban population with access to improved sanitation (%) 61 79 93
For each individual profile the results of the economic evaluation of total program costs and health benefits in terms
of DALYs retrieved is given.
Profile I: rural, low tech, high population density
This first profile relates to a cost-health benefit analyses for a rural, low tech, high population density area, like in
South Asia. For the standard set of intervention options we list the costs and population health benefits, by most cost-
effective option in Table 13. For a typical rural Asia case the WHO programme has computed the programme costs
of water supply and the potential health gain at the population level (Table 13). It shows that disinfect ion at point
use is a cost-effective alternative and first step to improve water health. Reduction of the population without safe
water and sanitation with about 50% would be more expensive but would lead proportionally to more population
benefit. These costly options are, hence, more cost-effective as compared to the first option. Piped water is the least
cost-effective option of the alternatives considered, but yields most population health gains.
Table 13 Health benefits and costs for various water & sanitation intervention options in the South-east Asia Region
(WHO: SEARD)
Average Annual Cost
(Intl $ )
Effectiveness
(DALYs)
Ratio Cost per Health Benefit
Intervention Programme costs DALYs averted
per year
Average cost per
DALY retrieved
Incremental cost per
DALY retrieved
Disinfect ion at point of use with
education 523,019,455 3,248,440 161 161.01
Halving the population without
improved water supply 585,826,305 951,318 616 More efficient
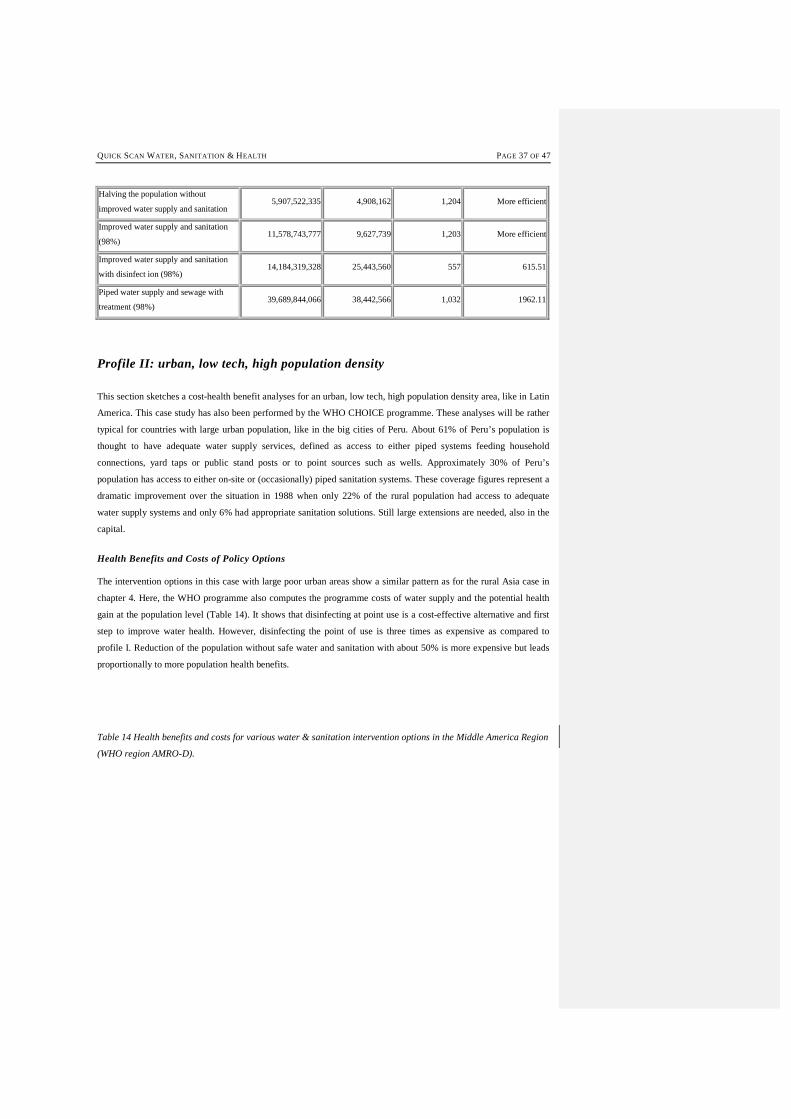
QUICK SCAN WATER, SANITATION & HEALTH PAGE 37 OF 47
Halving the population without
improved water supply and sanitation 5,907,522,335 4,908,162 1,204 More efficient
Improved water supply and sanitation
(98%) 11,578,743,777 9,627,739 1,203 More efficient
Improved water supply and sanitation
with disinfect ion (98%) 14,184,319,328 25,443,560 557 615.51
Piped water supply and sewage with
treatment (98%) 39,689,844,066 38,442,566 1,032 1962.11
Profile II: urban, low tech, high population density
This section sketches a cost-health benefit analyses for an urban, low tech, high population density area, like in Latin
America. This case study has also been performed by the WHO CHOICE programme. These analyses will be rather
typical for countries with large urban population, like in the big cities of Peru. About 61% of Peru’s population is
thought to have adequate water supply services, defined as access to either piped systems feeding household
connections, yard taps or public stand posts or to point sources such as wells. Approximately 30% of Peru’s
population has access to either on-site or (occasionally) piped sanitation systems. These coverage figures represent a
dramatic improvement over the situation in 1988 when only 22% of the rural population had access to adequate
water supply systems and only 6% had appropriate sanitation solutions. Still large extensions are needed, also in the
capital.
Health Benefits and Costs of Policy Options
The intervention options in this case with large poor urban areas show a similar pattern as for the rural Asia case in
chapter 4. Here, the WHO programme also computes the programme costs of water supply and the potential health
gain at the population level (Table 14). It shows that disinfecting at point use is a cost-effective alternative and first
step to improve water health. However, disinfecting the point of use is three times as expensive as compared to
profile I. Reduction of the population without safe water and sanitation with about 50% is more expensive but leads
proportionally to more population health benefits.
Table 14 Health benefits and costs for various water & sanitation intervention options in the Middle America Region
(WHO region AMRO-D).
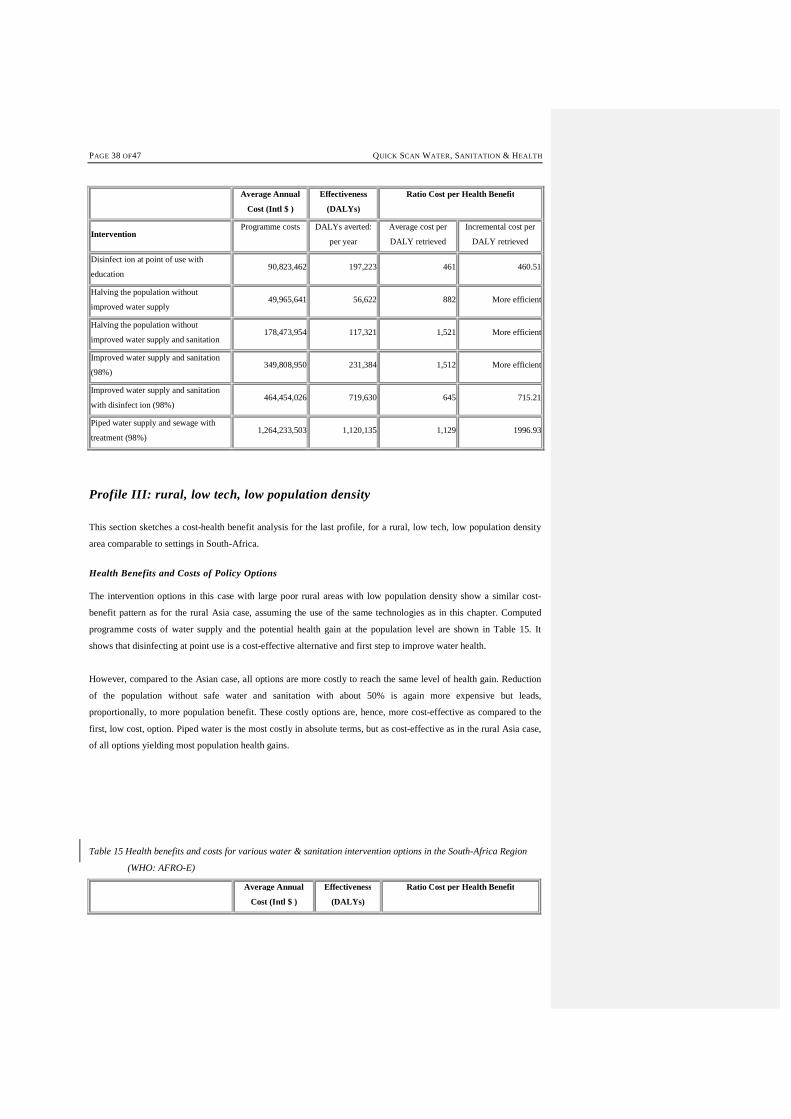
PAGE 38 OF47 QUICK SCAN WATER, SANITATION & HEALTH
Average Annual
Cost (Intl $ )
Effectiveness
(DALYs)
Ratio Cost per Health Benefit
Intervention Programme costs DALYs averted:
per year
Average cost per
DALY retrieved
Incremental cost per
DALY retrieved
Disinfect ion at point of use with
education 90,823,462 197,223 461 460.51
Halving the population without
improved water supply 49,965,641 56,622 882 More efficient
Halving the population without
improved water supply and sanitation 178,473,954 117,321 1,521 More efficient
Improved water supply and sanitation
(98%) 349,808,950 231,384 1,512 More efficient
Improved water supply and sanitation
with disinfect ion (98%) 464,454,026 719,630 645 715.21
Piped water supply and sewage with
treatment (98%) 1,264,233,503 1,120,135 1,129 1996.93
Profile III: rural, low tech, low population density
This section sketches a cost-health benefit analysis for the last profile, for a rural, low tech, low population density
area comparable to settings in South-Africa.
Health Benefits and Costs of Policy Options
The intervention options in this case with large poor rural areas with low population density show a similar cost-
benefit pattern as for the rural Asia case, assuming the use of the same technologies as in this chapter. Computed
programme costs of water supply and the potential health gain at the population level are shown in Table 15. It
shows that disinfecting at point use is a cost-effective alternative and first step to improve water health.
However, compared to the Asian case, all options are more costly to reach the same level of health gain. Reduction
of the population without safe water and sanitation with about 50% is again more expensive but leads,
proportionally, to more population benefit. These costly options are, hence, more cost-effective as compared to the
first, low cost, option. Piped water is the most costly in absolute terms, but as cost-effective as in the rural Asia case,
of all options yielding most population health gains.
Table 15 Health benefits and costs for various water & sanitation intervention options in the South-Africa Region
(WHO: AFRO-E)
Average Annual
Cost (Intl $ )
Effectiveness
(DALYs)
Ratio Cost per Health Benefit

QUICK SCAN WATER, SANITATION & HEALTH PAGE 39 OF 47
Intervention Programme costs DALYs averted
per year
Average cost per
DALY retrieved
Incremental cost per
DALY retrieved
Disinfect ion at point of use with
education 826,324,525 3,398,430 243 243.15
Halving the population without
improved water supply 563,092,965 627,627 897 More efficient
Halving the population without
improved water supply and sanitation 1,527,910,726 1,512,576 1,010 More efficient
Improved water supply and sanitation
(98%) 2,994,705,024 3,392,285 883 More efficient
Improved water supply and sanitation
with disinfect ion (98%) 3,967,801,683 8,264,523 480 645.59
Piped water supply and sewage with
treatment (98%) 13,160,732,747 12,274,239 1,072 2292.66
Hypothetical Asian case: Cost-benefits of promising water and sanitation interventions
As an alternative approach, this section reports the results of a cost-benefit analysis of the more promising options
(see section 2.4 for promising options) in water and sanitation for a hypothetical population in rural South-Asia.
Table 16 shows the results of this analysis. The main assumption underneath these calculations is that the alternative
low-tech solutions will be just as effective as the more standard options. This assumption seems to be justified, as the
premise is that also these alternative options break the vicious cycle of infection and re-infection somewhere in the
intermediate stages.
Table 16 indicates that the promising rural low-tech options (Intervention I) in the hypothetical population show
better, lower, cost-benefits rations than the options in the three case studies. This is mainly due to the low costs of the
interventions and the longer functional lifetime of the intervention techniques. The results for the second alternative
intervention (II) shows that high coverage of population with conventional treatment, like in Western countries, lead
to very costly, cost-ineffective policies. The last option (III) shows that the alternative three-step approach as outlined
in section 2.4 also may lead to a cost-effective policy choice, assuming similar health gains. This shows a cost-
minimisation.
Table 16 Health benefits, costs and cost-benefit ratio in a hypothetical rural population in Asia of 100.000 using
promising alternative, low technology water & sanitation interventions in rural, densely populated areas.
Average Annual
Cost (Intl $ )
Effectiveness
(DALYs/100.000)
Ratio Cost per Health Benefit
Alternative intervention options
Programme costs DALYs averted / year
Average cost per
DALY retrieved
Incremental cost per
DALY retrieved
Improved water supply & sanitation
disinfect ion (98%) - WHO 1.051.967 1.887 557 0
Piped water supply and sewage with
treatment (98%)- WHO 2.943.562 2.851 1.032 3.053
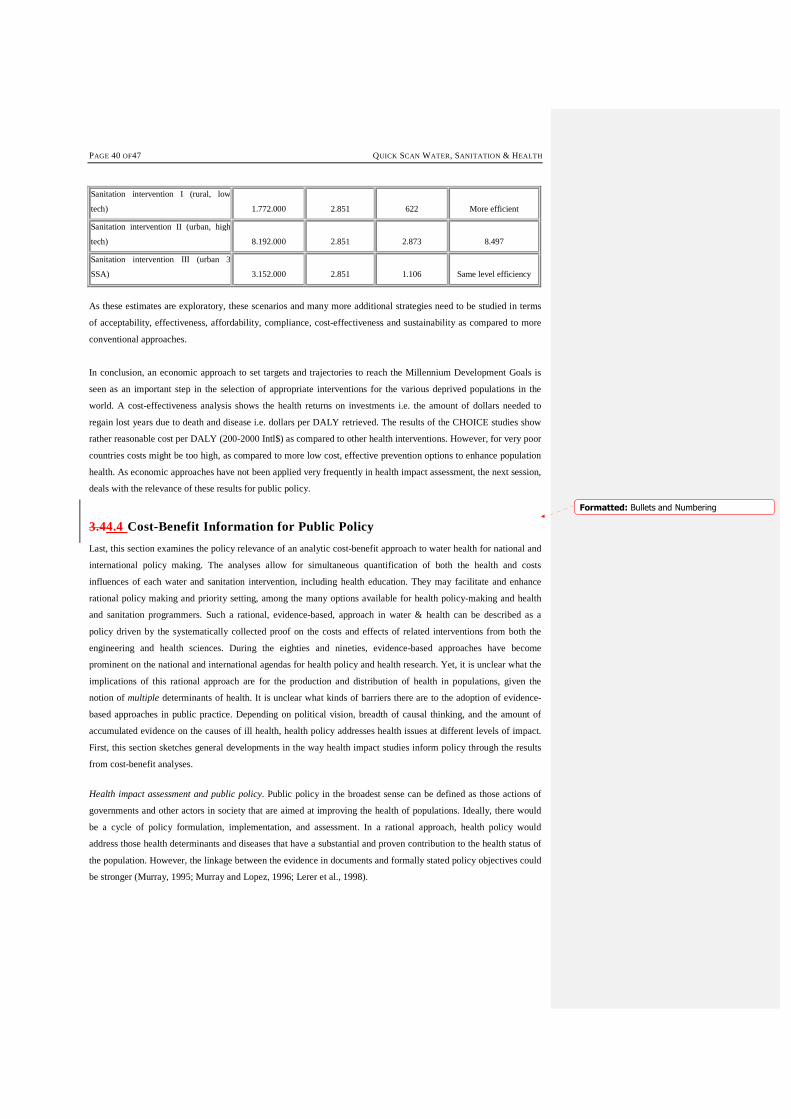
PAGE 40 OF47 QUICK SCAN WATER, SANITATION & HEALTH
Sanitation intervention I (rural, low
tech) 1.772.000 2.851 622 More efficient
Sanitation intervention II (urban, high
tech) 8.192.000 2.851 2.873 8.497
Sanitation intervention III (urban 3
SSA) 3.152.000 2.851 1.106 Same level efficiency
As these estimates are exploratory, these scenarios and many more additional strategies need to be studied in terms
of acceptability, effectiveness, affordability, compliance, cost-effectiveness and sustainability as compared to more
conventional approaches.
In conclusion, an economic approach to set targets and trajectories to reach the Millennium Development Goals is
seen as an important step in the selection of appropriate interventions for the various deprived populations in the
world. A cost-effectiveness analysis shows the health returns on investments i.e. the amount of dollars needed to
regain lost years due to death and disease i.e. dollars per DALY retrieved. The results of the CHOICE studies show
rather reasonable cost per DALY (200-2000 Intl$) as compared to other health interventions. However, for very poor
countries costs might be too high, as compared to more low cost, effective prevention options to enhance population
health. As economic approaches have not been applied very frequently in health impact assessment, the next session,
deals with the relevance of these results for public policy.
3.44.4 Cost-Benefit Information for Public Policy
Last, this section examines the policy relevance of an analytic cost-benefit approach to water health for national and
international policy making. The analyses allow for simultaneous quantification of both the health and costs
influences of each water and sanitation intervention, including health education. They may facilitate and enhance
rational policy making and priority setting, among the many options available for health policy-making and health
and sanitation programmers. Such a rational, evidence-based, approach in water & health can be described as a
policy driven by the systematically collected proof on the costs and effects of related interventions from both the
engineering and health sciences. During the eighties and nineties, evidence-based approaches have become
prominent on the national and international agendas for health policy and health research. Yet, it is unclear what the
implications of this rational approach are for the production and distribution of health in populations, given the
notion of multiple determinants of health. It is unclear what kinds of barriers there are to the adoption of evidence-
based approaches in public practice. Depending on political vision, breadth of causal thinking, and the amount of
accumulated evidence on the causes of ill health, health policy addresses health issues at different levels of impact.
First, this section sketches general developments in the way health impact studies inform policy through the results
from cost-benefit analyses.
Health impact assessment and public policy. Public policy in the broadest sense can be defined as those actions of
governments and other actors in society that are aimed at improving the health of populations. Ideally, there would
be a cycle of policy formulation, implementation, and assessment. In a rational approach, health policy would
address those health determinants and diseases that have a substantial and proven contribution to the health status of
the population. However, the linkage between the evidence in documents and formally stated policy objectives could
be stronger (Murray, 1995; Murray and Lopez, 1996; Lerer et al., 1998).
Formatted: Bullets and Numbering
QUICK SCAN WATER, SANITATION & HEALTH PAGE 41 OF 47
There are few studies that have assessed the rationale behind national health investments in water health. Analysis
show, in general, a relation between the funding of disease programmes and disease burden when estimated in
disability-adjusted life years (DALYs) lost. There is a poor relationship between funding and disease burden when
measured in life years lost. In the international debates agreement seems to be, regarding the use of a burden of
disease approach to select priority areas for policy and research using. In this approach, epidemiology provides the
information on the occurrence of specific diseases and the estimated contribution of health determinants to their
occurrence. At the same time, health economics provides information on equity issues and the selection of cost-
effective interventions (Niessen, 2002) . Priority diseases identified through this approach by the WHO are, among
others, broad environmental factors such as nutrition and water supply, childhood infections, malaria, tuberculosis,
cardiovascular diseases, other tobacco-related diseases, and mental health (WHO, 1997a). Given the increasing
advocacy for health in the political arena over the past decades, there is an increasing attempt towards transparency
and rationalisation of the decision making process in public policy. Consensus is growing on the interpretation of the
role of both broad and specific health determinants, including environmental interventions, as well as on priority
setting based on the burden of diseases.
National status documents recognise the role of multiple determinants of health. It includes the influences of other
societal sectors of governmental concern. Research, however, in these areas is still scarce. Some econometric
modelling deals with entangling the relationship between economic developments, or health development, and
mortality change at the national level (Pritchett, 1997; Kwakani, 1993; Preston, 1975; Mackenbach, 1988; McGuire,
1993). Existing analytic frameworks explaining ill health at the population level (Lalonde, 1974; Ruwaard, 1994;
Lerer et al., 1998; WHO, 1997: Niessen, 2003) consider both broad determinants (such as income, education,
nutrition, water and hygiene) and more specific determinants (such as smoking, body mass, health interventions).
Recently, the WHO and other UN agencies have recognised the role of environmental determinants of health
(Brundtland, 1999; UNEP, 1997; WHO, 2002). The exact size of the marginal contributions of each health
determinant is subject to continuing debate (Weil, 1990, Lerer et al., 1998). There are inputs from epidemiologists,
public health specialists, economists, and also demographers (Murray and Lopez, 1997b; Pritchett, 1997; Niessen
and Hilderink, 1997; Preston, 1975). Among the many analytical difficulties are three large ones: the measurement of
ill health (e.g. in terms of mortality by cause or of reduced quality of life), estimation of the ‘net’ effect of a
particular contributing factor and the phenomena of substitution of disease risks.
Prospective formal appraisal, as proposed in this paper, of options in intersectoral and sector-wide policy is defined
as ‘health impact assessment’. This has become rather established for policy outcomes other than health, especially
in the environmental field (Swart, 1995, Scott-Samuel, 1996). Methods draw on a variety of disciplines and may
focus on those groups affected most by policy changes. We predict that there will be a growing demand for
intersectoral assessment, in spite of the fact that its methodology is still developing (Lerer et al., 1998; Rather et al.,
1997; Gunning and Hagen, 1987; Mackenbach and Gunning-Schepers, 1997). Nowadays, one can observe a shift
regarding accountability towards the initiator of policy changes in other sectors than health care. They will have to
provide evidence on the impact on health of such policy changes. Health impact assessment, including estimates of
both expected costs and health benefits, is a crucial element in this policy making process at the international and
national level.
PAGE 42 OF47 QUICK SCAN WATER, SANITATION & HEALTH
45 Synthesis, Conclusion and Recommendations
4.1Feasible Policy Options
The selection of feasible policy options depends on both general and local specific criteria regarding the feasibility of
options. General criteria may be technical, demand for facilities, the relation between benefits and costs, as well as
available budgets. Other, more specific criteria will depend on the appropriateness of intervention option within a
particular context and will involve cultural, religious and social characteristics of populations.
Standard options in water supply and sanitation, as evaluated in the WHO example, have been selected in a generic
matter and are seen as potentially feasible options in all world regions. Their computed cost-benefit ratios all lie in
the range of rather cost-effective interventions as are known within health prevention in most countries. The range
for the most cost-effective interventions in prevention and care outside water supply & sanitation field, however,
shows an order of magnitude between 2 - 400 US$ per DALY gained. Examples are vaccines in childhood, treatment
for tuberculosis. These options are seen as affordable options for also the most impoverished nations. Alternative,
more affordable options in water supply and sanitation need to be identified.
This study identifies a feasible option that can be just as effective in health terms, be more sustainable and come at a
lower cost as conventional systems. This promising option focuses on sewage management, but also considers water
supply, nutrient uses and other material flows associated with the urban water cycle. This approach includes three
steps: 1) prevention, 2) treatment for re-use, and 3) planned discharge with stimulation of self-purification capacity.
This approach shifts the paradigm of wastewater as a waste full product because products generated from this
approach (energy, fish, irrigation water) can create income. The proposed integrated option has the potential to
become a commercial enterprise generating substantial revenues.
Cost-Benefits of Promising Water & Sanitation Interventions
In a synthesis, this section reports the results of a first cost-benefit analysis of the more promising options in water
and sanitation for a hypothetical population in rural South-Asia. Table 17 shows the results of this analysis. The
assumption underneath these calculations has been that the alternative low-tech solutions will be just as effective as
the more conventional approaches. Table 17 summarises that promising rural low-tech options (Intervention I) in a
hypothetical population show better, lower, cost-benefits ratios as the options in the three case studies. This is mainly
due to the low costs of the interventions and the longer functional lifetime of the intervention techniques. The results
for the second alternative intervention (II) shows that high coverage of population with conventional treatment, like
in Western countries and stated in the Millennium Goals, lead to very costly, cost-ineffective policies. The last option
(III) shows that the alternative three-step approach as outlined in section 2.4. also may lead to a cost-effective policy
choice, assuming similar health gains. This shows the possibility of cost-minimisation. These kinds of scenarios and
many more additional strategies need to be studied in terms of acceptability, effectiveness, affordability, and
compliance and cost-effectiveness as compared to more standard approaches, proposed in the context of Millennium
Development Goals.
Formatted: Bullets and Numbering
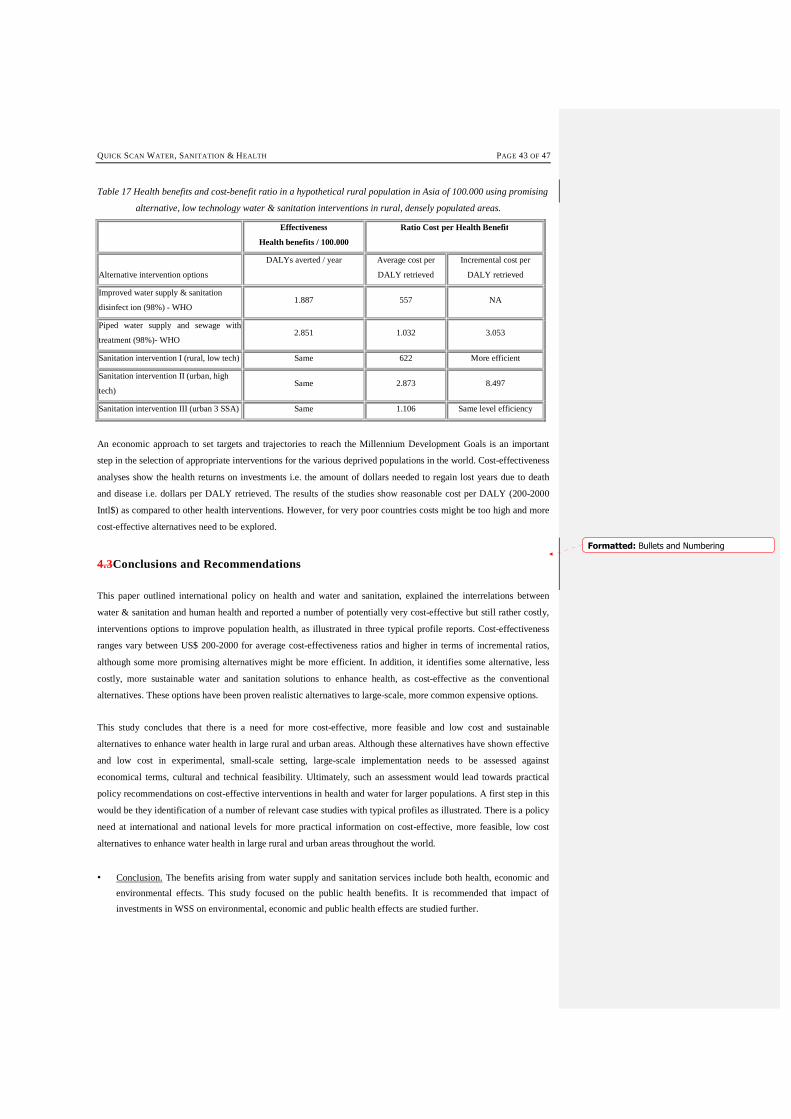
QUICK SCAN WATER, SANITATION & HEALTH PAGE 43 OF 47
Table 17 Health benefits and cost-benefit ratio in a hypothetical rural population in Asia of 100.000 using promising
alternative, low technology water & sanitation interventions in rural, densely populated areas.
Effectiveness
Health benefits / 100.000
Ratio Cost per Health Benefit
Alternative intervention options
DALYs averted / year Average cost per
DALY retrieved
Incremental cost per
DALY retrieved
Improved water supply & sanitation
disinfect ion (98%) - WHO 1.887 557 NA
Piped water supply and sewage with
treatment (98%)- WHO 2.851 1.032 3.053
Sanitation intervention I (rural, low tech) Same 622 More efficient
Sanitation intervention II (urban, high
tech) Same 2.873 8.497
Sanitation intervention III (urban 3 SSA) Same 1.106 Same level efficiency
An economic approach to set targets and trajectories to reach the Millennium Development Goals is an important
step in the selection of appropriate interventions for the various deprived populations in the world. Cost-effectiveness
analyses show the health returns on investments i.e. the amount of dollars needed to regain lost years due to death
and disease i.e. dollars per DALY retrieved. The results of the studies show reasonable cost per DALY (200-2000
Intl$) as compared to other health interventions. However, for very poor countries costs might be too high and more
cost-effective alternatives need to be explored.
4.3Conclusions and Recommendations
This paper outlined international policy on health and water and sanitation, explained the interrelations between
water & sanitation and human health and reported a number of potentially very cost-effective but still rather costly,
interventions options to improve population health, as illustrated in three typical profile reports. Cost-effectiveness
ranges vary between US$ 200-2000 for average cost-effectiveness ratios and higher in terms of incremental ratios,
although some more promising alternatives might be more efficient. In addition, it identifies some alternative, less
costly, more sustainable water and sanitation solutions to enhance health, as cost-effective as the conventional
alternatives. These options have been proven realistic alternatives to large-scale, more common expensive options.
This study concludes that there is a need for more cost-effective, more feasible and low cost and sustainable
alternatives to enhance water health in large rural and urban areas. Although these alternatives have shown effective
and low cost in experimental, small-scale setting, large-scale implementation needs to be assessed against
economical terms, cultural and technical feasibility. Ultimately, such an assessment would lead towards practical
policy recommendations on cost-effective interventions in health and water for larger populations. A first step in this
would be they identification of a number of relevant case studies with typical profiles as illustrated. There is a policy
need at international and national levels for more practical information on cost-effective, more feasible, low cost
alternatives to enhance water health in large rural and urban areas throughout the world.
• Conclusion. The benefits arising from water supply and sanitation services include both health, economic and
environmental effects. This study focused on the public health benefits. It is recommended that impact of
investments in WSS on environmental, economic and public health effects are studied further.
Formatted: Bullets and Numbering
PAGE 44 OF47 QUICK SCAN WATER, SANITATION & HEALTH
• Conclusion. Recent policy documents address the need to improve ‘Water Supply and Sanitation’ services
improvement. Cost estimates provided in these studies (e.g. World water Vision, WHO Choice), do not foresee
in full coverage of wastewater treatment. Without integrated attention for wastewater management, improved
water supply services will worsen the already dramatic impact effluents have on fresh water quality
deterioration and on public health. It is recommended that existing costing models be reconsidered to
incorporate the cost of wastewater management services. Because of the prohibitive costs of conventional
wastewater management technology, it is recommended to consider low-cost alternatives.
• Conclusion. The results obtained via the WHO Choice model show cost ranges of 200 to 2000 US$ per DALY.
This cost range seems reasonable compared to the costs of other health interventions, but for poor regions these
costs are probably too high. The financial feasibility of different intervention options needs to be established for
developing regions. A strategic approach needs to be adopted and effective low cost technology alternatives,
especially for wastewater management, need to be considered.
• Conclusion. The goal to reduce by half in 2015 the number of people without safe water supply or appropriate
sanitation services, or to provide full coverage of these services by 2025, presents an enormous challenge for
the UN system, governments, sector professionals and sector organisations. In order to achieve this goal we
need to develop and adopt alternative innovative approaches in the WSS sector, such as the 3-SSA.
• Conclusion. An economic approach to set targets and trajectories to reach the Millennium Development Goals
is needed. This will be an important step in the selection of appropriate interventions for the various deprived
populations in the world. Cost-effectiveness analyses will show the health returns on investments i.e. the
amount of dollars needed to regain lost years due to death and disease i.e. dollars per DALY retrieved.
• Conclusion. More region-specific data are required to develop case studies in order 1) to validate WHO Choice
and 2) to develop costing and benefit component in the model for effective low-cost approaches.
QUICK SCAN WATER, SANITATION & HEALTH PAGE 45 OF 47
References
Ahmed F, Clemens JD, Rao MR and Banik AK (1994): Family latrines and paediatric Shigellosis in rural Bangladesh: benefit or risk? Int J Epi 23 4 856-862.
Ashworth A and Dowler E: Child malnutrition. Chapter 8 in: Feacham RG and Jamison DT (eds) (1991): Disease and mortality in Sub-Saharan Africa. World Bank. Oxford UP.
Bairagi R and Chowdhury MK (1994): Socio-economic and anthropometric status, and mortality of young children in rural Bangladesh, Int J Epid 23 1179-1184.
Bartecchi CE, McKenzie TD and Schrier RW (1994): The human costs of tobacco use - part I; NEJM 330 907-12.
Bartlett A III, Paz de Bocaletti ME and Bocaletti MA (1993): Reducing perinatal mortality in developing countries: high risk management or improved labor management?, Hlth Pol Plan 8 4 360-8. Binswanger HP and Landell Mills P (1995): World Bank’s strategy for reducing poverty and hunger: a report to the development community
Black, R.R., Brown, K.H. and Becker, S. (1984). Malnutrition is a determining factor in diarrheal duration and severity but not incidence, among young children in a longitudinal study in Bangladesh. American Journal of Clinical Nutrition, 39: 87-94.
Bobadilla, J. L., J. Frenk, et al. (1993). The epidemiological transition and health priorities. Disease control priorities in developing countries. D. T. Jamison, W. H. Mosley, A. R. Measham and J. L. Bobadilla. New York, Oxford Medical Publications.
Caldwell JC (1979): Education as a Factor in Mortality Decline: an examination of Nigeria data; Population Studies 1979 33 3
Caldwell JC (1986): Routes to low morbidity in poor countries, Pop Dev Rev 1986 12 2.
Caldwell, J. C. (1993). ‘Health transition: The cultural, social and behavioural determinants of health in the Third World.’ Social Science and Medicine 36: 125-135.
Cosgrove, W.J., Rijsberman, F.R. (2000). World Water Vision, Making Water Everybody’s Business. The World Water Council, Earthscan Publ. Ltd., UK, 108p
Crigg D (1989): The world food problem 1950-1980. Basic Blackwell
Dreze J and Sen A (1989): Hunger and public action. Clarendon Press, Oxford
Drummond MF, Bloom BS, Carrin G, Hillman AL, Hutchings HC, Knill-Jones RP, et al. Issues in the cross-national assessment of health technology. International Journal of Technology Assessment in Health Care 1992;8:671-82.
Drummond, MF, Stoddart GL, Torrance GW. Methods for the economic evaluation of health care programmes. Oxford: Oxford University Press, 1987.
Esrey SA, Anderson I, Hillers A, Sawyer R (2000). Closing the loop. Ecological sanitation for food security. Publications on Water Resources, Sida, 96 pp.
Esrey SA, Feacham RG and Hughes JM: Interventions for the control of diarrhoeal disease among young children: improving water supplies and excreta disposal facilities, Bull WHO 1985 63 757-72.
Esrey SA, Pothas JB, Roberts L and Shiff C: Effects of improved water supply and sanitation on ascariasis, diarrhea, dracunculiasis, hookworm infection, schistosomiasis and trachoma; Bull. WHO 1991 69 609-621.
FAO (1996). The state of food and agriculture. Rome, Food and Agriculture Organization of the United Nations.
FAO- Food and Agriculture Organisation (1992): World food supplies and the prevalence of chronic undernutrition in developing regions as assessed in 1992. Statistical Analysis Office, Statistics Division, Economic and Social Policy Department, Rome.
FAO-Food and Agriculture Organization: The fifth world food survey m- 1985. Food and Agricultural Organization of the United Nations, Rome, Italy, 1987.
Frenk, J., J. L. Bobadilla, et al. (1993). Elements for a theory of the health transition. Health and social change in international perspective. L. C. Chen, A. Kleinman and N. C. Ware. Boston, Harvard University Press.
Ghana Health Assessment Project Team: A Quantitative Method of Assessing the Health Impact of Different Diseases in Less Developed Countries (1981): Int J Epi 10(1):73-80.
PAGE 46 OF47 QUICK SCAN WATER, SANITATION & HEALTH
Gijzen, H.J. (2001a) Low cost wastewater treatment and potentials for re-use: a cleaner production approach to wastewater management. In: proceedings Intl. Symposium on low cost wastewater treatment and re-use. Cairo, Egypt, February 3-4
Gijzen, H.J. (2001b). Aerobes, anaerobes and phototrophs: a winning team for wastewater management. Wat.Sci.Technol.44(8):123-132
Gijzen HJ (in press). A 3-Step Strategic Approach to Sewage Management for Sustainable Water Resources Protection. Wat. Sci Technol.
Gijzen, H.J., Ikramullah, M (1999). Pre-feasibility of duckweed-based wastewater treatment and resource recovery in Bangladesh. World Bank Report, Washington D.C., pp194
Gijzen HJ, Veenstra S (2000). Duckweed based wastewater treatment for rational resource recovery and re-use. In: Olguin E et al. (eds). Environmental Biotechnology and Cleaner Bioprocesses, Taylor & Francis, 83-100
Grau, P. (1994). What’s next? Wat. Qual. Intl., no.4: 29-32
Gunning-Schepers LJ (1989): The health benefits of prevention; Health Policy 12:93A-129A.
Heerink N (1994): Population growth, income distribution, and economic development. Theory, methodology and empirical results. Population Economics Series. Springer Verlag.
Hilderink, H. B. M. (2000). World population in transition: an integrated regional modelling framework. Amsterdam, Thela Thesis / Rozenberg.
Van Hoek, Konradsen and Jehangi (1999) in World Water Vision, Making water everybody’s business. World Water Council, Earthscan Publications, Ltd, London
IIED (2000) in World water Vision, Making water everybody’s business. World Water Council, Earthscan Publications, Ltd, London
Ince, M. (1999), Water and Environmental Health, Water Engineering Development Centre, Loughborough, UK
Johannesson M. The relationship between cost effectiveness analysis and cost benefit analysis. Soc Sci Med 1995;41:483-9.
Kielmann, A.A. and McCord, C. (1978): Weight for age as an index of risk of death in children. Lancet 1: 1247-1250.
Lier J.B van Lettinga G (1999) Appropriate technologies for effective management of industrial and domestic wastewaters; the decentralised approach, Water Science Technology 40, 171-184
Lim Chong-Yah (1991): Development and underdevelopment. Longman. Singapore.
Mackenbach, J. P. (1994). The epidemiologic transition theory. J Epidemiological Community Health 48(4): 329-331.
Martens WJM, Niessen LW, Rotmans J, Jetten TH and McMichael AJ (1995): Potential impact of global climate change on malaria risk, Environmental Health Perspectives 103 5 458-464.
Moreland S (1984): Population, development and income distribution - a modelling approach. ILO. St.Martin’s Press. New York.
Mosley WH and Cowley P (1991): The challenge of world health, Population Bulletin 46: 2-39
Murray CJL and Lopez AD (1994): Quantifying disability: data, methods and results; Bull WHO 72: 447-80.
Najman, J. M. (1993). ‘Health and poverty: past, present and prospects for the future.’ Social science and medicine 36(2): 157-166.
Niessen, L. W. (20023). Roads to health: multi-state modelling of population health and resource use. Amsterdam, Dutch University Press.
Niessen, L. W. and H. B. M. Hilderink (1997). The population and health submodel. Perspectives on global change: the TARGETS approach. J. Rotmans and B. J. M. de Vries. Cambridge, Cambridge University Press: 55-82. Cambridge UP. ISBN 0 521 62176.
Olshansky, S. J., M. A. Rudberg, et al. (1991):Trading off longer life for worsening health: the expansion of morbidity hypothesis. Journal of aging and health 3: 194-216.
Omran, A. R. (1983). ‘The epidemiological transition, a preliminary update.’ Journal of Tropical Pediatrics 29: 305-316.
Parsonage M, Neuburger H. Discounting and health benefits. Health Economics 1992;1:71-6.
Pelletier DL, Frongillo EA and Habicht JP (1993). Epidemiological evidence for a potentiating effect of malnutrition on child mortality. American Journal of Public Health, 83(8): 1130-1133.
Pelletier DL, Frongillo EA Schroeder DG and Habicht JP (1995): The effects of malnutrition on child mortality in developing countries, Bull WHO 73 443-448.
QUICK SCAN WATER, SANITATION & HEALTH PAGE 47 OF 47
Pinstrop-Andersen P and Pandya-Lorch R (1995): Alleviating poverty, intensifying agriculture and effectively managing natural resources. Food, Agriculture and the Environment Discussion Paper. International Food Policy Research Institute, Washington.
Pinstrop-Anderson P, Burger S, Habicht JP and Peterson K (1993): Protein-energy malnutrition. Chapter 18 in: Jamison DT, Mosley WH, Measham AR and Bobadilla JL (eds): Disease control priorities in developing countries. Oxford Publications, New York.
Pruss A, Kay D, Fewtrell L and Bartram J (2002): Estimating the burden of Disease from Water, Sanitation, and Hygiene at a Global Level, Environmental Health Perspectives 110 5 537-42.
Rose G (1992): The Strategy of Preventive Medicine. Oxford Medical Publications. OUP.
Ruwaard D, Kramers PGN, Berg Jetts van de A and Achterberg PW (eds) (1994): Public Health Status and Forecast: - the health status of the Dutch population over the period 1950-2010 SDU, The Hague.
Sai FT and Nassim J (1991): Mortality in Sub-Saharan Africa: an overview. Chapter 2 in: Feacham RG and Jamison DT (eds): (Disease and mortality in Sub-Saharan Africa. World Bank. Oxford UP.
Schofield R, Reher D and Bideau (1991): The decline of mortality in Europe. International Studies in Demography. Clarendon Press. Oxford
Task Force on Principles for Economic Analysis of Health Care Technology. Economic analysis of health care technology. A report on principles. Ann Intern Med 1995;123:61-70.
UNDP- (1993) UN Development Programme: Human Development Report. Oxford UP.
UNEP (1997): Global Environmental Outlook. First World Environment Report. Oxford University Press.
UNEP/GPA (2000). Strategy options for sewage management to protect the marine environment. Report produced by IHE-Delft for UNEP/GPA, November 2000, pp102
Walle vander E, Pison G and Sala-Diakanda M (1992): Mortality and society in Sub-Saharan Africa. International Studies in Demography. Clarendon Press. Oxford
Water and Sanitation Collaborative Council (2003), WASH Facts and Figures, http://www.wsscc.org/
Walter SD (1976): The estimation and interpretation of attributive risk in health research; Biometrics 32:829-849.
Winkelstein W (1993): Determinants of worldwide health, Am J Public Health 82 931-2.
World Bank (1992) Environmental Assessment Sourcebook – Volumes I and II, World Bank Technical Paper 140
World Bank (1993): Investing in Health - World Development Report. Oxford UP, New York.
World Health Organisation (1996). World Health Report 1996: Fighting diseasefostering development. Geneva, World Health Organization. Oxford University Press.
WHO / UNEP (1997) Water Pollution Control – A guide to the Use of Water Quality Management Principles
World Health Organisation (1999). World Health Report 1999, Making a difference. Geneva, World Health Organization. Oxford University Press.
World Health Organisation / UNICEF (2000). Global Water Supply and Sanitation. Assessment 2000 Report. Geneva, World health Organisation
World Health Organization (2000): World Health Report. Oxford University Press.
World Health Organization (2002): World Health Report. Reducing health risk, promoting healthy lives. Oxford University Press.
World Resources Institute (1995): World Resources 1995. Oxford UP, New York.