Lattice models of polycrystalline microstructures: A quantitative approach
Upload
independentCategory
view
6download
0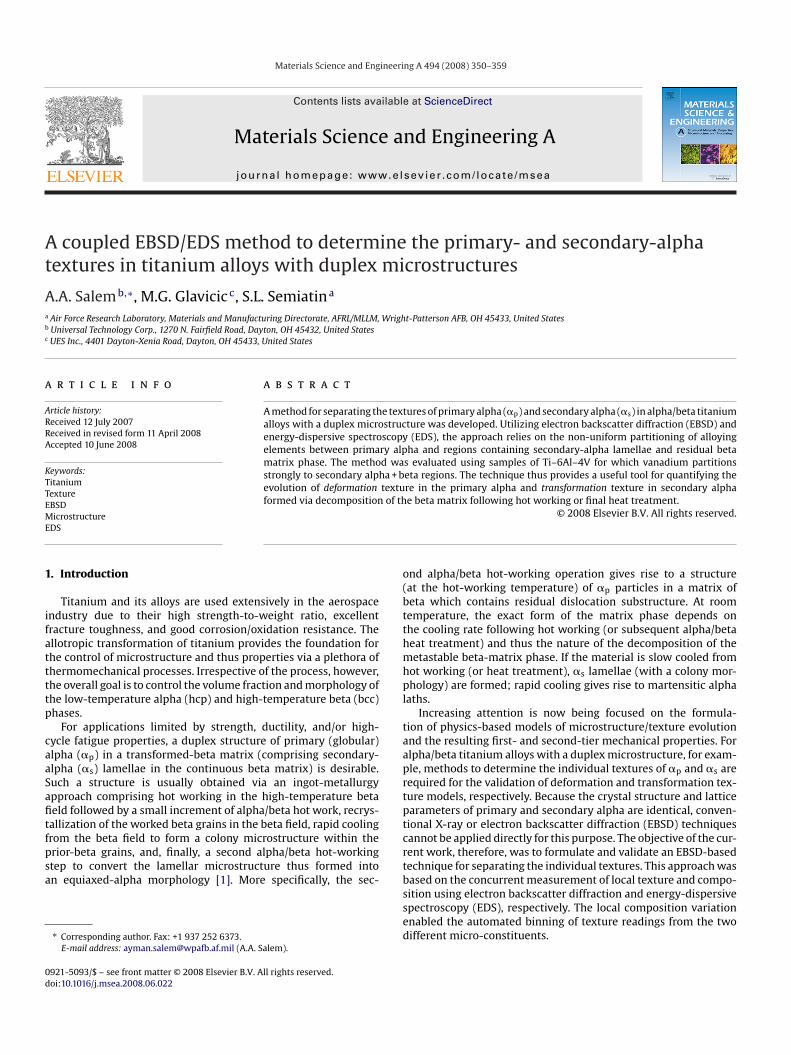
Materials Science and Engineering A 494 (2008) 350–359
Contents lists available at ScienceDirect
Materials Science and Engineering A
journa l homepage: www.e lsev ier .com/ locate /msea
A coupled EBSD/EDS method to determine the primary- and secondary-alphatextures in titanium alloys with duplex microstructures
A.A. Salemb,∗, M.G. Glavicicc, S.L. Semiatina
a Air Force Research Laboratory, Materials and Manufacturing Directorate, AFRL/MLLM, Wright-Patterson AFB, OH 45433, United Statesb Universal Technology Corp., 1270 N. Fairfield Road, Dayton, OH 45432, United Statesc UES Inc., 4401 Dayton-Xenia Road, Dayton, OH 45433, United States
a r t i c l e i n f o
Article history:Received 12 July 2007Received in revised form 11 April 2008Accepted 10 June 2008
Keywords:
a b s t r a c t
A method for separating the textures of primary alpha (�p) and secondary alpha (�s) in alpha/beta titaniumalloys with a duplex microstructure was developed. Utilizing electron backscatter diffraction (EBSD) andenergy-dispersive spectroscopy (EDS), the approach relies on the non-uniform partitioning of alloyingelements between primary alpha and regions containing secondary-alpha lamellae and residual betamatrix phase. The method was evaluated using samples of Ti–6Al–4V for which vanadium partitionsstrongly to secondary alpha + beta regions. The technique thus provides a useful tool for quantifying the
TitaniumTextureEME
evolution of deformation texture in the primary alpha and transformation texture in secondary alphaformed via decomposition of the beta matrix following hot working or final heat treatment.
1
ifattttp
caaSafitfpsa
o(btthmhpl
taaprtpt
0d
BSDicrostructure
DS
. Introduction
Titanium and its alloys are used extensively in the aerospacendustry due to their high strength-to-weight ratio, excellentracture toughness, and good corrosion/oxidation resistance. Thellotropic transformation of titanium provides the foundation forhe control of microstructure and thus properties via a plethora ofhermomechanical processes. Irrespective of the process, however,he overall goal is to control the volume fraction and morphology ofhe low-temperature alpha (hcp) and high-temperature beta (bcc)hases.
For applications limited by strength, ductility, and/or high-ycle fatigue properties, a duplex structure of primary (globular)lpha (�p) in a transformed-beta matrix (comprising secondary-lpha (�s) lamellae in the continuous beta matrix) is desirable.uch a structure is usually obtained via an ingot-metallurgypproach comprising hot working in the high-temperature betaeld followed by a small increment of alpha/beta hot work, recrys-allization of the worked beta grains in the beta field, rapid cooling
rom the beta field to form a colony microstructure within therior-beta grains, and, finally, a second alpha/beta hot-workingtep to convert the lamellar microstructure thus formed inton equiaxed-alpha morphology [1]. More specifically, the sec-∗ Corresponding author. Fax: +1 937 252 6373.E-mail address: [email protected] (A.A. Salem).
crtbssed
921-5093/$ – see front matter © 2008 Elsevier B.V. All rights reserved.oi:10.1016/j.msea.2008.06.022
© 2008 Elsevier B.V. All rights reserved.
nd alpha/beta hot-working operation gives rise to a structureat the hot-working temperature) of �p particles in a matrix ofeta which contains residual dislocation substructure. At roomemperature, the exact form of the matrix phase depends onhe cooling rate following hot working (or subsequent alpha/betaeat treatment) and thus the nature of the decomposition of theetastable beta-matrix phase. If the material is slow cooled from
ot working (or heat treatment), �s lamellae (with a colony mor-hology) are formed; rapid cooling gives rise to martensitic alpha
aths.Increasing attention is now being focused on the formula-
ion of physics-based models of microstructure/texture evolutionnd the resulting first- and second-tier mechanical properties. Forlpha/beta titanium alloys with a duplex microstructure, for exam-le, methods to determine the individual textures of �p and �s areequired for the validation of deformation and transformation tex-ure models, respectively. Because the crystal structure and latticearameters of primary and secondary alpha are identical, conven-ional X-ray or electron backscatter diffraction (EBSD) techniquesannot be applied directly for this purpose. The objective of the cur-ent work, therefore, was to formulate and validate an EBSD-basedechnique for separating the individual textures. This approach was
ased on the concurrent measurement of local texture and compo-ition using electron backscatter diffraction and energy-dispersivepectroscopy (EDS), respectively. The local composition variationnabled the automated binning of texture readings from the twoifferent micro-constituents.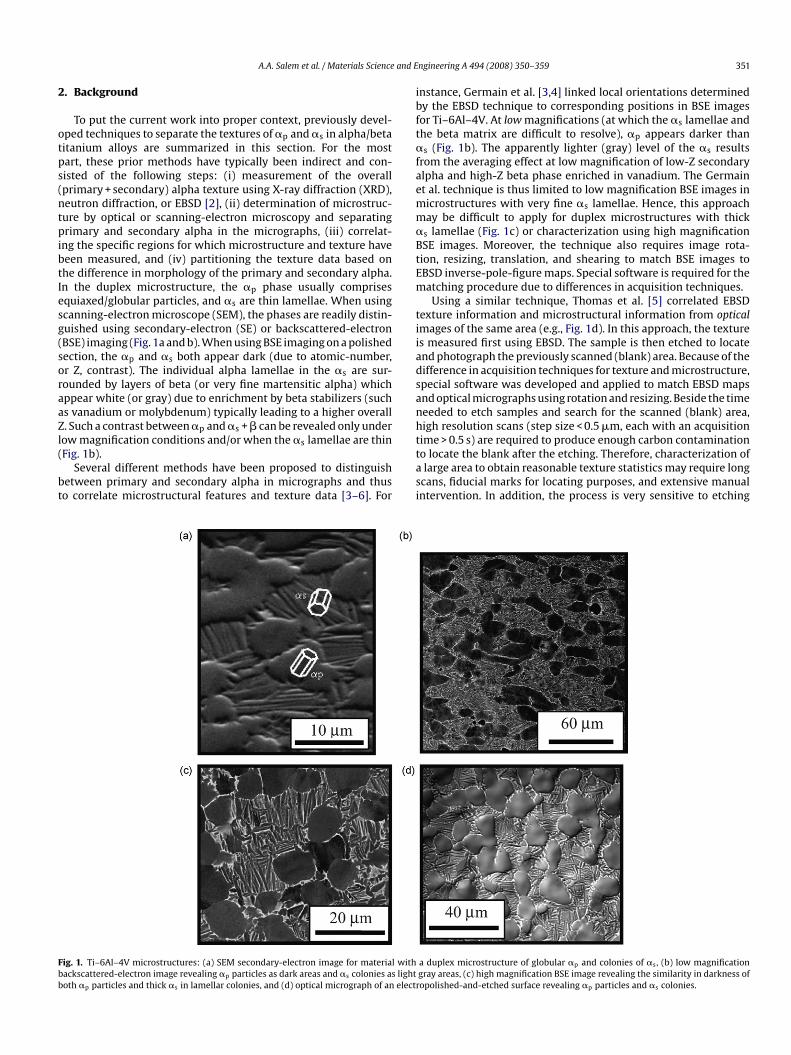
and E
2
otps(ntpibtIesg(soraaZl(
bt
ibft�faemm�BtEm
tiiadsanh
Fbb
A.A. Salem et al. / Materials Science
. Background
To put the current work into proper context, previously devel-ped techniques to separate the textures of �p and �s in alpha/betaitanium alloys are summarized in this section. For the mostart, these prior methods have typically been indirect and con-isted of the following steps: (i) measurement of the overallprimary + secondary) alpha texture using X-ray diffraction (XRD),eutron diffraction, or EBSD [2], (ii) determination of microstruc-ure by optical or scanning-electron microscopy and separatingrimary and secondary alpha in the micrographs, (iii) correlat-
ng the specific regions for which microstructure and texture haveeen measured, and (iv) partitioning the texture data based onhe difference in morphology of the primary and secondary alpha.n the duplex microstructure, the �p phase usually comprisesquiaxed/globular particles, and �s are thin lamellae. When usingcanning-electron microscope (SEM), the phases are readily distin-uished using secondary-electron (SE) or backscattered-electronBSE) imaging (Fig. 1a and b). When using BSE imaging on a polishedection, the �p and �s both appear dark (due to atomic-number,r Z, contrast). The individual alpha lamellae in the �s are sur-ounded by layers of beta (or very fine martensitic alpha) whichppear white (or gray) due to enrichment by beta stabilizers (suchs vanadium or molybdenum) typically leading to a higher overall. Such a contrast between �p and �s + � can be revealed only under
ow magnification conditions and/or when the �s lamellae are thinFig. 1b).Several different methods have been proposed to distinguishetween primary and secondary alpha in micrographs and thuso correlate microstructural features and texture data [3–6]. For
ttasi
ig. 1. Ti–6Al–4V microstructures: (a) SEM secondary-electron image for material withackscattered-electron image revealing �p particles as dark areas and �s colonies as lightoth �p particles and thick �s in lamellar colonies, and (d) optical micrograph of an electr
ngineering A 494 (2008) 350–359 351
nstance, Germain et al. [3,4] linked local orientations determinedy the EBSD technique to corresponding positions in BSE imagesor Ti–6Al–4V. At low magnifications (at which the �s lamellae andhe beta matrix are difficult to resolve), �p appears darker thans (Fig. 1b). The apparently lighter (gray) level of the �s results
rom the averaging effect at low magnification of low-Z secondarylpha and high-Z beta phase enriched in vanadium. The Germaint al. technique is thus limited to low magnification BSE images inicrostructures with very fine �s lamellae. Hence, this approachay be difficult to apply for duplex microstructures with thick
s lamellae (Fig. 1c) or characterization using high magnificationSE images. Moreover, the technique also requires image rota-ion, resizing, translation, and shearing to match BSE images toBSD inverse-pole-figure maps. Special software is required for theatching procedure due to differences in acquisition techniques.Using a similar technique, Thomas et al. [5] correlated EBSD
exture information and microstructural information from opticalmages of the same area (e.g., Fig. 1d). In this approach, the textures measured first using EBSD. The sample is then etched to locatend photograph the previously scanned (blank) area. Because of theifference in acquisition techniques for texture and microstructure,pecial software was developed and applied to match EBSD mapsnd optical micrographs using rotation and resizing. Beside the timeeeded to etch samples and search for the scanned (blank) area,igh resolution scans (step size < 0.5 �m, each with an acquisition
ime > 0.5 s) are required to produce enough carbon contaminationo locate the blank after the etching. Therefore, characterization oflarge area to obtain reasonable texture statistics may require longcans, fiducial marks for locating purposes, and extensive manualntervention. In addition, the process is very sensitive to etching
a duplex microstructure of globular �p and colonies of �s, (b) low magnificationgray areas, (c) high magnification BSE image revealing the similarity in darkness ofopolished-and-etched surface revealing �p particles and �s colonies.
352 A.A. Salem et al. / Materials Science and Engineering A 494 (2008) 350–359
pitaxi
te
ett(tetobsmuttph
3
seiaslc(ftcmpi[
3
esc(
it
3
Tsqc
wfssaatm7wu
ls8ms
tppwam(podCw
Fig. 2. SEM BSE images of hot-rolled Ti–6Al–4V: (a) as-deformed, and (b) after e
ime; i.e., the marks left by the scanning process are lost if thetching time is too long.
To overcome some of shortcomings of other methods, Glavicict al. [6] suggested an indirect technique involving a heat treatmento eliminate the �s phase. In this approach, X-ray diffraction is usedo measure the total (�p + �s) texture of the duplex microstructureFig. 2a). The separate �p texture is then determined on a portion ofhe sample which has been solution treated at a temperature highnough in the two-phase field to dissolve the �s and slow cooledo promote growth of the primary alpha without decompositionf the beta matrix (e.g., Fig. 2b). The texture of the �p (weightedy its volume fraction in the initial duplex microstructure) is thenubtracted from the �p + �s texture. The major shortcoming of thisethod concerns the implicit assumption that the heat treatment
sed to obtain the microstructure with only �p particles maintainshe original texture of this phase; in other words, it is assumedhat there is (a) no recrystallization or (b) preferential growth ofarticles with either different amounts of stored work from priorot-working operations or different texture components.
. Materials and experimental procedures
The present method to separate the textures of primary andecondary alpha was developed to overcome the shortcomings ofarlier techniques. In brief, the approach is based on simultaneous,n situ measurements of local orientation and composition withinn SEM and eliminates the need for additional heat treatments orpecial post-processing software. Specifically, Kikuchi patterns andocal composition data for the alpha phase are collected automati-ally inside an SEM using EBSD and energy-dispersive spectroscopyEDS) detectors, respectively, for each point on the sample sur-ace scanned by the electron beam. For this purpose, it is criticalhat both detectors be located on the same side of the microscopehamber (facing the surface of the sample), thus ensuring that botheasurements are synchronized and come from the same material
oint during the scanning process. Texture is determined by off-linendexing of the Kikuchi patterns using OIM® data-analysis software7].
.1. Material
Ti–6Al–4V was used to establish the usefulness of the newxperimental technique for separating the textures of primary andecondary alpha, �p and �s, respectively. The as-received materialomprised a 32-mm-thick plate having a measured compositionin weight pct.) of 6.15 aluminum, 3.9 vanadium, 0.20 oxygen, 0.21
rsrsa
al growth of the �p particles via furnace cooling from the solution temperature.
ron, 0.008 nitrogen, 0.01 carbon, 0.0031 hydrogen, and balanceitanium.
.2. Experimental procedures
To establish baseline microstructure and texture data, thei–6Al–4V program material was heated to 955 ◦C for 4 h (to dis-olve all �s lamellae from prior processing) and then either wateruenched (WQ) (to preserve the �p texture at 955 ◦C) or furnaceooled to grow a microstructure comprising solely �p particles.
Pre-forms of the heat-treated-and-furnace-cooled materialere hot rolled at 955 ◦C to a 3:1 reduction (effective strain of 1.15)
ollowed by air cooling. To determine microstructures and textures,amples of the unrolled materials and the hot-rolled plate wereectioned along the midplane, ground, and lightly electropolishedt −20 ◦C in a solution of 590 ml methanol and 60 ml perchloriccid. Following electropolishing, each sample was mounted on theilting stage inside an XL30 field-emission-gun scanning-electron-
icroscope (FEG-SEM). The microscope was operated at 20 kV andnA with the stage tilted at an inclination of 70◦. The EDS detectoras fully retracted to avoid overexposure due to the large currentsed to collect the EBSD data.
Local Kikuchi patterns and chemical composition were col-ected using EBSD and EDS systems from EDAX [7]. A 0.3-�mtep size at 50 s/frame was used to cover an area measuring0 �m × 120 �m. Different step sizes and larger areas (within theaximum of 25 mm × 50 mm associated with the microscope con-
truction) were also utilized.The texture results from the present technique were compared
o those obtained using the X-ray diffraction approach developedreviously by Glavicic et al. [6]. For this purpose, an additional sam-le was removed from the hot-rolled Ti–6Al–4V plate. The pieceas cut into two equal sections. One half was analyzed in the
s-hot-rolled condition (Fig. 2a). The other was given a heat treat-ent to produce an alpha microstructure that was fully globular
Fig. 2b); i.e., it was annealed at 960 ◦C (just above the rolling tem-erature) for 1 h followed by furnace cooling. The volume fractionf primary alpha in the as-hot-rolled duplex microstructure wasetermined by analysis of BSE micrographs (Fig. 2a) taken in a Leica-ambridge Stereoscan 360 FEG-SEM. Subsequently, both piecesere prepared for XRD on the RD-TD plane (at the midplane) of the
olled plate using standard metallographic techniques. XRD mea-urements were conducted using Cu K� radiation from an 18 kWotating anode source, and textures were determined from mea-urements of partial (1 0 1̄ 0), (0 0 0 2), (1 0 1̄ 1), (1 0 2̄ 1), and (1 1 2̄ 0)lpha-phase pole figures. In addition, partial (1 1 0) and (2 0 0) beta-
and E
p�pfp
4
4
twttlp
iprpt
HOigwFi�o
4
amwam
Frm
A.A. Salem et al. / Materials Science
hase pole figures were determined to enable a comparison of thes texture and the texture of the parent beta phase. The partialole figures were completed using the orientation-distribution-unction (ODF) analysis software in popLA (preferred orientationackage from Los Alamos National Laboratory) [8].
. Results and discussion
.1. Microstructure observations for hot-rolled Ti–6Al–4V
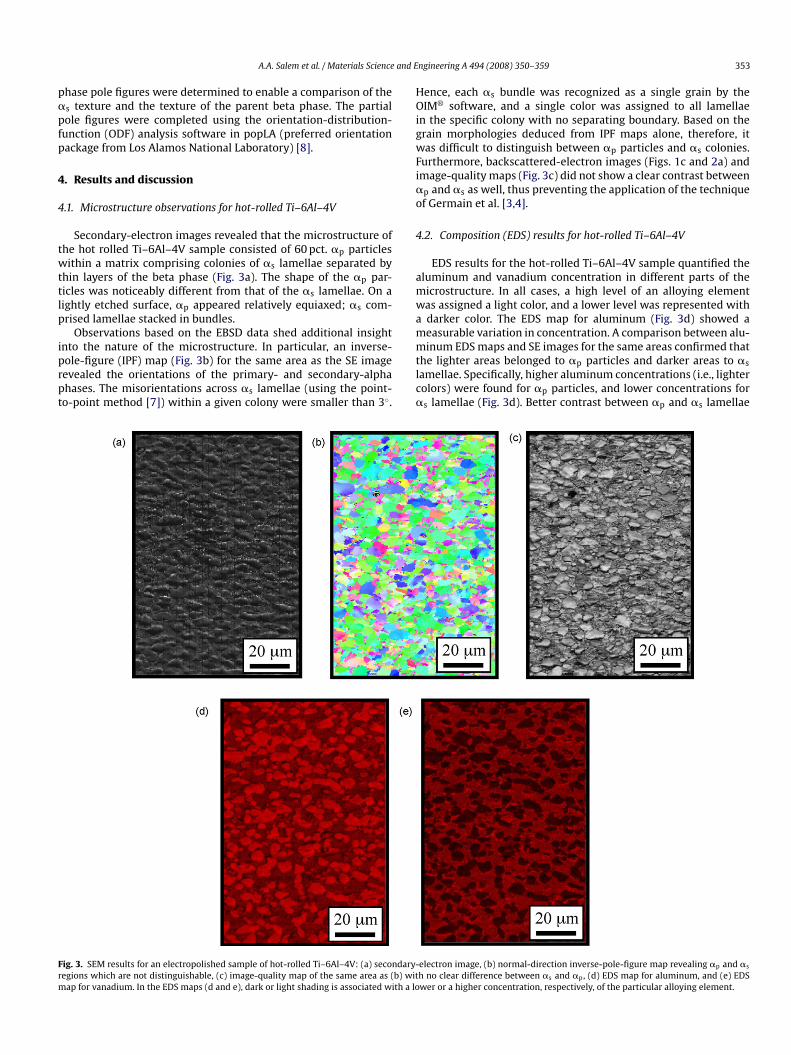
Secondary-electron images revealed that the microstructure ofhe hot rolled Ti–6Al–4V sample consisted of 60 pct. �p particlesithin a matrix comprising colonies of �s lamellae separated by
hin layers of the beta phase (Fig. 3a). The shape of the �p par-icles was noticeably different from that of the �s lamellae. On aightly etched surface, �p appeared relatively equiaxed; �s com-rised lamellae stacked in bundles.
Observations based on the EBSD data shed additional insight
nto the nature of the microstructure. In particular, an inverse-ole-figure (IPF) map (Fig. 3b) for the same area as the SE imageevealed the orientations of the primary- and secondary-alphahases. The misorientations across �s lamellae (using the point-o-point method [7]) within a given colony were smaller than 3◦.mtlc�
ig. 3. SEM results for an electropolished sample of hot-rolled Ti–6Al–4V: (a) secondary-egions which are not distinguishable, (c) image-quality map of the same area as (b) witap for vanadium. In the EDS maps (d and e), dark or light shading is associated with a lo
ngineering A 494 (2008) 350–359 353
ence, each �s bundle was recognized as a single grain by theIM® software, and a single color was assigned to all lamellae
n the specific colony with no separating boundary. Based on therain morphologies deduced from IPF maps alone, therefore, itas difficult to distinguish between �p particles and �s colonies.
urthermore, backscattered-electron images (Figs. 1c and 2a) andmage-quality maps (Fig. 3c) did not show a clear contrast between
p and �s as well, thus preventing the application of the techniquef Germain et al. [3,4].
.2. Composition (EDS) results for hot-rolled Ti–6Al–4V
EDS results for the hot-rolled Ti–6Al–4V sample quantified theluminum and vanadium concentration in different parts of theicrostructure. In all cases, a high level of an alloying elementas assigned a light color, and a lower level was represented withdarker color. The EDS map for aluminum (Fig. 3d) showed aeasurable variation in concentration. A comparison between alu-
inum EDS maps and SE images for the same areas confirmed thathe lighter areas belonged to �p particles and darker areas to �s
amellae. Specifically, higher aluminum concentrations (i.e., lighterolors) were found for �p particles, and lower concentrations fors lamellae (Fig. 3d). Better contrast between �p and �s lamellae
electron image, (b) normal-direction inverse-pole-figure map revealing �p and �s
h no clear difference between �s and �p, (d) EDS map for aluminum, and (e) EDSwer or a higher concentration, respectively, of the particular alloying element.
354 A.A. Salem et al. / Materials Science and Engineering A 494 (2008) 350–359
F histb
wda
te[vaTepba
sal�fttminIhst
risyun�ti
4
taT�ooeaaa�
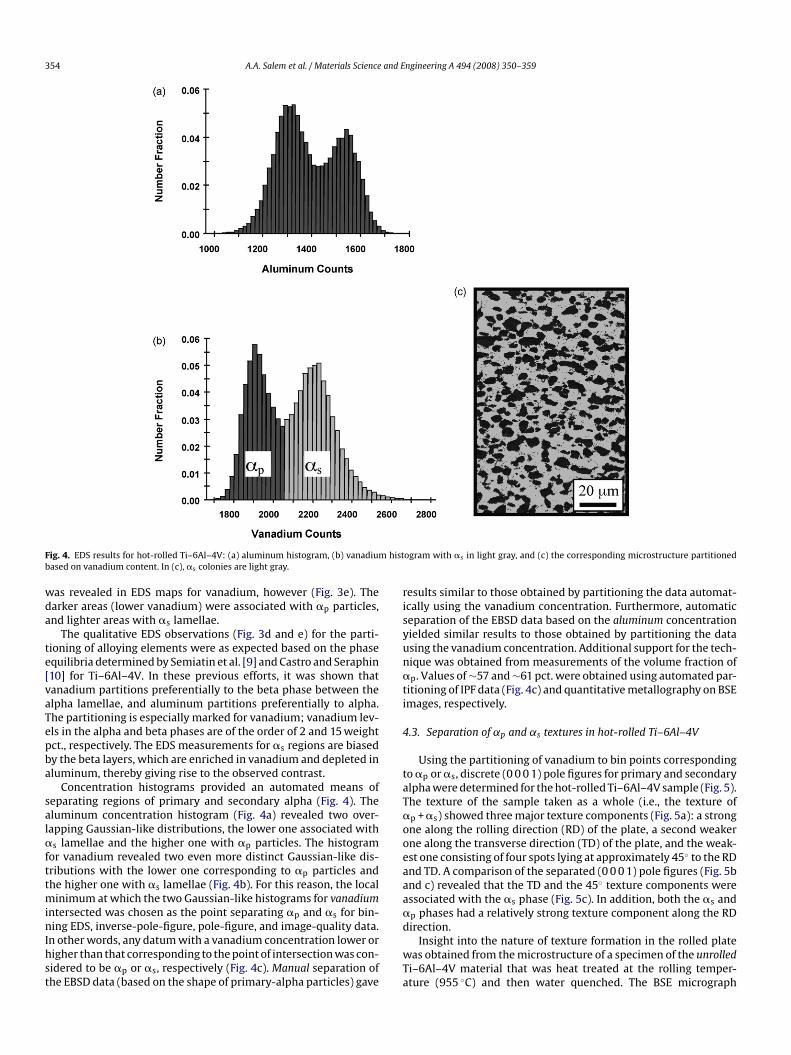
ig. 4. EDS results for hot-rolled Ti–6Al–4V: (a) aluminum histogram, (b) vanadiumased on vanadium content. In (c), �s colonies are light gray.
as revealed in EDS maps for vanadium, however (Fig. 3e). Thearker areas (lower vanadium) were associated with �p particles,nd lighter areas with �s lamellae.
The qualitative EDS observations (Fig. 3d and e) for the parti-ioning of alloying elements were as expected based on the phasequilibria determined by Semiatin et al. [9] and Castro and Seraphin10] for Ti–6Al–4V. In these previous efforts, it was shown thatanadium partitions preferentially to the beta phase between thelpha lamellae, and aluminum partitions preferentially to alpha.he partitioning is especially marked for vanadium; vanadium lev-ls in the alpha and beta phases are of the order of 2 and 15 weightct., respectively. The EDS measurements for �s regions are biasedy the beta layers, which are enriched in vanadium and depleted inluminum, thereby giving rise to the observed contrast.
Concentration histograms provided an automated means ofeparating regions of primary and secondary alpha (Fig. 4). Theluminum concentration histogram (Fig. 4a) revealed two over-apping Gaussian-like distributions, the lower one associated with
s lamellae and the higher one with �p particles. The histogramor vanadium revealed two even more distinct Gaussian-like dis-ributions with the lower one corresponding to �p particles andhe higher one with �s lamellae (Fig. 4b). For this reason, the local
inimum at which the two Gaussian-like histograms for vanadiumntersected was chosen as the point separating �p and �s for bin-
ing EDS, inverse-pole-figure, pole-figure, and image-quality data.n other words, any datum with a vanadium concentration lower origher than that corresponding to the point of intersection was con-idered to be �p or �s, respectively (Fig. 4c). Manual separation ofhe EBSD data (based on the shape of primary-alpha particles) gave
d
wTa
ogram with �s in light gray, and (c) the corresponding microstructure partitioned
esults similar to those obtained by partitioning the data automat-cally using the vanadium concentration. Furthermore, automaticeparation of the EBSD data based on the aluminum concentrationielded similar results to those obtained by partitioning the datasing the vanadium concentration. Additional support for the tech-ique was obtained from measurements of the volume fraction ofp. Values of ∼57 and ∼61 pct. were obtained using automated par-
itioning of IPF data (Fig. 4c) and quantitative metallography on BSEmages, respectively.
.3. Separation of ˛p and ˛s textures in hot-rolled Ti–6Al–4V
Using the partitioning of vanadium to bin points correspondingo �p or �s, discrete (0 0 0 1) pole figures for primary and secondarylpha were determined for the hot-rolled Ti–6Al–4V sample (Fig. 5).he texture of the sample taken as a whole (i.e., the texture ofp + �s) showed three major texture components (Fig. 5a): a strongne along the rolling direction (RD) of the plate, a second weakerne along the transverse direction (TD) of the plate, and the weak-st one consisting of four spots lying at approximately 45◦ to the RDnd TD. A comparison of the separated (0 0 0 1) pole figures (Fig. 5bnd c) revealed that the TD and the 45◦ texture components weressociated with the �s phase (Fig. 5c). In addition, both the �s andp phases had a relatively strong texture component along the RD
irection.Insight into the nature of texture formation in the rolled plateas obtained from the microstructure of a specimen of the unrolled
i–6Al–4V material that was heat treated at the rolling temper-ture (955 ◦C) and then water quenched. The BSE micrograph

A.A. Salem et al. / Materials Science and Engineering A 494 (2008) 350–359 355
F he EBa
o∼ttmsfohs
4
at{cv4eio
Fff
c[baiEepafilt[
4
ow
ig. 5. Alpha-phase (0 0 0 1) pole figures for hot-rolled Ti–6Al–4V determined by tnd (c) �s colonies.
f the unrolled Ti–6Al–4V material (Fig. 6) indicated that only30 pct. of the microstructure was �p at the rolling tempera-
ure. Due to the small amount of �p at 955 ◦C, the majority ofhe strain imposed during the rolling process at 955 ◦C was thus
ost likely accommodated by the beta phase [11]. Hence, onlymall changes in the �p texture relative to that in the unde-ormed material would be expected due to deformation. On thether hand, the �s texture formed as a result of decomposition ofeavily worked beta. The aspects are discussed in the followingections.
.4. Interpretation of beta-phase texture in hot-rolled Ti–6Al–4V
XRD measurements for the beta phase retained at room temper-ture in the hot-rolled Ti–6Al–4V plate (Fig. 7) revealed a moderateexture. The ODF consisted of a (45◦, 0◦, 0◦) component and a1 1 1} 〈u v w〉 fiber (so-called � fiber in rolled bcc metals) [2]. Theurrent measurements are in good agreement with previous obser-ations for hot rolled Ti–6Al–4V [12]. As mentioned in Section
.3, a moderate-to-strong deformation texture might have beenxpected in the beta phase because it accommodates most of themposed deformation during rolling at 955 ◦C. The decompositionf beta to form �s (plus a small amount of retained beta) typi-ig. 6. Backscattered-electron image of the microstructure developed in unde-ormed Ti–6Al–4V during solution treatment at the rolling temperature (955 ◦C)ollowed by water quenching.
GdttHtErmR
F
SD/EDS technique and vanadium partitioning: (a) �p + �s texture, (b) �p particles,
ally follows the Burger relationship ((0 0 0 1)� parallel to (1 0 1)�13]). As a result, the (0 0 0 1)˛s
and (1 0 1)� pole figures woulde expected to be similar, as was indeed observed (i.e., Figs. 5cnd 7a). The similar locations of the different texture componentsn these pole figures provided support for the usefulness of theBSD/EDS technique. However, there were some noticeable differ-nces in the intensity of different components. The XRD (1 0 1)�ole figure showed high intensities at the 45◦ location as wells at the RD and TD locations. By contrast, the �s (0 0 0 1) polegure showed the highest intensity at the TD direction and the
owest at 45◦. Such differences are most likely related to preferen-ial variant selection during the decomposition of the beta phase12].
.5. Comparison of EBSD/EDS and XRD methods
Results from the EBSD/EDS method for separating the texturesf primary and secondary alpha in the hot-rolled Ti–6Al–4V plateere compared with those obtained using the XRD method oflavicic et al. [6]. The overall texture of the � phase (�p + �s) wasetermined via XRD from the same sample used for the EBSD/EDSechnique. The (0 0 0 1) pole figure for this sample (Fig. 8a) showedhe same three components as in the EBSD/EDS measurement.owever, the magnitude of the XRD TD component was greater
han that of the RD component, in contrast to the findings from the
BSD/EDS measurement (Fig. 5a). Furthermore, the texture of theolled sample heat treated at 955 ◦C and furnace cooled to obtain aicrostructure of equiaxed alpha (Fig. 8b) exhibited a very strongD component (∼2.5 times as strong as the EBSD/EDS measure-
ig. 7. Beta-phase (1 1 0) pole figure for hot-rolled Ti–6Al–4V determined by XRD.

356 A.A. Salem et al. / Materials Science and Engineering A 494 (2008) 350–359
F g thet
ma�fwss
tboitepatTasvi
cttml
4
�ptdrb(
mwvotqscr
tnt
Fo
ig. 8. Alpha-phase (0 0 0 1) pole figures for hot-rolled Ti–6Al–4V determined usinexture, and (c) calculated �s texture.
ent) as well as very weak TD and 45◦ components which had beenbsent in the EBSD/EDS case. By subtracting the measured XRDp texture (weighted by its volume fraction in the rolled sample)
rom the XRD �p + �s measurement, an estimate of the �s textureas obtained (Fig. 8c). The XRD (0 0 0 1) pole figure so determined
howed moderate TD and 45◦ components as did the EBSD/EDSample, but lacked the RD component.
Several sources of the difference in the EBSD/EDS and XRD tex-ures can be postulated. These factors include the overlap of theeta- and alpha-phase peaks in XRD data and the possible growthf different �p components during the heat treatment process usedn the Glavicic et al. method to obtain the �p texture. With regard tohe first possibility, the (1 1 0) pole figure of the beta phase may bexpected to be superimposed on and thus “contaminate” (0 0 0 1)ole-figure data for the alpha phase in Ti–6Al–4V (for �p + �s as wells �p) due to the proximity of the (1 1 0)� and (0 0 0 1)� diffrac-ion peaks [14,15]. This contamination may be the source of theD and 45◦ components in the XRD �p (0 0 0 1) pole figure, whichre not found in the EBSD/EDS measurement. From a quantitativetandpoint, however, the degree of contamination depends on theolume fraction and relative strength of the texture of beta retainedn Ti–6Al–4V at room temperature (∼6 pct.).
The high intensity along the TD in the XRD �p pole figureompared to that for the EBSD/EDS pole figure may be due to
he preferential growth of a weak �p texture component alonghe TD during furnace cooling to produce a fully equiaxed alphaicrostructure. Evidence for such an effect is presented in the fol-owing section.
(sKw
ig. 9. SEM BSE images of the microstructure developed in the unrolled Ti–6Al–4V prograr (b) furnace cooling.
XRD technique of Glavicic et al. [6]: (a) measured �p + �s texture, (b) measured �p
.6. Effect of slow cooling on preferential growth of primary alpha
The major assumption of the XRD method to separate the �p ands textures [6] is that the �p texture is preserved during high tem-erature solution treatment of the �s and subsequent slow coolinghat gives rise to epitaxial growth of the �p. However, observedifferences between the room-temperature �p texture of the hot-olled Ti–6Al–4V determined by EBSD (Fig. 5b) and that measuredy XRD on a sample slow cooled following solution treatmentFig. 8b) cast doubt on this assumption.
The microstructure and texture of unrolled Ti–6Al–4V programaterial after a 4-h heat treatment 955 ◦C followed by eitherater quenching or furnace cooling to room temperature pro-
ided needed insight into this assumption and the possible growthf weak �p texture components during slow cooling from high-emperature solution treatment. The microstructure of the wateruenched sample, for example, revealed 30 pct. �p particles (dark)urrounded by martensite (Fig. 9a). On the other hand, the furnace-ooled (FC) sample revealed 93 pct. �p Particles in a matrix ofetained beta (Fig. 9b).
The EBSD technique was used to determine the �p texture ofhe unrolled FC sample. However, an alternate EBSD binning tech-ique using image-quality (IQ) maps was found to be necessary forhe unrolled WQ sample which contained a large volume fraction
∼70 pct.) of martensite. The high dislocation density in marten-itic alpha results in a very low IQ during the indexing of EBSDikutchi patterns. For the WQ sample, an OIM® IQ threshold of 200as found to provide an accurate separation of data for the primarym material during heat treatment at 955 ◦C for 4 h followed by (a) water quenching
A.A. Salem et al. / Materials Science and Engineering A 494 (2008) 350–359 357
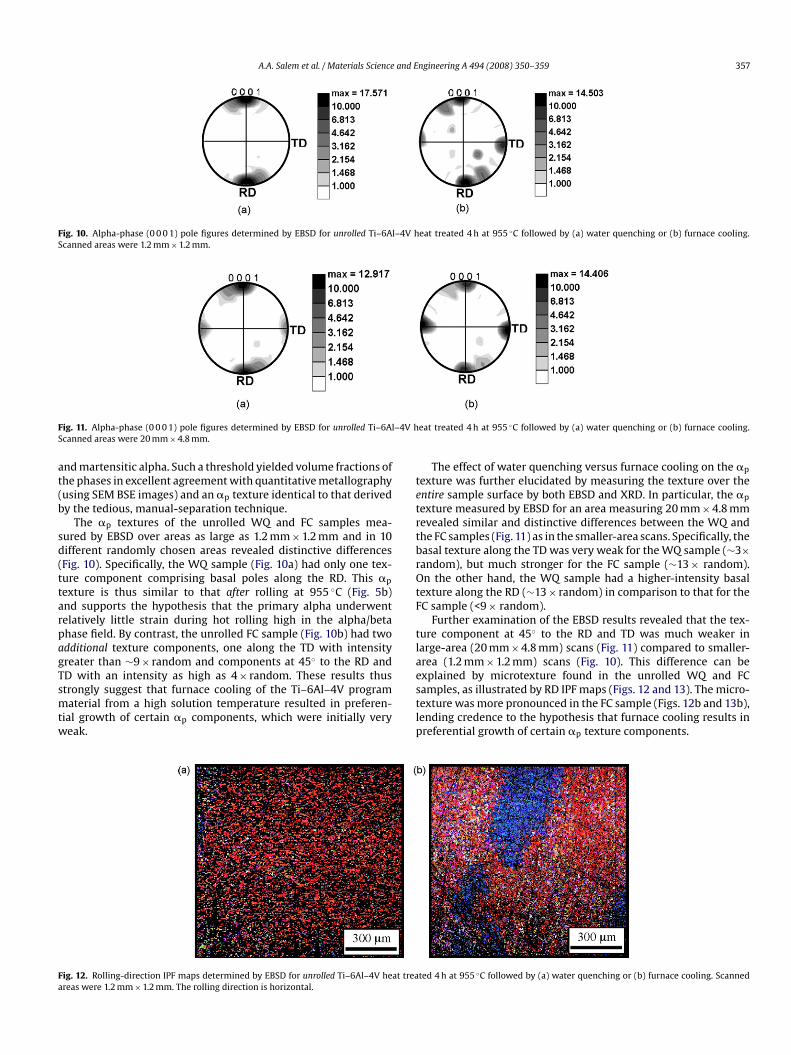
Fig. 10. Alpha-phase (0 0 0 1) pole figures determined by EBSD for unrolled Ti–6Al–4V heat treated 4 h at 955 ◦C followed by (a) water quenching or (b) furnace cooling.Scanned areas were 1.2 mm × 1.2 mm.
F –4V hS
at(b
sd(ttarpagTsmtw
tetrtbrOtF
tla
Fa
ig. 11. Alpha-phase (0 0 0 1) pole figures determined by EBSD for unrolled Ti–6Alcanned areas were 20 mm × 4.8 mm.
nd martensitic alpha. Such a threshold yielded volume fractions ofhe phases in excellent agreement with quantitative metallographyusing SEM BSE images) and an �p texture identical to that derivedy the tedious, manual-separation technique.
The �p textures of the unrolled WQ and FC samples mea-ured by EBSD over areas as large as 1.2 mm × 1.2 mm and in 10ifferent randomly chosen areas revealed distinctive differencesFig. 10). Specifically, the WQ sample (Fig. 10a) had only one tex-ure component comprising basal poles along the RD. This �p
exture is thus similar to that after rolling at 955 ◦C (Fig. 5b)nd supports the hypothesis that the primary alpha underwentelatively little strain during hot rolling high in the alpha/betahase field. By contrast, the unrolled FC sample (Fig. 10b) had twodditional texture components, one along the TD with intensityreater than ∼9 × random and components at 45◦ to the RD and
D with an intensity as high as 4 × random. These results thustrongly suggest that furnace cooling of the Ti–6Al–4V programaterial from a high solution temperature resulted in preferen-ial growth of certain �p components, which were initially veryeak.
estlp
ig. 12. Rolling-direction IPF maps determined by EBSD for unrolled Ti–6Al–4V heat treareas were 1.2 mm × 1.2 mm. The rolling direction is horizontal.
eat treated 4 h at 955 ◦C followed by (a) water quenching or (b) furnace cooling.
The effect of water quenching versus furnace cooling on the �p
exture was further elucidated by measuring the texture over thentire sample surface by both EBSD and XRD. In particular, the �p
exture measured by EBSD for an area measuring 20 mm × 4.8 mmevealed similar and distinctive differences between the WQ andhe FC samples (Fig. 11) as in the smaller-area scans. Specifically, theasal texture along the TD was very weak for the WQ sample (∼3×andom), but much stronger for the FC sample (∼13 × random).n the other hand, the WQ sample had a higher-intensity basal
exture along the RD (∼13 × random) in comparison to that for theC sample (<9 × random).
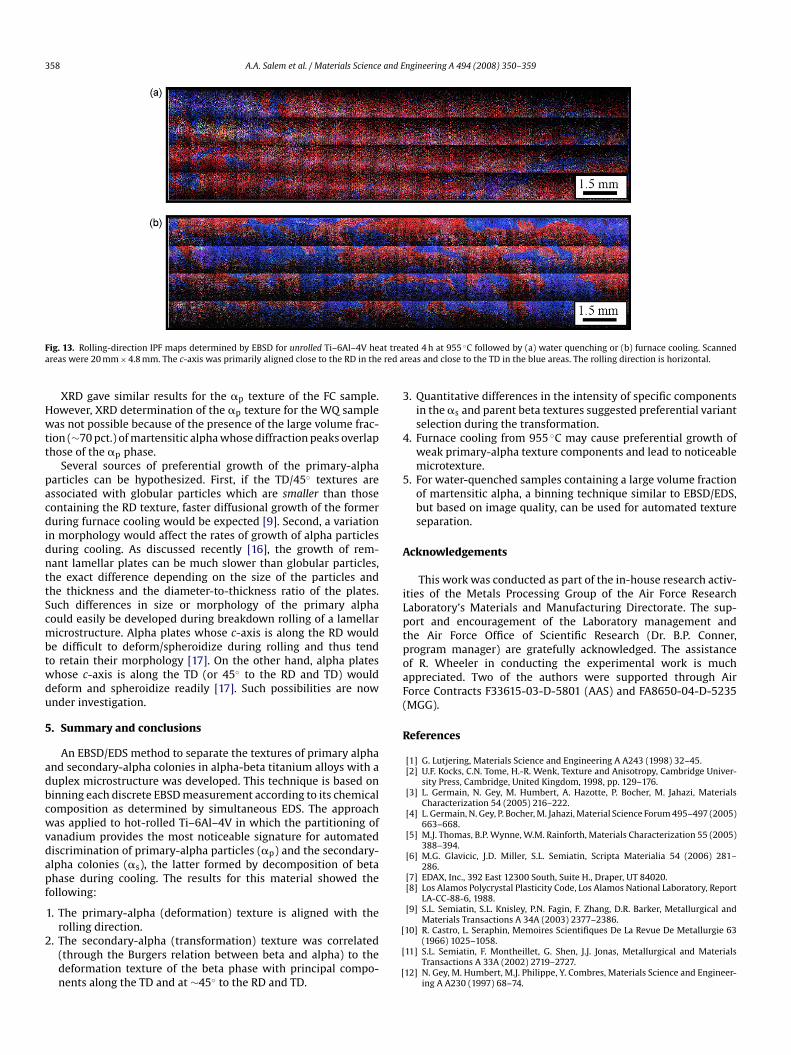
Further examination of the EBSD results revealed that the tex-ure component at 45◦ to the RD and TD was much weaker inarge-area (20 mm × 4.8 mm) scans (Fig. 11) compared to smaller-rea (1.2 mm × 1.2 mm) scans (Fig. 10). This difference can be
xplained by microtexture found in the unrolled WQ and FCamples, as illustrated by RD IPF maps (Figs. 12 and 13). The micro-exture was more pronounced in the FC sample (Figs. 12b and 13b),ending credence to the hypothesis that furnace cooling results inreferential growth of certain �p texture components.ted 4 h at 955 ◦C followed by (a) water quenching or (b) furnace cooling. Scanned
358 A.A. Salem et al. / Materials Science and Engineering A 494 (2008) 350–359
F at treaa red a
Hwtt
pacdidnttScmbtwdu
5
adbcwvdapf
2
3
4
5
A
iLptpoaF(
R
ig. 13. Rolling-direction IPF maps determined by EBSD for unrolled Ti–6Al–4V hereas were 20 mm × 4.8 mm. The c-axis was primarily aligned close to the RD in the
XRD gave similar results for the �p texture of the FC sample.owever, XRD determination of the �p texture for the WQ sampleas not possible because of the presence of the large volume frac-
ion (∼70 pct.) of martensitic alpha whose diffraction peaks overlaphose of the �p phase.
Several sources of preferential growth of the primary-alphaarticles can be hypothesized. First, if the TD/45◦ textures aressociated with globular particles which are smaller than thoseontaining the RD texture, faster diffusional growth of the formeruring furnace cooling would be expected [9]. Second, a variation
n morphology would affect the rates of growth of alpha particlesuring cooling. As discussed recently [16], the growth of rem-ant lamellar plates can be much slower than globular particles,he exact difference depending on the size of the particles andhe thickness and the diameter-to-thickness ratio of the plates.uch differences in size or morphology of the primary alphaould easily be developed during breakdown rolling of a lamellaricrostructure. Alpha plates whose c-axis is along the RD would
e difficult to deform/spheroidize during rolling and thus tendo retain their morphology [17]. On the other hand, alpha plateshose c-axis is along the TD (or 45◦ to the RD and TD) wouldeform and spheroidize readily [17]. Such possibilities are nownder investigation.
. Summary and conclusions
An EBSD/EDS method to separate the textures of primary alphand secondary-alpha colonies in alpha-beta titanium alloys with auplex microstructure was developed. This technique is based oninning each discrete EBSD measurement according to its chemicalomposition as determined by simultaneous EDS. The approachas applied to hot-rolled Ti–6Al–4V in which the partitioning of
anadium provides the most noticeable signature for automatediscrimination of primary-alpha particles (�p) and the secondary-lpha colonies (�s), the latter formed by decomposition of betahase during cooling. The results for this material showed theollowing:
1. The primary-alpha (deformation) texture is aligned with the
rolling direction.. The secondary-alpha (transformation) texture was correlated(through the Burgers relation between beta and alpha) to thedeformation texture of the beta phase with principal compo-nents along the TD and at ∼45◦ to the RD and TD.
[
[
[
ted 4 h at 955 ◦C followed by (a) water quenching or (b) furnace cooling. Scannedreas and close to the TD in the blue areas. The rolling direction is horizontal.
. Quantitative differences in the intensity of specific componentsin the �s and parent beta textures suggested preferential variantselection during the transformation.
. Furnace cooling from 955 ◦C may cause preferential growth ofweak primary-alpha texture components and lead to noticeablemicrotexture.
. For water-quenched samples containing a large volume fractionof martensitic alpha, a binning technique similar to EBSD/EDS,but based on image quality, can be used for automated textureseparation.
cknowledgements
This work was conducted as part of the in-house research activ-ties of the Metals Processing Group of the Air Force Researchaboratory’s Materials and Manufacturing Directorate. The sup-ort and encouragement of the Laboratory management andhe Air Force Office of Scientific Research (Dr. B.P. Conner,rogram manager) are gratefully acknowledged. The assistancef R. Wheeler in conducting the experimental work is muchppreciated. Two of the authors were supported through Airorce Contracts F33615-03-D-5801 (AAS) and FA8650-04-D-5235MGG).
eferences
[1] G. Lutjering, Materials Science and Engineering A A243 (1998) 32–45.[2] U.F. Kocks, C.N. Tome, H.-R. Wenk, Texture and Anisotropy, Cambridge Univer-
sity Press, Cambridge, United Kingdom, 1998, pp. 129–176.[3] L. Germain, N. Gey, M. Humbert, A. Hazotte, P. Bocher, M. Jahazi, Materials
Characterization 54 (2005) 216–222.[4] L. Germain, N. Gey, P. Bocher, M. Jahazi, Material Science Forum 495–497 (2005)
663–668.[5] M.J. Thomas, B.P. Wynne, W.M. Rainforth, Materials Characterization 55 (2005)
388–394.[6] M.G. Glavicic, J.D. Miller, S.L. Semiatin, Scripta Materialia 54 (2006) 281–
286.[7] EDAX, Inc., 392 East 12300 South, Suite H., Draper, UT 84020.[8] Los Alamos Polycrystal Plasticity Code, Los Alamos National Laboratory, Report
LA-CC-88-6, 1988.[9] S.L. Semiatin, S.L. Knisley, P.N. Fagin, F. Zhang, D.R. Barker, Metallurgical and
Materials Transactions A 34A (2003) 2377–2386.
10] R. Castro, L. Seraphin, Memoires Scientifiques De La Revue De Metallurgie 63(1966) 1025–1058.11] S.L. Semiatin, F. Montheillet, G. Shen, J.J. Jonas, Metallurgical and Materials
Transactions A 33A (2002) 2719–2727.12] N. Gey, M. Humbert, M.J. Philippe, Y. Combres, Materials Science and Engineer-
ing A A230 (1997) 68–74.

[[[
A.A. Salem et al. / Materials Science and E
13] W.G. Burgers, Physica 1 (1934) 561–586.14] M.G. Glavicic, S.L. Semiatin, Acta Materialia 54 (2006) 5337–5347.15] S.L. Semiatin, P.N. Fagin, M.G. Glavicic, I.M. Sukonnik, O.M. Ivasishin, Materials
Science and Engineering A A299 (2001) 225–234.
[
[
ngineering A 494 (2008) 350–359 359
16] S.L. Semiatin, T.M. Lehner, J.D. Miller, R.D. Doherty, D.U. Furrer, Metallurgicaland Materials Transactions A 38A (2007) 910–921.
17] T.R. Bieler, S.L. Semiatin, International Journal of Plasticity 18 (2002) 1165–1189.
Copyright © 2022 FDOKUMEN