Bilateral filter based orientation smoothing of EBSD data
9
Bilateral filter based orientation smoothing of EBSD data Delphic Chen, Jui-Chao Kuo n Department of Materials Science and Engineering, National Cheng Kung University, 70101 Tainan, Taiwan article info Article history: Received 31 October 2009 Received in revised form 24 May 2010 Accepted 1 June 2010 Keywords: EBSD Orientation smoothing Bilateral filter Orientation noise abstract Bilateral filter based orientation smoothing was implemented in this study to improve the angular precision of orientation maps for deposited and deformed structures of pure Cu obtained from electron backscattered diffraction (EBSD) measurements. Applying the method to the deformed and deposited structures, the accuracy of misorientation (or the limit of orientation noise) is enhanced from 0.71 to 0.251 and 0.071, respectively. Orientation smoothing has two features: preservation of boundary structures or deformed substructures and significant reduction in orientation noise after only one pass. & 2010 Elsevier B.V. All rights reserved. 1. Introduction Electron backscatter diffraction (EBSD) is widely used for the quantitative characterization of crystallographic microstruc- tures. Boundaries of low-angle misorientations that occur during deformation are known as incidental dislocation boundaries [1]. Such misorientations in the subgrains may be in the range of 1–51, which is near the detectable angular resolution of 21 [2]. The detection of subgrain boundaries with misorientation angles below 21 is then limited by the angular resolution. According to Humphreys et al. [2], the angular resolution is affected by a number of factors, such as the microscope operating conditions, the pixels in the CCD camera, the resolution of the digitized pattern, and the accuracy of the pattern solving algorithms [3]. In subgrain boundaries the Kikuchi pattern quality becomes worse with increase in strain because of both the overlapping patterns in the vicinity of the subgrains and the increased incoherent scattering associated with higher dislocation densities. Rapid data collection using low-resolution electron backscatter patterns (EBSPs) can also reduce the Kikuchi pattern quality. This results in inaccurate orientations, which is considered the local orientation deviation or orientation spread. As the EBSD data collection rate increases, the local orientation spread, known as the ‘‘orientation noise’’ [2,4], also increases and then the angular resolution decreases. Post-processing routines are important for reducing the orientation noise and improving the angular accuracy. These routines are aimed at reducing the average orientation noise and the number of artificial errors introduced by filtering. The Kuwahara-based orientation filter was introduced by Humphreys et al. [5] to reduce the average noise level. Godfrey [6] proposed a modified Kuwahara filter to improve the edge preservation near the triple junctions. Cho et al. [7] also introduced a new orientation averaging method. The bilateral filter introduced by Tomasi and Manduchi [8] can be used to smooth out image noise and to retain the edge detail of an original image. This filter is now applied in the field of image processing to recover details from noisy signals. The bilateral filter, similar to a Gaussian filter, smoothes the pixels in a digital image [9], but it does not smooth the pixels if the color components (i.e. RGB value) are not similar. An orientation smoothing method based on a bilateral filter is used to reduce orientation noise and to preserve boundary structures. Deposited and deformed (10% tensile strain) pure Cu structures are applied to examine the performance of the bilateral-based orientation smoothing method. The paper is organized as follows: the concept of the orientation bilateral filter is presented firstly in Section 2. Then the materials and the experimental procedure are presented in Section 3. After that the performance of the orientation bilateral filter is discussed in terms of the reduction of the orientation noise and of the preservation of the grain boundaries in Sections 4 and 5, respectively. Finally, three filtering methods are compared in Section 6. 2. Orientation bilateral filter A simple Kuwahara filter, which uses the average orientation, is used to remove the orientation noise in EBSD data. A conventional Contents lists available at ScienceDirect journal homepage: www.elsevier.com/locate/ultramic Ultramicroscopy 0304-3991/$ - see front matter & 2010 Elsevier B.V. All rights reserved. doi:10.1016/j.ultramic.2010.06.003 n Corresponding author. Tel.: + 886 6 2757575x31130; fax: + 886 6 2754194. E-mail address: [email protected] (J.-C. Kuo). Ultramicroscopy 110 (2010) 1297–1305
Transcript of Bilateral filter based orientation smoothing of EBSD data
Ultramicroscopy 110 (2010) 1297–1305
Contents lists available at ScienceDirect
Ultramicroscopy
0304-39
doi:10.1
n Corr
E-m
journal homepage: www.elsevier.com/locate/ultramic
Bilateral filter based orientation smoothing of EBSD data
Delphic Chen, Jui-Chao Kuo n
Department of Materials Science and Engineering, National Cheng Kung University, 70101 Tainan, Taiwan
a r t i c l e i n f o
Article history:
Received 31 October 2009
Received in revised form
24 May 2010
Accepted 1 June 2010
Keywords:
EBSD
Orientation smoothing
Bilateral filter
Orientation noise
91/$ - see front matter & 2010 Elsevier B.V. A
016/j.ultramic.2010.06.003
esponding author. Tel.: +886 6 2757575x311
ail address: [email protected] (J.-C. Kuo
a b s t r a c t
Bilateral filter based orientation smoothing was implemented in this study to improve the angular
precision of orientation maps for deposited and deformed structures of pure Cu obtained from electron
backscattered diffraction (EBSD) measurements. Applying the method to the deformed and deposited
structures, the accuracy of misorientation (or the limit of orientation noise) is enhanced from 0.71 to
0.251 and 0.071, respectively. Orientation smoothing has two features: preservation of boundary
structures or deformed substructures and significant reduction in orientation noise after only one pass.
& 2010 Elsevier B.V. All rights reserved.
1. Introduction
Electron backscatter diffraction (EBSD) is widely used forthe quantitative characterization of crystallographic microstruc-tures. Boundaries of low-angle misorientations that occur duringdeformation are known as incidental dislocation boundaries [1].Such misorientations in the subgrains may be in the range of1–51, which is near the detectable angular resolution of 21 [2].The detection of subgrain boundaries with misorientationangles below 21 is then limited by the angular resolution.According to Humphreys et al. [2], the angular resolution isaffected by a number of factors, such as the microscope operatingconditions, the pixels in the CCD camera, the resolution of thedigitized pattern, and the accuracy of the pattern solvingalgorithms [3].
In subgrain boundaries the Kikuchi pattern quality becomesworse with increase in strain because of both the overlappingpatterns in the vicinity of the subgrains and the increasedincoherent scattering associated with higher dislocation densities.Rapid data collection using low-resolution electron backscatterpatterns (EBSPs) can also reduce the Kikuchi pattern quality. Thisresults in inaccurate orientations, which is considered the localorientation deviation or orientation spread. As the EBSD datacollection rate increases, the local orientation spread, known asthe ‘‘orientation noise’’ [2,4], also increases and then the angularresolution decreases.
Post-processing routines are important for reducing theorientation noise and improving the angular accuracy. These
ll rights reserved.
30; fax: +886 6 2754194.
).
routines are aimed at reducing the average orientation noise andthe number of artificial errors introduced by filtering. TheKuwahara-based orientation filter was introduced by Humphreyset al. [5] to reduce the average noise level. Godfrey [6] proposed amodified Kuwahara filter to improve the edge preservation nearthe triple junctions. Cho et al. [7] also introduced a neworientation averaging method. The bilateral filter introduced byTomasi and Manduchi [8] can be used to smooth out image noiseand to retain the edge detail of an original image. This filter is nowapplied in the field of image processing to recover details fromnoisy signals. The bilateral filter, similar to a Gaussian filter,smoothes the pixels in a digital image [9], but it does not smooththe pixels if the color components (i.e. RGB value) are not similar.
An orientation smoothing method based on a bilateral filter isused to reduce orientation noise and to preserve boundarystructures. Deposited and deformed (10% tensile strain) pure Custructures are applied to examine the performance of thebilateral-based orientation smoothing method. The paper isorganized as follows: the concept of the orientation bilateralfilter is presented firstly in Section 2. Then the materials and theexperimental procedure are presented in Section 3. After that theperformance of the orientation bilateral filter is discussed interms of the reduction of the orientation noise and of thepreservation of the grain boundaries in Sections 4 and 5,respectively. Finally, three filtering methods are compared inSection 6.
2. Orientation bilateral filter
A simple Kuwahara filter, which uses the average orientation,is used to remove the orientation noise in EBSD data. A conventional
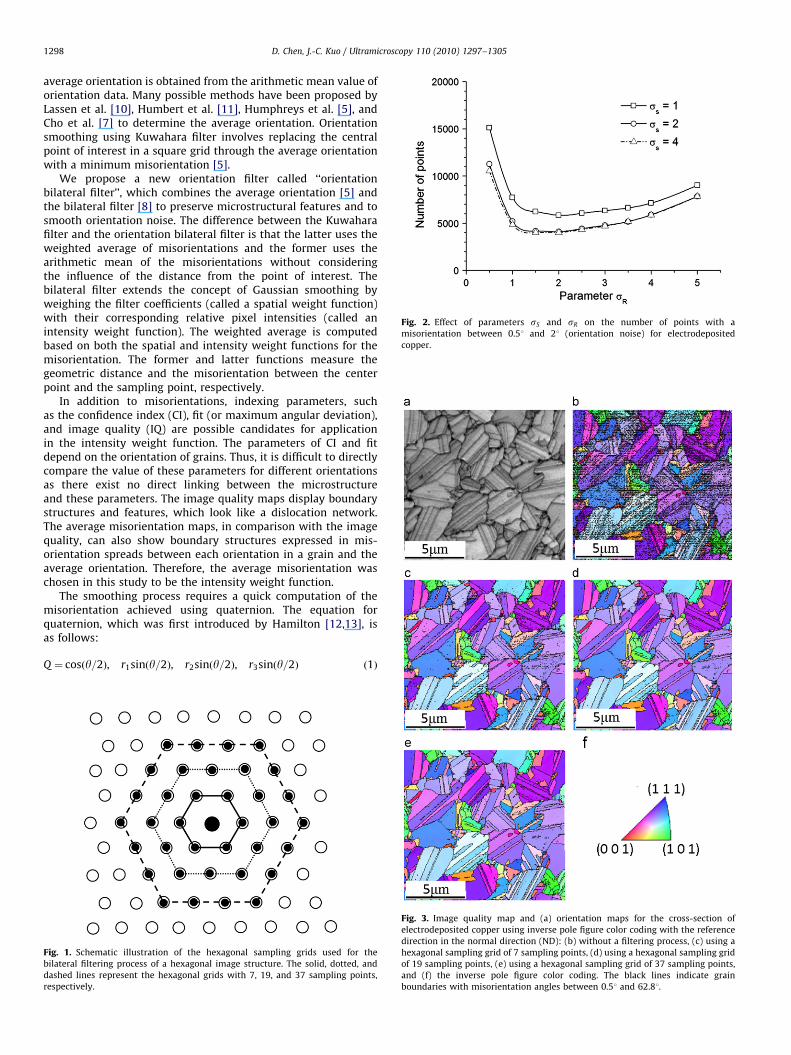
Fig. 2. Effect of parameters sS and sR on the number of points with a
misorientation between 0.51 and 21 (orientation noise) for electrodeposited
copper.
D. Chen, J.-C. Kuo / Ultramicroscopy 110 (2010) 1297–13051298
average orientation is obtained from the arithmetic mean value oforientation data. Many possible methods have been proposed byLassen et al. [10], Humbert et al. [11], Humphreys et al. [5], andCho et al. [7] to determine the average orientation. Orientationsmoothing using Kuwahara filter involves replacing the centralpoint of interest in a square grid through the average orientationwith a minimum misorientation [5].
We propose a new orientation filter called ‘‘orientationbilateral filter’’, which combines the average orientation [5] andthe bilateral filter [8] to preserve microstructural features and tosmooth orientation noise. The difference between the Kuwaharafilter and the orientation bilateral filter is that the latter uses theweighted average of misorientations and the former uses thearithmetic mean of the misorientations without consideringthe influence of the distance from the point of interest. Thebilateral filter extends the concept of Gaussian smoothing byweighing the filter coefficients (called a spatial weight function)with their corresponding relative pixel intensities (called anintensity weight function). The weighted average is computedbased on both the spatial and intensity weight functions for themisorientation. The former and latter functions measure thegeometric distance and the misorientation between the centerpoint and the sampling point, respectively.
In addition to misorientations, indexing parameters, suchas the confidence index (CI), fit (or maximum angular deviation),and image quality (IQ) are possible candidates for applicationin the intensity weight function. The parameters of CI and fitdepend on the orientation of grains. Thus, it is difficult to directlycompare the value of these parameters for different orientationsas there exist no direct linking between the microstructureand these parameters. The image quality maps display boundarystructures and features, which look like a dislocation network.The average misorientation maps, in comparison with the imagequality, can also show boundary structures expressed in mis-orientation spreads between each orientation in a grain and theaverage orientation. Therefore, the average misorientation waschosen in this study to be the intensity weight function.
The smoothing process requires a quick computation of themisorientation achieved using quaternion. The equation forquaternion, which was first introduced by Hamilton [12,13], isas follows:
Q ¼ cosðy=2Þ, r1sinðy=2Þ, r2sinðy=2Þ, r3sinðy=2Þ ð1Þ
Fig. 1. Schematic illustration of the hexagonal sampling grids used for the
bilateral filtering process of a hexagonal image structure. The solid, dotted, and
dashed lines represent the hexagonal grids with 7, 19, and 37 sampling points,
respectively.
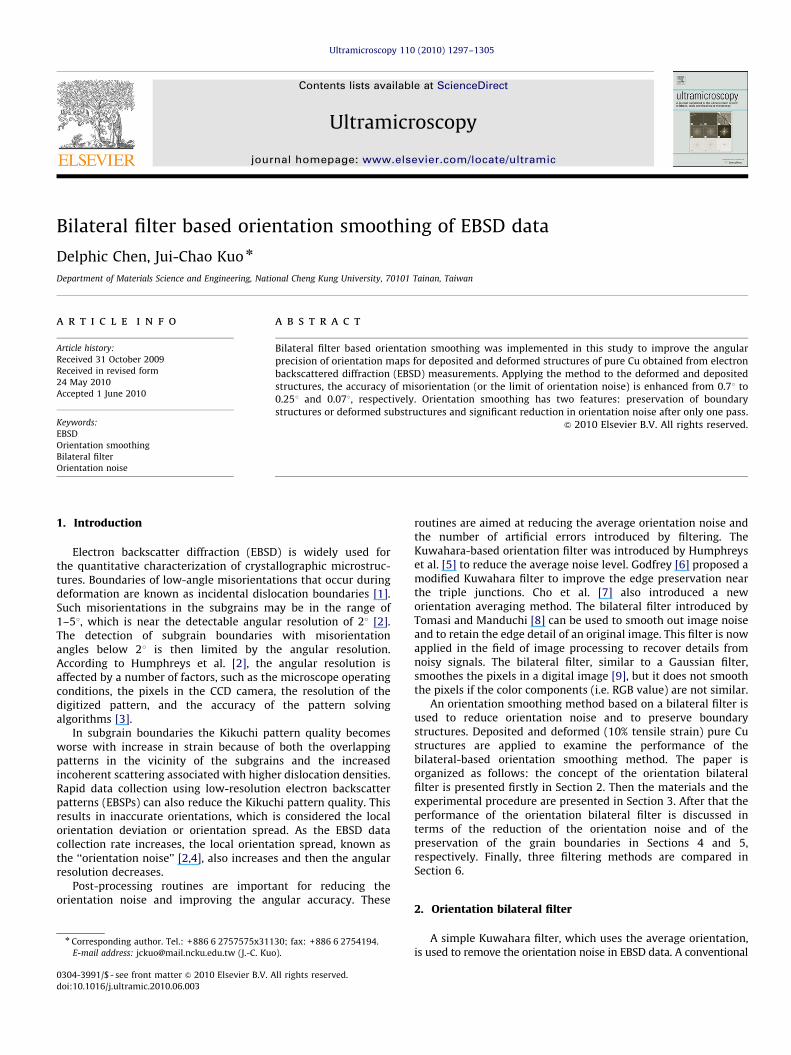
Fig. 3. Image quality map and (a) orientation maps for the cross-section of
electrodeposited copper using inverse pole figure color coding with the reference
direction in the normal direction (ND): (b) without a filtering process, (c) using a
hexagonal sampling grid of 7 sampling points, (d) using a hexagonal sampling grid
of 19 sampling points, (e) using a hexagonal sampling grid of 37 sampling points,
and (f) the inverse pole figure color coding. The black lines indicate grain
boundaries with misorientation angles between 0.51 and 62.81.

D. Chen, J.-C. Kuo / Ultramicroscopy 110 (2010) 1297–1305 1299
where r¼(r1,r2,r3) is the axis with a common numerical descrip-tion for both the crystal and the reference axes, and y is therotation angle of the axis that completes the orientationspecification.
The average orientation for the center point, based on theorientation bilateral filter, is computed by the weight function
Q ðx0,y0Þ ¼
Pn�1
i ¼ 0
Q ðxi,yiÞ �wðxi,yiÞ
Pn�1
i ¼ 0
wðxi,yiÞ
ð2Þ
Fig. 5. Distribution of point-to-point misorientation angle for electrodeposited copper:
sampling points. The Lorentz and Gauss fitting curves are shown as solid and dashed l
Fig. 4. Misorientation angle histogram of electrodeposited copper for raw data
and bilateral filtered data using 7, 19, and 37 sampling points. (The value of 62.8 is
referred to in [17].)
where Q(xi,yi) and Q(x0,y0) are the quaternions at the samplingpoint (xi,yi) and the center point (x0,y0), respectively. The weightfunction Q(xi,yi) is given by
wðxi,yiÞ ¼wSðxi,yiÞ �wRðxi,yiÞ ð3Þ
The spatial weight function wS(xi,yi) and intensity weightfunction wR(xi,yi) are obtained by
wSðxi,yiÞ ¼ e�½ðxi�x0Þ2þðyi�y0Þ
2�=2s2
S ð4Þ
and
wRðxi,yiÞ ¼ e�ðDgi0Þ2=2s2
R ð5Þ
where sS is a parameter in the spatial domain, sR is a parameter inthe intensity domain, and Dgi0 is the misorientation between thesampling point (xi,yi) and the center point (x0,y0).
The smoothing process is performed on a hexagonal grid ofmeasured orientations. A new orientation is replaced by theaveraged orientation, over a set of values at each hexagonalgrid point, according to Eq. (2). The size and shape of the entiresampling region can have significant effects on the smoothingprocess. The shape of the orientation bilateral filter is a hexagonalgrid that contains 37 points, including the central point.These points correspond to the three nearest hexagonal neighbor-hoods (Fig. 1). Other grid sizes such as 7 (the nearest hexagonneighbors) and 19 (two nearest hexagon neighbors) are alsodiscussed. The orientation bilateral filter varying the values of sS
and sR is applied on an EBSD data set to find the optimal valuesfor the spatial and intensity domain parameters sS and sR,.The points with misorientations 0.5–21 are considered as theorientation noise after the smoothing process. Fig. 2 showsthe effect of the parameters sS and sR on the number of theorientation noise. The orientation noise for sS¼2 and 4 is smallerthan that for sS¼1 when the value of sR is in the range 0.5–5.A minimum sR was observed at 2 when sS¼2 and 4. Based on the
(a) raw data; (b) with 7 sampling points; (c) with 19 sampling points; and (d) 37
ines, respectively.
D. Chen, J.-C. Kuo / Ultramicroscopy 110 (2010) 1297–13051300
observations, the parameters sS and sR are selected to be 2 and 2,respectively.
Gaussian and Lorentz distribution functions are chosen to fitthe curve in order to investigate the distribution of misorienta-tions 0–1.01. The Gaussian distribution is given by the formula
y¼ y0þA
wffiffiffiffiffiffiffiffiffip=2
p e�2ðx�xc Þ2=w2
ð6Þ
where y0 is the offset, A the total area under the curve, xc themean, and w/2 the standard deviation, which is approximately0.425 the full-width at half-maximum (FWHM).
The Lorentz distribution is given as
y¼ y0þ2A
pw
4ðx�xcÞ2þw2
ð7Þ
where y0 is the offset, A the total area under the curve, xc themean, and w is FWHM.
Fig. 6. Maximum deviation after filter passes for electrodeposited copper.
3. Materials and experimental procedure
Cu film was synthesized through a pulsed electrodepositiontechnique from an additive-free acidic Cu electrolyte 0.5 M CuSO4.The pH value was adjusted to 1 by adding sulfuric acid.Mechanical agitation was applied to ensure the refreshment ofthe electrolytic solution and to prevent organic contamination. Alldepositions were conducted at 20 1C under a current density of0.5 A/cm2. The pulsed current chain was composed of time-on0.2 s and time-off 2.0 s.
A pure Cu sample for the tensile test was prepared by anelectric discharge machine into the specimen dimensions. Aspecimen was ground, polished with a 1 mm diamond paste, andelectropolished in a phosphoric-based electrolyte at 20 1C under1.5 V for 60 s. This sample was deformed by 10% through micro-tensile testing (Kammrath and Weiss GmbH).
The deposited and deformed Cu samples were mechanicallypolished through a standard metallographic procedure to a finallevel of 0.03 mm. This was followed by electropolishing at avoltage of 1.5 V for 60 s in a phosphoric acid electrolyte. EBSDmeasurements were carried out using an EDAX/TSL TechnologyEBSD system, including a Digiview IV Detector, mounted on afield-emission scanning electron microscope (FESEM, JEOL JSM-7001F). All EBSD data collection and analysis were performedusing TSLs OIM Data Collection and Analysis software 5.2. Theelectron beam was operated at 30 kV with step sizes of 50 and25 nm for the deposited and 10% strained Cu samples, respec-tively. To achieve a low orientation noise—that is, a high-qualityEBSD orientation map—the exposure time for the CCD camerawas set to 0.03 s for the deposited Cu and 0.05 s for the deformedCu. The binning size for the CCD camera was set to 4�4 and 2�2pixels, for the deposited and deformed Cu, respectively.
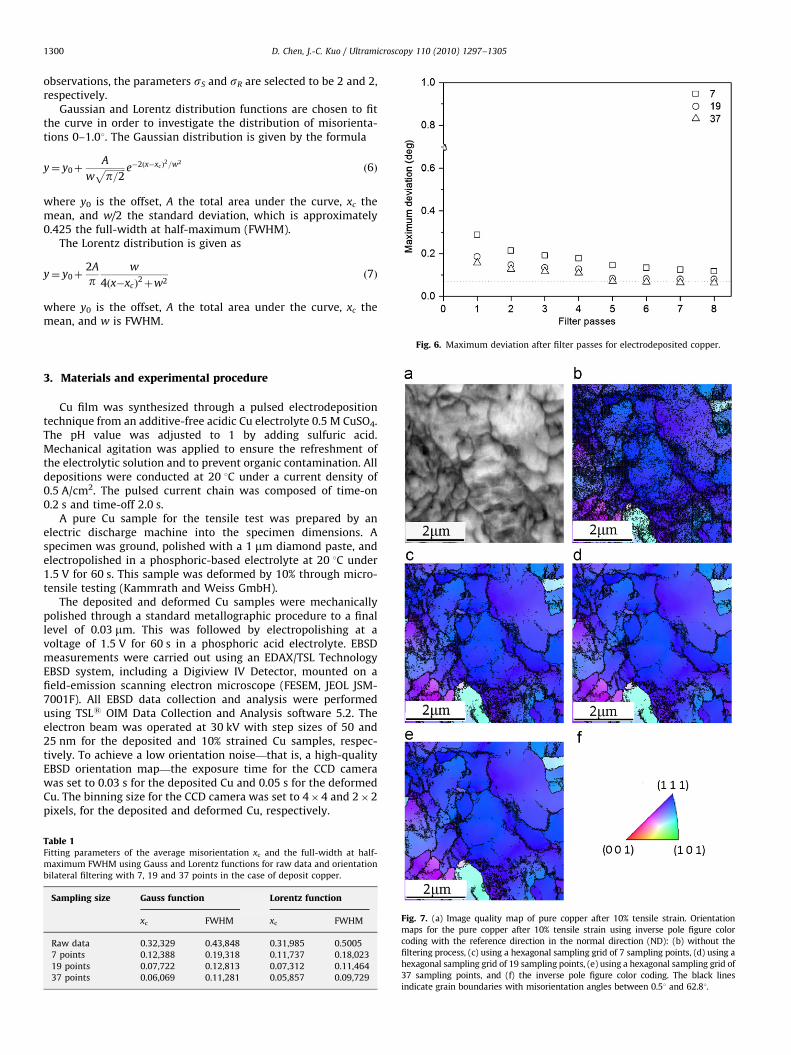
Fig. 7. (a) Image quality map of pure copper after 10% tensile strain. Orientation
maps for the pure copper after 10% tensile strain using inverse pole figure color
coding with the reference direction in the normal direction (ND): (b) without the
filtering process, (c) using a hexagonal sampling grid of 7 sampling points, (d) using a
hexagonal sampling grid of 19 sampling points, (e) using a hexagonal sampling grid of
37 sampling points, and (f) the inverse pole figure color coding. The black lines
indicate grain boundaries with misorientation angles between 0.51 and 62.81.
Table 1Fitting parameters of the average misorientation xc and the full-width at half-
maximum FWHM using Gauss and Lorentz functions for raw data and orientation
bilateral filtering with 7, 19 and 37 points in the case of deposit copper.
Sampling size Gauss function Lorentz function
xc FWHM xc FWHM
Raw data 0.32,329 0.43,848 0.31,985 0.5005
7 points 0.12,388 0.19,318 0.11,737 0.18,023
19 points 0.07,722 0.12,813 0.07,312 0.11,464
37 points 0.06,069 0.11,281 0.05,857 0.09,729
D. Chen, J.-C. Kuo / Ultramicroscopy 110 (2010) 1297–1305 1301
4. Orientation smoothing
4.1. Deposited structure
Fig. 3a shows the image quality map of a deposited structure ofCu obtained using a scanning step size of 50 nm. The inverse polefigure maps with highlighted boundaries obtained from the rawESBD data are shown in Fig. 3b. The black represents boundarieswith misorientations 0.5–62.81, which are comprised of theorientation noise of 0.5–51, low-angle grain boundaries (LAGBs) of
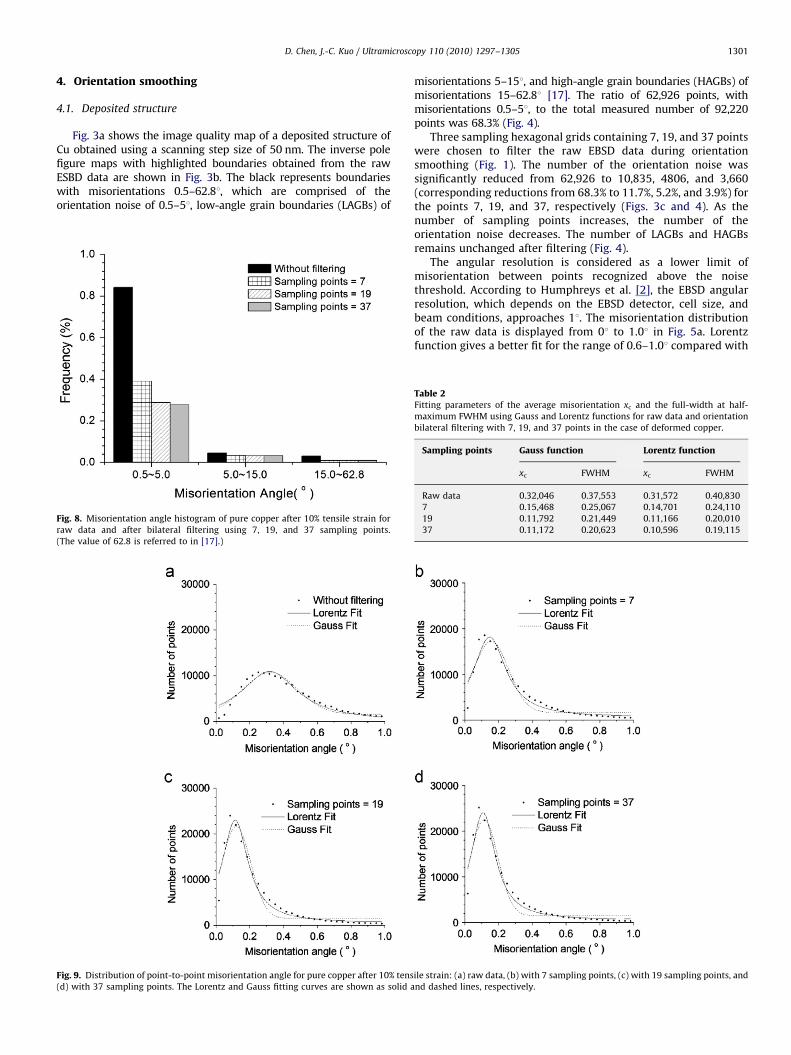
Fig. 9. Distribution of point-to-point misorientation angle for pure copper after 10% tens
(d) with 37 sampling points. The Lorentz and Gauss fitting curves are shown as solid a
Fig. 8. Misorientation angle histogram of pure copper after 10% tensile strain for
raw data and after bilateral filtering using 7, 19, and 37 sampling points.
(The value of 62.8 is referred to in [17].)
misorientations 5–151, and high-angle grain boundaries (HAGBs) ofmisorientations 15–62.81 [17]. The ratio of 62,926 points, withmisorientations 0.5–51, to the total measured number of 92,220points was 68.3% (Fig. 4).
Three sampling hexagonal grids containing 7, 19, and 37 pointswere chosen to filter the raw EBSD data during orientationsmoothing (Fig. 1). The number of the orientation noise wassignificantly reduced from 62,926 to 10,835, 4806, and 3,660(corresponding reductions from 68.3% to 11.7%, 5.2%, and 3.9%) forthe points 7, 19, and 37, respectively (Figs. 3c and 4). As thenumber of sampling points increases, the number of theorientation noise decreases. The number of LAGBs and HAGBsremains unchanged after filtering (Fig. 4).
The angular resolution is considered as a lower limit ofmisorientation between points recognized above the noisethreshold. According to Humphreys et al. [2], the EBSD angularresolution, which depends on the EBSD detector, cell size, andbeam conditions, approaches 11. The misorientation distributionof the raw data is displayed from 01 to 1.01 in Fig. 5a. Lorentzfunction gives a better fit for the range of 0.6–1.01 compared with
ile strain: (a) raw data, (b) with 7 sampling points, (c) with 19 sampling points, and
nd dashed lines, respectively.
Table 2Fitting parameters of the average misorientation xc and the full-width at half-
maximum FWHM using Gauss and Lorentz functions for raw data and orientation
bilateral filtering with 7, 19, and 37 points in the case of deformed copper.
Sampling points Gauss function Lorentz function
xc FWHM xc FWHM
Raw data 0.32,046 0.37,553 0.31,572 0.40,830
7 0.15,468 0.25,067 0.14,701 0.24,110
19 0.11,792 0.21,449 0.11,166 0.20,010
37 0.11,172 0.20,623 0.10,596 0.19,115
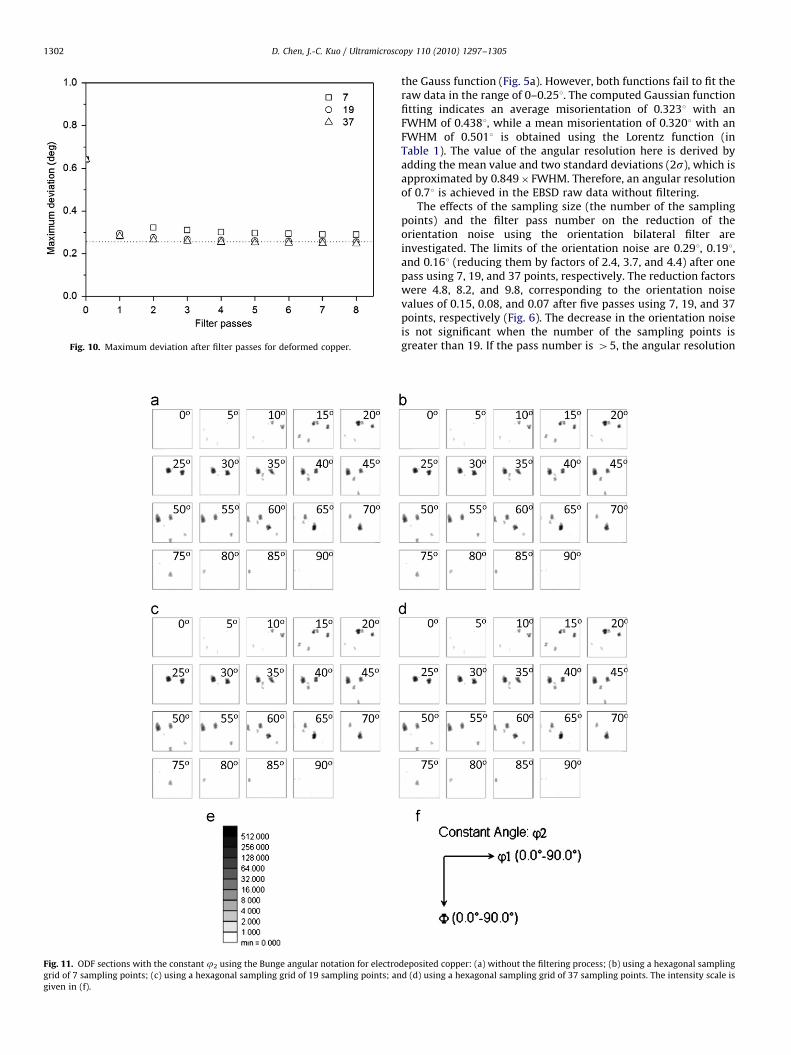
Fig. 11. ODF sections with the constant j2 using the Bunge angular notation for electro
grid of 7 sampling points; (c) using a hexagonal sampling grid of 19 sampling points; an
given in (f).
Fig. 10. Maximum deviation after filter passes for deformed copper.
D. Chen, J.-C. Kuo / Ultramicroscopy 110 (2010) 1297–13051302
the Gauss function (Fig. 5a). However, both functions fail to fit theraw data in the range of 0–0.251. The computed Gaussian functionfitting indicates an average misorientation of 0.3231 with anFWHM of 0.4381, while a mean misorientation of 0.3201 with anFWHM of 0.5011 is obtained using the Lorentz function (inTable 1). The value of the angular resolution here is derived byadding the mean value and two standard deviations (2s), which isapproximated by 0.849� FWHM. Therefore, an angular resolutionof 0.71 is achieved in the EBSD raw data without filtering.
The effects of the sampling size (the number of the samplingpoints) and the filter pass number on the reduction of theorientation noise using the orientation bilateral filter areinvestigated. The limits of the orientation noise are 0.291, 0.191,and 0.161 (reducing them by factors of 2.4, 3.7, and 4.4) after onepass using 7, 19, and 37 points, respectively. The reduction factorswere 4.8, 8.2, and 9.8, corresponding to the orientation noisevalues of 0.15, 0.08, and 0.07 after five passes using 7, 19, and 37points, respectively (Fig. 6). The decrease in the orientation noiseis not significant when the number of the sampling points isgreater than 19. If the pass number is 45, the angular resolution
deposited copper: (a) without the filtering process; (b) using a hexagonal sampling
d (d) using a hexagonal sampling grid of 37 sampling points. The intensity scale is
D. Chen, J.-C. Kuo / Ultramicroscopy 110 (2010) 1297–1305 1303
approaches to the limit value of 0.071, which is recognized as theangular resolution with filtering. The angular resolutionafter filtering is clearly improved from an initial value of 0.71to 0.071.
4.2. Deformed substructure
The image quality map taken a step size of 25 nm and having65,008 total measured points shows the 10% tensile strainedstructure of pure Cu (Fig. 7a). The subgrain structure is clearlyseen in the image quality map. The corresponding map usingcolor coding in terms of an inverse pole figure is overlaid withreconstructed boundaries (Fig. 7b). The black representsboundaries with misorientations 0.5–62.81, which include theorientation noise (0.5–51), LAGBs (5–151), and HAGBs (15–62.81).
Fig. 7c–e illustrates that applying this technique to the ESBDorientation data significantly reduces the amount of the orienta-tion noise. The fraction of the orientation noise is significantlydecreased to 28.7% of the total measured points after one passusing 37 points (Fig. 8).
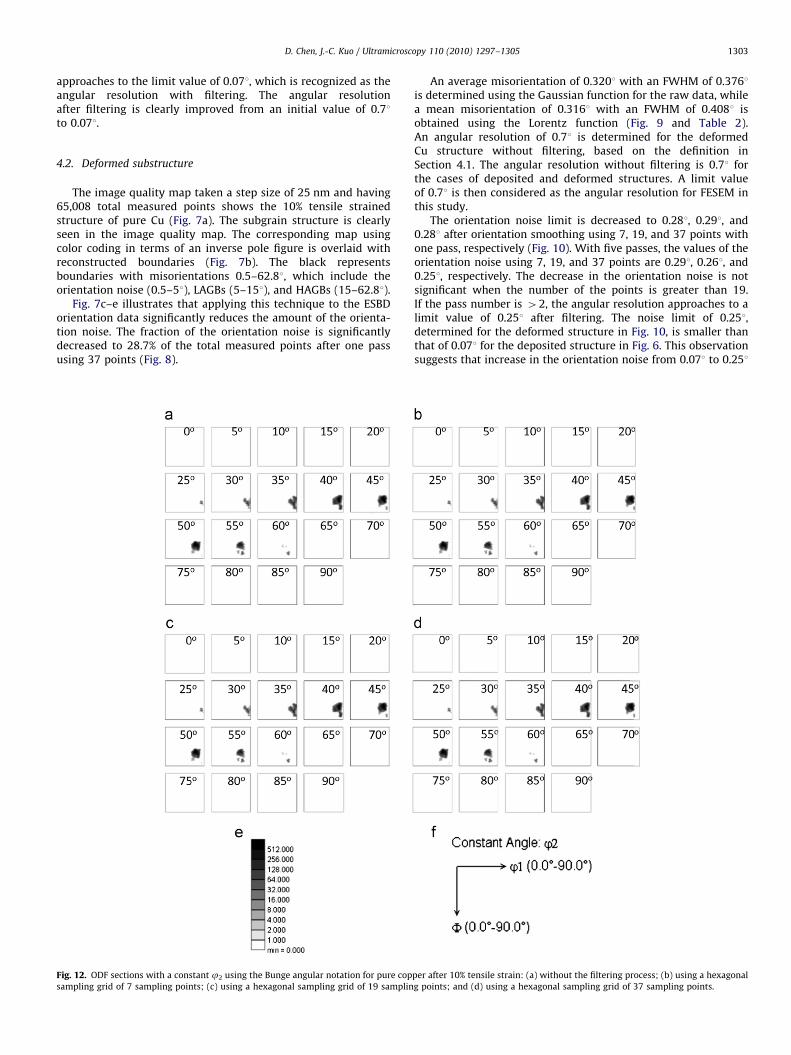
Fig. 12. ODF sections with a constant j2 using the Bunge angular notation for pure cop
sampling grid of 7 sampling points; (c) using a hexagonal sampling grid of 19 samplin
An average misorientation of 0.3201 with an FWHM of 0.3761is determined using the Gaussian function for the raw data, whilea mean misorientation of 0.3161 with an FWHM of 0.4081 isobtained using the Lorentz function (Fig. 9 and Table 2).An angular resolution of 0.71 is determined for the deformedCu structure without filtering, based on the definition inSection 4.1. The angular resolution without filtering is 0.71 forthe cases of deposited and deformed structures. A limit valueof 0.71 is then considered as the angular resolution for FESEM inthis study.
The orientation noise limit is decreased to 0.281, 0.291, and0.281 after orientation smoothing using 7, 19, and 37 points withone pass, respectively (Fig. 10). With five passes, the values of theorientation noise using 7, 19, and 37 points are 0.291, 0.261, and0.251, respectively. The decrease in the orientation noise is notsignificant when the number of the points is greater than 19.If the pass number is 42, the angular resolution approaches to alimit value of 0.251 after filtering. The noise limit of 0.251,determined for the deformed structure in Fig. 10, is smaller thanthat of 0.071 for the deposited structure in Fig. 6. This observationsuggests that increase in the orientation noise from 0.071 to 0.251
per after 10% tensile strain: (a) without the filtering process; (b) using a hexagonal
g points; and (d) using a hexagonal sampling grid of 37 sampling points.
D. Chen, J.-C. Kuo / Ultramicroscopy 110 (2010) 1297–13051304
is due to the formation of subgrain structures with LAGBs duringdeformation.
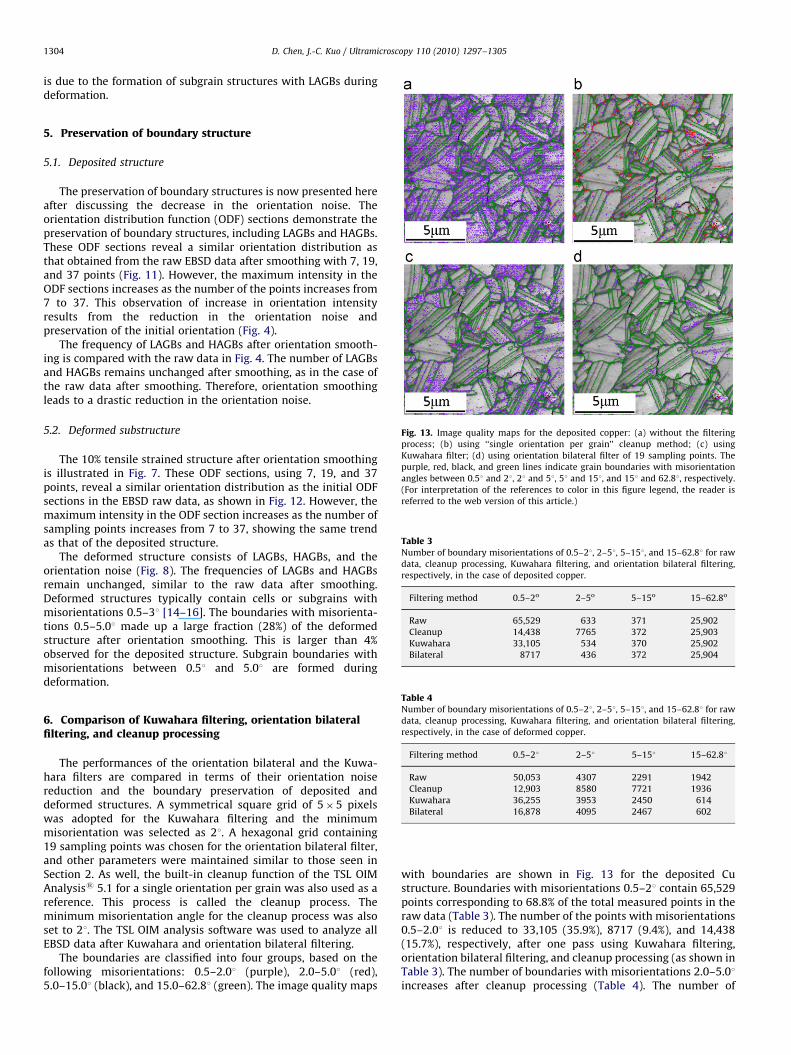
Fig. 13. Image quality maps for the deposited copper: (a) without the filtering
process; (b) using ‘‘single orientation per grain’’ cleanup method; (c) using
Kuwahara filter; (d) using orientation bilateral filter of 19 sampling points. The
purple, red, black, and green lines indicate grain boundaries with misorientation
angles between 0.51 and 21, 21 and 51, 51 and 151, and 151 and 62.81, respectively.
(For interpretation of the references to color in this figure legend, the reader is
referred to the web version of this article.)
Table 3Number of boundary misorientations of 0.5–21, 2–51, 5–151, and 15–62.81 for raw
data, cleanup processing, Kuwahara filtering, and orientation bilateral filtering,
respectively, in the case of deposited copper.
Filtering method 0.5–2o 2–5o 5–15o 15–62.8o
Raw 65,529 633 371 25,902
Cleanup 14,438 7765 372 25,903
Kuwahara 33,105 534 370 25,902
Bilateral 8717 436 372 25,904
5. Preservation of boundary structure
5.1. Deposited structure
The preservation of boundary structures is now presented hereafter discussing the decrease in the orientation noise. Theorientation distribution function (ODF) sections demonstrate thepreservation of boundary structures, including LAGBs and HAGBs.These ODF sections reveal a similar orientation distribution asthat obtained from the raw EBSD data after smoothing with 7, 19,and 37 points (Fig. 11). However, the maximum intensity in theODF sections increases as the number of the points increases from7 to 37. This observation of increase in orientation intensityresults from the reduction in the orientation noise andpreservation of the initial orientation (Fig. 4).
The frequency of LAGBs and HAGBs after orientation smooth-ing is compared with the raw data in Fig. 4. The number of LAGBsand HAGBs remains unchanged after smoothing, as in the case ofthe raw data after smoothing. Therefore, orientation smoothingleads to a drastic reduction in the orientation noise.
5.2. Deformed substructure
The 10% tensile strained structure after orientation smoothingis illustrated in Fig. 7. These ODF sections, using 7, 19, and 37points, reveal a similar orientation distribution as the initial ODFsections in the EBSD raw data, as shown in Fig. 12. However, themaximum intensity in the ODF section increases as the number ofsampling points increases from 7 to 37, showing the same trendas that of the deposited structure.
The deformed structure consists of LAGBs, HAGBs, and theorientation noise (Fig. 8). The frequencies of LAGBs and HAGBsremain unchanged, similar to the raw data after smoothing.Deformed structures typically contain cells or subgrains withmisorientations 0.5–31 [14–16]. The boundaries with misorienta-tions 0.5–5.01 made up a large fraction (28%) of the deformedstructure after orientation smoothing. This is larger than 4%observed for the deposited structure. Subgrain boundaries withmisorientations between 0.51 and 5.01 are formed duringdeformation.
Table 4Number of boundary misorientations of 0.5–21, 2–51, 5–151, and 15–62.81 for raw
data, cleanup processing, Kuwahara filtering, and orientation bilateral filtering,
respectively, in the case of deformed copper.
Filtering method 0.5–21 2–51 5–151 15–62.81
Raw 50,053 4307 2291 1942
Cleanup 12,903 8580 7721 1936
Kuwahara 36,255 3953 2450 614
Bilateral 16,878 4095 2467 602
6. Comparison of Kuwahara filtering, orientation bilateralfiltering, and cleanup processing
The performances of the orientation bilateral and the Kuwa-hara filters are compared in terms of their orientation noisereduction and the boundary preservation of deposited anddeformed structures. A symmetrical square grid of 5�5 pixelswas adopted for the Kuwahara filtering and the minimummisorientation was selected as 21. A hexagonal grid containing19 sampling points was chosen for the orientation bilateral filter,and other parameters were maintained similar to those seen inSection 2. As well, the built-in cleanup function of the TSL OIMAnalysiss 5.1 for a single orientation per grain was also used as areference. This process is called the cleanup process. Theminimum misorientation angle for the cleanup process was alsoset to 21. The TSL OIM analysis software was used to analyze allEBSD data after Kuwahara and orientation bilateral filtering.
The boundaries are classified into four groups, based on thefollowing misorientations: 0.5–2.01 (purple), 2.0–5.01 (red),5.0–15.01 (black), and 15.0–62.81 (green). The image quality maps
with boundaries are shown in Fig. 13 for the deposited Custructure. Boundaries with misorientations 0.5–21 contain 65,529points corresponding to 68.8% of the total measured points in theraw data (Table 3). The number of the points with misorientations0.5–2.01 is reduced to 33,105 (35.9%), 8717 (9.4%), and 14,438(15.7%), respectively, after one pass using Kuwahara filtering,orientation bilateral filtering, and cleanup processing (as shown inTable 3). The number of boundaries with misorientations 2.0–5.01increases after cleanup processing (Table 4). The number of
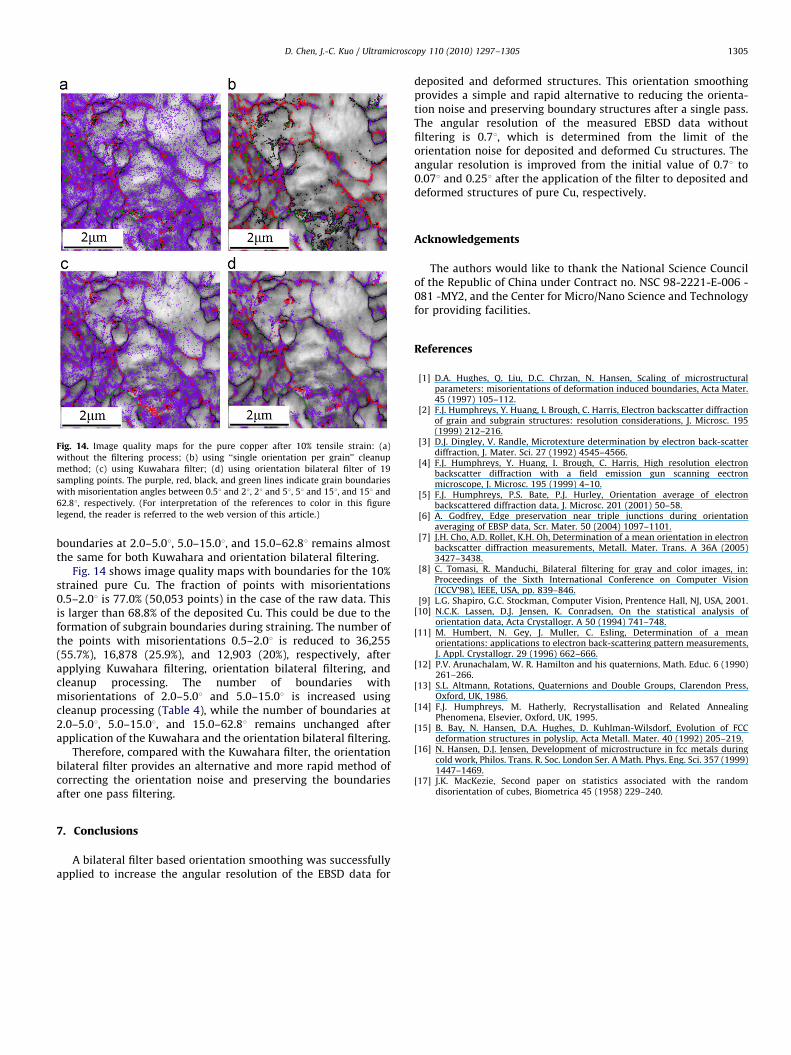
Fig. 14. Image quality maps for the pure copper after 10% tensile strain: (a)
without the filtering process; (b) using ‘‘single orientation per grain’’ cleanup
method; (c) using Kuwahara filter; (d) using orientation bilateral filter of 19
sampling points. The purple, red, black, and green lines indicate grain boundaries
with misorientation angles between 0.51 and 21, 21 and 51, 51 and 151, and 151 and
62.81, respectively. (For interpretation of the references to color in this figure
legend, the reader is referred to the web version of this article.)
D. Chen, J.-C. Kuo / Ultramicroscopy 110 (2010) 1297–1305 1305
boundaries at 2.0–5.01, 5.0–15.01, and 15.0–62.81 remains almostthe same for both Kuwahara and orientation bilateral filtering.
Fig. 14 shows image quality maps with boundaries for the 10%strained pure Cu. The fraction of points with misorientations0.5–2.01 is 77.0% (50,053 points) in the case of the raw data. Thisis larger than 68.8% of the deposited Cu. This could be due to theformation of subgrain boundaries during straining. The number ofthe points with misorientations 0.5–2.01 is reduced to 36,255(55.7%), 16,878 (25.9%), and 12,903 (20%), respectively, afterapplying Kuwahara filtering, orientation bilateral filtering, andcleanup processing. The number of boundaries withmisorientations of 2.0–5.01 and 5.0–15.01 is increased usingcleanup processing (Table 4), while the number of boundaries at2.0–5.01, 5.0–15.01, and 15.0–62.81 remains unchanged afterapplication of the Kuwahara and the orientation bilateral filtering.
Therefore, compared with the Kuwahara filter, the orientationbilateral filter provides an alternative and more rapid method ofcorrecting the orientation noise and preserving the boundariesafter one pass filtering.
7. Conclusions
A bilateral filter based orientation smoothing was successfullyapplied to increase the angular resolution of the EBSD data for
deposited and deformed structures. This orientation smoothingprovides a simple and rapid alternative to reducing the orienta-tion noise and preserving boundary structures after a single pass.The angular resolution of the measured EBSD data withoutfiltering is 0.71, which is determined from the limit of theorientation noise for deposited and deformed Cu structures. Theangular resolution is improved from the initial value of 0.71 to0.071 and 0.251 after the application of the filter to deposited anddeformed structures of pure Cu, respectively.
Acknowledgements
The authors would like to thank the National Science Councilof the Republic of China under Contract no. NSC 98-2221-E-006 -081 -MY2, and the Center for Micro/Nano Science and Technologyfor providing facilities.
References
[1] D.A. Hughes, Q. Liu, D.C. Chrzan, N. Hansen, Scaling of microstructuralparameters: misorientations of deformation induced boundaries, Acta Mater.45 (1997) 105–112.
[2] F.J. Humphreys, Y. Huang, I. Brough, C. Harris, Electron backscatter diffractionof grain and subgrain structures: resolution considerations, J. Microsc. 195(1999) 212–216.
[3] D.J. Dingley, V. Randle, Microtexture determination by electron back-scatterdiffraction, J. Mater. Sci. 27 (1992) 4545–4566.
[4] F.J. Humphreys, Y. Huang, I. Brough, C. Harris, High resolution electronbackscatter diffraction with a field emission gun scanning eectronmicroscope, J. Microsc. 195 (1999) 4–10.
[5] F.J. Humphreys, P.S. Bate, P.J. Hurley, Orientation average of electronbackscattered diffraction data, J. Microsc. 201 (2001) 50–58.
[6] A. Godfrey, Edge preservation near triple junctions during orientationaveraging of EBSP data, Scr. Mater. 50 (2004) 1097–1101.
[7] J.H. Cho, A.D. Rollet, K.H. Oh, Determination of a mean orientation in electronbackscatter diffraction measurements, Metall. Mater. Trans. A 36A (2005)3427–3438.
[8] C. Tomasi, R. Manduchi, Bilateral filtering for gray and color images, in:Proceedings of the Sixth International Conference on Computer Vision(ICCV’98), IEEE, USA, pp. 839–846.
[9] L.G. Shapiro, G.C. Stockman, Computer Vision, Prentence Hall, NJ, USA, 2001.[10] N.C.K. Lassen, D.J. Jensen, K. Conradsen, On the statistical analysis of
orientation data, Acta Crystallogr. A 50 (1994) 741–748.[11] M. Humbert, N. Gey, J. Muller, C. Esling, Determination of a mean
orientations: applications to electron back-scattering pattern measurements,J. Appl. Crystallogr. 29 (1996) 662–666.
[12] P.V. Arunachalam, W. R. Hamilton and his quaternions, Math. Educ. 6 (1990)261–266.
[13] S.L. Altmann, Rotations, Quaternions and Double Groups, Clarendon Press,Oxford, UK, 1986.
[14] F.J. Humphreys, M. Hatherly, Recrystallisation and Related AnnealingPhenomena, Elsevier, Oxford, UK, 1995.
[15] B. Bay, N. Hansen, D.A. Hughes, D. Kuhlman-Wilsdorf, Evolution of FCCdeformation structures in polyslip, Acta Metall. Mater. 40 (1992) 205–219.
[16] N. Hansen, D.J. Jensen, Development of microstructure in fcc metals duringcold work, Philos. Trans. R. Soc. London Ser. A Math. Phys. Eng. Sci. 357 (1999)1447–1469.
[17] J.K. MacKezie, Second paper on statistics associated with the randomdisorientation of cubes, Biometrica 45 (1958) 229–240.