A conceptual framework for the effective implementation of statistical process control
19
Business Process Management Journal A conceptual framework for the effective implementation of statistical process control Jiju Antony Tolga Taner Article information: To cite this document: Jiju Antony Tolga Taner, (2003),"A conceptual framework for the effective implementation of statistical process control", Business Process Management Journal, Vol. 9 Iss 4 pp. 473 - 489 Permanent link to this document: http://dx.doi.org/10.1108/14637150310484526 Downloaded on: 25 September 2014, At: 17:02 (PT) References: this document contains references to 22 other documents. To copy this document: [email protected] The fulltext of this document has been downloaded 2355 times since 2006* Users who downloaded this article also downloaded: Jiju Antony, (2000),"Ten key ingredients for making SPC successful in organisations", Measuring Business Excellence, Vol. 4 Iss 4 pp. 7-10 Jiju Antony, Alejandro Balbontin, Tolga Taner, (2000),"Key ingredients for the effective implementation of statistical process control", Work Study, Vol. 49 Iss 6 pp. 242-247 Roland Caulcutt, (1996),"Statistical process control (SPC)", Assembly Automation, Vol. 16 Iss 4 pp. 10-14 Access to this document was granted through an Emerald subscription provided by 173423 [] For Authors If you would like to write for this, or any other Emerald publication, then please use our Emerald for Authors service information about how to choose which publication to write for and submission guidelines are available for all. Please visit www.emeraldinsight.com/authors for more information. About Emerald www.emeraldinsight.com Emerald is a global publisher linking research and practice to the benefit of society. The company manages a portfolio of more than 290 journals and over 2,350 books and book series volumes, as well as providing an extensive range of online products and additional customer resources and services. Emerald is both COUNTER 4 and TRANSFER compliant. The organization is a partner of the Committee on Publication Ethics (COPE) and also works with Portico and the LOCKSS initiative for digital archive preservation. *Related content and download information correct at time of download. Downloaded by HERIOT WATT UNIVERSITY At 17:02 25 September 2014 (PT)
Transcript of A conceptual framework for the effective implementation of statistical process control
Business Process Management JournalA conceptual framework for the effective implementation of statistical process controlJiju Antony Tolga Taner
Article information:To cite this document:Jiju Antony Tolga Taner, (2003),"A conceptual framework for the effective implementation of statisticalprocess control", Business Process Management Journal, Vol. 9 Iss 4 pp. 473 - 489Permanent link to this document:http://dx.doi.org/10.1108/14637150310484526
Downloaded on: 25 September 2014, At: 17:02 (PT)References: this document contains references to 22 other documents.To copy this document: [email protected] fulltext of this document has been downloaded 2355 times since 2006*
Users who downloaded this article also downloaded:Jiju Antony, (2000),"Ten key ingredients for making SPC successful in organisations", Measuring BusinessExcellence, Vol. 4 Iss 4 pp. 7-10Jiju Antony, Alejandro Balbontin, Tolga Taner, (2000),"Key ingredients for the effective implementation ofstatistical process control", Work Study, Vol. 49 Iss 6 pp. 242-247Roland Caulcutt, (1996),"Statistical process control (SPC)", Assembly Automation, Vol. 16 Iss 4 pp. 10-14
Access to this document was granted through an Emerald subscription provided by 173423 []
For AuthorsIf you would like to write for this, or any other Emerald publication, then please use our Emerald forAuthors service information about how to choose which publication to write for and submission guidelinesare available for all. Please visit www.emeraldinsight.com/authors for more information.
About Emerald www.emeraldinsight.comEmerald is a global publisher linking research and practice to the benefit of society. The companymanages a portfolio of more than 290 journals and over 2,350 books and book series volumes, as well asproviding an extensive range of online products and additional customer resources and services.
Emerald is both COUNTER 4 and TRANSFER compliant. The organization is a partner of the Committeeon Publication Ethics (COPE) and also works with Portico and the LOCKSS initiative for digital archivepreservation.
*Related content and download information correct at time of download.
Dow
nloa
ded
by H
ER
IOT
WA
TT
UN
IVE
RSI
TY
At 1
7:02
25
Sept
embe
r 20
14 (
PT)
A conceptual framework forthe effective implementation of
statistical process controlJiju Antony
Warwick Manufacturing Group, University of Warwick,Coventry, UK, andTolga Taner
Institute of Biomedical Engineering, Bogazici University,Istanbul, Turkey
Keywords Statistical process control, Quality, Critical success factors
Abstract Statistical process control (SPC) is a powerful technique which organisations can use intheir pursuit of continuous improvement of both product and service quality. Many organisations inthe UK are still learning about the successful introduction, development and implementation of SPC,even though it has been widely and commonly used in many Japanese organisations with greatsuccess. Research in the UK academic institutions has clearly indicated that the only thing taught toengineers in relation to SPC is control charting and the mathematical aspects of the subject ratherthan the implementation aspects of the technique. It can be argued that it is not just control chartswhich makes SPC initiative successful in organisations, rather the emphasis should be on the criticalfactors which are essential for the success of SPC program and also issues such as “how to getstarted” and “where to get started”. This paper compares the existing frameworks for SPCimplementation in terms of their strengths and weaknesses and then illustrates a conceptualframework for the successful introduction and application of SPC program in any organisation. Theframework also shows a systematic approach to apply the SPC technique in an industrial setting.
IntroductionStatistical process control (SPC) is an integral part of monitoring, managing,maintaining and improving the performance of a process (either manufacturingor service) through the effective use of statistical methods. In manyorganisations today, SPC initiatives fail to perform adequately due to the lackof understanding of the technique and its applicability within the organisation.It is recognised that failure to operate SPC effectively may result in increasedproduct recalls, product rework, scrap rate, customer complaints, warrantycosts and decreased profit margin, productivity, market share, etc. (Little, 2001).
The lack of SPC success in some companies may be related to the adoptionof a wrong methodology (Ribeiro and Cabral, 1999). In many cases, peopleblindly believe that SPC is about plotting of control charts and sticking them onthe walls for satisfying customers. It is important to note that SPC uses controlcharts to indicate when to adjust a process when it is going out of statisticalcontrol. However it does not tell the user what is wrong with the process. In thewestern world, the consensus is that SPC should be implemented for customer
The Emerald Research Register for this journal is available at The current issue and full text archive of this journal is available at
http://www.emeraldinsight.com/researchregister http://www.emeraldinsight.com/1463-7154.htm
Implementationof SPC
473
Business Process ManagementJournal
Vol. 9 No. 4, 2003pp. 473-489
q MCB UP Limited1463-7154
DOI 10.1108/14637150310484526
Dow
nloa
ded
by H
ER
IOT
WA
TT
UN
IVE
RSI
TY
At 1
7:02
25
Sept
embe
r 20
14 (
PT)

satisfaction rather than part of a strategic plan by the company (Oakland,1999).
Recent research has indicated that within many engineering institutions inthe UK, very little time is spent on management and implementation aspects ofSPC. The main focus seems to be on control charting of processes and themathematical aspects of the subject. This invokes fear amongst the engineeringfraternity. This argument can be reinforced by the following statement:
Too often organisations look at “the control chart” as the only approach to handle issues andthis will not work (Xie and Goh, 1999).
The successful application of SPC rather requires a blend of planning skills,engineering skills, management skills, statistical skills and communicationskills (Antony, 2000). In academic world, the emphasis must be on the criticalfactors that are essential for the effective introduction and implementation ofSPC. This paper makes an attempt to illustrate a conceptual framework thattakes all the critical factors into account for the successful implementation ofSPC in any industrial setting.
Inspection-based quality control vs prevention-based quality controlThe traditional approach to manufacturing is to rely on production to make theproduct and on quality control to inspect the final product and screen out itemsnot meeting specifications. This involves a strategy of “detection” or“inspection”. Inspection is an activity which is often expensive, unreliable andprovides very little information as to why the defects or errors occurred andhow they can be corrected. Figure 1 shows the generalised process diagram fora process operating on an inspection-based quality control.
Figure 1.Inspection-basedquality control
BPMJ9,4
474
Dow
nloa
ded
by H
ER
IOT
WA
TT
UN
IVE
RSI
TY
At 1
7:02
25
Sept
embe
r 20
14 (
PT)

Problems with the above approach include:. Inspection-based quality control approach is reactive in the sense that
defective items will be made before they are found and thus will incurscrapping or reworking costs. Dr Deming calls this as “burning the toastand then scraping it ”.
. There is no such thing as an infallible inspection system. There is alwaysa probability that good item will be rejected and bad item will beaccepted.
. Assessing products for pass or fail is not informative in terms ofcontinuous improvement of product or process quality.
The logical way to overcome the problems associated with this type ofapproach is to apply preventative techniques at the operation stage to ensurethat the product is produced to the required quality. Such an approach requiresthe application of statistical methods to monitor, analyse, manage and improvethe process performance and thereby improve product quality. This approachis called SPC (see Figure 2).
Problems and difficulties in the implementation of SPC inorganisationsThe following points seem to inhibit the successful application of SPC inorganisations:
. Lack of commitment and involvement of top management. One of the mostcommon reasons for the failure of SPC implementation in manyorganisations is due to lack of commitment and involvement of topmanagement (Mason and Antony, 2000). It is always important toremember that change within the organisation cannot occur until there isa “change agent” present. In this case, the change agent would usually betop or senior management representatives. Management mustunderstand that variability-reduction techniques such as SPC are theirresponsibility and therefore they should be the first recipients of SPCtraining. They should believe in SPC as a powerful problem-solving tooland understand the requirements or key ingredients for a successful SPCsystem within the organisation.
. Lack of training and education in SPC. Lack of training and education inSPC creates problems company-wide, from the operators to the senior
Figure 2.Prevention-based
quality control
Implementationof SPC
475
Dow
nloa
ded
by H
ER
IOT
WA
TT
UN
IVE
RSI
TY
At 1
7:02
25
Sept
embe
r 20
14 (
PT)

management, because there is a general lack of understanding andawareness of why SPC is being implemented. The purpose of this trainingand education is to establish a culture in which SPC is welcomed as apowerful quality management technique to understand, manage andreduce variation due to special causes and to support the goal ofcontinuous improvement (Gaafar and Keats, 1992).
. Failure to interpret control charts and take any necessary actions. Thepurpose of a control chart is not only just to hunt for special causes ofvariation but also to bring a process into a state of statistical control bytaking appropriate remedial actions on the process. The emphasis mustbe placed on the selection of and interpretation of control charts and noton the construction of control charts. Many existing training programmeshave given an awful lot of importance on the construction of controlcharts and not on when, where and why a particular control chart must bechosen for a certain process.
. Lack of knowledge of which product characteristics or process parametersto measure and monitor within a process. Many SPC initiatives inorganisations get kicked-off without having a good understanding of theprocess and the product characteristics or parameters related to coreprocesses. It is best to identify the key process parameters and itsrelationship to process output using experimental design methods.Experimental design is a powerful technique to discover a set of processvariables which are most important to the process and determine at whatlevels these variables should be kept to optimise the process output(Montgomery, 1991a, b). The critical product characteristics may beidentified from a quality function deployment exercise by working closelywith customers (Chen, 1995).
. Invalid and incapable measurement system at workplace. Measurement is aprocess, and varies, just like all processes vary. Many organisations oftenignore the variation associated with the measurement system that iscertainly an important feature for the successful implementation of SPC inorganisations. There is uncertainty in every measurement that is takenand this can be attributed to a number of key inputs such as gauges,operators, parts, methods or the interaction between these inputs. If themeasurement system is not capable, the SPC study must be deferred (Birdand Dale, 1994).
. SPC should be implemented not as a customer requirement rather it mustbe used to make customers happy with your stability and capability ofprocesses. SPC should not be used as a requirement from your customers.It should be used to improve the stability and capability of processes thatare most critical to your customers and thereby a distinct competitiveedge and increased market share can be generated.
BPMJ9,4
476
Dow
nloa
ded
by H
ER
IOT
WA
TT
UN
IVE
RSI
TY
At 1
7:02
25
Sept
embe
r 20
14 (
PT)

Frameworks for SPC implementation: a comparative studyThis section of the paper is primarily focused on the results of a comparativestudy of existing frameworks for the implementation of SPC. The results of thestudy are principally looking at the strengths and limitations of eachframework.
Framework 1. Oakland’s (1999) frameworkStrengths of framework 1. The main strength of this framework lies on theimportance of follow-up SPC training at a pre-determined interval. Accordingto Oakland (1999), the successful formula is the in-house training course plusfollow-up projects and workshops. He encourages the presence of seniormanagement within the organisations in all follow-up activities. Another goodpoint with Oakland’s framework is on the importance of tackling one process orproblem at a time until the process is satisfactory, before moving onto the next.This gives commitment and a focus to each process in turn.
Limitations of framework 1. Oakland (1999) advocates the use of Paretoanalysis for prioritising processes on which SPC can be implemented. Thereis no indication for whatsoever on how to prioritise or select processes forSPC studies. Moreover, there is a lack of instruction on how relevant datamight be collected and analysed from a process. The importance ofmeasurement system capability is clearly missing in the framework. Theformation of teams and the significance of teamwork for out-of-controlsituations are not mentioned.
Framework 2. Watson’s (1998) frameworkStrengths of framework 2. The main strength of this framework is theimportance of measurement system capability study as part of SPCimplementation (Watson, 1998). Empowerment is another important aspect.Management should give process ownership to the operators so that they cantake remedial actions on the process without relying too much on themanagement. The result is that workers have responsibility and this helps tobuild good working relations between operators and top management. Theframework also accentuates the selection of SPC facilitator for the successfulintroduction and development of SPC programme within organisations. TheSPC facilitator should also be able to provide technical and statistical advice onall aspects of SPC to people within the organisation.
Limitations of framework 2. There is no mention of managementinvolvement or commitment in the framework. In fact, this is one of themost important ingredients for the successful kick-off of an SPC pilot studywithin any organisation. No explanation is given on how to prioritise processesfor SPC pilot studies and what are the criteria for the selection of SPC pilotprojects.
Implementationof SPC
477
Dow
nloa
ded
by H
ER
IOT
WA
TT
UN
IVE
RSI
TY
At 1
7:02
25
Sept
embe
r 20
14 (
PT)

Framework 3. Kumar and Motwani’s (1996) frameworkStrengths of framework 3. The main strength of this framework is on theimportance of training for both top management and operators. The frameworkemphasises the importance of a capable measurement system as a pre-requisitefor SPC implementation. The framework does refer to customer requirementsearly on. This is important because the process specifications must be clearlyunderstood before SPC can be applied correctly. Another good point with theframework is on the formation of an SPC implementation team.
Limitations of framework 3. One of the fundamental limitations withframework 3 is the fact that there is no indication whatsoever as to how toselect a process for SPC implementation. It does not mention anything onprocess prioritisation or how to identify key processes from a large number ofprocesses. The framework does not provide any guidance for out of controlsituations.
Framework 4. Does et al.’s (1997) frameworkStrengths of framework 4. The framework provided by Does et al. (1997) is themost comprehensive of the four frameworks considered in this paper. Theframework suggests splitting the implementation process into two areas;organisational and methodological. This could help separating themanagement issues from those of the operators. The framework encouragesthe usage of SPC pilot study to a critical process within the business ratherthan applying SPC principles simultaneously to a number of processes. Theframework provides some useful guidance on the use of cause and effectanalysis, Pareto analysis and failure mode and effect analysis to assist with theprioritisation of critical processes for SPC implementation. Another excellentfeature of the framework is an “out of control action plan” (OCAP) with theassistance of steering committee, top management and process action team(involving process engineers, quality engineers, maintenance engineers,operators, etc.).
Limitations of framework 4. There is very little stated on the importance oftraining and education. The importance of management involvement,commitment and support for the introduction and development of SPCprogram is not emphasised adequately.
A conceptual framework for the implementation of SPCThe framework proposed in this paper aims to address the limitations of theabove frameworks explained above. Moreover the framework has beendeveloped from a critical analysis of existing literature on SPC. The first step inthe development of the conceptual framework was to determine the essentialingredients that will make the application successful. Four essential areas thatshould be the focus are: management issues; engineering skills; statisticalskills; and teamwork skills (see also Figure 3):
BPMJ9,4
478
Dow
nloa
ded
by H
ER
IOT
WA
TT
UN
IVE
RSI
TY
At 1
7:02
25
Sept
embe
r 20
14 (
PT)
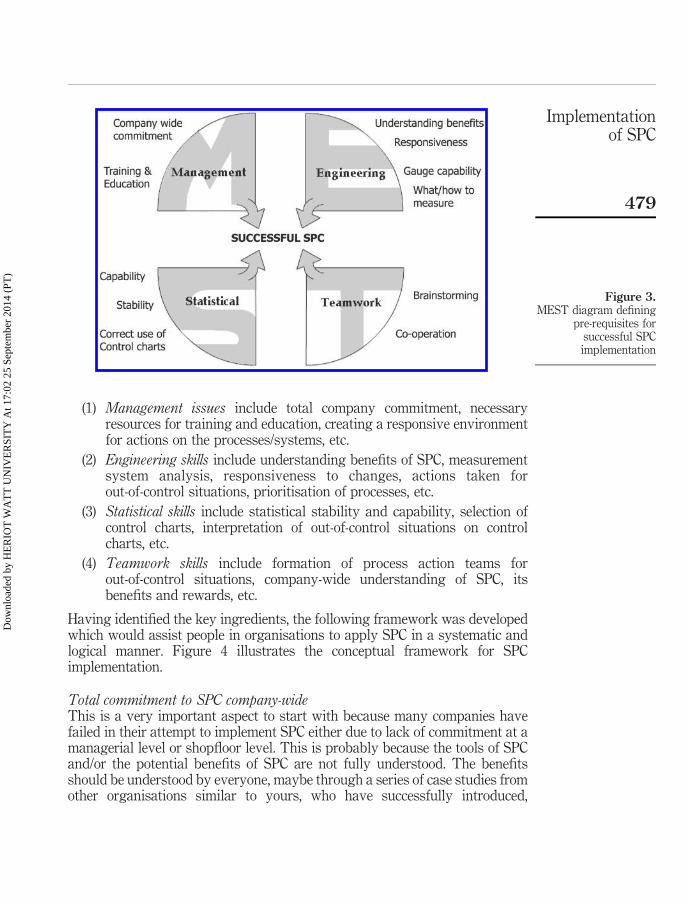
(1) Management issues include total company commitment, necessaryresources for training and education, creating a responsive environmentfor actions on the processes/systems, etc.
(2) Engineering skills include understanding benefits of SPC, measurementsystem analysis, responsiveness to changes, actions taken forout-of-control situations, prioritisation of processes, etc.
(3) Statistical skills include statistical stability and capability, selection ofcontrol charts, interpretation of out-of-control situations on controlcharts, etc.
(4) Teamwork skills include formation of process action teams forout-of-control situations, company-wide understanding of SPC, itsbenefits and rewards, etc.
Having identified the key ingredients, the following framework was developedwhich would assist people in organisations to apply SPC in a systematic andlogical manner. Figure 4 illustrates the conceptual framework for SPCimplementation.
Total commitment to SPC company-wideThis is a very important aspect to start with because many companies havefailed in their attempt to implement SPC either due to lack of commitment at amanagerial level or shopfloor level. This is probably because the tools of SPCand/or the potential benefits of SPC are not fully understood. The benefitsshould be understood by everyone, maybe through a series of case studies fromother organisations similar to yours, who have successfully introduced,
Figure 3.MEST diagram defining
pre-requisites forsuccessful SPCimplementation
Implementationof SPC
479
Dow
nloa
ded
by H
ER
IOT
WA
TT
UN
IVE
RSI
TY
At 1
7:02
25
Sept
embe
r 20
14 (
PT)

Figure 4.A conceptual frameworkfor the implementationof SPC
BPMJ9,4
480
Dow
nloa
ded
by H
ER
IOT
WA
TT
UN
IVE
RSI
TY
At 1
7:02
25
Sept
embe
r 20
14 (
PT)

developed and implemented SPC. This would help the people within theorganisation to understand the need for SPC and ease the introduction process.
The management should be prepared to address any resistance to changethat might be present within the organisation, plus any fear of training orreluctance to embrace the technique SPC and its tools. Eckes (2001) identifiesfour different factors of resistance, which are:
(1) Technical. Frequently people found difficulties in understandingstatistical elements within the technique SPC. This can be tackled bycontinuous education and training programmes.
(2) Political. It is based on seeking the solution to be implemented as a loss,real or imagined. The strategy to avoid this is creating the need forchange and then showing how change can be beneficial for them.
(3) Individual. It consists of employees who are highly stressed as a result ofpersonal problems, and not associated with the company. The strategycould be to try to reduce stress with a less workload.
(4) Organisational. This occurs when an entire organisation is committed tocertain underlying beliefs, which are usually instituted by themanagement. Reluctance to change can be reduced by communicatingto the managers the benefits of the initiative.
Some companies that have succeeded in managing change have identified thatthe best way to tackle resistance to change is through increased and sustainedcommunication, motivation and education. Perhaps an aid to reducingresistance to change is to introduce incentive schemes and award team bonuseswhen specific goals are met in processes using SPC applications.
Training and education with follow-upsOakland (1999) suggested that training for SPC must start at the top of theorganisation and should then be cascaded down through the organisationalhierarchy. Training should include exposure to relevant statistics, creation ofcontrol charts, tools of SPC, types of control charts, assumptions in controlchart theory, interpretation of control charts and appreciation of the reasons forSPC. Training should not just be short-term but should involve educating on along-term basis, with regular training follow-ups and briefings. Softwarepackages will only be introduced after the underlying principles of SPC (i.e.why, where, when, etc.) are understood.
Formation of SPC implementation teamFor the effective introduction of SPC, it is strongly suggested to build across-functional team encompassing top management, steering committee anda process action team (Does et al., 1999). Does et al. (1999) propose that animplementation team should consists of: two to five operators (depending onthe number of shifts and their supervisors, a process engineer, maintenance
Implementationof SPC
481
Dow
nloa
ded
by H
ER
IOT
WA
TT
UN
IVE
RSI
TY
At 1
7:02
25
Sept
embe
r 20
14 (
PT)

engineer, SPC facilitator and a quality engineer, quality manager, productionmanager, purchasing manager, etc. The steering committee (involving the SPCfacilitator, purchasing manager, quality manager, production manager, etc.)should initiate the introduction, development and implementation process ofSPC and should be directly responsible to management. The following aresome of the functions of steering committee:
. to promote SPC awareness;
. to provide necessary training and resources with the support from topmanagement; and
. to provide continuous support to SPC implementation team.
It is always a good practice to select an SPC facilitator or co-ordinator (chosenfrom the steering committee) for the overall implementation of SPC. Bird andDale (1994) observe that companies who appoint an SPC facilitator are lesslikely to experience difficulties with the introduction and application of SPC.The facilitator can be from within or outside the organisation.
The steering committee and top management should play a supporting rolefor the process action team who are responsible for taking necessary actions onthe process once special or assignable causes of variation are identified. Atypical process action team may include operators, their supervisors, a processengineer, production engineer, etc.
Process prioritisation for SPC studiesNormally, all products are produced through a variety of different processesor sub-processes which all contribute towards the quality of the finalproduct. It is not practical to apply SPC manufacturing-wide in the firstinstance due to cost and time constraints. The best way to tackle thisproblem is by prioritising processes according to their technical andstatistical criticality (Goh and Xie, 1998). Here technical criticality refers tohow important the process is relative to the quality of the final product andthe production process. Statistical criticality refers to both statistical stabilityand capability of the process.
The approach taken by Goh and Xie (1998) is called analytic hierarchyprocess (AHP). AHP is actually a multi-criteria decision making technique thatis particularly useful for complex multi-attribute alternatives involvingsubjective criteria (Saaty, 1980). The same principle is used to determine thepriority of the processes involved in SPC planning. Goh and Xie (1998) providean excellent explanation with a well illustrated example on processprioritisation using the AHP in their paper. Once the processes have beenprioritised, the next stage should be process understanding that would help todefine the customer requirements. One of the initial steps to understand orimprove a process is to gather data about the important activities within theprocess so that a “dynamic model” may be constructed (Oakland, 1999).
BPMJ9,4
482
Dow
nloa
ded
by H
ER
IOT
WA
TT
UN
IVE
RSI
TY
At 1
7:02
25
Sept
embe
r 20
14 (
PT)

Pilot study/cost-benefit analysisIt is always a good practice to acquire an appreciation of the power of SPC bymeans of a pilot study. If SPC is implemented too quickly and without properplanning, there is always a chance of overlooking some of the essentialingredients that are essential for success. A better approach is to apply SPC toone process and gradually extend its use to other processes within theorganisation after it has been successfully applied to the first process.Feedback from the pilot experiments can be obtained and assessed by thesteering committee and management. It is also worthwhile to consider acost-benefit analysis to determine if it is actually financially beneficial toimplement SPC. Does et al. (1997) propose that depending on the complexityand size of a process, a typical pilot study may take from three months to morethan a year.
Measurement system analysis (MSA)Measurement is a process that varies just as all processes vary. Identifying,isolating and removing measurement variation would lead to improvement tothe actual measured values obtained from the measurement process.
The purpose of a MSA is to determine the variability accounted for bythe measurement or gauge system for making measurements. This analysisis used to see if gauges used to make measurements in a process arecapable. Measurement system variability basically consists of repeatability(i.e. variation in the measurement device itself) and reproducibility (i.e.variation in using the measurement devices). Gauge repeatability is alsocalled gauge error and reproducibility can be divided into two componentsof variation: variation due to operators and variation due to (part x operator)interaction.
A gauge is considered to be capable if the precision-to-tolerance ratio (P/Tratio) is less than 0.1 (i.e. 10 per cent). It is also advised to calculate thevariability accounted for by the gauge and calculate the ratio of gaugevariability to total variability (Montgomery and Runger, 1993/1994). Forcapable gauges, this ratio must also be less than or equal to 10 per cent. If themeasurement system is not capable, the SPC study should be deferred (Birdand Dale, 1994).
Construct control chartsA control chart is a tool to detect assignable or special causes of variationpresent in a process. The primary use of a control chart is to detect whether amajor change or shift has occurred in a process resulting in an alteration in themean value or dispersion of the process (Bergman and Klefsjo, 1994). Selectionof appropriate control charts is an important aspect towards successfulimplementation of SPC. It is worthwhile considering the following points whileconstructing control charts:
Implementationof SPC
483
Dow
nloa
ded
by H
ER
IOT
WA
TT
UN
IVE
RSI
TY
At 1
7:02
25
Sept
embe
r 20
14 (
PT)

. establish a suitable and responsive environment for action;
. define the process where SPC must be applied and its link to otherprocesses both upstream and downstream;
. determine the quality characteristic (or process parameters) which needsto be measured, monitored and managed;
. define the measurement system and determine whether or not the currentmeasurement system is capable to do its intended job;
. understand the type of data and select a suitable control chart for theprocess.
Figure 5 provides some useful guidance for the selection of a suitable controlchart in industrial settings. For a detailed explanation of the types of controlcharts and their construction, refer to Montgomery (1991a, b) and Oakland(1999).
Interpretation of control chartsThere are several rules that should be adhered to when interpreting controlcharts to determine whether a process is in or out of control. However thefollowing rules provide some guidance which would assist with theinterpretation of control charts:
. Rule 1. A process is said to be out of control if a point falls outside thecontrol limits.
. Rule 2. A process is said to be out of control if two out of three successivepoints fall outside the warning limits on the same side of the centre line.Warning limits are placed at two standard deviations from the centre line.
. Rule 3. A process is said to be out of control if four out of five successivepoints fall outside one sigma limit on the same side of the centre line.
. Rule 4. A process is out of control if seven or more successive points fallon one side of the centre line.
. Rule 5. A process is said to be out of control if there is a run of seven ormore successive points either above or below the centre line.
. Rule 6. A process is said to be out of control if the chart shows periodiclow and high points (also called a cyclic pattern of variation).
If the process is considered to be out-of-control (or unstable), possible reasonsfor out-of-control situations should be investigated immediately. Thisinvestigation may take in the form of a problem solving process. In otherwords, an out-of-control action plan is necessary when the process exhibitsspecial causes of variation. The incidents of out-of-control should be noted in alogbook or on-line records to help prevent further cases arising. The followingflowchart (refer to Figure 6) is useful when a process has gone out-of-control.
BPMJ9,4
484
Dow
nloa
ded
by H
ER
IOT
WA
TT
UN
IVE
RSI
TY
At 1
7:02
25
Sept
embe
r 20
14 (
PT)

Figure 5.A framework for theselection of suitable
control charts
Implementationof SPC
485
Dow
nloa
ded
by H
ER
IOT
WA
TT
UN
IVE
RSI
TY
At 1
7:02
25
Sept
embe
r 20
14 (
PT)
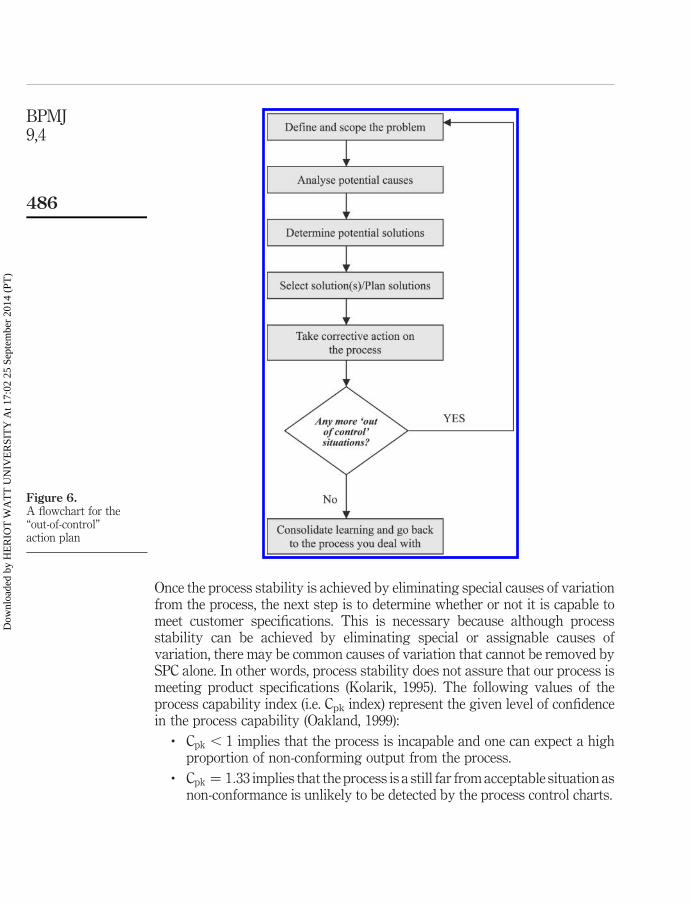
Once the process stability is achieved by eliminating special causes of variationfrom the process, the next step is to determine whether or not it is capable tomeet customer specifications. This is necessary because although processstability can be achieved by eliminating special or assignable causes ofvariation, there may be common causes of variation that cannot be removed bySPC alone. In other words, process stability does not assure that our process ismeeting product specifications (Kolarik, 1995). The following values of theprocess capability index (i.e. Cpk index) represent the given level of confidencein the process capability (Oakland, 1999):
. Cpk , 1 implies that the process is incapable and one can expect a highproportion of non-conforming output from the process.
. Cpk ¼ 1:33 implies that the process is a still far from acceptable situation asnon-conformance is unlikely to be detected by the process control charts.
Figure 6.A flowchart for the“out-of-control”action plan
BPMJ9,4
486
Dow
nloa
ded
by H
ER
IOT
WA
TT
UN
IVE
RSI
TY
At 1
7:02
25
Sept
embe
r 20
14 (
PT)

. Cpk ¼ 1:67 implies that the capability is promising, non-conformingoutput may be expected from the process but there is a very good chancethat it will be detected.
. Cpk $ 2 implies a highly capable process and therefore provides a highlevel of confidence in the manufacturer.
For incapable processes, it is highly recommended to utilise powerfultechniques such as design of experiments (DoE) or Taguchi (Antony and Kaye,1999). These techniques are very powerful for minimising or even eliminatingcommon causes of variation from the process. Having performed thesetechniques in real life situations, it is strongly encouraged to evaluate thepotential benefits in financial terms. This would provide a wider acceptanceand appreciation of the power of such techniques among top management andemployees within the organisation.
When changes or modifications are made to a process either to improve asub-process or the whole process, it is important that they are noted anddocumented. Management should institute policies so as to ensure thatknowledge of any critical processes is reviewed, documented and updated asthe process changes. It is essential that these encountered situations aredocumented and fed forward in order that there is knowledge of what to dowhen a similar situation would arise in the future. Once SPC has beensuccessfully implemented to one process, it is then much easier to extend itsapplications to other processes within the organisation.
ConclusionsSPC is a powerful technique for monitoring, analysing, managing andimproving the performance of a process through the use of statistical methods.Alhough SPC has been widely accepted and used in many Japanese companieswith immense success, it has not yet equally proved to be successful in manywestern companies, particularly in UK organisations. One of the fundamentalproblems related to SPC implementation is that the only thing taught toengineering community in the academic world in relation to SPC is controlcharting and types of control charts. Very little has been taught on themanagement and implementation aspects of SPC, such as, “where to getstarted”, “how to get started”, etc. This problem can be tackled by providing astructured approach (or roadmap) for implementing SPC in organisations. Theroadmap assists engineers recognise the amount of effort and initial costrequired to undertake SPC implementation. The roadmap should look at thefollowing issues:
(1) Recognise the importance of SPC for variability reduction and qualityimprovement within an organisation.
(2) Gain appreciation of SPC from top management and company’s seniorexecutives through a one day training programme.
Implementationof SPC
487
Dow
nloa
ded
by H
ER
IOT
WA
TT
UN
IVE
RSI
TY
At 1
7:02
25
Sept
embe
r 20
14 (
PT)

(3) Extend the training programme to all levels including the operators onthe shop floor.
(4) Identify a pilot project and develop estimates of initial costs andpotential savings from the application of SPC. It is worthwhile carryingout a simple cost-benefit analysis at this stage.
(5) Select an implementation team (involves top management, SPCfacilitator, process manager, quality manager, maintenance manager,R&D manager, operators, etc.).
(6) Evaluate measurement system in order to ensure the capability of themeasurement system.
(7) Select appropriate critical-to-quality characteristics (CTQs) related to theprocess and develop a sampling strategy (i.e. what kind of data needs tobe collected from the process, how often do we need to collect data, howmany samples per sub-group do we need to collect from the process, whois involved in data collection process, etc.).
(8) Select an appropriate control chart (this involves the selection of controlcharts, calculations of control limits, etc.).
(9) Develop a process action team responsible for out-of-control situations.This point must be over-emphasised as this makes the most importantpart of SPC.
(10) Document and update of knowledge of processes (i.e. actions performedand policies instituted to ensure that knowledge of processes arereviewed, documented and updated).
(11) Audit and review of SPC practice (this is to make sure that SPC iscorrectly implemented and practiced).
This paper compares the existing frameworks for SPC implementation in termsof their merits and demerits and then illustrates a conceptual framework for theeffective application of SPC. This framework can be easily taught to theengineering fraternity for wider applications of SPC in an industrial setting.The next stage of our research is to validate the framework in a number oforganisations, especially in terms of the steps involved in the framework andhow does it influence engineers in the context of learning and application ofSPC technique for variability reduction and continuous improvement ofprocess/product quality. Moreover, the author will make an attempt to comparethe current teaching practice of SPC in the UK universities against theproposed roadmap illustrated in this paper. The author would like toaccentuate the point that engineering graduates must be taught themanagement and implementation aspects of SPC rather than teaching justdifferent types of control charts. Control chart is a tool used within the SPCtechnique and it is SPC that must be taught properly in the academic world andnot just control charts.
BPMJ9,4
488
Dow
nloa
ded
by H
ER
IOT
WA
TT
UN
IVE
RSI
TY
At 1
7:02
25
Sept
embe
r 20
14 (
PT)
References
Antony, J. (2000), “Ten key ingredients for making SPC successful in organisations”, MeasuringBusiness Excellence, Vol. 4 No. 4, pp. 7-11.
Antony, J. and Kaye, M. (1999), Experimental Quality: A Strategic Approach to Achieve andImprove Quality, Kluwer Academic Publishers, Norwall, MA.
Bergman, B. and Klefsjo, B. (1994), Quality: From Customer Needs to Customer Satisfaction,McGraw-Hill, London.
Bird, R. and Dale, B. (1994), “The misuse and abuse of SPC: a case study examination”,International Journal of Vehicle Design, Vol. 15 No. 1/2, pp. 99-107.
Chen, L. (1995), Quality Function Deployment: How to Make QFD Work for You,Addison-Wesley, Reading, MA.
Does, R.J.M.M. et al., (1997), “A framework for implementation of statistical process control”,International Journal of Quality Science, Vol. 2 No. 3, pp. 181-98.
Does, R.J.M.M. et al. (1999), Statistical Process Control in Industry, Kluwer Academic Publishers,Norwall, MA.
Eckes, G. (2001), The Six Sigma Revolution, John Wiley & Sons, New York, NY.
Gaafar, L.K. and Keats, J.B. (1992), “Statistical process control: a guide for implementation”,International Journal of Quality & Reliability Management, Vol. 9 No. 4, pp. 9-20.
Goh, T.N. and Xie, M. (1998), “Prioritising processes in initial implementation of SPC”, IEEETransactions on Engineering Management, Vol. 45 No. 1, pp. 66-71.
Kolarik, W.J. (1995), Creating Quality: Concepts, Systems, Strategies and Tools, McGraw-Hill,New York, NY.
Kumar, A. and Motwani, J. (1996), “Doing it right the second time”, Industrial Management &Data Systems, Vol. 6, pp. 14-19.
Little, T.A. (2001), “10 requirements for effective process control: a case study”, Quality Progress,Vol. 34 No. 2, pp. 46-52.
Mason, B. and Antony, J. (2000), “Statistical process control: an essential ingredient forimproving service and manufacturing quality”, Managing Service Quality, Vol. 10 No. 4,pp. 233-8.
Montgomery, D.C. (1991), Introduction to Statistical Quality Control, John Wiley & Sons, NewYork, NY.
Montgomery, D.C. (1991), Design and Analysis of Experiments, John Wiley & Sons, New York,NY.
Montgomery, D.C. and Runger, G.C. (1993/1994), “Gauge capability and designed experiments:part 1 – basic methods”, Quality Engineering, Vol. 6 No. 1, pp. 115-35.
Oakland, J. (1999), Statistical Process Control, Butterworth-Heinemann, Oxford.
Ribeiro, L.M. and Cabral, J.A. (1999), “The use and misuse of statistical tools”, Journal ofMaterials Processing Technology, Vol. 92/93, pp. 288-92.
Saaty, T.L. (1980), The Analytic Hierarchy Process, McGraw-Hill, New York, NY.
Watson, R. (1998), “Implementing self-managed process improvement teams in a continuousimprovement environment”, The TQM Magazine, Vol. 10 No. 4, pp. 246-57.
Xie, M. and Goh, T.N. (1999), “Statistical techniques for quality”, The TQM Magazine, Vol. 11No. 4, pp. 238-41.
Implementationof SPC
489
Dow
nloa
ded
by H
ER
IOT
WA
TT
UN
IVE
RSI
TY
At 1
7:02
25
Sept
embe
r 20
14 (
PT)
This article has been cited by:
1. Jukka Rantamäki, Eeva‐Liisa Tiainen, Tuomo Kässi. 2013. A case of implementing SPC in a pulp mill.International Journal of Lean Six Sigma 4:3, 321-337. [Abstract] [Full Text] [PDF]
2. George J. Besseris. 2013. Robust quality controlling: SPC with box plots and runs test. The TQM Journal25:1, 89-102. [Abstract] [Full Text] [PDF]
3. Rupa Mahanti, James R. Evans. 2012. Critical success factors for implementing statistical process controlin the software industry. Benchmarking: An International Journal 19:3, 374-394. [Abstract] [Full Text][PDF]
4. Jos van Iwaarden, Ton van der Wiele. 2012. The effects of increasing product variety and shorteningproduct life cycles on the use of quality management systems. International Journal of Quality & ReliabilityManagement 29:5, 470-500. [Abstract] [Full Text] [PDF]
5. Maneesh Kumar, Jiju Antony, M.K. Tiwari. 2011. Six Sigma implementation framework for SMEs – aroadmap to manage and sustain the change. International Journal of Production Research 49:18, 5449-5467.[CrossRef]
6. Martyna Sliwa, James O'Kane. 2011. Service quality measurement: appointment systems in UK GPpractices. International Journal of Health Care Quality Assurance 24:6, 441-452. [Abstract] [Full Text][PDF]
7. Evdokia Korakianiti, Dimitrios Rekkas. 2011. Statistical Thinking and Knowledge Management forQuality-Driven Design and Manufacturing in Pharmaceuticals. Pharmaceutical Research 28:7, 1465-1479.[CrossRef]
8. Hollis Landrum, Victor R. Prybutok, Xiaoni Zhang. 2010. The moderating effect of occupation on theperception of information services quality and success. Computers & Industrial Engineering 58:1, 133-142.[CrossRef]
9. Chiao-Tzu Huang, Tsu-Ming Yeh, Wen-Tsann Lin, Bo-Tim Lee. 2009. A fuzzy AHP-basedperformance evaluation model for implementing SPC in the Taiwanese LCD industry. InternationalJournal of Production Research 47:18, 5163-5183. [CrossRef]
10. Martyna Sliwa, Mark Wilcox. 2008. Philosophical thought and the origins of quality management:uncovering conceptual underpinnings of W.A. Shewhart’s ideas on quality. Culture and Organization 14:1,97-106. [CrossRef]
Dow
nloa
ded
by H
ER
IOT
WA
TT
UN
IVE
RSI
TY
At 1
7:02
25
Sept
embe
r 20
14 (
PT)