Effective rural development
141
Effective rural development IFAD’s evidence-based approach to managing for results
-
Upload
khangminh22 -
Category
Documents
-
view
0 -
download
0
Transcript of Effective rural development

Effective ruraldevelopment
IFAD’s evidence-based approach to managing for results

The opinions expressed in this publication are those of the authors and do not necessarily represent
those of the International Fund for Agricultural Development (IFAD). The designations employed and the
presentation of material in this publication do not imply the expression of any opinion whatsoever on
the part of IFAD concerning the legal status of any country, territory, city or area or of its authorities, or
concerning the delimitation of its frontiers or boundaries. The designations “developed” and “developing”
countries are intended for statistical convenience and do not necessarily express a judgement about the
stage reached in the development process by a particular country or area.
This publication or any part thereof may be reproduced for non-commercial purposes without prior
permission from IFAD, provided that the publication or extract therefrom reproduced is attributed to IFAD
and the title of this publication is stated in any publication and that a copy thereof is sent to IFAD.
© IFAD 2018
All rights reserved
ISBN 978-92-9072-839-9
Printed June 2018

Effective rural developmentIFAD’s evidence-based approach to managing for results

3
Table of contents
About the authors ��������������������������������������������������������������������������������������������������������������������������������� 4
Abbreviations and acronyms ����������������������������������������������������������������������������������������������������������������� 9
Chapter 1
IFAD’s approach to promoting effective rural development ������������������������������������������������������������������������10
PART I: Analysing corporate-level evidence
Chapter 2
Approach to attributing IFAD’s aggregate impact �������������������������������������������������������������������������������������30
Chapter 3
IFAD’s disbursement performance: trends and drivers ������������������������������������������������������������������������������46
Chapter 4
Assessment of IFAD’s end-of-project documentation �������������������������������������������������������������������������������59
PART II: Assessing project-level impact
Chapter 5
Ethiopia’s Participatory Small-Scale Irrigation Development Programme (PASIDP) �����������������������������������������64
Chapter 6
Kenya’s Smallholder Dairy Commercialization Programme ������������������������������������������������������������������������70
Chapter 7
Madagascar’s AD2M-I Project ��������������������������������������������������������������������������������������������������������������78
Chapter 8
The Philippines’s Irrigated Rice Production Enhancement Project ���������������������������������������������������������������88
PART III: Analysing the evidence on thematic activities
Chapter 9
Land administration interventions: a systematic review ���������������������������������������������������������������������������100
Chapter 10
Smallholder irrigation in a broader productivity and value chain framework: implications for IFAD investments ���111
Chapter 11
Assessment of IFAD’s policy impact in four countries in Asia ��������������������������������������������������������������������122
Chapter 12
The impact of adoption of CGIAR’s improved varieties on poverty: a systematic review��������������������������������131

4
About the authors
Aslihan Arslan
is a senior agricultural development economist
(research) in the Research and Impact
Assessment Division (RIA), Strategy and
Knowledge Department, IFAD. Before joining
IFAD in January 2017, she worked at FAO as a
natural resource economist, primarily focusing
on research and policy support on climate-smart
agriculture. Prior to that, she was a post-doctoral
research economist at the poverty reduction,
equity and development research group of the
Kiel Institute for the World Economy in Germany.
She holds a PhD and an MSc in agricultural
and resource economics from the University of
California, Davis, and a BSc in economics from
the Middle East Technical University, Ankara.
Tim Balint
is a technical specialist in RIA at IFAD. His work
focuses on analysing the development
effectiveness of IFAD’s investment projects
through quantitative and qualitative techniques,
including impact assessments and systematic
reviews. He also has expertise in strategic
planning, results-based management and
organizational change. He holds a PhD
and master’s degree in politics and public
administration from the University of Konstanz.
Rui Benficais a lead economist in RIA at IFAD. His work
focuses on developing regions. Before joining
IFAD, he worked for the Department of
Agricultural Food and Resource Economics
at Michigan State University as an associate
professor, and for the World Bank, where he held
the positions of economist in the Gender and
Development Group, and poverty economist in
the Africa Region, where he worked on poverty
assessments and poverty and social impact
analyses of public sector reforms. Prior to
obtaining his PhD from Michigan State University,
he was a policy advisor at the USAID Office of
Agriculture and Food Resources in Maputo.
Juan Bonillais a senior economist at the International
Development, Evaluation and Research Program
at American Institutes for Research. He conducts
impact evaluations of social programmes in
developing countries, including agricultural
extension, cash transfers and value chain
interventions. Bonilla has served on the scientific
committee both for the Latin American and the
Caribbean Economic Association, and for the
Brazilian Econometric Society. Before joining
American Institutes for Research, he worked for
the World Bank and was an assistant professor

5
at the University of São Paulo, where he taught
graduate courses in development economics and
applied microeconomics, including programme
evaluation. He holds an MA in economics from
New York University, and a PhD in economics from
the University of Maryland.
Peter Brueckmann
is a specialist in impact assessment and
development effectiveness research in RIA at
IFAD. His research interests are in the areas of
poverty, agriculture, infrastructure and global
health. He previously worked on a research project
in Pakistan, jointly conducted by the Deutsche
Gesellschaft für Internationale Zusammenarbeit
and the University of Göttingen. He holds an MA
in development economics from the University
of Göttingen, and a BSc in economics from the
Philipps-Universität Marburg.
Romina Cavatassi
is a senior technical specialist in RIA at IFAD. Her
areas of expertise are impact evaluation of projects
and programmes, survey design and data collection.
Before joining IFAD, she worked for the Food and
Agriculture Organization of the United Nations (FAO)
as project coordinator, natural resources economist,
in its Agricultural Development Economics Division,
and prior to that as a consultant and also as a junior
economist on several aspects of natural resources,
economic development and poverty reduction. She
holds a PhD in natural resources and development
economics from Wageningen University, an MS in
environmental assessment and evaluation from the
London School of Economics, and a bachelor’s
degree in economics from the University of Bologna.
Constanza Di Nucci
is the senior technical advisor to the Associate
Vice-President of IFAD’s Strategy and Knowledge
Department. She coordinated IFAD’s Rural
Development Report 2016, as well as other
initiatives on rural transformation and policy issues.
She was formerly programme officer at the IFAD
Environment and Climate Division. Before joining
IFAD, she was coordinator of governmental
agencies and international cooperation for WWF
Argentina, and project coordinator of the Center
for the Implementation of Public Policies Promoting
Equity and Growth (CIPPEC). She holds a
master’s degree in public policy from the Harvard
Kennedy School of Government, a postgraduate
degree in management of social organizations
from Universidad Torcuato Di Tella, and a BA
in international relations from the University of
San Andrés.
Alessandra Garberois a senior econometrician in RIA at IFAD. Her work
focuses on impact assessment methodologies
and applied econometrics. Her prior work
experience includes working at the United Nations
Population Division on population projections; in
FAO, on the impact of HIV/AIDS on food security
and agriculture; and at the International Institute
for Applied Systems Analysis, on population
forecasting, demographic modelling and
vulnerability to climate change. She holds a BA
in economics and an MSc in statistics and social
research methods from the University of Rome
La Sapienza, and an MSc in demography from the
London School of Economics. She obtained her
PhD in epidemiology and population health from
the London School of Hygiene & Tropical Medicine.
Edward Heinemannis a lead technical specialist in the Programme
Management Department at IFAD, promoting
IFAD’s country-level policy engagement agenda.
He is the principal author of the 2014 Consultation
Report for the Tenth Replenishment of IFAD’s
resources, IFAD’s 2011 Rural Poverty Report,
and its Strategic Framework 2007-2010, policy
on sector-wide approaches, partnership strategy
and grants policy. Prior to 2007, he worked
first as a country programme manager in East
and Southern Africa, and later as the regional
economist for that region. Before joining IFAD,
he worked at the African Development Bank as
a project officer. He holds a BSc in agricultural
economics from the University of Reading, and
an MA in rural development from the University
of East Anglia.

6
Daniel Higginsis a specialist in impact assessment and
development effectiveness research in RIA at IFAD.
He previously conducted such work for UNESCO,
the University of East Anglia, and a Ugandan
education non-governmental organization. He has
an MSc in impact assessment for international
development, and a BA in development economics,
both from the University of East Anglia.
Harold Liversageis the lead land tenure technical specialist for
IFAD. Prior to joining IFAD in 2004, he worked
in the early 1990s for the association for a land
rights NGO in KwaZulu-Natal, South Africa, and
then as a land reform programme coordinator
for the South African Government from 1996 to
1998. Subsequently he worked as a land tenure
adviser for the Zambézia Agricultural Development
Programme, working with the Government of
Mozambique’s provincial land administration
service and a national land rights NGO. From
2002 to 2004, he worked as a land policy adviser
for the Government of Rwanda/United Kingdom
Department for International Development.
He holds a master’s degree in town and regional
planning from the University of KwaZulu-Natal.
Chandra A. Madramootoois a James McGill Professor of Bioresource
Engineering at McGill University, and Director of the
McGill Water Innovation Lab. He holds BSc, MSc
and PhD degrees from McGill. His areas of expertise
are water management, irrigation and food security.
He is also a visiting professor and visiting scholar
at the Massachusetts Institute of Technology.
He served as dean of the Faculty of Agricultural
and Environmental Sciences at McGill from 2005
to 2015. During his tenure as dean, he created
programmes in integrated water management,
food safety, food security, and innovation and
entrepreneurship. He was founding director
of McGill’s Brace Centre for Water Resources
Management. He holds several awards, including a
DSc (honoris causa) from the University of Guelph.
Paola Malliais a specialist in impact assessment and
development effectiveness research in RIA at
IFAD. Her research interests are in the areas
of poverty, food security, agriculture, rural
development and migration. She previously
worked in FAO’s Agricultural Development
Economics Division. She holds an MSc in
economics from Bocconi University.
Pierre Marion is a quantitative research assistant in the
Young Lives team in the Oxford Department
of International Development at the University
of Oxford. He previously worked as a research
analyst, specialized in impact assessments
and agriculture research in RIA at IFAD as well
as in the FAO Statistics Division. His research
interests are in the areas of poverty, vulnerability,
food security, agriculture and rural development.
He holds an MSc in development economics
from the University of Sussex.
Lisandro Martinis Director of the West and Central Africa
Division and Acting Director of the Operational
Policy and Results Division at IFAD. Prior to
joining IFAD, he worked for the World Bank in
Washington, D.C., where he served as senior
operations officer in charge of its results agenda.
At the World Bank, he also held other positions,
both in headquarters and in the field, including
as a senior results specialist for Bangladesh
and Nepal, based in Dhaka, and as a social
development specialist in the Southern Cone
of Latin America. Between 2008 and 2011, he
worked for the African Development Bank in
Tunisia, where his last position was as principal
results specialist. He holds an MA in public
affairs from Princeton University, where he was a
Fulbright Scholar. He also holds an honours BA
degree in international relations from Universidad
del Salvador.

7
Nancy McCarthyearned a PhD in agriculture and resource
economics from the University of California,
Berkeley in 1996, and a JD from the George
Mason University School of Law in 2009. In 2010,
she founded LEAD Analytics, a consulting firm
that specializes in agricultural economics and
legal analyses to support economic development.
The firm’s clients have included the World Bank,
FAO, Inter-American Development Bank, and 3ie.
Prior to founding LEAD Analytics, she worked at
the International Food Policy Research Institute
(IFPRI) in Washington, D.C., and held a joint
position with IFPRI and the International Livestock
Research Institute based in Nairobi for four years.
Anna McCordis a research economist and sociologist,
specializing in the design and evaluation of social
protection programmes, with a particular interest
in programme impact at household level, public
works and labour markets, and political economy.
She has over 25 years’ experience working
in international development, with experience
throughout sub-Saharan Africa, as well as in
South and South-East Asia; and she has worked
with a range of governments, major donors,
United Nations agencies and non-governmental
agencies. She has an MA in social and political
science from the University of Cambridge, a
diploma in economics from the Open University,
and a master’s and PhD in economics from the
University of Cape Town.
Mitchell Moreyis an economic researcher at American Institutes
for Research. He is responsible for evaluations of
development programmes, with a special focus
on sub-Saharan Africa. He received his PhD in
economics, with a minor in African studies, from
the University of Wisconsin–Madison. Prior to that,
he received a master’s in industrial and labour
relations from Cornell University. He also lived
and worked in Madagascar as a peace volunteer,
teaching English as a foreign language.
Lauren Phillipsis a senior technical specialist in the Programme
Management Department at IFAD, promoting
IFAD’s country-level policy engagement agenda.
From 2008 to 2014, she was an assistant
professor of international political economy in
the Department of International Relations at the
London School of Economics, and also taught at
Johns Hopkins School of Advanced International
Studies Europe. She has published on a wide
range of topics related to the political economy
of development and finance. She previously
worked for the Overseas Development Institute,
and has additional experience in private finance
and international NGOs. She holds a PhD in
international political economy from the London
School of Economics, an MA in international policy
studies from Stanford University, and a BA in
international relations and Latin American studies
from Stanford University.
Silvana Scalzois an administrative associate in RIA at IFAD
responsible for coordinating impact assessment
activities. She has worked as both a research
associate and a statistical associate for various
IFAD divisions since 1990, focusing on corporate
data and databases, and combining these
data into corporate statistical outputs. She
has worked closely with the Organisation for
Economic Co-operation and Development,
reporting on IFAD’s official development assistance
statistics, to ensure IFAD’s historical data are
properly represented in the online Common
Reporting Standard.
Tisorn Songsermsawasis a research analyst in RIA at IFAD. His research
interest focuses on investigating how social
interactions and agricultural interventions relate
to household welfare outcomes. He holds a PhD
in agricultural and applied economics from the
University of Illinois at Urbana-Champaign, and
a BS in economics and statistics from Bucknell
University. His prior experience includes periods

8
at the University of Illinois, teaching development
economics and environmental economics at
undergraduate level; FAO’s Investment Centre,
conducting research on rice production in
Southeast Asia; and the International Crops
Research Institute for the Semi-Arid Tropics,
conducting research on marketing barriers of
small-scale farmers in rural India.
Paul Wintersis the Associate Vice-President of the Strategy
and Knowledge Department, and Director of the
Research and Impact Assessment Division at
IFAD. From 2004 to 2015, he was a professor in
the Department of Economics at the American
University in Washington, D.C., where he taught
courses on impact evaluation, development
economics and environmental economics.
He also worked at the International Potato
Center in Lima, the University of New England,
and the Inter-American Development Bank in
Washington, D.C. He holds a PhD in agricultural
and resource economics from the University of
California, Berkeley, an MA in economics from
the University of California, San Diego, and a BA
in non-Western studies from the University of
San Diego.

9
AD2M-I CGIAR CIS CLPE COSOP CPM DP FFS IA IAI ICO IFAD9 IFAD10 IFI IRPEP MOP-SEDP
M&E NERCORMP
NGO NRD NTP-NRD ORMS PASIDP
PBAS PCR PNPM PRiME RIMS RMF SDCP SDG SO VfM WUA 4Es 4Ps
Appui au Développement du Menabe et du MelakyConsultative Group on International Researchcommunal irrigation systemcountry-level policy engagementCountry Strategic Opportunities Programmecountry programme managerdevelopment partnerfarmer field schoolirrigators associationImpact Assessment InitiativeIFAD country officeNinth Replenishment of IFAD’s ResourcesTenth Replenishment of IFAD’s Resourcesinternational financial institutionIrrigated Rice Production Enhancement Projectmarket-oriented participatory socio-economic development planningmonitoring and evaluationNorth Eastern Region Community Resource Management Project for Upland Areasnon-governmental organizationNew Rural DevelopmentNational Target Program on New Rural DevelopmentOperational Results Management SystemParticipatory Small-Scale Irrigation Development Programmeperformance-based allocation systemproject completion reportNational Programme for Community EmpowermentProgram in Rural Monitoring and EvaluationResults and Impact Management SystemResults Measurement/Management FrameworkSmallholder Dairy Commercialization ProgrammeSustainable Development Goalstrategic objectivevalue for moneywater user associationeconomy, efficiency, effectiveness and equitypublic-private-producer partnerships
Abbreviations and acronyms

10
In September 2015, the United Nations General
Assembly adopted the Sustainable Development
Goals (SDGs) with the aim of ending poverty
and hunger, protecting the planet, and ensuring
prosperity for all, leaving no one behind. Building
on the experience of the Millennium Development
Goals, which accentuated the importance of
thinking through indicators of success as early
as possible, this agenda sought to develop
measurement frameworks that would allow
countries not only to report progress, but also
to manage their implementation strategies,
allocate resources accordingly, and ensure the
accountability of all actors (SDSN, 2015).
The need to focus on and measure development
results has been recognized at each of the four
high-level forums on aid effectiveness (in Rome,
Paris, Accra and Busan in 2003, 2005, 2008
and 2011, respectively). Efforts to modernize,
deepen and broaden development effectiveness
have led to the formulation of frameworks,
strategies and plans in most international financial
institutions (IFIs), including at IFAD. Development
effectiveness – understood as “the extent to
which the development intervention’s objectives
were achieved, or are expected to be achieved,
taking into account their relative importance”
(OECD, 2002, 20) – has become a core
operational principle of international development
organizations (OECD, 2012).
Furthermore, a consensus has emerged
that generating evidence by monitoring and
measuring results can play a strategic role in
informing programme, policy and investment
decisions, and in making them more likely to
achieve development objectives (Segone, 2008).
Sound, relevant and frequent information about
the progress of a given intervention allows
decision makers to assess whether progress is
being made, whether results are being achieved,
and whether changes need to be introduced
in order to reach expected impacts. Indeed,
managing for results leads to better decisions,
which in turn contribute to the achievement of
development results.
However, effectively supporting development is
not just about generating evidence on individual
interventions, it is also about effectively managing
development institutions. The scarce resources
used for development must be employed as
efficiently and effectively as possible to ensure
value for money. Effective development thus
requires examining the policies, procedures
and use of resources of institutions working
in development.
Hence, at both the corporate and project level,
the generation of evidence is central for learning
and accountability. The rapid changes and
increasing complexity and uncertainty of the
IFAD’s approach to promoting effective rural development
Chapter 1
by
Paul Winters
Lisandro Martin
Constanza Di Nucci

11
development landscape create new and evolving
challenges to reaching sustainable development
results. Thus, it is essential for IFIs to monitor
and generate evidence from their own projects,
learn from internally and externally generated
knowledge, and build a culture of continuous
learning and progress towards results.
Working towards achieving development
effectiveness in IFIs does not happen
automatically; it must be made to happen.
It requires a corporate agenda that involves,
among other things: leadership and guidance to
drive change; corporate frameworks to set up
a structure that facilitates the use of evidence in
decisions about the design and implementation
of projects; institutionalized systems that allow
effective monitoring, evaluation and assessment
of interventions; concrete instruments and tools
to harmonize and aggregate results in order to
assess corporate impact; and continuous learning
processes that enhance existing capacities and
knowledge, and ensure that future operations
incorporate learning. For international development
organizations to advance their agendas on
development effectiveness, all of these elements
are necessary. However, they are not sufficient
unless they also build a corporate-wide culture of
results-based management.
With this background in mind, IFAD has
systematically increased its efforts to create a
culture of results-based management and to bring
innovative thinking on development effectiveness
to the organization. Building on previous
efforts to focus on results, IFAD’s Development
Effectiveness Framework was presented to the
Fund’s Executive Board in December 2016 with
the objective of creating the structure needed
to facilitate the use of evidence in decisions on
designing and implementing projects (IFAD,
2016). It proposes a series of actions to overcome
constraints on the generation and use of evidence
in decision-making and seeks to push forward
a results-based agenda. In 2017, during the
Eleventh Replenishment of IFAD’s Resources,
1. These commitments can be found in the Commitment Matrix in Annex 1 of the Report of the Consultation on the Eleventh Replenishment of IFAD’s Resources (IFAD, 2017).
additional commitments were made to enhance
IFAD’s development effectiveness and its value
for money.1
This report reflects IFAD’s ongoing efforts to
generate evidence to inform decision-making at
the corporate and project level. The chapters in
this volume include examples of: corporate-level
evidence analysis (Part I); project-level impact
assessment (Part II); and evidence analysis for
thematic activities (Part III). They are based on
detailed quantitative and qualitative technical
papers that are being or will be published in
appropriate technical products, including in
IFAD’s Research Paper Series and in academic
journals. Overall, the report shows how creating
a culture of results-based management operates
in practice – namely, through a series of different
types of analyses that can inform decisions.
To put these individual chapters into a broader
context, this introductory chapter provides
an overview of IFAD’s results architecture.
This report is the first publication of this type
at IFAD, and it is important to articulate how
these activities fit together. Building on the
Development Effectiveness Framework, it
presents an overview of the ongoing corporate
efforts to develop a culture of results that aims
to go beyond the standard approaches of most
IFIs. Key components of such a system include:
(1) a strong and coherent self-evaluation and
impact assessment system that links project
reporting to corporate reporting; (2) a systematic
understanding of the portfolio that helps identify
corporate indicators and targets as well as
analytics for assessing progress; (3) internal
systems that monitor the use of resources
and link them to corporate outputs, outcomes
and impact to enhance value for money; and
(4) trained staff and partners who understand
and are actively engaged in generating and
using results.
The rest of this chapter covers each of these four
areas in turn. It then provides an overview of the
conclusions of the individual chapters as well as
general conclusions and the challenges ahead.
Ch
apte
r 1

12
From project to corporate measurement: IFAD’s corporate reporting system
An organization’s corporate-level indicators of
success should reflect its strategic goals and
objectives as well as the anticipated pathways
through which it will reach these goals and
objectives. Identifying these indicators should be
relatively straightforward provided that:
(1) it is easy to quantify the stated goals and
objectives; and (2) it is possible to identify
indicators that can be easily aggregated across
projects for corporate results reporting.
For IFIs such as IFAD, which provides
investments primarily through loans to borrowing
countries, projects are the primary means
of achieving corporate strategic goals and
objectives. They are thus the starting point for a
corporate results-based management system.
To be effective in obtaining results, projects
need to be designed to address a development
problem linked to a corporate strategic objective
or goal. Projects not linked to corporate
strategic objectives or goals are not fulfilling the
corporate mandate. Projects that fail to address
a development problem are not targeting a
fundamental reason for underdevelopment.
Figure 1.1 demonstrates the link between a
project and a development problem.
Adequately addressing a development problem
requires analysing the underlying causes of that
problem to allow for careful reflection on its
sources and to determine potential solutions.
The proposed solution should not only be
directly linked to the underlying causes of
underdevelopment, but also have a clear logic
and be based on the available evidence of
what has proved successful in overcoming the
identified constraints.
A development project is a series of inputs
anticipated to lead to an output that should
address the underlying causes limiting
development under certain assumptions.
These inputs and outputs embody the proposed
solution. Assuming they adequately address the
underlying causes constraining beneficiaries, the
expectation is that beneficiaries will respond in a
manner that leads to anticipated outcomes and
the hypothesized impact. In the pathway from
inputs and outputs to outcomes and impacts, a
project should have an underlying logic, or theory
of change, that articulates how the proposed
solution will bring about the desired result and
what the assumptions are behind that logic.
If the proposed solution is successful and brings
about the desired results (outputs, outcomes
and impact), the development problem should
be addressed (as indicated by the arrow in
figure 1.1 showing that the result is linked to the
identified problem).
Thus, projects are hypotheses about how to
address a development problem. The success
of the proposed solution should be verified
through careful collection of data on key results
Inputs Activities
Development problem
Underlying causes
Proposed solution Result
Outputs
Theory of Change
Outcomes Impact
Figure 1.1 Effective projects

13
indicators and analysis of those data. Each
project provides an opportunity to learn whether
and why a solution is effective. This work builds
an evidence base on what approaches are, and
are not, effective and the reasons for success
or limitations.
A sound project theory of change that
addresses a development problem, combined
with effective implementation and strong data
collection, constitutes the first step in assessing
development impacts at the project level.
Assessing this performance at the corporate
level requires aggregating these individual project
results to the corporate level. This, in turn,
requires that projects include indicators that can
be aggregated across interventions.
This is precisely the system IFAD has set up
for corporate reporting, which is summarized
in figure 1.2. The figure shows how IFAD has
organized data collection in individual projects
to build a corporate results reporting system.
To understand this figure, some critical factors
must be considered.
First, every project should have its own data
collection system linked to the project’s theory of
change. At IFAD, this is done through the logical
framework (logframe), which includes indicators
on results to be achieved. Data on these
indicators are collected throughout the project
cycle based on a monitoring and evaluation
(M&E) plan developed at the initiation of the
project. As projects necessarily differ because
they address distinct development problems
in differing contexts, these indicators vary by
project. This presents a challenge for aggregation
to the corporate level because it is not possible
to aggregate different indicators. However, there
are sufficient similarities among IFAD projects
to allow for some similar indicators – what IFAD
refers to as core indicators. These are discussed
further below.
Second, a key part of measuring results
involves attributing them to IFAD interventions.
As discussed more fully in Chapter 2, this is not
challenging at the input and output level, but it is
a significant issue at the impact level, and in many
cases at the outcome level. Because attribution
at the impact level is more complicated, it is
also more costly. Therefore, it is difficult to justify
impact assessments for all projects. For this
reason, IFAD performs impact-level measurement
in only 15 per cent of projects but requires
measurement of outputs and certain outcomes of
all projects. Chapter 2 describes IFAD’s approach
to measuring impact through attributable
impact assessments.
IFAD’s approach is to ensure that all projects have
strong, high-quality logframes with indicators
linked directly to its strategic objectives, which
are in turn drawn from the SDGs. Project-level
Figure 1.2 Corporate- and project-level reporting
PROJECT-LEVEL REPORTING (logframe)
CORPORATE-LEVEL REPORTING
Core indicators RMF indicatorsOutputs Impact
Inputs Outputs Outcomes Impact
Project-speci�c indicators
RMF indicators
100% OF PROJECTS 15% OF PROJECTS
Project indicatorsCustomized for projects
Core indicatorsMandatory when relevant
Note: RMF = Results Management Framework (previously, Results Measurement Framework)�
Ch
apte
r 1

14
indicators are tracked over time using an
online system called the Operational Results
Management System (ORMS).2 As explained in
box 1.1, ORMS includes project data from all
projects in the portfolio at the output level, and in
some cases at the outcome level.
Included in the indicators identified in the
logframes are core indicators – that is, a set
of indicators that are mandatory for projects
2. ORMS replaces the previous system, known as the Results and Impact Management System (RIMS-online).
depending on a project’s sectoral focus.
For example, a project that includes a finance
component would include an indicator on
the numbers of voluntary savers and active
borrowers. A project that promotes agricultural
technologies would include the number of
people trained in crop production or livestock
production practices. And a project that improves
an irrigation system would include hectares
Box 1.1 Operational Results Management System (ORMS)
To help facilitate a results culture and increase the probability of achieving development objectives,
IFAD has put in place the Operational Results Management System (ORMS), a single interconnected
system that provides real-time data on projects for evidence-based decision-making.
ORMS is a fully fledged online platform that allows IFAD to aggregate outputs to the corporate
level. By collecting all the data from each project, the system links expected results (as per the
logframes in project design reports) with progress towards results (as documented in supervision
reports) and results actually achieved (as reported in project completion reports).
ORMS brings IFAD more in line with the standards of other international financial institutions
while promoting efficiencies. Efficiency gains include streamlined and harmonized reporting
processes, improved data generation and accessibility, and more-useful complete statistics and
reports. These improvements allow for timelier evidence-based decision-making, informed by
better-quality, accessible and real-time reporting and analysis of results.
Natural resource management Marketing
22.2 millionvoluntary savers
4 millionactive borrowers
3.6 millionhectares of common-property-resource landunder improved management practices
16,460kilometres of roadscontructed/rehabilitated
168,000hectares under constructed/rehabilitatedirrigation schemes
31,740marketing groupsformed/strengthened
63:37
Microenterprises1 millionpeople trained in businessand entrepreneurship
67,070enterprises accessing businessdevelopment services
81:19
Agricultural technologies2.01 millionpeople trained in crop productionpractices/technologies
721,000people trained in livestock production practices/technologies
52:48
53:47
54:46
112.8 millionpeople
50:50
Figure 1.3 Core indicators reported in 2016

15
covered by constructed or rehabilitated irrigation
schemes. ORMS facilitates the aggregation
of these project-level core indicators to report
outputs at the corporate level as needed.
Figure 1.3 provides some examples of the use
of core indicators to report on IFAD’s 2016
corporate output.
As described in Chapter 2, a similar process
occurs at the impact level. In this case,
15 per cent of IFAD projects completed within
the three-year replenishment period undergo an
impact assessment in which a counterfactual is
identified to determine impact. This attributable
impact estimate is combined with a strong
understanding of IFAD’s portfolio of projects and
used to estimate total corporate impact at the
end of each replenishment period. This process
makes it possible to report on key indicators of
corporate success at the impact level.
Overall, IFAD’s approach involves careful planning
and measurement to cascade results from
individual projects to corporate measurement.
It allows for corporate reporting that can be
attributed to IFAD investment. Equally importantly,
it creates an opportunity to generate lessons
from individual projects, and from IFAD’s
overall approach, that can provide insights for
future programming and for the development
community.
As noted, Chapter 2 provides an overview of
the approach used for the impact assessments.
Chapters 5, 6, 7 and 8 give examples of specific
impact assessments for projects in Ethiopia,
Kenya, Madagascar and the Philippines. These
chapters not only show IFAD’s impact resulting
from those projects but also present lessons
from those projects. These individual impact
assessments will also be used as the basis for
corporate-level impact estimates, in this case for
the Tenth Replenishment of IFAD’s Resources
(IFAD10) period. By allowing IFAD to draw
significant lessons from individual projects as well
as aggregate lessons at the corporate level, this
approach helps ensure that IFAD is “doing things
right”. Of course, as discussed below, it is also
important that IFAD is “doing the right things”.
Indicators, targets and analysis: generating and using results
While the previous section described IFAD’s
overall corporate approach to measuring results,
this section discusses how these results can
be generated and used for decision-making.
It describes how to identify the indicators and
targets to measure in order to reflect corporate
performance, and how to analyse information about
the portfolio to determine whether IFAD is doing the
right things.
IFAD’s Strategic Framework 2016–2025 establishes
its overarching goal – that is, to invest in rural people
to enable them to overcome poverty and achieve
food security through remunerative, sustainable
and resilient livelihoods. To support this goal, the
framework identifies strategic objectives, outcomes,
and pillars of results delivery that guide IFAD’s
operations over the 2016–2025 period (figure 1.4).
Because one key purpose of measuring results is to
determine whether corporate goals and objectives
are achieved, identified indicators of success and
targets for those indicators should be linked to
stated corporate objectives. Following this logic,
IFAD’s Results Measurement Framework (RMF) for
IFAD10 has been revised to ensure alignment with
the corporate strategy. A key principle of corporate
measurement should be alignment of RMFs and
indicators used to collect data.
With this in mind, the impact indicators and the
core indicators (reflecting outputs and outcomes)
have been mapped, respectively, to each of the
strategic objectives and areas of thematic focus of
IFAD’s Strategic Framework in such a way that each
project’s impact and outputs can be linked directly
to the corporate strategy. Project-level data collected
through ORMS and the impact assessment initiative
can be used to determine whether IFAD is reaching
its corporate objectives. Examples of core indicators
are shown in figure 1.3, and the impact indicators
are discussed in Chapter 2.
Once indicators have been identified, it is necessary
to determine targets for those indicators in order to
express the scale of an organization’s ambition in a
given period. Assuming (1) that corporate goals and
Ch
apte
r 1

16
project-specific output and impact goals align,
and (2) that clear implementation plans identify
the investments and the number of beneficiaries
affected by different types of investments, it
should be possible to determine the anticipated
output and impact of the project, and the number
of people obtaining benefits associated with each
corporate indicator.
If this process can be carried out for every
project for the period in question, determining the
corporate-level impact target for each indicator
involves simply adding the anticipated impacts on
that indicator for each project.
This requires understanding the portfolio of
investments being undertaken. There needs to
be a sense of the types of activities to be carried
STRATEGIC OBJECTIVES (SOs)
OUTCOMES
PILLARS OF IFAD’S RESULTS DELIVERY
STRATEGIC VISION
Inclusive and sustainable rural transformation
OVERARCHING GOAL
Poor rural people overcome poverty and achieve food security through remunerative, sustainable and resilient livelihoods
PRINCIPLES OF ENGAGEMENT
Targeting
Empowerment
Gender equality
Innovation, learning
and scaling up
Partnerships
SO 1
Increase poor rural people’s productive capacities
Enabling policy and regulatoryframeworks at national and
international levels
Increased levels of investment in the
rural sector
Improved country-levelcapacity for rural policy
and programmedevelopment, implementation
and evaluation
SO 2
Increase poor rural
market participation
SO 3
Strengthen the environmental sustainability and climate
resilience of poor rural people’s economic activities
• Access to natural resources
• Access to agricultural technologies and production services
• • Nutrition
• Environmental sustainability
• Climate change
• enterprise and employment opportunities
• Rural investment environment
• Rural producers’ organizations
• Rural infrastructure
Areas of thematic focus
Country programme
deliveryKnowledge-building, dissemination and policy engagement
Financial capacity and instruments
Institutional functions, services and systems
people’s bene�ts from
Diversi�ed rural
Inclusive �nancial services
Figure 1.4 Overview of IFAD’s Strategic Framework 2016–2025

17
out across the institution, and the anticipated
outputs, outcomes and impacts that will occur
as a result of those activities. Targets for IFAD
corporate indicators should reflect how IFAD is
investing – not just in what activities but how
much in each activity – because this information
will determine the anticipated outputs. Any shift
in overall strategy should generate a change in a
target level going forward. For example, if IFAD
decides to invest in more irrigation as a pathway
to improve production and market access (two
strategic objectives noted in figure 1.4), the target
for beneficiaries receiving irrigation investment
should also increase. Chapter 2 illustrates how
this can be done by discussing how impact-level
targets were established for IFAD10.
In short, measuring IFAD’s corporate
performance requires three steps:
1. identifying indicators that reflect IFAD’s
corporate strategic objectives;
2. determining targets for those indicators that
reflect IFAD’s approach to development as
represented in its project portfolio;
3. creating a system of measuring whether
targets are reached.
This process creates significant quantities of data,
both on individual projects and for aggregation
across projects. Given the other data that are also
collected to manage projects and the institution,
this means there is a wealth of data available on
corporate activities. Managing for results requires
identifying and understanding the conditions
and factors that determine project performance,
as well as the binding constraints behind those
factors. Results should be not just considered but
analysed. These data provide that opportunity.
For example, the Strategic Framework shows
the potential pathways towards achieving
IFAD’s goals, but the collected data identify the
relative emphasis of these pathways across
the investment portfolio. This, in turn, allows
questions to be asked about whether IFAD’s focus
is correct: Is IFAD doing the right things? Are
there areas that are over- or under-emphasized?
Are there gaps in the approach? In other words,
3. See the Campbell Collaboration definition for details: www.campbellcollaboration.org/library.html
understanding and analysing the portfolio and
complementary activities allow for broader
introspection. IFAD’s approach to results-based
management is then to reflect on activities being
undertaken and consider whether they represent
the best way forward.
While understanding IFAD’s own work is central,
it is also necessary to look beyond the Fund and
incorporate existing evidence on issues related
to IFAD’s portfolio. One way of doing this is
through systematic reviews – literature reviews
that use a transparent process to find, evaluate
and synthesize evidence on a given topic.3
This information, along with ongoing impact
assessments, consolidates what IFAD knows and
does not know about what works in a particular
sector or subsector. By conducting regular
systematic reviews that synthesize all existing
high-quality evidence on a given intervention,
an organization such as IFAD can ensure that
“what works” is considered when it is time to
design new operations, action plans, policies or
strategies on specific topics.
Examples of this type of analysis can be seen
in Part III of this report. Chapter 9 reflects on
the approaches IFAD uses to support land
administration and provides a systematic review
of the evidence on what works and what does
not in this area. Along similar lines, Chapter 10
considers how to improve on IFAD’s approach
to irrigation investment. Chapter 11 looks
beyond individual projects to consider IFAD’s
policy engagement in Asia to draw lessons for
improving how IFAD works with governments.
It provides critical insights on how to improve
policy engagement just as IFAD is in the process
of stepping up these efforts. Finally, Chapter 12
provides a meta-analysis of the poverty-reducing
effects of particular types of agricultural research
that IFAD has supported in the past. In general,
the motivation for these analyses is to improve on
IFAD’s overall approaches by regularly considering
the set of activities that IFAD is supporting. They
help ensure that IFAD is doing the right things.
Ch
apte
r 1

18
Monitoring and analysing the use of resources to ensure value for money
While the focus of activities should be on
achieving key development results, particularly
the SDGs, this work should be accomplished
using resources as efficiently and effectively as
possible. This section highlights IFAD’s efforts to
improve internal processes to enhance value for
money (VfM).
In the IFAD context, VfM means that IFAD
maximizes the impact of each dollar invested
to improve the lives of poor and food-insecure
rural men and women.4 It requires balancing the
“4Es”: economy, efficiency, effectiveness and
equity. Economy means reducing the cost of
individual resources used for an activity while
maintaining high-quality output. Efficiency means
increasing output at the same quality but at a
lower cost or, equivalently, minimizing costs for a
given quality of output, generally by reallocating
resources. Economy and efficiency are closely
linked – they focus on obtaining more at the
same cost. Effectiveness means achieving an
activity’s intended impact. Equity means ensuring
that the impacts are felt by poor or marginalized
beneficiaries. The 4Es are not new, but VfM
seeks to integrate a number of concepts that
are already part of the results agenda so that
development practitioners focus on resource use
as well as impact (Schiere, 2016).
VfM can be considered at the project level or the
corporate level (Jackson, 2016). At the project
level, it entails ensuring that investments in
project activities are the best use of resources
to achieve the goals of the project – that is, that
project resources could not be used in a better
way to achieve the same project impact, nor
could the project have a greater impact with an
alternative approach. At the corporate level, VfM
focuses on whether the business model used by
IFAD is the best approach to transforming core
resources into impact.
4. This definition follows standard definitions used elsewhere, including, for example, DFID (2011), ICAI (2011), Jackson (2016), and the articles in IDEV (2016).
The previous sections of this chapter have
focused on building from the project level to
identify corporate indicators, including impact.
Similarly, corporate VfM requires that both
projects and the overall institution use resources
wisely. At IFAD, economic and financial analysis
is completed for projects as part of their
preparation. This analysis considers the returns
to the project, and the economy and efficiency
of resource use. As described above, measures
of outputs and impact determine project
effectiveness.
At the corporate level, the RMF includes
indicators linked to operational and institutional
efficiency, and it seeks to monitor and
improve corporate-level resource use. Overall,
corporate-level VfM is a product of project-level
VfM as well as of corporate operational and
institutional efficiency. As it is IFAD’s business
model that largely determines the approach
to resource use, improving VfM depends on
conceptualizing and implementing a business
model that is created with the 4Es in mind.
The VfM literature emphasizes the need to
systematically and simultaneously consider the
use of resources, at both project and corporate
level, to be sure that the best option is used
to obtain the highest output and impact.
This consideration requires regular analysis of
resource use and its links to the project and
corporate results chain. As one analysis states,
“Evaluative reasoning needs to preside over
measurement” (King and Guimaraes, 2016, 67).
VfM is not simply about reducing operational
costs or cutting budgets, but rather about using
evaluative reasoning to think carefully about
maximizing impact for the lowest cost possible.
In that sense, IFAD recognizes that moving
towards a culture of VfM goes beyond operations.
It requires ensuring that policies and procedures
be designed to achieve intended outcomes
cost-effectively and implemented following the
same principles. If the corporate mechanisms
behind IFAD’s operations do not incorporate the

19
principles of efficiency, effectiveness, economy
and equity, then the consequences could
significantly compromise the VfM of IFAD’s
operations (National Audit Office, 2001). For this
reason, IFAD has developed a VfM scorecard
as described in box 1.2, and related to selected
RMF indicators shown in table 1.1.
Improving the VfM of a development organization
such as IFAD is not easy. Among other elements,
it requires being able to establish the pathway
from budget allocations to results achieved,
at both the project and the corporate level.
Towards this end, IFAD has recently moved
from a budgeting approach based on clusters of
activities to a pillars approach based on outputs.
IFAD has aligned all instruments in its strategic
planning and budgeting architecture around four
main results pillars (box 1.3). The overall objective
is to improve the effectiveness and efficiency of
corporate planning and budgeting processes,
as well as to ensure better consistency between
the allocation of resources and the Fund’s latest
strategic objectives and outcomes as expressed
in the Strategic Framework. Thus, IFAD aims
to ensure that programming of outputs drives
the budget process, rather than having budget
allocations drive the programme.
Chapters 3 and 4 reflect efforts to improve the
use of resources by analysing internal systems.
Chapter 3 presents trends in IFAD’s disbursement
performance and the drivers of that performance.
Disbursements at IFAD, as at other IFIs, were
falling below targets, and the analysis provides
input into internal IFAD plans to improve
disbursement. Chapter 4 considers the use of
evidence to make claims in project completion
reports (PCRs) – the final reports on project
performance, which include lessons for future
projects. The chapter reveals a strong need for
IFAD to improve the use of evidence in drawing
conclusions from projects.
Box 1.2 Value-for-money scorecard
IFAD has developed a value-for-money (VfM) scorecard to drive the VfM agenda and to help
management use evaluative reasoning to identify and balance the trade-offs inherent in pursuing
that agenda. These trade-offs include: (1) maximizing the short-term versus long-term benefits
of any course of action; (2) maximizing the number of poor and food-insecure men and women
who benefit versus supporting the poorest countries or those in the most fragile situations; and
(3) reducing overheads versus strengthening the quality of operations. By helping clarify such
trade-offs, the scorecard will support IFAD’s efforts to increase its effectiveness, efficiency and
sustainability.
The scorecard is composed of a subset of indicators from the Results Management Framework
of the Eleventh Replenishment of IFAD’s Resources that measure progress in improving economy,
efficiency, effectiveness and equity in IFAD’s operational and organizational performance.
The indicators are chosen based on their potential to enhance IFAD’s VfM, to achieve greater
economy and equity, and to overcome long-standing barriers to greater operational efficiency
and effectiveness.
Selected RMF indicators for the VfM scorecard are also linked to the different dimensions of
the business model (that is, resource mobilization, resource allocation, resource utilization, and
resource transformation).
Source: IFAD (2017).
Ch
apte
r 1

20
Table 1.1 IFAD’s value-for-money (VfM) scorecard
Dimensions of business model
Key problems Actions taken to enhance VfM Link to VfM “4E” dimensions Measurement of success through Results
Management Framework indicators
Resource mobilizationCore resources not being leveraged to the greatest possible degree
Leverage resources through borrowing
Economy and efficiency. Allows each dollar of official development assistance to have a multiplier effect on the total amount of loans, thereby increasing the efficiency and economy of these resources.
• Debt-to-equity ratio (3.1.2)
• Cofinancing ratio (3.1.3 and 3.1.4)
• Number of persons receiving services (millions) (2.3.1)
Cofinancing with domestic and international partners
Effectiveness. Enhances effectiveness by improving impact with funds and knowledge that complement IFAD’s approaches and reinforce domestic ownership.
Mobilization of supplementary funds linked to climate, youth, fragility (refugees) and private sector
Effectiveness and equity. Enhances equity by facilitating targeting of funds, and enhances effectiveness by addressing particular concerns of disadvantaged groups.
Resource allocationTargeting of countries and within countries needs strengthening
Country selection and resource allocation through performance-based allocation system (PBAS)
Efficiency and equity. Enhances equity through a focus on countries with strong needs and effectiveness through an emphasis on performance. It also improves efficiency by sequencing services to borrowers.
• Share of core resources allocated to low-income, lower-middle-income and upper-middle-income countries (3.2.1)
• Percentage of PBAS resources reallocated in the Eleventh Replenishment of IFAD’s Resources (3.2.2)
• Number of countries included in the PBAS at the beginning of the cycle (3.2.3)
• Number of persons receiving services (millions) (2.3.1)
Tailoring country-level approaches
Effectiveness and equity. Enhances equity by ensuring that targeting is appropriate for the context and leads to effective projects.
Enhanced targeting of youthEquity. Enhances equity by ensuring reach to key populations.
Resource utilizationResource use within countries not reaching full potential
Decentralization and enhanced country-based model
4Es. Enhances the 4Es through expanded country presence, which allows for better information flow and engagement, and more effective use of resources.
• Time from concept note to approval (3.5.1)
• Time from project approval to first disbursement (3.5.2)
• Disbursement ratio (3.5.3)
• Ratio of budgeted staff positions in IFAD country offices / regional hubs (3.6.1)
• Average size of IFAD’s investments projects (IFAD financing) (3.2.4)
• Percentage of operations rated 5 and above at completion for overall project achievement (IFAD’s Independent Office of Evaluation) (2.2.3)
Enhanced synergies between lending and non-lending activities
Economy and effectiveness. Enhances economy and efficiency through better solutions and enhances effectiveness through improved impact.
Increased loan size Economy and efficiency. Enhances economy and efficiency through economies of scale in project design and implementation.
Mainstreaming climate, gender, nutrition and youth
Equity. Enhances equity through improved targeting and effectiveness by focusing on key issues (e.g. climate and nutrition).
Resource transformationInsufficient focus on measuring and managing for results
Development Effectiveness Framework and framework to manage for results
4Es. Ensures adequate information to drive increases in the 4Es through evidence-based decisions.
• Number of persons receiving services (millions) (2.3.1)
• Number of people with: greater economic mobility, greater production, greater market access and increased resilience (2.1.1, 2.1.2, 2.1.3, 2.1.4)
• Percentage of countries with disbursable projects using the IFAD Client Portal (3.7.5)
• Percentage of IFAD operations using Operational Results Management System (3.7.6)
• Percentage of IFAD-supported projects trained through Centers for Learning on Evaluation and Results initiative (3.7.7)
Impact assessment initiativeEffectiveness. Ensures attributable impact to determine effectiveness.
Enhanced transparency through systematic action plan
Effectiveness. Creates an openness to data in order to provide incentives for improving the 4Es, and reinforces domestic accountability mechanisms to increase aid effectiveness.
Service delivery platform improvements
Economy and efficiency. Enhances corporate-level economy and efficiency by shortening processing times and facilitating nimbler business processes.

21
Dimensions of business model
Key problems Actions taken to enhance VfM Link to VfM “4E” dimensions Measurement of success through Results
Management Framework indicators
Resource mobilizationCore resources not being leveraged to the greatest possible degree
Leverage resources through borrowing
Economy and efficiency. Allows each dollar of official development assistance to have a multiplier effect on the total amount of loans, thereby increasing the efficiency and economy of these resources.
• Debt-to-equity ratio (3.1.2)
• Cofinancing ratio (3.1.3 and 3.1.4)
• Number of persons receiving services (millions) (2.3.1)
Cofinancing with domestic and international partners
Effectiveness. Enhances effectiveness by improving impact with funds and knowledge that complement IFAD’s approaches and reinforce domestic ownership.
Mobilization of supplementary funds linked to climate, youth, fragility (refugees) and private sector
Effectiveness and equity. Enhances equity by facilitating targeting of funds, and enhances effectiveness by addressing particular concerns of disadvantaged groups.
Resource allocationTargeting of countries and within countries needs strengthening
Country selection and resource allocation through performance-based allocation system (PBAS)
Efficiency and equity. Enhances equity through a focus on countries with strong needs and effectiveness through an emphasis on performance. It also improves efficiency by sequencing services to borrowers.
• Share of core resources allocated to low-income, lower-middle-income and upper-middle-income countries (3.2.1)
• Percentage of PBAS resources reallocated in the Eleventh Replenishment of IFAD’s Resources (3.2.2)
• Number of countries included in the PBAS at the beginning of the cycle (3.2.3)
• Number of persons receiving services (millions) (2.3.1)
Tailoring country-level approaches
Effectiveness and equity. Enhances equity by ensuring that targeting is appropriate for the context and leads to effective projects.
Enhanced targeting of youthEquity. Enhances equity by ensuring reach to key populations.
Resource utilizationResource use within countries not reaching full potential
Decentralization and enhanced country-based model
4Es. Enhances the 4Es through expanded country presence, which allows for better information flow and engagement, and more effective use of resources.
• Time from concept note to approval (3.5.1)
• Time from project approval to first disbursement (3.5.2)
• Disbursement ratio (3.5.3)
• Ratio of budgeted staff positions in IFAD country offices / regional hubs (3.6.1)
• Average size of IFAD’s investments projects (IFAD financing) (3.2.4)
• Percentage of operations rated 5 and above at completion for overall project achievement (IFAD’s Independent Office of Evaluation) (2.2.3)
Enhanced synergies between lending and non-lending activities
Economy and effectiveness. Enhances economy and efficiency through better solutions and enhances effectiveness through improved impact.
Increased loan size Economy and efficiency. Enhances economy and efficiency through economies of scale in project design and implementation.
Mainstreaming climate, gender, nutrition and youth
Equity. Enhances equity through improved targeting and effectiveness by focusing on key issues (e.g. climate and nutrition).
Resource transformationInsufficient focus on measuring and managing for results
Development Effectiveness Framework and framework to manage for results
4Es. Ensures adequate information to drive increases in the 4Es through evidence-based decisions.
• Number of persons receiving services (millions) (2.3.1)
• Number of people with: greater economic mobility, greater production, greater market access and increased resilience (2.1.1, 2.1.2, 2.1.3, 2.1.4)
• Percentage of countries with disbursable projects using the IFAD Client Portal (3.7.5)
• Percentage of IFAD operations using Operational Results Management System (3.7.6)
• Percentage of IFAD-supported projects trained through Centers for Learning on Evaluation and Results initiative (3.7.7)
Impact assessment initiativeEffectiveness. Ensures attributable impact to determine effectiveness.
Enhanced transparency through systematic action plan
Effectiveness. Creates an openness to data in order to provide incentives for improving the 4Es, and reinforces domestic accountability mechanisms to increase aid effectiveness.
Service delivery platform improvements
Economy and efficiency. Enhances corporate-level economy and efficiency by shortening processing times and facilitating nimbler business processes.
Ch
apte
r 1

22
Staff and counterparts’ readiness for results management
Taking the actions noted in the previous
sections will not move IFAD to a results-based
organization unless a corporate-wide culture of
results is constructed. This requires ensuring
that staff, development partners and country
counterparts are equipped to manage for results
and embrace the ideas underlying results-based
management. As part of IFAD’s efforts in this
area, special training programmes have been
developed to ensure readiness to manage
for results.
To provide a foundation for results-based
management, and more generally to become
a more competitive and relevant IFI, IFAD is
updating the knowledge, skills and competencies
of its staff. The IFAD Operations Academy has
been designed to equip staff to deliver. It provides
a learning environment that allows staff to
develop their core operational competencies,
while offering them opportunities to improve
their technical capacities and providing a peer-
to-peer platform where staff can learn from one
another or from external experts who can provide
cutting-edge knowledge.
Operating at a high pedagogic level, the
Academy offers a mix of training, most of which
is face-to-face. These face-to-face sessions
are complemented by follow-up activities,
e-learning, video tutorials and other distance
knowledge-sharing tools. Its learning methods
are based on three key principles: participation,
experiential learning and brain-based learning.
The Academy is structured around three main
complementary and mutually reinforcing pillars
(figure 1.5). The first pillar, the Core Learning
Curriculum, is at the heart of the Academy.
It includes a set of basic training modules aimed
at ensuring that staff have the skills necessary to
effectively design and implement IFAD programmes
while at the same time taking into account the
Fund’s priorities, commitments and evolving delivery
model. In this pillar, special emphasis is given
to data collection, analysis and reporting at the
different stages of projects. The second pillar offers
a set of technical training modules that complement
the core curriculum, delving deeper into many of
the technical and fiduciary areas covered in the
basic training. Finally, the third pillar offers a space
for peer-to-peer learning in order to capitalize on the
wealth of experience accumulated by the Fund and
by external experts and partner institutions.
IFAD-financed projects, as those financed by
most IFIs, are implemented by national staff in
the borrowing countries, and occasionally by
other development partners or non-governmental
organizations (NGOs). Thus, to effectively track
and achieve development outcomes, IFAD must
enhance not only its own culture of results but
also those of its partners at the country level.
Specifically, countries should invest in developing
Box 1.3 IFAD’s results pillars
• Pillar 1 – Country programme delivery: Strengthened effectiveness of IFAD-supported
programmes and their capacity to systematically scale up successful interventions.
• Pillar 2 – Knowledge-building, dissemination and policy engagement: Strengthened
capacity to learn, generate and disseminate evidence-based lessons on rural development
so that innovations and proven solutions are scaled up.
• Pillar 3 – Financial capacity and instruments: Diversified IFAD financing instruments relevant
to different country contexts, with funds mobilized from a broader range of partners to
expand public and private investments for inclusive and sustainable rural transformation.
• Pillar 4 – Institutional functions, services and systems: Strengthened effectiveness and
efficiency of IFAD’s institutional management, administration and service delivery platform,
including part of the decentralization process.

23
adequate in-country M&E capacities and in
putting in place systems that facilitate data
collection, analysis, and reporting of results.
These types of efforts are not new. In fact,
most efforts to date, both by IFAD and by
other development partners, have focused on
increasing capacities in their own institutions
and the M&E activities of their projects.
However, there have been no systematic
efforts (or standardized tools) to measure
governmental capacities at the institutional
level for results-based management in the rural
and agricultural development sector. There is
usually little emphasis on the capacities and
systems required to collect, understand and
use data; to systematically link evidence to
decision-making; and even less to effectively
incorporate evidence in public decisions.
Figure 1.5 Structure of the IFAD Operations Academy
1core learning curriculum
2technical training
3peer-to-peer
learning
Module 1 Operationalizing IFAD’s decentralization plan
Module 2 Developing country strategies
Module 3 Strengthening project design
Module 4 Strengthening project supervision
Module 5 Commitments and safeguards
Technical training on disciplines relevant to IFAD’s rural transformation agenda
Examples of topics that will be covered in technical training sessions
• Learning events• Exchanges• Mentoring/
coaching• Participating in
missions of other divisions• Agricultural risk
management• Anti-corruption • Climate and
development• Climate finance• Conservation
agriculture• Economic and
financial analysis – advanced
• Engaging with indigenous peoples
• Environmental sustainability
• Financial management
• Fisheries• Gender • Institutional analysis • Knowledge
management in country programmes
• Land tenure• Livestock
development• Nutrition• Partnership-
building skills• Private-sector
engagement • Procurement
(for reviewers) – advanced
• Reduction of food losses
• Remittances and migrant investment
• Rural finance• Rural infrastructure• Seed management• Small-scale
irrigation• Support of farmers’
organizations• Value chains• Youth
Mandatory (within 2 years)
On demand Initiative-based
Ch
apte
r 1

24
To identify and understand the capacities that are
in place, where the gaps are, how to measure
progress, and how to build on and strengthen
what exists in order to achieve sustainable
development, IFAD has put forward the AVANTI
grant to adapt an existing tool (CAP-Scan) to the
rural sector (AG-Scan). This tool can be used to
assess in-country M&E systems and capacities
and identify shortfalls. The application of this
programme is in itself a capacity development
exercise. Through facilitated self-assessment
tools, governmental units and institutions will
deepen their understanding of the challenges,
success factors and open questions existing
around M&E. This assessment results in the
development of an action plan for strengthening
rural-sector M&E capacities and systems.
To ensure synergies between these efforts, IFAD’s
upcoming country strategies will include the
results of these action plans to guide M&E efforts
and resources through future IFAD projects.
Box 1.4 describes AVANTI.
To support countries in improving overall
M&E systems in the rural and agricultural
development sector, IFAD has brought together
The Evaluators’ Institute with Centers for
Learning on Evaluation and Results to develop a
comprehensive rural development-focused M&E
and impact assessment training and certification
framework, called the Program in Rural
Monitoring and Evaluation (PRiME). This training,
described in box 1.5, aims to significantly expand
and add value to efforts to close data gaps by
strengthening country and regional capacities to
collect and manage data on rural development.
Taken together, these efforts at the individual and
institutional level seek to build a culture of results
in order to facilitate an overall strategy to improve
development effectiveness. The expectation
is that the more widely results management is
understood and its value recognized, the more
likely it is that high-quality data will be collected
and used in decision-making. Ultimately,
success in this area will be reflected in the active
engagement by IFAD staff and counterparts in
management for results.
Box 1.4 AVANTI – Advancing Knowledge for Agricultural Impact
AVANTI adapts a tried and tested self-assessment methodology of governments’ capacities
in managing for development results (CAP-Scan) to the rural sector. This results into a new
product (Ag-Scan) following three steps:
1. Identify key stakeholders, engage senior government officials, motivate champions to
engage, and coordinate with CAP-Scan facilitators.
2. Conduct preparatory working sessions and a two-day workshop to discuss and prioritize
needs.
3. Implement action plan, and collect lessons learned.
AVANTI will also generate knowledge products and case studies that include developing methods
for measuring SDG indicators. In addition, information on the progress of these indicators in
concrete cases will feed into ongoing debates and foster the exchange of knowledge within the
interested community.
For further information, see: www.avantiagriculture.org

25
Box 1.5 Program in Rural Monitoring and Evaluation
The Program in Rural Monitoring and Evaluation (PRiME) seeks to establish a high-quality,
global and sustainable training programme to certify IFAD-affiliated and other rural development
professionals. The programme aims to achieve the following outcomes:
1. an improved skill base in M&E and impact assessment in the rural sector of IFAD-financed
client countries;
2. development of a knowledge management repository, where all curriculum materials
and learning from the global course delivery, the “train the trainer” component, and the
certification process will be codified, stored, and made available as public goods;
3. development of a new M&E and impact assessment certification framework that will be
quality assured, implemented and widely recognized by M&E and rural development
professionals globally.
PRiME works with government officials and ministries currently engaged with IFAD, improving
their knowledge of M&E as a tool for greater impact in the rural sector. Participants are nominated
by their respective governments, based on pre-established criteria. In addition, the training and
certification programme is open to other government officials, IFAD staff, consultants, partner
institutions, staff of other IFIs and multilateral development banks, and others.
The PRiME curriculum has two levels: a fundamentals course in M&E; and advanced training
in either M&E or impact assessment. The curriculum uses a modular approach, with exercises,
case studies, and other innovative tools for learning and sharing. PRiME is headquartered at
the Centers for Learning on Evaluation and Results (CLEAR)–Latin America, based at Centro
de Investigación y Docencia Económicas (CIDE), Mexico City. For further information, see:
www.primetraining.global
Afghanistan
Albania
Algeria
Angola
Antigua and Barbuda
Argentina
ArmeniaAzerbaijan
Bangladesh
Barbados
Belize
Benin
Bhutan
Bolivia
Bosnia and Herzegovina
Botswana
Brazil
Burkina Faso
Burundi
Cambodia
Cameroon
CaboVerde
Central AfricanRepublic
Chad
Chile
China
Colombia
Comoros
Congo
Costa Rica
Croatia
Cuba
Côted'Ivoire
Dem People'sRep of Korea
DemocraticRepublic
of the Congo
Djibouti
Dominica
DominicanRepublic
Ecuador
El Salvador
EquatorialGuinea
Eritrea
Ethiopia
Fiji
Gabon
Gambia
Georgia
Ghana
Grenada
Guatemala
Guinea-BissauGuinea
Guyana
Haiti
Honduras
India
Indonesia
Islamic Republicof IranIraqIsrael
Jamaica
Jordan
Kazakhstan
KenyaKiribati
Kuwait
Kyrgyzstan
Lao People'sDem Rep
Lebanon
Lesotho
Liberia
Libya
Madagascar
Malawi
Malaysia
Maldives
Mali
Malta
MarshallIslands
Mauritania
Mauritius
Mexico
Federated Statesof Micronesia
Republicof Moldova
Mongolia
Morocco
Mozambique
Myanmar
Namibia
Nauru
Nepal
Nicaragua
Niger
Nigeria
Oman
Pakistan
PalauPanama
Papua NewGuinea
Paraguay
Peru
Philippines
Qatar
Republicof Korea
Romania
Rwanda
Saint Lucia
Sao Tomeand Principe
Saudi Arabia
Senegal
Seychelles
SierraLeone
SolomonIslands
Somalia
South Africa
SriLanka
Suriname
Swaziland
Syrian ArabRepublic
Tajikistan
Thailand
Macedonia
Timor-Leste
TogoTrinidad and Tobago
Tunisia
Turkey
Tuvalu
Uganda
United ArabEmirates
United Republicof Tanzania
Uruguay
Uzbekistan
Vanuatu
Venezuela
Viet Nam
Gaza and the West Bank
Yemen
Zambia
Zimbabwe
Montenegro
Sudan
Egypt
South Sudan
Saint Vincent and the Grenadines
Saint Kitts and Nevis
Cyprus
Brazil and Lusophone Africa CenterSão Paulo School ofEconomics at Getulio VargasFoundation (EESP/FGV)São Paulo, Brazil
Anglophone Africa CenterUniversity of WitwatersrandJohannesburg, South Africa
South Asia Center J-PalSouth Asia Institute for Financial Management and Research (IFMR) Chennai, India
East Asia CenterAsia Paci�c Finance andDevelopment Institute (AFDI) Shanghai, China
Francophone Africa CenterCentre Africain d'Etudes Supérieures en Gestion (CESAG)Dakar, Senegal
Global Hub TeamWorld Bank Group (WBG)Washington, D.C., United States
Latin America CenterCentro de Investigación y Docencia Económicas (CIDE)Mexico City, MexicoFocal point for managing the grant funds and all activities
Ch
apte
r 1

26
Conclusions
The purpose of this report is to highlight IFAD’s
ongoing efforts to generate evidence to inform
decision-making at the corporate and project
levels, and to create a culture of results. The
chapters provide examples of corporate-level
analysis (Part I: Chapters 2–4), project-level
impact assessments (Part II: Chapters 5–8),
and analysis on thematic areas (Part III:
Chapters 9–12). These chapters are based on
quantitative and qualitative analysis, which have
been used to answer key questions. While the
individual chapters provide specific lessons,
the report overall highlights that creating a
culture of results-based management requires a
combination of data collection and analyses that
can be used to inform decisions.
In addition to providing an overview of IFAD’s
results architecture, this chapter has drawn
attention to how the different pieces of IFAD’s
ongoing efforts fit together, and shown the
actions being undertaken more broadly to
ensure management for results. These efforts
are critical to ensuring that IFAD maintains its
focus on contributing to SDG 1 (no poverty) and
SDG 2 (zero hunger) in rural areas. This chapter
recognizes the importance of corporate buy-in
and the role of leadership, and it highlights that
building a culture of results requires working
throughout an organization and embedding this
culture in all processes and products, not just
in operations.
While IFAD has had a history of measuring
results, these efforts represent a surge in activity
to expand management for results. This is neither
a small nor an easy enterprise. New challenges
will emerge, mistakes will be made, and new
analysis will uncover areas where IFAD is not
doing as well as it should. This is expected as
part of the process of improving development
effectiveness in rural areas. The insights should
be used to draw lessons and continue to improve
so that IFAD can be more effective in promoting
rural development.

27
References
DFID (UK Department for International
Development). 2011. DFID’s approach to value
for money (VfM). Manuscript, Quest reference:
3116186. London.
ICAI (Independent Commission for Aid Impact).
2011. ICAI’s approach to effectiveness and value
for money. Report 1 November. London.
IDEV (Independent Development Evaluation).
2016. Value for money in development work.
eVALUation Matters: A Quarterly Knowledge
Publication on Development Evaluation (third
quarter). Abidjan: IDEV, African Development Bank.
IFAD (International Fund for Agricultural
Development). 2016. IFAD development
effectiveness framework. EB 2016/119/R.12.
Rome, https://webapps.ifad.org/members/
eb/119/docs/EB-2016-119-R-12.pdf
IFAD. 2017. Report of the Consultation on the
Eleventh Replenishment of IFAD’s Resources:
Leaving no one behind: IFAD’s role in the 2030
agenda. IFAD11/4/R.2/Rev.1. December 8.
Rome, https://webapps.ifad.org/members/
repl/11/04/docs/IFAD11-4-R-2-Rev-1.pdf
Jackson, P. 2016. Value for money and
international development: Deconstructing myths
to promote a more constructive discussion.
eVALUation Matters: A Quarterly Knowledge
Publication on Development Evaluation
(third quarter 2016). Abidjan: IDEV, African
Development Bank.
King, J. and Guimaraes L. 2016. Evaluating
value for money in international development:
The Ligada female economic empowerment
programme in Mozambique. eVALUation
Matters: A Quarterly Knowledge Publication on
Development Evaluation (third quarter 2016).
Abidjan: IDEV, African Development Bank.
National Audit Office. 2001. Modern
policy‑making: Ensuring policies deliver value
for money. HC 289 Session 2001–2002:
1 November 2001. London.
OECD (Organisation for Economic Co-operation
and Development). 2002. Glossary of key terms in
evaluation and results‑based management. Paris:
Development Assistance Committee (DAC).
OECD. 2012. The Busan Partnership for Effective
Development Cooperation. Paris: Development
Assistance Committee (DAC).
Schiere, R. 2016. What is new in value for
money? eVALUation Matters: A Quarterly
Knowledge Publication on Development
Evaluation (third quarter 2016). Abidjan: IDEV,
African Development Bank.
SDSN (Sustainable Development Solutions
Network). 2015. Indicators and monitoring
framework for the Sustainable Development
Goals: Launching a data revolution for the
SDGs. A report to the Secretary-General of the
United Nations by the Leadership Council of the
Sustainable Development Solutions Network.
New York.
Segone, M., ed. 2008. Bridging the gap:
The role of monitoring and evaluation in
evidence‑based policy making. Geneva:
UNICEF Evaluation Office.
Ch
apte
r 1

28
©IF
AD
/Fah
ad A
bdul
lah
Kai
zer

29
PART I
Analysing corporate-level evidence

30
Attributing corporate impact
The Sustainable Development Goals (SDGs) have
generated a renewed focus on results-based
management, inducing the development
community to place more emphasis on creating
corporate monitoring and evaluation (M&E)
systems that generate evidence. This new
emphasis has been driven partly by the desire of
donor countries to ensure accountability for funds
provided to development institutions, and partly
by the recognition that managing for results can
improve the impact of interventions and generate
lessons for subsequent activities in the same
country or elsewhere.5
Significant progress has been made in methods
to rigorously assess impact6 – the highest-level
results that are linked to activities’ ultimate
objectives, such as increasing income, food
security, nutrition or resilience. However, this
progress has been made vis-à-vis specific
targeted interventions. With these approaches,
it is possible to identify the impact of individual
projects and programmes supported by a given
organization, but not corporate-level impact.
Showing that a number of individual interventions
have impacts does not necessarily mean that
5. See, for example, the call by the Evaluation Gap Working Group (2006) to systematically build evidence about what works in social development.
6. See Gertler et al. (2011) and Khandker, Koolwal and Samad (2010).
7. In general, an attempt to empirically attribute the causal impact of a project on an indicator is referred to as “impact evaluation”, but IFAD and others use the term “impact assessment”. In this publication, the terms are used synonymously.
there is an overall corporate impact. It depends on
whether the evaluated interventions can be seen
as representing overall corporate efforts.
Some might question the need to measure
impact at a corporate level at all; surely, what
matters is understanding whether individual
interventions have an impact and drawing
lessons on successes and failures to improve
future projects and programmes. Worrying about
corporate-level impact potentially distracts from
an intervention-level focus and may come at the
expense of learning from innovative individual
activities. Projects are often selected for impact
assessments7 specifically for their potential to
produce key lessons.
In fact, however, there are several reasons to
assess corporate-level impact. A corporate-level
estimate of impact can be crucial for justifying
funding to an institution as well as, more broadly,
funding for development. It can address taxpayers’
questions about whether development assistance
is effective. For donors, the lack of corporate-
level impact assessments represents a missed
opportunity, given their interest in assessing the
impact of providing an institution with funding as
well as the value for money of their donations.
Approach to attributing IFAD’s aggregate impact
Chapter 2
by
Paul Winters
Alessandra Garbero

31
PAR
T I
Ch
apte
r 2
/
In addition, corporate-level impact measurement
induces systematic thinking about an institution’s
overall portfolio. While the selection of
individual projects for impact assessments is
often theoretically justified based on learning,
practically speaking it often reflects what is
feasible and in the interest of researchers. This
leads to a collection of impact assessments that
are skewed towards certain sectors, particularly
social sectors, or towards narrow research
questions. For example, the impact evaluation
database of the International Initiative for Impact
Evaluation includes more than 5,000 studies.
Of those, about 70 per cent are in the social
sector and 20 per cent are in economic and
productive sectors (Sabet and Brown, 2017).
This is in spite of the fact that the Organisation
for Economic Co-operation and Development
reports that about 40 per cent of funding goes
to the social sector and 35 per cent goes to
economic and productive activities.8 A corporate-
level approach requires reflecting on the range of
activities in a portfolio. It facilitates a consideration
of whether a corporation is “doing the right
things” rather than just “doing things right”.
This chapter seeks to clarify the general
challenges of measuring impact at a corporate
level and to describe IFAD’s overall approach.
A primary challenge to measuring impact is
assessing attribution. Attribution refers to the
ability to claim that impact on a key high-order
indicator is the result of a particular investment
– that is, that an intervention caused an
observed effect. This is distinct from measuring
contribution, which involves monitoring a key
indicator to determine whether it is heading in
a direction consistent with an investment to
support the claim that an intervention helped
to create the observed effect. Attribution
involves a claim of causality that contribution
does not include. As described more carefully
later in this chapter and discussed in box 2.1,
attribution requires the creation of a reasonable
counterfactual that allows for comparison of
what would have happened in the absence of
8. See Table 1.3.3 in OECD (2017).
9. The issue of discrete indicators creating perverse incentives for policymakers is widely known and was recently articulated in a blog by Lant Pritchett (2014) for the Center for Global Development.
an intervention. At the corporate level, as seen
in table 2.1, contribution to impact is what is
commonly measured.
Besides attribution, there is another issue in
assessing corporate impact: aggregation.
Corporate impact requires having indicators
that can be aggregated across a range of
interventions as well as a means to add up
the overall impacts across those interventions.
If every intervention had the same objective,
such as higher income, and every intervention
had an impact assessment, aggregation would
be straightforward – a matter of adding up the
individual estimates of impact in a systematic
way. However, in reality, this is not the case.
Projects vary in their objectives based on local
development needs and country priorities.
Impact assessments are costly and therefore
are rarely undertaken for every project as each
additional impact assessment provides less
information. However, the absence of an impact
assessment means no ability to identify impact
and learn from projects. Determining the optimal
number of impact assessments and how to
aggregate these into a corporate measure is not
a trivial task.
With these challenges in mind, IFAD has
been seeking to attribute its corporate-level
impact on key indicators linked to its Strategic
Framework. These efforts are a by-product of
the Consultation on the Ninth Replenishment of
IFAD’s Resources (IFAD9) (2013-2015), where its
Results Measurement Framework (RMF) included
the aspirational goal of raising 80 million people
out of poverty. The indicator “people out of
poverty” can create perverse policy incentives.9
It was found to be a narrow measure of IFAD’s
corporate impact because it did not reflect all
of IFAD’s corporate strategic objectives, which
include goals other than moving people over a
poverty line. Moreover, the target itself was not
based on a careful analysis of IFAD’s portfolio – it
is not clear how much of IFAD’s investment was
designed to move people over a poverty line.

32
Table 2.1 Corporate measurement of impact
Institution Impact indicators Target Year Type of assessment
Asian Development Bank (ADB)
Population living on less than US$1.25 per day (%)
27.4
2015 Contribution
GDP per capita growth rate (%) N/A
Underweight children under 5 years old (%) 17.7
Under-5 child mortality (number per 1,000 live births)
17.7
Ratio of girls and boys in education 1.0
Gross lower secondary education graduation rate (%)
N/A
Maternal mortality ratio (number per 100,000 births)
100.7
African Development Bank (AfDB)
GDP growth (%)
N/A N/A Contribution
GDP per capita (US$)
Proportion of population living below the poverty line
Income inequality (Gini coefficient)
Life expectancy
Enrolment in education (%)
Unemployment rate (%)
Economic Diversification Index
Global Competitiveness Index
Food insecurity (% of population)
Resilience to water shocks (index)
Institutional capacity for environmental sustainability
Caribbean Development Bank
Population below the poverty line (%) 34
2019 Contribution
Population below the indigence line (%) 17
Multidimensional Poverty Index (headcount %) N/A
GDP per capita growth rate 0.9
Unemployment rate Decrease
Consultative Group on International Research (CGIAR)
People assisted to exit poverty (of whom 50% are women)
100 m
2030 AttributionPeople meeting minimum dietary energy requirements (of whom 50% are women)
150 m
Women of reproductive age who consume less than the adequate number of food groups
Reduce by 33%
Global Agriculture and Food Security Program (GAFSP)
Increased household income of direct beneficiaries
N/A N/A AttributionProportion of target population below the minimum level of dietary energy consumption

33
PAR
T I
Ch
apte
r 2
/
Institution Impact indicators Target Year Type of assessment
Global Environment Fund (GEF)
Landscapes and seascapes under improved biodiversity management
300 million ha
N/A AttributionTons of CO2 equivalent avoided, both direct and indirect, over the investment or impact period
750 million tons
Globally overfished fisheries (volume) moved to more sustainable levels
20%
Inter-American Development Bank (IDB)
Poverty headcount ratio (US$4 per day PPP) (%)
N/A N/A ContributionGini coefficient
Growth rate of GDP per person (%)
International Fund for Agricultural Development (IFAD)
Number of people experiencing economic mobility
40 million
2018 AttributionNumber of people with improved production 43 million
Number of people with improved market access 42 million
Number of people with greater resilience 22 million
International Finance Corporation (IFC)
End extreme poverty and boost shared prosperity
N/A 2030 Contribution
Islamic Development Bank
Proportion of population living on < US$1.25 a day
Reduce by ¾
2020 Contribution
Poverty rate of member countries whose poverty rate is above 40%
Halve
Poverty rate of member countries whose rate is below 40%
Reduce by ¾
Under-5 mortality rate Reduce by ¾
Maternal mortality rate Reduce by ¾
GDP of member countries Double
Income inequality Halve
Work Bank Group and International Development Association(IDA)
Proportion of population living on < US$1.90 a day
3% 2030
Contribution
Median income growth rate of bottom 40% of population
N/A N/A
Agriculture value added per worker N/A N/A
GDP per capita N/A N/A
Under-5 mortality rate N/A N/A
Malnutrition N/A N/A
Population living in areas under water stress N/A N/A
Population exposed to harmful air pollution (PM2.5)
N/A N/A
CO2 emissions (kg per 2011 PPP$ of GDP) N/A N/A
Note: N/A = not applicable; PPP = purchasing power parity.

34
Box 2.1 Contribution and attribution in results measurement and management frameworks
The contribution-attribution tension can clearly be seen in results measurement and management
frameworks (RMFs) or similar corporate measurement systems. RMFs are performance
measurement and management frameworks mechanisms that contain a suite of indicators and
targets to monitor corporate performance. Progress against an RMF is tracked and reported for
the purpose of accountability and learning, although in practice the use of RMFs is often limited
to communication and reporting tools for corporate executive boards.
RMFs are reasonably homogeneous across international financial institutions (IFIs) in terms of
terminology and structure but vary for other institutes. In general, most organizations adopt a
multilevel structure composed of three tiers:
• Tier 1 focuses on the overall global picture and monitors progress towards the Sustainable
Development Goals (SDGs).
• Tier 2 determines the development results that are attributable to an institution – the causal
effect of activities.
• Tier 3 assesses operational and organizational performance, although some IFIs have
separate tiers for these two areas.
Whereas tier 1 monitors progress, and thus contribution, tier 2 measures results that can be
attributed to the institution’s efforts. Impact indicators that seek to measure the ultimate goals of
activities, such as those linked to the SDGs, tend to be in tier 1. In most cases, tier 2 results tend
to be outputs, such as the number of people reached or receiving some type of support.
Using the most recent information available at the time of writing, table 2.1 presents impact-level
indicators from either tier 1 or tier 2 for the RMFs or equivalent corporate documents of IFAD,
selected regional development banks, the World Bank Group (including the International
Development Association and International Finance Corporation separately), and major
agricultural institutes (the CGIAR, the Global Agriculture and Food Security Program [GAFSP],
and the Global Environment Facility [GEF]). The impact-level indicators are noted, as well as
whether they measure contribution or attribution.
Generally, across all the major institutions included in the table, there is a lack of impact indicators
attributable to that institution. Only IFAD, CGIAR, GAFSP and GEF have set at least one impact
target generated by their own operations, whereas the others report only lower-level outputs and
outcomes.
Moreover, only in the case of IFAD, and to some extent CGIAR, can one see an attributed impact
target and an explanation of how it is to be produced and measured. In light of this, IFAD’s
approach of attempting to attribute an impact to the institution, rather than merely monitoring its
contribution, remains unusual among IFIs.

35
PAR
T I
Ch
apte
r 2
/
Even with these limitations, the IFAD9 Impact
Assessment Initiative (IAI) recognized IFAD
management’s responsibility to generate evidence
on project success in order to report on past
projects and learn lessons for future projects.
The approach to the IFAD9 IAI attempted to be
scientific, systematic and comprehensive, and it
provided IFAD with significant lessons that helped
it advance a results-based agenda.10
Results of the IFAD9 IAI are reported in table 2.2
to illustrate the types of corporate-level impact
measures that can be calculated. The results
demonstrate that IFAD beneficiaries analysed
as part of the initiative are, on average, better
off in percentage terms when compared with a
comparison, or control, group (discussed in more
detail later in this chapter). IFAD’s investments in
rural people have generated returns in a number
of critical areas, including assets, resilience,
livestock ownership, agricultural revenues, nutrition
and women’s empowerment. Aggregate impact
projections show that 43 million beneficiaries will
see substantial increases in agricultural revenues,
10. For details of the IFAD9 IAI, see IFAD (2016).
and 29 million and 23 million beneficiaries will
obtain significant gains in poultry and livestock
asset ownership, respectively. More than 10 million
beneficiaries will experience an increase in each of
the following domains: overall assets, productive
assets, gender empowerment, dietary diversity,
and reduction in shock exposure. Finally, using
an asset-based poverty measure, an estimated
24 million beneficiaries are expected to move
out of poverty as a result of projects that were
either closing or ongoing between 2010 and
2015. Overall, the analysis paints a portrait of
IFAD improving the well-being of rural people in
terms of asset accumulation and higher revenue
and income.
While the IFAD9 IAI was able to provide an
assessment of impact, the process had some
limitations. This is particularly true given that other
IFIs have not yet sought to attribute impact at a
corporate level and lessons could not be drawn
from the experience of others. Reflecting on this
process has led to lessons that have helped
move forward IFAD’s agenda for measuring
Table 2.2 IFAD9 estimated impacts (for projects open during 2010–2015)
Impact domain Indicator Global impact estimate (average
treatment effect) (%)
Projected number of people impacted
(million)
Economic mobility
Overall asset index 6.6 15.8
Durables asset index 2.7 6.4
Productive asset index 5.6 13.4
Income 4.0 9.5
Asset poverty reduction 9.9 24.0
Resilience
Ability to recover from shocks 1.5 3.5
Reduced shock severity 1.8 4.3
Reduced shock exposure 4.5 10.9
Nutrition Dietary diversity 4.6 11.0
AgricultureAgricultural revenue 18.0 43.2
Yields 3.8 9.2
LivestockLivestock asset index 9.5 22.8
Poultry count index 12.0 28.9
Gender Gender empowerment 4.8 11.6

36
corporate-level impact. Although the IFAD9 IAI
had a number of fundamental flaws, starting from
the identification of key indicators and targets, it
provided a reasonable basis on which to build.
The remainder of this chapter discusses and
justifies the approach IFAD is currently taking.
The following section discusses how corporate
indicators and targets can be and are identified.
The chapter then examines how impact
assessments are conducted on individual projects,
and looks at how they are aggregated to the
corporate level. The final section discusses some
of the limitations of the approach and how to move
forward to continue to improve measurement.
From projects to aggregate impact: identifying indicators and targets
As described in Chapter 1, corporate-level
indicators of success should reflect an
organization’s strategic goals and objectives,
and should be relatively straightforward to
identify provided that: (1) it is easy to quantify
the stated goals and objectives; and (2) it is
possible to identify indicators that can be easily
aggregated across projects. As an example, one
can consider the difference between the goal
of “improved livelihoods” and that of “greater
income”. The former is a more encompassing
goal but is not easily quantified as there is no
agreed-upon livelihood measure. The latter
is a narrower goal but is easy to quantify in
monetary terms and easy to aggregate across
projects because it is expressed in the same
unit. Measuring project or corporate impact
requires measurable and aggregable indicators;
hence, even if corporate goals have not been
written with measurability in mind, a solution
must be found.
Even if an adequate indicator is found to
represent corporate priorities, one cannot
assume that an institution’s individual projects are
designed and implemented to reflect corporate
strategic objectives and goals – that is, that
there is a one-to-one correspondence between
corporate and project objectives. If there is not,
a problem arises. Without a link to the indicators,
the projects would not be counted in an
institution’s aggregate success. While a mismatch
between project and corporate objectives may
seem inappropriate, in work with governments
and communities it may be difficult to avoid.
For example, IFAD has had projects that improve
drinking-water quality, which should provide clear
health benefits. However, its strategic objectives,
which focus on productive investment, do not
include health outcomes.
Calculating the associated targets of success
for each indicator and for a given period is
more complicated than identifying the indicator.
For example, if the indicator of success is the
number of rural people with increased agricultural
production (linked to SDG 2.3 on doubling
agricultural productivity), how many people
constitute success over what period? Answering
this question requires a thorough understanding
of the institution’s portfolio of activities – what is
the magnitude of activities undertaken to achieve
an objective? The target for a given indicator
and period of corporate reporting then depends
on the objectives in the individual projects (e.g.
recipients expected to benefit from the project
for a given objective) and whether the project is
successful (the anticipated effectiveness rate of
projects). The key building blocks of measuring
aggregate performance are: the design and
implementation of effective projects; and
understanding the distribution and the potential
of such projects across the institution’s portfolio.
As the starting point for corporate-level
measurement of impact is individual projects, a
sound project theory of change that addresses
a development problem, combined with
effective implementation plans, constitutes
the first step towards achieving aggregate
performance. Assuming that corporate goals and
project-specific impact goals align, and that clear
implementation plans identify the investments
and the number of beneficiaries affected by
different types of investments, it should be
possible to determine the anticipated impact of
the project and the number of people obtaining

37
PAR
T I
Ch
apte
r 2
/
benefits associated with each corporate indicator.
If this can be done for every project for the period
in question, determining the corporate-level
impact target for each indicator involves simply
adding the anticipated impacts on that indicator
for each project.
The corporate-level impact targets for the
period relating to the Tenth Replenishment of
IFAD’s Resources (IFAD10) (2016-2018) can be
used to illustrate how this is done. Figure 2.1
summarizes the steps taken by IFAD to develop
targets. IFAD’s Strategic Framework 2016-2025
states that IFAD’s strategic goal is: poor rural
people overcome poverty and achieve food
security through remunerative, sustainable and
resilient livelihoods. To achieve this goal, IFAD
identifies three strategic objectives (SOs): SO1
– increase rural people’s productive capacities;
SO2 – increase rural people’s benefits from
market participation; and SO3 – strengthen
the environmental sustainability and climate
resilience of rural people’s economic activities.
In accordance with this strategy, the following
impact indicators were proposed:
• Number of people experiencing economic
mobility (goal).
• Number of people with improved production
(SO1).
• Number of people with improved market
access (SO2).
• Number of people with greater resilience
(SO3).
The selection of these particular indicators follows
a set of basic rules:
• They need to be clearly defined, measurable
indicators that are aligned with IFAD’s
Strategic Framework. For the three SOs, this
was straightforward because the objectives
are relatively precise – although even in this
case clear rules across diverse projects are
required. For the goal, which is broad and
includes multiple dimensions, choosing an
indicator was more complicated, and in
order to reflect the broad nature of the goal,
economic mobility was used.
11. This review of IFAD’s portfolio did find that one in five projects included an objective that was not aligned with current corporate SOs.
• They need to be aggregable – that is,
one must be able to add up corporate
indicators across distinct projects with
aligned but diverse objectives. For example,
one project may increase rice production
through irrigation, and another may increase
livestock production through finance and
technical assistance. To add these together,
a broad category, such as increased value of
production, is necessary.
• A clear rule of impact needs to be established.
If on average project beneficiaries improved
resilience by 1 per cent, do they have greater
resilience? Although any rule is arbitrary, rules
should reflect what project success would
look like – that is, what percentage increase
would be considered successful.
To determine the targets for each of these
impact indicators, IFAD performed a broad
portfolio analysis based on the distribution of
IFAD interventions across the portfolio. Through
a lengthy process, IFAD analysed project design
documents and available data from all projects
approved between 2010 and 2015, for a total of
189 projects. A systematic analysis was carried
out to identify each project’s theory of change
and record these into a database, along with
financial data and outreach estimates. The link
between each project and the key indicator
categories was determined in order to identify the
potential impact of that project.11
Using the anticipated outreach target of 110-130
million beneficiaries for IFAD10 and assuming a
50 per cent success rate, the estimated RMF
targets for IFAD10 were calculated for the four
indicators. According to these targets, as a
result of IFAD-financed investment projects,
40 million individuals are expected to experience
significant economic mobility, 43 million people to
significantly increase production (SO1), 42 million
people to significantly increase market access
(SO2), and 22 million people to experience
greater resilience (SO3).
The indicators reflect IFAD’s corporate strategic
goal and objectives, and the targets reflect what

38
IFAD actually does in the field. Because this was
a new undertaking for IFAD, it was necessary to
review the portfolio to understand where IFAD
has historically invested. In moving forward,
ideally, IFAD will keep track of its anticipated
impacts per project beginning at the design stage
and have a consistent flow of information on
the expected impact for a given indicator. Given
these indicators and targets, the key challenge
is then to estimate whether these targets are met.
Impact assessment of individual projects
At the core of the proposed strategy to measure
corporate-level impact for IFAD10 is the
aggregation of the results of rigorous project-level
impact assessments. The key to project-level
impact assessments is being able to attribute
the impact observed on the ground to the
intervention being evaluated.
Defining impact means estimating the difference
between how project beneficiaries fared with
the project and how they would have fared in
the absence of the project. It implies identifying
something that is inherently unobservable:
the beneficiaries’ status had they not received
the project; in other words, a parallel status
referred to as the counterfactual. One can
observe individuals in only one of the two states
– with the project or without it – and not the
other. To substitute for this lack of information,
attribution requires using one set of individuals
or households as a counterfactual for another
set. The task then is to identify a comparison,
or control, group that is as similar as possible
to the beneficiary, or treatment, group had it not
received the project.
The fundamental problem of attribution is
preventing selection bias in estimates of impact
– that is, the tendency for those who receive a
project (treatment group) to be different from
those who do not (control group). Selection bias
can occur when individuals self-select into the
project (self-selection bias) or when implementers
allocate the intervention to particular types of
individuals (project placement bias). Those
Goal
Strategic Objective 1
Strategic Objective 2
Strategic Objective 3
Strategic Framework IFAD10 targetsSystematic analysis of projectsTheory of Change
40 million peoplegreater economic mobility
43 million peopleincrease production
42 million peopleincrease market access
22 million peoplegreater resilience
Poor rural people overcome poverty and achieve food security through remunerative, sustainable and resilient livelihoods
Increase poor rural people's productive capacities
Increase poor rural people's bene�ts from market participation
Strengthen the environmental sustainability and climate resilience of poor rural people's economic activities
189 projects2010-2015
Figure 2.1 Identifying corporate impact targets

39
PAR
T I
Ch
apte
r 2
/
who self-select into a project may be more
entrepreneurial, more willing to work with others,
or have more time available. Those selected into
a project by project leaders may be poorer or
from marginalized populations. If evaluators fail
to account for the fundamental characteristics
of beneficiaries in conducting an impact
assessment, selection bias can be introduced
in the impact estimate. The differences between
a treatment and control group could be due
to pre-existing differences in those who self-
selected into or are selected for the project rather
than due to the activities of a project.
There are several methods for constructing a
comparison group to attempt to ensure unbiased
estimates of impact. These different evaluation
designs all share the ultimate goal of trying
to validly construct a counterfactual, but they
differ in their data requirements, methodological
strategy and assumptions. Methods that require
fewer assumptions and are therefore valid in
more settings are preferred.
Impact assessment can be designed ex ante or
ex post. Those designed ex ante are developed
during the project design phase and implemented
in conjunction with the project. Those designed
ex post are initiated after implementation has
begun, and require constructing treatment and
comparison groups after the fact. Ex ante impact
assessments are preferred because they embed
data collection into the project, generating
high-quality baseline data before the project is
implemented and high-quality follow-up data after
it is implemented. They tend to be challenging
to implement because they require that projects
be well planned in advance so that beneficiaries
for the entire project cycle are known. Ex post
impact assessments face their own challenges,
including the difficulty of identifying a reasonable
control group after implementation has begun
and the lack of baseline data from which to build
an evidence base.
There are two broad classes of impact
assessment designs: experimental and
non-experimental. They differ in the way
they identify the counterfactual population.
12. This assumes that randomization and sampling are done following appropriate statistical procedures.
Experimental designs, such as randomized
controlled trials, randomly assign the eligible
population into treatment and control groups. This
random assignment of those eligible for the project
ensures that there are no systematic differences
between project recipients and those who serve
as a comparison group. The only difference
between treatment and control groups should be
that the treatment group receives the project.12
Random assignment can only be done before
project implementation and in the case of ex ante
impact assessments. Randomized controlled trials
are generally considered the gold standard for
assessing impact, because they clearly provide
attribution that avoids selection bias.
Non-experimental approaches seek to mirror
experimental designs by using the best data
possible, and then applying statistical techniques
to create a counterfactual and address selection
bias. Non-experimental designs often require
assumptions that cannot always be tested.
When they are designed ex ante, their underlying
assumptions are easier to defend where baseline
data are available on both treatment and control
groups. When they are designed ex post, their
underlying assumptions are harder to defend.
Yet, under the right conditions, these approaches
can plausibly replicate experimental treatment
effect estimates. These approaches include
matching methods, difference-in-difference
estimators, instrumental variable models, and
regression discontinuity designs.
Careful data collection and appropriate statistical
methods lie at the core of rigorous impact
assessments at the project level. All impact
assessments seek to estimate average treatment
effects – a measure that estimates the difference
in mean (or average) outcomes between
households or individuals in the treatment
group and households or individuals in the
control group. For example, if one objective of
an agricultural project is to increase yields, the
average treatment effect would be the increase
in the value of production per hectare due to the
project, which is the difference in the value of
production per hectare between the treatment

40
group and the control group. From this, the
attributable impact of the project is determined.
It identifies whether, on average, the treatment
group is better off as a result of the project.
Although the impact indicators selected in a
given project should be relevant to the project’s
theory of change, they need to be aggregable in
order to measure corporate-level impact. Thus,
data collection across individual projects must
include a reasonably comparable set of indicators
linked to corporate objectives, and the average
treatment effect must be identified for each of
these indicators at the project level. If a project
is not linked to a given corporate indicator,
this may be acceptable from a project-specific
standpoint, but its impact will then be zero at the
corporate level, suggesting that the project made
no contribution to that objective. Therefore, each
project that is assessed should be linked to at
least one corporate objective.
Furthermore, in some cases, including in the case
of IFAD, there may be a desire to determine the
number of people who receive the benefits of a
project. For example, as figure 2.1 shows, one of
IFAD’s impact indicators is the number of people
with increased market access. Because impact
assessments calculate the average treatment
effect, it can be challenging to determine the
number of people who benefited. If, for example,
a project increases yields by 10 per cent on
average, some people will receive gains lower
than 10 per cent, and others, greater. An average
treatment effect does not reveal the distribution
of impacts, and in fact this is not straightforward
to determine. However, with assumptions about
what level of change constitutes a substantial
impact (e.g. a 10 per cent increase in yield) and
about the distribution of benefits across the
target population, it is possible to estimate the
number of people benefiting. This is discussed
further in the next section.
In its current strategy for IFAD10 and beyond,
IFAD has tried to conduct impact assessments
designed both ex ante and ex post. Given the
benefits of planning ahead to ensure high-quality
data and a sound counterfactual, the long-term
objective is to focus on ex ante studies.
However, it will take time to identify projects
and to implement ex ante impact assessments
in the field. Such impact assessments require
a baseline before investment in the field, and
then follow-up of from two to four years after
investment has actually occurred. Impact
estimates and the lessons learned from the
analysis will then be produced within three to five
years after the initial investment. Given the need
to assess impact during IFAD10 (2016–2018),
IFAD is focusing more heavily on ex post impact
assessments in the short run because they are
essential to ensuring sufficient reporting of results
for this replenishment period, and therefore to
computing corporate impact estimates.
Using these project-level impact assessments
for corporate reporting in the manner
described below also requires a certain level of
comparability of impact assessments across
projects and countries. To this end, IFAD has
developed a management system to ensure
that a solid and consistent approach is put
forward and used across the various impact
assessments. This allows consistency in
methodology, approach and tools for any given
study, taking into account project and country
specificities.
Aggregating to the corporate level
The key objective of measuring corporate-level
impact is to determine whether investments
allowed the institution to reach its targets. For
IFAD, these targets have been described above.
In practice, estimating impact at a corporate level
requires a number of ingredients. First, it requires
a critical mass of impact assessments that meet
the attribution principle through carefully designed
impact identification strategies, and that provide
measurable, aggregable indicators. Second, it
requires a methodology that allows one to go
from a set of individual estimates of impact to an
aggregate estimate of corporate impact. Inferring
the potential impact of the entire portfolio requires
conducting a projection or extrapolation.

41
PAR
T I
Ch
apte
r 2
/
This can be termed “intelligent aggregation” – a
result synthesis that is informed by a carefully
thought-out methodology.
The first step is to select a critical mass of projects
to be evaluated through an impact assessment.
Ideally, all projects would include a rigorous impact
assessment, but as already noted this is generally
not possible owing to cost considerations. Data
collection requires administering questionnaires,
and data analysis requires technical expertise;
each has its own costs. Knowledge generation
is also subject to diminishing returns as
each additional impact assessment on a
given development approach provides less
new information.
Projects selected for impact assessment should
reflect the corporate portfolio both geographically
and in terms of the focus. In selecting projects
for impact assessments, there are normally two
options: (1) purposively select projects based on
criteria that would reflect a preference towards
strategic, innovative projects, or simply a potential
for learning; and (2) randomly select projects to
be evaluated, ensuring some form of statistical
representativeness. There is a trade-off between
purposive selection and random selection.
Choosing projects purposively to maximize
learning from each individual impact assessment
is justified by the reality that not all projects have
the same potential to generate knowledge. Some
may implement business-as-usual or small-scale
interventions, whereas others may have
large-scale or innovative interventions that warrant
an impact assessment. However, an approach
based on a purposive selection designed to
maximize learning does not necessarily lead
to a set of impact assessments that reflect the
corporate portfolio. This approach can thus bias
corporate reporting.
The alternative is to randomly select projects for
an impact assessment from the list of projects.
If the randomization is done properly,13 it should
lead to a representative sample of projects that
can be used to make inferences about the overall
portfolio. This approach maximizes corporate
13. Random selection would necessarily require some form of stratification to ensure that all regions and types of projects are covered.
accountability as the selected projects should be
representative – to the degree possible – of the
portfolio. However, it may come at the expense
of learning, because the selected projects
may not be those that can generate insightful
recommendations and lessons learned. Random
project selection is also difficult to implement in
practice, particularly when the critical mass of
impact assessments includes studies designed ex
ante. Most of the time, it is not possible to know
the entire corporate project portfolio distribution
in advance with certainty, so randomly selecting
projects is not feasible. Moreover, it is not always
possible to assess the impact of a project.
For example, partner governments need to agree,
monitoring data must be sufficiently strong to
create the basis for an impact assessment, and
it must be possible to create a counterfactual.
These last three elements make random
selection of projects for impact assessments
almost impossible to implement. In practice,
some compromise between rigour and feasibility
is needed to ensure a realistic approach that
contains a critical mass of impact assessments
able to reflect the corporate portfolio.
Once impact estimates for key measurable
indicators from individual impact assessments
have been obtained, the next step is to aggregate
this measure to the corporate level through
projection or extrapolation of some sort. Making
such an extrapolation requires understanding the
portfolio and the relationship between the projects
selected for the impact assessment and those
that are not selected. In other words, it requires
an understanding of to what extent the selected
impact assessments relate to the overall portfolio.
The extrapolation can be conducted in a variety
of ways. The focus here is on the basic approach
used by IFAD. This approach begins by developing
a global, or aggregate, estimate of impact for
the indicator of interest and then projecting it
onto the population of interest. This means using
the estimated average treatment effects for an
indicator from each project to calculate one global
estimate of impact showing the average treatment
effect for an indicator based on IFAD’s full portfolio

42
of work. For example, if the indicator is an increase
in the value of production per hectare, the average
treatment effects for each project can be used to
make a global estimate of increase in the value
of production per hectare based on an intelligent
aggregation of the average treatment effect of the
projects evaluated. This intelligent aggregation can
potentially be done through meta-analysis, which
is a systematic approach designed to provide
a quantitative summary of statistical indicators
reported in similar empirical studies.14
Once this global estimate has been calculated,
the measure of corporate impact must be
computed. As noted in figure 2.1, this is the
number of people achieving certain benefits,
such as increased value of production. This is
calculated by applying the global estimate to
the population of interest, which consists of the
beneficiaries of the projects in the portfolio (within
a given time frame). As the global estimate is a
global average treatment effect, assumptions must
be made about the distribution of benefits – that
is, the different percentage gains achieved by
different beneficiaries. Actual impacts on individual
beneficiaries will vary, with some receiving greater
benefits than the average and others receiving less
14. For an example of how this is done, see Garbero (2016).
than average. Precisely calculating who benefits
is challenging. One conservative approach is to
assume a doubling of benefits for some and zero
benefits for the remaining population, and then
to extrapolate this to the projected population of
beneficiaries. In effect, this is multiplying the global
estimated effect by the total number of projected
beneficiaries. Alternative, more reasonable
assumptions could be made.
Figure 2.2 summarizes how this was done
under IFAD9 and how the results shown in table
2.2 were obtained. Under IFAD9, there was an
attempt to randomly select projects that could be
evaluated to compile a critical mass of projects
representative of IFAD projects across IFAD’s five
regions. Initially, about 200 projects were identified
as being near completion during the 2010–2015
period and thus could be assessed for impact.
Of those, only 122 had sufficient data. Of the
projects with data, 41 were randomly selected for
potential inclusion – 26 projects was the target
number of impact assessments, so 15 were
selected as reserves. For a number of reasons
(such as data availability, strategic relevance, and
timing), only 14 of the 26 were retained and 8
additional projects purposively selected, for a total
Review of portfolio Selection of projects Estimates of impactacross selected projects
Meta-analysis and projection to the portfolio
Projects closing during replenishment period
Number and types of projects
Representative of portfolio
15 per cent of portfolio
1 2 3 4
X million people
impacted
Figure 2.2 Steps of the IFAD9 Impact Assessment Initiative

43
PAR
T I
Ch
apte
r 2
/
of 22 impact assessments. To augment those, an
additional 14 projects were chosen for analysis
using secondary data. A total of 36 projects
underwent some form of impact assessment
(with primary or secondary data). The process
highlighted the challenges of random selection of
projects for impact assessments, and provided a
strong argument that purposive selection from the
beginning was more likely to be successful.
Next, the average treatment effects on key
variables were calculated for these projects based
on available data – not all indicators were available
in every study. A meta-analysis was conducted
to obtain one global estimate per indicator.
This procedure provided the global estimates
of impact reported in table 2.2, column heading
“Global impact estimate (average treatment
effect)”. Such global estimates of impact were
then projected to a universe of beneficiaries
(both direct and indirect) reached by projects
that were active or due to be completed in the
2010-2015 period. Outreach estimates on the
number of beneficiaries reached were about
240 million. It was therefore possible to project
impact with a simple multiplicative function, given
that the global average treatment effects were
representative of the portfolio at the regional
level. For example, the poverty reduction global
estimate of 9.9 per cent translates into 24 million
people projected to move out of asset poverty
from the investments of projects open and closed
during the 2010-2015 period.
As part of IFAD10, a similar logic will be applied
to estimate corporate impact. The first step
has entailed identifying projects suitable for an
impact assessment in the existing portfolio of
projects ongoing and closing between 2016 and
2018 according to a number of key features,
including region and project type. The projects
have been selected purposively according to
project type and geographical distribution in
order to reflect the overall portfolio. The second
step entails conducting impact assessments of
the selected projects by 2018. As generating
evidence through ex ante impact assessment
takes time, this approach relies only on ex
post impact assessments and will include the
estimation of average treatment effects for the
impact indicators of interest noted in figure 2.1
(among other indicators). The third step will be to
carry out a meta-analysis across all the ex post
impact assessments to derive global estimates of
corporate impact. The latter can be stratified by
the key portfolio features. The last step would be
to extrapolate to the portfolio universe.
The end result of this approach would be
the generation of corporate-level impact
estimates across the main impact indicators
– namely, agricultural production, market
access, resilience and economic mobility.
These can then be compared with the targets
noted in figure 2.1. The main strength of this
approach lies in its simplicity, transparency
and, ultimately, coherence. Projects evaluated
not only support learning, they also respond
to the need for accountability because they
are able to systematically reflect IFAD’s project
portfolio distribution.
However, these approaches rely on a host of
assumptions, starting from those linked to the
individual impact assessments and including the
assumptions underlying the meta-analysis and
extrapolation. In interpreting results coming out
of this exercise, these caveats must be kept in
mind. The primary benefit of conducting such an
analysis is to increase and maintain the focus on
achieving the results articulated in a corporate
strategic framework.
Moving forward: opportunities and challenges
Discussions of impact assessment often focus
on reporting for the purpose of accountability,
which is important for stakeholders. However,
this focus significantly underestimates the value
of impact assessment as a means of learning and
as a way to focus development efforts. Attempts
to attribute impact put a spotlight on a project
by raising questions about how investments
should ultimately lead to impact. Such scrutiny

44
can lead to a reassessment of the project’s
theory of change and reconsideration of the
adequacy of a project’s monitoring and evaluation
(M&E) systems.
Highlighting the role of impact assessments,
a paper by Legovini, Di Maro and Piza (2015)
analysed the differences between projects with
and without an impact assessment. The analysis
showed that the delivery of projects with an
impact assessment was significantly timelier and
avoided common delays. These effects were
attributed to a clearer implementation road map,
evidence-based midcourse corrections, and
strengthened capacity on the ground. Thus, the
benefits of impact assessments include not just
improving learning and accountability but also
focusing project managers on results and thereby
enhancing project design and general M&E.
The scrutiny that accompanies an individual
impact assessment also accompanies
corporate-level impact measurement. IFAD’s
attempt to assess impact both in IFAD9 and in
IFAD10 has been a key factor in the elaboration
of its Development Effectiveness Framework.
As described in Chapter 1, this framework is
an institutional set-up that seeks to create a
structure to facilitate the use of evidence in
decisions on the design and implementation of
projects. A focus on development effectiveness
requires the adequate measuring of results
– from outputs to outcomes and impact – and
the design and implementation of effective
projects. As with individual projects, the benefit of
corporate-level impact assessment is to enhance
the focus on results.
While a corporate impact assessment agenda
presents an opportunity for IFAD in the long run,
there are significant challenges to implementing
the plans noted in this chapter and deriving the
benefits of corporate measurement. One set
of challenges revolves around the project-level
impact assessments that are the basis of the
corporate approach.
First, buy-in from both IFAD and government
stakeholders is crucial to ensure that
policy-relevant questions are asked in the impact
assessment and to allow impact assessments
to be properly designed and implemented.
An impact assessment provides the greatest
benefits when there is a strong partnership
between the project team and the technical team
conducting the assessment.
Second, project design can create challenges.
A project that lacks a clear focus on delivering a
key result and that has multiple components that
are not clearly connected is difficult to assess
because there is no critical mass of interventions
linked to a clear and measurable result.
In contrast, a project whose components all
drive to a single consistent set of results is easier
to assess.
Third, weak M&E systems within a project
hinder the overall impact assessment because
it is difficult to identify impact without adequate
information. This is particularly challenging for
impact assessments designed ex post because
the lack of adequate monitoring data, including
baselines and lists of beneficiaries, means
researchers have to try to create information from
past activities.
Fourth, the best timing for the selection of projects
that will undergo an impact assessment is also
an issue. Data collection often needs to fit not
only the agricultural cycle but also the project
timeline. Ex post impact assessment ideally
occur prior to the closure of the project so project
completion reports can benefit from the impact
assessment findings. The timing of ex ante impact
assessments depends on project start-up.
Another set of challenges relates to determining
corporate-level impact. IFAD has been striving
for evaluable projects that are suitable for impact
assessments, that can maximize learning, and
that reflect IFAD’s overall portfolio distribution.
However, there is often a mismatch between a
project’s initial concept and its implementation.

45
PAR
T I
Ch
apte
r 2
/
This design-implementation mismatch means
that projects do not reflect the expected project
type and therefore the portfolio distribution.
Corrections or adaptations in implementation
are not always carefully documented, and this
is particularly problematic because projects with
impact assessments form the empirical basis of
the extrapolation methodology.
The resources needed to conduct an impact
assessment also present a challenge for two
reasons. First, if a primary objective of impact
assessment is corporate reporting, it is difficult
to embed data collection costs within a project.
This is potentially resolved by ensuring that the
impact assessment is relevant for governments.
Second, knowledge generation is a public good,
and its value goes beyond the individual project or
country – impact assessments provide knowledge
with potentially broad implications. Consequently,
it tends to suffer from underinvestment. This
means that new resources are likely to be required
for impact assessment, putting pressure on
already tight development assistance budgets.
Last, there are challenges linked to the overall
aggregation methodology. The methods
necessary for individual impact assessments
and corporate aggregation are technically
sophisticated and require specialist knowledge.
This creates challenges in conveying the
arguments for appropriate methods and in
providing the caveats in any reporting. It also
creates challenges in communicating results.
Nevertheless, these challenges represent
tremendous opportunities for improvement.
Ultimately, the lessons learned, both positive and
negative, will improve M&E systems overall. They
will simplify and therefore focus IFAD-supported
projects, increasing IFAD’s capacity to deliver
evidence-based, policy-relevant results; and they
will allow IFAD to achieve higher (and measurable)
standards in aggregate terms.
References
Evaluation Gap Working Group. 2006. When will
we ever learn? Improving lives through impact
evaluation. Washington, D.C.: Center for Global
Development.
Garbero, A. 2016. Measuring IFAD’s impact:
Background paper to the IFAD9 Impact
Assessment Initiative. IFAD Research Series 07.
Rome: IFAD.
Gertler, P., Martinez, S., Premand, P., Rawlings,
L. B. and Vermeersch, C. M. J. 2011. Impact
evaluation in practice. Washington, D.C.:
World Bank.
IFAD (International Fund for Agricultural
Development). 2016. Synthesis of lessons
learned from the IFAD9 Impact Assessment
Initiative. Rome, https://webapps.ifad.org/
members/eb/117/docs/EB-2016-117-R-8-
Rev-1.pdf
Khandker, S. R., Koolwal, G. B. and Samad,
H. A. 2010. Handbook on impact evaluation:
Quantitative methods and practices. Washington,
D.C.: World Bank.
Legovini, A., Di Maro, V. and Piza, C. 2015.
Impact evaluation helps deliver development
projects. Policy Research Working Paper No.
WPS 7157. Washington, D.C.: World Bank,
http://documents.worldbank.org/curated/
en/676351468320935363/Impact-evaluation-
helps-deliver-development-projects
OECD (Organisation for Economic Co-operation
and Development). 2017. Development aid at a
glance: Statistics by region, 2017 edition. Paris.
Pritchett, L. 2014. Saturday Night Live satirizes
kinky development. Blog post, October
21. Washington, D.C.: Center for Global
Development, www.cgdev.org/blog/saturday-
night-live-satirizes-kinky-development
Sabet, S. M. and Brown, A. N. 2017. Is impact
evaluation still on the rise? Recent trends in the
evidence base for development. 3ie Draft paper.

46
In the wake of the Addis Ababa Action Agenda’s
call for unprecedented investments in achieving
the Sustainable Development Goals, international
financial institutions (IFIs) – such as the World
Bank and the regional development banks –
have been playing an increasingly important role
in providing financial assistance to developing
countries. Unlike budget support, which is non-
earmarked and provided as a one-off payment,
operations financed by IFIs are typically tied to
the implementation of a particular programme or
project for which funding is granted in tranches
of disbursements. Accordingly, the success of
IFI-financed operations, and their ability to have
the intended development impact, depends on
a rapid project start-up, and regular and timely
disbursements of funding to recipient countries
(Gohou and Soumaré, 2009; Sunjka and Jacob,
2013; Mishra, 2016). Although the observed
disbursement performance is to a large extent
a reflection of the recipient’s ability to implement
the project, IFIs have a shared responsibility by
supervising project implementation and releasing
funds to the recipient when necessary and
deemed appropriate.
In an effort to promote more timely and
accelerated disbursements to IFAD’s projects,
the study presented in this chapter rigorously
analyses trends in the Fund’s disbursement
performance and the drivers of those trends.
This reflects broader efforts by IFAD to move
towards results-based management and to
inform decisions through the analysis of data.
As a specialized United Nations agency and
IFI that provides grants and concessional and
non-concessional loans to governments of
developing countries, IFAD currently manages
a portfolio of about US$6.8 billion of its own
financing to 230 rural and smallholder agricultural
development projects in more than 90 countries.
Projects are collaboratively designed by IFAD
and the recipient government, and implemented
by a project management unit composed of
recipient government staff, with IFAD adopting
a supervisory role throughout implementation.
Thus, when testing the factors that influence
disbursement performance, this study considers
factors related both to the country and to IFAD.
The number of published studies of IFI
disbursement performance is relatively small
– table 3.1 provides an overview. By adding
to that body of work, the study presented in
this chapter can provide important lessons not
only for IFAD but also for other IFIs. Internally, it
represents the first systematic investigation of the
drivers of IFAD’s disbursement performance and
seeks to offer evidence-based insights for future
improvement. Externally, the study represents
the most comprehensive, and possibly the
most methodologically robust, analysis of
IFAD’s disbursement performance: trends and drivers
Chapter 3
by
Tim Balint
Daniel Higgins
Paola Mallia
Silvana Scalzo
Paul Winters

47
PAR
T I
Ch
apte
r 3
/
disbursement performance of an IFI to date.
It can serve as a potential best-practice approach
for other IFIs wanting to assess and improve their
disbursement performance.
Formally, the investigation aims to answer the
following research questions:
• What are the trends in IFAD’s disbursement
performance over the past 20 years?
• What are the most significant factors that
influence IFAD’s disbursement performance?
• How can IFAD (and other IFIs, if relevant)
improve disbursement performance in
the future?
Table 3.1 Existing quantitative studies of the drivers of IFI disbursement performance
Organization and study Focus and sample Results
African Development Bank (AfDB)
Gohou and Soumaré (2009)
• Focus: Factors that influence time between approval and first disbursement.
• Sample: 2,195 AfDB-financed projects approved between 1967 and 2008.
• Positive effect: Higher GDP per capita; higher project budget; project being financed by a grant rather than a loan; project being related to communication sector.
• Negative effect: Project in the south of the continent.
• No effect: Project sector; project in north, west or east of the continent.
African Development Bank (AfDB)
Nkamleu, Tourino and Edwin (2011)
• Focus: Causes of delay between approval and first disbursement.
• Sample: 525 AfDB-financed projects approved between 1990 and 2007 in the agriculture and agro-industry sector.
• Positive effect: Higher approved project budget; more recent approval date; higher number of components.
• Negative effect: Longer planned duration.
• No significant effect: Goal linked to agricultural and productivity growth; share of budget covered by AfDB; located in an AfDB-only eligible country.
Inter-American Development Bank (IDB)
Álvarez, Bueso-Merriam and Stucchi (2012)
• Focus: Factors that drive disbursement performance from approval until end of project.
• Sample: 1,049 IDB projects approved between 1996 and 2011.
• Positive effect: Higher approved budget; team leader located in country (after policy change in 2009).
• Negative effect: Team leader located in country (before policy change in 2009); longer preparation time; change in team leader during project life; number of projects managed by team leader.
• No effect: Age and experience of team leader.
World Bank
Kersting and Kilby (2015)
• Focus: Effects of country having an upcoming election and being aligned with the United States of America on the United Nations Security Council, against the number of months taken to disburse 25 per cent of project budget.
• Sample: 5,115 projects implemented between 1984 and 2012.
• Positive effect on accelerating disbursements): When a country that is aligned with the United States of America on the United Nations Security Council has an upcoming election.
• Limitation: Effect does not hold for non-competitive elections where there is little risk to the incumbent.

48
Data and methodology
Data
This study analyses the disbursement
performance of the 577 IFAD-supported projects
approved between 1995 and 2014. It excludes
investment projects approved before 1995
because data on potential explanatory factors
for IFAD’s disbursement performance are not
available for the 1980s and early 1990s owing
to the lack of corporate databases at that time.
To ensure that the most up-to-date data were
included, disbursements until 31 December 2015
were considered for the selected project sample.
Data on the disbursements were drawn from an
internal data source and carefully adjusted, taking
into account the specifics of start-up advances
and consistent retroactive financing in Botswana,
Mexico and Morocco, as well as returns and
refunds. Country-level data from a variety of
sources were merged with these internal data.
Defining disbursement performance
indicators
Disbursement-delaying issues can occur at many
points along a project’s life cycle. Figure 3.1
gives an overview of the life of an IFAD-financed
project from approval to closure, highlighting
these points. Based on internal documents and
consultations with in-house disbursement experts,
it was determined that the most meaningful way
of categorizing these points for the purpose of
analysis was to group them into: (1) those that
come before the first two project disbursements;
and (2) those that come thereafter. Through this
consultation process, indicators were formulated
for these two areas of disbursement performance.
Accordingly, IFAD’s disbursement performance is
considered from two perspectives: disbursement
readiness, and disbursement effectiveness.
Disbursement readiness covers the period
leading up to the first two disbursements. This
period represents the ability to actually begin
implementation of a project after formal approval.
Disbursement effectiveness covers the remaining
period, looking at the pace and amount of
disbursements throughout the project lifetime until
closure. These two dimensions are of the utmost
importance for development effectiveness. They
also reflect the most common indicators used in
the results measurement frameworks of other IFIs,
including the African Development Bank, Asian
Development Bank, Inter-American Development
Bank and World Bank, as well as those used in
previous studies conducted on their disbursement
performance (see table 3.1).
To assess disbursement readiness, the analysis
uses five indicators covering the three key
stages of this period, which are: being declared
effective/entering into force; receiving the
first disbursement; and receiving the second
disbursement. The second disbursement was
identified as an important readiness milestone.
This was because, while the first disbursement
is sometimes an advance to cover planned
project expenditures, the second disbursement
occurs only once proof has been provided that
expenditures are under way and therefore that
Executive Boardapproval
Financing agreementis signed
Entry intoforce
Firstdisbursement
Seconddisbursement
Projectclosure
Financialclosure
Series of disbursementsper year
Further disbursements(settlement of activities)
Rati�cation(if needed)
Possibility to request
start-up funds
If rati�cation is not needed, signing =
entry into forceWithdrawal conditionsto be met by borrower
Figure 3.1 The life of an IFAD project
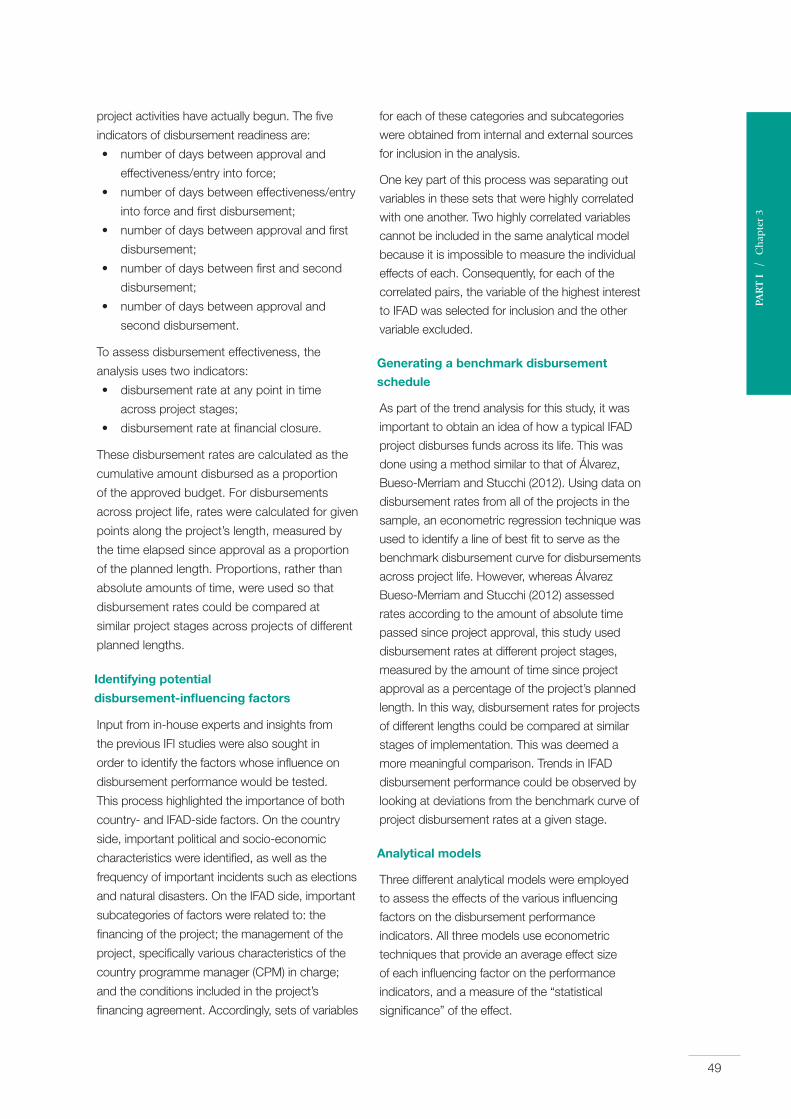
49
PAR
T I
Ch
apte
r 3
/
project activities have actually begun. The five
indicators of disbursement readiness are:
• number of days between approval and
effectiveness/entry into force;
• number of days between effectiveness/entry
into force and first disbursement;
• number of days between approval and first
disbursement;
• number of days between first and second
disbursement;
• number of days between approval and
second disbursement.
To assess disbursement effectiveness, the
analysis uses two indicators:
• disbursement rate at any point in time
across project stages;
• disbursement rate at financial closure.
These disbursement rates are calculated as the
cumulative amount disbursed as a proportion
of the approved budget. For disbursements
across project life, rates were calculated for given
points along the project’s length, measured by
the time elapsed since approval as a proportion
of the planned length. Proportions, rather than
absolute amounts of time, were used so that
disbursement rates could be compared at
similar project stages across projects of different
planned lengths.
Identifying potential
disbursement-influencing factors
Input from in-house experts and insights from
the previous IFI studies were also sought in
order to identify the factors whose influence on
disbursement performance would be tested.
This process highlighted the importance of both
country- and IFAD-side factors. On the country
side, important political and socio-economic
characteristics were identified, as well as the
frequency of important incidents such as elections
and natural disasters. On the IFAD side, important
subcategories of factors were related to: the
financing of the project; the management of the
project, specifically various characteristics of the
country programme manager (CPM) in charge;
and the conditions included in the project’s
financing agreement. Accordingly, sets of variables
for each of these categories and subcategories
were obtained from internal and external sources
for inclusion in the analysis.
One key part of this process was separating out
variables in these sets that were highly correlated
with one another. Two highly correlated variables
cannot be included in the same analytical model
because it is impossible to measure the individual
effects of each. Consequently, for each of the
correlated pairs, the variable of the highest interest
to IFAD was selected for inclusion and the other
variable excluded.
Generating a benchmark disbursement
schedule
As part of the trend analysis for this study, it was
important to obtain an idea of how a typical IFAD
project disburses funds across its life. This was
done using a method similar to that of Álvarez,
Bueso-Merriam and Stucchi (2012). Using data on
disbursement rates from all of the projects in the
sample, an econometric regression technique was
used to identify a line of best fit to serve as the
benchmark disbursement curve for disbursements
across project life. However, whereas Álvarez
Bueso-Merriam and Stucchi (2012) assessed
rates according to the amount of absolute time
passed since project approval, this study used
disbursement rates at different project stages,
measured by the amount of time since project
approval as a percentage of the project’s planned
length. In this way, disbursement rates for projects
of different lengths could be compared at similar
stages of implementation. This was deemed a
more meaningful comparison. Trends in IFAD
disbursement performance could be observed by
looking at deviations from the benchmark curve of
project disbursement rates at a given stage.
Analytical models
Three different analytical models were employed
to assess the effects of the various influencing
factors on the disbursement performance
indicators. All three models use econometric
techniques that provide an average effect size
of each influencing factor on the performance
indicators, and a measure of the “statistical
significance” of the effect.

50
For the disbursement readiness analysis, a survival
model analysis was employed. This structures the
data into time periods and assesses the influence
of a given factor on the likelihood of a project’s
first disbursement occurring in that period (see
Cameron and Trivedi, 2005). The benefit of this
approach over other econometric models is that
it allows for the inclusion of projects that have
not yet disbursed, as these are classed as “right
censored” in the survival model, and the periods
that have already occurred before the end of the
dataset can still be analysed.
The analytical model used for the disbursement
effectiveness indicator of disbursements across
project life was a dynamic random-effects
generalized least squares model (see Wooldridge,
2002). This was deemed the most appropriate
owing to its usefulness for analysing data
taken across multiple points over time. For the
assessment of factors influencing the amount
disbursed by project closure, which would have
only one data point for each project, a standard
ordinary least squares regression analysis was
deemed the most appropriate.
Trends in IFAD’s disbursement performance
Disbursement readiness
IFAD’s overall disbursement readiness has
improved slightly over its past five three-year
replenishment periods (table 3.2). The average
time from approval to first disbursement fell from
21.0 months to 17.6 months, and the average
time from approval to second disbursement
dropped from 28.3 months to 24.5 months.
Strikingly, the time it takes to complete different
phases has changed dramatically over the years.
Projects that disbursed for the first time in the
IFAD9 replenishment period (2013-2015) needed
only 7.4 months to be declared effective – half the
time needed during IFAD5 (2001-2003). At the
same time, projects in IFAD9 needed twice as
much time to obtain a first disbursement after
effectiveness as those in IFAD6. This change is
probably an effect of the 2009 revision of the
General Conditions for Agricultural Development
Financing, which abolished effectiveness
conditions but resulted in the addition of many
more first disbursement conditions to project
financing agreements.
Table 3.2 Disbursement readiness in IFAD’s past five replenishment periods
IFAD5(2001-2003)
IFAD6(2004-2006)
IFAD7(2007-2009)
IFAD8(2010-2012)
IFAD9(2013-2015)
Board approval to effectiveness
15.8 15.3 13.7 9.9 7.4
Effectiveness to first disbursement
5.3 5.1 5.3 8.2 10.2
Subtotal (Board approval to first disbursement)
21.0 20.4 19.0 18.1 17.6
First to second disbursement
7.3 9.4 7.4 8.3 6.9
Total (Board approval to second disbursement)
28.3 29.8 26.4 26.4 24.5

51
PAR
T I
Ch
apte
r 3
/
Regionally, the average time from approval to
first disbursement improved across the board
over time, with the recent exception of the
Near East, North Africa and Europe region
(table 3.3). The West and Central Africa region’s
performance greatly improved from a peak of
more than 24 months in IFAD6 to 16 months in
IFAD9. Projects in the Asia and the Pacific and
in the East and Southern Africa regions also
managed to reduce the time lag by more than
30 per cent, from about 19 months in IFAD5 to
14-15 months in IFAD9. The Latin America and
the Caribbean region still has the highest lag
between approval and first disbursement, but
here as well disbursement readiness has steadily
improved since IFAD6.
Disbursement effectiveness
IFAD projects often run beyond their planned
length. The data on disbursement effectiveness
show that by the 100 per cent planned
completion point, the benchmark curve rate of
disbursement of funds reaches only 71.4 per cent
(figure 3.2 and table 3.4). In addition, figure 3.2
highlights the high amount of variation in the
disbursement performance of IFAD projects.
While values for the disbursement curve are not a
reflection of average values but a smoothed-out
stylized depiction, the figure shows that many
projects fall both well above and well below the
benchmark curve. Moreover, it is clear that IFAD
RegionIFAD5
(2001-2003)IFAD6
(2004-2006)IFAD7
(2007-2009)IFAD8
(2010-2012)IFAD9
(2013-2015)
Asia and the Pacific 19.6 16.1 17.7 15.6 14.8
East and Southern Africa 19.3 17.6 15.5 16.6 14.2
Latin America and the Caribbean
26.0 31.3 28.3 26.5 23.3
Near East, North Africa and Europe
17.1 20.1 19.7 15.4 21.1
West and Central Africa 22.7 24.2 17.4 18.3 15.9
Table 3.3
Table 3.4
Average time from approval to first disbursement by IFAD region and replenishment period
Disbursement rates along the line of best fit
% planned time Disbursement rate (%)
10 2.8
20 8.6
30 16.7
40 25.1
50 33.4
60 41.6
70 49.4
80 57.0
90 64.4
100 71.4
110 78.2
120 83.5
130 91.3
140 97.5
150 100.0

52
100
90
80
70
60
50
40
30
20
10
0
All
84.4 88.4 81.5 85 90.8 79.7
APR ESA LAC NEN WCA
Gro
ss d
isbu
rsem
ent r
ate
(%)
020
4060
8010
0
0 50 100 150
Percentage of planned length complete
Gro
ss d
isb
urse
men
t ra
te (%
)
Figure 3.2
Figure 3.3
Disbursement rates of all projects with line of best fit
Disbursement rates at project closure by region
Note: These data show the benchmark disbursement curve plotted across all of the disbursement rates of the 577 IFAD projects included in the sample, taken at intervals of 2.5 per cent of planned project length.
Note: APR = Asia and the Pacific; ESA = East and Southern Africa; LAC = Latin America and the Caribbean; NEN = Near East, North Africa and Europe; WCA = West and Central Africa.

53
PAR
T I
Ch
apte
r 3
/
Variables Disbursement readiness Disbursement effectiveness
Time to first disbursement
Time to second disbursement
Disbursement rate across project life
Disbursement rate at project closure
Country classification
State fragility index (The higher, the ...)
nsSlower***
(+14 days per point)
Lower*(-0.5%)
ns
Gross national income (GNI) per capita (The higher, the ...)
Slower** Slower*** - -
Financing terms (The more grant versus non-grant financing, the ...)
- -Higher***(+15%)
Higher***(+12%)
Small state (If yes, then ...) - - nsHigher**(+13%)
Socio-economic and political variables
Official development assistance (ODA) to agriculture (The higher, the …)
Quicker** (#) Quicker*** (#) ns ns
Elections in current year(If yes, then …)
Slower***(+84 days)
Slower*** (#)
(+141 days)ns
Higher*(+0.9% per
election)
General government revenue (The higher as % of GDP, the …)
Quicker** Quicker** - -
Current account balance (The higher as % of GDP, the …)
Slower*** ns ns ns
SDR/local currency exchange rate (The stronger SDR versus local currency, the …)
- - -Lower**(-3.2%)
Events in country during implementation
Number of extreme weather events (The more events, the …)
Slower***(+8 days per
event)
Slower***(+11 days per
event)ns
Higher*(+0.2% per
event)
Number of epidemics (The more epidemics, the …)
Slower***(+7 days per
event)
Slower*(+3 days per
event)- -
Number of incidents of drought (The more events, the …)
- - nsHigher**
(+0.7% per event)
Number of incidents of agricultural disasters (The more events, the …)
- - ns ns
Notes: ns = not significant; # = level only significant in one of the two statistical models. – = variable not tested for this indicator. SDR = special drawing rights. Coefficients in brackets are shown only if easy to interpret. Estimated p-values of statistics: *** = p < 0.01 (meaning a 99% probability that the result is different from 0), ** = p < 0.05 (95%), * = p < 0.1 (90%).
Table 3.5 Results for country-level factors on disbursement readiness and effectiveness

54
Table 3.6 Results for project-level factors on disbursement readiness and effectiveness
Variables Disbursement readiness Disbursement effectiveness
Time to first disbursement
Time to second disbursement
Disbursement rate across project life
Disbursement rate at project closure
Financing
Approved IFAD financing(The higher the amount, the …)
Quicker***(optimal: US$32 million)
Quicker* - -
First disbursement (as % of approved)(The higher the first disbursement, the …)
- Quicker*** - -
Use of start-up funds(If used, then …)
Slower*** (#) ns - -
Start-up advance (as % of approved)(The higher the start-up, the …)
- ns - -
Cofinancing ratio(The higher, the …)
- -Lower**(-0.4%)
ns
Infrastructure financing (The higher as % planned, the …)
- - ns ns
Credit financing (The higher as % planned, the …)
- - ns ns
Soft activities financing(The higher as % planned, the …)
- - ns ns
Management
Operational IFAD country office (ICO)(If yes, then …)
Slower* Slower*** (#)Higher**(+4.6%)
Lower*(-9%)
ICO is headed by country programme manager (CPM)(If yes, then …)
Quicker** (#)
(-62 days)Quicker*** (#)
(-9 days)ns
Higher***(+24%)
Project was directly supervised (If yes, then …)
- - nsHigher***(+16%)
Country Programme Manager
CPM turnover (If CPM who designed the project is still in charge during start-up, then …)
Quicker***(-160 days)
Quicker* (#)
(-146 days)ns ns
CPM experience (The more years of IFAD experience the CPM has, the …)
Quicker*** (#) Quicker*** ns ns
CPM workload (The larger the portfolio managed by the CPM, the …)
Slower** (#) Slower* (#) ns ns
CPM gender(If the CPM is a woman, then …)
ns
(Quicker for time
to entry into
force**)
ns
(Quicker from
first to second
disbursement**)
ns ns

55
PAR
T I
Ch
apte
r 3
/
Variables Disbursement readiness Disbursement effectiveness
Time to first disbursement
Time to second disbursement
Disbursement rate across project life
Disbursement rate at project closure
Financing agreement conditions
Ratification of financing agreement(If required, then …)
ns
(Slower for time to
entry into force***)
(Quicker for entry
into force to first
disbursement***)
ns - -
Financing agreement was signed by correspondence (If yes, then …)
ns
(Slower for
approval to entry
into force***)
ns - -
Project implementation manual required (If yes, then …)
ns
ns
(Quicker for
first to second
disbursement*)
- -
Number of accounts required (The higher the number of accounts, the …)
ns ns - -
Project management unit required(If yes, then …)
Quicker***
(-61 days)ns - -
Project director required (If yes, then …)
ns ns - -
Number of conditions (The higher the number of conditions, the …)
ns ns - -
Note: ns = not significant; # = level only significant in one of the two statistical models. – = variable not tested for this indicator. Coefficients in brackets are shown only if easy to interpret. Estimated p-values of statistics: *** = p < 0.01 (meaning a 99% probability that the result is different from 0), ** = p < 0.05 (95%), * = p < 0.1 (90%).

56
projects are typically slow starters, with the curve
reaching around just 33 per cent by the halfway
mark of planned project length.
For various reasons, IFAD projects do not have
to have disbursed their total approved budget
by the time of financial closure, and undisbursed
balances are returned to IFAD. In fact, the
average amount actually disbursed across all
projects is 84.4 per cent (figure 3.3). Across
regions, the Near East, North Africa and Europe
stands out with the highest rate, at 90.8 per cent,
followed by projects in Asia and the Pacific
with 88.4 per cent, and Latin America and
the Caribbean with 85.0 per cent. The closed
portfolio for projects in sub-Saharan Africa lags
behind, with West and Central Africa reaching a
disbursement rate below 80 per cent.
Explaining IFAD’s disbursement performance
Tables 3.5 and 3.6 present the findings of the
econometric analysis for the country- and
the IFAD-side factors affecting disbursement
readiness and effectiveness indicators. R-squared
statistics are a measure of the strength of an
analytical model. In this case, they show that the
included variables explain more than 60 per cent
of the variation for the disbursement readiness
models and 45 per cent of the variation for the
effectiveness models.
On the country side, the analysis finds that the
likelihood of disbursements being delayed during
start-up significantly increases if a country is a
fragile middle-income country, has constrained
fiscal space (measured by government revenue
and current account balance), or is in an
election year. In addition, non-fragile low-income
countries, countries with a stable local currency,
and those that have had a higher frequency of
elections and natural disasters (e.g. droughts)
during the project life tend to have higher
disbursement rates. Thus, the study confirms
the hypothesis by Ahsan and Gunawan (2010)
that a devalued national currency decreases the
likelihood of fully disbursing the approved project
budget, and the need to do so. Elections and
natural disasters have a negative effect during
early project stages but a positive effect in the
long term. This result may occur because a
high incidence of such events generates more
demand for spending the available resources, but
such demand is offset by the disruption caused if
they occur during project start-up.
On the IFAD side, the results show that the
size, type and sequencing of project financing
all play a role. Projects with larger budgets
disburse faster. However, during implementation,
IFAD’s disbursement rates suffer from excessive
dependence on cofinancing. Although the
study also finds that start-up advances do not
accelerate first disbursements, it shows that
a relatively high first disbursement is a good
predictor of a more rapid second disbursement.
This finding suggests that IFAD’s efforts to support
the submission of larger and better-quality
withdrawal applications are bearing fruit.
Furthermore, the variables over which IFAD has
the most control clearly make a difference. The
results assert that having offices in the field (IFAD
country offices [ICOs]) with nationally recruited
IFAD staff (country programme officers) benefits
IFAD’s disbursement performance during
implementation. ICOs headed by outposted
country programme managers (CPMs) are
also shown to have a positive impact on both
disbursement readiness and effectiveness.
Moreover, signing financing agreements
face-to-face (rather than by correspondence)
is shown to accelerate the process and almost
offsets the delays resulting from ratification
requirements. Finally, the study shows that the
turnover, experience and workload of CPMs
are important elements of IFAD’s disbursement
readiness. If the CPM remains the same at
approval and during start-up of a project, the
first and second disbursements are roughly
five months quicker than in cases of turnover.
Performance is further enhanced if the CPM is
experienced, is not overloaded with work and/or
is a woman.

57
PAR
T I
Ch
apte
r 3
/
Concluding remarks
The study presented in this chapter is the first
in-depth investigation of the trends and drivers of
IFAD’s disbursement performance. It is also the
most extensive study of this area conducted for
any IFI. It reveals areas where IFAD, and perhaps
other IFIs, can improve their performance in
disbursing funds for development projects, and
thereby achieve better end results.
Indeed, the analysis of disbursement trends
highlights the need to do better. From 2003
to 2015, the time between approval and first
disbursement improved only slightly, from
21.0 months to 17.6 months. IFAD-supported
projects disbursed, on average, only 84.4 per cent
of their approved budget, albeit with significant
differences across countries and regions. On a
year-by-year basis, projects were generally
slow in disbursing funds, reaching a rate of only
33 per cent at the halfway point of their originally
planned implementation schedule, and not
more than 71 per cent at the originally planned
completion date.
These trends, according to the study, result
from several factors under the control of
recipient countries and IFAD itself. These factors
– especially the internal factors over which a
funding organization such as IFAD has control
– have implications for measuring and improving
the disbursement performance of IFAD and
other IFIs. Perhaps the strongest message is
that larger projects perform better, especially in
terms of disbursement readiness. This message
is supported by previous studies on disbursement
performance in the African Development Bank and
the Inter-American Development Bank (see Gohou
and Soumaré, 2009; Nkamleu, Tourino and Edwin,
2011; Álvarez, Bueso-Merriam and Stucchi, 2012).
In addition, relationships in which one cofinancier
shoulders a much higher burden than others
can lead to disbursement problems for all parties
involved if the most important cofinancier performs
poorly. Hence, careful consideration should be
given to how financiers share costs.
Other controllable factors include the role of
project managers, as also shown by Álvarez,
Bueso-Merriam and Stucchi (2012). The analysis
showed that the gender, experience, workload,
location and amount of turnover of IFAD’s CPMs
affected disbursement performance. Investments
capitalizing on this knowledge are thus likely to
bear fruit. In addition, the results for disbursement
readiness show that financing agreement
conditions constitute a powerful tool for shaping
disbursement performance; these conditions
should be carefully considered to ensure more
streamlined project preparation.
Although country-level factors are less under the
control of funding agencies, findings in this area
also have implications for future decisions and
policy. Factors such as state fragility, constrained
fiscal space and a devalued currency were
shown to hinder disbursement performance.
IFIs should adjust their disbursement performance
expectations accordingly, so that when these
hindrances occur they are not a surprise and
thus have a less debilitating effect on a project’s
implementation and impact.
IFAD has already taken on board several of the
lessons of this study. IFAD management has
approved a corporate action plan aimed at better
projecting, measuring, monitoring and managing
the Fund’s disbursements. All actions have a
specific timeline, as well as clear responsibilities
and measures of success. A corporate workshop
held in early 2017 further raised awareness
among all responsible staff about the importance
of disbursement performance to demonstrate
efficient use of Member States’ contributions and
to ensure that IFAD clients – and especially target
beneficiaries – receive adequate support.
Looking ahead, measures to enhance IFAD’s
disbursement performance will include revisiting
policies (e.g. cancellation policy and restructuring
policy) and reviewing current products, processes
and procedures. IFAD will need to give critical
attention to ex ante disbursement forecasts and
the disbursement dimension of projects, aiming
for a balance of project types within each country
portfolio. Finally, to help strengthen borrowers’
readiness to implement projects, IFAD will make
more targeted use of start-up advances and focus
more on procurement issues in project design.
The results of the analysis are facilitating the
management of disbursement performance.

58
References
Ahsan, K. and Gunawan, I. 2010. Analysis of
cost and schedule performance of international
development projects. International Journal of
Project Management, 28: 68-78.
Álvarez, C., Bueso-Merriam, J. and Stucchi,
R. 2012. So you think you know what drives
disbursements at the IDB? Think, think again...
Technical Note No. IDB-TN-479. Washington,
D.C.: Inter-American Development Bank.
Cameron, A. C. and Trivedi, P. K. 2005.
Microeconomics: Methods and applications.
Cambridge: Cambridge University Press.
Gohou, G. and Soumaré, I. 2009. The impact of
project cost on aid disbursement delay: The case
of the African Development Bank,
www.afdb.org/fileadmin/uploads/afdb/
Documents/Knowledge/2009%20AEC-%20
The%20Impact%20of%20Project%20Cost%20
on%20Aid%20Disbursement%20Delay%20
The%20Case%20of%20the%20African%20
Development%20Bank.pdf
Kersting, E. K. and Kilby, C. 2015. With a little
help from my friends: Global electioneering and
World Bank lending. Journal of Development
Economics, 121: 153-165.
Mishra, P. K. 2016. Managing international
development projects: Case studies of
implementation of large-scale projects in India.
International Journal of Rural Management,
12(1): 4-26.
Nkamleu, G. B., Tourino, I. and Edwin, J. 2011.
Always late: Measures and determinants of
disbursement delays at the African Development
Bank. Working Paper No. 141. Tunis: African
Development Bank.
Sunjka, B. P. and Jacob, U. 2013. Significant
causes and effects of project delays in the Niger
Delta region, Nigeria. Paper prepared for the
25th annual conference of the Southern African
Institute of Industrial Engineering, July 9-11,
Stellenbosch, South Africa.
Wooldridge, J. 2002. Econometric analysis of
cross section and panel data. Cambridge, USA:
MIT Press.

59
PAR
T I
Ch
apte
r 4
/
In the past couple of decades, as international
development discourse and practice have
focused more heavily on improving development
effectiveness, the role of evidence-based reporting
on results has also gained prominence. The
development community has recognized the
need to focus on results rather than inputs and
to ensure that a project’s processes contribute
to the achievement of its objectives (Flint, 2003).
Multiagency commitments such as the Paris
Declaration on Aid Effectiveness (OECD, 2016)
have underlined issues around the quality, impact
and accountability of development interventions.
At a practical level, several international
development agencies have established
development effectiveness frameworks that
seek to integrate project data into a learning
process (ACFID, 2015). Within these frameworks,
project completion reports (PCRs) are the main
instrument many development institutions use
to report on results. They tell the story of a
project, make sense of data generated during the
project cycle, and discuss the project’s success
at achieving its development objectives, the
challenges or failures it encountered, and the
sustainability of interventions. They are crucial
tools for internal and external accountability as
well as for learning from experience to inform the
design of future operations (Crespo et al., 2013).
As such, these documents should provide solid
evidence of a project’s effectiveness in bringing
about development.
This study sought to examine how well claims
about project results were supported by evidence
in a sample of PCRs from IFAD. Using an
IFAD-specific conceptual framework to capture
the diversity of activities and potential impacts of
IFAD investments, it classified claims about project
results according to their themes, the results level,
and the presence and types of evidence sources.
Study design
Under the Results Management Framework (RMF)
covering the period between 2013 and 2015,
IFAD committed to providing a broader and more
in-depth assessment of the Fund’s impact on
poverty reduction. This study was originally part of
a larger impact evaluation initiative that employed
a mixed-methods approach to assess IFAD’s
contribution to movements out of poverty across
the project portfolio. Among other things, it aimed
to verify the hypothesis that because PCRs – as
standardized documents that take stock of project
performance – play an important role within the
project cycle and in broader institutional planning,
they are based on robust evidence.
To accomplish this goal, categories of analysis
were divided into two distinct types: case coding,
and thematic coding. Case coding was used
to characterize the claims, and thematic coding
described the subject of the claims; the two were
combined for a comprehensive analysis. In order
Assessment of IFAD’s end-of-project documentation
Chapter 4
by
Alessandra Garbero

60
to ensure consistency and reliability during the
coding process, a detailed codebook that defined
the parameters that coders should consider for
each of the indicators within the categories of
analysis was developed for both case coding and
thematic coding.
The characteristics of claims were categorized into
four types: claim direction, claim support, claim
quantification, and evidence source. Thematic
coding described the subject or the content of a
claim, representing the most important category
of analysis by organizing the various results
associated with IFAD’s projects by themes.
The ten themes were: (1) agricultural production,
(2) capacity to innovate, (3) commerce and value
chain, (4) economic mobility, (5) environmental
sustainability, (6) food security and health,
(7) human capital, (8) policies and institutions,
(9) resilience capacity, and (10) women’s
empowerment. This categorization system
allowed for the analysis of results according to the
recurring themes found in the theories of change
of IFAD-funded projects, as well as aligned with
the Fund’s broader rural development mission.
When combined with the case coding, findings
across themes could be further contextualized and
described across all case coding categories.
IFAD PCRs were the principal source for analysis.
After defining and applying eligibility criteria, the
research team coded 72 project documents.
Results
The research team coded almost 4,000 unique
claims across the sample of 72 projects. They
found considerable variation in the rates at which
claims were made for different themes, as well as in
the degree of evidence used to support the claims.
The “commerce and value chain” theme
tallied more claims than any other category
– a result that reflects IFAD’s market-oriented
strategy. “Economic mobility” was a close
second; although this theme is aligned with
IFAD’s goal of reducing poverty, reporting in
this area included few mentions of longer-term
impacts such as moving people out of poverty.
The third-most frequent theme was “human
capital”, which captures outputs related to
training, demonstrations and model farming.
Yet the medium-term outcomes of such
capacity-building initiatives, which were grouped
under the theme “capacity to innovate”, received
significantly fewer claims, revealing a lack of
reporting on how well people applied the skills
they learned through the extensive training.
At the bottom of the list, representing just
1.5 per cent of claims, was “resilience capacity”,
which encompassed several impact-level
indicators related to the ability of individuals,
households and communities to cope with
shocks. “Women’s empowerment”, another
theme that pertained to longer-term results, was
mentioned in just 6 per cent of all claims.
Across all themes, 71 per cent of claims in the
sample were not explicitly supported by a source
of evidence. The “commerce and value chain”
theme had the fewest explicitly supported claims:
77 per cent were either partially supported
or not supported at all. Indeed, in both of the
predominant themes – “commerce and value
chain” and “economic mobility” – most claims
were either not supported or only partially
supported by evidence. Conversely, “food
security and health” had the largest share of
supported claims, 41 per cent.
The analysis also looked at the level of
results reported. The vast majority of claims
– 96 per cent – report on relatively immediate
outputs and outcomes rather than long-term
impacts. Still, although impact claims have such
a negligible presence across PCRs, 49 per cent
of such claims are supported by a source of
evidence, compared with just 36 per cent
of outcomes and 22 per cent of outputs.
Medium-term changes account for the largest
level of claims – more than 930 outcome-level
claims are backed by direct evidence, and
a similar number are backed by “partially
supported” results. Across the sample, outputs
were rarely supported by direct evidence; more
than 1,400 claims, or 66 per cent, at this result
level were coded as “partially supported”.
The research team also categorized the sources
of evidence. Many of the data came from external
sources rather than IFAD’s own efforts to collect

61
PAR
T I
Ch
apte
r 4
/
impact data. The share of claims supported
by IFAD’s Results and Impact Management
System (RIMS) rose from 2 per cent in 2010 to
32 per cent in 2014. However, this rate is still low,
especially considering that external, non-RIMS
surveys served as sources of evidence almost
as often as RIMS data until 2013. Reliance on
PCR missions for data collection decreased
10 percentage points, from 29 per cent in 2010
to 19 per cent in 2014. This shift could point to
improved attempts to collect data throughout
the life of the projects rather than relying on
end-of-programme support. Nevertheless,
PCRs overwhelmingly rely on project monitoring
and evaluation (M&E) data for reporting. This is
problematic given that many of IFAD’s project
M&E systems were not designed to support
reporting on longer-term results. Sixty-six per
cent of project M&E data were related to outputs,
24 per cent to outcomes, and only 9 per cent
to impacts.
Finally, claims made were overwhelmingly
– 84 per cent – positive. The lack of neutral
claims (at just 5 per cent of the total) shows
insufficient reporting on indicators that have
not been affected by IFAD initiatives. About
11 per cent of claims were negative. This
overall pattern indicates a reporting bias that
reduces the transparency of project results and
hinders the effective learning that could arise
out of PCRs.
Conclusion
This study highlights a significant need for IFAD
to incorporate evidence-based results into its
end-of-project reporting processes. Current
reporting suffers from a lack of clear evidence and
from an unbalanced focus on immediate results.
The sources of evidence used to support project
claims rely too heavily on project M&E systems
that are ill-equipped to provide data on outcomes
and impacts. Despite the availability of RIMS – the
precursor to the Operational Results Management
System (ORMS) – as a tool for impact reporting,
compliance with its procedures remains low, which
in turn affects the quality of reporting.
This inefficient use of evidence in PCRs
makes it difficult to gauge the successes and
achievements of projects. Although these
documents often compile the full extent of
project reporting, their findings can be opaque,
and the large amounts of unclear information
sometimes obscure significant results or learning.
Moreover, the positive reporting bias confounds
the transparency of project results. This bias is
structural to internal project reporting processes,
as PCR authors are more likely to exaggerate
positive results while overlooking neutral and
negative ones for fear of losing subsequent
funding. The result is that learning from project
success is not balanced with learning from
project failures. Such a bias could be minimized
through the use of objective indicators.
Because the quality of reporting largely depends
on the quality of data available – which in
turn depends on the capacity of the project
management team – agencies would benefit from
encouraging the incorporation of robust impact
evaluation strategies into project design.
References
ACFID (Australian Council for International
Development). 2015. Developing an effectiveness
framework: A toolkit for small and medium sized
NGOs. Canberra.
Crespo, A., Hallberg, K., Ruiz, N., Martin, L.,
Alonso, D., Zambrano, P., Dal-Toe, T., et al. 2013.
IDB‑9: The development effectiveness framework
and overview. Washington, D.C.: Inter-American
Development Bank.
Flint, M. 2003. Easier said than done: A review
of RBM in multilateral development institutions.
Herefordshire, UK: UK Department for
International Development (DFID).
OECD (Organisation for Economic Co-Operation
and Development). 2016. Paris Declaration
and Accra Agenda for Action. Paris, www.
oecd.org/development/effectiveness/
parisdeclarationandaccraagendaforaction.htm

62
©IF
AD
/Sus
an B
ecci
o

63
PART II
Assessing project-level impact

64
Ethiopian agriculture faces a number of challenges
that prevent smallholder farmers from attaining
higher levels of productivity. Although average
rainfall in Ethiopia is higher than in the rest of
sub-Saharan Africa, farmers’ production is
often affected by frequent drought, severe soil
degradation, unpredictable weather patterns,
and a lack of irrigation, transportation and market
infrastructure (Escobal, 2005; Kassahun, 2007;
Matouš, Todo and Mojo, 2013). Because these
smallholder farmers’ main source of income is their
agricultural production, these challenges have direct
implications for their welfare and poverty outcomes.
The Government of Ethiopia has addressed some
of these challenges by promoting investments
in small-scale irrigation systems, as put forward
in the country’s Poverty Reduction Strategy
Paper 2005/06. One such investment was the
Participatory Small-Scale Irrigation Development
Programme (PASIDP), a project funded by IFAD,
which took place between 2008 and 2015. PASIDP
was designed to develop small-scale irrigation
infrastructure systems in four regions: Amhara,
Oromia, Tigray and Southern Nations, Nationalities
and Peoples Region. PASIDP had three main
components: (1) institutional development;
(2) small-scale irrigation development; and
(3) agricultural development. Through these
components, PASIDP sought to develop
sustainable irrigation systems and empower project
communities by engaging community members in
designing, constructing, operating, managing and
repairing such systems. The project was expected
to improve the food security and incomes of
households in project communities.
The total cost of the project was US$57.8 million,
of which about 70 per cent was supported
by IFAD as a grant and a highly concessional
loan. The remaining portion of the project cost
was funded by the Government of Ethiopia as
well as by direct payments of water user fees
to the water user associations (WUAs). This
study examines the evidence on the impacts of
this project and considers lessons that can be
applied to similar future projects.
The project’s theory of change
PASIDP institutionalized a participatory
approach to small-scale irrigation development
in rural Ethiopia by helping members of project
communities form WUAs. These WUAs consisted
of farmers whose agricultural plots were located
within range of the project’s irrigation systems
and were suitable for crop cultivation. WUA
members pooled their financial, technical,
material and labour resources to plan, operate,
maintain and repair the irrigation systems. WUAs
elected their leaders and committee members,
collected water fees, maintained the irrigation
systems, and settled water-related conflicts and
disputes within the WUAs.
The project also built new irrigation schemes
or rehabilitated existing schemes, including
river diversion, spate irrigation, spring sourcing
Ethiopia’s Participatory Small-Scale Irrigation Development Programme (PASIDP)
Chapter 5
by
Alessandra Garbero
Tisorn Songsermsawas

65
PAR
T II
Ch
apte
r 5
/
and shallow wells. Finally, as part of the project
interventions, capacity-building and training
activities related to best practices in agricultural
production were delivered to farmers in the
project communities.
PASIDP interventions were expected to improve
the outcomes of households that received the
project through a number of possible channels.
Most importantly, an irrigation system can help
improve farm productivity by increasing crop
yields as farmers receive a greater overall volume
of water for cultivation, a more consistent water
supply, and timely access to water when they
most need it for crop production (Hussain and
Hanjra, 2003). In addition, irrigation allows farmers
to cultivate a larger area and cultivate crops over
multiple rotations in a given year (Huang et al.,
2006). Access to irrigation may also complement
farmers’ use of inputs including improved seeds,
fertilizer and pesticides (Evenson and Gollin,
2003). Previous studies have noted other possible
channels through which irrigation can improve
farmers’ productivity and income. Irrigation can:
lead to more diverse income or livelihood strategies
(Smith, 2004); buffer the effects of drought (Prasad,
Van Koppen and Strzepek, 2006); increase access
to output markets (Gidwani, 2002; Dorward et al.,
2004); raise demand for wage labour on irrigated
farms (Narayanamoorthy and Deshpande, 2003);
reduce fluctuations in output prices (Lipton,
Litchfield and Faurès, 2003); and increase resilience
to exogenous shocks and adverse weather events
(Barrett, Reardon and Webb, 2001). Figure 5.1
illustrates the theory of change of the PASIDP
project, presenting the project’s causal chain from
inputs to outputs, outcome and impacts.
Based on this theory of change, the research
team designed an ex post impact assessment
to investigate whether households with access
to irrigation systems developed under PASIDP
exhibited higher farm productivity and welfare
outcomes than those in a comparison group – that
is, a group of households facing similar agroclimatic
conditions and with similar socio-economic
Figure 5.1 The theory of change of PASIDP
Inputs/activities
• Formation of water user associations (WUAs)• Training of WUA leaders and members about water management and water
distribution/allocation• Provision of agricultural capacity-building and training services • Construction of irrigation infrastructure systems
Outputs
• Greater access to water available for crops (through construction of irrigation infrastructure system)
• More efficient water management (through formation and training of WUA leaders and members)
• More efficient water distribution/allocation (through formation and training of WUA leaders and members)
• Greater ability to adopt risk management and risk coping strategies (through construction of irrigation infrastructure system)
• Improved access to information about agricultural knowledge and technology (through training activities)
Outcomes
• Adoption of new and more suitable agricultural technology• Expansion of cultivation areas (extensive margin) and crop rotations (intensive
margins)• Increased crop production / higher yields of crop • More higher-valued crops cultivated• Increased agricultural diversification• Greater resilience against negative shocks
Impacts• More stable and increased household income• Higher ability to adopt risk coping and risk management strategies against
negative shocks

66
characteristics that did not access PASIDP
irrigation systems. Specific focus was devoted to
assessing the project’s impact on crop revenues
and on household consumption levels (in terms
of both food and non-food expenditures).
The impact assessment complements existing
studies that explore the extent to which changes
in household-level productivity and welfare
outcomes are attributable to the development
of small-scale irrigation infrastructure systems
(Hamdy, Abu-Zeid and Lacirignola, 1998; Del
Carpio, Loayza and Datar, 2011; Dillon, 2011).
Project outreach and outputs
Before proceeding to explore the project impact,
an analysis was conducted of the project’s
coverage, the types of people reached, and
the outputs generated as a result of the project
interventions. Between 2008 and 2015, PASIDP
interventions facilitated the formation of 175
WUAs and developed 116 small-scale irrigation
schemes that covered at least 12,020 hectares
of arable land. The project interventions were
estimated to have reached more than 311,000
people in 62,200 households in the four regions
covered by the project.
Project impact
Data and methods
The impact assessment drew on both quantitative
and qualitative data. The quantitative data
consisted of a household survey collected from
1,531 households in 20 kebeles (or subdistricts) in
the four Ethiopian regions. To identify households
similar to the ones receiving the project as potential
candidates for the comparison group, the research
team first conducted an enumeration survey to
collect information about agricultural production,
poverty status, agroclimatic conditions, and source
of irrigation in all 20 kebeles. The purpose of this
enumeration survey was to help ensure that the
characteristics of the households in the comparison
group (those not receiving the project) were similar
to those in the treatment group (those receiving
the project) so that the outcomes of such groups
could be compared to measure the project impact.
To establish valid comparison groups, researchers
used a number of characteristics that should have
been uninfluenced by the project. These included:
household size; sex, age and education level of
the household head; an asset-based wealth index
based on recalled measures prior to the project
start (with durable, livestock and productive assets);
landownership; elevation; average precipitation
during the past five years; and time employed by
farmers to reach the market.
Then, based on the information collected in the
enumeration survey, the household survey was
carried out with one treatment group (households
with access to PASIDP-built irrigation schemes)
and two comparison groups (those using water
from traditional irrigation sources, and those
relying solely on rainfall for agricultural production).
To further ensure that the households in the
two comparison groups were comparable to
the ones in the treatment group, extensive
discussions with the staff members from the
project management unit and the development
agents office were held to validate the selection
of the households to be part of the comparison
groups. Of the 1,531 households in the full sample,
766 (50 per cent) were households with access
to PASIDP-supported irrigation systems, 438 (29
per cent) were traditional irrigation users, and 327
(21 per cent) relied mainly on rainfall for agriculture.
Qualitative data were used to support and
triangulate the findings from the quantitative
household surveys. These qualitative surveys
consisted of key informant interviews with kebele
leaders and development agents and focus
group discussions with households in project and
comparison kebeles. In total, 24 key informant
interviews (six in each project, four in treatment
kebeles and two in comparison kebeles), and
24 focus group discussions (six in each region,
four in treatment kebeles and two in comparison
kebeles) were administered.
The impact of the PASIDP project was estimated
using a non-experimental approach. Researchers
looked at the treatment group and the two
comparison groups in pairs to compare the
observed outcomes of households in each
group. This approach allowed them to observe

67
PAR
T II
Ch
apte
r 5
/
the gradient of effects ranging from farmers with
access to PASIDP-supported irrigation, to those
with traditional irrigation only, to those relying only
on rainfall.
Key quantitative findings
The key impact estimates centred on indicators
of agricultural production and household
consumption, and the impacts in these areas
were sizeable. In terms of agricultural production,
the largest impact was on average crop yields
(figure 5.2). Compared with households that
relied mainly on rainfed agriculture (the reference
group in the figure), PASIDP households had
average crop yields that were twice as high, and
traditional irrigation users 20 per cent higher.
PASIDP had similar impacts on crop revenues.
Households using PASIDP-supported irrigation
doubled their revenue compared with rainfed
farmers, and those using traditional irrigation had
crop revenues 30 per cent higher than those
relying only on rainfall. Given that the project
had no significant effects on other production
outcomes, such as use of physical inputs
(improved seeds, fertilizers and pesticides), size
of crop cultivation area, or number of crops grown,
the results provide evidence that the increase in
revenues observed among PASIDP households
was driven largely by the increase in crop yields.
For outcomes related to household consumption,
and particularly food consumption expenditures,
results indicated similar impact magnitudes
(figure 5.3). Relative to households relying mainly
on rainfall, the per capita food expenditures of
PASIDP households were twice as high, and
those of farmers that relied on traditional irrigation
were 50 per cent higher. However, the project had
no significant impact on non-food expenditures.
This impact assessment also explored project
impacts on other outcome indicators. These
indicators included: poverty measures (whether
or not the household was above asset-based
and expenditure-based poverty lines); asset
accumulation (durable assets and productive
assets); and measures of female empowerment
(level of participation in agricultural-related
decisions and income-related decisions).
However, no significant effects of the project were
observed on such outcome indicators.
Rainfed agriculture
Traditional irrigation
PASIDP
0.0 0.5 1.0 1.5 2.0
Figure 5.3 Per capita food expenditure (factor)
Rainfed agriculture
Traditional irrigation
PASIDP
0.0 0.5 1.0 1.5 2.0
Figure 5.2 Average crop yield (factor)

68
Key qualitative findings
Key informant interviews with kebele leaders and
development agents highlighted the importance
of forming WUAs before constructing the irrigation
schemes. This approach engaged potential
water users in developing the irrigation schemes
in an organized manner according to their local
needs. Community members contributed labour,
construction materials and cash to construct the
irrigation schemes. In addition, capacity-building
and training activities on water management,
operation and maintenance of irrigation schemes,
WUA rules and regulations, and bookkeeping skills
were delivered to WUA leaders and committee
members to ensure efficient management of
WUAs. After the training, project staff members
transferred responsibility for managing and
maintaining the irrigation schemes to WUAs.
Interviews with kebele leaders and development
agents revealed a number of capacity gaps within
the WUAs. WUAs commonly faced difficulties
collecting membership and water-use fees,
mobilizing financial resources, and controlling
members’ water use. Several incidents of water
theft and conflicts over water use took place. Key
informant interviews also suggested that training
in agricultural marketing would have been useful
for those who received the project. However,
such training was not contemplated in the training
package provided by PASIDP.
Focus group discussions with those who received
the project confirmed that project benefits took the
form of increased agricultural productivity through
improved yields, and promotion of new agricultural
technologies and crop cultivation practices through
strengthened extension services and formation of
farmer research groups. However, the discussions
also revealed several development challenges,
including lack of access to input and output
markets, high input prices, and low crop prices.
Lessons learned
This ex post impact assessment of PASIDP offers
a number of lessons for future project design and
implementation, as well as for future policy and
country strategies. Notably, the scale-up phase of
this project, PASIDP – Phase II, has included these
lessons in its design and implementation stages.
The main lessons learned can be summarized
as follows:
• Returns on investment in irrigation
infrastructure systems can be transformative.
By raising agricultural revenues, mainly through
higher crop yields, the project increased
household income and consumption levels of
treated households. Relative to farmers who
relied only on rainfall for agricultural production,
the crop yields of those with access to
PASIDP-supported irrigation doubled.
• Better-off farmers, who were usually more
productive farmers, benefited the most
from the investments in irrigation in terms
of increased crop yields and crop revenues.
Interventions that benefit mostly more
productive farmers may raise questions
about equity, so this finding implies the
need for other complementary interventions
for farmers with less productive capacity.
For example, climate-smart solutions
compounded with irrigation could be a
potential intervention for worse-off farmers
who live in the watersheds and depend
on rainfed agriculture.The main channel
through which access to irrigation raises
crop revenues is through higher crop yields.
The project had no significant effects on
other intermediate channels such as input
expenditures (seed, fertilizer and pesticide),
cultivation area or number of crops cultivated
in a season. Follow-up projects should
devote further attention to these aspects.
• PASIDP fostered a strong participatory
approach that engaged community members
in forming WUAs and involved them in
planning, designing, constructing, managing
and maintaining the irrigation systems.
This approach helped create a sense of
ownership within the community and was
crucial to the project’s sustainability.
• Although improved access to irrigation can
help produce higher levels of agricultural
outputs, farmers may not be able to take full
advantage of the project interventions if they
cannot sell their crops at the market at the right
time. To help farmers manage post-harvest

69
PAR
T II
Ch
apte
r 5
/
losses, interventions that strengthen market
access and agricultural marketing should be
included along with irrigation development
interventions. A key lesson learned is that
projects need to take into account markets
and viable crop models to meet these
markets. The participatory processes during
project design and implementation must allow
farmers to understand their options and the
financial implications in terms of production
cost. At the same time, the project should
facilitate linkages with aggregators, service
providers, financial institutions and input
dealers, among others, to build transparent
and trusting relationships between all of these
value chain operators. These relationships
can form the basis on which marketing
associations (or cooperatives) can elaborate
concrete production plans (agricultural
development plans).
• Project implementation activities experienced
a number of delays. One approach to
address this issue is to recruit and train
project staff early on, and to involve relevant
stakeholders in the early stages of planning.
The roles and responsibilities of project staff
and other stakeholders should be well defined
within a strict implementation timeline.
References
Barrett, C. B., Reardon, T. and Webb, P. 2001.
Non-farm income diversification and household
livelihood strategies in rural Africa: Concepts,
dynamics, and policy implications. Food Policy,
26(4): 315-331.
Del Carpio, X. V., Loayza, N. and Datar, G. 2011. Is
irrigation rehabilitation good for poor farmers? An
impact evaluation of a non‐experimental irrigation
project in Peru. Journal of Agricultural Economics,
62(2): 449-473.
Dillon, A. 2011. The effect of irrigation on poverty
reduction, asset accumulation, and informal
insurance: Evidence from Northern Mali. World
Development, 39(12): 2165-2175.
Dorward, A., Kydd, J., Morrison, J. and Urey, I.
2004. A policy agenda for pro-poor agricultural
growth. World Development, 32(1): 73-89.
Escobal, J. 2005. The role of public infrastructure in
market development in rural Peru. PhD dissertation,
Wageningen University.
Evenson, R. E. and Gollin, D. 2003. Assessing the
impact of the Green Revolution, 1960 to 2000.
Science, 300(5620): 758-762.
Gidwani, V. 2002. The unbearable modernity of
development? Canal irrigation and development
planning in Western India. Progress in Planning,
58(1): 1-80.
Hamdy, A., Abu-Zeid, M. and Lacirignola, C. 1998.
Institutional capacity building for water sector
development. Water International, 23(3): 126-133.
Huang, Q., Rozelle, S., Lohmar, B., Huang, J. and
Wang, J. 2006. Irrigation, agricultural performance
and poverty reduction in China. Food Policy, 31(1):
30-52.
Hussain, I. and Hanjra, M. A. 2003. Does irrigation
water matter for rural poverty alleviation? Evidence
from South and South-East Asia. Water Policy,
5(5-6): 429-442.
Kassahun, D. 2007. Rainwater harvesting in
Ethiopia: Capturing the realities and exploring
opportunities. Working paper. Addis Ababa: Forum
for Social Studies.
Lipton, M., Litchfield, J. and Faurès, J.-M. 2003.
The effects of irrigation on poverty: A framework for
analysis. Water Policy, 5(5-6): 413-427.
Matouš, P., Todo, Y. and Mojo, D. 2013. Roles
of extension and ethno-religious networks in
acceptance of resource-conserving agriculture
among Ethiopian farmers. International Journal of
Agricultural Sustainability, 11(4): 301-316.
Narayanamoorthy, A. and Deshpande, R. 2003.
Irrigation development and agricultural wages:
An analysis across states. Economic and Political
Weekly, 38(35): 3716-3722.
Prasad, K. C., Van Koppen, B. and Strzepek,
K. 2006. Equity and productivity assessments
in the Olifants River basin, South Africa. Natural
Resources Forum, 30(1): 63-75.
Smith, L. E. D. 2004. Assessment of the
contribution of irrigation to poverty reduction and
sustainable livelihoods. International Journal of
Water Resources Development, 20(2): 243-257.
70
Agriculture is the largest contributor to Kenya’s
GDP, and it employs 61 per cent of the country’s
workforce, mainly represented by smallholder
farmers living in rural settings (Muriuki, 2011;
FAO, 2014). Within agriculture, the country’s
livestock dairy sector has special importance.
Kenya is one of the largest milk-producing
countries in Africa – it currently has more than
5.6 million dairy cattle, accounting for about
15 per cent of East Africa’s dairy livestock (FAO,
2017). Investing in smallholder dairy farming is
an effective way to improve farmers’ production
and commercialization, which in turn can help
alleviate poverty and increase food security
(Burke et al., 2007; Muriuki, 2011; Olwande et al.,
2015; Randolph et al., 2007; Smith et al., 2013).
The need to invest in and improve Kenya’s dairy
industry was especially strong after the collapse
of the monopolistic dairy cooperative structure
in the 1990s (Muriuki, 2011), when farmers
faced high transaction costs for production
and marketing (Staal, Delgado and Nicholson,
1997), and dairy groups and cooperatives were
unable to address these issues (Holloway et al.,
2000). Smallholder dairy farmers faced additional
barriers to improving their dairy production,
including poor and unreliable quality of feed, lack
of access to animal health and breeding services,
loss of milk production, and inadequate access
to milk markets (Atieno and Kanyinga, 2008).
The Smallholder Dairy Commercialization
Programme (SDCP), which started in 2005,
was designed to increase the income of
resource-poor rural smallholders who depend
substantially on production and trade of dairy and
dairy-related products for their livelihoods in nine
dairy commercialization counties in central and
central-western Kenya. To this end, the project
aimed to address constraints to smallholders’
milk production, productivity and participation
in milk markets by training dairy groups, offering
technical support for household dairy production,
and developing milk marketing chains. Special
emphasis was placed on ensuring women’s
participation in all project activities, given that
women play a key role in dairy production in
Kenya and have been traditionally disadvantaged
(e.g. in terms of education and access to
credit). The first phase of this programme was
implemented from 2005 to 2015 at a total cost
of US$19.75 million, jointly funded by IFAD,
the Government of Kenya and beneficiary
communities. In December 2015, IFAD decided
to extend this project, with completion expected
in September 2019.
A number of studies and impact assessments
of interventions in the dairy sector in Kenya have
shown that technical support to dairy groups
and farmers, as well as stronger market linkages,
can have important and positive impacts on the
livelihoods of smallholder dairy farmers. Given
the great relevance of dairy cattle as a source of
food consumption and income for smallholder
dairy farms in Kenya and East Africa as a whole
Kenya’s Smallholder Dairy Commercialization Programme
Chapter 6
by
Romina Cavatassi
Peter Brueckmann
Nancy McCarthy
Juan Bonilla

71
PAR
T II
Ch
apte
r 6
/
(Bingi and Tondel, 2015; Muriuki, 2011), the
SDCP has been selected as the subject of a
rigorous impact assessment, the results of which
are presented in this chapter. This study aims to
provide further evidence on the effectiveness of
investments in dairy agriculture, and to identify
challenges and barriers that could be addressed
to improve future project and policy designs and
development impact.
The project’s theory of change
Before the SDCP, dairy groups in the nine
selected milk-producing counties suffered from:
weak links with input suppliers and output
purchasers; a limited ability to disseminate
production advice to farmers; weak business and
commercialization skills; and financial services
constraints. To address these barriers, the SDCP
trained beneficiary dairy groups on organizational
and enterprise skills, and helped them establish
and maintain links with input providers, output
purchasers and extension systems. In addition,
the project sought to improve dairy groups’
access to financial services by promoting
competitive investment grants designed to
improve dairy business activities and techniques.
Through these activities, the SDCP aimed to:
establish sustainable dairy enterprises; enable
members to obtain financial services; reduce
transaction and input costs; raise output prices;
and increase beneficiaries’ production and
market knowledge (Atieno and Kanyinga, 2008).
To further boost productivity and reduce
production costs, the project used training
sessions, field days and demonstrations to
provide smallholder farm households with
technical support on artificial insemination, fodder
production and management, dairy enterprise
management practices, and animal diseases and
disease management. With the help of newly
established community-level artificial insemination
schemes, community-based animal health funds,
and information-dissemination activities, the
project was expected to result in: better-bred and
healthier dairy cows (Gelan and Muriithi, 2015;
VanLeeuwen et al., 2012); greater production
and better management of fodder and feed
(Nafula, 2013; Richards et al., 2016); and better
enterprise management practices. These results
would lead to more milk per cow, higher and
more stable output, and lower production costs.
Furthermore, the programme sought to improve
the linkages of small-scale milk producers,
traders and processors with local milk markets,
and to increase producer access to the
processing sector. To this end, the project
invested in improving market infrastructure,
such as milk-cooling facilities, improved road
infrastructure, conducted capacity-building
activities for milk marketing groups, developed
low-cost market information systems and trained
beneficiaries on hygienic milk handling, among
other things. These activities should lead to
better-quality milk (which is likely to lead to higher
prices), reduced transaction costs, an overall
increase in the size of the country’s dairy market,
and more reliable trade relations and sales
(Burke, Myers and Jayne, 2015).
Through these highly interrelated and mutually
supportive activities, the SDCP was expected
to achieve the overall objective of the project:
increasing incomes through dairy farming. This
in turn should have led to an increase in the food
security of participating dairy farmers (Smith et
al., 2013). Moreover, given the overall importance
of resource-poor farmers and the special
emphasis on women in the Kenyan dairy sector,
it was expected to have a positive impact on the
participation of these groups in milk markets and
as leaders in dairy groups (Walton et al., 2012).
Project outreach and outputs
The first phase of the SDCP was implemented
in 27 divisions within nine counties across
three regions of central and central-western
Kenya – namely, Rift Valley Region, Western
Region and Nyanza Region, home to about
350,000 dairy farmers. The beneficiaries of the
programme and the members of the targeted
dairy groups comprised mainly: resource-
poor dairy farmers; part-time and small-scale

72
intensive dairy farmers; crop-oriented farmers
with dairy cows; and small-scale milk bars,
shop operators and mobile milk traders. As
mentioned above, particular attention was paid
to women, given that many female-headed
households in the project’s districts had dairy
cows. Even in male-headed households, females
controlled more than 60 per cent of the income
from dairy activities. Women in these counties
face a number of constraints. They own smaller
farms, which affects their access to credit using
land as collateral. They are less educated and
receive less extension advice, which limits their
access to technical information for enhancing
production. They often do not play a vital role
in dairy groups. The project sought to address
all of these constraints. The first phase of the
SDCP intervention supported 13,132 small
dairy farmers, of whom 60 per cent were
women, through 556 dairy groups and apex
organizations, reaching 120,000 beneficiaries
overall. Upon completion of the extended SDCP
in September 2015, various outputs had been
achieved, including:
• 8 milk-cooling or -processing facilities had
been set up.
• 6,123 farmers had participated in
educational and exchange tours.
• 500 fodder-bulking sites had been
established by dairy groups.
• 27 community-level artificial insemination
schemes had been established.
• 81 dairy groups and 13 apex organizations
had benefited from dairy enterprise grants,
with an average amount of Ksh 638,000
(about US$6,250).
• 1,821 goats had been procured and
distributed to the 801 most vulnerable
resource-poor women.
Project impact
Data and methods
The estimation of the project’s impact was
based on a comprehensive quantitative survey
covering 2,562 dairy farmers who are members
of 184 dairy groups in the nine project counties.
To conduct a valid assessment of the project’s
impact on the livelihoods of smallholder dairy
farmers, it was also necessary to identify
and establish a valid comparison group
that shares the same characteristics as the
SDCP beneficiaries.
The impact assessment focused on the
first phase of the SDCP project, which was
completed in September 2015; data were
collected throughout November and December
2016. Given the ex post nature of the evaluation,
a quasi-experimental matching approach was
used to establish a meaningful comparison
group. As a first step, this assessment aimed to
replicate the initial targeting process conducted
by the SDCP in 2005, in order to identify
non-programme areas that had characteristics
similar to the project areas before the programme
started. Drawing on the original database used
to identify the 27 SDCP divisions, and taking
into account the opinions of local experts, the
research team identified eight study sites as valid
comparison areas to serve as controls.
Within these SDCP divisions and the eligible
control area divisions, 95 treatment and
89 control dairy groups were identified. From
these, 1,297 beneficiary and 1,265 comparison
dairy farm households were randomly selected
and interviewed on household characteristics
and dairy farming activities, including inputs,
production activities, costs and sales. In addition,
each existing dairy group was surveyed to
obtain information on its structure, activities
and performance. Based on the available and
collected information, and using dairy group
performance indicators, household characteristics,
dairy farming information, and pre-project
divisional and community characteristics, SDCP
beneficiaries were matched with comparison
smallholder farming households, and the outcome
indicators of interest were compared using a
doubly robust estimator (see Van der Laan and
Robins, 2003). The impact of the SDCP – the
average of the differences between the matched
treatment and comparison households – was
estimated for numerous indicators, including:

73
PAR
T II
Ch
apte
r 6
/
• husbandry practices;
• extension services;
• input and transaction costs;
• gross margins and milk prices.
To better understand the experiences, opinions
and perspectives of the SDCP beneficiaries,
12 focus group discussions with six to eight
farmers each from 12 dairy groups were
conducted. Moreover, key informants were
interviewed on the uptake of the programme,
coordination of government departments and
the functioning of the dairy sector in the regions
of interest. These qualitative results augment the
quantitative findings.
Given the SDCP’s main objective of increasing
the incomes of resource-poor rural smallholder
households engaged in dairy farming activities,
the impact evaluation addressed the following
main questions of interest: (1) Does the project
improve the well-being of dairy farmers through
improved animal management, increased
production and productivity, improved efficiency
and increased incomes for farmers? and (2) Does
increased income from dairy farming ultimately
improve food security?
Key impact estimates
In line with the main research questions, the
impact evaluation investigated the effect
of the SDCP project on various intended
intermediate and final outcome indicators of
dairy farming households.
Animal management practices
Regarding the impact of the intervention on
animal management activities, the project was
estimated to have had statistically significant
positive effects on beneficiaries’ feeding
practices. SDCP participants were 8 per cent
more likely to practise zero grazing with their
cattle – a practice that gave farmers better
control over how much and what cows ate,
and reduced losses in potential milk production
that resulted from searching for grazing land
across large areas. Farmers recognized the
positive effect, and the improvement in animal
management was the most reported benefit of
the SDCP. A female participant stated: “Initially
I would send the children to go and graze, [but]
I now practice zero grazing. I realized I used to
lose a lot on milk yields.”
Furthermore, the SDCP increased the likelihood
that farmers kept their cattle in a paddock with a
stall floor made of concrete. Such paddocks are
easier to clean and reduce the chances of milk
being contaminated.
The SDCP also led to an improvement in
breeding services. Programme participants were
7 per cent more likely to monitor their cattle
on a regular basis, and 12 per cent more likely
to have used artificial insemination services
in the preceding 12 months. No differences
between participants and comparison farmers
were observed in the availability of livestock
technology, showing that the SDCP was
successful in promoting the benefits of new
artificial insemination breeding practices, which
resulted in a higher uptake of these services.
Finally, the SDCP project had positive and
significant effects on the availability and
accessibility of specific animal health services.
Relative to non-participants, SDCP farming
households were 25 percentage points more
likely to have access to and use vaccination
services, 10 percentage points more likely to
have access to curative treatment services, and
7 percentage points more likely to make use of
them. However, the programme did not seem to
have changed access to other health services,
including deworming or tick control services.
Access to extension and information
One of the project’s key activities was to
disseminate information on farming practices
through extension services and training of dairy
group members. The impact evaluation shows
that beneficiary farmers were 12-18 percentage
points more likely to have cattle extension
services available in their village. The categories
of information for which the effects were
estimated to be greatest were: general livestock
best practices (15 percentage points); milk

74
processing and quality control (10 percentage
points); and fodder establishment and fresh
milk marketing (7 percentage points). Most
importantly, farmers tended to adopt these new
practices, although adoption rates remained, as
did the probability of receiving information, mainly
below 15 per cent.
Dairy group performance
The SDCP aimed to establish sustainable dairy
groups with formalized structures and better
performance indicators to link these groups
to the milk value chain. In terms of formalized
structures, the evidence was mixed. There were
no differences between SDCP groups and control
dairy groups with respect to legal registration, the
election of chairs and representation of women.
SDCP groups were more likely to have an elected
secretary and treasurer as well as to have more
monthly meetings to share information and engage
in decision-making.
Treatment dairy groups were far more likely to
obtain financing from microfinance institutions,
local credit and savings groups, and commercial
banks, and this financing can help farmers gain
access to input and output markets. However,
both SDCP and comparison groups still relied
heavily on members’ financial contributions,
with 93 per cent of all groups stating that they
depended on membership dues.
For the most part, SDCP and comparison groups
faced similar levels of conflict among members,
with the exception of conflict surrounding unpaid
dues. Only 21 per cent of beneficiary dairy groups
reported conflicts over unpaid dues compared
with 37 per cent of comparison groups.
The most striking difference in the performance
between the two groups concerned the number
of training sessions provided to the dairy group
members. SDCP group members were more likely
to be trained on fodder management, proposal
writing or dairy group management.
Few differences between SDCP and comparison
dairy groups existed in terms of services provided
by the respective dairy groups. Both groups
organized educational exchange tours, collected
and shared milk price data, and facilitated links
between members and input suppliers and milk
purchasers. The only exception was that SDCP
groups were more likely to contract with milk
purchasers on behalf of members, even though
the rate was relatively low: 11 per cent, as
opposed to 2 per cent for the comparison groups.
This result shows that significant room remains to
improve the performance of SDCP dairy groups,
particularly in terms of providing services that aim
to reduce smallholders’ transaction costs.
Number of livestock and milk production
Overall, the project had positive and statistically
significant effects on the composition and
number of cattle per household as well as on milk
production and the value of milk sold. Relative
to the comparison group, SDCP farmers owned
0.49 more head of cattle, 0.35 more cows that
had calved at least once, and 0.44 more animals
they were currently milking (figure 6.1). These
results were explained mostly by a higher number
of cross-bred cattle and not of the exotic, more
productive breeds.
The intervention’s positive impact on the number
of livestock was reflected in the effect on milk
production. Beneficiary farmers had 37 per cent
higher total milk production and 58 per cent
more total milk production at calving compared
with non-beneficiaries. SDCP farmers were
8 percentage points more likely to have sold milk
at any time during the day before the interview,
indicating positive impacts on milk marketing.
The evidence suggests that there was no statistical
significant difference between participants and
comparison farmers in terms of quantity sold.
Nevertheless, those SDCP farmers who sold to
the market obtained a 31 per cent higher selling
price than that received by non-beneficiaries. This
finding could mean that beneficiaries have better
linkages with the milk market or higher-quality dairy
products. The total value of milk sold – that is,
the quantity of milk sold times the price obtained
– obtained by SDCP farming households was
43 per cent higher than the value obtained by the
control group (figure 6.2).

75
PAR
T II
Ch
apte
r 6
/
These quantitative positive results on farmers’
incomes were supported by the beneficiaries’
comments during the qualitative fieldwork.
One SDCP farmer said: “My milk production
has increased, and that’s more income. With it,
I have taken my children to school.” Moreover,
many farmers perceived a significant increase
in their productivity. Another SDCP farmer
reported: “Initially I would only get 3 cups of milk,
but currently my cow production is 7 bottles.”
Based on these results, it can be assumed that
overall the SDCP was successful in increasing
smallholder dairy farmers’ milk production, milk
marketing and milk prices received.
Food security
Did this positive impact on dairy farmers’ income
also lead to increased food security, as envisaged
by the project?
According to multiple SDCP participants, the
increase in income as a result of the SDCP
intervention enabled them to keep a variety of
foods available in their households, confirming
the objective of the project. One farmer stated
that his family’s general health had improved,
while others said that they now consistently had
tea with milk in their house. Farmers’ perception
of increased food security may have resulted
partially from their increased understanding of
better practices for growing crops, including
the use of cow dung as fertilizer to obtain
higher yields. One beneficiary farmer said: “The
animal manure from both the goats and cattle is
channelled on the farm, which in turn accelerates
the growth of crops and more yields – this too
has ensured a consistent supply of food in
the household.”
These qualitative findings were supported by the
estimated quantitative data on food consumption
within households (using seven-day recall). Those
results provided some evidence that programme
beneficiaries exhibited higher levels of food
diversification, a good proxy for food security.
As highlighted in figure 6.3, SDCP households
were more likely to have a more diverse food
basket, with higher levels of animal and vegetable
proteins (such as red meat, milk products and
legumes) and lower levels of tubers and fruits.
All of these findings suggest that SDCP activities
contributed to a positive overall impact on Kenyan
dairy farmers, particularly for dairy production.
Lessons learned
These quantitative and qualitative results point
to a number of important lessons for informing
the design and implementation of similar dairy
policies and projects elsewhere in Kenya and in
other developing countries:
• Interventions that aim to support dairy groups,
enhance farmers’ productivity through
training and strengthen market linkages for
small-scale milk producers can translate
into higher incomes for smallholder farmers.
The results presented here show that this
is determined mainly by the higher per-litre
selling price that participants were able
to obtain.
Milking cows
Comparison dairy farmers
SDCP bene�ciaries
Cows, calved at least once
Cattle owned
0 1 2 3
Figure 6.1 Average number of animals

76
• Disseminating information on different
aspects of production through training,
field days and demonstrations to dairy
group members increases the availability
of extension services, and beneficiaries
tend to adopt these practices more than
do comparison farmers. However, adoption
rates for all promoted activities remain low,
suggesting that there is still significant room
to improve activities and training in future
project designs.
• Special emphasis should be placed on
disseminating market-related information
and promoting dairy group marketing.
Quantitative results show that the services
provided to dairy group members have
limited impacts on marketing. Only a
minority of dairy groups facilitate links
between members and input suppliers as
well as milk purchasers. Although SDCP
dairy groups contracted more with milk
purchasers than comparison groups did,
the number remained low. Despite these
low numbers, SDCP farmers obtained
higher prices in the market, indicating the
considerable potential to strengthen market
linkages for small-scale milk producers.
References
Atieno, R. and Kanyinga, K. 2008. The
revitalisation of Kenya Cooperative Creameries:
The politics of policy reforms in the dairy sector in
Kenya. Research Paper 9. Brighton, UK: Future
Agricultures Consortium.
Bingi, S. and Tondel, F. 2015. Recent
developments in the dairy sector in Eastern
Africa. Briefing Note 78. Maastricht, Netherlands:
European Centre for Development Policy
Management.
Burke, W., Myers, J. and Jayne, T. 2015. A
triple-hurdle model of production and market
participation in Kenya’s dairy market. American
Journal of Agricultural Economics, 97(4): 1227-
1246.
Burke, W. J., Jayne, T., Freeman, H. and
Kristjansen, P. 2007. Factors associated with
rural farm households’ movements into and out
of poverty: The rising importance of livestock.
International Development Working Paper 90.
East Lansing, USA: Department of Agricultural
Economics, Michigan State University.
FAO (Food and Agriculture Organization of the
United Nations). 2014. FAOSTAT Statistics
Database. Statistical Yearbook-Kenya, http://
faostat.fao.org/static/syb/syb_114.pdf
Comparison dairy farmers
Percentage-point increase
SDCP bene�ciaries
Total litres of milk sold
Selling price of milk/litre
Total value of milk sold
Total milk production at calving
Total milk production
0.0 0.5 1.0 1.5 2.0
Figure 6.2 Average milk production and total value

77
PAR
T II
Ch
apte
r 6
/
FAO. 2017. FAOSTAT Statistics Database. Cattle,
dairy stocks Kenya and Eastern Africa, www.fao.
org/faostat/en/#data/GE
Gelan, A. and Muriithi, B. W. 2015. Examining
returns to scale in smallholder dairy farms in
East Africa. Quarterly Journal of International
Agriculture, 54(3): 239-261.
Holloway, G., Nicholson, C., Delgado, C., Staal,
S. and Ehui, S. 2000. Agroindustrialization
through institutional innovation: Transaction
costs, cooperatives and milk‐market
development in the east‐African highlands.
Agricultural Economics, 23(3): 279-288.
Muriuki, H. G. 2011. Dairy development in Kenya.
Rome: FAO.
Nafula, S. S. 2013. The impact of enhanced
nutritional and feeding practices on growth and
health of dairy calves in Mukurweini district of
Kenya. Doctoral dissertation, University of Nairobi.
Olwande, J., Smale, M., Mathenge, M. K., Place,
F. and Mithöfer, D. 2015. Agricultural marketing
by smallholders in Kenya: A comparison of maize,
kale and dairy. Food Policy, 52: 22-32.
Randolph, T. F., Schelling, E., Grace, D.,
Nicholson, C. F., Leroy, J. L., Cole, D. C. and
Ruel, M. 2007. Role of livestock in human nutrition
and health for poverty reduction in developing
countries. Journal of Animal Science, 85(11):
2788-2800.
Richards, S., VanLeeuwen, J. A., Shepelo, G.,
Gitau, G. K., Wichtel, J., Kamunde, C. and
Uehlinger, F. 2016. Randomized controlled trial
on impacts of dairy meal feeding interventions
on early lactation milk production in smallholder
dairy farms of Central Kenya. Preventive Veterinary
Medicine, 125: 46-53.
Smith, J., Sones, K., Grace, D., MacMillan, S.,
Tarawali, S. and Herrero, M. 2013. Beyond milk,
meat, and eggs: Role of livestock in food and
nutrition security. Animal Frontiers, 3(1): 6-13.
Staal, S., Delgado, C. and Nicholson, C. 1997.
Smallholder dairying under transactions costs in
East Africa. World Development, 25(5): 779-794.
Van der Laan, M. and Robins, J. 2003. Unified
methods for censored longitudinal data and
causality. New York, USA: Springer-Verlag.
VanLeeuwen, J. A., Mellish, T., Walton, C.,
Kaniaru, A., Gitau, R., Mellish, K., et al. 2012.
Management, productivity and livelihood effects on
Kenyan smallholder dairy farms from interventions
addressing animal health and nutrition and milk
quality. Tropical Animal Health and Production,
44(2): 231-238.
Walton, C., VanLeeuwen, J. A., Yeudall, F. and
Taylor, J. 2012. Association between duration
of community-based group membership and
sustainable livelihoods for Kenyan women dairy
farmers. Journal of Agriculture, Food Systems,
and Community Development, 3(1): 43-60.
Comparison dairy farmers
SDCP bene ciaries
Beans, peas, lentils, nuts
Red meats, other organ meats
Milk products
Fruits
Patatoes, yams, cassava
0.0 0.2 0.80.60.4 1.0 1.2Percentage-point increase
Figure 6.3 Food consumption (seven-day recall)

78
Madagascar, Africa’s largest island state, remains
one of the least-developed countries in the
world after decades of slow economic growth,
unstable governance and political turmoil.
About 65 per cent of its population lives in rural
settings, mainly relying on subsistence-oriented
farming practices, exploiting small areas of
land (INSTAT, 2011; World Bank, 2017a), and
suffering from persistent high levels of poverty,
food insecurity and malnutrition (Dostie,
Haggblade and Randriamamonjy, 2002; Minten
and Barrett, 2008). Rice is the main staple crop
and the main source of income for farming
households in Madagascar, with 87.5 per cent
of all farming households growing rice and
48 per cent of agricultural income generated
through rice cultivation (INSTAT, 2011). As such,
rice is of critical importance to the welfare of
the Malagasy population and farmers, as well
to the development of the country’s agriculture
sector. Nonetheless, Malagasy rice farmers face
numerous barriers to improving their agricultural
production and well-being, including: tenure
insecurity, land degradation, lack of irrigation
infrastructure, high marketing transaction costs,
inadequate agricultural production techniques,
and low adoption rates of new rice cultivation
techniques and of improved rice varieties (Barrett
et al., 2004; Harper et al., 2007; Harvey et al.,
2014; Minten and Barrett 2008; Moser, Barrett
and Minten, 2009).
In the mid-2000s, the Government of
Madagascar began adopting laws and
implementing policies aimed at empowering the
poor and decentralizing administration and public
services. Beginning in 2005, this process focused
strongly on land reforms and decentralization of
land offices. The 2009 coup delayed activities
significantly; nevertheless, the new government
managed to continue the land reform and other
decentralization plans. At the same time, despite
relatively generous rainfall and water resources
within the country, many farm households
remained mired in poverty and vulnerable to the
vagaries of weather (Harvey et al., 2014; Tadross
et al., 2008). Climate change increases the need
to protect farmers from weather shocks that
reduce agricultural yields. This is particularly true
for farmers in the regions of Menabe and Melaky
in central western Madagascar, who currently
face very high levels of poverty and malnutrition.
Most of the empirical evidence suggests
that when irrigation infrastructure is well built
and governance of the irrigated areas is well
functioning, investments in irrigation infrastructure
can both increase agriculture’s climate resilience
and also significantly raise farmers’ yields,
leading to higher and more stable productivity
and increased net revenue (Hussain and Hanjra,
2004; Knox, Daccache and Hess, 2013; Nakano
et al., 2013). In the case of Madagascar, Jacoby
Madagascar’s AD2M-I Project
Chapter 7
by
Romina Cavatassi
Peter Brueckmann
Nancy McCarthy
Mitchell Morey

79
PAR
T II
Ch
apte
r 7
/
and Minten (2007) documented higher yields
and net revenues per hectare (of more than
30 per cent in each case) on irrigated lands
compared with non-irrigated lands. At the same
time, experience has shown that many projects
aiming to increase the area under irrigation have
not led to the hoped-for gains. The literature cites
a number of reasons, including: the quality of
initial feasibility studies; the quality and location
of irrigation infrastructure; and the efficacy of
governance structures put in place to regulate
water uses and users, and ensure maintenance
of irrigation infrastructure.
Madagascar is one of the six most-irrigated
countries in Africa (You et al., 2011), but
only 2.18 per cent of its agricultural land is
under irrigation (World Bank, 2017b). Thus,
increasing and rehabilitating irrigation facilities in
Madagascar was considered of key importance
by policymaker and development organizations.
As such, between 2006 and 2015, IFAD
implemented the Appui au Développement
du Menabe et du Melaky (AD2M-I) project in
the two regions. The project consisted of two
components designed to strengthen farmers’
tenure security and result in higher, more stable
and sustainable agricultural incomes. It sought
to meet these goals by increasing access
to irrigation, introducing new seed varieties,
promoting additional cash crops, increasing
access to agricultural equipment, and increasing
access to markets through road construction
and rehabilitation, waterway infrastructure and
microfinance kiosks. The project had a total
cost of US$27.2 million, cofinanced by IFAD, the
Millennium Challenge Account, the European
Union and the Government of Madagascar. A
second phase of the project is currently ongoing
and expected to be completed by the end of
2022 (AD2M-II).
To analyse the effects of the AD2M-I project
and provide insights on the impact of irrigation
infrastructure on the agricultural production
and well-being of smallholder farmers, IFAD
conducted a rigorous ex post impact assessment
through the International Initiative for Impact
Evaluation, the American Institutes for Research,
and Lead Analytics. This impact assessment
can provide evidence on the effectiveness
of irrigation to promote more stable crop
production and farmer livelihoods, and it can
be used to better design and implement future
irrigation interventions and policies, not only in
Madagascar but also in other countries that share
the features and challenges of Madagascar’s rural
farmers. The descriptive analysis of infrastructure
construction, management and maintenance also
sheds light on the relative importance of these
components in generating gains at the farm level.
The project’s theory of change
Given the complexity of the project and its
various components, the impact assessment
focused on household-level outcomes and
impacts from access to certificated irrigation
land. However, this chapter describes the theory
of change for the entire project, including both
the certification and irrigation activities that were
the focus of the impact assessment, as well as all
other project inputs on which data were collected
and thus controlled for in the analysis in order
to provide a more comprehensive picture of the
assessment conducted.
Strengthening local governance and tenure
security
Customary tenure institutions alone were
insufficient to guarantee tenure security to many
farmers, including women and other vulnerable
groups, or to resolve conflicts adequately.
The resulting tenure insecurity dampened
farmers’ incentives to invest in sustainable land
management practices. The purpose of the
AD2M-I intervention was to complement and
take part in the Governmental National Land
Programme process by establishing and training
local land administration offices. These would
be part of a well-functioning decentralized land
administration system that establishes local land
management plans and issues land certificates

80
efficiently and effectively. This would give farmers
more tenure security and therefore greater
incentives to engage in sustainable soil and land
management practices.
Support for sustainable development of the
productive base
Despite relatively generous rainfall and water
resources in the regions of Menabe and Melaky,
farmers’ rice yields had been low and stagnating
in the years before project inception. Farming
households in the project regions either had
access to irrigation systems that were in poor
condition or they had no access at all, suggesting
that one key intervention should focus on
irrigation. As such, the AD2M-I project focused
on building new, or rehabilitating existing,
irrigation perimeters in rice-growing communities.
This work was supported by capacity-building
activities aimed at better coordination and
management of irrigation facilities through new
or informally existing water user associations
(WUAs). WUAs – with formalized leadership
structures, rules and chains of command – are
an important element in operating, maintaining
and repairing irrigation schemes, and they are
a key determinant in whether farmers will gain
benefits from irrigated land (Burney and Naylor,
2012; Hamdy, Abu-Zeid and Lacirignola, 2009;
Meinzen-Dick, 2007). Improved access to
irrigation and increased capacity of associated
WUAs should lead to higher-efficiency water use
and, most importantly, to stable irrigation of farm
plots. The consistent availability of irrigation water
should allow rice and other crop production
throughout the year by enabling a second or
even a third crop season, and this in turn should
lead to higher, more diversified and more stable
productivity and yields for farm households
(Knox, Daccache and Hess, 2013; Minten and
Barrett, 2008; Nakano et al., 2013).
To achieve an even more ambitious objective, the
AD2M-I project conducted training on integrated
15. The system of rice intensification is an agroecological methodology intended to increase the productivity of irrigated rice by changing the management of plants, soil, water and nutrients. Originating in Madagascar in the 1980s, it is based on the cropping principles of significantly reducing the plant population, improving soil conditions and irrigation methods for root and plant development, and improving plant establishment methods (Uphoff, 2002; Glover, 2011).
crop and resource management systems,
including the system of rice intensification15
and the improved rice system. The project
undertook farmers field schools, demonstrations
and workshops to encourage farmers to adopt
cultivation techniques, more resistant seed
varieties, livestock management techniques,
environmental protection practices, and crop
diversification. These were complemented with
the provision of agricultural inputs, including
seeds and farming tools, to project beneficiaries.
The expectation was that adoption would lead
to more diversified agricultural production and
income sources, enhanced land productivity
and lower costs of cultivation (Barrett et al.,
2004; Tsujimoto et al., 2009) through more
productive inputs and techniques, and through
reduced erosion and increased adaptation to
climatic events.
As an important complementary subcomponent,
rural roads and waterway transport infrastructure
were constructed or rehabilitated. This improved
transportation and infrastructure was expected
to reduce marketing transaction costs and raise
marketable surpluses.
All activities of this multifaceted and complex
AD2M-I project strongly complemented one
another. Overall, it was expected that the outputs
of the AD2M-I activities would lead to positive
impacts on the community environment, land use
and management and, most importantly, the level
and stability of beneficiaries’ incomes. This in
turn should lead to present and future household
welfare gains and reduced poverty.
Project outreach and outputs
Given the intervention’s complex approach
in 19 communes throughout five districts
across the Menabe and Melaky Regions, the
AD2M-I project targeted numerous groups of
beneficiaries. Among these groups were: landless

81
PAR
T II
Ch
apte
r 7
/
agricultural wage earners; farm households with
non-irrigated landholdings smaller than two
hectares; poor, often indigenous, households
focusing on fishing activities; farmers with small
irrigated landholdings and small numbers of
cattle; and pastoral farmers engaged mainly
in cattle breeding. Project activities reached
40,000 households – about 40 per cent of the
rural households in both project regions – and
16,000 of these households constituted direct
beneficiaries.
Over the project’s nine years, many activities
were undertaken and outputs obtained. With
respect to land administration and legal land
rights, project activities included land-use
diagnostics, the development of local land-use
plans and the establishment of 15 land offices, as
well as numerous training sessions for land office
staff, local leaders and community members. In
addition, 8,840 land certificates, covering 7,257
hectares, were issued.
With respect to irrigation, 18 sites received new
or rehabilitated infrastructure covering 5,588
hectares of irrigated land (3,393 hectares covered
by new infrastructure and 2,195 hectares
covered by rehabilitated infrastructure) reaching
5,600 agricultural producers (4,000 in Menabe
and 1,600 in Melaky). In addition, 32 WUAs and
2 WUA unions were created or strengthened,
accounting for a total of 3,724 members.
Project impact
Data and methods
In every impact evaluation, great importance is
attached to carefully selecting an appropriate
control group in order to be able to assess and
attribute project impacts. For this evaluation, the
strategy for constructing a reliable comparison
group was to replicate the targeting process
used to select AD2M-I beneficiaries during the
16. Criteria-based targeting is based on expert opinions to determine to what extent non-targeted areas could have been chosen for the project. These expert opinions relied on historical variables likely to be associated with the uptake of the intervention in 2007 such as climate, population density and other agroecological conditions.
implementation of the project itself, which was
mostly based on agroecological observable
characteristics. During the inception process of
AD2M-I, the project conducted detailed irrigation
feasibility studies to identify irrigated areas in
need of rehabilitation, as well as sites for new
irrigation infrastructure. The feasibility studies
included detailed information on hydrological
and topographical features, rainfall, the size of
the irrigable area and cost estimates for irrigation
infrastructure as well as basic information on
the socio-economic characteristics of potential
beneficiaries. Of 62 sites considered, 36 were
deemed feasible, of which 18 obtained new
irrigation infrastructure or had existing irrigation
infrastructure rehabilitated.
For the impact evaluation, the overall sampling
strategy replicated the targeting process
used in 2007 by using the same or similar
available historic data sources. As a first step,
observation-based targeting was used, with
AD2M-I project sites being plotted on a map to
identify the common characteristics of the sites.
This information was then used to determine a
group of potential non-project areas that had
characteristics similar to AD2M-I areas before
the project started. Once the first group of
potential areas had been selected, criteria-based
targeting was used to refine the selection of the
comparison sites.16
From the final list of AD2M-I intervention
and comparison areas, 1,986 households in
62 villages were interviewed in October and
November 2016 (682 treatment households
and 1,304 comparison households), and these
interviews produced detailed information on
household and plot management characteristics.
In addition, one survey in each treatment and
comparison commune was conducted to obtain
additional community-level variables.
Given the complexity of the project, the
impact assessment focuses on households
that benefited from access to irrigated plots

82
in Menabe.17 To complement characteristics
obtained from household interviews, additional
control variables covering biophysical
characteristics and a set of spatial dummies were
used to account for differences that would have
explained differences in the outcome indicators
of interest between treatment and comparison
households. These indicators included a
normalized difference vegetation index – a useful
measure of soil fertility computed by using
available satellite images of the treatment and
comparison areas. Based on this comprehensive
dataset, treatment households were matched
with comparison households, and the impact of
the AD2M-I irrigation activities was quantified.18
The quantitative data collection and subsequent
estimation of results were complemented with
focus group discussions and key informant
interviews with programme beneficiaries and
relevant officials. These qualitative data were
collected to: facilitate a better understanding
of projects’ mechanisms and impacts; support
and validate or amend key impact findings; and
identify challenges and potential moderating
factors. Moreover, they allowed the research
team to draw conclusions not only about the
impact of the irrigation component itself but also
about the role of the WUAs and of other project
components.
Based on the theory of change and the focus
of the impact evaluation of AD2M-I investments
in new and rehabilitated irrigation infrastructure,
the following key research questions were
addressed:
• Did access to irrigated land increase
farmers’ rice yields, the total value of their
irrigated crop production, their total net crop
revenues and the value of crop output they
marketed?
• Did access to irrigated land enable farmers
to increase the number of cropping
seasons within the year and to have a more
diversified crop portfolio?
17. Melaky was excluded for a number of reasons, including logistics, resources and the fact that some areas were not covered by irrigation, the main component being assessed.
18. Specifically, the inverse-probability-weighted regression adjustment estimator was used. For more information, see Wooldridge (2010).
19. All results reported are statistically significant at a 95 per cent confidence interval level or higher (in most cases at 99 per cent) unless otherwise specified.
Answers to both questions can be used to draw
conclusions about the extent to which farmers
obtained higher and more stable incomes. In
addition, the following questions were addressed:
• Did project activities lead to an increase in
sustainable land management practices at
both the community and household levels?
• Given the importance of well-functioning
WUAs in maintaining irrigation infrastructure
and regulating water use, did measures of
WUA performance affect the extent to which
farmers were able to realize benefits from
their irrigated plots?
Key results
Impacts on annual crop production
Overall, the impact assessment estimated that
the intervention made meaningful improvements
to the agricultural production and productivity of
beneficiaries.19 As shown in figure 7.1, the annual
per hectare value of beneficiaries’ crop production
was 24 per cent higher than that of control
households, and the annual per capita value of
their crop production was 23 per cent higher than
that of control households.
Results show similarly positive effects for project
participants’ rice yields. Annual rice yields were
estimated to be 27 per cent higher for beneficiary
households compared with control farmers,
whereas the quantity of rice harvested per capita
was 22 per cent higher for beneficiary farmers
than for control farmers.
These positive impacts on crop production
were supported by the qualitative analysis that
complemented the impact assessment. A farmer
from Belo, one of the beneficiary villages, reported:
“The harvests improved, mostly thanks to the
increased water supply.” A farmer from Mahabo
said: “Yes, we are able to produce in excess and
have to sell [the rice] outside our region.”

83
PAR
T II
Ch
apte
r 7
/
These quantified and perceived benefits also
had positive effects on the community, according
to many key informants and group discussion
participants. These effects included positive
impacts on the labour market, households’
purchasing power and village economies as a
whole. “The community is also more peaceful,
we eat well, our harvests are successful and
even the unemployed get work,” stated a farmer
from Mahabo. A key informant from Mahabo
reported: “In the past, a farmer, one family did
not own a zebu working the fields, but now after
they harvested the rice, they bought two zebus,
and this resulting in that, this transformed the
economy in general in the … village.”
One important reason behind the rise in
beneficiaries’ annual crop production is that
irrigation allows farmers to increase the number
of cropping seasons per year. Beneficiary
households are 19 per cent more likely to engage
in a second cropping season compared with
control farmers. Moreover, researchers found
no statistically significant impacts for crop and
rice production when looking only at the primary
season. This combination of results implies that
most of the gains come from farmers’ ability to
crop for a second season, which counteracts
the reduced yield and higher risk of agricultural
production linked to the vagaries of weather
patterns. Indeed, among the factors reported
during the qualitative fieldwork and documented
in the literature mentioned above that can
potentially reduce or impede improvements in
crop production per season, it is worth reporting
recurring weather shocks (mainly cyclones and
floods), in addition to local market constraints
and safety concerns.
Impacts on farmers’ access to extension
services and crop inputs
In contrast to control households, of which
30 per cent reported having received extension
services from any source, 38 per cent of
beneficiaries reported having participated in
training sessions and workshops, and they are
also 8 per cent more likely to attend training than
were control households.
Beneficiaries are also 8 per cent more likely to use
pesticides than control farmers – although the
average number of beneficiary farmers applying
herbicides or pesticides remains low, with an
overall average of 9 per cent and 23 per cent,
respectively. It is estimated that the project had no
impact on the use of inorganic fertilizers.
Further evidence that farmers’ addition of a
second cropping season, thanks to irrigation,
was behind the increase in agricultural production
also comes from the results on adoption of
new farming practices, which were expected
to produce higher yields per se but which
the farmers largely failed to adopt or soon
abandoned after the completion of the AD2M-I
project. During the qualitative analysis, a farmer
from Belo said: “Crop production has decreased
since AD2M-I left the town. Some farmers went
back to traditional agricultural practices.”
Similarly, quantitative data show limited evidence
of farmers in beneficiary areas expanding into
new crops. However, the qualitative analysis does
not validate this finding. During interviews and
focus group discussions with beneficiaries, many
respondents reported that AD2M-I encouraged
farmers to cultivate new crops (besides only rice),
such as onions, beans, peanuts and tomatoes,
and that farmers in Mahabo and Belo continue
to harvest these crops today. According to a
community leader from Ankilizato Nord (Mahabo):
“Onions and beans are the main alternative crops
that AD2M has introduced here. Now they have
a warehouse where the onions are stored here.”
A community leader from Antrobiky corroborated
this statement: “We continued growing peanuts
and onions. We have truly continued.”
Several respondents also commented that
multicropping improved the quality of their soil
and ultimately the quality of their rice. However,
experiences cultivating new crops in Belo were

84
slightly less positive, and both farmers and WUA
members seemed more reluctant to focus on
cultivating crops other than rice.
Impacts on household welfare gains
Given that annual rice yields and total annual
value of crop production increased significantly,
clear higher welfare impacts were expected.
Indeed, farmers and project implementers from
both districts reported higher incomes thanks
to higher rice yields. The quantitative impact
evaluation confirms these findings to a certain
extent. In contrast to control households, of
which 57 per cent reported worrying about
securing enough food in the preceding seven
days, 46 per cent of project beneficiaries
reported such worries. Nonetheless, no
significant differences were found in annual food
security, indicating high levels of intra-annual food
insecurity across the entire sample. Beneficiary
households also had 1.1 more household
durable assets than control households, and they
spent more on education. Perceived broader
community benefits include lessened disputes
over water supply, enhanced communication
between neighbourhoods, and a unifying effect
on the local community.
Quality of irrigation and performance of
water user associations
According to quantitative and qualitative results,
the project had positive effects on the quality and
efficiency of irrigation compared with the control.
AD2M-I beneficiaries with plots located in a
gravity-based irrigation system were 15 per cent
more likely to receive water on time, and
26 per cent more likely to receive good-quality,
non-brackish water. However, only 40 per cent
of the beneficiaries rated the quality of the water
as good, and 27 per cent of project participants
did not receive water on time. Moreover, there is
no difference between beneficiaries and controls
with regard to whether they received their full
allocation of water. About 37 per cent of both
groups claimed that they did not receive all of the
promised water allocation. These results show
that significant room for improvement remains.
It is crucial to meet the irrigation needs of farmers
who follow different harvesting schedules and
have varying water needs, and to maintain the
irrigation infrastructure. The performance of
WUAs is particularly important to maintaining this
infrastructure and using it effectively. According
to the qualitative results, one main challenge was
a lack of communication by AD2M-I between
Comparison farmers
AD2M-I bene�ciaries
Value crop production per hectare
Value crop production per capita
Quantity of rice
per capita
Rice yields
1.4
1.2
1.0
0.8
0.6
0.4
0.2
0.0
Per
cent
age-
poin
t inc
reas
e
Figure 7.1 Crop production and management indicators

85
PAR
T II
Ch
apte
r 7
/
the WUAs’ leadership and farmers. In particular,
some AD2M-I farming households reported
having been left uninformed about water supply
schedules, resulting in unforeseen water cuts and
crop losses. In addition, some farmers were not
informed about the objectives and importance of
WUAs, and thus were not encouraged to spend
their time actively participating in WUA activities.
The importance of WUA leadership that has the
trust of the community was often stressed in the
qualitative analysis. WUAs led by trustworthy
people elected by the community resulted in
more active community participation, fewer
concerns about corruption and fewer disputes
about members’ fees. After project completion,
some respondents stated that groups fell apart
or became ineffective, preventing farmers
from benefiting from irrigation schemes in a
sustainable manner. This was a less serious
problem among groups for which community
leaders stepped up and took more responsibility;
these groups continued to function and maintain
the irrigation schemes successfully.
Lessons learned
The AD2M-I programme experience offers a
number of important lessons:
• Improved access to irrigation infrastructure
and a more efficient water supply increase
the rice yields and annual value of crop
production of smallholder farmers in
Madagascar, mainly by allowing them
to cultivate for a second season. Future
project designs could promote agricultural
strategies – including adoption of
techniques, crops or varieties – specifically
geared to cultivating land for a second
cropping season.
• To address farmers’ reluctance to adopt
new farming techniques, future project
designs must use activities and information
dissemination that will raise awareness
of interventions’ long-term benefits
for sustainability.
• Well-constructed and well-functioning
WUAs are key to successfully implementing
projects and to achieving positive impacts.
Trusted and well-respected WUA leaders
who communicate transparently with
community members on the benefits
of maintaining and improving irrigation
schemes can do much to improve
community cohesion and engagement, and
generate higher benefits from irrigated plots.
• Given the importance of land tenure
insecurity in Madagascar, further evidence
on the effectiveness of tenure interventions,
especially in combination with irrigation
investments, will help determine the need for
additional investments in land administration
systems (Jacoby and Minten, 2007).
• The long-term success and
cost-effectiveness of irrigation investments
depend largely on sustainable irrigation
structures that will last and can be
maintained by local community members
and WUAs after project completion.
As such, capacity-building activities to
improve WUAs’ management of irrigation
structures are of great importance.
• Quantitative results suggest a good success
of the project following its logic that a
well-managed irrigation system translates
into higher yields and harvests, mainly
thanks to a second agricultural season.
However, a deeper analysis of the social
capital and networking system of the
WUA, as well as strengthening of training
and capacity to maintain the adoption of
improved techniques, would be advisable in
order to better understand social aspects,
particularly given the fact that some farmers
seem to suggest scope for improvement.

86
References
Barrett, C. B., Moser, C. M., McHugh, O. V.
and Barison, J. 2004. Better technology, better
plots, or better farmers? Identifying changes
in productivity and risk among Malagasy rice
farmers. American Journal of Agricultural
Economics, 86(4): 869-888.
Burney, J. A. and Naylor, R. L. 2012. Smallholder
irrigation as a poverty alleviation tool in
sub-Saharan Africa. World Development, 40(1):
110-123.
Dostie, B., Haggblade, S. and Randriamamonjy,
J. 2002. Seasonal poverty in Madagascar:
Magnitude and solutions. Food Policy, 27(5):
493-518.
Glover, D. 2011. The System of Rice
Intensification: Time for an empirical turn. NJAS
– Wageningen Journal of Life Sciences, 57:
217-224.
Hamdy, A., Abu-Zeid, M. and Lacirignola, C.
2009. Institutional capacity building for water
sector development. Water International, 23(3):
126-133.
Harper, G. J., Steininger, M. K., Tucker, C. J.,
Juhn, D. and Hawkins, F. 2007. Fifty years
of deforestation and forest fragmentation in
Madagascar. Environmental Conservation, 34(4):
325-333.
Harvey, C. A., Rakotobe, Z. L., Rao, N. S., Dave,
R., Razafimahatratra, H., Rabarijohn, R. H., et
al. 2014. Extreme vulnerability of smallholder
farmers to agricultural risks and climate change
in Madagascar. Philosophical Transactions of the
Royal Society B, 369(1639): 20130089.
Hussain, I. and Hanjra, M. A. 2004. Irrigation
and poverty alleviation: Review of the empirical
evidence. Irrigation and Drainage, 53(1): 1-15.
INSTAT (Institut National de la Statistique de
Madagascar). 2010, 2011. Enquêtes périodique
auprès des ménages 2010, 2011. Antananarivo,
catalog.ihsn.org/index.php/catalog/5127/
download/62289
Jacoby, H. G. and Minten, B. 2007. Is land titling
in Sub-Saharan Africa cost-effective? Evidence
from Madagascar. The World Bank Economic
Review, 21(3): 461-485.
Knox, J., Daccache, A. and Hess, T. 2013. What
is the impact of infrastructure investments in
roads, electricity and irrigation on agricultural
productivity? Systematic review. CEE Review,
11-007. Bedford, UK: Collaboration for
Environmental Evidence.
Meinzen-Dick, R. 2007. Beyond panaceas in
water institutions. Proceedings of the National
Academy of Sciences, 104(39): 15200-15205.
Minten, B. and Barrett, C. B. 2008. Agricultural
technology, productivity, and poverty in
Madagascar. World Development, 36(5):
797-822.
Moser, C., Barrett, C. and Minten, B. 2009.
Spatial integration at multiple scales: Rice
markets in Madagascar. Agricultural Economics,
40(3): 281-294.
Nakano, Y., Bamba, I., Diagne, A., Otsuka,
K. and Kajisa, K. 2013. The possibility of a
rice Green Revolution in large-scale irrigation
schemes in Sub-Saharan Africa. In K. Otsuka and
D. Larson, eds., An African Green Revolution.
Dordrecht, Netherlands: Springer.
Tadross, M., Randriamarolaza, L., Rabefitia,
Z. and Zheng, K. Y. 2008. Climate change
in Madagascar: Recent past and future.
Washington, D.C.: World Bank.
Tsujimoto, Y., Horie, T., Randriamihary, H.,
Shiraiwa, T. and Homma, K. 2009. Soil
management: The key factors for higher
productivity in the fields utilizing the system of
rice intensification (SRI) in the central highland of
Madagascar. Agricultural Systems, 100(1): 61-71.

87
PAR
T II
Ch
apte
r 7
/
Uphoff, N. 2002. Opportunities for raising yields
by changing management practices: the system
of rice intensification in Madagascar. In N. Uphoff,
ed. Agroecological innovations: increasing food
production with participatory development,
145-161. London: Earthscan.
Wooldridge, J. M. 2010. Econometric analysis
of cross section and panel data. Second edition.
Cambridge, USA: MIT Press.
World Bank. 2017a. World development
indicators. Rural population (% of total
population), http://data.worldbank.org/indicator/
SP.RUR.TOTL.ZS?locations=MG
World Bank. 2017b. World development
indicators. Agricultural irrigated land (% of total
agricultural land), http://data.worldbank.org/
indicator/AG.LND.IRIG.AG.ZS?locations=MG
You, L., Ringler, C., Wood-Sichra, U., Robertson,
R., Wood, S., Zhu, T., Nelson, G., Guo, Z. and
Sun, Y. 2011. What is the irrigation potential
for Africa? A combined biophysical and
socioeconomic approach. Food Policy, 36(6):
770-782.

88
Although agriculture generates about 11 per cent
of the GDP of the Philippines, it provides
livelihoods for 30 per cent of the population
(OECD, 2017). This share is higher in rural
areas, where 70 per cent of the population is
poor and depends on agriculture – primarily rice
production. Rice is one of the most important
commodities for the Philippines. In Filipino
diets, rice is the principal source of energy and
protein, accounting for 46 per cent of calorie
availability and 34 per cent of protein (WFP,
2017). Therefore, improving rice production
and productivity remain major policy priorities.
The country has one of the largest yield gaps in
South-East Asia (FAO, 2010), and a large focus
of agricultural policy is on how best to improve
smallholder family farm rice productivity in order
to keep prices down in the face of production
efficiency issues (Bordey et al., 2016), rising
demand from a fast-growing population (PSA,
2016), and climate change effects (Rosegrant
et al., 2016). However, trade restrictions in the
sector20 undercut rice accessibility by leading to
artificially high consumer prices and negatively
affecting food security (OECD, 2017). At the
same time, the government allocates large
amounts of money to irrigation support, but the
effectiveness of the methods and management
of irrigation projects has been questioned
(Inocencio et al., 2016). There is debate about
20. The Government of the Philippines recently decided to extend quantitative restrictions on rice imports for another three years (President of the Philippines, 2017).
the extent to which irrigation management should
be decentralized to communal irrigation systems
and irrigators associations (IAs), and how best
the IAs should be organized (Bandyopadhyay,
Shyamsundar and Xie, 2007; Kakuta, 2014;
Nguyen et al., 2015). The impact assessment
of the Irrigated Rice Production Enhancement
Project (IRPEP) contributes timely evidence to
the ongoing discourse on the policy agenda and
programme design.
IRPEP was implemented in three regions of
the Philippines between 2010 and 2015 with
funding from IFAD, the European Union and
the Government of the Philippines. IRPEP was
a subproject of the Rapid Food Production
Enhancement Project, along with the two-year
Rapid Seed Supply Financing Project that
directly preceded it. While the latter provided
emergency seeds to smallholder rice farmers in
response to the 2008 food price spike, IRPEP
targeted longer-term rice productivity and
income increases by expanding and improving
irrigation infrastructure, building capacity of IAs,
and providing farmer field schools (FFSs), rice
marketing support, and seed buffer stocks. The
project was implemented by six agencies of the
Government of the Philippines, with technical
support from IFAD.
This assessment adds to a small number of
in-depth impact assessments conducted on
The Philippines’s Irrigated Rice Production Enhancement Project
Chapter 8
by
Aslihan Arslan
Daniel Higgins
Paul Winters

89
PAR
T II
Ch
apte
r 8
/
similar projects in the region. An assessment
of an irrigation project in Bohol Province found
positive effects on yields and income but noted
that downstream households may have benefited
less. It also suggested that downsizing IAs led
to increased benefits through reduced water
conflict (JICA, 2012). Similarly, a study of the
Communal Groundwater Irrigation Sector Project
in Nepal found an increase in yields, especially for
smaller water user groups (ADB, 2012). Finally,
highlighting the difficulty of conducting such
assessments, a study of the Mao Lao Irrigation
Project in Thailand produced inconclusive
findings, attributed to difficulties in identifying a
comparison group of non-beneficiary households
that had not received similar support from
elsewhere (Palmer-Jones et al., 2012).
The project’s theory of change and research questions
IRPEP was implemented by first identifying
suitable communal irrigation systems (CISs) in
Regions VI, VIII and X of the country, and by
offering support to the smallholder rice farmers
that use them and the IAs that manage them.
CISs have smaller land coverage than national
or private irrigation systems and have a more
decentralized management system run by the IAs
(Decena, 2016). IRPEP used the following criteria
to select beneficiary CISs:
• baseline annual paddy productivity less than
3.78 tons per hectare;
• average landholding size less than 0.76
hectares;
• low or inadequate supply of water through
CIS;
• high incidence of poverty;
• sufficient irrigation potential of CIS;
• feasibility of support from implementing
agency;
• willingness and capacity of local government
units to provide timely counterpart funding.
Figure 8.1 presents the theory of change for
IRPEP, which maps the pathways linking its
activities to its expected impacts. The project
aimed to address constraints to farmers’
agricultural productivity and income generation,
primarily by improving their supply of irrigation
water, as well as teaching new skills and
practices, and providing input and marketing
support. By expanding and rehabilitating irrigation
canals to improve water supply, strengthening
IAs to improve management and maintenance,
and teaching improved practices through FFSs,
the project is expected to help farmers increase
their productivity and the quality of their produce,
contributing to food security and nutrition. The
increased yields, plus improved post-harvest
processing facilities and other marketing support,
are expected to contribute to increased incomes.
Because IRPEP also promoted women’s
involvement in IAs as both members and officers,
improved gender empowerment is also expected.
This impact assessment focuses only on the
impact of the irrigation, IA capacity-building
and market support activities of IRPEP. This
is because in the three project regions similar
FFS and buffer stock support was offered to all
non-IRPEP smallholder households. Thus, no
suitable comparison group could be found to
assess the impact of these components. This
assessment effectively compares households that
have received only FFS and buffer stock support
with those that have also received irrigation, IA
capacity-building and marketing support. It also
focuses mainly on the production of rice – the
project’s target crop and the only crop grown by
most of the households. Project implementation
and operations differed significantly across
regions. Activities started two years later in
Region VI, and a severe typhoon damaged
canals and storage facilities, particularly in
Region VIII. The impact assessment takes these
differences into account. With this in mind, and
based on the expected impact chains of IRPEP
and the findings of previous studies, the following
research questions were used to guide this
impact assessment:
• Did IRPEP have the intended impacts on
irrigation supply, rice productivity, market
participation and other outcomes? Are there
constraints that limit farmers from achieving
these objectives that should be addressed?

90
Figure 8.1 Theory of change for IRPEP activities
INPUTS AND ACTIVITIES OUTPUTS OUTCOMES IMPACTS
Rehabilitation of communal irrigation systems (CISs)
Investment in canal infrastructure leading to improved water delivery and expansion of area
Strengthening of irrigators associations (IAs)
• Strengthening of IA rules
• Training of IA leadership
• Inclusion of women
• CIS area expanded, and timely water delivery to farmers improved
• IAs established and functioning with more members, including women
• Farmers trained in water management and new rice production technologies and techniques
• Improved availability of seeds during natural disasters
• Farmers provided with information and skills on post-harvest management
• Solar dryers, storage warehouses, and other post-harvest facilities established
Household level
• Increased input use
• Two-season planting and harvesting
• Increased rice productivity
• Increased rice market participation
• Increased rice profitability
Household level
• Increased income
• Increased food security and nutrition
• Increased resilience of production
• Empowerment of women
IA level
• Increased membership and participation
• Sustained management structure
• Collection and adequate management of water user fees
• Increased involvement of women in IAs
IA level
• Ability to mobilize IA-owned implements
• Ability to mobilize additional resources
• Ability to expand activities
Farmer capacity building
• Training on water and crop management
• Provision of seed buffer stocks
• Improvement of post-harvest management, including access to facilities and marketing support

91
PAR
T II
Ch
apte
r 8
/
• Did the impact of IRPEP vary across
regions, parcel locations, and small and
large IAs?
• Did IRPEP strengthen IA participation
and the capacity of IAs to support their
members and to sustain improvements in
smallholders’ livelihoods?
Project outreach and outputs
The project reached a total of 14,082 smallholder
rice farmer beneficiaries – of whom 4,225 were
women – in 112 IAs. Irrigation facilities of 109
CISs were rehabilitated and restored, covering
9,347 hectares of irrigated rice land, exceeding
the original target of 4,664 hectares (mainly
thanks to the expansion of the project to include
Region VI). As part of the support provided
to the 112 IAs, 5,048 IA officers (30 per cent
women) and members were trained on irrigation
operation and maintenance, and given access
to post-harvest facilities and marketing. The FFS
component (not evaluated here for the reasons
mentioned above) covered 5,295 farmers, mainly
focusing on the Palay Check technology (Pinoy
Rice Knowledge Bank, 2017).
Project impact
Data and methods
The analysis of IRPEP’s impact is based
on quantitative data collected from 2,104
households and 112 IAs, both evenly spread
across regions. The quantitative data were
supplemented by qualitative information
gathered through focus group discussions and
key informant interviews with national, regional
and provincial project staff and IA officers. The
key to a robust ex post impact assessment is
to compare treatment (beneficiary) units with
control (non-beneficiary) units that represent
how treatment units would have fared in the
absence of the project. The sampling frames
of both quantitative and qualitative data were
designed to ensure that the treatment and
control households and IAs met this requirement.
The sample was further refined during the
analysis stage to ensure that the impacts were
estimated using a valid comparison group.
For the household and IA samples, the process
of identifying the control samples sought to
mirror IRPEP’s process for selecting beneficiary
households and IAs. As the project first identified
suitable CISs, and provided support to the
households that use them and the IAs that
manage them, the first stage of sample selection
was conducted at the CIS level. First, using a
small set of variables on CIS characteristics
before the project had started, researchers
estimated propensity scores for each CIS. These
propensity scores were used to identify treatment
and control CISs that would have had similar
chances of being selected for the project (Austin,
2011). Second, regional project staff selected
well-matched treatment and control CISs for
the final sample based on their contextual
knowledge. The IA sample was thus comprised
of those managing the 58 treatment and
55 control CISs selected through this process,
and the household sample was comprised of
1,082 treatment and 1,022 control households
randomly selected from within the selected CISs.
Table 8.1 presents the distribution of the CISs
and households covered by the data collection.
The quantitative data were collected between
March and June 2017. Household questionnaires
gathered detailed information about: households’
sociodemographic characteristics; all agricultural
production activities over all seasons during
the previous 12 months at the plot level;
agricultural marketing; other income-generating
activities; access to basic services; and
food security indicators. IA questionnaires
gathered information on: the IA structure and
improvements since 2010; efficiency in irrigator
fee collection; details of irrigation water supply;
post-harvest processing facilities; access to
marketing and finance; and membership by
gender. The qualitative information gathered
through the focus group discussions and key
informant interviews helped the research team
better understand the challenges faced during
implementation.

92
The quantitative impacts were estimated using
an inverse probability weighted regression
adjustment model, which reduces important
differences between treatment and control units,
using both propensity scores and a regression
adjustment based on a specification of a model
for the outcomes of interest (Austin and Stuart,
2015). This method was chosen as the main
model because of its robustness in case of
misspecification of treatment or the outcome
models, and it had been used effectively in a
previous impact assessment of a similar irrigation
project in Madagascar (see Chapter 7).
Key impact estimates
Irrigation water supply
Various indicators were used to assess the
impact of the project on irrigation water supply,
and all showed highly positive effects. Overall,
IRPEP households were 50 per cent more likely
to have a sufficient level of irrigation across both
of the main cropping seasons, and their irrigation
expenditure per hectare was on average 204
per cent higher. These positive effects were
observed across regions (figures 8.2 and 8.3),
except for irrigation expenditure in Region X,
which was actually found to decrease despite
the apparent improvements in supply. The results
also show that improvements in supply were
more marked for households based in smaller
IAs and for parcels located downstream from the
irrigation source.
Production and market participation
In contrast to the unanimously positive findings
for irrigation supply, findings for rice production
were mixed. First, cropping intensity – a measure
of land use across seasons – was found to
increase only in Regions VIII and X, whereas
expenditure on production inputs increased only
in Region VI. As shown in figure 8.4, rice yields
were found to increase significantly in Region VI,
by 13 per cent, and in Region X, by 8 per cent,
while a significant decrease of 8 per cent was
observed for Region VIII. The qualitative research
suggests that the lack of impact in Region VIII
was probably caused by the extensive typhoon
damage experienced in the region, as well as
by a lack of capital for inputs. The value-cost
ratio of rice production – an efficiency indicator
that measures the value of harvest divided by
the value of inputs – was found to increase
only in Region X, suggesting that the increase
in yields in Region VI may have been driven
by an increased volume of inputs rather than
increased efficiency.
Figure 8.5 presents the differential results of
IRPEP on market participation, measured in
rice sales revenue. In Region X, the increase in
yields was translated into a higher proportion
of rice harvest being sold and a higher
proportion of processed rice sales, leading to
an average increase in revenue from sales of
rice of 128 per cent. However, the same is not
observed in Region VI, where farmers channelled
the yield increase into non-sale uses – mainly
paying back the costs related to their increased
Table 8.1 Distribution of communal irrigation systems (CISs) and household samples
Region Treatment Control
CISs Households CISs Households
Region VI 21 361 19 360
Region VIII 20 359 20 361
Region X 17 362 16 301
Total 58 1,082 55 1,022

93
PAR
T II
Ch
apte
r 8
/
Figure 8.2
Figure 8.3
Differential impacts on likelihood of sufficient irrigation in wet and dry seasons
Differential impacts on irrigation expenditure per hectare
inputs – and thus did not experience an increase
in rice revenue. The ineffectiveness of the
marketing support provided by IRPEP was widely
noted in the qualitative research, which identified
the encouragement of collective marketing and
the provision of market information services as
ill-suited to the operating context and, thus,
having a low level of uptake.
Figures 8.4 and 8.5 also show that the results
for yields and market participation continue the
trend of more favourable results for smaller IAs
and downstream households. A non-significant
impact on large IA households is contrasted with
a significant increase in yields of 5 per cent and a
non-significant increase in rice revenue of 57 per
cent for households located in smaller IAs.
Although both upstream and downstream parcels
experienced a significant increase in yields, the
increase for downstream parcels was found to
be, on average, about 8 percentage points larger.
However, possibly reflecting their lower need for
increased household consumption, upstream
and midstream households experienced a much
higher effect on rice sales revenue than did
downstream households.
Overall income and other impacts
IRPEP was found to have a significant positive
impact on household per capita income of
11 per cent. However, as with yields and rice
income, this finding masks significant regional
differences (figure 8.6). Although Region VI
Region VI
IRPEP impact (change in % probability)
79% (s)
44% (s)
29% (s)
36% (s)
88% (s)
19% (s)
45% (s)
Region VIII
Region X
Large IA
Small IA
Up/Midstream parcels
Downstream parcels
0 50 100
Note: s = statistically signi�cant above 90 per cent con�dence level.
Region VI
IRPEP impact (% change)
316% (s)
297% (s)
-33% (s)
12% (s)
249% (s)
139% (s)
146% (s)
Region VIII
Region X
Large IA
Small IA
Up/Midstream parcels
Downstream parcels
-50 50 150 250 350
Note: s = statistically signi�cant above 90 per cent con�dence level.

94
did not experience a significant increase in rice
revenue, IRPEP was found to have increased
household income there by about 18 per cent,
which seems to have been driven by increases in
household enterprise and livestock activities. This
finding suggests that improvements in irrigation
supply may allow households to dedicate less
time to rice farming, leaving them more time to
spend on other income-generating activities.
In contrast, Region X experienced a large increase
in rice revenues but only a small significant
increase in household income. This suggests
that, unlike households in Region VI, households
in Region X chose to devote more time to rice
farming in response to the IRPEP support, at
the expense of other income sources. Finally, in
Region VIII, household income was found to have
slightly decreased – although this decrease was
not statistically significant – reflecting the poor
all-round project performance in this region.
Once again, households based in smaller IAs
showed more favourable results than households
in larger IAs (figure 8.6). Household income in
small IAs was found to increase significantly by
about 25 per cent, whereas a negative although
not significant effect was observed for larger IA
households. Assessment of household income
effects was not done by parcel location because
households could have multiple parcels across
different locations.
Figure 8.4
Figure 8.5
Differential impacts on rice yields (harvest per hectare)
Differential impacts on rice sales revenue per hectare
Region VI
IRPEP impact (% change)Note: s = statistically signi�cant above 90 per cent con�dence level.
13.3% (s)
-7.9% (s)
8.1% (s)
5.2%
4.6% (s)
2.5% (s)
10.3% (s)
Region VIII
Region X
Large IA
Small IA
Up/Midstream parcels
Downstream parcels
-5-10 0 5 10 15
Region VI
IRPEP impact (% change)Note: s = statistically signi�cant above 90 per cent con�dence level.
-5.9%
-37.2%
127.5% (s)
-58.4%
56.5%
92.0% (s)
18.6%
Region VIII
Region X
Large IA
Small IA
Up/Midstream parcels
Downstream parcels
-50-100 0 50 100 150

95
PAR
T II
Ch
apte
r 8
/
The project’s theory of change also anticipated
positive effects on household nutrition.
A measure of household dietary diversity ranging
from 0 to 12 was found to significantly increase
on average by 0.4, but breaking this figure down
by region shows that the result was driven largely
by improvements in Region VI. Also, in contrast
to most of the other results, dietary diversity was
found to improve in households based in larger
IAs but not in smaller IAs.
IA-level impacts
Figures 8.7, 8.8 and 8.9 show that IRPEP was
found to produce positive effects across the
board at the IA level. Although these effects were
mostly not significant, this is likely to be due to
the small sample size in many cases. The number
of members in IAs was found to have increased
by an average of 32 overall, by an average of
9 for female members, and by an average 3 for
members under 30, with the latter starting from
a low base. There was a significant increase of
1.5 in the number of female IA officers, reflecting
favourably on the IA capacit-building activities
that focused on increasing women’s involvement
in CIS management.
The increased irrigation expenditure found in the
household analysis is reflected at the IA level
with a 49 per cent increase in water user fee
collection, and an overall increase in IA income
per member of 90 per cent. This increase in
income – highly relevant to the sustainability
of the project’s effects – is converted into a
102 per cent increase in IA spending per member
on operation and maintenance, and an 85 per cent
increase in overall spending per member.
Lessons learned
IRPEP proved very effective in improving the
irrigation water supply of households across the
project regions, and this effect translated into
higher rice yields in two of the regions. However,
mixed results for production, market participation
and household income highlight the following:
• Further supplementary support is required
when households are coping with extreme
weather conditions.
• Production efficiency does not automatically
increase with improved irrigation supply;
other supplementary supports should be
provided to ensure that yields increase in
proportion with increased expenditure on
water and other inputs.
• Capital constraints may have limited the
beneficiaries’ use of production inputs.
This suggests that the yield impact may
be greater if future projects can address
these constraints.
• Market support must be rethought. More
research is needed on whether, and how,
to encourage collective marketing, and how
best to provide market information services.
Figure 8.6 Differential impacts on household income per capita
Region VI
IRPEP impact (% change)
Note: s = statistically signi�cant above 90 per cent con�dence level.
18.2% (s)
-9.1%
25.2% (s)
0.4% (s)
-13.1%
Region VIII
Region X
Large IA
Small IA
-10-20 0 10 20 30

96
• Future projects must consider household
income in its entirety and should be wary of
encouraging concentration of livelihoods on
a narrow range of activities to the potential
detriment of livelihood resilience.
Project performance was notably better for
downstream parcels and households located
in smaller IAs. This highlights the pro-poor
potential of this type of project, and supports
the view that smaller IAs are easier to organize
and mobilize, as found in previous studies.
Strengthening the capacity of IAs combined with
a conducive institutional environment can have
distinct benefits for sustainable improvements
in smallholder livelihoods, including significant
increases in IA participation, income,
operation and maintenance expenditure, and
women’s empowerment.
Figure 8.8
Figure 8.9
Irrigators associations – income impacts
Irrigators associations – expenditure impacts
Total income per member
IRPEP impact (% change)
90.1%
49.3%Water fee income
per member
0 60 8020 40 100
Total IA expenditure per member
IRPEP impact (% change)
84.6%
102.4%Expenditure on operation
and maintenance per member
0 60 80 10020 40 120
Figure 8.7 Irrigators associations – membership impacts
Number members
IRPEP impact (change in members)
31.9
9.1
1.5
3.3
Number female members
Number female of�cers
Number members under 30
0 20 3010 40

97
PAR
T II
Ch
apte
r 8
/
References
ADB (Asian Development Bank). 2012. Shallow
tubewell irrigation in Nepal: Impacts of the
Community Groundwater Irrigation Sector Project,
www.adb.org/sites/default/files/evaluation-
document/35900/files/ies-nep-final.pdf
Austin, P. C. 2011. An introduction to propensity
score methods for reducing the effects of
confounding in observational studies. Multivariate
Behavioural Research, 46(3): 399-424.
Austin, P. C. and Stuart, E. A. 2015. Moving
towards best practice when using inverse
probability of treatment weighting (IPTW) using
the propensity score to estimate causal treatment
effects in observational studies. Statistics in
Medicine, 34(28): 3661-3679.
Bandyopadhyay, S., Shyamsundar, P. and Xie,
M. 2007. Yield impact of irrigation management
transfer: Story of the Philippines. Policy Research
Working Paper No. 4298. Washington, D.C.:
World Bank.
Bordey, F. H., Moya, P. F., Beltran, J. C. and
Dawe, D. C., eds. 2016. Competitiveness of
Philippine rice in Asia. Science City of Muñoz,
Philippines: Philippine Rice Research Institute.
Decena, F. L. C. 2016. Analysis of the effects of
various irrigation service fees for national irrigation
systems in the Philippines. FFTC Agricultural
Policy Article. Taipei, Taiwan Province of China:
Food and Fertilizer Technology Center for the
Asian and Pacific Region (FFTC-AP), http://ap.fftc.
agnet.org/ap_db.php?id=585
FAO (Food and Agriculture Organization of the
United Nations). 2010. Global agro-ecological
zones: Yield and production gaps, www.fao.org/
nr/gaez/about-data-portal/yield-and-production-
gaps/en/
Inocencio, A. B., Ureta, C., Baulita, A. and Baulita,
A. 2016. Technical and institutional evaluation
of selected national and communal irrigation
systems and characterization of irrigation sector
governance structure. Discussion Paper Series
No. 2016-12. Quezon City, Philippines: Philippine
Institute for Development Studies.
JICA (Japan International Cooperation Agency).
2012. Impact evaluation of the Bohol Irrigation
Project (Phase 2) in the Republic of the
Philippines. Tokyo, http://open_jicareport.jica.
go.jp/pdf/1000008651.pdf
Kakuta, I. 2014. Impact of participatory irrigation
management on the Bohol Irrigation Project in
the Philippines. Journal of the Institute for Asian
Studies, 41: 123-162.
Nguyen, M. R., Rola, A. C., Arcala-Hall, R.,
Lizada, J. C., Abansi, C. L. and David, M. E.
2015. Comparative analysis of the national and
communal irrigation systems’ water governance:
The Philippines case. Journal of Public Affairs and
Development, 2(2): 1-35.
OECD (Organisation for Economic Co-operation
and Development). 2017. Agricultural policies in
the Philippines. Paris: OECD Publishing. www.
oecd-ilibrary.org/docserver/download/5117011e.
pdf?expires=1513772073&id=id&accname=ocid1
95767&checksum=B17BBA91326D0491351C32
4F8CBA9855
Palmer-Jones, R., Dilokkunanant, N., Phonyiam,
B., Punyaratabandhu, S., Sutthiwongse, T. and
Hanpongpandh, S. 2012. Impact evaluation of
Mae Lao Irrigation Improvement project, Thailand.
3ie Grantee Final Report. Washington, D.C:
International Initiative for Impact Evaluation (3ie).
Pinoy Rice Knowledge Bank. 2017. Palay Check
system for the Philippine irrigated lowland rice,
www.pinoyrice.com/palaycheck/
President of the Philippines. 2017. Executive
Order No. 23: Extending the effectivity of the
most‑favoured‑nation rates of duty on certain
agricultural products under Republic Act No.
10863, www.officialgazette.gov.ph/2017/04/28/
executive-order-no-23-s-2017/
PSA (Philippine Statistics Authority). 2016.
Highlights of the Philippines population 2015
Census of Population. Quezon City, Philippines,
https://psa.gov.ph/content/highlights-philippine-
population-2015-census-population
Rosegrant, M. W., Perez, N., Pradesha, A. and
Thomas, T. S. 2016. The economywide impacts
of climate change on Philippine agriculture.
Climate Change Policy Note 1. Washington, D.C.:
International Food Policy Research Institute.
WFP (World Food Programme). 2017. Food
security and nutrition in the Philippines. Strategic
Review, https://docs.wfp.org/api/documents/
WFP-0000015508/download/

98
©IF
AD
/Sar
ah M
orga
n

99
PART III
Analysing the evidence on thematic activities

100
The agenda for the Sustainable Development
Goals (SDGs) cites secure access to land as
a key means of meeting SDG 2: “end hunger,
achieve food security and improved nutrition and
promote sustainable agriculture.” With proof of
ownership and reduced risk of appropriation,
rural households with secure tenure are
expected to: invest more in production and land
conservation (Meinzen-Dick, 2009); have greater
access to collateral-based credit (De Soto, 2000);
rent and sell their land with more ease (Deininger
and Binswanger, 1999); and experience less
land-related conflict (Nuesiri, 2014). In addition,
land tenure security is expected to contribute to
women’s empowerment when women’s names
are included on land titles (USAID, 2016).
These perceived benefits have led to large
investments in land tenure interventions,
particularly through national land reform, which
has been widespread across Asia and Africa
since the early 1990s (Holden, Otsuka and
Deininger, 2013). Specific activities implemented
have consisted mainly of:
• demarcating and issuing formal titles to
already-held land parcels;
• allocating and redistributing formally
registered land to those with low
landholdings;
• strengthening institutions tasked with
administering land ownership;
• raising awareness of land rights and how to
obtain them.
Despite the investments by governments
and donor agencies, questions remain over
the validity of the expected benefits of land
tenure security. Many observers call for more
clarity on how best to implement land tenure
security interventions in complex contexts
(Everest-Phillips, 2008; Gignoux, Macours and
Wren-Lewis, 2013). To help fill this knowledge
gap, IFAD commissioned a systematic review
of high-quality evidence on the effects of
strengthening rural peoples’ land tenure security
in an effort to gain insights for a key area of its
portfolio. This review aims to test the expected
effects and to provide insights to guide policy
and practice, taking advantage of the significant
number of studies published since a similar
review was conducted in 2012 (Lawry et al.,
2017).
The systematic review presented in this
chapter is the only known example of such
a rigorous review being conducted based on
one organization’s portfolio, and it is expected
to be the first in a series of reviews of various
IFAD-funded activity types. In considering all
forms of land tenure security activity, the review’s
insights are also applicable to non-IFAD projects.
Moreover, the review has additional external value
as a potential best-practice example of how to
systematically use evidence in decision-making
within a development organization.
Land administration interventions: a systematic review
Chapter 9
by
Daniel Higgins
Tim Balint
Harold Liversage
Paul Winters

101
PAR
T II
IC
hap
ter
9/
Review methodology
Owing to its rigour and neutrality, the systematic
review methodology is considered the gold
standard among approaches to literature
reviews (Bryman, 2008). This review followed
the standard procedure for the method (Higgins
and Green, 2011), first conducting an exhaustive
search of all relevant sources of published
and unpublished literature for relevant studies,
using a detailed set of predefined inclusion
criteria.21 These criteria restricted eligible studies
to those undertaken after 1990 that: (1) use
quantitative or qualitative data to investigate the
impact of land tenure security in a middle- or
low-income country; and (2) use a methodology
that exceeds a specified level of rigour. For
the second criterion, quantitative studies were
mainly required to have assessed the effects of
land tenure security using a well-constructed
comparison/control group, and qualitative studies
needed to perform well on the widely used
Critical Appraisal Skills Programme checklist
(CASP, 2015). Eligible studies were also given
a ranking for their methodological rigour, which
was then considered when interpreting the
study findings.
The research team synthesized the studies
identified through the search using the narrative
approach, which was conducted in a way that
ensured that the findings of all studies were
considered. Another method of synthesizing
21. The search was conducted between February and April 2016.
study findings in a systematic review is to
combine the quantitative study results through a
meta-analysis, producing aggregate estimates of
effects on a given outcome (McDonald, 2008).
However, given the review’s coverage of a wide
range of land tenure activities, contexts and
outcomes, and its aim of drawing rich in-depth
insights, the research team decided that such
aggregate figures would not suit the nature or
purpose of the review.
Review findings
Distribution of the research base
From among almost 30,000 identified studies,
278 were selected as eligible based on title and
abstract screening. After full-text screening and
assessment of methodological quality, a final set
of 59 studies – 36 based on quantitative data,
and 23 based on qualitative data – were selected
for a transparent and neutral synthesis of their
findings.
Figure 9.1 shows the distribution of studies
by publication/completion year. No eligible
studies from 1990-1999 were identified, and
a particularly high number were identified from
the past five years. These two results could be
due to an increasing research focus on land
tenure effects, or to recent improvements in
methodological rigour.
Figure 9.1 Distribution of studies by publication year
2000
0 0 0
2 2
5
10 10
8
4
111 1
2002 2003 20042001 2005 2006 2007 2008 2009 2010 2011 2012 2013 2014 2015 2016
12
10
8
6
4
2
0
45 5
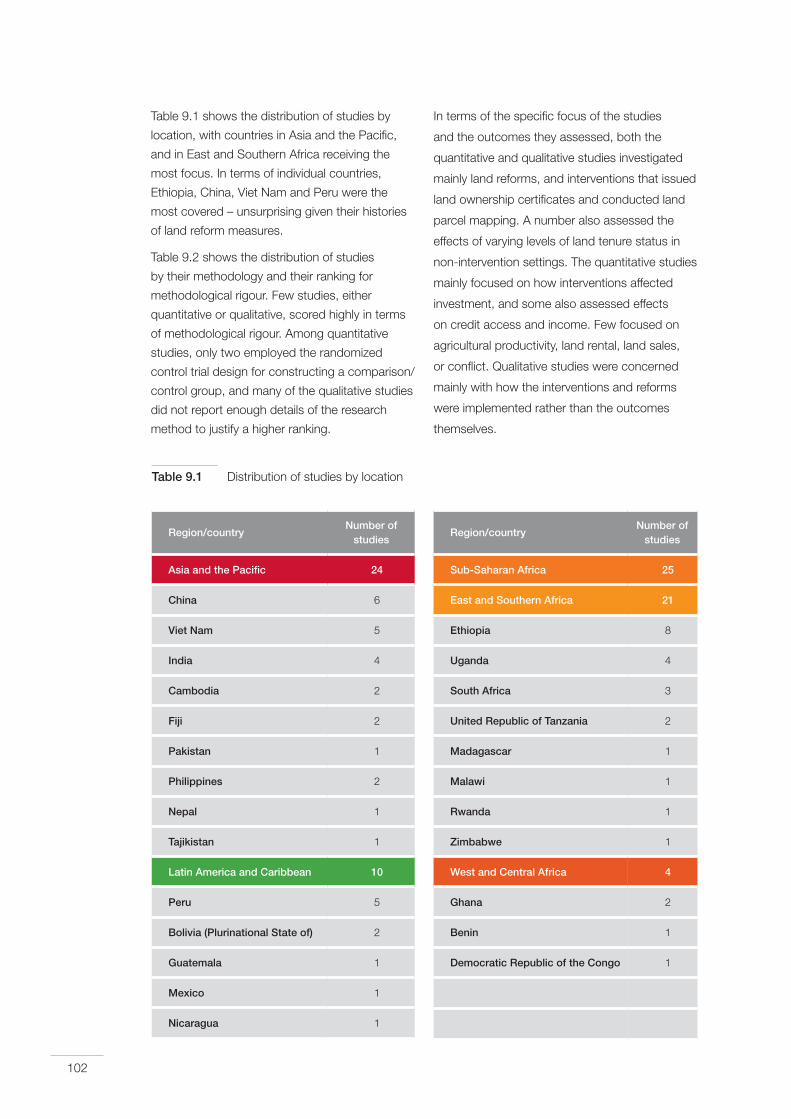
102
Table 9.1 shows the distribution of studies by
location, with countries in Asia and the Pacific,
and in East and Southern Africa receiving the
most focus. In terms of individual countries,
Ethiopia, China, Viet Nam and Peru were the
most covered – unsurprising given their histories
of land reform measures.
Table 9.2 shows the distribution of studies
by their methodology and their ranking for
methodological rigour. Few studies, either
quantitative or qualitative, scored highly in terms
of methodological rigour. Among quantitative
studies, only two employed the randomized
control trial design for constructing a comparison/
control group, and many of the qualitative studies
did not report enough details of the research
method to justify a higher ranking.
In terms of the specific focus of the studies
and the outcomes they assessed, both the
quantitative and qualitative studies investigated
mainly land reforms, and interventions that issued
land ownership certificates and conducted land
parcel mapping. A number also assessed the
effects of varying levels of land tenure status in
non-intervention settings. The quantitative studies
mainly focused on how interventions affected
investment, and some also assessed effects
on credit access and income. Few focused on
agricultural productivity, land rental, land sales,
or conflict. Qualitative studies were concerned
mainly with how the interventions and reforms
were implemented rather than the outcomes
themselves.
Table 9.1 Distribution of studies by location
Region/countryNumber of
studies
Asia and the Pacific 24
China 6
Viet Nam 5
India 4
Cambodia 2
Fiji 2
Pakistan 1
Philippines 2
Nepal 1
Tajikistan 1
Latin America and Caribbean 10
Peru 5
Bolivia (Plurinational State of) 2
Guatemala 1
Mexico 1
Nicaragua 1
Region/countryNumber of
studies
Sub-Saharan Africa 25
East and Southern Africa 21
Ethiopia 8
Uganda 4
South Africa 3
United Republic of Tanzania 2
Madagascar 1
Malawi 1
Rwanda 1
Zimbabwe 1
West and Central Africa 4
Ghana 2
Benin 1
Democratic Republic of the Congo 1

103
PAR
T II
IC
hap
ter
9/
Themes in the study findings
The findings of the 59 identified studies can be
separated into those focusing on the economic,
social and environmental effects of land tenure
security. Although the studies analyse different
settings (ranging from different land tenure
security interventions to situations where land
tenure security already exists), evidence for
positive effects across such different settings
can provide an evidence-based rationale for
investments in land tenure security.
Economic effects
Productive investment, productivity and income
were among the most heavily studied effects in the
identified studies. Figure 9.2 presents the findings
of the included quantitative studies on these
three outcomes, separating them by study focus.
The findings show a clear divergence between
investment and income effects, with the majority of
studies showing positive effects on investment but
not on income. With most of the studies focusing
on reasonably short periods, it is unclear whether
this divergence occurs because the expected
income effect is not valid – which would be
surprising given the support for positive investment
effects – or because the studies did not have
time to capture the income effects that may have
followed increased investment.
Some qualitative studies highlight factors that
may mitigate the economic effects. Many
studies noted that formally titled households still
Table 9.2 Distribution of studies by methodology and ranking
Study type Number of studies
Quantitative studies
Methodology
Instrumental variable 14
Propensity score matching (PSM) 8
Difference-in-difference (DD) 6
PSM and DD 4
Randomized control trial 2
Regression discontinuity 2
Risk of bias level
Low 2
Medium-low 15
Medium-high 19
Qualitative studies
Grade
A 3
B 6
C 14

104
perceived their tenure security to be low, most
often as a result of past experience of state-led
land appropriation, and as a result they did not
change their investment behaviour. In addition,
many qualitative studies found that certain
groups – mainly women, minorities and the
very poorest – were often hindered or excluded
from obtaining titles through interventions and
reforms, mainly because of discrimination,
corruption, elite capture, and expensive,
complex application procedures within local land
administration institutions.
The other main expected economic effect of
land tenure security is improved credit access,
but it received little support from the quantitative
or qualitative studies that investigated this link.
According to the qualitative studies, the main
explanation was that lending institutions often
Figure 9.2 Quantitative results of land tenure security on productive investment, productivity and income
No effect
Productive investment
Productive investment
Productivity
Effect of land formalizationintervention on:
Effect of varying level of tenuresecurity in a natural setting on:
Commercial investment
Productivity
Productive investment
Effects of vouchers topurchase own land on:
Productivity
Income
Productive investment
Effect of strengthenedcollective rights on:
Income
Effect of strengthenedforest rights on:
Productive investment
Effect of title against renting or sharecropping on:
Productive investment
Effect of varying knowledgeof land law on:
Productivity
Income
Income
Number of studies
Positive effect
2
2
5
2
2
2
2
1
1
1
1
1
1
1
1
1
1
0
0
0
0
0
0
0
0
0
0
0
0
6

105
PAR
T II
IC
hap
ter
9/
employ non-collateral-based lending policies,
thus nullifying the mechanism through which
credit access is expected to improve. In addition,
households were found to face other barriers to
credit access unrelated to land tenure security,
including excessive distance from lending
institutions, and long and complex loan application
processes.
Social effects
The quantitative studies found unanimously
positive effects on gender empowerment for
interventions that specifically target women’s
secure land access. However, three of the
four studies were based in one country – India
– raising doubts about whether the effect crosses
contexts. Moreover, one qualitative study of a
joint-titling programme, which found positive
effects for joint-titled women, noted that women
were often excluded from participating, either by
their spouses or by local institutions.
Another social effect commonly expected from
land tenure security is a reduction in conflict
over land. Although the handful of quantitative
studies that tested this effect produced
inconclusive outcomes, some of the qualitative
studies provided important insights. The most
salient was that interventions that do not pay
proper consideration to the pre-existing land
administration system can actually increase
land contestation, either through ineffective land
mapping or by disrupting and weakening existing
mechanisms for conflict resolution.
Environmental effects
Eight quantitative studies assessed the effect of
land tenure security on environmentally beneficial
investment, using indicators such as organic
fertilizer use and frequency of land fallowing. Few
focused on any other environmental outcomes,
such as soil degradation or deforestation.
Of the studies focused on conservation
investments, all but one observed a positive
effect. A number of qualitative studies suggest
that these effects were probably caused by
households being induced to take a longer-term
approach to farming, in the knowledge that their
land was safe from appropriation. However, other
qualitative studies noted that poorly designed or
poorly implemented interventions can actually
induce overfarming of titled land. This result
occurred mainly when households were required
to provide ongoing payments for their land title or
were threatened with eviction if the land was not
used. In these cases, neither actual nor perceived
security was increased, leading to detrimental
effects on the environment.
Key implications of review findings
This review aimed to use high-quality evidence to
test the expected benefits of land tenure security
and to generate insights to inform future work
using land tenure security to reduce poverty and
to promote rural development. The synthesized
findings of 59 studies identified through an
exhaustive search point to the following policy,
practice and research implications:
• It is valid to expect increased land
tenure security to lead farmers to invest
more in agricultural production and land
conservation. However, interventions must
ensure that farmers’ perceptions of tenure
security increase along with their actual
tenure status; whether farmers trust the
state to protect their access rights is a
key consideration. Interventions must also
address the potential economic and social
barriers – discrimination, long and expensive
application procedures, and elite capture
of land administration institutions – facing
intended beneficiaries.
• The expected increase in credit access
seemingly relies on a number of contingent
factors. Practitioners hoping to improve
credit access using land tenure security
should assess whether local lending
institutions have collateral-based lending
policies, are within spatial reach of
beneficiaries, and have manageable
application processes. On the demand
side, in light of the positive findings on

106
investment in the absence of a credit effect,
practitioners should also consider whether
beneficiaries are actually capital constrained
and, therefore, in need of credit.
• There appears to be strong potential for
boosting women’s empowerment by
improving their access to secure land,
although more research is needed on
interventions beyond India. However, to
ensure that all women can benefit, the
research highlights the need to understand
community and household gender dynamics,
and the other potential barriers women face
in obtaining secure access to land.
• To avoid increasing the level of land conflict
or producing other unintended effects, land
tenure security interventions should seek to
fully understand existing land administration
systems, and to align activities with them
accordingly.
• Further research is required in a number
of areas: (1) capturing the longer-term
effects of land tenure security; (2) assessing
the effect of women-focused land tenure
interventions on gender empowerment
beyond India; and (3) filling the research
gaps relating to effects on land rental, land
sales and conflict.
The results of this review will feed into the Global
Land Indicators Initiative to help produce better
impact measurement indicators and techniques.
In collaboration with the Millennium Challenge
Corporation, IFAD is also developing an
interactive study database that the development
community can use as a one-stop source for
high-quality land tenure security studies.
References
General references
Bryman, A. 2008. Social research methods. Third
edition. Oxford: Oxford University Press.
CASP (Critical Appraisal Skills Programme). 2017.
CASP qualitative checklist, http://docs.wixstatic.
com/ugd/dded87_25658615020e427da194a325
e7773d42.pdf
De Soto, H. 2000. The mystery of capital:
Why capitalism triumphs in the West and fails
everywhere else. New York, USA: Basic Books.
Deininger, K. and Binswanger, H. 1999. The
evolution of the World Bank’s land policy:
Principles, experience, and future challenges.
World Bank Research Observer, 14(2): 247-276.
Everest-Phillips, M. 2008. The myth of “secure
property rights”: Good economics as bad history
and its impact on international development.
SPIRU Working Paper No. 23. London: Overseas
Development Institute, Strategic Policy Impact and
Research Unit.
Gignoux, J., Macours, K. and Wren-Lewis, L.
2013. Evaluating the impact of land administration
programs on agricultural productivity and
rural development. IDB Technical Note No.
IDB-TN-506. Washington, D.C.: Inter-American
Development Bank.
Higgins, J. P. T. and Green, S., eds. 2011.
Cochrane handbook for systematic reviews of
interventions. Version 5.1.0 [updated March 2011].
The Cochrane Collaboration, www.handbook.
cochrane.org
Holden, S., Otsuka, K. and Deininger, K. 2013.
Land tenure reforms, poverty and natural
resource management: Conceptual framework.
In S. Holden, K. Otsuka and K. Deininger, eds.
Land tenure reform in Asia and Africa: Assessing
impacts on poverty and natural resource
management. London: Palgrave Macmillan.

107
PAR
T II
IC
hap
ter
9/
Lawry, S., Samii, C., Hall, R., Leopold, A., Hornby,
D. and Mtero, F. 2017. The impact of land property
rights interventions on investment and agricultural
productivity in developing countries: A systematic
review. Journal of Development Effectiveness,
9(1): 61-81.
McDonald, J. H. 2008. Handbook of biological
statistics. Baltimore, USA: Sparky House.
Meinzen-Dick, R. 2009. Property rights for
poverty reduction? DESA Working Paper No. 91.
New York, USA: United Nations Department of
Economic and Social Affairs.
Nuesiri, E. O. 2014. Secure tenure must be the
foundation of adaptation in East and Southern
Africa. Conflict sensitive adaptation: Use human
rights to build social and environmental resilience.
Brief 4. Indigenous Peoples of Africa Co-
ordinating Committee and IUCN Commission on
Environmental, Economic and Social Policy.
USAID (US Agency for International Development).
2016. Fact sheet: Land tenure and women’s
empowerment. Washington, D.C., www.land-links.
org/issue-brief/fact-sheet-land-tenure-womens-
empowerment
References for quantitative studies identified
through the search
Ali, D. A., Deininger, K. and Goldstein, M. 2014.
Environmental and gender impacts of land
tenure regularization in Africa: Pilot evidence from
Rwanda. Land and Property Rights, 110:
262-275.
Ameha, A., Nielsen, O. J. and Larsen, H. O.
2014. Impact of access and benefit sharing on
livelihoods and forest: Case of participatory forest
management in Ethiopia. Ecological Economics,
97: 162-171.
Bellemare, M. F. 2013. The productivity impacts
of formal and informal land rights: Evidence from
Madagascar. Land Economics, 89(2): 272-290.
Brulé, R. 2010. Changes in India’s rights regime
and the implications for gender parity: Evidence
from regression discontinuity analysis of panel data
for 17 Indian states. American Political Science
Association 2010 annual meeting paper.
Deininger, K. and Jin, S. 2002. The impact of
property rights on households’ investment, risk
coping, and policy preferences: Evidence from
China. Economic Development and Cultural
Change, 51(4): 851-882.
Deininger, K., Ali, D. A. and Alemu, T. 2009.
Impacts of land certification on tenure security,
investment and land market participations:
Evidence from Ethiopia. Land Economics, 87(2):
312-334.
Deininger, K., Ayalew, D. and Yamano, T. 2006.
Legal knowledge and economic development: The
case of land rights in Uganda. World Bank Policy
Research Working Paper 3868. Washington, D.C.:
World Bank.
Deininger, K., Goyal, A. and Nagarajan, H. 2010.
Inheritance law reform and women’s access to
capital: Evidence from India’s Hindu Succession
Act. World Bank Policy Research Paper No. 5338.
Washington, D.C.: World Bank.
Do, Q.-T. and Iyer, L. 2007. Land titling and rural
transition in Vietnam. Economic Development and
Cultural Change, 56(3): 531-579.
Dower, P. C. and Pfutze, T. 2013. Specificity of
control: The case of Mexico’s ejido reform. Journal
of Economic Behaviour and Organisation, 91:
13-33.
Fatema, N. and Kibriya, S. 2015. Can land and
food entitlement reduce conflict? Evidence from
violence prone Eastern DR Congo. Selected paper
prepared for presentation at the 2015 Agricultural
and Applied Economics Association and Western
Agricultural Economics Association Joint Annual
Meeting, San Francisco, CA, July 26-28.

108
Field, A. J., Field, E. and Torero, M. 2006. Property
rights and crop choice in rural Peru, 1994-2004.
MTID Discussion Paper No. 100. Washington,
D.C.: International Food Policy Research Institute.
Fort, R. 2008. The homogenization effect of
land titling on investment incentives: Evidence
from Peru. NJAS – Wageningen Journal of Life
Sciences, 55(4): 325-343.
Gelo, D. and Koch, S. F. 2014. The impact of
common property right forestry: Evidence from
Ethiopian villages. World Development, 64:
395-406.
Goldstein, M., Houngbedji, K., Kondylis, F.,
O’Sullivan, M. and Selod, H. 2015. Formalizing
rural land rights in West Africa: Early evidence from
a randomized impact evaluation in Benin. Policy
Research Working Paper No. 7435. Washington,
D.C.: World Bank.
Gordoncillo, P. U. 2012. The economic effects of
the Comprehensive Agrarian Reform Programme
in the Philippines. Journal of ISSAAS (International
Society for Southeast Asian Agricultural Sciences),
18(1): 76-86.
Hagos, H. G. and Holden, S. 2013. Efficiency and
productivity differential effects of land certification
program in Ethiopia. IFPRI Discussion Paper
01295. Washington, D.C.: International Food
Policy Research Institute.
Ito, J., Bao, Z. and Ni, J. 2016. Land rental
development via institutional innovation in rural
Jiangsu, China. Food Policy, 59: 1-11.
Kemper, N., Ha, L. V. and Klump, R. 2015.
Property rights and consumption volatility:
Evidence from a land reform in Vietnam. World
Development, 71: 107-130.
Kemper, N., Klump, R. and Schumacher, H.
2011. Representation of property rights and credit
market outcomes: Evidence from a land reform in
Vietnam. Proceedings of the German Development
Economics Conference, Berlin, No. 45.
Keswell, M. and Carter, M. 2011. Poverty and land
distribution: Evidence from a natural experiment.
UNU-WIDER Working Paper No. 2011/46.
Helsinki: United Nations University – World Institute
for Development Economics Research.
Kousar, R. and Abdulai, A. 2015. Impact of
non-farm work and land tenancy contracts on
soil conservation measures. Paper prepared for
the 88th annual conference of the Agricultural
Economics Society, April 9-11, 2014, Paris.
Kumari, R. and Nakano, Y. 2015. Does land lease
tenure insecurity cause decreased productivity
and investment in the sugar industry? Evidence
from Fiji. Tsukuba Economics Working Papers No.
2015-001. Tsukuba, Japan: University of Tsukuba.
Lawson-Remer, T. 2013. Do stronger collective
property rights improve household welfare?
Evidence from a field study in Fiji. World
Development, 43: 207-225.
Li, G., Rozelle, S. and Huang, J. 2000. Land
rights, farmer investment incentives, and
agricultural production in China. Working
Paper No. 00-024. Davis, USA: University of
California, Davis, Department of Agricultural and
Resource Economics.
Ma, X., Heerink, N., van Ierland, E. C., van den
Berg, M. and Shi, X. 2013. Land tenure security
and land investments in Northwest China. China
Agricultural Economic Review, 5(2): 281-307.
Macours, K. 2009. Land titles and conflicts
in Guatemala. IDB Working Paper CS 1-164.
Washington, D.C.: Inter-American Development
Bank.
Markussen, T. 2008. Property rights, productivity,
and common property resources: Insights from
rural Cambodia. World Development, 36(11):
2277-2296.
Mendola, M. and Simtowe, F. 2015. The welfare
impact of land redistribution: Evidence from a
quasi-experimental initiative in Malawi. World
Development, 72: 53-69.

109
PAR
T II
IC
hap
ter
9/
Nakasone, E. 2011. The impact of land titling on
labor allocation: Evidence from rural Peru. IFPRI
Discussion Paper 01111. Washington, D.C.:
International Food Policy Research Institute.
Petracco, C. K. and Pender, J. 2009. Evaluating
the impact of land tenure and titling on access to
credit in Uganda. IFPRI Discussion Paper 00853.
Washington, D.C.: International Food Policy
Research Institute.
Reyes-Garcia, V., Orta-Martinez, M., Gueze, M.,
Luz, A. C., Paneque-Galvez, J., Macia, M. J.
and Pinto, J. 2012. Does participatory mapping
increase conflicts? A randomized evaluation in the
Bolivian Amazon. Applied Geography, 34: 650-658.
Santos, F., Fletschner, D., Savath, V. and
Peterman, A. 2014. Can government-allocated
land contribute to food security? Intrahousehold
analysis of West Bengal’s Microplot Allocation
program. World Development, 64: 860-872.
Wiig, H. 2013. Joint titling in rural Peru:
Impact on women’s participation in household
decision-making. World Development, 52: 104-119.
Xie, L., Berck, P. and Xu, J. 2016. The effect on
forestation of the collective forest tenure reform in
China. China Economic Review, 38: 116-129.
References for qualitative studies identified
through the search
Ali, D. A., Collin, M., Deininger, K., Dercon, S.,
Sanderfur, J. and Zeitlin, A. 2014. The price of
empowerment: Experimental evidence on land
titling in Tanzania. World Bank Policy Research
Paper 6908. Washington, D.C.: World Bank.
Antwi-Agyei, P., Dougill, A. J. and Stringer, L. C.
2015. Impacts of land tenure arrangements on
the adaptive capacity of marginalised groups: The
case of Ghana’s Ejura Sekyedumase and Bongo
districts. Land Use Policy, 49: 203-212.
Bajracharya, B. 2008. Institutional factors that
influence access of the poor to forest benefits:
Case studies of community and leasehold
forestry regimes in Nepal. PhD dissertation,
Massey University.
Bezu, S. and Holden, S. 2014. Demand for
second-stage land certification in Ethiopia:
Evidence from household panel data. Land Use
Policy, 41: 193-205.
Bose, P. 2013. Individual tenure rights, citizenship,
and conflicts: Outcomes from tribal India’s forest
governance. Forest Policy and Economics, 33:
71-79.
Bradstock, A. 2006. Implementing land reform in
South Africa’s Northern Cape Province. Network
Paper No. 137. London: Overseas Development
Institute, Agricultural Research and Extension
Network.
Broegaard, R. B. 2009. Land access and titling
in Nicaragua. Development and Change, 40:
149-169.
Cardona, W. C., de Jong, W., Zuidema, P. A.
and Boot, R. 2014. Diverse local regulatory
responses to a new forestry regime in forest
communities in the Bolivian Amazon. Land Use
Policy, 39: 224-232.
Castella, J.-C., Boissau, S., Thanh, N. H. and
Novosad, P. 2006. Impact of forestland allocation
on land use in a mountainous province of Vietnam.
Land Use Policy, 23(2): 147-160.
Chen, J. and Innes, J. L. 2013. The implications
of new forest tenure reforms and forestry property
markets for sustainable forest management
and forest certification in China. Journal of
Environmental Management, 129: 206-215.
Gondo, T. and Kyomuhendo, V. 2011. Between
reality and rhetoric in land conflicts: An anecdotal
anatomy of the lawful, bonafide occupants and
customary tenants in Kyenjonjo district, Uganda.
Land Tenure Journal, 1: 27-50.
Keating, N. B. 2013. Kuy alterities: The struggle to
conceptualise and claim Indigenous land rights in
neoliberal Cambodia. Asia Pacific Viewpoint, 54(3):
309-322.

110
Kuusaana, E. D. and Bukari, K. N. 2015. Land
conflicts between smallholders and Fulani
pastoralists in Ghana: Evidence from the Asante
Akim North District (AAND). Journal of Rural
Studies, 42: 52-62.
Mazhawidza, P. and Manjengwa, J. 2011. The
social, political and economic transformative
impact of the Fast Track Land Reform on the
lives of women farmers in Goromonzi and
Vungu‑Gweru Districts of Zimbabwe. Harare:
Women Farmers Land and Agriculture Trust and
Center for Applied Social Sciences, University of
Zimbabwe.
Mukhamedova, N. and Wegerich, K. 2014. Land
reforms and feminization of agricultural labor
in Sughd province, Tajikistan. IWMI Research
Report No. 157. Colombo: International Water
Management Institute.
Pedersen, R. H. 2015. A less gendered access
to land? The impact of Tanzania’s new wave of
land reform. Development Policy Review, 33(4):
415-432.
Rakolojane, M. J. 2013. The gender dimensions
of land reform in South Africa: A case study of
Daggakraal Rural Housing and Resettlement
project. PhD dissertation, University of South
Africa.
Sikor, T. 2006. Politics of rural land registration
in post-socialist societies: Contested titling in
villages of northwest Vietnam. Land Use Policy,
23(4): 617-628.
Shibeshi, G. B. 2012. Lessons from systematic
evaluation of land administration systems: The
case of Amhara National Regional State of
Ethiopia. World Development, 68: 282-295.
Teklu, A. 2005. Land registration and women’s
land rights in Amhara region, Ethiopia. London:
International Institute for Environment and
Development.
Van Leeuwen, M. 2015. Localising land
governance, strengthening the state:
Decentralization and land tenure security in
Uganda. Journal of Agrarian Change, 17(1):
208-227.
Vista B. M., Nel, E. and Binns, T. 2012. Land,
landlords and sustainable livelihoods: The impact
of agrarian reform on a coconut hacienda in the
Philippines. Land Use Policy, 29(1): 154-164.
Yami, M. and Snyder, K. A. 2015. After all, land
belongs to the state: Examining the benefits of
land registration for smallholders in Ethiopia. Land
Degrading Development, 27(3): 465-478.

111
PAR
T II
IC
hap
ter
10/
Irrigation is critical for smallholder agriculture.
Insufficient rainfall, changing weather patterns,
and climatic variability all reduce crop yields
and often lead to crop failure and food scarcity.
In arid and semi-arid regions, prolonged drought
has led to hunger and malnutrition, and in some
cases to famine.
Irrigation offers protective insurance against
variations in rainfall and drought. It meets
cropwater demands by increasing soil moisture
and, if properly managed, enhances plant uptake
of nutrients. It leads to changes in cropping
patterns – farmers who depend on rainfall
generally have only one cropping season per
year, whereas irrigation permits at least two
cropping seasons a year. Irrigation supports the
production of high-value crops and improves
overall crop quality. Recent studies show that
beneficial agricultural management practices
in combination with irrigation increase food
production and minimize the impacts of climate
change on food security (Verge, De Kimpe
and Desjardins, 2007; Heard et al., 2012).
Apart from food security, irrigation systems, if
properly designed and managed, can contribute
to poverty alleviation and environmental
sustainability (Walker, 1989; Madramootoo, Wiyo
and Enright, 1992; Hussain and Hanjra, 2004;
Hanjra, Tadele and Gutta, 2009; Dukhovny,
2011), and drive economic development (Sezen
et al., 2010; Gao et al., 2012).
Irrigation covers about 16 per cent of the world’s
cropland, and these irrigated lands make a
disproportionate contribution to global food
security, producing 36 per cent of the world’s
food (World Food Summit, 1996). However,
irrigated area is unevenly distributed worldwide,
and net irrigated area is declining. Whereas
agricultural land under irrigation was estimated to
be about 263 million hectares in the mid-1990s,
in 2013 it was estimated at about 255 million
hectares (Amede, 2015). More than 70 per cent
of the irrigated area is in Asia. Sub-Saharan
Africa, a highly food-insecure region, has just
over 3 per cent of the irrigated area (FAO, 2016).
While the area that could be exploited globally
for irrigation could be significantly more 300
million hectares, there are several constraints
to achieving this potential, particularly in Africa.
These constraints include: inadequate technical
skills and institutional capacity; lack of financial
capital (You et al., 2010); problems with water
and land rights (Gunda et al., 2013; Wanvoeke
et al., 2016); transboundary constraints; future
climates (Muller et al., 2015); and difficulties
obtaining the necessary environmental permits.
Over the years, IFAD has made loan and grant
funds available for the development of new
irrigation schemes, rehabilitation of existing
schemes, the capacity-building of water
user associations (WUAs), and strengthening
processes such as irrigation management
Smallholder irrigation in a broader productivity and value chain framework: implications for IFAD investments
Chapter 10
by
Chandra Madramootoo
Rui Benfica

112
transfers. This chapter argues that IFAD can
significantly increase the water-use efficiency,
irrigation system performance, and crop water
and economic productivity of smallholder
irrigation schemes, as well as the financial returns
to irrigation, by linking the design, operation and
management of irrigation systems to markets,
value chains, and input supplies and services.
It seeks to explore business opportunities
and technological innovations in smallholder
irrigation, and to develop a framework to inform
programmatic development relevant to IFAD in
building irrigation value chains.
IFAD’s irrigation portfolio
IFAD has few projects focused exclusively on
water, and even fewer focused exclusively
on irrigation. It currently has some 76 active
projects with investments in irrigation/water,
with only about 11 devoted primarily to both the
hard and soft components of irrigation. While
these 11 projects focus primarily on smallholder
irrigation systems, they include complementary
components that cover capacity and institution
building, management, extension and technical
advice, markets, inputs, rural infrastructure
and credit. Without these other functions and
services, the irrigation projects could not achieve
their full potential. The largest investments are in
Asia and the Pacific. The primary characteristics
of IFAD’s irrigation investments in its five
operational regions are shown in box 10.1.
IFAD’s approach to value chain development
IFAD recognizes that poverty reduction,
economic resilience among the rural poor, and
rural transformation are increasingly dependent
on a value chain approach. Whereas in 1999 only
3 per cent of IFAD projects had a value chain
development component, today that figure is
more than 50 per cent. This significant increase
Box 10.1 IFAD’s programmatic approach to water/irrigation investments by geographic region
Region Programmatic focus
West and Central Africa
Small-scale garden irrigation; watershed management; soil and water conservation; water harvesting, small dams and ponds, tube wells; lowland development for rice irrigation; climate-smart agriculture; economic poles/clusters; value chains.
East and Southern Africa
Irrigation infrastructure expansion, rehabilitation and modernization; watershed and land management; water resources and basin development; soil and water management; adaptation to climate change; farmer capacity- and institution-building; markets and value chains.
Asia and the Pacific
Improvements in irrigation infrastructure; expansion of irrigation facilities; water harvesting, pond and tube-well development; drought proofing; drinking-water supply and sanitation; strengthening of water user associations; farmer capacity- and institution-building; markets and value chains.
Latin America and Caribbean
Limited involvement in irrigation in the region. Irrigation improvements; capacity-building of water user associations; natural-resource protection and management; water harvesting. Limited indication about markets and value chains in these water/irrigation projects.
Near East and North AfricaIrrigation development, expansion and rehabilitation; strengthening of water user associations; watershed management; soil and water conservation; climate-smart agriculture; markets and value chains.

113
PAR
T II
IC
hap
ter
10/
is linked to the adoption of IFAD’s Private Sector
Development and Partnership Strategy in 2005.
While earlier value chain projects centred on
cooperatives, today public-private-producer
partnerships (4Ps) are being promoted.
IFAD projects use three types of value chain
models: producer-driven, buyer-driven and
intermediary-driven. In the producer-driven
model, producers are organized in groups,
associations or cooperatives that take on
production and, sometimes, post-production
functions aiming at capturing the largest share
of the retail value. Through IFAD and other
project support, these groups become strong
enough to network, search for buyers and
negotiate contracts with them. In many cases,
they become the leaders of the value chains
and are able to transform, process, transport
and market their commodities themselves,
thereby earning a higher share of value addition
along the value chain. Examples of such
models are most prominent in Latin America,
where farmers’ organizations are strong and
well established. In the buyer-driven model,
the private sector (e.g. processors, retailers,
traders and wholesalers) organizes producers
into suppliers through various contractual
arrangements (e.g. outgrower schemes, contract
farming and joint ventures). This model is
particularly appealing when a private company
is identified from the start of the project and the
value chain is a large infrastructure or processing
investment that only a private-sector entity can
undertake. In the intermediary-driven model,
the most common intermediary is usually an
NGO or a service provider that brings the parties
together, provides them with services (e.g.
capacity building of farmers, information and
sourcing to private companies, and networking
between the parties), and brokers and monitors
value chain linkages. This model is useful
when the value chain linkages are not very
strong, the private-sector presence is weak,
and value chains are identified during project
implementation.
There is no single right or optimal way to
organize a value chain. Models will vary
according to country, commodity, local context,
capacity of value chain actors, policy framework
and the business environment. IFAD observes
that, for commodity value chains where
marketing arrangements or prices are controlled
by governments, these tend to distort markets
and displace the private sector.
IFAD and irrigation value chains
Of the 76 active IFAD projects with a water/
irrigation component, 43 have a component
on value chains. Although in some projects the
value chain model is not specified, most of the
projects seem to favour the producer-driven
and the intermediary-driven models, or a
combination of the two. For example, the
economic clusters that are part of the small
garden irrigation projects in Benin and the Niger
require producers and intermediaries, such
as brokers and retailers, to work in tandem.
The Market Access Alliances in Ethiopia’s
Participatory Small-Scale Irrigation Development
Programme II (PASIDP II) are a combination of
commodity organizations, farmers’ organizations
and retailers. The Swaziland Market-led Project
links irrigated producers to small local traders
and larger wholesalers, but is not a complete
buyer-driven model. At present, the full
buyer-driven model seems to be more oriented
to outgrower schemes such as the Bagamoyo
Sugar Infrastructure and Sustainable Community
Development Programme in the United Republic
of Tanzania.
Emerging opportunities in irrigation value chains
Global demand for food is expected to at least
double over the next 25 years. An emerging
middle class, particularly in Asia, will also
demand more higher-value food products.
Therefore, smallholder irrigators will have multiple
opportunities to contribute to local and regional
food security, and to manage environmental
services within watersheds. These scenarios
will lead to more economic and financial
opportunities for small irrigators.

114
However, to date, investments in value-chain
irrigated agriculture are severely lacking in
public smallholder irrigation schemes. Such
investments have the potential to drive economic
growth, reduce poverty, and fulfil domestic and
global demand for agricultural products (Seville,
Buxton and Vorley, 2011). Linking smallholders
to markets and identifying which markets have
the potential to benefit certain producers are
crucial steps towards improving the livelihoods
of the rural poor. The small irrigator is at the
base of the economic pyramid, and the objective
is to lift such smallholders from the bottom of
the pyramid.
A new development pathway for the design of
smallholder irrigation projects is proposed in
order to enhance crop water productivity and to
significantly augment the economic, social and
environmental benefits of irrigated agriculture.
The emphasis should be not just on upstream
irrigation hardware components but also on the
value chain – and particularly on lengthening
the chain from irrigated production of high-value
commodities to local, national, regional and
international markets.
Stronger links between irrigators, farmers
organizations and marketing systems could
lead to a stronger asset base, new employment
opportunities, and increased income generation
in rural areas. Moreover, a more robust irrigation
business enterprise model offers potential
to leverage co-investments from the private
sector, impact investors, venture capitalists,
microcredit agencies, and emerging NGOs with
a strong interest in agricultural value chains and
financial inclusivity.
This development pathway is rooted in the
inclusion of women and rural youth in irrigated
agriculture, and in the emergence of new
economic and employment opportunities for
the people who depend on rural areas and
agriculture for their livelihoods. Building value
chains and markets will raise the asset base of
women, indigenous groups and the rural poor.
Through new entrepreneurship programmes
around irrigation value chains, poorly educated
youth, who represent almost 40 per cent of the
agricultural workforce in rural areas, will be in a
better economic and financial position.
Strengthening IFAD’s investments in irrigation value chains
An analysis of IFAD’s work in irrigation value
chains has revealed the following shortcomings:
• Few projects have significant investments
in agroprocessing, cold storage and
transportation.
• Most projects appear to lack investments
in marketing infrastructure and marketing
information systems.
• There are few successful examples of the
4Ps in current project execution.
• With the exception of the PASIDP II project,
there is no strong attempt to link the irrigation
water user associations to marketing
organizations and value chains.
• Few projects address gender and inclusivity,
and financial inclusivity, in the value chain.
Based on these observations, IFAD can improve
its activities in irrigation value chains in several
ways, as outlined below.
Increase private-sector involvement.
Apart from the traders, wholesalers and
outgrower schemes, there is little full
private-sector involvement in irrigation value
chains. More private-sector involvement should
be encouraged given that, in conjunction with
the public sector, private companies can help
cover capital investments and logistics along the
cold chain, including storage and transportation
infrastructure. Moreover, the private sector can
provide an integrated package of services,
ranging from irrigation equipment and pumps to
improved seed availability, agronomic advisory
services, transport, grading and packaging,
storage, agroprocessing and, ultimately,
high-end markets. In addition, the private sector,
mainly large commercial firms and multinationals,
has experience with contract farming, whereby
farmers are provided with seed, inputs and
technical advice to grow specific high-quality
products (cocoa, coffee, horticulture and
potatoes). Contract farming with private firms
also allows farmers to know in advance what
their prices will be, and may also include
mechanisms to pay farmers a premium price for
top-quality products.

115
PAR
T II
IC
hap
ter
10/
Expand the scope of the 4Ps. Given the
high capital costs associated with irrigation,
transportation and storage infrastructure, the
4Ps model should be explored much more
significantly in irrigation value chains. It can be
used to fund the high upfront investment costs
of agricultural value chains, cover the risks,
provide a stronger regulatory and contractual
framework, and ensure fuller farmer participation.
When farmers are involved structuring and
implementing the value chains, they could be
more fairly compensated.
Enhance the intermediary-driven model.
NGOs and companies are working to link small
farmers to regional and global formal markets.
An advantage of NGOs is that they put the
farmer first, and they have the ability to raise
funds from private investors, angel investors,
venture capitalists, impact investors, financial
intermediaries and microcredit agencies. Another
emerging marketing mechanism consists of
commodity exchanges. Buyers employed by
the commodity exchange and working on
commission can link to farmers in the field and
offer prices based on commodity trading prices
in markets in other countries. The goal is to
have a pyramid whereby food producers are
aggregated upward in the pyramidal structure,
and the commodity exchange then purchases
the raw commodities. The exchange deals
with the aggregators at the top of the pyramid
rather than with hundreds of small farmers at
the bottom of the purchasing pyramid. This
significantly reduces transaction costs.
Challenges to successful value chains
Efforts to establish successful value chains
face several hurdles. One is the lack of strong
market intelligence systems in many developing
countries. There are few institutionalized
mechanisms for linking irrigated production to
market demand, in terms of timely supplies of
product in the right volumes to specific markets.
Formal markets have requirements – such as
quality, consistency, traceability, food safety and
third-party certified standards – that necessitate
direct communication and coordination along
the supply chain. Although these requirements
raise the barrier to entry for new producers,
they also present potential opportunities for
diversification, income generation and high-end
value-added production. Poor households in
rural areas can also participate in formal supply
chains as wage labourers in production, grading,
sorting, labelling, handling or processing, and
as providers in the service markets that support
value chains (Seville, Buxton and Vorley, 2011).
Small and medium-sized companies have had
mixed success with smallholder value chains.
These companies are risk averse and need the
financial backing of governments, which is not
always forthcoming. In many instances, they
are not able to pay the high costs of cold chain
logistics, and they depend on government to
pay for roads, electricity, transport and storage
facilities. In some cases, small farmers do not
honour contracts with these firms if they can
suddenly obtain a better price elsewhere. In
other cases, the firms do not honour the prices
to small farmers if they suddenly have a glut of a
specific commodity.
A new irrigation business model
The proposed business model for new irrigation
projects is tied to value chains, and it frames
smallholder irrigation in a more sustainable
financial, economic, environmental and social
context (figure 10.1). By incorporating aspects of
youth entrepreneurship, women’s empowerment
and gender inclusivity, the proposed business
model can create new economic opportunities,
jobs and wealth in rural areas.
In both smallholder irrigation projects and value
chain projects, IFAD has a unique opportunity
to support women with access to training,
productive assets (including rights to land and
water) and financial tools so that they can
more easily access concessionary credit. Any
development of irrigation value chains should
be firmly anchored in educating and promoting
women as business managers. This will require
a suite of training programmes not just on
the technical aspects but in areas such as

116
purchasing, retailing, keeping financial records,
understanding balance sheets, business
development, financial planning, marketing,
procurement, entrepreneurship and banking.
More than 40 per cent of the population in rural
regions of developing countries are under the
age of 18, and a large number of these people
are unemployed. Creating irrigation value chains
will stimulate the need for technicians, truck
drivers and handlers, mechanics, packers
and graders. IFAD is uniquely positioned to
implement a signature programme in youth
empowerment and inclusivity in irrigation value
chains. Such a programme would require
investments in short-term, hands-on, applied,
practical training courses at high schools,
technical schools, and agricultural, technical and
vocational education and training schools for
disenfranchised youth. Training is also required in
post-harvest handling techniques, food handling,
preparation and recipe creation to promote
consumption of traditional vegetables across
cultures. At training hubs, farmers learn how
to identify markets, grow vegetables that meet
quality attributes required by specific consumers,
and work collaboratively with other key players in
a given value chain. The outcomes will be more
opportunities for profitable self-employment
in peri-urban and rural areas, and better
production and consumption of nutritious
value-added commodities.
Figure 10.1 Proposed irrigation business model
Government participation
Establishment of land and water rights, institutions, policies, regulations, participatory irrigation management, water user association, standards, funding
Capacity-building, training and education
Increased income, youth and gender empowerment, poverty reduction
Economic and environmental sustainable irrigation value streams
Increased technical know-how, innovation platform, job and wealth creation, and entrepreneurship
Improved infrastructure (Transport, electricity, roads, storage); strengthened farmer cooperatives, market access alliance, economic poles, commodity markets, training programmes, farmer & �eld centres, farmer research groups
Improved inputs (e-wallets, agroprocessing equipment and facilities), public-private partnerships, contract farming, �nancial inclusivity, gender and youth inclusivity, innovative �nancial platforms
System bene�ts
Increased irrigation productivity, water savings, new irrigation technologies, production of high-value crops
Irrigation value chains
Create value chains for smallholders, new market opportunities, improved logistic chains
Private-sector participation
Increased technological and economic productivity, �nancial investments, building sustainable irrigation �nancing for operation and maintenance

117
PAR
T II
IC
hap
ter
10/
Innovation and entrepreneurship
As part of the new business model for
smallholder irrigation, there is an opportunity
to develop a unique programme on innovation
and entrepreneurship. Figure 10.2 shows a
series of activities within the innovation and
entrepreneurship pathway that are necessary for
successful irrigation value chains.
A range of entrepreneurial capabilities will be
required. Skilled people will be needed as pump
and irrigation system technicians, truck drivers
and handlers, mechanics, packers and graders.
Local technical colleges and agricultural,
technical and vocational education and training
schools can train unemployed youth in such
skills. In addition, women and young people
can be employed in packinghouses and can
undertake small cottage-level agroprocessing
– they will need training in food processing,
food safety and quality control. New microcredit
vehicles are required so that these skilled people
can take out small loans to purchase hand tools
and other items.
Technological innovations will also be
necessary. For example, high energy costs
and scarce energy availability in rural villages
are impediments to prolonged shelf life
and marketability of high-value, perishable
commodities. Solutions could include solar-
powered irrigation pumps, solar-cooled storage
tents in the fields, and solar- or biofuel-powered
transport systems. Another innovation is the use
of e-wallets to procure credit and agricultural
inputs, and to sell commodities, thereby
minimizing the handling of cash, and cutting
transaction costs.
Figure 10.2 The development pathway towards building irrigation value chains
Irrigated horticulture production
Harvest and transport to collection points
Grading, packaging, labelling and storage
Transport to economic centers
Sale of fresh products to consumers, agroprocessorsand retailersVA
LUE
CH
AIN
EN
TR
EP
RE
NE
UR
SH
IPA
ND
INN
OVA
TIO
NF
INA
NC
IAL
INC
LUS
IVIT
Y A
ND
S
OC
IAL
IMP
AC
T
Providing inputs, irrigation pumps and equipment
Training and �nancing programmes for youth in the provision of input supplies, irrigation equipment
Reduced rural poverty and youth unemployment; higher economic returns from irrigation; new market opportunities; wealth creation; educated youth workforce; new skills and jobs created; new educational programmes for youth; opportunities for youth entrepreneurship and innovation; increased farm and rural incomes
Supply of crates, bags and labels; standards for grading and sorting; low-cost storage points
Training in grading, sorting, packing and containerized storage
Creation of commercial distribution points for sale of fresh and processed products; creation of local cottage industries for light agroprocessing; creating markets and attracting clients
Training and �nancing programmes for youth entrepreneurs in marketing, sales, light agroprocessing, and distribution
Logistics and transport services; creating collection depots
Training and �nancing programmes for drivers, mechanics, logistics agents
Logistics and transport services
Training and �nancing programmes for logistics services, drivers, mechanics

118
Recommendations to advance IFAD’s investment programme in smallholder irrigation
Based on the analyses conducted, meetings
held with IFAD staff and leading international
irrigation experts, this chapter makes several
recommendations for advancing IFAD’s
investment programme in smallholder irrigation.
Irrigation water management
These recommendations pertain to all
geographic regions and are of equal importance:
• Harvest and use rainwater efficiently.
More than 80 per cent of cultivated cropland
worldwide relies on rainwater. Therefore,
water harvesting, water conservation,
soil moisture management, water-use
efficiency, dryland cropping and conservation
agriculture in the rainfed areas must continue
to receive investments.
• Continue to emphasize the multiple uses
of water. In rural areas, irrigation is the
largest water user and is often the stimulus
for providing water for other uses such as
aquaculture, livestock, agroprocessing, water
supply and sanitation. It would be good
to formalize the broader water allocation,
pricing and institutional framework for
multiple-use systems, and to ensure that
irrigation water supplies are not jeopardized.
• Fit irrigation design and management into
a holistic framework. Irrigation practices
must be in support of natural-resource
management and integrated watershed
management, and more emphasis must be
placed on impacts of irrigation schemes on
downstream water quality. This will mean
working with environmental regulators and
agencies to establish water-monitoring
networks and to develop environmental
management plans.
• Play a stronger role in managing
groundwater irrigation. Given concerns
about the injudicious pumping of
groundwater and the depletion of aquifers,
IFAD should place greater emphasis on
technical and institutional frameworks for
groundwater use in irrigation in order to
protect the resource and the terrestrial
and aquatic ecosystems that depend on
groundwater.
• Adapt to climate change, improve
water management in rainfed areas,
and adopt climate-smart practices.
Drought, water scarcity and desertification
will limit agricultural productivity. Therefore,
investments in climate-smart agriculture
should reflect funding of water conservation
and water reuse, and make use of new
sources of climate-resilient and green
corridor funds.
• Establish an IFAD study group on water
productivity. A study group on water
productivity should identify the exact causes
of low irrigation efficiencies by region,
and define a package of technological
improvements for enhancing efficiencies.
In addition, the study group could use data
from the Performance Management System
for various IFAD water/irrigation projects to
quantify both physical water productivity and
economic water productivity for selected
projects, and determine the scope for
possible productivity increases.
Technological innovations
These recommendations pertain to all regions
and are prioritized as follows:
High priority
• Promote water-saving technologies.
These technologies include, among others,
improved on-farm water management,
land levelling, and drip and microsprinkler
irrigation. They can be combined with
conservation agriculture and climate-smart
agriculture to reduce greenhouse gas
emissions and sequester soil carbon.
• Control soil salinity in arid and semi-arid
areas. Mitigation measures are required in
order to prevent and control soil salinity in
both irrigated and rainfed schemes.

119
PAR
T II
IC
hap
ter
10/
• Introduce irrigation scheduling
techniques. Simple soil moisture sensors
and weather stations installed in irrigation
districts with support from WUAs can help
conserve water and improve water-use
efficiency.
• Investigate the potential for water table
control/subirrigation. This technology is
especially suited to lowland and river valley
irrigation developments, particularly when
adopted by several farmers in a drainage/
irrigation district.
Lower priority
• Examine new models for allocating and
delivering water. This includes shifting from
a supply-driven irrigation system to one
that is demand driven. To reduce current
problems of over- and under-irrigation,
existing irrigation systems will need to be
re-engineered as part of investments in
irrigation modernization.
• Use modern water assessment models.
Apply integrated decision-making platforms
comprising climate forecasting models,
geographic information systems (GIS), and
hydrological and crop models to assess
water availability and water allocations for
irrigation project designs.
• Apply new irrigation sensor technologies
for precision irrigation management.
This involves the use of automated weather
stations, soil sensors, and remote sensing
of soil, climate and crop stress to schedule
irrigation, thereby conserving water and
improving water-use efficiency.
Value chain development
These recommendations pertain to all
geographic regions and are of equal importance:
• Tie irrigation investments more closely
to value chains. Appropriate business
models need to be developed, and each
project will need to be designed to fit the
marketing situation, institutional and financial
circumstances, and stakeholder interests.
• Place increasing emphasis on
private-sector involvement. Apart from
in sugar cane outgrower schemes, there
appears to be limited larger private-sector
involvement in irrigation value chains.
It will be increasingly important to engage
larger private-sector interests, through
the buyer-driven model or 4Ps, in order
to finance more costly infrastructure
investments of storage, transport, shipping
and logistics chains.
• Support the public-private-producer
partnership (4Ps) model. This model
allows farmers (or their representatives)
to participate more in securing markets,
engaging in contract negotiations and
obtaining fairer compensation.
• Use private-sector partnerships to
increase investments in agroprocessing,
cold storage, marketing facilities and
transportation. Existing projects invest
little in agroprocessing and other stages
of the value chain. These activities add
value to perishable, high-value horticultural
commodities.
• Partner with the private sector to provide
an integrated package of services.
These services range from selling irrigation
equipment and pumps to improved seed
availability, to fertilizer and other chemicals,
to soil nutrient testing, to agronomic advisory
services, and to value chain logistics, such
as transport, grading and packaging,
storage, agroprocessing and ultimately
high-end markets. This provides a one-stop
service for irrigators.
• Build stronger marketing information
systems in value chains. There is a weak
link between market demand and farmer
supplies. Most projects appear to lack strong
marketing information systems and market
intelligence, and this aspect should be
strengthened.
• Strengthen the linkage between the
irrigation water user associations and
marketing organizations. This can be a
natural link to enhance the producer-driven

120
value chain model, as the associations
comprise the irrigation farmers, and they
can operate within a legal and administrative
framework.
• Introduce new service providers and
financial models. These include agroclimate
agencies, mobile phone companies,
insurance companies, information
technology companies, digital banking,
e-wallets, venture capitalists, impact
investors and village-based microcredit
agencies, in order to support indigenous
entrepreneurial development of value chains.
• Build a new class of rural entrepreneurs,
and promote stronger gender and
inclusivity in irrigation value chains.
This would focus on capacity-building for
women and young people through targeted
hands-on, applied training programmes,
thereby enabling them to create jobs, wealth
and assets.
• Implement a robust monitoring,
evaluation and learning programme.
This is necessary in order to verify the
value chain approach and models, and use
lessons learned to make necessary course
corrections.
References
Amede, T. 2015. Technical and institutional
attributes constraining the performance
of small-scale irrigation in Ethiopia. Water
Resources and Rural Development, 6: 78-91.
Dukhovny, V. 2011. Water and food security in
Central Asia. In C. A. Madramootoo, ed. Water
management for global food security. Montreal,
Canada: McGill Institute for Global Food Security.
FAO (Food and Agriculture Organization of the
United Nations). 2016. The State of Food and
Agriculture: Climate change, agriculture and food
security. Rome.
Gao, X., Shi, Y., Zhang, D. and Giorgi, F. 2012.
Climate change in China in the 21st century as
simulated by a high-resolution regional climate
model. Chinese Science Bulletin, 57(10):
1188-1195.
Gunda, C., Gasasira, J., Sithole, S., Liversage,
H. and Jonckheere, S. 2013. Securing
smallholder farmers’ land and water rights and
promoting equitable land access in irrigation
and watershed management in Malawi, Rwanda
and Swaziland. Paper presented for the annual
World Bank Conference on Land and Poverty.
Washington, D.C.: World Bank.
Hanjra, M. A., Tadele, F. and Gutta, D. G.
2009. Reducing poverty in sub-Saharan Africa
through investments in water and other priorities.
Agricultural Water Management, 96(7):
1062-1070.
Heard, J., Porker, M., Armstrong, D., Finger,
L., Ho, C., Wales, W. and Malcolm, B. 2012.
The economics of subsurface drip irrigation on
perennial pastures and fodder production in
Australia. Agricultural Water Management,
111: 68-78.
Hussain, I. and Hanjra, M. 2004. Irrigation and
poverty alleviation: Review of the empirical
evidence. Irrigation and Drainage, 53(1): 1-15.
Madramootoo, C. A, Wiyo, K. A. and Enright,
P. 1992. Nutrient losses through tile drains
from two potato fields. Applied Engineering in
Agriculture, 8(5): 639–646.

121
PAR
T II
IC
hap
ter
10/
Müller, C., Elliott, J., Chryssanthacopoulos, J.,
Deryng, D., Folberth, C., Pugh, T. and Schmid,
E. 2015. Implications of climate mitigation for
future agricultural production. Environmental
Research Letters, 10(12): Article 125004.
Seville, D., Buxton, A. and Vorley, W. 2011.
Under what conditions are value chains effective
tools for pro‑poor development? Report for
the Ford Foundation. London: Sustainable
Food Laboratory and International Institute for
Environment and Development.
Sezen, S. M., Celikel, G., Yazar, A., Tekin, S. and
Kapur, B. 2010. Effect of irrigation management
on yield and quality of tomatoes grown in
different soilless media in a glasshouse. Scientific
Research and Essays, 5(1): 41-48.
Verge, X. P. C., De Kimpe, C. and Desjardins, R.
2007. Agricultural production, greenhouse gas
emissions and mitigation potential. Agricultural
and Forest Meteorology, 142(2): 255-269.
Walker, W. 1989. Guidelines for designing and
evaluating surface irrigation systems. FAO
Irrigation and Drainage Paper No. 45. Rome:
Food and Agriculture Organization of the United
Nations.
Wanvoeke, J., Venot, J. P., De Fraiture, C. and
Zwarteveen, M. 2015. Smallholder drip irrigation
in Burkina Faso: The role of development
brokers. Development Studies, 52(7):
1019-1033.
World Food Summit. 1996. Rome Declaration
on World Food Security and World Food Summit
Plan of Action. Rome: Food and Agriculture
Organization of the United Nations.
You, L., Ringler, C., Wood-Sichra, U., Robertson,
R., Wood, S., Zhu, T., Nelson, G., Guo, Z. and
Sun, Y. 2010. What is the irrigation potential
for Africa? A combined biophysical and
socioeconomic approach. IFPRI Discussion
Paper No. 993. Washington, D.C.: International
Food Policy Research Institute, Environment and
Production Technology Division.

122
The possibility of achieving inclusive and
sustainable rural transformation is determined
in large part by the policies that national
governments put in place and implement.
Thus, the policy framework can have a
dramatic impact – positive or negative – on the
opportunities open to rural men and women.
IFAD recognizes that it has a key role to play
in shaping the policy framework in its Member
States, drawing on its specialized expertise
to promote enabling country-level policies for
rural people. For this reason, beyond the more
traditional activities embedded in IFAD’s lending
programme, an increasing number of loans have
the specific objective of engaging in country-level
policy, to enable poor rural men and women
and their organizations to participate in policy
processes, to stimulate the production and use
of evidence for policy processes, and to enhance
the policy capacity of governments.
Today, it is widely understood that projects alone
cannot eradicate rural poverty or generate rural
transformation because, inevitably, they reach
a limited number of people. However, projects
can serve as a space in which to innovate and
experiment with new possible policy solutions.
Moreover, by feeding the lessons learned back to
local, national and international actors, projects
can also be a lever for influencing public policies
and national-level programmes, thus bringing
about systemic change. Policy engagement
can serve the more immediate purpose of
improving the impact of IFAD’s projects as well.
Implementation of projects may be constrained
by a mismatch between the project objectives
and the policy framework, or a gap between
the policy and its implementation. Therefore,
addressing policy bottlenecks or weaknesses
in policy implementation can help to create an
enabling environment for project implementation,
thereby improving the chances that outcomes
are realized, and development impacts achieved.
IFAD has defined country-level policy
engagement (CLPE) as a process in which the
Fund can collaborate, directly and indirectly, with
partner governments and other country-level
stakeholders to influence policy priorities or
the design, implementation and assessment of
formal policies that shape the opportunities for
inclusive and sustainable rural transformation.
It is a broad definition that is rooted in an
understanding of a “policy cycle” and one that
enables a relatively broad range of activities
to be considered as contributing to a policy
engagement agenda. IFAD’s approach is to
facilitate, support and inform nationally owned
policy processes so as to enable governments
and other national stakeholders themselves
to determine the policy change required. Its
approach is characterized by building national
capacities for dialogue and the design,
implementation and assessment of policies, and
by bringing evidence to those processes where
appropriate and useful. It includes, but goes
Assessment of IFAD’s policy impact in four countries in Asia
Chapter 11
by
Anna McCord
Edward Heinemann
Lauren Phillips

123
PAR
T II
IC
hap
ter
11/
beyond, policy dialogue. IFAD does not impose
policy change as a condition for its support for
investment projects, and rarely does it seek
specific policy change.
In 2016, as part of a broader series of activities
aimed at facilitating a consistent approach to
monitoring and evaluating its CLPE efforts, IFAD
commissioned a study to assess the impact of
its policy engagement on policy change in four
countries in the Asia and the Pacific region.
This chapter is based on the findings of this
review (McCord, Heinemann and Phillips, 2018).
The study had three objectives:
• Review the experience of sampled IFAD
CLPE activities associated with five
IFAD-supported projects in four countries
(India, Indonesia, Nepal and Viet Nam), and
analyse their outcomes and impact.
• Identify the factors that contributed to these
outcomes and those that limited success,
drawing out lessons for future policy work.
• Propose a credible, cost-effective and
replicable methodology that can be used to
undertake similar exercises.
Methodology
The study was implemented by a two-person
team comprising an international evaluation
and policy specialist, and a national expert in
the area of agricultural policy under review. The
case study countries and CLPE interventions for
review were selected to focus on activities linked
to policy development, policy outcomes or policy
implementation, in line with the IFAD definition of
CLPE, as part of a narrative that identifies IFAD
as a contributing agent in that change.
A methodology was devised to enable a rapid
review of a single CLPE case study in each of
the four countries. This entailed a two-phase
process. First, in each country, the national
expert prepared a background report providing
summary information on IFAD programming and
the case study CLPE intervention, with guidance
from the IFAD country office. This report included
a statement of the IFAD contribution narrative,
which articulated IFAD’s perception of the impact
of the intervention under review on national policy
and formed the hypothesis to be tested during
the second phase. It also identified potential key
informants from across a range of sectors who
were knowledgeable about the policy process
under review. The national expert then arranged
an interview schedule for the research visits.
Second, once this preparatory phase had been
completed, the review team (the international
consultant and the national expert) made
five-day research visits to each country. In three
of the four countries, the research took place
exclusively in the capital, although in India
both the capital and the state were visited.
The research visits started with an orientation
session with IFAD staff that covered the national
programme, the programme associated with
the CLPE, and the CLPE activity itself, including
the IFAD contribution narrative under review.
A bellwether approach was adopted, using
semi-structured interviews to explore the CLPE
intervention and the policy-related change under
review. This entailed interviewing 15-30 of the
previously identified informants in each country,
drawing on civil servants, politicians, civil society
representatives, international development
partners, academics and media actors.
In cases where IFAD was mentioned as a
driver or contributor, the research team sought
evidence in support of this assertion. When it
was not mentioned as such, they probed the
context and sought evidence to identify and
assess the relative importance of other drivers,
as well as asked questions in order to assess
the informant’s knowledge and perception of
IFAD. To elicit further insights, open-ended
questions regarding IFAD’s role in relation to
the broader policy debate and its potential
contribution were also asked. This approach
to identify the main drivers of a change in
discourse or policy did not in all cases identify
IFAD as a factor, and thus not all cases were
consistent with the IFAD narrative. The review
team reviewed findings after each interview and
analysed the set of responses overall in order
to appraise CLPE performance in relation to
the IFAD change narrative, and also to explore
the specific questions set out in the terms of

124
reference. The findings were validated with IFAD
country staff at the end of the research period
where possible. A final review team workshop
was held to finalize the findings, which were then
shared with the IFAD country staff in draft format
for verification.
The methodology adopted could not provide any
formal scoring of CLPE performance to allow
for geographical or intertemporal comparisons.
However, it did provide insights and draw out
nationally and internationally relevant themes that
could not be extracted using more quantitative
or formal approaches. The approach also had
the advantage that it could also be applied
consistently, despite the extreme differences in
the case studies under review. Finally, because
the methodology relied on interpretation and
synthesis by the authors and was influenced by
the selection of informants, there was a degree
of subjectivity to the findings. However, extensive
discussion and triangulation were used to
minimize this challenge.
Nepal: Transforming an IFAD‑financed pilot into a national programme for leasehold forestry
The IFAD-supported projects associated with
the policy engagement experience under review
were the Hills Leasehold Forestry and Forage
Development Project (1992-2002) and its
successor, the Leasehold Forestry and Livestock
Programme (2005-2014). IFAD introduced
these projects to address the lack of a pro-poor
dimension in the community forestry approach
prevalent in Nepal. The initial Hills Leasehold
Forestry and Forage Development Project
programme did not have a policy engagement
agenda. However, CLPE relating to leasehold
forestry is consistent with the strategic goal of
the 2013-18 Country Strategic Opportunities
Programme (COSOP), which explicitly includes
policy engagement objectives relating to the
programme in Nepal overall and to leasehold
forestry in particular. These policy objectives
include incorporating farmer participation in local
and national policy processes, and promoting
policymaker capacity and programme innovation.
Over a sustained period covering two projects,
IFAD made the case for pro-poor leasehold
forestry. It identified a programming and policy
gap, and financed a pilot and a follow-up project
to demonstrate the potential role of leasehold
forestry in rehabilitating land and creating
institutions to represent the most marginalized.
The projects’ most innovative feature was the
handing over of degraded forestland to the
poor, together with the introduction of livelihood
improvement planning. These steps helped
raise people’s incomes through commercial
agricultural and livestock farming. Despite
the 1996-2006 insurgency, which severely
hindered programme implementation and policy
engagement, the successive leasehold forestry
projects supported by IFAD demonstrated
the leasehold forestry concept, and showed
that transferring land with degraded forests
to the poor could both reduce poverty and
reforest the hills. The projects also showed
that this approach could empower women and
reduce the time they spent collecting fuelwood
and fodder.
The two leasehold forestry programmes also
created platforms for dialogue at local and
national levels, as well as institutions to facilitate
poor people’s representation and participation
in forestry dialogue. These institutions included
local farmer-based institutions, notably leasehold
forestry user groups and cooperatives, and
village financial institutions, which were
subsequently used by other government and
development partner projects to replicate
and adapt the leasehold forestry models.
The projects had a significant effect on land
rehabilitation and poverty. They addressed
the pro-poor deficit in the community forestry
discourse dominant in the 1980s and 1990s, and
the fact that within this dominant approach “the
voice of the poor was not heard” (former district
forestry officer). IFAD support for CLPE relating
to leasehold forestry ceased after programme
funding came to an end in 2014, despite the
priority status it was given in the COSOP.

125
PAR
T II
IC
hap
ter
11/
IFAD played a catalytic role in promoting
leasehold forestry within Nepal. It established the
concept of pro-poor leasehold forestry, which
combined agriculture, forestry and livestock. The
projects developed a model that later influenced
legislation and government structure. Before the
intervention, the concept of leasehold forestry
was not widely accepted, and was poorly
addressed in national forestry sector policy
and legal instruments. A number of legal and
technical hurdles delayed the process (including
a lengthy process of handover of leasehold
forestry to centralized authorities at the Ministry
of Forests and Soil Conservation, and the
long-standing prioritization of community over
leasehold forestry). However, the amendment
of the Forests Act (1992) in early 2017 finally
resolved the legal barriers restraining leasehold
forestry implementation. Under the amendment,
leasehold forestry has technical parity with
community forestry, the legal authority to issue
lease certificates has been decentralized,
and provisions integrating leasehold forestry
into community forestry have been enacted,
with leasehold forestry formally identified as
a mechanism for implementing the national
community-managed forestry system. As such,
leasehold forestry has been institutionalized in
the forestry sector, and the National Planning
Commission has officially recognized the role
of leasehold forestry by giving it Priority 1
programme status, which should mean that
it will be mainstreamed by donors working
in interventions related to forestry and
poverty alleviation.
In addition, the leasehold forestry concept
has been widely replicated in other parts of
the country. It has influenced the design of
subsequent IFAD-financed projects and informed
the leasehold forestry components of a variety
of interventions by other development partners
(DPs). Support for leasehold forestry by the DP
community largely occurred after 2007, when
Australian support to the forestry sector came to
an end. Before this, the position of most donors
was in conflict with IFAD’s leasehold forestry
position, and it was only after a ten-year struggle
with the donor community that leasehold forestry
was recognized as a successful model. As one
key informant stated, before IFAD “there was
nothing in the policy [about leasehold forestry],
we did not know how to do it – we were starting
from zero” (former district forestry officer).
Achieving these outcomes is particularly
significant given that IFAD is not a major player
in Nepal’s donor context in terms of the size of
its programme or its country representation.
It had not participated in the development of
community forestry programming in Nepal, but
joined the forestry debate later, championing
the concept of pro-poor leasehold forestry.
Moreover, the leasehold forestry model initially
met strong opposition from the forestry DPs,
which were committed to promoting community
forestry. The DPs and the government accepted
leasehold forestry only after a decade of
successful project implementation. Thus, IFAD
was obliged to work alone in the initial decade of
this initiative.
India: Approaches to community‑based resource management for scaling up
The North Eastern Region Community Resource
Management Project for Upland Areas
(NERCORMP) – a government project that was
supported by IFAD – aims to transform the
lives of poor and marginalized tribal families in
selected districts of three states in the North
Eastern Region of India. It seeks to do so
through improved and environmentally sound
management of their resource base. CLPE is not
formally mentioned in the NERCORMP project
design report or the associated logframes, and
neither phase had explicit CLPE objectives or
activities. In addition, the 2010-2015 COSOP
contained no CLPE objectives relating to the
NERCORMP intervention. However, the project
offers some successes and lessons on CLPE.
IFAD had limited contact with government
actors both nationally and regionally relating to
NERCORMP. During annual loan reviews, there
was limited space for CLPE with Delhi-based
policymakers, given that NERCORMP was

126
only one of multiple projects under discussion.
Annual IFAD supervision missions to the North
Eastern Region provided a greater opportunity
for policy-related contact, through government
officials’ participation in the missions and the
debriefing process to the North Eastern Council,
but neither was strategically used to promote
CLPE. As such, IFAD was perceived by those
involved as not advocating for the project,
resulting in missed opportunities to celebrate
achievements and share innovations arising from
the project more widely within the North Eastern
Region and beyond in other areas of the country
where conventional project implementation
modalities were not viable. IFAD instead
allowed NERCORMP successes to “speak for
themselves”, an approach that was consistent
with the COSOP statement that advocacy was
not part of IFAD’s role. This stance also reflected
the fact that NERCORMP is a government
programme, from which the government
itself learns directly, arguably rendering IFAD’s
engagement in policy dialogue redundant.
Nonetheless, the outcomes of the NERCORMP
intervention, in terms of policy impact in its
broadest sense, were fourfold:
• Contributing new modalities for
programme implementation: NERCORMP
had multiple influences in terms of community
mobilization and participation processes,
NGO participation, and the creation of
community institutions. Subsequent
IFAD-supported projects and other DP
and government programmes adopted or
replicated these approaches, as did national-
and state-level government programmes
implemented in the region. The project
also mainstreamed women’s participation
in community decision-making, promoted
natural resource management and community
ownership of a livelihoods agenda, and
engaged NGOs in offering alternative
institutional options for programme delivery
in addition to government departments. All
these ideas were subsequently adopted in
government programming in the region.
• Promoting convergence: Convergence
involves harmonizing diverse government
development interventions to increase
impact and promote efficiencies in delivery,
an agenda that is central to the policy
debate in the North Eastern Region. The
IFAD innovations contributed directly to
convergence by harmonizing programme
delivery for key community institutions and
processes. One example is the adoption
of NERCORMP-created institutions and
processes by the national employment
guarantee scheme.
• Promoting government buy-in, scaling up
and sustainability: The central government
funded the NERCORMP Secretariat directly
during the unfunded period between the
first and second phases. It did so in order
to prevent staff attrition and protect the
investment made previously. The government
used the second loan to expand the
geographical coverage of NERCORMP, while
a third phase exclusively funded by the North
Eastern Council is currently being initiated,
indicating programme sustainability.
• Creating technical assistance capacity:
In recent years, the NERCORMP Secretariat
has been taking on a role as a regional
resource, providing technical assistance
for project implementation. Formalization
of this role is currently under discussion.
The NERCORMP Secretariat is expected
to become a government-financed regional
resource centre to provide technical
assistance for programme management
and implementation, thereby capturing
NERCORMP implementation experience as a
resource for the region.
Thus, although CLPE was not part of the
NERCORMP concept, the project successfully
devised new ways of delivering “development” in
a resource-poor and remote region. Because its
success was recognized by key officials, it was
replicated and expanded, and other states and
donor programmes adopted key programme
components. NERCORMP delivery models were
also used in other government programmes.
In the absence of a policy agenda, it was the
spontaneous transmission of knowledge about
the programme, derived from programme

127
PAR
T II
IC
hap
ter
11/
experience (the programme “speaking for itself”)
that led to these positive outcomes, and IFAD
presents this as an indicator of successful CLPE.
However, if IFAD had had a policy engagement
agenda at the design stage and had actively
mandated IFAD personnel to engage in CLPE in
support of the programme, it is probable that the
impact could have been greater in terms of policy
influence, with impacts beyond the three states in
which the programme was implemented.
Indonesia: Informing the government’s approach to implementing the Village Law
From 2009 to 2014, IFAD piloted and cofinanced
the agriculture component of the National
Programme for Community Empowerment
(PNPM) in Papua and West Papua. The
objective of the larger PNPM was to reduce
poverty and improve local-level governance and
socio-economic conditions in rural Indonesia.
The agriculture component aimed to improve
agricultural livelihoods by developing new models
of participatory community participation in
development planning and resource allocation,
and in this way influence PNPM implementation.
Following elections in 2014, the new government
suspended the project, along with all similar
programmes, as it sought to move away
from the PNPM. In its place, the government
focused on implementing the Village Law, a
national policy that promotes the autonomy of
villages and serves as a framework for village
development and community empowerment.
Villages are allocated resources, which they
manage through participatory community
development plans. In 2016, the government
invited the agriculture component to restart
programming in Papua and West Papua, and to
advise on modalities for improving participatory
planning in the national implementation of the
Village Law. This represented an opportunity
for the component to draw on its initial
implementation experience to create a model for
livelihood activities related to infrastructure and
related economic activities, using participatory
community development and trained facilitators
drawn from the local community. As of 2016,
the objectives of the CLPE were to successfully
implement the second phase of the agriculture
component of the PNPM in Papua and West
Papua, and to promote the nationwide adoption
of innovations to help villages select appropriate
economic infrastructure and ensure the provision
of technical support, resulting in improved
livelihoods. These are the aspirations against
which future achievements should be appraised.
IFAD was able to be opportunistic, capitalize on
successful institutional repositioning, and engage
in responsive ad hoc CLPE. It built on the
success of a programme that largely “spoke for
itself”, and drew the government’s attention as a
potential model for Village Law implementation.
It is premature to assess the sustainability of
the outcome of the CLPE initiative, as PNPM
implementation in Papua and West Papua has
only recently recommenced. Whether IFAD can
capitalize on the invitation to influence national
implementation will depend on its capacity
to mobilize appropriate technical assistance.
However, the invitation to provide inputs, which
brought an IFAD pilot to the national agenda,
may itself be taken as a CLPE success. Whether
the IFAD-supported agriculture PNPM will
have broader influence and affect Village Law
outcomes in the medium or long term remains
to be seen. Equally, it is not known whether the
government will continue to fund the Village Law
investment in infrastructure, which is at the heart
of the IFAD model beyond elections in 2019.
This case study offers three main insights: (1)
evidence of programme outcomes can be less
important in driving CLPE than institutional
relationships, project exposure and perceptions
of programme performance; (2) effective
processes for engagement can be as important
for success as final programme outcomes; and
(3) access to financial and human resources and
programming flexibility are key to responsive
programming and opportunistic engagement.
These results reflect the non-linear relationship
between policy and evidence that has been
documented in Indonesia and elsewhere (see
McCord, Yablonski and Winder Rossi, 2016).

128
Viet Nam: Supporting the National Targeted Program on New Rural Development (NTP‑NRD)
IFAD supports the market-oriented participatory
socio-economic development planning
(MOP-SEDP) component of Viet Nam’s National
Target Program on New Rural Development
(NTP-NRD). The NTP-NRD is a national
programme implemented in 9,071 communes
to consolidate the multiple social, economic,
cultural and political interventions taking place
there. The New Rural Development (NRD)
approach seeks to promote community
ownership of key development processes at the
commune level alongside government policy
orientation and support.
In 2013, in preparation for the second phase
of the NTP-NRD (2016-2020), the government
approached key DPs, including IFAD, seeking
support and financial assistance for expanding
the NRD rollout. In response, the DPs proposed
carrying out a review of NTP-NRD performance
to date before making financial commitments.
The partners’ objective in this CLPE intervention
was thus to contribute to the formulation of the
second phase of the NTP-NRD, revising the
conceptualization and design to accommodate
a reduction in centralized control, with more
market and community engagement and
context-specific programming.
In late 2015, IFAD worked with the World
Bank to conduct a detailed assessment of the
NTP-NRD strategy, reviewing its performance
and proposing recommendations for moving
forward – drawn in part from IFAD programme
experience. The assessment confirmed
the NRD’s contribution to socio-economic
development in rural Viet Nam in terms of rural
infrastructure and services, but concluded that
it had done little to promote rural economic
transformation. For the second phase of the
NRD, it identified the need to invest in planning,
investment modalities and monitoring, and
it recommended using more flexible and
context-specific performance criteria to assess
performance. It also called for a greater role for
community-level planning and decentralization
in place of the top-down socio-economic
development planning process from the district
to the commune level. The IFAD-supported
MOP-SEDP was put forward as a model of
participatory commune-level planning that could
be adopted.
The recommendations from the IFAD/WB
assessment were presented in March 2016 at a
workshop co-hosted by IFAD and the National
Office of the NTP-NRD. Workshop participants,
including key representatives from government
and DPs, agreed to the recommendations, and
the government charged the National Office
of the NTP-NRD to use those findings and
recommendations as inputs into the design
of the second phase of the NRD. Many of the
recommendations were subsequently endorsed
in the Prime Minister’s Decision 1600/QD-TTg
– notably, the implementation of agricultural
restructuring to develop value chains for high
added value and sustainable development, and
the shift from 19 fixed performance criteria to a
smaller number to be applied flexibly depending
on local context. To advance the assessment
report’s recommendations on strengthening NRD
monitoring and evaluation in phase two, IFAD
provided a grant for technical assistance to the
NRD National Office, starting in December 2016.
In February 2017, the Ministry of Planning and
Investment issued the Draft Circular on Manual for
Participatory Planning at Commune Level under
the Implementation of NTP-NRD, using evidence
from the MOP-SEDP along with other DP
interventions. The intervention served to further
consolidate IFAD’s relationship with the national
NRD implementing agency, and to position
IFAD for further engagement in developing
future monitoring and evaluation aspects of the
NTP-NRD. These are results that in themselves
may be perceived as positive CLPE outcomes.
In terms of the overall impact of the CLPE activity,
a view outside IFAD is that the changes outlined in
the Prime Minister’s Decision 1600/QD-TTg would
have occurred regardless of the intervention
because the government already recognized the
need for policy revision. This may be true, but it is
also the case that the evidence provided through

129
PAR
T II
IC
hap
ter
11/
the study facilitated this process. It is also possible
that the intervention could have had a greater
impact if it had extended the existing discourse
into new areas and provided an agenda for more
progressive programming and policy change,
based on a longer-term engagement in the policy
debate and deeper engagement in the political
discourse. However, the political feasibility of this
approach is open to question.
Informants perceived several untapped
opportunities for constructive CLPE, such
as greater sectoral collaboration by donors,
potentially under IFAD leadership. Informants
also noted that IFAD could also play a larger
role in central-level policy discussions related
to promoting smallholder agriculture within the
NTP-NRD, drawing on areas of IFAD expertise
and experience. This is a critical area in which
few DPs with access to significant resources
are working and where informants identified
important gaps. Closing these gaps would involve
providing ongoing support to the working group
on smallholder farming that IFAD had initiated,
participating regularly in and supporting the donor
policy forum, and creating strategic initiatives
among like-minded agencies.
Overall, this review identifies CLPE in Viet Nam
as an appropriate investment for IFAD at this
juncture. Government policies are in flux, and
the country is exploring market mechanisms.
However, there is a lack of investment, technology
and markets, and there is a need to support
the use of markets by farmers. As Viet Nam
undergoes significant economic change,
becoming an increasingly important exporter,
there is potential for IFAD to support Viet Nam
given its comparative advantage in the area of
smallholder farming. Viet Nam is currently open
to the provision of counterparts, consultants
and policy inputs in support of decentralization
and market-based development, and support
in this area may be more relevant now than
project-based support. Referring to the current
need for institutional reform at the grass-roots
level and for policy change at the central level,
one informant stated: “Now is not time for projects
but for policy.”
Conclusions and way forward
The variety of outcomes highlighted in the four
case studies illustrates the different functions
of CLPE. On the one hand, CLPE can create
opportunities for increased IFAD engagement,
in which case it is essentially instrumental – it
positions the agency for future engagement,
resulting in requests for technical assistance
(as in Indonesia and Viet Nam). On the other
hand, CLPE can lead governments and DPs
to adopt innovative IFAD-financed policy or
implementation models (as in India and Nepal).
It is useful to divide the activities reviewed in this
report into two distinct CLPE approaches. The
first is direct and active engagement by IFAD
staff, carried out to complement programme
activity. The second is indirect CLPE, where
programmes “speak for themselves” by
demonstrating the success of implementation
modalities or policy innovation (which may
be described as indirect CLPE). The studies
reviewed here include both approaches,
although the majority of CLPE resulted from
programme performance, and only a small
number of CLPE activities were directly carried
out by IFAD staff.
Analysis of the four case study interventions
identified a number of common factors
affecting CLPE performance. Above all, there
are clear tensions between IFAD’s in-country
staffing levels, financing modalities, operational
instruments and historic mandate on the one
hand, and increased CLPE activity, including the
facilitation of domestic national policy discourse,
on the other. In the case study countries, IFAD
does not have the resource base needed to
participate in ongoing policy discourses or
to carry out significant direct CLPE requiring
IFAD staff engagement. As a result, IFAD has
focused on indirect policy engagement related
to its implementation models, drawing on
IFAD’s specific institutional competence and a
key aspect of IFAD programming. Elsewhere,
this approach might not be considered policy
engagement, given that it is not directly linked
to either engagement or policy. It might more
typically be considered good development work
and provision of good models for development

130
processes, which are recognized and then
replicated and scaled up by governments and
DPs, and in other IFAD programmes.
Despite these constraints, some direct CLPE did
take place. In Viet Nam, the country programme
manager (CPM) and a consultant reallocated
staff time and used additional funds to overcome
the resource constraints outlined above. They
directly engaged in CLPE, and their focus on
general institutional repositioning using existing
CPM resources encouraged the government
invitation to extend programming. Overall,
however, IFAD’s institutional structure limited the
potential for active, explicit policy engagement in
each of the case studies.
If IFAD seeks to play an increased role in
CLPE, in line with an extended mandate that
incorporates policy engagement alongside
programme implementation, it will need to: make
changes to its resource allocation modalities and
country-level programming practices; increase
both its financial and human resources at the
country level; and provide additional support
from IFAD headquarters in Rome. IFAD policy
engagement is unlikely to yield significant results
unless country offices, which are currently
engaged primarily in managing loan and project
portfolios, are provided with these additional
resources and skills. As such, increased CLPE
implies an associated realignment of human,
financial and procedural resources within the
institution. The key question is the extent to
which this can be accommodated within IFAD’s
existing business model and funding modality.
References
McCord, A., Yablonski, J. and Winder Rossi, N.
2016. The political economy of cash transfer
evaluations. In B. Davis, S. Handa, N. Hypher,
N. Winder Rossi, P. Winters and J. Yablonski,
eds., From evidence to action: The story of cash
transfers and impact evaluation in Sub Saharan
Africa. Oxford: Oxford University Press.
McCord A., Heinemann E. and Phillips L. (2018).
Exploration of a methodology for assessing the
impact of policy engagement: what impact and
how to assess it? IFAD Research Series 26.
Rome: IFAD.
131
PAR
T II
IC
hap
ter
12/
It is widely acknowledged that agricultural
research has played a key role in improving rural
livelihoods in the developing world (Thirtle, Lin
and Piesse, 2003). Donors and governments
have invested heavily in agricultural research
institutions, particularly the Consultative Group
on International Research (CGIAR) and its
network of research centres and partners.
Specifically, IFAD funded many CGIAR
improved-seed interventions from 2007 to 2014
through its grant-funding programme. However,
at a time when some donors are increasing
pressure on development institutions to show
evidence-based results, the causal linkages
between agricultural research, poverty reduction,
and welfare, and other development outcomes
more broadly, have not been sufficiently and
convincingly demonstrated (Renkow and
Byerlee, 2010). This has cast doubt on the
effectiveness of CGIAR’s investments and those
of its donors.
A large literature has documented substantial
pro-poor impacts resulting from international
agricultural research and development generally,
and from CGIAR-led research in particular
(Thirtle, Lin and Piesse, 2003; Adato and
Meinzen-Dick, 2007). However, this “impact”
literature has focused only on aggregate returns
and on the efficiency of research investments,
neglecting a thorough examination of the
possible causal impacts of technology adoption
on poverty reduction. To date, only two reviews
– Fan et al. (2007) and Alene et al. (2009)
– have sought to quantify impacts on poverty,
and specifically movements out of poverty.
The first study examined the macroevidence of
the impact of modern rice varieties developed
by the International Rice Research Institute on
poverty in China and India. The study found that,
between 1981 and 1999, the institute’s research
contributed to moving more than 6.75 million
Chinese out of poverty. In India, 14 million people
exited poverty between 1991 and 1999. Alene
et al. (2009) estimated that improved maize
seed adoption in West and Central Africa moved
740,000 people out of poverty annually, with the
rate of exit increasing over time.
Relative to global assessments, CGIAR
system-level assessments date back to
Anderson (1985). Nelson and Maredia (1999),
Evenson and Gollin (2003), Maredia and Raitzer
(2006), and Raitzer and Kelley (2008) have
validated the perception that the CGIAR has
had, over its lifetime, a sustainable impact on
poor people by helping to develop technologies
and agricultural management tools that have
increased food security and dramatically lowered
the cost of producing the world’s major staple
food crops. However, this perception has not
been supported by a rigorous appraisal of the
The impact of adoption of CGIAR’s improved varieties on poverty: a systematic review
Chapter 12
by
Alessandra Garbero
Pierre Marion

132
“counterfactual”-based evidence available to
date – that is, rigorous impact evaluations from
the CGIAR centres.
This study aims to fill this gap. To this end,
a systematic review was conducted and
a quantitative synthesis was performed to
assess the poverty and welfare impacts
of the adoption of improved seed varieties
developed and disseminated by CGIAR from
2007 to 2015. The study used meta-analysis
to compute the global estimate of the impact
of agricultural research on poverty reduction
and intermediate outcomes such as income
and expenditure. A meta-analysis is a powerful
technique that allows one to summarize the
quantitative evidence on intervention effects
from different environments in a comprehensive
and unbiased way. Compared with traditional
ways of aggregating research results, such as
vote counting, which do not remove the risk of
purposively selecting studies based on subjective
criteria, meta-analyses are scientific. They
take into account precision, sample size, the
magnitude of the effect, and the research design.
The rationale for this study of CGIAR
interventions is IFAD’s large investments in
CGIAR’s improved seed variety interventions
over the period. Out of the 95 grants provided
to CGIAR (equivalent to US$96.4 million), 30
(amounting to US$40.5 million, or 42 per cent
of the total amount provided to CGIAR in
grants) were allocated to improved seed
variety interventions.
Conceptual framework
When farmers adopt improved varieties, it
can lead to poverty reduction through several
mechanisms, both direct and indirect. Improved
seed varieties can generate gains in crop
productivity, raising farmers’ incomes and
subsequently reducing poverty (direct impacts).
Improved varieties can also benefit both adopting
and non-adopting households by increasing
employment opportunities and wages, and by
lowering food prices as a result of the rise in
agricultural production (indirect impacts).
This systematic review appraises and
quantitatively synthesizes the findings of studies
assessing the direct impacts of improved seed
varieties on the welfare and poverty of adopting
households. While these direct impacts can be
rigorously measured, evaluating indirect impacts
is more challenging because they affect both
adopting and non-adopting households, and
they depend on local market conditions.
In terms of direct effects, improved varieties
have characteristics that can lead to greater
agricultural production, on average, than
traditional seeds. The improved seeds have
higher yield potential, are more responsive to
fertilizer and irrigation, have shorter maturation
periods, have longer storage capabilities, are
more tolerant of environmental stresses, or have
a higher nutrient content.
For households that produce and sell on the
local market, higher agricultural yields at a
constant cost level may be associated with
greater income and greater profits. Similarly,
for subsistence households – which purchase
the food they need but cannot produce
– higher yields benefit farmers by reducing their
spending on food. Farmers may thus reallocate
expenditures away from food to assets, which
may further increase productivity. With higher
production, farmers can also enter local markets
to sell excess production (Irz et al., 2001; de
Janvry and Sadoulet, 2002). Thus, improved
varieties can reduce poverty through higher
yields for adopting households if the income gain
is large enough to allow them to exit poverty.
However, farmers’ access to markets may be
hindered by a rise in costs associated with higher
production, such as storage and transportation
costs. Moreover, as improved varieties are
disseminated, prices and costs in the food
market may change, leading to indirect impacts
in other markets. With higher potential income
gains, large landowners may have the incentive
to increase rents or to expand their cropped
area by cultivating land previously rented out,
thereby eliminating income gains for tenants
and increasing landlessness (Hazell and Haddad
2001). Increased income may not translate into
poverty reduction if, as often happens, credit

133
PAR
T II
IC
hap
ter
12/
is required to purchase improved varieties.
This credit may impose a significant financial
burden on poor households, and in the case of
a negative shock, debt repayments may instead
increase poverty (Diagne and Zeller, 2001).
Numerous external factors, such as political
instability or extreme climate shocks, may
also eliminate the productivity improvements.
Moreover, households may lack the education
and experience to adequately cultivate these
improved varieties.
Methodology
This study methodology begins with a systematic
review of studies that measured the poverty
and welfare impacts of adoption of improved
varieties developed and disseminated by
CGIAR in the period 2007-2015, and it then
employs a meta-analysis. In contrast with a
standard literature review, a systematic review
is a clear protocol for systematically searching
defined databases over a defined period, with
transparent criteria for including or excluding
studies, and with an analysis and reporting of
study findings (Hedges and Cooper, 1994).
The three steps required to perform a rigorous
systematic review are described below.
Step 1: Study selection
First, a search for all relevant studies was
conducted, following a strict protocol and
search strategy. The selection of studies was
governed by the so-called PICOS study selection
criteria (participants, interventions, comparison,
outcomes and study design). Studies were
included in the review when they satisfied the
following criteria:
• Participants: Participants were small
farmers growing food crops and living in any
country except in high-income economies.
They owned less than 2 hectares of land,
and agriculture was their primary source of
income. They also allocated a significant
proportion of their land to the growth of
food crops.
• Interventions/exposure: The studies
included were those that examined the
impact of adoption of modern seed varieties
on welfare outcomes. These modern seed
variety interventions had to be supported by
CGIAR institutes.
• Comparison: The impact needed to be
evaluated through real or reconstructed
control groups (the latter correspond to the
sampled households that did not adopt
improved varieties).
• Outcomes: Outcomes were poverty impacts
and/or estimates on intermediate monetary
development outcomes, such as income and
expenditure for adopting households.
• Study design: The studies included used
either a “microlevel” experimental study
design (whereby improved varieties were
randomly assigned to potential beneficiaries)
or a quasi-experimental study design
(whereby modern varieties were not
randomly assigned but groups of adopting
and non-adopting households could be
identified). Such study designs reduce the
risk of biased results.
The study search was conducted on the largest
relevant databases (Science Direct, Google
Scholar, the International Initiative for Impact
Evaluation’s impact evaluation database, the
CGIAR Standing Panel on Impact Assessment
publications, and the CGIAR Library). This search
strategy followed the methodology indicated
by Waddington et al. (2014) and Stewart et al.
(2015). For each of the above criteria, search
terms were chosen. Each search term from
the “interventions” criterion was inputted in the
database search and combined with a search
term of one or more criteria. For all databases,
the search was repeated in order to combine
all or most of the search terms from each
criterion. The bibliographies of included studies
and of existing systematic reviews on related
topics were also screened for completeness.
Finally, key researchers from the eligible studies
and colleagues working on impact evaluation
initiatives were contacted for additional
published and unpublished studies. Two analysts
independently performed this search. A third
analyst repeated this search to ensure that all
relevant studies were included.

134
Step 2: Critical appraisal of selected studies
The second step entailed appraising the
quality of each individual estimate presented
in each study. The framework summarized
in Waddington et al. (2014) was used to
structure the analysis. Studies were evaluated
based on the probable risks of bias (internal
validity or causal identification) and external
validity (generalizability of the study’s results).
Each paper was assigned a bias score, a
generalizability score and a total score (the sum
of the two previous scores). This step was highly
important as it assessed the reliability of the
studies’ estimates and the extent to which the
estimated impact of improved seed varieties
could constitute a reliable measure of the actual
causal impact.
Step 3: Meta-analysis
To perform a meta-analysis, the research team
computed standardized estimates across all
included studies. The final estimates were thus
expressed in terms of effect sizes. Response
ratios were chosen as the appropriate metric of
effect size. The response ratio is defined as the
ratio of the mean outcome for the households
adopting the improved varieties divided by
the mean outcome for the households not
adopting the improved varieties. It has the same
interpretation as a risk ratio: 1 is the point of
“no effect,” and any movement above or below
the “no effect” point represents a percentage
change in the adopting households’ outcome
compared with the non-adopting households.
For example, a response ratio of 1.3 translates
into a 30 per cent increase in the outcome
variable for the adopting households compared
with the non-adopting households.
Many studies provided several estimates as they
presented different methods and estimators.
To avoid double counting studies in the
meta-analysis, a single estimate was derived per
study. Following the discussion in Waddington
et al. (2014), the method with the lowest risk
of bias was chosen. Some methods were
considered unambiguously superior, and the
choice of the best estimate was straightforward.
22. Details on effect-size calculations for specific papers can be provided upon request.
This methodology also guided the selection of
the estimates when multiple studies existed (for
example, a working paper and a journal article
covering the same study by the same authors) or
when multiple studies were based on the same
dataset. However, other econometric methods
were more difficult to rank. Thus, a “synthetic
effect”22 was computed when the choice of the
best estimate was ambiguous. This synthetic
effect is based on the sample weighted average,
using the procedure described in Borenstein et
al. (2009), which calculates the variance and the
standard error of the estimate (these are both
measures of the spread in the magnitude of the
outcome variable across surveyed households
in each study). For papers that reported results
over several years of follow-up, the results were
reported for the most recent years. In papers
where subgroup analysis was conducted,
estimates were combined into a single number
as in Waddington et al. (2014).
The response ratios from each study can
therefore be combined using two meta-analytic
methods: (1) the fixed-effect model (where
studies are weighted in the meta-analysis only
according to the amount of information they
contain); and (2) the random-effects model
(where an estimate of between-study variation
is incorporated in the weighting). The choice
of model ultimately affects the distribution of
weights given to studies in the meta-analysis.
In the fixed-effect model, the main assumption
is that the true effect is the same across studies.
In a random-effects model, the true effect is
assumed to differ across studies. Under the
latter, each study presents new information that
is equally important, and therefore the weights
are more balanced across studies with varying
effect sizes. Given the fact that adoption of
improved varieties may have different impacts in
different settings, a random-effects model was
chosen to derive the final estimate.

135
PAR
T II
IC
hap
ter
12/
Results
Step 1: Study selection
Based on the search strategy, about 25,000
titles in the selected databases were screened.
The search strategy identified 21 studies for
inclusion in the systematic review. Of these,
16 were found initially, and the other 5 were
identified by screening the bibliographies of
included studies and of existing systematic
reviews. Out of these 21 studies, 7 study
poverty, while 12 report the effects on income
and 8 on expenditure outcomes over different
crops (rice, wheat, maize, bananas, chickpea,
pigeon pea and groundnut); some studies
examine more than one type of impact.
Step 2: Critical appraisal of selected studies
As described above, each study received three
scores: bias, generalizability and a total score.
None received the maximum score. For the bias
score, most studies suffered from selection bias
(e.g. selected households included in the sample
were not representative of the population). Many
papers chose non-adopting households that
were geographically close to adopting ones,
which may have produced spillover bias. One
subset of papers failed to report all outcomes
and omitted some necessary statistics. For
the generalizability score, many received lower
scores on rigour of analysis, context description
and data collection methods.
Step 3: Meta-analysis
A final aggregate estimate was computed and
provided a weighted average of all estimates
(response ratios), where each study was
weighted according to its variance (a measure
of the spread in the magnitude of the outcome
variable across surveyed households). Studies
that reported a more precise estimate carried a
larger weight than studies with lower precision.
The precision of the study estimate reflected the
sample size. However, it is important to note
that the weight does not reflect the validity of
methodology presented in the paper.
Figure 12.1a Results for poverty, disaggregated by region
.
.
Overall (I−squared = 83.9%, p = 0.000)
Smale et al. 2014 − Zambia
Khonje et al. 2014 − Zambia
Subtotal (I−squared = 84.6%, p = 0.000)
Subtotal (I−squared = .%, p = .)
Mendola 2007 − Nigeria
Simtowe et al. 2012 − Malawi
Kassie et al. 2011 − Uganda
Mathenge et al. 2014 − Kenya
Asia and the Paci�c
Asfaw et al. 2012 − Tanzania
East and Southern Africa
0.96 (0.91, 1.02)
1.00 (1.00, 1.00)
0.85 (0.50, 1.44)
0.97 (0.92, 1.02)
0.55 (0.32, 0.94)
0.55 (0.32, 0.94)
0.83 (0.33, 2.08)
0.90 (0.29, 2.75)
0.94 (0.93, 0.96)
0.78 (0.31, 1.95)
100.00
50.04
1.03
99.01
0.99
0.99
0.34
0.23
47.02
0.35
Decrease Increase .292 1 3.42
Note: Based on inverse variance weighting/dependent effect sizes removed.
IDStudy
Weight%
ES (95% CI)

136
Figure 12.1b
Figure 12.1c
Results for income, disaggregated by region
Results for expenditures, disaggregated by region
.
.
.
.
Overall (I−squared = 87.4%, p = 0.000)
Wu et al. 2010 − China
Wiredu et al. 2014 − GhanaSubtotal (I−squared = 0.0%, p = 0.972)
Nguezet et al. 2011 − NigeriaDibba et al. 2012 − Gambia
ID
Subtotal (I−squared = .%, p = .)
Mathenge et al. 2014 − Kenya
Subtotal (I−squared = 91.4%, p = 0.000)
Kikulwe et al. 2012 − KenyaKhonje et al. 2014 − Zambia
Subtotal (I−squared = 0.0%, p = 0.938)
Rovere et al. 2009 − Mexico
East and Southern AfricaSmale et al. 2014 − Zambia
Bezu et al. 2014 − Malawi
Latin America
Asia and the Paci�c
West and Central Africa
Kassie et al. 2011 − Uganda
Mendola 2007 − Nigeria
Study
1.35 (1.19, 1.53)
1.34 (1.16, 1.55)
1.51 (1.13, 2.03)1.50 (1.14, 1.98)
1.46 (0.60, 3.56)1.01 (0.03, 31.10)
ES (95% CI)
1.28 (0.99, 1.64)
1.07 (1.00, 1.14)
1.33 (1.14, 1.56)
2.38 (0.75, 7.61)2.75 (1.86, 4.07)
1.34 (1.17, 1.53)
1.28 (0.99, 1.64)
1.01 (1.00, 1.01)
1.62 (1.31, 2.00)1.47 (1.13, 1.90)
1.32 (0.96, 1.82)
100.00
13.11
8.5310.44
1.780.13
Weight
9.80
15.25
58.83
1.106.28
20.93
9.80
15.85
10.919.43
7.82
%
Decrease Increase
1.0322 31.1
Note: Based on inverse variance weighting/dependent effect sizes removed.
.
.
Overall (I−squared = 0.0%, p = 0.897)
West and Central Africa
Asfaw et al. 2012 − Tanzania
Subtotal (I−squared = 0.0%, p = 0.994)
Subtotal (I−squared = 0.0%, p = 0.953)
East and Southern Africa
Khonje et al. 2014 − Zambia
Adekambi et al. 2009 − Benin
Audu & Aye 2014 − Nigeria
Simtowe et al. 2012 − Malawi
Shiferaw et al. 2014 − Ethiopia
Debello et al 2015 − Ethiopia
Asfaw at al. 2012 (2) − Ethiopia
1.14 (1.12, 1.16)
1.36 (0.53, 3.53)
1.14 (1.12, 1.16)
1.49 (1.06, 2.10)
1.32 (0.66, 2.63)
1.41 (0.22, 8.89)
1.50 (1.06, 2.12)
1.18 (0.47, 2.96)
1.14 (1.11, 1.16)
1.15 (1.09, 1.20)
1.25 (0.68, 2.28)
100.00
0.04
99.66
0.34
0.08
0.01
0.33
0.05
82.14
17.24
0.11
Decrease Increase 1.112 1 8.89
Note: Based on inverse variance weighting/dependent effect sizes removed.
IDStudy
Weight%
ES (95% CI)
Source: Authors’ analysis.

137
PAR
T II
IC
hap
ter
12/
Figure 12.1 presents results by region. The
reported coefficients under the effect-size
column are the response ratios, representing
the percentage change between adopting
households and non-adopting households.
Figure 12.1 also reports the probable
range of the estimated impact (95 per cent
confidence interval) and the individual study
weight. The 95 per cent confidence interval
of both the subtotal and overall effect size is
represented by a diamond. Also reported is
the I-squared statistic, which describes the
percentage of variation across studies that is
due to heterogeneity (this refers to the variation
in study outcomes between studies). A higher
I-squared suggests large differences in effect
sizes between the studies. The p value provides
an indication as to whether one can consider
that all studies in the meta-analysis give a similar
effect size. A p value below 0.05 indicates that
it is very likely not the case. The numbers on the
horizontal axis delineate the range within which
the estimates are contained.
The forest plot shown in Figure 12.1a – a typical
representation of meta-analysis results – shows
that adoption of improved varieties resulted
in a 4 per cent decrease in poverty. However,
this estimate is not significant, owing both
to the paucity of the studies and to the large
imprecision of the reported study estimates.
The effect size for income indicates instead a
significant impact – about a 35 per cent increase
for adopting households relative to non-adopting
households, with the largest increase occurring
in West and Central Africa (50 per cent) (Figure
12.1b). Finally, results for the expenditure
outcome are also positive and significant (Figure
1c), with a 14 per cent increase on average, and
the largest increase being found in West and
Central Africa (49 per cent).
Conclusion and policy recommendations
In this systematic review, the aggregate direct
impact of CGIAR-related improved seed varieties
on welfare was synthesized across all regions
of the world for adopting households relative
to non-adopters. A systematic review protocol
was followed in order to find relevant studies
and appraise and quantify the direct aggregate
impact. The methodology encompassed three
steps: (1) a rigorous search of relevant studies;
(2) a critical appraisal of the selected studies;
and (3) a meta-analysis. A comprehensive search
led to a final sample of 7 papers for poverty
outcomes, 12 for income and 8 for expenditure
outcomes over different crops, and included
unpublished papers.
The meta-analysis findings showed that
adoption of CGIAR’s improved varieties has led
to statistically significant increases in income
and expenditures by 35 and 14 per cent,
respectively, for adopting households relative to
a valid comparison group. In addition, although
improved varieties may have reduced poverty
by 4 per cent, this finding is not statistically
significant, and therefore one cannot rule out
the possibility of no impact, given both the
paucity of studies and the large imprecision of
study estimates.
It is worth noting a number of limitations. First,
owing to a high risk of bias for some studies,
results may not be perfectly representative of
causal impacts. In addition, results may be
underestimated because of the period analysed
in some of the included impact evaluations.
The studies’ timespan may be too short to
fully capture the welfare impacts of improved
varieties or agricultural research in general, given
that such impacts may take several years to
occur. Finally, this analysis may be subject to
publication bias – that is, studies with negative or
low impacts may be less likely to be published or
available in the databases.
Nevertheless, some implications for policy can
be derived from this study. Barriers to access
to improved seeds may exist, preventing poorer
farmers from fully benefiting from the potential
of such technologies. The same structural and
contextual constraints to adoption emerge
across the included studies. These constraints
are related to: human capital endowments (the
education and experience of the household

138
head); access to knowledge and the technology
itself; information asymmetries (such as proximity
to the extension office and to markets, and
information about the technology in general);
financial and physical capital endowments (initial
assets, farm size, livestock holdings, and off-farm
income sources); social capital endowments
(group membership); and behavioural aspects
such as risk aversion. Given the potential for
strong welfare benefits for smallholder farmers,
policy interventions should aim at reducing
the many constraints that households face in
adopting improved varieties. More effort should
be made to increase the scale and efficiency
of agricultural extension services and input
supply systems. The studies included in this
analysis also point to the need for greater
investments in developing local markets and
road infrastructure in order to facilitate diffusion.
In addition, economic incentives for more
constrained farmers should be considered in
order to encourage early adoption and the use
of improved varieties; such incentives could be
packaged with technology development as part
of CGIAR research projects.
References
Adato, M. and Meinzen-Dick, R. 2007.
Agricultural research, livelihoods, and poverty:
Studies of economic and social impacts in
six countries. Baltimore, USA: Johns Hopkins
University Press.
Alene, A. D., Menkir, A., Ajala, S. O.,
Badu-Apraku, B., Olanrewaju, A. S., Manyong,
V. M. and Ndiaye, A. 2009. The economic and
poverty impacts of maize research in West and
Central Africa. Agricultural Economics,
40: 535-550.
Anderson, J. R. 1985. Assessing the impact
of farming systems research: Framework and
problems. Agricultural Administration, 20(4):
225-235.
Borenstein, M., Hedges, L. V., Higgins, J. P.
T. and Rothstein, H. R. 2009. Introduction to
meta‑analysis. Chichester, UK: John Wiley & Sons.
de Janvry, A. and Sadoulet, E. 2002. World
poverty and the role of agricultural technology:
Direct and indirect effects. Journal of
Development Studies, 38(4): 1-26.
Diagne, A. and Zeller, M. 2001. Access to credit
and its impact on welfare in Malawi. Research
Report 116. Washington, D.C.: International
Food Policy Research Institute.
Evenson, R. E. and Gollin, D. 2003. Crop variety
improvement and its effect on productivity: The
impact of international agricultural research.
Wallingford, UK: CABI Publishing.
Fan, S., Chan-Kang, C., Qian, K. and Krishnaiah,
K. 2007. National and international research and
rural poverty: The case of rice research in India
and China. In M. Adato and R. Meinzen-Dick,
eds. Impacts of agricultural research on poverty
reduction: Studies of economic and social
impact in six countries, 285-305. Baltimore,
USA: Johns Hopkins University Press.
Hazell, P. and Haddad, L. 2001. Agricultural
research and poverty reduction. IFPRI 2020
Discussion Paper 34. Washington, D.C.:
International Food Policy Research Institute.

139
PAR
T II
IC
hap
ter
12/
Hedges, L. V. and Cooper, H. M., eds. 1994. The
handbook of research synthesis. New York, USA:
Russell Sage Foundation.
Irz, X., Lin, L., Thirtle, C. and Wiggins, S. 2001.
Agricultural productivity growth and poverty
alleviation. Development Policy Review, 19:
449-466.
Maredia, M. K. and Raitzer, D. A. 2006. CGIAR
and NARS partner research in sub‑Saharan
Africa: Evidence of impact to date. Rome:
Science Council Secretariat.
Nelson, M. and Maredia, M. 1999. Environmental
impacts of the CGIAR: An initial assessment.
Rome: Consultative Group on International
Agricultural Research (CGIAR), Technical
Advisory Committee Secretariat, Food and
Agriculture Organization of the United Nations.
Raitzer, D. A. and Kelley, T. G. 2008. Benefit-cost
meta-analysis of investment in the international
agricultural research centers of the CGIAR.
Agricultural Systems, 96(1-3): 108-123.
Renkow, M. and Byerlee, D. 2010. The impacts
of CGIAR research: A review of recent evidence.
Food Policy, 35: 391-402.
Stewart, R., Langer, L., Rebelo Da Silva, N.,
Muchiri, E., Zaranyika, H., Erasmus, Y., Randall,
N., et al. 2015. The effects of training, innovation
and new technology on African smallholder
farmers’ economic outcomes and food security:
A systematic review. 3ie Grantee Final Review.
London: International Initiative for Impact
Evaluation (3ie).
Thirtle, C., Lin, L. and Piesse, J. 2003. The
impact of research-led agricultural productivity
growth on poverty reduction in Africa, Asia and
Latin America. World Development, 31(12):
1959-1975.
Waddington, H., Snilstveit, B., Hombrados,
J. G., Vojtkova, M., Anderson, J. and White,
H. 2014. Farmer field schools for improving
farming practices and farmer outcomes in
low‑and middle‑income countries: A systematic
review. London: International Initiative for Impact
Evaluation (3ie).