Agriculture and Rural Development - National Treasury
17
37 Vote 3 Agriculture and Rural Development Main appropriation Adjusted appropriation Decrease Increase R thousand Operational budget 2 168 822 2 214 840 46 018 MEC remuneration 1 1 822 1 902 80 Total amount to be appropriated 2 170 644 2 216 742 46 098 of which: Current payments 1 742 000 1 576 383 (165 617) Transfers and subsidies 249 496 465 965 216 469 Payments for capital assets 179 148 174 394 (4 754) Payments for financial assets - - Responsible MEC Administering department Accounting Officer MEC for Agriculture and Rural Development Agriculture and Rural Development Head: Agriculture and Rural Development 2016/17 1. Vision and mission Vision The vision of the Department of Agriculture and Rural Development (DARD) is: A united, sustainable and vibrant agricultural sector with thriving rural communities in balance with nature. 1 Mission The department’s mission is: To promote, through partnerships, sound agricultural practices that promote economic growth, food security and advancement of rural communities. 2. Strategic objectives Strategic policy direction: The department has taken into account the policy direction and priorities of national and provincial government, as well as its mandate in order to come up with its priority activities. DARD’s new approach to agrarian reform is built on the foundation of sound scientifi c agricultural technology, and the optimal use of resources as captured in the commodity approach. The next level in the reform is based on a sound business model that will support the development and running of the “farming business”. To penetrate the value chain, an agro-processing building block is also advocated so that value is added to primary agricultural production for best value in the market place and to improve shelf life. The department has set the following goals and strategic objectives in order to achieve this: Rural development, agrarian reform and social and economic infrastructure development Provide technical support, extension, specialist advisory services and progressive training and mentorship to households and farmers. Provide and develop support systems and infrastructure for sustainable land use, agricultural development and comprehensive rural development. 1 At the time of going to print with the 2016/17 EPRE, the proclamation determining the 2015 salary adjustment relating to office bearers had not been signed, hence this amount remained unchanged from the 2015/16 EPRE. Similarly, at the time of going to print with this document, the proclamation determining the 2016 salary adjustment relating to office bearers has not been signed. As such, the above-mentioned adjustment now aligns the MEC's salary to the 2015 salary level.
-
Upload
khangminh22 -
Category
Documents
-
view
2 -
download
0
Transcript of Agriculture and Rural Development - National Treasury

37
Vote 3 Agriculture and Rural Development
Main appropriation Adjusted appropriation Decrease Increase
R thousand
Operational budget 2 168 822 2 214 840 46 018
MEC remuneration1 1 822 1 902 80
Total amount to be appropriated 2 170 644 2 216 742 46 098
of which:
Current payments 1 742 000 1 576 383 (165 617)
Transfers and subsidies 249 496 465 965 216 469
Payments for capital assets 179 148 174 394 (4 754)
Payments for financial assets - -
Responsible MEC
Administering department
Accounting Officer
MEC for Agriculture and Rural Development
Agriculture and Rural Development
Head: Agriculture and Rural Development
2016/17
1. Vision and mission
Vision
The vision of the Department of Agriculture and Rural Development (DARD) is: A united, sustainable
and vibrant agricultural sector with thriving rural communities in balance with nature.1
Mission
The department’s mission is: To promote, through partnerships, sound agricultural practices that promote
economic growth, food security and advancement of rural communities.
2. Strategic objectives
Strategic policy direction: The department has taken into account the policy direction and priorities of
national and provincial government, as well as its mandate in order to come up with its priority
activities.
DARD’s new approach to agrarian reform is built on the foundation of sound scientific agricultural
technology, and the optimal use of resources as captured in the commodity approach. The next level in
the reform is based on a sound business model that will support the development and running of the
“farming business”. To penetrate the value chain, an agro-processing building block is also advocated so
that value is added to primary agricultural production for best value in the market place and to improve
shelf life.
The department has set the following goals and strategic objectives in order to achieve this:
Rural development, agrarian reform and social and economic infrastructure development
Provide technical support, extension, specialist advisory services and progressive training and
mentorship to households and farmers.
Provide and develop support systems and infrastructure for sustainable land use, agricultural
development and comprehensive rural development.
1 At the time of going to print with the 2016/17 EPRE, the proclamation determining the 2015 salary adjustment relating to
office bearers had not been signed, hence this amount remained unchanged from the 2015/16 EPRE. Similarly, at the time of
going to print with this document, the proclamation determining the 2016 salary adjustment relating to office bearers has not
been signed. As such, the above-mentioned adjustment now aligns the MEC's salary to the 2015 salary level.

Vote 3: Agriculture and Rural Development
38
Ensure the prevention, control and/or eradication of animal diseases.
Create and facilitate improved access to a stable and diversified food supply for improved nutritional
well-being and improvement in household income.
Undertake appropriate adaptive agricultural research and technology development and transfer, to
advance agriculture.
Creation of decent work opportunities and ensuring economic growth and infrastructure development
Create access to local and international markets for local agricultural products.
Develop commercial farming entrepreneurs and agri-business.
Enhance linkages with international entities, partners, stakeholders and all spheres of government.
3. Summary of adjusted estimates for the 2016/17 financial year
The Main Appropriation of the department was R2.171 billion in 2016/17. During the year, the
department received an additional allocation totalling R46.098 million, resulting in the revised budget of
R2.217 billion. The main reasons for this increase, as well as other adjustments, are summarised below,
and explained in detail in Section 4.
Roll-overs: An amount of R46.098 million was rolled over from 2015/16 to 2016/17, as follows:
R8.089 million in respect of motor vehicles, for which orders were placed in 2015/16 but were not
delivered by year-end, resulting in an amount of R8.089 million being rolled over and allocated to
Programme 1: Administration (R5.023 million) under the Financial Management sub-programme
and Programme 2: Agriculture (R3.066 million) under Farmer Support and Development against
Machinery and equipment. There is a need for departmental vehicles to enable the department to
perform its duties effectively.
R27.733 million relates to boreholes, stock watering dams and the rehabilitation of diptanks. The
funds were not spent in 2015/16 but orders were issued by year-end. These funds were allocated
to Buildings and other fixed structures under Programme 2 in the Farmer Support and
Development sub-programme and the Veterinary Services sub-programme.
R10.276 million in respect of feed, fodder and animal medicine for which orders were issued by
year-end. The general supply of animal feed was limited, due to the high demand across the
country as a result of the drought. These funds were allocated against Goods and services under
Programme 2 in the Veterinary Services sub-programme and the Farmer Support and
Development sub-programme.
Virement between programmes: The following virements were undertaken across programmes:
Savings of R3 million were identified against Goods and services under Programme 2 and were
moved to Programme 3: Rural Development against Higher education institutions to fund the
partnership with the University of Zululand (UNIZULU) for the establishment and
operationalisation of the Centre for Sustainable and Integrated Rural Development. The objective
of the Memorandum of Understanding (MOU) between the department and UNIZULU is to
collaborate on formal education, non-formal education, outreach, schools programme, etc. This
R3 million was offset by savings of R700 000 under Compensation of employees in Programme 3
which were moved to Transfers and subsidies to: Households in Programme 2, resulting in a net
decrease of R2.300 million in Programme 2, and an equivalent increase in Programme 3.
In addition to the above virements across programmes, the department undertook extensive virements
within programmes, affecting sub-programmes, sub-sub-programmes and economic classifications,
details of which are provided per programme in Section 4 below.
The above virements are permissible in terms of the PFMA and Treasury Regulations. The increase in
transfers and subsidies was approved by Provincial Treasury, while the reduction in capital (discussed
under the programme) requires Legislature approval. In addition, the virement to Programme 3 exceeds
the 8 per cent threshold, and therefore Legislature approval is required.
Vote 3: Agriculture and Rural Development
39
Shifts: The department undertook the following shifts:
R455 000 was shifted from Programme 2 to Programme 1 in respect of motor vehicle licence fees
within Transfers and subsidies to: Provinces and municipalities. This is due to the fact that the
bulk of departmental vehicles are budgeted for under Programme 1. The purpose of the funds
remains unchanged.
R4.265 million shifted within Programme 1 from Goods and services to Transfers and subsidies
to: Households to correct the classification for external bursaries. The purpose of the funds
remains unchanged.
R73.686 million from Goods and services and R35.576 million from Buildings and other fixed
structures was shifted to Transfers and subsidies to: Public corporations and private enterprises
to cater for projects funded through direct transfer payments such as the SA Sugar Association
(R28.115 million), Inqanawe Tunnels (R3.054 million), Rapid Dawn 1064 CC (R1.474 million),
River Valley Project (R1.200 million), Siyathuthuka Farms (R4.099 million), Independent
Development Trust (IDT) (R20.326 million), Nyezenhle Holdings – Roadside Abattoir
(R7 million), Uthukela Local House of Traditional Leaders Development Trust (R18.245 million),
Sizisizwe Trading Enterprise Co-operative (R4.728 million), Copperfield Dairy (R6.500 million),
Izobuya Nini Trading Enterprise CC (R1.500 million), Indlovu Family CC (R7.521 million), as
well as Ekuphileni Poultry and Agricultural Farming Primary Co-operative (R5.500 million).
These shifts are within Programme 2 and the purpose of the funds remains unchanged.
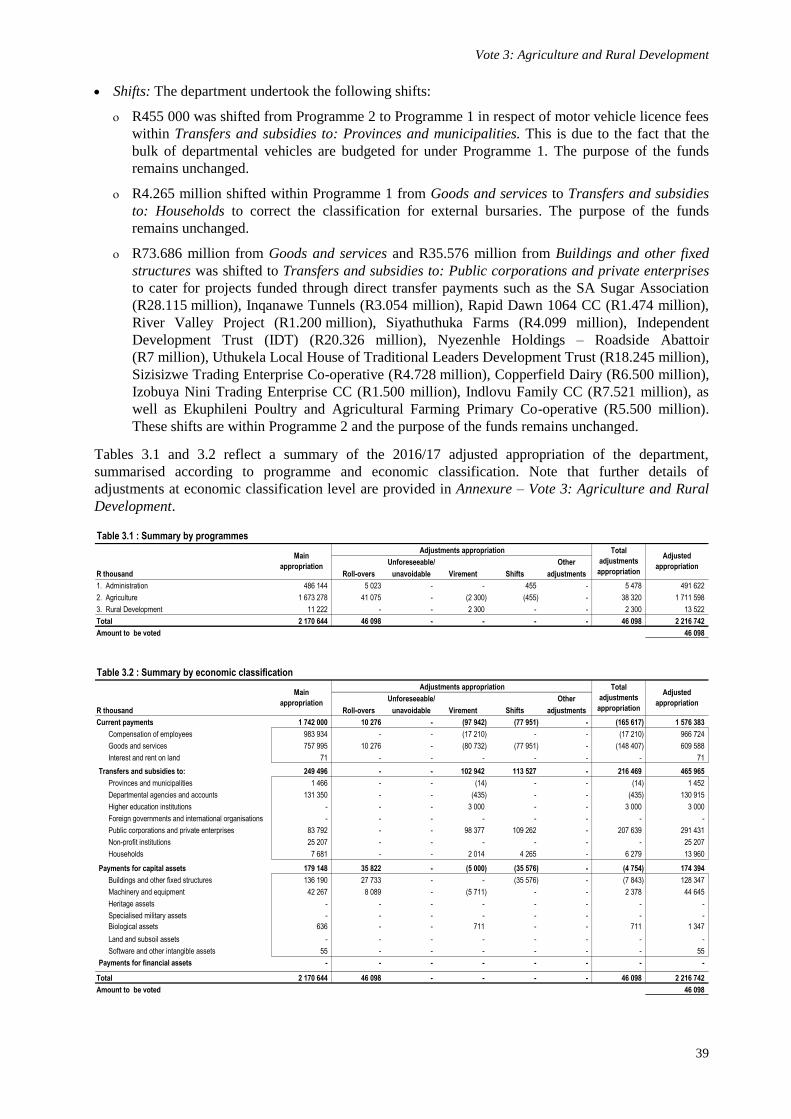
Tables 3.1 and 3.2 reflect a summary of the 2016/17 adjusted appropriation of the department,
summarised according to programme and economic classification. Note that further details of
adjustments at economic classification level are provided in Annexure – Vote 3: Agriculture and Rural
Development.
Table 3.1 : Summary by programmes
Unforeseeable/ Other
R thousand unavoidable adjustments
1. Administration 486 144 5 023 - - 455 - 5 478 491 622
2. Agriculture 1 673 278 41 075 - (2 300) (455) - 38 320 1 711 598
3. Rural Development 11 222 - - 2 300 - - 2 300 13 522
Total 2 170 644 46 098 - - - - 46 098 2 216 742
Amount to be voted 46 098
Adjusted
appropriationShifts
Main
appropriation
Adjustments appropriation
Roll-overs Virement
Total
adjustments
appropriation
Table 3.2 : Summary by economic classification
Unforeseeable/ Other
R thousand unavoidable adjustments
Current payments 1 742 000 10 276 - (97 942) (77 951) - (165 617) 1 576 383
Compensation of employees 983 934 - - (17 210) - - (17 210) 966 724
Goods and services 757 995 10 276 - (80 732) (77 951) - (148 407) 609 588
Interest and rent on land 71 - - - - - - 71
Transfers and subsidies to: 249 496 - - 102 942 113 527 - 216 469 465 965
Provinces and municipalities 1 466 - - (14) - - (14) 1 452
Departmental agencies and accounts 131 350 - - (435) - - (435) 130 915
Higher education institutions - - - 3 000 - - 3 000 3 000
Foreign governments and international organisations - - - - - - - -
Public corporations and private enterprises 83 792 - - 98 377 109 262 - 207 639 291 431
Non-profit institutions 25 207 - - - - - - 25 207
Households 7 681 - - 2 014 4 265 - 6 279 13 960
Payments for capital assets 179 148 35 822 - (5 000) (35 576) - (4 754) 174 394
Buildings and other fixed structures 136 190 27 733 - - (35 576) - (7 843) 128 347
Machinery and equipment 42 267 8 089 - (5 711) - - 2 378 44 645
Heritage assets - - - - - - - -
Specialised military assets - - - - - - - -
Biological assets 636 - - 711 - - 711 1 347
Land and subsoil assets - - - - - - - -
Software and other intangible assets 55 - - - - - - 55
Payments for financial assets - - - - - - - -
Total 2 170 644 46 098 - - - - 46 098 2 216 742
Amount to be voted 46 098
Main
appropriation
Total
adjustments
appropriation
Adjusted
appropriationShiftsRoll-overs
Adjustments appropriation
Virement

Vote 3: Agriculture and Rural Development
40
4. Changes to programme purposes and service delivery measures
The department has not changed the purpose of any of its programmes. It is noted that there have been a
few minor changes to service delivery measures to align the targets originally published in the 2016/17
EPRE with the department’s APP, which was published after the 2016/17 EPRE.
4.1 Programme 1: Administration
The primary role of Programme 1 is to support the line function components of the department in
achieving their goals. Tables 3.3 and 3.4 summarise the 2016/17 adjusted appropriation of Programme 1,
summarised according to sub-programme and economic classification. Details of the main adjustments,
which resulted in an overall increase of R5.478 million, are given in the paragraphs below.
Table 3.3 : Programme 1: Administration
Unforeseeable/ Other
R thousand unavoidable adjustments
1. Office of the MEC 12 920 - - 12 920
2. Senior Management 38 301 171 171 38 472
3. Corporate Services 213 771 13 963 13 963 227 734
4. Financial Management 190 386 5 023 (14 156) 455 (8 678) 181 708
5. Communication Services 30 766 22 22 30 788
Total 486 144 5 023 - - 455 - 5 478 491 622
Amount to be voted Vehicles 5 478
Adjusted
appropriationShiftsRoll-overs Virement
Adjustments appropriationMain
appropriation
Total
adjustments
appropriation
Table 3.4 : Summary by economic classification
Unforeseeable/ Other
R thousand unavoidable adjustments
Current payments 433 010 - - 135 (4 265) - (4 130) 428 880
Compensation of employees 201 857 (8 419) (8 419) 193 438
Goods and services 231 153 8 554 (4 265) 4 289 235 442
Interest and rent on land - -
Transfers and subsidies to: 4 192 - - (135) 4 720 - 4 585 8 777
Provinces and municipalities 770 455 455 1 225
Departmental agencies and accounts 2 952 (435) (435) 2 517
Higher education institutions - -
Foreign governments and international organisations - -
Public corporations and private enterprises - -
Non-profit institutions - -
Households 470 300 4 265 4 565 5 035
Payments for capital assets 48 942 5 023 - - - - 5 023 53 965
Buildings and other fixed structures 26 775 - 26 775
Machinery and equipment 22 167 5 023 5 023 27 190
Heritage assets - -
Specialised military assets - -
Biological assets - -
Land and subsoil assets - -
Software and other intangible assets - -
Payments for financial assets - -
Total 486 144 5 023 - - 455 - 5 478 491 622
Amount to be voted 5 478
Main
appropriation
Total
adjustments
appropriation
Adjusted
appropriationShifts
Adjustments appropriation
Roll-overs Virement
Roll-overs – Programme 1: Administration: R5.023 million
R5.023 million was rolled over and allocated to the Financial Management sub-programme against
Machinery and equipment in respect of the purchase of motor vehicles, for which orders were placed but
not delivered by year-end. There is a need for departmental vehicles to enable the department to perform
its duties effectively.
Virement – Programme 1: Administration
Various virements were undertaken within the programme both at sub-programme and economic
classification level, which resulted in no change to the allocation for the programme. The detail of the
virements is explained below:
Savings of R8.854 million were identified within the programme as follows:

Vote 3: Agriculture and Rural Development
41
R8.419 million from Compensation of employees due to delays in the filling of vacant budgeted
posts such as Deputy Director General: Rural Development, Chief Director: Scientific Research,
Chief Director: Veterinary Services, Director: Supply Chain Management.
R435 000 from Transfers and subsidies to: Departmental agencies and accounts in respect of a
provision for payments to PSETA. In terms of a National Treasury circular, departments with
sector SETAs no longer need to transfer funds to PSETA from 2015/16 onwards.
These savings were moved as follows:
R300 000 was moved to Transfers and subsidies to: Households within Programme 1, in respect
of higher than anticipated staff exit costs.
R8.554 million was moved to Goods and services within Programme 1 for the training of staff, as
well as the new SITA Service Level Agreement in respect of the department’s IT.
The above virements account for the movements across sub-programmes. The virements are permissible
in terms of the PFMA and Treasury Regulations. The reduction in transfers and subsidies does not
require Legislature approval, as it is not gazetted.
Shifts – Programme 1: Administration: R455 000
The department undertook the following shifts, where the purpose of the funds remains unchanged:
R4.265 million was shifted within Programme 1 from Goods and services to Transfers and subsidies
to: Households to correct the classification for external bursaries.
R455 000 was shifted from Programme 2 to Programme 1 in respect of motor vehicle licence fees
against Transfers and subsidies to: Provinces and municipalities. This is due to the fact that most
departmental vehicles are budgeted for under Programme 1.
4.2 Programme 2: Agriculture
Programme 2 has two main core functions, namely Agriculture and Veterinary services. Agriculture
encompasses crop production, livestock farming, land use and land reform (a national priority run by
DARD at provincial level), as well as veterinary services which entails animal disease control,
prevention of zoonotic diseases, and ensuring safety of food products of animal origin.
Tables 3.5 and 3.6 summarise the 2016/17 adjusted appropriation of Programme 2 according to sub-
programme, sub-sub programme and economic classification. Details of the main adjustments, which
resulted in an overall increase of R38.320 million, are provided in the paragraphs following the tables.
Table 3.5 : Programme 2: Agriculture
Unforeseeable/ Other
R thousand unavoidable adjustments
1. Sustainable Resource Management 88 808 - - 2 453 - - 2 453 91 261
Engineering Services 34 337 (1 453) (1 453) 32 884
Land Care 37 832 4 000 4 000 41 832
Land Use Management 13 202 (94) (94) 13 108
Disaster Risk Management 3 437 - 3 437
2. Farmer Support and Development 1 154 348 30 309 - (16 755) (455) - 13 099 1 167 447
Farmer-settlement and Development 488 319 27 243 (22 344) 4 899 493 218
Extension and Advisory Services 617 129 3 066 (10 511) (455) (7 900) 609 229
Food Security 48 900 16 100 16 100 65 000
3. Veterinary Services 145 959 10 766 - 18 017 - - 28 783 174 742
Animal Health 108 935 10 766 18 100 28 866 137 801
Veterinary Public Health 8 752 - 8 752
Veterinary Laboratory Services 28 272 (83) (83) 28 189
4. Research and Technology Development Services 159 058 - - (5 763) - - (5 763) 153 295
Research 100 376 (6 062) (6 062) 94 314
Infrastructure Support Services 58 682 299 299 58 981
5. Agricultural Economic Services 7 492 - - 32 - - 32 7 524
Agri-Business Support and Development 7 492 32 32 7 524
6. Structured Agricultural Education and Training 117 613 - - (284) - - (284) 117 329
Higher Education and Training 100 799 (284) (284) 100 515
Further Education and Training (FET) 16 814 - 16 814
Total 1 673 278 41 075 - (2 300) (455) - 38 320 1 711 598
Amount to be voted 38 320
Main
appropriation
Adjustments appropriation Total
adjustments
appropriation
Adjusted
appropriationRoll-overs Virement Shifts

Vote 3: Agriculture and Rural Development
42
Table 3.6 : Summary by economic classification
Unforeseeable/ Other
R thousand unavoidable adjustments
Current payments 1 298 068 10 276 - (97 377) (73 686) - (160 787) 1 137 281
Compensation of employees 775 610 (8 091) (8 091) 767 519
Goods and services 522 387 10 276 (89 286) (73 686) (152 696) 369 691
Interest and rent on land 71 - 71
Transfers and subsidies to: 245 304 - - 100 077 108 807 - 208 884 454 188
Provinces and municipalities 696 (14) (455) (469) 227
Departmental agencies and accounts 128 398 - 128 398
Higher education institutions - -
Foreign governments and international organisations - -
Public corporations and private enterprises 83 792 98 377 109 262 207 639 291 431
Non-profit institutions 25 207 - 25 207
Households 7 211 1 714 1 714 8 925
Payments for capital assets 129 906 30 799 - (5 000) (35 576) - (9 777) 120 129
Buildings and other fixed structures 109 415 27 733 - (35 576) (7 843) 101 572
Machinery and equipment 19 800 3 066 (5 711) (2 645) 17 155
Heritage assets - -
Specialised military assets - -
Biological assets 636 711 711 1 347
Land and subsoil assets - -
Software and other intangible assets 55 - 55
Payments for financial assets - -
Total 1 673 278 41 075 - (2 300) (455) - 38 320 1 711 598
Amount to be voted 38 320
Main
appropriation
Total
adjustments
appropriation
Adjusted
appropriationShiftsRoll-overs Virement
Adjustments appropriation
Roll-overs – Programme 2: Agriculture: R41.075 million
The roll-over of R41.075 million relates to various outstanding commitments from 2015/16 that were
paid in 2016/17, and includes:
An amount of R10.276 million in respect of feed, fodder and animal medicine for which orders were
issued by year-end. The general supply of animal feed was limited in 2015/16, due to the high
demand across the country as a result of the drought. These funds were allocated under Goods and
services in the Animal Health sub-sub-programme against the Veterinary Services sub-programme
(R4.631 million) and Farmer-settlement and Development sub-sub-programme in the Farmer Support
and Development sub-programme (R5.645 million).
R27.733 million relates to boreholes, stock watering dams and the rehabilitation of diptanks. The
funds were not spent in 2015/16, but orders were issued by year-end. These funds were allocated to
Buildings and other fixed structures in the Farmer-settlement and Development sub-sub-programme
under the Farmer Support and Development sub-programme (R21.598 million) and the Animal
Health sub-sub-programme under the Veterinary Services sub-programme (R6.135 million).
R3.066 million in respect of motor vehicles, for which orders were placed but not delivered by year-
end, resulting in the funds being rolled over and allocated to the Extension Advisory Services sub-
sub-programme under the Farmer Support and Development sub-programme against Machinery and
equipment.
Virement – Programme 2: Agriculture: (R2.300 million)
Extensive virements were undertaken within the programme, at sub-programme, sub-sub-programme
and economic classification level, which resulted in an overall decrease of R2.300 million. The detail of
the virements is explained below:
R3 million was reprioritised from Goods and services to Programme 3 against Transfers and
subsidies to: Higher education institutions to fund the partnership agreement with UNIZULU for the
establishment of the Centre of Sustainable and Integrated Rural Development. The objective of the
MOU between the department and UNIZULU is to collaborate on formal education, non-formal
education, outreach, schools programme, etc., as mentioned above. This was offset by a virement of
R700 000 from savings under Compensation of employees in Programme 3 which were moved to
Programme 2 to offset a shortfall with regard to staff exit costs under Transfers and subsidies to:
Households. This resulted in a net reduction of R2.300 million in respect of Programme 2.

Vote 3: Agriculture and Rural Development
43
In addition to the above, savings of R100.102 million were identified across various sub-programmes
and economic classification within Programme 2, as follows:
R8.091 million against Compensation of employees due to delays in filling vacant posts such as
District Managers for eight districts due to slow recruitment processes, and unplanned staff exits.
R86.286 million from Goods and services in respect of the reprioritisation of projects. These
funds were for Communal Estate projects and these projects were moving slower than anticipated.
R14 000 under Transfers and subsidies to: Provinces and municipalities in respect of municipal
rates at Owen Sithole College of Agriculture (OSCA) which were over-budgeted for.
R5.711 million against Machinery and equipment due to challenges in respect of service providers
not meeting the specifications for high tech laboratory equipment. This will only be re-advertised
and procured in the next financial year.
These savings were moved within Programme 2 as follows:
R98.377 million against Transfers and subsidies to: Public corporation and private enterprises to
use the Masisizane Fund as the implementing agent for the acquisition of tractors and implements,
training of operators of the equipment, capacitating farmers through education, training and skills
transfer, etc.
R1.014 million against Transfer and subsidies to: Households in respect of staff exit costs.
R711 000 against Biological assets to offset the shortfall as a result of the purchase of animals for
research purposes under this category.
These virements are permissible in terms of the PFMA and Treasury Regulations, but the reduction in
capital requires Legislature approval, while the increase in transfers was approved by Provincial
Treasury.
Shifts – Programme 2: Agriculture: (R455 000)
The department undertook the following shifts:
R455 000 was shifted from this programme under the Extension Advisory Services sub-sub-
programme in the Farmer Support and Development sub-programme to Programme 1 under the
Financial Management sub-programme in respect of motor vehicle licence fees against Transfers and
subsidies to: Provinces and municipalities. The purpose of the funds remains unchanged.
R73.686 million was moved from Goods and services and R35.576 million from Buildings and other
fixed structures to Transfers and subsidies to: Public corporations and private enterprise to cater for
projects funded through direct transfer payments such as the SA Sugar Association
(R28.115 million), Inqanawe Tunnels (R3.054 million), Rapid Dawn 1064 CC (R1.474 million),
River Valley Project (R1.200 million), Siyathuthuka Farms (R4.099 million), IDT (R20.326 million),
Nyezenhle Holdings – Roadside Abattoir (R7 million), Uthukela Local House of Traditional Leaders
Development Trust (R18.245 million), Sizisizwe Trading Enterprise Co-operative (R4.728 million),
Copperfield Dairy (R6.500 million), Izobuya Nini Trading Enterprise CC (R1.500 million), Indlovu
Family CC (R7.521 million), as well as Ekuphileni Poultry and Agricultural Farming Primary Co-
operative (R5.500 million), as mentioned. These shifts are within Programme 2 and the purpose of
the funds remains unchanged. Also, it is noted that the R35.576 million moved from Buildings and
other fixed structures remains a capital transfer, hence there is no reduction in capital.
Service delivery measures – Programme 2: Agriculture
Table 3.7 shows the service delivery measures relating to Programme 2, including both customised
measures prescribed for the Agriculture sector, as well as several measures, which are not prescribed by
the sector.

Vote 3: Agriculture and Rural Development
44
It must be noted that not all the targets fall in line with the APP, which was tabled subsequent to the
EPRE, and this accounts for the amounts reflected in the Revised target column. New measures were
introduced in the APP after the EPRE was published, and these are indicated as “New” in the Original
target column and targets are shown in the Revised target column.
Table 3.7 : Service delivery measures – Programme 2: Agriculture
Outputs Performance indicators Performance targets
2016/17 Original target
2016/17 Mid-year
actual
2016/17 Revised target
1. Sustainable Resource Management
1.1 Engineering services No. of agricultural engineering advisory reports prepared
No. of designs with specification for agricultural engineering solutions provided
No. of agricultural infrastructure established
180
250
337
116
175
126
12
1.2 Infrastructure No. of dip tanks constructed
No. of dip tanks rehabilitated
No. of boreholes established
No. of irrigation schemes rehabilitated
No. of irrigation schemes developed
No. of km of fencing erected
No. of dams established
No. of projects of animal houses implemented (piggery, poultry, etc)
No. of agro-processing facilities established
30
78
80
2
34
450
77
26
12
10
10
45
-
7
280
19
4
14
1.3 Land use No. of ha of agricultural land protected through guiding subdivision / rezoning / change of agricultural land use
No. of natural resource assessments completed
No. of soil profiles described (NRS)
No. of ha of vegetation sites surveyed e.g. veld condition assessment
4 000
16
5 000
5 000
3 167
12
436
58
400
61
1.4 Disaster risk management
No. of disaster relief schemes managed
No. of disaster risk reduction programmes managed
1
1
-
2
1.5 Land care No. of green jobs created through land care
No. of ha protected/rehabilitated to improve agricultural production
No. of awareness campaigns conducted at schools on Land Care
2 000
6 500
New
1 930
6 677
2
970
8 000
10
2. Farmer Support and Development
2.1 Farmer-settlement and development
No. of smallholder producers receiving support
No. of commercial farmers supported
3 150
275
6 827
12
2.2 Specialist agricultural advisory services
No. of scientific evaluation reports on commodity based projects
No. of scientific value adding reports on diversified agricultural products
No. of agricultural business plans assessed
90
22
330
61
19
116
2.3 Mentorship No. of projects mentored 50 4
2.4 Extension and advisory services
No. of smallholder producers supported with agricultural advice 15 000 14 693
No. of ha under irrigation used by smallholder farmers
No. of jobs created 2 500
1 000
1 000
416
No. of communal estates established 74 5
2.5
Crop production No. of ha of maize established
No. of ha of beans established
No. of ha of vegetables established
No. of ha of soya bean established
No. of ha of cotton established
No. of ha of sugarcane established
No. of ha of groundnuts rehabilitated
No. of ha of banana established
No. of ha of macadamia established
No. of ha of citrus fruits established
15 500
5 800
700
1 600
1 000
1 445
665
13
150
105
40
128
25
-
-
10
61
-
-
-
No. of ha of pineapple established 25 -
2.6
Food security
No. of households benefitting from agricultural food security initiatives
No. of hectares cultivated for food production in communal areas and land reform projects
No. of community gardens established
No. of household gardens established
No. of institutional gardens supported
No. of food security livestock projects established (goats, layers & indigenous chickens)
No. of food security tunnels established
No. of food security mushroom projects resuscitated
2 130
25 865
170
1 370
190
-
198
60
3 712
61
10
18
7
4
8
-
400

Vote 3: Agriculture and Rural Development
45
Table 3.7 : Service delivery measures – Programme 2: Agriculture
Outputs Performance indicators Performance targets
2016/17 Original target
2016/17 Mid-year
actual
2016/17 Revised target
3. Veterinary Services
3.1 Animal health No. of epidemiological units visited for veterinary interventions
Animals vaccinated control / notifiable diseases
No. of animals surveyed for diseases (TB, CA, rabies, AI, NCD, nagana, BSE)
20 000
1 500 000
68 000
3 656
526 338 23 235
3.2 Export control No. of clients serviced for animal products export control 500 226 1500
3.3 Veterinary public health % level of abattoir compliance to meat safety legislation
No. of inspections of facilities processing animal product and by-product
No. of inspections to further processing facilities
100%
705
600
78%
452
33
3.4 Veterinary laboratory services
No. of veterinary laboratory quality control tests which meets ISO 17025 standards
No. of tests performed
65 000
150 000
24 071
74 217
4. Research and Technology Development Services
4.1 Research and technical development
No. of research and technology development projects implemented to improve agricultural production
No. of samples analysed
96
35 000
-
19 495
4.2 Infrastructure and support services
No. of research infrastructure managed 11
-
4.3 Technology transfer services
No. of scientific papers published (nationally or internationally)
No. of presentations made at scientific events (nationally or internationally)
11
101
-
217
5. Agricultural Economic Services
5.1 Agri-business support and development
No. of agri-businesses supported with agricultural economics services toward accessing markets
No. of clients benefitted from agricultural economic advice provided
No. of functional agro-processing facilities established
40
1 000
6
18
523
5
30
5.2 Macro-economic support
No. of agricultural economic information responses provided
No. of economic reports compiled
800
5
567
2
4
6. Structured Agricultural Education and Training
6.1 Higher education and training (HET)
No. of agricultural HET graduates 500 - 90
6.2 Further education and training (FET)
No. of participants trained in agricultural skills development programmes
No. of intervention in revitalisation of agricultural schools
No. of interventions in schools programmes
2 400
5
4
1 835
-
-
2 500
8
4.3 Programme 3: Rural Development
This is a fairly new programme created in 2015/16 with the aim to initiate, plan and monitor
development in specific rural areas (comprehensive rural development project sites) across the three
spheres of government and to facilitate rural development initiatives by engaging communities on
priorities and to institutionalise and support community organisational structures.
Tables 3.8 and 3.9 reflect a summary of the 2016/17 adjusted appropriation of Programme 3,
summarised according to sub-programme and economic classification.
Details of the main adjustments, which resulted in an overall increase of R2.300 million, are given in the
paragraphs below the tables.
Table 3.8 : Programme 3: Rural Development
Unforeseeable/ Other
R thousand unavoidable adjustments
1. Rural Development Coordination 4 492 1 849 1 849 6 341
2. Social Facilitation 6 730 451 451 7 181
Total 11 222 - - 2 300 - - 2 300 13 522
Amount to be voted 2 300
Total
adjustments
appropriation
Adjusted
appropriationShiftsRoll-overs
Main
appropriation
Adjustments appropriation
Virement

Vote 3: Agriculture and Rural Development
46
Table 3.9 : Summary by economic classification
Unforeseeable/ Other
R thousand unavoidable adjustments
Current payments 10 922 - - (700) - - (700) 10 222
Compensation of employees 6 467 (700) (700) 5 767
Goods and services 4 455 - 4 455
Interest and rent on land - -
Transfers and subsidies to: - - - 3 000 - - 3 000 3 000
Provinces and municipalities - -
Departmental agencies and accounts - -
Higher education institutions 3 000 3 000 3 000
Foreign governments and international organisations - -
Public corporations and private enterprises - -
Non-profit institutions - -
Households - -
Payments for capital assets 300 - - - - - - 300
Buildings and other fixed structures - -
Machinery and equipment 300 - 300
Heritage assets - -
Specialised military assets - -
Biological assets - -
Land and subsoil assets - -
Software and other intangible assets - -
Payments for financial assets - -
Total 11 222 - - 2 300 - - 2 300 13 522
Amount to be voted 2 300
Main
appropriation
Total
adjustments
appropriation
Adjusted
appropriationShifts
Adjustments appropriation
Roll-overs Virement
Virement – Programme 3: Rural Development: R2.300 million
Various virements were undertaken affecting the programme both at sub-programme and economic
classification level, which resulted in an overall increase of R2.300 million. The detail of the virements
is explained below:
Savings of R700 000 were identified under Compensation of employees as a result of vacant posts
due to delays in the finalisation of the matching and placing process of staff. The matching and
placing of staff into the new structure is a process which involved organised labour and, due to the
large number of employees within the department, the process could not be finalised by the end of
2015/16. These savings were moved to Programme 2 to offset the shortfall with regard to staff exit
costs against Transfers and subsidies to: Households.
R3 million was moved from Programme 2 to Transfer and subsidies to: Higher education institutions
under Programme 3 in the Rural Development Co-ordination sub-programme for the department’s
contribution to the development of the Centre for Sustainable and Integrated Rural Development at
UNIZULU.
The above virements are permissible in terms of the PFMA and Treasury Regulations and the required
Treasury approval was obtained in respect of the increase in transfers. The virement from Programme 2
to Programme 3 exceeds the 8 per cent threshold, and therefore Legislature approval is required.
Service delivery measures – Programme 3: Rural Development
Table 3.10 shows the service delivery measures relating to Programme 3. Many new measures were
introduced in the APP after the EPRE was published, and these are indicated as “New” in the Original
target column and targets are shown in the Revised target column.
Table 3.10 : Service delivery measures – Programme 3: Rural Development
Outputs Performance indicators Performance targets
2016/17 Original target
2016/17 Mid-year
actual
2016/17 Revised target
1.
1.1
Rural Development
Effective Rural Development monitoring and evaluation
Co-ordination
No. of KZN Interdepartmental task team meetings convened to track rural development implementation
District rural development plans integrated into IDPs
No. of youth, women and people with disabilities who participate in rural development project
4
11
2 000
1
-
-

Vote 3: Agriculture and Rural Development
47
Table 3.10 : Service delivery measures – Programme 3: Rural Development
Outputs Performance indicators Performance targets
2016/17 Original target
2016/17 Mid-year
actual
2016/17 Revised target
Develop outcome 7 performance reports for the province
No. of reported sub-outcomes verified
No. of impact assessments completed
No. of statistical review reports produced
4
2
2
2
2
-
-
-
2.
2.1
Social Facilitation
Sustainable enterprises & industries promoted in areas with economic potential
increased participation in the value chain of prioritised commodities
Develop rural development plans for each of the 4 pillars – River catalytic, Agri-villages, Communal estates and Land Reform
No. of Agri-businesses supported with agricultural economics advice towards accessing markets & sustainable participation in value chains
4
New
1
-
10
No. of clients who have benefited from agricultural economic and advice provided
No. of agricultural economic information responses provided
No. of economic reports provided
New
New
New
-
-
-
1 000
800
4
No. of Agri-businesses supported with business entity advice
Develop a youth in agribusiness empowerment model
No. of business entities (incl co-ops) equipped with rural enterprise development skills
No. of projects mentored
No. of agricultural graduates deployed in rural projects
No. of reports on implementation of the agri-park strategy for each district
No. of partnerships brokered promoting rural development
No. of women owned enterprises supported to participate in agricultural value chains
65
1
110
50
50
4
5
11
55
1
100
4
2
2
2
42
65
1
110
50
50
4
5
11
5. Specifically and exclusively appropriated allocations
Table 3.11 shows the amounts that are specifically and exclusively appropriated for specific purposes in
terms of the 2016/17 KZN Adjustments Appropriation Act. Note that transfers to public entities and
conditional grants (which are also specifically and exclusively appropriated funds) are not included here,
as they are discussed in Sections 8 and 9 below.
There was no amendment to the amount of R50 million allocated for drought relief. It is noted that the
department will receive additional funding in the form of an indirect grant in respect of additional fodder
via the Comprehensive Agricultural Support Programme (CASP) grant, and the province was advised of
this by National Treasury.
Table 3.11 : Summary of specifically and exclusively appropriated funding
Unforeseeable/ Other
R thousand unavoidable adjustments
1. Prog. 2: Drought Relief 50 000 - 50 000
Total 50 000 - - - - - - 50 000
Amount to be voted -
Total
adjustments
appropriation
Adjusted
appropriation
Main
appropriation
Adjustments appropriation
Roll-overs Virement Shifts
6. Gifts, donations and sponsorships
The department is not envisaging any gifts, donations and sponsorships above R100 000 during the
current financial year.
7. Infrastructure
Table 3.12 shows the summary of infrastructure payments per main category.
Details of the main adjustments, which resulted in an overall increase of R9.407 million, are provided in
the paragraphs following the tables.

Vote 3: Agriculture and Rural Development
48
Table 3.12 : Summary of infrastructure payments by category
Unforeseeable/ Other
R thousand unavoidable adjustments
Existing infrastructure assets 108 005 6 135 - (18 326) - - (12 191) 95 814
Maintenance and repair: Current 26 654 (18 326) (18 326) 8 328
Upgrades and additions: Capital - -
Refurbishment and rehabilitation: Capital 81 351 6 135 6 135 87 486
New infrastructure assets: Capital 54 839 21 598 - - (35 576) - (13 978) 40 861
Infrastructure transfers - - - - 35 576 - 35 576 35 576
Infrastructure transfers: Capital 35 576 35 576 35 576
Infrastructure transfers: Current - -
Infrastructure: Payments for fin assets - -
Infrastructure: Leases - -
Capital infrastructure 136 190 27 733 - - - - 27 733 163 923
Current infrastructure 26 654 - - (18 326) - - (18 326) 8 328
Total 162 844 27 733 - (18 326) - - 9 407 172 251
Amount to be voted 9 407
Main
appropriation
Total
adjustments
appropriation
Adjusted
appropriation
Adjustments appropriation
Roll-overs Virement Shifts
Roll-overs: An amount of R27.733 million was allocated in respect of the following:
Refurbishment and rehabilitation: Capital was allocated an amount of R6.135 million which
relates to the rehabilitation of diptanks. The funds were not spent in 2015/16, but orders were
issued by year-end.
New infrastructure assets: Capital was increased by R21.598 million in respect of boreholes,
stock watering dams and diptanks. The funds were not spent in 2015/16 but orders were issued by
year-end.
Virements: The decrease of R18.326 million against Maintenance and repair: Current is in respect of
an incorrect allocation for repairs of agricultural infrastructure. This category was inadvertently over-
budgeted for in the EPRE.
Shifts: An amount of R35.576 million is shifted from direct payment for New infrastructure assets:
Capital to Infrastructure transfers: Capital in respect of projects where the department’s CASP grant
portion is transferred to the beneficiaries. The department provides 50 per cent of the funding to
farmers as support and the farmer must provide the other 50 per cent. These beneficiaries include
Copperfield Dairy, Izobuya Nini Trading Enterprise CC, Indlovu Family CC, as well as Ekuphileni
Poultry and Agricultural Farming Primary Co-operative. The original purpose of the funds remains
unchanged.
8. Conditional grants
Tables 3.13 and 3.14 provide a summary of changes to conditional grants.
Details of the main adjustments, which result in no change to the overall grant allocations, are provided
below the table.
It is noted that the department will receive additional funding in the form of an indirect grant in respect
of additional fodder via the CASP grant, and the province was advised of this by National Treasury.
Table 3.13 : Summary of changes to conditional grants
Unforeseeable/ Other
R thousand unavoidable adjustments
1. Administration - - - - - - - -
2. Agriculture 300 503 - - - - - - 300 503
CASP grant 222 155 - 222 155
Ilima/Letsema Projects grant 63 876 - 63 876
Land Care Programme grant 10 632 - 10 632
EPWP Integrated Grant for Provinces 3 840 - 3 840
3. Rural Development - - - - - - - - - - Total 300 503 - - - - - - 300 503
Amount to be voted -
Main
appropriation
Total
adjustments
appropriation
Adjusted
appropriation
Adjustments appropriation
Roll-overs Virement Shifts

Vote 3: Agriculture and Rural Development
49
Table 3.14 : Summary of conditional grants by economic classification
Unforeseeable/ Other
R thousand unavoidable adjustments
Current payments 245 500 - - - (10 500) - (10 500) 235 000
Compensation of employees 17 893 - 17 893
Goods and services 227 607 (10 500) (10 500) 217 107
Interest and rent on land - -
Transfers and subsidies to: - - - - 41 348 - 41 348 41 348
Provinces and municipalities - -
Departmental agencies and accounts - -
Higher education institutions - -
Foreign governments and international organisations - -
Public corporations and private enterprises 41 348 41 348 41 348
Non-profit institutions - -
Households - -
Payments for capital assets 55 003 - - - (30 848) - (30 848) 24 155
Buildings and other fixed structures 47 492 (30 848) (30 848) 16 644
Machinery and equipment 7 511 - 7 511
Heritage assets - -
Specialised military assets - -
Biological assets - -
Land and subsoil assets - -
Software and other intangible assets - -
Payments for financial assets - -
Total 300 503 - - - - - - 300 503
Amount to be voted -
Adjusted
appropriationRoll-overs Virement Shifts
Main
appropriation
Adjustments appropriation Total
adjustments
appropriation
Shifts: The department undertook a shift of R10.500 million from Goods and services and
R30.848 million from Buildings and other fixed structures to Transfers and subsidies to: Public
corporations and private enterprises in respect of projects where the department’s CASP grant
portion is transferred to the beneficiaries. The department provides 50 per cent of the funding to
farmers as support and the farmer must provide the other 50 per cent. Also, it is noted that the
R30.848 million moved from Buildings and other fixed structures remains a capital transfer, hence
there is no reduction in capital. The original purpose of the funds remains unchanged.
9. Transfers and subsidies
Table 3.15 shows the summary of transfers and subsidies by programme and main category. Details of
the main adjustments, which resulted in an overall increase of R216.469 million in the transfers and
subsidies allocation, are provided in the paragraphs before and following the tables.
Virement: The following virements were undertaken at programme level:
In respect of Programme 1:
- Departmental agencies and accounts was decreased by R435 000 in respect of a provision that
was made for payments to PSETA. In terms of a circular from National Treasury, departments
that have sector SETAs no longer need to transfer funds to PSETA from 2015/16 onwards.
- Households was increased by R300 000 to fund the shortfall for unplanned staff exit costs.
In respect of Programme 2:
- Provinces and municipalities was decreased by R14 000 due to municipal rates for OSCA
which were over-budgeted for.
- Public corporations and private enterprises was increased by R98.377 million to use the
Masisizane Fund as the implementing agent for the acquisition of tractors and implements,
training of operators of the equipment, capacitating farmers through education, etc.
- Households was increased by R1.714 million in respect of unplanned staff exit costs.
In respect of Programme 3:
- Higher education institutions was increased by R3 million, being the department’s
contribution to UNIZULU for the Centre for Sustainable and Integrated Rural Development, as
mentioned.

Vote 3: Agriculture and Rural Development
50
The above virements are permissible in terms of the PFMA and Treasury Regulations, and the increase
in Public corporations and private enterprises for the Masisizane Fund, and in Higher education
institutions for UNIZULU was approved by Provincial Treasury.
Table 3.15 : Summary of transfers and subsidies by programme and main category
Unforeseeable/ Other
R thousand unavoidable adjustments
1. Administration 4 192 - - (135) 4 720 - 4 585 8 777
Provinces and municipalities 770 - - - 455 - 455 1 225
Motor vehicle licences 770 455 455 1 225
Departmental agencies and accounts 2 952 - - (435) - - (435) 2 517
Skills Development Levy 2 952 (435) (435) 2 517
Households 470 - - 300 4 265 - 4 565 5 035
Other transfers to households 4 265 4 265 4 265
Staff exit costs 470 300 300 770 - -
2. Agriculture 245 304 - - 100 077 108 807 - 208 884 454 188
Provinces and municipalities 696 - - (14) (455) - (469) 227
Motor vehicle licences 658 (455) (455) 203
Municipal accounts 38 (14) (14) 24
Departmental agencies and accounts 128 398 - - - - - - 128 398
Agri-Business Development Agency 128 397 - 128 397
TV and radio licences 1 - 1
Public corporations and private enterprises 83 792 - - 98 377 109 262 - 207 639 291 431
Mjindi 53 183 - 53 183
Independent Development Trust (IDT) 20 326 20 326 20 326
Agricultural Show Societies 100 - 100
SA Sugarcane Research Institute 2 242 - 2 242
SA Sugar Association 28 115 28 115 28 115
Soil Conservation Subsidy 1 605 - 1 605
Inqanawe Tunnel Project 3 054 3 054 3 054
Rapid Dawn 1064 CC 1 474 1 474 1 474
River Valley Project 1 200 1 200 1 200
Siyathuthuka Farms 4 099 4 099 4 099
Communal Estates 26 662 - 26 662
Masisizane Fund 98 377 98 377 98 377
Nyezenhle Holdings - Roadside Abattoir 7 000 7 000 7 000
Uthukela Local House of Trad. Leaders Dev. Tr. 18 245 18 245 18 245
Sizisizwe Trad. Ent. Primary Co-Op. 4 728 4 728 4 728
Copperfield Dairy 6 500 6 500 6 500
Izobuya Nini Trading Enterprise CC 1 500 1 500 1 500
Indlovu Family CC 7 521 7 521 7 521
Ekuphileni Poultry and Agric. Farming Prim. Co-op. 5 500 5 500 5 500
Non-profit institutions 25 207 - - - - - - 25 207
Zakhe Agricultural College 3 446 - 3 446
Agricultural Schools 21 761 - 21 761
Households 7 211 - - 1 714 - - 1 714 8 925
Social benefit - staff exit costs 7 211 1 714 1 714 8 925 - -
3. Rural Development - - - 3 000 - - 3 000 3 000
Higher education institutions - - - 3 000 - - 3 000 3 000
University of Zululand 3 000 3 000 3 000 0 -
Total 249 496 - - 102 942 113 527 - 216 469 465 965
Amount to be voted 216 469
Main
appropriation
Total
adjustments
appropriation
Adjusted
appropriation
Adjustments appropriation
Roll-overs Virement Shifts
Shifts: Some shifts were made at programme level, and the purpose of the funds remains unchanged:
In respect of Programme 1:
- R455 000 was shifted from Programme 2 to Programme 1 in respect of motor vehicle licence
fees against Provinces and municipalities.
- R4.265 million was shifted within Programme 1 from Goods and services to Households to
correct the classification for external bursaries.
In respect of Programme 2:
- R455 000 was shifted from this programme to Programme 1 for motor vehicle licence fees
against Provinces and municipalities.
- R73.686 million was moved from Goods and services and R35.576 million from Buildings and
other fixed structures to Public corporations and private enterprises to cater for projects
funded through direct transfer payments such as the SA Sugar Association, Inqanawe Tunnels,
Rapid Dawn 1064 CC, River Valley Project, Siyathuthuka Farms, IDT, Nyezenhle Holdings –

Vote 3: Agriculture and Rural Development
51
Roadside Abattoir, Uthukela Local House of Traditional Leaders Development Trust,
Sizisizwe Trading Enterprise Co-operative, Copperfield Dairy, Izobuya Nini Trading
Enterprise CC, Indlovu Family CC, as well as Ekuphileni Poultry and Agricultural Farming
Primary Co-operative, as mentioned. These shifts are within Programme 2.
10. Transfers to public entities
Table 3.16 reflects transfers made by the department to public entities. There were no movements in
respect of the transfers to the public entities and therefore, there was no change in the allocation.
Table 3.16 : Summary of transfers to public entities
Unforeseeable/ Other
R thousand Roll-overs unavoidable Virement Shifts adjustments
Agri-Business Development Agency 128 397 - 128 397
Mjindi Farming (Pty) Ltd 53 183 - 53 183
Total 181 580 - - - - - - 181 580
Amount to be voted -
Main
appropriation
Adjustments appropriation Total
adjustments
appropriation
Adjusted
appropriation
11. Transfers to local government
The department does not make any transfers to local government. It is noted that an amount of R770 000
is reflected against Transfers and subsidies to: Provinces and municipalities in Table 3.15 above. This
relates to the payment of motor vehicle licences. As this amount will not be transferred to any
municipality, the table reflecting transfers to local government is excluded.
12. Actual payments and revised spending projections for the rest of 2016/17
Tables 3.17 and 3.18 reflect actual payments as at the end of September 2016, projected payments for
the rest of the financial year and the total revised spending in rand value and as a percentage of the
adjusted appropriation per programme and economic classification. The tables also show the 2015/16
Audited outcome.
Table 3.17 : Actual payments and revised spending projections by programme
% of budget % of budget
1. Administration 341 761 491 622 210 363 42.8 281 259 57.2 491 622
2. Agriculture 1 855 535 1 711 598 829 699 48.5 881 899 51.5 1 711 598
3. Rural Development 1 891 13 522 5 017 37.1 8 505 62.9 13 522
Total 2 199 187 2 216 742 1 045 079 47.1 1 171 663 52.9 2 216 742
Projected actual
Adjusted
appropriation
Projected payments
October '16 - March 2017
R thousand
Actual payments
April '16 - September 2016
2015/16 Audited
outcome
Table 3.18 : Actual payments and revised spending projections by economic classification
% of budget % of budget
Current payments 1 738 423 1 576 383 786 034 49.9 790 349 50.1 1 576 383
Compensation of employees 911 392 966 724 473 146 48.9 493 578 51.1 966 724
Goods and services 826 804 609 588 312 888 51.3 296 700 48.7 609 588
Interest and rent on land 227 71 - 71 100.0 71
Transfers and subsidies to: 246 968 465 965 143 358 30.8 322 607 69.2 465 965
Provinces and municipalities 1 313 1 452 620 42.7 832 57.3 1 452
Departmental agencies and accounts 101 306 130 915 27 872 21.3 103 043 78.7 130 915
Higher education institutions 3 000 - 3 000 100.0 3 000
Foreign governments and international organisations - - - - -
Public corporations and private enterprises 112 091 291 431 107 861 37.0 183 570 63.0 291 431
Non-profit institutions 13 770 25 207 - 25 207 100.0 25 207
Households 18 488 13 960 7 005 50.2 6 955 49.8 13 960
Payments for capital assets 213 177 174 394 115 687 66.3 58 707 33.7 174 394
Buildings and other fixed structures 172 688 128 347 102 144 79.6 26 203 20.4 128 347
Machinery and equipment 40 139 44 645 13 441 30.1 31 204 69.9 44 645
Heritage assets - - - - -
Specialised military assets - - - - -
Biological assets 350 1 347 51 3.8 1 296 96.2 1 347
Land and subsoil assets - - - - -
Software and other intangible assets 55 51 92.7 4 7.3 55
Payments for financial assets 619 - - - - -
Total 2 199 187 2 216 742 1 045 079 47.1 1 171 663 52.9 2 216 742
Adjusted
appropriation Projected actual
Projected payments
April '16 - September 2016 October '16 - March 2017
R thousand
Actual payments 2015/16 Audited
outcome

Vote 3: Agriculture and Rural Development
52
The total expenditure at mid-year was at 47.1 per cent of the adjusted budget which is slightly below the
straight-line benchmark of 50 per cent.
Spending against Programme 1 is at 42.8 per cent of the adjusted budget mainly due to vacant posts,
slower than anticipated progress relating to upgrades/renovations at departmental offices, as well as
once-off expenditure on departmental vehicles which are to be delivered in the second half of the year.
Programme 2 shows actual expenditure of R829.699 million or 48.5 per cent of the adjusted budget
spent which is is closely aligned to the straight-line benchmark of 50 per cent. This level of expenditure
is high compared to trends in previous years and is mainly due to the increase in transfer payments in
respect of the acquisition of mechanisation equipment, as well as the department’s 50 per cent grant
funded projects.
Programme 3 is a new programme utilised by the department with effect from 2015/16. The spending
was low at 37.1 per cent as this function is being developed and posts still need to be filled. Also
contributing to the low spending is the provision of a once off R3 million transfer payment to
UNIZULU for the establishment of the centre for Sustainable and Integrated Rural Development which
will be paid in the second half of the year.
As at mid-year, the department is projecting to fully spend the adjusted budget of R2.217 billion.
With regard to economic category:
Spending against Compensation of employees was slightly low at 48.9 per cent against the annual
budget. The low spending is due to delays in the filling of vacant posts such as Deputy Director
General: Rural Development, Chief Director: Scientific Research, Chief Director: Veterinary
Services, District Directors, Director: Supply Chain Management as a result of slow recruitment
processes, as well as unplanned exits, as mentioned above.
Goods and services expenditure was high at mid-year, with 51.3 per cent of the annual budget spent,
as a result of the carry-over of expenditure from 2015/16 relating to feed, fodder and animal
medicine for which a roll-over was approved.
With regard to Transfers and subsidies:
Expenditure against Provinces and municipalities was at 42.7 per cent due to the fact that this is
dependent on when vehicles were purchased.
Spending on Departmental agencies and accounts was lower than the mid-year benchmark of 50
per cent at 21.3 per cent, in line with the actual requirement for project implementation by ADA.
Spending on Public corporations and private enterprises was low compared to the mid-year
benchmark at 37 per cent due to the fact that this item depends on the progress made by
implementing agents and project beneficiaries.
Expenditure against Households was largely on par with mid-year benchmark at 50.2 per cent and
is projecting to be fully spent.
Buildings and other fixed structures was significantly high at 79.6 per cent at mid-year, largely due to
the good progress on infrastructure projects in the Makhathini area, as well as the roll-over requested
for boreholes and stock watering dams where invoices were processed in the first six months.
Machinery and equipment was lower than the mid-year benchmark of 50 per cent. This low rate of
expenditure relates mainly to vehicles ordered but not yet delivered and paid for. A roll-over in
respect of vehicles ordered was approved and this category is anticipated to fully spend at year-end.
Biological assets was significantly lower than the mid-year benchmark at 3.8 per cent. This relates to
animals required for research and training, and these are only acquired when the correct breed is
available and required.
Software and other intangible assets spent R51 000 at mid-year in respect of computer licences
against an annual budget of R55 000 and is projecting to be fully spent at year-end.

Annexure – Vote 3: Agriculture and Rural Development
53
Table 3.A : Summary by economic classification : Agriculture and Rural Development
Unforeseeable/ Other
R thousand unavoidable adjustments
Current payments 1 742 000 10 276 - (97 942) (77 951) - (165 617) 1 576 383
Compensation of employees 983 934 - - (17 210) - - (17 210) 966 724
Salaries and wages 839 933 - - (14 076) - - (14 076) 825 857
Social contributions 144 001 - - (3 134) - - (3 134) 140 867
Goods and services 757 995 10 276 - (80 732) (77 951) - (148 407) 609 588
Administrative fees 1 562 - - 547 - - 547 2 109
Advertising 6 450 - - (490) - - (490) 5 960
Assets less than capitalisation threshold 8 095 - - (3 230) - - (3 230) 4 865
Audit cost: External 6 004 - - (109) - - (109) 5 895
Bursaries: Employees 5 622 - - (90) (4 265) - (4 355) 1 267
Catering: Departmental activities 2 439 - - (76) - - (76) 2 363
Communication (G&S) 29 766 - - 2 770 - - 2 770 32 536
Computer services 42 513 - - 7 784 - - 7 784 50 297
Cons & prof serv: Business and advisory services 637 - - (18) - - (18) 619
Cons & prof serv: Infras and planning 92 918 - - (20 160) (41 894) - (62 054) 30 864
Cons & prof serv: Laboratory services 445 - - (98) - - (98) 347
Cons & prof serv: Scientific and tech services - - - - - - - -
Cons & prof serv: Legal costs 2 473 - - (213) - - (213) 2 260
Contractors 43 837 - - (4 816) (9 500) - (14 316) 29 521
Agency and support / outsourced services 14 683 - - (2 463) - - (2 463) 12 220
Entertainment - - - - - - - -
Fleet services (incl. govt motor transport) 41 721 - - (69) - - (69) 41 652
Housing - - - - - - - -
Inventory: Clothing material and accessories 5 521 - - 1 026 - - 1 026 6 547
Inventory: Farming supplies 167 543 5 645 - (62 639) (22 292) - (79 286) 88 257
Inventory: Food and food supplies - - - - - - - -
Inventory: Fuel, oil and gas 3 199 - - (440) - - (440) 2 759
Inventory: Learner and teacher support material 1 323 - - 30 - - 30 1 353
Inventory: Materials and supplies 11 232 - - (2 348) - - (2 348) 8 884
Inventory: Medical supplies 518 - - (154) - - (154) 364
Inventory: Medicine 17 142 4 631 - 12 261 - - 16 892 34 034
Medsas inventory interface - - - - - - - -
Inventory: Other supplies 4 059 - - 343 - - 343 4 402
Consumable supplies 27 143 - - 3 135 - - 3 135 30 278
Consumable: Stationery, printing and office supplies 9 688 - - (2 368) - - (2 368) 7 320
Operating leases 30 848 - - 646 - - 646 31 494
Property payments 79 402 - - (2 886) - - (2 886) 76 516
Transport provided: Departmental activity 302 - - 190 - - 190 492
Travel and subsistence 79 676 - - (8 791) - - (8 791) 70 885
Training and development 9 951 - - 406 - - 406 10 357
Operating payments 9 586 - - 1 334 - - 1 334 10 920
Venues and facilities 1 697 - - 244 - - 244 1 941
Rental and hiring - - - 10 - - 10 10
Interest and rent on land 71 - - - - - - 71
Interest - - - - - - - -
Rent on land 71 - - - - - - 71
Transfers and subsidies to 249 496 - - 102 942 113 527 - 216 469 465 965
Provinces and municipalities 1 466 - - (14) - - (14) 1 452
Provinces 1 428 - - - - - - 1 428
Provincial Revenue Funds - - - - - - - -
Provincial agencies and funds 1 428 - - - - - - 1 428
Municipalities 38 - - (14) - - (14) 24
Municipalities - - - - - - - -
Municipal agencies and funds 38 - - (14) - - (14) 24
Departmental agencies and accounts 131 350 - - (435) - - (435) 130 915
Social security funds - - - - - - - -
Entities receiving funds 131 350 - - (435) - - (435) 130 915
Higher education institutions - - - 3 000 - - 3 000 3 000
Foreign governments and international organisations - - - - - - - -
Public corporations and private enterprises 83 792 - - 98 377 109 262 - 207 639 291 431
Public corporations 57 130 - - (3 947) 20 326 - 16 379 73 509
Subsidies on production - - - - - - - -
Other transfers 57 130 - - (3 947) 20 326 - 16 379 73 509
Private enterprises 26 662 - - 102 324 88 936 - 191 260 217 922
Subsidies on production - - - - - - - -
Other transfers 26 662 - - 102 324 88 936 - 191 260 217 922
Non-profit institutions 25 207 - - - - - - 25 207
Households 7 681 - - 2 014 4 265 - 6 279 13 960
Social benefits 7 681 - - 2 014 - - 2 014 9 695
Other transfers to households - - - - 4 265 - 4 265 4 265
Payments for capital assets 179 148 35 822 - (5 000) (35 576) - (4 754) 174 394
Buildings and other fixed structures 136 190 27 733 - - (35 576) - (7 843) 128 347
Buildings 26 775 - - - - - - 26 775
Other fixed structures 109 415 27 733 - - (35 576) - (7 843) 101 572
Machinery and equipment 42 267 8 089 - (5 711) - - 2 378 44 645
Transport equipment 18 028 8 089 - - - - 8 089 26 117
Other machinery and equipment 24 239 - - (5 711) - - (5 711) 18 528
Heritage assets - - - - - - - -
Specialised military assets - - - - - - - -
Biological assets 636 - - 711 - - 711 1 347
Land and sub-soil assets - - - - - - - -
Software and other intangible assets 55 - - - - - - 55
Payments for financial assets - - - - - - - -
Total 2 170 644 46 098 - - - - 46 098 2 216 742
Amount to be voted 46 098
Main
appropriation
Adjustments appropriation Total
adjustments
appropriation
Adjusted
appropriationRoll-overs Virement Shifts