Community-environment relations and development of rural
12
Vol. 7(7), pp. 591-602, July 2013 DOI: 10.5897/AJEST11.143 ISSN 1996-0786 © 2013 Academic Journals http://www.academicjournals.org/AJEST African Journal of Environmental Science and Technology Full Length Research Paper Community-environment relations and development of rural communities in Uyo, Nigeria Ikurekong, E. E. and Atser Jacob* Department of Urban and Regional Planning, University of Uyo, PMB 1017 Uyo, Akwa Ibom State, Nigeria. Accepted 6 May, 2013 Primary production activity and environmental resources hold the key to rural development. The range of activities in primary production forms the basis with which rural communities relate with the environment and carry out rural development activities. This study examined the interactions in man- environment system and how such interactions could affect development processes. A multistage sampling framework was adopted in the selection of 400 respondents in eight rural communities in Uyo Local Government Area. Structured questionnaire was applied to collect data on 35 independent and 22 dependent variables. Factor analysis was applied to collapse the two sets of data. Both the 35 independent and 22 dependent variables yielded five new factors for each set of data. Step wise multiple regression analyses model was performed to regress all the five new x-components against each of the five y-components and the results showed strong and positive levels of relationships. The study recommended tripartite-P model to promote sustainable development in rural communities. Key words: Environmental resources, exploitation, rural development. INTRODUCTION Human environment is integral to the overall process of development and includes the relationship and interdependences that exist between people and the natural resources. The environment in short is where we live and where development takes place. The two are inseparable yet their inter-relatedness causes enduring tensions (Evans, 1986). It is the resultant effects of this inter-relationship that indicates the level and trends of rural development in any community. According to Aniah (1995) man and his environment are intractably bound together. The land on which man lives, the air he breathes, the water he uses for domestic, industrial, transportation and other purposes, as well as the resources contained in these ecosystems all impinge on man and vice versa. Within each community, irrespective of the level of development, it is imperative that man determines the extent to which he can effectively exploit process and utilize the resources available to him. However, for such exploitation to be sustainable it has to be within the resources capacity for renewal. The underlying premise is that rural development effort should include the development of the rural population to enable them analyze their relationship with their environment and to raise awareness that natural resources should be exploited and utilized in a way that does not impair process of regeneration. Community-environment rela- tions and rural development entail finding solutions to problems of poverty, malnutrition, health, roads, rural- urban migration, food and housing and planned exploitation of natural resources for better and more meaningful life. In the developing countries of Africa, natural resource exploitation and utilization constitute the mainstay of rural economies. This ranges from activities such as farming, fishing and hunting to fuel-harvesting, lumbering, quarrying and rural craft. These ranges of activities form *Corresponding author.E-mail: [email protected]. Tel: +234 803 675 8258.
-
Upload
khangminh22 -
Category
Documents
-
view
0 -
download
0
Transcript of Community-environment relations and development of rural

Vol. 7(7), pp. 591-602, July 2013
DOI: 10.5897/AJEST11.143
ISSN 1996-0786 © 2013 Academic Journals
http://www.academicjournals.org/AJEST
African Journal of Environmental Science and Technology
Full Length Research Paper
Community-environment relations and development of rural communities in Uyo, Nigeria
Ikurekong, E. E. and Atser Jacob*
Department of Urban and Regional Planning, University of Uyo, PMB 1017 Uyo, Akwa Ibom State, Nigeria.
Accepted 6 May, 2013
Primary production activity and environmental resources hold the key to rural development. The range of activities in primary production forms the basis with which rural communities relate with the environment and carry out rural development activities. This study examined the interactions in man-environment system and how such interactions could affect development processes. A multistage sampling framework was adopted in the selection of 400 respondents in eight rural communities in Uyo Local Government Area. Structured questionnaire was applied to collect data on 35 independent and 22 dependent variables. Factor analysis was applied to collapse the two sets of data. Both the 35 independent and 22 dependent variables yielded five new factors for each set of data. Step wise multiple regression analyses model was performed to regress all the five new x-components against each of the five y-components and the results showed strong and positive levels of relationships. The study recommended tripartite-P model to promote sustainable development in rural communities. Key words: Environmental resources, exploitation, rural development.
INTRODUCTION Human environment is integral to the overall process of development and includes the relationship and interdependences that exist between people and the natural resources. The environment in short is where we live and where development takes place. The two are inseparable yet their inter-relatedness causes enduring tensions (Evans, 1986). It is the resultant effects of this inter-relationship that indicates the level and trends of rural development in any community. According to Aniah (1995) man and his environment are intractably bound together. The land on which man lives, the air he breathes, the water he uses for domestic, industrial, transportation and other purposes, as well as the resources contained in these ecosystems all impinge on man and vice versa. Within each community, irrespective of the level of development, it is imperative that man determines the extent to which he can effectively exploit process and utilize the resources available to him.
However, for such exploitation to be sustainable it has to be within the resources capacity for renewal. The underlying premise is that rural development effort should include the development of the rural population to enable them analyze their relationship with their environment and to raise awareness that natural resources should be exploited and utilized in a way that does not impair process of regeneration. Community-environment rela-tions and rural development entail finding solutions to problems of poverty, malnutrition, health, roads, rural-urban migration, food and housing and planned exploitation of natural resources for better and more meaningful life.
In the developing countries of Africa, natural resource exploitation and utilization constitute the mainstay of rural economies. This ranges from activities such as farming, fishing and hunting to fuel-harvesting, lumbering, quarrying and rural craft. These ranges of activities form
*Corresponding author.E-mail: [email protected]. Tel: +234 803 675 8258.

592 Afr. J. Environ. Sci. Technol. the basis with which community members relate with the environment and participate in rural development activities. Accordingly, Batten in 1957 asserted that “many communities have sought to perpetuate training in self-reliance among appropriate age groups all aimed at ensuring that the communities are appropriately equipped to change and control their environment” (Ekong, 2003). World Bank (1996) listed some of these factors that put rural environment at risk to include lack of capital, poverty and population growth. Environmental and socio-econo-mic concerns that are consistently identified in rural areas include land degradation and deplorable state of infrastructure such as safe drinking water, paved roads, healthcare facilities and educational facilities.
The severity of these mutually re-enforcing constraints is the evidence of the increasing challenge of rural development when one considers the fact that up to 80% of people in the poorest countries still lives in rural areas and are dependant directly or indirectly on the land (Kohlmeyer, 2001). To the villager, for instance, wood fuel possesses the overwhelming advantage of being and it is commonly used as firewood. Being available source of income fuel, wood is harvested and carried over considerable distances into town for sale to urban dwellers (Sampson, 1992). Also, quarrying of sand gravel of building and road construction has contributed substantially to the degradation of the environment. NEST (1991) reported that one spectacular consequence of quarrying is the emergence of borrow pits along major highways and even within urban centres or their suburbs to mark to aid in the reshaping and modification of natural environment. On the other hand, while farming systems, technologies and cultural values and norms of rural communities have constructive and beneficial influence on the rural landscape they have also unleashed destructive measures that have seriously or permanently impaired the original productive power of the landscape. The obvious result of this negative impact is the increasing inability of the environment to provide the necessary sustenance to agricultural and rural develop-ment progammes.
In Uyo Local Government Area of Akwa Ibom State, rural communities occupy a major portion of the land mass. These communities depend directly or indirectly on the exploitation of land. Due to the changed status of Uyo to become a state capital and the gradual increase in population, the hitherto rural communities have increased in population, thereby exerting pressure on the rural land resources. The implication of this trend of development is that the quality of life of the rural dwellers is adversely affected. In most of the rural communities, literacy is still low, spatial inaccessibility is still high while basic social infrastructures such as portable water, electricity, health-care and good housing are in deplorable state. As rural areas where productivity is predicated on the effect-tiveness of man-environment nexus and in spite of the rural-urban linkages, the level of underdevelopment, po-
verty and social deprivation prevalent in the rural communities pose enormous challenges for rapid rural transformation.
Therefore, the increasing inability in community-environment interaction to provide the necessary impetus for rural development calls for investigation. It is hoped that the understanding of the complex linkages of human activities in the rural communities will lead to productive management of naturally occurring resources and in the process will also help in the reorganization of the rural development initiatives for enhanced rural income, rural commerce and environmental health. The extensive ravines and relief in some of the communities have a marked influence on farming (a predominant occupation of the people) and on rural development programmes. Farming in these areas has led to accelerated soil erosion and soil infertilities hence poor yield or output. On the other hand, infrastructural development has greatly been hampered.
Economic activities in these commu-nities are largely subsistent and localized in scope. Commercial farming activities are hampered by land fragmentation. This affects the socio-economic status of the people and their contribution to rural development hence negative impact on community-environment rela-tions and rural develop-ment. Another characteristic in the study area that impin-ges on community-environment relations and rural deve-lopment is the beliefs attached to sacred forests and shrines. The general belief of the people is that the gods and the spirit of their ancestors resides in sacred forests and shrines, therefore attempts at clearing such forests and shrines for rural infra-structural development is always resisted. Restrictions placed on entry into these grooves also influence community-environment relations and development.
MATERIALS AND METHODS The research design used is the survey approach, aims at assessing the effects of primary occupations on rural community development. This design is most appropriate because it permits an accurate assessment of the activities and characteristics of the population under investigation. Data required for the study were on socio-economic activities of the communities and development indicators. Data on socio-economic indicators include farming methods, size of farm, levels of exploitation of land resources, belief systems and cultural practices of the rural communities. Data on development indicators include education and health infrastructure, agricultural storage and marketing facilities, source of drinking water, type of houses and nature of rural roads and levels of income. The striking feature of man-development relationship in the context of rural development is that it places primary production activities at the centre of economic life of rural communities. To examine these relationships, two groups of variables representing socio-economic activities (independent variables) and development indicators (dependent variables) were identified and measured. The socio-economic activities and their specific effects on the environment have wide applicability for rural development hence the variables are interrelated and interdependent. Primary data were obtained from interaction with rural dwellers in the com-
munities through structured questionnaire administration, semi-structured interview and observation.
This study employed a combination factor analysis and multiple regression analysis as statistical tools. The interest in multivariate analytical techniques arises from the fact that isomorphism, that is, the existence of one-on-one relationship is rare. An analysis of community-environment relations involves an understanding of causally related variables. The principal components analysis is a multivariate statistical technique which primarily facilitates the reduction of a large data matrix X1, X2, X3 …Xn into a smaller one Y1, Y2, Y3 …Yn without much loss of information. This it does by using an orthogonal transformation which converts a set of data of possible correlated variables into a set of uncorrelated data called factors. Multiple regressions technique was applied to measure the relationship between the dependent variable and a set of independent variables. It is a multivariate statistical tool which relates quantitatively variations in the dependent variable based on some independent variables. Uyo Local Government Area has 11 political wards. Three of these wards constitute the urban area while 8 wards constitute the rural areas. Due to the rural focus of the study, the 8 wards comprising 63 communities were used as population of the study. With a combined population of 129102 persons and a sample size of 400 respondents derived from Taro Yamane formula for finite population, an average of 6 household heads was sampled per community using proportional representation and systematic random sampling approach. The contribution of human activities to rural community development was investigated using the primary productive activities of the population (crop cultivation and extraction of sand, gravel, laterite and fuel wood). All the 35 socio-economic (independent) variables and 22 rural development (dependent) variables were subjected to factor analysis statistics so as to extract the major factor for X and Y as well as to achieve a parsimonious description of the sets of variables.
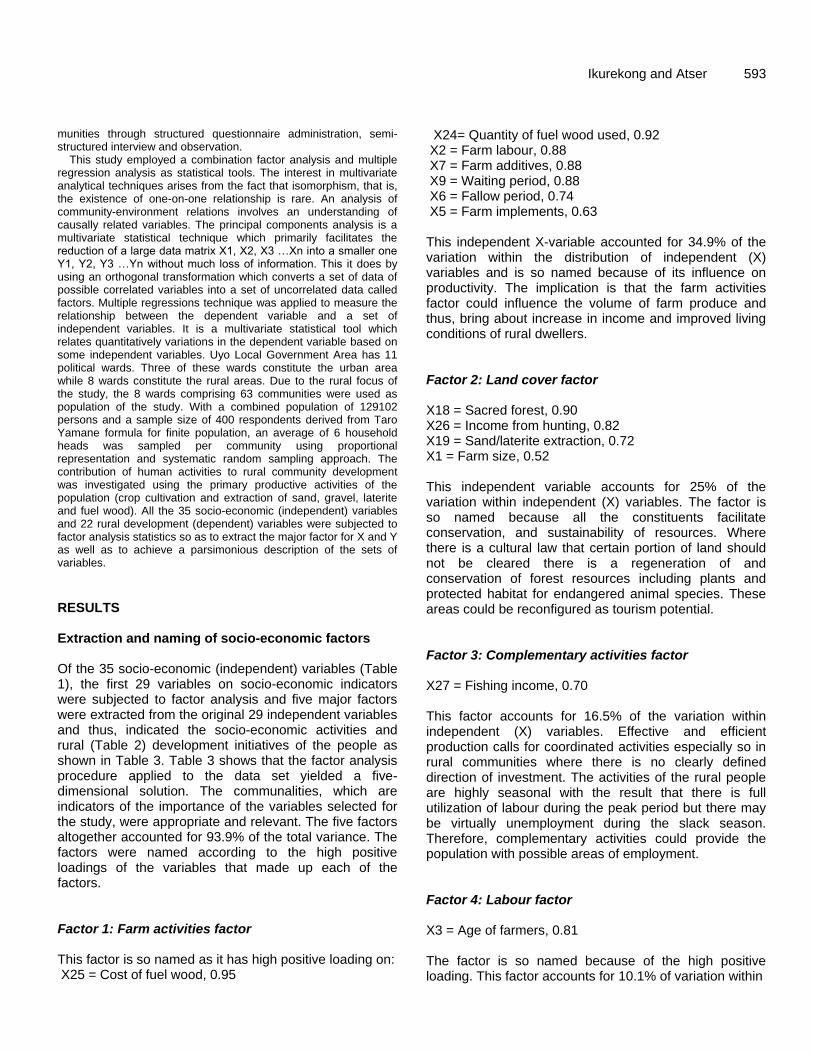
RESULTS Extraction and naming of socio-economic factors Of the 35 socio-economic (independent) variables (Table 1), the first 29 variables on socio-economic indicators were subjected to factor analysis and five major factors were extracted from the original 29 independent variables and thus, indicated the socio-economic activities and rural (Table 2) development initiatives of the people as shown in Table 3. Table 3 shows that the factor analysis procedure applied to the data set yielded a five-dimensional solution. The communalities, which are indicators of the importance of the variables selected for the study, were appropriate and relevant. The five factors altogether accounted for 93.9% of the total variance. The factors were named according to the high positive loadings of the variables that made up each of the factors. Factor 1: Farm activities factor This factor is so named as it has high positive loading on: X25 = Cost of fuel wood, 0.95
Ikurekong and Atser 593 X24= Quantity of fuel wood used, 0.92 X2 = Farm labour, 0.88 X7 = Farm additives, 0.88 X9 = Waiting period, 0.88 X6 = Fallow period, 0.74 X5 = Farm implements, 0.63 This independent X-variable accounted for 34.9% of the variation within the distribution of independent (X) variables and is so named because of its influence on productivity. The implication is that the farm activities factor could influence the volume of farm produce and thus, bring about increase in income and improved living conditions of rural dwellers. Factor 2: Land cover factor X18 = Sacred forest, 0.90 X26 = Income from hunting, 0.82 X19 = Sand/laterite extraction, 0.72 X1 = Farm size, 0.52 This independent variable accounts for 25% of the variation within independent (X) variables. The factor is so named because all the constituents facilitate conservation, and sustainability of resources. Where there is a cultural law that certain portion of land should not be cleared there is a regeneration of and conservation of forest resources including plants and protected habitat for endangered animal species. These areas could be reconfigured as tourism potential. Factor 3: Complementary activities factor X27 = Fishing income, 0.70 This factor accounts for 16.5% of the variation within independent (X) variables. Effective and efficient production calls for coordinated activities especially so in rural communities where there is no clearly defined direction of investment. The activities of the rural people are highly seasonal with the result that there is full utilization of labour during the peak period but there may be virtually unemployment during the slack season. Therefore, complementary activities could provide the population with possible areas of employment. Factor 4: Labour factor X3 = Age of farmers, 0.81 The factor is so named because of the high positive loading. This factor accounts for 10.1% of variation within

594 Afr. J. Environ. Sci. Technol.
Table 1. Socio-economic activities (X- independent variables).
Variable Parameter Justification
X1 Farm size Hectares (m2)
The larger the farm size, the greater the volume of produce and vice-versa. Those having larger farm size cultivate more crops as against those with small farm size. This affects the level of income.
X2 Labour Number Availability and cost of labour determine how many rural farmers can afford to hire. Where labour is scares, the level of cultivation will be less hence reduces output.
X3 Age of farmer Years
Farming activities in the rural area is stressful and energy intensive. The aged who are mostly engaged in farming in rural area lack the stamina hence productivity per unit of farmland is very low.
X4 Crops Type and number
Certain types of crops being more income than others within a farming season. Thus the rates of earning overtime signify and influence the choice and type of crop and rural income.
X5 Farming implements Type and number
Type and number on implement play major roles in farm output. In rural areas farming if rudimentary with the use of simple tools and implement. Farming practices where the hoe and matches are most use implement are not likely to yield much output compare to where mechanized implement are used.
X6 Land tenure period (fallow period)
Number of years Fallow period affect rate of exploitation soil nutrient, hence farm output and rural income.
X7 Farm additives Number Influence soil fertility, output and income.
X8 Farm product sold Percentage (%) Determine rural income, savings and capacity building/utilization.
X9
Waiting period before harvest
Number of months
This represents slack period from farming and much influence the consumption pattern of the people thus affecting capital and any development projects.
X10 Price per bag of garri Naira (N) Determine savings and capital accumulation.
X11 Price per bag of palm oil Naira (N) Determine saving and capital accumulation.
X12 Price per bag of kernel Naira (N) Determine saving and capital accumulation.
X13 Average cost of a plot of land
Naira (N) Affordability influences number of people in farming and income distribution. Increase contribution lead to development activities.
X14 Income from farming Naira (N) Increase income may influence amount of money devoted or set aside for development projects.
X15 Loan received for farming Naira (N) Facilitate volume of production, hence increased rural income.
X16 Farmer cooperative society Number Coordinates activities of rural farmers toward effective and efficient production. Also active on direction of investment.
X17 Average saving per farming Naira (N) By savings a portion of income individual can afford to contribute substantially to the development of community.
X18 Sacred forest shrine etc. Number These could be reconfigured as tourism potential. Also conservation measures for sustainability of resources.
X19 Sand/laterite extraction sites
Number of trucks per month
These could reduce the land area for crop production besides the degradation effect on environment.
X20 Income from sand/literite per month
Naira (N) Quantity sold adds to the rural income and increased earning influences development.
X21 Amount of Osusu per month
Naira (N) This increases the amount of money available for investment by and individual overtime.
X22 Distance to farm Km The nearness to and from farm influences type of crops cultivated, care and yield
X23 Distance to market (accessibility)
Km This influences what could be conveyed to the markets and the violence of sale hence rural income
X24 Fuel wood used per month. Number of bindles
Determines level of exploitation and utilization of forest/vegetation resource and exposure of land to erosion.
X25 Price per bundles of fuel wood
Naira (N) As a source of rural income, the volume of sale contribute to rural economy and hence development
X26 Income from hunting Naira (N) Determine what is set aside for development activities. Improves nutrient intakes and health of rural people

Ikurekong and Atser 595
Table 1. Contd.
X27 Income from fishing Naira (N) Determine what is set aside for development activities. . Improves nutrient intakes and health of rural people
X28 Income from cane craft (rural craft)
Naira (N) Determine what is set aside for development activities. Tourism potential hence rural income
X29 Income from sales of stakes for pumpkin
Naira (N) Determine what is set aside for development activities. Facilitates growth of related crops.
X30 Quantity of Sand extracted per week
Number of trucks in cubic meters
Determine level and rate of exploitation
X31 Quantity of gravel extracted per week
Number of trucks in cubic meter
Determine level and rate of exploitation
X32 Quantity of timber harvested per month
Number of logs Determine level and rate exploitation
X33 Quantity of fire wood harvested per week
Number of bundle
Determine rate of exploitation
X34 Average quantity of farm produced per season
Number in the unit of crops
Determine rate of exploitation
X35 Quantity of ‘ndisa’ yam stakes harvested per season
Number of bundle
Determine rate of exploitation
Source: authors’ field survey (2007).
Table 2. Rural development indicators (Y-dependent variables).
Variable Parameter Justification
Y1 School Number Development of human capital. Promotes literacy and education of the rural populace.
Y2 Drinking water Distance in km
Enhance rural health hence improves economic activity and productivity. It affects quantity and quality available, which affect household hygiene and to a large extent affect environment health of the community.
Y3 Houses connected to electric
Electricity attracts rural enterprise, facilitates rural commerce and improve living condition. Create enabling environment for economic growth
Y4 Health facilities Number
A healthy workforce is a productive one. Without good health no society or individual can develop. The richness of development depends on how healthy the populace is. Hence Millennium Development Goals number 4, 5 and 6 are directly link to the promotion of good health services in our society. Health care facilities is therefore essential for improve economic activities
Y5 Skill acquisition center Number
Skill acquisition finds application Development Goals number 1with focus on poverty eradication, which focuses on development of skill to raise the component of people for income generation. The establishment of skill acquisition centres in rural areas is one means of empowering the people individually and collectively to contribute to rural economic development.
Y6 Community bank Number Create enabling environment for economics growth provides loan rural farmer. Efficient management of rural income. Also provides employment
Y7 Culture( sacred forest shrines etc)
Hectares (m2) and Number
and size Biodiversity conservation could be reconfigured for tourism purpose

596 Afr. J. Environ. Sci. Technol. Table 2. Contd.
Y8 Agricultural storage facilities Number Efficient management and utilization of environmental resources. Enhance rural income. Provides employment
Y9 Co-operative development shop Number
Co-ordinate rural commerce for efficient and effective exchange of goods and services. Improves employment
Y10 Length of paved roads Km and number Create enabling environment for economic growth facilitates movement of goods and persons hence improves rural investments and aesthetics.
Y11 Local industries Number and type
The local industries offer employment especially for youth who otherwise will be idle and restive with adverse consequent to the community. As the saying goes’’ an idle man is a devil workshop’’ Local industries enhance economic growth. Ensures that some percentage of the bulk of the body of natural resources are retained or captured locally.
Y12 Adult literacy centres Number Provide education and training hence reducing literacy level. Improves rural living condition.
Y13 Motor park Number Facilitates movement of good, persons and services to and from rural areas. Enhance rural income and live ability. Farmer rely on these for easy movement production.
Y14 Markets Number Farmers rely on this for exchange of their products. Facilities rural commerce hence income.
Y15 Village hall Number Facilities effective administration and transmission of information. Rules and regulations within the community.
Y16 Children in school Number Indicates level and potentials human resources utilization for further development.
Y17 Income from farming Naira (N) Indicate or measures development potentials of the community, as well as level of exploitation and utilization of resources.
Y18 Income from fuel wood Naira (N) Indicate or measures development potentials of the community, as well as level of exploitation and utilization of resources.
Y19 Income from sand, laterite Naira (N) Indicate or measures development potentials of the community, as well as level of exploitation and utilization of resources.
Y20 Income from hunting Naira (N) Indicate or measures development potentials of the community, as well as level of exploitation and utilization of resources.
Y21 Income from fishing Naira (N) Indicate or measures development potentials of the community, as well as level of exploitation and utilization of resources.
Y22 Income from rural craft Naira (N) Indicate or measures development potentials of the community, as well as level of exploitation and utilization of resources.
Source: Authors’ field survey (October, 2007).
the independent (X) variables. Rural development is handicapped by the quality and quantity of its human resources. With the pull exerted by the urban sector, rural areas are left with younger and older elements of the population who are less productive but more consumptive labour force. Fuller and effective utilization of available productive rural resources is therefore a function of the age of farmers.
Factor 5: Distance factor X22 = Distance to farm, 0.56 This factor accounts for 7.3% of the variation within the independent (X) variables. This factor is so named
because of its influence on primary production activities. The farm land activities are characterized by fragmented landholdings. Enormous time is wasted moving from one plot to another. The unprogressive nature of farm tenancy arrangement that is at work, the conditions of tenancy are fluid and informal and could involve plot allocation of several kilometers away from home. Therefore the distance to farm land does not only influence the number of people meaningfully engaged in farming but also the level of farmers’ productivity.
Extraction and naming of rural development factors Five major factors were extracted from the twenty two 22) original variables in the data set after being

Ikurekong and Atser 597
Table 3. Rotated factor matrix for socio-economic activities in Uyo rural communities.
S/N X-variable F1 F2 F3 F4 F5 Communality
X1 Farm size 0.31755 0.53639 0.70579 0.15842 0.29003 0.99591
X2 Labour 0.88429 0.16036 0.12669 0.00800 0.35331 0.94863
X3 Age of farmers 0.44526 0.10423 0.21707 0.81287 0.12724 0.93319
X4 Crops 0.70617 0.10213 0.56691 0.20923 0.08073 0.88079
X5 Farming implements 0.63209 0.72180 0.21266 0.06726 0.5435 0.97324
X6 Land fallow period 0.74333 0.00408 0.35232 0.03794 0.49928 0.92741
X7 Farm additives 0.88439 0.16036 0.12669 0.00800 0.35331 0.94863
X8 Farm product sold 0.29484 0.46003 0.66136 0.44854 0.20536 0.97931
X9 Waiting period before harvest 0.88429 0.16036 0.12669 0.00800 0.35311 0.94863
X10 Price per bag of garri 0.72180 0.35572 0.52528 0.09238 0.24437 0.99169
X11 Price per ton of palm oil 0.80995 0.31904 0.45938 0.19013 0.29803 0.98874
X12 Price per bag of kernel -0.11426 0.22861 -0.12075 0.05418 0.31106 0.90211
X13 Average cost of a plot of land 0.60605 0.54806 0.34287 0.19013 0.29803 0.91020
X14 Income from farming 0.31755 0.53639 0.70579 0.15842 0.29003 0.99591
X15 Loan received for farming 0.26625 0.41286 -0.14022 0.32171 -0.06441 0.84396
X16 Farmers cooperative society 0.06448 0.72212 0.39988 0.42642 0.02148 0.86781
X17 Average Savings per farming season 0.43563 0.59174 0.29757 0.33431 0.18072 0.77290
X18 Sacred forest shrine etc. 0.11583 0.90470 0.11773 0.20242 0.00237 0.88674
X19 Sand/laterite extraction sites 0.04020 0.72394 0.46998 0.16609 0.17946 0.80638
X20 Income from sand/laterite per month 0.88429 0.16036 0.12669 0.00800 0.35331 0.89533
X21 Amount of Osusu per month (saving) 0.57400 0.73870 0.24500 0.01255 0.24937 0.99775
X22 Distance to farm 0.43864 0.06191 0.42490 0.49444 0.56467 0.94010
X23 Distance to market (spatial access) 0.26299 0.86524 0.19139 0.01619 0.13458 0.87281
X24 Fuel wood used per month 0.92465 0.09509 0.08970 0.24101 0.21261 0.97353
X25 Price per bundle of fuel wood 0.95033 0.09601 0.27968 0.02683 0.08523 0.99855
X26 Income from hunting 0.47651 0.82390 0.08573 0.22757 0.12954 0.98180
X27 Income from fishing 0.27520 0.58130 0.69960 0.21882 0.08434 0.95811
X28 Income from cane craft (rural craft) 0.78907 0.04023 0.44354 0.36351 0.11376 0.96607
X29 Income from stakes for pumpkin 0.32557 0.13147 0.46498 0.78680 0.19742 0.99753
Eigen Value 9.42239 6.75068 4.45495 2.74039 1.97112
Variance (%) 34.9 25.0 16.5 10.1 7.3
Cumulative (%) 34.9 39.9 76.4 86.5 93.9
Source: Authors’ field data (2007).
(subjected to factor analysis. These were referred to as development factors and altogether accounted for 94.7% of the total variance in the data set of Y variables as Table 4 shows. The communalities are high and thereby indicating the importance of the variables considered in the study and were named according to the high positive loading of the variables.
Factor 1: Rural infrastructure factor Y3– house connected to electricity, 0.92 Y11– Local industries, 0.90 Y4– Health facilities, 0.88 Y1– Schools, 0.77 Y10– Length o f paved roads, 0.79
This was so named because it loads highly and positively on all activities within the communities. This factor accounts for 44.8% of the total variation in the data set of Y-dependent variables it measures. An examination of this factor reveals lapses in the provision of rural infrastructures. The presence of adequate infrastructures enhances the production activities, promotes literacy and education in case of schools. It is also a measure of social satisfaction in the physical development of any community.
Factor 2: Rural income factor Y21– Income from fishing, 0.74 Y9– Co-operative development shop, 0.68

598 Afr. J. Environ. Sci. Technol.
Table 4. Rotated factor matrix for rural development indicators in Uyo rural communities.
S/N Y-variable F1 F2 F3 F4 F5 Communality
Y1 School 77088 -0.02276 -0.47269 0.23816 0.32761 0.98227
Y2 Drinking water -0.37668 0.50684 0.66584 0.09368 0.37243 0.98960
Y3 House connected to electric 0.92394 -0.31659 0.10864 0.00102 0.04618 0.96783
Y4 Health facilities 0.88923 0.13129 -0.05704 0.32109 0.21019 0.95849
Y5 Skill acquisition centre 0.79814 -0.50953 0.28946 0.02881 0.13046 0.99828
Y6 Community bank 0.79814 -0.50953 0.28946 0.02881 0.13046 0.99828
Y7 Cultural centre (sacred forest, shrines) 0.73167 0.54044 -0.08939 -0.19931 -0.29808 0.96397
Y8 Agricultural storage facilities 0.34117 0.28401 -0.15721 0.29642 0.50162 0.91106
Y9 Co-operative development shop 0.36614 0.68142 -0.36414 0.39159 0.14475 0.90528
Y10 Length of paved road 0.79814 -0.80953 0.28946 0.02881 0.13046 0.90528
Y11 Local industries 0.90111 0.13453 -0.16535 -0.32165 -0.16698 0.98878
Y12 Adult literacy centres 0.79814 -0.50953 0.28946 0.02881 0.13046 0.99828
Y13 Motor park 0.14411 -0.42867 -0.24419 -0.27114 0.03886 0.80113
Y14 Markets 0.80661 31410 -0.10550 0.16953 0.08606 0.79655
Y15 Village hall 0.14393 0.21545 0.53037 0.61328 -0.32998 0.83343
Y16 Children in school 0.91603 -0.01998 -0.04117 -0.02869 -0.24846 0.90375
Y17 Income from farming 0.14389 0.27972 0.79775 -0.47634 -0.19003 0.99836
Y18 Income from fuel wood 0.71593 0.51084 0.15953 0.07999 -0.39105 0.95828
Y19 Income from sand, laterite 0.27302 0.16632 -0.10802 -0.83594 0.34616 0.93250
Y20 Income from hunting 0.46764 0.65838 0.35401 -0.29621 0.10917 0.97713
Y21 Income from fishing 0.41985 0.74274 -0.44112 -0.01537 0.18407 0.95663
Y22 Income from rural craft -0.20150 0.45851 0.71585 0.24180 0.33398 0.93328
Eigen value 80.96382 30.89552 20.98492 10.95226 10.14234
Variance (%) 440.8 190.5 140.9 90.8 50.7
Cumulative (%) 440.8 640.3 790.2 890.0 940.7
Source: Authors’ field data (2007) Y20– Income from hunting, 0.65 Y18– Income from fuel wood, 0.51 The factor accounts for 19.5% of the variables within the Y-independent variables. This measures level of income, the development potentials of the communities and the financial stability of the dwellers and ensures a level of livelihood that may be sustainable. Factor 3: Rural employment factor Y17– Income from farming, 0.79 Y2 – Income from rural craft, 0.71 This factor accounts for 14.9% of the variation within the Y-dependent variables. This is so named because it measures the level of stability and movement of human capital within rural communities. The entire population of labour force mostly the aged is involved in the factor. The introduction of modern farming techniques and adequate incentives may help to check rural-urban drift of the rural-farm labour force.
Factor 4: Rural administration factor Y15– Village hall, 0.61 This factor accounts for 9.8% of the variance within the Y-independent variables and is so named because it demonstrates the capacity of rural communities to adapt to their cultural and traditional values with socio-economic development. The level and pattern of development of communities is thus a measure of the healthy relationship between families, communities and clans. Effective administrative set in rural areas could facilitate mobilization and sensitization of the people for collective developmental activities. Factor 5– Agricultural storage facilities factor Y8– Agricultural storage facilities, 0.50 This factor accounts for 5.7% of the variance within the Y-dependent variables. It loads highly and positively on the variable of development of rural communities.

Ikurekong and Atser 599
Table 5. Impact of socio-economic activities on rural development.
Parameters Y1 Y2 Y3 Y4 Y5
Multiple R 0.82403 0.86513 0.84130 0.93748 0.57854
R square 0.67903 0.74845 0.70779 0.87887 0.33470
Adjusted R2 0.62554 0.11956 0.65909 0.57606 -1.32854
Standard Error 0.61193 0.93832 0.58388 0.65111 1.52596
F 12.69339 1.19012 14.53321 2.90235 0.20124
Sig. F 0.0119 0.5154 0.0088 0.2759 0.9352
Table 6. Level of resource exploitation and rural development.
Parameters Y1 Y2 Y3 Y4 Y5
Multiple R 0.99976 0.75649 0.99976 0.71596 0.84003
R square 0.99952 0.57228 0.98433 0.51259 0.70565
Adjusted R2 0.99663 0.50099 0.96891 0.43136 -1.06045
Standard Error 0.5806 0.70640 0.78236 0.75408 1.43543
F 345.941 8.02788 5.19384 6.31003 0.39955
Sig. F 0.0441 0.0298 0.3236 0.0458 0.8353
Agricultural storage facilities are vital to rural development. This is due to the perishability nature of rural produce. The provision of these facilities will reduce wastage during seasons of surplus harvest. Impacts of socio-economic activities on rural development This relationship was investigated using a multiple correlation/regression analysis. A multiple correlation/regression analysis of the five extracted X-independent variables on each of the five extracted Y-dependent variables defines the strength of association of the two sets of variables as well as the causal relationship between the variables. For the Y1 factor defined and named as Rural Infrastructure Factor, a multiple correlation coefficient of R = 0.82402 was obtained indicating that about 67.9% of this factor is impacted by the five extracted X- (components) factors. The square of the multiple correlations co-efficient R indicates the degree of predictability of the value of Y with all the X- components as inputs. This result of the multiple correlation/regression analysis is presented in Table 5.
In the same way, the multiple correlation/regression analysis for the second Y2 factor named as rural income factor showed strength of association of 0.86513. This means that 74.8% of the total value of Y is explained by the five extracted X independent factors. This indicates that the five X-component factors as inputs for factor 2 yields a very high significant. For the third Y3 factor (Rural Employment factor) the multiple correlation
coefficient of 0.84130 indicates that about 70.8% of this factor is contributed by five extracted X-independent factors. The square of the correlation coefficient of 0.70779 indicates that about 70.7% can be predicted considering all the inputs of X. For the Rural Adminis-tration (Y4) factor, the multiple correlation coefficient of 0.93748 indicates that about 87.9% of this factor is contributed by five extracted X-independent factors. The square of the correlation coefficient of 0.87887 indicates that about 87.8% of Y can be predicted considering all the inputs of X. In the same way, the multiple corre-lation/regression analysis for the Y5 factor named as rural health reveals strength of association of 0.57854 as a multiple correlation coefficient R. This is about 33.5% contribution to the factor named as rural health factor. This is not very significant as F = 0.9352. Level of resource exploitation and rural development This relationship was investigated using the six X- variables (X30 – X35) to test the relationship between the rate of exploitation and rural development in the study area. Multiple regressions of the six X-independent variables were carried out on the five-y extracted development factors and the result is presented in Table 6. For Y1 factor defined and named as rural infras-tructure, a high multiple correlation coefficient (R = 0.99976) was obtained. The square of the multiple corre-lations co-efficient is 0.99952 indicating that 99% of the total value of Y can be predicted with the six variables as inputs. This result is very significant as F = 0.0441. In the same way, the multiple correlation/regression analy-
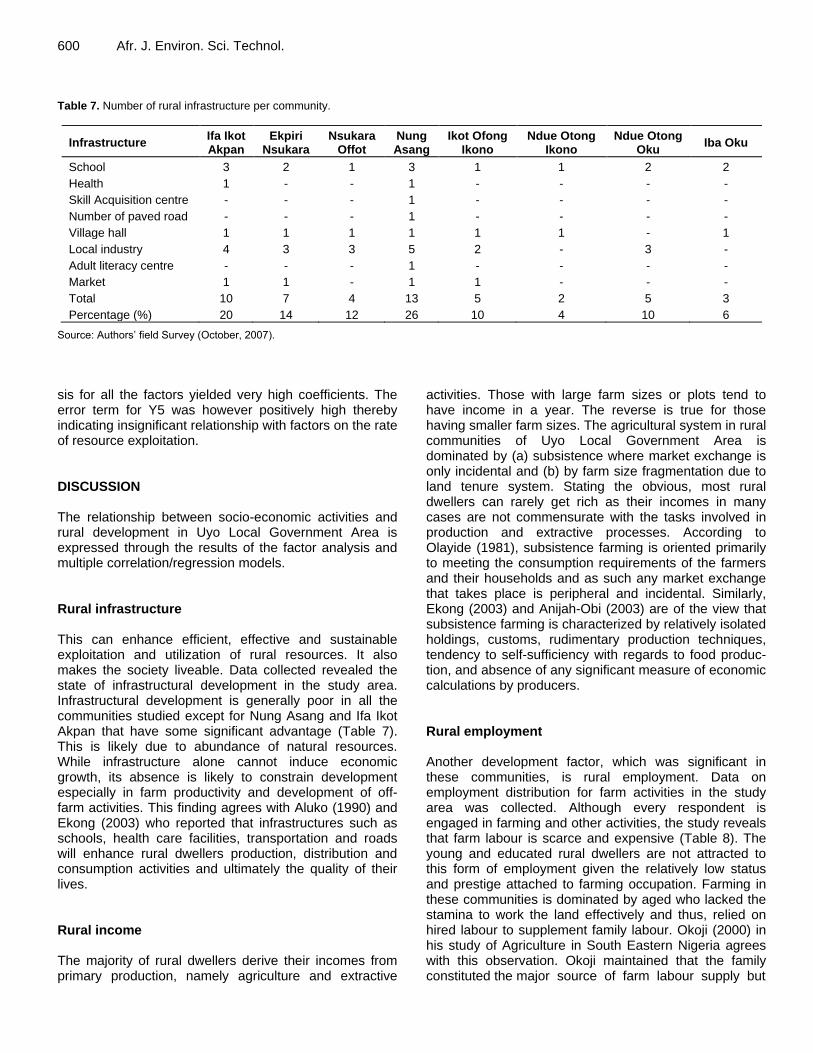
600 Afr. J. Environ. Sci. Technol. Table 7. Number of rural infrastructure per community.
Infrastructure Ifa Ikot Akpan
Ekpiri Nsukara
Nsukara Offot
Nung Asang
Ikot Ofong Ikono
Ndue Otong Ikono
Ndue Otong Oku
Iba Oku
School 3 2 1 3 1 1 2 2
Health 1 - - 1 - - - -
Skill Acquisition centre - - - 1 - - - -
Number of paved road - - - 1 - - - -
Village hall 1 1 1 1 1 1 - 1
Local industry 4 3 3 5 2 - 3 -
Adult literacy centre - - - 1 - - - -
Market 1 1 - 1 1 - - -
Total 10 7 4 13 5 2 5 3
Percentage (%) 20 14 12 26 10 4 10 6
Source: Authors’ field Survey (October, 2007).
sis for all the factors yielded very high coefficients. The error term for Y5 was however positively high thereby indicating insignificant relationship with factors on the rate of resource exploitation. DISCUSSION The relationship between socio-economic activities and rural development in Uyo Local Government Area is expressed through the results of the factor analysis and multiple correlation/regression models. Rural infrastructure This can enhance efficient, effective and sustainable exploitation and utilization of rural resources. It also makes the society liveable. Data collected revealed the state of infrastructural development in the study area. Infrastructural development is generally poor in all the communities studied except for Nung Asang and Ifa Ikot Akpan that have some significant advantage (Table 7). This is likely due to abundance of natural resources. While infrastructure alone cannot induce economic growth, its absence is likely to constrain development especially in farm productivity and development of off-farm activities. This finding agrees with Aluko (1990) and Ekong (2003) who reported that infrastructures such as schools, health care facilities, transportation and roads will enhance rural dwellers production, distribution and consumption activities and ultimately the quality of their lives. Rural income The majority of rural dwellers derive their incomes from primary production, namely agriculture and extractive
activities. Those with large farm sizes or plots tend to have income in a year. The reverse is true for those having smaller farm sizes. The agricultural system in rural communities of Uyo Local Government Area is dominated by (a) subsistence where market exchange is only incidental and (b) by farm size fragmentation due to land tenure system. Stating the obvious, most rural dwellers can rarely get rich as their incomes in many cases are not commensurate with the tasks involved in production and extractive processes. According to Olayide (1981), subsistence farming is oriented primarily to meeting the consumption requirements of the farmers and their households and as such any market exchange that takes place is peripheral and incidental. Similarly, Ekong (2003) and Anijah-Obi (2003) are of the view that subsistence farming is characterized by relatively isolated holdings, customs, rudimentary production techniques, tendency to self-sufficiency with regards to food produc-tion, and absence of any significant measure of economic calculations by producers. Rural employment Another development factor, which was significant in these communities, is rural employment. Data on employment distribution for farm activities in the study area was collected. Although every respondent is engaged in farming and other activities, the study reveals that farm labour is scarce and expensive (Table 8). The young and educated rural dwellers are not attracted to this form of employment given the relatively low status and prestige attached to farming occupation. Farming in these communities is dominated by aged who lacked the stamina to work the land effectively and thus, relied on hired labour to supplement family labour. Okoji (2000) in his study of Agriculture in South Eastern Nigeria agrees with this observation. Okoji maintained that the family constituted the major source of farm labour supply but

Ikurekong and Atser 601
Table 8. Employment distribution in farming activity per community.
Community Number of respondents (farmers) Number employed in farming Percentage of employed
Ifa Atai 76 228 25.3
Ifa Ikot Akpan 26 52 5.8
Ekpiri Nusara 55 57 6.3
Nsukara Offot 116 232 25.8
Nung Asang 36 108 12.0
Ikot Offong Ikono 19 57 6.3
Ndue Otong Oku 43 129 14.3
Iba Oku 18 36 4.0
Total 389 899 100
Source: Authors’ field survey (October, 2007).
present supplies from this source have been drastically reduced and as a result farmers are increasingly dependent on hired labour, however, because of their lean financial resources, labour has become the most expensive and most restrictive of the factors of agricultural production in the region. Similarly, Todaro and Smith (2005) list three forces restricting the growth of output of rural subsistence farming to include labour scarcity during the busiest part of the growing season, planting and weeding times. They found out that the demand for workers during the early weeks of this season usually exceeds all available rural labour supplied.
Rural administration
Another development factor is rural administration. The rural communities’ shared beliefs are nurtured and cherished by the people. This is expressed through restriction to sacred forests, streams and exploitation of palm fruits for some specified periods. There exist kinship relations, mutual trust and clean environment, built around local administrative rules and custom. An examination of this factor however reveals some lapses especially in the enforcement of restrictions covering the exploitation of certain naturally occurring resources. For instance, sand, gravels and laterite in some of these communities are extracted with little or no regards to its adverse effects on the environment. Streams, the main source of water supply in these communities, are polluted. Village roads are seriously damaged by heavy duty tippers which carry the sand and gravels. Also communities’ forests are fast disappearing due to uncontrolled logging and firewood exploitation. The administration should strive to harmonize effective use of its natural resources with conservation and protection of its environment as cherished by its customs and tradition.
Rural health The fifth factor, which is rural health, is crucial to human
socio-economic activities. In fact, it constitutes a significant impact on primary production and other related activities. A healthy society is a productive society and the richness of development depends on how healthy the populaces are. Health indicator in Uyo rural communities is very poor as exemplified by the absence of orthodox health facilities. A close examination of the factor reveals a relative reflection and influence of belief and value system of rural dwellers. The rural communities rely heavily on indigenous and traditional health practices and their herbal knowledge than orthodox medicines. They prefer consulting the herbalists and prayer homes. This likely explains a low rating of health factor in socio-economic activities. However, a sub-group engaging in the extractive activities such as sand, gravel and logging seems to be more conscious of health need to maintain fitness for their strenuous work. This create in them appreciation for proper medical services. This subgroup tends to rely on the orthodox medicine; hence they visit the patent medicine shops where available for substitute to the herbal medicine. It should be noted that farming and extractive activities demand a great deal of energy and without good health there will be no stamina to carryout cultivation processes. Good health care facilities are therefore essential for any productive and sustainable development activities. Conclusion and recommendations The research focused on the numerous links between the community and environment that affects rural development. It highlighted major factors that significantly influence rural development in the study area using chosen statistical models. The implication of the results is that there are five major factors that could have significant influence on rural community development and thus, suggest the articulation of policies towards such issues. The farm activities factor has the potentials to influence rural development and therefore the existing customary land tenure practices, which are at variance with larger farm sizes, should be checked to permit

602 Afr. J. Environ. Sci. Technol. acquisition of larger farm plots for agricultural activities. Other activities such as labour, farm activities, cropping, fuel wood and fallow period dominate this sector. It has a paramount influence and needs a focus of rural development policy. In the health sector, it is recom-mended that collaborative efforts involving the public and private sectors should be encouraged. Adequate provi-sion should be made for safe drinking water supply in rural communities while access to healthcare facilities should be made free for the rural populace. Above all, Sanitary Inspectorate Department should be set up to monitor levels of sanitation in rural communities. Given that rural infrastructure generate a number of positive externalities and facilitate rural commerce and income, the study recommends public-private partnership in the provision and maintenance of basic rural infrastructure. The exploitation of common resources such as sand and gravel could improve rural economy and as such should be carried out under the supervision of village develop-ment committee in order not to undermine the sustain-ability of the environment in the process of resources exploitation as well as to channel the monetary gain into useful community oriented development projects that will enhance welfare of the community as a whole rather than individual gain.
REFERENCES Aluko SA (1990). Industry in the Rural Setting. In Otite & Ikali (Eds)
Readings in Nigerian Rural Society. Heinemann Educational Books (Nig.) Ltd; Ibadan.
Aniah EJ (1995). Environment and Development Perspectives. In Lawal N (Ed.) Education for Sustainable Development. Macmillan Nig. Pubs. Ltd; Ibadan.
Anijah-Obi FN (2003). Fundamentals of Environmental Education and Mgt. University of Calabar Press,Calabar.
Ekong EE (2003). Introduction to Rural Sociology. Dove Pubs; Uyo Evans HZ (1986). Employers and the Environmental Challenges. ILO,
Switzerland. Kohlmeyer C (2001). Rural Development: A Reference Framework.
Federal Ministry of Economic Coop. & Dev. NEST (1991). Nigeria’s Threatened Environment: A National Profile.
NEST, Ibadan. Okoji MA (2000). Agriculture. In Inyang I. B (Ed.) South-Eastern
Nigeria: Its Environment. Abaan Press, Kaduna. Olayide NO (1981). Elements of Rural Economics. University of Ibadan
Press, Ibadan. Sampson ES (1992). Energy Resources. In Gleav MB (Ed.) Tropical
African Development: A geographical Perspective. Longman, London.
Todaro MP, Smith SC (2005). Economic Development. Pearson Educational Pubs; India.
World Bank (1996). Towards Environmentally Sustainable Dev. in Sub-Saharan Africa: A World Bank Agenda. Washington DC.