Rural infrastructure for inclusive rural transformation - WUR ...
221
Rural infrastructure for inclusive rural transformation: Case studies on roads, markets and irrigation from Bangladesh and the Philippines Daniel Higgins Rural infrastructure for inclusive rural transformation: Case studies on roads, markets and irrigation from Bangladesh and the Philippines Daniel Higgins 2021
-
Upload
khangminh22 -
Category
Documents
-
view
3 -
download
0
Transcript of Rural infrastructure for inclusive rural transformation - WUR ...

Rural infrastructure for inclusive rural
transformation:
Case studies on roads, markets and irrigation from
Bangladesh and the Philippines
Daniel Higgins
Ru
ral
infr
astr
uct
ure
fo
r in
clu
siv
e ru
ral
tran
sfo
rmat
ion
: C
ase
stu
die
s on
ro
ads,
mar
ket
s an
d i
rrig
atio
n f
rom
Ban
gla
des
h a
nd t
he
Ph
ilip
pin
es
Dan
iel
Hig
gin
s 2
021


Propositions
1. Improved rural infrastructure - under the right conditions - is an important tool
to promote inclusive rural transformation.
(this thesis)
2. Improvements in crop yields is just one of several indicators of a successful rural
development project.
(this thesis)
3. When women’s rights are restricted, promoting gender equity requires more than
just improving infrastructure.
4. It is possible to conduct robust impact evaluations using only ex-post data.
5. External PhD programmes can offer a valuable alternative for those who want to
continue to work while completing their studies.
6. Working towards a goal is often more satisfying than achieving it.
Proposition belonging to the thesis, entitled
Rural infrastructure for inclusive rural transformation: Case studies on roads, markets and
irrigation from Bangladesh and the Philippines
Daniel Higgins
Wageningen, 10 January 2022

2
Rural infrastructure for inclusive rural transformation:
Case studies on roads, markets and irrigation from
Bangladesh and the Philippines
Daniel Higgins

Thesis committee
Promoter
Prof. Dr. Ruerd Ruben
Professor Impact Assessment for Food Systems
Wageningen University & Research
Co-promotor
Prof. Dr. Erwin Bulte
Professor Development Economics
Wageningen University & Research
Other members
Prof. Francisco Alpizar Rodriquez, Wageningen University & Research, the Netherlands
Prof. Dr. Arjun Bedi, Erasmus University Rotterdam, the Netherlands
Prof. Dr. Paul Winters, University of Notre Dame
Dr. Rob Kuijpers, KIT Royal Tropical Institute, the Netherlands
This research was conducted under the auspices of the Wageningen School of Social Science
(WASS)

4
Rural infrastructure for inclusive rural transformation:
Case studies on roads, markets and irrigation from
Bangladesh and the Philippines
Daniel Higgins
Thesis
submitted in fulfilment of the requirements for the degree of doctor at Wageningen University
by the authority of the Rector Magnificus
Prof. Dr. A.P.J. Mol,
in the presence of the
Thesis Committee appointed by the Academic Board
to be defended in public
on Monday 10 January 2022
at 4 p.m. in the Aula

Daniel Higgins
Rural infrastructure for inclusive rural transformation in developing countries: Case studies on roads,
markets and irrigation from Bangladesh and the Philippines
209 pages.
PhD thesis, Wageningen University, Wageningen, the Netherlands (2021)
With references, with summary in English
ISBN 978-94-6343-787-5
DOI https://doi.org/10.18174/554722

6
Financial support from Wageningen University for printing this thesis is gratefully
acknowledged. No other financial support was provided for this thesis.
Printed by ProefschriftMaken

Contents
List of abbreviations………………………………………………………………………..…………..…………………………….….vii
Chapter 1. Introduction ................................................................................................................ 1
Chapter 2. What role can small-scale irrigation play in promoting inclusive rural
transformation? Evidence from smallholder rice farmers in the Philippines ............................ 31
Chapter 3. Measuring the impact of improved irrigation on the productivity of smallholder rice
farmers in the Philippines: A Stochastic Meta-Frontier analysis............................................... 57
Chapter 4. How can climate resilient infrastructure stimulate inclusive rural transformation?
Evidence from southwest Bangladesh ....................................................................................... 97
Chapter 5. Protecting farm productivity from the effects of seasonal floods in Bangladesh:
A Stochastic Meta-Frontier analysis of a climate resilient infrastructure project .................. 121
Chapter 6. Conclusion .............................................................................................................. 149
References ................................................................................................................................ 169
Summary .................................................................................................................................. 205
Acknowledgements .................................................................................................................. 209

8
List of abbreviations
ATE Average Treatment Effect
ATET Average Treatment Effect on the Treated
CCRIP Coastal Climate Resilient Infrastructure Project
CEM Coarsened Exact Matching
CIS Communal Irrigation System
IA Irrigators’ Association
IFAD International Fund for Agricultural Development
IPTW Inverse Probability of Treatment Weighting
IPWRA Inverse Probability Weighted Regression Adjustment
IRPEP Irrigated Rice Production Enhancement Project
FFS Farmer Field Schools
FGD Focus Group Discussion
FIES Food Insecurity Experience Scale
HDDS Household Dietary Diversity Scale
KII Key Informant Interview
LCS Labour Contracting Societies
MF Deterministic Meta-Frontier
MMC Market Management Committee
MTE Meta-Technical Efficiency
PSM Propensity Score Matching
SC-SPF Selectivity Corrected Stochastic Production Frontier
SDGs Sustainable Development Goals
SMD Standardised Mean Difference
SPF Stochastic Production Frontier
SMF Stochastic Meta-Frontier
TE Technical Efficiency
TGR Technology Gap Ratio
VR Variance Ratio


Chapter 1
Introduction

Ch 1. Introduction
2
1.1 Inclusive rural transformation and the Sustainable Development
Goals (SDGs)
Many of the goals outlined in the 2030 Agenda for Sustainable Development will not be achieved
unless additional measures are taken to accelerate progress (UN, 2019). These measures must
arrest the slowdown in extreme poverty reduction, stubbornly high rates of gender inequality,
uneven infrastructure development, and the alarming rise in global hunger, economic inequality
and land degradation (FAO, 2018a; UN, 2019). In rural areas, a range of factors have hindered
progress, including frequent climatic shocks and changing rainfall patterns, conflict and
displacement, youth unemployment, population growth and land stress, and limited access to
information, inputs, markets and value chains (World Bank, 2008a; Wheeler & Von Braun,
2013; Pinstrup-Andersen, 2015; IFAD, 2016a). Identifying effective ways to address these issues
in rural areas is key to stimulating inclusive transformation of rural economies in developing
countries, which in-turn is central to achieving the SDGs (IFAD, 2018a).
As economies develop, they invariably follow a process of structural transformation that sees
agriculture constitute a declining share of national income, moving instead towards integrated
and high-productivity economies based primarily on industry and services (McMillan and
Rodrik, 2011; Gollin, 2014). The speed and form of this structural transformation process is
shaped significantly by the economic and social changes that occur in rural areas (Timmer, 2009;
Losch et al., 2011; IFAD, 2016a). The reduced share of agriculture in national incomes is a result
of rural households shifting into more efficient on- and off-farm activities that allow labour to
be released into the manufacturing and services sectors, thus driving the industrialisation and
urbanisation characteristic of more developed economies (Haggblade et al., 2007; IFAD, 2016a).

Ch 1. Introduction
3
The integration of rural households into consolidated value chains also facilitates trade, further
fuelling the growth of towns and cities and attracting outside investment, and as rural incomes
increase, the structural transformation process is further accelerated through greater spending,
investment, taxes and savings (Timmer, 2009; Berdegué et al., 2013).
Rural transformation refers to the transition of a subsistence-based, low productivity, labour-
intensive rural economy to one that is modernised and more capital-intensive, with higher
productivity, greater off-farm income generation, and more integration with national and
international value chains (Berdegué et al., 2013). Rural transformation that is inclusive ensures
that no one is left behind as part of this process (IFAD, 2016a).
Rural transformation as a concept has its roots in Farming Systems Research, the Sustainable
Rural Livelihoods framework and the Integrated Rural Development approach (Ruttan, 1984;
Carney, 1998; Collinson, 2000; Berdegue et al., 2013). These approaches have been developed
over the past thirty-five years based on the notion that rural development is not based solely on
Green Revolution-style agricultural modernisation, but on the all-round improvement of rural
livelihoods and the efficient reallocation of labour across sectors (World Bank, 2008a; Berdegue
et al., 2013). As climate change has begun to threaten farming activities in developing countries,
making off-farm opportunities more important, the relevance of such wider approaches to rural
development that consider both on and off-farm activities has heightened further (Rigg et al.,
2016). The inclusive rural transformation concept builds on these approaches by emphasising
the links between rural change and wider structural transformation and brings to the fore the
need for inclusivity of all groups.

Ch 1. Introduction
4
Rural transformation in a given area is comprised of multiple interlinked processes. Based on
the experience of most developed countries, rural transformation is usually sparked by
improvements in agricultural productivity, which helps to activate labour re-allocation to other
sectors and activities (Timmer, 2009). Greater farm yields also provide more marketable surplus,
the income from which can then be re-invested in the further improvement and modernisation of
on-farm activities, and for advancing into lucrative off-farm income generating activities, thus
stimulating the growth of off-farm sectors and diversification of the economy. Both a condition
and an outcome of this re-investment effect is an increase in households’ access to markets and
physical assets. As part of a snowball effect, more off-farm income can in turn complement
farming activities by easing binding capital constraints (Babatunde and Qaim, 2010).
Changes in risk attitudes also play an important role. With the safety net that robust and reliable
farm productivity and income provides—plus the increase in assets and resilience—some of the
constraints that shape rural households' risk attitudes can be reduced. This could make them more
willing to adopt new technologies and innovations or to shift towards the more lucrative activities
that are characteristic of modernised rural economies (Feder et al., 1985; Rosenzweig &
Binswanger, 1993; Boto et al., 2011; Freguin-Gresh et al., 2012).
Rising agricultural productivity and income should also lead to an increase in food security and
nutrition, unless there are food supply constraints (Kennedy and Bouis, 1993; Bashir and
Schilizzi, 2013). In-turn, better food security and nutrition can contribute to the transformation
process by ensuring households have the long-term capacity to engage in productive livelihood
activities on and off the farm (Strauss, 1986; FAO, 2014; Tiwasing et al., 2019).

Ch 1. Introduction
5
Rising incomes can also allow rural households to afford more training and extension services
and to send their children to school. Children’s educational enrolment can also be improved if
more efficient livelihood activities helps to reduce the need for child labour (FAO, 2012a). As
with food security and nutrition, better education can feed back into the transformation process
by enhancing long-term livelihood capacities, reducing risk aversion, and increasing technology
adoption (Lockheed et al. 1980; Phillips, 1994; Knight et al. 2010; Dadzie and Acquah, 2012;
Paltasingh and Goyari, 2018).
Changes in access to social capital and networks is another facilitator and outcome of rural
transformation. Social capital is defined as the capacity of a household to draw upon the power
of collective action to increase their wellbeing or protect against shocks (Woolcock & Narayan,
2000). More efficient livelihoods achieved through the transformation process, along with local
economic development and institution strengthening, can help to improve social capital by
allowing more time and opportunities for collaborative activities, and by increasing trust within
communities (Narayan and Pritchett, 1999; Asadullah, 2017). In-turn, stronger social capital can
complement the transformation process by improving productivity and livelihood capacity
through sharing of information and risk, increased trust, and reduced transaction costs
(Fafchamps and Minten, 2002; Katungi, 2007; Liverpool and Winter-Nelson, 2010).
Rural transformation that is inclusive requires that opportunities to improve upon the
components outlined above are available to all members of the rural population (IFAD, 2016a;
FAO, 2017). Inequality in any of these areas can hinder efficient allocation of labour and other
resources in the rural economy, potentially forcing disadvantaged households into undesirable
activities, or causing mass migration to urban areas to the detriment of both the rural and urban

Ch 1. Introduction
6
economy and to national poverty levels (Berdegué et al., 2013; Christiaensen and Todo, 2013;
IFAD, 2016a). This is detrimental to individual households and can slow down the wider
transformation process. For example, concentrated land ownership could mean that gains from
agricultural surplus are less likely to be spent and invested locally (Berdegué et al., 2013), while
Zhang and Wan (2006) find that, between 1988-1999, economic growth in China was curtailed
because many rural producers were unable to advance into the off-farm sector, having lacked the
market access and financial, physical and human capital to do so.
The inclusion of women is particularly salient, given the importance of gender equality to the
transformation process, and the multiple social and economic barriers that women face to their
productive participation in the economy (Lele, 1986; Deere & Doss 2006; Meinzen-Dick et al.
2014). Rural transformation has the potential to increase gender equality and women’s
empowerment, for example, by increasing their income generating opportunities, or by
increasing agricultural efficiency and thus reducing their need to tend the family farm. However,
much of the evidence suggests that adoption of new technologies and greater farm output may
instead increase women’s labour requirements, and women are also at risk through the
transformation process of being left to tend the family farm or focusing on subsistence crops
whilst male household members engage in new higher-value activities or migrate to urban
centres (Doss, 2001; Slavchevska et al., 2016). As well as being detrimental to women’s
wellbeing, such exclusion can seriously hinder the transformation process, as limiting women’s
economic opportunities will restrict efficient allocation of labour. In addition, some research
suggests that offering women greater decision making power in the household can lead to better
management of the household budget, which could lead to more effective investments in
Ch 1. Introduction
7
economic activities, better nutrition and more education (World Bank, 2001; FAO, 2011a; Duflo,
2012).
Based on this outline of the rural transformation process, it is clear that stimulating faster and
more inclusive rural transformation in developing countries can contribute to the SDGs in many
ways. Modernised production and enhanced off-farm activities are important determinants of
productivity and income, and are thus key to achieving zero poverty and hunger (Goals 1 and 2).
Higher incomes and more stable and resilient livelihoods should also promote greater investment
in health and education (Goals 3 and 4), as well as in improved industry, innovation and
infrastructure (Goal 9). A fully inclusive transformation process will increase equality (Goal 10),
particularly for women (Goal 5). As rural economies become more modernised, efficiency is
expected to improve, especially in agriculture, and time horizons for investments are expected
to lengthen, meaning that the rural transformation process can also help to ensure sustainable
production patterns (Goal 12) and sustainable use of land and other natural resources (Goal 15).
More efficient, diversified and sustainable livelihoods could also facilitate climate change
mitigation and adaptation (Goal 13).
In recognition of these linkages with the SDGs, accelerating inclusive rural transformation has
become a policy priority amongst rural development institutions, as highlighted by two recent
flagship publications in the rural development community: the Rural Development Report 2016
(entitled “Fostering inclusive rural transformation”) by the International Fund for Agricultural
Development (IFAD), and the State of Food and Agriculture Report 2017 (entitled “Leveraging
Food Systems for Inclusive Rural Transformations”) by the United Nations’ Food and
Agriculture Organisation (IFAD, 2016a; FAO, 2017). Through the insights provided by this

Ch 1. Introduction
8
thesis, a better understanding of inclusive rural transformation pathways can help to guide this
growing policy-focus and investment.
1.2 Mission statement
In this thesis, we analyse the ways that improved rural infrastructure can impact inclusive rural
transformation, represented by changes in farm and off-farm livelihoods, assets, food security,
nutrition, resilience, social capital, education, and gender equality. While plausible, many of the
potential links between rural infrastructure and these indicators lack consistent supporting
evidence. Empirically testing these links will help to fill these evidence gaps, and in-turn improve
our understanding of the impact pathways of rural infrastructure projects and the influence of
various contextual factors. Ongoing investments aiming to stimulate inclusive rural
transformation, as a means of contributing to the SDGs, can then be made more effective,
equitable and efficient thanks to these insights. Our analyses focus on two large-scale rural
infrastructure projects in the Philippines and Bangladesh, two countries that are at risk of failing
to meet several of the SDGs (Sachs et al., 2020).
1.3 Case study contexts
Along with most countries in South Asia, there has been notable progress in both structural and
rural transformation in Bangladesh and the Philippines over the past twenty years. Between
2000-2018, the value added from agriculture as a proportion of GDP fell from 23 to 13 per cent
in Bangladesh, and from 14 to 9 per cent in the Philippines (World Bank, 2019). In the same
period, the proportion of agricultural employment as a proportion of total employment shifted
from 61 to 31 per cent for men and from 79 to 59 per cent for women in Bangladesh, and from

Ch 1. Introduction
9
45 to 31 per cent for men and 24 to 14 per cent for women in the Philippines (World Bank, 2019).
A key indicator of rural transformation is agricultural labour productivity (measured by value
added per worker), which, between 2000-2018, increased from $445 to $989 in Bangladesh and
from $1,894 to $3,235 in the Philippines—however the level for Bangladesh remains well below
the average for the South Asia region ($1,756) and the level for the Philippines is below that for
the industry and services sectors in the country (NEDA, 2017a; World Bank, 2019).
Smallholder farmers comprise the majority of the rural population in both countries, and
according to both countries’ national development plans, further rural and structural
transformation progress is being hindered by the challenges faced by this group (GED, 2015;
NEDA, 2017a). In Bangladesh, almost all rural households are involved in some form of
agriculture and the average farm size amongst them is just 1.1 hectares, while in the Philippines,
99 per cent of the country's farms are family-owned and 88 per cent of landholdings are smaller
than three hectares (PSA, 2015; BBS, 2018). In both countries, smallholder farmers and their
households are predominantly poor, and have limited access to land, assets, markets,
infrastructure, extension services, credit, varied diets, schools, and healthcare, and are highly
vulnerable to climatic shocks (Anderson et al., 2016; Rigg et al., 2016). These barriers hinder
them from contributing to and benefitting from the rural transformation process and has left both
countries off-course in meeting several of the SDGs including zero hunger (Goal 2), good health
and wellbeing (Goal 3), gender equality (Goal 5), and economic equality (Goal 10) (Sachs et al.,
2020).
The issue of equality for rural women in smallholder households is a particular issue in both
countries. In the Philippines, according to a recent gender assessment of the rural sector by FAO

Ch 1. Introduction
10
(2018b), women face considerable cultural barriers to work—such as the unequal burden of
unpaid care work in the household and community—and are more likely to suffer from
malnutrition. Another survey found that less than ten per cent of rural female respondents had
access to production capital (PAKISAMA, 2015). In Bangladesh the situation is seemingly even
more severe, especially in terms of the restrictive cultural norms imposed upon women’s
mobility and activities in poor rural households (Ahmed and Nahiduzzaman, 2016; Paul, 2016;
Ambler et al., 2017). Reflecting this, unemployment among rural women stands at 58 per cent,
and as noted above, only one third of women’s employment is outside of the agriculture sector
(Rahman and Islam, 2019; World Bank, 2019). Within the agriculture sector, agricultural wage
rates are 38 per cent higher for men than women (Wiggins and Keats, 2014).
The national development plans of both countries identify improvements in rural infrastructure
as a key tool for solving the barriers faced by smallholder farmers, and thus driving inclusive
rural transformation and economic growth (GED, 2015; NEDA, 2017a). In Bangladesh, policy
and investment has focused primarily on the improvement of rural roads, as well as building and
improving local markets used by smallholders to buy inputs and sell their produce (GED, 2015).
This focus is also shared by development agencies, with the Asian Development Bank recently
announcing a new $100 million project to improve rural road networks, which builds upon a
$200 million project approved in 2018 (ADB, 2020). In the Philippines, given the predominance
of rice farming amongst smallholders, the focus has been on improving irrigation coverage for
this group (NEDA, 2017a; Delos Reyes and Schultz, 2018). In 2019, for instance, the National
Irrigation Authority increased irrigation coverage by 33,407 hectares and repaired systems
covering a further 9,954 hectares, using its annual budget of $800 million (NIA, 2020).

Ch 1. Introduction
11
In Chapters 2 and 3 of this thesis we focus on the impacts of the Irrigated Rice Production
Enhancement Project (IRPEP) in the Philippines. This was a $25 million project implemented
in three of the country’s poorest regions that targeted 14,000 smallholder rice farming
households with new and improved canal irrigation systems. It also provided complementary
support by strengthening the capacity of Irrigators Associations (IAs) tasked with managing the
systems, and offering training through Farmer Field Schools (FFS). Chapters 4 and 5 focus on
the impact of the Coastal Climate Resilient Infrastructure Project (CCRIP) in southwest
Bangladesh, a $150 million project that targeted 3.5 million small-scale producers by building
climate resilient roads and markets in remote areas affected by climatic shocks. As with IRPEP,
CCRIP also complemented this support by providing capacity building training to local MMCs.
Both of the case study projects were financed by IFAD, a United Nations agency with a mandate
to support the livelihoods of small-scale producers in rural areas in developing countries. With
contributions from member states, the Fund designs projects in collaboration with recipient
governments, which the government then implements with financing from the Fund in the form
of grants or loans (both concessional and non-concessional). In its current financing window
(2019-2021), the Fund has a portfolio of investments totalling $3.5 billion, targeted at supporting
the achievement of the SDGs by increasing the food security, market participation, and climate
change mitigation and adaptation of the rural poor (IFAD, 2016b).

Ch 1. Introduction
12
1.4 Theory of change
Both projects aim to achieve their objectives mainly by reducing the barriers and improving the
conditions for better agricultural production among smallholders. In the case of CCRIP in
Bangladesh, climate resilient road and market infrastructure is expected to help to improve and
modernise smallholder production by reducing transaction costs for accessing inputs, and in the
Philippines, better irrigation systems are expected to accelerate crop growth and avoid disruption
caused by unreliable rainfall (BUET, 2018; Delos Reyes and Schultz, 2018). With more reliable
production, combined with more reliable sales locations in Bangladesh, beneficiaries are
expected to be encouraged to invest more in agricultural production, be less risk averse, and
adopt new technologies, cash crops, practices and seeds. In the Philippines, more efficient
production thanks to better irrigation is also expected to drive labour re-allocation. Better market
access through improved markets and roads in Bangladesh is also intended to help to connect
smallholder producers to existing value chains and help to develop new ones, and can provide
opportunities for households to re-allocate labour in line with their comparative advantage
(Swinnen, 2007; Reardon, 2015; Bradbury et al., 2017). The higher incomes produced by these
linkages would then ideally also be invested into assets, better diets, and education. Nutrition
and education could also be improved if the roads help to improve access to schools, food, and
health centers.
In Bangladesh, social capital among smallholders could also be improved if better roads and
markets allow smallholder households to be better connected and to access well-attended
meeting points (Bradbury, 2006). In the Philippines, irrigation schemes that are user-managed—
a common aspect of small-scale irrigation projects in the country—can increase trust, social

Ch 1. Introduction
13
cohesion and mutual support, as well as provide opportunities for households to increase their
involvement in collective activities in their community (Kähkönen, 1999; Uphoff and
Wijayaratna, 2000). In both countries, increased incomes and labour productivity through the
above linkages can also allow households to dedicate more time and resources to collective
activities and building social networks, which can then feed back into income generation
(Narayan and Pritchett, 1999).
Another reason that rural infrastructure is being used to drive inclusive rural transformation in
Bangladesh and the Philippines is its potential to build the resilience of smallholders’ livelihoods
to climatic shocks. The two countries are among the worst affected by these shocks, which
include droughts, floods, storms, typhoons, cyclones, changing rainfall patterns, and rising
temperatures and sea levels (Parvin and Johnson, 2015; Maplecroft, 2019). Such shocks threaten
the inclusive rural transformation process in several ways. First they can hinder agricultural
production by damaging produce and assets (including land, machinery and storage facilities)
and disrupting growing seasons (Morton, 2007). Nelson et al. (2014) estimate, for instance, that
global yields will have reduced by 17 per cent by 2050 due to the weather effects caused by
climate change. Damage to assets and infrastructure can also mean that households do not have
the resources to shift into more lucrative livelihood activities (IPCC, 2014). By reducing the
resilience and stability of their livelihoods, and potentially increasing their risk aversion, these
effects—which disproportionately affect smallholders and other vulnerable groups—can also
serve to disincentivise investment in new livelihood activities and practices that would advance
the transformation process (Mirza, 2003; Béné et al, 2014; Anand and Khetarpal, 2015;
MacMahon, 2017).

Ch 1. Introduction
14
The two case study projects aim to mitigate the threats of climatic shocks in a number of ways.
First, higher farm income and adjusted risk attitudes, achieved in both countries through the
pathways outlined above, may enhance access to and adoption of resilience-enhancing inputs,
such as seeds for flood resistant crop varieties (Nelson et al., 2010). This could also be enhanced
by better access to markets to purchase these inputs in the case of Bangladesh. In both countries,
as livelihood opportunities increase through the above pathways, vulnerability of livelihoods to
climatic stressors can be reduced through income diversification (Ellis, 1999; Lin, 2011; Estruch
and Grandelis, 2013). Also, in Bangladesh, the fact that the infrastructure is specifically designed
to be climate resilient can help to ensure that access to markets and other services are not
disrupted by climatic stressors, thus enhancing the resilience and sustainability of livelihoods
and smoothing incomes (Ziervogel and Ericksen, 2010; UN, 2016).
Finally, among beneficiaries of both projects, it is expected that improved rural infrastructure
will also contribute to women’s empowerment by reducing the economic and social barriers that
they face. In both countries, improved agricultural productivity as a result of better infrastructure
could reduce the requirements of women to tend the family farm. Also in Bangladesh, the
improved roads and markets could improve women’s mobility and economic opportunities, and
give them more scope to build their social capital. Women’s inclusion in the rural transformation
process can also be enhanced through the above-mentioned impacts on resilience to climatic
shocks. Coping with these shocks can increase women's workloads and force them to forego
food for the sake of their family, hardships which may be reduced by increased climate resilience
(MacMahon, 2017).

Ch 1. Introduction
15
As well as aiming to enhance the size and sustainability of their impacts, the case study projects
also target the inclusion of women by providing capacity building support to local institutions.
The projects in Bangladesh and the Philippines respectively work through Market Management
Committees (MMCs) and Irrigators’ Associations (IAs), aiming to increase women’s
involvement in these groups, and thus improve their standing and voice in their households and
communities. However, in the case of IAs, such groups have sometimes been found to exclude
women and other vulnerable groups (Meinzen-Dick & Zwarteveen, 1998; Hussain, 2007b;
Sargeson & Jacka, 2017).
Figure 1.1 collates the expected impact pathways of the two case study projects outlined above
into an overarching Theory of Change around which this thesis is structured.
Figure 1.1. Theory of Change of improved rural infrastructure on inclusive rural transformation
Improved rural
roads, markets and
irrigation systems,
and local
institutions
Better access to farm inputs
(including seeds, fertiliser
and water)
Better access to trading
points for produce and
other economic and social
activities
Lower risk aversion and
increased investment in
on- and off-farm economic
activities and technology
Higher agricultural
productivity and profits
Increased opportunities for
off-farm employment
Greater resilience of
livelihoods to climatic
shocks
More economic and social
opportunities for women
Strengthened trust,
cohesion and social capital
Higher incomes
Strengthened food
security and nutrition
Increased asset ownership
More investment in
education
Increased economic and
social inclusion of women
Modernised agriculture
sector
More developed and
diverse off-farm sector

Ch 1. Introduction
16
1.5 Research problem
Our objective is to build the evidence base and to inform the design of future projects aiming to
stimulate inclusive rural transformation using rural infrastructure. Drawing from the theory of
change above, the overarching research problem of this thesis is:
How can improved rural infrastructure impact inclusive rural transformation?
And how may contextual factors help or hinder these impacts?
As outlined in the previous section, there are several theoretical channels through which
improved rural infrastructure can (positively or negatively) impact each component of inclusive
rural transformation. There are also possible ways that these components can complement each
other, with an improvement in one component potentially catalysing a snowballing of the
transformation process. To contribute new insights to the overarching research problem, we
focus on two types of infrastructure investments: improved irrigation (Chapters 2 and 3) and
climate resilient roads and markets (Chapters 4 and 5).
While covering each of the components of inclusive rural transformation, our analysis focuses
particularly on the most complex element of the rural transformation process—productivity—
for which we conduct analyses on how improving these types of rural infrastructure changes the
Frontier Output and Technical Efficiency (TE) of beneficiary farmers (Chapters 3 and 5).
Improved agricultural productivity has been the main historic driver of rural transformation, and
is central to the theory of change above. Acknowledging its complexity, we analyse two different
aspects of productivity—output and efficiency—which allows us to draw richer insights into
how farm activities and behaviours have been influenced by the case study projects.
Ch 1. Introduction
17
We also particularly consider the cross-cutting effect of increased resilience to climatic shocks—
given the growing threat that these shocks pose to the transformation process in developing
countries. As mentioned above, the effect of climate change and climate shocks have the
potential to derail inclusive rural transformation pathways, and hinder the impact of development
projects, meaning they are a key consideration within our overarching research question.
In order to fully address our overarching research question, we collate our findings about how
each component of the transformation process is impacted to ask what these imply for the
inclusive rural transformation process as a whole. As discussed, it is not necessarily the case that
an improvement in one area is beneficial for the speed, balance, sustainability or inclusivity of
the overall rural transformation process as a whole. If, for instance, improved infrastructure
causes a small positive increase in farm output, but limited progress in off-farm activities or in
production efficiency, this could mean that farmers are being encouraged to remain in traditional
agriculture, doing slightly better than before, but without the modernisation or diversification
that is required for significant long-term change. Such an effect is a particular concern for
irrigation, as evidenced by past studies in India and the Philippines (World Bank, 2008b; JICA,
2012). Similarly if incomes increase but assets and social capital, for instance, do not, this
implies that incomes are not being invested in improving production capacity and building
resilience to shocks, which raises questions about the economic pathways of beneficiaries and
the sustainability of these livelihood improvements (Ellis, 1999; Winters et al., 2009).
In terms of the influence of contextual factors, the role of existing market opportunities is of
prime importance, as this plays a key role in whether the projects can spur advancement into
more lucrative on- and off-farm activities, in terms of demand for their outputs and access to the

Ch 1. Introduction
18
required inputs (IFAD, 2016). We also focus on the role played by rural institutions, given their
widely acknowledged importance to the effectiveness and inclusivity of the impact of rural
development projects (Agrawal et al., 2008; FAO, 2012b). Finally, based on findings of past
studies, including a recent evaluation of a nutrition project in Bangladesh by Nisbett et al. (2016),
we consider the role of social norms for women, (especially in the Bangladesh case study), given
the barrier that these can pose to women’s inclusion in such contexts.
1.6 Key knowledge gaps
Answering this research problem will help to contribute new insights on the potential links
between improved rural infrastructure and the components of rural transformation, as well as on
the interactions between the components themselves. As discussed in more detail in the chapters
of this thesis, the evidence that has been generated in both cases is patchy, despite rural
infrastructure being one of the most costly forms of development spending (Jouanjean, 2013;
Knox et al., 2013). Our focus on infrastructure that is designed to be climate resilient, in
particular, offers insights on a heavily under-studied area of rural development investment
(Douven et al., 2012).
In terms of the links between improved rural infrastructure and inclusive rural transformation,
there is some evidence of the positive impacts of better rural roads and irrigation systems on
agricultural production, and to a lesser extent on income. However, the potential links between
improved rural infrastructure of any kind and other rural transformation indicators remain largely
theoretical in nature with limited empirical validation. This includes impacts on asset ownership,
livelihood composition, nutrition and social capital. The latter for instance has been cited as the

Ch 1. Introduction
19
“forgotten dimension of the SDG indicators” due to limited recognition of its importance to
sustainable development (Verbeek and Dill, 2017). The same applies to climate resilient
infrastructure, which apart from all-weather roads has received limited focus in any area. As
discussed in further detail in the chapters of this thesis, existing studies also rarely consider
details of the impact pathways of improved rural infrastructure, including changes in risk
attitudes or climate resilience, or the role played by mitigating factors such as market access,
resource endowments of beneficiaries, local institutions, and the type of infrastructure that is
being implemented (Hine et al., 2019). Finally, effects on the inclusivity of the transformation
of the process is largely absent from the evidence base, an oversight that is a particular concern
in the case of women’s inclusion, given that projects could potentially entrench or worsen the
position of women in their communities.
Apart from the links between agricultural production and income, the potential interactions
between the components of inclusive rural transformation are also largely theoretical. As income
is rarely disaggregated by source, little is known on the potential links between agricultural
production and off-farm activities, for instance, while there has been limited focus on the links
between social capital or nutrition with the other components of rural transformation (Cameron
et al., 2016). In this thesis, for instance, we particularly consider how improvements in livestock
production can influence nutrition. Empirical studies of the links between gender equality and
components such as agricultural production and livelihood composition are also limited.

Ch 1. Introduction
20
1.7 Contributions
1.7.1. Insights to inform development practice
The two projects provide useful case studies for drawing rich and widely applicable insights for
development practice for a number of reasons. First, both projects are located in South Asia, a
region that is in the middle of an economic growth boom, but still suffers from considerable
economic and social inequality and high poverty rates (Nabi et al., 2010; World Bank, 2019). As
the majority of the countries in the region share similar economic and structural challenges—
including widespread inequality, unbalanced growth, poor connectivity, and increasing frequent
and severe climatic shocks—insights from the two case study projects can be applied to inform
a more inclusive growth agenda across the region (Nabi et al., 2010; Goretti et al., 2019). In
addition, the two projects: (i) cover three of the main types of rural infrastructure investment
(roads, markets and irrigation); (ii) allow us to test the efficacy of a complementary support such
as institution building and FFS; and (iii) are implemented across a range of beneficiaries to allow
for insightful sub-group analyses.
In terms of contributions to development practice, first, the robust quantitative measurement of
the impacts of the two projects, across a much wider range of outcomes compared to most impact
studies, can help to ensure that similar future investments are made based on a clearer picture of
the expected benefits. As willingness is wavering amongst some donors to meet the estimated
$2.5-$3 trillion in additional funds required each year to meet the SDGs, the need for better-
informed, more cost-effective development spending is becoming increasingly acute (UNCTAD,
2014; Kharas and Rogerson, 2017).

Ch 1. Introduction
21
Similarly, the insights from the thesis can help to inform the design of future rural infrastructure
projects in terms of how activities are packaged and the way that they are targeted—helping
them to be tailored to a given context to achieve higher impacts. Rural development policy often
targets the poorest households with support focused on subsistence production and meeting basic
needs, while less poor rural households who have the required resources are targeted with more
market- and value chain-oriented support (Deshpande et al., 2018; Devereux et al., 2019). As it
is inherently difficult to provide such tailored support through rural infrastructure projects, as
the infrastructure usually serves the same function for all users, there is consensus that
complementary support is required in order to achieve the desired development outcomes for
each strata of rural households (World Bank, 1994; Ali and Yao, 2004; OECD, 2007), and that
such targeting should be based on robust evidence (Kharas and McArthur, 2017).
Through the rich sub-group analyses based on both quantitative and qualitative data, the four
chapters provide in-depth insights to inform the tailoring of rural infrastructure projects. In
analysing the relative impacts on the poorest beneficiaries—focusing on downstream households
in Chapters 2 and 3 and landless households in Chapters 4 and 5—we determine the extent to
which the packages of support provided by IRPEP and CCRIP were able to reach these
households, identify factors that mitigated impacts, and propose additional support required
through future projects to overcome them. Moreover, for CCRIP in Chapter 4 we test whether
impacts on the poorest and less poor households differs based on the package of infrastructure
support that they receive. We also take advantage of differences in exposure to climatic shocks
in Chapters 2 and 5, and in market access in Chapters 2 and 3, to investigate the efficacy of the
packages of support under these different circumstances, and to identify ways that these

Ch 1. Introduction
22
challenges could be better addressed in future projects. Across the chapters, we provide
particularly in-depth insights into the extent to which building the capacity of local institutions—
specifically IAs in Chapters 2 and 3 and MMCs in Chapters 4 and 5—serve to complement the
impacts of improved rural infrastructure. Finally, in applying the multi-faceted transformation
framework in Chapters 2 and 4, we are able to identify the linkages between the different
components of the transformation process that can then be leveraged in future projects.
1.7.2. Contributions to the literature
In addition to the contributions to development practice, the thesis aims to advance impact
evaluations conducted on rural development projects by introducing a tailored framework of
indicators designed to comprehensively assess impacts on inclusive rural transformation.
Applying this new framework allows us to capture how the project has influenced the dynamic
rural transformation process, which has important implications for the medium- and longer-term
impacts of the project. Impact evaluations of rural development projects commonly focus on a
limited set of direct agriculture-related indicators such as yields and income from crop sales,
however as stated by Dercon (2013: 184) “looking at agriculture in isolation is a recipe for
misunderstanding the economic transformation in growing economies and the role of agriculture
therein”. Highlighting the importance of this, a review of the longer-term impacts of rural
development interventions in Bangladesh by Quisumbing et al. (2011) finds that impacts on
indicators such as consumption expenditure and asset accumulation often diminished over time,
and the authors advocate that considering a wide range of impact indicators at the point of project
completion can help to predict whether impacts will be sustained. Doing so can provide

Ch 1. Introduction
23
indications of how future projects can be improved to achieve sustainable impacts without
having to wait several years after the project has finished to conduct a follow-up analysis.
Chapters 3 and 5 add to a limited but growing body of literature that is advancing the rural impact
evaluation field by combining Stochastic Production Frontier (SPF) and causal inference
techniques to robustly measure impacts on agricultural productivity (Bravo-Ureta, 2014).
Further, Chapter 5 provides the first known application of this combined approach to analysing
the impact of climate resilient markets and roads. This approach is a valuable addition to the
toolkit of impact evaluation methods as it builds upon the relative strengths of the SPF and
impact evaluation literature while addressing their shortcomings. In terms of SPF studies that
compare different groups of rural producers, these rarely address possible selection bias
associated with entry into a given comparison group, whereas, as mentioned, impact evaluation
studies of rural development projects rarely go further than using output per hectare to measure
impacts on agricultural productivity.
1.8 Materials and methods
The data on the two projects used for this thesis was collected by the author while working as an
analyst in IFAD’s Research and Impact Assessment Division. This division is tasked with
analysing the impact of 15 per cent of the projects in IFAD’s project portfolio during each
financing window, the findings from which are then extrapolated to the rest of the portfolio in
order to estimate IFAD’s overall impact to be reported to the Fund’s Executive Board (IFAD,
2019a). The two projects used for this thesis were included as part of the impact measurement
exercise for the 2014-2016 financing window (see Garbero, 2016). For each project, the data
was collected for the purpose of an official impact report (see Arslan et al., 2018; Arslan et al.,

Ch 1. Introduction
24
2019), after which the author conducted additional analyses for the chapters included in this
thesis.
For each project, the data consists of a large quantitative household level dataset covering
treatment and control households, and qualitative data collected through Key Informant
Interviews (KIIs) and Focus Group Discussions (FGDs) with beneficiaries, local leaders and key
project staff. The household datasets contain agricultural production information by season and
parcel, as well as information on all other income generating activities, asset ownership, access
to credit, food security and nutrition, education, social capital, exposure to shocks, and women’s
empowerment. The data for the Philippines also includes a quantitative survey of IAs. The
quantitative datasets are cross sectional, and were collected shortly after the projects were
completed, meaning that robust statistical techniques are required to produce accurate
measurements of impact.
Accurate causal inference of the impact of a development project requires comparing a set of
treated households with a set of control households who accurately represent how treated
households would have fared in the absence of the project (Winters et al., 2010). Ideally, this
type of analysis would involve randomly assigning the project within a pool of eligible
households at the baseline stage, thus ensuring that the treatment and control groups compared
for the analysis are free from selection bias (Khandker et al., 2010). Selection bias in impact
evaluation refers to the presence of unbalanced characteristics between the treatment and control
group due to a lack of random selection, and is problematic when the characteristics that are
unbalanced have the potential to distort impact measurements (Heckman et al., 1996). As is the
case for the majority of development projects, project selection was not random for the IRPEP

Ch 1. Introduction
25
and CCRIP datasets, meaning that efforts must be taken when designing the sample and
analysing the data to mitigate possible selection bias ex-post.
Regarding the design of the quantitative household questionnaire sample, we aimed to reduce
potential selection bias by carefully selecting treatment and control households who would have
stood a similar chance of being selected for inclusion in the project at the baseline stage. For the
IRPEP household dataset, as the project selected beneficiaries by first identifying areas where
irrigation systems required improvement and where its users were poor, we applied Propensity
Score Matching (PSM) to first identify treated and control irrigation systems that were well-
matched according to the selection criteria used by the project, based on data from the year that
the project began. For the systems selected through this process, we then randomly selected
households from among their registered users. Similarly for the CCRIP household dataset, as the
project first identified markets that were remote, climate-vulnerable, and used by poor
households, we conducted a similar matching exercise, using project data from the year the
project began combined with GIS information to identify treated and control markets that were
similar according to the project’s selection criteria. As with the IRPEP sample, we then randomly
selected households for interviews from within the catchment area of the selected markets.
Using these datasets, the analyses detailed in the chapters of this thesis then apply different
analytical methods to further reduce the risk of selection bias and to thus produce robust impact
estimates. In Chapters 2 and 4, we analyse the impacts of IRPEP and CCRIP, respectively, on a
framework of impact indicators designed to assess the multi-faceted impacts of the projects on
inclusive rural transformation. In Chapter 2, we estimate impacts using an Inverse Probability
Weighted Regression Adjustment (IPWRA) model. This model reduces selection bias between
Ch 1. Introduction
26
the treatment and control groups by combining a parametric regression approach that controls
for potential biasing covariates, with a Propensity Score-based weighting approach whereby
control units are assigned higher weights if they better represent a treatment household. In
Chapter 4, we use a method that matches similar treatment and control pairs using a matrix-based
distance matching, using which we estimate impacts by taking the average distance in the
outcome variable across all of the matched pairs.
In Chapters 3 and 5, we narrow our focus onto the respective impacts of IRPEP and CCRIP on
agricultural productivity using a combination of causal inference and SPF techniques. In each
case, this involves first applying a PSM technique to the household level dataset to trim the
sample of treatment and control households without a sufficiently close match in the opposing
group. We then compare the TE and Frontier Output of the trimmed treatment and control
households using an enveloping Stochastic Meta-Frontier (SMF). This approach thus allows for
robust productivity measurement whilst also controlling for potential selection bias.
In each case these analytical methods produce estimates of the magnitude of the impact of the
projects on a range of indicators, both for the full sample as well as relevant sub-groups. In order
to uncover the story behind the numbers, we then draw from the qualitative data to identify
potential causal mechanisms and contextual factors that may have mitigated impacts.
The main methodological challenge of this thesis is that its analyses are based on ex-post cross-
sectional datasets, which could potentially threaten the validity of our impact estimates.
Especially in the absence of random allocation to the treatment or control group ex-ante, baseline
data can help to considerably reduce selection bias in an impact analysis (Winters et al., 2010).
Without random allocation, statistical matching is the most common method for reducing

Ch 1. Introduction
27
selection bias, and the aim of this matching is to pair treatment and control households who were
similar at the baseline stage. Without baseline data, we must try to reconstruct the baseline
characteristics of the sample households without real-time data, instead using variables that are
fixed over time or variables based on recall by the respondent, which can be prone to error. This
risks the validity of the results as treatment and control households may not be paired with a
household with whom they were truly similar at the baseline stage, and who therefore do not
provide a valid counterfactual.
We take three main measures to mitigate this risk. First, as explained above, we employ
carefully-designed samples, informed by administrative data from the baseline stage and input
from local project staff, to ensure that treatment and control households are already similar
before we come to the data analysis stage. Second, we conduct balance testing to validate our
results and use secondary analytical models to cross-reference the results to confirm that they
are consistent across specifications. Finally, across the analysis, we draw upon rich qualitative
datasets to validate our findings and to look for inconsistencies, based on which we are able to
better-interpret and potentially temper the messages we draw from the quantitative results.
1.9 Overview of chapters
In the proceeding chapter of this thesis (Chapter 2), we assess how IRPEP in the Philippines
impacted the various elements of inclusive rural transformation amongst the smallholder
beneficiaries of the project. To identify factors that may have mitigated the project’s impacts,
we take advantage of the heterogeneity of two of the project regions to assess how and why
impacts differed in each case. We also analyse whether impacts differ for producers located

Ch 1. Introduction
28
downstream on the irrigation canals, who are often poorer and suffer from overuse of water by
the wealthier upstream producers.
In recognition of agricultural production as the main historic driver of the rural transformation
process, in Chapter 3 we narrow our focus onto IRPEP’s impacts on the efficiency of agricultural
production. Again, we draw upon sub-group analyses using both the quantitative and qualitative
data to determine the factors that shaped the project’s impacts, separating the sample in several
ways, including by the gender and education of the household head, location on the irrigation
canal, region, and land ownership.
In Chapter 4, in a similar vein to Chapter 2, we analyse the impacts of CCRIP in Bangladesh on
a framework of inclusive rural transformation indicators. To understand the specific causal
mechanisms and the circumstances under which the impact pathways are valid, we analyse
whether improving both the local market and the market-connecting road has a larger impact
compared to solely improving the market, and test the influence of initial resource endowments
by analysing if impacts differed according to land ownership.
In Chapter 5, in a similar vein to Chapter 3, we delve deeper into the impacts of CCRIP on the
efficiency of agricultural production. Given that this project was specifically designed to increase
the resilience of beneficiaries to climatic shocks, the sub-group analysis for this chapter focuses
on how impacts differed according to exposure to extreme flooding, both in terms of a one-off
event and in terms of cumulative exposure over a prolonged period.
In the concluding chapter we synthesise the quantitative and qualitative insights from the two
case studies across the four chapters, discuss their implications for the overarching research

Ch 1. Introduction
29
questions of this thesis, their contributions to the literature, and their implications for project
design and policymaking going forward.

30

Ch 2. Role of irrigation in inclusive rural transformation
31
Chapter 2
What role can small-scale irrigation play in promoting
inclusive rural transformation?
Evidence from smallholder rice farmers in the Philippines
Abstract: Cultivating inclusive rural transformation is key to sustainable growth and
poverty reduction in developing countries, but existing research rarely analyses the impacts of
rural development projects on this process. We use a combination of quantitative and qualitative
data to rigorously measure impacts and uncover the causal pathways of a canal irrigation project
for rice farmers in the Philippines, finding that positive impacts were heavily determined by
market access and the strength of the local economy. We also find limited impacts for poorer
farmers located further downstream on the irrigation canals. Based on these findings, we draw
several lessons about the complementary conditions and support that are required in order for
irrigation to be an effective tool in promoting inclusive rural transformation in developing
countries.
This chapter is based on:
Higgins, D., Arslan, A. and Winters P. 2021. What role can small-scale irrigation play in
promoting inclusive rural transformation? Evidence from smallholder rice farmers in the
Philippines. Agricultural Water Management, 243(1): 106437.

Ch 2. Role of irrigation in inclusive rural transformation
32
2.1 Introduction
It is well-documented that improved irrigation increases agricultural productivity, but higher
crop yields alone are not enough to drive transformational change for rural households (Lipton
et al., 2003; Pinstrup-Andersen and Shimokawa, 2006). While rising crop productivity is
important, sustainable and inclusive rural transformation also involves changes in the
composition of livelihood activities and continuous improvements in incomes, assets, off-farm
productivity, social capital, nutrition, education and gender equality (IFAD, 2016; FAO, 2017).
By increasing and stabilising yields, along with other mechanisms, better irrigation has the
potential to contribute to each of these aspects of inclusive rural transformation, but empirical
evidence on its wider impacts is scarce.
This chapter addresses this research gap with an in-depth impact evaluation of a small-scale
irrigation project for smallholder rice farmers in the Philippines, in a bid to inform ongoing
efforts to shape and accelerate the most desirable forms of rural transformation in developing
countries. We focus on small-scale irrigation in particular because the low cost of its construction
and maintenance means it is well suited to supporting smallholder farmers, who make up the
majority of the producers in the country (Xie et al., 2014). Focusing on irrigation systems that
are user-managed also helps to fill a significant knowledge gap on the benefits of this type of
local governance structure, about which there remains some doubts (Senanayake et al., 2015).
We use a combination of quantitative and qualitative data from treatment and control households
to analyse the project’s impacts on a set of indicators within a novel inclusive rural
transformation framework. As part of the investigation, we take advantage of the differences
between the project regions to identify important contextual factors that shaped impacts. To our

Ch 2. Role of irrigation in inclusive rural transformation
33
knowledge, this is the first impact evaluation study to apply an inclusive rural transformation
framework in this manner.
The remainder of the paper first outlines the potential linkages between small-scale irrigation
and inclusive rural transformation around which the framework of impact indicators is based.
This is followed by an overview of the case study project; details of the data and methodology;
a profile of the sample; a presentation and discussion of the results; and the conclusions and
policy implications.
2.2 Potential links between small-scale irrigation and inclusive rural
transformation
There is a large body of evidence showing that well-managed irrigation systems help farmers to
increase their cropping intensity and cultivate year-round, leading to higher and more stable crop
yields (Lipton et al., 2003; Hussain and Hanjra, 2004; Pinstrup-Andersen and Shimokawa,
2006). This effect on agricultural production can contribute in-turn to the rural transformation
processes in several ways. As evidenced during the Green Revolution, for instance, more reliable
production can promote agricultural modernisation by increasing farmers’ incentives to adopt
new technologies (Evenson and Gollin, 2003; Estudillo and Otsuka, 2006; Hazell, 2009).
Improved irrigation could also promote higher-value, market-oriented agricultural production by
increasing farmers’ production capacity and marketable surplus, and potentially by allowing
farmers to grow cash crops that are hard to grow with rain-fed irrigation (Namara et al., 2010;
Burney and Naylor, 2012). In Bangladesh, for instance, Mottaleb et al. (2015) find that better
irrigation infrastructure increased rice farmers’ market integration thanks to their increased

Ch 2. Role of irrigation in inclusive rural transformation
34
marketable surplus, while Mishra et al. (2018) find a positive link between irrigation and contract
farming among smallholders in India.
In addition, more reliable and efficient crop production could also change risk attitudes and
reduce labour requirements, both of which may encourage farmers to advance into the type of
productive off-farm activities characteristic of a transforming economy (Freguin-Gresh et al.,
2012). As irrigation water can also be used to improve grazing lands and for other livestock
needs, better irrigation can especially encourage more livestock production, a link supported by
evidence from Mali and Nepal (Dillon, 2011; ADB, 2012).
Although largely untested, better irrigation could also theoretically contribute to improved
nutrition, education and social capital, all key components of a sustainable rural transformation
process. Better nutrition and food security may be achieved as households consume more fruits,
vegetables, staples and livestock products thanks to their higher crop yields, enhanced livestock
production and greater market integration. Higher labour productivity and income as a result of
better irrigation could also reduce the need for children to work on family farms, leading to
higher school enrolment and attendance (FAO, 2012a). An irrigation project in Madagascar, for
instance, was found to have increased incomes, and as a result, increased the amount that farmers
spent on their children’s education (Ring et al., 2018). Higher education also has the potential to
in-turn complement the impact of irrigation on productivity as part of a virtuous cycle (Hanjra
et al., 2009). Social capital could be improved through user-led irrigation schemes, a common
aspect of small-scale irrigation which can increase social cohesion and mutual support
(Kähkönen, 1999). An irrigation project in Mali, for instance, found evidence of increased meal
sharing as a form of risk protection (Dillon, 2011). As with education, higher social capital can

Ch 2. Role of irrigation in inclusive rural transformation
35
also feed back into the performance of the irrigation system by increasing collective action within
user-led management systems, as has been found among water user associations in Japan
(Takayama et al., 2018).
The capacity of better irrigation to promote a more inclusive form of transformation lies in its
potential benefits for smallholder farmers as well as women, two of the groups most at risk of
exclusion (FAO, 2017). Regarding smallholders, small-scale irrigation systems are cheaper to
implement and maintain, making them an accessible and sustainable option for these farmers.
Among smallholders, those located downstream—who are usually the poorest and often suffer
from overuse of water by those located upstream—stand to benefit the most from more efficient
and better-managed canal systems (Namara et al., 2010; Darko et al., 2016). Moreover, research
shows that where there are low transmission losses and other supporting factors, equitable
irrigations systems are also the most productive for all users (Steiner and Walter, 1992).
Women could benefit through new economic opportunities as livelihoods are enhanced through
the mechanisms discussed above. However, there is also potential for women to be left to tend
the family farm while men pursue other high-value activities (Smith 2004; Slavchevska et al.,
2016). When they engage in democratically managed user-led water management groups,
women could also improve their representation and responsibilities within their communities
(Sargeson and Jacka, 2017). In practice, however, these groups tend to suffer from high levels
of exclusion, especially of women (Meinzen-Dick and Zwarteveen, 1998; Hussain, 2007).
Of the few existing studies that analyse the impact of irrigation on outcomes other than yields,
the findings are not all positive, and some even demonstrate how irrigation can hinder the rural
transformation process by making livelihoods more static. Studies of small-scale irrigation

Ch 2. Role of irrigation in inclusive rural transformation
36
projects for rice farmers in the Philippines and India that compared treatment and control groups
to measure impacts both found that improved irrigation led beneficiaries to consolidate their
livelihoods around rice production, while control households diversified and were able to keep
pace with the income improvements of beneficiaries (World Bank, 2008b; JICA, 2012). Without
sufficient gains from specialisation, such an effect can hinder income growth and increase
vulnerability to crop-specific shocks, thus reducing resilience and potentially hindering
livelihood choices and technology adoption (Feder et al., 1985; Lin, 2011; Makate et al., 2016).
There is also evidence that a lack of crop diversity can have a negative effect on dietary diversity
and nutrition (Sekabira and Nalunga, 2020).
For the same projects, and another in Madagascar, impacts on inclusivity were also doubtful
(World Bank, 2008b; JICA, 2012; Ring et al., 2018). In each case, a failure of collective action
and instances of elite capture within the user groups led to inequitable water distribution and
hence increased inequality between up and downstream households. This confirms a common
concern about small-scale canal irrigation that, without effective institutions managing the
systems, the benefits of irrigation are likely to be unequal and captured by wealthier farmers
located upstream (Magistro et al., 2007; Meinzen-Dick, 2007; World Bank, 2008b; Burney and
Naylor, 2012). Irrigation governance is a contested issue, and despite knowledge gaps and doubts
over their effectiveness that are fuelled by findings such as those above, there are growing calls
for an increase Irrigation Management Transfer, particularly in Africa, and for user-led water
management institutions to be provided with more support, responsibility and involvement in
policy formation (Senanayake et al., 2015; Mutambara et al., 2016; IFAD, 2018a).

Ch 2. Role of irrigation in inclusive rural transformation
37
Findings from the studies mentioned above indicate that contextual factors such as the strength
of local institutions will be important in determining which of the potential positive and negative
links between irrigation and rural transformation are realised. The quality of local markets for
inputs, outputs and credit are also likely to play an important role. Shifts in livelihood activities
and benefits from specialisation, for instance, cannot be supported through irrigation without
market and value chain connectivity (Namara et al., 2010; Freguin-Gresh et al., 2012; FAO,
2017).
2.3 Details of the case study project
IRPEP was implemented in Region VI (Western Visayas), Region VIII (Eastern Visayas) and
Region X (Northern Mindanao) of the Philippines between 2010-2015, with a budget of $25
million. By the time of its completion, the project had provided support to 109 Communal
Irrigation Systems (CIS) and the Irrigators' Associations (IAs) that manage them, covering 9,347
hectares of land. CIS are small-scale canal diversion irrigation systems that cover areas no larger
than 1,000 hectares and account for around 35 per cent of the total irrigated land in the country
(NIA, 2017). The project targeted smallholders because they represent one of the country's
poorest groups, due mainly to their low productivity and frequent exposure to climatic shocks,
issues exacerbated by the low irrigation coverage in the country (Bordey et al., 2016).
IRPEP targeted CIS that had inadequate or inefficient water supply but high potential for
improvement, and whose users had low income and crop productivity. For each of these CIS,
IRPEP extended the canals of the CIS to cover more land, repaired canals damaged by climatic
shocks, and lined canals with concrete to prevent water seepage. In addition, IRPEP provided

Ch 2. Role of irrigation in inclusive rural transformation
38
training to IA officers to manage the system sustainably and equitably, encouraged women's
participation in IAs, and offered marketing facilitation services. By lining the canals to reduce
transmission losses, and improving system management, a key aim of the project was to improve
water supply to households located downstream on the canals.
The project is likely to have impacted the three regions differently. For instance, Region VI and
VIII are more at risk of climatic shocks compared to Region X. In fact, Region VIII was very
severely affected by Super Typhoon Haiyan during the project's implementation, which caused
serious damage to infrastructure and strained local institutions to cope with the implications—
ultimately leading to them being excluded from this study so as not to distort the findings. Region
X is much wealthier and its economy is mainly focused on cash crop production compared to
Region VI, which is more focused on rice and livestock production and has a services sector
(PSA, 2016). Despite being poorer, Region VI has experienced much larger poverty reduction
in recent years, while growth in Region X has been less pro-poor, an issue attributed partly to
the poor connectivity of households in rural areas (NEDA, 2017b; NEDA, 2017c; de la Rosa,
2018).
2.4 Data and methodology
2.4.1 Data and indicators
The quantitative data comes from a household questionnaire administered 18 months after
IRPEP's completion. We use data from 580 households in Region VI from 20 treatment and 20
control CIS, and 566 households in Region X from 16 treatment and 17 control CIS, equally

Ch 2. Role of irrigation in inclusive rural transformation
39
split between beneficiary and control households.1
Several measures were taken during both the sampling and data analysis stages to obtain
comparable treatment and control groups to measure IRPEP's impact. In the sampling stage, we
first used PSM to identify similar treatment and control CIS from a longlist of all the CIS in the
two regions, with the scores calculated to represent the likelihood of a CIS being selected for
IRPEP (Khandker et al., 2010). These scores were created using pre-project data linked to the
project's selection criteria, including the average yields of users, distance to the regional capital,
and the percentage of the system that is operational. By removing CIS without at least one match
in the opposite group, we used the scores to create a shortlist of potential treatment and control
CIS, from which we selected the final set for the sample with expert input from project staff.
From these CIS, we randomly selected households from amongst the CIS users for the household
survey. After the data was collected, we verified the sample and removed 29 treatment
households who still did not have access to rehabilitated irrigation, and 195 control households
who had already received similar irrigation support from the Philippines government.
Complementary qualitative data were collected through KIIs and FGDs. This included a KII with
the National Project Coordinator and one FGD with other project staff at the national level, along
with a KII and three FGDs with regional staff in each of the three project regions. In addition,
12 FGDs were held with officers from 6 treatment and 6 control IAs of the selected CIS, and 12
KIIs were also held with the Presidents of the same 12 IAs.
1 The sample size was determined based on obtaining a Minimum Detectable Effect Size of 10%, using the formula
outlined in World Bank (2007).

Ch 2. Role of irrigation in inclusive rural transformation
40
In order to test the potential linkages between irrigation and inclusive rural transformation
outlined above, we use the household dataset to create indicators relating to agricultural
production, income, livelihood composition, asset ownership, nutrition, social capital, education,
and women's inclusion. Regarding agricultural productivity, we focus on rice production given
its importance for smallholder livelihoods and because too few households grew other crops to
facilitate a meaningful analysis. To represent asset ownership, we create an index that
incorporates ownership of a range of productive assets, calculated using principle component
analysis (Filmer & Pritchett, 2001). We also create an index for livestock ownership based on
Tropical Livestock Units (Jahnke, 1982). Household Dietary Diversity Scores are used to assess
impact on nutrition, whereby a score is assigned based on the consumption of different food
groups in the past 24 hours (FAO, 2010).
To assess impacts by parcel location, we compare key indicators from each impact domain for
households who used only downstream parcels during the study period against households who
used at least one up or midstream parcel. This classification was chosen so as to focus on those
households likely to be the poorest (as all of their parcels are downstream)—although only a
small percentage of households had a mix of up, mid and downstream parcels.
2.4.2 Impact estimation methodology
We estimate the average treatment effect on the treated (ATET) for IRPEP using an IPWRA
approach, an impact estimation method that improves the comparability of the treatment and
control samples using both weighting and regression adjustment (see Wooldridge, 2010; Austin
and Stuart, 2015).

Ch 2. Role of irrigation in inclusive rural transformation
41
In this model, all treatment households are assigned a weight of one, and control households are
assigned a weight that represents the inverse of the probability of their being a control household.
These probability weights are calculated in a similar way to the Propensity Scores created for
the sample design, whereby the likelihood of being in the treatment or control group is modelled
based on pre-project livelihood capacities and other factors likely to influence their
participation.2 Using the inverse of the probability means that we assign greater weight to control
households who better represent a common treatment household, rather than a common control
household. We employ the IPWRA model as it allows for the use of additional control variables
within a regression framework which are important to incorporate in the case of detailed
agricultural data, and does not require the dropping of a large number of households as with
some PSM algorithms.
Formally, these weights are calculated as follows:
𝐼𝑃𝑊𝐴𝑇𝐸𝑇 = T +𝑃(1−T)
1−𝑃 (2.1)
where T = the treatment status (1 = treated, 0 = control), and P = the probability of receiving the
treatment they received given the set of weighting variables.
The next step is to run a regression adjustment model with the weights applied to each household.
Separate models are run for the treatment and control groups, and in each case an expected value
for the impact indicator is estimated. The formal specification of the regression model is as
follows:
2 The variables used to the create the scores consisted of the age, education and gender of the household head,
household size, asset ownership at the start of the project, climatic shocks in the past year, number of IA members
in the household, amount of land owned and proportion of land owned up/mid/downstream on the irrigation canal.

Ch 2. Role of irrigation in inclusive rural transformation
42
𝑌𝑖 = 𝛽0 + 𝛽1𝑇𝑖 + 𝛴𝑋𝑖𝑗𝛽2𝑗 + 𝑒𝑖 (2.2)
Where Y is the outcome for household i for the impact indicator, Ti is the treatment status for
household i, Xij represents an I x J matrix of control variables used in the model, 𝛽1 is the
coefficient of the treatment indicator and 𝛽2𝑗 is a vector of coefficients to be estimated for each
of the control variables, βo is the constant, and ei is the error term, which was calculated using a
cluster robust estimator at the province level (Cameron and Miller, 2015). Control variables were
chosen based on their likelihoods to have influenced the outcome variable, while not having been
affected by the project, meaning that different sets of control variables were used depending on
the outcome variable being analysed. 3
The final estimated impact, the ATET, is then calculated as follows:
𝐴𝑇𝐸𝑇 = �̂�1 − �̂�𝑜 (2.3)
Where �̂�1 is the average expected outcome for the treatment households, and �̂�𝑜 is the average
expected outcome for control households obtained from the regression in Equation 2.2 above.
Both the inverse probability weighting and regression adjustment components of the IPWRA
model can be used individually for this type of impact analysis, but to produce consistent
estimates, the former is dependent on the weights being correctly specified and the latter is
dependent on the correct-specification of the regression model. However, the IPWRA model
3 Control variables for each impact indicator were selected from the following list: Province; Location on irrigation
canal; Distance from local market; Education of household head; Age of household head; Average age in household;
Number of adults in household; Household size; Experiences drought/flood/pest outbreak shock in past year; Soil
fertility; Hectares of land owned; Received training on rice production/water management/input subsidy; Received
loan in past 12 months; Baseline asset index.

Ch 2. Role of irrigation in inclusive rural transformation
43
only requires one of the two to be correctly specified for the estimates to be consistent, therefore
the model is classified as a doubly-robust estimator.
Tests of the effectiveness of the model indicate that we were able to further reduce the minor
imbalances between treatment and control the households . For the variables used to weight the
sample, the Standardised Mean Difference (SMD) was reduced from 0.09 to 0.07, and the
Variance Ratio (VR) was reduced from 1.11 to 1.09.4 To test the sensitivity of the results to
model specification, the results were also verified using a secondary model based on a nearest
neighbour PSM algorithm (Austin, 2011), which produced qualitatively similar results,
suggesting that our findings are consistent across model specifications.5
2.5 Profile of the sample
Table 2.1 presents descriptive statistics on livelihood characteristics for the household samples
from Regions VI and X. For both regions, average incomes are both well below the national
average of PHP140,259, as well as the regional averages of PHP76,459 for Region VI and
PHP120,799 for Region X (PSA, 2016). Although income and land use in Region VI are
considerably lower than in Region X. Rice production is widespread amongst the sample but
average harvests are larger in Region X and a much larger proportion of harvests are sold rather
than consumed in this region.
Although poorer, the livelihoods of households in Region VI are more diversified compared to
households in Region X, with the latter more dependent on rice sales. This diversity in Region
4 An SMD of below 0.1 is recommended for a well-balanced sample (Austin, 2009). 5 Results from this secondary model are available upon request from the corresponding author.

Ch 2. Role of irrigation in inclusive rural transformation
44
VI may be survival (rather than opportunity) based, given their lower incomes, lower land access,
and higher risk of climatic shocks (Ellis, 2000; Svodziwa, 2018). Conversely, households in
Region X may show signs of transformation in terms of the benefits they are gaining from
specialising in rice farming, but they do not show signs of shifting into more lucrative on- and
off-farm activities. They also seem to face barriers to their rice marketing, with further
investigation finding that the majority of the rice sold by these farmers was unprocessed.
Qualitative data from the region also highlights that CIS in the region are located far from local
government offices and trading centers, a disconnection which may explain why their profile
differs from their wealthier, cash-crop producing rural neighbours in the rest of the region.
Table 2.1. Livelihood characteristics of the household sample
Region
VI
Region
X
Region
VI
Region
X
Land cultivated (ha.) 1.7 2.3 Income ($/cap.) 932 1,348
Crops grown (% of
sample):
- Rice
- Other
99.8
4.3
100.0
5.6
Income sources (% of
total):
- Rice sale
- Other crop sale
- Waged labour
- H'hold enterprise
- Livestock
- Other
(remittances,
inheritance, etc.)
14.1
0.4
25.0
19.2
7.9
33.4
46.0
0.7
22.5
10.4
4.0
16.5
Rice harvest (t/ha) 3.3 3.7
Proportion of rice
harvest sold (%) 16.9 42.6

Ch 2. Role of irrigation in inclusive rural transformation
45
2.6 Results and discussion
2.6.1 Agricultural production and income
Table 2.2 presents the results for IRPEP's impact on rice production per hectare, cropping
intensity, production efficiency and rice sales in Region VI and X (the mean values for each of
the impact indicators can be found in Appendix 2.A). We find that rice yields were significantly
increased in both regions, but more so in Region VI (13 per cent compared to 8 per cent).
However cropping intensity—measured by the proportion of operable land that was cultivated—
was only increased in Region X and was significantly reduced in Region VI. The efficiency of
production—measured by the value of inputs (not including land) used to produce one tonne of
rice—was only improved in Region X. Apart from land use, insights from the qualitative data
suggest that efficiency of production was not impacted in Region VI due to farmers being unable
to afford or access efficiency-enhancing inputs such as improved seed varieties.
Only in Region X did the project increase the proportion of rice harvest that was sold (by nine
percentage points) and income from rice sales (by 128 per cent). In Region VI, further analysis
finds that there was instead a significant increase in the proportion of harvest used to pay back
costs incurred during production. Insights from the qualitative data suggest that this outcome
was partially caused by farmers taking loans from local traders to fund their production, which
then had to be repaid with their harvest.
The large impact on income from rice sales in Region X seems to have been driven by the
increase in yields, rather than improvements in marketing. Qualitative data from Region X
highlights similar issues of farmers being tied into credit-for-harvest arrangements with local

Ch 2. Role of irrigation in inclusive rural transformation
46
traders, along with high transport costs and limited access to post-harvest processing machinery.
IA leaders also reported that they have attempted to establish collective crop selling and value
chain access for their members, but have failed due to farmers' persistent sale to local traders
based on traders' lower processing requirements and the credit and immediate payment they
provide. In a similar vein, it was widely reported that the marketing support provided by IRPEP,
which was not provided in Region VI, was largely ineffective for the same reason, and thus is
unlikely to be the reason for the different impacts in the two regions.
We were unable to analyse the project's impact on crop diversity as very few households grew
crops other than rice in the two regions, which implies that the project's impacts on agricultural
productivity were restricted to rice production. For projects like IRPEP that are focused around
the production of a single crop, it is expected that the economic benefits from specialisation
counteract the potential increase in households' vulnerability to crop-specific shocks, however
such benefits are only reflected in farm incomes in Region X.
Table 2.2. IRPEP impact on agricultural production and sales
Harvest/ha.
Cropping
intensity†
Input expt. per
tonne of output
Per cent of
harvest sold†
Rice sale
revenue/ha Obs
Region VI 13.31%*** -12.48*** 1.05% -0.12 -5.90% 441
Region X 8.08%*** 27.79*** -10.10%*** 9.27*** 127.50%*** 480
Note: *,** and *** indicate that the estimated impact is statistically significant at the 10, 5 and 1% levels, respectively.
Households not producing rice are not included in the model (Region VI = 26; Region X = 17).
† Coefficient represents a percentage point change.

Ch 2. Role of irrigation in inclusive rural transformation
47
2.6.2 Household income and livelihood composition
Despite the lack of impact on rice sales in Region VI and the large impact in Region X, we find
a 19 per cent increase in income for households in Region VI, compared to a significant increase
of just 0.4 per cent in Region X (see Table 2.3). The livelihood composition results in the table
show that there was a shift in both regions. In Region VI, the share of income from crop sales
reduced significantly by five percentage points, which reflects the reduction in cropping intensity
noted above, while the share from the sale of livestock products and from off-farm waged labour
increased by five and three percentage points, respectively. Additional analysis finds that
livestock income per capita increased by 193 per cent in this region. In Region X, the share of
income from crop sales increased significantly by 11 percentage points, while the share from
off-farm waged labour reduced significantly by nine percentage points. We also find reductions
in the share of income from livestock production and household enterprises, but these results are
not statistically significant.
These results highlight the potential for opposing impacts of small-scale irrigation projects on
livelihood composition based on context; impacts which can help or hinder the rural
transformation process. Households in Region VI are poorer but with more diversified
livelihoods, have restricted access to agricultural inputs, and are more at risk of climatic shocks.
Livestock production is also a major part of the rural economy. IRPEP's impacts in this region
indicate that the project helped to enhance households' already-diversified portfolio of activities,
further reducing concentration on staple crop production and increasing the benefits from
existing market linkages in livestock as well as off-farm waged activities—all signs of
advancement in rural transformation at the household level.
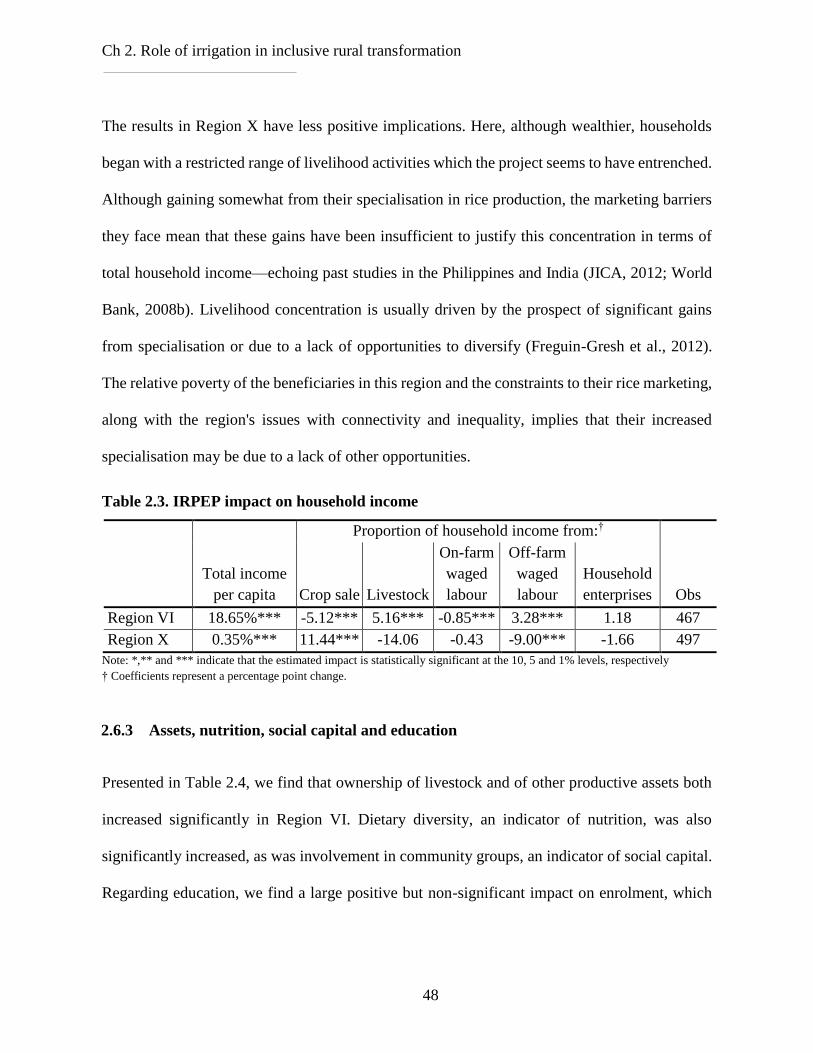
Ch 2. Role of irrigation in inclusive rural transformation
48
The results in Region X have less positive implications. Here, although wealthier, households
began with a restricted range of livelihood activities which the project seems to have entrenched.
Although gaining somewhat from their specialisation in rice production, the marketing barriers
they face mean that these gains have been insufficient to justify this concentration in terms of
total household income—echoing past studies in the Philippines and India (JICA, 2012; World
Bank, 2008b). Livelihood concentration is usually driven by the prospect of significant gains
from specialisation or due to a lack of opportunities to diversify (Freguin-Gresh et al., 2012).
The relative poverty of the beneficiaries in this region and the constraints to their rice marketing,
along with the region's issues with connectivity and inequality, implies that their increased
specialisation may be due to a lack of other opportunities.
Table 2.3. IRPEP impact on household income
Total income
per capita
Proportion of household income from:†
Obs Crop sale Livestock
On-farm
waged
labour
Off-farm
waged
labour
Household
enterprises
Region VI 18.65%*** -5.12*** 5.16*** -0.85*** 3.28*** 1.18 467
Region X 0.35%*** 11.44*** -14.06 -0.43 -9.00*** -1.66 497
Note: *,** and *** indicate that the estimated impact is statistically significant at the 10, 5 and 1% levels, respectively
† Coefficients represent a percentage point change.
2.6.3 Assets, nutrition, social capital and education
Presented in Table 2.4, we find that ownership of livestock and of other productive assets both
increased significantly in Region VI. Dietary diversity, an indicator of nutrition, was also
significantly increased, as was involvement in community groups, an indicator of social capital.
Regarding education, we find a large positive but non-significant impact on enrolment, which

Ch 2. Role of irrigation in inclusive rural transformation
49
may be linked to the low sample size (as the sample is restricted to households with school age
children). For Region X, we do not find significant impacts on any of these indicators.
The different impacts on these indicators in the two regions are seemingly linked to the larger
impact on income in Region VI. In the qualitative interviews, households in Region VI noted
that they used higher incomes from the project to purchase healthier foods and to send their
children to school. In addition, the project's support to IAs may have also contributed to the
impact on social capital. In the qualitative interviews, it was highlighted that the strengthened
IAs in both regions helped to increase community engagement, although the lack of impact in
Region X suggests that households may have faced additional barriers to improving social capital
in this area.
These results also highlight important links between small-scale irrigation, livestock, and dietary
diversity. In Region VI, we find livestock ownership and income to have increased, similar to
findings from previous studies in Mali, Nepal and Vietnam (Dillon, 2011; ADB, 2012; Nguyen
et al., 2017). Furthermore, enhanced livestock activities may have also contributed to improved
dietary diversity in Region VI, as further analysis indicated that the project had a significantly
positive impact on the consumption of both meat and eggs in the region.
Table 2.4. IRPEP impact on assets, nutrition, social capital and education
Productive
asset index
Livestock
ownership
(TLU)
Dietary
diversity
score
Group
meetings Obs
School
enrolment
(% enrolled) † Obs
Region VI 0.07** 1.10*** 0.18*** 3.95*** 467 10.35 233
Region X 0.09 0.30 0.04 0.73 497 -2.74 260
Note: *,** and *** indicate that the estimated impact is statistically significant at the 10, 5 and 1% levels, respectively
† Coefficients represent a percentage point change. Note that the number of observations for school enrolment model is lower
as the it only includes households with school aged children.
Ch 2. Role of irrigation in inclusive rural transformation
50
2.6.4 Women’s inclusion
Table 2.5 shows that the favourable impacts in Region VI also apply to women's inclusion in
economic activities. In Region VI, we find a significant increase of four percentage points in the
share of household income provided by women's income from waged labour and from household
enterprises that they own, and a significant increase of six per cent in the likelihood of a female
household member owning their own enterprise.
For both regions, analysis of data collected from IAs also suggests that the project increased the
number of women serving as IA officers. This impact could potentially have been mutually
complementary to the impacts on women's economic inclusion in Region VI. Women's
involvement in collective action groups can enhance their income generating capacity by
increasing their economic opportunities and credit access, providing protection from risk,
transferring knowledge and skills, and providing assistance in long-term asset accumulation
(Pandolfelli et al., 2007; Quisumbing and Kumar, 2011; Schroeder et al., 2013). In-turn, the
breaking of social norms achieved through autonomous income generation, more knowledge and
assets, and increased strength in numbers can lead to increased representation and standing of
women in their communities and households (FAO, 2011b).
In Region VI, these results suggest that women were not excluded from the positive contributions
of the project to rural transformation. Furthermore, women's increased economic activities may
have contributed to the impact on total household income, and their increased income and
bargaining power may have also fed into the positive impacts on education and nutrition.
Conversely in Region X, women's economic opportunities do not seem to have changed, as part
of the project's overall lack of influence on components of rural transformation in the region.

Ch 2. Role of irrigation in inclusive rural transformation
51
While in Region VI, the expansion into livestock production and non-farm activities likely
presented more opportunities for women to increase their income generating capacities, the
increased focus on farm production in Region X likely restricted their activities to family farming
(Slavchevska et al., 2016).
Table 2.5. IRPEP IA level impact on women's empowerment
Women's wage and enterprise
income (% of total) †
Likelihood of owning
enterprise (%)† Obs
Region VI 4.09*** 5.54*** 437
Region X -3.67 -2.98 474
Note: *,** and *** indicate that the estimated impact is statistically significant at the 10, 5 and 1% levels, respectively.
Households where there are no women were not included in the model (Region VI = 30; Region X = 23).
† Coefficients represent a percentage point change.
2.6.5 Impacts by parcel location
There were significant positive impacts on rice yields and rice sale income for households that
cultivated downstream parcels (Table 2.6). Respondents in the qualitative interviews attributed
this mainly to better regulation of water use along the canals by IAs. Although the yield impact
was very similar, households with up or midstream parcels had a much larger impact on rice sale
income. Despite this, we do not find a significant impact on total income for either group. There
was also no impact for either group on women's income, but there was a significant positive
impact for downstream households on group meeting attendance. Not shown in the table is the
impact for these households on income composition, for which the majority of income sources
were not significantly impacted, except that the proportion of income from selling rice increased
for up and midstream households.

Ch 2. Role of irrigation in inclusive rural transformation
52
Given their restricted irrigation water supply before the project, downstream households were
expected to benefit relatively more from the project if they had the same amount of access to
inputs as those further upstream. The similar yield impacts for the two groups thus implies input
constraints may have hindered poorer downstream households from fully capitalising on the
improved water supply, something that is supported by the qualitative data.
The smaller impact on income from rice sales for downstream households indicates that
downstream households may also face greater obstacles to market access. The impact on income
for up and midstream households echoes that for the wealthier households in Region X, whereby
large rice income gains were counteracted by reduced involvement in other activities. However,
the opposite effect was not found for downstream households as was found for the poorer
households in Region VI, implying the diversification benefits for poorer households were
specific to Region VI. The positive impact on social capital for downstream households without
a significant impact on income suggests that this impact was driven by increased involvement of
these households in communal activities of the CIS and IA, potentially due to the productivity
benefits.
Table 2.6. IRPEP impact on up and downstream households
Harvest/ha.
Rice sale
revenue/ha. Obs
Total income
per capita
Group
meetings
Women's wage and
enterprise income
(% of total) † Obs
Up/midstream 9.21%** 148.67%*** 490 6.17% -0.21 -3.45 (487) 514
Downstream 9.21%*** 30.56%*** 431 17.20% 1.67** 0.52 (424) 450
Note: Households not producing rice are not included in the model for the first two columns (Region VI = 26; Region X = 17).
*,** and *** indicate that the estimated impact is statistically significant at the 10, 5 and 1% levels, respectively.
† Coefficient represents a percentage point change.

Ch 2. Role of irrigation in inclusive rural transformation
53
2.7 Conclusions
In this chapter, we find that user-managed small-scale irrigation can play a useful role in
promoting inclusive rural transformation, but its impact is shaped by several contextual factors.
In one project region that provided a supportive environment, we find that small-scale irrigation
projects have the potential to contribute considerably to inclusive rural transformation. Before
the project, households in Region VI were reasonably well-connected (living in a small but
densely populated area), and the regional economy was structured to provide opportunities for
rewarding livelihood expansion. In addition, due to exposure to frequent climatic shocks, the
livelihoods of households in this region were characterised by diversification for survival and
risk mitigation. For smallholders within this context, there is evidence that already-diversified
livelihood activities can be enhanced and become more characteristic of the lucrative activities
typical of a transforming rural economy. This impact on livelihoods comes particularly through
fruitful links between irrigation and livestock, and is also reflected in more income generating
opportunities for women.
In the other project region, however, less enabling local conditions led to limited impacts on the
components of inclusive rural transformation. We find that, where smallholders' livelihoods are
more static, and issues of connectivity, market access and unbalanced economic growth hinder
livelihood expansion and value chain access, projects such as IRPEP struggle to contribute to
inclusive rural transformation by themselves. In the worst cases, broader strategies to modernise
the rural economy and to draw labour into more productive rural and urban sectors could even
be hindered as smallholders become entrenched in existing livelihood activities and potentially
become more vulnerable to shocks.

Ch 2. Role of irrigation in inclusive rural transformation
54
The finding that improved water supply and regulation can benefit downstream households in
terms of yields and on-farm income is promising, and highlights the benefits of supporting IAs
to manage systems equitably. Broader livelihood benefits for these households, however, may
be hindered by poverty-related obstacles such as limited access to inputs and markets.
Based on these results, if small-scale irrigation is to be used as a tool to promote inclusive rural
transformation, it must be combined with strategies to foster complementary market linkages at
the household level. These strategies must focus on building strong agricultural input and output
markets (including financial markets), and opportunities to expand livelihoods into more
lucrative on- and off-farm activities. Particular attention is needed to ensure the inclusion of
smallholder farmers, especially those located downstream, and rural women, who often face
more obstacles to market access and inclusion (FAO, 2017). The strong link between small-scale
irrigation and livestock production is surely an opportunity to capitalise upon in this case, given
the rising urban demand for animal protein in developing countries (Henchion et al., 2017).
Regarding the specific components of inclusive rural transformation, we add further evidence
supporting the link between irrigation and yields. However, we note that improvements in
production efficiency can be hindered by input and credit access constraints, which can
subsequently limit benefits from crop sales. In addition, we find that increased income and
livestock ownership from improved irrigation can increase dietary diversity, consumption of
livestock products, and social capital, with the latter also being improved through strengthened
IAs. Finally, on the under-studied link between small-scale irrigation and women's
empowerment, we find that improving irrigation infrastructure and encouraging women's

Ch 2. Role of irrigation in inclusive rural transformation
55
involvement in its management can considerably improve women's economic opportunities and
their role in the community.
Our results also highlight that the effectiveness of using local institutions to manage small-scale
irrigation systems, if these institutions are provided with appropriate support. We find that these
institutions can provide effective and efficient system management to the particular benefit of
those located downstream and provide an avenue for women to gain greater responsibility and
representation in the community. Based on our findings, an avenue for future initiatives could
be to equip these institutions to provide further support to the livelihoods of system users in ways
that address the input, market and credit access barriers that mitigated the impacts of IRPEP.

Ch 2. Role of irrigation in inclusive rural transformation
56
Appendix 2.A. Mean values of impact indicators
Treatment mean Control mean
Agricultural production and sales
Harvest per ha (tonnes) 3.55 3.44
Cropping intensity (%)
Total input expt per mt of output
(PHP) 145.97 143.11
Per cent of harvest sold (%) 33.23 30.97
Rice sale revenue per ha. (PHP) 438.96 403.42
Household income
Total income per capita (PHP) 1142.70 1145.23
Proportion of household income
from:
Crop sale
Livestock
On-farm waged labour
Off-farm waged labour
Household enterprises
31.46
5.98
2.18
20.19
15.13
30.24
8.29
1.85
23.93
14.14
Assets, nutrition, social capital and education
Productive asset index 1.14 1.06
Livestock ownership (TLU) 2.38 1.58
Dietary diversity score 7.41 7.07
School enrolment (% of school age
children enrolled) 93.41 91.50
Group meetings 6.25 5.50
Women's inclusion
Women's wage and enterprise
income (% of total) 15.95 18.46
Likelihood of owning enterprise (%) 17.93 18.06

57
Chapter 3
Measuring the impact of improved irrigation on the
productivity of smallholder rice farmers in the Philippines
A Stochastic Meta-Frontier analysis
Abstract: Using a Stochastic Meta-Frontier approach, we analyse how improved canal
irrigation can affect the Technical Efficiency and Frontier Output of smallholder rice farmers.
We find that the project had a positive impact on Frontier Output but not on Technical Efficiency,
suggesting that improved irrigation technology increased beneficiaries' production potential, but
it did not improve efficiency likely due to insufficient training and input access. Heterogeneity
analysis reveals that the main beneficiaries were downstream parcels, smaller parcels, those
located in the poorer project district, and farmers with lower education, all implying a more pro-
poor impact. Finally, we find that female-headed households benefitted less from the project,
suggesting the need for additional support in future interventions.
This chapter is based on:
Bravo-Ureta, B.B., Higgins, D. and Arslan, A. 2020. Measuring the impact of improved
irrigation on the productivity of smallholder rice farmers in the Philippines: A Stochastic Meta-
Frontier analysis. World Development, 135: 105073
Ch 3. Impact of irrigation on smallholder rice productivity
58
3.1 Introduction
Given its historic role in catalyzing rural transformation, better farm productivity is central to
any attempts to foster inclusive rural transformation in developing countries. However,
productivity gains are becoming increasingly threatened by growing water scarcity. Caused by
increasing demand from agriculture, mining, industry, hydroelectricity generation, and a rising
population (USGCRP 2017; World Bank 2016; de Fraiture et al. 2010), this scarcity is being
exacerbated by the melting of glaciers and changes in precipitation patterns, events that have
been connected to climate change and that are altering hydrological systems with negative effects
on the quantity and quality of water resources (USGCRP 2017; IFAD 2016; IPCC 2014).
Given the challenges climate change is expected to pose on smallholder agriculture, irrigation
has been identified as an important adaptation strategy to increase agricultural productivity, and
thus to promote inclusive rural transformation in developing countries (World Bank 2017; IFAD
2016). As the potential for bringing additional land under irrigation is limited (FAO 2012), a key
strategy is to focus on improving water management efficiency in agriculture, which is especially
important in developing countries where farming can account for over 90 per cent of water use
(Doungmanee 2016; FAO 2011).
Our concern in this chapter is rice production, which is a central crop for many of the rural poor
in terms of caloric and protein intake, overall food consumption, employment, income, and labor
and land use in small-scale farms (Muthayya 2014; GRiSP 2013). Rice is also the crop with the
highest water use in the world (approximately 784 billion m3/year), which is more than double
the amount of water used for maize or wheat (Chapagain & Hoekstra, 2010). Coping with this

Ch 3. Impact of irrigation on smallholder rice productivity
59
water demand requires sizeable investments in irrigation infrastructure and large operating and
maintenance budgets (Bouman 2009; Chapagain and Hoekstra 2010).
Despite the importance of the link between irrigation and farm productivity in a context of rising
water scarcity, there is a lack of rigorous assessments of the impact of irrigation projects
generally and in rice farming in particular. Furthermore, evidence focused on efficiency impacts
based on SPF models is nearly nonexistent (Njuki and Bravo-Ureta 2018; World Bank 2011).
This chapter adds to this slim literature and aims to inform future projects and policies by
evaluating the impact of IRPEP on the productivity of smallholder farmers in the Philippines.
We use state of the art SPF methodologies within an impact evaluation framework to measure
the project's impact on two key productivity components: 1) Technological change captured by
a shift in the frontier; and 2) TE differentials between IRPEP beneficiary (treated) and non-
beneficiary (control) groups.
The rest of the chapter is organized as follows. Section 3.2 provides a brief discussion of key
features of IRPEP followed by a review of the related literature in Section 3.3. We then present
the methodology in Section 3.4, followed by the data and the empirical model in Section 3.5.
Section 3.6 contains the results and the final section offers a summary and concluding remarks.
3.2 Context
Agriculture in the Philippines, which is dominated by smallholder farming, generates around 11
per cent of national income and provides livelihoods for 30 per cent of the population (OECD
2017). In rural areas, about 70 per cent of the population is poor and heavily reliant on

Ch 3. Impact of irrigation on smallholder rice productivity
60
agriculture, chiefly rice farming. Rice is the most important source of calories (46 per cent) and
of protein (34 per cent) (WFP 2017).
There are serious concerns over the competitiveness of rice production in the Philippines,
evidenced by high import rates from countries such as Thailand and Vietnam (Dawe 2006;
Bordey et al. 2016). This reliance on imports is partially linked to low productivity, with the
paddy yield in the country averaging around 3.99 t/ha., much lower than other countries in the
region such as China (6.75 t/ha.) and Vietnam (5.75 t/ha.) (Ricepedia 2017; GRiSP 2013).
Consequently, increasing the productivity and production of rice is a key strategic policy aim
(Bordey et al. 2016; NEDA 2017). To this end, the National Irrigation Authority has made
substantial investments to upgrade irrigation systems, but the success of these efforts is unclear
and a sizeable share of irrigable land (around 41 per cent) has not benefited from such
investments (Inocencio et al. 2016; PSA 2016). As a result, improving irrigation coverage to
enhance productivity, and thus promote rural transformation, remains a key aim of the
Philippines Development Plan 2017-2022, with small-scale communal irrigation the preferred
instrument for reaching smallholders (NEDA, 2017a).
IRPEP aimed to unlock the production potential of smallholder rice farmers in the Philippines
by rehabilitating the canal infrastructure of CISs, mainly in the form of concrete-lining to reduce
seepage, in order to improve the quality and coverage of water delivery. The project also
strengthened the capacity of IAs in order to improve the management, maintenance and
leadership of the CIS in a sustainable manner (Bagadion and Korten 1991; Hamdy et al. 2009).
More reliable, efficient, timely and equitable water availability as a result of IRPEP activities
was anticipated to increase cropping intensity and productivity (particularly during the dry

Ch 3. Impact of irrigation on smallholder rice productivity
61
season), to improve labor efficiency and reduce susceptibility to pests (IFC 2003). Combined
with FFS based on the PhilRice Palay Check System, plus marketing support, increased rice
productivity was expected to translate into increased household output and income from crop
sales, as well as improved food security and nutrition (Bhattarai et al. 2002; Godfray et al. 2010;
Knox et al. 2013).
In this paper we focus on IRPEP's impact on beneficiaries' production frontier and their TE. The
shift in the frontier is expected to arise from the technology improvements in irrigation, while
TE improvements are expected from project activities intended to strengthen managerial
performance, such as the FFS and the capacity building of IAs who can then provide
management support to the CIS users. In addition, TE may be improved by complementarities
between irrigation and other inputs (which was a key aspect of the Green Revolution), and also
through farmers deciding to invest more in improving their managerial performance due to the
greater reliability provided by improved water supply (Evenson and Gollin 2003; Hazell 2009;
Gebregziabher et al. 2012).
3.3 Related literature
This study combines methods from two strands of the literature related to rice farming: studies
on the relationship between irrigation and TE, and rigorous impact evaluation studies of
irrigation projects for rice farmers.
The analysis of TE using frontier function methodologies has been a dynamic area of research
in production economics and an extensive literature has evolved focusing on agriculture (Bravo-
Ureta et al. 2007 and 2017). In applied work, the most common approach to measuring TE is the

Ch 3. Impact of irrigation on smallholder rice productivity
62
gap between observed and potential output that could be produced relative to a reference “best
practice” frontier (Greene 2008; Coelli et al. 2005). The estimation of best practice frontiers to
derive TE measures can be done with different methods, and here we focus on the studies using
SPF models to examine TE in rice farming, which is the approach we implement below (Fried
et al. 2008).
Findings from the existing SPF studies focusing on irrigation and TE in rice farming are mixed.
In the Philippines, for instance, Yao and Shively (2007) applied a Cobb-Douglas SPF to a panel
data sample of 747 parcels (irrigated and rainfed) and found a positive correlation between
irrigation and TE. Similarly, in Tanzania, Mkanthama et al. (2018) applied a translog SPF to a
sample of 68 irrigated and 74 rainfed plots and estimated that the average TE for irrigated plots
was 96 per cent, compared to 29 per cent for rainfed plots. In a study of rice farmers in Ethiopia,
however, Makombe et al. (2017) applied a translog SPF to a sample of 248 farmers with irrigated
and 319 with rainfed land and reported that the average TE was higher for those with rainfed
land (78 per cent vs. 71 per cent). In addition, in Bangladesh, Rahman (2011) applied Green's
(2010) sample selection SPF along with a translog model to a sample of 946 rice farmers and
found an average TE of 82 per cent.
There are many factors that could potentially influence the link between irrigation and TE of rice
production. For instance, the same study in Tanzania also found that the high TE of irrigated
plots was linked to adoption of high yielding seed varieties (Mkanthama et al. 2018). This
mechanism relies on access and affordability of such complementary inputs which farmers from
the studies in Ethiopia and Bangladesh may have lacked. Knowledge of water management may
also be a mitigating factor. This is highlighted by a study in Tamil Nadu in India, which applied

Ch 3. Impact of irrigation on smallholder rice productivity
63
a translog SPF to a sample of 224 rice plots and found that the relatively low TE of the irrigated
plots (63 per cent) was partly due to low Irrigation Water Efficiency, which was estimated at 34
per cent (Kuppannan et al. 2017).
The equality of water distribution within the irrigation systems may also influence the
relationship between irrigation and TE. In the same study from the Philippines, it was found that
water was not distributed evenly along the irrigation canals due to poor administration, meaning
that the benefits to TE were unequally distributed (Yao and Shively 2007). In such cases, the
average TE may suffer as a result of this inequality. Given that unequal water distribution is
particularly an issue for canal irrigation projects such as IRPEP (Fujiie et al. 2005; Kakuta 2017),
we conduct additional tests for impact in this chapter, as with the previous chapter, according to
location on the irrigation canal.
Although impact evaluation as a subfield of research has grown very quickly, few impact
evaluations have been conducted on irrigation projects, especially those that focus on rice
production (World Bank 2011; Cameron et al. 2016). The existing impact evaluation literature
on irrigation projects is dominated by quasi-experimental methodologies, including studies that
rely only on cross-sectional data and utilize PSM with limited or no attention given to selection
bias from unobservables.
The existing studies that focus on rice production invariably find positive impacts on rice yields.
In the previous chapter focusing on the same project, we find positive impacts on yields of 13
per cent and eight per cent for Regions VI and X, respectively. Another large-scale canal
irrigation project in Region VI was also found to have improved rice yields by around 50 per
cent, as well as the use of chemical fertilizer and hybrid seeds (JICA 2012). Using a PSM

Ch 3. Impact of irrigation on smallholder rice productivity
64
methodology, an irrigation infrastructure project in Madagascar (which also promoted land
tenure security and use of improved seeds) was found to have significantly improved rice yields
by around 25 per cent (Ring et al. 2018). Similarly, using a Difference in Difference
methodology, a large-scale canal irrigation project in Andhra Pradesh, India was found to have
increased rice yields by up to 66 per cent, while a smaller-scale canal irrigation project in Ghana,
analyzed using a PSM methodology, was found to have increased rice yields by 1.1 t/ha. (World
Bank 2008; Kuwornu and Owusu 2012). As also noted in the review of the TE literature above,
issues of water equality were detected in the impact evaluation studies in India and the
Philippines (World Bank 2008; JICA 2012).
The only known irrigation study that combines TE and impact evaluation methods is that of
Gebregziabher et al. (2012), though it is not related to rice production. With a sample of 426
irrigated and 1,768 rainfed plots located in the Tigray region of Ethiopia, the authors first use
PSM to create a matched sample of treated and control plots and then estimate Cobb-Douglas
SPF models following the Battese and Coelli (1995) framework. Their approach, however, does
not address possible selection bias from unobservables and does not test for potential technology
differences between irrigated and rainfed farming. Consistent with the impact evaluation studies
mentioned above, the authors find that agricultural productivity was higher on the irrigated plots;
however, the average TE for irrigated plots was just 45 per cent compared to 82 per cent for
rainfed plots.
Both of these strands of the literature have shortcomings that we address in this paper. The
existing TE studies provide inconclusive evidence of the link between irrigation and TE in rice
production. Although the mixed findings of these studies may be driven by differing contextual

Ch 3. Impact of irrigation on smallholder rice productivity
65
factors, the absence of rigorous comparisons between irrigated and non-irrigated plots, does not
make it possible to assess whether these results are biased and thus misleading due to selectivity.
For instance, better farm managers may be richer and more motivated to use irrigation, meaning
that without an adequate counterfactual it is not possible to ascertain the degree to which the
higher productivity or TE of irrigated plots is attributable to irrigation or to unobserved farmer
characteristics.
On the other hand, while addressing the selection bias issue, the impact evaluation studies only
focus on rice yields, without considering TE. As the findings from the study by Gebregziabher
et al. (2012) show, productivity can be improved without an increase in TE, meaning that
irrigation projects may expand the production frontier and improve yields, but leave beneficiaries
producing far below their production potential. Therefore, assessing both technology effects and
TE provides a more detailed picture of the mechanisms through which irrigation affects
productivity, and thus provides richer implications of the package of technology and
management support that future projects should provide in a given context to maximize impact.
In this paper, we apply the most robust known analysis to achieve this goal, using sample
selection bias-corrected SPF frontiers to identify separately a project’s technology effect and TE
differentials across suitably matched groups of treated and control plots. A comparison across
the two groups is then undertaken based on a common benchmark estimated with a Stochastic
Meta-Frontier (SMF) model.

Ch 3. Impact of irrigation on smallholder rice productivity
66
3.4 Methodology
Our aim is to identify separately production technology induced effects and TE differentials
associated with improved irrigation infrastructure and to this end we employ the approach by
Bravo-Ureta et al. (BGS) (2012). Unlike in the literature reviewed above, this framework
corrects for biases from both observables (using matching methods) and unobservables (by
implementing Greene’s (2010) selectivity corrected SPF model (SC-SPF)). BGS (2012) applied
the SC-SPF model to investigate technology and TE gaps using an ex-post cross-sectional dataset
for treated and control farmers originally collected to evaluate the MARENA Program
implemented in Honduras. Subsequent applications of the BGS model include: González-Flores
et al. (2014), who explored the impact of Plataformas de Concertación in Ecuador; Villano et
al. (2015), who incorporated a deterministic meta-frontier (MF) to analyze the impact of
adopting certified rice seed in the Philippines; De los Santos-Montero and Bravo-Ureta (2017),
who also used a deterministic MF to examine the productivity effects of a natural resource
management program implemented in Nicaragua (POSAF-II); Abdulai and Abdulai (2017), who
studied the impact of conservation practices on the environmental efficiency of maize producers
in Zambia; Lawin and Tamini (2019), who incorporated a SMF to examine the impact of land
tenure security on TE in Benin; and Abdul-Rahaman and Abdulai (2018), who investigated the
impact of farmer groups on yields and TE in Northern Ghana.
With the exception of Lawin and Tamini (2019), a clear shortcoming of the studies just cited as
well as the TE studies discussed in Section 3.3, is the failure to estimate a meta-frontier to provide
a benchmark technology required for valid performance comparisons across the groups under
study. In what follows, we implement the BGS (2012) along with the SMF approach of Huang

Ch 3. Impact of irrigation on smallholder rice productivity
67
et al. (2014) to obtain a common benchmark technology. Hence, we are able to conduct a
rigorous analysis of the impact of IRPEP including meaningful technology and TE comparisons
between project beneficiaries and control farmers.
The methodology we utilise entails the following steps: 1) Estimation of a binary project
participation model to obtain Propensity Scores; 2) Use of PSM to define a sample of beneficiary
and treated parcels that are as similar as possible based on observable baseline attributes; 3)
Estimation of separate SC-SPF models for control and beneficiary parcels to deal with biases
from unobservables; and 4) Estimation of an SMF model that makes it possible to make valid
comparisons between the performance of beneficiary and control groups vis-á-vis a common
benchmark technology.
In this paper, we estimate a probit participation model at the parcel level to generate Propensity
Scores representing a parcel's probability of being treated, i.e. receiving IRPEP support
(Khandker et al. 2010; Cameron and Trivedi 2005). Once the Propensity Scores are generated,
we discard observations that do not fulfil the common support condition (Heinrich et al. 2010).
The remaining parcels are the basis for a second round of sample adjustment to improve the
balance of the treatment and control groups, where balance refers to the similarity of treated and
control parcels according to the variables included in the participation model. We test for balance
using the standardized percentage bias for each covariate, which is the mean of the treated group
minus the mean of the control group divided by the average of the square root of the variance of
the treatment and control samples (see Austin and Stuart 2015; Rosenbaum and Rubin 1985).
Several models are available to generate treated-control groups that are comparable (on
observables) and it is common practice to implement alternative approaches so as to find better

Ch 3. Impact of irrigation on smallholder rice productivity
68
covariate balance and to assess whether results are consistent across different approaches. Here
we employ two different approaches: (i) Radius matching which pairs all control parcels that fall
within a predetermined PS value, or caliper, and drops all units that do not have at least one
match; and (ii) Inverse Probability of Treatment Weighting (IPTW) where all parcels are
assigned a weight equal to the inverse of the PS and no units are dropped (Austin and Stuart
2015). Once the treated and control samples are defined, we check for balancing. 6
Once the best matched samples are determined, and assuming that bias from unobservables is
not an issue, the project’s ATET can be calculated as (Khandker et al. 2010; Winters et al. 2010;
Villano et al. 2015):
𝐴𝑇𝐸𝑇 = 𝐸(𝑌1|𝐷 = 1) − 𝐸(𝑌0|𝐷 = 0) (3.1)
where Y1 and Y0 are the average values of the indicator in question (e.g., value of farm output)
for the treated and non-treated groups, respectively, and D is a dummy variable equal to 1 for
treated units.
Our objective is to go beyond a measure of the ATET by examining differences in the technology
and in the managerial performance, captured by TE, between treated and control groups. The
SPF framework is well suited to undertake these separate measurements, but we need to deal
with bias from unobservables within the SPF structure (Bravo-Ureta 2014). To accomplish the
latter, we rely on Greene (2010), which is an extension of Heckman (1979) to nonlinear models.
Specifically, Greene (2010) considers sample selection in a SPF framework assuming that the
6 Additional alternatives were tried before concluding that radius and IPTW perform better than the other methods
tested.

Ch 3. Impact of irrigation on smallholder rice productivity
69
unobserved characteristics in the sample selection equation are correlated with the two-sided
error in the stochastic frontier. Following Greene (2010), the model is written as:
Sample selection: 𝑑𝑖 = 1[𝛼′𝑍𝑖 + 𝑤𝑖 > 0], 𝑤𝑖~𝑁(0,1) (3.2)
Stochastic frontier: 𝑌𝑖 = 𝛽′𝑋𝑖 + 휀𝑖 휀𝑖~𝑁[0, 𝜎𝜀2] (3.3)
(𝑌𝑖 , 𝑋𝑖) are observed only when 𝑑𝑖 = 1
Error structure:7 휀𝑖 = 𝑣𝑖 − 𝑢𝑖 (3.4)
𝑢𝑖 = 𝜎𝑢|𝑈𝑖| where 𝑈𝑖~𝑁(0,1)
𝑣𝑖 = 𝜎𝑣𝑉𝑖 where 𝑉𝑖~𝑁(0,1)
(𝑤𝑖,𝑣𝑖)~𝑁2[(0, 0), (1, 𝜌𝜎𝑣, 𝜎𝑣2)]
The sample selection equation in (3.2) as well as the stochastic frontier in (3.3) are estimated
twice, once assuming that d is equal to one for treated and zero for controls and then reversing
the values for d; Z is a vector of explanatory variables; and wi is an unobservable error term.
Furthermore, Y is output, X is a vector of inputs in the production frontier and ε is the composed
error term. In the stochastic frontier, 𝛽 is a vector of parameters to be estimated and the error
structure is 2-sided (normal)/1-sided (half-normal). As noted, sample selection in Greene’s
(2010) model arises when vi, is correlated with wi and this is captured by the term in equation
7 The normalisation of 𝑣𝑖 and 𝑢𝑖 in equation (3.4) is fully consistent with the expressions commonly used in standard
stochastic production frontiers estimated with maximum likelihood procedures. The normalization is introduced to
facilitate the estimation of the model parameters, which is done using maximum simulated likelihood (Greene
2010).

Ch 3. Impact of irrigation on smallholder rice productivity
70
(3.4). If is non-zero, then selectivity bias from unobservables is present. Details concerning
estimation are available in Greene (2010) and Bravo-Ureta et al. (2012).
Another issue that needs consideration is whether the treated and control groups share the same
technology because we are interested in comparing TE across the two groups. If the two groups
do not share the same technology, then we need to estimate a standard benchmark of comparison.
To generate this benchmark, we use the SMF model of Huang et al. (2014), which finds its origin
in the deterministic MF model introduced by Battese and Rao (2002), and refined by Battese et
al. (2004), and O’Donnell et al. (2008). The underpinning of the meta-frontier concept is that all
units in the different groups (treated and control in this study), have access to different production
technologies but each group uses a technology set depending on particular situations including:
resource availability; human and financial capital; agro-ecological conditions; project
participation status, being the key here, among others (O’Donnell et al. 2008). The advantage of
the SMF is that it possesses statistical properties and has the ability to accommodate idiosyncratic
shocks (Huang et al. 2014).
Following closely the exposition in Huang et al. (2014), the estimation of the SMF is done in
two steps. In the first step, a separate SPF is estimated for each group (treated and control in our
case), which can be represented by:
Yi,g = fi,g (Xi,g, 𝛽) + Vi,g – Ui,g (3.5)
where Yi,g and Xi,g are respectively, a scalar output and a vector of inputs, in logs, for the ith unit
(firm, farm or a parcel) in the gth group; 𝛽 is a vector of parameters to be estimated; V is the

Ch 3. Impact of irrigation on smallholder rice productivity
71
standard 2-sided normally distributed error and U the one-sided error denoting efficiency. The
TE for the ith unit in group g is given by e– Ui,g.
Denoting the predicted values from the SPF estimates for group g from the first step as fi,g(Xi,g,
�̂�), the meta-frontier is written as:
ln𝑓(Xi,g, 𝛽) = ln fi,gM
(Xi,g, 𝛽) + Vi,gM - Ug,i
M (3.6)
Equation (3.6) has the structure of a usual SPF model, where the last term is non-negative
assumed to follow an exponential distribution. We underscore that the evidence indicates that
results are robust with respect to different distributional assumptions for the one-sided term, and
that the half-normal and exponential distributions are favored because of their relative simplicity
(Kumbhakar and Lovell 2000; Coelli et al. 2005). In the second step, the predicted values for
each group's frontier from the first step are pooled and then another SPF, which is the SMF, is
estimated.
Figure 3.1 illustrates the connection between a unit's SPF and the SMF for a given level of input
and associated observed output (Yi). The observed output relative to the corresponding SMF can
be decomposed into three elements: 1) The technology gap ratio (𝑇𝐺𝑅𝑖𝑔
), given by the unit’s
Frontier Output (𝑌𝑖,𝑔𝐹 ) divided by the corresponding SMF output (𝑌𝑖
𝑀), which arises from the
choice of a particular technology and depends on how accessible the technology embedded in
the SMF is to the individual groups and on the rate of technology adoption; 2) The unit’s TE
equal to observed output divided by Frontier Output (𝑇𝐸𝑖𝑔
) given by e–Ui,g; and 3) The random
noise denoted by e–Vi,g. Then, the estimated TE of the ith unit in group g relative to the SMF,
called meta-technical efficiency (𝑀𝑇𝐸𝑖𝑔
), can be written as:

Ch 3. Impact of irrigation on smallholder rice productivity
72
𝑀𝑇�̂�𝑖𝑔
= 𝑇𝐺�̂�𝑖𝑔
x 𝑇�̂�𝑖𝑔
(3.7)
The MTE makes it possible to compare the TE of each group relative to the common SMF, while
the TGR can be used to evaluate the position of each group’s SPF with respect to the best
available technology represented by the SMF.
Figure 3.1. Graphical illustration of the SPF and SMF
Ou
tpu
t
Meta
TE
META-FRONTIER
Observed Yi
𝒀𝒊𝑭
Observed Yi - v
i
Input
Group 1 Frontier
Group 2 Frontier
𝑴𝑻𝑬𝒊𝟏 = 𝑻𝑮𝑹𝒊
𝟏 𝒙 𝑻𝑬𝒊𝟏
𝑻𝑮𝑹𝒊𝟏 = 𝒀𝟏
𝑭 / 𝒀𝟏𝑴
𝑻𝑬𝒊𝟏
𝒀𝟏𝑴

Ch 3. Impact of irrigation on smallholder rice productivity
73
3.5 Data and empirical framework
We use the same household dataset as for Chapter 2, however we conduct the analysis at the
parcel rather than household level. The sample is comprised of 714 treated parcels and 440
control parcels covering 1,000 households across 73 CISs, including 304 treated and 326 control
parcels from Region VI, and 217 treated and 307 control parcels from Region X.
The household survey was designed to collect in-depth season and parcel level agricultural
production data, along with socio-economic characteristics, covering the 12-month period
preceding the data collection. The data spans two full cropping seasons and all agricultural
variables are aggregated across both seasons. Hence, our focus is on the impact of IRPEP on
annual production at the parcel level. This data was combined with high resolution (0.05°×0.05°
degree) GIS-based rainfall data sourced from the Climate Hazards Group Infrared Precipitation
and Station (Funk et al. 2015).
Table 3.1 presents descriptive statistics for key variables for the raw sample separately for the
treatment and control groups. Results of t-tests between the means of the two groups reveal that
the sampling design was effective at producing reasonably similar groups, thanks to the efforts
taken to sample comparable treated and control groups explained in Chapter 2. However,
differences in key variables, such as years of education of the household head, and the number
of rooms in the house, a common indicator of wealth (Rutstein and Johnson 2004), highlight the
need for additional steps to further improve balance.
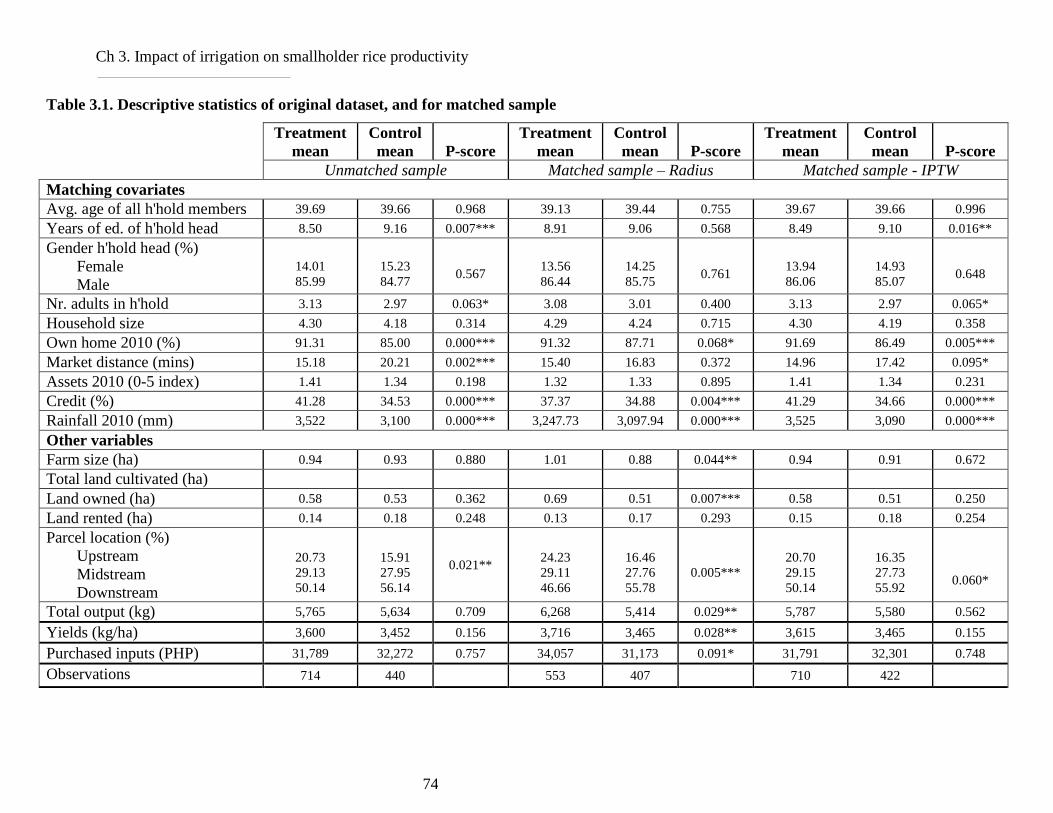
Ch 3. Impact of irrigation on smallholder rice productivity
74
Table 3.1. Descriptive statistics of original dataset, and for matched sample
Treatment
mean
Control
mean P-score
Treatment
mean
Control
mean P-score
Treatment
mean
Control
mean P-score
Unmatched sample Matched sample – Radius Matched sample - IPTW
Matching covariates
Avg. age of all h'hold members 39.69 39.66 0.968 39.13 39.44 0.755 39.67 39.66 0.996
Years of ed. of h'hold head 8.50 9.16 0.007*** 8.91 9.06 0.568 8.49 9.10 0.016**
Gender h'hold head (%)
Female
Male
14.01
85.99
15.23
84.77
0.567
13.56
86.44
14.25
85.75
0.761
13.94
86.06
14.93
85.07
0.648
Nr. adults in h'hold 3.13 2.97 0.063* 3.08 3.01 0.400 3.13 2.97 0.065*
Household size 4.30 4.18 0.314 4.29 4.24 0.715 4.30 4.19 0.358
Own home 2010 (%) 91.31 85.00 0.000*** 91.32 87.71 0.068* 91.69 86.49 0.005***
Market distance (mins) 15.18 20.21 0.002*** 15.40 16.83 0.372 14.96 17.42 0.095*
Assets 2010 (0-5 index) 1.41 1.34 0.198 1.32 1.33 0.895 1.41 1.34 0.231
Credit (%) 41.28 34.53 0.000*** 37.37 34.88 0.004*** 41.29 34.66 0.000***
Rainfall 2010 (mm) 3,522 3,100 0.000*** 3,247.73 3,097.94 0.000*** 3,525 3,090 0.000***
Other variables
Farm size (ha) 0.94 0.93 0.880 1.01 0.88 0.044** 0.94 0.91 0.672
Total land cultivated (ha)
Land owned (ha) 0.58 0.53 0.362 0.69 0.51 0.007*** 0.58 0.51 0.250
Land rented (ha) 0.14 0.18 0.248 0.13 0.17 0.293 0.15 0.18 0.254
Parcel location (%)
Upstream
Midstream
Downstream
20.73
29.13
50.14
15.91
27.95
56.14
0.021**
24.23
29.11
46.66
16.46
27.76
55.78
0.005***
20.70
29.15
50.14
16.35
27.73
55.92
0.060*
Total output (kg) 5,765 5,634 0.709 6,268 5,414 0.029** 5,787 5,580 0.562
Yields (kg/ha) 3,600 3,452 0.156 3,716 3,465 0.028** 3,615 3,465 0.155
Purchased inputs (PHP) 31,789 32,272 0.757 34,057 31,173 0.091* 31,791 32,301 0.748
Observations 714 440 553 407 710 422

Ch 3. Impact of irrigation on smallholder rice productivity
75
The next step is to estimate the participation model to generate Propensity Scores which are then
used to verify the balance of the treatment and control samples at the parcel level. After dropping
one treated and 16 control parcels whose Propensity Scores were out of the range of common
support, we then applied radius matching and IPTW to define the samples to be used in the
analysis. Table 3.1 also contains descriptive statistics for key variables for the two sets of treatment
and control samples created by the radius and IPTW approaches.
Table 3.2 presents the reduction in the average magnitude of the standardized percentage bias
achieved by the two matching approaches and the resulting sample sizes.8 As shown in the table,
the percentage bias for the unmatched treatment and control groups is around 17.5 per cent while
after matching this percentage dropped significantly, particularly with the radius matching where
the bias is 7.9 per cent. By contrast, the IPTW approach makes it possible to retain all parcels on
common support for the analysis and reduces the associated bias to 10.1 per cent. These bias
reductions reflect that both approaches yield well balanced samples (Austin and Stuart 2015).
Table 3.2. Standardized percentage bias and final sample size for Radius matching and
IPTW
Standardized percentage bias Final sample size (units dropped)
Before Matching After Matching Treatment Sample Control Sample
Radius 17.5% 7.9% 556 (157) 409 (15)
IPTW 17.5% 10.1% 713 (0) 424 (0)
8 A description of variables and results from the participation model are in the appendix in Tables 3.A.1 and 3.A.2.
Graphs of propensity score distributions, before and after imposing common support, are in Figure 3.A.1. Table 3.A.3
contains a list of variable-specific reductions in standardized bias.

Ch 3. Impact of irrigation on smallholder rice productivity
76
Having determined the final sample to be used in the analysis, we proceed with the estimation of
alternative Cobb-Douglas SPF models, one for the treatment and one for the control group, using
the following overall specification:9
ln 𝑌𝑖 = 𝛽0 + ∑ 𝛽𝑗 ln 𝑋𝑖𝑗 + ∑ γ𝑖𝑗 ln 𝐹𝑖𝑗 + ∑ 𝛿𝑗 ln 𝐻𝑖𝑗 + ∑𝑗 ln 𝑍𝑖𝑗+𝑣𝑖 − 𝑢𝑖 (3.8)
where Yi is total rice production (kg) for parcel i; Xij is the jth traditional input used on the ith parcel;
Fij comprises of three farm level variables; Hij are five household attributes; and Zij are five
environmental variables. All Greek letters are unknown parameters to be estimated; and vi and ui
are the two sided and one-sided error terms, respectively.10
We use a log likelihood test to check the null hypothesis that the treated and control parcels share
the same technology (De los Santos-Montero and Bravo-Ureta 2017). The test rejects the null
hypothesis, which provides evidence that control and treated groups exhibit different technologies,
supporting the need to estimate a MF.
The following step is to estimate the SPF models correcting for self-selection (SC-SPF) using the
specification in equation (3.8) separately for treated and controls along with the selection model
given by:
𝑆𝐸𝐿𝐸𝐶i = 𝛼0 + ∑ 𝛼𝑖𝑘11𝑘=1 𝐶𝑉𝑖𝑘 + 𝑤𝑖 (3.9)
where SELECi is a binary variable for the treatment status of the ith individual, CVik is a vector of
exogenous covariates; α are the unknown parameters to be estimated; and w is an error term
distributed as N(0, 1).11 The empirical specification of the SELEC model is in line with what is
9 We use a Cobb-Douglas specification, which globally satisfies key regularity conditions from production theory. In
contrast, the translog functional form, a commonly used alternative, does not satisfy such conditions at all data points
and thus inevitably violates theoretical properties that can distort the empirical analysis (see O’Donnell 2012; 2016). 10 Descriptive statistics for all variables used in the production frontier models appear in Tables A-4 and A-5. 11 The SC-SPF models are estimated using the sample selection option in LIMDEP Version 11 (Greene 2016).

Ch 3. Impact of irrigation on smallholder rice productivity
77
found in the literature (e.g., Lawin and Tamini 2019; De los Santos-Montero and Bravo-Ureta
2017; Villano et al. 2015; Wollni and Brümmer 2012).12
3.6 Results
3.6.1 Parameter estimates for SPFs, SC-SPFs, and the SMF
Table 3.3 presents the results for the conventional SPFs, the SC-SPFs and the SMF for the two
data balancing approaches: (i) Radius matching; and (ii) IPTW. Overall, the parameter estimates
are highly consistent across the six models shown. We note that the coefficients of the three
traditional inputs (land, labor and purchased inputs) are positive and highly significant and, as
expected from theory, have values greater than zero and less than one. Given the Cobb-Douglas
specification, these coefficients are partial production elasticities and based on their values, land
is the most important input, followed by purchased inputs and then labor. The sum of these partial
elasticities, which provides a measure of returns to scale, ranges from 1.00 to 1.08 revealing
constant to slightly increasing returns.
The signs of the parameters for the other variables included in the model are largely as expected,
such as the positive signs for soil fertility, rainfall, household experience and education, FFS
involvement and credit access, and the negative sign for weather shock exposure. The coefficients
for tiller and seed transplanting are positive and significant only for the treatment group, which
indicates that improved irrigation also enhanced the contribution of these inputs. As noted above,
FFS were provided by IRPEP but also by the government to farmers across the country, so its
coefficient refers to FFS in any form (not only those provided by IRPEP). The only unexpected
12 A description of the variables used in the selection model and the results from the estimation are contained in
Appendix Tables 3.A.1 and 3.A.6, respectively.

Ch 3. Impact of irrigation on smallholder rice productivity
78
result is the negative sign for land ownership. One potential explanation is that land tenure is not
secure in the study area due to weak enforcement of land ownership claims or risks of land
appropriation (Fitzpatrick & Compton, 2014).
The results of the SC-SPFs reveal statistically significant selectivity bias when radius matching is
used. Hence, these results along with the evidence of different technologies for the treated and
control groups reported earlier support the use of the SMF framework. In addition, a simple
inspection of the results reveals differences between the corresponding parameter values for the
control and treated samples.

Ch 3. Impact of irrigation on smallholder rice productivity
79
Table 3.3. Parameter Estimates for conventional and SC-SPF, and SMF models
Conventional SPF SC-SPF SMF
Treatment Control Treatment Control
(i) Radius (ii) IPTW (i) Radius (ii) IPTW (i) Radius (ii) IPTW (i) Radius (ii) IPTW (i) Radius (ii) IPTW
Constant 3.190** 3.940*** 3.796** 5.848*** 2.967* 2.881*** 4.381** 6.804*** 3.194*** 3.636***
Area 0.656*** 0.659*** 0.678*** 0.558*** 0.639*** 0.582*** 0.671*** 0.588*** 0.662*** 0.578***
Labour 0.073*** 0.070*** 0.158*** 0.159*** 0.093*** 0.122*** 0.167*** 0.162*** 0.113*** 0.117***
Purchased inputs 0.283*** 0.303*** 0.202*** 0.295*** 0.277*** 0.373*** 0.198*** 0.250*** 0.238*** 0.359***
Tiller 0.232*** 0.260*** -0.017 -0.022 0.235** 0.280*** 0.034 -0.049 0.157*** 0.158***
Improved seed 0.001 -0.047 0.080 0.052 -0.057 -0.082*** 0.091 0.051 0.020*** -0.016
Transplant 0.128** 0.159*** 0.076 0.100* 0.172*** 0.235*** 0.071 0.099 0.128*** 0.201***
Owned parcel -0.047 -0.041 -0.050 -0.056 -0.014 -0.036*** -0.026 -0.037 -0.018*** -0.027***
Soil fertility 0.081 0.097** -0.000 -0.041 0.058 0.061*** 0.002 -0.038 0.041*** 0.016
Parcel location 0.080* 0.043 -0.070 -0.120** 0.076 0.044*** -0.086 -0.123** 0.029*** 0.012
Rainfall 0.170 0.062 0.178 -0.140 0.227 0.125*** 0.154 -0.190 0.258*** 0.057***
Weather shock -0.009 -0.067 0.130** 0.119* -0.048 -0.098*** 0.133* 0.138* 0.027*** -0.019
Experience 0.111 0.088 0.105 0.026 0.080 0.084*** 0.057 0.051 0.068*** 0.095***
Education 0.091*** 0.082*** 0.010 0.026 0.101*** 0.096*** 0.000 0.034 0.043*** 0.058***
Credit 0.185 0.320 0.322 0.390* 0.287 0.404*** 0.547* 0.570* 0.445*** 0.707***
FFS 0.074* 0.062* -0.001 0.001 0.090* 0.075*** -0.014 -0.028 0.057*** 0.077***
Region VI -0.260*** -0.288*** -0.190* -0.234** -0.264*** -0.257*** -0.242** -0.273*** -0.265*** -0.302***
Rho 0.020 0.000 -0.531* -0.351
Observations 553 710 407 422 553/960# 710/1,132# 407/960# 422/1,132# 960 1,132
# The first number is the sample size for the Probit model and the second for the SC-SPF.
*,** and *** indicate that the estimated coefficient is statistically significant at the ten, five and one per cent levels, respectively.

Ch 3. Impact of irrigation on smallholder rice productivity
80
3.6.2 Predicted Frontier Output, TGR, TE and MTE
Table 3.4 presents predicted mean Frontier Output, TGRs and the TE values calculated from
the SC-SPF and the SMF models for the treatment and control groups using the radius and
IPTW samples. The mean Frontier Output calculated from the SC-SPF models for the treated
is significantly higher (at the 1 per cent level) compared to controls for both the radius (9,680kg
vs. 8,231kg) and the IPTW (10,900kg vs. 8,654kg) samples. In contrast, the mean TE scores
are 61 per cent (treated) and 74 per cent (control) for the radius samples and this difference is
significant at the 1 per cent level. The corresponding mean TE scores for the IPTW samples
are 53 per cent and 65 per cent, again significant at the 1 per cent level.
As would be expected, the mean Frontier Output levels from the SMF are higher than those
obtained from the SC-SPF models, as shown by the figures in columns 1 and 3 of Table 3.4.
Specifically, for the radius samples the meta-frontier mean output for the treated is 14.7 per
cent greater than controls (9,911kg vs. 8,642kg) and the corresponding number for the IPTW
is 3.9 per cent (11,147kg vs. 10,717kg). We note that the mean difference for the radius sample
is significant at the 5 per cent level while it is not significant for the IPTW sample.
Column 4 in Table 3.4 presents the mean TGR which is equal to a group’s mean Frontier
Output (column 1) divided by the corresponding mean SMF output (column 2). Consequently,
the TGRs for the treated and control groups are 0.98 and 0.95 for the radius sample, and the
corresponding values for IPTW are 0.98 and 0.81. The differences in mean TGRs are
statistically significant in both cases (1 per cent).
The final set of numbers in Column 5 present the MTE which is given by the multiplication of
the TE and TGR; thus, this indicator incorporates inefficiency gaps with respect to both the
corresponding own group frontier and the SMF. For the radius sample, Table 3.4 shows a mean
MTE equal to 59 per cent and 70 per cent for treated and control, respectively, and this amounts

Ch 3. Impact of irrigation on smallholder rice productivity
81
to an average gap equal to 15.7 per cent in favor of control farmers which is statistically
significant (1 per cent). The figures for the IPTW samples are 52 per cent for treated and 54
per cent for controls and the difference is again significant (1 per cent) in favor of controls but
with a narrower gap of 3.7 per cent.
These results reveal that beneficiaries exhibit a significantly higher average Frontier Output
compared to the control group, a difference that is attributable to IRPEP. This result is
consistent for samples generated with radius matching as well as IPTW, and for both the
respective SPFs as well as the common SMF. Conversely, control farmers possess a TE
advantage relative to beneficiaries, which is observed for all calculations presented in Table
3.4, although the magnitudes differ. In the case of both Frontier Output and MTE or TE, the
difference between treated and control is smaller for the SMF model, which highlights the
importance of using a common benchmark (i.e., the meta-frontier) to avoid distorted estimates
of project impact.
This indicates that IRPEP enhanced the technology available to beneficiaries leading to an
increase in their Frontier Output, but did not contribute to improving managerial performance,
which exerted a negative effect on MTE. IRPEP was designed to improve both the technology
and managerial ability (thereby MTE) of beneficiaries through the strengthening of IAs, so
they could be in a better position to support their members. The project was also expected to
improve TE through more effective FFS relative to what was available from the government
to all farmers in the country. In analyzing the impact of an agricultural support project for
small-scale potato farmers in Ecuador, González-Flores et al. (2014) attribute a lack of impact
on TE to farmers still being in the “learning by doing” stage. Based on this, another possible
factor here is that the full impact of IRPEP might take additional exposure to be fully absorbed
by beneficiaries, with TE and MTE increasing over time as farmers adjust their managerial
performance to the new technology.

Ch 3. Impact of irrigation on smallholder rice productivity
82
Table 3.4. Predicted mean Frontier Output and TE values calculated from the SC-SPF
and the SMF models for the Radius and IPTW samples.
Output
SC-SPF
-1-
TE
SC-SPF
-2-
Output
SMF
-3-
TGR
-4-
MTE
-5-
Obs.
-6-
(i) Radius
Treatment mean 9,680 0.61 9,911 0.98 0.59 553
Control mean 8,231 0.74 8,642 0.95 0.70 407
Difference 17.6% -17.6% 14.7% 3.2% -15.7%
P-score 0.008*** 0.000*** 0.022** 0.000*** 0.000***
(ii) IPTW
Treatment mean 10,900 0.53 11,141 0.98 0.52 710
Control mean 8,654 0.65 10,717 0.81 0.54 422
Difference 25.9% -18.5% 3.9% 15.5% -3.7%
P-score 0.000*** 0.000*** 0.502 0.000*** 0.013**
3.6.3 Distribution of MTE
Graph 3.1 presents the distribution of the MTE values for the treatment and control groups. For
both groups, the largest percentage of parcels have an MTE between 71-80 per cent, but a
higher proportion of control parcels have MTE scores in the 81-90 per cent and the 91-100 per
cent brackets. There are 14 per cent of treated parcels with an MTE below 40 per cent, whilst
no control parcels have an MTE below 40 per cent.
The different distributions between the treated and control parcels are clearly linked to the
findings presented in Table 3.4. Specifically, given that the frontier for treated parcels has
expanded, the larger shares of these parcels in the lower brackets highlight lagging TE with
respect to the higher frontier. The distribution of the control parcels represents how treated
parcels would have fared without the increase in the frontier, showing that TE was reasonably
high before the impact of IRPEP. This may be due to the project's targeting of CISs with high
potential for increasing their productivity through the provision of improved technology and
may also be linked to the widespread provision of FFS by the Philippines government.
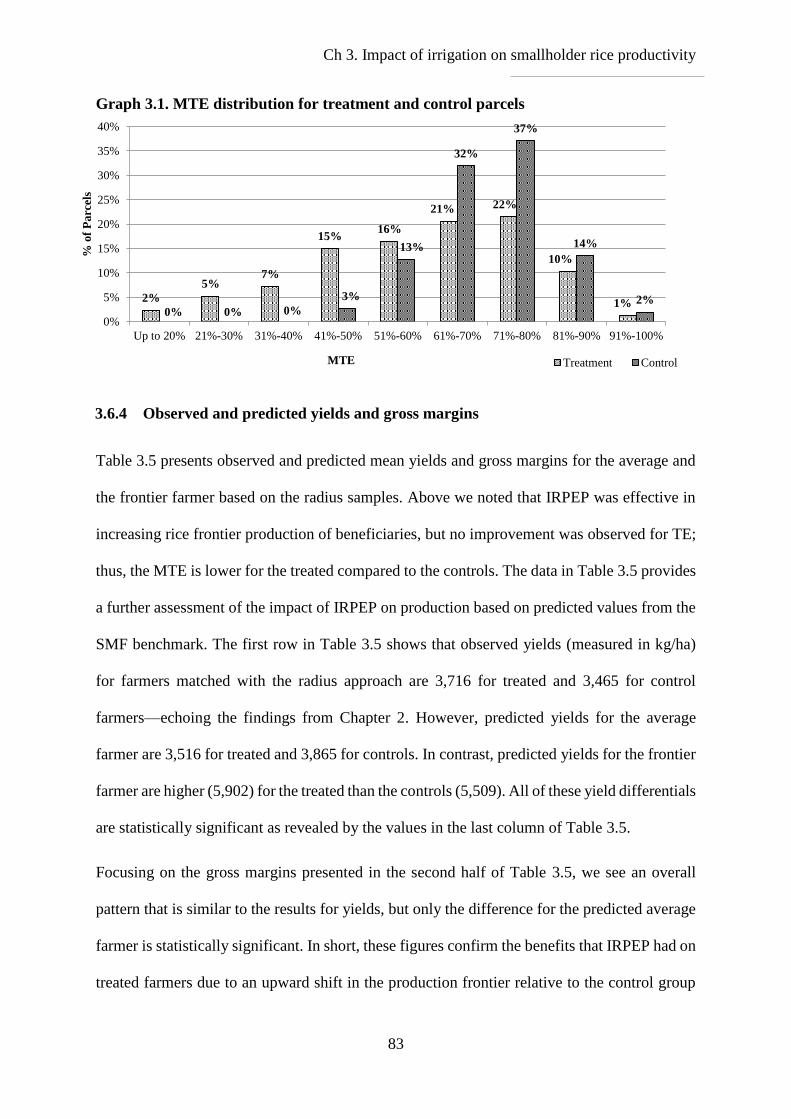
Ch 3. Impact of irrigation on smallholder rice productivity
83
Graph 3.1. MTE distribution for treatment and control parcels
3.6.4 Observed and predicted yields and gross margins
Table 3.5 presents observed and predicted mean yields and gross margins for the average and
the frontier farmer based on the radius samples. Above we noted that IRPEP was effective in
increasing rice frontier production of beneficiaries, but no improvement was observed for TE;
thus, the MTE is lower for the treated compared to the controls. The data in Table 3.5 provides
a further assessment of the impact of IRPEP on production based on predicted values from the
SMF benchmark. The first row in Table 3.5 shows that observed yields (measured in kg/ha)
for farmers matched with the radius approach are 3,716 for treated and 3,465 for control
farmers—echoing the findings from Chapter 2. However, predicted yields for the average
farmer are 3,516 for treated and 3,865 for controls. In contrast, predicted yields for the frontier
farmer are higher (5,902) for the treated than the controls (5,509). All of these yield differentials
are statistically significant as revealed by the values in the last column of Table 3.5.
Focusing on the gross margins presented in the second half of Table 3.5, we see an overall
pattern that is similar to the results for yields, but only the difference for the predicted average
farmer is statistically significant. In short, these figures confirm the benefits that IRPEP had on
treated farmers due to an upward shift in the production frontier relative to the control group
2%
5%7%
15%16%
21% 22%
10%
1%0% 0% 0%
3%
13%
32%
37%
14%
2%
0%
5%
10%
15%
20%
25%
30%
35%
40%
Up to 20% 21%-30% 31%-40% 41%-50% 51%-60% 61%-70% 71%-80% 81%-90% 91%-100%
% o
f P
arc
els
MTE Treatment Control

Ch 3. Impact of irrigation on smallholder rice productivity
84
and reflect the converse impact of the project on MTE and TE. This latter finding is compatible
with the empirical results reported by González-Flores et al. (2014) for potato farmers in
Ecuador and by Sipiläinen and Lansink (2005) for Finnish dairy farmers. Moreover, these
results are consistent with the theoretical proposition that technological change disrupts the
prevailing farm equilibrium preceding that change (Schultz 1975). Building on the proposition,
which asserts that education is a key component in overcoming disequilibria effects, our results
also indicate that more emphases on training could have led to favorable impacts on MTE.
Table 3.5. Observed and predicted mean values for key outcome variables of yields
(kg/ha) and gross margins (PHP/kg) for the Radius samples
Treatment
mean Control mean Difference P-score
Yields (kg/ha)
Observed 3,716 3,465 -7.2% 0.028**
Predicted-Average farmer 3,516 3,865 -9.0% 0.000***
Predicted-Frontier farmer 5,902 5,509 7.1% 0.000***
Gross Margins (PHP/kg)
Observed 10.18 10.22 -0.4% 0.889
Predicted-Average farmer 10.55 11.98 -11.9% 0.000***
Predicted-Frontier farmer 13.79 13.68 0.8% 0.224
3.6.5 Heterogeneity analysis
As is shown in Table 3.3, numerous factors play a significant role in shaping rice production
within the sample. Therefore, Table 3.6 presents an analysis of possible heterogeneity in the
project impact on mean Frontier Output across several key variables using the results from the
SMF model with the radius sample. The table presents t-tests of mean outcomes of treated
versus control groups for different sub-samples separated by key variables of interest. Using
SMF values, the analysis indicates that gender and education of the household head, regional
location, farm size and parcel location along the canal are all associated with project impact.
First, we find that the project had a significant impact (at the 5 per cent level) on Frontier
Output for treated male-headed households compared to control male-headed households, but

Ch 3. Impact of irrigation on smallholder rice productivity
85
this pattern is not observed for female-headed households. This suggests that potential barriers
faced by rural women and female-headed households—including higher poverty, lower access
to productive assets and capital, higher workloads and constraining social norms (World Bank,
2012)—likely prevented them from taking advantage of project benefits. Although the project
targeted women by encouraging them to enter into management positions within IAs—
something that we find in the previous chapter to have been successful—our findings indicate
that this support may have mainly benefitted women who live in male-headed households.
Looking further into the IRPEP data, we find that female-headed households were less likely
to be an IA member or to use IA facilities.
Second and surprisingly, we find a significant impact (at the 1 per cent level) on the mean
Frontier Output for household heads with education below the median level for the sample, but
not so for those with education above the median level. This may be due to a higher
involvement of more educated household heads in off-farm activities, which would leave less
time for them to engage effectively with the project and thus obtain benefits in terms of rice
production.
Third, we find stronger evidence of project impact on mean Frontier Output for households in
Region VI compared to Region X. Given that Region VI has much lower starting yields, this
finding suggests that the marginal effect of irrigation on the frontier is stronger at lower
productivity systems, while other complementary support becomes essential in higher
productivity systems.
At the parcel level, we find that size and location on the irrigation canal are important in terms
of productivity. Specifically, smaller farms (defined as those below the median farm size) and
those located downstream on the canal experienced a significant impact (at the 5 per cent and
1 per cent levels respectively) on Frontier Output, while larger farms and those located up or
midstream did not. This offers a nuanced finding to Chapter 2, where we find that the impact

Ch 3. Impact of irrigation on smallholder rice productivity
86
on yields was similar for down and upstream households. Smaller farms and downstream farms
are both associated with lower production and higher levels of poverty—as reflected by the
lower mean predicted output for these groups. Similar to the regional results discussed above,
these findings suggest that starting from a lower output may have increased the project’s
potential impact thus being relatively more beneficial to poorer beneficiaries.
The results for downstream parcels suggest that IRPEP has succeeded in improving water
equity, echoing the findings in Chapter 2. As noted, downstream parcels usually suffer the most
from poor irrigation access due to overuse by parcels located further up the canal (Lebdi 2016).
As discussed in Chapter 2, qualitative interviews found that improved water equity for
downstream parcels was achieved thanks to the improved canal infrastructure making more
water available through improved efficiency, as well as improved capacity of IAs to monitor
and manage water use to ensure equitable distribution (Arslan et al. 2018)
IRPEP’s impact on Frontier Output did not differ markedly between owned and rented parcels,
although owned parcels have higher mean output as expected. There are a number of potential
beneficial interactions between land ownership and the impact of development projects
(Higgins et al., 2018). The aforementioned issues with tenure enforcement may have weakened
these potential linkages in the case of IRPEP.
We performed the same heterogeneity tests for project impact on TE (data not shown).
However, we found very little variation in the mean scores based on either the SC-SPF or the
SMF, indicating that regardless of the sub-group, the means for control farmers were
significantly larger than for the treated group. Interestingly, however, we find that the mean
difference in TE is noticeably smaller for male-headed households compared to female-headed,
and for downstream compared to up- and mid-stream parcels. These differences, combined
with the findings for mean Frontier Output, suggest that the TE gap created by the project in

Ch 3. Impact of irrigation on smallholder rice productivity
87
favor of the control was less pronounced for male-headed households and for downstream
parcels.
Table 3.6. Heterogeneity analysis based on Radius matching and SMF estimates: Output
and yields
Frontier Output (kg) from SMF Estimates
Treatment
mean
Control
mean P- score
1) Gender of household
head:
Male
Female
9,969 (478)
9,548 (75)
8,617 (349)
8,796 (58)
0.023**
0.627
2) Education of
household head:
Below median
Above median
10,385 (266)
9,473 (287)
8,234 (186)
8,987 (221)
0.009***
0.518
3) Region:
Region VI
Region X
6,312 (237)
12,612 (316)
5,389 (218)
12,395 (189)
0.089*
0.801
4) Farm size:
Below median
Above median
4,029 (267)
15,403 (286)
3,652 (212)
14,068 (195)
0.014**
0.111
5) Parcel location:
Up/midstream
Downstream
10,807 (295)
8,888 (258)
10,568 (180)
7116 (227)
0.787
0.008***
6) Land:
Owned
Not owned
10,438 (353)
8,982 (200)
9,344 (226)
7,767 (181)
0.149
0.127 Note: Number of observations in parentheses
3.7 Conclusions
This chapter contributes to two strands of the literature by applying an SC-SPF model in an
impact evaluation framework. We use parcel level data collected from beneficiaries and non-
beneficiaries of IRPEP to assess the impact of small-scale irrigation improvements, together
with support to IAs, on production technology and TE.
Based on predicted mean output and observed mean yields, we find that IRPEP significantly
expanded the rice production frontier and improved rice productivity for beneficiaries.
However, project beneficiaries exhibited lower TE, echoing findings of a previous study in

Ch 3. Impact of irrigation on smallholder rice productivity
88
Ethiopia (Gebregziabher et al., 2012). This lower TE is also reflected in the observed and
predicted gross margins of the sample. In summary, the project seemingly targeted poor but
reasonably efficient rice farmers while providing technology that successfully improved the
production potential of beneficiaries. However, no TE improvement of beneficiaries relative
to controls is found. The latter is likely due to a lack of managerial support to stimulate
complementarity activities, and/or adequate help to overcome the disequilibria caused by
improved access to irrigation, leaving beneficiaries unable to take full advantage of their
expanded production frontier. Given the available data, it is not possible to determine if
additional exposure to improved irrigation would in due time lead to better management
performance.
Small-scale irrigation is the subject of substantial policy attention and investment in the
Philippines, and many other developing countries. Broadly, our findings suggest that policies
to increase communal small-scale irrigation coverage can contribute to development objectives
relating to productivity and food security, which in-turn have implications for inclusive rural
transformation. However, this package of support does not seem to have met the urgent need
to increase production efficiency (measured by TE) for rice in the face of growing water
scarcity. Our findings indicate several ways that future interventions can be adjusted in order
to achieve this goal.
First, complementary training and better access to high quality inputs need to be provided to
enhance overall productivity gains. The appropriate tailoring of FFS could help farm managers
to make decisions that increase their efficiency despite input and capital constraints. A
systematic review of the impact of FFS found that bottom-up participatory approaches are often
the most effective (Waddington et al., 2014). This approach highlights the potential benefits of
making the PhilRice Palay Check System curriculum more flexible and open to feedback from
farmers. Echoing Chapter 2, our findings also suggest that future irrigation infrastructure

Ch 3. Impact of irrigation on smallholder rice productivity
89
interventions should improve the availability of credit to relax liquidity constraints thus
enabling the adoption of complementary inputs (e.g. improved seeds and planting material).
This latter point aligns well with Waddington et al. (2014) who found that improving access to
finance alongside FFS can have a powerful effect on productivity.
Appropriate training is also important to overcome input access constraints by helping farmers
to identify which inputs and practices deserve prioritisation. For instance, our results from the
SC-SPF estimates indicate that irrigation is highly complementary with mechanical tillage,
along with seed transplanting, suggesting that training and extension support should encourage
farm managers to adopt these practices so as to augment productivity.
Impacts on productivity, as well as equality, can also be enhanced for future interventions by
addressing barriers faced by female-headed households. Among IRPEP beneficiaries, female-
headed households seem to have faced particular barriers to participating and benefitting from
IAs. Therefore, future interventions need to boost the capabilities of local institutions to
manage and implement projects with a clear goal of being inclusive and sensitive to the needs
of participants from female-headed households.
How beneficiaries are targeted with this complementary support is also an important factor
for future interventions that can be informed by our findings. We find that the support
package delivered by IRPEP was most effective among poorer households with low yields,
including those with smaller farms located downstream on the canals, while better off
households with higher yields are more in need of the complementary support outlined above
to achieve further improvements. The more favorable impacts for downstream parcels
confirms the findings from the previous chapter, showing that this combination of
infrastructure and institutional support can prove very effective at improving the water equity
issues that are commonplace in canal irrigation systems.

Ch 3. Impact of irrigation on smallholder rice productivity
90
In terms of future research, our findings highlight the value of a multi-faceted approach that
enables the separate identification of the role of technology and TE on productivity, going
beyond the usual focus on yields, which can inform future impact evaluation studies.
Comparing parcels from various groups to a common benchmark allows us to properly account
for technology and TE differentials. Also, by using PSM combined with the SC-SPF
framework we address selection bias that may have affected previous TE studies. That our
results run counter to past studies on irrigation and TE in rice farming, which do not use a
common benchmark to evaluate productivity, suggests that such studies may have generated
misleading comparisons.

Ch 3. Impact of irrigation on smallholder rice productivity
91
Appendix 3.A
Table 3.A.1. Description of variables included in the Probit models
Variable name Description
Household characteristics
House experience Average age in household
Head experience Age of household head
Education Number of years of education of household head
Gender Gender of household head
Number of adults Number of adults (18+) in household
House size Number of rooms in household in 2010
House ownership Dummy: House was owned in 2010
House rooms Number of rooms in house in 2010
Large livestock Number of large livestock owned in 2010
Family workforce Number of economically active household members in 2010
Social capital Number of groups of which household is a member in 2010
Market distance Distance from household to market (mins)
Assets Household 2010 asset index
Credit Proportion of households in municipality who accessed loan 2016
Parcel characteristics
Owned parcel Dummy: Parcel is owned
Owned parcel upstream Dummy: Parcel is owned and is located upstream from irrigation source
Owned parcel midstream Dummy: Parcel is owned and is located midstream from irrigation source
Environmental factors
Rainfall 2010 Total rainfall in 2010 (mm)
Drought Number of droughts experienced by household since 2010
Flood Number of floods experienced by household since 2010
Table 3.A.2. Results of Probit participation model
Variables Coefficient Std. error
Constant -1.854 0.760
House experience -0.000 0.004
Head experience -0.021 0.014
Gender -0.033 0.110
Nr. adults 0.065 0.045
House size -0.062 0.045
Home ownership 0.369** 0.157
Market distance -0.007** 0.003
Assets 0.000 0.058
Credit 2.199* 1.272
Owned parcel upstream 0.332** 0.167
Rainfall 2010 0.000 0.000
Nr. Observations 1,154
Log-likelihood function -683.83
Chi-squared test statistic 30.55

Ch 3. Impact of irrigation on smallholder rice productivity
92
Table 3.A.3. Change in standardized percentage bias for all balancing covariates
Variable Raw Radius matching IPTW
House experience -0.2 -2.3 13.8
Gender -3.5 -2.7 8.0
Education -16.3 -3.2 -10.5
Nr. adults 11.3 6.0 2.4
House size -10.4 -3.2 -3.1
Home ownership 20.1 11.2 -4.6
Market distance -18.6 -5.5 -0.01
Assets 7.8 -0.8 10.7
Credit 47.5 18.9 19.0
Owned parcel upstream 2.9 8.4 2.7
Rainfall 2010 54.2 24.6 -35.8
Average magnitude 17.5 7.9 10.1
Table 3.A.4. Description of variables included in the production frontiers
Variable name Description
Inputs (all tallied across seasons)
Area Total area cultivated with rice crops
Labor Number of family and hired labor days use during production process
Purchased inputs Sum of expenditure on seeds, fertilizer, pesticides, herbicides and insecticides
(PHP)
Tiller Dummy: Tiller was used on parcel
Improved seed Dummy: Seeds on parcel were hybrid/certified
Transplant Dummy: Seeds on parcel were transplanted
Parcel characteristics
Owned parcel Dummy: Parcel is owned by household
Soil fertility Dummy: Household reported that soil on parcel is moderate-very fertile
Parcel location Dummy: Parcel is located downstream from irrigation source
Environmental factors
Rainfall Total rainfall in 2016 calendar year (mm)
Weather shock Dummy: Household reported experiencing a drought, typhoon or flood during
2016
Household characteristics
Experience Age of household head
Education Number of years of education of household head
Credit Proportion of households in municipality who accessed loan 2016
FFS Dummy: Household reported engaging in a Farmer Field School at least once
between 2010-2016
Region VI Dummy: Household located in Region VI

Ch 3. Impact of irrigation on smallholder rice productivity
93
Table 3.A.5. Descriptive statistics of variables included in the production frontiers
Treatment Control
Mean Std. Deviation Mean Std. Deviation P-score
Area 1.64 1.61 1.71 1.59 0.494
Labour 51.81 41.99 52.68 43.07 0.736
Purchased inputs 20,226 16,922 19,604 16,460 0.540
Tiller 0.93 0.25 0.95 0.22 0.234
Improved seed 0.77 0.42 0.71 0.45 0.023**
Transplant 0.40 0.49 0.36 0.48 0.104
Owned parcel 0.58 0.49 0.55 0.50 0.257
Soil fertility 0.86 0.35 0.87 0.34 0.568
Parcel location 0.50 0.50 0.56 0.50 0.048**
Rainfall 3,164 528 2,695 512 0.000***
Weather shock 0.47 0.50 0.45 0.50 0.347
Experience 57.15 11.97 57.23 13.53 0.912
Education 8.50 3.90 9.16 4.35 0.007***
Credit 0.41 0.14 0.35 0.14 0.000***
FFS 0.29 0.45 0.25 0.43 0.186
Region VI 0.55 0.50 0.53 0.50 0.527
Observations 714 440
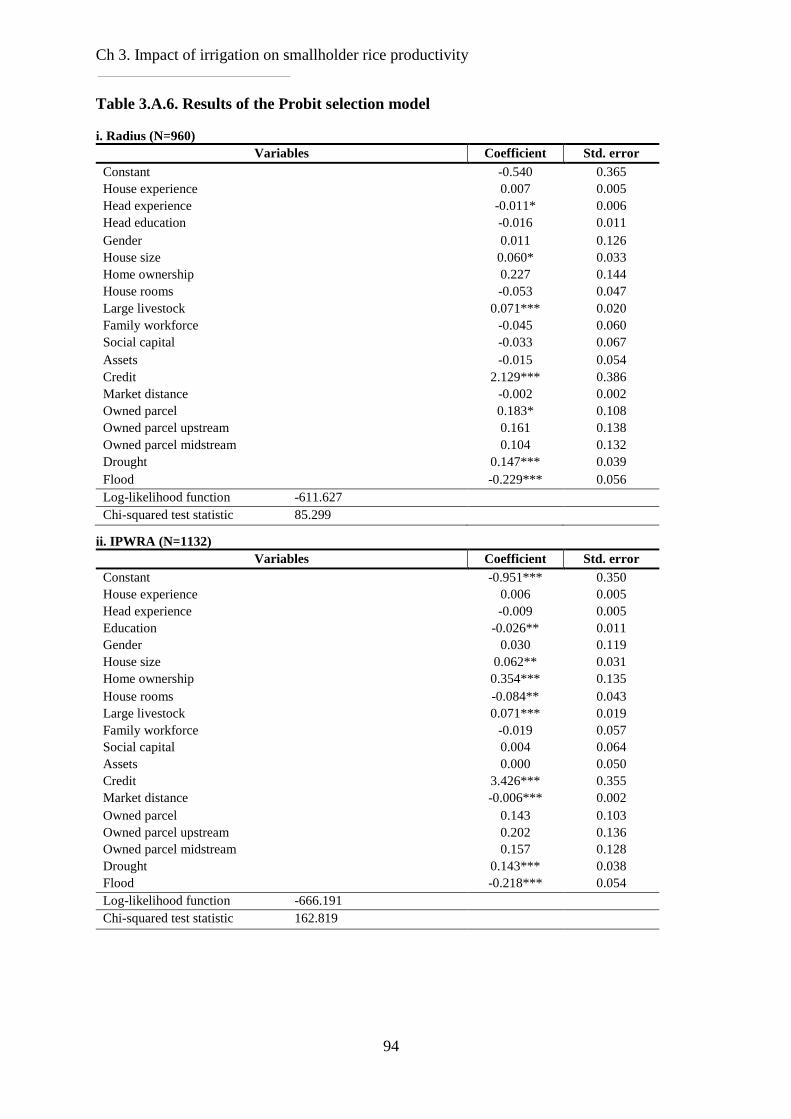
Ch 3. Impact of irrigation on smallholder rice productivity
94
Table 3.A.6. Results of the Probit selection model
i. Radius (N=960)
Variables Coefficient Std. error
Constant -0.540 0.365
House experience 0.007 0.005
Head experience -0.011* 0.006
Head education -0.016 0.011
Gender 0.011 0.126
House size 0.060* 0.033
Home ownership 0.227 0.144
House rooms -0.053 0.047
Large livestock 0.071*** 0.020
Family workforce -0.045 0.060
Social capital -0.033 0.067
Assets -0.015 0.054
Credit 2.129*** 0.386
Market distance -0.002 0.002
Owned parcel 0.183* 0.108
Owned parcel upstream 0.161 0.138
Owned parcel midstream 0.104 0.132
Drought 0.147*** 0.039
Flood -0.229*** 0.056
Log-likelihood function -611.627
Chi-squared test statistic 85.299
ii. IPWRA (N=1132)
Variables Coefficient Std. error
Constant -0.951*** 0.350
House experience 0.006 0.005
Head experience -0.009 0.005
Education -0.026** 0.011
Gender 0.030 0.119
House size 0.062** 0.031
Home ownership 0.354*** 0.135
House rooms -0.084** 0.043
Large livestock 0.071*** 0.019
Family workforce -0.019 0.057
Social capital 0.004 0.064
Assets 0.000 0.050
Credit 3.426*** 0.355
Market distance -0.006*** 0.002
Owned parcel 0.143 0.103
Owned parcel upstream 0.202 0.136
Owned parcel midstream 0.157 0.128
Drought 0.143*** 0.038
Flood -0.218*** 0.054
Log-likelihood function -666.191
Chi-squared test statistic 162.819

Ch 3. Impact of irrigation on smallholder rice productivity
95
Figure 3.A.1. Propensity score distribution before and after imposing common support
Before
After

96

97
Chapter 4
How can climate resilient infrastructure stimulate
inclusive rural transformation?
Evidence from southwest Bangladesh
Abstract: Using a tailored framework of indicators, we assess the impact of climate
resilient infrastructure on inclusive rural transformation. We find positive impacts on climate
resilience, agricultural profitability, and off-farm advancements, for all but the poorest
households. Income and income diversification progressed for the poorest households, but they
faced barriers to off-farm advancements. The project had limited impacts on farm yields, self-
employment, social indicators and women's empowerment. Limited impacts on asset
ownership also meant that vulnerability to non-climatic shocks remained high. Living close to
both an improved market and road helped to improve social capital, especially for women.
This chapter is based on:
Higgins, D., Arslan, A. and Ruben, R. Can climate resilient infrastructure stimulate inclusive
rural transformation? Evidence from southwest Bangladesh. Working Paper
Currently under review by the Journal of South Asian Development

Ch 4. Resilient infrastructure and inclusive rural transformation
98
4.1 Introduction
Without climate resilience, increasingly intense climatic stressors have the potential to derail
inclusive rural transformation pathways, especially for the poorest rural households (IFAD,
2018b). The aim of this chapter is to provide practical insights to inform future rural
development initiatives aiming to stimulate sustainable transformational progress in areas of
climate vulnerability.
We focus on how upgraded rural infrastructure—specifically climate resilient markets and
market-connecting roads—can address this development challenge. Improved markets and
roads have numerous potential impacts in this regard, including improving on- and off-farm
livelihood opportunities, land and labour productivity, human capital and asset ownership, and
can facilitate alternative economic engagement by marginalised groups, including women
(World Bank, 1994; Bryceson et al., 2008; Jouanjean, 2013). Moreover, when designed to
withstand exposure to climatic stressors, they can also increase climate resilience as part of the
inclusive rural transformation process (OECD, 2018). We test these pathways using CCRIP
southwest Bangladesh as a case study, using impact evaluation methods with a combination of
quantitative and qualitative data.
Based on the findings of past studies, we focus on how impacts differ based on the type of
infrastructure and beneficiaries' initial resource endowments. We do this using separate
catchment areas to quantitatively assess whether households located close to both an upgraded
market and market-connecting road benefitted more than households only located close to an
upgraded market; and within these groups we assess whether landowners benefitted more than
non-landowners. In both cases, we use in-depth qualitative data to understand impact
mechanisms and reasons for impact heterogeneity.

Ch 4. Resilient infrastructure and inclusive rural transformation
99
The proceeding section of the chapter outlines the potential links between climate resilient
infrastructure and inclusive rural transformation (Section 4.2), followed by a description of the
project used as a case study (Section 4.3), the analytical methodology (Section 4.4), descriptive
statistics (Section 4.5), results (Section 4.6), and the conclusions (Section 4.7).
4.2 Inclusive rural transformation, climatic stressors and infrastructure
The impacts of climate change and climatic shocks on livelihoods can hinder each of the
components of rural transformation (Rickards & Howden, 2012; Carter et al., 2018; IFAD,
2018b). Floods, droughts, cyclones, changing rainfall patterns, and rising temperatures and sea
levels can hinder agricultural production by damaging produce and farming assets (land,
machinery, storage facilities) and disrupting growing seasons (Morton, 2007). They can also
impede households from shifting into more lucrative livelihood activities by damaging other
productive assets and infrastructure, thus reducing productive capacity and economic
opportunities, and increasing vulnerability (Ahmed et al., 2009). By changing risk attitudes,
increasing vulnerability and uncertainty, and reducing incomes, these effects—which
disproportionately affect the most vulnerable—can also disincentivise investment in
transformational livelihood activities (Mirza, 2003; FAO, 2017).
The potential impacts of improved rural markets and market-connecting roads on inclusive
rural transformation are numerous, with varying levels of supporting evidence. Operational
markets with quicker, cheaper and safer access can connect buyers and sellers of agricultural
inputs and outputs, stimulating increased productivity, on-farm diversification and cash crop
production (Gannon & Liu, 1997; van de Walle, 2009; Suri, 2011). Transaction costs can be
reduced, improving access to value chains and options for selling produce, leading to higher
prices and profits from farming (Banister & Berechman, 2003; Sieber & Allen, 2016; Devaux
et al., 2018). These productivity and income benefits can in-turn drive rural transformation

Ch 4. Resilient infrastructure and inclusive rural transformation
100
through labour reallocation and investment in higher-value activities (IFAD, 2016). These
benefits have a large body of supporting evidence, covering projects in Afghanistan (Sieber &
Allen, 2016), Bangladesh (Ali, 2011; Haider et al., 2011), China (Fan & Chan-Kang, 2005),
Ethiopia (Wondemu & Weiss, 2012), India (Binswanger et al., 1993; Aggarwal, 2018), Nepal
(Jacoby, 2000), Nicaragua (Broegaard et al., 2011), and Vietnam (Mu & van de Walle, 2007).
In terms of impacts on the climate resilience of agricultural production, better market access
and higher farm income may enhance access to and adoption of resilience-enhancing inputs
(Nelson et al., 2010). Climate resilient infrastructure can also help to avoid access to markets
and other services being disrupted by climatic stressors, thus enhancing the resilience and
sustainability of livelihoods and smoothing incomes (Ziervogel & Ericksen, 2010;
Chongvilaivan et al., 2016). All-weather roads are the main focus of the existing literature,
having been found to improve hybrid rice adoption in Bangladesh (Ali, 2011), decrease poverty
and increase income in Ethiopia (Dercon et al., 2009; Wondemu & Weiss, 2012), and increase
crop sales and income and decrease post-harvest losses in Uganda (Sieber & Allen, 2016).
Improved internal and external connectivity can also help to transform the composition of
livelihoods by presenting new opportunities for households to capitalise on their comparative
advantages (Asher & Novosad, 2016). These opportunities can include on- or off-farm wage
employment or self-employment, or migration to cities, towns or other rural areas (IFAD, 2016;
IIED, 2017). They may also help households to enter more lucrative agricultural or non-
agricultural value chains and support specialisation (Reardon et al., 2007). This proliferation
of options can subsequently reduce the vulnerability of livelihoods to climatic stressors through
income diversification (Ellis, 1999; Füssel & Klein, 2006).
Empirical evidence suggests these potential livelihood composition impacts are heavily
influenced by contextual factors. While upgraded rural roads have been found to increase off-
farm opportunities in Indonesia (Gibson & Olivia, 2010), Peru (Escobal & Ponce, 2004), and

Ch 4. Resilient infrastructure and inclusive rural transformation
101
Vietnam (Mu & van de Walle, 2007), further studies find off-farm impacts to be dependent
upon wealth and skills (Lokshin & Yemtsov, 2005; Bucheli et al., 2018), credit access
(Aggarwal, 2018; Ahmed & Nahiduzzaman, 2016), proximity to urban centers (Asher &
Novosad, 2016), and the strength of the off-farm sector (Khandker et al., 2009). Similarly, there
is evidence of increased cash crop production, but also of poorer beneficiaries increasing their
focus on staple crops (Sieber & Allen, 2016; Setboonsarng, 2008; Aggarwal, 2018). Improved
infrastructure has also been found to facilitate value chain access, diversification and lucrative
specialisation in some cases (Broegaard et al, 2011; Lakshmanan, 2011; Luo & Xu, 2018), but
elsewhere evidence suggests these benefits are only available to those with high initial resource
endowments, especially land (Qiaolun, 2006; Fujita, 2017).
Increased income from the pathways outlined above can enable the purchase of assets to
increase productivity or manage risk, and can also encourage investments in improving social
outcomes such as social capital, education, and better diets (Trivelli et al., 2017; Bucheli et al.,
2018). Direct effects on these key social indicators of rural transformation can also occur
through reduced transport time to schools and markets for healthy food. Social capital can also
be directly enhanced as improved mobility and communication, and better-attended local
marketplaces, facilitate collective action and group formation (Bradbury, 2006; IIED, 2017).
This latter effect can have particular benefits for coping with climatic shocks through mutual
support networks, for instance by borrowing money from a rotating fund (Chigwada, 2005).
The importance of contextual factors and resource endowments means that the impacts of
infrastructure on the inclusivity of rural transformation are unpredictable and likely to be
context specific (Starkey & Hine, 2014). Impacts on inclusivity are also noted as being heavily
dependent on the type of infrastructure, or combination of infrastructures, to which households
are exposed (van de Walle, 2009; Chowdhury, 2010; Hansen et al., 2011). Despite evidence of
pro-poor impacts in some cases (Mu and van de Walle, 2007; Aggarwal, 2018), interventions

Ch 4. Resilient infrastructure and inclusive rural transformation
102
have also been found to increase inequality where the poorest households are unable to take
advantage of the potential benefits (Haider et al., 2018). A key risk is that households with low
productive capacity are forced out of increasingly competitive markets (Winters, 2014; Asher
& Novosad, 2016).
Improved infrastructure can offer new opportunities for income generation for women, one of
the groups most at risk of exclusion, but could also increase the migration of males leaving
female household members with a greater work burden (Chowdhury, 2010; Mohun & Biswas,
2016; Slavchevska et al., 2016). Impacts may also be hampered by cultural constraints faced
by women which improved infrastructure may be insufficient to overcome (Asher and
Novosad, 2016). There is some evidence that rural infrastructure can increase wage and self-
employment opportunities for women in some settings (Lokshin & Yemsov, 2005; Aggarwal,
2018; Ahmed & Nahiduzzaman, 2016), but also that women and female-headed households
can be excluded, or can benefit economically to the detriment of their overall work burden
(Chowdhury, 2010; Rahman, 2014).
4.3 Context
Bangladesh is one of the most climate vulnerable countries in the world, facing increasingly
severe seasonal flooding, cyclones and drought, especially in the southwest region
(Christensen, 2012). Despite this, improvements in agricultural technology have contributed to
relatively fast rural transformation in recent years, but imbalances in access to land, assets,
markets, credit, education, and healthcare, has meant the process has not been inclusive
(Gautam & Faruqee, 2016; IFAD, 2016). The lack of inclusivity applies especially to women,
who face considerable economic and social constraints based on cultural norms (Ambler et al.,
2017). In addition, with cropping intensity reaching its limit, furthering rural transformation
requires different drivers such as on- and off-farm diversification, improved value-added and

Ch 4. Resilient infrastructure and inclusive rural transformation
103
marketing, and more consolidated value chains (Rahman, 2014; Gautam & Faruqee, 2016). As
outlined in the previous section, better rural connectivity through improved infrastructure has
the potential to unlock these new avenues (Fujita, 2017).
CCRIP was implemented between 2013 and 2019 with a budget of $150 million, and covered
12 districts across the divisions of Barisal, Dhaka and Khulna in southwest Bangladesh. The
project sought to improve livelihoods through improved connectivity by building and
improving a range of rural infrastructure including large-scale rural roads and large "Growth
Center" markets, smaller community and village roads and markets, bridges and culverts, and
cyclone shelters. The focus of this case study is solely on the impact of the smaller community
and village roads and markets (implemented using $40.5 million of the project budget).
The project's strengthening of community and village markets—selected for support based on
their remoteness, poverty, and potential for impact—is intended to increase their year-round
usability and their management. This involves constructing facilities such as sheds, river docks,
internal roads, and toilets; installing raised and paved areas and improving drainage systems to
increase resilience to flooding; and providing capacity building training to MMCs. CCRIP also
improved the main road that connects each market to the surrounding communities in order to
increase its year-round usability (especially during the monsoon season when roads are likely
to be submerged and damaged), raising and paving the roads with material resistant to frequent
submersion by salty or brackish water, and lining them with vetiver grass to prevent erosion.
The project also targeted women through the Public Works approach (see Slater & McCord,
2009). This involved training and hiring mainly destitute women through Labour Contracting
Societies (LCS) to conduct some of the construction work for the project. This was expected
to provide women with skills and experience that would improve their economic participation
even after the project. In addition, as part of the MMC capacity building training, they
encouraged that each MMC include a quota of female members.

Ch 4. Resilient infrastructure and inclusive rural transformation
104
Within each project area, households may benefit from being close to both the upgraded market
and the improved market-connecting road, or may only benefit from being located close to the
market and not the road. Both sets of households are expected to benefit from improved
demand, prices, input access, local economic opportunities and social networks through better-
attended markets that are operational year-round regardless of shocks. While those located
close to the road could benefit more from undisrupted and cheaper transport to local and non-
local markets as well as to schools and group meetings. If this is the case, they stand to
ultimately benefit more in terms of increased income and livelihood transformation. Whether
this is the case is an empirical question that we test in our analysis.
4.4 Data and methodology
4.4.1 Data and indicators
The empirical analysis is based on data from in-depth household questionnaires from 1,350
treatment and 1,650 control households, surveyed in August-September 2018 from the three
divisions where CCRIP was implemented.13 The questionnaire covered the three annual
cropping seasons during the 12-month period between August 2017 and July 2018. Households
were sampled from the surrounding areas of nine CCRIP markets (work on all of which was
completed before June 2015) and nine control markets. CCRIP was implemented by first
identifying suitable markets, and then improving the market and its main connecting road.
Based on this, the sample was designed by first identifying well-matched treatment and control
markets before randomly sampling households from within their catchment areas.
Key to the sample design was defining the catchment areas for the markets and roads of CCRIP
according to their zones of influence (van de Walle, 2009). Local project specialists estimated
13 A representative sample was obtained by weighting the sample size per division based on the relative project
expenditures per division.

Ch 4. Resilient infrastructure and inclusive rural transformation
105
that the maximum distance that households would be willing to travel to utilise the markets is
approximately 2km, while for the roads, the distance is 0.5km. In order to assess the impact of
the market alone, as well as the incremental impact of the market and the market-connecting
road, we stratified the sample according to two catchment areas: (i) within a 2km radius of the
market but not within 0.5km either side of the market-connecting road; and (ii) within a 2km
radius of the market, and within 0.5km on either side of the market-connecting road.
Treatment and control markets were identified using a combination of GIS data and input from
project specialists. Control markets were identified from a list of markets that narrowly missed-
out on being selected for the project due to financial constraints, in addition to other markets
proposed by local staff in the project divisions as having been similar to CCRIP markets at the
time of the project's initial implementation. The final set of treatment and control markets were
then selected using GIS data by producing matched pairs of markets that were geographically
close (ideally in the same upazila) but whose catchment areas were not overlapping (to avoid
spillover), and who shared similar population densities.
In addition to the household questionnaires, extensive qualitative data was collected from
senior national and regional project staff, and from other key figures in both treatment and
control areas. In the treatment areas, this included: five KIIs with MMC members in CCRIP
markets; five FGDs with LCS members involved in roads construction; and five FGDs with
LCS members involved in market construction. In control areas, this included: three KIIs with
control market managers; and two KIIs with the local Women's Representatives (in the absence
of active LCS in these areas).
We use the quantitative data to construct a set of impact indicators designed to
comprehensively assess the project's impact on inclusive rural transformation. In addition to
indicators of agricultural production, livelihood composition, school enrolment, and social
capital (proxied by membership of a local social group) we also construct an index for

Ch 4. Resilient infrastructure and inclusive rural transformation
106
ownership of household and productive assets using Principle Component Analysis (see Filmer
& Pritchett, 2001), along with Food Insecurity Experience Scale (FIES) and Household Dietary
Diversity Scale (HDDS) scores.14
To assess impacts on resilience to shocks we use subjective measures of the severity of a
shock's impact and the household's ability to recover from the shock. These are two key aspects
of resilience, with severity assessing the degree of vulnerability of a household to a shock, and
recovery assessing the household's ability to cope in its wake (OECD, 2014; FSIN, 2015;
Schipper & Langston, 2015). Both of these are based upon a five-point scale. In order to assess
the project's specific impact on resilience to climatic shocks, we construct these indicators
separately for climatic shocks (floods, cyclones, storms, etc.) and non-climatic shocks (loss of
employment, illness or death of a household member, etc.).
4.4.2 Methodology
Using the household data, we estimate the impact of CCRIP by catchment area, and within
each catchment area we assess whether impacts were different for landowners, in order to
assess the influence of initial resource endowments. As noted above, land ownership has
proven to be a key influencing factor in past impact studies, and is a reliable indicator of pre-
project resource endowments as it is mostly fixed over the short-term. We do not estimate
impacts for non-landowners due to insufficient sample size, but we can infer how impacts
differed for these households by comparing the impact estimates for the entire catchment area
and for landowners within the area.
We use a statistical matching-based approach to estimate impacts on these sub-groups.
Broadly, matching-based approaches are used to increase the comparability of treatment and
14 The FIES is a score based on responses to eight questions related to experiences of food insecurity during the
12 month study period (Ballard et al., 2013). The HDDS is a score based on the consumption of 16 different
food groups during the seven days preceding the day of the questionnaire (Kennedy et al., 2011).

Ch 4. Resilient infrastructure and inclusive rural transformation
107
control groups by only comparing households matched according to a set of relevant pre-
project characteristics. After testing various matching approaches, we identified a non-
parametric, mahalanobis distance-based radius matching model as our primary estimator. This
estimator provided the highest level of bias reduction while minimising the number of
households dropped from the analysis for not having a match. The mahalanobis distance is a
matrix-based method of determining the distance between two units based on multiple data
points (Hill & Lewicki, 2006). In this case we use this measure to find treatment and control
households with the smallest distance according to a set of relevant characteristics,15 and we
match treatment households with all control households within a specified radius. The average
difference in the impact indicator for each matched pair provides the Average Treatment Effect
(ATE) of the project on that indicator (Abadie et al., 2004). Formally, the ATE from this model
for a given impact indicator is calculated as follows:
ATE = E(y1i – y0i) (4.1)
Where y1i represents the outcome for treatment household i, and y0i represents the outcome for
control household i, and the E is the expectation operator.
Our preferred estimator reduces the average SMD between the covariates from 0.09 to 0.03
and VR from 1.14 to 1.01 (Austin, 2009), indicating that the process considerably improves
the comparability of the treatment and control group based on observable characteristics. We
also assess the sensitivity of the results of this model using a secondary model and find that the
results are qualitatively similar.16
15 These consist of the household size and dependency ratio; average age in the household; age, education and
gender of the household head; number of literate and English-speaking household members; Religion; number
of climatic shocks experience in the past 12 months; Productive and household assets owned at baseline (2014);
and the upazila in which the household is located. 16 We use an IPWRA model, as used in Chapter 2, to test sensitivity of results to model specification. The
specification and results of this model are available upon request from the contact author.

Ch 4. Resilient infrastructure and inclusive rural transformation
108
4.5 Profile of the sub-groups
Table 4.1 presents key economic and social statistics of households in the two catchment areas,
including separate statistics for landowners and non-landowners. Treatment and control
households located close to both the market and the road have a higher average income than
treatment and control households located away from the road, and within both catchment areas
landowners unsurprisingly have higher incomes. The amount of land cultivated is low in all
cases, but especially for those located away from the road. Non-landowners in this area
cultivated an average of just 0.8 hectares through renting, sharecropping or borrowing.
School enrolment is also similar across the sub-groups, with each averaging around 70-72 per
cent, as is average years of households' education, although again in both cases the average for
landowners within the groups is higher. Women's decision-making involvement is low in all
cases, with only 35-45 per cent of treatment and control households reporting that women are
involved either solely or jointly in decisions regarding household purchases, reflecting the
country's well-documented equality issues (Ambler et al., 2017; Matin, 2017). Shock exposure
during the 12-month study period is high across the groups, with similar proportions of
households reporting being affected by floods (10-11 per cent), cyclones or storms (2-4 per
cent), and other shocks such as illness or death of a family member of loss of employment (48-
55 per cent).

Ch 4. Resilient infrastructure and inclusive rural transformation
109
Table 4.1. Key characteristics of sub-groups
Market only Market & Road
All Land-
owners
Non-
landowners All
Land-
owners
Non-
landowners
Total income per capita ($) 2,246 2,402 1,643 2,532 2,707 1,749
Land cultivated (ha.) 2.8 (985) 3.3 (786) 0.8 (199) 3.2 (891) 3.5 (737) 1.6 (154)
Years of ed. in household 6.0 6.2 5.3 6.2 6.3 5.6
School enrolment (%) 69.9 (1,207) 70.1 (951) 69.5 (256) 71.4 (997) 72.0 (801) 68.9 (196)
Women involved in
decision-making on
household purchases (%)
35.3 (1,483) 36.5 (1,178) 30.5 (305) 42.6 (1,247) 44.7 (1,019) 33.3 (228)
Shock exposure (% of
households):
Flood
Cyclone/Storm
Non-climatic
10.9
4.2
52.6
10.4
3.5
53.5
12.7
6.8
48.9
10.3
2.3
49.5
10.2
2.3
48.2
10.5
2.6
55.3
Number of households, unless otherwise stated in parentheses: Market only: All = 1,491, Landowners = 1,184, Non-
landowners = 307; Market & Road: All = 1,249; Landowners = 1,021, Non-landowners = 228.
Graphs 4.1a and 4.1b provide an overview of the livelihood composition of the sub-groups.
Graph 4.1a shows that selling crops is the main livelihood activity for all of the sub-groups,
with little variation by land ownership, although no more than 50 per cent of households in
each case are involved in this activity. Sales of fish and livestock are the second most popular
livelihood activity across the groups. For both catchment areas, around 30 per cent of
households are involved in self-employment, whilst those treatment and control households
located away from the road have a higher level of involvement in off-farm wage employment
(31 per cent) compared to those closer to the road (25 per cent). Amongst those treatment and
control households located away from the market, landowners have a slightly lower level of
involvement in wage employment and are more involved in self-employment. Remittances are
also a key part of livelihoods in both catchment areas, especially for landowners, whilst
participation in on-farm wage employment is low in all cases.
Graph 4.1b presents the average income per capita earned from each activity for each of the
sub-groups. The average income from crop sales is much lower than self-employment and off-

Ch 4. Resilient infrastructure and inclusive rural transformation
110
farm wage employment. Being located closer to the market-connecting road seems particularly
beneficial for off-farm wage employment. Treatment and control landowners do not seem to
benefit from larger incomes from selling crops in either catchment area, but they have higher
incomes per capita in both areas from self-employment and off-farm wage employment. That
landowning households obtain higher average incomes in almost all sectors highlights than
non-landowners—with their higher poverty, lower resource endowments and lower
education—are the most at risk of exclusion from any rural transformation processes occurring
in the study area.
Graph 4.1a. Participation in livelihood activities Graph 4.1b. Average income by activity
4.6 Results
4.6.1 Agricultural Productivity and Marketing
Table 4.2 presents results for CCRIP's impact on crop, fish and livestock production. We find
that the project did not significantly increase crop productivity or fish production for
households located in either catchment area, regardless of land ownership, and the value of
livestock production was only significantly increased for households located away from the
road (by 25 per cent). We also find a significant impact on this indicator when the sample is
restricted solely to landowners in this catchment area, although the smaller coefficient implies
that the impact may have been higher for non-landowners in this area.
0
10
20
30
40
50
60
Crop sales Fish and
livestock
sales
On-farm
waged emp.
Off-farm
waged emp.
Self-emp. Remittances
% o
f sa
mp
le
0
200
400
600
800
1000
1200
1400
Crop sales Fish and
livestock
sales
On-farm
waged emp.
Off-farm
waged emp.
Self-emp. Remittances
Ave.
in
com
e p
er c
ap
ita
($
)
Market only Market only w. landMarket & Road Market & Road w. land

Ch 4. Resilient infrastructure and inclusive rural transformation
111
In terms of income from agriculture (Table 4.3), the project had large significant impacts on
income from selling crops for both catchment areas, with a larger impact for those located away
from the road (150 per cent vs 81 per cent). As with the impact on livestock production, the
effects on income from crop sales were lower in both catchment areas for landowners,
suggesting a larger impact on non-landowners. Despite the lack of impact on fish production,
income from selling fish increased for both catchment areas, which was due to higher prices
and a higher proportion of fish harvests being sold according to both the quantitative and
qualitative data. Finally income from livestock increased alongside production for those
located away from the road, again with a smaller impact for landowners.
The results for crop productivity and sales broadly suggest that the project improved market
access for selling outputs but not for buying inputs. Further analysis of the quantitative data
supports this in terms of selling outputs, highlighting that positive impacts were driven by
increases in the proportion of harvests being sold, the likelihood of selling crops at a market
rather than from the farm gate, and the likelihood of growing cash crops. Regarding buying
inputs, however, responses in the qualitative data indicate that affordability hindered input use
despite improvements in physical access.
Further analysis of the quantitative data on the sale of seasonal crops reveals that the project
increased income from the sale of seasonal crops in both the dry and monsoon seasons.
Importantly, this indicates that all-weather access and usability of markets for farmers was
improved. The role of MMCs in improving and maintaining market access in the face of
shocks—thanks to improved financial capacity from CCRIP training and higher rents collected
from better attended markets—was widely reported as a key factor in the qualitative data.
Furthermore, the overall crop income findings highlight that poorer households (those located
away from the road and non-landowners) benefitted more, and the higher impacts for those

Ch 4. Resilient infrastructure and inclusive rural transformation
112
located away from the road also implies that the market strengthening activities were the main
driver behind these agricultural impacts.
Table 4.2. Impact of CCRIP on crop, fish and livestock production
Value of total crop
prod./ha.
Value of total fish
prod.
Value of total
livestock prod.
Market only 17.1% (985) -11.8% (865) 25.2%** (1,170)
Market only w. land 18.5% (786) -11.3% (726) 23.4%** (936)
Market & Road 10.8% (891) -31.9% (661) -2.6% (1,001)
Market & Road w. land 8.14% (737) -31.9% (545) -0.8% (806)
Note: Sample size varies according to the number of households involved in the activity in each case, sample size indicated in
parentheses;
*,** and *** indicate the statistical significance of the estimated ATE at the 10, 5 and 1% levels, respectively.
Table 4.3. Impact of CCRIP on crop, fish and livestock income
Value of crop
sales/ha.
Value of total
fish sales
Value of total
livestock sales
Market only 150.4%*** (985) 59.6%* (865) 69.3%** (1,170)
Market only w. land 100.2%***(786) 33.7% (726) 48.7% (936)
Market & Road 81.2%** (891) 70.6%** (661) -32.9% (1,001)
Market & Road w. land 70.1% (737) 59.2% (545) -52.4% (806)
Note: Sample size varies according to the number of households involved in the activity in each case, sample size indicated in
parentheses;
*,** and *** indicate the statistical significance of the estimated ATE at the 10, 5 and 1% levels, respectively.
4.6.2 Total Income and Livelihood Activities
Table 4.4 presents the results for CCRIP's impact on total income, livelihood diversity, and
income from wage and self-employment, and remittances. Total income was only significantly
increased for those located away from the road (13 per cent), and the lack of impact for
landowners within this catchment area suggests that this impact was driven by improvements
for non-landowners. For those located close to the road we do not find a significant impact
despite the increase in agricultural income noted above.
Along with income from agriculture, the increase in total income for those located away from
the road was driven by income from employment, especially off-farm work. Further analysis
indicates that this impact is based on an increase in wages rather than in labour days, implying

Ch 4. Resilient infrastructure and inclusive rural transformation
113
that the project helped these households to identify more lucrative employment opportunities
rather than increasing overall wage employment. Further quantitative and qualitative
investigation into non-landowners in this catchment area reveals that similar employment
impacts were not achieved, potentially due to their lower education and skills, and that income
impacts were instead driven solely by agricultural income.
Despite the importance of self-employment in the livelihoods of households in all of the sub-
groups (see Graph 4.1a), we do not find an impact on income from this source for any group.
There was also no mention in the qualitative data of the project benefitting self-employment or
migration, suggesting that this type of local market and road infrastructure may not be
conducive to these activities. However, we do find that income from remittances was increased
for those located close to the connecting road, suggesting the road provided opportunities for
more lucrative migration, seemingly more so for non-landowning households.
Regarding income diversification, this was increased significantly for those located away from
the road, with the impact likely to be higher for non-landowners. For non-landowners located
away from the road, the poorest group in the sample, further analysis shows that this impact
was driven by increased involvement in agricultural sales. Along with the lack of impact on
off-farm income for this sub-group, we also do not find an impact on the number of households
involved in off-farm employment for either landowners or non-landowners located away from
the road. In the case of non-landowners, these impacts indicate that resilience through
diversification seems to have been developed within existing agrarian livelihoods for these
households. Conversely, for households located close to the road, their diversification did not
increase but testing for impacts on the number of households involved in off-farm wage
employment shows that that involvement did increase, especially for landowners. This has
positive implications for climate resilience, alongside the increase in income from remittances,

Ch 4. Resilient infrastructure and inclusive rural transformation
114
given that these activities are commonly at a lower risk of disruption from climatic stressors,
and can provide a buffer against harvest failure (Svodziwa, 2018).
Table 4.4. Impact of CCRIP on total income and income sources
Total
income
per capita
Nr.
income
sources
Income per capita from:
On-farm
employment
Off-farm
employment
Self-
employment Remittances
Market only 12.7%* 0.3** 34.2% (98) 17.8%* (460) -26.6% (457) -9.0% (424)
Market only w. land 3.5% 0.2 40.1% (68) 18.5% (347) -33.0% (372) -16.6% (377)
Market & Road 7.5% 0.04 -82.9%*** (81) 8.6% (316) 5.7% (390) 32.2%* (375)
Market & Road w. land 7.2% 0.1 -78.5% (59) 9.3% (234) 2.2% (322) 28.9% (339)
Note: Full sample used for all indicators, unless otherwise stated in parentheses, with the following sample sizes: Market only
= 1,491; Market only w. land = 1,184; Market & Road = 1,249; Market & Road w. land = 1,021;
*,** and *** indicate the statistical significance of the estimated ATE at the 10, 5 and 1% levels, respectively.
4.6.3 Asset Ownership, Social Outcomes and Shock Resilience
Table 4.5 presents the results for CCRIP's impact on asset ownership and social outcomes. The
project did not increase asset ownership for any of the sub-groups. Involvement in social or
community groups, an indicator of social capital, was increased only for households located
close to the road, suggesting that the market-connecting road was the key factor in this impact
pathway. Qualitative responses also indicate that households were able to travel to meeting
points more easily year-round using the upgraded roads.
Food insecurity was found to have significantly decreased only for those located close to the
road, by an average of 0.4 on the eight-point scale. Without improved agricultural production,
higher incomes may have driven this impact. Dietary diversity was not improved, however,
and we actually find a significant reduction for landowners located away from the road. This
could be linked to the increased market orientation of agriculture, meaning that a smaller
variety of crops were produced for home consumption. Table 4.1 also shows that males are the
main decision-makers regarding household purchases, which has also been found to lead to
less household income being spent on nutrition (Amugsi et al., 2016). School enrolment was
also not increased for any of the sub-groups. In the qualitative data, households reported

Ch 4. Resilient infrastructure and inclusive rural transformation
115
improved access to schools in some cases, meaning the lack of impact may be partially due to
school enrolment already being reasonably high (see Table 4.1).
Table 4.5. Impact of CCRIP on asset ownership and social indicators
Asset index
(0-12 score)
Nr. social/
community
groups involved
FIES
(0-8 score)
HDDS
(0-16 score)
School
enrolment (%)
Market only 0.04 0.04 -0.4*** -0.2 -1.0 (1,207)
Market only w. land 0.01 0.02 -0.5*** -0.3* -1.4 (951)
Market & Road -0.01 0.08*** -0.2 -0.01 -0.2 (997)
Market & Road w. land -0.01 0.06** -0.2 -0.1 -0.9 (801)
Note: Full sample used for all indicators, unless otherwise stated in parentheses, with the following sample sizes: Market only
= 1,491; Market only w. land = 1,184; Market & Road = 1,249; Market & Road w. land = 1,021;
*,** and *** indicate the statistical significance of the estimated ATE at the 10, 5 and 1% levels, respectively.
Table 4.6 presents the results for CCRIP's impact on household's subjective resilience to
shocks. In terms of climatic shocks, we find significant improvements for both catchment areas,
with slightly higher impacts for land owning households in both cases. According to these
results, the average reported score on the scale for shock severity (five being the most severe)
was reduced by an average of 0.3 points for both catchment areas, whilst the average reported
score on the scale for households' ability to recover from the shock (five being a full recovery),
was increased by an average of 0.4 for those located away from the road and 0.6 for those
located close to the road. By enhancing improved seasonal market access, and livelihood
diversification and off-farm activities for some sub-groups, the project has had a clear impact
on climate resilience in the project areas. The project's impact on social capital may have also
contributed to households' ability to recover by enhancing coping mechanisms through
improved support networks (Adger et al., 2001).
The results are less promising for other shocks, the prevalence of which remains high in the
sample (see Table 4.1). We do not find significant reductions in non-climatic shock severity or
ability to recover for either catchment area, regardless of land ownership. This may be linked
to the lack of impact on asset ownership (a key coping resource), and perhaps because remote

Ch 4. Resilient infrastructure and inclusive rural transformation
116
rural households require more extended periods of income growth, asset accumulation, and
livelihood transformation to reduce their overall vulnerability (Tanner et al., 2017). This
prevailing vulnerability may also help to explain the lack of impact on agricultural productivity
and advancement into more lucrative off-farm activities amongst some households, as high risk
exposure is known to disincentivise productive investments for the sake of low-risk, low-return
investments (Rosenzweig & Binswanger, 1993; Yesuf & Bluffstone, 2009; Hurley, 2010).
Table 4.6. Impact of CCRIP on shock resilience
Severity of
climatic shocks
(1-5 score†)
Recovery from
climatic shocks
(1-5 score††)
Severity of other
shocks (1-5 score)
Recovery from
other shocks
(1-5 score)
Market only -0.4*** (220) 0.4** (220) 0.1 (784) 0.1 (784)
Market only w. land -0.5*** (160) 0.4** (160) 0.1 (634) 0.1 (634)
Market & Road -0.3** (149) 0.6*** (149) -0.1 (618) 0.1 (618)
Market & Road w. land -0.4*** (121) 0.5*** (121) -0.03 (492) 0.03 (492)
† Scale: 1= Low severity, 5 = High severity; †† Scale: 1= Did not recover at all; 5 = Full recovery
Note: Sample size varies according to the number of households who experienced at least one shock during the 12 month period
in each case, sample size indicated in parentheses;
*,** and *** indicate the statistical significance of the estimated ATE at the 10, 5 and 1% levels, respectively.
4.6.4 Women's Inclusion and Empowerment
As shown in Table 4.7, the contribution to household income by women's autonomous
economic activities was not improved amongst any of the sub-groups, and the likelihood of
women owning their own business was also not increased, which may be symptomatic of the
overall lack of impact on self-employment activities. At the same time, women's likelihood of
having off-farm wage employment was improved for both catchment areas, while there were
too few women in on-farm employment in any group to analyse this impact.
The project specifically aimed to improve the economic inclusion of women through the use
of LCS. Respondents in the qualitative data noted that this initiative provided useful training
and a temporary income increase, but once the construction work was completed, members
struggled to find further employment, and when they did, they were paid lower wages

Ch 4. Resilient infrastructure and inclusive rural transformation
117
compared to men. Such discrimination in wages may explain the lack of impact on household
income contribution despite increases in off-farm wage employment, but may also reflect them
being in a lower standard of employment.
Regarding social capital, women were actively involved in an average of 0.03 more groups for
those located away from the road and 0.05 more groups for those located close to the road (both
of which are statistically significant)—again highlighting the importance of roads to social
capital impacts. Within these groups, the findings suggest that the impact was higher for non-
landowners in the former, and was not different in the latter. For women in households located
away from the market, there was also a significant increase of six per cent in the likelihood of
their being involved in decisions about household purchases, although there was no impact for
any group regarding decisions about children's schooling.
We have found that CCRIP stimulated rural transformation progress by advancing agricultural
activities for some households, and off-farm activities for others, but these findings suggest
women faced barriers to participating in these advancements. Qualitative data from project
staff confirms that limits on women's mobility and labour were considerable barriers in this
area, especially among Muslim households. In fact, further analysis shows that amongst the
small number of non-Muslim households, women's contribution to household income did
significantly increase. More positively, the improvements in social capital and decision making
may represent the beginning of a longer term process of transformational economic and social
change for women if these effects can be maintained.

Ch 4. Resilient infrastructure and inclusive rural transformation
118
Table 4.7. Impact of CCRIP on women's inclusion and empowerment
Share of
income in
household
total (%)
Own
business (%
likelihood)
In off-farm
employment
(% likelihood) Nr groups
Involved in decision-making
about (% likelihood):
Household
spending
Children's
schooling
Market only 0.4 0.2 2.4** 0.03* 6.04** 0.2
Market only w. land 0.2 -0.4 2.1** 0.02 2.9 0.5
Market & Road 1.0 0.5 1.3 0.05*** -3.9 -1.6
Market & Road w. land 1.1 0.9 0.8 0.05** -5.0 -1.0
Note: Only households with adult female members included, sample sizes are as follows: Market only = 1,483; Market only w.
land = 1,178; Market & Road = 1,247; Market & Road w. land = 1,019.
*,** and *** indicate the statistical significance of the estimated ATE at the 10, 5 and 1% levels, respectively.
4.7 Conclusions
Using the case study of CCRIP in southwest Bangladesh, this paper investigates how upgraded
rural markets and market-connecting roads can support inclusive rural transformation, applying
a framework of impact indicators that incorporates changes in livelihood climate resilience.
Our findings provide strong evidence that investing in climate resilient market infrastructure
in areas of high climate vulnerability can reduce household's vulnerability to climatic shocks
and increase their ability to recover from them. It can particularly increase resilience to climatic
stressors for agricultural marketing, leading to higher agricultural profitability regardless of
initial resource endowments. Through sub-group analysis we also find that these impacts do
not necessarily require additional connecting roads and can be achieved through upgraded
markets alone. Qualitative insights highlight how strengthening local committees to manage
the markets can contribute to the sustainability of these impacts.
However, the potential for this type of investment to stimulate other areas of inclusive rural
transformation is far less clear. For poorer households, we find that they can benefit more than
others in terms of agricultural income, total income, and income diversification, which has
positive implications for inclusivity, but for the poorest (non-landowners located away from
the road in this case), we find limited evidence that they are able to advance into the off-farm

Ch 4. Resilient infrastructure and inclusive rural transformation
119
sphere, potentially due to limited education and skills. Whilst representing progress, in areas
with limited space for increased cropping intensity such improvements may not be sustainable.
Impacts were also mixed for relatively wealthier households. Whilst benefitting in terms of
more profitable crop and fish production, more off-farm wage employment, and higher
remittances, their livelihoods were not substantially strengthened due to a lack of impact on
self-employment or income from wage employment, their main income sources.
We also find that increased income does not automatically unlock improvements in all of the
components of rural transformation, especially in terms of asset ownership or social outcomes.
For instance, we find that a lack of road access may hinder improvements in social capital, and
increased market orientation of agricultural production may hinder improvements in dietary
diversity. Without such improvements, we find that vulnerability to non-climatic shocks may
persist, which in-turn may limit project impacts by maintaining risk aversion, potentially
explaining the static nature of crop production practices for both groups, and the lack of
advancement into off-farm activities for non-landowners.
Regarding women, we find widespread improvements in women's social capital as a result of
the project, highlighting the power of improved rural connectivity to affect this important
aspect of women's empowerment. On the other hand, we find limited evidence of women
having improved their income generating activities or household decision-making
involvement. Based on these findings, and as noted in previous studies, this type of project may
be insufficient to structurally transform the position of women in the face of cultural barriers.
These findings provide many implications for future policy and practice. First, they confirm
that increasing the usability of rural markets alone can increase livelihood resilience to climatic
stressors in climate vulnerable areas, and adding market-connecting roads can generate further
improvements, especially in terms of increasing social capital. Future initiatives can magnify
these impacts by ensuring households can afford to purchase inputs from these markets, helping

Ch 4. Resilient infrastructure and inclusive rural transformation
120
to generate greater productivity and resilience impacts. Also in terms of resilience to both
climatic and non-climatic shocks, future initiatives would also benefit from facilitating the
transfer of increased incomes into increased asset accumulation, and capitalising on the strong
linkages between rural infrastructure and social capital.
For poorer households, impacts on resilience and income can be furthered by facilitating the
investment of increased agricultural income into a more lucrative mix of on- and off-farm
activities. Based on the barriers identified in this study, this can be achieved through skills
training and provision of capital to increase agricultural productivity and to invest in off-farm
ventures. For wealthier households, they must be targeted with more nuanced support that is
focused on making non-farming activities more lucrative. This can be achieved by ensuring
that a wider range of goods are traded at the local markets or by improving connectivity to
larger markets.
Finally, future initiatives in countries such as Bangladesh must place greater emphasis on
overcoming the barriers to economic and social inclusion faced by women. If not, women are
at risk of being excluded from rural transformation progress and having their unequal position
in society further entrenched. This analysis has shown that improving connectivity through
markets and roads can have powerful effects on women's social capital. Future initiatives
should try to build upon this mechanism, using collective action and networks to generate new
opportunities for breaking social norms, increasing skill acquisition, and increasing
opportunities for wage and self-employment. Based on the findings regarding the use of LCS,
this may serve as an effective tool in this regard if future applications place greater emphasis
on generating longer term benefits.

121
Chapter 5
Protecting farm productivity from the effects of seasonal
floods in Bangladesh
A Stochastic Meta-Frontier analysis of a climate resilient
infrastructure project
Abstract: This chapter assesses the impacts of CCRIP on farm productivity. The analysis
combines Stochastic Meta-Frontier modelling and counterfactual-based impact evaluation
methods to test whether the project improved agricultural productivity, and whether impacts
varied by flood exposure. The findings indicate that average Frontier Output grew only for
beneficiaries with low flood exposure. TE increased for beneficiaries with high flood exposure,
but only for those who had been exposed to recurrent floods over time, which we attribute to a
change in coping strategies. Our results also indicate that it was harder to improve access to
agricultural inputs than for selling outputs. Based on the analysis, we suggest complementary
support that could help to increase the impacts of future rural infrastructure projects.
This chapter is based on:
Higgins, D., Arslan, A. and Bravo-Ureta, B.E. Protecting farm productivity from the effects
of seasonal floods in Bangladesh: A Stochastic Meta-Frontier analysis of a climate resilient
infrastructure project. Working Paper
Currently under review by the European Journal of Development Research

Ch 5. Protecting farm productivity from floods
122
5.1 Introduction
Ensuring that extreme weather events do not temporarily or permanently hinder access to
markets for inputs and outputs is key for achieving sustainable improvements in productivity
for smallholder farmers in developing countries. Unreliable market access hampers
productivity as farmers cannot acquire the inputs they need at the required time and may be
reluctant to invest in new technologies and practices because of uncertainty about reaping
adequate returns (OECD, 2007; Taylor et al., 2009; Zezza et al,. 2011; FAO, 2018b). This has
implications for short-term productivity and food security, and for the longer-term
transformation of rural economies that is key for wider economic growth (IFAD, 2016).
This chapter provides much-needed evidence on how to address development challenges
stemming from climatic shocks in rural areas, focusing on the effectiveness of flood-proof rural
markets and market-connecting roads implemented through CCRIP in southwest Bangladesh.
We take a sample of treatment and control households, which we trim using Coarsened Exact
Matching (CEM) to increase comparability, and then apply a SPF analysis to estimate the
project’s impacts on several agricultural productivity indicators.
The marginal benefit of climate-proofing new infrastructure is unclear as most existing studies
do not attempt to clarify their impact pathways (Douven et al., 2012). For instance, a new road
designed to be climate resilient may fail in this aim but still improve livelihoods simply by
being better than the previous road when the area is not flooded. To inform future project
design, we try to uncover specific impact pathways by testing whether project impacts differ
by flood exposure intensity (both short-term and recurrent).
The proceeding section reviews the relevant literature, followed by an overview of the case
study project and its context, the data and methodology, descriptive statistics of the sample, the
results of the analysis, and finally the conclusions and policy implications.

Ch 5. Protecting farm productivity from floods
123
5.2 Related literature
Similar to Chapter 3, the approach used in this paper draws from two different strands of
literature: (i) studies focusing on robust impact evaluations of climate resilient infrastructure
projects; and (ii) studies investigating agricultural productivity differentials using SMFs.
Studies from the former stream rarely go further than using output per hectare to measure
impacts on agricultural productivity, whereas studies from the latter rarely address possible
selection bias associated with entry into a given comparison group (Greene, 2010; Bravo-Ureta
et al., 2012; Bravo-Ureta et al., 2020a). Moreover, both types of studies seldom examine the
impact of markets and roads that are climate resilient. In combining the two streams, this
chapter builds upon their respective strengths while addressing their shortcomings.
5.2.1 Assessing the impacts of climate resilient infrastructure projects
Access to infrastructure (such as roads, markets, irrigation and electricity) is recognised as one
of the five main factors that determine the adaptive capacity of a community (Smit and
Pilifosova, 2001), and there is a large body of evidence showing that investing in rural
infrastructure is among the strongest ways to secure agricultural productivity against the threats
of climate change (Binswanger, 1989; Binswanger et al., 1993; Nelson et al., 2010; ILO, 2011;
Below et al., 2012). Enabling farmers to navigate the effects of climate change—including
increasingly frequent and severe climatic shocks—has now been mainstreamed into rural
development policymaking (Frelih-Larsen, 2014; IFAD, 2019b), and based on its perceived
effectiveness, and lower maintenance and repair costs, increasing investment is being
channelled into climate resilient infrastructure, defined as infrastructure that can “withstand,
respond to, and recover rapidly” from changing climate conditions (OECD, 2018: 4).
Robustly estimating the impacts of development interventions, such as rural infrastructure
projects, requires that beneficiaries are compared with a counterfactual that accurately

Ch 5. Protecting farm productivity from floods
124
represents how beneficiaries would have fared in the absence of the intervention (Winters et
al., 2010). Although many impact evaluations of improved rural infrastructure have been
conducted using this approach, climate resilient infrastructure investments have received
limited attention (Douven et al., 2012; Sabet and Brown, 2018).
Existing evaluations of the impact of climate resilient infrastructure on agriculture focus
predominantly on all-weather roads (Hine, 2016; Raitzer et al., 2019). For instance, a national
all-weather road building programme in Ethiopia was found to have reduced the likelihood of
being poor and increased household consumption, attributed partially to improved market
access and increased purchasing of crop inputs (Dercon and Hoddinott, 2005; Dercon et al.,
2009). For a similar national programme in India, studies by Shamdasani (2016) and Aggarwal
(2018) find that access to all-weather roads increased use of fertiliser, hybrid seeds, farm labour
and irrigation, and supported a shift from subsistence to market-oriented agriculture.
Shamsadani (2016) adds, however, that impacts were lower for small-scale cultivators who
could not afford to increase farm investments.
Effective modelling of climatic shocks and stressors, and analysing the response of
beneficiaries to these, is key to determining the impacts of climate resilient infrastructure.
Smith and Frankenberger (2018) applied this type of test to a disaster mitigation project in
northern Bangladesh to analyse the project’s effects on beneficiaries’ response to flooding.
They define flood exposure using an index based on satellite data on stream flows combined
with self-reported severity. They find that the project helped to reduce the negative effects of
flood exposure on food security which they attribute partially to flood effects being mitigated
by improved access to input markets and to financial services. Asfaw et al. (2017) assess the
impact of a conditional cash transfer project on the effects of drought in Zambia, defining
exposure based on negative deviation of rainfall from the district-level mean. The findings
Ch 5. Protecting farm productivity from floods
125
indicate that the project ensured that household expenditures and nutrition were not negatively
affected by drought, especially for the poorest households.
Analysing the influence of drought on household expenditures in Ghana, Tanzania and Uganda,
Haile et al. (2018) report that effects differ temporally and according to the number of shocks
experienced, highlighting the need to focus on both short-term and recurrent shocks. While a
one-off shock may not be significant enough to cause long-term damage to the livelihood of a
household, recurrent shocks can gradually degrade livelihood capacity, by eroding resources,
savings and social capital, and by promoting long-term risk averse decision-making behaviour
(Rosenzweig and Binswanger, 1993; Blaikie et al., 1994; World Bank, 2013; Birhanu et al.,
2017).
Investigating the ability to cope with recurrent shocks can also help to uncover the coping
strategies that are employed before and after a shock. So-called negative coping strategies, such
as the sale of assets, could help households to overcome a temporary shock but are likely to
reduce their ability to cope with future shocks, meaning that the harmful effects of these
strategies would only become evident when subsequent shocks occur (Smit and Skinner, 2002;
Smit and Wandel, 2006; Nguyen et al., 2020). By mitigating the negative effects of shocks,
climate resilient infrastructure has the potential to reduce the need to resort to these detrimental
coping strategies, which include ex-ante risk averse strategies such as avoiding investing in
new technologies or higher value crops that are costlier to produce (Liebenehm et al., 2018).
Focusing on individual coping strategies is particularly important in the case of floods, which
usually affect whole communities meaning households are unable to rely on social networks to
cope (Kurosaki, 2015; Nguyen et al., 2020).
Béné and Haque (2021) provide a rare analysis of the impact of a development project on
coping strategies, assessing the ability of a multi-faceted development project to build the
resilience of fishery users, in the same area of coastal Bangladesh as our case study project.

Ch 5. Protecting farm productivity from floods
126
They categorise coping strategies such as selling productive assets or taking a loan in response
to a shock as detrimental, and strategies such as income diversification or saving money as
adaptive or transformative. While the results of the project’s impacts on negative coping
strategies are inconclusive (although there is an indication that impacts vary by shock), they
find a strong positive impact on promoting adaptive/transformative coping strategies. They
conclude that it may be easier to promote positive strategies than to induce the rural poor to
avoid negative strategies. A similar assessment is applied by Béné et al. (2020) to a disaster
risk reduction project in Niger, focusing on responses to drought, flood or other shocks.
Complementing findings on indicators of shock recovery and food security, they find similar
results in that the project only reduced the probability of engaging in detrimental coping
strategies for five out of 25 of the shock-response combinations that they tested, and increased
the probability of engaging in positive responses in six out of ten cases.
5.2.2 Assessing agricultural productivity differentials using SMFs
More efficient farm production means that less natural and physical inputs are required per unit
of output, meaning that production is less affected if access to these inputs is hindered due to a
climatic shock (McCarthy et al., 2011). For example, more efficient production means farmers
can produce more on a smaller amount of land, which would allow them to cope with growing
land degradation (IPCC, 2019). Higher agricultural productivity can also lead to higher
incomes, which can then be invested in new inputs, machinery and practices that further
increase farmers’ ability to withstand shocks and to navigate worsening threats from climate
change (Lipper et al., 2014). In terms of mitigation, more efficient agriculture usually incurs a
lower unit cost in terms of emissions, and lessens the demand for forests and wetlands to be
converted for farming (Lipper et al., 2014; Searchinger et al., 2018). Rural development
policies are beginning to recognise these benefits, but methodologically robust evidence on the
Ch 5. Protecting farm productivity from floods
127
impacts of infrastructure projects that aim to increase the efficiency of agricultural production
are scarce (World Bank, 2011; Cameron et al., 2016).
Agricultural productivity can be increased in various ways, including improved input and
technology access, and more efficient input use. The majority of existing impact evaluations
of projects aiming to improve agricultural productivity use total output as the main indicator
of productivity—but without knowing how total output was affected, the causal pathways
remain unknown (Headey et al., 2005). Employing a production frontier approach provides a
more granular analysis of productivity, allowing to first identify a producer’s maximum
potential output from a given set of inputs, technology and environment, and then to assess TE
based on the distance between the maximum potential and the corresponding observed output
(Aigner et al., 1977; Battese and Coelli, 1992). Production frontier methodologies have
considerable, largely untapped, potential to enhance the analysis of how development
interventions affect agricultural productivity (Bravo-Ureta et al., 2012; Bravo-Ureta et al.,
2020a).
To assess the impact of an intervention on Frontier Output and TE, treated and control groups
must be compared against a common benchmark frontier. TE scores are not comparable if
production is dependent on group-specific frontiers that do not share the same technology. The
MF approach, introduced by Battese et al. (2004) and refined by O’Donnell et al. (2008),
provides a common benchmark to make valid productivity comparisons across groups that
exhibit different technologies. The method consists of using linear programming to derive a
frontier that envelopes the individual group frontiers under the assumption that all producers
have access to the same production technologies, but that individual groups can use different
technologies depending on their resources and farming conditions. Using this best-practice
approach, Villano et al. (2015) find that adopters of certified rice seeds in the Philippines had
a significantly higher MTE (i.e. TE with respect to the Meta-Frontier) of 62 per cent compared

Ch 5. Protecting farm productivity from floods
128
to non-adopters who averaged only 37 per cent. Adopters also enjoyed a significantly higher
annual predicted Frontier Output (6,242 kg/ha) compared to non-adopters (5,114 kg/ha).
More recently, Huang et al. (2014) developed the SMF approach that we apply in this chapter,
which has received very limited attention in the literature. One such application is by Alem et
al. (2018) who compare the efficiency of dairy farms in Norway across five regions with
different climatic and production conditions. They find minimal differences across regions,
with MTE scores averaging between 87 per cent and 89 per cent. The SMF approach has also
been used by Lawin and Tamini (2019) to compare the TE of landowners and non-landowners
amongst smallholder farmers in Benin. They find that non-landowners are significantly more
efficient with an average MTE score of 82 per cent, compared to 45 per cent for landowners,
which they suggest may be due to better farm managers choosing to enter the land rental
market.
To date, the similar analysis conducted for Chapter 3, based on the paper by Bravo-Ureta et al.,
2020b, is the only study known to the authors that has used the SMF approach to assess the
impact of a development intervention. As explained in Chapter 3, we find that treated farmers
expanded their production frontiers compared to control farmers but did not improve TE due
to a lack of support to enhance farm management, reporting that MTE scores for beneficiaries
averaged 59 per cent against 70 per cent for controls.
Although comparing TE using a common benchmark frontier allows for a meaningful
comparison across different groups who may access different technologies, if assignment to
groups is not random then the comparison may be biased. Recognising this risk, some studies
have employed causal inference methods commonly used in impact evaluations to address
potential selection biases. In addition to the analysis in Chapter 3, the aforementioned studies
in Benin (Lawin and Tamini, 2019), and the Philippines (Villano et al. 2015) do so using
propensity score-based techniques to mitigate bias from observable covariates between the

Ch 5. Protecting farm productivity from floods
129
comparison groups. This involves estimating propensity scores for treated and control units,
using a logit or probit model, to determine the likelihood of being in the treated group based
on a set of relevant covariates. Then, treated and control units are matched based on the
proximity of their propensity scores and those units without a match are dropped. An alternative
is to assign a weight to each unit based on their scores (Caliendo and Kopeinig, 2008).
Recognising possible bias from unobservable characteristics—which is a potential
shortcoming when PSM approaches are used alone—the SC-SPF framework that addresses
bias from unobservables, as employed in Chapter 3, is an attractive methodology for impact
evaluation (see Greene, 2010; Bravo-Ureta et al., 2012; De los Santos-Montero and Bravo-
Ureta, 2017).
5.3 Context and research questions
As explained in Chapter 4, CCRIP aimed to increase resilience to flooding in one of the most
flood-prone countries in the world, focusing on the southwest region where, especially in the
low-lying char lands, vulnerability is especially high (Huq et al., 2015; Maplecroft, 2018). In
addition to occasional extreme weather shocks, such as cyclones and storm surges, large areas
are submerged by flooding during the monsoon season months (June-September) each year,
and this problem is growing in intensity due to climate change (Brouwer et al., 2007; Hossain
et al., 2012). The area is populated by remote poor households whose main livelihood activity
is small-scale agriculture, and for whom heavy seasonal floods pose considerable threats to
their crop production and sales.
The project was expected to improve agricultural productivity through three main channels.
First, improved access to local markets, which is not interrupted during the monsoon season,
is expected to allow farmers to buy the right inputs at the right time, and potentially of higher
quality and at lower prices, and to access more and better information. This equates to improved

Ch 5. Protecting farm productivity from floods
130
access to technology, which is expected to expand their production possibility frontier (Bravo-
Ureta and Pinheiro, 1993). Second, secured access to well-attended local markets for sales
should provide higher returns for harvests, which is expected to incentivise farmers to invest
in more effective and efficient farm management, thus increasing their TE (Taylor et al., 2009).
Third, a less direct impact is expected through the project’s potential effect on off-farm income.
Studies have confirmed that off-farm income can help to increase investment and smooth cash
flow cycles in agriculture in the face of extreme weather (Ruben and van den Berg, 2001;
Abebe, 2014; Ahmed and Melesse, 2018). However, there is also evidence that increased off-
farm income has led to agriculture being deprioritised, thus exerting a negative or neutral effect
on farm productivity (Alene and Hassan, 2003; Obwona, 2006; Bäckman et al., 2011).
As such impacts do not necessarily require that the infrastructure is climate resilient, so to
determine the additional benefits, we assess the importance of the CCRIP infrastructure being
flood-proof by testing whether impacts vary according to flood exposure. Although flooding is
ubiquitous during the monsoon season in the study area, the test takes advantage of the
variation in exposure. Our hypothesis is that higher impacts for less exposed households would
mean that CCRIP mainly achieved its impacts by generally improving market access, rather
than ensuring that the infrastructure is fully functional for all purposes linked to production
during times of intense flooding. Treated and control households are categorised into sub-
groups in two ways: (i) Short-term exposure - determined by flood exposure during the 2017-
2018 study period; and (ii) Recurrent exposure - measured according to exposure to recurrent
floods between 2014, when the project began, and 2018, when the survey was implemented.
By comparing different treated and control sub-groups using the two alternative exposure
definitions, we can determine whether CCRIP’s flood-proofing strengthened productivity
against both temporary shocks in the short-term and recurrent shocks over the longer term. The

Ch 5. Protecting farm productivity from floods
131
questions that are addressed through different sub-group comparisons are summarised in Table
5.1.
Table 5.1. Summary of sub-groups and research questions
Sub-group comparison Research question
Treated with high short-term exposure vs control
with high short-term exposure
Did CCRIP help beneficiaries to maintain or
improve their productivity during and
immediately following an extreme flood event?
Treated with high recurrent exposure vs control with
high recurrent exposure
Did CCRIP help beneficiaries to maintain or
improve their productivity in the face of recurrent
floods over multiple production cycles?
Treated with low short-term exposure vs control with
low short-term exposure; Treated with low recurrent
exposure vs control with low recurrent exposure
To what extent did the impacts of CCRIP accrue
for households with low flood exposure?
5.4 Data and methodology
The analysis is based on cross-sectional data from a household questionnaire, and geo-coded
rainfall data. We combined the same household dataset used in Chapter 4, covering a sample
of 1,873 small-scale farm households (803 treated and 1,070 control)17, with rainfall data
sourced from the Climate Hazards Group Infrared Precipitation and Station (Funk et al. 2015).
Based on the resolution of the rainfall data, a total of 28 data points spread across the sample
were generated. Thus, each rainfall data point covered an average of 59 households.
The empirical methodology involves four steps: (i) statistical matching to increase the
comparability of the treated and control groups; (ii) calculating indicators of flood exposure
using the rainfall data; (iii) estimating separate SPFs for each sub-group along with a
benchmark SMF; and (iv) analysing differences in estimated Meta-Frontier Output, TGRs and
MTE between treated and controls for the various sub-groups using t-tests.
17 The household questionnaire covers the three annual cropping seasons between 2017-18, beginning with the
Kharif II (July 2017-November 2017), Rabi (November 2017-March 2018) and the Kharif I season (March
2018-July 2018).
Ch 5. Protecting farm productivity from floods
132
The intention of the first step is to create a set of treated and control households who would
have had a similar chance of being a beneficiary of the project when it was first implemented.
Although reasonably balanced treated and control groups were obtained through the sampling
strategy, matching at the household level is used to address any remaining differences. This
matching is done using a CEM approach, which involves assigning each household to a stratum
based on a set of relevant matching variables, with continuous variables “coarsened” into
categories to facilitate the stratification (Iacus et al., 2012; Sidney et al., 2015). A treatment
household was then dropped from the sample if it was assigned to a stratum that did not contain
at least one control household, and vice versa for control households. This broader strata-based
CEM approach is preferred over PSM for two reasons: (i) assigning households to strata
requires less parameters to be set a priori (such as the number of nearest neighbours or the
matching radius) compared to pair-wise matching, leaving it less open to researcher bias (Iacus
et al., 2012); and (ii) CEM has a lower risk that households in the middle of the distribution
(i.e. those who are similar to the average household in the sample and who should be kept) are
dropped for not having a match (Sidney et al., 2015).
Based on seven categorical matching variables, a total of 217 strata were created, of which 106
contained at least one treated and one control household.18 The remaining 111 strata contained
117 treated and 99 control households who were dropped from the sample, giving a final
sample size of 1,657 households, 686 treated and 971 control. Appendix 5.A contains the
average SMD for each of the matching variables for the raw and trimmed samples. The average
SMD across the variables before trimming of 0.15 was reduced to 0.06, which is well below
the 0.1 threshold that is commonly considered as an acceptable maximum value (Austin, 2009).
18 The matching variables are: gender and education of the household head; the household’s religion and
dependency ratio; amount of land owned with a title; an index of the assets owned by the household in 2014 (based
on recall data); and geographical location (division) of the household.

Ch 5. Protecting farm productivity from floods
133
These figures suggest that the samples are well balanced and that the risk of bias in the final
analysis based on observable variables is minimal.
The second step of the methodology is to create the flood exposure variables to be used for
splitting the sample. Informed by the methods employed in past studies (see Dercon 2004;
Thiede, 2014; Asfaw et al. 2017), we first calculated how much each household’s rainfall
deviated from the sample average for their district in each monsoon month during the 12-month
questionnaire reference period.19 We then took the sum of the monthly deviations in rainfall
and assigned households to a high or low short-term exposure category if the sum of their
monthly rainfall deviation was above or below the median deviation for the sample,
respectively. We then applied the same process for each preceding year dating back to 2014
(the first year of the project), assigning households to a high or low exposure category in the
same way for each of these years. Based on this we grouped households by recurrent flood
exposure according to the number of years they were above the median rainfall deviation. If a
household was above the median rainfall deviation for more than one year, then it was assigned
to the high recurrent exposure category.
Table 5.2 presents the distribution of households according to the two definitions. There are
275 households assigned to the high short-term exposure/low recurrent exposure group, and
192 households assigned to the low short-term exposure/high recurrent exposure group. This
means that around 28 per cent of the sample have a different short-term and recurrent exposure
status, while the rest either have both high short-term and recurrent exposure (621 households,
38 per cent) or low short-term and recurrent exposure (569 households, 34 per cent). It is
important to remember when interpreting the results that the groupings are not mutually
exclusive. For instance, households with high short-term exposure are not being compared with
19 These months covered August and September 2017, and June and July 2018. District-level rainfall statistics are
from the Bangladesh Meteorological Department (2014).
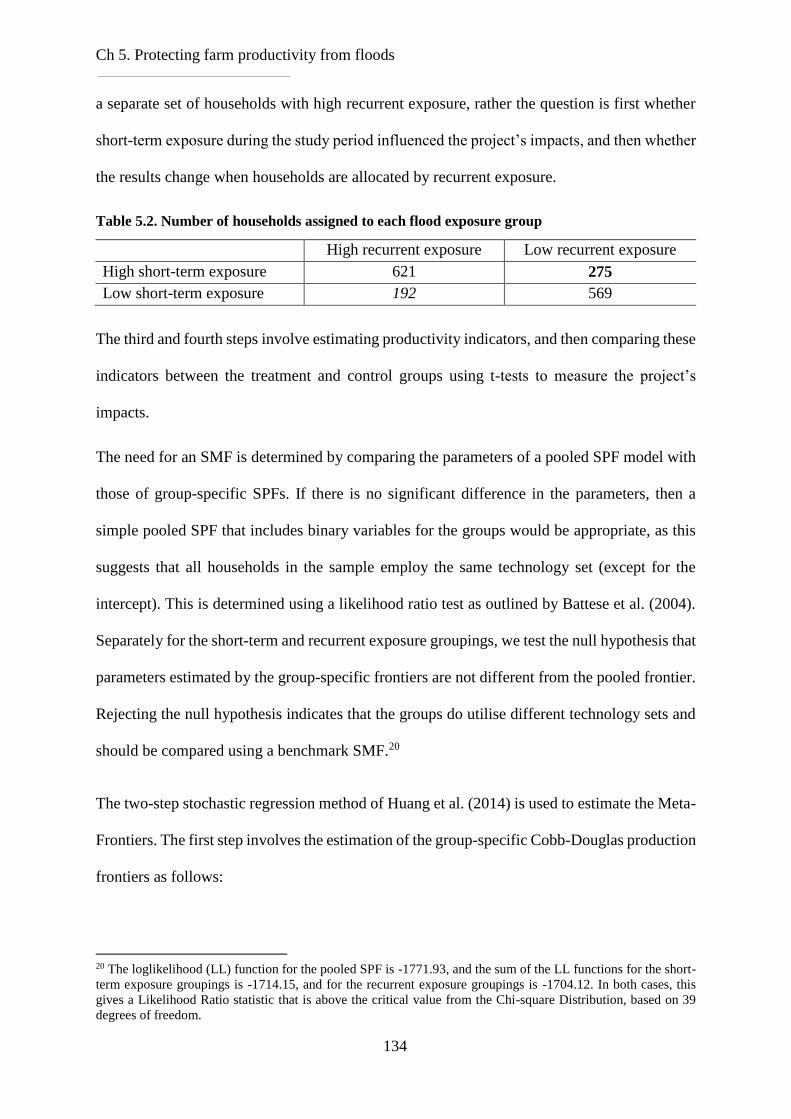
Ch 5. Protecting farm productivity from floods
134
a separate set of households with high recurrent exposure, rather the question is first whether
short-term exposure during the study period influenced the project’s impacts, and then whether
the results change when households are allocated by recurrent exposure.
Table 5.2. Number of households assigned to each flood exposure group
High recurrent exposure Low recurrent exposure
High short-term exposure 621 275
Low short-term exposure 192 569
The third and fourth steps involve estimating productivity indicators, and then comparing these
indicators between the treatment and control groups using t-tests to measure the project’s
impacts.
The need for an SMF is determined by comparing the parameters of a pooled SPF model with
those of group-specific SPFs. If there is no significant difference in the parameters, then a
simple pooled SPF that includes binary variables for the groups would be appropriate, as this
suggests that all households in the sample employ the same technology set (except for the
intercept). This is determined using a likelihood ratio test as outlined by Battese et al. (2004).
Separately for the short-term and recurrent exposure groupings, we test the null hypothesis that
parameters estimated by the group-specific frontiers are not different from the pooled frontier.
Rejecting the null hypothesis indicates that the groups do utilise different technology sets and
should be compared using a benchmark SMF.20
The two-step stochastic regression method of Huang et al. (2014) is used to estimate the Meta-
Frontiers. The first step involves the estimation of the group-specific Cobb-Douglas production
frontiers as follows:
20 The loglikelihood (LL) function for the pooled SPF is -1771.93, and the sum of the LL functions for the short-
term exposure groupings is -1714.15, and for the recurrent exposure groupings is -1704.12. In both cases, this
gives a Likelihood Ratio statistic that is above the critical value from the Chi-square Distribution, based on 39
degrees of freedom.

Ch 5. Protecting farm productivity from floods
135
ln 𝑌𝑔𝑖 = ln𝑓𝑔(𝑋𝑔𝑖) + 𝑉𝑔𝑖 − 𝑈𝑔𝑖 (5.1)
where 𝑌𝑔𝑖 is output—measured as the observed value of production based on median prices for
each crop—for household i in group g, 𝑋𝑔𝑖 is a vector of inputs applied by household i in group
g, f g is the group-specific production frontier, 𝑉𝑔𝑖 is the standard 2-sided normally distributed
error, and 𝑈𝑔𝑖 is the one-sided error denoting the inefficiency of household i in relation to its
production frontier. The one-sided error term is assumed to follow a half-normal distribution.
The evidence indicates that results are robust with respect to different distributional
assumptions, and that the half-normal is favoured because of its relative simplicity (Kumbhakar
and Lovell 2000; Coelli et al. 2005).21 The Cobb-Douglas and transcendental logarithm (or
translog) have been the two most commonly used functional forms for this type of analysis
(Bravo-Ureta et al., 2007; Ogundari, 2014). While TE results from these two forms have been
found to be very similar in different contexts (e.g., Baccouche and Kouki, 2003; Bravo-Ureta
et al., 2020c) we opt for the Cobb-Douglas because it satisfies regularity conditions imposed
by microeconomic theory globally and this is not the case for the translog (Ahmad and Bravo-
Ureta, 1996; O’Donnell, 2012; O’Donnell, 2016). The choice of inputs was based on the
literature, contextual knowledge and data availability.
The benchmark SMF is then estimated using the predicted group-specific frontier values as the
dependent variable as follows:
ln𝑓𝑔(X𝑔𝑖) = ln𝑓𝑚(X𝑔𝑖) + V𝑔𝑖𝑚 − U𝑔𝑖
𝑚 (5.2)
where f m is the SMF that envelopes the group specific frontiers, and U𝑔𝑖𝑚 denotes the gap
between the frontier of group g and the Meta-Frontier.
21 As the selection of households was random in the market areas and the intervention was not specifically targeted
within a given areas, there is no need to employ the selectivity-corrected SPF model of Greene (2010), something
confirmed by a log-likelihood test for bias from unobservables.

Ch 5. Protecting farm productivity from floods
136
The TGR is equal to a household’s estimated group-specific production frontier estimated from
Equation 5.1 (ln𝑓𝑔(Xgi)) divided by their meta-production frontier estimated from Equation
5.2 (ln𝑓𝑚(Xgi)). Once the TGR is calculated, a household’s MTE is obtained by multiplying
the TGR by the corresponding group-specific TE (e–Ugi from Equation 5.1). Thus, the MTE
takes into account the distance between each group’s individual frontier and the overall Meta-
Frontier, as well as the output shortfall for each individual relative to its own frontier. These
two steps are outlined below in equations 5.3 and 5.4:
𝑇𝐺�̂�𝑖𝑔
= ln�̂�𝑔(X𝑔𝑖)
ln�̂�𝑚(X𝑔𝑖) (5.3)
𝑀𝑇�̂�𝑖 = 𝑇𝐺�̂�𝑖 x 𝑇�̂�𝑔𝑖 (5.4)
This process of estimating group-specific SPFs and a benchmark SMF is done twice, once with
the sample divided by exposure to short-term flood exposure, and again with the sample
divided by recurrent exposure. There are four groups in each case—treated households with
high exposure, control households with high exposure, treated households with low exposure,
control households with low exposure. Hence, four production frontiers and one SMF are
estimated for the short-term exposure grouping, and the same for the recurrent exposure
grouping. The analysis thus generates two different estimates of a household’s Meta-Frontier
Output, TGR, TE and MTE according to the two exposure groupings. These values for the
groups are then compared using t-tests.
It is important to define what each of these components represent in our analysis. The TGR
reflects an outward or technological shift of a group-specific frontier, placing it closer to the
Meta-Frontier and thus increasing maximum potential output (Meta-Frontier Output). Based
on this definition, these indicators are likely to be affected by changes in access to technology
and information. TE is an indication of managerial performance with respect a group’s own

Ch 5. Protecting farm productivity from floods
137
frontier, while MTE is a summary measure that combines both the technology and the
managerial (TE) effects.
5.5 Profile of the sub-groups
Table 5.3 presents livelihood characteristics of the different sub-groups, separated by flood
exposure as explained above. Across the groups, the statistics are reflective of small-scale farm
households. They cultivate around three hectares of land with slim margins between the value
of production and inputs, and the majority of their harvest is consumed rather than sold. In this
area, rice is the predominant crop, followed by mung bean, betel nut and coconut. Details of
the cash income of the sample highlights that off-farm activities are an important complement
to agricultural production, with between 60-70 per cent of household cash income coming from
off-farm activities. Households with greater exposure to flooding produce lower harvest values
per hectare, and use less inputs. Recurrent exposure would understandably be expected to cause
more damage to livelihoods, and those with low exposure produce more per hectare, and have
higher land and input use, and cash income.

Ch 5. Protecting farm productivity from floods
138
Table 5.3. Livelihood characteristics of sample households by flood exposure
Short-term Recurrent
High exposure Low exposure High exposure Low exposure
Value of harvest ($/ha.) 521.91 571.98 522.56 566.44
Land cultivated (ha.) 3.3 2.4 2.6 3.2
Value of inputs ($/ha.) 360.13 462.43 391.19 422.45
Main crops grown
- Rice
- Mung bean
- Betel nut
- Coconut
- Khesari
- Mango
75.5
34.4
24.4
19.8
10.5
15.6
79.5
25.4
11.0
13.1
12.8
7.4
73.7
28.0
22.0
17.5
11.8
13.0
80.81
32.35
14.69
16.00
11.26
10.66
Proportion of harvest sold (%) 29.9 33.5 29.8 33.2
Proportion of sales made at a market (%) 17.3 15.0 12.3 20.1
Total cash income ($) 936.17 679.67 807.47 828.87
Observations (treated/control) 896 (280/616) 761 (406/355) 813 (279/534) 844 (407/437)
5.6 Results
5.6.1 SPF and SMF parameters by flood exposure
Tables 5.4a and 5.4b present the parameter estimates for each explanatory variable included in
the short-term and recurrent exposure groupings, respectively (see Appendix 5.B for the mean
values of the explanatory variables used in the models). The results in Tables 5.4a and 5.4b are
the basis for the productivity analysis that follows. The parameters in both tables for land,
labour, inputs and paid labour are positive and significant as expected, while expenditure on
machinery is only significant for some of the sub-groups. Being located inland, away from the
char areas, has a strong positive effect on output across the sub-groups for both the short-term
and recurrent exposure groupings. For both of the flood exposure groupings, differences in the
parameters of land ownership and crop diversity, among others, highlight the need for a
benchmark SMF. In addition, differences in the parameters for the same sub-groups (for
example, treatment with high exposure) when grouped by short-term or recurrent flood
exposure highlight the value of using two flood exposure definitions.

Ch 5. Protecting farm productivity from floods
139
The parameters for the proportion of land that is owned, crop diversity, and off-farm income
are all negative, although only significant in some cases, while in most instances the age and
education of the household head, and having received agricultural extension support, does not
seem to be influential. 22 The results for off-farm income suggest that, in this context, the
potential positive effect on farm production of greater and more stable cash income is
outweighed, potentially by a lower priority given to agriculture.
Table 5.4a. Parameters of SPFs and SMF by short-term flood exposure
High -
Treated
High -
Control
Low -
Treated
Low -
Control SMF
Constant 9.610*** 9.797*** 9.942*** 9.419*** 9.963***
Area (log) 0.355*** 0.406*** 0.440*** 0.386*** 0.413***
Labour days (log) 0.208*** 0.161*** 0.198*** 0.139*** 0.193***
Expenditure on fertiliser, pesticide and seeds (log) 0.032* 0.076*** 0.046*** 0.054*** 0.049***
Expenditure on machinery (log) 0.031* 0.021 0.037** 0.036** 0.030***
Labour that was paid (%) 0.746*** 0.479*** 0.681*** 0.447*** 0.635***
Proportion of cultivated land that is owned (%) -0.225** -0.046 -0.179** -0.266*** -0.149***
Herfindahl-Hirschman crop diversity index -0.465*** -0.233*** -0.143 -0.439*** -0.222***
Proportion of off-farm income in total income (%) -0.821*** -0.716*** -0.612*** -0.302*** -0.650***
Head above age 40 (yes/no) 0.180* 0.017 -0.072 -0.001 0.019**
Head more than four years of education (yes/no) 0.012 -0.012 0.044 0.140** 0.045***
Received agricultural extension support (yes/no) 0.108 0.165** 0.022 0.169* 0.099***
Inland (yes/no) 0.129 0.389*** 0.355*** 0.309*** 0.374***
Observations 280 616 406 355 1,657
Note: *, ** and *** indicate statistical significance at the 10, 5 and 1% levels, respectively.
22 The Herfindahl-Hirschman index has been inverted in this case for ease of interpretation, meaning that a
higher score represents greater diversification.

Ch 5. Protecting farm productivity from floods
140
Table 5.4b. Parameters of SPFs and SMF by recurrent flood exposure
High -
Treated
High -
Control
Low -
Treated
Low -
Control SMF
Constant 9.022*** 9.512*** 9.959*** 9.745*** 10.018***
Area (log) 0.384*** 0.449*** 0.450*** 0.355*** 0.416***
Labour days (log) 0.106*** 0.144*** 0.236*** 0.148*** 0.217***
Expenditure on fertiliser, pesticide and seeds (log) 0.087*** 0.076*** 0.039*** 0.061*** 0.039***
Expenditure on machinery (log) 0.031 0.039*** 0.029* 0.013 0.029***
Labour that was paid (%) 0.405*** 0.481*** 0.751*** 0.480*** 0.694***
Proportion of cultivated land that is owned (%) -0.151 -0.125** -0.168* -0.118 -0.155**
Herfindahl-Hirschman crop diversity index -0.538*** -0.200*** -0.112 -0.454*** -0.182***
Proportion of off-farm income in total income (%) -0.562*** -0.414*** -0.654*** -0.635*** -0.654***
Head above age 40 (yes/no) 0.064 0.062 0.006 -0.074 0.005
Head more than four years of education (yes/no) 0.051 0.067 0.017 0.002 0.056***
Received agricultural extension support (yes/no) 0.178 0.080 0.011 0.209** 0.101***
Inland (yes/no) 0.161 0.358*** 0.243*** 0.347*** 0.334***
Observations 279 534 407 437 1,657
Note: *, ** and *** indicate statistical significance at the 10, 5 and 1% levels, respectively.
5.6.2 Comparison of productivity indicators
Tables 5.5a and 5.5b present the t-test results for the indicators of productivity derived from
the models. Treated households with low short-term flood exposure have a significantly higher
Meta-Frontier Output compared to the control group (averaging $1,169 vs $833), and a
significantly higher MTE (52 per cent vs 49 per cent), driven by an improvement in the TGR.
For the high short-term exposure grouping, there is no significant difference in Meta-Frontier
Output or MTE between the treated and control groups, stemming from a lack of improvement
in the TGR which mitigated the positive and significant effect on TE. For the recurrent flood
exposure grouping, treated households with low exposure have a higher MTE (47 per cent vs
43 per cent), driven by a reduction in their TGR, but the difference in Meta-Frontier Output is
not significant for treated households with low or high short-term exposure. Unlike treated
households with high short-term exposure, treated households with high recurrent exposure
have a significantly higher MTE compared to the control group (51 per cent vs 47 per cent).
When households are grouped by short-term flood exposure, Meta-Frontier Output and MTE
were only improved by CCRIP in areas with low exposure, indicating that impacts were
Ch 5. Protecting farm productivity from floods
141
hindered by extreme flooding. When households are grouped by recurrent flood exposure,
however, we find that the project was able to improve MTE for those with high exposure. That
the high recurrent exposure group has the lowest average income in the sample (see Table 5.3)
implies a pro-poor impact of the project, echoing findings of the aforementioned study of a
conditional cash transfer project for climate vulnerable households in Zambia (Asfaw et al.,
2017).
The project aimed to improve access to inputs (including seeds, fertiliser, pesticides, machinery
and information), and thus Meta-Frontier Output, by establishing well-attended markets that
functioned year-round. A potential explanation for the lack of impact on input access for the
high exposure groupings is that suppliers of higher quality inputs may have needed to travel
from farther away to access these markets, having to use other roads before reaching the local
market-connecting road installed by the project, meaning that they could not reach some of the
markets more heavily affected by flooding. While positive impacts on input access were found
for an all-weather road project in India, this may be because roads were implemented on a
larger scale compared to CCRIP (Shamdasani, 2016).
The project mainly aimed to improve farm management, and thus MTE, by increasing the
potential returns from crop sales and thus incentivising and facilitating more efficient practices.
The results indicate that these objectives were achieved in areas with low short-term or
recurrent flood exposure. The project was also expected to indirectly improve MTE by
loosening liquidity constraints through enhanced off-farm income generation, but based on the
negative parameters for off-farm income in all models exhibited in Table 5.4a and 5.4b, this
potential impact pathway is not supported in this context.
The positive impact on MTE for households exposed to recurrent flooding sheds further light
on the project’s impact pathways. The implication is that, before the project, treated and control
households subjected to recurrent shocks did not have incentives to optimise their farming

Ch 5. Protecting farm productivity from floods
142
practices, or had implemented long-term risk averse coping strategies. Then, with improved
access to markets, the potential for larger and more reliable benefits from market participation
increased treated households’ incentives to improve their farm management (i.e. TE) compared
to their control counterparts. Following this reasoning, and informed by discussions with
project staff, the difference in the impacts on Meta-Frontier Output and MTE for this group
may be because, whilst suppliers of better inputs may have had to travel farther to reach project
markets, buyers of produce may have been closer, meaning they could still have accessed
project markets by the connecting road during floods.
The different MTE impacts by short-term and recurrent flood exposure also has implications
for the project’s impacts on coping strategies. The lack of impact for the high short-term
exposure grouping may have been due to control households maintaining their farming
practices in-line with treated households through unsustainable coping strategies, such as
drawing down assets. However, when households are grouped by recurrent exposure, the
impact on MTE of the treated farmers under high exposure is positive. This implies that treated
households with high recurrent exposure benefitted by avoiding detrimental coping strategies
thanks to sustained market access, causing impacts to gradually arise compared to control
households with similar exposure.
For further investigation, Graphs 1a and 1b plot the estimated MTE scores for the treated and
control households according to the number of months during which they experienced high
flood exposure between 2014 and 2018 (based on being above the median rainfall deviation
for the sample for each month). The respective trend lines show that the MTE of treated
households increases with the number of recurrent floods they faced, and that of control
households decreases. For control households, the implication is that, without market access
that can be maintained during flooding, a farmer seemingly has less incentive to produce close

Ch 5. Protecting farm productivity from floods
143
to their frontier, perhaps instead deciding to invest more in off-farm activities (shown in Tables
5.4a and 5.4b to be negatively associated with farm output).
The findings suggest that for treated households, production frontiers likely contracted in-line
with recurrent flooding, as highlighted in Table 5.5b by the higher average Meta-Frontier
Output for treated households with low recurrent exposure compared to those with high
exposure ($1,398 vs $787). Based on this, MTE might have risen gradually with recurrent
exposure as management performance improved, remained steady, or simply decreased at a
lower rate compared to Frontier Output, leading to more floods being associated with a higher
MTE. This gradual improvement echoes the findings of the previous study by Béné et al. (2020)
of a disaster mitigation project in Niger. Their study concludes that adopting positive and
avoiding detrimental coping strategies as a result of the project often produced benefits in the
mid- to long-term, meaning project impacts were not always immediately apparent.
Table 5.5a. T-tests of productivity indicators by short-term flood exposure
Meta-Frontier
Output TGR TE MTE Obs
High flood exposure
Treated mean $1,084 73.8% 68.9% 50.8% 280
Control mean $1,097 85.3% 58.9% 50.2% 616
P-Score 0.885 0.000*** 0000*** 0.471
Low flood exposure
Treated mean $1,169 91.5% 56.5% 51.7% 406
Control mean $833 73.6% 66.9% 49.1% 355
P-Score 0.000*** 0.000*** 0.000*** 0.002***
Note: *,** and *** indicate statistical significance at the 10, 5 and 1% levels, respectively.

Ch 5. Protecting farm productivity from floods
144
Table 5.5b. T-tests of productivity indicators by recurrent flood exposure
Meta-Frontier
Output TGR TE MTE Obs
High flood exposure
Treated mean $787 51.4 98.8% 50.8% 279
Control mean $895 79.6 58.8% 46.8% 534
P-Score 0.139 0.000*** 0.000*** 0.000***
Low flood exposure
Treated mean $1,398 89.3 52.4% 46.8% 407
Control mean $1,344 69.7 61.9% 43.2% 437
P-Score 0.613 0.000*** 0.000*** 0.000***
Note: *,** and *** indicate significance at the 10, 5 and 1% levels, respectively.
Graph 5.1a. Mean MTE by recurrent flood exposure:
Treated households
Graph 5.1b. Mean MTE by recurrent
flood exposure: Control households
5.7 Conclusions
Our results provide evidence that constructing flood-proof local markets and market-
connecting roads can have positive impacts on farm productivity, but that impacts differ
according to flood exposure and by productivity indicators.
The key finding of this paper is that, for beneficiaries with a high level of recurrent flood
exposure, the project helped them to better manage their farms in the face of these recurrent
shocks. The results imply that the project helped these beneficiaries to avoid detrimental coping
0%
10%
20%
30%
40%
50%
60%
70%
80%
90%
100%
0 1 2 3 4 5 6 7 8 9 10 11 12 13 14 15 16 17 18 19
MT
E (
%)
Number of months with high flood exposure
(2014-2018)
0%
10%
20%
30%
40%
50%
60%
70%
80%
90%
100%
0 1 2 3 4 5 6 7 8 9 10 11 12 13 14 15 16 17 18 19
MT
E (
%)
Number of months with high flood exposure
(2014-2018)

Ch 5. Protecting farm productivity from floods
145
strategies compared to control group households with the same level of exposure, and
incentivised farm management efforts with the prospect of more reliable returns. This incentive
may have led farmers to undertake higher risk/reward production and farm investment options
stemming from better trading conditions and information coming from improved market
access. Data constraints preclude us from investigating further the changes in coping strategies,
but the findings highlight this as a potentially fruitful area for future research. The lack of
impact on Meta-Frontier Output—a reflection of input access rather than production
incentives—for the high recurrent exposure grouping suggests input supply chains are more
vulnerable and harder to protect from recurrent shocks compared to those for outputs.
The positive effects of CCRIP on coping strategies and incentives highlight the role that climate
resilient infrastructure can play in promoting broader rural transformation in climate-affected
areas. That the sub-group with the lowest average income benefitted the most also highlights
the potential for climate resilient infrastructure projects to improve the inclusivity of rural
transformation processes and to reduce inequality and poverty.
Our finding that better access to inputs and information benefitted only those with low short-
term flood exposure confirms the potential for generally improved rural markets and market-
connecting roads to expand production possibilities. However, the lack of impact for other
groups implies that further support and planning is required to ensure that benefits can be
sustained even under higher and repeated exposure conditions, which would subsequently help
to improve the cost-effectiveness of climate-proofing the infrastructure. We also find that the
well-documented positive effect that off-farm income can have on farm productivity by easing
liquidity constraints did not occur, thus highlighting another area where complementary
support could help to augment impacts.
Based on these findings, an effective form of complementary support for future rural
infrastructure projects in similar contexts would be to take additional measures to support input

Ch 5. Protecting farm productivity from floods
146
access and liquidity. To do so, future projects could map the location of input providers and
implement strategies to ensure that they are able to access the local markets (or that producers
can access them) even under extreme weather exposure. Support could also be combined with
forecast-based cash transfers provided before flooding occurs, especially to those in high or
repeated exposure areas, an intervention that has proven successful in Bangladesh and could
ease potential liquidity constraints related to accessing key inputs (Gros et al., 2019). A study
by Afrin et al. (2017) in Bangladesh finds a positive link between financial inclusion and TE,
and given the well-documented challenges to financial inclusion among smallholders in the
country (see Anderson et al., 2016), efforts to improve access to credit, formal or mobile phone-
based bank accounts, and savings services could also be an effective means of facilitating
investments in improved inputs and other efficiency-enhancing measures.
In terms of methodological insights, the difference in the findings between Frontier Output and
TE, and between flood exposure categorisations, highlights the value of using more granular
measures of productivity and shock exposure when assessing the impacts of rural development
projects.

Ch 5. Protecting farm productivity from floods
147
Appendix 5.A: SMD of raw and trimmed samples
Raw sample Trimmed sample
Treatment
mean
Control mean SMD Treatment
mean
Control mean SMD
Land owned (ha.) 0.30 0.25 -0.12 0.25 0.23 -0.05
Female household head
(%) 6.80 10.70 0.14 6.30 5.60 -0.03
Household is muslim 83.62 93.55 0.32 94.13 95.56 0.06
Dependency ratio 60.51 66.79 0.12 59.87 65.48 0.11
Ed. of household head
(yrs) 4.27 3.92 -0.09 4.17 3.83 -0.09
Baseline asset index
score 1.22 1.15 -0.08 1.13 1.15 0.01
Average SD
(magnitude) - - 0.15 - - 0.06
Appendix 5.B: Average values of Production Frontier variables
Table 5.B.1. Average values by short-Term flood exposure
SPF Variable High flood exposure Low flood exposure
Treatment Control Treatment Control
Total value of harvest 867.65 675.67 780.23 403.15
Land cultivated (ha.) 3.66 3.12 2.99 1.81
Labour days 35.32 33.72 41.73 30.82
Expenditure on fertiliser, pesticide and seeds 48.51 55.40 56.05 56.42
Expenditure on machinery 48.35 44.91 52.75 41.18
Labour that was paid (%) 32.33 26.62 33.27 29.66
Proportion of cultivated land that is owned (%) 64.23 60.55 64.57 61.18
Crop diversity index (hhi) 0.61 0.56 0.60 0.50
Proportion of off-farm income in total income
(%) 66.88 70.79 62.50 68.62
Head above age 40 (yes/no) 75.00 71.75 78.82 80.56
Head more than four years of education
(yes/no)
38.21 43.34 52.22 43.10
Received ag. extension (y/n) 13.21 7.79 11.33 14.08
Located inland (y/n) 28.93 43.99 35.47 23.38
Observations 280 616 406 355

Ch 5. Protecting farm productivity from floods
148
Table 5.B.2. Average values by recurrent flood exposure
SPF Variable High flood exposure Low flood exposure
Treatment Control Treatment Control
Total value of harvest 694.29 452.63 899.29 726.83
Land cultivated (ha.) 3.67 1.98 2.99 3.44
Labour days 25.39 33.00 48.52 32.24
Expenditure on fertiliser, pesticide and seeds 54.90 62.83 51.66 47.14
Expenditure on machinery 38.95 46.93 59.18 39.40
Labour that was paid (%) 29.47 26.55 35.23 29.18
Proportion of cultivated land that is owned (%) 61.47 58.33 66.46 63.77
Crop diversity index (hhi) 0.54 0.54 0.65 0.53
Proportion of off-farm income in total income
(%) 73.07 74.54 58.26 64.46
Head above age 40 (%) 77.78 72.28 76.90 78.26
Head more than four years of education (%) 40.14 36.14 50.86 51.95
Received ag. extension (%) 11.11 8.05 12.78 12.59
Located inland (%) 13.62 29.96 45.95 44.39
Observations 279 534 407 437

149
Chapter 6
Conclusions

Ch 6. Conclusions
150
6.1 Summary of findings
This thesis responds to the lack of evidence on the links between improved rural infrastructure
and the various components of inclusive rural transformation. Better understanding of these
links can help to inform better policies and projects that make a larger contribution towards
meeting the SDGs by 2030. By solving challenges including unreliable access to water, other
inputs, and buyers that make farmers more risk-averse and with a lower incentive to invest in
their livelihoods, improved irrigation, roads and markets are expected to accelerate inclusive
rural transformation through various channels. This includes by enhancing agricultural
productivity and hence food security and nutrition; providing incentives and opportunities for
shifting into lucrative off-farm activities; promoting investment in assets and education thanks
to higher incomes; increasing resilience to climatic and non-climatic shocks; providing the
conditions to grow social capital; and facilitating equal social and economic inclusion of
women. Broadly, we find varying levels of support for these links, and confirm that, while
improved rural infrastructure is an important tool in promoting inclusive rural transformation,
it should be combined with other complementary support (particularly institution building) in
order to achieve balanced and sustainable impacts.
Our overarching research question asks how improved rural infrastructure impacts inclusive
rural transformation, and how impacts are influenced by contextual factors. Below we collate
the findings from the four chapters for each component of inclusive rural transformation in-
turn, before discussing the implications for the transformation process as a whole.
6.1.1 Agricultural productivity and farm income
We find that impacts on agricultural productivity differ both by the type of infrastructure and
the type of indicator. The irrigation project had a positive impact on rice yields, but in the
absence of complementary support, had limited impacts on TE of farming, while the climate

Ch 6. Conclusions
151
resilient market and road project had limited impacts on either crop or fish yields, but
improvements in TE were more commonplace.
This difference in the impacts on yields and on efficiency are reflected in the findings for farm
income. Without efficiency gains, we find varied impacts of the irrigation project on income
from crop sales, and where positive impacts are observed, this is driven by more investment
and volume, rather than increased profitability. However, we find broad-based positive impacts
on income from selling both crops and fish for the market and road project. This higher
profitability was seemingly driven by more efficient farming, combined with higher prices and
more market-oriented production (including focusing more on cash crops), due to the incentive
of better-attended markets that can be relied upon to function year-round. On the latter point,
we find that market income was improved both in the dry and monsoon season, thus confirming
the benefits of climate resilient infrastructure support. Conversely, the irrigation project,
focusing mainly on the production of one staple crop, offered limited support to increase the
vibrancy of local markets, and beneficiaries were often found to be locked into unfavourable
cash-for-harvest arrangements with local traders that offered their best option to obtain inputs
during the production phase. These arrangements also hindered the project’s efforts to foster
collective marketing among beneficiaries.
Another key finding of this thesis is the powerful impacts that all of these types of rural
infrastructure support can have on livestock production and income. Where there was an
existing market for livestock products, irrigation was found to have a large impact on livestock
production, potentially due to the irrigation also being used for grazing land and other livestock
needs, or potentially due to more reliable crop production providing an incentive for
households to increase their investment in this livelihood source. Similarly, we find that
proximity to markets had a positive impact on livestock production.
Ch 6. Conclusions
152
We identify several contextual factors that influenced impacts on farm production and income.
First we find that, while irrigation can have positive impacts on poorer households located
downstream on the irrigation canals, their income from crop sales remained constrained by
limited access to markets and inputs (which hindered their profitability). In fact, issues with
accessing farm inputs of the required type and quality was an important influence on impacts
for both case study projects. As mentioned, limited capital for inputs led some beneficiaries of
the irrigation project to enter into unfavourable marketing arrangements, while for beneficiaries
of the market and road project, some markets, while well-attended and functional, may not
have sold all the required inputs for farm production (potentially as input sellers could not reach
these remote local markets), thus influencing farmer’s ability to increase yields.
With regard to the climate resilient market and road project, our results indicate that proximity
to the improved markets was the main determining factor for the impacts on income from
selling crops, fish and livestock. However, the group located close to the market and further
from the connecting road were also poorer on average, meaning this finding may also reflect
the pro-poor impacts of the project, which is also reflected in the higher impacts on farm
income for functionally landless households.
Finally, in Chapter 5 we find that exposure to climatic shocks had an important influence on
the impact of the market and road project on crop production. Specifically, we find the highest
impacts on TE for the sub-sample of households with high exposure to recurrent climatic
shocks over the past five years. This we attribute to the project changing incentives of
households who have adapted their practices to these recurrent shocks. With the prospect of
year-round functioning markets, they were seemingly induced to loosen their long-term risk
averse coping strategies.

Ch 6. Conclusions
153
6.1.2 Income and livelihood composition
We find that impacts of rural infrastructure on total household income vary, and are not always
closely linked with impacts on income from farming. We find that irrigation can have the
largest impact on total income when it induces beneficiaries to enhance their livestock
production and off-farm activities, specifically engagement in off-farm waged employment.
Where irrigation induces beneficiaries to increase their focus on crop production, especially
for a staple crop, this can lead to them foregoing other opportunities, which may not pay-off
unless farming efficiency increases. Similarly in the case of the climate resilient market and
road project, it was only where incomes were diversified, and again where off-farm
employment increased, did we see a positive impact on total income for the full sample.
Across the infrastructure types, we find limited evidence of the projects catalysing significant
shifts in livelihood composition that are characteristic of the rural transformation process. The
main change observed both in terms of irrigation, and markets and roads, is enhancements in
livestock production and off-farm waged labour. Conversely, we see limited evidence that at
this stage the support has encouraged beneficiaries to move into lucrative forms of self-
employment, to invest in new on-farm technologies such as post-harvest processing machinery,
or to generally engage in a more diverse range of livelihood activities.
Many contextual factors seem to influence impacts on livelihood composition. We find that
irrigation can have a positive effect on enhancing incomes from livestock production and off-
farm waged employment only if existing market linkages are in place. In a project region where
connectivity to local markets was limited, we did not see these effects. Attempting to solve this
market proximity issue, the main insight from the market and road project is that the largest
impacts on livelihood compositions was for those located close to the market but further from
the connecting road, although as mentioned above this may reflect the project’s pro-poor
impacts. The results indicate a slightly higher impact for landed households on off-farm

Ch 6. Conclusions
154
employment, which could be due to limited education and skills of the functionally landless.
Where proximity to the connecting road was shown to be important, however, was in increasing
remittances, an impact that was higher for functionally landless beneficiaries.
6.1.3 Asset ownership and resilience
We find that there is not a guaranteed link between higher incomes and asset accumulation,
which has important implications for the long-term resilience of beneficiaries to climatic and
non-climatic shocks. We find that higher incomes achieved through improved irrigation led to
beneficiaries purchasing more productive assets. However, income gains through the market
and road project were not converted to more assets. This we suggest is due to the latter group
being poorer, and thus more likely to use their higher incomes for immediate needs rather than
investing in household or productive assets.
Our results confirm that building climate resilient markets and market-connecting roads can
ensure year-round market access in areas of extreme flooding, and can subsequently increase
beneficiaries’ ability to absorb and recover their livelihoods from climatic shocks. As discussed
above, we also find that building this infrastructure can especially help to increase the resilience
of farm production to recurrent climatic shocks. However, we note the risk that beneficiaries
may have remained vulnerable to non-climatic shocks due to the lack of impact on asset
accumulation. While we find a positive impact of irrigation on asset accumulation where
incomes were increased, we also note a risk that the case study project, with its focus
predominantly on rice production, may have increased vulnerability to crop-specific shocks by
inducing a narrowing on livelihoods around rice production for some households.
In terms of factors that we find to have influenced impacts in this area, it is clear that promoting
asset accumulation through rural infrastructure is more difficult for poorer households as
investing in assets for them is not a priority. From the irrigation case study we also infer that

Ch 6. Conclusions
155
existing market linkages are key to avoiding a narrowing of livelihoods and thus an increase in
vulnerability to crop-specific shocks, as discussed in the previous section.
6.1.4 Food security and nutrition
Food security and nutrition were mainly expected to have been increased thanks to better crop
production and higher incomes, as well as potentially due to better access to markets. While
rice yields were improved, our findings for the irrigation project show that impacts on nutrition
are more closely linked to changes in income. Where incomes were not increased, we find that
dietary diversity did not increase, potentially due to the project mainly focusing on enhancing
rice production. For neither of the case study projects do we find any evidence of a link between
market access and food security or nutrition. We do, however, find a link between enhanced
livestock income through improved irrigation and dietary diversity, which we find contributed
to increased consumption of meat and eggs. There is also an unexpected implication in the
Bangladesh case study that among some households increased market-orientation of farm
production may have hindered dietary diversity as the majority of crops were produced for sale
rather than home consumption, but this was not substantiated by the qualitative data.
6.1.5 Social capital
We do not find a direct link between improved irrigation infrastructure and involvement in
community groups (which is our main indicator of social capital). However, results indicate
that this infrastructure can contribute by increasing incomes, thus giving more capacity and
time to engage in these groups. We also find that strengthening IAs to manage the systems can
provide a channel for increasing beneficiaries’ involvement in community activities, especially
for women. For the market and road project, we find that proximity to the road had a strong
impact on group involvement, while being close to the market alone did not. This finding
suggests that providing an all-weather road to travel to meet others was the most important

Ch 6. Conclusions
156
impact mechanism, as opposed to having a well-attended market to meet others, or being
involved in a strengthened MMC, which did not have the same effect on social capital as the
IAs in the irrigation project. While proximity to roads was the main influencing factor for the
market and road project, for the irrigation project initial poverty levels seems to have a key
determinant, with impacts on this indicator being higher for poorer households located
downstream on the canals, which we attribute to greater involvement in IAs.
6.1.6 Education
This aspect of the rural transformation process was mainly expected to be improved through
higher incomes, as well as potentially through improved access from climate resilient rural
roads. This has proven the hardest indicator to investigate, and the main insight is perhaps that
more focused studies are required to assess impacts on education. We find that where improved
irrigation improved incomes, there is potential for increased educational enrolment. We also
find that all-weather roads may make it easier for children to attend school, but further insights
are limited given that school attendance was already high in the project area. One potential
channel through which infrastructure projects could theoretically improve educational
outcomes is by increasing efficiency of farm production, which would reduce the demand for
children to stay at home and assist on the family farm, but we find limited indication of this
mechanism in the quantitative or qualitative insights. Based on our findings, we do not uncover
any contextual factors that may have influenced impacts in this area.
6.1.7 Women’s empowerment
This is the key indicator that we use to determine the inclusiveness of the transformational
impacts achieved through the two case study projects. Regarding women’s economic inclusion,
this seems less influenced by the type of infrastructure, and more by contextual factors. In terms
of irrigation, in the areas where the support helped to spur transformational improvements in

Ch 6. Conclusions
157
livelihoods, women were also found to increase their economic inclusion. While we find
limited evidence of climate resilient markets and roads opening most channels for women’s
economic inclusion, we do find an increase in off-farm wage employment (although with
potential wage discrimination). Our qualitative analysis suggests that in Bangladesh the limited
impacts were due to restrictive social norms, especially for Muslim households.
We find stronger positive impacts in terms of women’s social capital. We find that encouraging
women’s involvement in IAs is a powerful tool for increasing women’s involvement in their
communities and building their networks. The benefits of climate resilient roads for social
capital were also found to apply particularly to women, which may also have been
complemented by the encouragement of their involvement in MMCs.
6.1.8 Implications for the overall process of inclusive rural transformation
While not achieving large-scale livelihood shifts at the point that the research was conducted,
we do find that improved rural infrastructure can help to catalyse inclusive rural transformation
processes under the right conditions. For irrigation, better water supply, and supporting
institutions, can help to increase agricultural and livestock productivity, and promote
households to invest in a more lucrative mix of on- and off-farm activities, complemented in a
virtuous cycle by improvements in assets, social capital and household nutrition. However, we
find that catalytic impacts on the transformation process can be hindered by a lack of impact
on production efficiency, and limited uptake of post-harvest technologies. This particularly
applied to households who were induced to specialise in rice production, rather than diversify,
due to connectivity constraints. This limited their income gains from specialisation, which
limited the re-investment effect that is crucial to the transformation process. This lack of re-
investment also applied to non-economic components, thus limiting the potential snowball
effect caused by the interlinkages between the components.

Ch 6. Conclusions
158
In the case of markets and roads, these were found to have catalytic impacts driven by increased
production efficiency, and sales profits, suggesting that transformational effects can be
achieved without necessarily increasing farm output. Key to this mechanism were the closer
proximity of markets that were usable year-round and supported by effective local institutions.
However the ability of the project to promote more modern and lucrative on- and, particularly,
off-farm activities for the poorest households in the project areas were limited due to a lack of
access to inputs and skills, as well as limited re-investment in asset accumulation. Our analyses
also find that more could also be done to spur transformational effects by promoting
opportunities for self-employment and waged labour, and investment in technology. Finally,
inconsistent impacts on dietary diversity, social capital and education suggest that the
transformational effect of this type of infrastructure may be slightly unbalanced and limited to
the economic sphere.
In terms of the inclusivity of the transformation process, as mentioned above, these effects are
patchy, with uneven impacts of irrigation for downstream households and women, and for
landless households and women from the market and road project. Based on this, the results
highlight the risk of promoting an unequal transformation process unless further support is
provided, as discussed further below.
While difficult to fully assess the sustainability of the impacts on the wider transformation
process, we take some insights from the impacts on income diversity and asset ownership.
Particularly for the market and road project, the lack of re-investment in assets could threaten
the sustainability of impacts by leaving beneficiaries vulnerable to shocks. Similarly for the
irrigation project, limited impacts on livelihood diversity for some households could have the
same effect. This vulnerability is important, not only for when shocks occur, but also as it may
hinder re-investment over the long-term due to higher risk aversion. Finally, sustainability of
transformational impacts may be hindered by the limited inclusivity of the impacts in some

Ch 6. Conclusions
159
cases. In particular for the market and road project, the lack of impact on the economic
inclusion of women has the scope to severely curtail the transformation process in the long-
term by limiting the economic potential of a large share of the population and hindering
efficient allocation of labour which is a key mechanism within the process.
6.2 Contributions to the literature
This thesis provides nuanced views to the existing literature, fills evidence gaps, and offers
several methodological contributions.
In terms of nuanced views, we highlight the need to delve further into the well-established
positive link between rural infrastructure and agricultural productivity. In terms of irrigation,
while confirming its strong positive impact on yields found elsewhere (see Lipton et al., 2003;
Hussain and Hanjra, 2004; Pinstrup-Andersen and Shimokawa, 2006), our Meta-Frontier
efficiency analysis highlights that impacts can be driven by increased investment and input use,
rather than increased efficiency. Existing literature often struggles to explain why higher yields
from rural development projects are not always converted into higher incomes—see for
example Gordoncillo (2012) on the impact of land reform in the Philippines or a study by the
World Bank (2008) on an irrigation project in India–and it may be that this lack of improvement
in farming efficiency (and thus profitability) is the missing link.
In terms of evidence gaps, we contribute in several areas with regard to the impact of improved
rural infrastructure. For instance, we offer scarce evidence on the impact of rural infrastructure
on social capital, where we uncover an unexpectedly strong impact of rural roads, and of
strengthened local institutions tasked to manage the infrastructure. On the understudied link
between rural infrastructure and women’s empowerment, we offer new insights on the
heterogeneous effects that this infrastructure can have on the economic and social inclusion of
women, confirming the suspicion that infrastructure may be insufficient for some indicators

Ch 6. Conclusions
160
and contexts to overcome the barriers they face (Asher and Novosad, 2016) and highlighting
the need to consider the gendered impacts of infrastructure on women in future studies. The
differential impacts we find for Muslim households reflects similar findings for a business
training programme in India (see Field et al., 2010) and should be taken into account in future
impact evaluations.
We also provide new evidence on the link between improved irrigation infrastructure and
nutrition through the mechanism of enhanced livestock production. Not only does this address
a well-known knowledge gap on how best to enhance livestock production in rural areas (Serra
et al., 2020), it also adds evidence to support the link between enhanced livestock production
and nutrition which was previously under-researched (McKune et al., 2020), with this impact
pathway between irrigation and nutrition offering a fertile area for further investigation.
Through our sub-group analyses, we also add empirical evidence to confirm the importance of
contextual factors including market connectivity and supporting institutions, that hitherto have
been largely theoretical in the literature (see Namara et al., 2010; Freguin-Gresh et al., 2012;
Starkey and Hine, 2014; FAO, 2017).
We also contribute the first known impact evaluation of a project that built both climate
resilient markets and market-connecting roads, expanding the evidence base from an exclusive
focus on all-weather roads. Our findings confirm the until-now largely theoretical assertion
that the type and package of infrastructure is important in shaping impacts (see van de Walle,
2009; Chowdhury, 2010; Hansen et al., 2011) showing that there are marginal benefits to
climate-proofing infrastructure, and that combining road and market infrastructure can magnify
impacts in some areas, while some indicators are only impacted by one of these. Also the fact
that our findings differ by proximity to the infrastructure highlights the need to consider
proximity in future impact studies, as well as the value of using GIS data in defining proximity,
building on the work of BenYishay and Tunstall (2011) among others.

Ch 6. Conclusions
161
In terms of methodological contributions, our findings in Chapters 3 and 5 highlight the value
of combining impact evaluation and SMF techniques. In both chapters our results indicate that
increased yields found in past impact evaluations may have missed underlying mechanisms for
how these improved yields were achieved (i.e through inputs input use rather than improved
farm management). Our findings also indicate that past analyses using SPF methods to
determine project impacts may have suffered from unaddressed selection bias. This highlights
the need to reconsider how we interpret the findings of these past studies.
We also offer methodological contributions in adding to the growing body of literature
employing the best-practice SMF methodology to compare the efficiency of sub-groups, which
our results show differs notably from the traditional SPF approach. In doing so we build on
rare examples from Alem et al. (2018) and Lawin and Tamini (2019). By analysing the effect
of climatic shocks temporally—and finding interesting contrasts between recurrent and one-
off shocks that are shaped by differences in coping strategies—we highlight the value of
considering different types of exposure to such shocks. In uncovering the important role of
coping strategies in shaping the impacts of projects focusing on climate change adaptation, we
highlight a key area for further investigation whereby effects on coping strategies are
investigated using datasets with a more explicit focus on household level coping strategies.
Finally, a further methodological contribution is our application of a new framework of
indicators designed to assess impacts on inclusive rural transformation. In finding that projects’
impacts on agricultural productivity, income, assets and other indicators of inclusive rural
transformation do not always go in the same direction, we show that the common practice of
focusing on projects’ impacts on agricultural production and farm income may not tell the full
story of their short- or long-term impacts. This insight likely applies to all types of rural
development project, as supported by a systematic review of evidence on land tenure projects
that also found impacts to differ considerably according to the dimension of the indicators (see

Ch 6. Conclusions
162
Higgins et al., 2018). As with the TE findings, this should be taken into account both for future
impact evaluations of rural development projects, and in interpreting the results of past studies
that apply a narrow set of indicators.
6.3 Implications for development policy and practice
Finding effective ways to foster inclusive rural transformation will be key to meeting the SDGs
by 2030, and there are several implications that we can draw from the findings to inform
ongoing policymaking and investments with this aim.
In terms of higher agricultural productivity, and subsequently profits, and our findings show
that improving rural infrastructure in isolation may not always be sufficient to activate this
mechanism within the rural transformation process consistently. Impacts on profitability, in
particular, seem often to be hindered by a lack of improvement in production efficiency, which
is a concern given the ongoing rise in land and water scarcity (USGCRP 2017; IPCC, 2019).
To increase profitability, and to promote sustainable input use amid growing scarcity, our
results point to the need for complementary support to help to improve farm management,
access to inputs, and market connectivity. Reviews of the evidence show that farm management
can potentially be improved through extension services and FFS (Kahan, 2007; Waddington et
al., 2014) and better information sharing (as discussed further below). Based on our findings,
supporting access to inputs must chiefly address supply and affordability issues, which could
be achieved by promoting linkages between local markets and broader market networks and
supply chains, and by improving access to credit on favourable terms (taking care to align
repayment schedules with agricultural seasons) (Dorward et al., 2008; Lipper et al., 2010;
Langyintuo, 2020). In terms of credit access, future rural infrastructure projects should try to
capitalise upon the wave of investments and innovations in digital technologies to improve
access to rural financial services (World Bank, 2015; IFAD, 2019c). Finally, given the high

Ch 6. Conclusions
163
profitability of agriculture thanks to better market proximity in Bangladesh, but limited profits
where connectivity was weak in the Philippines, future projects must consider during the
scoping phase the presence (or absence) of markets that are close, vibrant and with low
transport costs, and to incorporate this into the project design accordingly.
Based on our findings, promoting lucrative on- and off-farm opportunities that are
representative of a transforming rural economy must focus on finding and enhancing activities
that have existing potential. This is demonstrated most notably in the irrigation case study,
where we find that improved water supply can be very beneficial for livestock rearing, helping
income from this source to double in project areas where livestock value chains were already
developed. This indicates that the design of future infrastructure projects should be informed
by mapping of local value chains to help identify on- and off-farm activities with potential to
be enhanced through better infrastructure (Best et al., 2005). Based on the issues identified in
our case studies, complementary support to target these identified activities can then be
provided to address market information constraints, or promote connections with rural or urban
markets (Marter, 2005; FAO, 2017).
On livestock production, furthermore, future policies and projects should seek to capitalise on
the strong link that we uncover between livestock production and nutrition. As well as being a
key component in the rural transformation process (especially in the longer term), improved
nutrition is key to meeting the SDGs, and there is an ongoing push to make rural development
projects more nutrition-sensitive (McKune et al., 2020). But despite this push, the role of
livestock production has so far been largely ignored; something that was already considered as
a missed opportunity (McKune et al., 2020), and appears even more so based on our findings.
Our results highlight that any policy or project aiming to promote inclusive, balanced and
sustainable rural transformation must consider the role of local institutions. It has been
suggested that investment in building institutions to stimulate development is often under-

Ch 6. Conclusions
164
prioritised because the benefits are not immediately apparent or measurable (Natsios, 2010).
However, our results show that strengthening existing local institutions (such as IAs), or
creating new ones (such as MMCs) can enhance project impacts in the short-term by ensuring
that infrastructure built by the project is managed and maintained in a way that is equitable and
sustainable after the project is over. Projects implementing climate resilient markets should in
particular look to invest in local institutions to ensure the markets remain functional during and
after climatic shocks. Scoping for new projects should therefore include a mapping of local
institutions and their capacity and resource needs, and support to them should be incorporated
into the project design. Policies can also help in some contexts by providing more
responsibilities to these local institutions where they have the capacity and can be monitored
accordingly (Agrawal et al., 2008).
Alongside improved roads, our findings show that activities to strengthen local institutions also
seem to have a powerful effect on social capital—which could be used as a powerful
mechanism to enhance rural transformation impacts of future policies and projects. For
instance, as mentioned above, a key constraint to the impacts of rural infrastructure on
agricultural production and profitability is weak input access, and as demonstrated in a range
of contexts (see FAO, 2012c), strong local institutions and collective action can help to
overcome these challenges, particularly in terms of providing micro-lending, cost-sharing or
collective bargaining functions. These benefits could also enhance advancement into lucrative
on- and off-farm opportunities. Future projects could also leverage this link to promote
information-sharing that could help to address the lack of improvement in farm management
that also hindered the impacts of our two case study projects. Lipper et al. (2010) recommend
that local institutions be strengthened to verify seed sellers, and provide information to buyers
on their quality and use. Finally, strengthened local institutions could help to add another layer
of protection from both climatic and non-climatic shocks—the latter most notably was not

Ch 6. Conclusions
165
always strengthened in our case studies—by facilitating risk sharing and offering social
protection services (Adger, 2003).
While strengthening local institutions like IAs can help, our findings indicate that improving
the inclusivity of rural transformation through rural infrastructure requires further targeted
support to the poorest beneficiaries. This targeted support must address the input access issues
outlined above (from which they disproportionately suffer), as well as the specific barriers they
face to progressing into off-farm activities. Based on our findings, advancement into off-farm
activities for the poorest, with the help of improved infrastructure, can be enhanced with
complementary skills training and access to credit. This can encourage and facilitate the
investment of the poorest beneficiaries in activities more representative of a transforming rural
economy, whether that is increased specialisation in high output, high profitability farming, or
lucrative off-farm opportunities (Alobo Loison, 2015; FAO, 2017).
Based on our findings, increasing the economic inclusion of the poorest rural women requires
another layer of tailored support. Highlighted by our findings from public works employment
through LCS in Bangladesh, and evidenced elsewhere, women face challenges both in finding,
and in keeping employment, especially off the farm (Bezu and Barrett, 2012; Fuje, 2017;
Djurfeldt, 2018; Van den Broeck and Kilic, 2019). An effective complementary support could
be informed by BRAC’s Empowerment and Livelihood for Adolescents approach
(implemented in seven countries to date), which has proven effective at improving women’s
hard and soft skills through sessions held in a safe space environment and involving men and
other community members, thus helping to develop women’s skills as well as promoting
dialogue about the position of women in households and the community (Bandiera et al., 2018;
Arslan et al., 2019). In addition to training, the impact of future rural infrastructure projects on
women’s inclusion could be boosted by leveraging the strong link we uncover between roads,

Ch 6. Conclusions
166
institutions and women’s social capital, especially in contexts such as Bangladesh where other
channels to improve women’s economic inclusion are heavily constrained.
Finally, with regard to investing in ways to ensure that the effects of climate change do not
derail rural transformation processes, our results confirm the incremental benefits of ensuring
infrastructure is climate proof. To make these investments even more worthwhile, our results
suggest that future projects could also promote the purchase of resilience-enhancing assets,
which are key to long-term climate change adaptation (IPCC, 2014). We also find evidence
that promoting the production of a specific crop through these projects could increase the risk
of crop-specific shocks. The recommendations above for more efficient production can help to
protect farmers from these shocks in cases where increased specialisation makes sense. Where
it does not, efforts should be made during project design to avoid this specialisation by securing
access to inputs and information for producing other crops, and fostering beneficial market
linkages for a wide range of crops (Thornton et al., 2019; Kruseman et al., 2020).
6.4 Limitations of the thesis and challenges for future research
As noted in the introductory chapter, a key constraint of this research is that it is based on cross-
sectional data, with the lack of baseline data potentially hindering the ability to reliably control
for selection bias between treatment and control households. However, we have shown that
using a sophisticated sample design, and employing GIS data, can help to identify well-
matched treatment and control households who can then be treated further for selection bias
using econometric techniques. The main challenge, as with all ex-post impact evaluations, is
that we have only been able to reduce selection bias based on observable characteristics. While
robustness checks confirm that we were able to reduce selection bias on observables to a
negligible level, the risk remains of bias based on unobservables. To combat this we cross-
check the results using qualitative data, and we do not find instances where the qualitative data

Ch 6. Conclusions
167
contradicts the quantitative findings, which suggests that any bias on unobservables is unlikely
to have influenced the results. Similarly we find that results are qualitatively similar in all the
analyses when different models are applied, another indicator of the validity of the results. The
reliability of our findings is also helped by a healthy sample size in both cases – derived from
best-practice sample calculations – although we do run into sample size issues when breaking
down the sample for some of the sub-group analyses, such as for education impacts in Chapter
2 and for certain livelihood impacts in Chapter 4.
Based on the sample size issue, a key area for future research is a more focused study of the
impact of improved rural infrastructure on education. While included as an indicator in the
impact frameworks of some other rural infrastructure studies—such as Aggarwal (2018) in
India and Ring et al. (2018) in Madagascar—more evidence on impact pathways is required
given the importance of this indicator to inclusive rural transformation in the long-term (IFAD,
2016). Other insights from this thesis also warrant further investigation through focused
studies, including the promising connections between irrigation, livestock production and
nutrition; and between all types of rural infrastructure and social capital. Detailed modelling of
the influence of our case study projects on coping strategies was out of the scope of this thesis,
but our indication that climate resilient infrastructure can help to avoid negative coping
strategies should be followed-up, informed by the methodologies employed by Béné et al.
(2020) and Béné and Haque (2021) on resilience-building projects in Niger and Bangladesh,
respectively. Finally, given our research is applied to just two countries, the inclusive rural
transformation framework should be applied to rural infrastructure projects in other countries
in order to grow the evidence base and further inform policy.

168

169
References
Abadie, A., Drukker, D., Herr, J.L., Imbens, G,W. 2004. Implementing matching estimators
for average treatment effects in Stata. The Stata Journal, 4(3): 290-311
Abdul-Rahaman, A. and Abdulai, A. 2018. Do farmer Groups impact on farm yield and
efficiency of smallholder farmers? Evidence from rice farmers in Northern Ghana.
Food Policy, 81: 95-105
Abdulai, A-N. and Abdulai, A. 2017. Examining the impact of conservation agriculture on
environmental efficiency among maize farmers in Zambia. Environment and
Development Economics, 22: 177–201
Abebe, G.G. 2014. Off-farm income and technical efficiency of smallholder farmers in
Ethiopia. Publication No. 862. Uppsala, Sweden: Department of Economics, University
of Uppsala.
ADB (Asian Development Bank). 2012. Shallow tubewell irrigation in Nepal: Impacts of the
Community Groundwater Irrigation Sector Project. Manila, Philippines: ADB
. 2020. ADB support rural road network expansion in Bangladesh. Press Release.
[Online] Available at: https://www.adb.org/news/adb-supports-rural-road-network-
expansion-
bangladesh#:~:text=DHAKA%2C%20BANGLADESH%20(15%20June%202020,po
pulation%20to%20agricultural%20development%20zones.&text=The%20expanded%
20project%20will%20benefit%2040.2%20million%20inhabitants.
Adger, W.N. 2000. Social and ecological resilience: Are they related? Progress in Human
Geography, 24(3): 347-364.
Adger, W.N. 2001. Social capital and climate change. Tyndall Center for Climate Change
Research Working Paper No. 8. Norwich, UK: Tyndall Center for Climate Change
Research
Adger, W.N. 2003. Social capital collective action and adaptation to climate change.
Economic Geography, 79: 387-404
Afrin, S., Haider, M.Z. and Islam, S. 2017. Impact of financial inclusion on technical efficiency
of paddy farmers in Bangladesh. Agricultural Finance Review, 77(4): 484-505.

References
170
Aggarwal, S. 2018. Do rural roads create pathways out of poverty? Evidence from
India, Journal of Development Economics, 133: 375-395.
Agrawal, A., McSweeney, C. and Perrin, N. 2008. Mobilizing rural institutions for improving
governance and development. Social Development Notes No. 115. Washington, D.C.,
USA: World Bank
Ahmad, M. and Bravo-Ureta, B.E. 1996. Technical efficiency measures for dairy farms using
panel data: a comparison of alternative model specifications. Journal of Productivity
Analysis, 7(4): 399-415
Ahmed, S.A., Diffenbaugh, N.S. and Hertel, T.W. 2009 Climate volatility deepens poverty
vulnerability in developing countries. Environmental Research Letters, 4: 1-8.
Ahmed, S. and Nahiduzzaman, M. 2016. Impacts of rural accessibility on women
empowerment: The case of Southwest Bangladesh. Transport and Communications
Bulletin for Asia and the Pacific No. 86. Bangkok, Thailand: United Nations
Economic and Social Commission for Asia and the Pacific
Ahmed, M.H. and Melesse, K.A. 2018. Impact of off-farm activities on technical efficiency:
Evidence from maize producers of eastern Ethiopia. Agricultural and Food Economics,
6(3): 1-15
Aigner, D., Lovell, C.K. and Schmidt, P. 1977. Formulation and estimation of stochastic
frontier production models, Journal of Econometrics, 6(1): 21-37
Alem, H., Lien, G., Hardaker, J.B. and Guttormsen, A. 2018. Regional differences in technical
efficiency and technological gap of Norwegian dairy farms: A stochastic meta-frontier
model. Applied Economics, 51(4): 409-421
Alene, A.A.D. and Hassan, R.M. 2003. Measuring the impact of Ethiopia’s new extension
program on the productivity efficiency of farmers. Proceedings of the 25th International
Conference of Agricultural Economists (IAAE), 16: 613-626
Ali, A. and Yao, X. 2004. Inclusive growth for sustainable poverty reduction in developing
Asia: The enabling role of infrastructure development. Economics and Research
Department Policy Brief Series No. 27. Manila, Philippines: Asian Development Bank
Ali, R. 2011. Impact of rural road improvement on high yield variety technology adoption:
Evidence from Bangladesh. Working Paper. Maryland, USA: University of Maryland.
References
171
Alobo Loison, S. 2015. Rural livelihood diversification in Sub-Saharan Africa: A literature
review. Journal of Development Studies, 51(9): 1125-1138
Ambler, K., Doss, C.R., Kieran, C. and Passarelli, S. 2017. He says, she says: Exploring
patterns of spousal agreement in Bangladesh, Vol. 1616. Washington, D.C., USA:
International Food Policy Research Institute.
Amugsi, D.A., Lartey, A., Kimani-Murage, E., Mberu, B.U. 2016. Women's participation in
household decision-making and higher dietary diversity: Findings from nationally
representative data from Ghana. Journal of Health, Population and Nutrition, 35 (1):
1-8
Anand, A. and Khetarpal, S. 2015. Impact of climate change on agricultural productivity. In:
Bahadur B., Venkat Rajam M., Sahijram L. and Krishnamurthy K. (Eds) Plant biology
and biotechnology (pp. 729-755). New Delhi, India: Springer.
Anderson, J., Moler, A. and Kretchun, N. 2016, National survey and segmentation of
smallholder households in Bangladesh: Understanding their demand for financial,
agricultural and digital solutions. Consultive Group to Assist the Poor (CGAP)
Working Paper. Washington, D.C., USA: CGAP
Arslan, A., Higgins, D., Winters, P. and Bresciani, F. 2018. Impact assessment of the Irrigated
Rice Production Enhancement Project, Philippines. Rome, Italy: IFAD.
Arslan, A., Higgins, D. and Islam, A.H.M.S. 2019. Impact assessment report: Coastal Climate
Resilience Infrastructure Project (CCRIP), People’s Republic of Bangladesh. Rome,
Italy: IFAD.
Asadulluah, M.N. 2017. Who trusts others? Community and individual determinants of social
capital in low-income countries. Cambridge Journal of Economics, 41(2): 515-544
Asfaw, S., Handa, S. and Seidenfeld, D. 2017. Cash transfer programmes for managing climate
risk: Evidence from a randomised experiment in Zambia. Rome, Italy: FAO
Asher, S., and Novosad, P. 2016. Market access and structural transformation: Evidence
from rural roads in India. Unpublished Manuscript. Oxford, UK: University of
Oxford
Austin, P.C., 2009. Balance diagnostics for comparing the distribution of baseline covariates
between treatment groups in propensity-score matched samples. Statistics in
Medicine, 28, 3083-3107

References
172
. 2011. An introduction to Propensity Score Methods for reducing the effects of
confounding in observational studies. Multivariate Behavioural Research, 46, 399–
424
Austin, P.C. and Stuart, E.A. 2015. Moving towards best practice when using inverse
probability of treatment weighting (IPTW) using the propensity score to estimate
causal treatment effects in observational studies. Statistics in Medicine, 34: 3661-3679
Babatune, R.O. and Qaim, M. 2010. Impact of off-farm income on food security and nutrition
in Nigeria. Food Policy, 35(4): 303-311
Baccouche, R. and Kouki, M. 2003. Stochastic Production Frontier and Technical Inefficiency:
A sensitivity analysis. Econometric Reviews, 22(1): 79-91
Bäckman, S., Zahidul Islam, K.M. and Sumelius, J. 2011. Determinants of technical efficiency
of rice farms in North-Central and North-Western Regions in Bangladesh. Journal of
Developing Areas, 45(1): 73-94
Bagadion, B.U. and Korten, F.F. 1991. Developing Irrigators’ Organizations: A learning
process approach. In Cernea, M. (Eds.) Putting people first: Sociological variables in
rural development (pp. 52-90). Washington D.C., USA: World Bank
Ballard T., Kepple, A.W. and Cafiero C. 2013. The Food Insecurity Experience Scale:
Development of a global standard for monitoring hunger worldwide. Technical Paper.
Rome, Italy: FAO
Bandiera, O., Buehren, N., Burgess, R., Goldstein, M., Gulesci, S., Rasul, I. and Sulaiman,
M. 2018. Women’s Empowerment in Action: Evidence from a Randomized Control
Trial in Africa. London, UK: Economic Organization and Public Policy
Banister D. and Berechman J. 2003. Transport investment and economic development.
London, UK: Routledge.
Bangladesh Meteorological Department. 2014. Average Monsoon Rainfall, 2005-2014.
[Online] Available at: http://bmd.gov.bd/
Bashir, M.K. and Schilizzi, S. 2013. Determinants of rural household food security: a
comparative analysis of African and Asian studies. Science of Food and Agriculture,
93(6): 1251-1258

References
173
Battese, G.E. and Coelli, T.J. 1992. Frontier production functions, technical efficiency and
panel data with application to paddy farmers in India. Journal of Productivity Analysis,
3:153-169
Battese, G.E. and Coelli, T.J. 1995. A Model of Technical Inefficiency Effects in a Stochastic
Frontier Production Function for Panel Data. Empirical Economics, 20: 325-332.
Battese G.E. and Prasada Rao, D.S. 2002. Technology Gap, Efficiency, and a Stochastic
Metafrontier Function. International Journal of Business and Economics, 1: 87–93.
Battese, G.E., Prasada Rao, D.S. and O’Donnell, C.J. 2004. A Metafrontier Production
Function for estimation of technical efficiencies and technology gaps for firms
operating under different technologies. Journal of Productivity Analysis, 21(1): 91-103.
BBS (Bangladesh Bureau of Statistics). 2018. Household Income and Experience Survey 2016-
2017. [Online] Available at: https://catalog.ihsn.org/index.php/catalog/7399/related-
materials
Below, T.B. and Tscherning, K. 2012. Can farmers’ adaptation to climate change be explained
by socio-economic household-level variables? Global Environmental Change, 22(1):
223-235
Béné, C., Cannon, T., Davies, M., Newsham, A. and Tanner, T. 2014. Social protection and
climate change. OECD Development Co-operation Working Papers No. 16. Paris,
France: OECD
Béné, C., Riba, A. and Wilson, D. 2020. Impacts of resilience interventions – Evidence from a
quasi-experimental assessment in Niger. International Journal of Disaster Risk
Reduction, 43: 101390.
Béné, C. and Haque, M.A.B.M. 2021. Strengthening the resilience of vulnerable communities:
Results from a quasi-experimental impact evaluation in coastal Bangladesh. The
European Journal of Development Research (2021).
BenYishay, A. and Tunstall, R. 2011. Impact evaluation of infrastructure investments: The
experience of the Millenium Challenge Corporation. Journal of Development
Effectiveness, 3(1): 103-130
Berdegué, J.A., Rosada, T. and Bebbington, A.J. 2013. The rural transformation. In Currie-
Alder, B. et al. (Eds.) International Development: Ideas, Experience, and Prospects.
Oxford, UK: Oxford University Press.

References
174
Best, R., Ferris, S. and Schiavone, A. 2005. Building linkages and enhancing trust between
small-scale rural producers, buyers in growing markets and suppliers of critical
inputs. In Almond, F.R. and Hainsworth, S.D. (Eds.). Beyond agriculture: Making
markets work for the poor. Proceedings from an international seminar, Westminster,
London, UK, 28 February – 1st March. (pp. 19-51). Kent, UK: Natural Resources
International Limited
Bezu, S. and Barrett, C.B. 2012. Employment dynamics in the rural nonfarm sector in
Ethiopia: Do the poor have time on their side? Journal of Development Studies, 48(9):
1223-1240
Bhattarai, M., Sakthivadivel, R. and Hussain, I. 2002. Irrigation impact on income inequality
and poverty alleviation: Policy issues and options for improved management of
irrigation systems. Working Paper 39. Colombo, Sri Lanka: International Water
Management Institute.
Binswanger, H.P. 1989. The policy response of agriculture. Proceedings of the World Bank
Annual Conference on Development Economics, April 27-28, 1989, Washington D.C.,
USA.
Binswanger, H., Khandker, S.R. and Rosenzweig, M.R. 1993. How infrastructure and
financial institutions affect agricultural output and investment in India. Journal of
Development Economics, 41: 337-366
Birhanu, Z., Ambelu, A., Berhanu, N., Tesfaye, A. and Woldemichael, K. 2017. Understanding
resilience dimensions and adaptive strategies to the impact of recurrent droughts in
Borana Zone, Oromia Region, Ethiopia: A grounded theory approach. International
Journal of Environmental Research and Public Health, 14(2): 118
Blaikie, P., Cannon, T., Davis, I. and Wisner, B., 1994. At risk: Natural hazards, people’s
vulnerability and disasters. London, UK: Routledge.
Bordey, F.H., Moya, P.F., Beltran, J.C. and Dawe, D.C. (Eds). 2016. Competitiveness of
Philippine rice in Asia. Muñoz, the Philippines: Philippine Rice Research Institute
Boto, I., Fotabong, E. and Proctor, F. 2011. Major drivers for rural transformation in Africa:
Resources on rural transformation in Africa. Brussels rural development briefings No.
24. Brussels, Belgium: Africa Caribbean Pacific-European Union (ACP-EU)
Bouman, B. 2009. How much water does rice use? Rice Today, 8(1): 28-29.

References
175
Bradbury, A. 2006. Transport, mobility and social capital in developing countries. Engineering
Sustainability, 159: 79-86
Bradbury, A., Hine, J., Njenga, P., Otto, A., Muhia, G. and Willilo, S. 2017. Evaluation of the
effect of road condition on the quality of agricultural produce – Phase 2 Report.
London, UK: UK Aid
Bravo-Ureta, B.E. and Pinheiro, A.E. 1993. Efficiency analysis of developing country
agriculture: A review of the frontier function literature. Agricultural and Resource
Economics Review, 22(1): 88-101
Bravo-Ureta, B.E., Solís, D., Moreira, V., Maripani, J., Thiam, A. and Rivas, T. 2007.
Technical Efficiency in farming: A Meta-Regression analysis. Journal of Productivity
Analysis, 27: 57-72.
Bravo-Ureta, B.E., Greene, W. and Solís, D. 2012. Technical Efficiency analysis correcting for
biases from observed and unobserved variables: An application to a natural resource
management project. Empirical Economics, 43: 55-72
Bravo-Ureta, B.E. 2014. Stochastic Frontiers, productivity effects and development projects.
Economics and Business Letters, 3: 51-58
Bravo-Ureta, B.E., Jara-Rojas, R., Lachaud, M.A. and Moreira, V.H. 2017. A Meta-Analysis
of farm efficiency: Evidence from the Production Frontier literature. University of
Connecticut Zwick Center for Food and Resource Policy Research Report No. 5.
Connecticut, USA: University of Connecticut.
Bravo-Ureta, B.E., Gonzalez-Flores, M., Greene, W. and Solis, D. 2020a. Technology and
technical efficiency change: Evidence from a difference in differences selectivity
corrected Stochastic Production Frontier model. American Journal of Agricultural
Economics, 103(1): 362-385
Bravo-Ureta, B.E., Higgins, D. and Arslan, A. 2020b. Irrigation infrastructure and farm
productivity in the Philippines: A stochastic Meta-Frontier analysis. World
Development, 135: 105073
Bravo-Ureta, B.E., Moreira, V.H., Troncoso, J.L. and Wall, A. 2020c. Plot-level technical
efficiency accounting for farm-level effects: Evidence from Chilean wine grape
producers. Agricultural Economics, 51(6): 811-824

References
176
Broegaard, E., Freeman, T. and Schwensen, C. 2011. Experience from a phased mixed-
methods approach to impact evaluation of Danida support to rural transport
infrastructure in Nicaragua. Journal of Development Effectiveness, 3(1): 9-27
Brouwer, R., Akter, S., Brander, L. and Haque, E. 2007. Socioeconomic vulnerability and
adaptation to environmental risk: A case study of climate change and flooding in
Bangladesh. Risk Analysis: An International Journal, 27(2): 313-326
Bryceson, D.F., Bradbury, A. and Bradbury T. 2008. Roads to poverty reduction? Exploring
rural roads' impact on mobility in Africa and Asia. Development Policy Review,
26(4): 459-482.
Bucheli, J.R., Bohara, A.K. and Villa K. 2018. Paths to development? Rural roads and
multidimensional poverty in the hills and plains of Nepal. Journal of International
Development, 30: 430-456
BUET (Bangladesh University of Engineering and Technology). 2018. Planning and
prioritisation of rural roads in Bangladesh. Final Report – Volume 1. Dhaka,
Bangladesh: BUET
Burney, J.A., Naylor, R.L., 2012. Smallholder irrigation as a poverty alleviation tool in Sub-
Saharan Africa. World Development, 40(1), 110-123
Cameron, A.C. and P.K. Trivedi. 2005. Microeconometrics: Methods and Applications.
Cambridge, New York: Cambridge University Press
Caliendo, M. and Kopeinig, S. 2008. Some practical guidance on the implementation of
Propensity Score Matching. Journal of Economic Surveys, 22: 31–72.
Cameron, D.B., Mishra, A. and Brown, A.N. 2016. The growth of impact evaluation for
international development: How much have we learned? Journal of Development
Effectiveness, 8 (1): 1-21.
Cameron, A.C. and Miller, D.L. 2015. A practitioner's guide to cluster-robust inference.
Journal of Human Resources, 50: 317-372
Carney, D. 1998. Sustainable rural livelihoods: What contribution can we make? London, UK:
UK Department for International Development (DFID).

References
177
Carter, R., Ferdinand, T. and Chan C. 2018. Transforming agriculture for climate resilience:
A framework for systemic change. World Resources Institute Working Paper.
Washington, D.C., USA: World Resources Institute
Chapagain, A.K. and Hoekstra, A.Y. 2010. The green, blue and grey water footprint of rice
from both a production and consumption perspective. Value of Water Research Report
Series No. 40. Delft, The Netherlands: UNESCO-IHE Institute for Water Education
Chigwada, J. 2005. Case study 6: Climate proofing infrastructure and diversifying livelihoods
in Zimbabwe. IDS Bulletin, 36(4): 103-116
Chongvilian, A., Taniguchi, K. and Rabanal R. 2016. Impacts of road access on subjective
well-being in Timor-Leste. Asian Economic Journal, 30(1): 91-114
Chowdhury, S.K. 2010. Impact of infrastructures on paid work opportunities and unpaid
work burdens on rural women in Bangladesh. Journal of International
Development, 22(7): 997-1017
Christensen, K., Raihan, S., Ahsan, R., Uddin, A.M.N., Ahmed, C.S. and Wright, H. 2012.
Ensuring access for the climate vulnerable in Bangladesh: Financing Local
Adaptation. Dhaka, Bangladesh: ActionAid Bangladesh
Christiaensen, L. and Todo, Y. 2013. Poverty reduction during the rural-urban transformation:
The role of the missing middle. World Bank Policy Research Working Paper No. 6445.
Washington, D.C., USA: World Bank
Coelli, T.J., Prasada Rao, D.S., O’Donnell, C.J. and Battese, G.E. 2005. An introduction to
efficiency and productivity analysis. 2nd ed. New York, USA: Springer
Collinson, M.P. (Eds). 2000. A history of farming systems research. London, UK: FAO and
CABI.
Dadzie, S.K.N. and Acquah, H. 2012. Attitudes toward risk and coping responses: The case
of food crop farmers at Agona Duakwa in Agona East District of Ghana. International
Journal of Agriculture and Forestry, 2(2): 29-37
Darko, R.O., Yuan, S., Hong, L., Liu, J. and Yan, H. 2016. Irrigation, a productive tool for
food security – A review. Acta Agriculturae Scandanavica, Section B – Soil & Plant
Science, 66(3), 191-206

References
178
Dawe, D.C. 2006. Some Little-known facts about rice in the Philippines. In: Dawe, D.C.,
Moya, P. and Casiwan, C.B. (Eds.) Why does the Philippines import rice? Meeting the
challenge of trade liberalisation. (pp. 1-5). Los Banos, Philippines: International Rice
Research Institute.
de Fraiture, C., Molden, D. and Wichelns, D. 2010. Investing in water for food, ecosystems,
and livelihoods: An overview of the comprehensive assessment of water management
in agriculture. Agricultural Water Management, 97(4): 495-501
de la Rosa, C.J., Fiestada, J.O., Sanchez, S.M. and Mangahas, M. 2018. Stats on the state of
the regions: Land, population, population density. A PCIJ Primer. Quezon City, the
Philippines: Philippine Center for Investigative Journalism
De los Santos-Montero, L.A. and Bravo-Ureta, B.E. 2017. Productivity effects and natural
resource management: Econometric evidence from POSAF-II in Nicaragua. Natural
Resources Forum, 41: 220-233
Deere, C.D. and Doss, C.R. 2006. The gender asset gap: What do we know and why does it
matter? Feminist Economics, 12(1-2): 1-50
Delos-Reyes, M.L.F. and Schultz, B. 2018. Modernisation of national irrigation systems in the
Philippines: linking design, operation and water supply. Irrigation and Drainage,
68(1): 59-66
Dercon, S. 2004. Growth and shocks: Evidence from rural Ethiopia. Journal of Development
Economics, 74(2): 309-329.
Dercon, S. and Hoddinott, J. 2005. Livelihoods, growth and links to market towns in 15
Ethiopian villages. Food Consumption and Nutrition Division Discussion Paper 194.
Washington, D.C., USA: International Food Policy Research Institute.
Dercon, S., Gilligan, D.O., Hoddinott, J. and Woldehanna T. 2009. The impact of agricultural
extension and roads on poverty and consumption growth in fifteen Ethiopian villages.
American Journal of Agricultural Economics, 91(4): 1007-1021
Dercon, S. 2013. Agriculture and development: Revisisting the policy narratives. Agricultural
Economics, 44: 183-187
Deshpande, C., Hill, C., Di Marco V., Ergin, I. and Morgia, L. 2018. 2018 annual report on
results and impact of IFAD operations: targeting the rural poor. IFAD Issues Paper.
Rome, Italy: IFAD

References
179
Devaux, A., Torero, M., Donovan, J. and Horton D. 2018. Agricultural innovation and
inclusive value-chain development: a review. Journal of Agribusiness in Developing
and Emerging Economies, 8(1): 99-123
Devereux, S., Roelen, K., Sabates, R., Sabates-Wheeler, R., Stoelinga, D. and Dyevre, A. 2019.
Graduating from food insecurity: Evidence from graduation projects in Burundi and
Rwanda. Food Security, 11: 219-232
Dillon, A. 2011. The effect of irrigation on poverty reduction, asset accumulation, and
informal insurance: Evidence from Northern Mali. World Development, 12, 2165-
2175
Djurfeldt, A.A. 2018. Gender and rural livelihoods: Agricultural commercialization and
farm/non-farm diversification. In Djurfeldt, A.A. et al. (Eds). Agriculture,
Diversification, and Gender in Rural Africa: Longitudinal Perspectives from Six
Countries. (pp. 81-122). Oxford, UK: Oxford Scholarship
Dorward, A.R., Chirwa, E.W. and Poulton, C. 2008. Improving access to input and output
markets. Paper presented at Southern Africa Regional Conference on Agriculture:
‘Agriculture-led Development for Southern Africa: Strategic Investment Priorities for
Halving Hunger and Poverty by 2015’, Gaborone, Botswana, 8–9 December 2008
Doss, C.R. 2001. Designing agricultural technology for African women farmers: Lessons from
25 years of experience. World Development, 29(12): 2075-2092
Doungmanee, P. 2016. The nexus of agricltural water use and economic development level.
Kasetsart Journal of Social Sciences, 37: 38-45
Douven, W., Buurman, J., Beevers, L., Verheij, H., Goichot, M. Nguyen, N.A., Truong, H.T.
and Ngoc, H.M. 2012. Resistance versus resilience approaches in road planning and
design in delta areas: Mekond floodplains in Cambodia and Vietnam. Journal of
Environmental Planning and Management, 10: 1289-1310
Duflo, E. 2012. Women empowerment and economic development. Journal of Economic
Literature, 50(4): 1051-1079
Ellis, F. 1999. Rural livelihood diversity in developing countries: Evidence and policy
implications. Natural Resource Perspectives No. 40. London, UK: Overseas
Development Institute.
References
180
Ellis, F. 2000. The determinants of rural livelihood diversification in developing countries.
Journal of Agricultural Economics, 51(2), 289-302
Escobal J. and Ponce C. 2004. The benefits of rural roads: enhancing income opportunities
for the rural poor. GRADE Working Paper No.40. Lima, Peru: GRADE Working
Group
Estudillo, J.P. and Keijiro, O. 2006. Lessons from three decades of green revolution in the
Philippines. The Developing Economies, 44(2): 123-148
Estruch, E. and Grandelis, I. 2013. Promoting economic diversification and decent rural
employment towards greater resilience to food price volatility. FAO Discussion Paper.
Rome, Italy: FAO.
Evenson, R.E. and Gollin, D., 2003. Assessing the impact of the Green Revolution, 1960 to
2000. Science, 300(5620): 758-762
Fafchamps, M. and Minten, B. 2002. Returns to social network capital among traders. Oxford
Economic Papers, 54(2): 173-206.
Fan, S. and Chan-Kang, C. 2005. Road development, economic growth, and poverty
reduction in China. Research Report No. 138. Washington, D.C., USA: International
Food Policy Research Institute
FAO (Food and Agriculture Organization of the United Nations), 2010. Guidelines for
measuring household and individual dietary diversity. Rome, Italy: FAO
. 2011a. The state of food and agriculture 2011. Women in agriculture: Closing the
gender gap for development. Rome, Italy: FAO
. 2011b. The State of the World’s Land and Water Resources for Food and
Agriculture: Managing Systems at Risk. Rome, Italy: FAO.
. 2012a. Reducing child labour in agriculture through good agricultural practices:
FAO experiences. Rome, Italy: FAO.
. 2012b. Good practice in building innovative rural institutions to increase food
security: Case studies. Rome, Italy: FAO
. 2012c. World agriculture towards 2030/2050 (The 2012 Revision). Food and
Agriculture Organization of the United Nations, ESA Working Paper No. 12-03. Rome,
Italy: FAO.

References
181
. 2014. Strengthening the links between resilience and nutrition in food and
agriculture: a discussion paper. Rome, Italy: FAO
. 2017. The state of food and agriculture: Leveraging food systems for inclusive rural
transformation. Rome, Italy: FAO
. 2018a. Transforming food and agriculture to achieve the SDGs. Rome, Italy: FAO
. 2018b. The State of Food Security and Nutrition in the World: Building climate
resilience for food security and nutrition. Rome, Italy: FAO
Feder, G., Just, R.E. & Zilberman, D. 1985. Adoption of agricultural innovation in developing
countries: A survey. World Bank Staff Working Papers No. 542. Washington D.C.,
USA: World Bank
Field, E., Jayachandran, S. and Pande, R. 2010. Do traditional institutions constrain female
entrepreneurship? A field experiment on business training in India. American
Economic Review, 100(2): 125-29
Filmer, D. and Pritchett, L.H., 2001. Estimating wealth effects without expenditure data – or
tears: An application to educational enrolments in states of India. Demography, 38(1),
115-132
Fitzpatrick, D. and Compton, C. 2014. Beyond safe land: Why security of land tenure is crucial
for the Philippines' Post-Haiyan recovery. Oxfam Joint Agency Briefing Paper.
Oxford, UK: Oxfam
Freguin-Gresh, S., White, E. and Losch, B. 2012. Rural transformation and structural change:
Insights from developing countries facing globalisation. Paper prepared for the
International Farming Systems Association 2012 Symposium.
Frelih-Larsen, A., MacLeod, M., Osterburg, B., Eory, A.V., Dooley, E., Kätsch, S., Naumann,
S., Rees, B., Tarsitano, D., Topp, K., Wolff, A, Metayer, N., Molnar, A., Povellato, A.,
Bochu, J.L., Lasorella, M.V. and Longhitano, D. 2014. Mainstreaming climate change
into rural development policy post 2013: Final Report. Berlin, Germany: Ecologic
Institute
Fried H., Knox Lovell, C.A. and Schmidt, S.S. (Eds). 2008. The measurement of productive
efficiency and productivity growth. Oxford, UK: Oxford University Press

References
182
FSIN (Food Security Information Network). 2015. Measuring shocks and stressors as part of
resilience measurement. Food Security Information Network Technical Series No. 4.
Rome, Italy: FSIN
Fuje, H. 2017. How do women fare in rural non-farm economy? Policy Research Working
Paper No. 8080. Washington D.C., USA: World Bank
Fujiie, M., Hayami, Y. and Kikuchi, M. 2005. The conditions of collective action for local
commons management: The case of irrigation in the Philippines. Agricultural
Economics, 33: 179-189
Fujita, Y. 2017. Does a rural road improvement project contribute to inclusive growth? A
case study from Bangladesh. JICA-RI Working Paper. No. 138. Tokyo, Japan: JICA
Research Institute
Funk, C., Peterson, P., Landsfeld, M., Pedreros, D., Verdin, J., Shukla, S., Husak, G., Rowland,
J., Harrison, L., Hoell, A. and Michaelsen, J. 2015. The climate hazards infrared
precipitation with stations—a new environmental record for monitoring extremes.
Scientific data 2: 150066
Füssel, H-M and Klein, R.J.T. 2006. Climate change vulnerability assessments: An evolution
of conceptual thinking. Climatic Change, 75(3): 301-329
Gannon, C, and Liu, Z. 1997. Poverty and transport. TWU Working Paper. Washington,
D.C., USA: World Bank
Garbero, A. 2016. Measuring IFAD’s impact: Background paper to the IFAD9 Impact
Assessment Initiative. IFAD Research Series No. 7. Rome, Italy: IFAD.
Gautam, M. and Faruqee, R. 2016. Dynamics of growth in Bangladesh: Sustaining poverty
reduction. Washington, D.C., USA: World Bank
Gebregziabher, G., Namara, R.E. and Holden, S. 2012. Technical efficiency of irrigated and
rain-fed smallholder agriculture in Tigray, Ethiopia: A comparative Stochastic Frontier
Production Function analysis. Quarterly Journal of International Agriculture, 3: 203-
226
GED (General Economics Division of the Government of the People’s Republic of
Bangladesh). 2015. Seventh Five Year Plan FY2016-FY2020. Dhaka, Bangladesh:
GED.

References
183
Gibson, J. and Olivia, S. 2010. The effect of infrastructure access and quality on non-farm
enterprises in rural Indonesia. Department of Economics Working Paper in
Economics 17/08. Hamilton, New Zealand: University of Waikato
Godfray, C., Beddington, J., Crute, I., Haddad, L., Lawrence, D., Muir, J., Pretty, J., Robinson,
D., Thomas, S., and Toulman, C. 2010. Food security: The challenge of feeding 9
billion people. Science, 327(5967): 812-818
Gollin, D. 2014. The Lewis Model: A 60-year retrospective. Journal of Economic Perspectives,
28(3): 71–88.
González-Flores, M., Bravo-Ureta, B.E., Solís, D. and Winters, P. 2014. The impact of high
value markets on smallholder efficiency in the Ecuadorean Sierra: A Stochastic
Production Frontier approach correcting for selectivity bias. Food Policy, 44: 237–247
Gordoncillo, P.U. 2012. The economic effects of the comprehensive agrarian reform
programme in the Philippines. Journal of the International Society for Southeast
Asian Agricultural Sciences, 18(1): 76-86
Goretti, M., Kihara, D., Salgado, R.M. and Gulde, A.M. 2019. Is South Asia ready for take off?
A sustainable and inclusive growth agenda. IMF Working Paper No. 19/18.
Washington D.C., USA: IMF
Greene, W. 2008. The econometric approach to efficiency analysis. In Fried, H., Knox, C.A.
and Schmidt, S.S. (Eds.) The measurement of productive efficiency and productivity
growth (pp. 92-250). Oxford, UK: Oxford University Press
Greene, W. 2010 A Stochastic Frontier Model with correction for sample selection. Journal of
Productivity Analysis, 34: 15-24
Greene, W. 2016. LIMDEP Version 11 Reference Guide. New York, USA: Econometric
Software, Inc.
GRiSP (Global Rice Science Partnership). 2013. Rice almanac: Source book for one of the
most important economic activities on Earth (4th ed.). Manila, Philippines: International
Rice Research Institute
Gros, C., Bailey, M., Schwager, S., Hassan, A., Zingg, R., Udding, M.M., Shahjahan, M., Islan,
H., Lux, S., Jaime, C. and de Perez, E.C. 2019. Household-level effects of providing
forecast-based cash in anticipation of extreme weather events: Quasi-experimental

References
184
evidence from humanitarian interventions in the 2017 floods in Bangladesh.
International Journal of Disaster Risk Reduction, 41: 101275
Haggblade, S., Hazell, P.B.R. and Reardon, T. 2007. Transforming the rural nonfarm
economy: Opportunities and threats to the Developing World. Washington, D.C., USA:
International Food Policy Research Institute
Haider, S.J., Rahman, Q., Sarker, S.K., Ferdous, S., Uddin, S.G. and Uddin, N. 2011. Impact
evaluation study of rural infrastructure development project: Greater Mymensingh.
Dhaka, Bangladesh: Ministry of Planning, Government of the People's Republic of
Bangladesh.
Haile, B., Signorelli, S., Azzarri, C. and Johnson, T. 2018. Welfare effects of weather
variability: Multi-country evidence from Africa south of the Sahara. PloS one, 13(11):
e0206415
Hamdy, A., Abu-Zeid, M. and Lacirignola, C. 2009. Institutional capacity building for water
sector development. Water International, 23(3): 126-133
Hanjra, M.A., Ferede, T. and Gutta, D.G. 2009. Reducing poverty in sub-Saharan Africa
through investments in water and other priorities. Agricultural Water Management,
96(7), 1062-1070
Hansen, H., Winckler Andersen, O. and White, H. 2011 Impact evaluation of infrastructure
interventions. Journal of Development Effectiveness, 3(1): 1-8
Hazell, P.B. 2009. The Asian Green Revolution. Washington, D.C., USA: International Food
Policy Research Institute
Heckman, J. 1979. Sample selection bias as a specification error. Econometrica, 47: 153-161
Heckman, J.J., Ichimura, H., Smith, J. and Todd, P. 1996. Sources of selection bias in
evaluating social programs: An interpretation of conventional measures and evidence
on the effectiveness of matching as a program evaluation method. PNAS, 93(23):
13416-13420
Heinrich, C., Maffioli, A. and Vázquez, G. 2010. A primer for applying Propensity-Score
Matching. Impact-Evaluation Guidelines, Technical Notes No. IDB-TN-161.
Washington, D.C., USA: Inter-American Development Bank

References
185
Henchion, M., Hayes, M., Mullen, A.M., Fenelon, M. and Tiwari, B., 2017. Future protein
supply and demand: Strategies and factors influencing a sustainable equilibrium.
Foods, 6(7): 53
Higgins, D., T. Balint, H. Liversage and Winters, P. 2018. Investigating the impacts of
increased rural land tenure security: A systematic review of the evidence. Journal of
Rural Studies, 61: 34-62
Hill, T. and Lewicki P. 2006. Statistics: Methods and Applications: A comprehensive
reference for science, industry and data mining. Oklahoma, USA: StatSoft, Inc.
Hine, J, Abedin, M., Stevens, R., Airey, T. and Anderson, T. 2016. Does the extension of the
rural road network have a positive impact on poverty reduction and resilience for the
rural areas served? If so how, and if not why not? A systematic review. London, UK:
EPPI-Centre, Social Science Research Unit, UCL Institute of Education, University
College London.
Hine, J, Sasidharan, M., Eskandari Torbaghan, M., Burrow, M.P.N. and Usman, K. 2019.
Evidence on impact of rural roads on poverty and economic development. K4D
Helpdesk Report. Brighton, UK: Institute of Development Studies.
Hossain, M.A., Reza, M.I., Rahman, S. and Kayes, I. 2012. Climate change and its impacts on
the livelihoods of the vulnerable people in the soutwestern coastal zone in Bangladesh.
In Filho, W.L. (Eds.) Climate change and the sustainable use of water resources (pp.
237-259). Berlin, Germany: Springer.
Huang, C.J., Huang, T-H., and Liu, N-H. 2014. A new approach to estimating the Metafrontier
Production Function based on a Stochastic Frontier Framework. Journal of Productivity
Analysis, 42: 241-254
Huq, N., Hugé, J., Boon, E. and Gain, A.K. 2015. Climate change impacts in agricultural
communities in rural areas of coastal Bangladesh: A tale of many stories. Sustainability,
7: 8437-8460
Hurley, T. 2010. A review of agricultural production risk in the developing world. Harvest
Choice Working Paper 11. Washington, D.C., USA: International Food Policy
Research Institute
Hussain, I. and Hanjra, M.A. 2004. Irrigation and poverty alleviation: Review of the
empirical evidence. Irrigation and Drainage, 53: 1-15

References
186
Hussain, I. 2007. Understanding gender and diversity dimensions of irrigation management for
pro-poor interventions. Irrigation and Drainage, 56: 299-305
Iacus, S.M., King, G. and Porro, G. 2012. Causal inference without balance checking:
Coarsened exact matching. Political Analysis, 20(1): 1-24
IFAD (International Fund for Agricultural Development). 2016a. Rural Development Report
2016: Fostering Inclusive Rural Transformation. Rome, Italy: IFAD.
. 2016b. IFAD Strategic Framework 2016-2025. Rome, Italy: IFAD.
. 2018a. How inclusive rural transformation can promote sustainable and resilient
societies. Policy Brief. Rome, Italy: IFAD.
. 2018b. Climate Action Report 2018. IFAD, Rome, Italy.
. 2019a. IFAD10 impact assessment: An overview. Rome, Italy: IFAD.
. 2019b. IFAD’s climate change action report 2019. Rome, Italy: IFAD.
. 2019c. Inclusive financial services for the rural poor: Evaluation synthesis.
Rome, Italy: IFAD.
IFC (International Finance Corporation). 2003. Impact of efficient irrigation technology on
small farmers. Washington, DC, USA: IFC.
IIED (International Institute for Environment and Development). 2017. Mobility and
connectivity: Driving rural livelihood transformations in Africa. IIED Briefing March
2017. London, UK: IIED
ILO (International Labour Organisation). 2011. Local investments for climate change
adaptation: Green jobs through green works. Bangkok, Thailand: ILO Regional Office
for Asia and the Pacific
Inocencio, A.B., Ureta, C. and Baulita, A. 2016. Technical and institutional evaluation of
selected national and communal irrigation systems and characterization of irrigation
sector governance structure. Discussion Paper Series No. 2016-12. Quezon City,
Philippines: Philippine Institute for Development Studies
IPCC (Intergovernmental Panel on Climate Change). 2014. Climate Change 2014: Impacts,
adaptation, and vulnerability. Part A: Global and sectoral aspects. Contribution of
Working Group II to the Fifth Assessment Report of the Intergovernmental Panel on

References
187
Climate Change (p.1132). In: Field C., V. Barros V, D. Dokken, K. Mach, M.
Mastrandrea, T. Bilir T., et al. (Eds.) Cambridge University Press, New York, USA.
. 2019. Special report on climate change and land. Geneva, Switzerland: IPCC
Jacoby, H.G. 2000. Access to markets and the benefits of rural roads. The Economic
Journal, 110(465): 713-737
Jahnke, H.E., 1982. Livestock production systems and livestock development in tropical
Africa. Kiel, Germany: Kieler Wissenschaftersverlag Vauk
JICA (Japan International Cooperation Agency), 2012. Impact evaluation of the Bohol
Irrigation Project (Phase 2) in the Republic of the Philippines. Tokyo, Japan: JICA.
Jouanjean, M-A. 2013. Targeting infrastructure development to foster agricultural trade and
market integration in developing countries: An analytical review. ODI Report. London,
UK: Overseas Development Institute (ODI).
Kahan, D.G. 2007. Farm management extension services: A review of global experience.
Rome, Italy: FAO
Kähkönen, S. 1999. Does social capital matter in water and sanitation delivery? A review of
literature. Washington, D.C., USA: World Bank.
Kakuta, I. 2017. Success factors of participatory irrigation management: Case of the Busao
Communal Irrigation System in Bohol, Philippines. Journal of the Institute for Asian
Studies, 43: 179-2228/ncomms15900
Katungi, E.M. 2007. Social capital and technology adoption on small farms: The case of
banana production technology in Uganda. Doctoral Disseration. Pretoria, South Africa:
University of Pretoria
Kennedy, E. and Bouis, H.E. 1993. Linkages between agriculture and nutrition: Implications
for policy and research. Washington, D.C., USA: International Food Policy Research
Institute.
Kennedy, G., Ballard, T. and Dop, M. 2011. Guidelines for measuring households and
individual dietary diversity. Rome, Italy: FAO.
Khandker, S.R., Bakht, Z. and Koolwal, G.B. 2009. The poverty impact of rural roads:
Evidence from Bangladesh. Economic Development and Cultural Change, 57(4):
685-722

References
188
Khandker, S., Koolwal, G.B. and Samad, H., 2010. Handbook on impact evaluation:
Quantitative methods and practice. Washington, D.C., USA: World Bank.
Kharas, H. and Rogerson, A. 2017. Global development trends and challenges: Horizon 2025
revisited. ODI Report. London, UK: Overseas Development Institute (ODI).
Kharas, H. and McArthur, J.W. 2017. An evidence-based approach to ending rural hunger.
G20 Insights Paper. [Online] Available at: https://www.g20-insights.org/wp-
content/uploads/2017/03/An-Evidence-Based-Approach-to-Ending-Rural-Hunger.pdf
Knight, J., Weir, S. and Woldehanna, T. 2010. The role of education in facilitating risk-taking
and innovation in agriculture. Journal of Development Studies, 39(6): 1-22
Knox, J., Daccache, A. and Hess, T. 2013. What is the impact of infrastructural investments in
roads electricity and irrigation on agricultural productivity? Systematic Review. CEE
Review 11-007. London, UK: Department for International Development.
Kruseman, G., Mottaleb, K. A., Tesfaye, K., Bairagi, S., Robertson, R., Mandiaye, D., Frija,
A., Gbegbelegbe, S., Alene, A. and Prager, S. 2020. Rural transformation and the
future of cereal-based agri-food systems. Global Food Security, 26: 100441
Kumbhakar, S. and Lovell, K. 2000. Stochastic Frontier Analysis. Cambridge, New York:
Cambridge University Press
Kuppannan, P., Ramarao, R.C., Samiappan, S. and Malik, R.P.S. 2017. Estimating technical
and irrigation water productivities in rice production in Tamil Nadu, India. Irrigation
and Drainage, 66: 163-172
Kurosaki, T. 2015. Vulnerability of household consumption to floods and droughts in
developing countries: Evidence from Pakistan. Environment and Development
Economics, 20(2): 209-235
Kuwornu, J.K.M. and Owusu, E.S. 2012. Irrigation access and per capita consumption
expenditure in farm households: Evidence from Ghana. Journal of Development and
Agricultural Economics, 4(3), 78-92
Lakshmanan, T.R. 2011. The broader economic consequences of transport infrastructure
investments. Journal of Transport Geography, 19(1): 1-12
Langyintuo, A., Mwangi, W., Diallo, A. O., MacRobert, J., Dixon, J. and Bänzinger, M.
2010. Challenges of the maize seed industry in eastern and southern Africa: a

References
189
compelling case for private-public intervention to promote growth. Food Policy,
35(4): 323-331.
Lawin, K.G. and Tamini, L.D. 2019. Tenure security and farm efficiency analysis correcting
for biases from observed and unobserved variables: Evidence from Benin. Journal of
Agricultural Economics, 70(1): 116-134
Lebdi, F. 2016. Irrigation for agricultural transformation. Background Paper for the African
Transformation Report 2016: Transforming Africa's Agriculture. Accra, Ghana:
African Center for Economic Transformation
Lele, U. 1986. Women and structural transformation. Economic Development and Cultural
Change, 34(2): 195-221
Liebenehm, S., Degener, N. and Strobl, E. 2018. Rainfall shocks and risk aversion: Evidence
from Southeast Asia. TVSEP Working Paper. Hannover, Germany: Thailand Vietnam
Socio Economic Panel (TVSEP)
Lin, B.B. 2011. Resilience in agriculture through crop diversification: Adaptive management
for environmental change, BioScience, 61(3): 183-193
Lipper, L., Leigh Anderson, C. and Dalton, T. J. 2010. Seed trade in rural markets:
Implications for crop diversity and agricultural development. London, UK: Earthscan
Lipper, L., Thornton, P., Campbell, B.M., Baedeker, T., Braimoh, A., Bwalya, M., Caron, P.,
Cattaneo, A., Garrity, D., Henry, K., Hottle, R., Jackson, L., Jarvis, A., Kossam, F.,
Mann, W., McCarthy, N., Meybeck, A., Neufeldt, H., Remington, T., Sen, P.T., Sessa,
R., Shula, R., Tibu, A. and Torquebiau, E.F. 2014. Climate-smart agriculture for food
security. Nature, 4: 1068-1072
Lipton, M., Litchfield, J. and Faurès, J.M., 2003. The effects of irrigation on poverty: A
framework for analysis. Journal of Water Policy, 5: 413-427
Liverpool, L.S.O. and Winter-Nelson, A. 2010. Poverty status and the impact of social
networks on smallholder technology adoption in rural Ethiopia. IFPRI Discussion
Paper 00970. Washington D.C., USA: International Food Policy Research Institute
Lockheed, M.E., Jamison, T. and Lau, L.J. 1980. Farmer education and farm efficiency: A
survey. Economic development and cultural change, 29(1): 37-76

References
190
Lokshin, M. and Yemtsov, R. 2005. Has rural infrastructure rehabilitation in Georgia helped
the poor? The World Bank Economic Review, 19(2): 311–333
Losch, B., Freguin-Gresh, S. and White, E. 2011. Rural transformation and late developing
countries in a globalizing world: A comparative analysis of rural change. Washington,
D.C., USA: World Bank
Losch, B., Freguin-Gresh, S. and White, E. 2012. Structural transformation and rural change
revisited: Challenges for Late Developing Countries in a globalizing world. World
Bank, Washington D.C., USA
Luo, X. and Xu, X. 2018. Infrastructure, value chains, and economic upgrades. Journal of
Infrastructure, Policy and Development, 2(2): 1-15
MacMahon, A. 2017. Climate change adaptation in Southwest Bangladesh: Vulnerability and
gender and equality. Doctoral Thesis. Queensland, Australia: School of Social Science,
University of Queenland.
Magistro, J., Roberts, M., Haggblade, S., Kramer, F., Polak, P., Weight, E. and Yoder, R.
2007. A model for pro-poor wealth creation through small-plot irrigation and market
linkages. Irrigation and Drainage, 56(2-3): 321-334
Makate, C., Wang, R., Makate, M. and Mango, N. 2016. Crop diversification and livelihoods
of smallholder farmers in Zimbabwe: Adaptive management for environmental
change. Springerplus, 5(1): 1135
Makombe, G., Namara, R.E., Awulachew, S.B., Hagos, F., Ayana, M. and Kanjere, M. 2017.
An analysis of the productivity and technical efficiency of smallholder irrigation in
Ethiopia. Water SA. 43(1): 48-57
Maplecroft. 2018. Climate change vulnerability index 2018. [Online] Available at:
https://www.maplecroft.com/risk-indices/climate-change-vulnerability-index/
Marter, A. 2005. Market information needs of rural producers. In Almond, F.R. and
Hainsworth, S.D. (Eds.). Beyond agriculture: Making markets work for the poor.
Proceedings from an international seminar, Westminster, London, UK, 28 February –
1st March. (pp. 51-69). Kent, UK: Natural Resources International Limited
Mataia, A.B., Olivares, R.O., Manalili, R.G., Malasa, R.B., Litonjua, A.C., Redondo, G.O.,
Relado, R.Z., Paran, S.J. and Tolentino, C.M. 2015. Impact of Farmer Field School –

References
191
Palaycheck in the irrigated rice areas in the Philippines. Philippines Journal of Crop
Science, 40(3): 30-42
Matin, K.A. 2017. Economic growth and inequality in Bangladesh. Paper prepared for
presentation at the 20th Biennial Conference on Economics and Ethics of the
Bangladesh Economic Association, 21-23 December, Dhaka, Bangladesh.
McCarthy, N., Lipper, L. and Branca, G. 2011. Climate-smart agriculture: Smallholder
adaptation and implications for climate change adaptation and mitigation. Mitigation
of Climate Change in Agriculture Series 4. Rome, Italy: FAO.
McKune, S., Lane, J., Ouma, E., Austin-Datta, R., Williams, R., Moore, E., Jacobs, M. and
Turk, J. 2020. Making livestock research and programming more nutrition sensitive.
Global Food security, 26: 100430
McMillian, M.S. and Rodrik, D. 2011. Globalization, structural change and productivity
growth. NBER Working Paper No. 17143. Cambridge, MA, USA: NBER
Meinzen-Dick, R. and Zwarteveen, M., 1998. Gendered participation in water management:
Issues and illustrations from water users' associations in South Asia. Agriculture and
Human Values, 15(4): 337-345
Meinzen-Dick, R. 2007. Beyond panaceas in water institutions. Proceedings of the National
Academy of Sciences, 104(39): 15200-15205
Meinzen-Dick, R., Johnson, N., Quisumbing, A.R., Njuki, J., Behrman, J.A., Rubin, D.,
Peterman, A. and Waithanji, E. 2014. Chapter 5: The gender asset gap and its
implications for agricultural and rural development. In A.R. Quisumbing, A.R et al.
(Eds.) Gender in Agriculture: Glosing the knowledge gap (pp. 91-115). Dordrecht, The
Netherlands: FAO and Springer Science.
Mirza, M.M.Q. 2003. Climate change and extreme weather events: Can developing countries
adapt? Climate Policy, 3: 233-248
Mishra, A.K., Kumar, A., Joshi, P.K. and D’Souza, A. 2018. Production risks, risk preference
and contract farming: Impact on food security in India. Applied Economic
Perspectives and Policy, 40(3): 353-378
Mkanthama, J., Makombe, G., Kihoro, J., Ateka, E.M. and Kanjere, M. 2018. Technical
efficiency of rainfed and irrigated rice production in Tanzania. Irrigation and Drainage
67: 233-241.

References
192
Mohun, R. and Biswas, S. 2016. Infrastructure: A game-changer for women's economic
empowerment. Background paper for the UN Secretary-General's high-level panel on
women's economic empowerment, London, UK.
Morton, J.F. 2007. The impact of climate change on smallholder and subsistence agriculture.
Proceedings of the national academy of sciences, 104.50 (2007): 19680-19685
Mottaleb, K.A., Mohanty, S. and Nelson, A. 2015. Strengthening market linkages of farm
households in developing countries. Applied Economic Perspectives and Policy,
37(2), 226-242
Mu, R. and van de Walle, D. 2007. Rural roads and poor area development in Vietnam.
Policy Research Working Paper No. 4340. Washington, D.C., USA: World Bank
Mutambara, S., Darkoh, M.B.K. and Atlhopheng, J.R. 2016. A comparative review of water
management sustainability challenges in smallholder irrigation schemes in Africa and
Asia. Agricultural Water Management, 171: 63-72
Muthayya, S., Sugimoto, J.D., Montgomery, S. and Maberly, G. 2014. An overview of global
rice production, supply, trade, and consumption. Annals of the New York Academy of
Sciences, 1324: 7-14.
Nabi, I., Malik, A., Hattari, R., Husain, T., Shafqat, A., Anwaar, S. and Rashid, A. Economic
growth and structural change in South Asia: Miracle or mirage? Working Paper
10/0859. London, UK: London School of Economics
Namara, R.E., Hanjra, M.A., Castillo, G.E., Munk Ravnborg, H. Smith, L. and Van Koppen,
B. 2010. Agricultural water management and poverty linkages. Agricultural Water
Management, 97: 520-527
Narayan, D. and Pritchett, L. 1999. Cents and sociability: Household income and social capital
in rural Tanzania. Economic Development and Cultural Change, 47(4): 871-897
Natsios, A. 2010. The clash of the counter-bureaucracy and development. Center for Global
Development Essay. Washington D.C., USA: Center for Global Development
NEDA (National Economic Development Authority). 2017a. Philippine Development Plan
2017-2022. Manila, Philippines: NEDA.
. 2017b. Western Visayas Regional Development Plan 2017-2022. Manila, the
Philippines: NEDA

References
193
. 2017c. Northern Mindanao Regional Development Plan 2017-2022. Manila the
Philippines: NEDA
Nelson, G.C., Rosegrant, M.W., Palazzo, A., Gray, I., Ingersoll, C., Robertson, R., Tokgoz, S.,
Zhu, T., Sulser, T.B., Ringler, C., Msangi, S. and You, L. 2010. Food security, farming,
and climate change to 2050: Scenarios, results, policy options. Washington, D.C.,
USA: International Food Policy Research Institute
Nelson, G.C., Valin, H., Sands, R.D., Havlik, P., Ahammad, H., Deryng, D., Elliot, J., Fujimori,
S., Hasegawa, T., Heyhoe, E., Kyle, P., Von Lampe, M., Lotze-Campen, H., Mason
d’Croz, D., van Meijl, H., van der Mensbrugghe, D., Muller, C., Popp, A., Robertson,
R., Robinson, S., Schmid, E., Schmitz, C., Tabeau, A. and Willenbockel, D. 2014.
Climate change effects on agriculture: Economic responses to biophysical shocks.
PNAS, 111(9): 3274-3279
Nguyen, C.V., Phung, T.C. and Ta, V.K. 2017. The impact of rural road and irrigation on
household welfare: Evidence from Vietnam. International Review of Applied
Economics, 31(6): 734-753
Nguyen, T-T., Nguyen, T.T. and Grote, U. 2020. Multiple shocks and households’ choice of
coping strategies in rural Cambodia. Ecological Economics, 167: 106442
NIA (National Irrigation Administration). 2017. Status of irrigation development. [Online]
Available at : http://www.nia.gov.ph/sites/default/files/pdf_reader/CY2017_status-of-
irrigation-development.pdf
. 2020. National Irrigation Authority 2019 Year-End Report. [Online] Available at:
https://www.nia.gov.ph/?q=content/cy-2019-year-end-report
Nisbett, N., Longhurst, R., Barnett, I., Feruglio, F., Gordon, J., Hoddinott, J., Jahan, F.,
Karachiwalla, N., Roy, S., Shah, V., Siddiki, O.F., Tranchant, J-P. and White, J. 2016.
Impact evaluation of the DFID programme to accelerate improved nutrition for the
extreme poor in Bangladesh: Final report. London, UK: Department for International
Development.
Njuki, E. and Bravo-Ureta, B.E. 2018. Irrigation water use and technical efficiencies:
Accounting for technological and environmental heterogeneity in U.S. agriculture
using random parameters. Water Resources and Economics, 24: 1-12

References
194
O’Donnell, C.J., Prasada Rao, D.S. and Battese, G.E. 2008. Metafrontier frameworks for the
study of firm-level efficiencies and technology ratios. Empirical Economics, 34: 231–
255
O’Donnell, C.J. 2012. An aggregate quantity framework for measuring and decomposing
productivity change. Journal of Productivity Analysis, 38(3): 255-272
O’Donnell, C.J. 2016. Using information about technologies, markets and firm behaviour to
decompose a proper productivity index. Journal of Econometrics, 190(2): 328-340
Obwona, M. 2006. Determinants of technical efficiency differentials amongst small and
medium-scale farmers in Uganda: A case of tobacco growers. AERC Research Paper
152. Nairobi, Kenya: African Economic Research Consortium
OECD (Organisation for Economic Co-operation and Development). 2007. Promoting poor
frowth: Chapter 13. Increasing productivity and improving market access. Paris,
France: OECD.
. 2014. Guidelines for resilience systems analysis. Paris, France: OECD Publishing
. 2017. Agricultural policies in the Philippines. Paris, France: OECD Publishing.
. 2018. Climate resilient infrastructure. OECD Environment Policy Paper No. 14.
Paris, France: OECD Environment Directorate
Ogundari, K. 2014. The paradigm of agricultural efficiency and its implication on food security
in Africa: What does meta-analysis reveal? World Development, 64: 690-702
PAKISAMA (National Confederation of Small Farmers and Fishers Organizations). 2015.
Analysis of land tools in the Philippines using Gender Evaluation Criteria (GEC).
Paper prepared for presentation at the “2015 World Bank Conference on Land and
Poverty”, The World Bank – Washington DC, March 23-27, 2015.
Paltasingh, K.R. and Goyari, P. 2018. Impact of farmer education on farm productivity under
varying technologies: case of paddy growers in India. Agricultural and Food
Economics, 6(7): 1-19
Pandolfelli, L., Meinzen-Dick, R. and Dohrn, S., 2007. Gender and collective action: A
conceptual framework for analysis. CAPRi Working Paper No. 64. Washington, D.C.,
USA: CGIAR

References
195
Parvin, A. and Johnson, C. 2014. Disaster vulnerability in the policy context of Bangladesh: A
critical review. In: Leal Filho W. (Eds) Handbook of climate change adaptation. (pp.
877-899). Berlin, Germany: Springer
Paul, G.K., Sarkar, D.C., and Naznin, S. 2016. Present situation of women empowerment in
Bangladesh, International Journal of Mathematics and Statistics Invention, 4(8): 31-38
Phillips, J.M. 1994. Farmer education and farmer efficiency: A meta-analysis. Economic
Development and Cultural Change, 43(1): 149-165
Pinstrup-Andersen, P. and Shimokawa, S. 2006. Rural infrastructure and agricultural
development. Paper prepared for presentation at the Annual Bank Conference on
Development Economics, Tokyo, Japan, May 29-30, 2006
Pinstrup-Andersen, P. 2015. Food price policy in an era of market instability: A political
economy analysis. Oxford, UK: Oxford University Press
PSA (Philippines Statistics Authority). 2015. Special Report – Highlights of the 2012 census
of agriculture. Manila, Philippines: PSA.
. 2016. CountrySTAT Philippines. [Online] Available at:
https://openstat.psa.gov.ph/Featured/CountrySTAT-
Philippines#:~:text=About%20CountrySTAT%20Philippines&text=The%20CountryS
TAT%20is%20a%20web,for%20analysis%20and%20policy%20making.
Qiaolun, Y. 2006. Malaysia: Case studies on poverty exit. A case study from the 2006 special
evaluation study on pathways out of poverty and the effectiveness of poverty
targeting. Manila, Philippines: Asian Development Bank
Quisumbing, A.R. and Kumar, N. 2011. Does social capital build women's assets? The long-
term impacts of group-based and individual dissemination of agricultural technology
in Bangladesh. Journal of Development Effectiveness, 3(2): 220-242
Quisumbing, A.R., Baulch, B. and Kumar, N. 2011. Evaluating the long-term impact of anti-
poverty interventions in Bangladesh: An overview. Journal of Development
Effectiveness, 3(2): 153-174
Rahman, S. 2011. Resource use efficiency under self-selectivity: The case of Bangladeshi rice
producers. Australian Journal of Agricultural and Resource Economics 55(2): 273-290

References
196
Rahman, S. 2014. Impact of rural infrastructure on farm and non-farm enterprise choice and
income in Bangladesh. Journal of Developing Areas, 48(1): 275-290
Rahman, R.I. and Islam, R. 2019. Employment, labour force participation and education:
Towards gender equality in Bangladesh. Dhaka, Bangladesh: Centre for Development
and Employment Research.
Raitzer, D., Blöndal, N. and Sibal, J. 2019. Impact evaluation of transport interventions: A
review of the evidence. Manila, Philippines: Asian Development Bank
Reardon, T., Berdegué, J., Barrett, C.B. and Stamoulis, C. 2007. Household income
diversification into rural nonfarm activities. In Haggblade, S., Hazell, P. and Reardon,
T. (Eds.) Transforming the rural nonfarm economy: Opportunities and threats in the
developing world (pp.115-140). Baltimore, USA: Johns Hopkins University Press
Reardon, T. 2015. The hidden middle: the quiet revolution in the midstream of agrifood value
chains in developing countries. Oxford Review of Economic Policy, 31(1): 45-63
Ricepedia. 2017. Basic Statistics. [Online] Available at: http://ricepedia.org/rice-around-the-
world/asia.
Rickards, L. and Howden, S.M. 2012. Transformational adaptation: Agriculture and climate
change. Crop & Pasture Science, 63(3): 240-250
Rigg, J., Salamanca, A. and Thompson, E.C. 2016. The puzzle of East and Southeast Asia’s
persistent smallholder. Journal of Rural Studies, 43: 118-133
Ring, H., Morey, M., Kavanagh, E., Kamto, K., McCarthy, N., Brubaker, J. and
Rakotondrafara, C. 2018. Impact evaluation of the Menabe and Melaky development
programme in Madagascar. 3IE Impact Evaluation Report 74. International Initiative
for Impact Evaluation, New Delhi
Rosenbaum, P.R. and Rubin, D.B. 1985. Constructing a control group using multivariate
matched sampling methods that incorporate the Propensity Score. The American
Statistician, 39(1): 33-38
Rosenzweig, M.R. and Binswanger, H. 1993. Wealth, weather risk and the composition and
profitability of agricultural investments. The Economic Journal 103(416): 56-78.
Ruben, R. and van den Berg, M. 2001. Nonfarm employment and poverty alleviation of rural
farm households in Honduras. World Development, 29(3): 549-560

References
197
Rutstein, S.O. and Johnson, K. 2004. The DHS Wealth Index. Maryland, USA: ORC Macro
Ruttan, V.W. 1984. Integrated rural development programmes: A historical perspective. World
Development, 12(4): 393-401
Sabet, S.M. and Brown, A.N. 2018. Is impact evaluation still on the rise? The new trends in
2010-2015. Journal of Development Effectiveness, 10(3): 291-304
Sachs, J., Schmidt-Traub, G., Kroll, C., Lafortune, G., Fuller, G. and Woelm, F. 2020.
Sustainable Development Report 2020: The Sustainable Development Goals and
COVID-19. Cambridge, UK: Cambridge University Press.
Sargeson, S. and Jacka, T. 2017. Improving women's substantive representation in community
government: Evidence from Chinese villages. Development and Change, 49(5): 1166-
1194
Schipper, E.L.F. and Langston, L. 2015. A comparative overview of resilience measurement
frameworks: Analysing indicators and approaches. ODI Working Paper No. 422,
London, UK: Overseas Development Institute (ODI)
Schroeder, C., Zeller, M. and Agboh-Noameshie, A.R. 2013. Women, social capital, and
collective action—The case of NERICA rice technology in Benin. Quarterly Journal
of International Agriculture, 52(4): 329-356
Schultz, T.W. 1975. The value of the ability to deal with disequilibria. Journal of Economic
Literature, 13(3): 827–846
Searchinger, T.D., Wirsenius, S., Beringer, T. and Dumas, P. 2018. Assessing the efficiency of
changes in land use for mitigating climate change. Nature, 564: 249-253
Sekabira, H. and Nalunga, S. 2015. Farm production diversity: Is it important for dietary
diversity? Panel data evidence from Uganda. Sustainability, 12(3), 1028
Senanayake, N., Mukherji, A. and Giordano, M., 2015. Re-visiting what we know about
Irrigation Management Transfer: A review of the evidence. Agricultural Water
Management, 149: 175-186
Serra, R., Kiker, G.A., Minten, B., Valerio, V.C., Varijakshapanicker, P. and Wane, A. 2020.
Filling knowledge gaps to strengthen livestock policies in low-income countries.
Global food security, 26: 100428

References
198
Setboonsarng, S. 2008. The impact of rural infrastructure and agricultural support services
on poverty: The case of agrarian reform communities in the Philippines. ADB
Institute Discussion Paper No. 110. Tokyo, Japan: ADB Institute
Shamdasani, Y. 2018. Rural road infrastructure and agricultural production: Evidence from
India. Working Paper. Pittsburgh, USA: Department of Economics, University of
Pittsburgh
Sidney, J.A., Coberley, C., Pope, J.E. and Wells, A. 2015. Extending coarsened exact matching
to multiple cohorts: An application to longitudinal well-being program evaluation
within an employer population. Health Services and Outcomes Research Methodology,
15: 136-156
Sieber, N. and Allen, H. 2016. Impacts of rural roads on poverty and equity. Transport and
Communications Bulletin for Asia and the Pacific. No. 86. Bangkok, Thailand:
United Nations Economic and Social Commission for Asia and the Pacific
Sipiläinen, T. and Lansink, A. 2005. Learning in organic farming – An application on Finnish
dairy farms. Paper Presented at the XIth Congress of the European Association of
Agricultural Economists, Copenhagen, Denmark, August 24–27
Slater, R. and McCord, A. 2009. Social protection, rural development and food security:
Issues paper on the role of social protection in rural development. ODI Issues Paper.
London, UK: Overseas Development Institute (ODI)
Slavchevska, V., Kaaria, S. and Taivalmaa, S-L. 2016. Feminization of agriculture in the
context of rural transformations: What is the evidence? Washington, D.C., USA: World
Bank.
Smit, B and Pilifosova, O. 2001. Adaptation to climate change in the context of sustainable
development and equity. In McCarthy, J.J. et al. (Eds.) TAR climate change 2001:
Impacts, adaptation and vulnerability (pp. 879-912). Cambridge, UK: Cambridge
University Press.
Smit, B. and Skinner, M.W. 2002. Adaptation options in agriculture to climate change: A
typology. Mitigation and Adaptation Strategies for Global Change, 7: 85-114
Smit, B. and Wandel, J. 2006. Adaptation, adaptive capacity and vulnerability. Global
Environmental Change, 16: 282-292

References
199
Smith, L.E.D., 2004. Assessment of the contribution of irrigation to poverty reduction and
sustainable livelihoods. Water Resources Development, 20(2): 243-257
Smith, L.C. and Frankenberger, T.R. 2018. Does resilience capacity reduce the negative impact
of shocks on household food security? Evidence from the 2014 floods in northern
Bangladesh. World Development, 102: 358-376
Starkey, P. and Hine, J. 2014. Poverty and sustainable transport: How transport affects poor
people with policy implications for poverty reduction. London, UK: Overseas
Development Institute
Steiner, R.A. and Walter, M.F. 1992. The effect of allocation and scheduling rules on equity
and productivity in irrigation systems. Agricultural Water Management, 21(4): 297-
312
Strauss, J. 1986. Does better nutrition raise farm productivity? Journal of Political Economy,
94(2): 297-320.
Suri, T. 2011. Selection and comparative advantage in technology adoption. Econometrica,
79(1): 159-209
Svodziwa, M. 2018. Rural diversification strategies in promoting structural transformation in
Zimbabwe. Sciendo, HSS VII.2(2018): 123-138
Swinnen, J. 2007. Global supply chains, standard and the poor: How the globalization of food
systems and standards affects rural development and poverty. Oxon, UK: CAB
International.
Takayama, T., Matsuda, H. and Nakatani, T. 2018. The determinants of collective action in
irrigation management systems: Evidence from rural communities in Japan.
Agricultural Water Management¸206: 113-123
Tanner, T., Bahadur, A. and Moench, M. 2017. Challenges for resilience policy and practice.
ODI Working Paper 519. London, UK: Overseas Development Institute (ODI)
Taylor, J.E., Zezza, A. and Gurkan, A.A. 2009. Rural poverty and markets. ESA Working
Paper No. 09-05. Rome, Italy: IFAD.
Thiede, B.C. 2014. Rainfall shocks and within-community wealth inequality: Evidence from
rural Ethiopia. World Development, 64: 181-193

References
200
Thornton, P.K., Loboguerrero, A.M., Campbell, B.M., Kavikumar, K.S., Mercado, L. and
Shackleton, S. 2019. Rural livelihoods, food security and rural transformation under
climate change. Background paper. Rotterdam and Washington, D.C. Research
Programe on Climate Change, Agriculture and Food Security
Timmer, C.P. 2009. A world without agriculture: The structural transformation in historical
perspective. Washington, D.C. USA: The American Enterprise Institute Press
Tiwasing, P., Dawson, P. and Garrod, G. 2019. The relationship between micronutrient intake
and labour productivity: Evidence from rice-farming households in Thailand. Outlook
on Agriculture, 48(1): 58-65
Trivelli, C., Vargas, S. and Clausen, J. 2017. Social protection and inclusive rural
transformation. IFAD Research Series Paper No. 9. Rome, Italy: IFAD
Ulimwengu, J.M., Liverpool-Tasie, L.S., Randriamamonjy, J. and Ramadan, R. 2011.
Understanding the linkage between agricultural productivity and nutrient
consumption. IFPRI Discussion Paper 1128. Washington, D.C., USA: International
Food Policy Research Institute (IFPRI).
UN (United Nations). 2016. Global sustainable development report 2016. New York, USA:
Department of Economic and Social Affairs
. 2019. The Sustainable Development Goals report 2019. New York, USA:
Department of Economic and Social Affairs
UNCTAD (United Nations Conference on Trade and Development), 2014. World Investment
Report 2020. Geneva, Switzerland: UNCTAD
Uphoff, N. and Wijayaratna, C.M. 2000. Demonstrated benefits from social capital: The
productivity of farmer organisation in Gal Oya, Sri Lanka. World Development, 28(11):
1875-1890
USGCRP (U.S Global Change Research Program). 2017. Climate Science Special Report:
Fourth National Climate Assessment, Volume 1. Washington, D.C., USA: USGCRP.
van de Walle D. 2009. Impact evaluation of rural road projects. Journal of Development
Effectiveness, 1(1): 15-36
Van den Broeck, G. and Kilic, T. 2019. Dynamics of off-farm employment in Sub-Saharan
Africa: A gender perspective. World Development, 119: 81-99

References
201
Verbeek, J. and Dill, A. 2017. The forgotten dimension of the SDG indicators – Social capital.
Blog Post. [Online] Available at: https://blogs.worldbank.org/voices/forgotten-
dimension-sdg-indicators-social-capital
Villano, R., Bravo-Ureta, B.E., Solís, D. and Fleming, E. 2015. Modern rice technologies and
productivity in the Philippines: Disentangling technology from managerial gaps.
Journal of Agricultural Economics, 66: 129–154
Waddington, H., Snilstveit, B., Hombrados, J., Vojtkova, M., Phillips, D., Davies, P. and
White, H. 2014. Farmer field schools for improving farming practices and farmer
outcomes: A systematic review. Campbell Systematic Reviews, 10(1), i-335
WFP (World Food Programme). 2017. Food security and nutrition in the Philippines. Strategic
Review. Rome, Italy: WFP.
Wheeler, T. and von Braun, J. 2013. Climate change impacts on global food security. Science,
341: 508-513
Wiggins, S. and Keats, S. 2014. Rural wages in Asia. London, UK: Overseas Development
Institute
Winters, P., Davis, B., Carletto, G., Covarrubias, K., Quiñones, E.J., Zezza, A., Azzarri, C. and
Stamoulis, K. 2009. Assets, activities and rural income generation: Evidence from a
multicountry analysis. World Development, 37(9): 1435-1452
Winters, P., Salazar, L. and Maffioli, A. 2010. Designing impact evaluations for agricultural
projects. IDB Technical Notes No. IDB-TN-198. Washington, D.C., USA: Inter-
American Development Bank. (IDB)
Winters, L.A. 2014. Globalization, infrastructure, and inclusive growth. ADBI Working
Papers No. 464, ADB Institute, Manila, Philippines.
Wollni, M. and Brümmer, B. 2012. Productive efficiency of specialty and conventional coffee
farmers in Costa Rica: Accounting for technological heterogeneity and self-selection.
Food Policy, 37: 67-76
Wondemu, K. and Weiss, J. 2012. Rural roads and development: Evidence from Ethiopia.
European Journal of Transport and Infrastructure Research, 12(4): 417-439
Woolcock, M. and Narayan. D. 2000. Social capital: Implications for development theory,
research, and policy. World Bank Research Observer, 15(2): 225-249

References
202
Wooldridge, J.M. 2010. Econometric analysis of cross section and panel data. 2nd Edition.
Cambridge, USA: MIT Press
World Bank. 1994. World Development Report 1994: Infrastructure for Development.
Washington, D.C., USA: World Bank.
. 2001. Engendering development: Through gender equality in rights, resources, and
voice. New York, USA and Oxford, UK: Oxford University Press and World Bank
. 2007. Data for impact evaluations. Doing Impact Evaluation No. 6. Washington,
D.C., USA: World Bank.
. 2008a. World development report 2008: Agriculture for Development. Washington,
D.C., USA: World Bank
. 2008b. An impact evaluation of India's Second and Third Andhra Pradesh
Irrigation Projects: A case of poverty reduction with low economic returns.
Washington, D.C, USA: World Bank
. 2011. Impact evaluations in agriculture: An assessment of the evidence.
Washington, DC., USA: World Bank Independent Evaluation Group
. 2012. World development Report 2012: Gender equality and Development.
Washington, D.C., USA: World Bank
. 2013. Building resilience: Integrating climate and disaster risk into development.
Washington, D.C., USA: World Bank.
. 2015. Financial inclusion: A foothold on the ladder toward prosperity: An
evaluation of World Bank Group support for financial inclusion for low-income
households and microenterprises. Washington, D.C., USA: World Bank Group.
. 2017. West Africa Sahel Irrigation Initiative Support Project. World Bank Project
Appraisal Document Report No: 1870. Washington, D.C., USA: World Bank.
. 2019. World Bank Open Data. [Online] Available at: https://data.worldbank.org/
Xie, H., You, L., Wielgosz, B. and Ringler, C., 2014. Estimating the potential for expanding
smallholder irrigation in Sub-Saharan Africa. Agricultural Water Management, 131(1):
183-193
Yao, R.T. and G.E. Shively. 2007. Technical change and productive efficiency: Irrigated rice
in the Philippines. Asian Economic Journal, 21(2): 155–168

References
203
Yesuf, M. and Bluffstone, R.A. 2009. Poverty, risk aversion and path dependence in low-
income countries: Experimental evidence from Ethiopia. American Journal of
Agricultural Economics, 91(4): 1022-1037
Zezza, A., Winters, P., Davis, B., Carletto, G., Covarrubias, K., Tasciotti, L. and Quiñones, E.
2011. Rural household access to assets and markets: A cross-country comparison. The
European Journal of Development Research, 23: 569-597
Zhang, Y. and Wan, G. 2006. The impact of growth and inequality on rural poverty in China.
Journal of Comparative Economics, 34(4): 694-712
Ziervogel, G. and Ericksen, P.J. 2010. Adapting to climate change to sustain food security.
Wiley Interdisciplinary Reviews: Climate Change, 1(4): 525-540

204
205
Summary
Finding effective ways to foster inclusive rural transformation in developing countries is key
to achieving the Sustainable Development Goals. Improving rural infrastructure has the
potential to impact the transformation process in many ways, including by enhancing
agricultural productivity, off-farm activities, asset accumulation, resilience, food security and
nutrition, social capital, and investments in education. It also has the potential to improve the
inclusion of women and other marginalised groups in the transformation process. Aiming to
fill evidence gaps and to inform policy, we test these potential impact pathways using two rural
infrastructure projects in Bangladesh and the Philippines. In order to draw more nuanced policy
implications, we particularly focus on the contextual factors that may have influenced the
impacts of the projects.
The first two chapters are focused on the Irrigated Rice Production Enhancement Project
(IRPEP) in the Philippines. Implemented by the International Fund for Agricultural
Development (IFAD), the project aimed to improve canal irrigation systems for smallholder
rice farmers, as well as building the capacity of local Irrigators’ Associations to manage them.
The next two chapters are focused on the impact of the Coastal Climate Resilience
Infrastructure Project (CCRIP) in southwest Bangladesh. Also implemented by IFAD, this
project built and improved small rural markets and market-connecting roads to make them
usable year-round, including during seasonal flooding, and also built the capacity of local
Market Management Committees to ensure markets are managed sustainably.
Sets of quantitative and qualitative data were collected for each of the projects. The quantitative
datasets consist of both beneficiary and control households, and the samples were designed in
order to ensure that, for each project, these two groups of households were comparable, with a
low risk of selection bias that could distort the impact estimates.

Summary
206
In Chapter 1 we analyse the impact of IRPEP using a framework of inclusive rural
transformation indicators and a statistical matching analysis to compare treated and control
households. While we find strong positive impacts on rice yields, we find that impacts on other
aspects of the transformation process were heavily influenced by market access and whether
the local economy was structured to support lucrative livelihood diversification. Where this
was the case, we find a particularly strong link between improved irrigation and livestock
production. While poorer downstream farmers benefitted in terms of better yields, broader
transformational impacts for this group were curtailed by limited access to inputs and markets.
Finally, we find that strengthening Irrigators’ Associations was particularly effective in
promoting women’s inclusion and equitable water use along the canals.
In Chapter 2 we further explore the impacts of IRPEP on agricultural productivity, using a
Stochastic Meta-Frontier approach, combined with impact evaluation techniques, to assess how
the project affected the Technical Efficiency and Frontier Output of beneficiaries at the parcel
level. Broadly, we find a strong impact on Frontier Output, suggesting that improved irrigation
technology helped to increase production potential, but this was coupled with limited impacts
on Technical Efficiency, suggesting that farm management was not improved, highlighting the
need for more support in this area in future projects. Analyses for various sub-groups suggest
that the project had a pro-poor impact, potentially enhanced by the role of the Irrigators’
Associations in promoting more equitable water use.
Similar to Chapter 1, in Chapter 3 we apply a framework of inclusive rural transformation
indicators to assess the impact of CCRIP using a similar statistical matching approach. We find
that the project had limited impacts on agricultural production, potentially as beneficiaries were
unable to afford the required inputs, but thanks to higher prices and a higher proportion of
harvests being sold, agricultural income increased substantially. That this income effect applied
to both the dry and monsoon season indicates that the flood-proofing of the market and road

Summary
207
infrastructure served its purpose, for which the role of the Market Management Committees
was reported to be crucial. Impacts on income and livelihood diversification were mixed, and
while the poorest sub-group experienced the highest impact on total income, advancements
into some off-farm livelihood activities may have been hindered by limited education and skills
for this group. Other key findings include a strong impact on social capital driven by the
improved roads, but limited re-investment of income into assets, leading to concerns about
resilience to shocks in the future. The impact on social capital was especially pronounced for
women, but we find limited impacts on their economic inclusion due to restrictive social norms.
Similar to Chapter 2, in Chapter 4 we conduct a more granular analysis of the impacts of CCRIP
on agricultural productivity using a Stochastic Meta-Frontier impact evaluation approach. We
find that Frontier Output was only improved for those with low exposure to floods, implying
that the impact of climate-resilient infrastructure on production potential—expected to be
achieved by improving access to inputs—may have continued to be hindered by flooding. We
also find that Technical Efficiency increased only for those exposed to recurrent floods over
time, indicating that, compared to the control group, these beneficiaries were able to
consistently avoid reverting to coping strategies that hindered their farm management in the
face of these recurrent shocks.
The concluding chapter summarises the findings for the various components of inclusion rural
transformation and draws implications for the impacts of the two projects on the overall
transformation process. We note that irrigation can be very effective at advancing both the
economic and social aspects of the transformation process in project areas with strong market
access and a conducive local economy. Climate resilient markets and roads, on the other hand,
mainly contributed to the economic aspects of the transformation process (with the exception
of social capital), which were achieved with limited impacts on agricultural production, which
is the historic driver of the transformation process. In the case of both projects, the

Summary
208
strengthening of local institutions to manage the infrastructure played a key role in their
impacts, especially in promoting inclusion of women and the poorest households, although
overall impacts on the economic and social inclusion of these marginalised groups was patchy,
which may have implications for the sustainability of the transformational progress catalysed
through the projects.
In the concluding chapter we also offer some implications for the literature and for
development policy and practice. For the literature we highlight the need to go beyond
analysing impacts on crop yields when assessing the impacts of rural development projects, as
well as highlighting the value of combining Stochastic Meta-Frontier and impact evaluation
techniques. Links between improved rural infrastructure and livestock production, and impacts
on coping strategies, are noted as interesting areas for future research. In terms of development
policy and practice, among other points, we highlight the need to leverage the value of local
institutions in enhancing the impact of rural development projects, and to map pre-existing
market access and account for this in project design.

209
Acknowledgements
This thesis would not have been possible without the support of Prof. Paul Winters, who helped
me to set up an arrangement with IFAD to carry out this PhD programme as an external
candidate, and offered lots of advice along the way. I am very grateful to him and the institution
for allowing me this flexibility, and to the many IFAD staff who supported the research projects
in Bangladesh and the Philippines upon which this thesis is based. I am also very grateful to
IFAD for allowing me to use the data from the two countries. I would also like to acknowledge
my supervisor, Prof. Ruerd Ruben, who has been a constant source of support and advice
during this process, and Prof. Boris Bravo-Ureta, who was a pivotal collaborator in this project.
Finally, I offer my huge gratitude to the rural women and men in Bangladesh and the
Philippines who gave us their time for the surveys.