economic science for rural development - LLUFB
211
-
Upload
khangminh22 -
Category
Documents
-
view
4 -
download
0
Transcript of economic science for rural development - LLUFB

1
Economic Science for Rural Development No. 32, 2013
ISSN 1691-3078
“ECONOMIC SCIENCE FOR RURAL DEVELOPMENT”
Proceedings of the
No. 32Rural Development and EntrepreneurshipMarketing and Sustainable Consumption
Jelgava
2013
Economic Science for Rural Development No. 32, 2013
ISSN 1691-3078
2
1-10
L. Rantamäki-Lahtinen Turning Rural Potential into Success
TIME SCHEDULE OF THE CONFERENCE
Preparation – September, 2012 – April 20, 2013 Process – April 25-26, 2013
Latvia University of Agriculture, Latvia, 2013Aleksandras Stulginskis University, Lithuania, 2013Banat University of Agricultural Sciences and Veterinary Medicine Timisoara, Romania, 2013Bremen University of Applied Sciences, Germany, 2013Daugavpils University, Latvia, 2013Fulda University of Applied Sciences, Germany, 2013
Kaunas University of Technology, Lithuania, 2013Khyber Pakhtunkhwa Agricultural University, Peshawar, Pakistan, 2013Klaipeda University, Lithuania, 2013Latvian State Institute of Agrarian Economics, Latvia, 2013Lithuanian Institute of Agrarian Economics, Lithuania, 2013Mykolas Romeris University, Lithuania, 2013Pope John Paul II State School of Higher Education in Biala Podlaska, Poland, 2013
Riga International School of Economics and Business Administration, Latvia, 2013Riga Technical University, Latvia, 2013Seinajoki University of Applied Sciences, Finland, 2013Siauliai University, Lithuania, 2013Slovak University of Agriculture in Nitra, Slovakia, 2013
Turiba University, Latvia, 2013University of Latvia, Latvia, 2013University of Agriculture in Krakow, Poland, 2013University of Bremen, Germany, 2013
University of Helsinki, Finland, 2013University of Social Science, Poland, 2013
University of Zielona Gora, Poland, 2013
Warsaw University of Life Sciences, Poland, 2013Wroclaw University of Technology, Poland, 2013
ISSN 1691-3078ISBN 978-9934-8304-8-8
Abstracted / Indexed: AGRIS, EBSCO
http://www.llu.lv/ef/konferences.htmhttp://www.fao.org/agris/
http://search.ebscohost.com/login.aspx?direct=true&db=a9h&jid=25AP&site=ehost-live
3
Economic Science for Rural Development No. 32, 2013
ISSN 1691-3078
1-10
L. Rantamäki-Lahtinen Turning Rural Potential into Success
Professor Baiba Rivza President of the Academy of Agricultural and Forestry Sciences of Latvia; academician of Latvian Academy of Sciences; foreign member of Academy of Agricultural Sciences of Russia; foreign member of the Royal Swedish Academy Geargophily (Italy), foreign member of the Royal Swedish Academy of Agriculture and Forestry
Professor Algirdas Miskinis Vilnius University, Lithuania
Professor Barbara Freytag-Leyer Department of Home Economics, Fulda University of Applied Sciences, Germany
Professor Department of Economics of the Swedish University of Agricultural Sciences, Uppsala, Sweden
Professor Bartosz Mickiewicz Dean of the Faculty of Economics, West Pomeranian Poland
Professor Alina Danilowska Head of Department of Economics and Economic Policy of Warsaw University of Life Sciences, Warsaw, Poland
Professor Maria Parlinska Faculty of Economic Sciences, Warsaw University of Life Sciences, Poland
Professor Julius Ramanauskas Dr. hab., prof. Klaipeda University, Lithuania
Professor Irina Pilvere Dean of the Faculty of Economics of Latvia University of Agriculture
Associate professor Aija Eglite Latvia University of Agriculture, foreign member of the Academy of Sciences of Bulgaria
Associate professor Modrite Pelse Latvia University of Agriculture
Professor Tiiu Pass Tartu University, Estonia
Professor Mona Vintila Professor West University of Timisoara, Romania
Professor Arild Sæther Faculty of Economics and Social Sciences of the University of Agder, Kristiansand, Norway
Associate professor Andra Latvia University of Agriculture
Professor Ingrida Jakusonoka Latvia University of Agriculture
Professor Aina Dobele Latvia University of Agriculture
Associate professor Inguna Leibus Latvia University of Agriculture
Assistant professor Dace Viksne Latvia University of Agriculture
Associate professor Aina Muska Latvia University of Agriculture
The chief facilitator and project leader – assoc. professor Aija Eglite
Economic Science for Rural Development No. 32, 2013
ISSN 1691-3078
4
L. Rantamäki-Lahtinen Turning Rural Potential into Success
1-10
Editorial Board
Associate professor Aija Eglite Latvia
Professor Barbara Freytag-Leyer Germany
Sweden
Professor Arild Sæther Norway
Professor Antoni Mickiewicz Poland
Associate professor Kaie Pappel Estonia
Professor Julius Ramanauskas Lithuania
Professor Bartosz Mickiewicz Poland
Professor Veronika Bugina Latvia
Professor Anastasija Vilcina Latvia
Associate professor Modrite Pelse Latvia
Professor Alina Danilowska Poland
Professor Mona Vintila Romania
Professor Maria Parlinska Poland
Editor – in-chief and responsible compiler of the proceedings: Associate professor Aija EGLITE
Assistant to the responsible compiler: Zane BULDERBERGA
Language Editor: Gunta GRINBERGA-ZALITE
Layout designer: Agnese RADZELE-SULCE
5
Economic Science for Rural Development No. 32, 2013
ISSN 1691-3078
L. Rantamäki-Lahtinen Turning Rural Potential into Success
1-10
Reviewers
international review.
All reviewers were anonymous for the authors of the articles.The following 112 10 countries
Pakistan, and Latvia) have written 288 reviews.
Adolfs Rucins Dr.sc.ing., leading researcher (Research Institute of Agricultural Machinery, Latvia)
Agnese Krievina Dr.oec., researcher (Latvian State Institute of Agrarian Economics, Latvia)
Dr.oec., assist.prof. (Latvia University of Agriculture, Latvia)
Aija Eglite Dr.oec., assoc. prof. (Latvia University of Agriculture, Latvia)
Aija van der Steina Dr. oec., lecturer (Turiba University, Latvia)
Aina Dobele Dr.oec., prof. (Latvia University of Agriculture, Latvia)
Aina Joppe Dr.oec., assist.prof. (University of Latvia, Latvia)
Aina Muska Dr.oec., assoc.prof. (Latvia University of Agriculture, Latvia)
Aivars Strautnieks Dr.oec., assoc.prof. (Latvia University of Agriculture, Latvia)
Alina Danilowska Dr.hab., assoc.prof. (Warsaw University of Life Sciences, Poland)
Anastasija Vilcina Dr.oec., prof. (Latvia University of Agriculture, Latvia)
Dr.oec., assist. prof. (Latvia University of Agriculture, Latvia)
Dr.oec., assoc.prof. (Latvia University of Agriculture, Latvia)
Dr.hab., prof. (University of Warsaw, Poland)
Dr.oec., assoc.prof. (Latvia University of Agriculture, Latvia)
Arturs PraulinsLatvia)
Audruis Gargasas Dr., assist.prof. (Aleksandras Stulginskis University, Lithuania)
Dr.hab.oec., prof. (Latvia University of Agriculture, Latvia)
Biruta Sloka Dr.oec., prof. (University of Latvia, Latvia)
Dr., prof. (Swedish University of Agricultural Sciences, Sweden)
Bogdan Klepacki Dr.hab., prof. (Warsaw University of Life Sciences, Poland)
Daiga Kunkulberga Dr.sc.ing., assoc.prof. (Latvia University of Agriculture, Latvia)
Daina Paula Dr.oec. (Bank of Latvia, Latvia)
Dr.oec., assoc.prof. (BA School of Business and Finance, Latvia)
Elita Jermolajeva Dr.oec., assoc.prof. (Daugavpils University, Latvia)
Evelina Spakovica Dr.oec., assist. prof. (Latvia University of Agriculture, Latvia)
Gediminas Kuliesis Dr. senior research fellow (Lithuanian Institute of Agrarian Economics, Lithuania)
PhD, (Warsaw University of Life Sciences, Poland)
Dr.oec., assoc.prof. (Latvia University of Agriculture, Latvia)
Gunta Grinberga-Zalite Dr.oec., assist. prof. (Latvia University of Agriculture, Latvia)
Dr. oec., prof. (University of Natural Sciences and Humanities in Siedlce, Poland)
Economic Science for Rural Development No. 32, 2013
ISSN 1691-3078
6
3-13
L. Rantamäki-Lahtinen Turning Rural Potential into Success
1-10
Hana Mohelska
Ieva Andersone Dr.oec., lecturer (Riga Technical University, Latvia)
Ieva BrenceLatvia)
Ilham Huseyinov Dr., assoc.prof. (University of Mediterranean Karpasia, Turkey)
Dr.sc.administr., assist.prof. (Information Systems Management Institute, Latvia)
Dr.oec., assist.prof. (Latvia University of Agriculture, Latvia)
Inara Jurgena Dr.oec., assoc.prof. (Latvia University of Agriculture, Latvia)
Inesa Voroncuka Dr.oec., prof. (University of Latvia, Latvia)
Ingrida Jakusonoka Dr.oec., prof. (Latvia University of Agriculture, Latvia)
Ingrida Kantike Mg.oec., lecturer (Latvia University of Agriculture, Latvia)
Inguna Leibus Dr.oec., assoc.prof. (Latvia University of Agriculture, Latvia)
Inguna Gulbe Dr.oec., assist.prof. (Latvia University of Agriculture, Latvia)
Irina Pilvere Dr.oec., prof. (Latvia University of Agriculture, Latvia)
Dr.paed., prof. (Riga Teacher Training and Educational Management Academy, Latvia)
Dr.hab., prof. (Warsaw University of Life Sciences, Poland)
Irija Vitola Dr.oec., prof. (Latvia University of Agriculture, Latvia)
Jan Eisler Republic)
Jan HybelPoland)
Jan Jarre Dr.rer.pol., prof. (University of Applied Sciences Munster, Germany)
Jan PolcynEducation in Pila Poland)
Janina Sawicka Dr.hab., prof. (Warsaw University of Life Sciences, Poland)
Jaroslaw Golebiewski Dr.hab. (Warsaw University of Life Sciences, Poland)
Javid Ullah Dr., prof. (University of Agriculture Peshawar, Pakistan)
Joanna Kisielinksa Dr.hab. (Warsaw University of Life Sciences, Poland)
Johana Paluchova PhD, (Slovak University of Agriculture in Nitra, Slovakia)
Justyna Franc-Dabrowska Dr.hab., assoc. dean, (Warsaw University of Life Sciences, Poland)
Karolina Pawlak
Konstantins Didenko Dr.oec., prof. (Riga Technical University, Latvia)
Krisjanis Abolins MBM (Latvia University of Agriculture, Latvia)
Dr.hab., prof. (Warsaw University of Life Sciences, Poland)
Liga Mihejeva Dr.oec., prof. (Latvia University of Agriculture, Latvia)
Liga Paura Dr.agr., assoc. prof. (Latvia University of Agriculture, Latvia)
Ligita Bite Dr.oec., assist.prof. (Latvia University of Agriculture, Latvia)
Linda Silina Dr.oec., assist.prof. (Latvia University of Agriculture, Latvia)
Ludwik Wicki Dr.hab. (Warsaw University of Life Sciences, Poland)
PhD, assoc. prof. (Agricultural University of Krakow, Poland)
Maija Senfelde Dr.oec., prof. (Riga Technical University, Latvia)
Maria Parlinska Dr.hab., prof. (Warsaw University of Life Sciences, Poland)
Marian Podstawka Dr.hab., prof. (Warsaw University of Life Sciences, Poland)
7
Economic Science for Rural Development No. 32, 2013
ISSN 1691-3078
3-131-10
L. Rantamäki-Lahtinen Turning Rural Potential into Success
Minna Vare PhD, principal research scientist (MTT Agrifood Research, Finland)
Modrite Pelse Dr.oec., assoc.prof. (Latvia University of Agriculture, Latvia)
Natalia PavlikhaPodlaska, Poland)
Director General (State Revenue Service, Latvia)
Nina Drejerska PhD, assist.prof. (Warsaw University of Life Sciences, Poland)
Dr.hab.sc.ing., prof. (Latvia University of Agriculture, Latvia)
Pjotr Kulyk PhD, vice-dean (University of Zielona Gora, Poland)
Pribeanu Gheorghe PhD, assoc. prof. (Vasile Goldis West University of Arad, Romania)
Dr.hab., prof. (Vilnius University, Lithuania)
Rimantas Krankalis Dr., assoc. prof. (Siauliai University, Lithuania)
Romena Sulca Dr.oec., assist.prof. (Latvia University of Agriculture, Latvia)
Ruta Petrauskiene Dr. assoc.prof. (Kaunas University of Technology, Lithuania)
Mg.oec., lecturer (Latvia University of Agriculture, Latvia)
Sandra Gusta Dr.oec., assist.prof. (Latvia University of Agriculture, Latvia)
Sandris Ancans Mg.oec., lecturer (Latvia University of Agriculture, Latvia)
Mg.oec. (Latvia University of Agriculture, Latvia)
Stanislavs Keiss
Svetlana Saksonova Dr.oec., assoc.prof. (University of Latvia, Latvia)
Tatjana Tambovceva Dr.oec., assoc. prof. (Riga Technical University, Latvia)
Ugis Zalitis Dr.oec., assoc. prof. (BA School of Business and Finance, Latvia)
Valentina Andrejeva
Vera Boronenko Dr.oec. (Daugavpils University, Latvia)
Veronika Bugina Dr.oec., prof. (Latvia University of Agriculture, Latvia)
Vita Zarina Dr.oec., asoc.prof. (Turiba University, Latvia)
Vladislavs Vesperis
Voldemars Strikis Dr.h.c., prof. (Latvia University of Agriculture, Latvia)
Dr.hab.oec., prof. (Latvia University of Agriculture, Latvia)
Zane Bulderberga Mg.oec., lecturer (Latvia University of Agriculture, Latvia)
Zanete Ilmete Dr.oec., prof. (University of Latvia, Latvia)
PhD, assoc.prof. (Institute of Economics and Methodology, Hungary)

Economic Science for Rural Development No. 32, 2013
ISSN 1691-3078
8
1-10
Foreword
Every year the Faculty of Economics, Latvia University of Agriculture holds the international
This year researchers from Europe and Asia representing not only the science of economics in the diversity of its sub-branches have contributed to the conference; they have expanded their
and multi-dimensional development of the contemporary science. The conference is dedicated to topical themes of rural development; hence, the research results are published in three
was published in 2000.Professors, doctors of science, associate professors, assistant professors, PhD students, and other researchers from the following higher education, research institutions and enterprises
1. Latvia University of Agriculture, Latvia2. Aleksandras Stulginskis University, Lithuania3. BA School of Business and Finance, Latvia4. 5. Banat University of Agricultural Sciences and Veterinary Medicine Timisoara, Romania6. Bremen University of Applied Sciences, Germany7. Daugavpils University, Latvia8. Fulda University of Applied Sciences, Germany9. 10. Kaunas University of Technology, Lithuania11. Khyber Pakhtunkhwa Agricultural University, Peshawar, Pakistan12. Klaipeda University, Lithuania13. 14. 15. Latvian State Institute of Agrarian Economics, Latvia16. Lithuanian Institute of Agrarian Economics, Lithuania17. Mykolas Romeris University, Lithuania18. Pope John Paul II State School of Higher Education in Biala Podlaska, Poland19. 20. 21. Professional Association of Project Managers, Latvia22. 23. Riga International School of Economics and Business Administration, Latvia24. Riga Teacher Training and Educational Management Academy, Latvia25. Riga Technical University, Latvia26. Seinajoki University of Applied Sciences, Finland27. Siauliai University, Lithuania28. Slovak University of Agriculture in Nitra, Slovakia29. State Regional Development Agency, Latvia30. 31. 32. Turiba University, Latvia33. University of Latvia, Latvia34. 35. University of Agriculture in Krakow, Poland36. University of Bremen, Germany
9
Economic Science for Rural Development No. 32, 2013
ISSN 1691-3078
37. 38. University of Helsinki, Finland39. University of Social Science, Poland40. 41. University of Zielona Gora, Poland42. 43. 44. Warsaw University of Life Sciences, Poland 45. 46. Wroclaw University of Technology, Poland
The following topical themes have been chosen for the conference: — — Integrated and Sustainable Regional Development — Rural Development and Entrepreneurship — — Finance and Taxes — Home Economics
methodological research results, meeting the requirements of international standards,
manuscript has been reviewed by one reviewer from the author’s native country or university, while the other reviewer came from another country or university. The third
for the authors of the articles. Every author received the reviewers’ objections or
author’s comments, the Editorial Board of the conference evaluated each article. Altogether,
for publication.
No. 30 Production and Cooperation in AgricultureFinance and Taxes
No. 31 Integrated and Sustainable Regional Development
No. 32 Rural Development and EntrepreneurshipMarketing and Sustainable Consumption
The publishing of the Proceedings before the conference will promote exchange of opinions, discussions, and collaboration of economic scientists on the international level. The research results included into the Proceedings are available worldwide to any interested person.
Economic Science for Rural Development No. 32, 2013
ISSN 1691-3078
10
The abstracts of the conference proceedings provided in English are submitted to the international databases:
AGRIS – International Information System for the Agricultural Sciences and Technology set up by the Food and Agriculture Organisation of the United Nations (FAO UN) (www.fao.org/agris/), and selected papers are submitted to especially comprehensive scholarly, multidisciplinary databases containing full research texts:
— — http://search.ebscohost.com/login.aspx?authtype=ip,uid&
as well as —
for the development of future conference proceedings and organisation of international
and the Editorial Board as well as supporting staff for their contribution organising the conference.
On behalf of the conference organisersDr. oec. Aija EgliteAssociate Professor of the Faculty of EconomicsLatvia University of [email protected]

11
Economic Science for Rural Development No. 32, 2013
ISSN 1691-3078
Content
Rural Development and Entrepreneurship
Dagmara K. Zuzek, Bartosz Mickiewicz
Support Instruments for the Sector of Small and Medium Enterprises with a Particular Focus on Areas
14
Adam MajchrzakDiversity of Agrarian Structures in EU Member States – Dynamic Approach
19
Wioletta Bienkowska Activities of Local Authorities in Promoting Entrepreneurship in Poland
26
Lukasz Poplawski Multifunctional Development of Rural Areas in the Imielno Commune Before and After Integration With the EU
32
Mikus Dubickis,Elina Gaile-Sarkane
Impact of Human Capital on Development of Innovation Ecosystem in Latvia
37
Baiba Plavina,Ineta Geipele
Chances for the Development of Multiapartment Dwelling Houses’ Policy in Latvia
43
Josef Mezera,Vaclav Vilhelm,Jindrich Spicka
Czech Food Processing Industry in the Period of Uncertainty About the Support From Rural Development Programme
48
Jakub Piecuch Evolution of Social and Economic Situation in Polish Agriculture Since the Accession to the European Union
54
Rosita Zvirgzdina,Elga Tilta
Possibilities of Diminishing of Differences in Regional Social Economics and Dairying in Latvia
60
Liga Proskina Consumer Behaviour on the Venison Market in Latvia 68
Robert Pietrzykowski Agricultural Land Market in Poland and the European Union
76
Maiga Kruzmetra,Baiba Rivza,
Laura Jeroscenkova
Culture Heritage as Important Product of RURAL Tourism
83
Jelena Dementjeva,Zilvinas Aidas Zilinskas
Role of Innovative Processes in Ensuring the Competitiveness of Companies
89
Julius Ramanauskas,Rimantas Stasys,
Vytautas Jonas Zilinskas
Coordination of the Objectives and Optimal Selection of Innovative Biofuel Market Participants
92
Vilma Atkociuniene,Asta Raupeliene,
Alvydas Aleksandravicius
Strategic Orientations for Rural Employment Development: The Case of Telsiai District Labour Market
98
Marketing and Sustainable Consumption
Evelina Spakovica,Genadijs Moskvins,
Marks Moskvins
Consumers’ Complaints and Complaint Handling as a Crucial Aspect of Good Market Functioning
106
Inese AleksejevaProduction and Future Challenges
113
Andris Valdemars,Dzintra Atstaja
Environmentally Friendly Transport Solutions 120
Economic Science for Rural Development No. 32, 2013
ISSN 1691-3078
12
3-13
Inesa Voronchuck,Irina Lando
Methods of Knowledge Management in Organisations 127
Valentina Echeverry Cárdenas,
Barbara Freytag-Leyer
Corporate Social Responsibility Communication and the Food Industry
134
Anda Batraga,Ilze Medne,
Ksenija Dmitrijeva,
Development of Higher Education Institution Brand – Association Context
141
Leonid Worobjow,Karolina Ertmanska
Relations Between Country Brand and Product Brand 148
Gunta Grinberga-Zalite,Evija Liepa,
Amanda Avotina
Role of Social Marketing in Maintaining the Balance Between Satisfaction of Immediate and Long-Term Needs in the Context of Food Consumption
152
Mariusz Chadrzynski Product and Marketing Innovation on the Yoghurt Market in Poland
158
Monika Gebska Consumer Perception and Willingness to Pay for the Welfare of Livestock During Long-Distance Transportation
165
Renata Prokeinova, Tomas Chrenko
Consumption of Foodstuff – Better Indicator of the Sustainability (Case Study About Slovakia)
172
Jaroslaw Golebiewski Changes in Competition Trends and Labour Productivity in the Marketing Chain of Foodstuffs
178
Aleksander Grzelak Reproduction Processes in Agriculture in Poland Considering Production Types of Farms (In the Light of the Data from Agricultural Accounting System FADN)
184
Barbara Freytag-Leyer,Ricarda Peschke,Joerg Hampshire
with the Additive Steviol Glycosides190
Baiba Rivza, Liva Grinevica
Long-Term Unemployment Problems in Latvia Between Forty and Preretirement Age
196
Muhammad Zafarullah Khan
Bridging the Knowledge Gap of Possessed and Required Professional Competencies of Pakistan’s
203

13
Economic Science for Rural Development No. 32, 2013
ISSN 1691-3078
“ECONOMIC SCIENCE FOR RURAL
DEVELOPMENT”
Proceedings of the
RURAL DEVELOPMENT AND ENTREPRENEURSHIP

Economic Science for Rural Development No. 32, 2013
ISSN 1691-3078
14
D. K. Zuzek, B. Mickiewicz Support Instruments for the Sector of Small and Medium
Enterprises with a Particular Focus on Areas
___________________________1 2
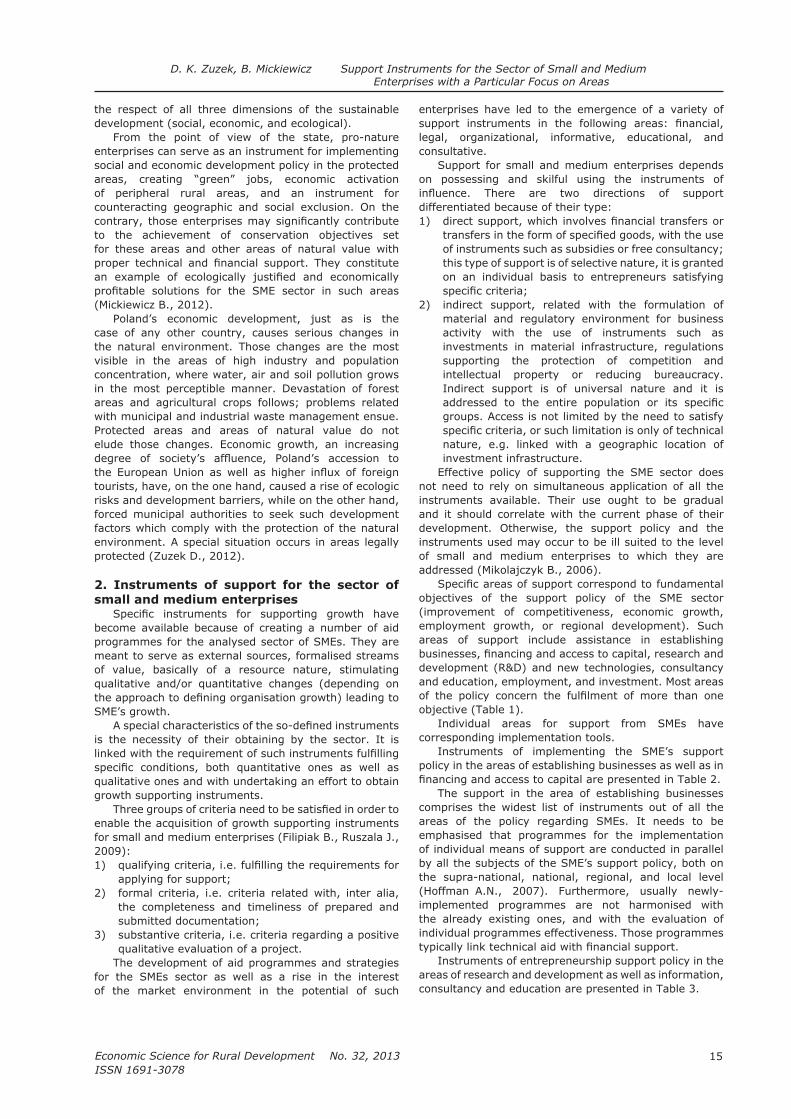
SUPPORT INSTRUMENTS FOR THE SECTOR OF SMALL AND MEDIUM ENTERPRISES WITH A PARTICULAR FOCUS ON AREAS
Dagmara K. Zuzek1, PhD
Bartosz Mickiewicz2, PhD, professor
Abstract. After Poland’s accession to the European Union economic units are obliged to obey the legal and strategic norms ruling on the common European market, including those aimed at preservation and introduction of high standards for the protection of natural environment. The consciousness on the necessity for introducing of changes related with production in protected areas is increasing among small and medium enterprises in Poland. They are
The aim of the article is to indicate essential instruments of support for the companies of the small and medium enterprises sector based on the main areas of support application.Key words: protected areas, sustainable development, support instruments.JEL code: Q18
Introduction The role that small and medium enterprises play in
innovation creation opportunities, including opportunities for entrepreneurship development and growth of economic competitiveness. The high share the sector holds in the GDP generation is a reason for strengthening the foundations of the sector operation and facilitating access to innovative solutions. A modern enterprise ought to become an innovative organisation, open to novelties, perceiving the internal and external environment from different perspectives, and, at the same time, sensitive to market signals and expectations as well as
Both theoretical and practical discussions are being conducted regarding the principles and directions for supporting small and medium enterprises. The discussions touch upon the questions of determining the subjective scope of granting aid (Piasecki B., 1998), specifying the construction, including grade
(Misiag F., 2005), and other issues related with the scope and effectiveness of the undertaken aid actions.
The aim of the article is to indicate essential instruments of support for the companies of the small and medium enterprises sector based on the main areas of support application.
Results and discussion1. Areas of natural value as locations for business activity of small and medium enterprises
The protection of areas of natural value has presently become particularly important on account of the scope
and pace of changes occurring in the environment and caused by human activities. Establishment of protected areas and systems of such areas constitutes one of the most critical trends of protection recognised in the world. The principles of nature conservation,
Red List of Endangered Plant Species, are as follows
— preservation of the habitat to protect species or a group of species;
— protection of the entire ecosystems or groups of ecosystems (species’ habitat);
— protection of ecosystems and species in the place of their natural occurrence – in situ protection;
— protected ecosystems ought to occupy the largest possible areas (large ecosystems are more ecologically stable and more resistant to antropopressure);
— maintenance of spatial continuity of (protected) natural areas – ecological connection between ecosystems (enabling species migration, being a necessary condition for their long-term survival).
with nature conservation, scarcity of legal instruments
low ecological awareness of the society, and weak enforcement of respecting the environment protection regulations.
The Lisbon Strategy constitutes a starting point for co-operation between enterprises and nature conservation, targeted at the development of knowledge- and innovation-based economy, oriented at creating a larger number of jobs and better jobs as well as requiring
15
Economic Science for Rural Development No. 32, 2013
ISSN 1691-3078
the respect of all three dimensions of the sustainable development (social, economic, and ecological).
From the point of view of the state, pro-nature enterprises can serve as an instrument for implementing social and economic development policy in the protected
of peripheral rural areas, and an instrument for counteracting geographic and social exclusion. On the
to the achievement of conservation objectives set for these areas and other areas of natural value with
Poland’s economic development, just as is the case of any other country, causes serious changes in the natural environment. Those changes are the most visible in the areas of high industry and population concentration, where water, air and soil pollution grows in the most perceptible manner. Devastation of forest areas and agricultural crops follows; problems related with municipal and industrial waste management ensue. Protected areas and areas of natural value do not elude those changes. Economic growth, an increasing
tourists, have, on the one hand, caused a rise of ecologic risks and development barriers, while on the other hand, forced municipal authorities to seek such development factors which comply with the protection of the natural environment. A special situation occurs in areas legally
2. Instruments of support for the sector of small and medium enterprises
become available because of creating a number of aid programmes for the analysed sector of SMEs. They are meant to serve as external sources, formalised streams of value, basically of a resource nature, stimulating qualitative and/or quantitative changes (depending on
SME’s growth.
is the necessity of their obtaining by the sector. It is
qualitative ones and with undertaking an effort to obtain growth supporting instruments.
enable the acquisition of growth supporting instruments
2009):1)
applying for support;2) formal criteria, i.e. criteria related with, inter alia,
the completeness and timeliness of prepared and submitted documentation;
3) substantive criteria, i.e. criteria regarding a positive qualitative evaluation of a project.
The development of aid programmes and strategies for the SMEs sector as well as a rise in the interest of the market environment in the potential of such
enterprises have led to the emergence of a variety of
consultative.Support for small and medium enterprises depends
on possessing and skilful using the instruments of
differentiated because of their type:1)
of instruments such as subsidies or free consultancy; this type of support is of selective nature, it is granted on an individual basis to entrepreneurs satisfying
2) indirect support, related with the formulation of material and regulatory environment for business activity with the use of instruments such as investments in material infrastructure, regulations supporting the protection of competition and intellectual property or reducing bureaucracy. Indirect support is of universal nature and it is
groups. Access is not limited by the need to satisfy
nature, e.g. linked with a geographic location of investment infrastructure.
Effective policy of supporting the SME sector does not need to rely on simultaneous application of all the instruments available. Their use ought to be gradual and it should correlate with the current phase of their development. Otherwise, the support policy and the instruments used may occur to be ill suited to the level of small and medium enterprises to which they are
objectives of the support policy of the SME sector (improvement of competitiveness, economic growth, employment growth, or regional development). Such areas of support include assistance in establishing
development (R&D) and new technologies, consultancy and education, employment, and investment. Most areas
objective (Table 1).Individual areas for support from SMEs have
corresponding implementation tools.Instruments of implementing the SME’s support
policy in the areas of establishing businesses as well as in
The support in the area of establishing businesses comprises the widest list of instruments out of all the areas of the policy regarding SMEs. It needs to be emphasised that programmes for the implementation of individual means of support are conducted in parallel by all the subjects of the SME’s support policy, both on the supra-national, national, regional, and local level (Hoffman A.N., 2007). Furthermore, usually newly-implemented programmes are not harmonised with the already existing ones, and with the evaluation of individual programmes effectiveness. Those programmes
Instruments of entrepreneurship support policy in the areas of research and development as well as information, consultancy and education are presented in Table 3.
D. K. Zuzek, B. Mickiewicz Support Instruments for the Sector of Small and Medium Enterprises with a Particular Focus on Areas

Economic Science for Rural Development No. 32, 2013
ISSN 1691-3078
16
Table 1Objectives of the SME’s support policy and corresponding areas of direct support
Aim
economic growth
— investments — R&D, new technologies — — establishment of businesses — internationalisation — information, consultancy and education
improvement of
competitiveness
— investments — R&D, new technologies — access to capital — internationalisation — information, consultancy and education
employment growth — employment — establishment of businesses — information, consultancy and education
regional development
— employment — investments — — information, consultancy and education
Source: authors’ construction
Table 2Instruments of implementing the SME’s support policy in the areas of establishing businesses as well as
Financing and access to
capital
— grants, subsidies — loan subsidising — loan guarantee — guarantees for venture capital funds providers —
sectors, investing in research and development
Establishing businesses
— grants, subsidies — loan subsidising — loan guarantee — guarantees for venture capital funds providers — public venture capital funds — feasibility studies — consultancy services — — courses on entrepreneurship and starting a business — industrial and technological parks
Source: authors’ construction
Table 3 Instruments of SME’s support policy in the areas of information, consultancy and education as well as
research and development (R&D)
Information, consultancy
and education
— general information sources, comprehensive service centres — consultancy and training available free or against partial payment — Internet source of knowledge — education programmes presenting knowledge on the establishment and operations
of an enterprise and creating entrepreneurial attitudes
Research and
development, new
technologies
— funds allocated to supporting the establishment of networks and industrial co-operation, management by research centres and universities
— subsidising jobs for R&D employees — public research and development centres offering services at prices lower than
market prices — guarantees for venture capital funds providers — grants and tax reductions on account of investments in innovations and R&D
Source: authors’ construction
D. K. Zuzek, B. Mickiewicz Support Instruments for the Sector of Small and Medium Enterprises with a Particular Focus on Areas
17
Economic Science for Rural Development No. 32, 2013
ISSN 1691-3078
The weight of support in the area of research and development and new technologies is rising considerably.
the implementation of new technologies by SMEs. They comprise cost reduction for introducing new technologies
links between research institutions, higher education
(Garofoli G., Musyck B., 2003).
Instruments of support in the area of information, consultancy and education are well developed in most European countries. However, this area of SME’s support is a relatively new one. Information and consultancy mostly concern establishing enterprises and export business activity; yet, presently, the instruments encompass nearly all aspects of small and medium enterprises’ operation as well as environment elements important to them. Many countries are extending information services by providing
activities, however, erase the entrepreneurs’ conviction on lack of transparency in respect of institutional structure of SME’s support. Education programmes put lot of emphasis on supporting knowledge and creating entrepreneurial attitudes (Henrekson M., Roine J., 2007).
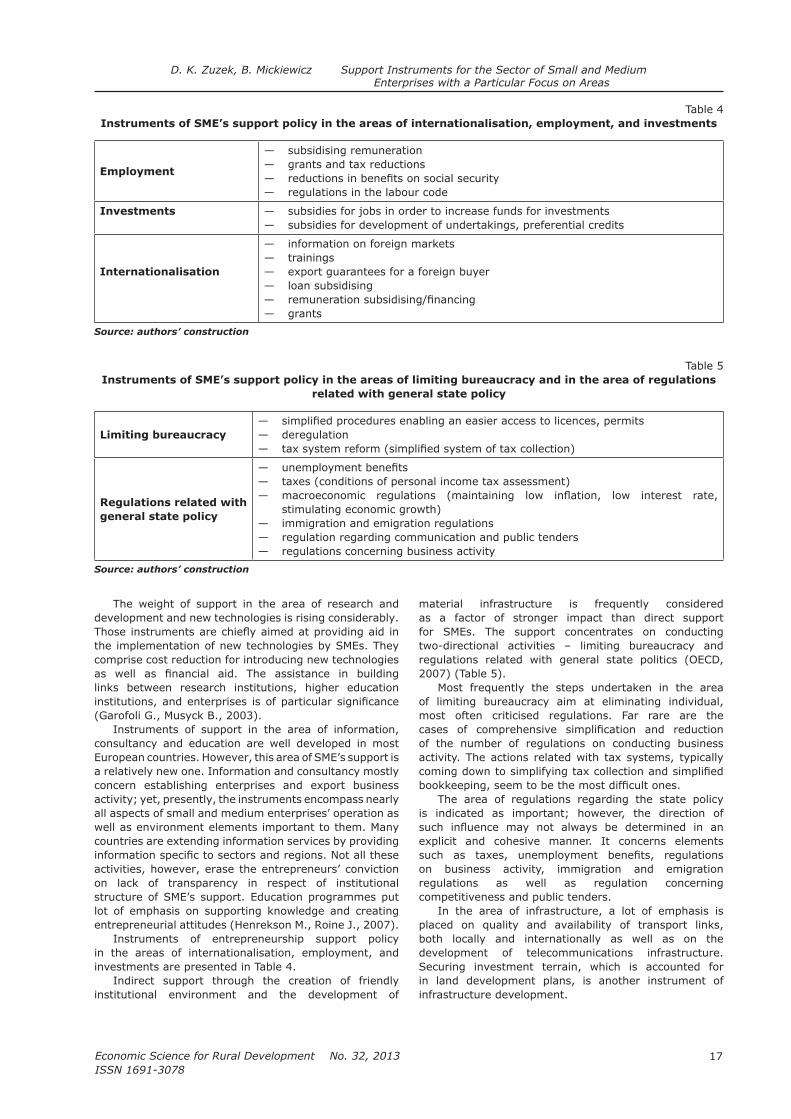
Instruments of entrepreneurship support policy in the areas of internationalisation, employment, and investments are presented in Table 4.
Indirect support through the creation of friendly institutional environment and the development of
Table 4Instruments of SME’s support policy in the areas of internationalisation, employment, and investments
Employment
— subsidising remuneration — grants and tax reductions — — regulations in the labour code
Investments — subsidies for jobs in order to increase funds for investments — subsidies for development of undertakings, preferential credits
Internationalisation
— information on foreign markets — trainings — export guarantees for a foreign buyer — loan subsidising — — grants
Source: authors’ construction
material infrastructure is frequently considered as a factor of stronger impact than direct support for SMEs. The support concentrates on conducting two-directional activities – limiting bureaucracy and
2007) (Table 5).Most frequently the steps undertaken in the area
of limiting bureaucracy aim at eliminating individual, most often criticised regulations. Far rare are the
of the number of regulations on conducting business activity. The actions related with tax systems, typically
The area of regulations regarding the state policy is indicated as important; however, the direction of
explicit and cohesive manner. It concerns elements
on business activity, immigration and emigration regulations as well as regulation concerning competitiveness and public tenders.
In the area of infrastructure, a lot of emphasis is placed on quality and availability of transport links, both locally and internationally as well as on the development of telecommunications infrastructure. Securing investment terrain, which is accounted for in land development plans, is another instrument of infrastructure development.
Table 5 Instruments of SME’s support policy in the areas of limiting bureaucracy and in the area of regulations
related with general state policy
Limiting bureaucracy
— — deregulation —
Regulations related with
general state policy
— — taxes (conditions of personal income tax assessment) —
stimulating economic growth) — immigration and emigration regulations — regulation regarding communication and public tenders — regulations concerning business activity
Source: authors’ construction
D. K. Zuzek, B. Mickiewicz Support Instruments for the Sector of Small and Medium Enterprises with a Particular Focus on Areas
Economic Science for Rural Development No. 32, 2013
ISSN 1691-3078
18
Conclusions Environment protection in Poland, just as in the
European Union, is regulated by already operating instruments and tools of the community policy. Still, entrepreneurs have a sense that realistically little has been done in respect of supporting SMEs that conduct business activity in protected areas. The reason for that is that so far most actions undertaken with the aim of building partnership between business and nature protection have been addressed to large enterprises and corporations, and outside the scope of interest of small and medium enterprises.
The future of the analysed sector of small and medium enterprises as well as the economic activity and prosperity of local communities will to a large extent depend on the creation of conditions conducive
based on the use of natural resources. However, these enterprises largely encounter numerous barriers, which
that are dependent on natural resources in rural areas, which is caused by high dispersion and fragmentation of potential borrowers, high transaction costs and high investment risk, which frequently results from the lack of plans for the management of protected areas and plans of protection for protected areas.
which starts in 2013, enterprises conducting their business activity in accordance with nature conservation are to receive a higher degree of support. It is going to be a credit fund offering preferential conditions for the implementation of projects, which ensure environmental results in pursuance of the nature conservation objectives in a particular area. Preliminary proposals demonstrate that this future fund will be used by the enterprises:1) 2) located in Natura 2000 area or using resources
located in such areas;3) whose existence depends on the use of natural
resources, especially those of biological diversity;4)
diversity in the area of their impact.Recommendations can be drawn up for those
small and medium enterprises which are interested in undertaking and developing business activity in the areas of natural value that encompass many different forms of pro-nature activities, including activities related with production, education, training, and consultations.
Bibliography 1. Instytucje otoczenia
biznesu. Rozwoj, wsparcie, instrumenty (Institutions Business Environment. Develop, Support, Tools).
2. Garofoli, G. Musyck, B. (2003). Innovation Policies
for SMEs: an Overview of Policy Instruments. In: B. Ödtling
(red.) Regional Innovation Policy for Small-Medium
Enterprises
3. Hoffman, A. N. (2007). A Rough Guide to
Entrepreneurship Policy. In: D. B. Audretsch, I. Grilo, R. Trurik (red.) Handbook of Research on
Entrepreneurship Policy. Edward Elgar Publishing,
4. Policy for European Union Member States after 2013. Proceedings of the 2012 International
5. Finansowe
uwarunkowania konkurencyjnosci przedsiebiorstw
z uwzglednieniem sektora MSP
6. Misiag, F. (red.) (2009). Pomoc publiczna
dla malych i srednich przedsiebiorstw. Mity
i rzeczywistosc (Public Assistance to Small and Medium Enterprises. Myths and Reality). PWE,
7. of SME and Entrepreneurship Policies and Programmers, Paris.
8. Piasecki, B. (1998). Teoria i praktyka (Entrepreneurship and Small
9. Uwarunkowania rozwoju
MSP
Zarzadzanie malym i srednim
przedsiebiorstwem (Management of Small and Medium Business). Wyd. AE im. O. Langego we Wroclawiu, Wroclaw.
10. Lista roslin wymierajacych i zagrozonych
w Polsce (List of Plants of Extinct and Endangered in
11. Competitiveness of Valuable
Natural Areas. Jelgava, No. 27, pp. 285-289. 12.
Financing Innovative Project in Small and Medium
D. K. Zuzek, B. Mickiewicz Support Instruments for the Sector of Small and Medium Enterprises with a Particular Focus on Areas

19
Economic Science for Rural Development No. 32, 2013
ISSN 1691-3078
A. Majchrzak Diversity of Agrarian Structures in EU Member States – Dynamic Approach
___________________________*
1 E-mail address2 One must note that in 2010 Farm Structure Survey methodology has been changed. In 2010, various Member
States used survey thresholds which were above the common threshold of 1 ha of UAA. Because of the fact that
Greece, the United Kingdom), which needs to be taken into account.
DIVERSITY OF AGRARIAN STRUCTURES IN EU MEMBER STATES – DYNAMIC APPROACH*
Adam Majchrzak1, MA, PhD Student
Abstract. The paper concerns the issue of shaping of the agricultural structures in the European Union member states. The aim is to assess the occurrence of uniform trend in changes of the volume structure of farms and owned agricultural land. Therefore, the author tries to answer the question whether the validity of the common principles of
on agricultural resources in the EU, showing the current shape of the agrarian structure in the EU-27 as well as the dynamics in the years 2003-2007, w used. To illustrate the degree of differentiation of the structures, Shannon Diversity Index was applied. It turns out that despite the assumptions about the dominant role of family farms in the
Key words: agrarian structures, agricultural land, diversity, EU-27, dynamics.JEL code: Q15
Introduction Under the terms of the Treaty of Rome - Article 295
(Now Art. 345 of the Treaty on the Functioning of the European Union), the issues related to the ownership of land in the EU member states are reserved to the jurisdiction of the laws of the member states. Moreover, issues related to the agricultural sector belong to shared competence between the EU and the member states. Hence, the importance for the development of agricultural
policies. Although in the EU there is no direct policy, which impacts the management of agricultural land, the EU projects introduce tools that indicate the desired direction of development of agricultural structures. First, it should be noted that one of the assumptions underlying
as the basic production units in European agriculture. On the other hand, in the EU certain forms of agricultural land management such as land lease are promoted (The
and 80s, in Western Europe it stimulated the transition from small family farms to large farms and agricultural enterprises, in parallel with implementing the land set-aside programmes, or the withdrawal from agricultural activities. The latter was also featured in MacSharry
Agricultural Policy reform parallel implements agricultural policy and the policy of rural development, which take into account the maintenance of the European model of agriculture with a focus on environmental protection
cross-compliance and modulation were conducted
interacted for instance by efforts to reduce agricultural production potential in Europe, or at least to limit its use. On the other hand, the family nature of European agriculture, protected, inter alia, through the agricultural
2010), limits the process of decreasing usage of land for production purpose.
The aim of this study is to answer the question whether in connection with the functioning of agriculture in the
the European Union, changes of agricultural structures
examined structures develop mainly in line with national
the differentiation of forms of support available under this policy promotes functioning of agriculture in different structures. In fact, it is an approach consistent with the concept of territorial cohesion, which does not mean striving for convergence of resources and structures, but to use the present regional disparities and ensure the harmonious development of all areas (Komunikat Komisji...2010).
The analysis concerns changes in agrarian structures in the years 2003 and 2010 and is based on the statistical
Farm Structure Survey2. In the paper, the changes in the

Economic Science for Rural Development No. 32, 2013
ISSN 1691-3078
20
than 2 hectares. To present the level of differentiation of structures, Shannon Diversity Index based on the following formula is used:
where: i – area groups Pi – share of number of farms in each group or share of UAA in each group
SHDI is set to 0, when in the structure there is only one type of usage, and the maximum value (equal to the negative logarithm of the number of classes) in the case of a balance between the distribution of different types (Zawalinska K., 2010)3. For distinguished 7 area groups Shannon Diversity Index takes a value between 0-1.95.
The diversity of agricultural structures in
the EU member states The European Union has a high internal diversity of
agricultural structures in the single countries. As evidence of this fact is that in only three countries – Romania, Poland and Italy more than 50% of all farms are located. Their number is not only determined by the available resources of agricultural land, because they have about 23% of total UAA held by households in the EU (data from 2007) (Agriculture in the ..., 2010). The largest area of agricultural land is located in France – 16.4% of UAA in the EU, while this area is used by 6.5% of the EU farms. Moreover, in Romania almost the same area as in Italy is managed by 60% more entities.
At the same time in the EU, one can distinguish countries, in which small and very small farms4
Italy, Latvia, Lithuania, Malta, Portugal, Romania, Poland, Slovakia and Slovenia as well as countries where most farms have over 30 hectares of land – France, the United Kingdom, Luxembourg (Figure 1). In addition, it is worth paying attention to the distribution of holdings in each class area. Shannon Diversity Index calculated for the number of households in a particular area class equals in 2010 ranges from 0.86 in the case of Romania and 1.9 for Sweden and Belgium (Table 4).
UAA owned by farms by area groups (Figure 2). In most countries, there is a concentration of agricultural land
Germany, Denmark, Estonia, Spain, Finland, France, the United Kingdom, Hungary, Lithuania, Luxembourg, Latvia, the Netherlands, Portugal, Romania, Sweden, and
Italy and Poland it is relatively evenly spread across the groups. Hence, the Shannon Diversity Index in 2010 accepted the values range from 0.43 in Slovakia to 1.91
Interesting regularities can also be seen when
states (Table 1). In 2010, this parameter amounted to
the EU-27 amounted to just over 27 hectares. In case
of 2-5 ha, 5-10 ha, 20-30 ha, 30-50 and 50-100 ha took values close to each other – the differences were only 1 to 9 ha, while there was a considerable diversity
Source: author’s construction based on the Farm Structure Survey, 2010
Fig. 1. The number of farms (> 2 ha) by area groups in the European Union in 2010
___________________________3 In the calculation of the structure diversity the case of Malta was omitted due to the lower number of distinguished
classes of agricultural land, and therefore incomparability of results.4
from 5 to 10 ha - small farms, from 10 to 20 ha – average – small farms, from 20 to 30 ha - average – large farms, from 30 to 50 ha – large farms, more than 50 ha - very large farms.
A. Majchrzak Diversity of Agrarian Structures in EU Member States – Dynamic Approach

21
Economic Science for Rural Development No. 32, 2013
ISSN 1691-3078
Source: author’s construction based on the Farm Structure Survey, 2010
Fig. 2. The share of UAA in farms (> 2 ha) by area groups in the European Union in 2010
Table 1 Average farm size in the EU Member States in 2010 by area groups
State > 2 ha 2-5 ha 5-10 ha 10-20 ha 20-30 ha 30-50 ha 50-100 ha > 100 ha
AT 22 3 7 14 24 38 67 185
BE 36 3 7 15 25 39 69 148
BG 69 3 7 14 24 38 69 672
CY 10 3 7 14 24 38 66 165
CZ 169 3 7 14 24 38 70 698
DE 59 3 7 15 25 39 70 274
Dk 66 4 7 14 25 39 72 217
EE 54 3 7 14 24 39 70 400
ES 34 3 7 14 24 38 70 256
FI 37 4 7 15 25 39 69 148
FR 63 3 7 14 25 40 72 175
GB 88 3 7 14 25 39 72 288
GR 9 3 7 14 24 37 65 167
HU 38 3 7 14 24 38 70 407
IE 36 4 8 15 25 39 67 244
IT 15 3 7 14 24 38 68 218
LT 16 3 7 14 24 39 68 300
LU 66 4 7 14 25 41 74 150
LV 24 3 7 14 24 38 68 328
MT 4 3 7 12 16 ----- ----- -----
NL 30 3 7 15 25 39 67 155
PL 12 3 7 14 24 38 68 323
PT 23 3 7 14 24 38 70 347
RO 12 3 7 13 24 38 69 474
SE 44 4 7 14 25 39 71 200
SI 9 3 7 14 24 37 67 329
SK 126 3 7 14 24 38 71 781
min 4 3 7 12 16 37 65 148
max 169 4 8 15 25 41 74 781
Source: author’s construction based on Agriculture in the…, 2010; the Farm Structure Survey, 2010
A. Majchrzak Diversity of Agrarian Structures in EU Member States – Dynamic Approach

Economic Science for Rural Development No. 32, 2013
ISSN 1691-3078
22
in farms bigger than 100 ha. Among them, the average
and more in the EU-27 in 2010 was 264.6 ha.It should be noted that the current agrarian structure
Republic, Estonia, Hungary and Slovakia come out of restitution process carried out in the 90s. It resulted in a highly fragmented agrarian structure, which as a result led to the diffusion of agricultural land lease. In this way, cooperatives and large farm holdings were formed. The structure of the agricultural land in the countries of Western Europe are the result of secular economic development and restructuring that took place in the
be noted, however, that the situation formed in those old member states shows that European integration
The dynamics of agrarian structures in
the EU member states during the period
2003-2010Heterogeneous agrarian structure inside the European
Union is also accompanied by various factors determining the dynamics, distinct in the countries of Western Europe
2010). One can specify the universal stimulants, which are: growth in parallel with the increase of farms, income opportunities and facilities in the implementation of European environmental regulations. At the same time,
structures in the European Union is affected by the
often the condition for achieving income in these units,
Table 2 Dynamics of the number of farms (> 2 ha) in the European Union by area groups during 2003-2010
State > 2 ha 2-5 ha 5-10 ha 10-20 ha 20-30 ha 30-50 ha 50-100 ha > 100 ha
AT -13.5% -15.8% -19.5% -19.3% -11.9% 2.9% 16.8% -3.4%
BE -19.0% -35.7% -28.4% -23.3% -24.1% -17.4% 4.6% 32.9%
BG -1.2% -27.4% 10.4% 71.4% 134.1% 157.1% 140.2% 41.5%
CY -24.9% -22.4% -28.8% -33.6% -21.3% -21.6% -15.4% -25.0%
CZ -23.3% -83.6% -13.3% -7.5% 2.0% 24.2% 18.6% 6.3%
DE -25.7% -82.5% -21.2% -18.3% -22.8% -16.4% -6.6% 18.8%
DK -16.0% 18.8% 0.4% -11.9% -23.2% -31.6% -37.7% 5.2%
EE -41.1% -61.9% -43.9% -35.1% -21.7% -20.9% 3.8% 57.8%
ES -11.8% -15.8% -16.1% -15.5% -12.6% 3.0% 6.2% 2.1%
FI -14.7% -16.2% -17.6% -24.1% -25.3% -19.2% 7.0% 69.0%
FR -15.2% -15.9% -18.4% -21.3% -26.8% -27.2% -17.5% 12.4%
GB -15.3% -75.9% -0.7% -3.2% -4.7% -6.7% -7.5% -1.5%
GR -18.1% -20.0% -20.0% -14.8% -8.0% -5.3% 10.0% -1.3%
HU -16.7% -29.6% -20.9% -10.1% 6.4% 10.2% 22.3% 35.9%
IE 2.7% 7.0% -21.0% 4.5% 3.5% 9.1% 12.2% 5.1%
IT -9.3% -15.5% -9.4% -1.5% -4.0% 5.9% 11.6% 8.9%
LT -29.6% -37.0% -30.3% -24.6% -10.9% 17.4% 60.5% 83.6%
LU -9.1% -27.3% 0.0% -10.5% -14.3% -20.0% -17.9% 29.4%
LV -23.1% -44.4% -23.0% -12.7% 1.6% 6.5% 22.3% 69.1%
MT -1.4% -4.3% 4.5% 33.3% ----- ----- ----- -----
NL -14.1% -13.2% -15.6% -20.5% -24.4% -16.9% 5.8% 24.9%
PL -5.7% -3.6% -10.1% -11.4% -0.9% 18.5% 48.6% 47.3%
PT -17.4% -22.5% -14.4% -15.1% -13.0% -6.2% 6.9% 8.1%
RO -19.4% -23.6% -16.6% 16.6% 75.9% 107.8% 97.4% 33.7%
SE 5.3% 39.5% 54.3% 3.9% -10.6% -17.0% -20.5% 0.8%
SI -9.5% -8.0% -15.5% -13.8% 22.4% 76.4% 153.3% 42.9%
SK 10.4% -18.9% 78.5% 56.7% 73.8% 45.8% 41.8% 19.5%
Source: author’s construction based on Agriculture in the…, 2010; the Farm Structure Survey, 2010
A. Majchrzak Diversity of Agrarian Structures in EU Member States – Dynamic Approach
23
Economic Science for Rural Development No. 32, 2013
ISSN 1691-3078
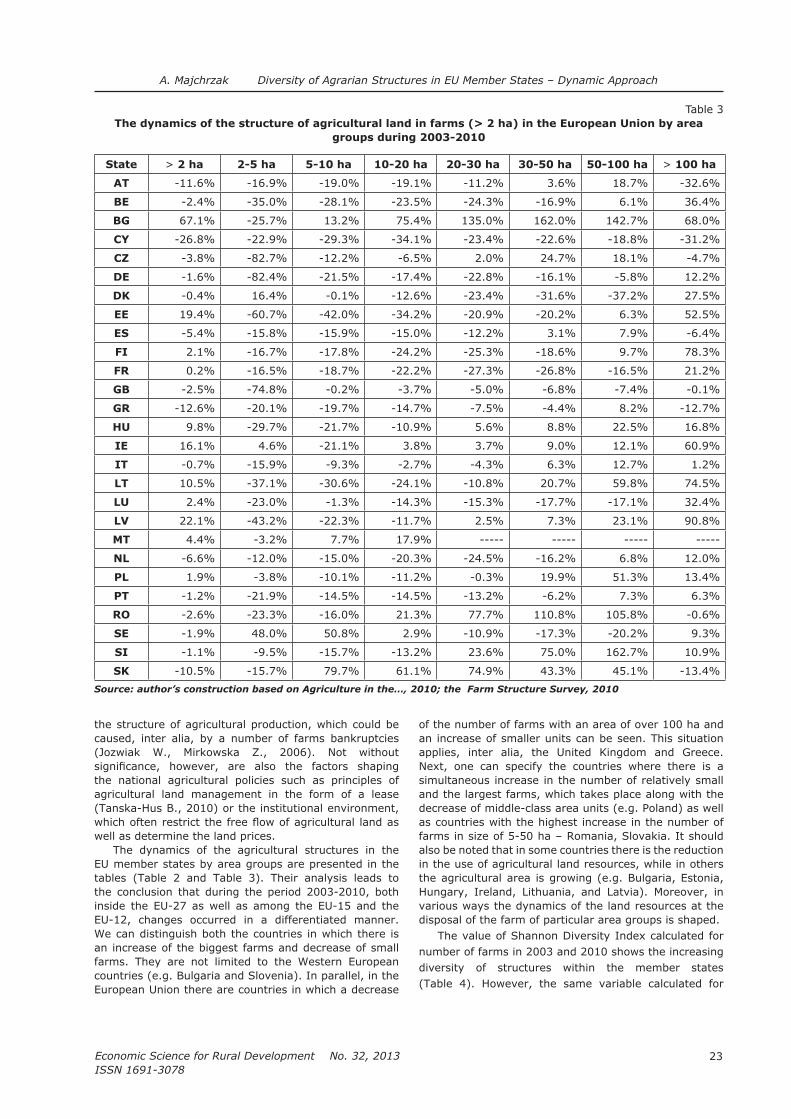
the structure of agricultural production, which could be caused, inter alia, by a number of farms bankruptcies
the national agricultural policies such as principles of agricultural land management in the form of a lease (Tanska-Hus B., 2010) or the institutional environment,
well as determine the land prices.The dynamics of the agricultural structures in the
EU member states by area groups are presented in the tables (Table 2 and Table 3). Their analysis leads to the conclusion that during the period 2003-2010, both inside the EU-27 as well as among the EU-15 and the EU-12, changes occurred in a differentiated manner. We can distinguish both the countries in which there is an increase of the biggest farms and decrease of small farms. They are not limited to the Western European countries (e.g. Bulgaria and Slovenia). In parallel, in the European Union there are countries in which a decrease
of the number of farms with an area of over 100 ha and an increase of smaller units can be seen. This situation applies, inter alia, the United Kingdom and Greece. Next, one can specify the countries where there is a simultaneous increase in the number of relatively small and the largest farms, which takes place along with the decrease of middle-class area units (e.g. Poland) as well as countries with the highest increase in the number of
also be noted that in some countries there is the reduction in the use of agricultural land resources, while in others the agricultural area is growing (e.g. Bulgaria, Estonia, Hungary, Ireland, Lithuania, and Latvia). Moreover, in various ways the dynamics of the land resources at the disposal of the farm of particular area groups is shaped.
The value of Shannon Diversity Index calculated for number of farms in 2003 and 2010 shows the increasing diversity of structures within the member states (Table 4). However, the same variable calculated for
Table 3 The dynamics of the structure of agricultural land in farms (> 2 ha) in the European Union by area
groups during 2003-2010
State > 2 ha 2-5 ha 5-10 ha 10-20 ha 20-30 ha 30-50 ha 50-100 ha > 100 ha
AT -11.6% -16.9% -19.0% -19.1% -11.2% 3.6% 18.7% -32.6%
BE -2.4% -35.0% -28.1% -23.5% -24.3% -16.9% 6.1% 36.4%
BG 67.1% -25.7% 13.2% 75.4% 135.0% 162.0% 142.7% 68.0%
CY -26.8% -22.9% -29.3% -34.1% -23.4% -22.6% -18.8% -31.2%
CZ -3.8% -82.7% -12.2% -6.5% 2.0% 24.7% 18.1% -4.7%
DE -1.6% -82.4% -21.5% -17.4% -22.8% -16.1% -5.8% 12.2%
DK -0.4% 16.4% -0.1% -12.6% -23.4% -31.6% -37.2% 27.5%
EE 19.4% -60.7% -42.0% -34.2% -20.9% -20.2% 6.3% 52.5%
ES -5.4% -15.8% -15.9% -15.0% -12.2% 3.1% 7.9% -6.4%
FI 2.1% -16.7% -17.8% -24.2% -25.3% -18.6% 9.7% 78.3%
FR 0.2% -16.5% -18.7% -22.2% -27.3% -26.8% -16.5% 21.2%
GB -2.5% -74.8% -0.2% -3.7% -5.0% -6.8% -7.4% -0.1%
GR -12.6% -20.1% -19.7% -14.7% -7.5% -4.4% 8.2% -12.7%
HU 9.8% -29.7% -21.7% -10.9% 5.6% 8.8% 22.5% 16.8%
IE 16.1% 4.6% -21.1% 3.8% 3.7% 9.0% 12.1% 60.9%
IT -0.7% -15.9% -9.3% -2.7% -4.3% 6.3% 12.7% 1.2%
LT 10.5% -37.1% -30.6% -24.1% -10.8% 20.7% 59.8% 74.5%
LU 2.4% -23.0% -1.3% -14.3% -15.3% -17.7% -17.1% 32.4%
LV 22.1% -43.2% -22.3% -11.7% 2.5% 7.3% 23.1% 90.8%
MT 4.4% -3.2% 7.7% 17.9% ----- ----- ----- -----
NL -6.6% -12.0% -15.0% -20.3% -24.5% -16.2% 6.8% 12.0%
PL 1.9% -3.8% -10.1% -11.2% -0.3% 19.9% 51.3% 13.4%
PT -1.2% -21.9% -14.5% -14.5% -13.2% -6.2% 7.3% 6.3%
RO -2.6% -23.3% -16.0% 21.3% 77.7% 110.8% 105.8% -0.6%
SE -1.9% 48.0% 50.8% 2.9% -10.9% -17.3% -20.2% 9.3%
SI -1.1% -9.5% -15.7% -13.2% 23.6% 75.0% 162.7% 10.9%
SK -10.5% -15.7% 79.7% 61.1% 74.9% 43.3% 45.1% -13.4%
Source: author’s construction based on Agriculture in the…, 2010; the Farm Structure Survey, 2010
A. Majchrzak Diversity of Agrarian Structures in EU Member States – Dynamic Approach

Economic Science for Rural Development No. 32, 2013
ISSN 1691-3078
24
the whole EU in the whole period remained unchanged. On the other hand, the decreasing rate of SHDI for the agricultural area by area groups means the diminishing diversity of UAA structure within the member states. In this case, the variation was reduced in scope of the EU-27.
Conclusions The analyses show that, despite the fact that
European agriculture is based on family farms, agrarian structures inside the EU are formed in a various ways, which are affected by many factors – both endogenous
approach, but also by the dynamics of the presented structures. This in turn indicates that pointing out one universal model of agricultural structure, to which the EU member states tend, is not possible. What’s more, the diversity of these structures will be increasingly
Agricultural Policy. Every EU country has the opportunity
agriculture, which will improve its competitiveness, yet not necessarily through the impact on agrarian structure. Taking into account the reforms of the
and rural areas instead of direct agricultural support
the multidirectional development of agricultural structures in the EU will continue. It should be noted, however, that the relative diversity of agricultural
with the potential to provide unconventional food and
of large commodity farms and small family farms in
production functions, including the maintenance of socio-economic activity, environmental safety and rural culture. Therefore, it can be stated that the diversity of agricultural structures in the EU is a strong point of European agriculture.
Bibliography 1. Ewolucja Wspolnej Polityki
dekade XXI wieku (The Evolution of the Common
Agricultural Policy of the European Union and its
century). In: Kopycinska, D. (ed.). Polityka Unii
Europejskiej
Table 4 of agricultural structures in the EU member states – Shannon Diversity Index
Number of farms by area groups
StateSHDI 2003
SHDI 2010
StateSHDI 2003
SHDI 2010
StateSHDI 2003
SHDI 2010
AT 1.73 1.77 FI 1.81 1.86 LV 1.50 1.65
BE 1.88 1.90 FR 1.91 1.88 MT ---- ----
BG 1.14 1.54 GB 1.92 1.87 NL 1.85 1.87
CY 1.27 1.25 GR 1.23 1.28 PL 1.37 1.41
CZ 1.82 1.87 HU 1.52 1.67 PT 1.35 1.42
DE 1.91 1.86 IE 1.80 1.79 RO 0.71 0.86
DK 1.83 1.83 IT 1.43 1.50 SE 1.91 1.90
EE 1.59 1.81 LT 1.21 1.38 SI 1.19 1.25
ES 1.72 1.77 LU 1.78 1.78 SK 1.39 1.64
UAA by area gruops
StateSHDI 2003
SHDI 2010
StateSHDI 2003
SHDI 2010
StateSHDI 2003
SHDI 2010
AT 1.83 1.83 FI 1.67 1.61 LV 1.83 1.60
BE 1.68 1.60 FR 1.30 1.15 MT ---- ----
BG 0.69 0.68 GB 1.00 0.95 NL 1.71 1.67
CY 1.91 1.92 GR 1.88 1.90 PL 1.84 1.87
CZ 0.51 0.52 HU 1.32 1.21 PT 1.47 1.37
DE 1.45 1.30 IE 1.67 1.64 RO 1.24 1.34
DK 1.32 1.11 IT 1.88 1.87 SE 1.43 1.41
EE 1.43 1.03 LT 1.84 1.70 SI 1.64 1.79
ES 1.42 1.41 LU 1.22 1.14 SK 0.30 0.43
Source: author’s construction based on Agriculture in the…, 2010; the Farm Structure Survey, 2010
A. Majchrzak Diversity of Agrarian Structures in EU Member States – Dynamic Approach
25
Economic Science for Rural Development No. 32, 2013
ISSN 1691-3078
pp. 28-29.
2. Agriculture in the EU – Statistical and Economic
Information Report 2010, The European Union, DG Agri, March 2011.
3. An Inside View of
the CAP Reform Process. Explaining the MacSharry,
Agenda 2000, and Fischler Reforms. New York: Oxfrod University Press, pp. 125-150.
4. Integration into the EU on the Economic Results of Different Types of Individual Farms in Poland. In:
Jelgava: Economic Science for Rural Development, Issue: 20, Jelgava, LLU. pp. 126-132.
5.
Dilemmas and Recommendations. In: Proceedings
LLU. pp. 202-209.6. Wspolna polityka
rolna UE po 2013 r. a interesy polskiego rolnictwa. (Common Agricultural Policy of the EU after 2013 and
the Interests of the Polish Agriculture) Ekonomista, Issue: 1, pp. 9-36.
7. Efektywnosc
rynku ziemi rolniczej oraz waloryzacja rent
gruntowych w kontekscie regulacji instytucjonalno-
prawnych w wybranych panstwach czlonkowskich
Unii Europejskiej (The Effectiveness of the
Agricultural Land Market and Valorisation of Land
Rents in the Context of Institutional and Legal
Regulations in Selected European Union Member
States) Nowe
trendy w metodologii nauk ekonomicznych i
mozliwosci ich wykorzystania w procesie ksztalcenia
akademickiego. T. 1: Problemy ogolne metodologii
nauk ekonomicznych.
8. Zmieniajaca sie
rola rolnictwa w spolecznym u ekonomicznym
funkcjonowaniu obszarow wiejskich (procesy
dostosowawcze polskiego rolnictwa do nowych
wyzwan) (The Changing Role of Agriculture in
Social and Economic Functioning of Rural Areas
(the Adjustment Process of Polish Agriculture
to New Challenges).
Wyzwania przed obszarami wiejskimi i rolnictwem
w perspektywie lat 2014-2020. Instytut
9. The Farm Structure Survey, Eurostat Retrieved: http://epp.eurostat.ec.europa.eu/portal/page/portal/agriculture/data/database. Access: 15.12.2012
10. Wplyw liberalizacji
wspolnej polityki rolnej na kondycje ekonomiczna
gospodarstw rolnych w wybranych krajach Unii
Europejskiej (The Impact of the Liberalization of
the Common Agricultural Policy on the Economic
Condition of the Farms in Selected Countries of
the European Union. Zagadnienia Ekonomiki Rolnej Issue: 2 (307).
11. Wspolna Polityka Rolna. Zagadnienia prawne.
(The Common Agricultural Policy. Legal Issues)
pp. 70-74.
12. Komunikat Komisji do Rady, Parlamentu
Europejskiego, Komitetu Regionow i Europejskiego
Komitetu Ekonomiczno-spolecznego – Zielona
ksiega w sprawie spojnosci terytorialnej.
(Communication from the Commission to the
Council, the European Parliament, the Committee of
the Regions and the European Economic and Social
Committee - Green Paper on Territorial Cohesion.
Turning Territorial Diversity into Strength). Komisja
2550, Retrieved: http://ec.europa.eu/regional_policy/consultation/terco/paper_terco_pl.pdf. Access: 25.04.2010
13. Struktury agrarne w panstwach
zalozycielskich Unii Europejskiej i w Polsce w dlugim
okresie (Agrarian Structures of the European Union
Founding Countries and Poland in the Long Term). In: Sokolowksa, S., Bisaga, A. (ed.). Problemy
transformacji rolnictwa europejskiego. Opole: Wydawnictwo Uniwersytetu Opolskiego, 2010.
14. Rynek ziemi rolniczej; stan i perspektywy
(Agricultural land market, the state and prospects),
nr 13, 15. Tanska-Hus, B. (2010). Dzierzawa jako instrument
mobilnosci ziemi w Polsce i UE (Lease as an
Instrument of Land Mobility in Poland and the EU),
16. Ewolucja wspolnej polityki
rolnej UE i strategia rozwoju rolnictwa polskiego
(The Evolution of the Common Agricultural Policy of
EU and Strategy of Polish Agriculture Development).
pp. 11-15, p.25, pp.33-62.
17. Polskie przeslanki zmian WPR.
Wyzwania przed obszarami
wiejskimi i rolnictwem w perspektywie lat 2014-
2020 (Challenges for Rural Areas and Agriculture in
the Perspective of the Years 2014-2020),
18. Zawalinska, K. (2010). Wielofunkcyjnosc rolnictwa w
ujeciu modelowym (Multifunctionality of Agriculture -
Model Approach). In: Wilkin J. (ed.). Wielofunkcyjnosc
rolnictwa. Kierunki badan, podstawy metodologiczne
i implikacje praktyczne
Wsi i Rolnictwa PAN.
A. Majchrzak Diversity of Agrarian Structures in EU Member States – Dynamic Approach

Economic Science for Rural Development No. 32, 2013
ISSN 1691-3078
26
W. Bienkowska Activities of Local Authorities in Promoting Entrepreneurship in Poland
___________________________1
E-mail address: [email protected]
ACTIVITIES OF LOCAL AUTHORITIES IN PROMOTING ENTREPRENEURSHIP IN POLAND
Wioletta Bienkowska1, PhDWarsaw University of Life Sciences
Abstract. The article brings closer to the concept and the essence of entrepreneurship in rural areas in Poland. The aim of this study was to present the action taken by the local authorities in promoting entrepreneurship, depending on the level of development of the municipality. The empirical research was done in 2009 and it encompassed 229 rural
method used in the development of the standard taxonomic by Z. Hellwig (Hellwig Z., 1968) and the data relating with the activities of local business support came from the research of their own. It was found that the development of entrepreneurship in rural areas was due to the existence of a particular place and time, and adequate resources, both tangible and intangible as well as adequate capital and people with the right knowledge and willingness to bear the risk of contributing to the development of the entire area.Key words:
JEL code: R11
IntroductionEffective assistance of local authorities in promoting
entrepreneurship can contribute to the economic development of the region. Actions taken to increase the competitiveness of the area are particularly important in terms of access to local markets for companies integrating into Europe. In a market economy, which is an essential feature of competition on the markets,
is quite an important issue. It is something more than resourcefulness of life, which consists in dealing with crisis. The issue of the development of local entrepreneurship is
through the development of the local economy, inter alia, increase of the GDP per capita, increase of jobs, and change of the economic structure of the area. The effects of this development should be: new businesses and jobs, increase in the volume and quality of services, resources in attractive locations (farmed land, real estate etc.), intellectual resources (skills, knowledge,
The aim of this study was to present the action taken by the local authorities in promoting entrepreneurship depending on the level of development of the municipalities surveyed. Empirical studies were carried out in 229 rural
statistical data were obtained from the Local Data Bank
level of development of local municipalities, the author used the method of pattern development taxonomic of
of synthetic variables to organise multi-dimensional socio-economic facilities in terms of their development.
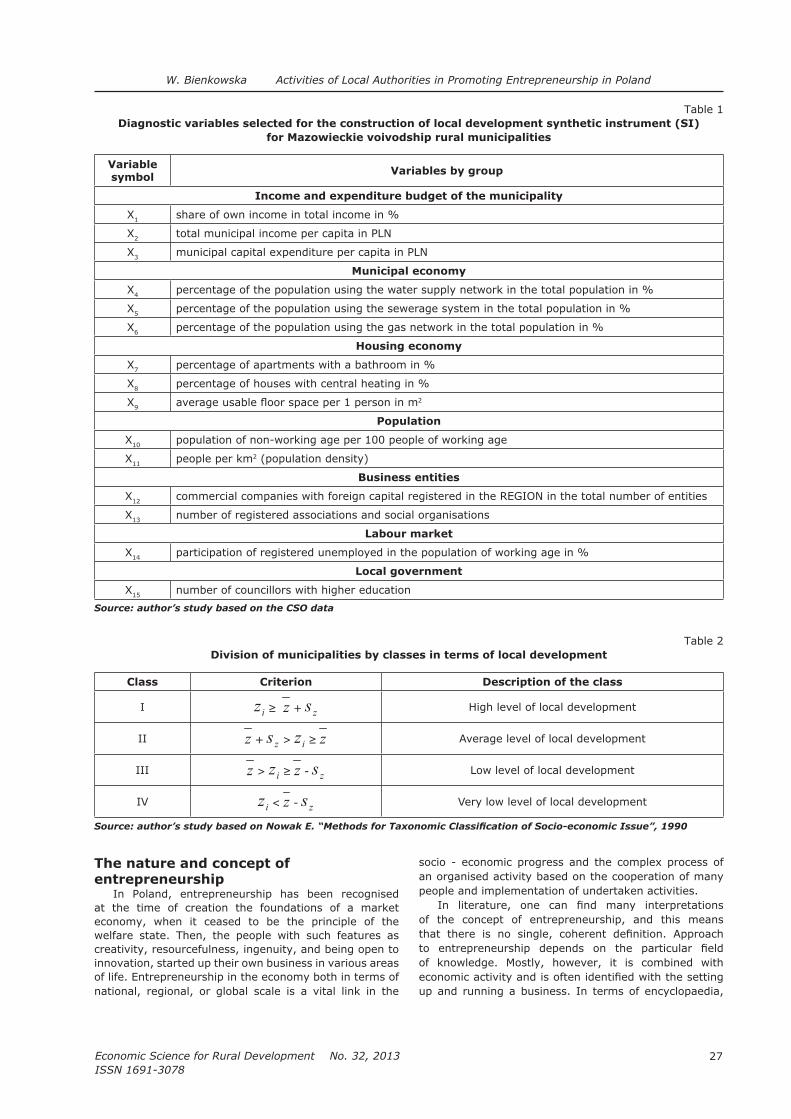
The design of local development of synthetic instrument (SI) was carried out in several successive stages. It was preceded by a process of selection of diagnostic variables that describe the phenomenon of
socio-economic development of municipalities. These variables were extracted taking into account three types of criteria such as value, form, and statistics. Subsequently, the strength of relation between variables
Finally, the study selected 15 variables describing various spheres of socio-economic development of the municipalities surveyed. The choice of diagnostic variables was preceded by a literature review on the development of local entrepreneurship and local governments, and variables selected on this basis are shown in Table 1.
The next stage involves the construction of local development taxonomic using the method of Z. Hellwig. This measure is one of the taxonomic methods which measures aggregate as a synthetic measure of taxonomic distance of the object from the so-called pattern of development which is an abstract object (in particular, it may be a really existing object) (Nowak E., 1990).
The calculated SI values were the starting point for linear arrangement of rural municipalities and isolation
municipalities in terms of their level of development was done based on the arithmetic mean and standard deviation - s. The set of objects is divided into four groups, as shown in Table 2 (the number of classes was known in advance).
Data relating with the activities of local business support were taken from the author’s own research, namely, a diagnostic survey carried out by using the technique of a standardised questionnaire survey addressed to the representatives of the local authorities. The questionnaire was sent to all rural municipalities
and the return of questionnaires was obtained from 137 municipalities, representing 60% of the surveyed municipalities.
27
Economic Science for Rural Development No. 32, 2013
ISSN 1691-3078
W. Bienkowska Activities of Local Authorities in Promoting Entrepreneurship in Poland
The nature and concept of entrepreneurship
In Poland, entrepreneurship has been recognised at the time of creation the foundations of a market economy, when it ceased to be the principle of the welfare state. Then, the people with such features as creativity, resourcefulness, ingenuity, and being open to innovation, started up their own business in various areas of life. Entrepreneurship in the economy both in terms of national, regional, or global scale is a vital link in the
socio - economic progress and the complex process of an organised activity based on the cooperation of many people and implementation of undertaken activities.
of the concept of entrepreneurship, and this means
of knowledge. Mostly, however, it is combined with
up and running a business. In terms of encyclopaedia,
Table 1Diagnostic variables selected for the construction of local development synthetic instrument (SI)
for Mazowieckie voivodship rural municipalities
Variable symbol
Variables by group
Income and expenditure budget of the municipality
X1 share of own income in total income in %
X2 total municipal income per capita in PLN
X3 municipal capital expenditure per capita in PLN
Municipal economy
X4 percentage of the population using the water supply network in the total population in %
X5 percentage of the population using the sewerage system in the total population in %
X6 percentage of the population using the gas network in the total population in %
Housing economy
X7 percentage of apartments with a bathroom in %
X8 percentage of houses with central heating in %
X92
Population
X10 population of non-working age per 100 people of working age
X11 people per km2 (population density)
Business entities
X12 commercial companies with foreign capital registered in the REGION in the total number of entities
X13 number of registered associations and social organisations
Labour market
X14 participation of registered unemployed in the population of working age in %
Local government
X15 number of councillors with higher education
Source: author’s study based on the CSO data
Table 2 Division of municipalities by classes in terms of local development
Class Criterion Description of the class
Ii
+ s High level of local development
II + s > iAverage level of local development
III > i - s Low level of local development
IVi < - s Very low level of local development
Economic Science for Rural Development No. 32, 2013
ISSN 1691-3078
28
W. Bienkowska Activities of Local Authorities in Promoting Entrepreneurship in Poland
entrepreneurship is the ability to be entrepreneurial, have a spirit of initiative, gumption, and resourcefulness (Polish Language Dictionary, 1988). However, according to the P. F. Drucker, the world expert in knowledge of business, this is the interdependence of the entrepreneurial and innovative skills, so that it is possible to achieve the pursued objective - for success in a particular market segment or business (Drucker P.F., 1992). J. Schumpeter emphasised the close relationship between the enterprise in terms of macroeconomics, treating it as a major factor in the economic development and the concept of individual micro-entrepreneurs, whom he called an innovator (Sikorska-Wolak I., 2008).
Entrepreneurship can be seen in three aspects,
and experience, critical evaluation; the behaviour and actions that can exploit this opportunity, taking risks, overcoming limitations; and the result of entrepreneurial thought and action, which is innovation, making business
ability to see possibilities inherent in the environment and their use in order to do business in the form of an organised enterprise, resulting from the internal (subjective) abilities of a person, or an entrepreneur (Nogalski B., 2003). Speaking of entrepreneurs and their entrepreneurial activities should be aware of their importance for the development of the economy that gives rise to innovation, creates new jobs and contribute to the development of individual operators, and thus, becomes an important entrepreneurial economic category. It can be considered in terms of individuals, the action team and the company as well as local government units.
In summary discussion of the concept and the essence of entrepreneurship, one can conclude that this issue is quite complex, multi-faceted combining many
in the modern economy is a symbol of success, winning
risky ventures, production and market initiatives in order
Research results and discussionAn important task in the development of
local governments is to develop entrepreneurial attitudes that contribute to act in different areas of human life, especially in business
Development of entrepreneurship in rural areas is largely dependent on the state aid and local authorities. Therefore, the development of entrepreneurship is important for creating the right conditions, and encouraging and leading business.
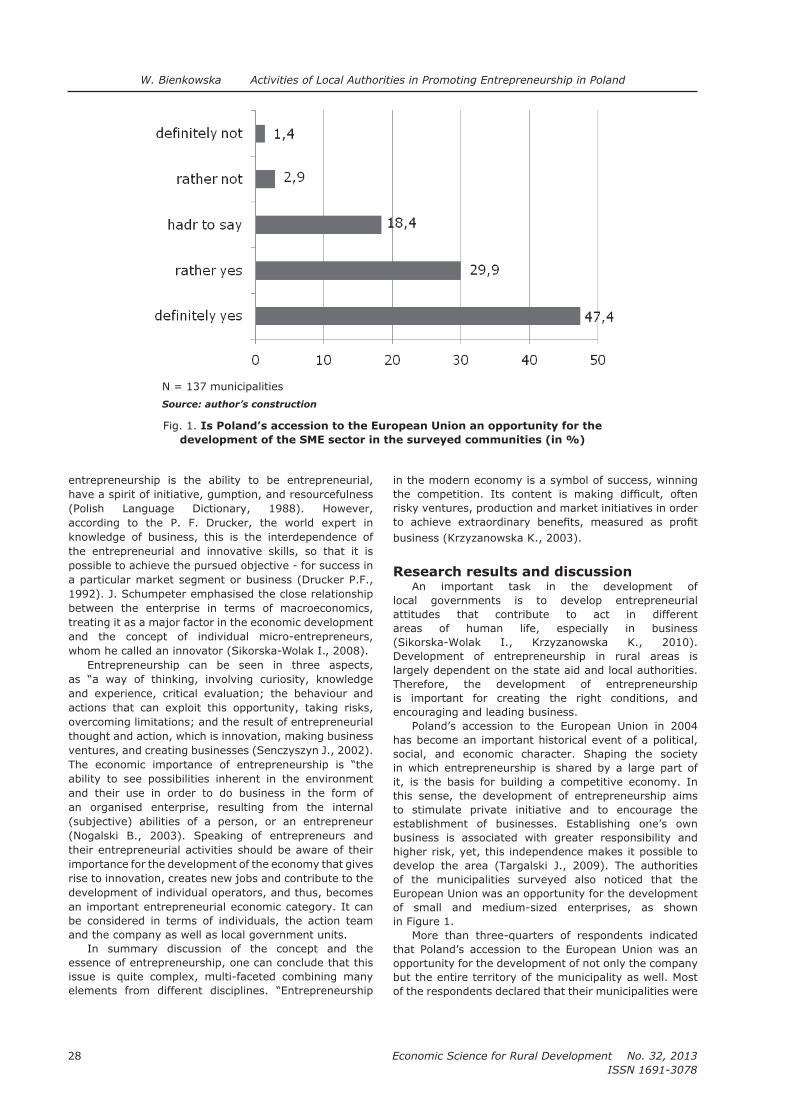
Poland’s accession to the European Union in 2004 has become an important historical event of a political, social, and economic character. Shaping the society in which entrepreneurship is shared by a large part of it, is the basis for building a competitive economy. In this sense, the development of entrepreneurship aims to stimulate private initiative and to encourage the establishment of businesses. Establishing one’s own business is associated with greater responsibility and higher risk, yet, this independence makes it possible to develop the area (Targalski J., 2009). The authorities of the municipalities surveyed also noticed that the European Union was an opportunity for the development
in Figure 1.
More than three-quarters of respondents indicated that Poland’s accession to the European Union was an opportunity for the development of not only the company but the entire territory of the municipality as well. Most of the respondents declared that their municipalities were
N = 137 municipalities
Source: author’s construction
Fig. 1. Is Poland’s accession to the European Union an opportunity for the
development of the SME sector in the surveyed communities (in %)

29
Economic Science for Rural Development No. 32, 2013
ISSN 1691-3078
W. Bienkowska Activities of Local Authorities in Promoting Entrepreneurship in Poland
taken actions aimed at helping entrepreneurs in obtaining funds from the European Union budget for running a business (Bienkowska W., 2012).
The study looked for an answer the question of what forms municipal authorities take to provide support to entrepreneurs. Table 2 presents detailed information.
The municipalities with the lowest level of local development activities often focus on training of entrepreneurs and supporting and promoting local leaders rather than the municipalities with a higher level of development. However, this cannot be referred to the taken action in these communities in the partnership.
Local authorities, business, and local communities are aware of the right and the need to take action to create favourable conditions for the development of entrepreneurship. In fact, entrepreneurs often face many obstacles in their actions which require not only a lot of
time and money but turn to be a stressful occupation which may have an effect on discouraging the next steps to be taken in developing the scale and scope of operations (Targalski J., 2009). Table 3 shows the factors hindering the use of the European Union funds, taking into account the level of development of local classes in the surveyed municipalities.
The municipalities with the lowest level of local
obtaining funds from the European Union related with
lack of experienced individuals for the preparation of applications was the lowest barrier in the opinion of the respondents.
Another issue affecting the development of the
with the economic situation of the country and the
Table 2 Forms of action taken for local entrepreneurs assistance in obtaining funds from the European Union
according to the level meter for local development (in %)
Classes of municipalities by the local development level measure (data for 2009)
N = 10 N = 52 N = 71 N = 4
Organisation of training courses for entrepreneurs60.0 51.9 52.1 75.0
Supporting and promoting local leaders 30.0 42.3 42.3 75.0
Promoting cooperation with business organisations20.0 32.7 31.0 0.0
Promoting partnerships 10.0 9.6 12.7 0.0
entrepreneurs 10.0 0.0 14.1 25.0
* the tested could indicate more than one answer
Source: author’s research
Table 3Factors impeding the use of the EU funds by the local development level measure (in %)
Classes of municipalities by the local development level
measure (data for 2009)
N = 10 N = 52 N = 71 N = 4
Long period of waiting for a decision to grant or not to grant funds
90.0 80.8 78.9 75.0
Long period of collecting the required documents 80.0 84.6 74.6 75.0
70.0 82.7 83.1 100.0
No experienced person with the preparation of proposals
10.0 21.2 25.4 0.0
High costs for preparing the proposal / business plan
70.0 63.5 69.0 75.0
Too complicated legal regulations 90.0 65.4 62.0 75.0
Reporting on implementation of the proposal 80.0 73.1 70.4 50.0
* the tested could indicate more than one answer
Source: author’s research
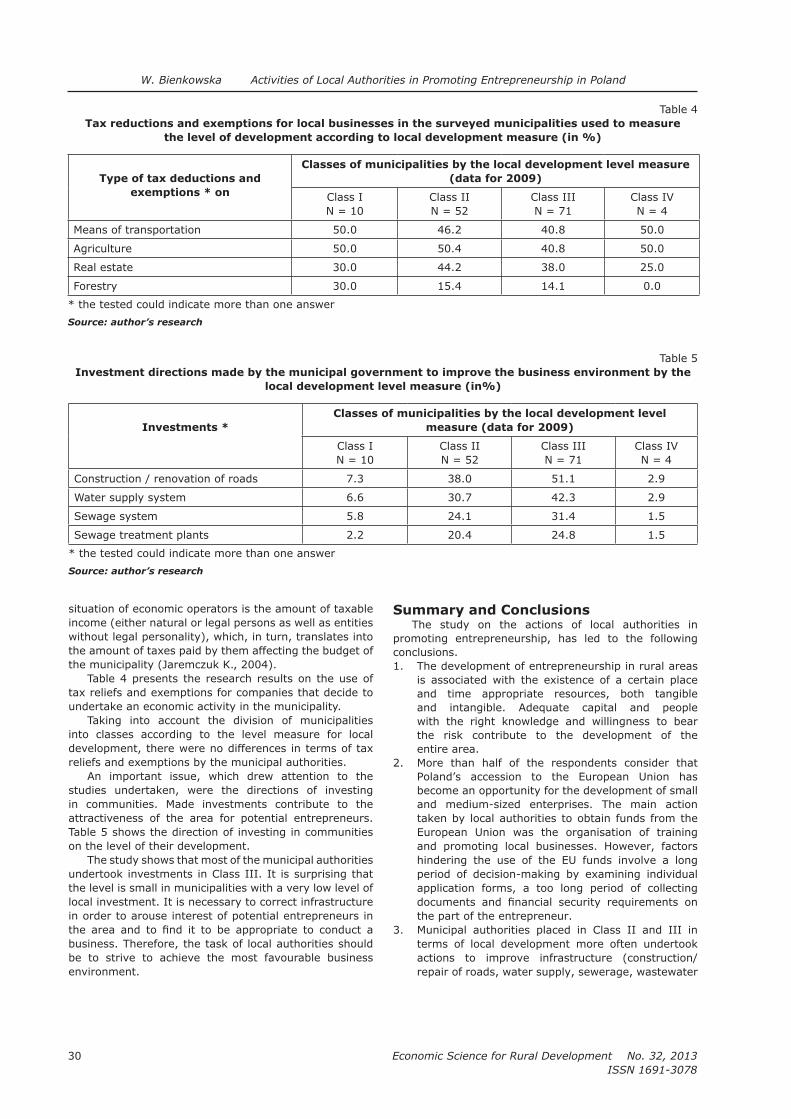
Economic Science for Rural Development No. 32, 2013
ISSN 1691-3078
30
W. Bienkowska Activities of Local Authorities in Promoting Entrepreneurship in Poland
situation of economic operators is the amount of taxable income (either natural or legal persons as well as entities without legal personality), which, in turn, translates into the amount of taxes paid by them affecting the budget of
Table 4 presents the research results on the use of tax reliefs and exemptions for companies that decide to undertake an economic activity in the municipality.
Taking into account the division of municipalities into classes according to the level measure for local development, there were no differences in terms of tax reliefs and exemptions by the municipal authorities.
An important issue, which drew attention to the studies undertaken, were the directions of investing in communities. Made investments contribute to the attractiveness of the area for potential entrepreneurs. Table 5 shows the direction of investing in communities on the level of their development.
The study shows that most of the municipal authorities
the level is small in municipalities with a very low level of local investment. It is necessary to correct infrastructure in order to arouse interest of potential entrepreneurs in
business. Therefore, the task of local authorities should be to strive to achieve the most favourable business environment.
Summary and ConclusionsThe study on the actions of local authorities in
promoting entrepreneurship, has led to the following conclusions.1. The development of entrepreneurship in rural areas
is associated with the existence of a certain place and time appropriate resources, both tangible and intangible. Adequate capital and people with the right knowledge and willingness to bear the risk contribute to the development of the entire area.
2. More than half of the respondents consider that Poland’s accession to the European Union has become an opportunity for the development of small
taken by local authorities to obtain funds from the European Union was the organisation of training and promoting local businesses. However, factors hindering the use of the EU funds involve a long period of decision-making by examining individual application forms, a too long period of collecting
the part of the entrepreneur.3.
terms of local development more often undertook actions to improve infrastructure (construction/ repair of roads, water supply, sewerage, wastewater
Table 4Tax reductions and exemptions for local businesses in the surveyed municipalities used to measure
the level of development according to local development measure (in %)
Type of tax deductions and
exemptions * on
Classes of municipalities by the local development level measure
(data for 2009)
N = 10 N = 52 N = 71 N = 4
Means of transportation 50.0 46.2 40.8 50.0
Agriculture 50.0 50.4 40.8 50.0
Real estate 30.0 44.2 38.0 25.0
Forestry 30.0 15.4 14.1 0.0
* the tested could indicate more than one answer
Source: author’s research
Table 5 Investment directions made by the municipal government to improve the business environment by the
local development level measure (in%)
Investments *
Classes of municipalities by the local development level
measure (data for 2009)
N = 10 N = 52 N = 71 N = 4
7.3 38.0 51.1 2.9
Water supply system 6.6 30.7 42.3 2.9
Sewage system 5.8 24.1 31.4 1.5
Sewage treatment plants 2.2 20.4 24.8 1.5
* the tested could indicate more than one answer
Source: author’s research
31
Economic Science for Rural Development No. 32, 2013
ISSN 1691-3078
W. Bienkowska Activities of Local Authorities in Promoting Entrepreneurship in Poland
treatment plants) technology, which greatly helps increase the attractiveness of the land.
Entrepreneurship plays an important role in the socio-economic development. It is a key factor for reducing unemployment and building a competitive economy based on private property. The SME development is thus one of the primary objectives of economic policy of the country (Babuchowska K., Marks-Bielska R., 2010).
Bibliography1. Babuchowska, K., Marks-Bielska, R. (2010).
(Support
for entrepreneurship in rural areas by the funds
of RDP 2007 – 2013).
2. Bienkowska, W. (2012). Formy wsparcia
(Forms of business
support by local government units on the example
of rural municipalities in Mazowieckie voivodship).
3. Drucker, P.F. (1992). (Innovation and entrepreneurship -
the practice and rules). 4. Hellwig, Z. (1968). Zastosowanie metody
(Application of
the taxonomic method to division of typological
countries due to their level of development and
. W:
pp. 307-327. 5.
(Entrepreneurship in the functioning of local
government).
6.
(Entrepreneurial teamwork of farmers and its
conditions).
7. Nogalski, B. (2003).
(Entrepreneurship - the modern challenge of the
Polish economy).
8. Nowak, E. (1990).
economic objects). p. 88.
9. (The role of
entrepreneurship in creating small and medium
businesses).
Wydaw.
10. Sikorska – Wolak, I. (2008). Wieloaspektowosc
(Many aspects of entrepreneurship
and its perception inhabitants of rural areas).
SGGW,
11.
praktyce (Entrepreneurship in theory and in
practice).
Wydawnictwo SGGW,
12. (Polish Language
Dictionary). (1988).Tom II. 13.
(Entrepreneurship in
the process of the development of local markets).
14. Targalski, J. (2009). Wplyw integracji europejskiej (The impact of
European integration on the development
of entrepreneurship). Wydaw. Uniwersytetu
p. 9.
Economic Science for Rural Development No. 32, 2013
ISSN 1691-3078
32
L. Poplawski Multifunctional Development of Rural Areas in the Imielno
Commune Before and After Integration with The EU
___________________________1 Tel.: 0048 12 662 44 19; Fax: 0048 12 662 43 52 E-mail address: [email protected]
MULTIFUNCTIONAL DEVELOPMENT OF RURAL AREAS IN THE IMIELNO COMMUNE BEFORE AND AFTER INTEGRATION WITH THE EU
Lukasz Poplawski1, PhD, prof. assoc.Agricultural University of KRAKOW
Department of Economy
Abstract. The main aim of the article is to present the evaluation of opinions of inhabitants about multifunctional development of rural areas in the Imielno commune. The evaluation is based on the compilation of opinions of inhabitants who expressed their views in questionnaires before and after integration with the EU. In Poland, the territory covered by protected areas amounts to 33.1%. The region with the highest percentage of
Imielno municipality, in which protected areas occupy 51%. Most of these areas are landscape parks and protected landscape areas. The poll was conducted among 117 inhabitants who expressed their opinions in questionnaires before the EU integration and 109 people who expressed their opinions after that event. This paper presents the conditions and courses of eco-
and after integration with the EU. The research was based on inhabitants’ opinions concerning particular courses of development, i.e. tourism, services, handicraft, industry, agriculture, food processing, and environmental protection. The results show that before the integration with the EU, agriculture and services were the most preferred courses of development in the protected areas of the Imielno municipality, whereas after the integration – the respondents preferred industry and agriculture. Key words: multifunctional development, opinions of inhabitants, rural areas, protected areas.JEL code: Q15, Q56
1. IntroductionThe conditions of the development in the protected
areas result from the potential of natural resources in this area as well as from objective conditions shaping their position in the region. Development processes should take place in the atmosphere of social acceptance of the development programme. The role of the local community, being a subject in the realisation of strategic goals, is based on the evaluation and analysis of inhabitants’ attitudes, their expectations towards the courses of future development, and legal conditions specifying action proceedings.
At the end of 2003, spatial forms of nature and landscape preservation constituted 33.1% of the total
together with national parks, nature reserves, and protected landscape areas make up the system of protected areas as a set of mutually complementary
protected areas are subject to particular legal statutes
as a process of economic, social, cultural, and political changes leading to the rise of the level of residents’ prosperity through the process of transformation from less advanced states to the ones that are more advanced
tasks of a commune is especially securing a harmonious development, i.e. balance between social and material elements of the commune as well as between economic and ecological ones.
accomplish strategic plans on their own as well as search
society, which can be achieved by involving the regional society in the process of strategy building, especially regional authorities and opinion-shaping circles.
The necessity of carrying research on the development of protected areas was the reason to refer to this problem in the current publication, and its goal is to show the opinions of inhabitants about multifunctional development of rural areas in Imielno commune before and after integration with the EU.
2. Materials and methodsThe research composed of setting the courses of
voivodeship include, among others, recognising nature and landscape value of the protected areas in the
in 1998. The assessment of environment components was limited to basic factors determining multifunctional and eco-development of rural areas and agriculture.
This paper is based on personal research, in particular: survey results, meetings with Imielno authorities and inhabitants who were concerned about the development
prospects of the protected areas development. People of different levels of education participated in surveys, and surveys involved mainly people considered as leaders according to the notion presented by Siekierski (2004)

33
Economic Science for Rural Development No. 32, 2013
ISSN 1691-3078
such people set the courses of development actions within a particular rural community.
10.060 ha, of which 5.130 ha (51 % of commune’s surface) are occupied by the protected area.
The statistical data and data from the case study given by Imielno commune authorities concerning the economic potential and the population conditions
the course of development preferred by farmers and inhabitants were: the local physical development plan
cultivating the protected area. Out of 150 questionnaires handed to the inhabitants, 117 were used for analysis. In
men and 36% women. Furthermore, 42% of respondents had primary education, 34% – vocational education, 21% – secondary, and 3% – higher education. In the next research, there were 250 questionnaires addressed
and 109 were analysed. The respondents were mainly white-collar workers (30.8 %) and farmers (18.7 %). The carried out survey concerned: favoured courses of development of the research area, ecological awareness, possibility of maintaining agricultural and tourist activity, problems of everyday life hindering the development, some demographic aspects, development chances, and obstacles.
The questionnaires concerned: preferred courses of development in the given area, perspectives, barriers, and chances for development of one’s farm, possibilities of carrying out agricultural and tourist activity, problems of every-day life that hinder the economic development.
3. Results before integration with
the EU The commune contains twenty-two villages, which
Four administrative areas of the village are situated in
actual number of people living in farms’ households is 4300 with an average 4.24 persons per farm. The ratio
of the commune’s agriculture production area’s quality according to the IUNG methodology amounts to 67.4 (5th
rate in Poland is equal to 66.6.The natural conditions of agricultural production of
the commune in general may be reckoned as medium
account, then Imielno commune is located much below the medium conditions.
The area of individual farms in the commune in most of cases is equal to the area from 7 to 15 ha, while in the protected area the individual farms occupy from 5 to 10 ha each. As far as the structure of land use and forms of ownership are concerned, the situation in Imielno commune and in the protected area is relatively stable. Table 1 shows the land use for individual farming (data in ha) in the commune and Landscape Park.
Arable lands occupy 77.2 % of municipality’s area, and 83% of those are plough lands. Permanent green lands make up 12 % of arable land, of which 1.3 % are orchards. Woods cover about 5% of the whole area, including 6.93 ha that are owned by National Ground Found.
In the commune, the average distance from the place of living to the farthest situated area is 2.5 km, and in the given territory varies between 1.5 and 3.6 km. In the protected area, there are mostly farms of which terrain includes about 5 – 7 ha, thus altogether covers up to 783 ha. The most common farms in the commune (7- 10 ha big) occupy up to 617 ha inside the park’s territory.
The average wheat crop in the protected area amounted to 23dt/ha, rye crop 15.8 dt/ha, barley crop 26.8 dt/ha, oat crop 23.5 dt/ha, and potato crop 140 dt/ha.
In the protected area, 177 farms (112 in the park itself) possess farm animals (among which there are 309 cows, 253 hogs, 264 horses, and 3 sheep). 37.6% of the inhabitants and landholders hope to set their future life on their own farm and intend to continue the hitherto existing way of running the farm, 50.4% do not see any chances for own farm’s development, 6.8% of people from the latter group intend to change the
Table 1The use of land for individual farming
Imielno commune Protected area
(ha) in % (ha) in %
Area as a whole 10060.00 100.00 3223.00 100.00
Arable land
total 8073.00 80.24 2207.19 68.48
plough land 6668.00 66.26 1476.94 45.83
orchards 99.00 0.98 12.96 0.40
meadows 966.00 9.60 534.83 16.59
340.00 3.40 182.46 5.66
Woods and woodlands 1078.00 10.72 526.58 16.34
The rest of lands and waste land 909.00 9.04 489.23 15.18
Source: author’s case study
L. Poplawski Multifunctional Development of Rural Areas in the Imielno Commune Before and After Integration with The EU

Economic Science for Rural Development No. 32, 2013
ISSN 1691-3078
34
farming. The respondents’ answers to the question about the courses of development were:
— agriculture – 85 %; — tourism – 42 %; — services – 54 %; — handicraft – 42 %; — industry – 47 %.
Agricultural and food processing along with environmental protection were not researched, because at the end of 2001 nobody had thought about these courses of development yet.
Before the integration with the EU, the respondents’ answers to the question about the greatest barriers that hinder the agricultural development included the following:
— — — lack of preferential credits – 9 %; — low quality of soil – 30 %; — too large division of farms – 27 %.
The conditions that would enable the agricultural development on the protected area are aggregated below:
— organised market – 60,7 %; — farmer’s contract – 33,3 %; — guaranteed prices – 45,3 %; — prices 15% higher – 2,6 %; — prices 30% higher - 9,4 %; — prices 50% higher – 38,5 %.
According to inhabitants of Imielno commune, the most necessary courses of municipality management activities were:
— social assurance – 71,8 %; — health and social welfare – 19,7 %; — shaping of social consciousness – 6,8 %; — developing of commune’s potential – 23,9 %; — shaping and protection of environment – 12,8 %.
Lack of organised market of agricultural products, small-scale food and agricultural processing as well as broadly understood services, not intended only for agriculture, were the most often mentioned problems among respondents. Respondents also stated that the elements of technical and agricultural infrastructure were the factors that to the greatest extend made the life harder and needed to be improved.
4. Results after integration with the EU Taking into consideration external factors, a question
was asked in scope of the survey. The opinion of
is exerted by the commune’s self-government units (47.1 %).
The respondents think that it should involve health care (53.8 %) and safety of inhabitants (59.0 %).
The respondents believe the following courses of economic development to be of highest importance for the commune:
— agriculture – 63.6 %; — agricultural and food processing – 59.6 %; — tourism – 53.9 %; — environmental protection – 63.1 %; — services – 53.3 %;
— handicraft – 44.2 %; — industry – 65.0 %.
Later on, the respondents answered the questions concerning barriers and opportunities for development in the above-mentioned courses of development.
As main barriers for the development of tourism in the commune, they mentioned:
— lack of organised tourist network – 56.2%; — lack of tourist infrastructure – 52.9 %.
They saw, however, an opportunity for the development in credit guarantees (39,4 %).
In respondents’ opinion, the main obstacle for services’ development was:
—– 51.4 %.
An opportunity for the development would be property tax allowances and exemptions (42.3 %).
In respondents’ opinion the main obstacles for handicraft development in the commune were:
— lack of any base for the development of handicraft – 40.2 %;
—development – 50.5 %.
An opportunity for the development they saw in the means of transport tax allowances and exemptions (45.3 %).
In respondents’ opinion, the main obstacles for the development of industry were:
— lack of economic instruments supporting such kind of development – 47.1 %;
—development – 51.4 %.
49.0 % of the respondents regard free legal and economic consultancy as an opportunity for the development. In respondents’ opinion, the main obstacles for the development of environmental protection were:
—development – 51.4 %;
— lack of infrastructure connected with environmental protection – 5.5 %.
The respondents also saw an opportunity for the development in free legal and economic consultancy services (42,7 %).
In respondents’ opinion, the main obstacles for food processing development were:
— lack of investors interested in processing development – 53.9 %;
— lack of market for products of processing – 48.0 %.In this respect, as an opportunity for the development
they saw the means of transport tax allowances and exemptions (44.3 %).
In respondents’ opinions, the main obstacles for the development of agriculture in the commune were the following:
— — lack of organised market for produce – 50.0 %.
The opportunity for the development they saw in free legal and economic consultancy services (46.7 %).
As the most important material and safety issues, that are possible to be carried out in the commune in the present conditions, the respondents have chosen: ensuring better public safety.
As the most urgent and possible activity to be carried out in the present conditions in the commune, the
L. Poplawski Multifunctional Development of Rural Areas in the Imielno Commune Before and After Integration with The EU

35
Economic Science for Rural Development No. 32, 2013
ISSN 1691-3078
respondents named: organised market for agricultural products and produce (62.0 %) and present offer for investors (63.5).
The inhabitants of the Imielno commune believe that the following elements of the infrastructure are
need of being improved: — communication infrastructure – 55.7 %; — agricultural infrastructure – 56.5 %.
As far as the elements of agricultural infrastructure are concerned, in opinion of inhabitants the following objects are underdeveloped and call for urgent improvement:
— agricultural machines and equipment repair services – 50.0 %;
— provisioning and purchase points – 52.8 %.As far as technical infrastructure is concerned, the
following elements are believed to be underdeveloped: — roads (building new ones and rebuilding the existing
ones) – 61.7 %; — building of sewerage system and sewage plants
(building up) – 55.7 %.As far as the social infrastructure is concerned, the
respondents’ opinion is that it would be necessary to build a culture centre (54.8%) and a secondary school in the commune (42.3 %) as an amenity of particular importance for inhabitants.
The most onerous social problems for the commune’s inhabitants were:
— unemployment among adults – 72.2 %; — unemployment among young people – 79.2 %.
As the least serious problems, the inhabitants mentioned national and ethnic problems (41.9 %).
According to the opinion of the local community, the following objectives connected with shaping and protection of environment are the most important:
— keeping the environment clean – 64.8 %; — elimination of illegal waste dumps – 69.2 %.
The respondents thought that tourism (45, 5 %) and environmental protection (51.5 %) have positive impact on the commune’s development in the protected area.
The most important objectives connected with social consciousness and attitudes are:
— availability of diverse forms of development for young people – 59.8 %;
— availability of diverse forms of culture – 53.9 %.
4. DiscussionThe process of transforming the present agriculture
based on the traditional way of cultivating and using the land should lead to the multifunctional development of rural areas, which also implies integrated and environment-friendly agriculture combined with recreation and tourism. Agriculture based on ecological methods should be adjusted to the local landscape and its water and soil conditions. Large labour force resources in agriculture provide a chance for alternative solutions also in such time-consuming branches of specialised agriculture as ecological agriculture, seed production, herb-cultivation, etc. Ecological agriculture should be not only recommended, but also the only one permitted in
such areas, it seems appropriate to promote the most environment-friendly direction of the development, i.e.
ecological agriculture (Siekierski, Dudek 2000). The development of tourism (ecological tourism) ought to be supported and treated as an alternative source of income
(2010) and S. Jarka (2012) have presented a similar point of view.
According to the data of the analysis and surveys conducted among the local population, the author found out that the primary aim – multifunctional and eco-development of the area - is common for normal and protected areas. The long-term goal of the local authorities and the community is to create favourable social and economic conditions, in which the commune authorities will co-operate with the local community as equal partners, inspire and co-ordinate local initiatives. They will also support the multifunctional development and co-operate with the inhabitants of Imielno commune who will cultivate the land in an environment-friendly way.
The following strategic aims should serve the multifunctional and eco-development of the rural areas: transformations in agriculture and food economy, environmental protection, the development of rural areas, tourism and recreation, the dynamic increase in the service sector, and encouraging the local community to support all aspects of social development.
The implementation of long-term initiatives undertaken in the protected areas requires the activity aimed at the further development of the infrastructure, which determines not only improvement of life conditions, but also makes the area more attractive for tourists and prospective investors. It concerns particularly the improvements in the technical and agricultural infrastructure.
policy in protected areas depends on the acceptance of the commune authorities; it should also be consistent with the development of the commune. Another indispensable aspect of the prospective success is a dynamic syllabus of courses organised for local inhabitants, which would comprise all economic spheres of the commune.
The activities connected with introduction and use of ecological methods in agriculture should be an integral part of environment protection activities and eco-development of legally protected areas. Among the factors, which would favour the activities, it is possible to mention respondents’ willingness to use ecological methods, which they expressed in their opinions and declarations (30% of questionnaire’s participants). The outcomes indicate the possibility of implementing eco-development and agriculture, ecological production in Imielno commune. The survey’s participants have different levels of ecological knowledge, eco-development principles, and ecological production methods.
5. ConclusionsBased on the results of the research on multifunctional
rural development in Imielno commune, the conclusions are as follows:
— the results of the assessment of the directions of development – handicraft and services – are assessed the same before and after the integration with the EU;
L. Poplawski Multifunctional Development of Rural Areas in the Imielno Commune Before and After Integration with The EU

Economic Science for Rural Development No. 32, 2013
ISSN 1691-3078
36
— despite the entry into the EU and a very strong support for non-agricultural activities, the respondents still indicate agriculture as the primary direction of development;
— the integration of agriculture is less preferred than before, and increasing number of people are inclined for the development of tourism and industry;
— the creation of markets for product sales and support from the state (contracting, free economy and legal advice)are very important issues for the respondents;
— one of the most important problems of the residents is their provision with a decent standard of living, by which the respondents understand ensuring public
Despite many restrictions resulting from environmental protection and infrastructure
have development possibilities. The development should
multifunctional development, particularly for creation of new non-agricultural work places and facilitating of structural changes in agriculture as well as environment protection infrastructure.
References1.
Development. In: Strategies of local development.
2. Biernat-Jarka, A. (2010). The Management of the EU Rural Development Policy as an Example of the
Management in Multilevel Governance and Policy Network System, Naukovij Visnik Nacionalnogo
Universitetu Bioresursiv i Prirodokoristuvanna
Ukraini 2010, Vip. 154, c. 2, pp. 11-18.3. The Relationships of Farm with
Market in Poland after 1990. An Attempt to Evaluate
the Intensity and Effectiveness
4. Jarka, S. (2012). Vertical Integration in Large-Scale Farms in Poland / Proceedings of the International
2012. In: Management - Leadership - Strategy –
Competitiveness. Hungary: Gödöllö: Vol. 2., 2012. pp. 527-532.
5. Statistical Yearbook - Environment (2003). GUS,
6. Siekierski, J. Dudek, P. (2000). Sustainable Development of Polish Agriculture and Rural Development in the Light of European Integration, In: of environmental protection Ekonomia i Srodowisko, pp. 178-179.
7. Siekierski, J. (2004). The Role of Leaders in Rural Financial Absorption of EU Funds for Development of Agriculture and Rural Areas, In: The impact of European integration on the structural
transformation of areas of high unemployment,
8. Issues of Agricultural advisory
services 1/2 2003 (34), pp. 55-68.
L. Poplawski Multifunctional Development of Rural Areas in the Imielno Commune Before and After Integration with The EU
37
Economic Science for Rural Development No. 32, 2013
ISSN 1691-3078
M. Dubickis, E. Gaile-Sarkane Impact of Human Capital on Development of Innovation Ecosystem in Latvia
IMPACT OF HUMAN CAPITAL ON DEVELOPMENT OF INNOVATION ECOSYSTEM IN LATVIA
Mikus Dubickis1, Bc.oec.; Elina Gaile-Sarkane, Dr.oec. Faculty of Engineering Economics and Management, Riga Technical University
Abstract.
potential for the development of human capital based innovation ecosystem. The paper is based on the study of
for sustainable development of innovation in Latvia. A part of the research results was also presented in the project
According to the research results, Riga has a good potential for attraction of local and foreign human capital and
Key words: national innovation system, innovation ecosystem, innovation environment, human capital, employment.JEL code: J24, O15
Introduction Every commercial success starts with an idea for a
new product or service. Innovations have been said to be generated by companies that want to satisfy customer needs, yet, also by user innovators who generate new products or solutions for their very own needs (von Hippel E., 1988, 2005). New idea can turn into innovation only in corresponding environment that is often called innovation ecosystem. Innovation ecosystem can be absolute only in balanced environment in which all stakeholders are involved for sustainable growth. Functioning of the national system of innovation shall ensure its elements and performance of innovation ecosystem. On the basis of convergence of innovation system elements, it is necessary to determine the cornerstone of the system and its impact on the development of the system to promote economic growth, and the development of regions and economics.
Research results and discussion1. National innovation ecosystem
Today’s competitive business environment requires more and more attention to planning, forecasting and analysing business, especially for the development of
focused on the topics of innovation development but not many of them have paid attention to innovation ecosystem as a source of innovation activity. The understanding of innovation ecosystem is very close to
The beginnings of innovation planning are dating back to the 1960s, when it started developing alongside the
and popular literature giving insight in a meaning of
After examining the most crucial studies and
before the beginning of the 21st century, the authors
key elements as fundamental of innovation system: institutions, individuals, technologies, market, processes, and competencies. Also it is obvious that human capital
Table 1.
the innovation system, while the meaning is very close to
Business ecosystem and innovation ecosystem is very
energy dynamics of the complex relationships that are formed between actors or entities whose functional goal
key elements in innovation ecosystem are institutions, individuals, and technologies. At the same time without
the development of innovation. Luoma-aho and Halonen have mentioned that
system of interaction and exchange among an ecology of various actors that enables the cross-pollination of ideas
(and actors usually belong to a category ‘human capital’) are the key element of successful innovation ecosystem.
Adner R. (2006); Subramanian V. (2012); Moore J. F. (1993); Jackson D.J. (2012); Engler J., Kusiak A. (2011); Mercan B., Goktas D. (2011) etc., the authors concluded
development of innovation ecosystem. Accordingly, the following research question
was proposed: Does Latvia have a potential for the development of on human capital based innovation ecosystem?
For getting answers on the research question, the
research.___________________________1 E-mail: [email protected]

Economic Science for Rural Development No. 32, 2013
ISSN 1691-3078
38
2. Statistics on regional innovationA comprehensive innovation level analysis among the
EU Member States has been included in the Innovation Union Scoreboard 2011 which characterises Latvia’s strengths and weaknesses in the area of innovation
and growth of innovation indicators. Among all the EU Member States Latvia has the lowest level of innovation, thus, Latvia is grouped with some other countries
Table 1
Key elements
InstitutionsMarketTechnologies
InstitutionsMarket
and economically useful, knowledge ... and are either located within or rooted inside the Market
the rate and direction of technological learning (or the volume and composition of change Institutions
TechnologiesMarket
contributes to the development and diffusion of new technologies and which provides the
process. As such it is a system of interconnected institutions to create, store and transfer the
InstitutionsIndividualsTechnologiesKnowledgeMarket
InstitutionsIndividuals
InstitutionsIndividualsMarket
(Hall A.J. et al., 2003)
InstitutionsIndividualsMarket
evolutionary way, whereby new products and processes are brought into economic and social use through the activities of networks of organisations mediated by various institutions and
InstitutionsMarketProcesses.
Source: authors’ construction based on literature
Table 2
Key elements
InstitutionsTechnologiesIndividuals
affects and is affected by the others, creating a constantly evolving relationship in which
InstitutionsIndividualsMarketInterdependency
each other, primarily complementing or supplying key components of the value propositions InstitutionsInterdependencyMarket
Source: authors’ construction based on literature
M. Dubickis, E. Gaile-Sarkane Impact of Human Capital on Development of Innovation Ecosystem in Latvia
39
Economic Science for Rural Development No. 32, 2013
ISSN 1691-3078
Technology and Innovation Foundation survey conducted among 40 countries worldwide, Latvia takes the 31st position in terms of creating, implementing and
2009). However, according to the World Bank Knowledge Economy Index, in 2012 Latvia takes the 37th position out of 146 countries, just as 12 years ago (The World Bank, 2012).
Bureau, the number of innovative enterprises in Latvia has decreased in the period after 2009, namely, if there were 707 enterprises in the sector of industry in 2006-2008, and then in 2008-2010, the number had reduced to 364 which constitute only 19.2% of the total number of enterprises in industry in Latvia. Likewise, the total turnover of innovative enterprises has reduced from LVL 68.9 to 62.3 million. Total expenditure on innovation
i.e. from LVL 210.3 to 47.0 million respectively, which shows a trend to save on machinery and equipment. The number of workforce employed by innovative enterprises in Latvia has decreased from 54.1% in 2008 to 47.3% in
. Latvia has the lowest research and development
activity in the EU (0.22% of the total GDP in 2010); also income from licensing and patents is relatively
EU fund distribution between Latvia’s regions, Riga Planning Region had received the largest portion of the envelope (total of LVL 291.4 million distributed between 1301 projects) in the period between 2007 and 2011. Also in terms of the EU funds contribution to innovation and entrepreneurship, Riga Planning Region takes the leading position with LVL 62.5 million (Ministry
2010-2011 (from 319 in 2010 to 468 in 2011). Funding allocated to science and research has almost doubled since 2009, namely, it has increased from LVL 59.9 million to LVL 99.4 million in 2011. Although funding earmarked for the entrepreneurship has reduced, the general trend
it should be taken into account that funding in Latvia in
to ensure higher competitiveness. Innovations can only be generated through developing education, science and research, which, of course, require appropriate investments.
The demographic forecasts for Riga and Pieriga 2030 (Eglite P. et al., 2012) are not overly optimistic. However, in comparison with the overall situation in Latvia, these regions are expected to maintain a relative stability in terms of population. It is expected that the population
by 2030.
3. Methodology of the researchThe research is based on the study of literature
(Section 1) and statistical data analysis (Section 2) as well as a consequent proposition of the research question. The research was conducted to obtain the potential of human capital as a main part of innovation ecosystem. The interview method (Section 4) was chosen as the most appropriate method for collecting detailed
information in a short time and graphical method was used for visualisation of the results of interviews.
direct, one-on-one interviewing. Sometimes this is a full
from the customer (target audience can be also included
and gathering of data involves contact with customers and experience with the use environment of the produce. Three methods are commonly used: interviews, focus groups, and observing the product in use (Ulrich K.T., Eppinger S.D., 2007). Interviews are usually conducted in the customer’s environment and typically last one
that one 2-hour focus group reveals about the same
Hauser J.R., 1993).
are usually less costly (per hour) than focus groups, and because an interview often allows the product development team to experience the use environment of the product, we recommend interviews to be the primary
2007).Twelve structured interviews were carried out with
four representatives of the education and research sector, four businesspeople and four policy-makers to obtain expert opinions on the attraction of highly
Riga. Seven questions were stated for interviews. The main conclusion on innovation ecosystem in Latvia (Riga) was developed on the basis of interviews (part of the
Regional Innovation Networks for Talent Attraction and
programme). Results and conclusions from the interviews are presented further.
With the aim of characterising business innovation and the business environment in Riga experts were asked to assess the regional innovation ecosystem, the availability of business premises and broadband services,
availability of banking services and venture capital as well as the business and innovation environment as a whole (Figure 1).
More than half of the experts (67%) agreed or fully agreed that Riga had a good business/innovation environment. However, only 17% agreed or fully agreed that the innovation ecosystem successfully achieved its goals, 50% disagreed and 25% fully disagreed with this statement, thus, indicating a crucial difference between the business environment and that of innovation, and pointing to the prerequisites of the innovation environment and the results achieved. A little over half (58%) of the experts agreed or fully agreed that business premises were available for adequate prices. In turn, 75% agreed and 25% fully agreed that communication services, considering the price and availability of broadband,
M. Dubickis, E. Gaile-Sarkane Impact of Human Capital on Development of Innovation Ecosystem in Latvia
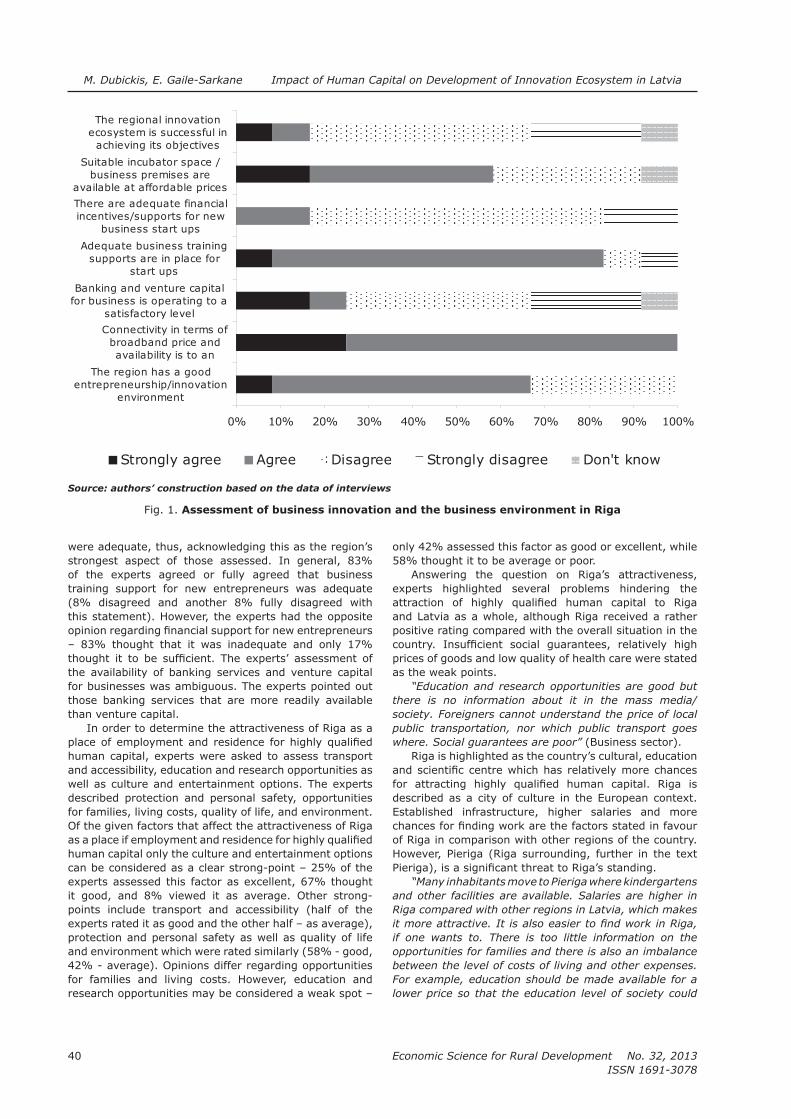
Economic Science for Rural Development No. 32, 2013
ISSN 1691-3078
40
were adequate, thus, acknowledging this as the region’s strongest aspect of those assessed. In general, 83% of the experts agreed or fully agreed that business training support for new entrepreneurs was adequate (8% disagreed and another 8% fully disagreed with this statement). However, the experts had the opposite
– 83% thought that it was inadequate and only 17%
the availability of banking services and venture capital for businesses was ambiguous. The experts pointed out those banking services that are more readily available than venture capital.
In order to determine the attractiveness of Riga as a
human capital, experts were asked to assess transport and accessibility, education and research opportunities as well as culture and entertainment options. The experts described protection and personal safety, opportunities for families, living costs, quality of life, and environment. Of the given factors that affect the attractiveness of Riga
human capital only the culture and entertainment options can be considered as a clear strong-point – 25% of the experts assessed this factor as excellent, 67% thought it good, and 8% viewed it as average. Other strong-points include transport and accessibility (half of the experts rated it as good and the other half – as average), protection and personal safety as well as quality of life and environment which were rated similarly (58% - good, 42% - average). Opinions differ regarding opportunities for families and living costs. However, education and research opportunities may be considered a weak spot –
only 42% assessed this factor as good or excellent, while 58% thought it to be average or poor.
Answering the question on Riga’s attractiveness, experts highlighted several problems hindering the
and Latvia as a whole, although Riga received a rather positive rating compared with the overall situation in the
prices of goods and low quality of health care were stated as the weak points.
“Education and research opportunities are good but
there is no information about it in the mass media/
society. Foreigners cannot understand the price of local
public transportation, nor which public transport goes
where. Social guarantees are poor” (Business sector).Riga is highlighted as the country’s cultural, education
described as a city of culture in the European context. Established infrastructure, higher salaries and more
of Riga in comparison with other regions of the country. However, Pieriga (Riga surrounding, further in the text
“Many inhabitants move to Pieriga where kindergartens
and other facilities are available. Salaries are higher in
Riga compared with other regions in Latvia, which makes
if one wants to. There is too little information on the
opportunities for families and there is also an imbalance
between the level of costs of living and other expenses.
For example, education should be made available for a
lower price so that the education level of society could
0% 10% 20% 30% 40% 50% 60% 70% 80% 90% 100%
The region has a goodentrepreneurship/innovation
environment
broadband price andavailability is to an
Banking and venture capitalfor business is operating to a
satisfactory level
Adequate business trainingsupports are in place for
start ups
There are adequate financialincentives/supports for new
business start ups
Suitable incubator space /business premises are
available at affordable prices
The regional innovationecosystem is successful in
achieving its objectives
Strongly agree Agree Disagree Strongly disagree Don't know
Source: authors’ construction based on the data of interviews
Fig. 1. Assessment of business innovation and the business environment in Riga
M. Dubickis, E. Gaile-Sarkane Impact of Human Capital on Development of Innovation Ecosystem in Latvia
41
Economic Science for Rural Development No. 32, 2013
ISSN 1691-3078
be capitalised upon to achieve a better earning capacity”
(Policy-maker).The experts assessed new employment opportunities
government and state administration, education/
enterprises. In total, 92% of the experts were of the opinion that new employment opportunities for highly
available in multinational enterprises (frequently – 42%, occasionally – 50%) and local enterprises frequently – 17%, occasionally – 75%), rather than in education/
frequently and occasionally – 50%, rarely – 50%) and the government and state administration (occasionally – 17%, rarely – 67%). Overall the expert assessment shows that new employment opportunities
relatively rarely.
capital to Riga as a place of employment and residence, the experts assessed the possibilities to obtain visas or work permits, language skills (how an immigrant will be able to learn the local languages), support and physical considerations, quality of employment, salary and working conditions as well as future career prospects as the strengths and weaknesses of the region. The expert assessment shows that there are no factors that can be considered clear strengths or weaknesses of the region. Relative strengths are physical considerations (strong – 75%) and language skills (strong – 67%), whereas relative weaknesses are salary and working conditions (weak – 58%), support and quality of employment (weak and very weak – 50%), and the possibility to easily obtain a visa or work permit (50% of those who rated this factor rated it as weak or very
weak). The rating of future career prospects was the most ambiguous – 50% thought it to be a strength and 50% - a weakness.
Conclusions, proposals,
recommendations Summarising results of the study, the authors
concluded that human capital was one of the most important components of the innovation ecosystem. It
the research conducted by the authors. Main conclusions
— in spite of Latvian innovation backwardness (among all the EU Member States, Latvia has the lowest level of innovation) in the European research area, Latvia and particularly Riga, has very good potential for further development;
— interview results showed that Riga had a good potential for attraction of local and foreign human capital (experts highlighted Riga as the country’s
had relatively more chances for attracting highly
— The research results also show that there is a gap in
and general population in various aspects. It should
and can be improved, especially because the part of
tremendous impact on innovation ecosystem development and there were possibilities to continue research on this topic.
Bibliography 1. Adner, R. (2006). Match Your Innovation Strategy
to Your Innovation Ecosystem. Harvard Business
Review, Volume 84, Issue 4, pp. 98-106.2. Arnold, E., Boekholt, P. (2002). Measuring ‘Relative
Instruments? Innovation Policy and Sustainable
Development: Can Public Innovation Incentives
Make a Difference? Retrieved: http://www.6cp.net/downloads/02brussels_arnold_boekholt_paper.doc. Access: 31.10.2012.
3. New
Products Management: Eight Edition. New York: McGraw-Hill. p. 540.
4. Retrieved: http://www.investopedia.com/terms/b/
01.11.2012.5. Systems of Innovation:
Technologies, Institutions and Organizations. London: Pinter. p. 408.
6. Eglite, P., Ivbulis, B., Gnedovska I. (2012). Demographic Forecasts for Riga and Pieriga. Institute of Economics, Latvian Academy of Sciences.
Access: 01.11.2012.7. Engler, J., Kusiak, A. (2011). Modelling an Innovation
Ecosystem with Adaptive Agents. International
Journal of Innovation Science, Volume 3, Number 2, pp. 55-67.
8. Technology Policy and Economic
Performance: Lessons from Japan. London: Pinter Pub. p. 155.
9. Marketing Science, Volume 12, No. 1,
pp. 1-27.10. Hall, A.J., Mytelka, L., Oyeyinka, B. (2004).
Innovation Systems: What’s Involved for Agricultural Policy and Practice. ILAC Brief 2. Retrieved: http://
Brief02_Innovation.pdf. Access: 01.11.2012.11.
(2003). Innovations in Innovation: Partnership, Learning and Diversity in the Generation, Diffusion and Use of New Knowledge. Post-Harvest Innovations
Learning. Retrieved: http://www.crispindia.org/docs/post%20harvest%20innovations%20in%20innovation.pdf. Access: 31.10.2012.
12. Industrial Innovation: Innovation Union Scoreboard 2011. (2012). European Commission. Retrieved: http://ec.europa.eu/enterprise/policies/innovation/
en.htm. Access 01.11.2012.
M. Dubickis, E. Gaile-Sarkane Impact of Human Capital on Development of Innovation Ecosystem in Latvia

Economic Science for Rural Development No. 32, 2013
ISSN 1691-3078
42
13. Innovation – Key Indicators. (2010). Central
Statistical Bureau of Latvia. Retrieved: http://www.csb.gov.lv/en/statistikas-temas/innovation-key-indicators-30750.html. Access: 25.10.2012.
14. Jackson, D. J. (2012). What is an Innovation Ecosystem? Retrieved: http://www.erc-assoc.org/docs/innovation_ecosystem.pdf. Access: 01.11.2012.
15. Knowledge Economy Index (KEI) 2012 Rankings. (2012). The World Bank. Retrieved: http://s i te resources .wor ldbank .org/ INTUNIKAM/Resources/2012.pdf. Access: 25.10.2012.
16. Lundvall, B-A. (1992). National Systems of
Innovation: Towards a Theory of Innovation and
Interactive Learning. London: Pinter Pub. p. 342.17. Luoma-aho, V., Halonen, S. (2010). Intangibles
Innovation Ecosystem. Innovation Journalism, Volume 7, No. 2, pp. 1-20.
18.
International Research Journal of Finance and
Economics, Issue 76, pp. 102-112.19. Metcalfe, S. (1995). The Economic Foundations of
Technology Policy: Equilibrium and Evolutionary Perspectives. Handbook of the Economics of
Innovation and Technological Change. Oxford/
20. Moore, J. F. (1993). Business Ecosystem. Retrieved: http://www.provenmodels.com/574. Access: 01.11.2012.
21. Nelson, R. R., (1992). National Innovation Systems: A Retrospective on a Study. Industrial and Corporate
Change, Volume 1, Number 2, pp. 347-374.22. Nieminen, M., Kaukonen, E. (2001). Universities and
R&D Networking in a Knowledge Based Economy:
A Glance at Finnish Developments. Sitra Reports
Series 11
raportti11.pdf, Access: 31.10.2012. 23. Patel, P., Pavitt K. (1994). The Nature and
Economic Importance of National Innovation Systems. OECD STI Review, No. 14, pp. 9-32.
24. on Latvia’s 2012 National Reform Programme
European Commission. Retrieved: http://ec.europa.eu/economy_finance/economic_governance/sgp/pdf/20_scps/2012/03_commission/lv_2012-05-30_recommendation_for_cr_en.pdf. Access: 26.10.2012.
25. Regional Development in Latvia 2011. (2012). Ministry of Environmental Protection and Regional
Development. Riga: State Regional Development Agency. p. 172.
26. Subramanian, V. (2012). Business Ecosystem. Retrieved: http://lexicon.ft.com/Term?term= business-ecosystem. Access: 01.11.2012.
27. The
Information Technology and Innovation Foundation.
century.pdf. Access: 01.11.2012.28. Ulrich, K.T., Eppinger, S.D. (2007). Product
Design and Development: Fourth edition. New York: McGraw-Hill. p. 368.
29. von Hippel, E. (1988). The Sources of Innovation. New York: Oxford University Press. p. 218.
30.
M. Dubickis, E. Gaile-Sarkane Impact of Human Capital on Development of Innovation Ecosystem in Latvia
43
Economic Science for Rural Development No. 32, 2013
ISSN 1691-3078
B. Plavina, I. Geipele Chances for the Development of Multiapartment Dwelling Houses’ Policy in Latvia
___________________________+ E-mail address: [email protected]
CHANCES FOR THE DEVELOPMENT OF MULTIAPARTMENT DWELLING HOUSES’ POLICY IN LATVIA
Baiba Plavina+, Mg.oec.; Ineta Geipele, Dr.oec.Riga Technical university
Abstract. Over the past 20 years, there have been a number of considerable aspects in the housing policy of Latvia that affect the development of housing policy in general. In 1995, Privatisation of State and
exactly 20 753 multi-storey apartment houses owned by the state or local government or 53% of the total number of multi-storey residential houses in Latvia were placed under the privatisation process. It should be highlighted that only 20% of the apartment house owners have taken over the house in their possession, while 95% of the
The aim of the presented study is a systematic evaluation of the information on dwelling houses’ policy development trends in Latvia from 1995 and regeneration of the national industry in the period after the crisis. The novelty of the study is the assessment of a three-level model for housing management and maintenance in Latvia, which considers the location of houses in the respective area, and full privatisation process of a house consistent
Results of the research are going to become the basis for sustainable development of Latvia dwelling houses policy. Keywords: cities, regions, housing policy, multi-storey apartment building, sustainable development.JEL code: D23, E65, K11, O18, P14, P26, R38.
Introduction When Latvia regained its independence in the 1990s,
the new government had to think of a new perspective for the development of the state housing policy. The transition from centralised planning of the national economy to the developed market economy of the democratic country had to be carried out simultaneously requiring the solution to the problems encountered in 50 years of
of 1990s ca. 69% of the country population lived in the cities of Latvia, thus, resulting in a continuous housing shortage. In particular, this shortage was felt in Riga, where 1/3 of the population had settled. Overpopulation facilitated a rapid deterioration of the housing fund - the number of worn-out buildings and buildings in critical condition amounted to 11.5% of the total number of residential houses in the country, while the percentage of houses being in the possession of local municipalities reached 12.3% In
1995 Privatisation
aimed to develop the real estate market and facilitate the development of residential house facility management, thus, protecting interests of the population. According to
storey apartment houses owned by the state or local government, as at 2010, or 53% of the total number of residential houses in Latvia (three and more apartment houses) were placed under the privatisation process.
The aim of the research within the cycle phase is a systematic evaluation of the information on dwelling houses’ policy development trends in Latvia from 1995 and regeneration of the national industry in the period after the crisis.
Tasks for the research: an analytical analysis of legal documents since 1995 and implementation of dwelling
of trends and problems of dwelling houses policy development.
The quality methods used in the research: sociological observation of experts, research discussion, and content analysis.
Research results and discussionThe development of national housing policy began in
1996 with the preparation of the Latvian National Report on the Implementation of the National Action Plan for
Habitat II (1996). On 30 July 1996
the Ministry of Environmental Protection and Regional
Housing Policy Concept
framework for housing policy, which prescribes goals, principles, and objectives for the housing policy development.
Housing development were the following: 1. Social objective of the housing development is to
provide opportunity for every person to participate in the housing selection and development process, in accordance with the existing living level and housing standard, at the same time building and ensuring
low-income or socially-disadvantaged families (persons);
2. The aim of changing structural properties of the housing fund is to facilitate:

Economic Science for Rural Development No. 32, 2013
ISSN 1691-3078
44
B. Plavina, I. Geipele Chances for the Development of Multiapartment Dwelling Houses’ Policy in Latvia
1) the increase in the proportion of the detached and other types of low-rise residential buildings of the housing fund;
2) the increase in the proportion of owner-occupied apartments in the multi-apartment residential
Protocol No. 39, 1996).
in the number of low-income families which currently
housing-related payments have incurred that, in turn, leads to failure to properly maintain and ensure provision
The following objectives of the housing policy concept were determined in this paper: 1) balanced polycentric development of the network
of settlements by putting an emphasis on the
related remote rural regions, particularly, ensuring implementation of such measures that form the basis of sustainable development of these settlements and rural territories;
2) ensuring an opportunity for each individual to access housing, according to the market relations set in the housing sector and in accordance with the existing level of living and housing standard;
3) activation of the construction industry emphasising renovation of the existing housing fund and modernisation, increasing the proportion of the resource-saving constructions and technology application, and increasing the proportion of saving in energy production and use;
4) humanisation of the city and village environment in
To ensure the implementation of this objective, the “Housing Development Lending
Program” on 13 June 2000 providing the credit granting system and the developing a mechanism for housing reconstruction, renovation, repair, construction, purchase, and ensuring provision of long-term credits. To facilitate the implementation the afore-mentioned objective, the Ministry of Economics was requested to develop the support programme for promotion of renovation of multi-apartment buildings for 2007 - 2010,
30 June 2008. The programme was developed in accordance with the guidelines provided in the National Development Plan for 2007-2013, which, regarding the housing policy situation and solutions, states that:
population and the relatively high charges for housing hinders effective maintenance and renewal of the existing housing fund. At the same time, it creates the preconditions for segregation, as the higher-income
Taking into account the diverse purchasing, it is necessary to provide a range of choices for the housing supply, for instance, development of the rent sector, including development of the social rent sector, public funds co-operation in construction projects, promotion of public and private partnership projects as well as new
No. 564, 2010).Tasks to be solved:
1) (including progressive management, renovation and modernisation);
2) to create conditions for diverse housing supply to increase the accessibility of diverse types of housing for population groups with different income levels;
3) assistance system in the housing sector by sharing obligations and responsibility among the state, local governments, and individuals themselves;
4) to establish a system for monitoring the quality of new housing;
5)
groups (for instance, families with children, young
A new law – the Law “On Administration of Residential
Houses” was developed and became effective as of 1 January 2010 to ensure completion of the set tasks.
With the entry into force of the Law on Administration of Residential Houses, the main purpose of this Law is as follows:1) to ensure the exploitation and maintenance of the
residential houses;2) to promote improvement of residential houses during
the whole exploitation time thereof;3) to ensure the continuity of the administration process
for every residential house;4) to preserve and develop the aesthetic values of
residential houses as environmental objects;5) to prevent risks related with the public safety and
the environmental safety during the exploitation of residential houses; and
6) to improve involved in the administration of residential houses.
Two important concepts, which are determined by the
1) administration of a residential house, if the total area of an apartment house exceeds 1500 square metres, can be performed by the person who has the required vocational education;
2) an appointed residential house administrator shall be appointed by the local government.
In accordance with the Law, residential house
administrator shall be required for the houses if the total area of the house exceeds 1500 square metres.
taken as the basis of this requirement. According to the
number of residential houses is the value to be measured
and location. Following informal information, it can be assumed that the largest number of houses with the total area of less than 1500 square metres is located in the regions, especially in villages and small towns. Therefore, it can be concluded that the law does not require house administrator’s competence for the house the total area of which does not exceed 1500 square metres if it is managed by apartment owners themselves.
45
Economic Science for Rural Development No. 32, 2013
ISSN 1691-3078
B. Plavina, I. Geipele Chances for the Development of Multiapartment Dwelling Houses’ Policy in Latvia
With regard to the afore-mentioned, it must be
increase in the proportion of low-rise residential buildings of the housing fund was set as one of its priorities in the housing policy concept developed in 1996. However, the new law determines that the house administration competence is not required for this type houses. The guidelines of the new law on residential house
3-level model of house administration has developed in Latvia: large cities, towns and villages, and rural areas.
The legislator in the new residential house administration law has introduced a new concept - appointed administrator. The main objective of introducing the concept of appointed administrator was to be the mediator, primarily, in the situations where residential house owners could not agree upon a common decision regarding the proper maintenance of the joint property, in order to avoid causing of threats to the society and
of the appointed administrator in the local government of the respective territory may be initiated by any person (including tenants) whose rights have been infringed by this Law or any institution in the competence of which is
the regulatory enactments regulating the administration of residential houses.
Local government in performing the functions and
to appoint an assigned residential house administrator, if:1) the residential house owner does not perform
the mandatory administrative activities or has not assigned the performance thereof to the administrator, and it has resulted in threats to human life, health, safety, property, or the environment (hereinafter – threats);
2) the residential house administration is performed in such a way that causes threats (Law on Residential House Management, 2010).
— the appointed administrator has a duty to prevent, within the time period indicated by the local government, the existing or potential threats to the residential house;
— the appointed administrator does not have the right to lodge new tenants or lessees to enter into rent and lease agreements regarding the use of premises;
— the appointed administrator is eligible to request the tenants and lessees of the premises of the residential house to cover the mandatory expenditure;
— activities of the appointed administrator are
Residential House Management, 2010).During the meetings of different government and
association expert working groups, it can be concluded that within these three years the parties involved in development of the residential house administration concept have failed to implement the objective of the law – appoint the appointed administrator for a particular apartment house in order to ensure that residential house owners are more capable to make decisions regarding their house facility management and administration. According to the authors, the legislator had not taken into
account the circumstances and the related information regarding the situation in residential housing in Latvia, in general, it has not been compiled and evaluated in
In rural areas or villages, where residential houses have not even had the administrator or this management
procedure how to ascertain that the residential house administrator does not perform the duties assigned to him and who is the person who supervises the activities
house and ensure provision of the necessary services if not all of the apartments are sold in the newly built residential house and the house needs heating in winter.
The issues related with the housing policy are addressed differently in the regions of Latvia. There are regions where residential house management is performed by the companies that provide not only the management and maintenance services but also some of the utility services. There are also situations when this type of service (house administration and facility management) in the remote villages is carried
other services.
Evaluating different documents, which have been developed since 1996, and which refer to the development of the housing policy in Latvia, it must be concluded that
Latvia for 2007-2013 adopted in 2006 and 2013 serve as the basis for housing policy development. The documents developed during these years include a statement and the conclusion that residential house tenants and owners
According to the authors, the legislators have not solved any of the following most important causes and reasons:1) ensuring of the provision of continuous service to
apartment owners who have received the service and have made a payment, while some other apartment owner has not paid for the received service due to certain reasons;
2) there is no procedure determining who and to what
apartment owner is declared to be insolvent person or the like and is not able to make payment for the received services.
The legislation prescribes that the apartment property consists of a separate property – principal property and joint property, which is considered to be auxiliary
apartment owner alone can make a decision regarding the residential property space, while the decision regarding the maintenance of the shares of co-ownership should be made jointly and democratically - 50 + 1 vote of all of the residential house owners. This way of implementation of the housing policy during 18 years has not shown successful results, because it is not possible for the owners who are from different social classes, with different income levels, values, goals etc., to make decision in a democratic way.
Economic Science for Rural Development No. 32, 2013
ISSN 1691-3078
46
B. Plavina, I. Geipele Chances for the Development of Multiapartment Dwelling Houses’ Policy in Latvia
Conclusions, proposals,
recommendations Taking into account the afore-mentioned, the authors
come to the following conclusions.
1.
housing policy guidelines in Latvia. 2. An increase in the proportion of low-rise residential
buildings of the housing fund was set as one of priorities in the housing policy concept of 1996,
determines that the house administration competence is not required for this type houses. The guidelines of the new law on residential house management did
house administration has developed in Latvia: large cities, towns and villages, and rural areas.
3.
had not reached the determined objective, yet, it has created even more dramatic situation when none of the long-term decisions are made for housing preservation and maintenance.
Proposals:
1. The legislator shall take into account the fact that residential house management in cities and regions
determining the procedure for the local government
management and which discusses (describes) and provides possible solutions for the situations most frequently appearing in the practice.
2. The Ministry of Economics or any other subordinate authority has to perform data collection on residential houses in Latvia, not only collecting the number of such but also compiling information, which is binding for developing the housing policy. Based on the data collected, the law provisions on
residential houses over 1500 m2 shall be reviewed considering residential house location features and character in the regions and cities.
3. The legislation should establish a procedure for solving two major causes that prevent the development and improvement of good practice in housing policy across the country:a) ensuring of the provision of continuous service
to apartment owners who have received the service and have made a payment, while some other apartment owner has not paid for the received service due to certain reasons;
b) there is no procedure determining who and
losses if the apartment owner is declared to be insolvent person or the like and is not able to make payment for the received services.
To summarise the afore-described, the authors conclude that “The Housing Policy Concept” adopted on 30 July 1996 by the government of Latvia served as the
basis for policy-making. Nineteen years have passed and it is necessary to review this policy concept, since the
objectives - 95% of the apartments are privatised, while only 20% of apartment house owners have taken over the house in their possession. Besides, in 2013 paying for the received services is still a problem for residential
Latvia and facilitate the development of Latvian economy as a whole to compile and evaluate in detail information regarding the residential housing issues in the entire country, taking into account the 3-level model of house
solutions for the causes of insolvency.
Bibliography 1.
(2012). Website of the Central Statistical Bureau.
Retrieved: http://www.csb.gov.lv/dati/statistikas-. Access: 02.12.2012.
2. Geipele, I., Geipele, S., Plavina, B., Stamure, I. (2011). Pricing Principles of Apartment House Management in Latvia. Selected International Proceedings of Economics Development and Research: E-business, Management and Economics.
Press, Singapore, pp. 271-277.3. Geipele, I., Geipele, S., Plavina, B., Stamure, I.
(2012). Pricing Peculiarities of Apartment House Management in Latvia. Selected Papers of the 7th
Management 2012, Lithuania, Vilnius, 10-11 May 2012, pp. 1075-1082.
4. Geipele, I., Geipele, S., Stamure, I. (2012).
Latvija (Models of Financing Housing Fund
I.M.Potravnijs (Krievija), prof. M.Zivitere, assoc.
5. Geipele, S., Geipele, I. (2011). Land in the System of Real Estate Objects and Features of Tax Application
Jelgava, 28-29 April 2011, pp. 164-172.6. Geipele, S. (2011). Peculiarities of the Property Tax
2011). Edited by Garry Lee. IERI Vol.2. © 2011 Information Engineering Research Institute, USA, pp. 339-346.
7. Geipele, S., Geipele, I., Slava, D., Stamure, I. (2012). Social, Economic and Legal Problems of Housing Management in Latvia. Selected Papers
Business and Management 2012, Lithuania, Vilnius, 10-11 May 2012, pp. 631-638.
8. Protocol No. 27. Latvijas Vestnesis. Retrieved: http://www.likumi.lv/doc.php?id=10094. Access: 14.12.2012.
9. Housing Development Lending Programme Latvijas
47
Economic Science for Rural Development No. 32, 2013
ISSN 1691-3078
B. Plavina, I. Geipele Chances for the Development of Multiapartment Dwelling Houses’ Policy in Latvia
Vestnesis. Retrieved: http://www.likumi.lv/doc.php?id=115283. Access: 14.12.2012.
10. No. 39. Latvijas Vestnesis. Retrieved: http://
www.multiprese.lv/source/pdf/Majokli/01.pdf.
Access: 14.12.2012.11.
attistibas planu 2014. – 2020. gadam (National Development Plan for 2014 – 2020). Retrieved http://www.nap. lv/319-saeima-apst ipr ina-
. Access: 03.01.2013.
12. Latvian National Development plan 2007-Latvijas
Vestnesis. Retrieved: http://www.likumi.lv/doc.php?id=139505. Access: 10.12.2012.
13. Slava, D., Geipele, S. (2012). Majoklu parvaldisanas tiesiski ekonomiskas problemas Latvija (Legal and Economic Problems of Housing Management in
Tautsaimnieciba: teorija un prakse. 22. Sejums,
14. Investigation in Spatial Planning of the Baltic Region. Recent Researches in Urban Sustainability
WSEAS Press, pp. 136-141. 15. Staube, T., Geipele, I. (2011). The Latest Trends
in the Spatial Planning Modelling of the Baltic Sea Region Determine a Territory’s Potential.
Lee. IERI Vol.2. © 2011 Information Engineering Research Institute, USA, pp. 403-409.
16. State Support Programme for Multi-storey Residential House Renovation Facilitation for 2007 – 2010,
Latvijas Vestnesis. Retrieved:
http://www.likumi.lv/doc.php?id=157804. Access: 17.12.2012.
17. Tambovceva, T., Geipele, I. (2011). Environmental Management Systems Experience among Latvian
Economic Development of Economy. Volume 17, Number 4, pp. 595-610.
18. Latvia. Latvijas Vestnesis. Retrieved: http://www.likumi.lv/doc.php?id=902211. Access: 17.12.2012.
19. The Law on Residential House Management: Law of the Republic of Latvia. Latvijas Vestnesis. Retrieved: http://www.likumi.lv/doc.php?id=193573. Access: 10.12.2012.
20. The Law On Assistance In Solving Apartment Matters: Law of the Republic of Latvia Latvijas
Vestnesis. Retrieved: http://www.likumi.lv/doc.php?id=56812. Access: 14.12.2012.
21. Vanags, J., Geipele, I. (2008). Latvijas tautsaimnieciba
nekustama ipasuma tirgu (National Economy of
prof., Dr.habil.oec.R.Pocs, prof., Dr.oec.J.Saulitis,
22. Geipele, S., Stamure, I. (2012). Pilsetu un regionu attistibas mijiedarbibas sociali ekonomiskie aspekti (Socio-economic Aspects of Urban and Regional
prof. K.Klavins, assoc.prof. T.Tambovceva, Riga, 123 lpp.
23. Vanags, J., Mote, G., Geipele, I., Butane, I., Jirgena, H. (2012). Social Sustainability: Overcome Duality Proposition // Integrated and Sustainable Development: Proceedings of the International
pp. 267-271.
Economic Science for Rural Development No. 32, 2013
ISSN 1691-3078
48
J. Mezera et al. Czech Food Processing Industry in The Period of Uncertainty About
The Support from Rural Development Programme
CZECH FOOD PROCESSING INDUSTRY IN THE PERIOD OF UNCERTAINTY ABOUT THE SUPPORT FROM
RURAL DEVELOPMENT PROGRAMME
Josef Mezera1+, Vaclav Vilhelm1, Jindrich Spicka2, Ing. PhD1 Institute of Agricultural Economics and Information
2 University of Economics, Faculty of Business Administration
Abstract. The economic recession has affected many sectors including food industry. It has increased the level of risk not only for suppliers, especially for farmers, but for the whole agribusiness and rural regions. The
counterfactual analysis. Propensity score matching (PSM) based on Mahalanobis distance within propensity score calipers (no matches outside calipers) is used to match supported and non-supported companies.
businesses consolidate their economic position to a certain extent. The investment support has a positive
project participants as compared to non-participants. The investment support also increases labour productivity. The investment support of the adding value to food products should continue in the upcoming programmer period 2014-2020.Key words: food industry, economic indicators, investment supportJEL code: Q18, L66
___________________________+ E-mail address
Introduction The food sector belongs among the key branches
as in the EU. The branch ensures good nutrition of population with the production and sales of healthy, quality and mostly also price accessible foodstuffs.
Because of the importance of the food sector in the
and competitiveness, a conception of this branch was prepared for the period after the country’s accession to EU, i.e. from 2004 to 2013, by the Ministry of Agriculture in co-operation with the Institute of Agricultural Economics and Information, and other institutions and experts. Now a new strategy for
and Mejstrikova (2012) evaluated the support provided from Rural Development Programme (RDP) of the
Strategic Rural Development Plan.
The goal of the paper is to assess the economic effects of investment support targeting at adding value
attempts to answer the following research question:
of the supported companies in comparison to the companies without public investment support? The results are based on counterfactual analysis and identify the main impacts on the food industry using economic indicators.
Research results and discussion1. Fundamental characteristics
of product groups, some of which are directly connected with agriculture. Other productions represent higher stages of processing of agrarian commodities.
Economic situation of the individual branches or their
receipts from sales of own products and services, is illustrated in Figure 1.
Figure 2 presents a comparison of the development of the basic production indicators in the manufacture of food
the period 2005 – 2011. The comparison shows that the crisis period was the year 2009 for MI and the year 2011
problems of competitiveness and the performance of the
in the framework of the domestic manufacturing sector and market as well as from the point of view of the relations in foreign trade, which means in the context of the European and world market. They conclude that the sector competitiveness is not in a critical situation. However, the sector competitiveness assessed by the
because of the coming stagnation. According to their SWOT analysis, the problem is that the opportunities of the sector are not fully utilised. Food producers are facing the basic problems in the output sphere mainly in the domestic market.

49
Economic Science for Rural Development No. 32, 2013
ISSN 1691-3078
J. Mezera et al. Czech Food Processing Industry in The Period of Uncertainty About The Support from Rural Development Programme
Fig. 1. Shares of the individual branches in receipts from sales of own products and services in 2011
80
85
90
95
100
105
2005 2006 2007 2008 2009 2010 2011
% Numbeer of employees
CZ-NACE 10 MI (kód C) CZ-NACE 11
90
98
106
114
122
130
2005 2006 2007 2008 2009 2010 2011
% Receipts from sales of own P a S
CZ-NACE 10 MI (kód C) CZ-NACE 11
90
97
104
111
118
125
2005 2006 2007 2008 2009 2010 2011
%Value added
CZ-NACE 10 MI (kód C) CZ-NACE 11
Fig. 2. Development of main production indicators in the period 2005 – 2011
The common feature of all analysed branches (food processing industry total, slaughtering, dairy, milling, feedstuffs, and beverages) of the food processing industry is that the technological change did not
in the analysed period. However, the distribution of technical change suggests that the gap between the best and the worst food processing companies increased within the analysed period. On the other hand, he concludes that TFP (Total Factor Productivity) in the food
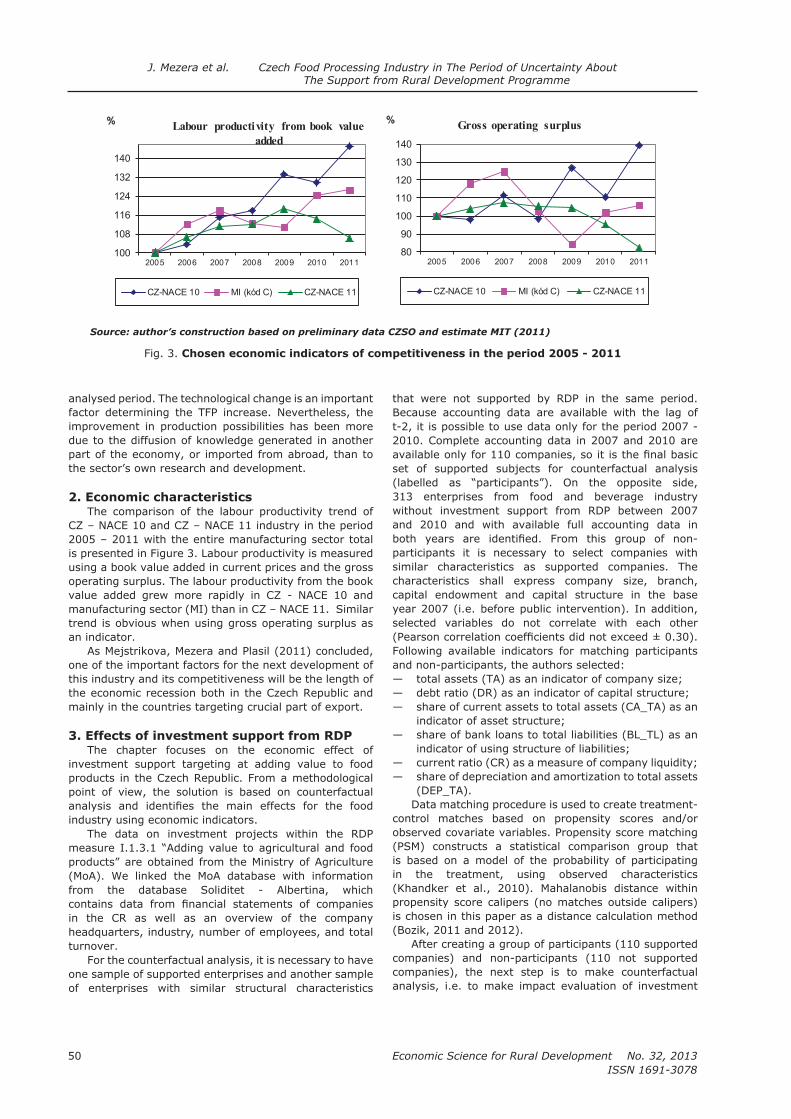
Economic Science for Rural Development No. 32, 2013
ISSN 1691-3078
50
J. Mezera et al. Czech Food Processing Industry in The Period of Uncertainty About
The Support from Rural Development Programme
analysed period. The technological change is an important factor determining the TFP increase. Nevertheless, the improvement in production possibilities has been more due to the diffusion of knowledge generated in another part of the economy, or imported from abroad, than to the sector’s own research and development.
2. Economic characteristicsThe comparison of the labour productivity trend of
2005 – 2011 with the entire manufacturing sector total is presented in Figure 3. Labour productivity is measured using a book value added in current prices and the gross operating surplus. The labour productivity from the book
trend is obvious when using gross operating surplus as an indicator.
one of the important factors for the next development of this industry and its competitiveness will be the length of
mainly in the countries targeting crucial part of export.
3. Effects of investment support from RDPThe chapter focuses on the economic effect of
investment support targeting at adding value to food
point of view, the solution is based on counterfactual
industry using economic indicators.The data on investment projects within the RDP
(MoA). We linked the MoA database with information from the database Soliditet - Albertina, which
headquarters, industry, number of employees, and total turnover.
For the counterfactual analysis, it is necessary to have one sample of supported enterprises and another sample of enterprises with similar structural characteristics
that were not supported by RDP in the same period. Because accounting data are available with the lag of t-2, it is possible to use data only for the period 2007 -
set of supported subjects for counterfactual analysis
313 enterprises from food and beverage industry without investment support from RDP between 2007 and 2010 and with available full accounting data in
participants it is necessary to select companies with similar characteristics as supported companies. The
capital endowment and capital structure in the base year 2007 (i.e. before public intervention). In addition, selected variables do not correlate with each other
Following available indicators for matching participants and non-participants, the authors selected:
— — debt ratio (DR) as an indicator of capital structure; —
indicator of asset structure; — share of bank loans to total liabilities (BL_TL) as an
indicator of using structure of liabilities; — —
(DEP_TA).Data matching procedure is used to create treatment-
control matches based on propensity scores and/or observed covariate variables. Propensity score matching (PSM) constructs a statistical comparison group that is based on a model of the probability of participating in the treatment, using observed characteristics (Khandker et al., 2010). Mahalanobis distance within propensity score calipers (no matches outside calipers) is chosen in this paper as a distance calculation method
After creating a group of participants (110 supported companies) and non-participants (110 not supported companies), the next step is to make counterfactual analysis, i.e. to make impact evaluation of investment
100
108
116
124
132
140
2005 2006 2007 2008 2009 2010 2011
%Labour productivity from book value
added
CZ-NACE 10 MI (kód C) CZ-NACE 11
80
90
100
110
120
130
140
2005 2006 2007 2008 2009 2010 2011
%Gross operating surplus
CZ-NACE 10 MI (kód C) CZ-NACE 11
Fig. 3. Chosen economic indicators of competitiveness in the period 2005 - 2011
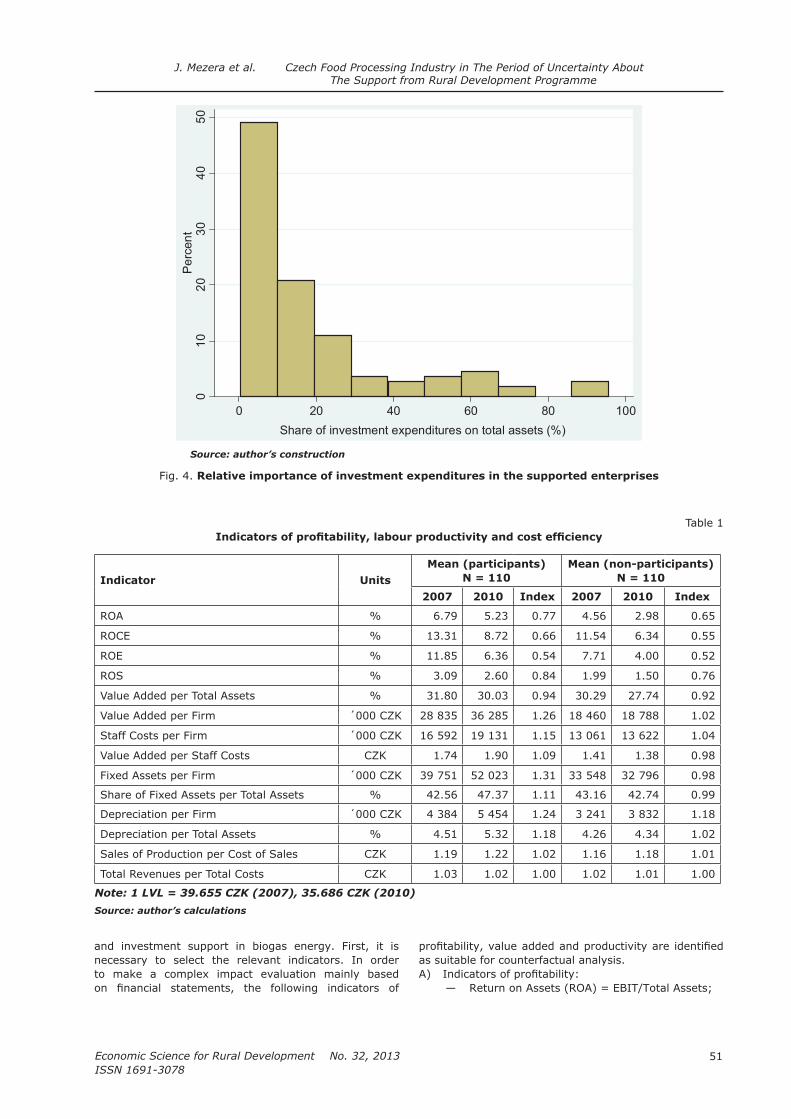
51
Economic Science for Rural Development No. 32, 2013
ISSN 1691-3078
J. Mezera et al. Czech Food Processing Industry in The Period of Uncertainty About The Support from Rural Development Programme
01
02
03
04
05
0P
erc
en
t
0 20 40 60 80 100
Share of investment expenditures on total assets (%)
Source: author’s construction
Fig. 4. Relative importance of investment expenditures in the supported enterprises
Table 1
Indicator Units
Mean (participants)
N = 110
Mean (non-participants)
N = 110
2007 2010 Index 2007 2010 Index
ROA % 6.79 5.23 0.77 4.56 2.98 0.65
% 13.31 8.72 0.66 11.54 6.34 0.55
ROE % 11.85 6.36 0.54 7.71 4.00 0.52
ROS % 3.09 2.60 0.84 1.99 1.50 0.76
Value Added per Total Assets % 31.80 30.03 0.94 30.29 27.74 0.92
Value Added per Firm 28 835 36 285 1.26 18 460 18 788 1.02
16 592 19 131 1.15 13 061 13 622 1.04
1.74 1.90 1.09 1.41 1.38 0.98
Fixed Assets per Firm 39 751 52 023 1.31 33 548 32 796 0.98
Share of Fixed Assets per Total Assets % 42.56 47.37 1.11 43.16 42.74 0.99
Depreciation per Firm 4 384 5 454 1.24 3 241 3 832 1.18
Depreciation per Total Assets % 4.51 5.32 1.18 4.26 4.34 1.02
1.19 1.22 1.02 1.16 1.18 1.01
1.03 1.02 1.00 1.02 1.01 1.00
Source: author’s calculations
and investment support in biogas energy. First, it is necessary to select the relevant indicators. In order to make a complex impact evaluation mainly based
as suitable for counterfactual analysis.A)
— Return on Assets (ROA) = EBIT/Total Assets;
Economic Science for Rural Development No. 32, 2013
ISSN 1691-3078
52
J. Mezera et al. Czech Food Processing Industry in The Period of Uncertainty About
The Support from Rural Development Programme
—(Equity + Provisions + Long-term payables + Long-term bank loans);
— Return on Equity (ROE) = EAT/Equity; — Return on Sales (ROS) = EBIT/(Sales of
Production + Sales of Goods).B) Value added indicators: Value added = (Sales
— Value Added per Total Assets; — Value Added per Firm; — —
Other indicators: — Fixed Assets per Firm; — Share of Fixed Assets per Total Assets; — Depreciation per Firm; — Depreciation per Total Assets; — —
As shown in Figure 4, about 50% of the participants have total investment expenditures up to 10% of total assets. It is obvious that the investments in adding value to food products are less important investments that can affect economic results of companies in the food sector. Table 1 gives information about effects of investment
The effects of investment support also arise from
(Table 1). The participants increased the mean level
from 2007 to 2010. This is also evident from the
did in 2010.
whether the investment support by the RDP is targeted at
dropped for both participants and non-participants.
systematic global economic recession that affected most industries worldwide. The positive effect is that a
the group of participants compared to non-participants. It can be explained as an effect of investment support. Nevertheless, the indicator ROE does not prove such obvious effect of support, thus the investment support
company. Investment support has an important effect on
productivity. The participants have higher value added than non-participants do. Furthermore, they also increased the mean value added by 26 % between 2007 and 2010. However, in relation to the total assets, the value added slightly dropped in both groups of companies because the rise of the value added was reduced by the rise of total assets in the group of participants as a consequence of investment.
compare the parallel changes of value added and staff costs, which can be expressed by an indicator value added per staff costs. Labour productivity of participants grew by 9 %, while there was a slight decline in the group of non-participants in the reporting period. Therefore, higher labour productivity can be considered as one of the positive effects of the investment support by the RDP.
Even if the effects of investment support on
of production per cost of sales). When total costs and
because of higher depreciation and staff costs in the group of participants. Depreciation and staff costs are not included in the sales costs, and their growth eliminates the effect of higher total revenues.
Conclusions The goal of the paper was to assess the economic
The results of the analysis show that the supported businesses consolidate their economic position to a certain extent. The investment support has a positive
non-participants did in the period 2007 - 2010. The investment support also increases labour productivity. The participants have higher value added than non-participants do. The participants increased the mean level
in 2010.The investment support of the adding value to food
products should continue in upcoming period 2014-2020. Only the targeted support can be the incentive
as the tool for improving competitiveness of the food industry. This plan corresponds with the vision of forming
competitive in the long term.
Bibliography 1.
podpory investicii Programu rovoje vidieka 2007-2013 na urovni fariem. Economics in Agriculture, vol. XI, issue 1, pp. 58-71. ISSN 1335-6186.
2. the Agroenvironmental Support in the Rural Development Programme 2007-2013 at the Farm Level. Economic of Agriculture, vol. XII, issue 1,
3. Zdroje a limity rustu agrarniho
sektoru – Analyza efektivnosti a produktivity
ceskeho agrarniho sektoru: aplikace SFA (Stochastic
Frontier Analysis)
2009, ISBN 978-80-7357-493-2, p. 296.4.

53
Economic Science for Rural Development No. 32, 2013
ISSN 1691-3078
we Experience in the Last Decade? In European
Association of Agricultural Economists -
131st Seminar, September 18-19, 2012, Prague,
5. Khandker, S. R., Koolwal, G. B., Samad, H. A. (2010). Handbook on Impact Evaluation. Quantitative
Methods and Practices. Washington: The World Bank. ISBN 978-0-8213-8029-1 (electronic).
6.
development in selected branches of the food
spider analysis. Agris On-line Papers in Economics
and Informatics, vol. 3, issue 2, pp. 39-54. ISSN 1804-1930.
7.
Development in Collection ”Organization-economic
and rights problems of development agriculture
a agriculture regions”, Lvov national agrarian
university, 2012, ISBN 978-966-345-257-9 pp. 300-304.
8. MoA, IAEI (2012). Panorama of Food Industry
2011. Prague: Ministry of Agriculture, Institute of
Agricultural Economics and Information, 84 p. ISBN
978-80-7434-087-1
9. Agricultural
Economics-Czech, vol. 57, no. 9, pp. 413–421. ISSN 0139-570X.
AcknowledgementThe author gratefully acknowledge the support of the Ministry of Agriculture – the support came from the institutional
J. Mezera et al. Czech Food Processing Industry in The Period of Uncertainty About The Support from Rural Development Programme

Economic Science for Rural Development No. 32, 2013
ISSN 1691-3078
54
J. Piecuch Evolution of Social and Economic Situation in Polish Agriculture
Since the Accession to The European Union
___________________________1 Phone: + 48 12 662 43 52, E-mail: [email protected]
EVOLUTION OF SOCIAL AND ECONOMIC SITUATION IN POLISH AGRICULTURE SINCE THE ACCESSION TO THE EUROPEAN UNION
Jakub Piecuch1, PhDInstitute of Economic and Social Sciences, Agriculture University in Krakow
Abstract. Ten years after the accession to the European Union, and despite all the funding and efforts, which have
topographic restrictions and over-employment. This situation causes integration problems with the common market. In the whole country, small-scale and low-tech agriculture still prevails and suffers from a lack of many natural resources and lack of investments. The dominant traditional economy is not adapted to the market conditions.
Product per capita equals only about 60% of the European average. The main goal of Poland’s budget strategy for the
below the constitutional threshold of 55% of GDP in the year 2013. During the past years, the population of Poland has witnessed a spectacular decrease in the contribution of the agricultural sector to Poland’s total employment and total value added of the whole economy. However, despite this, the process of structural changes in Poland’s agricultural employment exceeds 13% of labour force and value added is close to 3% of GDP. Key words: Poland, agriculture, European Union, Structural Funds.JEL code: F150, O100, Q10
Introduction The situation in Polish agriculture will be analysed in
the present article. This country has been a part of the
year 2004; though, even almost one decade later, the Polish economic situation and the level of development is far behind the West European economies. Unprivileged situation is agriculture is one of the reasons. The primary sector in Poland is still one of the crucial sectors of
of this sector the top priority for the Polish government.The aim of the research is to present the current
situation in Polish agriculture. Accession to the European
and access to the common market have been the most important factors which have determined positive changes in the whole Polish economy and, in particular, in agriculture over the past ten years. The European
labour force engaged in the primary sector activities and created new jobs outside agriculture, especially in a service sector.
countries, the changes having taken place in Poland can be very important, since the necessity of structural changes lies ahead of them. Any lessons learned from the mutual experience are crucial for undertaking the right decision in the times of crisis. This paper focuses on changes on the national level. The research is based on the analysis of reports prepared by the European
(annual macro-economic database of the European
Financial Affairs) have also been used for the research purpose.
1. Situation of agriculture in PolandAfter the latest two enlargements in the middle of
st century, over 50% of the
development and the importance of the aims of the
even higher than in the Western countries, and despite all changes, which have occurred in Poland during the past two decades, it is still a crucial sector for the Polish economy. The contribution of agriculture to the total GDP is falling; though, it is still relatively important at an estimated level of 4.0%. The agricultural labour force still holds a 13% share of the total employment. This high
and hidden unemployment in rural areas. Nevertheless, this essential difference between the GDP contribution and persons employed in agriculture indicates on a
of part-time farming. Due to strong dependence of
of restructuring the Polish primary sector. The origins

55
Economic Science for Rural Development No. 32, 2013
ISSN 1691-3078
J. Piecuch Evolution of Social and Economic Situation in Polish Agriculture Since the Accession to The European Union
a common market.With time, the system allowed the European
permanent surpluses of the many farm products. These actions had many consequences (high budgetary cost, distorted world markets, and lack of acceptance of
actions such as introduction of the quota on products
reaching. Production limits helped reduce surpluses and an accent was put on a shift from price support to direct support as an income compensation for farmers. Environmentally-friendly production became an essential
the 21st century, the EU adopted a fundamental reform of
Agriculture not only plays an important role for rural communities’ standard of living but it is also responsible for ties of cooperation between the members of local communities. As it was mentioned before, the level of unemployment rate in Polish regions is also connected with the necessity of agricultural restructuring. Regions located in the Eastern part of Poland, especially
in the primary sector. These regions also belong to the group of the less developed areas, both in Poland and
had a negative impact on those regions where low level of economic development coexists with the lack of possibility for non-agricultural job creation.
Poland, just like almost all other countries located in
as less developed economy with strong dependence on agricultural production. The position of the analysed country is somehow underprivileged due to topographic limitations and great distance to the main European
marketplaces, which cause integration problems with the common market. Small-scale and low-tech agricultural holdings still prevail in the majority of Polish regions. This traditional economy is not adapted to the market conditions. However, the contributions of primary, secondary, and tertiary activities to the total value added have changed strongly in Poland over the recent decade (Table 1).
forestry has sharply decreased in the total value added of the whole economy, and in 2010, it was much closer to well developed economies of the European Union than ten years earlier and accounted for 3.5%. The share of
the sector of services now account for almost 65% of the total gross value added.
A spectacular decrease in the contribution of the agricultural sector in total employment has been observed during the past years (Table 2). In 2000, more than 18% of labour force was employed in the primary sector. The share of employment in agriculture in the
percentage points to 13.4% of labour force by 2011. High level of employment is the only one problem connected with labour force in Poland’s rural areas; the other one is hidden unemployment and low farms income, which is a characteristic attribute of these areas.
In 2010, approximately 1.5 million of agricultural holdings were recorded in Poland. The General Agricultural
in Polish agriculture. Number of holdings has decreased
of holdings has decreased by more than ¼ of the total number compared with 2007 (2.4 million in 2007 and 1.5 million in 2010). All agricultural holdings in Poland occupied little more than 14.4 million hectares (ha) of the utilised agricultural area (UAA). An average physical farm
12 ha in 2005), which was less than the average physical
55% farms had less than 5 ha land, while approximately 10% had more than 50 ha. In 2007, 56% of the farms in
Table 1Value added by activity in 2000 – 2010 (%)
Agriculture,
hunting and
forestry;
Industry,
including
energy
Construction
Wholesale
and retail
trade, repairs;
hotels;
transport
Financial
intermediation;
real estate,
renting and
business activities
Other
services
activities
2000 2010 2000 2010 2000 2010 2000 2010 2000 2010 2000 2010
Poland 5.0 3.5 24.0 24.7 7.7 7.0 27.3 27.3 18.1 18.1 18.0 19.3
Germany 1.3 0.9 25.1 23.7 5.2 4.1 18.2 17.2 27.5 30.5 22.8 23.6
USA 1.2 1.0 18.4 15.9 5.0 4.1 20.0 18.0 31.7 34.2 23.7 26.8
15.1 10.3 40.4 39.7 5.6 6.6 8.2 8.5 8.3 10.7 22.5 24.2
Russia 6.4 4.7 31.1 27.3 6.6 5.5 33.1 30.3 4.6 17.6 18.3 14.6
Euro area 2.5 1.7 22.2 18.5 5.7 5.9 21.2 20.6 26.3 29.0 22.2 24.3
2.3 1.8 22.0 20.6 5.7 5.9 21.4 20.7 27.1 28.6 21.7 22.5
EU-27 2.4 1.7 22.4 18.7 5.6 6.0 21.6 20.9 25.9 28.8 22.1 23.9
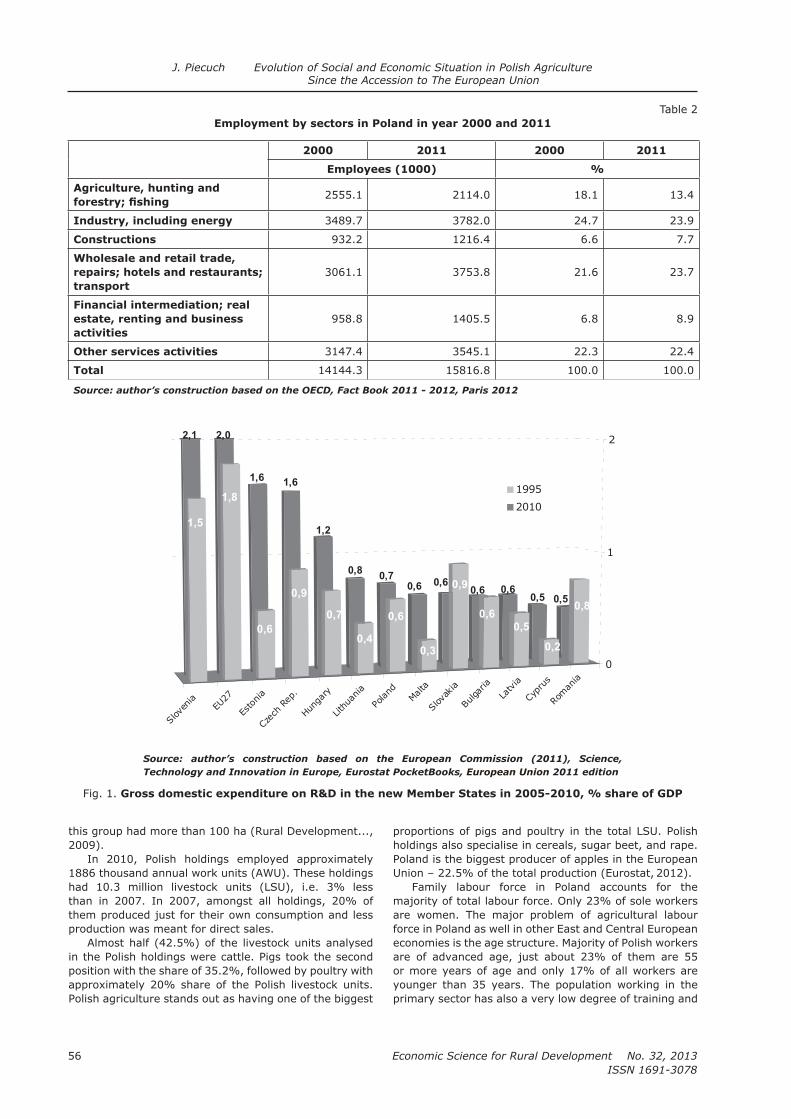
Economic Science for Rural Development No. 32, 2013
ISSN 1691-3078
56
J. Piecuch Evolution of Social and Economic Situation in Polish Agriculture
Since the Accession to The European Union
this group had more than 100 ha (Rural Development..., 2009).
In 2010, Polish holdings employed approximately 1886 thousand annual work units (AWU). These holdings had 10.3 million livestock units (LSU), i.e. 3% less than in 2007. In 2007, amongst all holdings, 20% of them produced just for their own consumption and less production was meant for direct sales.
Almost half (42.5%) of the livestock units analysed in the Polish holdings were cattle. Pigs took the second position with the share of 35.2%, followed by poultry with approximately 20% share of the Polish livestock units. Polish agriculture stands out as having one of the biggest
proportions of pigs and poultry in the total LSU. Polish holdings also specialise in cereals, sugar beet, and rape. Poland is the biggest producer of apples in the European Union – 22.5% of the total production (Eurostat, 2012).
Family labour force in Poland accounts for the majority of total labour force. Only 23% of sole workers are women. The major problem of agricultural labour
economies is the age structure. Majority of Polish workers are of advanced age, just about 23% of them are 55 or more years of age and only 17% of all workers are younger than 35 years. The population working in the primary sector has also a very low degree of training and
Table 2Employment by sectors in Poland in year 2000 and 2011
2000 2011 2000 2011
Employees (1000) %
Agriculture, hunting and 2555.1 2114.0 18.1 13.4
Industry, including energy 3489.7 3782.0 24.7 23.9
Constructions 932.2 1216.4 6.6 7.7
Wholesale and retail trade,
repairs; hotels and restaurants;
transport
3061.1 3753.8 21.6 23.7
Financial intermediation; real
estate, renting and business
activities
958.8 1405.5 6.8 8.9
Other services activities 3147.4 3545.1 22.3 22.4
Total 14144.3 15816.8 100.0 100.0
Slov
enia
EU27
Esto
nia
Hung
ary
Lithu
ania
Poland
Malta
Slov
akia
Bulga
riaLa
tvia
Rom
ania
0,50,50,60,6
0,60,60,7
0,8
1,2
1,61,6
2,02,1
0,8
0,2
0,5
0,6
0,9
0,3
0,6
0,4
0,7
0,9
0,6
1,8
1,5
0
1
2
1995
2010
European Union 2011 edition
Fig. 1. Gross domestic expenditure on R&D in the new Member States in 2005-2010, % share of GDP
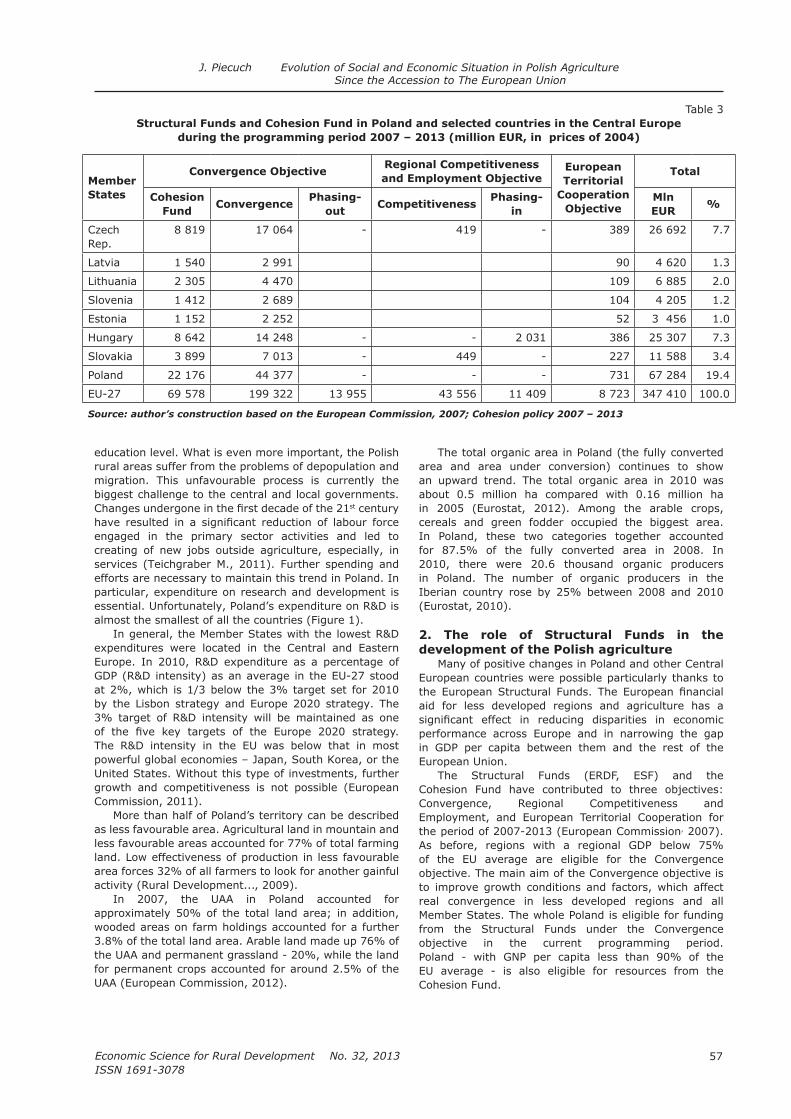
57
Economic Science for Rural Development No. 32, 2013
ISSN 1691-3078
J. Piecuch Evolution of Social and Economic Situation in Polish Agriculture Since the Accession to The European Union
education level. What is even more important, the Polish rural areas suffer from the problems of depopulation and migration. This unfavourable process is currently the biggest challenge to the central and local governments.
st century
engaged in the primary sector activities and led to creating of new jobs outside agriculture, especially, in services (Teichgraber M., 2011). Further spending and efforts are necessary to maintain this trend in Poland. In particular, expenditure on research and development is essential. Unfortunately, Poland’s expenditure on R&D is almost the smallest of all the countries (Figure 1).
In general, the Member States with the lowest R&D
Europe. In 2010, R&D expenditure as a percentage of GDP (R&D intensity) as an average in the EU-27 stood at 2%, which is 1/3 below the 3% target set for 2010 by the Lisbon strategy and Europe 2020 strategy. The 3% target of R&D intensity will be maintained as one
The R&D intensity in the EU was below that in most powerful global economies – Japan, South Korea, or the United States. Without this type of investments, further growth and competitiveness is not possible (European
More than half of Poland’s territory can be described as less favourable area. Agricultural land in mountain and less favourable areas accounted for 77% of total farming land. Low effectiveness of production in less favourable area forces 32% of all farmers to look for another gainful activity (Rural Development..., 2009).
In 2007, the UAA in Poland accounted for approximately 50% of the total land area; in addition, wooded areas on farm holdings accounted for a further 3.8% of the total land area. Arable land made up 76% of the UAA and permanent grassland - 20%, while the land for permanent crops accounted for around 2.5% of the
The total organic area in Poland (the fully converted area and area under conversion) continues to show an upward trend. The total organic area in 2010 was about 0.5 million ha compared with 0.16 million ha in 2005 (Eurostat, 2012). Among the arable crops, cereals and green fodder occupied the biggest area. In Poland, these two categories together accounted for 87.5% of the fully converted area in 2008. In 2010, there were 20.6 thousand organic producers in Poland. The number of organic producers in the Iberian country rose by 25% between 2008 and 2010 (Eurostat, 2010).
2. The role of Structural Funds in the development of the Polish agriculture
European countries were possible particularly thanks to
aid for less developed regions and agriculture has a
performance across Europe and in narrowing the gap in GDP per capita between them and the rest of the European Union.
The Structural Funds (ERDF, ESF) and the
, 2007). As before, regions with a regional GDP below 75%
to improve growth conditions and factors, which affect real convergence in less developed regions and all Member States. The whole Poland is eligible for funding
objective in the current programming period. Poland - with GNP per capita less than 90% of the EU average - is also eligible for resources from the
Table 3Structural Funds and Cohesion Fund in Poland and selected countries in the Central Europe
during the programming period 2007 – 2013 (million EUR, in prices of 2004)
Member
States
Convergence ObjectiveRegional Competitiveness
and Employment ObjectiveEuropean
Territorial
Cooperation
Objective
Total
Cohesion
FundConvergence
Phasing-
outCompetitiveness
Phasing-
in
Mln
EUR%
Rep.8 819 17 064 - 419 - 389 26 692 7.7
Latvia 1 540 2 991 90 4 620 1.3
Lithuania 2 305 4 470 109 6 885 2.0
Slovenia 1 412 2 689 104 4 205 1.2
Estonia 1 152 2 252 52 3 456 1.0
Hungary 8 642 14 248 - - 2 031 386 25 307 7.3
Slovakia 3 899 7 013 - 449 - 227 11 588 3.4
Poland 22 176 44 377 - - - 731 67 284 19.4
EU-27 69 578 199 322 13 955 43 556 11 409 8 723 347 410 100.0

Economic Science for Rural Development No. 32, 2013
ISSN 1691-3078
58
J. Piecuch Evolution of Social and Economic Situation in Polish Agriculture
Since the Accession to The European Union
Poland are shown in Table 3. In the programming period
from the Rural Development Programme for 2007-2013 (EUR 13.2 bln) and Direct Payments (EUR 3.2 bln per year) with the total value of EUR 307 per one hectare (Figure 2).
The support in the present programming period is implemented within four axes (priorities), concerning the main directions of support for rural and agricultural development:
— Axis 1: Improvement in the competitiveness of agricultural and forest sectors;,
— Axis 2: Improvement of natural environment and rural areas;
—of farming;
— Axis 4: Leader - to develop social potential in the rural areas by encouraging its residents to be active.
In Poland, the RDP 2007-2013 provides for support out of public funds in the amount of EUR 17.2 billion, whereas EUR 13.2 billion come from the EU budget and the share of national public funding accounts for approximately EUR 4 billion (Ministry of Agriculture, 2011).
The European structural aid has resulted not only in reorganisation of the primary sector but also in a
services, was possible thanks to a wide range of activities undertaken in the framework of structural policy and the
ConclusionsThe accession of Poland and other countries from
was a right step on the road to better developed and competitive economies. Integration with the EU structures forced them to restructure and liberalise the economy.
These positive changes are currently less obvious when one focuses on some disadvantageous aspects
and East European countries still have huge amount of unsolved economic and social problems, particularly,
countries and low internal demand contract possibilities of positive economic growth and new jobs creation. Polish agricultural sector, despite the 10 years of the EU membership, provides work for approximately 13% of the total employment. The share of the primary sector in total value added of the whole economy has sharply decreased but it still remains relatively large in comparison with other EU countries. The large part of agricultural land is located in disadvantaged areas, which decrease costs of agricultural production. It also suffers from the structural problems such as small-scale and low-tech agriculture and the domination of traditional economy, which is not adapted to the market conditions. Despite these negative aspects, the primary sector in Poland is currently much more modern and competitive as an effect of implementation of the structural adjustments than it was a decade ago.
Adjustments required by the EU internal market along with the Structural Funds from the EU budget resulted in an increase of competitiveness and higher income
challenge for Poland is to stop the process of depopulation in rural areas.
163
177
188
237
255 288 322
323
340
344
350
362
369
383
384
388
404
418
420
421
498
509 5
50
560
696
307330
0
100
200
300
400
500
600
700EU 2
7Latv
iaRom
ania
Bulg
aria
Lithuania
Est
onia
GB
Pola
nd
Port
ugal
Hungary
Sw
eden
Slo
vakia
Fra
nce
Spain
Cze
ch R
ep.
Fin
land
Italy
Luxem
bourg
Irel
and
Aust
ria
Denm
ark
Germ
any
Belg
ium
Neth
erlands
Cypru
sSlo
venia
Gre
ece
Euro/ha
Source: author’s construction based on the Ministry of Agriculture and Rural Development, 2011;
Fig. 2. Pillar I of the CAP (in 2013) and Pillar II of the CAP (average yearly 2007 - 2013)
EUR per one hectare

59
Economic Science for Rural Development No. 32, 2013
ISSN 1691-3078
Bibliography1. Cohesion Policy
, Luxembourg, pp. 13-25.
2. Eurostat Regional
Yearbook 2012.
Union. Luxembourg 2012, pp. 384-387.3. Science, technology
and Innovation in Europe. Eurostat Pocketbooks, European Union 2011 edition, pp. 29-39.
4. The Common
Agriculture Policy Explained. Luxembourg, pp. 24-30.
5. Eurostat (2012). Agriculture, Fishery and Forestry
Statistics. Main Results – 2010-11, Eurostat Pocketbooks. European Union, pp. 83-93, 125-127.
6. Eurostat (2010). Area under Organic Farming, Statistics in Focus No. 10/2010, pp. 2-6.
7. Wplyw
Wspolnej Polityki Rolnej na rolnictwo
Instytut Ekonomiki Rolnictwa i Gospodarki Zywnosciowej, pp. 8-14.
8. Ministry of Agriculture and Rural Development (2011). Agriculture and Food Economy in
Poland, Warsaw, pp. 75-85.9. Economic,
Environmental and Social Statistics,
152-154.10. Rural Development in the European Union.
Statistical and Economic Information, Directorate-General for Agriculture and Rural Development. European Union. December 2009, p. 96, 164.
11. Teichgraber, M. (2012). European Union Labour
Force Survey – Annual Results 2011, Eurostat. Statistics in focus 40/2012, pp. 3-7.
J. Piecuch Evolution of Social and Economic Situation in Polish Agriculture Since the Accession to The European Union

Economic Science for Rural Development No. 32, 2013
ISSN 1691-3078
60
R. Zvirgzdina, E. Tilta Possibilities of Diminishing of Differences in Regional
Social Economics and Dairying in Latvia
___________________________1 Tel.:+371 27618746, fax: +371 27619152. E-mail address: [email protected] Tel.:+371 28600687. E-mail address: [email protected]
POSSIBILITIES OF DIMINISHING OF DIFFERENCES IN REGIONAL SOCIAL ECONOMICS AND DAIRYING IN LATVIA
Rosita Zvirgzdina1, Master of Business Administration; Elga Tilta2, Dr. oec.
Abstract
balanced regional development in Latvia.
resources in dairy pointing out the existing differences in farming among rural areas. In the conclusion, there the authors have accentuated the ways favouring the improvement of production conditions in rural areas and contributing to the wealth and welfare of the producers and the population in rural areas of Latvia regions.
Introduction The intention to approach to the average social
as expected initially. It is evidenced by a comparatively slow increase in the GDP: in total and per capita. If in 2005, the GDP per capita in Latvia accounted for 48 per cent of the average in the EU, then in 2010 – 52 per cent. It means that in 2010, the GDP per capita in Latvia was 2.6 times less than in the Netherlands and 2.4 times less than in Austria, Denmark and Sweden. Due to the above mentioned scores Latvia still remains in one of the last places among the Member States of the European Union, outpacing only Romania and Bulgaria (Latvijas Statistikas Gadagramata, 2011).
The principal cause hampering Latvia to approach to the average social economic level of the EU in a more rapid way is uneven and unbalanced social economic development mainly in the territorial aspect. In 2008, the GDP had increased by 75 per cent in comparison with the 2000. Yet, due to the following recession caused by the crisis, in 2010, the excess over the level of the 2000 was only 43 per cent. This recession had caused a negative impact on the economy. As a result, the consumption of households had decreased by one third, but the investments – nearly twice. The differences between the well off and the people with low income continued to increase, and the distribution of the income became
to the EUROSTAT data, one fourth of Latvia inhabitants are still subjected to the risk of poverty. In the result of the lasting unbalanced social economic territorial development, there has developed a situation that, practically, in one pole there is the capital Riga, but in the other – the rest of Latvia. In 2008, Riga provided 54 per cent of the GDP; and in 2009, received 55 per cent of all
2011). It means that, overall, the share of other regions, i.e. the share of the other pole, makes less than one half of the GDP and investments.
Therefore, the unbalanced and uneven social
in which, among other kinds of activities, the agricultural production plays the dominant role employing the
most part of economically active inhabitants of rural households. In order to oppose the obviously unfavourable development tendencies and to facilitate a successful farming, it is necessary to carry out measures oriented on diminishing of regional differences and to the improvement of production in agriculture in compliance with the conditions for sustainable development. It, as a rule, requires creating of a closer relationship between the activation of economic processes in rural regions and the regional policy of the state that must be oriented to
of rural farms on the basis of increase of the productivity of the labour and capital and targeted and skilful use of natural and obtained advantages of every region. S. Keiss,
the role of agriculture as the basis of existence and welfare of rural inhabitants.
Primarily, it is essential to pay attention to the production areas, the development of which requires less investments and, as a result, contributes more to the improvement of living standard quality of the rural areas. Dairying industry belongs to such agricultural production area.
The aim of the paper is to have a closer look at the possibilities of dairying improvement that favour balanced regional development.
The tasks of the investigation are: 1) to characterise the development peculiarities of
dairying; 2) to evaluate the role of activities promoting the
development of dairying;
reports and such research methods as monographic, statistical analysis and others, the authors have evaluated the use of resources in dairying at the national, regional and farm level.
Key words: regions, resources, dairying, farmers.
Discussion and Results In the course of time, the formation and development
drastic changes. As soon as this industry had recovered
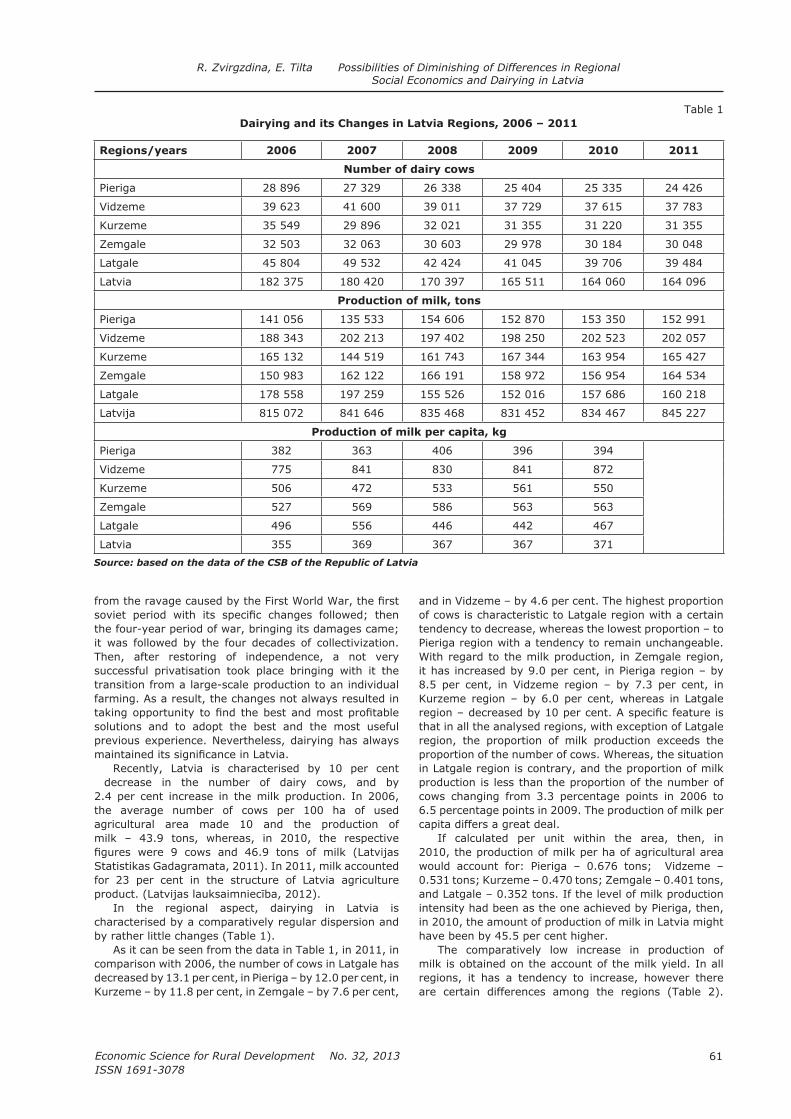
61
Economic Science for Rural Development No. 32, 2013
ISSN 1691-3078
the four-year period of war, bringing its damages came;
Then, after restoring of independence, a not very successful privatisation took place bringing with it the transition from a large-scale production to an individual farming. As a result, the changes not always resulted in
solutions and to adopt the best and the most useful previous experience. Nevertheless, dairying has always
Recently, Latvia is characterised by 10 per cent decrease in the number of dairy cows, and by 2.4 per cent increase in the milk production. In 2006, the average number of cows per 100 ha of used agricultural area made 10 and the production of milk – 43.9 tons, whereas, in 2010, the respective
Statistikas Gadagramata, 2011). In 2011, milk accounted for 23 per cent in the structure of Latvia agriculture
In the regional aspect, dairying in Latvia is characterised by a comparatively regular dispersion and by rather little changes (Table 1).
As it can be seen from the data in Table 1, in 2011, in comparison with 2006, the number of cows in Latgale has decreased by 13.1 per cent, in Pieriga – by 12.0 per cent, in
of cows is characteristic to Latgale region with a certain tendency to decrease, whereas the lowest proportion – to Pieriga region with a tendency to remain unchangeable. With regard to the milk production, in Zemgale region, it has increased by 9.0 per cent, in Pieriga region – by
that in all the analysed regions, with exception of Latgale region, the proportion of milk production exceeds the proportion of the number of cows. Whereas, the situation in Latgale region is contrary, and the proportion of milk production is less than the proportion of the number of cows changing from 3.3 percentage points in 2006 to 6.5 percentage points in 2009. The production of milk per capita differs a great deal.
If calculated per unit within the area, then, in 2010, the production of milk per ha of agricultural area
and Latgale – 0.352 tons. If the level of milk production intensity had been as the one achieved by Pieriga, then, in 2010, the amount of production of milk in Latvia might have been by 45.5 per cent higher.
The comparatively low increase in production of milk is obtained on the account of the milk yield. In all regions, it has a tendency to increase, however there are certain differences among the regions (Table 2).
Table 1 Dairying and its Changes in Latvia Regions, 2006 – 2011
Regions/years 2006 2007 2008 2009 2010 2011
Number of dairy cows
Pieriga 28 896 27 329 26 338 25 404 25 335 24 426
39 623 41 600 39 011 37 729 37 615 37 783
35 549 29 896 32 021 31 355 31 220 31 355
Zemgale 32 503 32 063 30 603 29 978 30 184 30 048
Latgale 45 804 49 532 42 424 41 045 39 706 39 484
Latvia 182 375 180 420 170 397 165 511 164 060 164 096
Production of milk, tons
Pieriga 141 056 135 533 154 606 152 870 153 350 152 991
188 343 202 213 197 402 198 250 202 523 202 057
165 132 144 519 161 743 167 344 163 954 165 427
Zemgale 150 983 162 122 166 191 158 972 156 954 164 534
Latgale 178 558 197 259 155 526 152 016 157 686 160 218
Latvija 815 072 841 646 835 468 831 452 834 467 845 227
Production of milk per capita, kg
Pieriga 382 363 406 396 394
775 841 830 841 872
506 472 533 561 550
Zemgale 527 569 586 563 563
Latgale 496 556 446 442 467
Latvia 355 369 367 367 371
Source: based on the data of the CSB of the Republic of Latvia
R. Zvirgzdina, E. Tilta Possibilities of Diminishing of Differences in Regional Social Economics and Dairying in Latvia
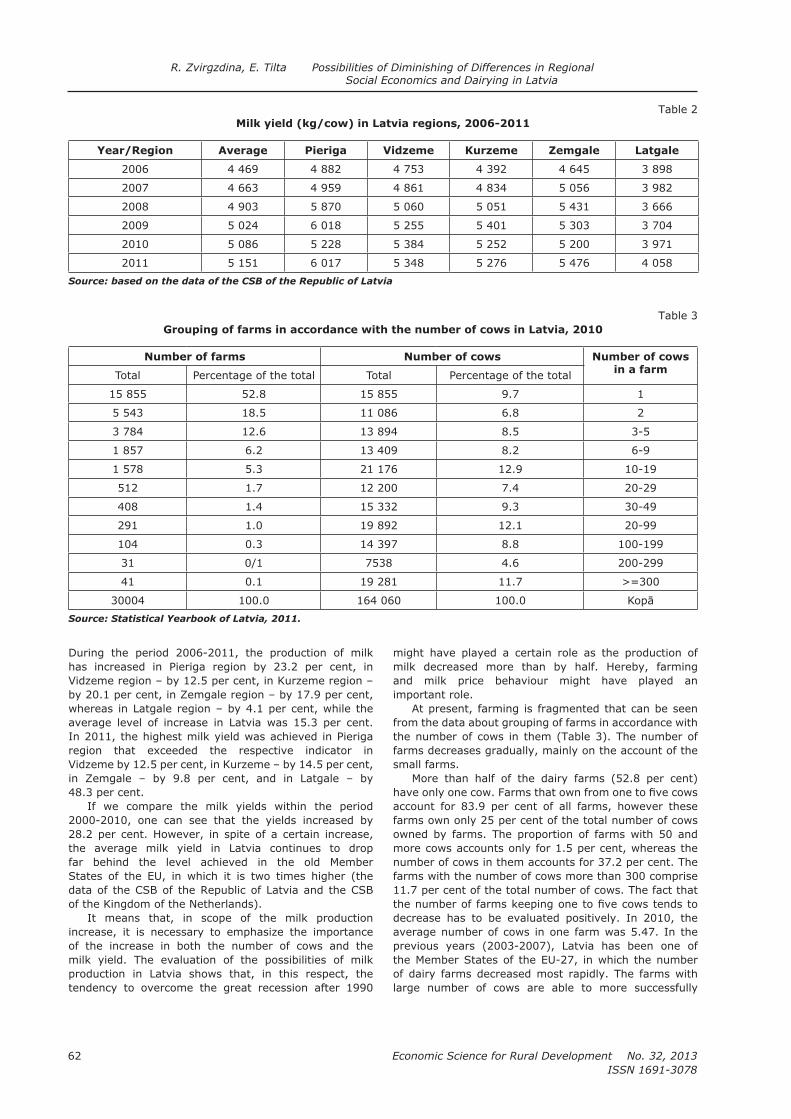
Economic Science for Rural Development No. 32, 2013
ISSN 1691-3078
62
During the period 2006-2011, the production of milk has increased in Pieriga region by 23.2 per cent, in
by 20.1 per cent, in Zemgale region – by 17.9 per cent, whereas in Latgale region – by 4.1 per cent, while the average level of increase in Latvia was 15.3 per cent. In 2011, the highest milk yield was achieved in Pieriga region that exceeded the respective indicator in
in Zemgale – by 9.8 per cent, and in Latgale – by 48.3 per cent.
If we compare the milk yields within the period 2000-2010, one can see that the yields increased by 28.2 per cent. However, in spite of a certain increase, the average milk yield in Latvia continues to drop far behind the level achieved in the old Member States of the EU, in which it is two times higher (the
of the Kingdom of the Netherlands).
It means that, in scope of the milk production
of the increase in both the number of cows and the milk yield. The evaluation of the possibilities of milk production in Latvia shows that, in this respect, the tendency to overcome the great recession after 1990
might have played a certain role as the production of milk decreased more than by half. Hereby, farming and milk price behaviour might have played an important role.
At present, farming is fragmented that can be seen from the data about grouping of farms in accordance with the number of cows in them (Table 3). The number of farms decreases gradually, mainly on the account of the small farms.
More than half of the dairy farms (52.8 per cent)
account for 83.9 per cent of all farms, however these farms own only 25 per cent of the total number of cows owned by farms. The proportion of farms with 50 and more cows accounts only for 1.5 per cent, whereas the number of cows in them accounts for 37.2 per cent. The farms with the number of cows more than 300 comprise 11.7 per cent of the total number of cows. The fact that
decrease has to be evaluated positively. In 2010, the average number of cows in one farm was 5.47. In the previous years (2003-2007), Latvia has been one of the Member States of the EU-27, in which the number of dairy farms decreased most rapidly. The farms with large number of cows are able to more successfully
Table 2 Milk yield (kg/cow) in Latvia regions, 2006-2011
Year/Region Average Pieriga Vidzeme Kurzeme Zemgale Latgale
2006 4 469 4 882 4 753 4 392 4 645 3 898
2007 4 663 4 959 4 861 4 834 5 056 3 982
2008 4 903 5 870 5 060 5 051 5 431 3 666
2009 5 024 6 018 5 255 5 401 5 303 3 704
2010 5 086 5 228 5 384 5 252 5 200 3 971
2011 5 151 6 017 5 348 5 276 5 476 4 058
Source: based on the data of the CSB of the Republic of Latvia
Table 3Grouping of farms in accordance with the number of cows in Latvia, 2010
Number of farms Number of cows Number of cows in a farmTotal Percentage of the total Total Percentage of the total
15 855 52.8 15 855 9.7 1
5 543 18.5 11 086 6.8 2
3 784 12.6 13 894 8.5 3-5
1 857 6.2 13 409 8.2 6-9
1 578 5.3 21 176 12.9 10-19
512 1.7 12 200 7.4 20-29
408 1.4 15 332 9.3 30-49
291 1.0 19 892 12.1 20-99
104 0.3 14 397 8.8 100-199
31 0/1 7538 4.6 200-299
41 0.1 19 281 11.7 >=300
30004 100.0 164 060 100.0
Source: Statistical Yearbook of Latvia, 2011.
R. Zvirgzdina, E. Tilta Possibilities of Diminishing of Differences in Regional Social Economics and Dairying in Latvia

63
Economic Science for Rural Development No. 32, 2013
ISSN 1691-3078
thus, function more effectively and provide a good quality of milk.
The conditions and results of farming are variable and
of dairy farming, and, since the price is prone to change, it does not satisfy dairy farmers. In 2010, the average price in Latvia was above 200 LVL per ton; however, there were also farms close to the critical line (Latvijas Piensaimnieku centralas savienibas informacija, 2012).
farms to carry out the credit payments and to pay off other services. It is important how high the credits of farms and the production costs are.
The changes in the prices and their level are interpreted differently. There are experts who underline
protest against the obstacles, to which the dairy farmer is exposed: the farms are obsolete, the handwork amount is high, but the modernisation requires great
Piensaimnieku centralas savienibas informacija, 2012). Farmers regard the unacceptable milk prices as the cause of a comparatively large amount of milk exports to other countries, for example, to Lithuania for a further processing that, respectively, decreases the budget revenues and the contribution to the GDP of Latvia.
The differences in farming conditions are evidenced by a survey of a group of farms that included the farms of Latvia regions exceeding the area of 20 ha. The same evidence was also given by the inquiry and the interviews. The land used in dairying is characterised by different farm areas per cow. It may be regarded as implications
milk prices. Similarly, the revenue from milk realisation differs as well. In 2006, the highest level of revenue from realisation of milk per ha in Latvia regions was
383 LVL per ha in Zemgale; in 2008, they were respectively 513 LVL per ha in Pieriga and 371 LVL per ha in Zemgale; and, in 2009, respectively,
Zemgale; but in 2010, 536 LVL per ha in Zemgale and
revenue of dairying is rather large. In 2010, in Pieriga it was within 100 LVL per ha and 1490 LVL per ha. Regarding the revenue from milk realisation, the survey revealed that from a total of 31 farms included in the survey in four farms the revenue exceeded 1000 LVL per ha, whereas, in 14 farms – from 500 to 1000 LVL per ha, and in 13 farms revenue were up to
3796 LVL per ha. The revenue exceeding 1000 LVL per ha was observed in 13 farms, the revenue from 500 to 1000 LVL per ha – 10 farms, but the revenue of
revenue from milk realisation in 2010 was within the interval from 92 to 4851 LVL per ha. From 45 farms, in six farms the related revenue exceeded 1000 LVL per ha; in 17 farms revenues were from 500 to 1000 LVL per ha, and in 22 farms – less than 500 LVL per ha. In Zemgale region, the interval was within 73 to 3605 LVL per ha. From 34 farms, in six the revenue exceeded 1000 LVL per ha, in 10 farms – from 500 to 1000 LVL per ha, and in 18 farms – less than 500 LVL per ha. The differences in income might have been caused by differences in the production structure, the technological level, the price, and the milk realisation possibilities. It means that the farms
dairying.
Table 4
RegionsFarms with
losses
Total of farmsto 50 50 - 100 100 - 200 200 - 300 300 - 500
500 - 1000
above 1000
Number of farms
Pieriga 10 3 7 7 - 1 - 3 31
10 7 8 8 4 6 3 5 51
6 5 19 8 3 3 - 1 45
Zemgale 5 5 8 4 4 2 1 5 34
Total 31 20 42 27 11 12 4 14 161
Percentage of the total
Pieriga 32.2 9.7 22.6 22.6 - 3.2 - 9.7 100.0
19.6 13.7 15.7 15.7 7.8 11.8 5.9 9.8 100.0
13.3 11.1 42.2 17.8 6.7 6.7 - 2.2 100.0
Zemgale 14.7 14.7 23.5 11.8 11.8 5.9 2.9 14.7 100.0
Total 19.3 12.4 26.1 16.8 6.8 7.4 2.5 8.7 100.0
Source: elaborated by the authors based on the data of annual reports
R. Zvirgzdina, E. Tilta Possibilities of Diminishing of Differences in Regional Social Economics and Dairying in Latvia

Economic Science for Rural Development No. 32, 2013
ISSN 1691-3078
64
The situation is also similar in relation to the revenue of milk realisation per cow. During the period 2006-2010, the highest rate was observed in Zemgale,
respectively 833 and 963 LVL per cow, in 2008 and
may be explained by the implications of the crisis and sharp changes in the milk prices, which, in its turn, had impeded the investments for improvement of dairying.
a half of the farms generated the revenue from the milk realisation within 1000 - 2000 LVL per ha, whereas in
33.3 per cent.
and loss accounts in 2010 (Table 4) shows that more
depends on the production costs and realisation prices. The production costs in Latvia regions differ a great deal. In nearly 4/5 of the farms, the production costs are less than 200 LVL per ha, and in one third of the farms – less than 50 LVL per ha. The highest proportion (35.3 per cent) of farms with production costs less than 50 LVL per ha is characteristic to Zemgale. This region is also characteristic with the proportion of farms that have production costs within 50 to 100 LVL per ha. The highest proportion of farms with production costs within 100 to 200 LVL per ha was observed in Pieriga
production costs exceeding 200 LVL per ha accounts
Zemgale. These rates lead to the conclusion that with regard to production costs, the improvement possibilities
The long term investments, which are an integral part
of the production and shaping it in accordance with nowadays requirements, have been the highest per ha
by 27.8 per cent, in 2008 – of Pieriga – 1.8 times, in
2.2 times. It is interesting that in all the regions there are farms
varies from less than 100 LVL per ha to some thousand LVL per ha. In 2010, the investments of 7.8 per cent
35.4 per cent of farms – within 100 to 500 LVL per ha, 23.5 per cent of farms – within 500 to 1000 LVL per ha, 15.7 of farms – within 1000 to 2000 LVL per ha, 17.6 per cent of farms – more than 2000 LVL per ha, and in six farms - within 2000 to 3000. One farm had the investments of 3600 LVL per ha, one – 4150 LVL per ha,
and one – 6700 LVL per ha. The situation is similar also
the opinion of employed persons about the farms’ development opportunities. The inquiry results showed that, for example, the biggest investments in formation of fodder basis had taken place in Zemgale region, but
– least. As to milking equipments, Latgale region is in
and Zemgale. The investments in keeping of dairy cattle are comparatively low in all the regions.
In the analysed regions, the use of credits differs a great deal. During the period 2006-2010, the lowest
in Zemgale, where, in 2006, they were 1.7 times, in 2007 – 1.4 times, in 2008 – 2.6 times and 2010 –
credits per farm was detected in Zemgale and exceeded
1.7 times, 2008 – 2.7 times, 2009 – 3.1 time, but in 2010 – 2.3 times.
In the context of the analysis carried out based on comparison of the four regions according to the revenue,
Latgale region. As shown by the author’s previous study, this region has achieved good results, sometimes exceeding the results of farms in other regions. During the period 2006-2010, these farms in Latgale have had the highest revenue from the realisation of milk per ha
Latgale farms per ha was higher than in other regions. During the period 2006-2009, the long-term investments per ha were also the highest in these farms of Latgale. In 2010, the realised amount of milk per cow in the surveyed farms of Latgale was within 4.55 to 7.99 tons that is very close to the highest level achieved in other Latvia regions. It gives evidence that the dairying of this region possesses potential development possibilities.
It may be concluded from the above-mentioned
production factors and looks for opportunities to lower production costs and gets a possibly higher return to be well-off and capable for a normal farming, will be obliged to take into consideration the impact of a number of internal and external factors, especially the impact of such changes as:
— anticipated foreign countries’ impact on the price of products with a low value added. It may come from the countries with low production costs in dairying
with considerable dairying amounts; — enlargement of production for exports in case of
increase in dairying; — access to a desirable market niche and formation of
export contacts; — production of products with possibly high value
added, especially for exports; — the necessity to constantly increase the
competitiveness. Wherewith, the question arises – what the farmer
needs most in such situation. Based on the inquiry results
R. Zvirgzdina, E. Tilta Possibilities of Diminishing of Differences in Regional Social Economics and Dairying in Latvia
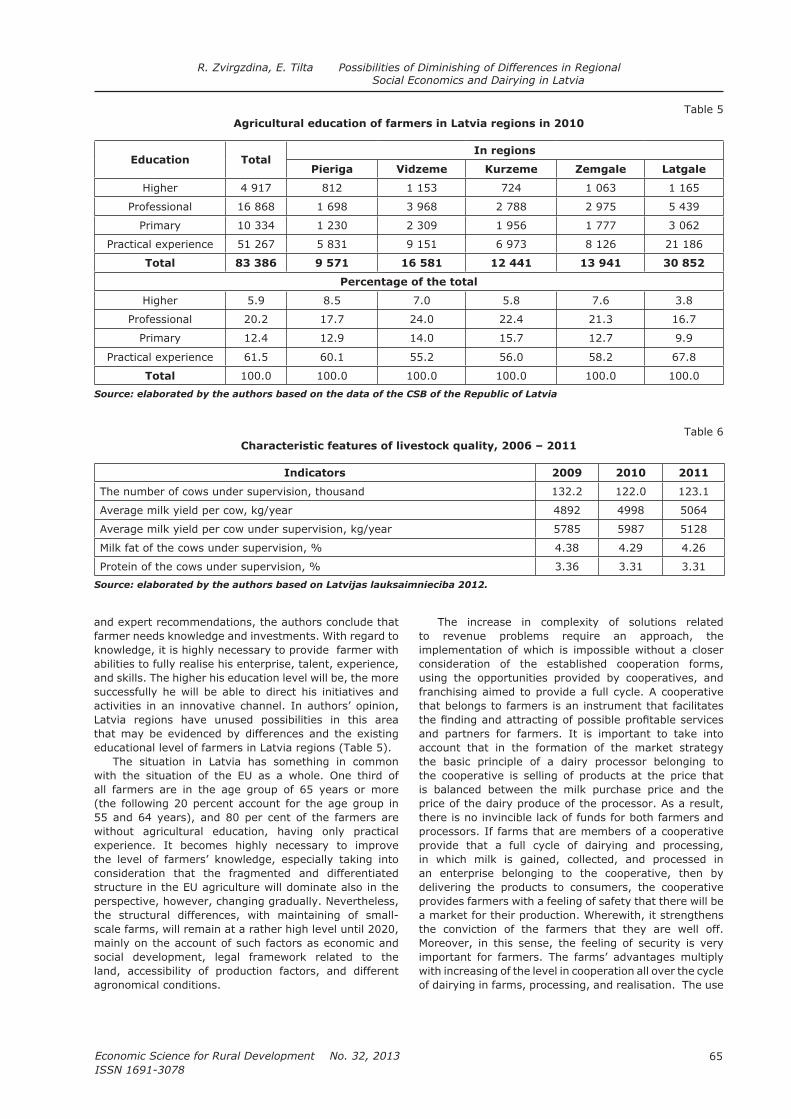
65
Economic Science for Rural Development No. 32, 2013
ISSN 1691-3078
and expert recommendations, the authors conclude that farmer needs knowledge and investments. With regard to knowledge, it is highly necessary to provide farmer with abilities to fully realise his enterprise, talent, experience, and skills. The higher his education level will be, the more successfully he will be able to direct his initiatives and activities in an innovative channel. In authors’ opinion, Latvia regions have unused possibilities in this area that may be evidenced by differences and the existing educational level of farmers in Latvia regions (Table 5).
The situation in Latvia has something in common with the situation of the EU as a whole. One third of all farmers are in the age group of 65 years or more (the following 20 percent account for the age group in 55 and 64 years), and 80 per cent of the farmers are without agricultural education, having only practical experience. It becomes highly necessary to improve the level of farmers’ knowledge, especially taking into consideration that the fragmented and differentiated structure in the EU agriculture will dominate also in the perspective, however, changing gradually. Nevertheless, the structural differences, with maintaining of small-scale farms, will remain at a rather high level until 2020, mainly on the account of such factors as economic and social development, legal framework related to the land, accessibility of production factors, and different agronomical conditions.
The increase in complexity of solutions related to revenue problems require an approach, the implementation of which is impossible without a closer consideration of the established cooperation forms, using the opportunities provided by cooperatives, and franchising aimed to provide a full cycle. A cooperative that belongs to farmers is an instrument that facilitates
and partners for farmers. It is important to take into account that in the formation of the market strategy the basic principle of a dairy processor belonging to the cooperative is selling of products at the price that is balanced between the milk purchase price and the price of the dairy produce of the processor. As a result, there is no invincible lack of funds for both farmers and processors. If farms that are members of a cooperative provide that a full cycle of dairying and processing, in which milk is gained, collected, and processed in an enterprise belonging to the cooperative, then by delivering the products to consumers, the cooperative provides farmers with a feeling of safety that there will be a market for their production. Wherewith, it strengthens the conviction of the farmers that they are well off. Moreover, in this sense, the feeling of security is very important for farmers. The farms’ advantages multiply with increasing of the level in cooperation all over the cycle of dairying in farms, processing, and realisation. The use
Table 5Agricultural education of farmers in Latvia regions in 2010
Education TotalIn regions
Pieriga Vidzeme Kurzeme Zemgale Latgale
Higher 4 917 812 1 153 724 1 063 1 165
Professional 16 868 1 698 3 968 2 788 2 975 5 439
Primary 10 334 1 230 2 309 1 956 1 777 3 062
Practical experience 51 267 5 831 9 151 6 973 8 126 21 186
Total 83 386 9 571 16 581 12 441 13 941 30 852
Percentage of the total
Higher 5.9 8.5 7.0 5.8 7.6 3.8
Professional 20.2 17.7 24.0 22.4 21.3 16.7
Primary 12.4 12.9 14.0 15.7 12.7 9.9
Practical experience 61.5 60.1 55.2 56.0 58.2 67.8
Total 100.0 100.0 100.0 100.0 100.0 100.0
Source: elaborated by the authors based on the data of the CSB of the Republic of Latvia
Table 6Characteristic features of livestock quality, 2006 – 2011
Indicators 2009 2010 2011
The number of cows under supervision, thousand 132.2 122.0 123.1
Average milk yield per cow, kg/year 4892 4998 5064
Average milk yield per cow under supervision, kg/year 5785 5987 5128
Milk fat of the cows under supervision, % 4.38 4.29 4.26
Protein of the cows under supervision, % 3.36 3.31 3.31
Source: elaborated by the authors based on Latvijas lauksaimnieciba 2012.
R. Zvirgzdina, E. Tilta Possibilities of Diminishing of Differences in Regional Social Economics and Dairying in Latvia

Economic Science for Rural Development No. 32, 2013
ISSN 1691-3078
66
of these advantages can be favourable for stability and welfare of farming, which can be seen from a comparison of dairying cooperatives depending on the level of milk processing in the framework of the cooperative. The main advantages related to the support of farmers’ initiatives and facilitation of production are:
— realisation of the planned price in the interests of farmers;
— modernisation of technological equipment at all levels;
— strengthening of farmers’ protection against the
— increased vertical integration. In the framework of cooperatives, it would also be
possible to facilitate the pedigree cattle breeding and organic farming. The development of this kind of cattle has a positive impact on milk yield, and in Latvia dairy
that. In 2011, the number of cows under supervision included 75 per cent of cows. The productivity of the cows
According to the data in Table 6, the average milk yield of the cows under supervision is 1.2 times higher than in herds without supervision. The best results of milk yield constantly are observed with Holstein black-white cows, the average milk yield of which in 2011 was 6868 kg or by 40 per cent higher than the average of the cows under supervision. It is important that the genetic quality in most of the farms is very good, and the demand has increased in breeding calves for exports (Latvijas lauksaimnieciba, 2012).
Organic farming, involving more and more new farms, expands, and dairying gains the dominance in this area. In 2011, there was 57 thousand tons of milk produced, of which cows’ milk accounted for 56.3 thousand tons, which is 6.8 per cent of the total in dairying. Still, smaller part of the production reaches the market. In 2011, only 31.6 per cent of that milk was sold in the market. Nevertheless, in our country, the processing of organic milk tends to increase; and, in 2011, 19 enterprises participated in it, processing 491.1 tons of milk.
The increase in investments is closely related to farmers’ support from the EU that may be helpful in solution of many urgent problems, especially, those related to the employment in rural areas and maintaining of social structure, further improvement of rural economy
conditions for the small farms, and promoting of rural
accentuating of competitiveness in the context of rural development, facilitating innovations and restructuring that provides opportunities for farms to use the resources
that foresees the maintaining of the production potential on a sustainable basis all over the EU to guarantee a long term providing with food and with support of rural production communities, maintaining of viable rural communities, the agriculture for which is an important economic activity providing local employment. It will lead to a multiplied economic, social, environmental, and
to maintain all that has already been achieved, at the
same time taking an orientation to increased use of new opportunities in the future. What is essential for Latvia regions is to take the best of the achieved at present and to support and develop it skilfully in the future as a precondition that facilitates the maintaining of the identity of the regions contributing in such way to their development.
Conclusions and Recommendations 1. In Latvia, dairying is an area that has experienced
2. Dairying industry in Latvia is fragmented. The productivity in dairying is comparatively low and differs in Latvia regions.
3. conditions for the development of dairying.
4. In dairying industry, the facilitation of cooperation
5. In case of production enlargement, the marketing problems may become more urgent.
6. In order to diminish social economic differences in dairying, it is necessary to improve the level of farmers’ special education to facilitate the use of disposable resources in the area.
7. In spite of a comparatively high level of cattle breeding in the country, further improvement is necessary to favour balanced revenue in dairying of Latvia.
8. It is an urgent necessity to substantiate the attracting of the EU funds and investments to development dairying industry in Latvia.
References1.
sabiedribu? (Who needs a two-speed society?) Diena, 25.01.2010.
2. (Agriculture in Latvia), 2012.
3. Latvijas statistikas gadagramata 2010 (Latvia
Statistical Yearbook 2010)
525. lpp.4. Latvijas statistikas gadagramata 2011 (Latvia
Statistical Yearbook 2011)
489. lpp.5. Lauka atbalsta dienesta publicetie dati (data
published by the Rural Support Service). Retrieved: http://www.lad.gov.lv/lv/ Access: 28.10.2012
6. iespejas Zemgales planosanas regiona lauku saimniecibas. Promocijas darba kopsavilkums (farms of Zemgale planning region. Summary of the
. Jelgava, 99. lpp.
7. REGULATION OF THE EUROPEAN PARLIAMENT AND
OF THE COUNCIL
direct payments to farmers in respect of the year 2013. Retrieved: http://www.agriculture.gov.ie/farmerschemespayments/methodsofpayments/common
8. of Management Levels in Latvia Agriculture.
R. Zvirgzdina, E. Tilta Possibilities of Diminishing of Differences in Regional Social Economics and Dairying in Latvia

67
Economic Science for Rural Development No. 32, 2013
ISSN 1691-3078
Economics Science for Rural Developoment. Jelgava: LLU, Nr.8, pp. 135-139.
9.
faktori Zemgales regiona (Business development and
Ekonomikas
102-109.10. Spogis, K., Mihejeva, L., Viekals, U., Ivans, U.,
Jurgena, I., Stanka, A., Spruge, S., Upite, I.,
attistiba (Entrepreneurship in Sustainable Rural
Development). Jelgava: LLU, 318. lpp.11. (Ministry of
Agriculture, Agriculture Report), 2011.
12.
(Problems of Agricultural Production and Business
Development).
13.
Sauli, 2010. 3 (19), pp.269-276. 14.
(The
in Latvia countryside)
R. Zvirgzdina, E. Tilta Possibilities of Diminishing of Differences in Regional Social Economics and Dairying in Latvia
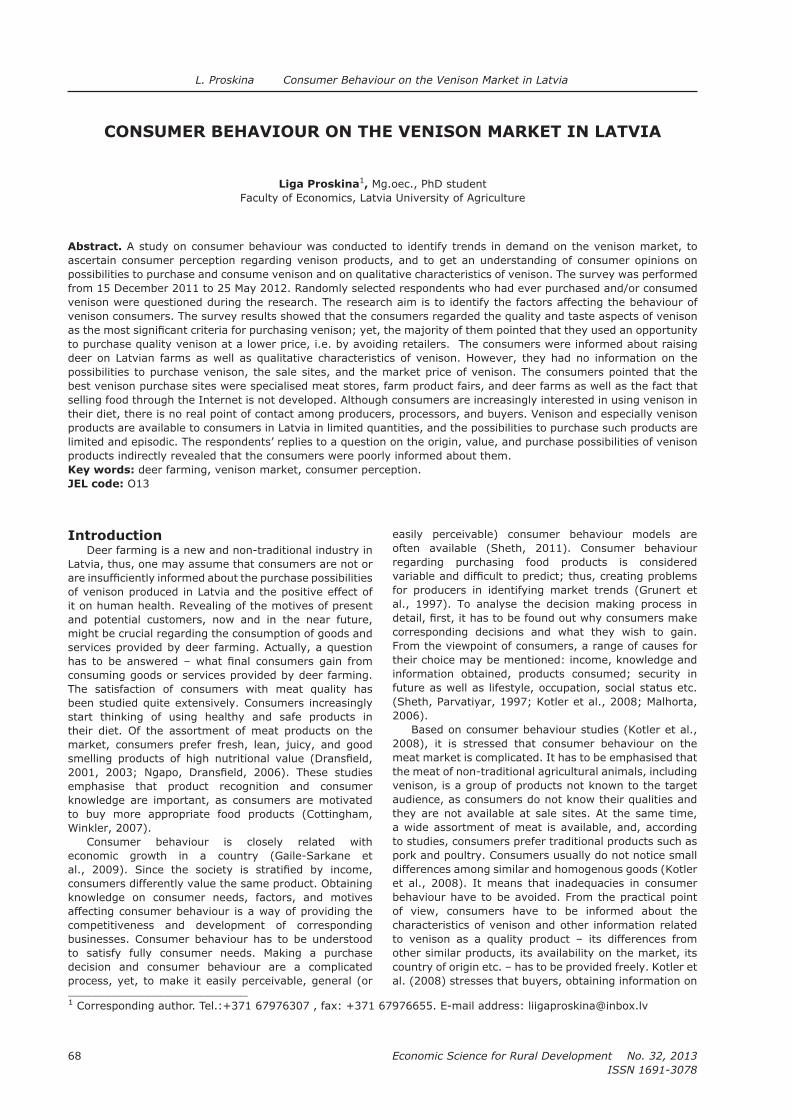
Economic Science for Rural Development No. 32, 2013
ISSN 1691-3078
68
L. Proskina Consumer Behaviour on the Venison Market in Latvia
___________________________1 Tel.:+371 67976307 , fax: +371 67976655. E-mail address: [email protected]
CONSUMER BEHAVIOUR ON THE VENISON MARKET IN LATVIA
Liga Proskina1, Mg.oec., PhD studentFaculty of Economics, Latvia University of Agriculture
Abstract. A study on consumer behaviour was conducted to identify trends in demand on the venison market, to ascertain consumer perception regarding venison products, and to get an understanding of consumer opinions on possibilities to purchase and consume venison and on qualitative characteristics of venison. The survey was performed from 15 December 2011 to 25 May 2012. Randomly selected respondents who had ever purchased and/or consumed venison were questioned during the research. The research aim is to identify the factors affecting the behaviour of venison consumers. The survey results showed that the consumers regarded the quality and taste aspects of venison
to purchase quality venison at a lower price, i.e. by avoiding retailers. The consumers were informed about raising deer on Latvian farms as well as qualitative characteristics of venison. However, they had no information on the possibilities to purchase venison, the sale sites, and the market price of venison. The consumers pointed that the best venison purchase sites were specialised meat stores, farm product fairs, and deer farms as well as the fact that selling food through the Internet is not developed. Although consumers are increasingly interested in using venison in their diet, there is no real point of contact among producers, processors, and buyers. Venison and especially venison products are available to consumers in Latvia in limited quantities, and the possibilities to purchase such products are limited and episodic. The respondents’ replies to a question on the origin, value, and purchase possibilities of venison products indirectly revealed that the consumers were poorly informed about them. Key words: deer farming, venison market, consumer perception.JEL code: O13
IntroductionDeer farming is a new and non-traditional industry in
Latvia, thus, one may assume that consumers are not or
of venison produced in Latvia and the positive effect of it on human health. Revealing of the motives of present and potential customers, now and in the near future, might be crucial regarding the consumption of goods and services provided by deer farming. Actually, a question
consuming goods or services provided by deer farming. The satisfaction of consumers with meat quality has
start thinking of using healthy and safe products in their diet. Of the assortment of meat products on the market, consumers prefer fresh, lean, juicy, and good
emphasise that product recognition and consumer knowledge are important, as consumers are motivated
Winkler, 2007).
economic growth in a country (Gaile-Sarkane et
consumers differently value the same product. Obtaining knowledge on consumer needs, factors, and motives affecting consumer behaviour is a way of providing the competitiveness and development of corresponding
to satisfy fully consumer needs. Making a purchase decision and consumer behaviour are a complicated process, yet, to make it easily perceivable, general (or
easily perceivable) consumer behaviour models are often available (Sheth,regarding purchasing food products is considered
for producers in identifying market trends (Grunert et al., 1997). To analyse the decision making process in
corresponding decisions and what they wish to gain. From the viewpoint of consumers, a range of causes for their choice may be mentioned: income, knowledge and information obtained, products consumed; security in future as well as lifestyle, occupation, social status etc. (Sheth, Parvatiyar, 1997; Kotler et al., 2008; Malhorta, 2006).
Based on consumer behaviour studies (Kotler et al., 2008), it is stressed that consumer behaviour on the meat market is complicated. It has to be emphasised that the meat of non-traditional agricultural animals, including venison, is a group of products not known to the target audience, as consumers do not know their qualities and they are not available at sale sites. At the same time, a wide assortment of meat is available, and, according to studies, consumers prefer traditional products such as
differences among similar and homogenous goods (Kotler et al., 2008). It means that inadequacies in consumer behaviour have to be avoided. From the practical point of view, consumers have to be informed about the characteristics of venison and other information related to venison as a quality product – its differences from other similar products, its availability on the market, its country of origin etc. – has to be provided freely. Kotler et al. (2008) stresses that buyers, obtaining information on
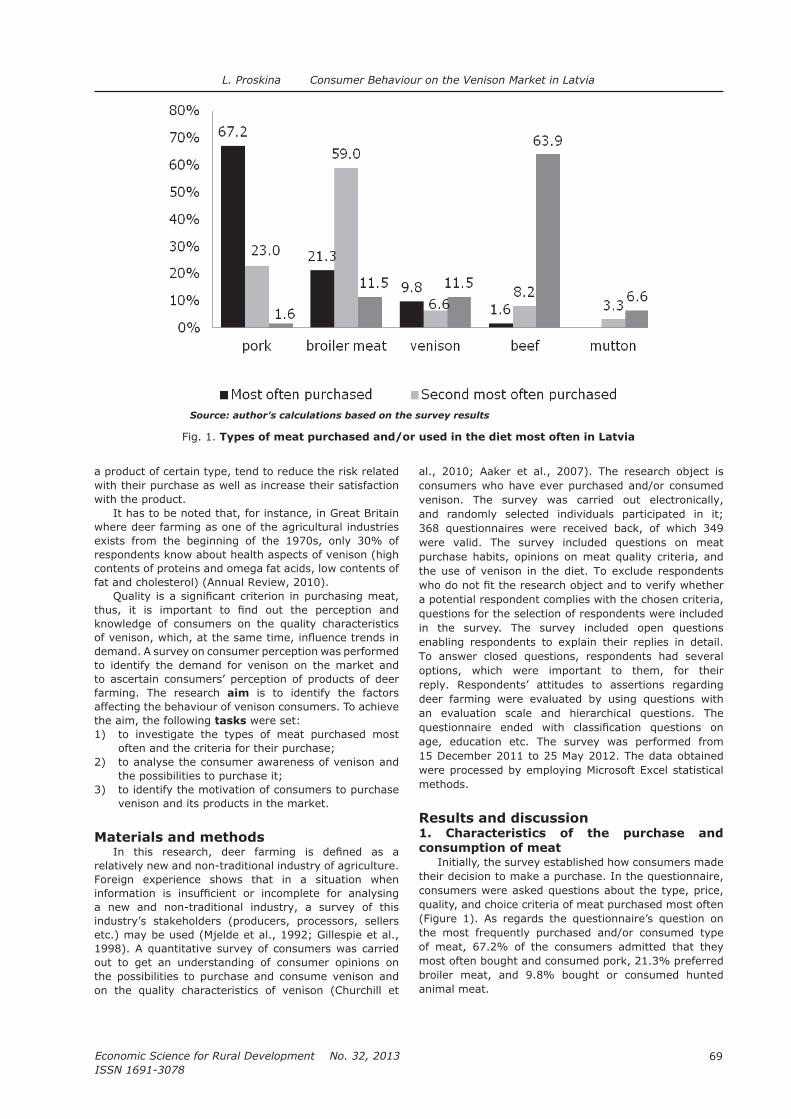
69
Economic Science for Rural Development No. 32, 2013
ISSN 1691-3078
L. Proskina Consumer Behaviour on the Venison Market in Latvia
a product of certain type, tend to reduce the risk related with their purchase as well as increase their satisfaction with the product.
It has to be noted that, for instance, in Great Britain where deer farming as one of the agricultural industries exists from the beginning of the 1970s, only 30% of respondents know about health aspects of venison (high contents of proteins and omega fat acids, low contents of fat and cholesterol) (Annual Review, 2010).
knowledge of consumers on the quality characteristics
demand. A survey on consumer perception was performed to identify the demand for venison on the market and to ascertain consumers’ perception of products of deer farming. The research aim is to identify the factors affecting the behaviour of venison consumers. To achieve the aim, the following tasks were set:1) to investigate the types of meat purchased most
often and the criteria for their purchase;2) to analyse the consumer awareness of venison and
the possibilities to purchase it;3) to identify the motivation of consumers to purchase
venison and its products in the market.
Materials and methods
relatively new and non-traditional industry of agriculture. Foreign experience shows that in a situation when
a new and non-traditional industry, a survey of this industry’s stakeholders (producers, processors, sellers etc.) may be used (Mjelde et al., 1992; Gillespie et al., 1998). A quantitative survey of consumers was carried out to get an understanding of consumer opinions on the possibilities to purchase and consume venison and
al., 2010; Aaker et al., 2007). The research object is consumers who have ever purchased and/or consumed venison. The survey was carried out electronically, and randomly selected individuals participated in it; 368 questionnaires were received back, of which 349 were valid. The survey included questions on meat purchase habits, opinions on meat quality criteria, and the use of venison in the diet. To exclude respondents
a potential respondent complies with the chosen criteria, questions for the selection of respondents were included in the survey. The survey included open questions enabling respondents to explain their replies in detail. To answer closed questions, respondents had several options, which were important to them, for their reply. Respondents’ attitudes to assertions regarding deer farming were evaluated by using questions with an evaluation scale and hierarchical questions. The
age, education etc. The survey was performed from 15 December 2011 to 25 May 2012. The data obtained were processed by employing Microsoft Excel statistical methods.
Results and discussion1. Characteristics of the purchase and consumption of meat
Initially, the survey established how consumers made their decision to make a purchase. In the questionnaire, consumers were asked questions about the type, price, quality, and choice criteria of meat purchased most often (Figure 1). As regards the questionnaire’s question on the most frequently purchased and/or consumed type of meat, 67.2% of the consumers admitted that they most often bought and consumed pork, 21.3% preferred broiler meat, and 9.8% bought or consumed hunted animal meat.
Source: author’s calculations based on the survey results
Fig. 1. Types of meat purchased and/or used in the diet most often in Latvia
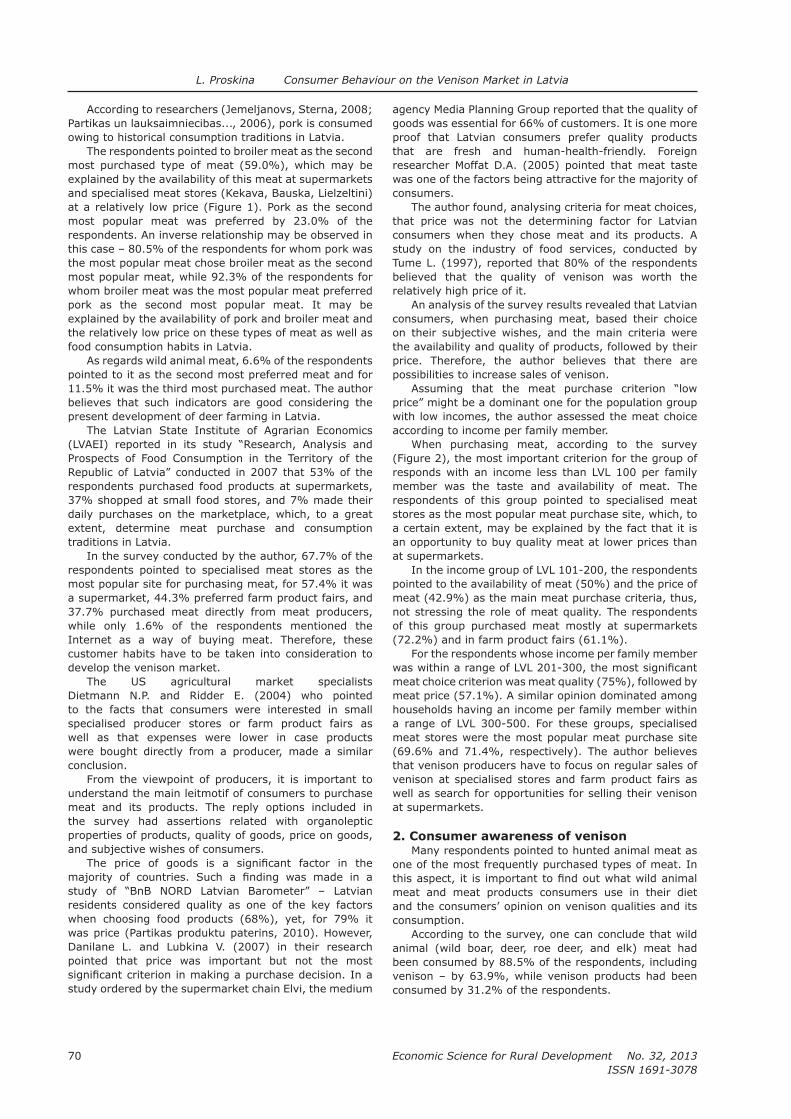
Economic Science for Rural Development No. 32, 2013
ISSN 1691-3078
70
L. Proskina Consumer Behaviour on the Venison Market in Latvia
According to researchers (Jemeljanovs, Sterna, 2008; Partikas un lauksaimniecibas..., 2006), pork is consumed owing to historical consumption traditions in Latvia.
The respondents pointed to broiler meat as the second most purchased type of meat (59.0%), which may be explained by the availability of this meat at supermarkets
at a relatively low price (Figure 1). Pork as the second most popular meat was preferred by 23.0% of the respondents. An inverse relationship may be observed in this case – 80.5% of the respondents for whom pork was the most popular meat chose broiler meat as the second most popular meat, while 92.3% of the respondents for whom broiler meat was the most popular meat preferred pork as the second most popular meat. It may be explained by the availability of pork and broiler meat and the relatively low price on these types of meat as well as food consumption habits in Latvia.
As regards wild animal meat, 6.6% of the respondents pointed to it as the second most preferred meat and for 11.5% it was the third most purchased meat. The author believes that such indicators are good considering the present development of deer farming in Latvia.
The Latvian State Institute of Agrarian Economics
respondents purchased food products at supermarkets, 37% shopped at small food stores, and 7% made their daily purchases on the marketplace, which, to a great extent, determine meat purchase and consumption traditions in Latvia.
In the survey conducted by the author, 67.7% of the respondents pointed to specialised meat stores as the most popular site for purchasing meat, for 57.4% it was a supermarket, 44.3% preferred farm product fairs, and 37.7% purchased meat directly from meat producers, while only 1.6% of the respondents mentioned the Internet as a way of buying meat. Therefore, these customer habits have to be taken into consideration to develop the venison market.
The US agricultural market specialists Dietmann N.P. and Ridder E. (2004) who pointed to the facts that consumers were interested in small specialised producer stores or farm product fairs as well as that expenses were lower in case products were bought directly from a producer, made a similar conclusion.
From the viewpoint of producers, it is important to understand the main leitmotif of consumers to purchase meat and its products. The reply options included in the survey had assertions related with organoleptic properties of products, quality of goods, price on goods, and subjective wishes of consumers.
residents considered quality as one of the key factors when choosing food products (68%), yet, for 79% it was price (Partikas produktu paterins, 2010). However, Danilane L. and Lubkina V. (2007) in their research pointed that price was important but not the most
study ordered by the supermarket chain Elvi, the medium
agency Media Planning Group reported that the quality of goods was essential for 66% of customers. It is one more proof that Latvian consumers prefer quality products that are fresh and human-health-friendly. Foreign researcher Moffat D.A. (2005) pointed that meat taste was one of the factors being attractive for the majority of consumers.
The author found, analysing criteria for meat choices, that price was not the determining factor for Latvian consumers when they chose meat and its products. A study on the industry of food services, conducted by Tume L. (1997), reported that 80% of the respondents believed that the quality of venison was worth the relatively high price of it.
An analysis of the survey results revealed that Latvian consumers, when purchasing meat, based their choice on their subjective wishes, and the main criteria were the availability and quality of products, followed by their price. Therefore, the author believes that there are possibilities to increase sales of venison.
with low incomes, the author assessed the meat choice according to income per family member.
When purchasing meat, according to the survey (Figure 2), the most important criterion for the group of responds with an income less than LVL 100 per family member was the taste and availability of meat. The respondents of this group pointed to specialised meat stores as the most popular meat purchase site, which, to a certain extent, may be explained by the fact that it is an opportunity to buy quality meat at lower prices than at supermarkets.
In the income group of LVL 101-200, the respondents pointed to the availability of meat (50%) and the price of meat (42.9%) as the main meat purchase criteria, thus, not stressing the role of meat quality. The respondents of this group purchased meat mostly at supermarkets (72.2%) and in farm product fairs (61.1%).
For the respondents whose income per family member
meat choice criterion was meat quality (75%), followed by meat price (57.1%). A similar opinion dominated among households having an income per family member within a range of LVL 300-500. For these groups, specialised meat stores were the most popular meat purchase site (69.6% and 71.4%, respectively). The author believes that venison producers have to focus on regular sales of venison at specialised stores and farm product fairs as well as search for opportunities for selling their venison at supermarkets.
2. Consumer awareness of venisonMany respondents pointed to hunted animal meat as
one of the most frequently purchased types of meat. In
meat and meat products consumers use in their diet and the consumers’ opinion on venison qualities and its consumption.
According to the survey, one can conclude that wild animal (wild boar, deer, roe deer, and elk) meat had been consumed by 88.5% of the respondents, including venison – by 63.9%, while venison products had been consumed by 31.2% of the respondents.
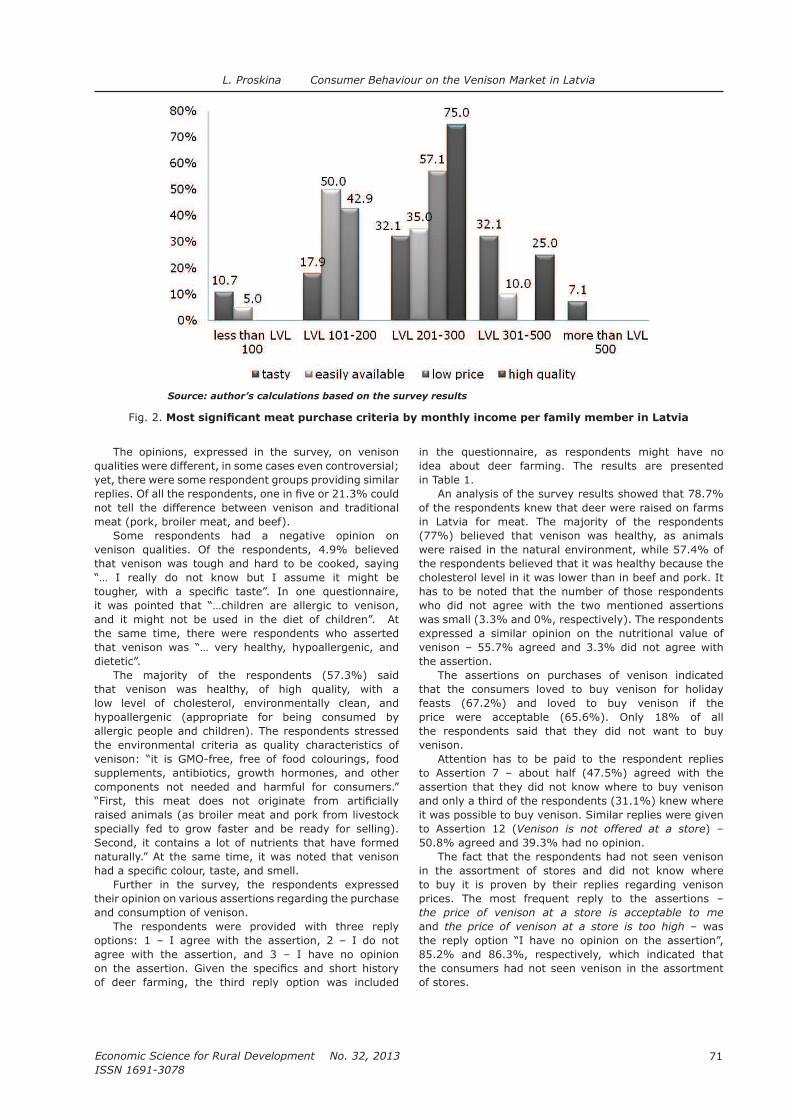
71
Economic Science for Rural Development No. 32, 2013
ISSN 1691-3078
L. Proskina Consumer Behaviour on the Venison Market in Latvia
The opinions, expressed in the survey, on venison qualities were different, in some cases even controversial; yet, there were some respondent groups providing similar
not tell the difference between venison and traditional meat (pork, broiler meat, and beef).
Some respondents had a negative opinion on venison qualities. Of the respondents, 4.9% believed that venison was tough and hard to be cooked, saying
the same time, there were respondents who asserted
The majority of the respondents (57.3%) said that venison was healthy, of high quality, with a low level of cholesterol, environmentally clean, and hypoallergenic (appropriate for being consumed by allergic people and children). The respondents stressed the environmental criteria as quality characteristics of
supplements, antibiotics, growth hormones, and other
raised animals (as broiler meat and pork from livestock specially fed to grow faster and be ready for selling). Second, it contains a lot of nutrients that have formed
Further in the survey, the respondents expressed their opinion on various assertions regarding the purchase and consumption of venison.
The respondents were provided with three reply options: 1 – I agree with the assertion, 2 – I do not agree with the assertion, and 3 – I have no opinion
of deer farming, the third reply option was included
in the questionnaire, as respondents might have no idea about deer farming. The results are presented in Table 1.
An analysis of the survey results showed that 78.7% of the respondents knew that deer were raised on farms in Latvia for meat. The majority of the respondents (77%) believed that venison was healthy, as animals were raised in the natural environment, while 57.4% of the respondents believed that it was healthy because the cholesterol level in it was lower than in beef and pork. It has to be noted that the number of those respondents who did not agree with the two mentioned assertions was small (3.3% and 0%, respectively). The respondents expressed a similar opinion on the nutritional value of venison – 55.7% agreed and 3.3% did not agree with the assertion.
The assertions on purchases of venison indicated that the consumers loved to buy venison for holiday feasts (67.2%) and loved to buy venison if the price were acceptable (65.6%). Only 18% of all the respondents said that they did not want to buy venison.
Attention has to be paid to the respondent replies to Assertion 7 – about half (47.5%) agreed with the assertion that they did not know where to buy venison and only a third of the respondents (31.1%) knew where it was possible to buy venison. Similar replies were given to Assertion 12 (Venison is not offered at a store) – 50.8% agreed and 39.3% had no opinion.
The fact that the respondents had not seen venison in the assortment of stores and did not know where to buy it is proven by their replies regarding venison prices. The most frequent reply to the assertions – the price of venison at a store is acceptable to me and the price of venison at a store is too high – was
85.2% and 86.3%, respectively, which indicated that the consumers had not seen venison in the assortment of stores.
Source: author’s calculations based on the survey results
Fig. 2.
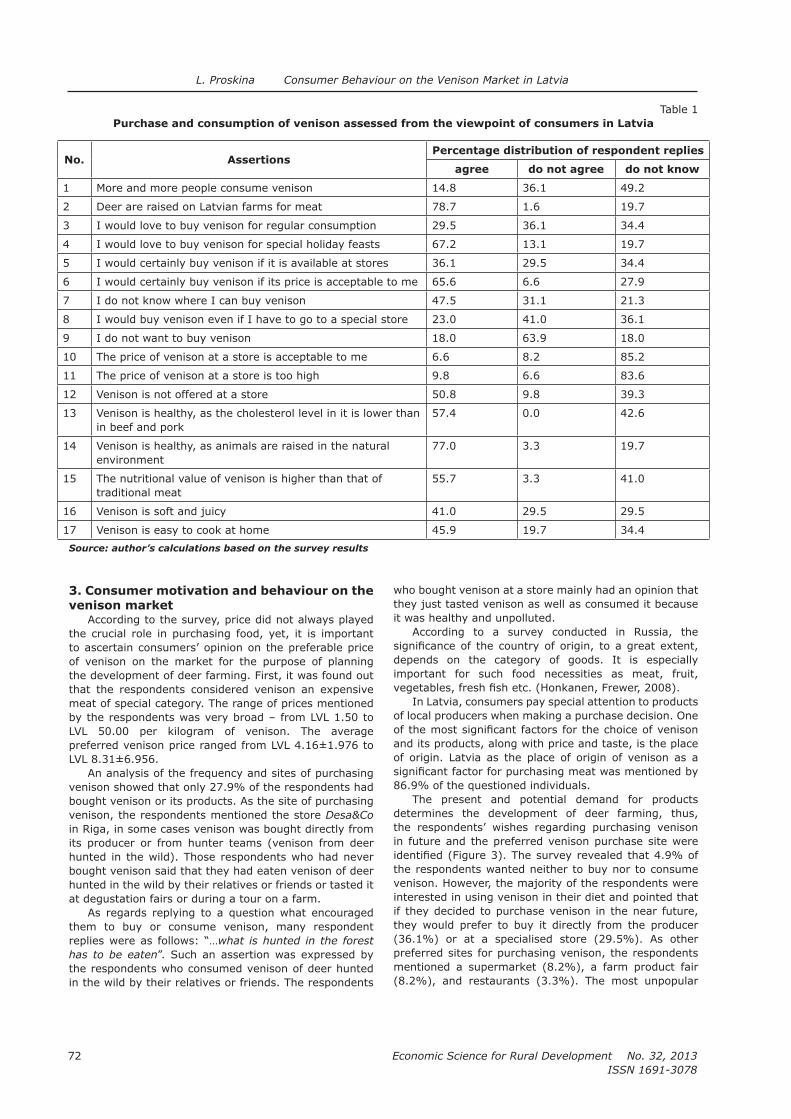
Economic Science for Rural Development No. 32, 2013
ISSN 1691-3078
72
L. Proskina Consumer Behaviour on the Venison Market in Latvia
3. Consumer motivation and behaviour on the venison market
According to the survey, price did not always played the crucial role in purchasing food, yet, it is important to ascertain consumers’ opinion on the preferable price of venison on the market for the purpose of planning the development of deer farming. First, it was found out that the respondents considered venison an expensive meat of special category. The range of prices mentioned by the respondents was very broad – from LVL 1.50 to LVL 50.00 per kilogram of venison. The average
An analysis of the frequency and sites of purchasing venison showed that only 27.9% of the respondents had bought venison or its products. As the site of purchasing venison, the respondents mentioned the store Desa&Co
in Riga, in some cases venison was bought directly from its producer or from hunter teams (venison from deer hunted in the wild). Those respondents who had never bought venison said that they had eaten venison of deer hunted in the wild by their relatives or friends or tasted it at degustation fairs or during a tour on a farm.
As regards replying to a question what encouraged them to buy or consume venison, many respondent
what is hunted in the forest
has to be eaten
the respondents who consumed venison of deer hunted in the wild by their relatives or friends. The respondents
who bought venison at a store mainly had an opinion that they just tasted venison as well as consumed it because it was healthy and unpolluted.
According to a survey conducted in Russia, the
depends on the category of goods. It is especially important for such food necessities as meat, fruit,
In Latvia, consumers pay special attention to products of local producers when making a purchase decision. One
and its products, along with price and taste, is the place of origin. Latvia as the place of origin of venison as a
86.9% of the questioned individuals.The present and potential demand for products
determines the development of deer farming, thus, the respondents’ wishes regarding purchasing venison in future and the preferred venison purchase site were
the respondents wanted neither to buy nor to consume venison. However, the majority of the respondents were interested in using venison in their diet and pointed that if they decided to purchase venison in the near future, they would prefer to buy it directly from the producer (36.1%) or at a specialised store (29.5%). As other preferred sites for purchasing venison, the respondents mentioned a supermarket (8.2%), a farm product fair (8.2%), and restaurants (3.3%). The most unpopular
Table 1Purchase and consumption of venison assessed from the viewpoint of consumers in Latvia
No. AssertionsPercentage distribution of respondent replies
agree do not agree do not know
1 More and more people consume venison 14.8 36.1 49.2
2 Deer are raised on Latvian farms for meat 78.7 1.6 19.7
3 I would love to buy venison for regular consumption 29.5 36.1 34.4
4 I would love to buy venison for special holiday feasts 67.2 13.1 19.7
5 I would certainly buy venison if it is available at stores 36.1 29.5 34.4
6 I would certainly buy venison if its price is acceptable to me 65.6 6.6 27.9
7 I do not know where I can buy venison 47.5 31.1 21.3
8 I would buy venison even if I have to go to a special store 23.0 41.0 36.1
9 I do not want to buy venison 18.0 63.9 18.0
10 The price of venison at a store is acceptable to me 6.6 8.2 85.2
11 The price of venison at a store is too high 9.8 6.6 83.6
12 Venison is not offered at a store 50.8 9.8 39.3
13 Venison is healthy, as the cholesterol level in it is lower than in beef and pork
57.4 0.0 42.6
14 Venison is healthy, as animals are raised in the natural environment
77.0 3.3 19.7
15 The nutritional value of venison is higher than that of traditional meat
55.7 3.3 41.0
16 Venison is soft and juicy 41.0 29.5 29.5
17 Venison is easy to cook at home 45.9 19.7 34.4
Source: author’s calculations based on the survey results

73
Economic Science for Rural Development No. 32, 2013
ISSN 1691-3078
L. Proskina Consumer Behaviour on the Venison Market in Latvia
venison purchase site was the Internet (1.6%). In case
venison purchase site, the respondents explained that they would probably buy venison from familiar hunters, thus, purchasing venison of deer hunted in the wild.
In Europe, venison sales are often practised on the spot on farms. It is related with consumers’ opinion
understanding of meat quality, Becker T., Benner E., and Glitsch K. (2000) point that consumers prefer to buy meat at specialised stores, while purchasing meat directly from a producer is the third most popular meat purchase site (Becker et al., 2000).
In European countries – Germany, Denmark, Great
enterprise, venison is mainly sold in the local market, on the spot on farms, at agricultural fairs, or sold to public catering companies. In this aspect, researches of LVAEI scientists Melece L., Romanova D., and Sena I. (2008), which set two economically viable priorities for food production, have to be stressed. Medium and large meat enterprises have to focus mainly on export markets and the regional market. Small meat enterprises, in their turn, have to focus their sales on the local market (Melece, Romanova, Sena, 2008). The majority of deer farming
Source: author’s calculations based on the survey results
Fig. 3. Venison purchase sites preferred by customers in Latvia
Source: author’s calculations based on the survey results
Fig. 4. Consumer motivation for purchasing venison and its products in Latvia
Economic Science for Rural Development No. 32, 2013
ISSN 1691-3078
74
L. Proskina Consumer Behaviour on the Venison Market in Latvia
other countries, the most popular type of sales for them is direct sales. According to the survey performed by the author, an opinion prevails among consumers in Latvia that meat and its products are human-health-friendly and of high quality if these products are purchased from a local producer.
target audience and further marketing activities (Sheth, 2011; Kotler et al., 2008; Malhorta, 2006). From the supply side, a broad assortment is a prerequisite for stimulating demand. It means that the development of venison processing is directly related not only with broadening a product assortment but also with increasing demand on the market (Michelsen et al., 1999).
The determinant criteria, based on which consumers purchase meat and its products and which, largely, reveal
(Figure 4).The venison price being equal to the price of beef
and pork would motivate the questioned individuals most to buy and consume venison and its products (63.9%). The possibility to purchase venison products
etc.) would motivate 59.0% of the respondents, while greater availability of venison could motivate 52.5% of them. Of the respondents, 47.5% pointed that information on quality characteristics of venison, ways of cooking venison, and recipes would motivate them to buy venison. Only about a fourth (24.6%) of the respondents noted that the availability of venison in restaurant menus would motivate them to buy venison. Some respondents said that they would love to consume
sandwiches etc.).
The economic activity of deer farms in Latvia generates income for Latvian residents from producing products of deer farming, processing hunted animals, trade, and providing tourism services, thus, reducing social and economic tension in rural areas. The increasing area used in deer farming promotes the use of agricultural land in agriculture and the preservation of rural landscapes. Therefore, the rural environment as a place of residence and recreation improves and the number of domestic and foreign tourists rises.
deer farming products in Latvia. It is due to the individual activities of producers in organising sales of their products. Deer farming products are mostly sold as unprocessed or minimally pre-processed products, delivering them in small quantities to consumers or sale sites.
development stages of the deer agribusiness market in Latvia, developing production and processing are equally
and actively informing the public on the qualitative characteristics, assortment, and sale sites of venison
expansion may be provided by small deer enterprises that develop their home production for the purpose of
consumers on the local market.
Conclusions1. Based on the survey, the author concludes that the
are the quality and taste of meat, while the majority of customers pointed that they used an opportunity to purchase quality meat at a lower price, i.e. by avoiding retailers.
2. The consumers were informed about raising deer on Latvian farms as well as qualitative characteristics of venison. However, they had no information on the possibilities to purchase venison, the sale sites, and the market price of venison.
3. The consumers pointed to specialised meat stores, farm product fairs, and deer farms as the best venison purchase sites. At the same time, they stressed that food trade via the Internet was not developed in Latvia, although there were several Internet sites offering hunted animal meat, mainly it was wild animal meat.
4. The possibilities to purchase venison in Latvia are limited and episodic. Venison and especially its products are available to customers in limited quantities. Although consumers are increasingly interested in using venison in their diet, there is no real point of contact among producers, processors, and buyers. It indicates on limited availability of venison and the possibilities to purchase venison.
5. The respondents’ replies to a question about the origin, value, and purchase possibilities of venison products indirectly revealed that the consumers were poorly informed about it.
Bibliography1. Aaker, D.A., Kumar, V., Day, G.S., Lawley, M.,
Stewart, D. (2007). Marketing Research. The Second
Limited, p. 601.2. Annual Review (2010). The British Deer Society
(BDS), UK, pp. 14-16.3.
Perception of Fresh Meat Quality in Germany. British
Food Journal. Volume 102, Issue 3, pp. 246-266. 4.
Basic Marketing Research. 7th Edition. South Western Educational Publisher, p. 640.
5. Handbook
of Organic and Fair Trade Food Marketing. Wiley-Blackwell Publishing, p. 312.
6. Danilane, L., Lubkina, V. (2007). Pateretaja izglitiba
un pateretaja kultura globala aspekta Izglitibas
reforma visparizglitojosa skola:
petijumi un ieviesanas problemas (Consumer
Education and Consumer Culture in the Global
Aspect. The Education Reform at General School:
Education Content Studies and Introduction
Problems)
pp. 21-32, in Latvian.7. Dietmann, N. P., Ridder, E. (2004). Non-
traditional Agricultural Markets a Few Trends and Examples. Retrieved: http://www.uwex.edu/ces/agmarkets/publications/documents/Non-TraditionalAgriculturalMarkets.pdf.

75
Economic Science for Rural Development No. 32, 2013
ISSN 1691-3078
8. Consumer Issues and
Acceptance of Meat. The 47th International
Poland, pp. 72-78.9. Consumer Acceptance –
Meat Quality Aspects. 11th International Meat Symposium. Pretoria, South Africa, pp. 146-159.
10. Gaile-Sarkane, E., Magidenko, A., Andersone, I. (2009). Pateretaju ricibas izmainas Latvija:
informacijas tehnologiju ietekmes novertesana
(Consumer Behaviour Changes in Latvia: An
Assessment of Information Technology Effects). No: 6. LZP Ekonomikas, juridiskas un vestures
komisija, pp. 61.-66, in Latvian.11. Gillespie J., Taylor G., Schupp A., Wirth F. (1998).
Opinions of Professional Buyers Toward a New, Alternative Red Meat: Ostrich. Agribusiness, Vol. 14, No. 3, pp. 247-256.
12. Grunert, K. G., Harmsen, H., Larsen, H. H., Sorensen, E., Bisp, S.(1997). New Areas in Agricultural and Food Marketing. In: B. Wierenga, A. Van Tilburg, K. Grunert, J. E. M. Steenkamp, M. Wedel (Eds.) Agricultural Marketing and Consumer
Behaviour in a Changing World. Boston: Kluwer Academic Publishers, pp. 3-29.
13. Honkanen, P., Frewer, L. (2008). Russian
Appetite Volume 52, Issue 2, pp. 363-371; 52(2) pp. 363-71. Available in Science Direct.
14. Jemeljanovs, A., Sterna, V. (2008). Liellopu gala - kvalitativs partikas products (Beef – a Quality Food
Product). Retrieved: http://www.saimnieks.lv/Lopkopiba/Govkopiba/3937. Access: 29 April 2010, in Latvian.
15. Kotler, P., Armstrong, G., Wong, V., Saunders J.A. (2008). Principles of Marketing (11th Edition) Pearson Education, p. 1020.
16. Malhorta, N.K. (2006). Marketing Research. Prentice Hall, p. 811.
17. Melece, L., Romanova, D., Sena, I. (2008). Kvalitates un vides vadibas sistemu ekonomisko
un partikas sfera (Assessment of the Effects of
Economic Factors of Quality and Environmental
Management Systems in the Agricultural and Food
Sector). No: LZP Ekonomikas, juridiskas un vestures
zinatnes galvenie petijumu virzieni 2007.gada.
komisija. Nr. 13, pp. 94-99, in Latvian.18. Michelsen, J., Hamm, U., Wynen, E., Roth, E.
(1999). The European Market for Organic Products:
Growth and Development. Hohenheim. Universität Hohenheim, Institut für Landwirtschaftliche Betriebslehre. p. 199.
19.
Producers. Agribusiness, Vol. 8, No. 5, pp. 473-484.20. Moffat, D.A. (2005). A Domestic Marketing
Positioning Strategy for Australian Venison - Report
21. British
Consumers Preferred Fatness Levels in Beef:
Surveys from 1955, 1982 and 2002. Food Quality and Preferences, 17, pp. 412–417.
22. Partikas produktu paterins (Consumption of Food
Products
petijums Nr. 24 (Study No. 24 of “DnB NORD
Latvian Barometer). Retrieved: http://www.dnb.lv/,
in Latvian.23. Partikas un lauksaimniecibas produktu bilance,
paterins, ta struktura un uzturvertiba Latvija
2013. gadam starptautisko saistibu izpildei un
uzraudzibas programmu izstradei (Balance,
Consumption and its Pattern and Nutritional Value
of Food and Agricultural Products in Latvia in 2003-
International Obligations and Developing Monitoring
Programmes) (2006). Melece L. (projekta vaditaja). Deponeta atskaite Zemkopibas ministrijas fondos
Valsts Agraras ekonomikas instituts, p.163, in Latvian.
24. Sheth Jagdish N., Parvatiyar A. (1997). Research in
Marketing. Emerald Group Publishing. p. 276.25. Sheth Jagdish, N. (2011). Models of Buyer Behaviour:
Conceptual, Quantitative & Empirical. Marketing
26. Tume, L. (1997). Venison Market Development
Programs Towards 2000,
Acknowledgements
L. Proskina Consumer Behaviour on the Venison Market in Latvia

Economic Science for Rural Development No. 32, 2013
ISSN 1691-3078
76
R. Pietrzykowski Agricultural Land Market in Poland and The European Union
___________________________1 E-mail address
AGRICULTURAL LAND MARKET IN POLAND AND THE EUROPEAN UNION
Robert Pietrzykowski1, PhDFaculty of Economics, Warsaw University of Life Sciences – SGGW
Abstract. The aim of this study was to compare the agricultural land market in Poland and in the selected countries of the European Union. The present paper compares the price changes of agricultural land in Poland and the EU. This research contains the information on institutions involved in agricultural land management in the selected EU countries. The paper presents the current state of the Polish market and its prospects for the land. Therefore, the development of the agricultural real estate market in Poland covers the years from 2004 to 2012. Agricultural land market can be described by agricultural land resources, a form of possession of land, soil quality, lease payments, and
of agricultural land. The main characteristic of the agricultural market is the price. Agricultural land market in Poland is of a great interest to investors despite some problems related with the lack of liquidity of the land. One believes that the land market opening to foreigners should stabilise the agricultural land market in the short term.Key words: agriculture land market, land management.JEL code: F16, R19
IntroductionIn Poland, the land area and its quality is still very
important in the formation of production. Some analyses show that the quality of land is one the main factors
technology (Wicki, Dudek, 2009). The direction of change was seen in recent years, i.e. an increase of the land
change the fact that land was limited and at the same time it was an indispensable means of production in agriculture. In developed countries, which are strong in economic terms, the production provides a certain degree of independence from the land of agriculture as a means of production. The European agricultural model is aimed at reconciling the land as a factor of production and environmental aspects of the environment (Kauko, d’Amato, 2008). Institutions that are responsible for land management have been established in the majority of the EU Member States. Attitude towards the land shows
advisors, agricultural land will be the best investment of capital in the current year. The aim of this study was to compare changes in the price of agricultural land in Poland and in the selected countries of the European Union.
Research results and discussionAgricultural land market can be described by
agricultural land resources, a form of land possession, soil quality, lease payments, and agricultural land prices.
assets. It should be noted that the price of agricultural land has been growing steadily since 2004; however,
2012). This paper presents the problems associated with the land management. The study of agricultural land market was characterised mainly by the land prices. The results presented relate with land prices, area, and land quality. The tasks of the research were twofold: 1) to compare the level of land prices; and 2) to compare the dynamics of changes in agricultural land prices. The data
APA in the period from 2002 to 2012.
1. Agricultural land managementThe functioning of the agricultural land market
is regulated by a set of laws that apply to trade with land, sales, and exchange of land. In individual countries of the European Union, various institutions have been established for this purpose. In Poland, the Agricultural Property Agency (formerly the Agricultural Property Agency of the State Treasury) is an institution responsible for agricultural property owned by the State Treasury. The Agency performs its activity based on two legal acts: the Act on the Management of Agricultural Real Estate of the State Treasury dated 19 October 1991 and the Act on the Formation of Agricultural System dated 11 April 2003. The Agricultural Property Agency is responsible for:
— creating and improving agricultural land structure of family farms;
— creating conditions conducive to the rational use of the productive potential of the Property Stock of the State Treasury;
— restructuring and privatisation of the State Treasury property used for agricultural purposes;
— real estate and other assets of the State Treasury to be used for agricultural purposes;
— administration of the resources of the State Treasury property intended for agricultural purposes;
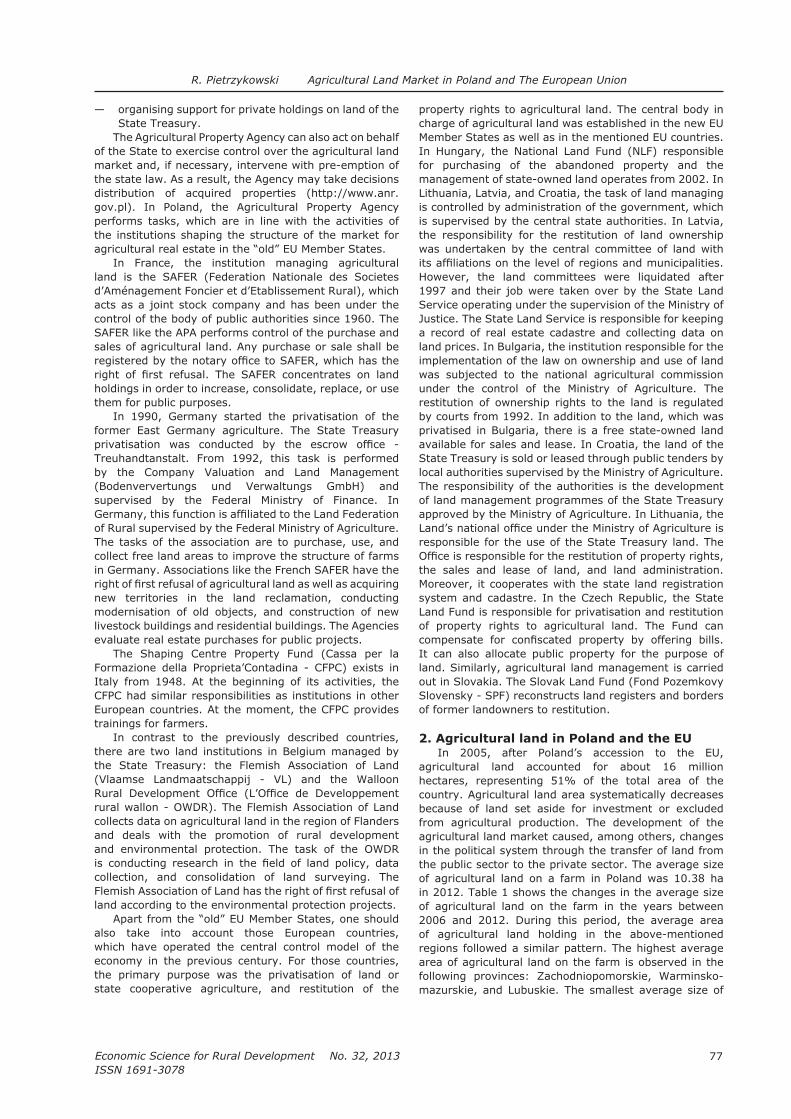
77
Economic Science for Rural Development No. 32, 2013
ISSN 1691-3078
— organising support for private holdings on land of the State Treasury.
The Agricultural Property Agency can also act on behalf of the State to exercise control over the agricultural land market and, if necessary, intervene with pre-emption of the state law. As a result, the Agency may take decisions distribution of acquired properties (http://www.anr.gov.pl). In Poland, the Agricultural Property Agency performs tasks, which are in line with the activities of the institutions shaping the structure of the market for
In France, the institution managing agricultural land is the SAFER (Federation Nationale des Societes d’Aménagement Foncier et d’Etablissement Rural), which acts as a joint stock company and has been under the control of the body of public authorities since 1960. The SAFER like the APA performs control of the purchase and sales of agricultural land. Any purchase or sale shall be
holdings in order to increase, consolidate, replace, or use them for public purposes.
In 1990, Germany started the privatisation of the former East Germany agriculture. The State Treasury
Treuhandtanstalt. From 1992, this task is performed
(Bodenververtungs und Verwaltungs GmbH) and supervised by the Federal Ministry of Finance. In
of Rural supervised by the Federal Ministry of Agriculture. The tasks of the association are to purchase, use, and collect free land areas to improve the structure of farms in Germany. Associations like the French SAFER have the
new territories in the land reclamation, conducting modernisation of old objects, and construction of new livestock buildings and residential buildings. The Agencies evaluate real estate purchases for public projects.
Italy from 1948. At the beginning of its activities, the
trainings for farmers.In contrast to the previously described countries,
there are two land institutions in Belgium managed by the State Treasury: the Flemish Association of Land (Vlaamse Landmaatschappij - VL) and the Walloon
rural wallon - OWDR). The Flemish Association of Land collects data on agricultural land in the region of Flanders and deals with the promotion of rural development and environmental protection. The task of the OWDR
collection, and consolidation of land surveying. The
land according to the environmental protection projects.
also take into account those European countries, which have operated the central control model of the economy in the previous century. For those countries, the primary purpose was the privatisation of land or state cooperative agriculture, and restitution of the
property rights to agricultural land. The central body in charge of agricultural land was established in the new EU Member States as well as in the mentioned EU countries. In Hungary, the National Land Fund (NLF) responsible for purchasing of the abandoned property and the management of state-owned land operates from 2002. In
is controlled by administration of the government, which is supervised by the central state authorities. In Latvia, the responsibility for the restitution of land ownership was undertaken by the central committee of land with
However, the land committees were liquidated after 1997 and their job were taken over by the State Land Service operating under the supervision of the Ministry of Justice. The State Land Service is responsible for keeping a record of real estate cadastre and collecting data on land prices. In Bulgaria, the institution responsible for the implementation of the law on ownership and use of land was subjected to the national agricultural commission under the control of the Ministry of Agriculture. The restitution of ownership rights to the land is regulated by courts from 1992. In addition to the land, which was privatised in Bulgaria, there is a free state-owned land
State Treasury is sold or leased through public tenders by local authorities supervised by the Ministry of Agriculture. The responsibility of the authorities is the development of land management programmes of the State Treasury approved by the Ministry of Agriculture. In Lithuania, the
responsible for the use of the State Treasury land. The
the sales and lease of land, and land administration. Moreover, it cooperates with the state land registration
Land Fund is responsible for privatisation and restitution of property rights to agricultural land. The Fund can
It can also allocate public property for the purpose of land. Similarly, agricultural land management is carried
Slovensky - SPF) reconstructs land registers and borders of former landowners to restitution.
2. Agricultural land in Poland and the EUIn 2005, after Poland’s accession to the EU,
agricultural land accounted for about 16 million hectares, representing 51% of the total area of the country. Agricultural land area systematically decreases because of land set aside for investment or excluded from agricultural production. The development of the agricultural land market caused, among others, changes in the political system through the transfer of land from
of agricultural land on a farm in Poland was 10.38 ha
of agricultural land on the farm in the years between 2006 and 2012. During this period, the average area of agricultural land holding in the above-mentioned regions followed a similar pattern. The highest average area of agricultural land on the farm is observed in the following provinces: Zachodniopomorskie, Warminsko-
R. Pietrzykowski Agricultural Land Market in Poland and The European Union
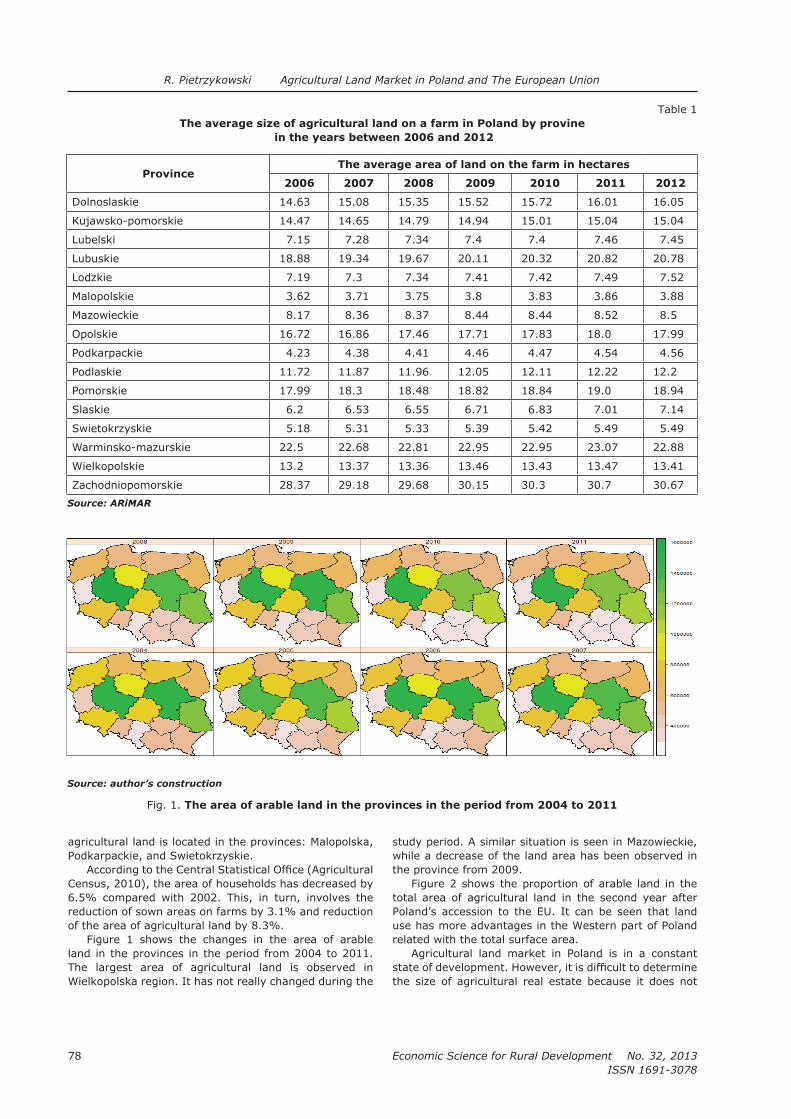
Economic Science for Rural Development No. 32, 2013
ISSN 1691-3078
78
agricultural land is located in the provinces: Malopolska,
6.5% compared with 2002. This, in turn, involves the reduction of sown areas on farms by 3.1% and reduction of the area of agricultural land by 8.3%.
Figure 1 shows the changes in the area of arable land in the provinces in the period from 2004 to 2011. The largest area of agricultural land is observed in Wielkopolska region. It has not really changed during the
while a decrease of the land area has been observed in the province from 2009.
Figure 2 shows the proportion of arable land in the total area of agricultural land in the second year after Poland’s accession to the EU. It can be seen that land use has more advantages in the Western part of Poland related with the total surface area.
Agricultural land market in Poland is in a constant
Table 1 The average size of agricultural land on a farm in Poland by provine
in the years between 2006 and 2012
ProvinceThe average area of land on the farm in hectares
2006 2007 2008 2009 2010 2011 2012
Dolnoslaskie 14.63 15.08 15.35 15.52 15.72 16.01 16.05
Kujawsko-pomorskie 14.47 14.65 14.79 14.94 15.01 15.04 15.04
Lubelski 7.15 7.28 7.34 7.4 7.4 7.46 7.45
Lubuskie 18.88 19.34 19.67 20.11 20.32 20.82 20.78
7.19 7.3 7.34 7.41 7.42 7.49 7.52
Malopolskie 3.62 3.71 3.75 3.8 3.83 3.86 3.88
8.17 8.36 8.37 8.44 8.44 8.52 8.5
Opolskie 16.72 16.86 17.46 17.71 17.83 18.0 17.99
Podkarpackie 4.23 4.38 4.41 4.46 4.47 4.54 4.56
Podlaskie 11.72 11.87 11.96 12.05 12.11 12.22 12.2
Pomorskie 17.99 18.3 18.48 18.82 18.84 19.0 18.94
Slaskie 6.2 6.53 6.55 6.71 6.83 7.01 7.14
5.18 5.31 5.33 5.39 5.42 5.49 5.49
22.5 22.68 22.81 22.95 22.95 23.07 22.88
Wielkopolskie 13.2 13.37 13.36 13.46 13.43 13.47 13.41
Zachodniopomorskie 28.37 29.18 29.68 30.15 30.3 30.7 30.67
Source: ARiMAR
Source: author’s construction
Fig. 1. The area of arable land in the provinces in the period from 2004 to 2011
R. Pietrzykowski Agricultural Land Market in Poland and The European Union

79
Economic Science for Rural Development No. 32, 2013
ISSN 1691-3078
lead to transaction summary records of the transfer of agricultural land. From July 2003, the APA is obliged to monitor the private market, evidencing the area of the property. As it was mentioned previously, the land market in Poland is monitored by the APA, which sells or leases land of the State Treasury. Buyers of agricultural land from the APA are mainly individuals and farmers managing their farms. Legal entities - companies engaged in agricultural production are in the vast
minority. In addition to this market, there are individuals who make sales or donations. This applies in most cases to minor property. It should also include transactions made by investors when buying agricultural land for investment purposes (change of use of agricultural land for construction purposes or recreational).
Transactions with agricultural land in Poland may be determined on the basis of the data from the Ministry of Justice, which obtains these data from notaries. The
Fig. 2. The share of arable lands in the total area of agricultural land, 2005
Source: author’s construction
Fig. 3. Dynamics of changes in agricultural land prices (poor, medium, and good)
in the years from 1999 to 2011
R. Pietrzykowski Agricultural Land Market in Poland and The European Union
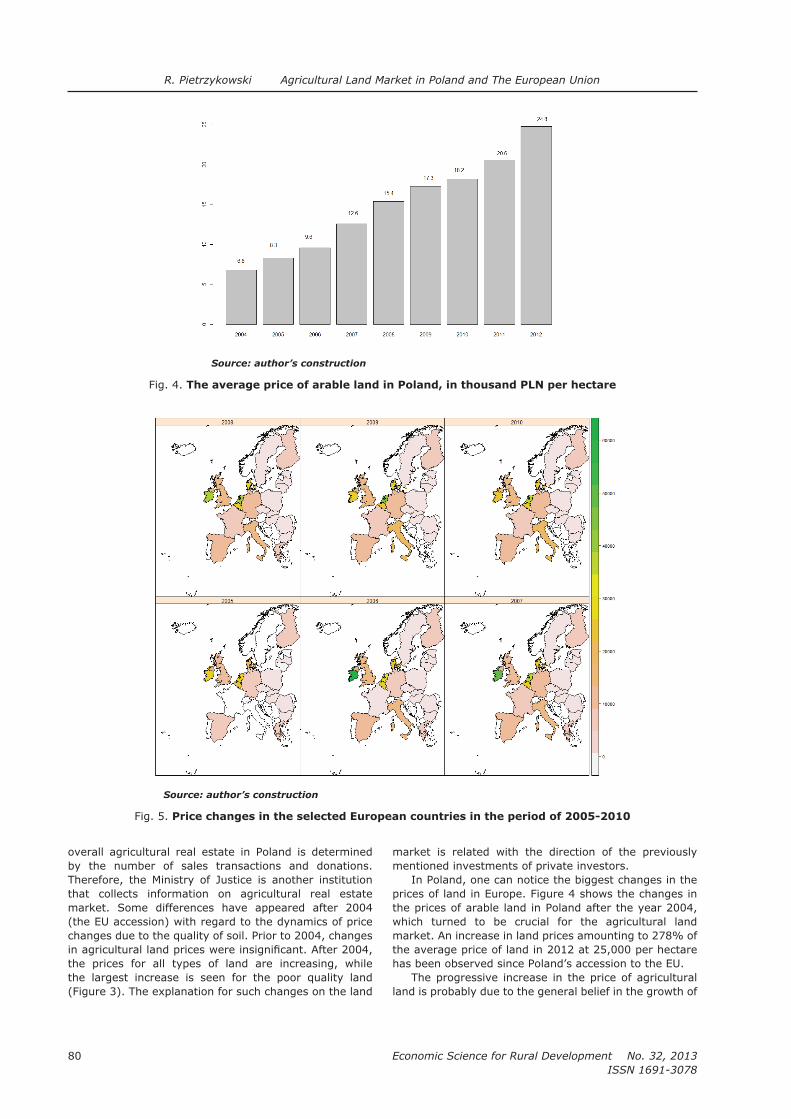
Economic Science for Rural Development No. 32, 2013
ISSN 1691-3078
80
overall agricultural real estate in Poland is determined by the number of sales transactions and donations. Therefore, the Ministry of Justice is another institution that collects information on agricultural real estate market. Some differences have appeared after 2004 (the EU accession) with regard to the dynamics of price changes due to the quality of soil. Prior to 2004, changes
the prices for all types of land are increasing, while the largest increase is seen for the poor quality land (Figure 3). The explanation for such changes on the land
market is related with the direction of the previously mentioned investments of private investors.
In Poland, one can notice the biggest changes in the prices of land in Europe. Figure 4 shows the changes in the prices of arable land in Poland after the year 2004, which turned to be crucial for the agricultural land market. An increase in land prices amounting to 278% of the average price of land in 2012 at 25,000 per hectare has been observed since Poland’s accession to the EU.
The progressive increase in the price of agricultural land is probably due to the general belief in the growth of
Source: author’s construction
Fig. 4. The average price of arable land in Poland, in thousand PLN per hectare
Source: author’s construction
Fig. 5. Price changes in the selected European countries in the period of 2005-2010
R. Pietrzykowski Agricultural Land Market in Poland and The European Union

81
Economic Science for Rural Development No. 32, 2013
ISSN 1691-3078
Source: author’s construction
Fig. 6. The average rate of changes in the period from 2005 to 2011
Source: author’s calculations based on the EUROSTAT
Fig. 7. The average price of agricultural land in the selected European countries in 2011 (EUR/ha)
demand for land in 2016. This year the Polish market is going to be opened to foreigners. Moreover, it is expected to increase the level of direct payments (this follows
Policy) in the years 2014 – 2020. It seems that in the
face of uncertainty, the purchase of agricultural land is a good investment. Problems that shall be overcome by the investor include restrictions introduced by the Polish government. It is necessary to be a farmer and to cultivate the land in order to use the subsidies. The
R. Pietrzykowski Agricultural Land Market in Poland and The European Union
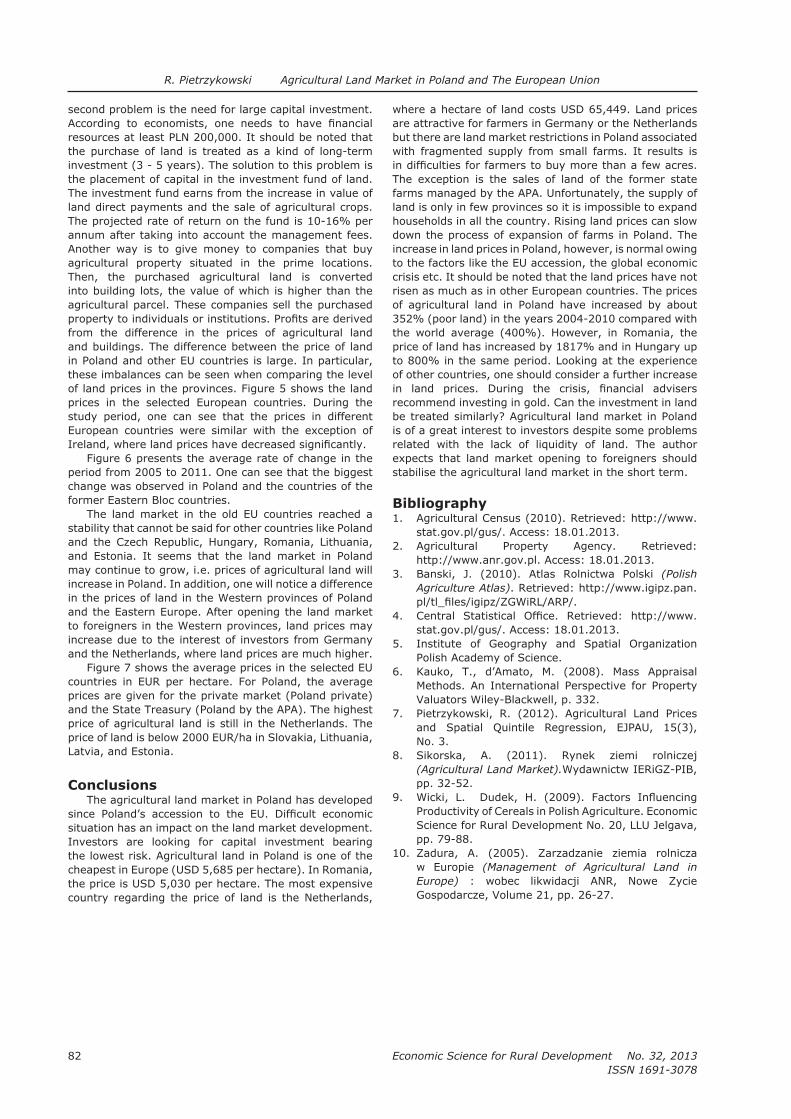
Economic Science for Rural Development No. 32, 2013
ISSN 1691-3078
82
second problem is the need for large capital investment.
resources at least PLN 200,000. It should be noted that the purchase of land is treated as a kind of long-term investment (3 - 5 years). The solution to this problem is the placement of capital in the investment fund of land. The investment fund earns from the increase in value of land direct payments and the sale of agricultural crops. The projected rate of return on the fund is 10-16% per annum after taking into account the management fees. Another way is to give money to companies that buy agricultural property situated in the prime locations. Then, the purchased agricultural land is converted into building lots, the value of which is higher than the agricultural parcel. These companies sell the purchased
from the difference in the prices of agricultural land and buildings. The difference between the price of land in Poland and other EU countries is large. In particular, these imbalances can be seen when comparing the level of land prices in the provinces. Figure 5 shows the land prices in the selected European countries. During the study period, one can see that the prices in different European countries were similar with the exception of
Figure 6 presents the average rate of change in the period from 2005 to 2011. One can see that the biggest change was observed in Poland and the countries of the former Eastern Bloc countries.
The land market in the old EU countries reached a stability that cannot be said for other countries like Poland
and Estonia. It seems that the land market in Poland may continue to grow, i.e. prices of agricultural land will increase in Poland. In addition, one will notice a difference in the prices of land in the Western provinces of Poland and the Eastern Europe. After opening the land market to foreigners in the Western provinces, land prices may increase due to the interest of investors from Germany and the Netherlands, where land prices are much higher.
Figure 7 shows the average prices in the selected EU countries in EUR per hectare. For Poland, the average prices are given for the private market (Poland private) and the State Treasury (Poland by the APA). The highest price of agricultural land is still in the Netherlands. The price of land is below 2000 EUR/ha in Slovakia, Lithuania, Latvia, and Estonia.
ConclusionsThe agricultural land market in Poland has developed
situation has an impact on the land market development. Investors are looking for capital investment bearing the lowest risk. Agricultural land in Poland is one of the cheapest in Europe (USD 5,685 per hectare). In Romania, the price is USD 5,030 per hectare. The most expensive country regarding the price of land is the Netherlands,
where a hectare of land costs USD 65,449. Land prices are attractive for farmers in Germany or the Netherlands but there are land market restrictions in Poland associated with fragmented supply from small farms. It results is
The exception is the sales of land of the former state farms managed by the APA. Unfortunately, the supply of land is only in few provinces so it is impossible to expand households in all the country. Rising land prices can slow down the process of expansion of farms in Poland. The increase in land prices in Poland, however, is normal owing to the factors like the EU accession, the global economic crisis etc. It should be noted that the land prices have not risen as much as in other European countries. The prices of agricultural land in Poland have increased by about 352% (poor land) in the years 2004-2010 compared with the world average (400%). However, in Romania, the price of land has increased by 1817% and in Hungary up to 800% in the same period. Looking at the experience of other countries, one should consider a further increase
be treated similarly? Agricultural land market in Poland is of a great interest to investors despite some problems related with the lack of liquidity of land. The author expects that land market opening to foreigners should stabilise the agricultural land market in the short term.
Bibliography1.
stat.gov.pl/gus/. Access: 18.01.2013.2. Agricultural Property Agency. Retrieved:
http://www.anr.gov.pl. Access: 18.01.2013.3. Banski, J. (2010). Atlas Rolnictwa Polski (Polish
Agriculture Atlas)
4. stat.gov.pl/gus/. Access: 18.01.2013.
5. Polish Academy of Science.
6. Kauko, T., d’Amato, M. (2008). Mass Appraisal Methods. An International Perspective for Property Valuators Wiley-Blackwell, p. 332.
7. and Spatial Quintile Regression, EJPAU, 15(3), No. 3.
8. (Agricultural Land Market).Wydawnictw IERiGZ-PIB, pp. 32-52.
9. Wicki, L.
Science for Rural Development No. 20, LLU Jelgava, pp. 79-88.
10. w Europie (Management of Agricultural Land in
Europe) : wobec likwidacji ANR, Nowe Zycie
R. Pietrzykowski Agricultural Land Market in Poland and The European Union
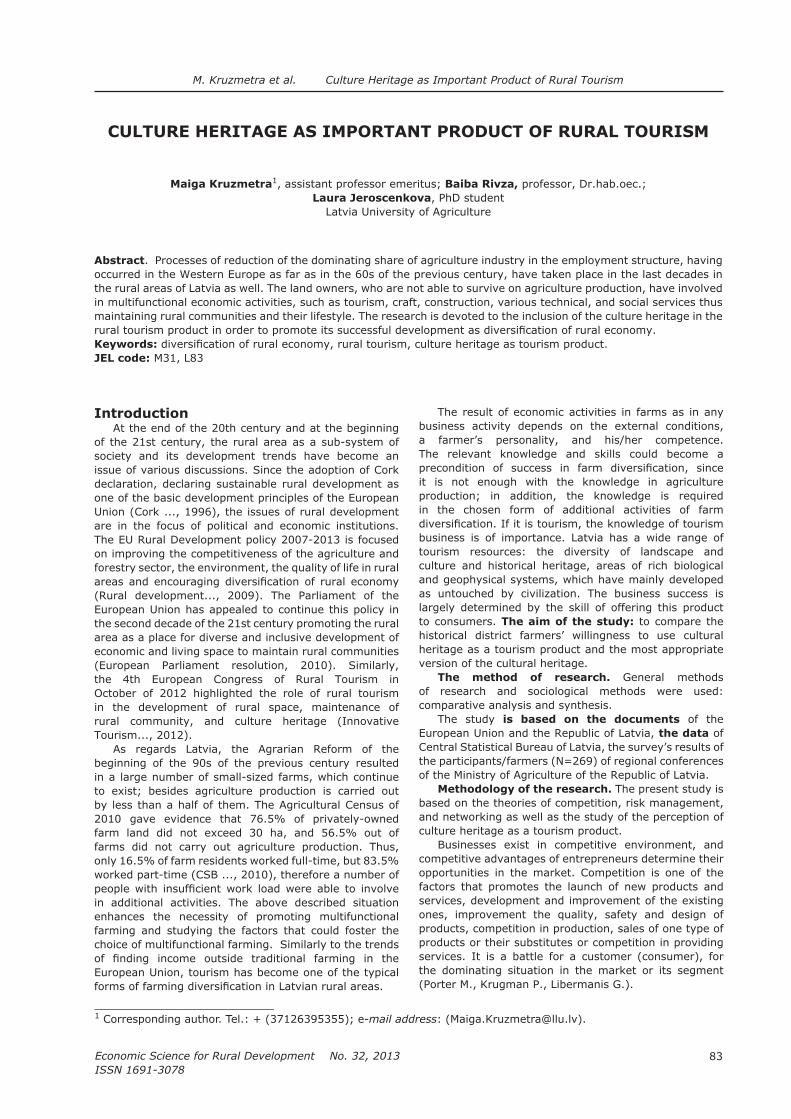
83
Economic Science for Rural Development No. 32, 2013
ISSN 1691-3078
M. Kruzmetra et al. Culture Heritage as Important Product of Rural Tourism
CULTURE HERITAGE AS IMPORTANT PRODUCT OF RURAL TOURISM
Maiga Kruzmetra1, assistant professor emeritus; Baiba Rivza, professor, Dr.hab.oec.; Laura Jeroscenkova, PhD student
Latvia University of Agriculture
Abstract. Processes of reduction of the dominating share of agriculture industry in the employment structure, having occurred in the Western Europe as far as in the 60s of the previous century, have taken place in the last decades in the rural areas of Latvia as well. The land owners, who are not able to survive on agriculture production, have involved in multifunctional economic activities, such as tourism, craft, construction, various technical, and social services thus maintaining rural communities and their lifestyle. The research is devoted to the inclusion of the culture heritage in the
Keywords:
JEL code: M31, L83
___________________________1 -mail address
IntroductionAt the end of the 20th century and at the beginning
of the 21st century, the rural area as a sub-system of society and its development trends have become an
declaration, declaring sustainable rural development as one of the basic development principles of the European
are in the focus of political and economic institutions. The EU Rural Development policy 2007-2013 is focused on improving the competitiveness of the agriculture and forestry sector, the environment, the quality of life in rural
(Rural development..., 2009). The Parliament of the European Union has appealed to continue this policy in the second decade of the 21st century promoting the rural area as a place for diverse and inclusive development of economic and living space to maintain rural communities (European Parliament resolution, 2010). Similarly,
October of 2012 highlighted the role of rural tourism in the development of rural space, maintenance of rural community, and culture heritage (Innovative Tourism..., 2012).
As regards Latvia, the Agrarian Reform of the beginning of the 90s of the previous century resulted
to exist; besides agriculture production is carried out
2010 gave evidence that 76.5% of privately-owned farm land did not exceed 30 ha, and 56.5% out of farms did not carry out agriculture production. Thus, only 16.5% of farm residents worked full-time, but 83.5%
in additional activities. The above described situation enhances the necessity of promoting multifunctional farming and studying the factors that could foster the choice of multifunctional farming. Similarly to the trends
European Union, tourism has become one of the typical
The result of economic activities in farms as in any business activity depends on the external conditions, a farmer’s personality, and his/her competence. The relevant knowledge and skills could become a
it is not enough with the knowledge in agriculture production; in addition, the knowledge is required in the chosen form of additional activities of farm
business is of importance. Latvia has a wide range of tourism resources: the diversity of landscape and culture and historical heritage, areas of rich biological and geophysical systems, which have mainly developed
largely determined by the skill of offering this product to consumers. The aim of the study: to compare the historical district farmers’ willingness to use cultural heritage as a tourism product and the most appropriate version of the cultural heritage.
The method of research. General methods of research and sociological methods were used: comparative analysis and synthesis.
The study is based on the documents of the European Union and the Republic of Latvia, the data of
the participants/farmers (N=269) of regional conferences of the Ministry of Agriculture of the Republic of Latvia.
Methodology of the research. The present study is based on the theories of competition, risk management, and networking as well as the study of the perception of culture heritage as a tourism product.
Businesses exist in competitive environment, and competitive advantages of entrepreneurs determine their
factors that promotes the launch of new products and services, development and improvement of the existing ones, improvement the quality, safety and design of products, competition in production, sales of one type of products or their substitutes or competition in providing services. It is a battle for a customer (consumer), for the dominating situation in the market or its segment (Porter M., Krugman P., Libermanis G.).

Economic Science for Rural Development No. 32, 2013
ISSN 1691-3078
84
M. Kruzmetra et al. Culture Heritage as Important Product of Rural Tourism
global competitiveness of an individual, a company, an industry, and an economy. (The Global..., 2010).
rural areas; rural tourism in addition to agriculture production, is gaining popularity. (Zobena A. etc., 2005;
besides the analysis of conditions of competitiveness in entrepreneurship, competitive environment in the respective industry should be studied (Kalve I., 2005).
risk situations. Risks are divided into external and risks manufactured by actors themselves (Giddens A., 1999). The risks caused by activities of the actors are closely connected with the choice of variants, but the choice of a variant is in the hands of an individual (Luhmann N., 1993). In addition, the choice of the variant depends not only on the general knowledge of actors, but also on the professional knowledge and the understanding of improvement of knowledge for successful business activities (Risk and ..., 2007).
Economic processes become more and more mutually dependent, social networks (Ferragina E., 2012) and
involved in the business activities. The networks are applied in the design, improvement of the tourism product, and they are used to inform the target audience about the product (Latvijas Turisma..., 2008).
concerned with culture activities and artefacts. However, only a part of culture activities could be referred to as culture heritage. The draft of the Law on
models of behaviour, and practice having been created by an individual, group, community in interaction with environment, history and nature and then inherited from
2011) Rural tourism, especially agro-tourism, is a branch with the help of which it is possible to retain various aspects of ancient legacy, if the new functional meaning is possible to create in the new context
of Rural Tourism held in October 2012, Bulgaria, highlighted the same opinion about tourism as the rural population and cultural heritage preservation mode (Innovative Tourism ..., 2012).
Research results and discussion1. Tourism in rural areas as variant of farming
Tourism in rural areas is a type of tourism the aim of which is to offer tourists an opportunity to relax or to use tourist accommodation in rural areas on the basis of local social, culture, and nature resources. Two different terms are used: rural tourism and farm tourism or agro-tourism. (European Parliament resolution
rural tourism
for the rural population not involved in agriculture sector; but agro-tourism economic activity of farms involved in agriculture production.
In 2010, the survey was carried out among the farm managers of Zemgale Planning Region, and the results showed that 2.5% of the respondents performed tourism activities as a part of their farm’s business activities (Liscova A. etc., 2011; Liscova A., 2011).
opinions all over the country, the survey was carried
by the Ministry of Agriculture in the autumn of 2012 regarding Latvian farmers’ opinion on rural tourism. In addition, the opinions of the representatives from all
Latvia regarding tourism as one of the forms of farming
The results showed that 59.9% of all respondents gave a positive evaluation to the development of tourism. On
not have any opinion at all. The analysis of the opinions concerning the
geographical location led to the following conclusions.
region, who did not have an opinion, accounted only for
As regards general evaluation and willingness to get involved in tourism personally, it is interesting to note
Table 1
Territorial location of the
respondents Positive, I am
ready
Positive, I don’t
want myselfNo opinion No answer
7 – 28.0 12 – 48.0 5 – 20.0 1 – 4.0
12 – 30.0 10 – 25.0 17 – 42.5 1 – 2.5
Farmers from Zemgale 25 – 29.1 22 – 25.6 38 – 44.2 1 – 1.2
Farmers from Latgale 38 – 31.4 37 – 30.6 45 – 37.2 1 – 0.8
Total 82 – 30.1 81 – 29.8 105- 38.6 4 – 1.5
Source: created by the authors based on the survey
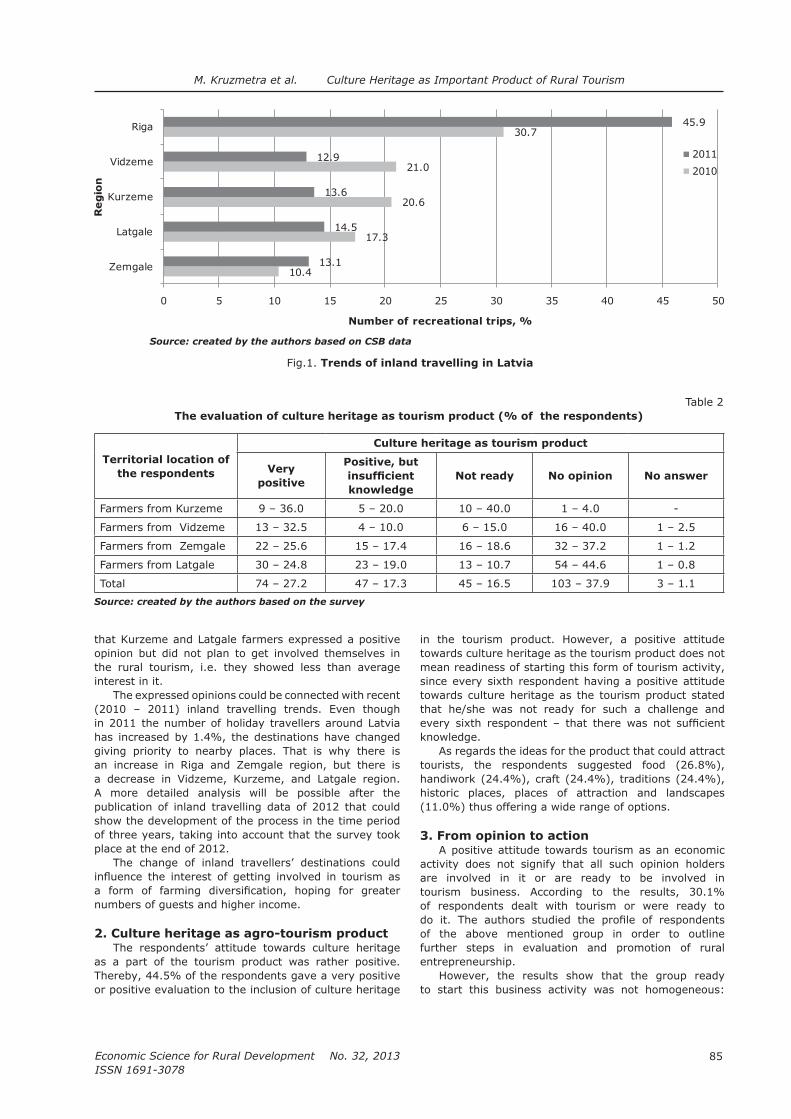
85
Economic Science for Rural Development No. 32, 2013
ISSN 1691-3078
M. Kruzmetra et al. Culture Heritage as Important Product of Rural Tourism
opinion but did not plan to get involved themselves in the rural tourism, i.e. they showed less than average interest in it.
The expressed opinions could be connected with recent (2010 – 2011) inland travelling trends. Even though in 2011 the number of holiday travellers around Latvia has increased by 1.4%, the destinations have changed giving priority to nearby places. That is why there is an increase in Riga and Zemgale region, but there is
A more detailed analysis will be possible after the publication of inland travelling data of 2012 that could show the development of the process in the time period of three years, taking into account that the survey took place at the end of 2012.
The change of inland travellers’ destinations could
numbers of guests and higher income.
2. Culture heritage as agro-tourism product The respondents’ attitude towards culture heritage
as a part of the tourism product was rather positive. Thereby, 44.5% of the respondents gave a very positive or positive evaluation to the inclusion of culture heritage
in the tourism product. However, a positive attitude towards culture heritage as the tourism product does not mean readiness of starting this form of tourism activity, since every sixth respondent having a positive attitude towards culture heritage as the tourism product stated that he/she was not ready for such a challenge and
knowledge.
As regards the ideas for the product that could attract tourists, the respondents suggested food (26.8%), handiwork (24.4%), craft (24.4%), traditions (24.4%), historic places, places of attraction and landscapes (11.0%) thus offering a wide range of options.
3. From opinion to actionA positive attitude towards tourism as an economic
activity does not signify that all such opinion holders are involved in it or are ready to be involved in tourism business. According to the results, 30.1% of respondents dealt with tourism or were ready to
of the above mentioned group in order to outline further steps in evaluation and promotion of rural entrepreneurship.
However, the results show that the group ready to start this business activity was not homogeneous:
10.4
17.3
20.6
21.0
30.7
13.1
14.5
13.6
12.9
45.9
0 5 10 15 20 25 30 35 40 45 50
Zemgale
Latgale
Riga
Number of recreational trips, %
Re
gio
n
2011
2010
Source: created by the authors based on CSB data
Fig.1. Trends of inland travelling in Latvia
Table 2The evaluation of culture heritage as tourism product (% of the respondents)
Territorial location of
the respondents
Culture heritage as tourism product
Very
positive
Positive, but
knowledge
Not ready No opinion No answer
9 – 36.0 5 – 20.0 10 – 40.0 1 – 4.0 -
13 – 32.5 4 – 10.0 6 – 15.0 16 – 40.0 1 – 2.5
Farmers from Zemgale 22 – 25.6 15 – 17.4 16 – 18.6 32 – 37.2 1 – 1.2
Farmers from Latgale 30 – 24.8 23 – 19.0 13 – 10.7 54 – 44.6 1 – 0.8
Total 74 – 27.2 47 – 17.3 45 – 16.5 103 – 37.9 3 – 1.1
Source: created by the authors based on the survey

Economic Science for Rural Development No. 32, 2013
ISSN 1691-3078
86
M. Kruzmetra et al. Culture Heritage as Important Product of Rural Tourism
46.3% of respondents had a positive opinion, 15.9% pointed to the lack of knowledge, but 4.9% were not ready to get involved in this type of business even though they were interested in using culture heritage
the group’s respondents were potentially ready to start
as the tourism product after the improvement of their
competition in this sphere of economic activity.
4. Main directions of actionIn the survey, 14.0% of all respondents, participants
Agriculture expressed the opinion that they were involved or they were ready to get involved in tourism as a form of farming
tourism product. However, the readiness of respondents
respondents.
rate of willingness to start tourism business, but the respondents from Latgale were the most unwilling. The opinion of the respondents from Zemgale supported the results expressed in 2010, however, with a slight increase
that could be explained by gradual involvement of people in the tourism business during two years.
Two restrictions for starting tourism business were mentioned by the respondents with positive evaluation:
readiness to start a new business form. Thereby, 4.8% pointed out the lack of knowledge, and 1.5% expressed the view that they were not ready for such a step. The data in the group selected by the authors were noticeably higher.
The respondents required integrated knowledge
As regards the territorial location, the willingness to improve the knowledge was shown by the respondents
and Latgale (55.2%). The respondents’ awareness
comparison, the results of the survey of 2010 among farm managers from Zemgale Planning Region involved
of respondents noted the lack of knowledge and skills creating obstacles for successful business activities
improve knowledge was enhanced.
Table 3
in the tourism product (% of respondents in the respective group)
TotalIncl. territorial location
Kurzeme Vidzeme Zemgale Latgale
Very positive 38 – 46.3 6 – 85.7 6 – 50.0 13 – 52.0 13 – 34.2
knowledge13 – 15.9 0 – 0.0 1 – 8.3 3 – 12.0 9 – 23.7
Not ready 4 – 4.9 1 – 14.3 1 – 8.3 2 – 8.0 0 – 0.0
No opinion 27 – 32.9 0 – 0.0 4 – 33.3 7 – 28.0 16 – 42.1
Total 82 – 100.0 7 – 100.0 12 – 100.0 25 – 100.0 38 - 100.0
Source: created by the authors on the basis of the survey
15.1
10.7
24.0
15.0
0
5
10
15
20
25
30
Zemgale Latgale
%
Region
Source: created by the authors based on the survey
Fig. 2. The share of respondents with readiness to start business in tourism and to involve culture
heritage in the tourism product

87
Economic Science for Rural Development No. 32, 2013
ISSN 1691-3078
M. Kruzmetra et al. Culture Heritage as Important Product of Rural Tourism
Table 4Restrictions for starting business activities (% of respondents in the respective group)
Respondents I evaluate the use of
culture heritage very
positively
I evaluate positively,
but I do not have
I am not ready
Total number of respondents (N=272)
14.0 4.8 1.5
Selected group of respondents (N=82)
46.3 15.9 4.9
Source: created by the authors based on the survey
It is obvious that the expansion of business
of necessary knowledge, in this case, in tourism business, in which culture heritage is included in the tourism product, therefore the knowledge should include at least three viewpoints: culture heritage as the tourism product, competitive environment as a result of boom of inclusion
business in the sphere of tourism.
Conclusions
Union and a range of European countries suggest two types of tourism in rural areas: farm or agro-tourism that is implemented in addition to agriculture production and rural tourism that is carried out by rural residents
division has not been observed yet in the rural areas of Latvia.
The second part of conclusions refers to the analysis
perception of agro-tourism or farm tourism and inclusion of culture heritage in the tourism product. It would not be correct to consider that the obtained data are true for the whole community of Latvian farmers; however, the obtained insight into the problem permits to make several conclusions.1. The interest about tourism as a form of
regions of Latvia. The survey’s results highlighted the resources (not enough knowledge, I am not ready)
all the Latvian regions. However, from the economic point of view, it is important to be aware of the
type, since the number of tourists is and will be restricted.
2. The interest in the improvement of the tourism
high. However, the lack of knowledge mentioned by respondents, especially by the selected group,
culture
heritage is necessary concerning what tangible and intangible culture values should be included in the tourism product and how it should be offered to users of a product or service.
3. The respondents’ opinions regarding tourism as
territorial differences in the number of interested individuals, the amount of knowledge, and readiness to improve it. Institutions, promoting business
to farmers of Latgale, the region with the lowest number of positive answers in this question of the survey.
4. The analysis of survey’s results of the participants of the conferences of the Ministry of Agriculture
in-depth analysis of culture heritage from the point of view of the content and a territorial place; the innovation of the tourism product with the economic return of culture heritage; the characteristics of farmers and farms involved in this form of
aspects depends on the number of participants in the niche.
Bibliography1.
Second ed. Blackwell Publishing. 594 p.2.
(The Agricultural Census of 2010). Retrieved: http://data.csb.gov.lv/DATABASE/laukskait_10/databasetree.asp?lang=16. Access: 13 December 2012.
3. European Parliament resolution on the role of women in agriculture and rural areas (2010/2054(INI)). Retrieved: http://eurlex.europa.
FULL:LV:PDF. Access: 12 December 2012.4. European Parliament resolution on Europe, the
world’s No 1 tourist destination - a new political framework for tourism in Europe. (2010/2206(INI)) - 27/09/2011. Retrieved: http://www.europarl.europa.eu/oeil/popups/summary.do?id=1166840&t=d&l=en. Access: 3 January 2013.
5.
Edward Elgar, UK. Retrieved: http://books.google.
r&source=gbs_ge_summary_r&cad=0#v=onepage&q&f=false Access: 27 December 2012.

Economic Science for Rural Development No. 32, 2013
ISSN 1691-3078
88
M. Kruzmetra et al. Culture Heritage as Important Product of Rural Tourism
6. Giddens, A. (1999). Risk and Responsibility. Modern Law Review. 62(1); pp.1-10.
7. Gnoth, J. (2004). Strengthening Tourism SME Brands. Proceedings: Rencontres de St Gall,
U. Fueglistaller, T. Volery, W. Weber (eds)
Retrieved:http://www1.kmu.unisg.ch/rencontres/.
Access: 17 December 2012.8. Handbook on Tourism Product Development
9. Tourism. Seventh ed. Pearson Education Ltd. 716 p.
10. Innovative Tourism - New Life for Rural Areas (2012).
6-9 October, Bulgaria. Retrieved: http://www.eurogites.org/new.php?lang=EN&id=9&show=EN Access: 30 December 2012.
11. Kalve, I. (2005). Apseglot parmainu vejus. Strategiska un parmainu vadiba (Saddle the wind
of change. Strategic and change management). Riga, 223 lpp.
12. Knowledge as Social Provision for Successful Entrepreneurship. Proceedings of the International
pp. 139-144.
13. Latvijas lauku attistibas valsts strategijas plans 2007.- 2013. gadam (Latvian Rural Development
National Strategy Plan 2007 -2013). Latvijas Republikas Zemkopibas ministrija. Riga, 2006, 36.-39. lpp.
14. Latvijas Turisma attistibas pamatnostadnu 2009.–2015.gadam projekts (Latvian Tourism
Development Guidelines for 2009 to 2015
project). Retrieved:http://www.mk.gov.lv/lv/mk/tap/?pid=40093845. Access: 20 December 2012.
15. Heritage into a Tourist Destination, Illustrated by the Lofotr Viking Museum in Borg, Norway. Master’s Dissertation. Retrieved: http://www.mt.usi.ch/master-thesis.htm. Access: 30 December 2012.
16. Libermanis, G. (2003). Pelna un konkurence. 132 lpp.
17. iespejas Zemgales planosanas regiona lauku
saimniecibas on the farms of Zemgale Planning Region). Promocijas darba kopsavilkums. LLU, Jelgava.
18.
Klaipeda University.19. Luhmann, N. (1993). Risk: A Sociological Theory.
N-Y, Aldine de Gruyter.20.
and Sustaining Superior Performance. Simon and Schuster. p. 592. Retrieved: http://books.
. Access: 23 December 2012.
21. Risk and decision theory (2007). The Blackwell
Bleckwell Publishing. pp. 3935 – 3936.22. Rural Development policy 2007-2013 Retrieved:
http://ec.europa.eu/agriculture/rurdev/index_en.htm. Access: 10 December 2012.
23. Sustainable Development of Rural Tourism in Latvia (2004). Summary of the Study. Retrieved: www.traveller.lv, www.eco.traveller.lv Access: 22 December 2012.
24.
on Agriculture Working Party on Women and the Family in Rural Development 18th Expert Meeting Summary Report and Draft Policy Notes and Recommendations. 5-9 September 2005, Krakow, Poland
25. (2010). World Economic Forum Retrieved: h t t p : / / w w w 3 . w e f o r u m . o r g / d o c s / W E F _
Access: 22 December 2012.
26. Tradicionalas kulturas mantojuma likums (Traditional
Cultural Heritage Law) (2011). Projekta 32. variants, 2011. gada 9. februaris. (Darba dokuments)
27. Vike – Freiberga, V. (2010). Kultura un latvietiba (Culture and Latvians) Riga, Karogs. 231 lpp.
28. Zobena, A., Sumane, S., Kalnina, A. (2005) Rural Tourism in Latvia: Rauna Tourism Association Department of Sociology University of Latvia. 1.1. Tourism: New Rural Development Perspective. pp.4-7.

89
Economic Science for Rural Development No. 32, 2013
ISSN 1691-3078
J. Dementjeva, Z. Aidas Zilinskas Role of Innovative Processes in Ensuring The Competitiveness of Companies
___________________________1 Tel.: +370 46 398 666, +370 612 58415, e-mail address: [email protected]
ROLE OF INNOVATIVE PROCESSES IN ENSURING THE COMPETITIVENESS OF COMPANIES
Jelena Dementjeva1, lecturer; Zilvinas Aidas Zilinskas2, magist.1 Department of Management, Klaipeda University, Lithuania
2
Abstract. Nowadays, people are having and holding ideas, which become more in demand than working and serving technique (Howkins J., 2007). It can be argued that creativity (as a style of thinking) is more important than hard
tend to move to this stage. The aim of this study is to determine the level of competitiveness of Lithuania on the European Union market in the context of relationship between creativity and innovation. The article emphasises the importance of creative thinking in the management of organisations as a pledge of competitive advantage on the market. It also examines the level of innovative activity of Lithuanian organisations on the background of the European Union.
overall investment is fairly evenly distributed. If one evaluates the cost of R&D by sectors, the research sector is clearly superior to other sectors. Lithuanian organisations seeking to become more creative, as a consequence, need to develop more competitive organisational performances, to reduce operating costs, to eliminate antagonistic contradictions, to bring the coalition aims together, to organise social partnership, and to develop external economic relations.Key words: innovative activity, creative management, creative society.JEL code: O32
IntroductionAt present, enterprises are forced to react
to the processes of globalisation and use their opportunities. Now, intellectual property plays a key role and it is increased by the usage of creative abilities.
Today, creativity, as a style of thinking, has become more topical than hard work. People who have ideas are becoming more popular than the workers
Korea are at the stage of creative development, while
the need for creativity in business and management, scientists have begun to explore new forms of social transformation - creative society and its characteristic creative industries, creative economy, and creative
management.The aim of this study is to determine the level of
competitiveness of Lithuania on the European Union market in the context of relationship between creativity and innovation.
Tasks of the study: to determine the role of creative thinking in the organisation competitiveness
2005; Howkins J., 2007; Gubanova S. J., 2008;
The authors used data from the Lithuanian Statistics for the analysis of the competitiveness level of Lithuanian organisations in the context of relationship between creativity and innovation.
Research results and discussion1. The role of creative thinking in the organisation competitiveness
Issues relating with the competitiveness of a company are the key to its leadership at every stage of business development. Especially these issues are urgent in the times of crisis. Businesses struggling for leadership mostly use the same methods, most of
However, on modern conditions one often needs to use a different approach to change the position of the company on the market based on the use of non-material
company to differ from the competitors. The objective necessity of search for unconventional solutions has one goal – to consolidate its position on the market
clear that creativity, innovation, and unconventional look at familiar things often ensure companies competitive advantages.
embodied in innovation, allows going from one stage of development to another, moving higher and making it a new qualitative state, and, accordingly,
(2010), these creatively minded organisations coming out with new materials, products, services, and technologies as well as their know-how and competent organisation promote their ability to receive exclusive pricing and controlling over the spread and development of innovations. The experience of successful

Economic Science for Rural Development No. 32, 2013
ISSN 1691-3078
90
companies shows that creative solutions and innovations not only provides a powerful competitive advantages
2010).Creative thinking organisation is the ability to
custom-associative perception of the situation on the market based on the system knowledge. As noted by
of creativity are originality, novelty, a high degree of attracting the attention of consumers and recalling the brand, and the content of communication.
It is useful to consider G. Morgan’s concept of organisation for the formation of a creative proposal for the organisation’s image. The organisation as brain and the organisation as culture are two closest images out of eight images (metaphors) of the
2010).
The image of the organisation as brain (as neural network) is related with such features: the organisation is always busy processing information, training (which is close to the idea of P. Senge’s Learning organisation), knowledge management, and self-organisation. A self-organising and constantly evolving system quickly and
J. Dementjeva, Z. Aidas Zilinskas Role of Innovative Processes in Ensuring The Competitiveness of Companies
creatively uses the knowledge and information to develop new ways for gaining success. Managers and other employees are open to changes; they manage knowledge and enhanced potential of creativity, and actively manage the changes.
Organisation as culture deals with the creation of social reality and perceives itself as a cultural phenomenon in which an important role is played by the values, norms of behaviour, expectations, traditions, and customs. In addition to the organisational culture, the object of attention and factor of existence encompass the subculture units, effective communication (formal and informal), availability of information to all members of the organisation, general understanding of the organisation effectiveness, and the need to maintain it.
potential of an individual by creating conditions for developing synergies at the level of teams working in the organisation and the level of interaction between the two groups, i.e. it is based on the integration of human resources of the organisation.
The consistency of staff, team, and organisational design is required to form a creative organisation (Gubanova S. J., 2008). As noted above, only a creative
Table 1R&D costs in Lithuania (by sectors) in 2009
Total Business sector Government sector Research sector
Million LTL 765 181.6 180.6 402.8
Proportion 100 23.7 23.6 52.7
R&D costs in the
share of GDP, %0.84 0.20 0.20 0.24
Source: Lietuvos ..., 2011
Table 2The number of staff involved in the R&D in 2009 compared with the total labour force
EU-27 Proportion EU-27 Proportion
1. Luxembourg 55.3 15. Austria 39.0
2. Denmark 51.8 16. Spain 39.0
3. Netherlands 50.9 17. Latvia 38.9
4. Finland 50.7 37.9
5. Sweden 49.6 19. Poland 34.9
6. Belgium 48.2 20. Italy 34.3
7. Estonia 45.6 21. Hungary 33.2
8. Germany 44.8 22. Malta 32.3
9. Ireland 44.7 23. Bulgaria 32.2
10. United Kingdom 44.4 24. Slovakia 32.0
11. France 43.2 25. Greece 31.8
43.0 26. Romania 24.1
13. Lithuania 41.7 27. Portugal 23.5
14. Slovenia 40.6
Source: Lietuvos ..., 2011
91
Economic Science for Rural Development No. 32, 2013
ISSN 1691-3078
J. Dementjeva, Z. Aidas Zilinskas Role of Innovative Processes in Ensuring The Competitiveness of Companies
approach and the work embodied in innovation provide organisations with new qualitative state and allow becoming them more competitive. Therefore, the level of innovation activity is very important.
2. The competitiveness of Lithuanian organisations in the context of the relationship between creativity and innovations
According to the Lithuanian Department of Statistics (Lietuvos statistikos departamentas, 2011), in 2009 the expenditure on research and technological development (R&D) in Lithuania amounted to 2.01 % of the total GDP of the European Union (EU). In the EU context, the
The costs for R&D in Lithuania suggest that they are most invested in applied research (36.4% of the total expenditure on R&D) and the least – in the development of technology (28.6% of the total expenditure on R&D), while the overall investment is fairly evenly distributed. If one evaluates the costs for R&D by sector, the research sector is clearly superior – 52.7% of the total expenditure on R&D (Table 1).
R. L. Florida (2002) emphasises that a new
the 21st century. Analysing the generation of economic
(2005) proposes the concept of 3Ts: technology, talent, and tolerance. These are the key elements contributing to the formation of a creative society. They emphasise the need to invest in human resources, disclosure and use of staff talents, and open society, where diversity is welcomed and creativity is easily implemented in the cultural sense.
For Lithuania, the number of staff involved in the R&D is 41.7% compared with the total labour force in the country (Lietuvos statistikos departamentas, 2011). According to this indicator, Lithuania takes the 13th place among the EU-27 countries (Table 2). The best index is shown by Luxembourg (55.3%), the worst – by Portugal (23.5%), while the EU-27 produces 40.1%. It can be argued that almost half of the population of Lithuania, if not creative class, then, at least, has the characteristics of this new class of the 21st century.
If one treats innovation as a result of creativity, the need to select an object of management is an innovative
organisation susceptibility to those innovations that are the result of the intellectual capital of the organisation or innovation that exist in the area of innovation. A basic element of the mechanism of innovation susceptibility in organisations shall be certain imperatives of governance.
It makes the following imperatives for the innovation
susceptibility of the development management
(Zhuravljov V.A., 2010): 1) the development of organisational characteristics; 2) the reduction of transaction costs; 3) the elimination of antagonistic contradictions; 4) the approach of coalition goals; 5) the organisation of social partnership; and 6) the development of external economic relations. These imperatives are recommendations for
organisations that want to become more creative, and thus, more competitive.
Conclusions
familiar things often ensure competitive advantages
coming out with new products, services, and
thinking organisation is the ability to custom-associative perception of the situation on the market based on the system knowledge. Two out of eight images of organisation proposed by G. Morgan - the organisation as and the organisation as culture are considered as useful for the formation of an ideal creative organisation. The consistency of staff, team, and organisational design are required to generate creative organisation needs.
2. The costs for R&D in Lithuania suggest that mostly they are invested in applied research; yet, the overall investment is fairly evenly distributed. If one evaluates the costs of R&D by sectors, the research sector is clearly superior to other sectors. Almost half of the population in Lithuania, if not creative class, then, at least, has the characteristics of this new class of the 21st century, since half of the labour force is involved in R&D compared with the total labour force in the country. Organisations seeking to become more creative, as a consequence, need to develop more competitive organisational performances, to reduce operating costs, to eliminate antagonistic contradictions, to bring the coalition aims together, to organise social partnership, and to develop external economic relations.
Bibliography 1. Florida, R. L. (2002). The Rise of Creative Class. 1st
Edition. New York: Basic Books.2. Florida, R. L. (2005). Cities and the Creative Class.
New York: Routledge.3. Gubanova, S.J. (2008). Sushchnostj metodologii
sistemnovo podhoda k formirovaniju kreativnih (The essence
of the methodology of systematic approach
to the development of creative structure of
the organization).. Voljnoje ekonomicheskoje
obshchestvo Rossii, 98 str.4. Howkins, J. (2007). The Creative Economy: How
People Make Money from Ideas. London: Penguin Books.
5. Lietuvos statistikos departamentas. (2011). Lietuva
Europoje 2010 (Lithuania in Europe 2010). Vilnius.6. Znachenije kreativnovo
podhoda v marketinge. Kreativnaja ekonomika (The
value of creative approach to marketing) . Moskva.7. Spivak V.
(The images of innovative organization). Kreativnaja
ekonomika. Moskva.8. Zhuravljov, V.A. (2010). Kreativnoje obshchestvo,
kreativnaja ekonomika i inovacii (Creative society,
creative economy and innovation). Kreativnaja
ekonomika. Moskva.

Economic Science for Rural Development No. 32, 2013
ISSN 1691-3078
92
J. Ramanauskas et al. Coordination of the Objectives and Optimal Selection of
Innovative Biofuel Market Participants
___________________________1 Tel. +370 698 17677, e-mail address: [email protected] Tel. +370 698 17677, e-mail address: [email protected]
COORDINATION OF THE OBJECTIVES AND OPTIMAL SELECTION OF INNOVATIVE BIOFUEL MARKET PARTICIPANTS
Julius Ramanauskas1, Dr.hab., prof.; Rimantas Stasys2, Dr., prof.; Vytautas Jonas Zilinskas3, Dr., prof.
Department of Management, Klaipeda University, Lithuania
Abstract. The main fuel in Lithuania is natural gas, and biofuels account for only 16%, while the EU Directive on the Promotion of Renewable Energy in Lithuania requires that Lithuania should increase this indicator to 23% by the year 2020. The aim of the research is to develop a model of compatibility of biofuel market after having analysed the trends of biofuel development and low usage of raw materials (timber harvesting and municipal waste, straw, green energy etc.) for energy production. The compatibility model of innovative biofuel market participants (raw material suppliers, manufacturers, and users) presented in this article will allow to coordinate their interests and to implement the best practices and business structures initiative.Key words: biofuel, processing, compatibility, material.JEL codes: Q160, Q230, L730.
IntroductionRenewable energy is already the third source of
energy generation in the world (after coal and gas), and there are many possibilities to expand its production
and the economy.
more expensive. The usage of natural gas could be reduced by half – about 40% through using only local renewable energy resources of Lithuania. Burning of forest harvesting, municipal waste, willow and straw, grown in special energy plantations, one could get an additional 5.1 million MWh of eneregy, and the total consumption of the country’s cities is 10 million MWh
about 17% of heat is generated by using biofuels in Lithuania. There are plans to produce 20% in 2010, 30% in 2015, and 50% in 2030 of district heat by using biomass in Lithuania. This means that it is planned to cover half of the heat demand for local fuels in Lithuania
It is necessary to install alternative heating production technologies in order to modernise the usage of domestic renewable energy resources and domestic waste.
best practices, and business structures initiative.However, the competitiveness and development of
market participants; thus, it is necessary to look for closer and deeper cooperation between science and business, increasing the availability of local resource - biomass and all types of biofuel production and usage. Successful cooperation between the participants and installation of alternative energy (e.g. heat) production system is one of the most important prerequisites to guarantee the success of biofuels usage (Lietuvos energetikoje vietos ..., 2008).
The aim of the research is to develop the models of objectives coordination for innovative biofuel market participants (raw material suppliers, manufacturers, and users) and to present optimal selection models after having analysed the trends of biofuel development and low usage of raw materials (timber harvesting and municipal waste, straw, green energy etc.) for energy production.
Research methodology – a systematic analysis
documents (AVEI naudojimo didinimas ..., 2003; Baltic Biomass Network, 2006; GreenFuel Technologies
Kugelevicius J. A., Kuprys A., 2006; Kuro ir energijos ..., 2008, Saladis J., 2007; United States Department..., 2007; Vrubliauskas S., Pedisius N., 2005), and formalised expert method of priorities allocation and selection (Zilinskas J. V., 2010). The questionnaire survey was carried, using telephone conversations and direct meetings with the respondents. They were divided into three groups: representatives of raw materials suppliers (12 respondents), biofuel producing companies (8 respondents), and biofuel using boiler companies (9 respondents). Totally, questionnaires were sent to 29 recipients. The list of biofuel market players was made and the members for experts’ commission were chosen during this research. The most important task for experts’ commission members
using non-transitive paired comparison system. The methods used in the research include the analysis
analysis and synthesis, comparative analysis, structural and relational analysis, statistical data
allocation of priorities and selection (MPAS), and graphical visualisation methods.

93
Economic Science for Rural Development No. 32, 2013
ISSN 1691-3078
J. Ramanauskas et al. Coordination of the Objectives and Optimal Selection of Innovative Biofuel Market Participants
Research results and discussionThe production and usage of alternative renewable
3.3% of the electricity (small hydro) is received from renewable sources of energy. First steps are taken for teh use of solar energy, photo electricity, biofuels, biogas, heat pumps (geothermal heating) and wind energy. The
is possible to alter substantially the situation (Table 1).As can be seen from the data of Table 1, the main
type of fuel in Lithuania (in contrast to Sweden) is natural gas, and biofuel accounts for only 16%. However, the EU Directive on the Promotion of Renewable Energy requires Lithuania to increase this parameter to 23% by the year 2020.
According to the survey results (Inovaciju pletra ..., 2007), it can be said that the
majority of economic subjects in projects pay little or no attention to the production of alternative renewable energy sources or to their usage for the projects. Modern facilities require huge investment, so, in Lithuania, the priority is given to civilisation investments checked by time. It is believed that one of the most important prerequisites to guarantee the success of biofuels usage is a successful collaboration between the participants
installing alternative energy (such as heat) production system. Heat generation model is analysed from three aspects: 1) biofuel raw material suppliers; 2) biofuel producers; and 3) biofuel users.
Raw materials suppliers, having sold their products, hope to get as much income as possible, biofuel producers hope to buy these raw materials cheaply and to sell produced biofuel for high price, and the goal of biofuel
users is to pay as little as possible for the fuel and sell it more expensively to heat consumers. The performed research allowed making exact objectives coordination model of biofuel market participants (Figure 1).
Biofuel raw material suppliers. A large part of the district heat in Lithuania could be produced using local biomass fuel, as it is 25% cheaper than natural gas. There are six main types of biofuels.
Wood fuel - one of the most important biofuels, whose main resources include timber cutting waste and coppice; minor stands (primarily alder), and shrubs. Statistical data show that the Lithuanian forests annually produce more than 2 million m3 of timber cutting waste, approximately 0.8 million m3 of it could be used for biofuel production. So far, only one-tenth of this waste volume is being used. Specialists recognise that private forest owners in Lithuania (there are about
Table 1Fuel expenses for heat production
Heat sourcesStructure, %
Lithuania Sweden
Natural gas 77.7 3.0
Biofuel 16.2 63.0
Another fuel 1.5 2.0
Oil 4.6 5.0
0 4.0
Heat pumps 0 11.0
Municipal waste energy 0 12.0
Total 100 100
Source: authors’ construction
Fig. 1. Objectives coordination model of biofuel market participants
Economic Science for Rural Development No. 32, 2013
ISSN 1691-3078
94
J. Ramanauskas et al. Coordination of the Objectives and Optimal Selection of
Innovative Biofuel Market Participants
232 thousand of them) rarely use of the option to sell the logging waste and generate additional revenue.
established, the establishment of which is supported from the EU funds. The development objective of these companies is to organise wood chips production, using shrubs and low value trees, growing at roadsides of the forests and villages as raw material. The production is organised at temporary sites near the cleaned roads and block lines, removing the produced wood chips to the base warehouse and from the warehouse to the customer warehouses (sites). These companies are operating
(3–4 employees at each such company).Such solution of this problem is chosen, because
during the past 4–6 years the number of boilers, using wood waste, is constantly increasing in the world and in Lithuania. The heat produced in these boilers helps
popular in thermal energy, which is foreseen in “National
Renewable Energy Resource Development Programme”. It is also important that a company’s activity has a full cycle: starting from preparation of low value wood as a
to the users.It is important that the raw material resources for the
production are practically unlimited: shrubs growing at the roadsides are not cut; the roads are rather long and over 5–6 years shrubs grow back again. Logging waste is also used as raw material.
Energy crops. It is expected that the cultivation and usage of herbaceous plants and short rotation forestry for energy production will expand, as there is a lot of unused, abandoned land, which could be planted with energy crops plantations. The estimated preliminary herb-energy potential is about 722 GWh (2.6 PJ).
Agricultural residues. Straw can also be used for energy purposes. Its amount is determined by the area used for cereal crops, their yields, and applied technology. Straw in agriculture is used for animal bedding, feed, and
straw is not collected due to weather conditions or other circumstances. Having eliminated these potential losses, straw energy potential could reach 500 thousand t/year (1.5 TWh).
Turf. Lithuania has 22 industrial (operated) and 45 derelict turf clusters with about 105 million tonnes of turf suitable for the production of fuel. This amounts to about 250 million MWh of useful thermal energy. It is possible to reach 500 thousand tonnes of turf fuel production potential using new turf fuel production technologies (Nacionalines biomases ir ..., 2006).
Municipal waste. Lithuania has more than 300 active
the extractable quantity of biogas could be 990 m3/h, which is equivalent to 45 MW capacity.
Biofuel producers. Wood briquettes and pellets started to be produced in Lithuania from 1994 and 1999, respectively. There are 16 organisations working in this area at present. Briquette production capacity is about 30,000 tonnes/year and pellet production capacity is about 46000 tonnes/year. Unfortunately, about 85% of wood briquettes and almost 100% of wood pellets
are exported abroad due to the high price, mainly to the Scandinavian countries, Germany, and the United Kingdom. Steadily rising energy prices and emerging local producers of the boilers for wood pellet fuel, allow expecting that these convenient for use types of fuels
..., 2008).Recently, there are four companies producing
sawdust pellets, and more than 10 companies producing briquettes. The part of local fuel resources in the general balance of the fuel is growing every year, yet, the input of the same types of fuel in energy system is different, and the development opportunities of its usage are also different. Recently, the consumption of peat and peat briquettes is reduced and the share of wood fuel on local fuel market has increased up to 85%. So extensive prospects of wood fuel production and usage development are determined by substantial material resources, low cost, simple and relatively inexpensive combustion technology, and low emissions of combustion products. This accelerates rapid growth of the consumption of wood in energy production system.
Biofuel users. Already few years ago, Lithuanian district heating manufacturers evaluated the advantages of renewable energy sources usage for heat production: about 200 boilers have been producing heat-using biofuel. However, in order to expand the use of biofuels
the coordination of biofuel market participants’ actions becomes one of the main challenges.
Today, about 15% of the district heating is produced from biofuel; wood fuel is used for heating 12 regional centres, 60 MW capacity biofuel boiler has started its operation in Vilnius and it is considered to be the largest
boilers use sawmill waste and wood chips, which make up almost 90% of the total amount of wood used, and only about 8% of the boilers use cutting waste as fuel (Janulis P. P., 2007).
Until this year, the overall capacity of boilers using wood fuel in Lithuania was about 300 MW (calculating only those boilers, which power is more than 0.5 MW). These boilers annually operate 5000 hours on average and in one year period they produce about 1,500 thousand MWh of energy. Taking into consideration that one m3 of wood chips is necessary to produce 1.8 MWh of energy; the boilers should consume 833 thousand m3 of wood chips. Based on the Swedish experience, they need about 714 thousand m3 of wood (Medienos pramones jmoniu ..., 2004).
Lately, Lithuania faces a number of non-traditional challenges associated with the innovation process. Implementation and development of innovations enable the modernisation of production and service delivery structures, the development of products and technologies, enhancement of their quality and international competitiveness. The assessment of innovative alternatives, selection and implementation management is an important way to guarantee
of alternative projects selection allows determining the effectiveness of innovative investment options according to certain indicators (criteria) that shall be based on both the investment project implementing entity and

95
Economic Science for Rural Development No. 32, 2013
ISSN 1691-3078
J. Ramanauskas et al. Coordination of the Objectives and Optimal Selection of Innovative Biofuel Market Participants
state interests. On the conditions of market economy, innovation investment activity is closely related with the design and implementation of innovative projects in order to achieve the set objectives. This is how companies can successfully develop their investment activities in modern competition.
assessment of state and biofuel market participants’ goals, is necessary for rational coordination of innovative biofuel market participants’ goals and for setting optimal expedience of the selection. One of the most important assumptions of company’s activity development warranties is the coordination of its objectives and optimal evaluation as an integral part of the management function, as one can only manage what one can evaluate. The results do not indicate the true position of a future project only
goals coordination of innovative biofuel participants and for optimal selection and management, it is necessary to evaluate other factors – long-term success, risks, and competitiveness – as well.
Innovative alternatives evaluation and selection methods are summarised in various methodologies, the analysis of which shows that they have several drawbacks: lack of consistent evaluation of the effectiveness according to different indicators (criteria) blocks and hierarchy levels, in other words, there is no alternative project evaluation algorithm, which could be used for a systematical and consistent evaluation and selection of the best option, since it is practically impossible without complex (total, integral) evaluation of indicator. It is necessary not only to select the best option (alternative) but also to place all the other options in ascending or descending order according to the priority
evaluation is that the individual indicators (criteria) are of different origin, qualitatively different, and in many cases,
combine them into a single integral (total). The method of allocating and selecting the priorities (ASP) method (Bljumberg V.A., Gluschenko K.F., 1982) helps solve similar multi-criteria decision management tasks with the
management decisions.It would be appropriate to use formalised expert
method of priorities allocation and selection (MPAS)
V. J., 2010) for the analysis, coordination, evaluation and
objectives. This method permits evaluation of innovative alternatives according to individual partial indicators (criteria) and the meaning of their importance, and to receive a complex evaluation of selected alternatives, which enables to rank and to select the most optimal innovation (innovative solution) and to ensure its successful, long-term implementation, seeking for effective usage of tangible and intangible resources in different types of biofuel market companies. This MPAS method is appropriate to use when one needs to
qualitative indicators (criteria). Integrated evaluation methodology and expert assessment procedure
(see Zilinskas V. J., 2010; 2012). This MPAS method unlike the ASP method is based on more reasonable logical procedure for converting qualitative characteristics used for making pair alignment into quantitative estimations received in relative scale. Since the rational management decision making (in this case – the cooperation of foals of an innovative biofuel market participants and selection of optimal alternatives) is associated with one of the many variants of solution selection, the necessary complex evaluation condition in evaluation and selection
determinants (indicators), shall be the conversion of
prerequisite is the evaluation of each partial indicator of
sub-indicators (criteria) in a scale of one measurement
complex evaluation formation and to record a complex (total, integral) ratio as total evaluated amount of these indicators, showing that this indicator is the function of partial indicators.
,
where
iP - i alternative complex indicator (total priority);
s
jiP )(- i alternative according to j partial indicator relative evaluation (priority);
Yj - j partial indicator (criteria) meaning of importance.
The calculation of cross ratio (total priority) iPand selection of priority having alternative (innovative variant) is performed according to each individual indicator,
every evaluation indicator. Each alternative is evaluated separately, indicating the rating, and the assessment of a complex indicator (overall priority) is calculated for each
is made and priority innovative alternative is selected, showing that it is superior to the other, measured by selected indicators (criteria). The institution, evaluating innovative project or experts commission, chooses the one that has the highest cumulative assessment and presents the conclusion, stating the choice of methodology and evaluation. The method of network planning and management PERT (Programme Evaluation and Review Technique) (Griskevicius A., Silickas J., 1998), created in the USA, is suitable
innovative alternatives.
Conclusions1. In Lithuania, biofuel constitutes only about 16% of
all fuels used for heat production. it is expected to double energy production, using local renewable

Economic Science for Rural Development No. 32, 2013
ISSN 1691-3078
96
J. Ramanauskas et al. Coordination of the Objectives and Optimal Selection of
Innovative Biofuel Market Participants
energy resources in the next decade through combining science and business opportunities. District heat production using biofuels and waste should make 20% by 2015, 50% - by 2030, while biofuel should make 20% of energy consumption and fuel amount.
2. Biofuel use development opportunities are associated with the possibilities of biofuels raw materials suppliers, producers, and potential users;
of this market on biofuel usage has not been established yet.
3. The proposed coordination model of innovative biofuel market participants (raw material suppliers, manufacturers, and consumers) will align their interests and implement best practices and initiative of business structures.
4. The rating of innovative alternative selection
is not examined enough currently. Financial analysis is not enough evaluating and selecting optimal alternatives, it is necessary to coordinate and evaluate these alternatives and their consequences for the development of national, regional, or enterprise economy.
5. Formalised expert method of priorities allocation
of this article, is proposed for coordination of the objectives and optimal selection of innovative biofuel market participants. It is possible to carry out objectively and justify the effectiveness of innovative bio-fuels using complex (total, integral) evaluation under different partial quantitative and qualitative indicators (criteria) and the meaning
pplying this method. The coordination and optimal selection complex evaluation methodology of participants objectives of this innovative biofuel market is proposed because of its versatility, accuracy and
making rational management decisions. This can be a strong basis for granting the EU Structural Funds or the selection and ranking of innovative projects that contribute to better implementation of the state investment programme.
Bibliography1. AVEI naudojimo didinimas Lietuvoje 2003.
(Increasing the usage of renewable energy in
Lithuania 2003) (2003). Vilnius: Danish Energy Management A/S.
2. biokuro gamybos ir naudojimo technologiju platformos galimybiu studija (Tehcnologies platform
feasibility study of national biomass and biofuels
production). Retrieved: www.biokuras.lt. Access: December 2008.
3. Baltic Biomass Network. Kas yra energetine biomase
(What is energetic biomass?) (2006). Energy Prices & Taxes. Quarterly Statistics. International Energy Agency, 1996–2007.
4. Bljumberg, V.A., Gluschenko, K.F. (1982). Kakoje
reshenije luchshe? Metod rasstanovki prioritetov
(Which solution is better? The method of choosing
priorities)
5. milijardus (Paying billions for negligence).
articleview/1124/1/207/. Access: December 2009.6.
http://www.greenfuelonline.com. Access: November 2007.
7. Griskevicius, A., Silickas, J. (1998). Investiciju
projektu valdymas (Investment projects
management). Vilnius: LII.8.
dalyvaujancius BPD priemonese (Innovation
development in modernizing farming enterprises,
involved in SPD media)
Kaunas-Akademija.9. International Energy Outlook (2006). Energy
Information Administration.10. Janulis, P. P. (2007). Bioenergetikos pletros
perspektyvu analize ir butinosios priemones, siekiant
uztikrinti moksliniu tyrimu ir technologines pletros
bioenergetikoje koordinavima (Prospective analysis
of bioenergy development and the necessary
reseach and technological development in
bioenergetics). LZUU mokslo darbai. Kaunas-Akademija.
11. Kugelevicius, J. A., Kuprys, A. (2006). Organinio (Fossil fuel price projections).
Energetika. Nr. 2. Kaunas.12. Kuro ir energijos balanso sudarymo metodika (The
methodology of fuel and energy balance formation) (2008). Vilnius: Statistikos departamentas.
13. Lietuvos energetikoje vietos yra ir biokurui (There is
a place for biofuel in Lithuanian energetics) (2008). Retrieved: http://www.manoukis.lt/index.php?s =2430&m=2&t=25. Access: 08.04.2008.
14. Medienos pramones jmoniu konkurencingumo
didinimo, pletojant klasterizacija, studija (The
study of increasing timber industry enterprises’
competitiveness developing clusterization) (2004).
15. (Wood waste
fuel market in Lithuania) (2008). Retrieved: h t t p : / / w w w. e ko s t r a t e g i j a . l t / i n d e x . p h p ? content=pages&lng=lt&page_id=31&news_id=88. Access: 11.12.2008.
16. Nacionalines biomases ir biokuro gamybos ir naudojimo technologiju platformos galimybiu studija (Tehcnologies platform feasibility study
of national biomass and biofuels production and
usage) (2006). Retrieved: http://www.biokuras.lt/
08.04.2008.17. Ramanauskas, J., Gargasas, A. (2009). Upravljenije
inovacionnovo biotopliva. Teoreticheskije i
prakticheskije problem formirovanija inovacionnoj
ekonomiki. Sbornik nauchnih trudov (Theoretical and
practical problems formatting innovative economy.
18. biomases deginimui (Technical and non-technical

97
Economic Science for Rural Development No. 32, 2013
ISSN 1691-3078
J. Ramanauskas et al. Coordination of the Objectives and Optimal Selection of Innovative Biofuel Market Participants
obsticles for biomass burning). Retrieved: www.mi.lt/Netbiocof/8_Saladis.pdf. Access: 01.11.2007.
19. Tyla, J., Ramanauskas, J. (2008). The Theoretical
Management Theory and Studies for Rural Business
and Infrastructure Development. Nr. 13 (2).20. United States Department of Agriculture
Ethanol: An Update, AER-813. Retrieved: http://www.transportation.anl.gov/pdfs/AF/265.pdf. Access: 15.09.2007.
21. Vrubliauskas, S., Pedisius, N. (2005). Kietojo
kuro standartizavimas ES ir Lietuvoje (Solid
fuel standardization in the EU and Lithuania) Kaunas: LEI.
22. Zilinskas, V. J. (2010). Investiciniu projektu optimalios atrankos metodas (Optimal selection
method of investment projects. Business,
. Verslas, vadyba ir studijos 2009: mokslo darbai. Vilnius: Technika.
23. Zhilinskas, V.J et al. (2012). Modelj vibora aljternativi inovacionnovo reshenija (Selection
of an alternative model of innovative solution). Management Theory and Studies for Rural Business
and Infrastructure Development. Nr. 2(31).

Economic Science for Rural Development No. 32, 2013
ISSN 1691-3078
98
V. Atkociuniene et al. Strategic Orientations for Rural Employment Development:
the Case of Telsiai District Labour Market
___________________________1 E-mail address: [email protected] E-mail address: [email protected] E-mail address: [email protected]
STRATEGIC ORIENTATIONS FOR RURAL EMPLOYMENT DEVELOPMENT: THE CASE OF TELSIAI DISTRICT LABOUR MARKET
Vilma Atkociuniene1, Dr., prof., Aleksandras Stulginskis UniversityAsta Raupeliene2, Dr., assoc. prof., Aleksandras Stulginskis University
Alvydas Aleksandravicius3, lecturer, Aleksandras Stulginskis University
Abstract.
and rural employment in Telsiai district municipality (LAU1) in Telsiai county (NUTS3), which were chosen as pilot areas
structured interviews. Vision of rural employment development and factors effecting changes in rural labour market
The SWOT and SOR analysis were provided based on the collected data and opinions of local labour market actors. Strategic orientations and recommendations for the solution of problems by saving the existing and creating new
Key words: rural development, labour market, rural employment, strategic orientation.JEL code:
Introduction The aim of the research is to identify the strategic
orientations for the development of rural employment. The research tasks are as follows: to analyse the pilot area on the labour market; to conclude whether any
through the interview of local actors; and to identify the current employment patterns and opportunities for rural
This research is based on two ideas: there are unused local resources, which can be used to ensure better and
constraints can be used to identify the employment growth potentials and to draw the recommendations for better targeting of future rural development measures.
The empirical research was carried out to identify employment needs and new sources of employment as well as constraints affecting the labour market; to evaluate the past and current employment development policies; and to make recommendations targeting on the new rural development measures for the pilot area.
The synthesis of bibliography and an overview of the employment situation in rural areas have provided a basis
Janusauskaite, 2007). A typology of rural areas was subsequently drawn up based on the analysis of existing typologies and in particular the one put forward by the
This research object focuses on the Telsiai district labour market areas. The territory has been chosen because of the following reasons:1) the boundaries of Telsiai labour market areas are
coincident with the administrative territories of Telsiai municipality;
2) Telsiai district Local Action Group (LAG) has been implementing the Strategy for Improvement Quality of Life in Rural Areas;
3) demographic and socio-economic decline in Telsiai district municipality.
An analysis of the area was carried out based on a thorough, joint diagnosis of the situation, mainly from an economic and social point of view and using the
the trend analysis, the stakeholders of Telsiai labour market were enabled to identify the issues at stake and give thought to the strategic orientations. The subject of the SWOT analysis was the rural labour market in the pilot area. The provisional SOR matrix results and the draft wording of the operational objectives were validated during the focus group meetings, attended by interviewees and other key local stakeholders.
Research results and discussion1. Analysis of the labour market at Telsiai
district municipality Telsiai municipality is one of four LAU1 level areas in
Telsiai county (NUTS3), where 40.9% of the population of Telsiai county lives in rural areas. Under the typology, the
According to the 2011 Lithuanian census, the Telsiai county (NUTS3) had a total population of 151 352 (i.e. 5.1% of the total national population) and it covers an area of 4350 km2 (12% of the total
population live in rural communities (i.e. in LAU2 areas
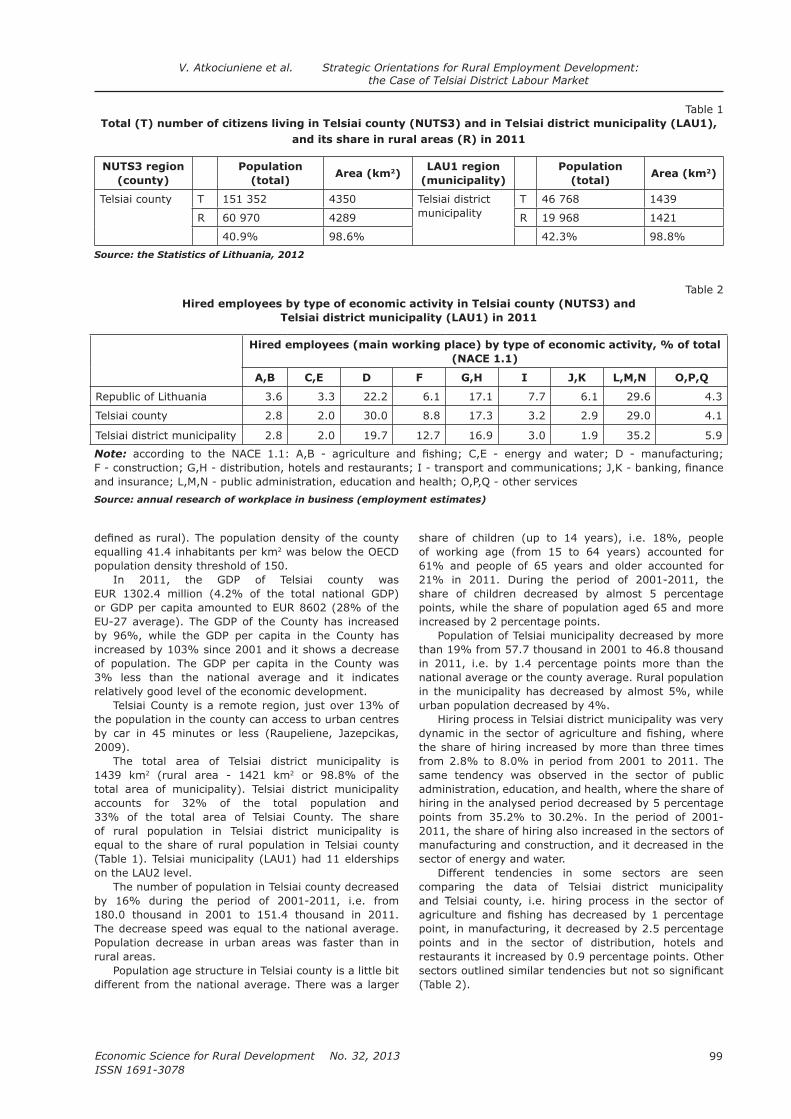
99
Economic Science for Rural Development No. 32, 2013
ISSN 1691-3078
equalling 41.4 inhabitants per km2
population density threshold of 150.In 2011, the GDP of Telsiai county was
EUR 1302.4 million (4.2% of the total national GDP) or GDP per capita amounted to EUR 8602 (28% of the
increased by 103% since 2001 and it shows a decrease
3% less than the national average and it indicates relatively good level of the economic development.
the population in the county can access to urban centres
2009).The total area of Telsiai district municipality is
1439 km2 (rural area - 1421 km2 or 98.8% of the total area of municipality). Telsiai district municipality accounts for 32% of the total population and
of rural population in Telsiai district municipality is equal to the share of rural population in Telsiai county (Table 1). Telsiai municipality (LAU1) had 11 elderships on the LAU2 level.
The number of population in Telsiai county decreased by 16% during the period of 2001-2011, i.e. from 180.0 thousand in 2001 to 151.4 thousand in 2011. The decrease speed was equal to the national average. Population decrease in urban areas was faster than in rural areas.
Population age structure in Telsiai county is a little bit different from the national average. There was a larger
share of children (up to 14 years), i.e. 18%, people of working age (from 15 to 64 years) accounted for 61% and people of 65 years and older accounted for 21% in 2011. During the period of 2001-2011, the share of children decreased by almost 5 percentage points, while the share of population aged 65 and more increased by 2 percentage points.
Population of Telsiai municipality decreased by more than 19% from 57.7 thousand in 2001 to 46.8 thousand in 2011, i.e. by 1.4 percentage points more than the national average or the county average. Rural population in the municipality has decreased by almost 5%, while urban population decreased by 4%.
Hiring process in Telsiai district municipality was very
the share of hiring increased by more than three times from 2.8% to 8.0% in period from 2001 to 2011. The same tendency was observed in the sector of public administration, education, and health, where the share of hiring in the analysed period decreased by 5 percentage points from 35.2% to 30.2%. In the period of 2001-2011, the share of hiring also increased in the sectors of manufacturing and construction, and it decreased in the sector of energy and water.
Different tendencies in some sectors are seen comparing the data of Telsiai district municipality and Telsiai county, i.e. hiring process in the sector of
point, in manufacturing, it decreased by 2.5 percentage points and in the sector of distribution, hotels and restaurants it increased by 0.9 percentage points. Other
(Table 2).
V. Atkociuniene et al. Strategic Orientations for Rural Employment Development: the Case of Telsiai District Labour Market
Table 1Total (T) number of citizens living in Telsiai county (NUTS3) and in Telsiai district municipality (LAU1),
and its share in rural areas (R) in 2011
NUTS3 region
(county)
Population
(total)Area (km2)
LAU1 region
(municipality)
Population
(total)Area (km2)
Telsiai county T 151 352 4350 Telsiai district municipality
T 46 768 1439
R 60 970 4289 R 19 968 1421
40.9% 98.6% 42.3% 98.8%
Source: the Statistics of Lithuania, 2012
Table 2Hired employees by type of economic activity in Telsiai county (NUTS3) and
Telsiai district municipality (LAU1) in 2011
Hired employees (main working place) by type of economic activity, % of total
(NACE 1.1)
A,B C,E D F G,H I J,K L,M,N O,P,Q
Republic of Lithuania 3.6 3.3 22.2 6.1 17.1 7.7 6.1 29.6 4.3
Telsiai county 2.8 2.0 30.0 8.8 17.3 3.2 2.9 29.0 4.1
Telsiai district municipality 2.8 2.0 19.7 12.7 16.9 3.0 1.9 35.2 5.9
Note:
and insurance; L,M,N - public administration, education and health; O,P,Q - other services

Economic Science for Rural Development No. 32, 2013
ISSN 1691-3078
100
Urban population is much more economic active than rural population in Telsiai county. Rural economic activity is lower and urban economic activity is higher comparing with the national average. Males in rural areas of Telsiai municipality are much more active than females. Male activity was higher than female activity by 9.4 percentage points (in rural areas by 17.4 percentage points). There was a larger share of self-employed in Telsiai municipality than the county average. Especially it was true for rural area of Telsiai municipality, where the share of self employed was 21.2% of the total working age population in 2011 (Table 3).
The unemployment rate in Telsiai municipality was in line with the national average. The unemployment rate in rural areas of Telsiai municipality was 12.1% in 2011 and it was by 1.7 percentage points lower than the average of the county.
A high unemployment rate among young people is a big problem of the local administration of Telsiai district municipality. It is estimated that there were 22% of young people unemployed at the beginning of 2011. These young people are usually uneducated and without any work experience. They do not have
physical work. Sometimes these young people even do
their illiteracy. These marginal young employees are at the risk of economic and social exclusion.
2. Potentials and constraints on rural
of Telsiai district Labour market dynamism has increased due to the
increase of travel to work area in Telsiai district. Local population began to travel longer distances to the cities in order to get a job. The travel costs were cut by cooperation among them to travel with one car or
to the city in the morning and taking them back home in the evening evolved later.
Rural entrepreneurs in Telsiai municipality still see agriculture as the main source of business activity and employment in rural areas. Production of agricultural goods is the main occupation for local population. Despite that agricultural land is relatively good for cultivation in
agricultural sector there. The conditions of international (global and regional) markets of milk products are strongly affecting incomes of local producers in Telsiai.
products from Lithuania.Telsiai district municipality is not fully dependent on
agriculture of crafts. It has an alcohol manufacturing line there. Production of spirit and alcoholic drinks support local farmers in terms of consuming agricultural products the farmers deliver to the market. It could be an example of small cluster of agriculture and food products in the local economy.
The great unused potential of Telsiai district municipality is hiding in data industry development. Data collection, analysis, and sharing among rural population would reveal additional incentives to take economic activities in rural areas. In that way more knowledge-based jobs would be created in local economy which would create higher value added. The municipality of Telsiai together with farm and agricultural associations and with local communities should develop a mechanism of transferring good practice across the district municipality population.
Local policy is encouraging employment in Telsiai district municipality. There were some public programmes for stopping the increase of unemployment in the district municipality. Local municipality set priorities for helping
activities, increasing
usage) on the local market, and improving environment for the development of a family business. In addition, the municipality was actively working on the indirect support mechanism for local labour market, e.g. tax discounts, social initiatives, and easing the requirements
V. Atkociuniene et al. Strategic Orientations for Rural Employment Development: the Case of Telsiai District Labour Market
Table 3Aggregate employment-related data in Telsiai county (NUTS3) and in Telsiai district municipality (LAU1)
totally (T) and split for rural (R) and urban (U) areas in 2001, disaggregated by sex and age
Activity rate,
%
Males activity rate, %
Females activity rate, %
In employment,
%
Employees, %
Self-employed,
%
Unemployed, %
Republic of T 57.4 63.1 52.7 48.7 42.7 11.7 11.0
Lithuania R 52.0 59.6 45.0 41.0 29.7 15.6 15.6
U 60.1 65.5 56.2 52.0 45.6 9.4 10.7
Telsiai county T 65.5 71.8 59.9 52.7 39.0 13.5 13.4
R 58.6 67.2 49.8 44.9 25.9 19.0 13.8
U 72.3 75.1 69.9 57.2 47.2 10.0 15.1
Telsiai district municipality
T 64.0 69.5 58.8 50.2 35.1 15.1 11.7
R 57.2 67.1 47.0 45.1 23.9 21.2 12.1
U 68.8 71.3 66.6 53.7 42.9 10.8 11.1
Note: data are taken from the 2011 census and include people aged 15-64
Source: the Statistics of Lithuania

101
Economic Science for Rural Development No. 32, 2013
ISSN 1691-3078
for manufacturing process or delivering products to the market.
One of the major effects of the economic crisis for Telsiai district municipality was that many of local population who had left their living places and travelled
without any job. Therefore, the number of unemployment in Telsiai district municipality has grown substantially. According to the opinion of some interviewees, about 60% of those who emigrated from Telsiai district municipality came back in time of the economic crisis.
Interviewees emphasise that making progress in
Starting a new business or investing in new training
However, low savings and relatively small amount of wealth that is at disposal of common rural habitant stand as a major hardship for the progress.
Negative externality of the Rural Development programme is that the ongoing funding is concentrated into large farms or agricultural companies. Large farms and agricultural enterprises have competitive advantage
agricultural enterprises have better human resources
some local people think that the EU funding should be distributed more equally across the economic actors in rural areas.
municipality is crafting. According to the interviewees, craft centres are risky due to the underdeveloped supply to the market chain of craft products. Thereby, investing own money is too risky due to the uncertainty of the product sales. Hence, marketing of craft products is the main problem of the development of crafts activities in the local area.
Human capital constraints play a fundamental role in low labour market dynamism. Business management
of business planning, organising and analysing market data, preparing an application for support or managing business risks cut the incentives to develop economic activities by rural population. Rural entrepreneurs feel incompetent to develop a relevant business plan by themselves. The future is very uncertain, thus, there is too much risk for taking action. Lack of managerial skills of rural labour force could be solved by developed business services in the local area, initiating better-targeted vocational trainings and developing an institution of local community (or local action groups - LAGs).
The EU policy is targeted at smart (i.e. knowledge-based) economy. Knowledge-based economy is better suited for urban development. Rural development is under the threat due to the low concentration of population, low purchasing power, and lagging behind the technological, social, and cultural development of the cities. However, the most important issue one needs to pay attention to is the fact that data are becoming a major production factor (i.e. ahead the land, labour,
play a crucial role in the development of a local area. Businessmen in Telsiai district municipality say that there is lack of market and technology data available for local
entrepreneurs in Telsiai. Business services are poor and slowly developing. The process of data (or information) transfer or good practice transfers is long in rural areas.
From institutional analysis point of view, the organisation of economic activities is chaotic, i.e. they have been evolved under the forces of stochastic business cycles and the short-term economic policy measures adopted by local or national government bodies. There is no strategic evolvement of economic relations in Telsiai. Interviewees see that there is a lack of links between the elements of economic system in the rural areas for faster growth. The interaction among economic activities, types and forms of business actors, and ongoing economic processes is weak.
Interviewees emphasise that it is very important to have a community leader who could initiate various processes in order to increase economic activity of local population.
The travelling longer distance to the work could increase employment in Telsiai district municipality but local people are attached to their living place. Most of them are living in a particular rural area from generation to generation. They cannot even imagine living somewhere else. Especially it is true for older rural population. The attachment to the living area decreases labour force mobility and thus local labour market dynamism.
Survey of the pilot area revealed a fact that there was a shortage of good practise for the local population on how to increase their economic and/or social activity. The survey also revealed that many of local population in Telsiai district municipality did not trust successful good practices of others. So, there is no just a shortage of data or information for local communities but also psychological issues of believing in them. Employment
Therefore, it is a continuous process of inclusion of rural population into the labour market, which requires a lasting infrastructure of services for promoting human capital there.
Mechanisms of data or knowledge transfers/sharing exist in Telsiai district municipality. There were number of consultancy companies, which could help with business organisation, accountancy, or development. There were also public exhibitions in the region, which attracted lots of local population and were an interesting and attractive way of transferring good practice, new technologies, or products for local communities.
Leader could inspire other members of the community to take actions, help organise social events when local community gathers together or initiate community projects targeted at improving living conditions in the local area.
Finally, summarising the results of pilot research in Telsiai municipality, the most important constraints of
1) complicated demographic situation and migration;
barriers;
marketing, business, and good practice information exchange;
V. Atkociuniene et al. Strategic Orientations for Rural Employment Development: the Case of Telsiai District Labour Market

Economic Science for Rural Development No. 32, 2013
ISSN 1691-3078
102
4) lack of entrepreneurship, leadership and risk fear; 5) low quality of life and decrease of purchasing power.
Summarising the research of labour market in Telsiai district municipality the following potentials could be emphasised for rural employment creation:1) changes of personal values and mobility of rural
2) better usage of existing resources and skills;3) activation of exchange of business information and
4) exchange.
3. SWOT and SOR analysis for Telsiai district municipality labour market
The following Strengths, Weaknesses, Opportunities, and Threats were considered by experts to be the most relevant to the rural employment in Telsiai municipality.
Strengths (S)
S1. Extensive network of institutions providing public services to the labour market
S2. Attractive market places for agricultural productsS3. Attractive environment and countryside, rich in
natural recreational resourcesS4. Developed traditional agriculture and ecological
farming
production, canned food production, furniture manufacturing)
S6. Good geographical location for local tourism development. Good road network to visitors from Latvia, Russia, Poland, Germany, and Sweden
S7. Established public Internet access points in rural areas
Weaknesses (W)
business
W3. Underdeveloped physical and social infrastructure in rural areas
W4. Low entrepreneurship levels among rural population
jobW5. Lack of cooperation among rural population involved
in different economic activitiesW6. Professional retraining and education are
with the development of new economic activitiesW7. Lack of territory attractiveness due to the
underdeveloped sector of entertainment and leisure, passive social life
Opportunities (O)
improvement of the rural life quality
O3. Improvement of place marketing systemO4. Development of cooperation between local actorsO5. Increase in education and consulting service supplyO6. Financial support for the environment protection and
forest management
O7. Development of the non-traditional trades, crafts and cultural heritage
O8. Development of the information infrastructure
Threats (T)
T1. The state social support policy fails to encourage work
T2. Very high sanitary, safety at work and other standard requirements for business, compared with other EU countries
T3. Non-sustainable investment into physical and social infrastructure of rural areas
T4. Growth of bureaucratic practices in administration of the EU and national support to business
T5. Reorganisation and centralisation of the rural public sector (local authorities, schools, libraries, cultural centres, and public utilities)
T6. Growth of living alone, disabled people, social risk families and people number, who need social care
T7. Macro-environment unattractive to foreign investment
The pair-wise combining of SOR factors was done by the experts from Telsiai municipality. The above table lists the issues for each combination. Each issue is given a mark according to the importance to be attributed to it for the implementation of the strategy (from 0 - not important, to 3 - very important). The SOR analysis conducted in Telsiai municipality
of Maxi-maxi strategy was 39; Mini –maxi strategy – 32; Maxi-mini strategy - 21; and Mini-mini strategy – 16. Maxi-maxi strategy has a priority over others in Telsiai municipality.
The relationships, which scored 3 or 2 in the SOR
as follows:
SO1. Promote multifunctional agriculture and new
economic activities
— Develop the economic activities like wood processing, bio fuel and furniture manufacturing, canned food manufacturing, regional food products, and traditional craft items
—based on local resources
— To achieve high productivity activities through innovations and new technologies
— To promote nature-friendly behaviour in rural areas
SO2. Promote cultural and natural tourism
— Develop cultural and natural tourism: creating and
traditions of region) — Organise marketing of rural tourism and its services — Develop the poles of rural tourism near memorials of
nature and National park — Promote cooperation between businesses, producers
of regional products, actors from tourism sectors, and the government
V. Atkociuniene et al. Strategic Orientations for Rural Employment Development: the Case of Telsiai District Labour Market

103
Economic Science for Rural Development No. 32, 2013
ISSN 1691-3078
Table
4S
OR
matr
ix o
f Tels
iai
mu
nic
ipali
ty L
ab
ou
r M
ark
et
Are
a
Fact
ors
aff
ecting T
elsi
ai loca
l la
bour
area
O
1.
Dem
and f
or
the
EU
and n
atio
nal
re
sourc
es
for
the
imple
men
tation
of
regio
nal
st
rate
gie
s
O2.
Gro
win
g
supply
of
free
la
bour
forc
e
O3.
Impro
ving
imag
e of
Tels
iai
O4.
Dev
elopm
ent
of
cooper
atio
n
bet
wee
n loca
l ac
tors
O5.
Incr
easi
ng
educa
tion
and
consu
ltin
g
serv
ice
supply
T1.
stat
e so
cial
su
pport
polic
y
T2.
Ext
ensi
ve
SM
E
busi
nes
s co
ntr
ol
T3.
No
sust
ainab
le
inve
stm
ent
polic
y in
to
phys
ical
an
d s
oci
al
infr
astr
uct
ure
of
rura
l ar
eas
T4.
Gro
wth
of
bure
aucr
atic
pra
ctic
es in
adm
inis
trat
ion
of
the
support
S1.
Dev
eloped
lab
our
mar
ket
infr
astr
uct
ure
31
21
10
11
2
S2.
Att
ract
ive
mar
ket
pla
ces
for
agricu
ltura
l pro
duct
s 0
00
20
32
10
S3.
Man
y pote
ntial
s of
nat
ura
l an
d c
ultura
l re
sourc
es
33
33
12
10
0
S4.
Dev
eloped
rura
l to
urism
se
rvic
e2
33
32
03
23
S5.
Dev
eloped
tra
ditio
nal
ag
ricu
lture
and v
iable
new
SM
Es
10
10
13
23
3
W1.
Low
er t
raditio
nal
ac
tivi
ties
pro
cess
ing v
olu
mes
11
01
31
22
3
W2.
Lim
ited
lab
our
pla
ces
in
public
adm
inis
trat
ion s
ervi
ce
spec
ialis
ts
13
00
00
00
0
W3.
Rat
her
wea
k m
otiva
tion
a jo
b,
low
entr
epre
neu
rship
le
vels
am
ong r
ura
l popula
tion
00
00
13
01
1
W4.
Under
dev
eloped
phys
ical
and s
oci
al
infr
astr
uct
ure
in r
ura
l ar
eas
00
20
00
12
0
among r
ura
l popula
tion
invo
lved
in d
iffe
rent
econom
ic a
ctiv
itie
s
11
12
30
00
0
To
tal
12
12
12
12
12
12
12
12
12
V. Atkociuniene et al. Strategic Orientations for Rural Employment Development: the Case of Telsiai District Labour Market

Economic Science for Rural Development No. 32, 2013
ISSN 1691-3078
104
SO3. Enhance rural physical and social
infrastructure
— Develop a strategy for sustainable and integrated rural physical and social infrastructure development
— Increase and develop social service in rural areas for senior people involving local communities
— Develop transport system in the remote areas of region
—for rural people
SO4. Promote entrepreneurship among rural
population
— Promote consultation and continuing education
working in rural areas —
the jobs seekers and offers from rural areas — Reinforce motivation of the unemployed,
entrepreneurship education, creating possibilities to work and earn money
The main recommendations, based on four strategic orientations, to increase rural employment in Telsiai
1. partnership strategies and networks; correlating activities: agriculture, production, manufacturing, processing, tourism, retail, and transport (logistic).
2. Manufacturing high value added products and services: agriculture - traditional agriculture, organic farming, horticulture, alternative business (snails); production, manufacturing, processing - manufacturing of organic food, rape processing, wood processing, biofuel, solid fuel briquettes, manufacturing of regional products, agricultural food production, confectionary, crafts; tourism - agro tourism, sightseeing tourism, rehabilitation services; retail - selling local products in internal marketing; transport - logistic services centre, transit transport services.
3. Stimulating young people’s interest in living and doing business in rural areas: education (knowledge centres in rural area); social infrastructure and quality of services; cooperation between institutions: providing services to the labour market and the employers, schools, and families.
4. Improvement of business development, employment and social policies: liberalisation of the legal, political, and economic (tax system) environment; cooperation between public policy administration institutions.
5. Decentralisation of decision-making, wide use of
Conclusions and recommendations1. The economic and employment situation in Telsiai
municipality (LAU1) of Telsiai county (NUTS3), which were chosen as pilot areas in Lithuania was analysed for the implementation of the research aim. These
region.
2. Empirical analyses show that the pilot area is different in the local labour market performance in Telsiai. The
react differently to national shocks. Therefore, the labour market policy is increasingly being decided on the regional or local level.
3. Rural entrepreneurs in Telsiai district as the main source of business activity and employment in rural areas still see agriculture, because land is relatively good for cultivation. Another traditional occupation of rural inhabitants of Telsiai municipality is crafting but this type of economic activity is relatively weak and information about crafting
know how a craft product could be applied in daily life. There have been efforts of establishing centres of crafts with support from the EU Structural Funds but the results did not fully meet expectations.
4. The main recommendations to increase rural
during the research together with local actors from Telsiai pilot areas: 1) to increase cooperation among local development stakeholders: partnership strategies and networks; 2) to ensure high value added manufacturing of products and services; 3) to stimulate young people’s interest in living and doing business in rural areas; 4) to improve business development, employment and social policies; and 5) to decentralise decision-making and wide use of
Bibliography 1.
(2009). Institutional Model of Employment System in a Rural Area. Rural Development 2009:
Kaunas region, Lithuania. Akademija: Lithuanian University of Agriculture, ISSN 1822-3230, Vol. 4, b. 1, pp. 196-202.
2. of Rural Areas in EU-27 for Spatial Analysis: Rural Labour Market Approach. Rural Development 2009: Proceedings of the Fourth International
Kaunas region, Lithuania. Akademija: Lithuanian University of Agriculture, ISSN 1822-3230, Vol. 4, b. 1, pp. 127-134.
3. (2007). The Unevenness of Life Quality in Lithuania‘s Rural Areas: Economic and Social Dimensions. The
Rural Development: Proceedings of International Symposium, May 16-17.
4. Genovese, E. (2005).Towards an Integrated Scenario
Mitigation. EUR 21900 EN. Retrieved: http://moland.jrc.it. ISBN 9986-820-24-3.
5. Futures. The ESPON Scenarios, Europe’s Rural Areas
V. Atkociuniene et al. Strategic Orientations for Rural Employment Development: the Case of Telsiai District Labour Market
105
Economic Science for Rural Development No. 32, 2013
ISSN 1691-3078
“ECONOMIC SCIENCE FOR RURAL
DEVELOPMENT”
Proceedings of the
MARKETING AND SUSTAINABLE CONSUMPTION
Economic Science for Rural Development No. 32, 2013
ISSN 1691-3078
106
E. Spakovica et al. Consumers’ Complaints and Complaint Handling as a
Crucial Aspect Of Good Market Functioning
___________________________1 Evelina Spakovica. Latvia University of Agriculture. Tel. + 371 63021041, e-mail address: [email protected] Genadijs Moskvins. Latvia University of Agriculture. Tel. + 371 63080687, e-mail address: [email protected] Marks Moskvins. E-mail address: [email protected]
CONSUMERS’ COMPLAINTS AND COMPLAINT HANDLING AS A CRUCIAL ASPECT OF GOOD MARKET FUNCTIONING
Evelina Spakovica1, Dr.oec., Genadijs Moskvins2, Dr. habil.sc.ing., Marks Moskvins3, Mg.oec.
Abstract. Despite a generally high level of consumer protection guaranteed by the EU legislation, the problems encountered by consumers are still too often left unresolved. At the same time, the fact that consumers do complain when they experience problems is an important feedback mechanism for businesses, allowing businesses to improve their performance. Therefore, the paper presents the analysis of actual consumer behaviour in the EU and Latvia in case if a complaint is necessary to protect their as consumers’ rights, the tendencies for the complaint submission
paper is to analyse the tendencies of complaint submission, the behaviour of consumers when complaint is necessary, and importance of complaining for good market functioning. The study is based on the review of legislation, the
aspects for a good market functioning. If consumers do not complain when they experience a problem, redress is
a problem. Therefore, both – the consumers and sellers/providers/manufacturers should be more active to solve the
complaint handling.Key words: consumers’ complaints, complaint handling, feedback, consumer behaviour.JEL code: M390
IntroductionThe role of consumers increases owing to
and empowered consumers are the motor of economic
consumer protection already achieved in the EU, it is still possible to improve fundamentally the situation for the EU consumers. While the technological means are increasingly in place, yet business and consumers’
17% of the EU consumers reported that they had encountered problems when buying something in their country (same proportion as in 2010). In Accordance with the Empowerment Report of 2011, the overall
incurred by European consumers due to their encountered problems was estimated at 4 % of the
A).
information and raising awareness of consumer rights and interests among both consumers and traders; 2) building knowledge and capacity for more effective consumer
2012 ). If consumers are able to play fully their role in the market, making informed choices, and rewarding
stimulating competition and economic growth. On the other hand, markets, where consumers are confused,
less competitive and generate more consumer detriment,
Therefore, it is important to identify, which parts of the market are not working well for consumers (European
B).In this connection, the aim of the paper is to
analyse the tendencies of complaint making, the behaviour of consumers when complaint is necessary, and importance of complaining for a good market functioning. In the framework of the research, the following tasks were undertaken: 1) to examine how often consumers encountered a problem with goods or services and their reaction to the experienced problem; 2) to analyse consumers’ propensity to complain as a
3) to understand the reasons for not complaining;
rights, trust, and satisfaction in the market; 5) to work out recommendations for better complaint handling taking into account the importance of complaint for a good market functioning.
The study is based on the review of legislation, the literature on consumer rights’ protection, and behaviour as well as on statistical data available from
Markets Scoreboard conducted in 2009-2012. In the study, the authors applied descriptive method and secondary data analysis.
Research results and discussion
demand will perform better in competitiveness and innovation terms and will be more in tune with the lives

107
Economic Science for Rural Development No. 32, 2013
ISSN 1691-3078
in economic and non-economic terms are the ultimate arbiter of whether markets are failing or succeeding
outcomes for consumers are based on consumers’ real experience in the market.
According to the survey of consumers’ opinion (TNS
(21%) in the EU 27 had encountered a problem with a commodity, a service, a retailer, or a provider in the past 12 months, for which they had legitimate cause for complaint. In Latvia, the respondents had encountered a problem in 16% of cases. However, in some cases
chosen by the respondents aged 25-39 (26%), the respondents with highest education levels, i.e. educated and older than 20 years (29%), and managers (32%). The respondents that reported the lowest incidence of such problems were among the oldest respondents aged 55 and older (16%) and the less educated who had left school at age 15 or younger (13%), retired persons (15%), and those who had never used a computer
rights better, were the ones, who had more encountered a problem (TNS Opinion & Social, 2011).
More than three-quarters of consumers, who had experienced problems in the last 12 months, took some form of action in response to their problems (77%), while 23% took no action at all. Those who took action (multiple answers were possible) were most likely to respond in the form of making a complaint to the retailer or provider
smaller number of consumers had made a complaint to the manufacturer (13%) (Figure1).
By contrast, consumers in Latvia were the least likely to take any action (only 55% took some form of action). That was the second lowest percentage of consumers, who were ready to take some actions in response to experienced problem in the EU 27.
A), consumers, who encountered a problem after they had bought something, complained about it to the seller/provider/manufacturer in 80% cases in the EU 27 and in 58% of cases in Latvia. That demonstrates a huge difference between the EU 27 and Latvia: consumers in Latvia are much more passive, compared with the EU 27. Therefore, and especially in Latvia, it is important to encourage consumers to communicate their problems and to seek
themselves but also the market as a whole. The indicator of complaints captures the severity of
a problem, given that it takes more time and effort to
another research, based on the annual market monitoring B) it was detected
that 76% of consumers who had encountered a problem complained about it to the company, the complaint body,
has considerably dropped both for goods and services’ markets, as compared with 2011 (81%) and 2010 (79%).
For all goods and services’ markets, by far the most likely party to be addressed is the seller of the product or the provider of the service, i.e. the immediate and known point of contact (approached by 60% of respondents who encountered a problem). Only 5% of those, who had a problem, addressed their complaint directly to a
as a public authority or consumer organisation remained rare (7%) and were more likely to occur in services’ markets (9% as against 4% in goods markets). Finally, almost a third of consumers (31%) shared their problems
Having established the fact that very few consumers after having experienced problems had made a complaint to a public authority or a consumer organisation, the surveyors asked those consumers who had not taken any action to explain the reasons for not taking their complaint to the relevant bodies. The most frequently cited reason (multiple answers were possible) for not
Source: authors’ construction based on TNS Opinion & Social, 2011
Fig. 1. Actions undertaken by consumers in response to experienced problem
E. Spakovica et al. Consumers’ Complaints and Complaint Handling as a Crucial Aspect Of Good Market Functioning

Economic Science for Rural Development No. 32, 2013
ISSN 1691-3078
108
making a complaint to a public authority or consumer organisation was the fact that the person had already received a satisfactory result from the retailer/provider of the good/service (44%) (Figure 2.) In Latvia, this percentage is much lower compared with the EU 27, only 29% of consumers had received a satisfactory result from the retailer/provider of the good/service. The retailers and providers in Latvia are not so loyal to consumers and their problems as in the EU 27.
The next most common reason, mentioned by close to a quarter of respondents, was that the sums involved were too small (24%), in Latvia – 28%. Obviously, relatively few respondents did not perform this procedure due to their expectations of an unsatisfactory response or outcome. For example, only 15% believed they were unlikely to get a satisfactory result, and similar number of respondents replied that in their opinion it would take too long or take too much effort (13% each). Whereas, 19% of respondents answered that either it would take
too long or it would take too much effort. The reasons mentioned by Latvian consumers were even more important – 25% believed they were unlikely to get a satisfactory result, 24% answered that in their opinion it would take too long, and 31% thought it would take too much effort. It means that consumers in Latvia
(Figure 2).
Moreover, Latvian consumers most likely admitted that their main reason for not complaining to a public authority or a consumer organisation was their opinion that this process would take too much effort. Moreover, the situation was similar in case of complaining to a
A) shows that even those consumers who felt they had a reason to complain to a seller/provider/manufacturer, did not do that in 20% of cases in the EU 27 and in 42% of cases in Latvia (Figure3).
Source: authors’ construction based on TNS Opinion & Social, 2011
Fig. 2. Reasons for not taking complaint to consumer organization
Source: authors’ construction based on the European Commission, 2012A
Fig. 3. Consumers who felt they had a reason to complain, but didn’t, %
E. Spakovica et al. Consumers’ Complaints and Complaint Handling as a Crucial Aspect Of Good Market Functioning
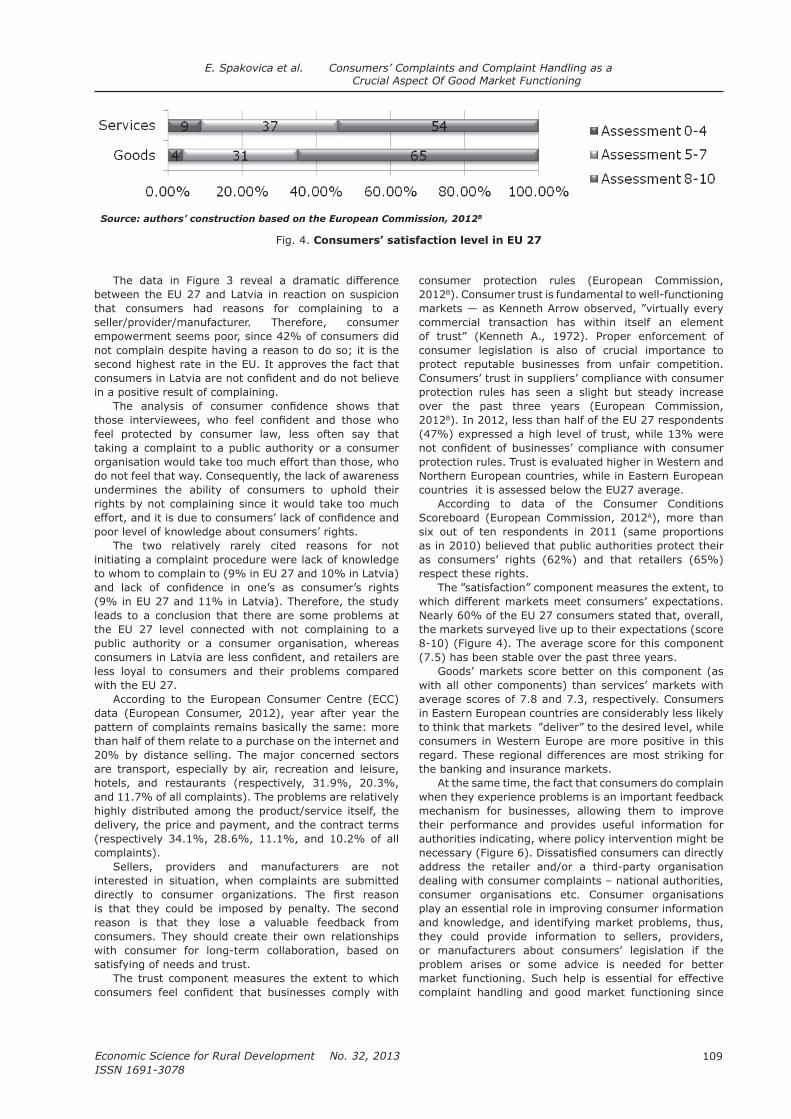
109
Economic Science for Rural Development No. 32, 2013
ISSN 1691-3078
The data in Figure 3 reveal a dramatic difference between the EU 27 and Latvia in reaction on suspicion that consumers had reasons for complaining to a seller/provider/manufacturer. Therefore, consumer empowerment seems poor, since 42% of consumers did not complain despite having a reason to do so; it is the second highest rate in the EU. It approves the fact that
in a positive result of complaining.
feel protected by consumer law, less often say that taking a complaint to a public authority or a consumer organisation would take too much effort than those, who
undermines the ability of consumers to uphold their rights by not complaining since it would take too much
poor level of knowledge about consumers’ rights.The two relatively rarely cited reasons for not
initiating a complaint procedure were lack of knowledge to whom to complain to (9% in EU 27 and 10% in Latvia)
(9% in EU 27 and 11% in Latvia). Therefore, the study leads to a conclusion that there are some problems at the EU 27 level connected with not complaining to a public authority or a consumer organisation, whereas
less loyal to consumers and their problems compared with the EU 27.
pattern of complaints remains basically the same: more than half of them relate to a purchase on the internet and 20% by distance selling. The major concerned sectors are transport, especially by air, recreation and leisure, hotels, and restaurants (respectively, 31.9%, 20.3%, and 11.7% of all complaints). The problems are relatively highly distributed among the product/service itself, the delivery, the price and payment, and the contract terms (respectively 34.1%, 28.6%, 11.1%, and 10.2% of all complaints).
Sellers, providers and manufacturers are not interested in situation, when complaints are submitted
is that they could be imposed by penalty. The second reason is that they lose a valuable feedback from consumers. They should create their own relationships with consumer for long-term collaboration, based on satisfying of needs and trust.
The trust component measures the extent to which
2012B
commercial transaction has within itself an element
consumer legislation is also of crucial importance to protect reputable businesses from unfair competition.
protection rules has seen a slight but steady increase
2012B). In 2012, less than half of the EU 27 respondents (47%) expressed a high level of trust, while 13% were
protection rules. Trust is evaluated higher in Western and Northern European countries, while in Eastern European countries it is assessed below the EU27 average.
A), more than six out of ten respondents in 2011 (same proportions as in 2010) believed that public authorities protect their as consumers’ rights (62%) and that retailers (65%) respect these rights.
which different markets meet consumers’ expectations. Nearly 60% of the EU 27 consumers stated that, overall, the markets surveyed live up to their expectations (score 8-10) (Figure 4). The average score for this component (7.5) has been stable over the past three years.
Goods’ markets score better on this component (as with all other components) than services’ markets with
in Eastern European countries are considerably less likely
consumers in Western Europe are more positive in this regard. These regional differences are most striking for the banking and insurance markets.
At the same time, the fact that consumers do complain when they experience problems is an important feedback mechanism for businesses, allowing them to improve their performance and provides useful information for authorities indicating, where policy intervention might be
address the retailer and/or a third-party organisation dealing with consumer complaints – national authorities,
play an essential role in improving consumer information and knowledge, and identifying market problems, thus, they could provide information to sellers, providers, or manufacturers about consumers’ legislation if the problem arises or some advice is needed for better market functioning. Such help is essential for effective complaint handling and good market functioning since
Source: authors’ construction based on the European Commission, 2012B
Fig. 4. Consumers’ satisfaction level in EU 27
E. Spakovica et al. Consumers’ Complaints and Complaint Handling as a Crucial Aspect Of Good Market Functioning

Economic Science for Rural Development No. 32, 2013
ISSN 1691-3078
110
previous research showed that some problems would also arise when sellers and providers are not informed about their obligations according to consumer legislation. For example, the retailer Eurobarometer survey in 2011 found that only 26% of retailers knew the exact period during which consumers have the right to return a defective product. (Spakovica E., Moskvins G., 2012)
Responsibility for the product quality helps to guarantee that sellers, providers, and manufacturers will satisfy their clients, it will strengthen the trust between parties, and could increase repeated purchases (Blackwell R. D., Miniard P.W., 2007). Similarly, poor complaint handling by companies is both a source of harm to consumers and a missed oppor tunity to
Source: authors’ construction based on the European Commission, 2012A
Fig. 5. Consumers’ satisfaction level with complaint handling and decision about
further action in Latvia and the EU 27, %
Fig. 6. Importance of complaint as an aspect of a good market functioning
E. Spakovica et al. Consumers’ Complaints and Complaint Handling as a Crucial Aspect Of Good Market Functioning
111
Economic Science for Rural Development No. 32, 2013
ISSN 1691-3078
reinforce consumer loyalty. At the same time, in line with previous years, only around half of those consumers
A) (Figure5).
handling was low – in the EU 27 (58% of consumers). However, in Latvia, this level was even lower – 50% in 2011, and it has decreased compared with 2010. It means that situation has not improved during these
complaint was handled, most consumers gave up and took no further action (73% of consumers – the highest in the EU). In the EU, the percentage of consumers, who were not ready to take further actions was much lower – 45% (Figure 5).
seller/provider/manufacturer, but not to consumer
dissatisfaction about quality of goods or services, improve it, and prevent consumers’ decision to
(Figure 6).
Basing on the survey analysis and requirements of legislation, the authors conclude that sellers/providers/manufacturers should play more active role in the process of complaint handling, for example, they should undertake some steps when they receive a complaint:1) to analyse the situation, requirements of legislation,
analyse causes of consumer’s dissatisfaction; 2) to work out a complaint handling mechanism
for quick and effective reaction on consumer’s complaint;
3) to analyse who was at fault for non-qualitative goods or services. In case, if it was a manufacturer or supplier’s fault, the seller or provider should change its supplier. Whereas, if that was a seller or provider’s fault, then they need to take into account consumer’s opinion, respect it, and to be grateful for the feedback since it gives possibility to detect problems with goods or services and improve their problematic points.
The detection of problematic points based on complaints and complaints’ handling system, helps to increase consumers’ level of satisfaction and provide stable communication and relationship between a consumer and a seller, a provider, or a manufacturer. Moreover, it gives possibility to react more quickly to the challenges of global supply chains and to get timely information about emerging product safety risks for improving quality and safety of goods, services, and competitiveness in the market.
Conclusions, proposals,
recommendations 1.
27 has encountered a problem with a good, a service, a retailer, or a provider. More than three-quarters of consumers, who have experienced problems in the last 12 months, took some form of action in response to their problems (77%), while 23% took no action at all.
2. The seller of the product or the provider of the service is by far the most likely party to be addressed by
such as a public authority or consumer organisation
essential role in the improving consumer information, knowledge, and identifying market problems. Yet, Latvian consumers (31%) are more inclined to consider that complaining to a public authority or a consumer organisation would take too much effort, and Latvia is the only exception in the EU 27 in choosing this substantiation as the main reason for not complaining to a public authority or a consumer organisation.
3. compared with the EU 27. One of the reasons is that
believe in a positive result of complaining. The second reason is that retailers and providers in Latvia are not so loyal to consumers and their problems as in the EU. Only 29% of consumers received a satisfactory result from the retailer/provider. In addition, being
most consumers give up and take no further action (73% of consumers – the highest in the EU). In the EU, the percentage of consumers, who are not ready to take further actions, is much lower – 45%.
4. The lack of awareness undermines the ability of consumers to uphold their rights: not complaining
knowledge about consumers’ rights.5. Sellers/providers/manufacturers are not interested
in situation, when complaints are submitted
reason is that they could be imposed by penalty. The second reason is that sellers/providers/manufacturers lose a valuable feedback from consumers, preventing them from improving their performance. Similarly, poor complaint handling by companies is both a source of harm to consumers and a missed oppor tunity to reinforce consumer loyalty. At the same time, in line with previous years, only around half of those consumers who
result.
6. On basis of the survey analysis and requirements of legislation, it was concluded that sellers/providers/manufacturers should play a more active role in the process of complaint handling and create relationships with consumers for a long-term collaboration, based on satisfaction of needs and trust. Detection of problematic points based on complaints and complaints’ handling system gives possibility to react more quickly on the challenges of global supply chains and get timely information about emerging product safety risks for improving quality and safety of goods, services, and competitiveness in the market. It is also important to encourage consumers to communicate their problems and seek solutions,
consumers themselves, but also for the market as a whole.
E. Spakovica et al. Consumers’ Complaints and Complaint Handling as a Crucial Aspect Of Good Market Functioning
Economic Science for Rural Development No. 32, 2013
ISSN 1691-3078
112
Bibliography1.
EU Consumer Policy Strategy 2007-2013. Brussels, p.13.
2. Consumer Rights Protection Law, 01.04.1999. Retrieved: http://www.ptac.gov.lv/page/271. Access: 26.12.2012
3. A). Consumer
Conditions Scoreboard. Consumers at Home in the
Single Market. 7th edition – May 2012, Brussels, p.126.
4. B). Consumer
Markets Scoreboard. Making Markets Work for
Consumers. 8th edition – December 2012, Brussels, p.125.
5. ). A European
Growth. Brussels, 22.5.2012, p.16.6. Kenneth A. (1972) Gifts and Exchanges. Philosophy
and Public Affairs, 1, p. 357.
7. Procedures for the Submission and Examination of
Consumer Claims Regarding the Non-conformity
of Goods or Services with Contract Provisions.
Adopted on 1 August 2006. Access: 26.12.2012.8. Spakovica E., Moskvins G. (2012). Protection of
Distance. Economics Science for Rural Development:
Conference
9. Get Help and Advice on Your Purchase Abroad, 2011
the European Union, p.46.10. TNS Opinion & Social (2011). Special Eurobarometer
342. Consumer Empowerment. Report, April 2011, Brussels, p.228.
11. Blackwell, R.D., Miniard, P.W, Engel J.F. (2007). Theory of Buyer Behaviour (in Russian).
E. Spakovica et al. Consumers’ Complaints and Complaint Handling as a Crucial Aspect Of Good Market Functioning
113
Economic Science for Rural Development No. 32, 2013
ISSN 1691-3078
I. Aleksejeva
USE OF GENETICALLY MODIFIED ORGANISMS IN FOOD PRODUCTION AND FUTURE CHALLENGES
Inese Aleksejeva1, Doctoral student, Faculty of Economics and Management, University of Latvia
Abstract. This is a theoretical research with the aim to assess some of the most important achievements regarding the
into future prospects of GMO used in agriculture and food production highlighting the use of GMO at different stages of food chain. There is a substantial challenge for the world food system, as for several years it is evident that the global population is growing, and diets and consumption levels change. Obviously, we will need to produce more food,
data suggest that the future of GMO used in food production looks encouraging, although success of this technology depends on many factors.Key words:
JEL code: N50; O13; O31; Q16
___________________________1 Tel.: +371 29675493
E-mail: [email protected]
Introduction The aim of this article is to present a theoretical
assessment of some of the most important achievements regarding the use of GMO – organisms in which the genetic material has been altered in a way that does not occur naturally by mating and/or natural recombination
food production. Respectively, GM food is food obtained
literature and data available to show what role GMO play
new technology, which could play a very important role not just in food production, but also in different sectors of national economics.
For centuries humans have altered plants and animals
to increase crop yields and food quality. As a result, we have a wide range of domestic animals and plants grown
is more targeted as it allows to predict the results and to improve necessary traits of the organisms: resistance to certain pests, herbicides, plant viruses or microscopic
enhanced or altered nutritional properties (second generation plants). Nowadays, food production broadly
animals, although still under investigation, can also
animals, or alter their products.In spite of huge progress and new technologies
introduced in food production processes, environmental conditions and cataclysms arouse daily problem of hunger to about one billion people. In developing countries, inadequate and unbalanced nutrition or malnutrition is a cause of premature death or disability for every third
resolve at least some of these important problems, and the data and information reviewed in this article provide an insight into different applications and prospects of GMO.
the use of GMOs in food production allows predicting the market demand in the future and consumers’ willingness to buy as well as consumers’ expectations of the
Research results In 1994, the US Food and Drug administration (FDA)
formally acknowledged that GM tomato Flavr Savr
conventional counterpart is, and issued permission to distribute them on the market. Flavr Savr tomato was
prevent it from softening, while still allowing the tomato
1992).
crops enter the food market increasing in areas from 1.7 million hectares in 1996 to 160 million hectares in 2011 making GM crops the fastest adopted crop technology in the history of modern agriculture (ISAAA, 2011).
In the world, there are 16.7 million farmers in 29 countries, including 19 developing countries and 10 industrial countries growing GM crops. The main
(30.3), the other main countries planting GM crops in
(10.4).

Economic Science for Rural Development No. 32, 2013
ISSN 1691-3078
114
I. Aleksejeva
used in food production. Although there are hundreds
just some of them have reached the global market: the
Soybeans are about 18% oil and 38% protein. Because soybeans are high in protein, they are a major ingredient in livestock feed. Most soybeans are processed for their oil and protein for the animal feed industry. A smaller percentage is processed for human consumption and made into products including ingredients, additives, and vitamins. It is estimated that soy plays at least a small part in 20000 to 30000 products that are on the market today (Table 1), whether directly as an ingredient or indirectly as feed or a nutrient source (GMO Compass).
GM soybeans are now widely grown in many countries all around the world. In 2011, soybean plantings occupied 75.4 million hectares or 47% of global biotech area
They make up a large part of diets in developing countries.
starch, which provides up to 72 - 73% of the kernel
livestock and as raw material for the starch industry. Starch, however, forms the basis of many foods and food additives.
expanded to more than 51 million hectares worldwide (32% of global biotech area (ISAAA, 2011)). Many countries in North and South America, Africa, and Asia
2011).
material in the production of numerous food additives such as corn syrup, corn sugar (glucose or dextrose),
According GMO Compass, only a few foods are
popcorn, canned sweet corn, corn on the cob, or corn oil.
Already more than 40 years ago, oilseed rape with very low toxic erucic acid content was obtained using selection methods. In nowadays, rape is the main raw material in the world used for the production of vegetable
hectares or 5% of the global biotech crop area (ISAA,
and Australia.
the production of margarine. With its high content of monounsaturated fatty acids (60-70%), rapeseed oil has also become important as healthy cooking oil. Rapeseed
and substances0 that can help lower cholesterol levels (GMO Compass).
In 2011, the cultivation areas of GM cotton according to ISAAA reached 24.7 million hectares or 15% of the global biotech crop area.
apparel, home furnishings, and other industrial uses (such
African countries, cottonseed oil provides the main source of fat and oil supply, and has several food applications
frying oil and is sometimes used to make margarine. The oil is also a source of vitamin E (tocopherol).
Besides the four main GM crops cultivated in the
plants: — Herbicide tolerant sugar beet, the commercial
planting of which was started in the USA in 2008.
Table 1Use of soy in the food production in 2011
Soy ingredient Use
Oils and fats Margarine, vegetable oils, mayonnaise, and many other fat products
Tocopherol / Vitamin Eproducts
Soy protein additives, soy isolate Prepared foods (soups, sauces), meat substitutes, diet foods, imitation milk products, e.g. non-dairy creamer
Hydrolysed soy protein Soy sauce, seasonings
Bread, snacks, pasta
Products from whole soybeans
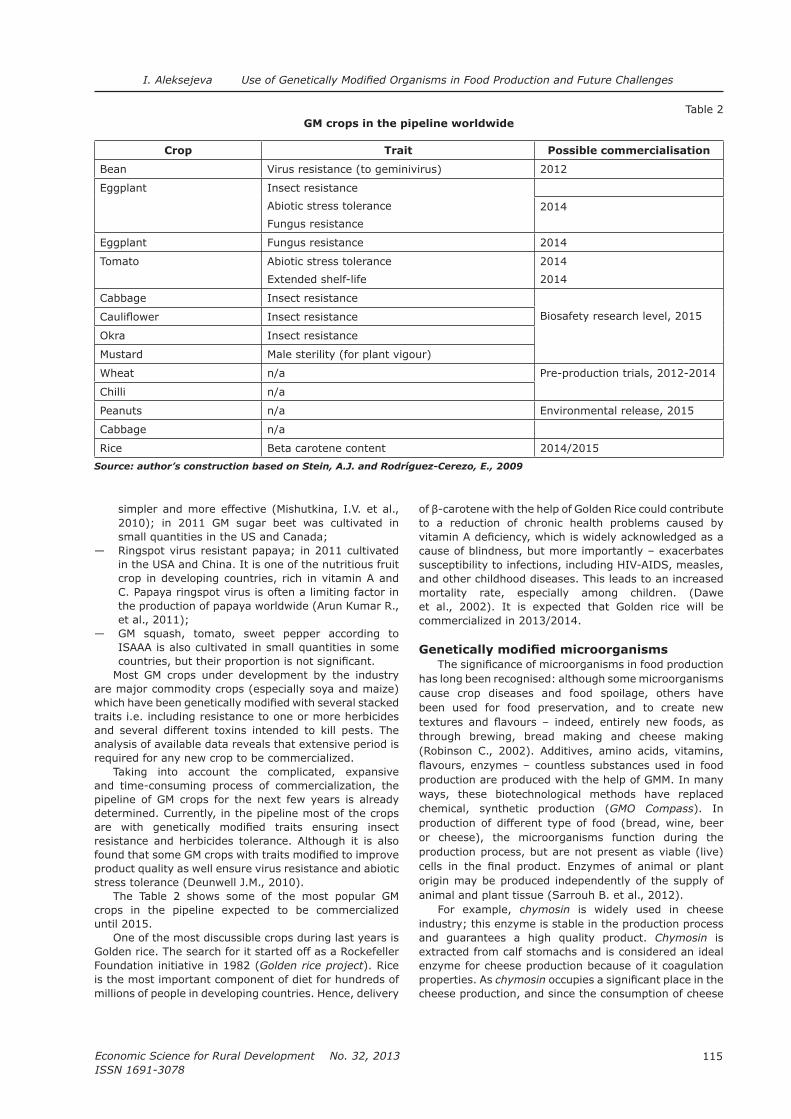
115
Economic Science for Rural Development No. 32, 2013
ISSN 1691-3078
I. Aleksejeva
simpler and more effective (Mishutkina, I.V. et al., 2010); in 2011 GM sugar beet was cultivated in
— Ringspot virus resistant papaya; in 2011 cultivated
crop in developing countries, rich in vitamin A and
the production of papaya worldwide (Arun Kumar R., et al., 2011);
— GM squash, tomato, sweet pepper according to ISAAA is also cultivated in small quantities in some
Most GM crops under development by the industry
traits i.e. including resistance to one or more herbicides and several different toxins intended to kill pests. The analysis of available data reveals that extensive period is
Taking into account the complicated, expansive
pipeline of GM crops for the next few years is already
insect resistance and herbicides tolerance. Although it is also
product quality as well ensure virus resistance and abiotic stress tolerance (Deunwell J.M., 2010).
The Table 2 shows some of the most popular GM
until 2015.One of the most discussible crops during last years is
Golden rice. The search for it started off as a Rockefeller Foundation initiative in 1982 (Golden rice project). Rice is the most important component of diet for hundreds of millions of people in developing countries. Hence, delivery
to a reduction of chronic health problems caused by
cause of blindness, but more importantly – exacerbates susceptibility to infections, including HIV-AIDS, measles, and other childhood diseases. This leads to an increased mortality rate, especially among children. (Dawe et al., 2002). It is expected that Golden rice will be
has long been recognised: although some microorganisms cause crop diseases and food spoilage, others have been used for food preservation, and to create new
through brewing, bread making and cheese making
production are produced with the help of GMM. In many ways, these biotechnological methods have replaced chemical, synthetic production (GMO Compass). In production of different type of food (bread, wine, beer or cheese), the microorganisms function during the production process, but are not present as viable (live)
origin may be produced independently of the supply of animal and plant tissue (Sarrouh B. et al., 2012).
For example, chymosin is widely used in cheese ocess
and guarantees a high quality product. Chymosin is extracted from calf stomachs and is considered an ideal
properties. As chymosin
cheese production, and since the consumption of cheese
Table 2GM crops in the pipeline worldwide
Crop Trait Possible commercialisation
Bean Virus resistance (to geminivirus) 2012
Eggplant Insect resistance
Abiotic stress tolerance
Fungus resistance
2014
Eggplant Fungus resistance 2014
Tomato Abiotic stress tolerance
Extended shelf-life
2014
2014
Insect resistance
Biosafety research level, 2015Insect resistance
Okra Insect resistance
Mustard Male sterility (for plant vigour)
Wheat n/a Pre-production trials, 2012-2014
n/a
Peanuts n/a Environmental release, 2015
n/a
Rice Beta carotene content 2014/2015
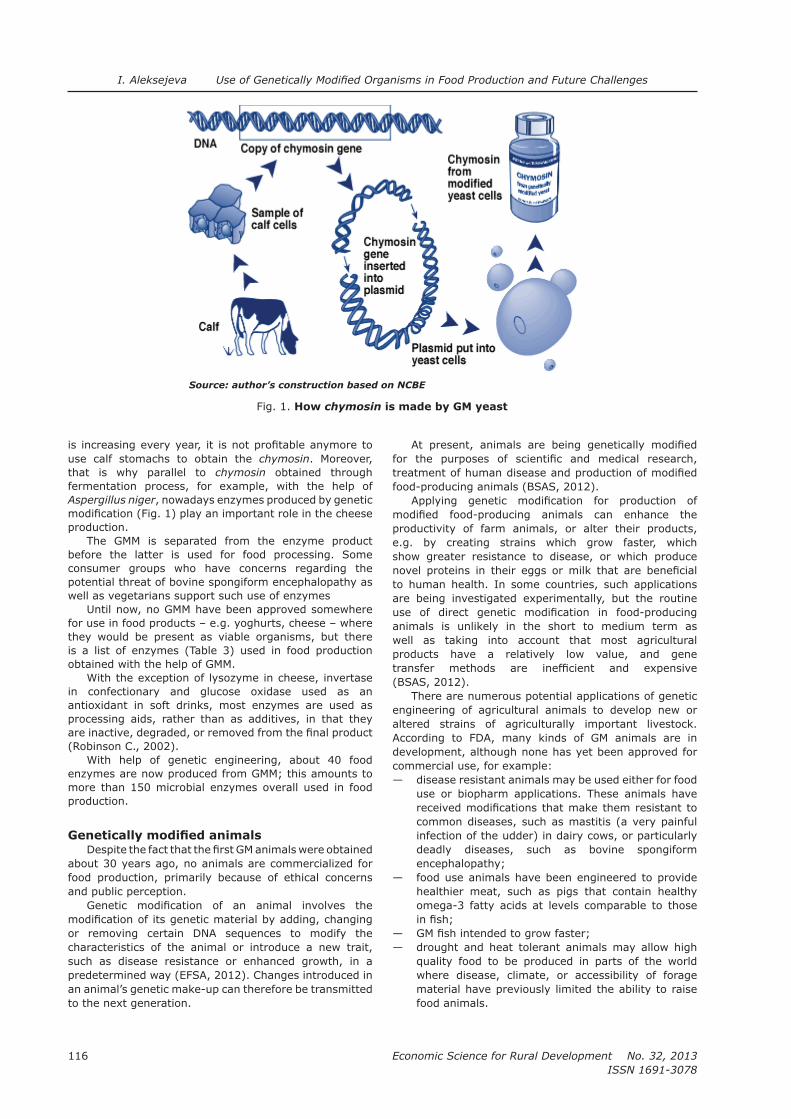
Economic Science for Rural Development No. 32, 2013
ISSN 1691-3078
116
I. Aleksejeva
use calf stomachs to obtain the chymosin. Moreover, that is why parallel to chymosin obtained through fermentation process, for example, with the help of Aspergillus niger
production.
before the latter is used for food processing. Some consumer groups who have concerns regarding the potential threat of bovine spongiform encephalopathy as
Until now, no GMM have been approved somewhere for use in food products – e.g. yoghurts, cheese – where they would be present as viable organisms, but there
obtained with the help of GMM.
in confectionary and glucose oxidase used as an
processing aids, rather than as additives, in that they
With help of genetic engineering, about 40 food
production.
food production, primarily because of ethical concerns and public perception.
or removing certain DNA sequences to modify the characteristics of the animal or introduce a new trait, such as disease resistance or enhanced growth, in a
an animal’s genetic make-up can therefore be transmitted to the next generation.
food-producing animals (BSAS, 2012).
productivity of farm animals, or alter their products, e.g. by creating strains which grow faster, which show greater resistance to disease, or which produce
to human health. In some countries, such applications are being investigated experimentally, but the routine
animals is unlikely in the short to medium term as well as taking into account that most agricultural products have a relatively low value, and gene
(BSAS, 2012).
There are numerous potential applications of genetic engineering of agricultural animals to develop new or altered strains of agriculturally important livestock. According to FDA, many kinds of GM animals are in development, although none has yet been approved for commercial use, for example:
— disease resistant animals may be used either for food use or biopharm applications. These animals have
common diseases, such as mastitis (a very painful infection of the udder) in dairy cows, or particularly deadly diseases, such as bovine spongiform encephalopathy;
— food use animals have been engineered to provide healthier meat, such as pigs that contain healthy omega-3 fatty acids at levels comparable to those
— — drought and heat tolerant animals may allow high
quality food to be produced in parts of the world where disease, climate, or accessibility of forage material have previously limited the ability to raise food animals.
Source: author’s construction based on NCBE
Fig. 1. How chymosin is made by GM yeast

117
Economic Science for Rural Development No. 32, 2013
ISSN 1691-3078
I. Aleksejeva
Table 3Commercialized food enzymes obtained from GMM
Enzyme activity Production organism Donor organism Food application
Alpha-acetolactatedecarboxylase
Bacillus amyloliquefaciens or subtilis Bacillus sp. Beverages
Aminopeptidase Trichoderma reesei or longibrachiatum
Aspergillus sp.
Alpha-amylase Bacillus amyloliquefaciens or subtilis Bacillus licheniformis
Bacillus sp.Thermoactinomyces sp.Bacillus sp.
Baking, beverages, starchBakingBeverages, starch and sugars
Arabinofuranosidase Aspergillus niger Aspergillus sp. Beverages
Aspergillus niger Aspergillus sp. Egg-based products
Aspergillus nigerKluyveromyces lactis
glucosyltransferase
Bacillus licheniformis Thermoanaerobacter Starch
Beta-glucanase Bacillus amyloliquefaciens or subtilis Trichoderma reesei or longibrachiatum
Bacillus spTrichoderma sp.
BeveragesStarch
Glucoamylase Aspergillus niger Aspergillus sp. Beverages, baking, starch, fruit-based products
Glucose isomerase Streptomyces lividansStreptomyces rubiginosus
Actinoplanes sp.Streptomyces sp.
StarchStarch
Glucose oxidase Aspergillus niger Aspergillus sp. Baking, egg-based products
Hemicellulase Bacillus amyloliquefaciens or subtilis Bacillus sp. Baking, starch
Lipase, triacylglycerol
Thermomyces sp.
Fats
Baking, fats
Maltogenic amylase Bacillus amyloliquefaciens or subtilis Bacillus sp Baking, starch
Pectin lyase Aspergillus nigerTrichoderma reesei or longibrachiatum
Aspergillus sp. Beverages, fruit-based products
Pectinesterase Trichoderma reesei or longibrachiatum
Aspergillus sp. Beverages, fruit-based products
Phospholipase A Trichoderma reesei or longibrachiatum
Aspergillus sp. Baking, fats
Phospholipase B Trichoderma reesei or longibrachiatum
Aspergillus sp. Baking, starch
Polygalacturonase Trichoderma reesei or longibrachiatum
Aspergillus sp. Beverages, fruit-based products
ProteaseBacillus amyloliquefaciens or subtilisBacillus licheniformis
Bacillus sp.Bacillus sp.
Baking, beverages, cheeseFish-, meat-based products
Pullulanase Bacillus licheniformisBacillus subtilisKlebsiella planticola
Bacillus sp.Bacillus sp.Klebsiella sp.
StarchBeverages, starchBeverages, starch
Xylanase Aspergillus nigerAspergillus niger
Bacillus amyloliquefaciens or subtilisBacillus licheniformisTrichoderma reesei or longibrachiatum
Aspergillus sp.Aspergillus sp.Aspergillus sp.Thermomyces sp.Bacillus sp.
Bacillus sp.Trichoderma sp.
Baking, beveragesBakingStarchBakingBaking, beverages, starch
StarchBeverages, starch
Source: author’s construction based on Robinson C., 2002
Economic Science for Rural Development No. 32, 2013
ISSN 1691-3078
118
I. Aleksejeva
ConclusionsIt is obvious that impact and progress of technologies
Every year more and more new technologies are introduced in the sector of agriculture and food production. It is important now to be conscious of their impact on exposure of products to predict market demand in the future, and to be able to manage food
consumers’ expectations, ensuring competitiveness and stimulating the development of national economics.1. To date, the data and information available on
commercial GM crops mostly give evidence of the
there is also a number of products in the pipeline which will make more direct contributions to food quality, for example, rice with higher levels of b-carotene; tomatoes with improved shelf-life;
and vegetables.It is possible that GM crops could contribute to
and ensuring developing countries with crops of high quality and nutrition.
2. The importance of GMM application in food chain is also indisputable. GMM have been developed
environment. Although GMM are not directly used
production are now produced by GMM (about
via the genetic engineering approach focuses
purity, and environmentally friendly production processes.
3. Although GM animals are not still allowed to place
technology can introduce in the food chain. GM animals have improved food production capabilities, enabling them to help meet the global demand
sources of food. GM animals can contribute to improving the environment and human health by consuming fewer resources and producing less waste. The future of GMO used in food production looks encouraging, although, which of these technologies will be successful, depends on many factors such as safety, politics, economics, ethics, moral and other.
Bibliography 1. Arun Kumar, R., Sathish Kumar, D., Gayatri, V.
and Assessment and Perception of Genetically
Genetic Syndromes & Gene
Therapy, 2:3.2. British Society of Animal Science (2012).
. Retrieved: http://www.bsas.org.uk/about_the_bsas/issue_
papers/genetic_modification_of_farm_animals/Access: 19.09.2012.
3.
ed. Bread for the World Institute (1994), p. 147. Retrieved: http://www.bread.org/learn/hunger-basics/hunger-facts-international.html. Access: 12.09.2012.
4. Dawe, D., Robertson, R. and Unnevehr, L. (2002). Golden Rice: What role could it play in alleviation of
Food Policy, 27:541-560.5. Dharmananda, S. (2005). Issues Surrounding
for Traditional Medicine, Portland, Oregon. Retrieved: http://www.itmonline.org. Access: 12.09.2012.
6. and opportunities. Journal of Agricultural Science.
7. Europe Food Safety Authority (EFSA), 2012. . Retrieved: http://
www.efsa.europa.eu/en/topics/topic/gmanimals.htm. Access:19.09.2012
8. Directive
2001/18/EC on the deliberate release into the
and repealing Council Directive 90/220/EEC. Retrieved: http://eur-lex.europa.eu. Access: 12.09.2012.
9. Nations. (1992). Maize in human nutrition. Retrieved: http://www.fao.org/docrep/T0395E/T0395E00.htm. Access: 05.09.2012.
10. Friends of the Earth Europe. (2012). Organic farming
dwarfs GM crop production in Europe. Retrieved: http://www.foeeurope.org/sites/default/files/press_releases/FoEE_factsheet_organic_farming_dwarfs_GM_Feb2012%5B1%5D.pdf. Access: 17.09.2012.
11. Golden Rice Humanitarian Board & Network, Golden rice project, Retrieved: http://www.goldenrice.org/index.php. Access: 15.09.2012.
12. Gottlieb, S. and Wheeler, M.B. (2011). Genetically
and Animal Welfare. Biotechnology Industry
Organization. p.38.13.
2003. Cotton Facts. Retrieved: http://icac.org/ Access: 05.09.2012.
14. ISAAA, 2011. Global Status of Commercialized
Biotech/GM Crops. Retrieved: http://www.isaaa.org/resources/publications/briefs/43/executivesummary /default.asp. Access: 05.09.2012.
15.
No. 17; 43. ISAAA: Ithaca, NY.16.
Minsk: Tehnalogija. p.51. 17. Mishutkina, I.V, Kamionskaia, A.M, Skriabin, K.G.
(2010). Generation of sugar beet transgenic plants
119
Economic Science for Rural Development No. 32, 2013
ISSN 1691-3078
I. Aleksejeva
expressing bar gene. Prikl Biokhim Mikrobiol.; 46(1):pp. 89-95.
18. GM Food. Retrieved: http://www.
ncbe.reading.ac.uk/ncbe/gmfood/chymosin.html. Access: 17.09.2012.
19. Redenbaugh, K., Hiatt, B., Martineau, B., Kramer, M.,
(1992). Safety Assessment of Genetically Engineered
Tomato. CRC Press. p. 288.20.
and food. Washington: ILSI Press. p. 45.
21. Sarrouh, B., Santos, T.M., Miyoshi, A., Dias, R.
and Global Market. Bioprocessing &
Biotechniques, S:4.22.
23. Stipanovic, R.D. and Rathore, K. S. (2006). Engineering cottonseed for use in human nutrition
The National Academy of Sciences of the USA, Volume 103, No. 48 18054-18059.

Economic Science for Rural Development No. 32, 2013
ISSN 1691-3078
120
A. Valdemars, D. Atstaja Environmentally Friendly Transport Solutions
___________________________1 Tel.:+371 26535333, E-mail address: [email protected]
ENVIRONMENTALLY FRIENDLY TRANSPORT SOLUTIONS
Andris Valdemars1, Manager of Transport Fleet Renewal Department, Latvenergo AS;Dzintra Atstaja, Dr.oec., associate professor BA School of Business and Finance
Abstract. An effective transport system is a necessary part of modern life. Industry and commerce depend on it, and increasing use of the car has shaped today’s social and recreational lifestyles. The key sustainable development objective is to strike the right balance between the ability of transport to serve economic development and the ability to protect the environment and sustain quality of life, both now and in the future.The objective of this paper is to study indicators of environmentally friendly transport’s purchase and contributing
infrastructure, and information instruments that facilitate development of transport economy in Latvia. Analysis of
environment friendly solutions.
uniform policy and, as a result, each country has mainly its own initiative regarding the direction of environmentally friendly decision.Key words: indicators, transport, system, industry, EU.JEL code: L62, L91
IntroductionAn effective transport system is a necessary part of
modern life. Industry and commerce depend on it, and increasing use of a car has shaped today’s social and recreational lifestyles. The key sustainable development objective is to strike the right balance between the ability of transport to serve economic development and the ability to protect the environment and sustain quality of life, both now and in the future.
Economic activity always affects the environment, but the potential degree of this impact a lot depends on
carbon economy. Businesses that can turn this challenge into an opportunity, by developing business models to enable adoption of low carbon solutions, will be in a stronger position to mitigate rising carbon emissions and adapt to the world dealing with the impacts of climate change (SMART 2020, 2012). A radical approach is required that incorporates different ways of thinking, living, working, playing, doing business, and developing solutions. Action is no longer an option; it has become an urgent necessity.
The objective of this paper is to study indicators of environmentally friendly transport’s purchase and contributing socio-economic factors of its popularity, to
integration of environmentally friendly solutions into the
and society, then statistical data are analysed and society
for environment friendly transport solutions in Latvia
are stated. Statistical data of Latvia and Europe, the European Automobile Manufacturers Association (EAMA)
and data of other sources are used in the work.
Research results and discussions1. The concept of environment friendly transport sector
In the context of this research, environment friendly branches of the economy (include transport sector) are those with the lowest consumption of resources and those that create the minimal possible damage (pollution) to environment (Atstaja D. et al., 2011).
Sustainable transport refers to the broad subject of transport that is or approaches being sustainable. It includes vehicles, energy, infrastructure, roads, railways, airways, waterways, canals, pipelines, and terminals. Transport operations and logistics as well as transit-oriented development are involved. Transportation sustainability is largely being measured by transportation
Sustainable transport systems make a positive contribution to the environmental, social, and economic sustainability of the communities they serve. Transport systems exist to provide social and economic connections, and people quickly take up the opportunities offered by increased mobility (Schafer A., 1998).
transportation system as one that: — allows the basic access and development needs
of individuals, companies, and society to be met safely and in a manner consistent with human and
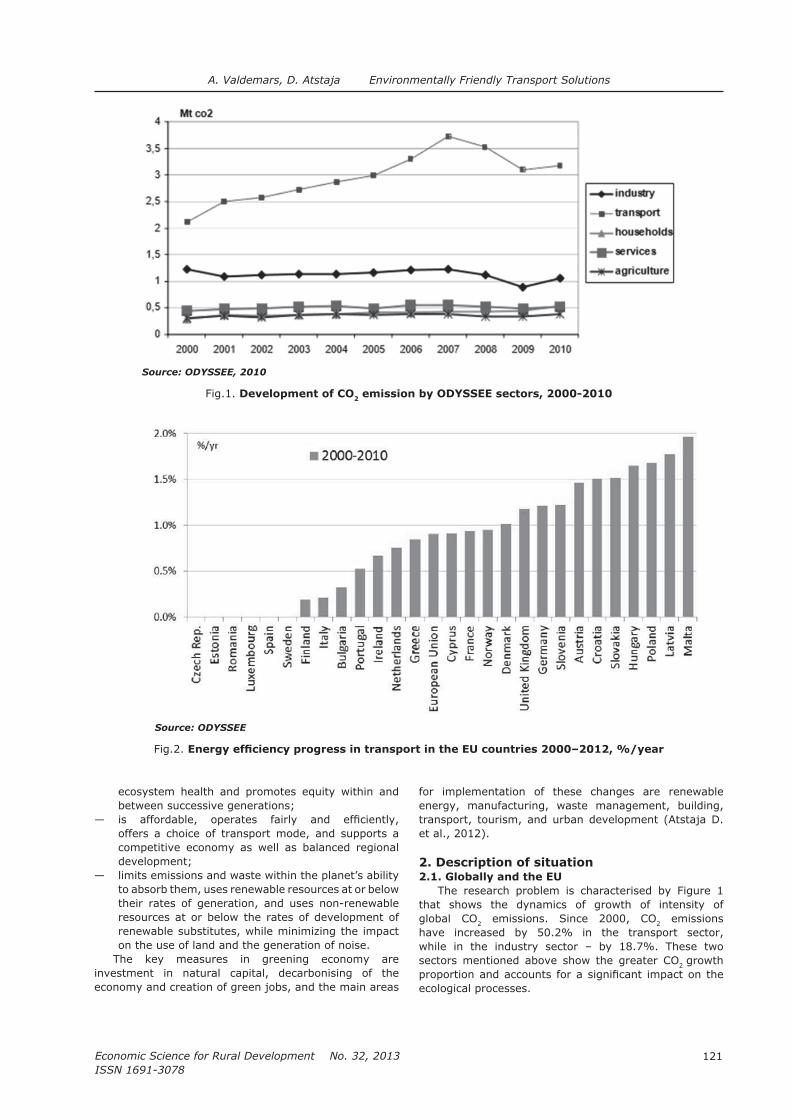
121
Economic Science for Rural Development No. 32, 2013
ISSN 1691-3078
A. Valdemars, D. Atstaja Environmentally Friendly Transport Solutions
Source: ODYSSEE, 2010
Fig.1. Development of CO2 emission by ODYSSEE sectors, 2000-2010
Source: ODYSSEE
Fig.2.
ecosystem health and promotes equity within and between successive generations;
—offers a choice of transport mode, and supports a competitive economy as well as balanced regional development;
— limits emissions and waste within the planet’s ability to absorb them, uses renewable resources at or below their rates of generation, and uses non-renewable resources at or below the rates of development of
on the use of land and the generation of noise.The key measures in greening economy are
investment in natural capital, decarbonising of the economy and creation of green jobs, and the main areas
for implementation of these changes are renewable energy, manufacturing, waste management, building, transport, tourism, and urban development (Atstaja D. et al., 2012).
2. Description of situation 2.1. Globally and the EU
The research problem is characterised by Figure 1 that shows the dynamics of growth of intensity of
2 2 emissions have increased by 50.2% in the transport sector, while in the industry sector – by 18.7%. These two
2 growth
ecological processes.
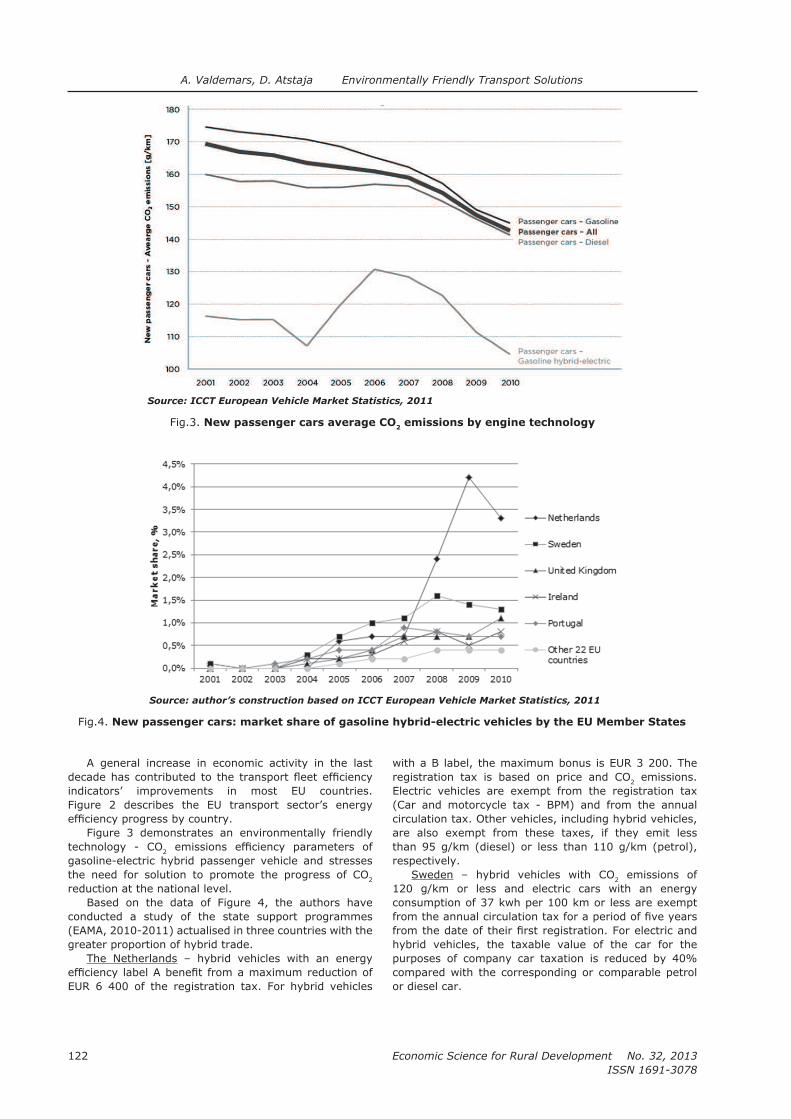
Economic Science for Rural Development No. 32, 2013
ISSN 1691-3078
122
A. Valdemars, D. Atstaja Environmentally Friendly Transport Solutions
A general increase in economic activity in the last
indicators’ improvements in most EU countries. Figure 2 describes the EU transport sector’s energy
Figure 3 demonstrates an environmentally friendly
2
gasoline-electric hybrid passenger vehicle and stresses
2 reduction at the national level.
Based on the data of Figure 4, the authors have conducted a study of the state support programmes (EAMA, 2010-2011) actualised in three countries with the greater proportion of hybrid trade.
The Netherlands – hybrid vehicles with an energy
EUR 6 400 of the registration tax. For hybrid vehicles
with a B label, the maximum bonus is EUR 3 200. The
2 emissions. Electric vehicles are exempt from the registration tax
circulation tax. Other vehicles, including hybrid vehicles, are also exempt from these taxes, if they emit less than 95 g/km (diesel) or less than 110 g/km (petrol), respectively.
Sweden 2 emissions of 120 g/km or less and electric cars with an energy consumption of 37 kwh per 100 km or less are exempt
hybrid vehicles, the taxable value of the car for the purposes of company car taxation is reduced by 40% compared with the corresponding or comparable petrol or diesel car.
Fig.4. New passenger cars: market share of gasoline hybrid-electric vehicles by the EU Member States
Fig.3. New passenger cars average CO2 emissions by engine technology
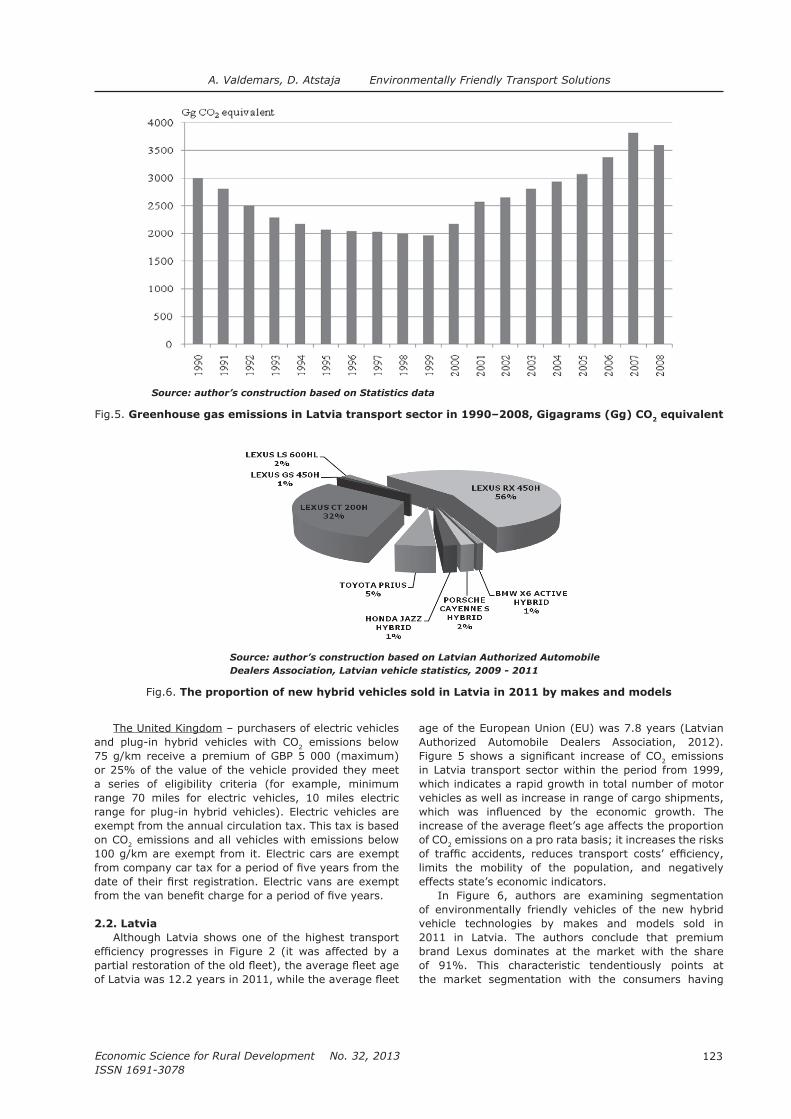
123
Economic Science for Rural Development No. 32, 2013
ISSN 1691-3078
A. Valdemars, D. Atstaja Environmentally Friendly Transport Solutions
The United Kingdom – purchasers of electric vehicles
2 emissions below 75 g/km receive a premium of GBP 5 000 (maximum) or 25% of the value of the vehicle provided they meet a series of eligibility criteria (for example, minimum range 70 miles for electric vehicles, 10 miles electric range for plug-in hybrid vehicles). Electric vehicles are exempt from the annual circulation tax. This tax is based
2 emissions and all vehicles with emissions below 100 g/km are exempt from it. Electric cars are exempt
2.2. Latvia
Although Latvia shows one of the highest transport
Source: author’s construction based on Statistics data
Fig.5. Greenhouse gas emissions in Latvia transport sector in 1990–2008, Gigagrams (Gg) CO2 equivalent
age of the European Union (EU) was 7.8 years (Latvian
2 emissions in Latvia transport sector within the period from 1999, which indicates a rapid growth in total number of motor vehicles as well as increase in range of cargo shipments,
2 emissions on a pro rata basis; it increases the risks
limits the mobility of the population, and negatively effects state’s economic indicators.
In Figure 6, authors are examining segmentation of environmentally friendly vehicles of the new hybrid vehicle technologies by makes and models sold in 2011 in Latvia. The authors conclude that premium brand Lexus dominates at the market with the share of 91%. This characteristic tendentiously points at the market segmentation with the consumers having
Fig.6. The proportion of new hybrid vehicles sold in Latvia in 2011 by makes and models

Economic Science for Rural Development No. 32, 2013
ISSN 1691-3078
124
A. Valdemars, D. Atstaja Environmentally Friendly Transport Solutions
high incomes and, relatively lower price brackets’
purchase or service.
The popularity of environment-friendly transport in Latvia is on average lower than in the EU countries, the main reason for which might be the overall economic situation in the country as well as the legislation and
promotion of green technology’s application.
2010) is applied to the vehicles during their initial
2 emissions. In the view of authors, the annual tax calculation is discouraging to the environmentally friendly vehicles’ users, because
been measured in the process of rates’ calculations, while parameters such as gross weight, engine’s capacity, and maximum engine’s power of the hybrid vehicles, in comparison with traditional analogues’ technology, are inversely proportional to fuel’s consumption and indices
policy does not stimulate the change of public opinion about the choice of environmentally friendly technology in the long term, meanwhile European auto makers therefore support taxation for passenger cars that is
2 emissions, technologically
3. Research of public opinion and data modelling
In order to clarify public opinion on the environmentally friendly vehicles and to explore the socio-economic factors that affect their acquisition, the authors conducted a comparison between two studies – the survey among
conducted by the research agency Accenture and the
SEB Bank in 2011 (Accenture, 2012; SEB, 2011). As a result, authors concluded the following.
— The largest proportion among survey respondents, to whom driving habits’ impact on the environment is important, is economically active population with higher education.
— The Baltic States’ population is less concerned on the preservation of the environment and quantity
2 emissions, respectively. Lower purchase’s price and/or lower fuel’s consumption are critical factors in the selection of a new vehicle in the Baltic
viewed car market and cause of low proportion of environmentally friendly vehicle’s purchase).
— The factors of road taxes, duties, and special parking availability are an essential part to the potential buyers of environmentally friendly vehicles of government support’s instruments.
Based on the comparative results of the study, the authors identify characteristics of environmentally friendly transport’s consumer groups in the Baltic States - with secondary or higher education, who are economically active, with the age over 40, with incomes above average and higher, and with the inelastic response to the overall price increases.
The authors conclude that characteristics of the aforementioned consumer groups can be explained by the tendencies displayed in Figure 6, and that the proportion of consumers who prefer environmentally friendly vehicles has minor effect on substantial decrease of greenhouse
legislation are not effective enough to motivate other consumer groups, which make it necessary to look for new solutions on the macro-economical level.
According to the massive entry of environment-friendly technologies in the transport industry, the
processes and model the changes of the impact on the related industries. The aim of the modelling is not to
Table 1 Impact of environmentally friendly transport solutions on economy
Factor Type of impact Necessary adjustments Result
Sustainable tax
policy implementation
and simplifying
support mechanisms:
1) Declining of collected transport taxes; 2) rising
costs of tax administration;
1) Applicable tax shall be calculated proportionally to
the source of pollution; 2) the tax revenue from the EU support funds should be
offset;
1) The society is motivated to use environment-friendly
technologies; 2) growing demand for environmentally
friendly cars.
Trade tends to
increase the average
purchase price of a
car:
1) Reduce the purchasing
businesses in other sectors;
1) New customer
mechanism should be created;
1) The emergence of new
vehicles offer may appear.
Maintenance area will
reduce fuel demand:
1) Declining tax and related tax revenue; related tax policy;
1) The tax burden is proportional to the pollution
source.
Changing technology
in after-sales service
industry:
1) Perhaps structural unemployment and the
1) Additional investment in new equipment and
staff retraining should be attracted;
1) Increase in the cost of
2) merchants lower liquidity.
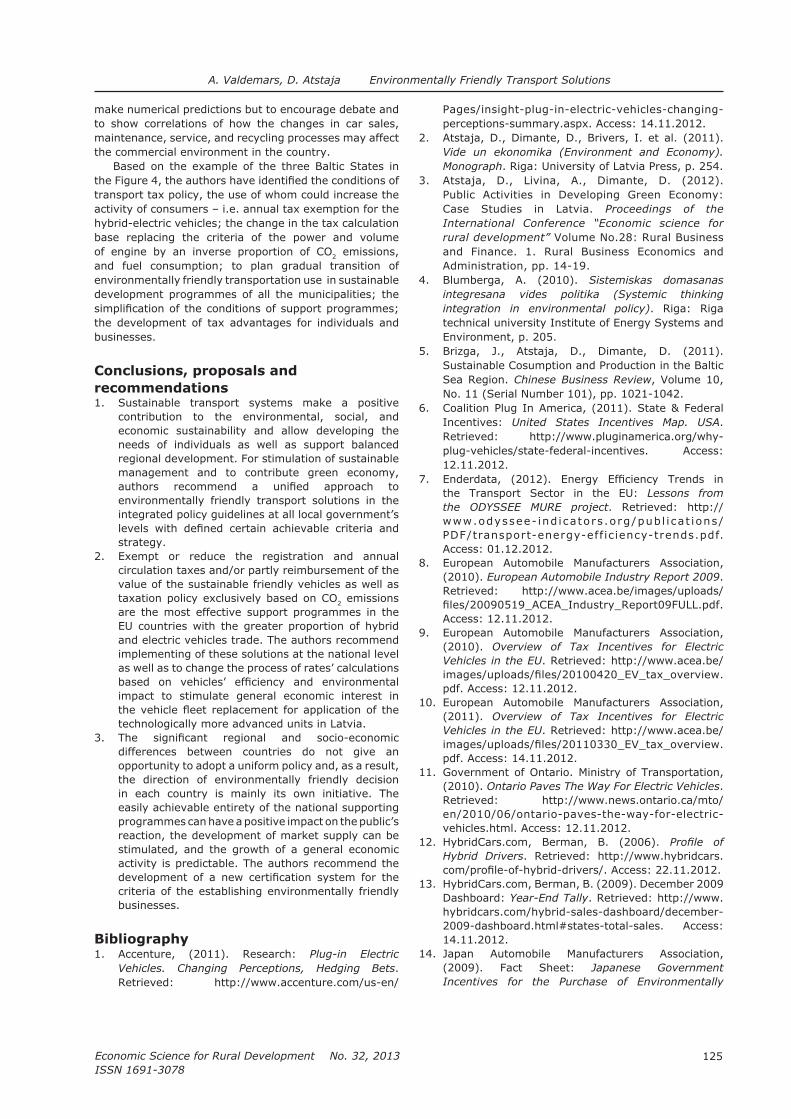
125
Economic Science for Rural Development No. 32, 2013
ISSN 1691-3078
A. Valdemars, D. Atstaja Environmentally Friendly Transport Solutions
make numerical predictions but to encourage debate and to show correlations of how the changes in car sales, maintenance, service, and recycling processes may affect the commercial environment in the country.
Based on the example of the three Baltic States in
transport tax policy, the use of whom could increase the activity of consumers – i.e. annual tax exemption for the hybrid-electric vehicles; the change in the tax calculation base replacing the criteria of the power and volume
2 emissions, and fuel consumption; to plan gradual transition of environmentally friendly transportation use in sustainable development programmes of all the municipalities; the
the development of tax advantages for individuals and businesses.
Conclusions, proposals and
recommendations1. Sustainable transport systems make a positive
contribution to the environmental, social, and economic sustainability and allow developing the needs of individuals as well as support balanced regional development. For stimulation of sustainable management and to contribute green economy,
environmentally friendly transport solutions in the integrated policy guidelines at all local government’s
strategy. 2. Exempt or reduce the registration and annual
circulation taxes and/or partly reimbursement of the value of the sustainable friendly vehicles as well as
2 emissions are the most effective support programmes in the EU countries with the greater proportion of hybrid and electric vehicles trade. The authors recommend implementing of these solutions at the national level as well as to change the process of rates’ calculations
impact to stimulate general economic interest in
technologically more advanced units in Latvia.3.
differences between countries do not give an opportunity to adopt a uniform policy and, as a result, the direction of environmentally friendly decision in each country is mainly its own initiative. The easily achievable entirety of the national supporting programmes can have a positive impact on the public’s reaction, the development of market supply can be stimulated, and the growth of a general economic activity is predictable. The authors recommend the
criteria of the establishing environmentally friendly businesses.
Bibliography1. Accenture, (2011). Research: Plug-in Electric
Vehicles. Changing Perceptions, Hedging Bets. Retrieved: http://www.accenture.com/us-en/
Pages/insight-plug-in-electric-vehicles-changing-perceptions-summary.aspx. Access: 14.11.2012.
2. Atstaja, D., Dimante, D., Brivers, I. et al. (2011). Vide un ekonomika (Environment and Economy).
Monograph. Riga: University of Latvia Press, p. 254.3. Atstaja, D., Livina, A., Dimante, D. (2012).
Public Activities in Developing Green Economy: Proceedings of the
International Conference “Economic science for
rural development” Volume No.28: Rural Business and Finance. 1. Rural Business Economics and Administration, pp. 14-19.
4. Blumberga, A. (2010). Sistemiskas domasanas
integresana vides politika (Systemic thinking
integration in environmental policy). Riga: Riga technical university Institute of Energy Systems and Environment, p. 205.
5.
Sea Region. Chinese Business Review, Volume 10, No. 11 (Serial Number 101), pp. 1021-1042.
6. Incentives: United States Incentives Map. USA. Retrieved: http://www.pluginamerica.org/why-plug-vehicles/state-federal-incentives. Access: 12.11.2012.
7. in the Transport Sector in the EU: Lessons from
the ODYSSEE MURE project. Retrieved: http://www.odyssee- ind icators .org/pub l i cat ions/PDF/transport-energy-eff ic iency-trends.pdf. Access: 01.12.2012.
8. European Automobile Manufacturers Association, (2010). European Automobile Industry Report 2009. Retrieved: http://www.acea.be/images/uploads/
. Access: 12.11.2012.
9. European Automobile Manufacturers Association, (2010). Overview of Tax Incentives for Electric
Vehicles in the EU. Retrieved: http://www.acea.be/
pdf. Access: 12.11.2012.10. European Automobile Manufacturers Association,
(2011). Overview of Tax Incentives for Electric
Vehicles in the EU. Retrieved: http://www.acea.be/
pdf. Access: 14.11.2012.11. Government of Ontario. Ministry of Transportation,
(2010). Ontario Paves The Way For Electric Vehicles. Retrieved: http://www.news.ontario.ca/mto/en/2010/06/ontario-paves-the-way-for-electric-vehicles.html. Access: 12.11.2012.
12. Hybrid Drivers. Retrieved: http://www.hybridcars.
. Access: 22.11.2012. 13.
Dashboard: Year-End Tally. Retrieved: http://www.hybridcars.com/hybrid-sales-dashboard/december-2009-dashboard.html#states-total-sales. Access: 14.11.2012.
14. Japan Automobile Manufacturers Association, (2009). Fact Sheet: Japanese Government
Incentives for the Purchase of Environmentally

Economic Science for Rural Development No. 32, 2013
ISSN 1691-3078
126
A. Valdemars, D. Atstaja Environmentally Friendly Transport Solutions
Friendly Vehicles. Retrieved: http://jama.org/pdf/FactSheet10-2009-09-24.pdf. Access: 10.11.2012.
15. Japan Automobile Manufacturers Association, (2010). The Motor Industry of Japan 2010. Retrieved: http://www.jama-english.jp/publications/MIJ2010.pdf. Access: 12.11.2012.
16.
and Metrics, Journal of infrastructure systems, pp. 31-50.
17. (2011). Latvian vehicle statistics, year 2009 - 2011. Retrieved: http://www.lpaa.lv/lv/statistika/latvija. Access: 12.11.2012.
18. Ministry of Environmental Protection and Regional Development, (2012). Information for press: Coming
for electric cars. Retrieved: http://www.varam.. Access:
12.11.2012. 19. Nordea Finance Latvia Ltd. (2010). Publication:
Nordea Leasing will Support the Purchase of a Hybrid
Car. Retrieved: http://www.nordea.lv/Par+Nordea/
1435382.html. Access: 12.11.2012.20.
Edenhofer, B.Hare (Australia), L. Kuijpers, M.
Mitigation. Contribution of Working
Group III to the Fourth Assessment Report of
the Intergovernmental Panel on Climate Change
[B. Metz, O.R. Davidson, P.R. Bosch, R. Dave,
L.A. Meyer (eds)]
pp. 97-116, 324-381.21.
Transportation Research A 32(6), pp. 455-477.
22. SEB bank, (2011). Press Release: The Research:
90% Driving a Car is an Important Purchase Price,
instead of a car for the Environment. Retrieved:
http://www.seb.lv/lv/about/press-centre/press-releases/y2011/new-jan/17102011kj/. Access: 12.12.2012.
23. Statistics Database, (2012). Merchants
(commercial) Net Turnover by Type of Activity
(in millions of lats). Retrieved: http://www.
f i n a n s e s - g a l v e n i e - r a d i t a j i - 3 0 3 0 9 . h t m l . Access: 10.11.2012.
24. Swedbank, Strautins, P. (2009). Look at the
Opportunities, Risks and Solutions Latvian Energy. Retrieved: h t t p : / /www. swedbank . l v / l i b / l v /energetika.pdf. Access: 11.11.2012.
25. Initiative (2008). Report: SMART 2020: Enabling
the Low Carbon Economy in the Information Age. Retrieved: 02_Smart2020Report.pdf. Access: 12.12.2012.
26. the European Union, (2009). Regulation: (EK)
Nr. 443/2009 (2009-04-23), which, as part of the
Community’s integrated approach to reduce CO2
emissions from light-duty vehicles, setting emission
performance standards for new passenger cars. Retrieved: http://eur-lex.europa.eu/LexUriServ/LexUriServ.do?uri=OJ:L:2009:140:0001:01:LV:HTML. Access: 10.11.2012.
27. European Union, (2009). Directive: 2009/33/
road transport vehicles promotion. Retrieved: http://eur-lex.europa.eu/LexUriServ/LexUriServ.do?ur i=OJ:L:2009:120:0005:01:LV:HTML. Access: 12.11.2012.
28. The Parliament of the Republic of Latvia, (2009). Law on Car and Motorcycle Tax. Retrieved: http://www.likumi.lv/doc.php?id=81065. 20.12.2012.
29. The Parliament of the Republic of Latvia, (2010). Law on the Vehicle Operation Tax and Company
Car Tax. Retrieved: http://www.likumi.lv/doc.php?id=223536. Access: 20.12.2012.
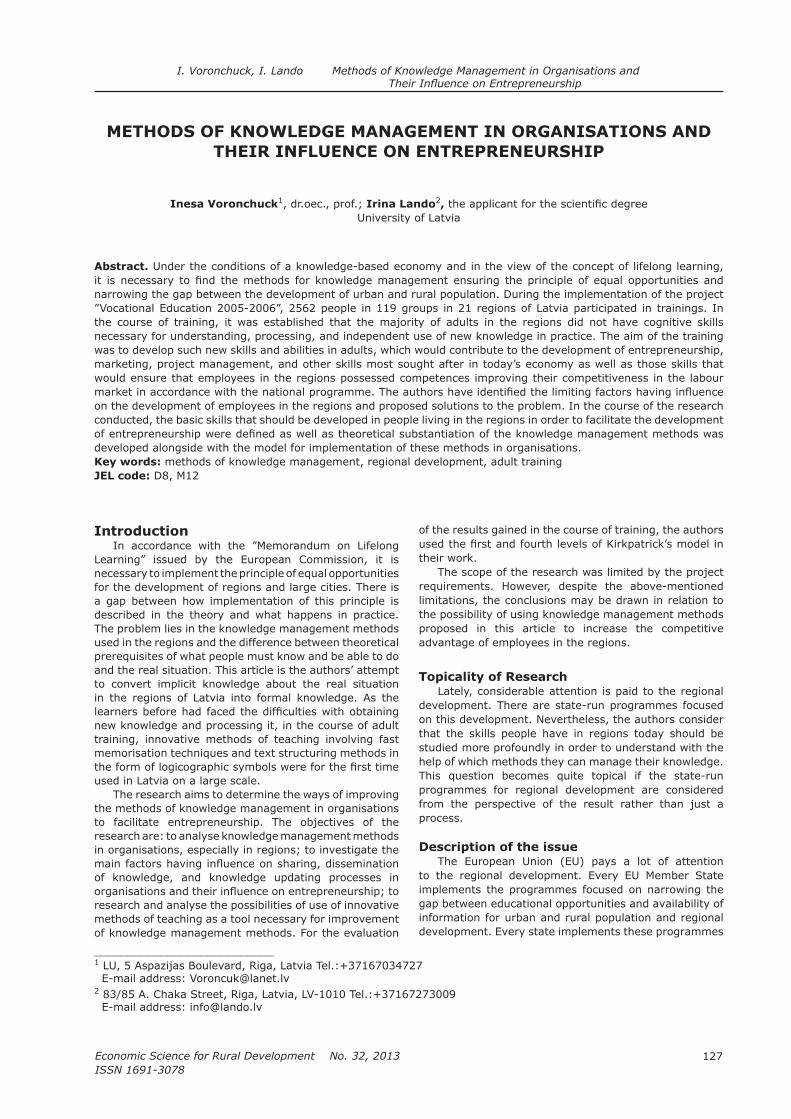
127
Economic Science for Rural Development No. 32, 2013
ISSN 1691-3078
I. Voronchuck, I. Lando Methods of Knowledge Management in Organisations and
___________________________1 E-mail address: [email protected] 83/85 E-mail address: [email protected]
METHODS OF KNOWLEDGE MANAGEMENT IN ORGANISATIONS AND THEIR INFLUENCE ON ENTREPRENEURSHIP
Inesa Voronchuck1, dr.oec., prof.; Irina Lando2,
University of Latvia
Abstract. Under the conditions of a knowledge-based economy and in the view of the concept of lifelong learning,
narrowing the gap between the development of urban and rural population. During the implementation of the project
the course of training, it was established that the majority of adults in the regions did not have cognitive skills necessary for understanding, processing, and independent use of new knowledge in practice. The aim of the training was to develop such new skills and abilities in adults, which would contribute to the development of entrepreneurship, marketing, project management, and other skills most sought after in today’s economy as well as those skills that would ensure that employees in the regions possessed competences improving their competitiveness in the labour
on the development of employees in the regions and proposed solutions to the problem. In the course of the research conducted, the basic skills that should be developed in people living in the regions in order to facilitate the development
developed alongside with the model for implementation of these methods in organisations. Key words: methods of knowledge management, regional development, adult trainingJEL code: D8, M12
Introduction
necessary to implement the principle of equal opportunities for the development of regions and large cities. There is a gap between how implementation of this principle is described in the theory and what happens in practice. The problem lies in the knowledge management methods used in the regions and the difference between theoretical prerequisites of what people must know and be able to do and the real situation. This article is the authors’ attempt to convert implicit knowledge about the real situation in the regions of Latvia into formal knowledge. As the
new knowledge and processing it, in the course of adult training, innovative methods of teaching involving fast memorisation techniques and text structuring methods in
used in Latvia on a large scale. The research aims to determine the ways of improving
the methods of knowledge management in organisations to facilitate entrepreneurship. The objectives of the research are: to analyse knowledge management methods in organisations, especially in regions; to investigate the
of knowledge, and knowledge updating processes in
research and analyse the possibilities of use of innovative methods of teaching as a tool necessary for improvement of knowledge management methods. For the evaluation
of the results gained in the course of training, the authors usetheir work.
The scope of the research was limited by the project requirements. However, despite the above-mentioned limitations, the conclusions may be drawn in relation to the possibility of using knowledge management methods proposed in this article to increase the competitive advantage of employees in the regions.
Topicality of Research
Lately, considerable attention is paid to the regional development. There are state-run programmes focused on this development. Nevertheless, the authors consider that the skills people have in regions today should be studied more profoundly in order to understand with the help of which methods they can manage their knowledge. This question becomes quite topical if the state-run programmes for regional development are considered from the perspective of the result rather than just a process.
Description of the issue The European Union (EU) pays a lot of attention
to the regional development. Every EU Member State implements the programmes focused on narrowing the gap between educational opportunities and availability of information for urban and rural population and regional development. Every state implements these programmes
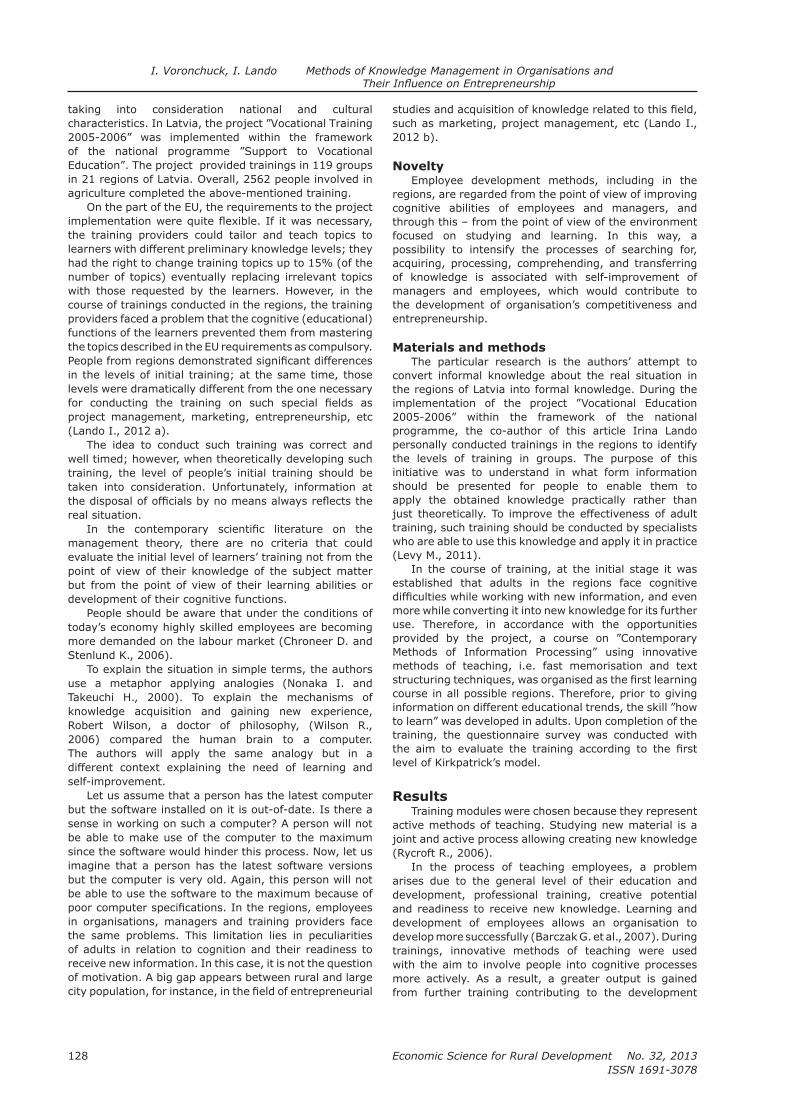
Economic Science for Rural Development No. 32, 2013
ISSN 1691-3078
128
I. Voronchuck, I. Lando Methods of Knowledge Management in Organisations and
taking into consideration national and cultural
in 21 regions of Latvia. Overall, 2562 people involved in agriculture completed the above-mentioned training.
On the part of the EU, the requirements to the project
the training providers could tailor and teach topics to learners with different preliminary knowledge levels; they had the right to change training topics up to 15% (of the number of topics) eventually replacing irrelevant topics with those requested by the learners. However, in the course of trainings conducted in the regions, the training providers faced a problem that the cognitive (educational) functions of the learners prevented them from mastering the topics described in the EU requirements as compulsory.
in the levels of initial training; at the same time, those levels were dramatically different from the one necessary
project management, marketing, entrepreneurship, etc (Lando I., 2012 a).
The idea to conduct such training was correct and well timed; however, when theoretically developing such training, the level of people’s initial training should be taken into consideration. Unfortunately, information at
real situation.
management theory, there are no criteria that could evaluate the initial level of learners’ training not from the point of view of their knowledge of the subject matter but from the point of view of their learning abilities or development of their cognitive functions.
People should be aware that under the conditions of today’s economy highly skilled employees are becoming
Stenlund K., 2006). To explain the situation in simple terms, the authors
use a metaphor applying analogies (Nonaka I. and Takeuchi H., 2000). To explain the mechanisms of knowledge acquisition and gaining new experience, Robert Wilson, a doctor of philosophy, (Wilson R., 2006) compared the human brain to a computer. The authors will apply the same analogy but in a different context explaining the need of learning and self-improvement.
Let us assume that a person has the latest computer but the software installed on it is out-of-date. Is there a sense in working on such a computer? A person will not be able to make use of the computer to the maximum since the software would hinder this process. Now, let us imagine that a person has the latest software versions but the computer is very old. Again, this person will not be able to use the software to the maximum because of
in organisations, managers and training providers face the same problems. This limitation lies in peculiarities of adults in relation to cognition and their readiness to receive new information. In this case, it is not the question of motivation. A big gap appears between rural and large
such as marketing, project management, etc (Lando I., 2012 b).
NoveltyEmployee development methods, including in the
regions, are regarded from the point of view of improving cognitive abilities of employees and managers, and through this – from the point of view of the environment focused on studying and learning. In this way, a possibility to intensify the processes of searching for, acquiring, processing, comprehending, and transferring of knowledge is associated with self-improvement of managers and employees, which would contribute to the development of organisation’s competitiveness and entrepreneurship.
Materials and methodsThe particular research is the authors’ attempt to
convert informal knowledge about the real situation in the regions of Latvia into formal knowledge. During the
programme, the co-author of this article Irina Lando personally conducted trainings in the regions to identify the levels of training in groups. The purpose of this initiative was to understand in what form information should be presented for people to enable them to apply the obtained knowledge practically rather than just theoretically. To improve the effectiveness of adult training, such training should be conducted by specialists who are able to use this knowledge and apply it in practice (Levy M., 2011).
In the course of training, at the initial stage it was established that adults in the regions face cognitive
more while converting it into new knowledge for its further use. Therefore, in accordance with the opportunities
methods of teaching, i.e. fast memorisation and text
course in all possible regions. Therefore, prior to giving
training, the questionnaire survey was conducted with
level of Kirkpatrick’s model.
ResultsTraining modules were chosen because they represent
active methods of teaching. Studying new material is a joint and active process allowing creating new knowledge (Rycroft R., 2006).
In the process of teaching employees, a problem arises due to the general level of their education and development, professional training, creative potential and readiness to receive new knowledge. Learning and development of employees allows an organisation to
trainings, innovative methods of teaching were used with the aim to involve people into cognitive processes more actively. As a result, a greater output is gained from further training contributing to the development
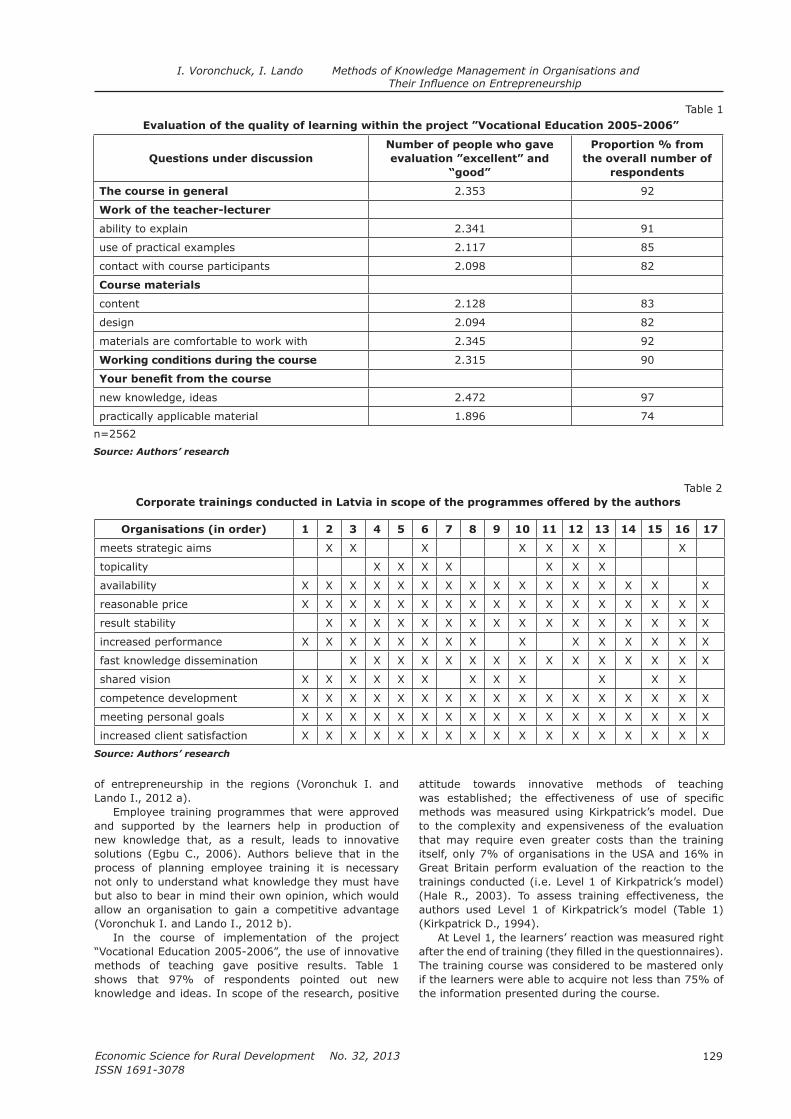
129
Economic Science for Rural Development No. 32, 2013
ISSN 1691-3078
I. Voronchuck, I. Lando Methods of Knowledge Management in Organisations and
of entrepreneurship in the regions (Voronchuk I. and Lando I., 2012 a).
Employee training programmes that were approved and supported by the learners help in production of new knowledge that, as a result, leads to innovative
process of planning employee training it is necessary not only to understand what knowledge they must have but also to bear in mind their own opinion, which would allow an organisation to gain a competitive advantage (Voronchuk I. and Lando I., 2012 b).
In the course of implementation of the project
methods of teaching gave positive results. Table 1 shows that 97% of respondents pointed out new knowledge and ideas. In scope of the research, positive
attitude towards innovative methods of teaching
methods was measured using Kirkpatrick’s model. Due to the complexity and expensiveness of the evaluation that may require even greater costs than the training itself, only 7% of organisations in the USA and 16% in Great Britain perform evaluation of the reaction to the trainings conducted (i.e. Level 1 of Kirkpatrick’s model) (Hale R., 2003). To assess training effectiveness, the authors used Level 1 of Kirkpatrick’s model (Table 1) (Kirkpatrick D., 1994).
At Level 1, the learners’ reaction was measured right
The training course was considered to be mastered only if the learners were able to acquire not less than 75% of the information presented during the course.
Table 1 Evaluation of the quality of learning within the project ”Vocational Education 2005-2006”
Questions under discussion
Number of people who gave
evaluation ”excellent” and
“good”
Proportion % from
the overall number of
respondents
The course in general 2.353 92
Work of the teacher-lecturer
ability to explain 2.341 91
use of practical examples 2.117 85
contact with course participants 2.098 82
Course materials
content 2.128 83
design 2.094 82
materials are comfortable to work with 2.345 92
Working conditions during the course 2.315 90
new knowledge, ideas 2.472 97
practically applicable material 1.896 74
n=2562
Source: Authors’ research
Table 2Corporate trainings conducted in Latvia in scope of the programmes offered by the authors
Organisations (in order) 1 2 3 4 5 6 7 8 9 10 11 12 13 14 15 16 17
meets strategic aims X X X X X X X X
topicality X X X X X X X
availability X X X X X X X X X X X X X X X X
reasonable price X X X X X X X X X X X X X X X X X
result stability X X X X X X X X X X X X X X X X
increased performance X X X X X X X X X X X X X X X
fast knowledge dissemination X X X X X X X X X X X X X X X
shared vision X X X X X X X X X X X X
competence development X X X X X X X X X X X X X X X X X
meeting personal goals X X X X X X X X X X X X X X X X X
increased client satisfaction X X X X X X X X X X X X X X X X X
Source: Authors’ research
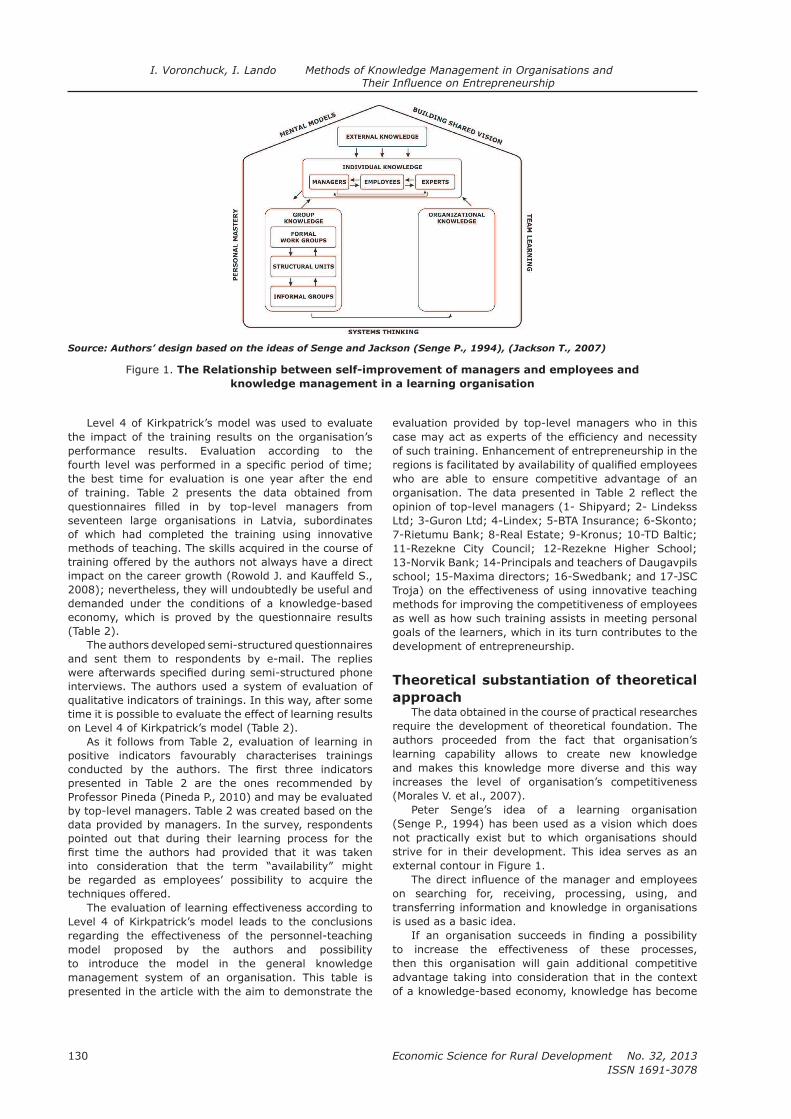
Economic Science for Rural Development No. 32, 2013
ISSN 1691-3078
130
I. Voronchuck, I. Lando Methods of Knowledge Management in Organisations and
Level 4 of Kirkpatrick’s model was used to evaluate the impact of the training results on the organisation’s performance results. Evaluation according to the
the best time for evaluation is one year after the end of training. Table 2 presents the data obtained from questioseventeen large organisations in Latvia, subordinates of which had completed the training using innovative methods of teaching. The skills acquired in the course of training offered by the authors not always have a direct impact on the career growth (Rowold J. and Kauffeld S., 2008); nevertheless, they will undoubtedly be useful and demanded under the conditions of a knowledge-based economy, which is proved by the questionnaire results (Table 2).
The authors developed semi-structured questionnaires and sent them to respondents by e-mail. The replies
interviews. The authors used a system of evaluation of qualitative indicators of trainings. In this way, after some time it is possible to evaluate the effect of learning results on Level 4 of Kirkpatrick’s model (Table 2).
As it follows from Table 2, evaluation of learning in positive indicators favourably characterises trainings
presented in Table 2 are the ones recommended by Professor Pineda (Pineda P., 2010) and may be evaluated by top-level managers. Table 2 was created based on the data provided by managers. In the survey, respondents pointed out that during their learning process for the
be regarded as employees’ possibility to acquire the techniques offered.
The evaluation of learning effectiveness according to Level 4 of Kirkpatrick’s model leads to the conclusions regarding the effectiveness of the personnel-teaching model proposed by the authors and possibility to introduce the model in the general knowledge management system of an organisation. This table is presented in the article with the aim to demonstrate the
evaluation provided by top-level managers who in this
of such training. Enhancement of entrepreneurship in the
who are able to ensure competitive advantage of an
opinion of top-level managers (1- Shipyard; 2- Lindekss Ltd; 3-Guron Ltd; 4-Lindex; 5-BTA Insurance; 6-Skonto; 7-Rietumu Bank; 8-Real Estate; 9-Kronus; 10-TD Baltic;
13-Norvik Bank; 14-Principals and teachers of Daugavpils
Troja) on the effectiveness of using innovative teaching methods for improving the competitiveness of employees as well as how such training assists in meeting personal goals of the learners, which in its turn contributes to the development of entrepreneurship.
Theoretical substantiation of theoretical
approach The data obtained in the course of practical researches
require the development of theoretical foundation. The authors proceeded from the fact that organisation’s learning capability allows to create new knowledge and makes this knowledge more diverse and this way increases the level of organisation’s competitiveness (Morales V. et al., 2007).
Peter Senge’s idea of a learning organisation (Senge P., 1994) has been used as a vision which does not practically exist but to which organisations should strive for in their development. This idea serves as an external contour in Figure 1.
on searching for, receiving, processing, using, and transferring information and knowledge in organisations is used as a basic idea.
to increase the effectiveness of these processes, then this organisation will gain additional competitive advantage taking into consideration that in the context of a knowledge-based economy, knowledge has become
Figure 1. The Relationship between self-improvement of managers and employees and
knowledge management in a learning organisation

131
Economic Science for Rural Development No. 32, 2013
ISSN 1691-3078
I. Voronchuck, I. Lando Methods of Knowledge Management in Organisations and
the most crucial asset for organisations (Grant R.,
work and the employees’ attitude towards knowledge (Jeroen P. et al., 2007). In this context, a two-sided process of converting individual knowledge into group knowledge and vice versa should be considered (Jackson T., 2007).
through communication encouraging the subordinates’ self-improvement, if the manager him/herself is focused on constant enhancement of his/her level of development (Krause D., 2004). If a manager has skills of fast information processing, he/she will be interested in his/her colleagues having the same skills, since by letting knowledge and information pass through them, the subordinates and colleagues share the knowledge and information with their supervisors. Manager’s self-improvement has a positive effect on the overall division, subdivision, and organisation. In the process of evaluation the work with knowledge, it is necessary to be aware of the fact that knowledge obtains its value only if it is used by employees in an organisation and, particularly, if it is
quite often face cognitive (educational) limitations of employees, i.e. a problem related to limitations of the employees’ abilities to receive and perceive new knowledge and information. These limitations may have a considerable effect on the understanding of information and knowledge in a more complicated context (Hinds P. and Pfeffer J., 2003). Manager who is constantly engaged in self-improvement will create an environment focused on self-improvement in his/her division, subdivision, and organisation. On the other hand, individual characteristics of any employee should be taken into consideration since there is a possibility to multiply knowledge in organisations
the expense of employees and their individual knowledge
(Tonnessen T., 2005). The importance of discovering and developing new methods that could be used in different organisations and that would be effective in the work with knowledge may be spoken of herein (Lambe P., 2011).
An important knowledge management method, i.e. the social constructivism approach, regards an organisation
we may consider a person as a part of a system who reacts to changes in the system in any case rather than works individually (Jackson T., 2007). Self-improvement of managers and employees will have a direct impact not only on the basic elements of the model of a learning organisation but also on the use and production of new knowledge in an organisation.
propose to use such innovative methods of personnel teaching as knowledge management methods that may be introduced in the general personnel development system at any level or stage. To gain the maximum effectiveness in return for use of the innovative methods of teaching, they should be introduced at a stage that is before any other training or development (Figure 2). Figure 2 demonstrates a model for implementation of knowledge management methods.
Innovative methods serve as a basis for the whole further education and development where a person’s
limiting factor. According to the authors’ opinion, the arrows depict contemporary knowledge management methods in organisations. This model may be used both by organisation’s managers and by managers of divisions and subdivisions for self-improvement and development of their subordinates.
The authors propose to compare these methods with the foundation of a house that is not seen and the importance of which is hard to evaluate. However, if one
Source: Figure developed by the authors on the grounds of the conducted researches
Figure 2. Model for use of the knowledge management system in organisations
Economic Science for Rural Development No. 32, 2013
ISSN 1691-3078
132
I. Voronchuck, I. Lando Methods of Knowledge Management in Organisations and
storey house without strengthening the foundation, the house may either break down or remain standing. It can happen if one slightly increases the load. Yet, if one has
the old foundation will hardly bear this construction. The excellent quality of materials used in construction does not matter unless the foundation is duly strengthened; and knowledge management methods are implied in a similar way. This model allows developing new personnel competences that are in-demand under the conditions of a knowledge-based economy. These competences allow personnel to perform their work duties contributing to the organisation’s development in accordance with the strategy and to achieve business results.
DiscussionThe authors are aware that their claim may seem
rather bold. However, according to the authors, prior to investing large amounts of money into adult training,
Although innovative methods of teaching as a new tool are placed in the employees’ service, cognitive problems in adults still are noticeable, especially in the regions. Despite growing demand for highly skilled labour force, the concept of lifelong learning, state-run programmes, and the EU requirements, people living in the regions are not used to constantly improve
contribute to the creation of an environment inspiring self-improvement of employees. In this way, knowledge in organisations will increase in terms of quantity and improve in terms of quality and reusing thereof, which will facilitate the enhancement of the organisation’s competitiveness and contribute to the development of entrepreneurship.
Conclusions and proposals1) In the course of trainings conducted for adults
in the regions, it was established that adults lacked reasonable skills necessary for knowledge acquisition that would be a requisite for the development of entrepreneurship, for instance, for the sake of mastering the skills of marketing, project management, etc.
innovative teaching methods has been implemented in the regions to such an extent within one country (in 21 out of 24 regions of the Republic of Latvia).
3) To contribute to the development of entrepreneurship in the regions, people should have skills allowing them to quickly process information, learn something new and retrain improving both their personal and their organisation’s competitive advantage.
4) The article presents a theoretical substantiation of the necessity to apply new information processing skills alongside with the developed model for implementation of these skills in organisations that can be successfully used for regional development.
by the authors.
managers proved that improving of the knowledge management methods allows developing the skills
facilitating enhancement of entrepreneurship in employees and managers.
Bibliography1.
Determinants of IT usage and new product performance. Journal of Product Innovation
Management, Volume 24, Issue 6, pp.600-613.2.
an effective product development process: Towards a conceptual framework for process industry. International Journal of Innovation Management, Volume 10, Issue3, pp. 237-269.
3. DeLong, D. W. (2004). Lost Knowledge. Oxford University Press, New York: NY. p. 258.
4. capabilities-their importance and challenges for
Journal of
Technology Management in China, Volume 1, Issue 3, pp. 304-321.
5. Grant, R. M. (1996). Toward a knowledge-based theory of the Firm, Strategic Management Journal, Volume 17, pp. 109-122.
6. Hale, R. (2003). How training can add real value
Training, Volume 35, Issue 1, pp. 29 – 32.7. Hinds P., Pfeffer J., (2003). Why organizations don’t
‘know what they know’: Cognitive and motivational
factors affecting the transfer of expertise. In M. Ackerman, V. Pipek, and V. Wulf (Eds.). Beyond Knowledge Management: Sharing
8. Jackson, T. W. (2007), Applying autopoiesis to knowledge management in organisations, Journal
of Knowledge Management, Volume 11 Issue 3, pp. 78 – 91.
9. Kirkpatrick, D. L. (1994). Evaluating training
programs: The four levels
Berrett-Koehler Publishers, Inc. p.229.10.
as a determinant of the inclination to innovate and of innovation-related behaviours: an empirical investigation, Leadership Quarterly, Volume 15, Issue 1, pp. 79-102.
11. Lambe, P. (2011). The unacknowledged parentage of knowledge management. Journal of Knowledge
Management, Volume 15, Issue 2, pp. 175-197.12.
Knowledge communication and translation a knowledge transfer model, Journal of Knowledge
Management, Volume 13, Issue 3, pp. 118 – 131.13. Lando, I. (2012 a). Practical Use of Innovative
Methods of Instruction for Personnel Training from
Organisations. In: Proceedings of the Conference
„New Challenges of Economic and Business
Development – 2012“, University of Latvia, May 10-12, 2012. Riga: LU. - pp. 340-353.
14. Lando, I. (2012 b). The experience of implementation of the innovation training methods for adult training within the framework
Proceedings of the
133
Economic Science for Rural Development No. 32, 2013
ISSN 1691-3078
I. Voronchuck, I. Lando Methods of Knowledge Management in Organisations and
Conference on Project Management in the Baltic
Countries” Riga, Latvia, February 8-9, 2012 Riga: LU, pp. 125-135.
15. Journal of Knowledge
Management, Volume 15, Issue 4, pp. 582 – 600.16. Morales, V. J. G., Moreno, A. R., Montes, F. J. L.
(2007). Effects of technology absorptive capacity
learning, innovation and performance: an empirical examination. Technology Analysis &
Strategic Management, Volume 19, Issue 4, pp. 527-558.
17. Nonaka, I., Takeuchi, H. (2000). The knowledge-
creating company. Oxford University Press, New York, p.304.
18. Pineda, P. (2010), Evaluation of training in organisations: a proposal for an integrated model, Journal of European Industrial Training, Volume 34, Issue 7, pp. 673 – 693.
19. Rowold J., Kauffeld S., (2008). Effects of career-related continuous learning on competencies, Personnel review, Volume 38, Issue 1, pp. 90-101.
20. Rycroft, R. W. (2006). Time and technological innovation: Implications for public policy. Technology
in Society, Volume 28, pp. 281-301.21. Senge, P. (1994). The Fifth Discipline. The Art and
Practice of Learning. New York: Dowbleday. p. 432.22.
company wide employee participation, The TQM
Magazine, Volume 17, Issue 2, pp. 195 – 207.23.
of knowledge management system within the framework of adult learning for effective regional development. Journal of Social Sciences, Volume 2, Issue 7.
24. Voronchuk, I., Lando, I. (2012 b). Practical Use of Innovative Methods of Instruction for Personnel
Development in Organisations. In: Proceedings
of the 10th International Conference “Public
Administration in the 21st Century“, May 29-31, 2012, MSU, Moscow (Russia).
25. Wilson R. A., (2006). Psihologija evolucii [The
Psychology of Evolutions p. 304.
Economic Science for Rural Development No. 32, 2013
ISSN 1691-3078
134
V. Echeverry Cárdenas, B. Freytag-Leyer Corporate Social Responsibility Communication and The Food Industry
CORPORATE SOCIAL RESPONSIBILITY COMMUNICATION AND THE FOOD INDUSTRY
Valentina Echeverry Cárdenas, M. Sc. University of Kassel Germany Barbara Freytag-Leyer 1, Prof. Dr. Socio-Ecology of Private Households Department Nutritional,
Abstract. Sustainability has become a relevant issue for consumers due to human rights violations and the environmental problems society faces. These problems are a consequence of unmeasured consumerism and massive production, which has led to the questioning of the current production-consumption paradigm. This has resulted in
them to their key stakeholders. This literature review, including the analysis of 77 publications printed in English from 2000 to 2012, concentrates on the techniques and media used by companies in the food and beverage sector to
of consumer behaviour in the aforementioned industry.Key words:
JEL code: M 14
___________________________1 E-mail address: [email protected].
Introduction
have a strong impact on how companies do business. The way, in which current goods are consumed and produced, is unsustainable, and it strongly contributes to
2010). Society expects organisations, including food and beverage producerd, to commit to social, environmental, and economic goals, and to demonstrate this commitment through their actions. That is because consumers have become more socially responsible, are better informed, more demanding, and are more aware of the consequences of their consumption habits on the environment. They are increasingly interested in expressing their social and/or environmental concerns through their consumption
their expectations (Smith, 2003). In order to do so,
and the information they receive has an effect on their consumer behaviour (Pomering A. and Dolnicar S., 2009). Therefore, it is necessary for companies to create more sophisticated and on-going stakeholder awareness,
2006). The objective of this paper is to offer insights on
communicated, and the tools being used for information disclosure, focusing on the food and beverage sector.
Research, results and discussionThe authors carried outAa literature review, as
the aim of further developing the theory related to it.
The literature review was implemented, as proposed by Seuring and Müller (2008) following four steps: material collection, descriptive analysis, inductive approach to select the categories of analysis, and then analysis. It was limited to papers and books in English with either a management/business, consumer studies, marketing, public relations/communication, or accountability focus. All of the references used were published after the year 2000, with the exception of those
the publications dealing with the view of stakeholders different to those of consumers (e.g. government) were not taken into account, whereas those that offer a general scope, which can be applied to different types of stakeholders, were considered.
A structured keyword search was carried out using major available databases such as Elsevier (www.elsevier.com), Springerlink (www.springerlink.com), Wiley (www.wiley.com), and Emerald (www.emeraldinsight.com). Additionally, the authors consulted library
(www.scopus.comd. The keywords used for the search
stakeholders, communication, reporting, disclosure, consumer behaviour, and consumption. Another source for references corresponded to that of the literature cited by the articles.
As a part of the descriptive analysis the publications
published and the research methodology that was used. The sources were organised by the year of publication. In the case of books, such as Visser et al. (2011), which are compilations of articles/chapters from different authors, each of the articles/chapters was considered separately
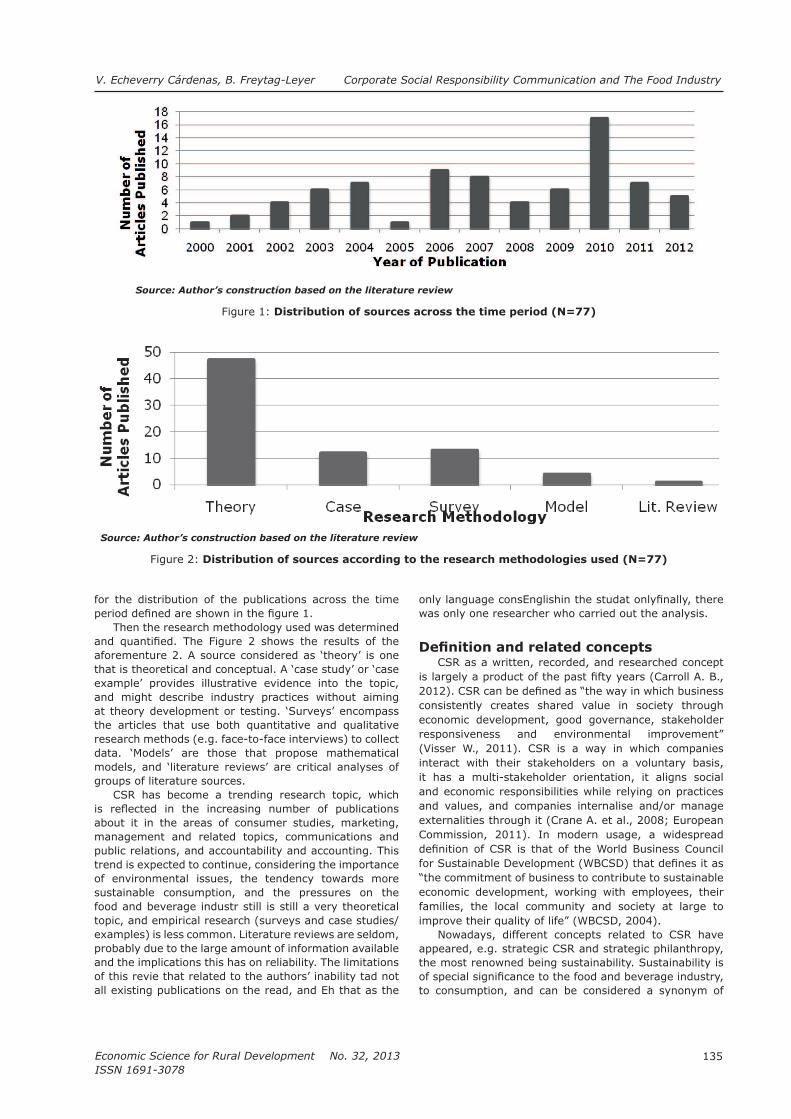
135
Economic Science for Rural Development No. 32, 2013
ISSN 1691-3078
V. Echeverry Cárdenas, B. Freytag-Leyer Corporate Social Responsibility Communication and The Food Industry
for the distribution of the publications across the time
Then the research methodology used was determined
aforementure 2. A source considered as ‘theory’ is one that is theoretical and conceptual. A ‘case study’ or ‘case example’ provides illustrative evidence into the topic, and might describe industry practices without aiming at theory development or testing. ‘Surveys’ encompass the articles that use both quantitative and qualitative research methods (e.g. face-to-face interviews) to collect data. ‘Models’ are those that propose mathematical models, and ‘literature reviews’ are critical analyses of groups of literature sources.
about it in the areas of consumer studies, marketing, management and related topics, communications and public relations, and accountability and accounting. This trend is expected to continue, considering the importance of environmental issues, the tendency towards more sustainable consumption, and the pressures on the food and beverage industr still is still a very theoretical topic, and empirical research (surveys and case studies/examples) is less common. Literature reviews are seldom, probably due to the large amount of information available and the implications this has on reliability. The limitations of this revie that related to the authors’ inability tad not all existing publications on the read, and Eh that as the
was only one researcher who carried out the analysis.
consistently creates shared value in society through economic development, good governance, stakeholder
interact with their stakeholders on a voluntary basis, it has a multi-stakeholder orientation, it aligns social and economic responsibilities while relying on practices and values, and companies internalise and/or manage
economic development, working with employees, their families, the local community and society at large to
the most renowned being sustainability. Sustainability is
to consumption, and can be considered a synonym of
Source: Author’s construction based on the literature review
Figure 1: Distribution of sources across the time period (N=77)
Source: Author’s construction based on the literature review
Figure 2: Distribution of sources according to the research methodologies used (N=77)
Economic Science for Rural Development No. 32, 2013
ISSN 1691-3078
136
V. Echeverry Cárdenas, B. Freytag-Leyer Corporate Social Responsibility Communication and The Food Industry
economy, and ecology seeking to assure the preservation of resources for both the present society and the future
profound changes in our ecological systems, caused by consumption habits and business practices. In the realm of food, there exists unmeasured consumerism that does not take into account the impact of purchases and production practices, such as intensive agriculture. These are issues that sustainability addresses and seeks to change through the encouragement of sustainable consumption (Sabapathy J., 2010/2).
Main stakeholders in the development of
CSR: Consumers
is affected by or can affect the achievement of an
engagement must be at the core because companies, who succeed at managing their relationships with their stakeholders successfully, will usually survive longer and outperform those who do not (Morsing M. and
comes down to identifying who those stakeholders are and what they represent to the company (Sillanpää M.,
The term stakeholder encompasses customers, employees, stockholders, competitors, suppliers, governments, distributors, media, etc.
of this paper consumers have been selected as the main
savvy about environmental issues and their interest on the impact and consequences of their purchases on the environment should be pondered (Darnall N. et al., 2010). In order to incorporate consumers’ interests, a close collaboration with them must exist based on proper communication. That is because consumers
programmes, so they usually lack knowledge on both
2011; Pomering A. and Johnson L.W., 2009).Getting the message through to consumers is
fundamental because they hold functional links with the organisation; they perform the ultimate output function of consuming the products and services, which is necessary in order to assure the permanence (at least in economic terms) of the company (Rawlins B.L., 2006). They can reward and punish the company (Pomering A. and Johnson L.W., 2009). They areactive, because consumption itself is an active
market rewards for socially responsible companies through the consumption and investment decisions they
can be both supportive and non-supportive, which is an issue that the company must identify and address
strategies (Rawlins B.L., 6). ButNevertheless, most importantly, they are legitimate stakeholders because
the most obvious being money, but others like word-of-mouth (good or bad) are also relevant. In order to engage
communicated (Pomering A. and Dolnicar S., 2009).
CSR communication
as socially responsible across key stakeholders is problematic (Morsing M. et al., 2008). Although there are
fail to communicate to their stakeholders actively enough
trust in the information source constitutes a critical issue
an increasingly important asset for a company’s strategy; therefore, the emphasis must be made on its eftively adjing it to the intended target group. In an ideal situation, what companies communicate as their principles should
proper use of relationship management in order to satisfy consumers’ expectancies, to build or enhance their relationship with them, and reach the anticipated levels
corporate level, or through product claims, at a product
address the information needs of various stakeholders, are usually issued by a limited number of companies, and tend to be of low quality, especially when it comes to
are voluntary statements released by enterprises, which
as ‘memory aids’ for consumers; they can take labels into account when making consumption choices. These can still be considered a signalling srategy, because producers decide voluntarily to engage themselves in the process to
The way, in which companies strategically engage
dependent on the way, in which they expect to create a shared understanding with their strategic stakeholders
(2006) have proposed three different communication strategies, in which companies engage themselves vis-à-vis their stakeholders: the stakeholder information strategy, the stakeholder response strategy, and the stakeholder involvement strategy.
In the stakeholder information strategy, there is a one-
This makes the purpose of this type of communication to spread information, not always seeking to persuade consumers, but to inform them about the organisation’s
on a two-way asymmetric communication model, where
The fact that the model is asymmetric means that there
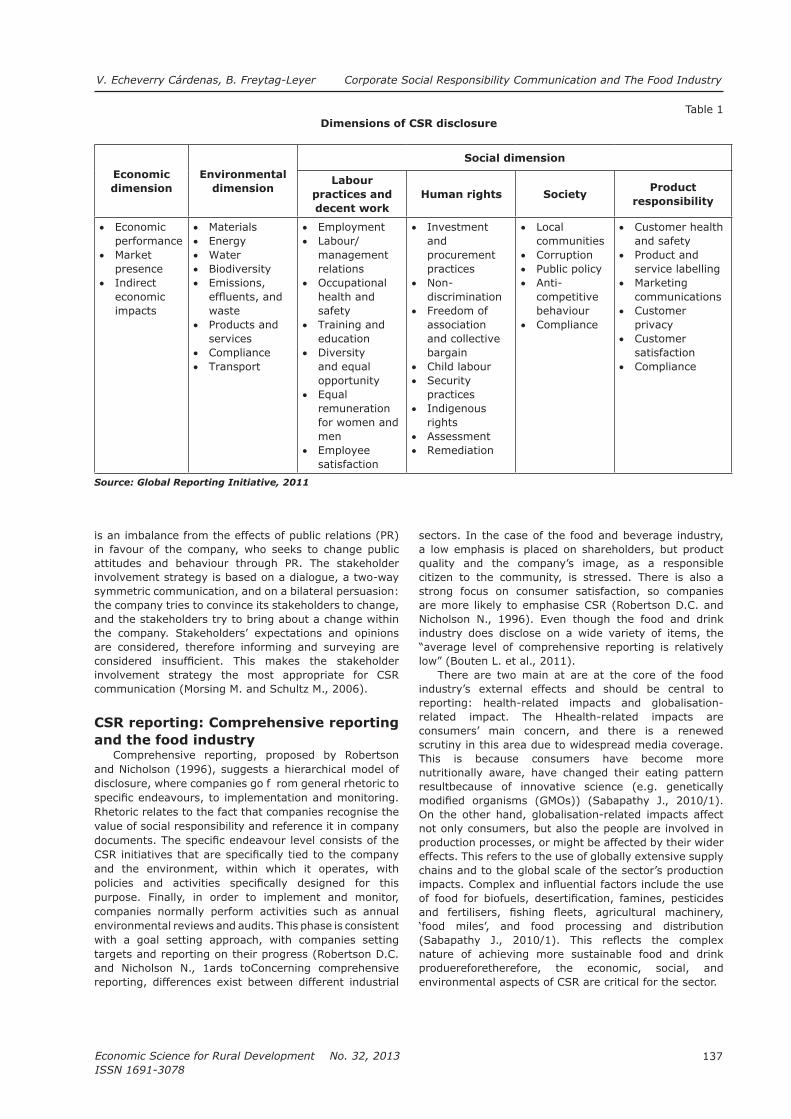
137
Economic Science for Rural Development No. 32, 2013
ISSN 1691-3078
V. Echeverry Cárdenas, B. Freytag-Leyer Corporate Social Responsibility Communication and The Food Industry
is an imbalance from the effects of public relations (PR) in favour of the company, who seeks to change public attitudes and behaviour through PR. The stakeholder involvement strategy is based on a dialogue, a two-way symmetric communication, and on a bilateral persuasion: the company tries to convince its stakeholders to change, and the stakeholders try to bring about a change within the company. Stakeholders’ expectations and opinions are considered, therefore informing and surveying are
CSR reporting: Comprehensive reporting
and the food industry
and Nicholson (1996), suggests a hierarchical model of disclosure, where companies go f rom general rhetoric to
Rhetoric relates to the fact that companies recognise the value of social responsibility and reference it in company
and the environment, within which it operates, with
purpose. Finally, in order to implement and monitor, companies normally perform activities such as annual environmental reviews and audits. This phase is consistent with a goal setting approach, with companies setting
.
reporting, differences exist between different industrial
sectors. In the case of the food and beverage industry, a low emphasis is placed on shareholders, but product quality and the company’s image, as a responsible
strong focus on consumer satisfaction, so companies
Nicholson N., 1996). Even though the food and drink industry does disclose on a wide variety of items, the
There are two main at are at the core of the food industry’s external effects and should be central to reporting: health-related impacts and globalisation-related impact. The Hhealth-related impacts are consumers’ main concern, and there is a renewed scrutiny in this area due to widespread media coverage. This is because consumers have become more nutritionally aware, have changed their eating pattern resultbecause of innovative science (e.g. genetically
On the other hand, globalisation-related impacts affect not only consumers, but also the people are involved in production processes, or might be affected by their wider effects. This refers to the use of globally extensive supply chains and to the global scale of the sector’s production
‘food miles’, and food processing and distribution
nature of achieving more sustainable food and drink produereforetherefore, the economic, social, and
Table 1Dimensions of CSR disclosure
Economic
dimension
Environmental
dimension
Social dimension
Labour
practices and
decent work
Human rights SocietyProduct
responsibility
Economic performanceMarket presenceIndirect economic impacts
MaterialsEnergyWaterBiodiversityEmissions,
wasteProducts and services
Transport
Employment Labour/management relationsOccupational health and safetyTraining and educationDiversity and equal opportunityEqual remuneration for women and menEmployee satisfaction
Investment and procurement practicesNon-discriminationFreedom of association and collective bargain
Security practicesIndigenous rightsAssessmentRemediation
Local communities
Public policyAnti-competitive behaviour
and safetyProduct and service labellingMarketing communications
privacy
satisfaction
Economic Science for Rural Development No. 32, 2013
ISSN 1691-3078
138
V. Echeverry Cárdenas, B. Freytag-Leyer Corporate Social Responsibility Communication and The Food Industry
Dimensions of CSR reportingTo satisfy the various interests of stakeholders andble
to comprehensively and clearly able to communicate on
concepts, a consistent language, and a way of measuring is required. The Global Reporting Initiative’s (GRI) Sustainability Guidelines (version 3.1) (2011) serve as a starting point to providing a complete and credible framework for sustainability reporting. They offer a series of performance indicators to assess the organisation’s
standard for sustainability reporting (Iansen-Rogers J. and Molenkamp G., 2010). The dimensions proposed by the GRI are shown in the Table 1.
concerning relevant economic, environmental, and social aspects, and they should set up the necessary indicators to measure the results of performance against the established goals. Policies should be brief and communicated organisation-wide, in order to clarify what the company is aiming to achieve. There should always be monitoring and follow-up procedures put into place that accompany the training and awareness created within the organisation’s stakeholders. Monitoring should always be carried out in order to apply corrective and preventive actions, and follow-up can be done through auditing/
to enhance the credibility of their reports, organisations can set up internal control systems and internal audits, and consult external assurance providers and stakeholder panels (Global Reporting Initiative, 2011; Waddock S. et al., 2001).
Tools for disclosure of CSR informationThe media channels that a company chooses to
to those that have the wider reach within their group of strategic stakeholders. The communication options depend on the goals and perspectives, the time frame set for them, the stakeholders, to whom the report is
content, the distribution channels, and reach the aims to be accomplished (Global Reporting Initiative, 2011). Active choices in communication and a long-term perspective assessment of the outcome are necessary to establish ‘stable grounds’ to build a corporate image
media, usually perceived as ineffective, through both formal (e.g. university courses) and informal (e.g. NGO seminars) sources, or through publications on ethical and sustainable consumption. The latter are more likely to
behaviour, because they are more literate and cognitively
through verbal communication, hard copies, print media, and presentations etc., using mainly a one-way communication, which was limited in reaching a heterogeneous audience, fully engaging stakeholders, and was (and is) costly and time consuming (Isenmann R. , 2006). Due to the way the Internet is used, today’s digital world is not just about providing
are always ‘on-line’ and are a part of a human and digital ‘power grid’. Social media pages (e.g. blogs, forums, social networks, etc.) show higher levels of activity as compared to corporate websites because they are valuable and easy-to-consult sources of information. They are a space where consumers can and do share links and opinions about the world around them, including companies, and their perceptions
engagement can be fostered through them by monitoring
For companies, the use of the Web for communication
public relations; and online archiving of the information (Schneider A.M. et al., 2007).
The favouring of the Web is also a result of the
sources has led to a shift towards different and more
appearance of new technologies and to shifting consumer preferences. They are increasingly interested in having
or ‘soft communication’ channels that include annual reports and websites, most commonly used, and
traditional communication channels, such as billboards
Pomering A. and Johnson L.W., 2009/1). The Web enables new kinds of interaction between a company and its key, targeted stakeholders. These social media open up possibilities like online availability, the opportunity to download content (e.g. reports), the integration of search engines, hyperlinks, and the possibility to obtain
(Isenmann R., 2006; Schneider A.M. et al., 2007).
Conclusions, proposals,
recommendations1. Social, economic, and environmental issues have
become increasingly important to the point of being
have voluntarily engaged in the creation of corporate social responsibility policies trying to reduce the negative impacts of their business operations and as a response to consumers’ expectations and demands.
2.
information.3. It is necessary for policy-makers or organisations
to develop and implement a framework that serves
must consider both the views from the industry and communities, it must be comparable across companies, countries, and sectors, must be available and understandable to the interested public, and should include parameters to ensure assurance and/
139
Economic Science for Rural Development No. 32, 2013
ISSN 1691-3078
V. Echeverry Cárdenas, B. Freytag-Leyer Corporate Social Responsibility Communication and The Food Industry
4. should recognise consumers as functional and active stakeholders, thus engaging them in the co-construction of corporate strategies (stakeholder involvement strategy). The use of corporate websites
wide population can be reached, but the use of social media, blogs, and wikis, accompanied by serious and appropriate online community management, can potentiate the involvement of consumers and constitute a two-way symmetric communication strategy.
5. Further research could focus on prioritising the issues that are central to the reporting for the food and beverage industry such as health and safety, the environment, fair trade etc., based on information collected through marketing research,
be performed in order to determine the drivers
sustainability initiatives. Additional investigation could focus on determining the best ways of
the tools used for disclosure have an effect on consumers’ perception of the validity of these claims. All the aforementioned could be done using more empirical research or case studies.
Bibliography 1. Bouten, L., Everaert, P., Van Liedekerke, L., De Moor,
Accounting Forum, Volume 35, pp.187-204. 2.
Sage Brief Guide To Corporate Social
Responsibility
3. Corporate Social Responsibility: Readings and Cases
In a Global Context. London: Routledge. 4.
tinyurl.com/bfyakdt (pdf). Access: 03.05.20115.
and Firms. Management Science, Volume 52, Issue 10, October, pp.1577-1593.
6. Making Sustainable
Consumption and Production a Reality. A Guide for
Business and Policy Makers to Life Cycle Thinking
and Assessments.
European Union.7.
Responsibility. Retrieved: http://tinyurl.com/http-ec-europa-eu-enterprise. Access: 13.02.2012
8.
Journal of Business Ethics, Volume 91, pp.599-614.
9. Fink, A. (1998): Conducting Research Literature
Reviews: From the Internet to Paper.
Müller, M. (2008): From a Literature Review to a
Management. Journal of Cleaner Production, Volume 16, pp.1699-1710.
10. Freeman, R.E., and McVea, J.A. (2001): Stakeholder Approach to Strategic Management. Darden Business School Working Paper No. 01-02. Retrieved: http://
11. Global Reporting Initiative (2011). Sustainability Reporting Guidelines Version 3.1. Retrieved: http://tinyurl.com/a8wkl9v. Access: 07.05.2012
12.
Free Associations Method. Applications Marketing, Volume24, Issue 3, pp.26-41.
13. Hou, J., and Reber, B.H. (2011). Dimensions of
Public Relations
Review, Volume 37, pp.166-168.14. Iansen-Rogers, J., and Molenkamp, G. (2010). Non-
Financial Reporting. The A-Zfof Corporate Social
Responsibility. Visser, W., Matten, D., Pohl, M., and Tolhurst, N. (eds.) West Sussex: John Wiley & Sons, Ltd.
15. Management Models for
Corporate Social Responsibility, Part 6, pp.26-41.16.
Sage Brief Guide to Corporate Social Responsibility.
17. Kim, H.-S. (2011). A Reputational Approach
Social Responsibility Motives. Asian Journal of
Communication, Volume 21, Issue 1, pp.84-101.18.
Social Responsibility. Journal of Communication
Management, Volume 7, Issue 4, pp.356-364. 19.
Brand Management. Electronic Journal of Business
Ethics and Organisation Studies, Volume 12, Issue 2, pp.4-11.
20.
Information, Response and Involvement Strategies. Business Ethics: A European Review, Volume 15, Issue 4, pp.323-338.
21.
Danish Study. Journal of Marketing Communications. Volume 14, Issue 2, April, pp.97-111.
22. Pomering, A., and Dolnicar, S. (2009). Assessing
Journal of
Business Ethics, Volume 85, pp.285-301. 23. Pomering, A., and Johnson, L.W. (2009). Advertising
to Enhance Persuasion. Corporate Communications:
Economic Science for Rural Development No. 32, 2013
ISSN 1691-3078
140
V. Echeverry Cárdenas, B. Freytag-Leyer Corporate Social Responsibility Communication and The Food Industry
An International Journal, Volume 14, Issue 4, pp.420-439.
24. Rawlins, B.L. (2006). Prioritizing Stakeholders
for Public Relations. Florida: Institute for Public Relations.
25.
U.K. Firms. Journal of Business Ethics, Volume 15, pp.1095-1106.
26. Sabapathy, J. (2010/1). Food and beverage sector. The A-Zfof Corporate Social Responsibility. Visser, W., Matten, D., Pohl, M., and Tolhurst, N. (eds.) West Sussex: John Wiley & Sons, Ltd.
27. The A-Zfof Corporate Social Responsibility. Visser, W., Matten, D., Pohl, M., and Tolhurst, N. (eds.) West Sussex: John Wiley & Sons, Ltd.
28.
Information and Communication Technology,
Transparency and Social Responsibility Conference: Lisbon, Portugal.
29. Seuring, S., and Müller, M. (2008). From a Literature
Journal of Cleaner
Production, Volume 16, pp.1699-1710. 30. Sillanpää, M. (2010). Stakeholder Engagement. The
A-Zfof Corporate Social Responsibility. Visser, W., Matten, D., Pohl, M., and Tolhurst, N. (eds.) West Sussex: John Wiley & Sons, Ltd.
31. Whether or How? California Management Review, Volume 45, Issue 4, pp.52–76.
32. Stø, E., Strandbakken, P., Scheer, D., and Rubik, F.
Eco-Labels And Environmental Policy, pp.16-45. Rubik, R. and Frankl, P. (eds.) (2005): The
Future of Ecolabelling. Making Environmental
Product Information Systems Effective. London: Greenleaf.
33. Analysis and Solutions for Market Failures. Journal of
Consumer Policy, Volume 31, pp.315-326.34. Visser, W. (2011). The Age of Responsibility. CSR 2.0
and the New DNA of Business. West Sussex: John Wiley and Sons Ltd.
35. Waddock, S., Googins, B.K., and May, S. (2001).
Responsibility. The Handbook of Communication and
Corporate Social Responsibility. Ihlen, Ø., Bartlett, J.L., and May, S. (eds.) West Sussex: John Wiley and Sons, Inc.
36.
Responsibility. Retrieved: http://www.wbcsd.org.
Dolnicar, S. (2009).37.
Our Common Future. New York: Oxford University Press.

141
Economic Science for Rural Development No. 32, 2013
ISSN 1691-3078
A. Batraga et al. Development of Higher Education Institution Brand – Association Context
___________________________1 Anda Batraga. Tel.: + 371 29224223; E-mail address: [email protected] E-mail address3 Ksenija Dmitrijeva. Tel.: +371 29994668; E-mail address: [email protected] Šalkovska. Tel.: +371 29615933; E-mail address: [email protected]
DEVELOPMENT OF HIGHER EDUCATION INSTITUTION BRAND – ASSOCIATION CONTEXT
Anda Batraga1, dr. oec., associated professor; Ilze Medne2, dr. oec., lecturer; Ksenija Dmitrijeva3, PhD; 4, Ms.oec.,lecturer
University of Latvia
Abstract.
by the value established by a range of criteria, including brand associations that bear an abstract link with the enterprise. The associations comprise the product attributes, customer’s gains, lifestyles, events and emotions.
and competitive advantage. The creation of associations is based on the aim to increase the brand value.
institution is among the topical competitive conditions, which allow distinguishing the achievements of the higher education institution and its communication ability to the target audience. A higher education institution, like an enterprise, is currently facing the conceptual and practical issues of developing its brand and the brand value, the issues being determined by the understanding of a brand and marketing. The article provides an insight in the aspects of the brand value conditions based on the role of associations in the development of a brand value. The article focuses on the creation and improvement of associations based on the brand value criteria of a higher education institution.Keywords: brand, value, associations, higher education institution.JEL code: M31
Introduction One of the main functions of marketing is to forecast
the set marketing aims and its overall mission. If the
to develop a brand, and respectively the direction can be indicated for the consumer to notice, remember and
of a brand in a consumer’s awareness, creation of a
development of a higher education institution (HEI)
to the creation of associations. The aim of associations is to create a value for consumers – the forthcoming or existing student and the higher education institution itself. The aim of the article: to assess the possibilities of the interaction between the brand value and associations for the brand development in the case of a HEI brand.
1. The need for developing the brand of a higher education institution
The development of a brand cannot take place
institution. It is connected with the HEI image that has developed in the preconceptions of the social groups
institution. The HEI brand currently represents a topical competition condition and allows for distinguishing HEI achievements and its communication ability to its target audiences. It has to be taken into account at all levels of brand development: HEI, students, graduates, and employers. The HEI brand is mainly created by the students and employees of HEI, HEI graduates and their achievements; secondly, the research and achievements of the university scholars; and, thirdly, the composition of the academic staff as well as the university infrastructure.
stability of the brand is essential as it provides for income.
2. Brand value concept and sourcesFor the purposes of the value added provided
by the brand, four elements are distinguished: authenticity – origin and quality of the brand, which is later associated with the product origin; loyalty – intangible and emotional rather than a functional brand value; experience –added value of the brand which is associated with emotions provided by using a product; character – meets the emotional needs of the consumer; it is the key difference from the competitive brands. In terms of HEI brand value, these elements in combination with the HEI development, qualitative
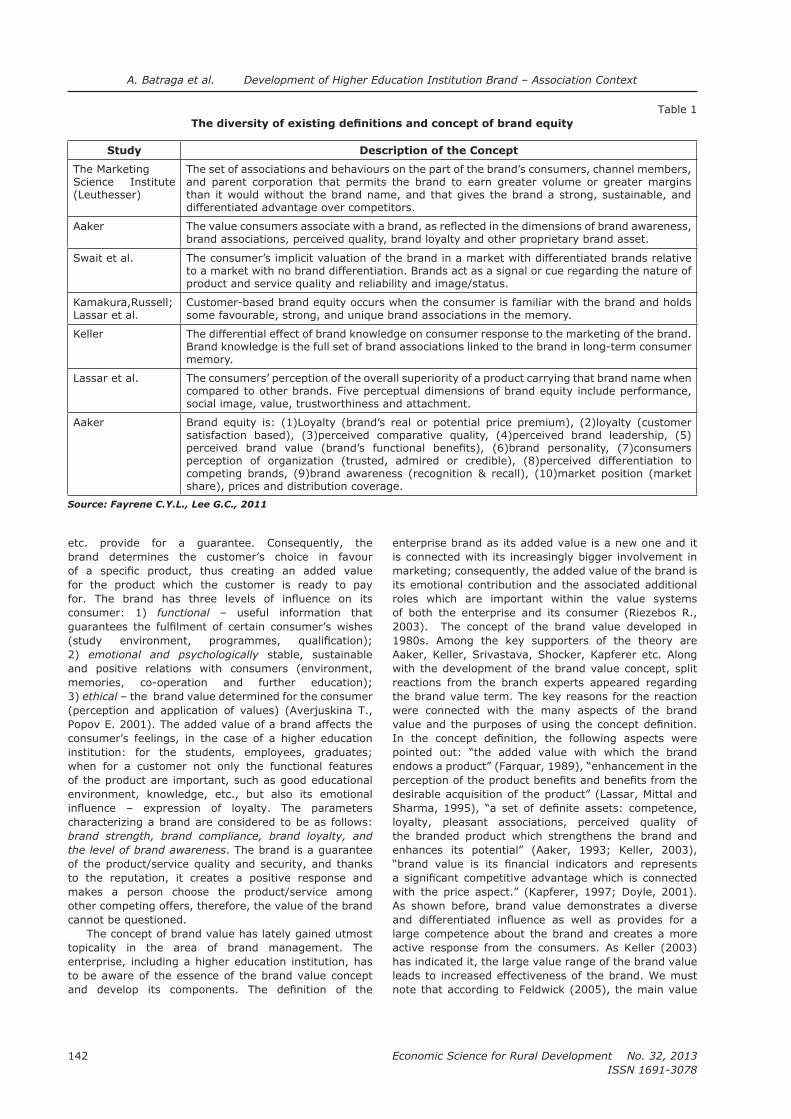
Economic Science for Rural Development No. 32, 2013
ISSN 1691-3078
142
brand determines the customer’s choice in favour
for the product which the customer is ready to pay
consumer: 1) functional – useful information that
2) emotional and psychologically stable, sustainable
and positive relations with consumers (environment, memories, co-operation and further education); 3) ethical – the brand value determined for the consumer (perception and application of values) (Averjuskina T., Popov E. 2001). The added value of a brand affects the consumer’s feelings, in the case of a higher education institution: for the students, employees, graduates; when for a customer not only the functional features of the product are important, such as good educational environment, knowledge, etc., but also its emotional
brand strength, brand compliance, brand loyalty, and
the level of brand awareness. The brand is a guarantee of the product/service quality and security, and thanks to the reputation, it creates a positive response and makes a person choose the product/service among other competing offers, therefore, the value of the brand cannot be questioned.
The concept of brand value has lately gained utmost topicality in the area of brand management. The enterprise, including a higher education institution, has to be aware of the essence of the brand value concept
enterprise brand as its added value is a new one and it is connected with its increasingly bigger involvement in marketing; consequently, the added value of the brand is its emotional contribution and the associated additional roles which are important within the value systems
2003). The concept of the brand value developed in 1980s. Among the key supporters of the theory are Aaker, Keller, Srivastava, Shocker, Kapferer etc. Along with the development of the brand value concept, split reactions from the branch experts appeared regarding the brand value term. The key reasons for the reaction were connected with the many aspects of the brand
loyalty, pleasant associations, perceived quality of the branded product which strengthens the brand and
As shown before, brand value demonstrates a diverse
large competence about the brand and creates a more active response from the consumers. As Keller (2003) has indicated it, the large value range of the brand value leads to increased effectiveness of the brand. We must note that according to Feldwick (2005), the main value
Table 1
Study Description of the Concept
The Marketing Science Institute (Leuthesser)
The set of associations and behaviours on the part of the brand’s consumers, channel members, and parent corporation that permits the brand to earn greater volume or greater margins than it would without the brand name, and that gives the brand a strong, sustainable, and differentiated advantage over competitors.
Aakerbrand associations, perceived quality, brand loyalty and other proprietary brand asset.
Swait et al. The consumer’s implicit valuation of the brand in a market with differentiated brands relative to a market with no brand differentiation. Brands act as a signal or cue regarding the nature of product and service quality and reliability and image/status.
Kamakura,Russell; Lassar et al. some favourable, strong, and unique brand associations in the memory.
Keller The differential effect of brand knowledge on consumer response to the marketing of the brand. Brand knowledge is the full set of brand associations linked to the brand in long-term consumer memory.
Lassar et al. The consumers’ perception of the overall superiority of a product carrying that brand name when compared to other brands. Five perceptual dimensions of brand equity include performance, social image, value, trustworthiness and attachment.
Aaker Brand equity is: (1)Loyalty (brand’s real or potential price premium), (2)loyalty (customer satisfaction based), (3)perceived comparative quality, (4)perceived brand leadership, (5)
competing brands, (9)brand awareness (recognition & recall), (10)market position (market share), prices and distribution coverage.
Source: Fayrene C.Y.L., Lee G.C., 2011
A. Batraga et al. Development of Higher Education Institution Brand – Association Context

143
Economic Science for Rural Development No. 32, 2013
ISSN 1691-3078
aspects attributable to the brand value are as follows: 1) overall brand value as a value of a permanent asset; 2) degree of the consumer’s involvement with the brand; 3) a combination of the consumer perception and associations with the brand accounting for the brand image.
meaning of the brand value and its measurements have not yet been determined. Almost all brand value concepts are currently unanimous that the phenomenon implies that consumer associations and ideas about the name of the particular brand award added value to the product
It must be concluded that we can speak about customer-based brand equity only if the consumer
and unique associations with it. No brand value can develop if the consumer is not aware of the brand.
components: brand loyalty, brand awareness, perceived quality, brand associations and other brand values. Brand value is created by the overall assessment of the set by the consumers comprising the consumers’ ideas, feelings, positions, associations and values regarding
tasks within the HEI brand development should involve facilitating positive popularity of the brand essence and contents both during the study process as well as in the further communication with the target audience.
a set of impressions offered by the brand we must point out that it implies the set of the brand feature perceptions that appear thanks to developing the consumer knowledge about the brand. The interrelation between the sources of the brand value and consumer positions is important for the understanding of brand value (Keller K.L., 2005). Moreover, the depth of brand awareness describes how possible and easy it is to remember the brand elements (the name, symbol etc. of the HEI brand). The breadth of brand awareness is a set of the purchase and use elements, where some of the brand elements are remembered (choice of the HEI/ programme, knowledge about etc.). Brand image, however, develops based on the set of associations connected with the brand (its rating, quality, guarantees etc.). The authors believe that the above-mentioned criteria lie in the foundation of the brand strength and
The brand value of an enterprise is created by all its integral parts: the product/service itself, its brand name and visual identity, advertisements and sales promotion activities, public existence and self-presentation of the enterprise brand as well as the legends associated with it. Therefore, the added value of a product or service is the total amount of perceived information in the
the value requires information, as the deeper a person considers the new information about the brand, the more he compares it with the already existing knowledge. This makes the associations with the brand stronger. Brand value basically arises from the information acquired and stored by consumers about the products and brands; it is
the purchase decision (based on the past experience or
(Aaker D., 1991). Moreover, the enterprise gains a
believe that in the case of the HEI brand, which develops over a longer time period, the information on the brand must ensure the synergy to provide for the development of the necessary value and awareness about it in the target audience. Although the existence of a brand is to be basically associated with the consumer’s perception and thoughts about the brand, all elements accounting
opinion, link the consumers to the brand, thus providing for the feedback (Aaker D., 2003). The enterprise must understand that its brand value is created by a set of elements, for example, its popularity, loyal consumers, quality and associations that are connected with the brand, its name and symbols and they add value to the enterprise product or service (Aaker D., 1991).
developing a brand is the concept of a brand value, which is its assets, and, secondly, for a successful brand value management it is necessary to take into account the peculiarities of using each particular kind of assets. The
context of the brand because it is most directly connected with the consumer perception.
3. Creation of brand associations
aspect of the brand value; a mental link with the enterprise forms the basis for choosing a purchase and for the loyalty to the brand. Brand associations comprise the brand attributes, customer’s attributes, customer’s gains, lifestyles and many other events which account for certain feelings and emotions in the customers. This is proved by the research made by Aaker (2008) and Starov (2010). Associations also determine the level of strength
its brand, loyalty and competitive advantages. The peculiarities of creating brand associations are mainly determined by the goal to increase the brand value.
The following features have to be considered in brand development: 1) the kind of brand associations: what associations arise for the consumer regarding the brand; 2) the availability of associations: the qualities must be easily attributable to the brand, and the brand must be easily attributable to the qualities; 3) essence of the verbal/non-verbal brand associations: strong brands possess non-verbal associations, which in the consumers’ perception are represented by a precise depiction of the brand; 4) intensity of associations: the closer the association, the more stable the brand image; 5) the number of associations: the more associations with the brand there are, the stronger is the brand. It is important that the associations are not contradictory, but rather develop harmoniously (and are not negative); 6) uniqueness of associations: uniqueness, difference from the associations with competitive brands, which makes associations a means of differentiation (Esch F.-R., 2005).
Accordingly, the brand is a powerful visual, emotional, rational and behaviour model, which a consumer
Associations can be both positive and negative;
A. Batraga et al. Development of Higher Education Institution Brand – Association Context

Economic Science for Rural Development No. 32, 2013
ISSN 1691-3078
144
however, in any case they make the consumer’s choice easier. Enterprises aim at creating positive associations with their brand, which would make the consumers choose in favour of the given enterprise rather than its
into 6 broad dimensions, or 15 dimensions in total. (Figure 1) (Korchia M., 1999)
Product associations comprise the functional quality and non-functional associations. The functional qualities are the material features of the product. If a brand does not meet the functions it is designed for, the brand will have a low brand value. Accordingly, the
judgement about impeccable and lasting tangible activity and absence of faults in the tangible construction of the product. The non-functional qualities, however, imply symbolic attributes that represent the intangible features, which correspond to the consumer needs and provide them with public recognition, personal growth
its social image, loyalty and perceived quality as well as differentiation and country of origin. Both functional and non-functional associations are equally important. The enterprise associations comprise the enterprise potential – the associations that are connected with the enterprise experience as well as the corporate social responsibility associations, which comprise the enterprise activities regarding the duties towards the
above, the brand associations represent a powerful tool. The enterprise may facilitate the development of
committing various measures aimed at the consumers.
Research results and discussionIn the association context of the brand development,
the practical focus of the authors’ research was the brand of the University of Latvia (UL). UL positions itself as a higher education institution with long-lasting traditions, strong academic environment and advanced research process. The vision of UL envisages that in 2020 UL will be one of the leading research universities in the Baltic
universities. The research potential of the University of Latvia will be contributing to the national economy of Latvia as well as sustainable development of the society
In compliance with the model of brand value dimensions (Aaker D., 1991), it comprises the brand loyalty, knowledge about the brand, perception of the brand quality, brand associations as well as other features
UL is striving to integrate these features in its brand. As it was stressed in the theoretical substantiation, a practical understanding of the market regarding HEI, in particular, UL, is connected with the image of the HEI, in this case UL, which has developed in the perception of the social groups and layers which directly affect the development of the HEI. The UL brand has to offer differentiated gains, which would allow for distinguishing the UL achievements and communication ability to its target audiences. It must be taken into account at all levels of the brand development: HEI, students, graduates, employers that account for the target groups of the UL brand. Each of the above-mentioned groups was involved in the brand assessment according to its role and status regarding the HEI (UL). All the target groups comprise the general set for the authors’ research.
During September – December 2012, a research of the target audiences of the UL brand was conducted under the authors’ guidance in order to evaluate the UL brand associations and their networks for further development of the UL brand as well as the problems related to this process. The data for the research were collected with the participation of the 2nd year students of marketing management master programme (2012).
To make a selection, the quota method was used. The quotation was carried out based on the structure of each target group. A set of 405 representatives of the target audiences were interrogated in scope of the
was representative. The dependence of the selection
Fig. 1. A typology of brand image
A. Batraga et al. Development of Higher Education Institution Brand – Association Context
145
Economic Science for Rural Development No. 32, 2013
ISSN 1691-3078
scope on the general multitude was based on Noel’s methodology. If we have an endless general multitude then the selection scope of 400 respondents would be
volume of general multitude achieves a certain level, its
the increase of the selection scope. Simultaneously a study was conducted in the
content accounting for the HEI brand because employers see the topicality of the HEI and its brand in the process of adopting the decision about the suitability of the potential employee. The experts were asked to provide their opinion about the HEI they have graduated from, the role of the HEI brand in adopting the decision about the suitability of a specialist (new employee) and development of cooperation with him. After the study, the authors concluded that even if education is not the primary criterion but is included in the set of the assessment criteria, the HEI the person has graduated
employers have certain established preconceptions about the knowledge and programme contents provided
capabilities and their compliance with the requirements and responsibilities; thus, additionally demonstrating the rank of HEIs regarding the needs and requirements towards the potential employee.
Research object: associations with the University of Latvia brand.
University of Latvia brand on its target audience and its assessment.
When interpreting the research results for the purposes of the article, the authors focused on the HEI brand associations, interaction between the HEI selection criteria and associations as well as on the interaction between the promotional communication and associations. In the presentation of the research results,
an integral network of associations without distinguishing typologically.
the system of education, the stereotypes pertaining to it, HEI as a whole, its symbols, logotype, main building etc. Various age and interest groups hold the opinions,
studies by their relatives, friends and acquaintances, their assessment. According to the results of the survey, generally the elements of the UL brand were assessed positively by pointing out such features as strength,
positive attitude and strong associations. Regarding the personal qualities to be highlighted in marketing communication, the majority or 90% of the respondents chose the human qualities, which become topical along with the acquisition of higher education and gaining success professionally. The range of the UL brand associations is meaningful for the analysis necessary
survey results, the task of the authors was to create an integral UL association network, which would demonstrate the associative attitude, which dominates
in the society and indicates the topical direction for the UL brand development (Figure 2). When creating the UL association network, the authors used the data, opinions
been caused and facilitated by the publicly available information and subjective emotions that arise in the minds of the potential or existing consumers.
In scope of the of the survey, it was found that almost all representatives of the UL target audience
selection decision. Based on the brand value dimensions as a whole as well as on the brand values and qualities stressed by UL in its vision and mission and as on some contrasting qualities, in the course of the study, the authors established the associative qualities. The summary of the survey data according to a 10-point scale resulted in the rating of the UL associative qualities for the perception of the UL brand in its target audiences, e.g. traditions – 7.62; quality – 6.77; developed research work; pleasant study environment – 6.68; maintenance of Latvia culture values – 6.60; emphasis on quantity rather than quality - 6.57; responsive, modern and knowledgeable academic staff – 6.52; stagnating academic environment – 6.43; modern equipment – 6.28; obsolete methods of instruction – 6.18; international competitiveness - 6.17; the best HEI in Latvia – 6.3; high entrance requirements – 5.7. The average assessment of the acquired results shows how strong the particular association is. It can be concluded that the range of the average assessment is not large (max - 7.62, min - 5.07), consequently, none of these associations is stronger than others or less expressed than others. There is a small number of extreme assessments (max
any of the qualities is certainly pertinent to the UL or is absolutely absent in it. Overall, the comparison of the assessments suggests that the qualities are more likely to be present than absent, and this is valid both regarding the positive and negative associations. Therefore, the associative opinions vary among the respondents and the perception of the UL brand varies.
audiences rather highly evaluate the general descriptive aspects of HEIs (quality; developed research area), which is positive and complies with the guidelines of the UL long-term vision, however, the authors of the article believe in a similar importance of the general view of the
as a result of the associative assessment is the ground for the adoption of the decision in the target audiences which develop/plan their future in connection with the studies at a HEI. In the research, the criteria have been
choose the HEI where to study or which to recommend to others. Overall, the HEI selection criteria, in value
In some questions, the acquired result differs from the UL association assessment, which in the authors’ opinion
associations based on the UL brand values. The criteria important for all audiences are the range of offered programmes and acquired skills (70-75%), accreditation and status of HEI (76-85%) and the study fee (55-65%). Of minor importance for all target groups, except
A. Batraga et al. Development of Higher Education Institution Brand – Association Context

Economic Science for Rural Development No. 32, 2013
ISSN 1691-3078
146
the employers (72-90%), are the following: modern equipment, new study aids, premises (35-47%), opinion of friends, acquaintances and family (35-58%) as well as the location (33%). In the authors’ opinion, the less topical criteria have to be assessed with caution because they directly and indirectly affect the formation of the important HEI criteria. As in terms of the UL development all of the suggested criteria are important, the authors believe that in the brand development process the provision for the link between the value and association will gain more topicality.
Any enterprise, including a HEI, promotes its product by using the corresponding information in accordance with the desirable effect of the communication. During the research, the authors evaluated the UL slogan of the public advertising campaign for operational period
indicators, e.g. the attraction of students. In the research,
audiences about the visual format of the campaign which,
target audiences. The authors would like to stress that the results have to be assessed in two respects – from the
the results showed that the associations that dominate in terms of the contents are as follows: wisdom, idea,
resourcefulness, insight, light, and thinking. However, the assessment in the visual respect is the following: dull
knowledge. The authors conclude that, when developing the contents of the brand association formation and respective communicative solutions, it is important to pay serious attention to the solutions of the contents and
tend to work more negatively than positively. Moreover, if the target audience, as it was mentioned above, comprises not only the potential and existing students, but also employers, parents and society as a whole, then
the visual advertising associations in the nearest future. For example, in the youth group a positive assessment was received from 35% respondents in average, however, in other target groups this indicator was from 0-10% (employers, parents). The situation is opposite regarding
60% of parents rejected the advertisement contents in relation to their choice, i.e. UL as their potential HEI. The authors conclude that for the purposes of developing positive associations UL has to reconsider its visual communication strategy in order not to enhance the detachment of the associative links from the desirable UL brand values. Regarding the assessment of the UL brand associations, where according to the survey none of the associations is stronger or less expressive, it must be
Source: author’s construction based on research of the target audiences of the UL brand
Fig. 2. University of Latvia association network
A. Batraga et al. Development of Higher Education Institution Brand – Association Context

147
Economic Science for Rural Development No. 32, 2013
ISSN 1691-3078
noted that the brand developers should take particular care of the desirable communication as the HEI brand has
stability in order to provide for income (rising of funding, number of students).
The authors have made the following conclusions and proposals:
The brand development of any enterprise, including UL, is its main strategic aim because it provides for the formation of the desirable target audience reaction in the long term by taking into account that the brand value orientation is based on the wishes and needs of the potential customer. The creation of associations, i.e. the provision for positive emotional contact in a long term, lies in the foundations of developing the desirable brand and its value.
The study proves that all suggested associative qualities (both the good and bad ones) are more likely to
the associative opinions differ considerably, and the perception of the UL brand in the target audiences is
of positive associations, it is necessary to assess with more care the approaches that require analysis that is more complex.
Strong brands possess verbal and non-verbal associations, which in the consumers’ perception are represented with a precise depiction of the brand. For the purposes of forming positive associations, UL should reconsider its visual communication strategy in order not to enhance the detachment of the associative links from the desirable UL brand values. It is important that the associations do not contradict each other, but rather develop harmoniously.
The brand association analysis and the acquired results allow for further elaboration of the communication with each of the target groups for the promotion of the UL brand development in terms of associations. At present, when assessing the existing communication as a whole, it focuses more on the group of the potential students, which is essential, however, does not fully comprise the audience that is considerably larger and under positive conditions would provide a more effective feedback in the future. In order to achieve higher motivation of the target audience to consume the UL brand, more attention should be paid to the development of communication based on the target audience requirements.
In the future, in order to specify the brand communication strategies, it would be necessary to assess in detail how the brand-creating associations and brand
faculty.
Bibliography1. Aaker, D. (2008). Strategic Market Management.
Hoboken, N.J.: Wiley. p. 322.2. Aaker D. (1991). Managing Brand Equity:
3. Adjouri, N. (2002).Die Marke als Botschafter–Markenidentität bestimmen und entwickeln. Gabler, p.96.
4. Esch F.-R. (2005). Strategie und Technik der Markenführung. ünchen:Vahlen, pp. 65-69.
5. Brand Equity: A Literature Review. Journal of Arts
6. Korchia M. (1999). A New Typology of Brand
pp. 147-154.
7. Korchia M. Brand image and brand associations. Retrieved: http://www.watoowatoo.net/mkgr/papers/mk-ceressec.pdf. Access: 06.11.2012
8. Theoretical and Practical Financial Times, London. p.331.
9. University of Latvia – home page, 2012. Retrieved:
10. of Branding (in Russian). Marketing, N
11. Aaker, D. A. and Joachimsthaler E. (2003). Brand
Russian). 374 s.
12. Keller, K. L. (2005). Strategic Brand Management: Building, Measuring, and Managing Brand Equity. Moskva. Viljams, 2005. 697 s.
13. Noel, E. (1993). Massovije oprosi (Mass survey),
14. Starov, S. (2010). Upravlenije brendomi (Brand
management)
A. Batraga et al. Development of Higher Education Institution Brand – Association Context
Economic Science for Rural Development No. 32, 2013
ISSN 1691-3078
148
L. Worobjow, K. Ertmanska Relations Between Country Brand and Product Brand
___________________________1
;
RELATIONS BETWEEN COUNTRY BRAND AND PRODUCT BRAND
Leonid Worobjow1, Dr.hab., prof.; Karolina Ertmanska, PhDDepartment of Marketing, West Pomeranian University of Technology
Abstract. The aim of this article is to identify links between the product brand and the brand of a territorial unit, which is the country. The authors point out that building the brand of the product and the brand of the country should be treated with the same seriousness and that the same tools can be used in both cases.The authors have analysed the essence of understanding the brand of the product as well as links between the product brand and the country brand in the present paper. The method used in the paper is the literature analysis. The paper describes the scheme, according to which one should work in creating a national brand as well as the process of
effect has been described as the impact that opinion and the image of the country has on a product originating from a particular country.The idea of links existing between the product brand and the country brand is topical because nowadays not only
inscribing in the process of grabbing new areas by brands and the knowledge on the use of techniques appropriate for brand management can help countries win competition and be more visible in the global market. Key words: country brand, product brand, national marketing, country-of-origin effect.JEL code: M3
IntroductionBuying goods and services consumers want to satisfy
their needs and desires. At the same time, they pay not
brings. The basis of commercial success is the ability of
offered by the brand creates its identity and distinguishes it from other brands.
Analysing consumer’s approach to the selection of products, one should pay attention to the factors that
factors (economic, social, cultural) and internal ones (personal, psychological). It should also be noted that the customer experience associated with previous purchases can play an important role in making purchase decisions. However, if the client does not have such experience, product brand or brand of the country from which the product comes can be helpful in making decision.
The country of origin of the product is now known to be the factor that may affect the perception of the product. Information about the origin of the product is always placed on the package but it can be more or less exposed. This exposure has been linked with the fact that the country of origin can help promote the product itself as well as lead to a purchase. Therefore, it is important to analyse the nature of the product brand as well as to understand the links between national brand and product brand.
The research tasks were to identify the similarities between competition techniques among brands and among countries. The contribution of the study is to show that the knowledge on the use of techniques appropriate for brand management can help countries win competition and be more visible on the global market.
Product brand
goods and services of the manufacturer or the seller (or their group) - distinguishing them in this way from the
subject to legal protection. In a holistic frame, the brand
the name, packaging, advertising, and accompanying activities of distribution and pricing that provides the consumer with distinctive functional and symbolic
such as: — to identify (to inform); — to guarantee; — to promote (Altkorn J., 1999).
The primary function is to distinguish the product from the goods and services offered by the competition.
assigned several meanings: — — — emphasising the values sought by of a certain group
of buyers; — technical representation of a particular culture
(Kotler Ph., 2001).Direct information occurs when simple, easily
readable message about the product, its use, purpose, or owner is included in the brand. The indirect information focuses on evoking by the brand associations
Brands more fully realise the function of the designation of origin, when they use the name of the owner of the
149
Economic Science for Rural Development No. 32, 2013
ISSN 1691-3078
(Altkorn J., 1999).The guarantee function means that the owner of
the brand is committed to maintain the quality of the product on a certain level. Buyer repeating purchase of the product expects that the product have at least the same characteristics as in the past. The producer will want to avoid a situation, which could result breaching of a positive opinion about the brand. This feature is
ad, creates the situation where image about the service provider and the product becomes the primary factor in the buyer selection process (Witek-Hajduk M., 2001).
The promotional function means that trademark owners should use the brand to promote the company and products sold. The brand as a promotional tool should attract attention and encourage purchases. An important feature of the brand is also the possibility to use it in the promotion of various forms, in particular, in a variety of media advertising.
The most important of brands are the
creating consumer attitudes to brand loyalty. This allows
provides psychological satisfaction to the consumer, guaranteeing his preferred status and quality of life. This satisfaction is presented as one of the results of the process aimed to produce products desired by customers or other interested parties. This approach shows that contentment equated with satisfaction is in practice often treated as a measure of the product produced.
An important disadvantage of the brand, especially for the seller (manufacturer), is the high cost of its promotion. The development and promotion of the brand on the market is expensive, so the company has to decide whether to give brand to the product. This is particularly important for giving brands to individual products.
The image of the brand is its picture in the mind of the customer (buyer). It is created as a synthesis of all the signals emitted by the brand (e.g. name, logos, products, advertising). The image is the result of decoding, extracting by the consumer the importance of these signals, their interpretation. It describes the way
Brand image can be positive, negative or neuter, it may be good, widespread, and thus, helpful to the company but it may be also little known, damaging the reputation. Sometimes, it is created randomly and cannot guarantee prestige to the company. It can be assumed that, for example, in the case of some basic consumer goods, this procedure is not needed. Yet, in the modern world, the tendency to give brands to the products is very strong, despite the high costs and falling consumer loyalty to the brand.
The country brandThe country brand is the essence of the country’s
history and its contemporary culture, products, people,
of the country that make up the identity and uniqueness. Strong national brand can create out of ordinary, or unknown, average country, a country that is perceived as
popular, attractive, and desirable. It can make that the
and that external customers (tourists, consumers, policy makers, and investors) put the country and its products high on the list of interesting destinations to visit and goods to be purchased. In addition, they are willing to pay more and recommend it to their friends.
Brands – of the product, institution, region, country -
the trust. In the mind of the recipient some abstract entity is created that includes and combines the functionality of a particular product (quality, utility) with the values that
of the brand - a product, a company, or a country. When creating a national brand one should act
one is the product - one that the place is known from. Products in this sense may be people or institutions. Surely, such products are goods produced in the country, having a certain quality and the reputation. Another area is the market communication - the message that carries the brand. This sphere includes also advertising. It should be remembered that when creating the image, good communication, promotion may substitute product shortages. Sometimes it happens that a good advertising creates a hit from the average product. Another component is the environment. It is good to know the market environment and then supplying the correct product should be successful. The last pillar is behaviour. These are nations that actually live from the fact that they behave in a certain way - they are nice,
The process of building a brand, based on these four pillars, should be divided into four stages:
— to stand out; — to be needed; — to deserve respect; — to create intimacy.
It can be concluded that the brand is the most valuable cultural phenomenon in the 21st century.
of the country functioning. It should also be noted that in the process of building a brand, everybody should
is needed, and the wider circles are involved, the better.
National marketingThe concept of national marketing has emerged in
the late 20th century. This phenomenon is associated with the search for methods to assess countries’ own strengths and opportunities and effective ways to improve competitiveness and boost the economy, which becomes particularly important in an era of globalisation and integration.
Each country is now trying to promote its own individual personality, culture, history, and values by emphasising what can be idealised but immediately recognisable as its image, which serves economic, commercial, and political purposes. However, the image of the country has to be current, clear and attractive, so it is impossible to use symbols and ideas from the past. The share of past and present should be properly balanced.
L. Worobjow, K. Ertmanska Relations Between Country Brand and Product Brand
Economic Science for Rural Development No. 32, 2013
ISSN 1691-3078
150
National marketing in a broader context can be
global market. It is a system methodology, which can
Accordingly, the world is a global market, and the country is mega-company, competing on a global market with
applying strategic marketing management tools to design development strategies of countries.
Therefore, the national economy promotion is a set of long-term, consistent, and professionally planned communication activities, which results in a systematic increase in the country’s economy - its products, services, companies, capital, regions, cities, events, people, and ultimately a permanent increase of the promotional
is the process by which the country is actively looking for ways to create a unique and competitive identity, aiming
of a good business partner and an attractive place for investors and tourists.
To identify factors affecting the image of the country, it seems reasonable to refer to areas of national
areas include tourism, branded exports, foreign and internal policy, investment and immigration, culture and heritage, and people.
The most prominent and widely promoted area is tourism. Governments support the promotion of the
Tourist attractiveness of the country is also desirable because of the fact that the country begins to exist in the minds of other nations, increasing its visibility, positive associations are created to form the image of the country.
Exported branded goods play a very important role in the dissemination of national culture. On their basis people form their opinions about the identity of the
to expect from products made in the country. Even if
brands are present in everyday life; they affect people’s lives, and contribute to their habits. The country of origin
everyday life.To build a positive image of the country, its political
stability is also important - whether people have
competences of its members; whether they believe that the government is able to ensure the safety of
authorities care about environment. That members of the
outside, which is why it is very important how other ations perceive them. It seems that nowadays the choice of brand of wine or a beverage is more than just a consumer choice – it becomes a kind of political demonstration.
Another area is investment and immigration. It is important that the country is able to attract foreign capital and skilled labour. A strong brand has the country,
which is an ideal place to live, where people are willing to settle permanently. It expresses their appreciation for the social conditions, education, quality of life, and work style in the country.
The country image to a great extent depends on the culture and heritage of the nation. The fascination
attitude towards its companies, products, or tourist values . In addition, sporting successes contribute to creating a positive image of the country. Soft values are becoming increasingly important and their impact on human associations is increasingly palpable. Music, books, movies and even the actors have an impact on the collective subconscious – they are the model, the point of reference.
Of course, the assessment of the country citizens is also important. People are the greatest wealth of a country. Nice people attract tourists; educated workers
is dealing with the existing stereotypes, which should be changed just by using national marketing.
Attractive and consistently communicated national brand, supported by branded products, is an important opportunity for developing countries to enter a group of highly developed countries. They are the intangible resources (particularly brand) that are now the main source of value added for national economies generating
building a competitive advantage is, in the light of these assumptions, the movement from a group of countries-suppliers of intermediates and non-branded products toward a group of brand owners, for which consumers are
Country-of-origin effectNowadays, countries are increasingly aware that their
good reputation and attractive image in the international arena has a fundamental impact on the perception and evaluation of their products by foreign consumers. The
impact of the reputation and image of the country on a product that comes from that country. It addresses the idea that consumers and business people have about the country and how they carry it on the product image.
Researchers from the 1970s were interested in relationship between the perception of the country and the perception of the product, and they saw a positive
information about the origin of the product in order to identify its quality. The adequate policy of the use of a
the attitudes of consumers, even when they are in contact with a very similar product but of different origin (Kotler Ph., 2002).
The less information a consumer has on a product, the
the product. In subsequent phases of the interaction,
consumers, this effect is important when they do not have much information about the product and have a limited
L. Worobjow, K. Ertmanska Relations Between Country Brand and Product Brand
151
Economic Science for Rural Development No. 32, 2013
ISSN 1691-3078
and incomplete knowledge. In creating their opinion, they are driven by factors such as the level of economic development of the country, the political, social, cultural conditions, traditions etc.
Sometimes strong reference to the country or region of origin can have negative effects. Historical events, geographic location may be the factors that, by combining with the country, will further shape the
purchasing decisions. However, analysing the positive effects, it is clear that it should be used to associate the product with the relevant characteristics of the country from which it comes.
on not only one but many products that they are potentially going to buy. The effect of origin consists of such items as:
— innovation (the use of new technologies and advanced techniques);
— design (look, style, colour, diversity); — prestige (exclusivity, status, reputation of the
brand); — performance (reliability, durability, quality of the
production) (Kotler Ph., Gertner D., 2002).Understanding the relationships and characteristics
macroeconomic conditions but also because of the companies operating on the market. This allows entrepreneurs have an appropriate adjustment of product to the conditions that prevail on the market.
fact that sometimes it is unavoidable to associate the product country of origin with the country of origin of the invention or license, place of assembly, country
should be exhibited from a marketing perspective.
Conclusions1.
of consumers but also cities and countries.
the process of grabbing new areas by brands. 2. On the contrary, countries have always been
brands but they were not so consciously
considered - until global competition and pervasive excess of possibilities options changed it.
3. Many countries have created national marketing ideas, since they noticed that on the global market, countries and nations operate and are
nations culturally and economically win with the others, when they consistently build their own brands - care about their reputation as companies. This reputation moves then everything that comes from these countries - companies, products, regions, people, capital, and ideas.
4. Successful brand names, in turn, enhance the image of the country. The country-of-origin effect is very well used by countries that have discovered national marketing the earliest such as Germany, Japan, and Italy.
5. The basis of national marketing is the belief that the state is a player on the global market, where it competes with other states. To be among the few who win in the 21st century, one needs a professional to take care of the competitiveness and to build and strengthen the attributes. Therefore, countries use methods and marketing techniques modelled on large corporations in creating brands.
Bibliography1. Altkorn, J. (1999). Brand Strategy. Warsaw, PWE,
p. 14.2.
Membership in the European Union. Marketing & Market, No. 8.
3. Beyond: a Place Marketing and Brand Management Perspective. Journal of Brand Management, Vol. 9, No. 4/5, pp. 249-261.
4. Kotler, Ph. (2001). Marketing. Analysis, Planning,
pp. 410-411.5. Sojka, B. (2003). Product Management. Warsaw,
PWE, p. 54.6. Witek-Hajduk, M. (2001). Brand Management.
7. www.s imonanhol t .com/Research/research-introduction.aspx. Access: 15.12.2012.
L. Worobjow, K. Ertmanska Relations Between Country Brand and Product Brand

Economic Science for Rural Development No. 32, 2013
ISSN 1691-3078
152
G. Grinberga-Zalite et al. Role of Social Marketing in Maintaining The Balance Between Satisfaction of
Immediate and Long-Term Needs in The Context of Food Consumption
___________________________1 Gunta Grinberga-Zalite. Latvia University of Agriculture. Tel. +371 63021041; e-mail address: [email protected] 3 Amanda Avotina. Latvia University of Agriculture. Tel. +371 63021041; e-mail address: [email protected]
ROLE OF SOCIAL MARKETING IN MAINTAINING THE BALANCE BETWEEN SATISFACTION OF IMMEDIATE AND LONG-TERM NEEDS IN
THE CONTEXT OF FOOD CONSUMPTION
Gunta Grinberga-Zalite1, Dr.oec; Evija Liepa2, Dr.math; Amanda Avotina3, Bc.sc.ing.
Abstract.
Latvian consumers have become more farsighted and in circumstances of limited budget and abundant range of food products purposefully choose locally grown and produced food, or on the contrary – the national budget austerity has forced the population to behave more short-sighted and satisfy immediate needs instead of thinking about long-term needs of Latvia food production and consumption sustainability. The study is based on the review of literature and publications on food consumption and production sustainability problems; secondary data analysis, and authors’ performed public survey data analysis applying chi square method.Key words: food, consumption, social marketing.JEL codes: M14; M31; M37
IntroductionThe fact that nowadays convenience is the value is
vividly demonstrated by the growing number of one-stop-shopping places, which typically alongside with all sorts of goods, e.g. building materials or stationery items, offer their customers to buy food products (most often chocolate, chips, cookies, and different fast-foods). Despite practical considerations and time economy, which is an important argument for yuppies (i.e. young urban professionals), at the same time it causes a serious social and psychological problem – the satisfaction of immediate needs buying pre-fabricated goods makes consumers start losing their connection with natural and traditional food sources. This problem is more common
to tempting commercials spread by powerful franchise coffee shops and restaurants to become one of them – modern, careless, and dynamically living enjoyers of life who have nothing to do with such time consuming and boring activities like regular food shopping and cooking (peeling, washing, crushing etc.).
However, positive is the fact that young people dragged into the busy rhythm of life (especially those who live in cities), despite losing their connection with food origin, tend to take up the fashion of alternative life style. Most often, the key words of such life style are sustainability
their expression also in appropriate food consumption.
provides elimination of products containing preservatives from the menu both while shopping and eating out. This alternative behaviour has found expression in different
community, in which its members themselves, but not supermarket assortment policy managers, are decision-
community supporting local small scale food producers (usually farmers), thus providing them with larger
such ideas of sustainable consumption can be regarded positively, yet not always visually appealing and fresh food products in shops, market pavilions, and farmer’s
today. Simplifying this problem, one could suggest that overall organic farming and industrial food production can be regarded as two polarities of the same continuity (G. Grinberga-Zalite, 2012).
In nowadays, high budget corporate food manufacturers’ posters seriously affect consumers’ behaviour in any public place (e.g. bus stop, public gym etc.). As a result, looking at this issue marginally, food can be bought almost everywhere (e.g. in the building materials store, car service), and if it is sold everywhere, then in the modern age it can be effectively produced from everything. Therefore, the problem with our next generation is losing a link between food and its producer, weak understanding of modern farming and of what it means to be a farmer, and what the farming conditions are.
During the economic growth period until 2007,
incentives in the form of subsidies. Today, it is important
more farsighted and in circumstances of limited budget and abundant range of food products purposefully choose
153
Economic Science for Rural Development No. 32, 2013
ISSN 1691-3078
locally grown and produced food, or on the contrary – national budget austerity has forced the population to behave more short-sighted and satisfy immediate needs instead of thinking about long-term needs of Latvia food production and consumption sustainability.
The hypothesis of the research is: those consumers who daily use locally grown and healthy food do not buy meat in supermarkets, choose not the cheapest but the healthiest vegetables, and do not consume meat prefabricated products.
The aim of the paper is to evaluate the role of social marketing activities implemented in 2007-2012 in
scope of the research, the authors have set the following tasks: 1) to analyse food promotion and consumption trends
in Latvia;2) to elicit the values of locally grown food;3)
consumption habits maintain the balance between short term and long-term needs in the context of food consumption in Latvia.
The study is based on the review of literature and publications on food consumption and production sustainability problems; secondary data analysis of
food consumption habits, and authors’ performed survey analysis applying chi square method.
Discussion and research resultsThe insights into the history of organic farming give
evidence that organic farming has occurred in the northern part the Europe in the beginning of the 20th century as the combination of theory and practice integrating a wide range of alternative agricultural production methods. Yet, despite expression of various trends and vitality, organic farming in Europe remained underdeveloped for many years. In order to satisfy European society urgent
20th century, the main task of agriculture was a rapid increase of productivity. Under such conditions,
disadvantageous. However, in the 60-70s, and especially in the context of environment protection problems, organic farming at last came in the forefront. The newly established associations attracted more and more producers, consumers, and other society groups interested in ecology and environmentally friendly style.
(Melece L., 2003). Organic products differ from conventional products
in crop production, use of antibiotics in cattle breeding, food additives, processing aids, and other inputs as well
Every year food and veterinary services control all the
in case of a positive accreditation, they are awarded
consumers can be sure that the proper organic product
compliance of the product origin with organically grown conditions.
Yet, despite the transparent organic products’ production cycle, consumers are not sure if the prices of organic products in the shelves of supermarket eco product department or eco shops really correspond to the value of these products. The reason for such scepticism roots in society perceptions that have once been distorted by two false beliefs – one of them assumes that organic products are exclusive commodities, which always cost high prices, and the other one – everything that is grown or processed in Latvia is anyway natural, and it makes no sense to pay more for some products only because they
Recently, in Latvia food industry several kinds of
product’s belonging to a products’ group with certain properties. Apart from the previously mentioned label
product), and many other. Among the mentioned labels,
(institution subordinated to the Ministry of Agriculture of the Republic of Latvia) was assigned 63 000 EUR for Latvian food industry support activities in international exhibitions. The envisaged support activities included collective Latvian food stands’ creation in international food exhibitions unifying food producers and processors
the message for consumers: the product contains at least 75% of inputs of the particular region and meets
does not mean that the product is organically grown and
and the fact that the product and its inputs’ origin is Latvia (Alta S., 2010). At the same time, it is commonly
consumers causing an impression that product labelling is a kind of extortion from sentimental buyers. As a result,
covered with labels. Along with these label initiatives, however, comes the inevitable misappropriation of language by large corporate companies, which have
customer manipulation. This is the fact of green washing in the food industry. Large corporate food manufacturers have created organic lines that have illusory appearance of products from small family-operated farms; these
(Philip Morris/Kraft), and Sunrise Organic (Kellog). The label designs, the names, even the websites give no
that manufactures the products. It is a deceptive and worrisome situation for conscientious consumers who want to support organics and not corporations
problem is the complexity of product information –
G. Grinberga-Zalite et al. Role of Social Marketing in Maintaining The Balance Between Satisfaction of Immediate and Long-Term Needs in The Context of Food Consumption
Economic Science for Rural Development No. 32, 2013
ISSN 1691-3078
154
life complexity increasingly becomes a burden, which
which is shopping (Leeb S., 2009). For the illustration of nowadays increasing life complexity, S. Leeb mentions
24 words, the Lord’s Prayer – 66 words but, e.g. the USA Government regulation on cabbage sales –
spend much longer time to detect the differences among products often using a loupe taken with them to be able to read microscopic letters of the products’ content and distinguish many different patriotically sounding slogans on the product packaging. In the context of the European Union single market policy and its negative side effects, Latvian consumers’ feelings are most often affected
Let’s support our local
producers!
and awareness, why they should support directly local producers, often are primitive and based on false stereotypes. One of the most successful social campaigns
Do not buy foreign!
initiated in 2012 with the budget of 20 thousand EUR.
local food producers. The objective set by this campaign was that in 2014 “do not buy foreign” must become a way of life. Besides, an important supplementing motivator
buying imported food products for public needs (e.g. kindergartens, old people’s homes, representative needs
replace imported food with locally grown. The professor L.Melece, Head of Department of
Quality and Environment Protection, Latvian State Institute of Agrarian Economics, considers that nowadays there can be distinguished two directions of food
production) mainly for international and regional (the EU, the former USSR countries etc.) markets. To ensure this type of production, companies need to implement
innovation; focus on regional and global markets; quality (ISO 9000, ISO 22 000) and environmental (ISO 14001, EMAS) control systems; use of food quality brands. The second direction for further development of the food sector is food production on farms, small and micro-scale enterprises that comply with principles of sustainable and environmentally friendly food chain and produce value-added food products mainly for the local market.
The main conditions for such food production are local and artisan (individually) produced food, including organic; organic food and market development; local
Slow
Food
grown and sold locally skips many steps of processing, packaging, and transporting, sparing the environment and eliminating the dependency on suppliers far removed
fresher, which makes it taste better and ensures that
the consumer is getting maximum nutrition for his/her buck, and after all the link between the producer and consumer is not lost. Another aspect is strengthening of local economy, providing work for small farmers, creating or saving workplaces, preserving small shops,
10 EUR in the supermarket, about 2 EUR remain in the regional community and 8 leave the area. If someone spends 10 EUR to buy from a regional producer, 8 EUR remain in the regional community and 2 leave the area. Buying regional products can generate 4 times more the regional community than buying supra regional. Even, if regional products would cost twice as much – comparing the supra-regional products, the regional people would gain more.
In Latvia, to educate consumers about healthy and sustainable food systems and their principles, pupils already in the primary education establishments are taught the basics of healthy and sustainable lifestyle both in biology and sport lessons. In addition, informative social marketing campaigns on products necessary for human health have been widely carried out in mass media during 2009-2012. Social marketing could be
tools to the achievement of socially desirable ends. Social marketing in contrast to commercial marketing not only targets individual behaviour change, but also attempts
legislative bodies, government departments, and non-
attitude that helps to protect people’s health, sustainable wellbeing and quality of life. These advertising campaigns were implemented on the EU money with the co-
Latvia. The total costs of these advertising projects were approximately 750 thousand EUR. The main activities envisaged by this project were advertising campaigns on TV informing TV viewers about necessity to consume fresh vegetables, fruit, milk products, and honey.
As the response to public dissatisfaction with the product prices and assortment in Latvia, the largest food retail stores lately often activate healthy eating issues. In the beginning of 2012, the results of public survey conducted by Rimi Latvia and SKDS research centre revealed that consumers’ food choice in 92% of cases is affected by its price. Only 29% of respondents have admitted that it is important for them that the products are organic, and for 42% of respondents it is important that the products are of Latvia origin. The research also
in general consume healthier food than rural residents
to buy diverse and seasonal products, such as fruit, berries, vegetables and cereals, whereas rural population
In rural areas, the product supply is less diverse and the motivation to cultivate the greens even only for non-
A similar pattern was found in the period of economic crisis escalation in 2008-2009, when one of the ways, how some local municipalities helped the local needy and unemployed population was garden patch assignment for vegetable cultivation. Unfortunately, needy population
G. Grinberga-Zalite et al. Role of Social Marketing in Maintaining The Balance Between Satisfaction of Immediate and Long-Term Needs in The Context of Food Consumption
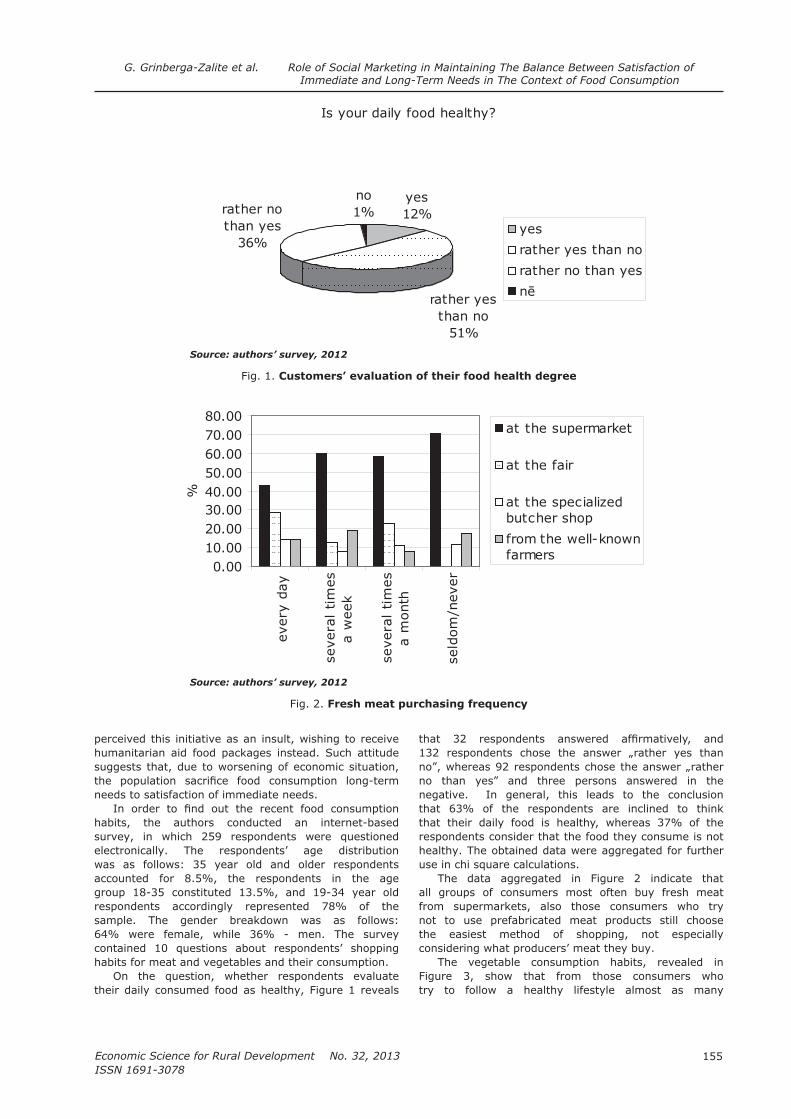
155
Economic Science for Rural Development No. 32, 2013
ISSN 1691-3078
perceived this initiative as an insult, wishing to receive humanitarian aid food packages instead. Such attitude suggests that, due to worsening of economic situation,
needs to satisfaction of immediate needs.
habits, the authors conducted an internet-based survey, in which 259 respondents were questioned electronically. The respondents’ age distribution was as follows: 35 year old and older respondents accounted for 8.5%, the respondents in the age group 18-35 constituted 13.5%, and 19-34 year old respondents accordingly represented 78% of the sample. The gender breakdown was as follows: 64% were female, while 36% - men. The survey contained 10 questions about respondents’ shopping habits for meat and vegetables and their consumption.
On the question, whether respondents evaluate their daily consumed food as healthy, Figure 1 reveals
132 respondents chose the answer „rather yes than
negative. In general, this leads to the conclusion that 63% of the respondents are inclined to think that their daily food is healthy, whereas 37% of the respondents consider that the food they consume is not healthy. The obtained data were aggregated for further use in chi square calculations.
The data aggregated in Figure 2 indicate that all groups of consumers most often buy fresh meat from supermarkets, also those consumers who try not to use prefabricated meat products still choose the easiest method of shopping, not especially considering what producers’ meat they buy.
The vegetable consumption habits, revealed in Figure 3, show that from those consumers who try to follow a healthy lifestyle almost as many
Is your daily food healthy?
rather yes than no
51%
yes12%
no1%rather no
than yes36%
yes
rather yes than no
rather no than yes
Source: authors’ survey, 2012
Fig. 1. Customers’ evaluation of their food health degree
0.0010.0020.0030.0040.0050.0060.0070.0080.00
every
day
severa
l tim
es
a w
eek
severa
l tim
es
a m
onth
seld
om
/never
%
at the supermarket
at the fair
butcher shop
from the well-knownfarmers
Source: authors’ survey, 2012
Fig. 2. Fresh meat purchasing frequency
G. Grinberga-Zalite et al. Role of Social Marketing in Maintaining The Balance Between Satisfaction of Immediate and Long-Term Needs in The Context of Food Consumption

Economic Science for Rural Development No. 32, 2013
ISSN 1691-3078
156
respondents buy the cheapest vegetables as those who try to buy not the cheapest but locally grown vegetables.
Basing on the survey results, the authors applied 2 method to either approve or deny the previously
formulated hypothesis – those consumers who daily use locally grown and healthy food do not buy meat in supermarkets, choose not the cheapest but the healthiest vegetables and do not consume meat prefabricated products (sausages, pates, smoked products etc.).
The authors aggregated respondents’ answers on the survey questions and displayed them in Table 1.
Unfortunately, the calculations obtained using the chi square method indicated that the empirical
2
is 1.679093, whereas theoretical 2 is 5.991465,
which suggests that there are no differences in eating habits among those consumers who consider that their consumed food is healthy and that they support local food producers and those consumers to whom these issues are not essential.
Conclusions, proposals,
recommendations 1. In nowadays, in the rich range of food labelling,
consumers often get confused, because similar label logo colours and symbols are misleading.
the buyers should be consistently educated not only
about the basics of healthy eating, but also should be given practical information about food products’ labels used in the food industry.
2. Despite costly advertisements and sales promotions, the link between local food producers and consumers is poor. The participants of local food system should develop more solid relationships with their consumers focusing on long-term social programmes (e.g. offering practice placement for
families with children, cooperating with schools in
3. In future, social campaigns should concentrate on the overall long-term needs of the society, which are strengthening of local economy, providing survival for small farmers, creating or saving workplaces, preserving small shops, and securing food. Small farmers are those who still maintain Latvia rural landscape diversity with its uniqueness. Therefore, in the long-term, it is not only small farmers’ concern to maintain Latvia regional diversity, but also all Latvia consumers’ concern, as more and more often people are looking for possibilities how to spend their weekends thoughtfully and eat healthy.
4. The value added tax on food products should be reduced to allow not only the wealthier, but also all social backgrounds people to purchase such food products that are healthy and enable them to
0.00
10.00
20.00
30.00
40.00
50.00
60.00
every day severaltimes aweek
seldom
%
the cheapest
home-grown or fromwell known farmers
grown in Latvia
grown in a certifiedorganic farm
Source: authors’ survey, 2012
Fig. 3. Choice of vegetables for daily consumption
Table 1Aggregated respondents’ answers on the survey questions
Healthy eating
habits
Choose the cheapest
vegetables
Very often consume
prefabricated meat products
Buy meat at the
supermarketTotal
yes 49 103 86 164
no 46 89 59 95
95 192 145 259
Source: authors’ survey data, 2012
G. Grinberga-Zalite et al. Role of Social Marketing in Maintaining The Balance Between Satisfaction of Immediate and Long-Term Needs in The Context of Food Consumption

157
Economic Science for Rural Development No. 32, 2013
ISSN 1691-3078
support local food producers, which overall would strengthen remote regional communities, which lately are in worse social and economic situation than urban population.
Bibliography1. Alta, S. (2010). Zala karotite briesmas? (Green
spoon in danger?) Saimnieks Nr.5 (71), 06.2010, pp. 10–12.
2. Association of Latvian Organic Agriculture website. Aktualitates (Topicalities). Retrieved: http://www.lbla.lv/LV/aktualitates. Access: 27.11.2012
3. Grinberga-Zalite, G. (2012). Evaluation of Green Marketing Activities in Scope of Local Food Systems’
website. Retrieved: http://www.lcbr-online.com/. Access:02.01.2013
4. in a Shattered Economy (in Latvian). Riga:
5. Melece, L. (2003). Biologisko lauksaimniecibu raksturojosie logo (Logos characterizing organic
farming). Agropols Nr.4(7), 04.2003. pp. 4–5.
6. Melece, L. (2012). Local Food Systems and Sustainability of Agriculture and Rural Areas. The
Jurmala, Latvia, 22 March 2012.7. Donovan, R., Henley, N. (2010). Principles and
University Press. pp. 4-21.8.
veseligi; to dara tikai 30% (72% of population
wants to eat healthy, yet only 30% does that). http://la.lv/index.
php?option=com_content&view=article&id=3396
30&Itemid=166. Access: 02.01.20139. Schenk, G. W. (2012). Slow Food Activities in
Promotion of Organic Products. The presentation in
22 March 2012.10.
(The Second Breath of Green Management). Latvijas
11. World changing: A User’s Guide for the 21st
(2008). New York: Harry N.Abrams, Inc. p.596.
G. Grinberga-Zalite et al. Role of Social Marketing in Maintaining The Balance Between Satisfaction of Immediate and Long-Term Needs in The Context of Food Consumption
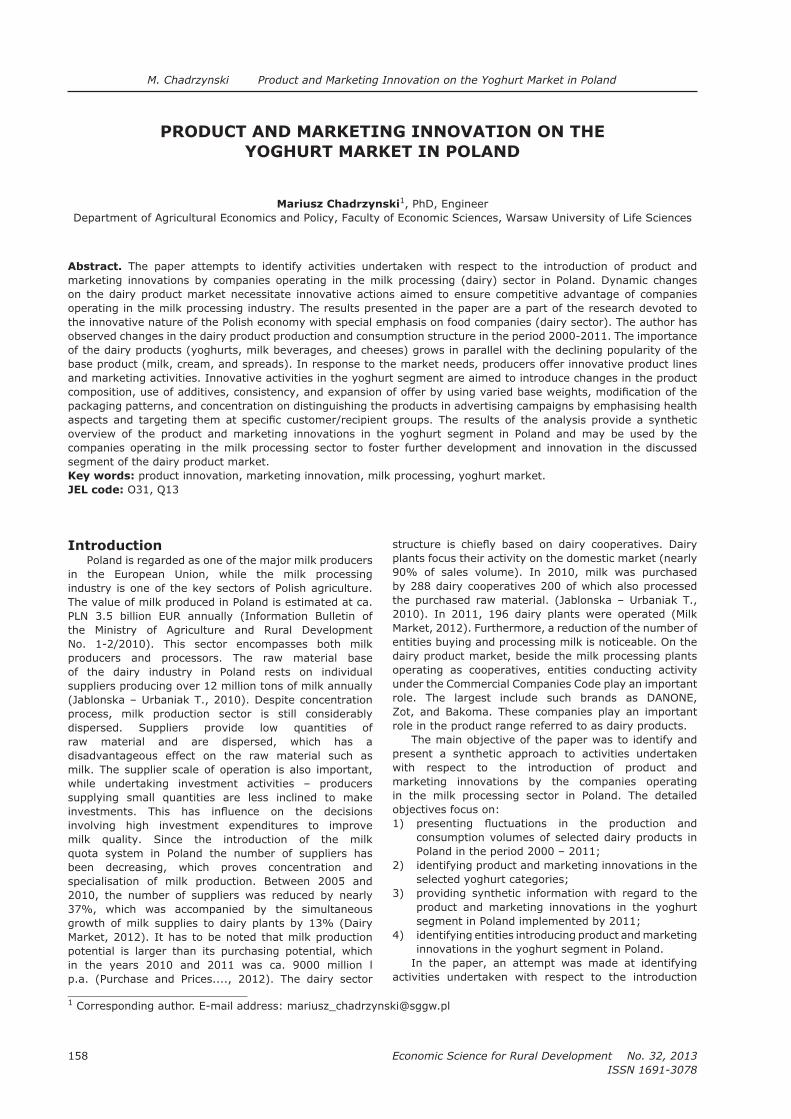
Economic Science for Rural Development No. 32, 2013
ISSN 1691-3078
158
M. Chadrzynski Product and Marketing Innovation on the Yoghurt Market in Poland
___________________________1
PRODUCT AND MARKETING INNOVATION ON THE YOGHURT MARKET IN POLAND
Mariusz Chadrzynski1, PhD, EngineerDepartment of Agricultural Economics and Policy, Faculty of Economic Sciences, Warsaw University of Life Sciences
Abstract. The paper attempts to identify activities undertaken with respect to the introduction of product and marketing innovations by companies operating in the milk processing (dairy) sector in Poland. Dynamic changes on the dairy product market necessitate innovative actions aimed to ensure competitive advantage of companies operating in the milk processing industry. The results presented in the paper are a part of the research devoted to the innovative nature of the Polish economy with special emphasis on food companies (dairy sector). The author has observed changes in the dairy product production and consumption structure in the period 2000-2011. The importance of the dairy products (yoghurts, milk beverages, and cheeses) grows in parallel with the declining popularity of the base product (milk, cream, and spreads). In response to the market needs, producers offer innovative product lines and marketing activities. Innovative activities in the yoghurt segment are aimed to introduce changes in the product
packaging patterns, and concentration on distinguishing the products in advertising campaigns by emphasising health
overview of the product and marketing innovations in the yoghurt segment in Poland and may be used by the companies operating in the milk processing sector to foster further development and innovation in the discussed segment of the dairy product market.Key words: product innovation, marketing innovation, milk processing, yoghurt market.JEL code: O31, Q13
IntroductionPoland is regarded as one of the major milk producers
in the European Union, while the milk processing industry is one of the key sectors of Polish agriculture. The value of milk produced in Poland is estimated at ca. PLN 3.5 billion EUR annually (Information Bulletin of the Ministry of Agriculture and Rural Development No. 1-2/2010). This sector encompasses both milk producers and processors. The raw material base of the dairy industry in Poland rests on individual suppliers producing over 12 million tons of milk annually (Jablonska – Urbaniak T., 2010). Despite concentration process, milk production sector is still considerably dispersed. Suppliers provide low quantities of raw material and are dispersed, which has a disadvantageous effect on the raw material such as milk. The supplier scale of operation is also important, while undertaking investment activities – producers supplying small quantities are less inclined to make
involving high investment expenditures to improve milk quality. Since the introduction of the milk quota system in Poland the number of suppliers has been decreasing, which proves concentration and specialisation of milk production. Between 2005 and 2010, the number of suppliers was reduced by nearly 37%, which was accompanied by the simultaneous growth of milk supplies to dairy plants by 13% (Dairy Market, 2012). It has to be noted that milk production potential is larger than its purchasing potential, which in the years 2010 and 2011 was ca. 9000 million l p.a. (Purchase and Prices...., 2012). The dairy sector
plants focus their activity on the domestic market (nearly 90% of sales volume). In 2010, milk was purchased by 288 dairy cooperatives 200 of which also processed the purchased raw material. (Jablonska – Urbaniak T., 2010). In 2011, 196 dairy plants were operated (Milk Market, 2012). Furthermore, a reduction of the number of entities buying and processing milk is noticeable. On the dairy product market, beside the milk processing plants operating as cooperatives, entities conducting activity
role. The largest include such brands as DANONE, Zot, and Bakoma. These companies play an important role in the product range referred to as dairy products.
The main objective of the paper was to identify and present a synthetic approach to activities undertaken with respect to the introduction of product and marketing innovations by the companies operating in the milk processing sector in Poland. The detailed objectives focus on:1)
consumption volumes of selected dairy products in Poland in the period 2000 – 2011;
2) identifying product and marketing innovations in the selected yoghurt categories;
3) providing synthetic information with regard to the product and marketing innovations in the yoghurt segment in Poland implemented by 2011;
4) identifying entities introducing product and marketing innovations in the yoghurt segment in Poland.
In the paper, an attempt was made at identifying activities undertaken with respect to the introduction

159
Economic Science for Rural Development No. 32, 2013
ISSN 1691-3078
of product and marketing innovation by the companies operating in the dairy processing sector on the basis of the analysis of materials and data from available publications concerning public statistics: GUS (Main
), ARR (Agricultural Market Agency), MRiRW (Ministry of Agriculture and Rural Development), IERiGZ – PIB (Institute of Agricultural and Food
Economics - National Research Institute), PIM (Polish
Milk Chamber), and other publicly available secondary sources. The research tools included an analysis of the status of explorations with respect to the particular topic and descriptive analysis. The paper provides a theoretical, empirical, and general overview.
Changes in the production volume and
consumption of selected dairy productsAn analysis of the dynamics of changes in
the production of selected dairy products in the period 2000 - 2011 shows changes which, on the one hand, are a result of transformations occurring in the structure of dairy products and, on the other, are related to the construction of the competitive advantage of processing companies on the basis of a change
same companies on the moulding of the dairy product consumption structure in the analysed period cannot be neglected.
During the analysis of the production changes occurring in 2005 in comparison with 2000, it is noticeable that the highest production growth dynamics was noted in the aging rennet cheeses followed by the processed cheese, standardised cream, butter, and processed liquid milk groups. The highest dynamics was observed in the case of low fat consumption milk, margarine, and spreads. This group of dairy products noted a drop in the production level.
The analysis of production changes occurring in 2011 in comparison with 2005 shows that the highest production growth dynamics was noted in the following product categories: low fat consumption milk, yoghurts, fresh cheese, cheese and quarks in general, and liquid processed milk. Reduced production of products like milk and cream in solid form, standardised cream, and butter can also be observed in this period.
A comparison of changes in the production volume in 2011 and 2000 indicates an increase in the production volume of such products as yoghurts, low fat consumption milk, cheeses, and white cheeses. At the same time, production of solid milk and cream was reduced. A slight increase of margarine and spreads production was also noted.
Observation of the production dynamics of the main dairy products allows stating that the growth in production of such products as yoghurts, liquid milk,
Table 1Dynamics of changes in the production of the selected dairy products (%)
No. Goods 2005 Previous year = 100 2011
2000 = 100
2006 2007 2008 2009 2010 2011 2000 = 100
2005 = 100
1 Margarine and low fat spreads with the exclusion of liquid margarine 90.6 99.3 99.9 98.9 106.4 107.4 101.9 103.5 114.2
2. Processed liquid milk 128.4 100.0 105.0 97.9 114.6 101.5 100.2 153.7 119.8
2.1. including: standardised consumption milk 124.4 94.8 103.0 101.2 114.4 103.5 96.0 139.7 112.3
2.2. low fat consumption milk 70.3 77.9 176.0 251.7 119.0 102.5 92.8 274.3 390.3
3. Standardised cream 136.8 110.6 105.6 100.5 79.4 95.7 94.5 115.2 84.2
4. Solid milk and cream 114.3 84.6 104.1 98.6 86.3 85.5 119.7 87.6 76.7
5. Butter 129.0 96.6 105.0 100.4 98.4 97.6 97.7 123.2 95.5
6. 127.5 106.6 103.8 104.3 102.7 101.9 103.2 158.7 124.5
6.1. including aging rennet cheeses 161.5 107.7 98.2 110.8 100.7 94.7 106.7 192.4 119.2
6.2. fresh cheese (not aging and without preservatives), including rennet cheese and curd cheese 112.6 102.4 109.0 99.8 103.6 108.9 103.6 146.6 130.2
6.3. processed cheeses (cheese spreads) other than grated or powder cheeses 137.6 120.4 103.6 96.3 105.8 96.2 94.1 158.4 115.2
7. Yoghurt 136.8 133.2 114.7 101.7 117.4 110.6 99.7 275.3 201.3
8. 13.1 104.7 38.1 176.5 51.1 78.3 63.9 2.4 18.0
9. Ice cream . 91.7 125.9 87.2 110.6 98.6 100.4 . 110.2
M. Chadrzynski Product and Marketing Innovation on the Yoghurt Market in Poland

Economic Science for Rural Development No. 32, 2013
ISSN 1691-3078
160
cheeses, and white cheeses is a dynamic process. Reduction, or an atomic increase, was noted in the cream, margarine and low fat spreads and butter
of a number of experts dealing with the exploration of changes in the dairy product consumption and production structure and opinions of dairy sector practitioners saying that the reduced consumption trend in the margarine, spreads, butter, and cream sector is accompanied by the increase in the milk, milk beverages, yoghurt and cheese consumption2. However, taking into account consumption of the dairy products in Poland, despite its annual increase, its level is still different from the EU Member State average. As regards milk, its consumption in Poland constitutes a little above 50% of the EU average, while the consumption of cheeses is lower by 1/3 in comparison with the EU average (Bugala A., 2012).
The analysis of the dynamics and changes in the milk and dairy product consumption in Poland shows a gradual increase in the consumption of these goods since 2006.
reduction of dairy products in comparison with other food products and of growing consumers’ interest in high nutritive value and healthy food. According to the estimates of IERiGZ-PIB (Institute of Agricultural and
Food Economics - National Research Institute), in 2011, the per capita balance sheet milk consumption in Poland, excluding the milk used for butter production, was ca. 195 l. It shows a 2% increase in comparison with the preceding year and over 12% growth in comparison with 20053. It is anticipated that in the following years, the growth trends in the dairy product consumption will be
development of the functional goods production and increased demand for these product types deriving from
butter consumption, one thing has to be emphasised, namely, that its declining consumption in the EU is linked with the decrease in the consumption of bread as a complementary good. In Poland, bread consumption has also decreased; it appears, however, that butter consumption is strongly dependent on the price level. In 2010, in consequence of a considerable growth of butter prices also in relation to other edible fats being its substitutes, its per capita consumption dropped to 4.4 kg (i.e. a decrease of over 6% in comparison with 2009). It is estimated that in 2011, as a result of a relatively high level of retail prices of butter, its per capita consumption was reduced to 4.1 kg. It is anticipated that in 2012, as the butter prices continue their atomic growth, the decreasing trend in butter consumption will prevail (Milk
Product and marketing innovation in the
selected yoghurt product categories
phenomenon that is intrinsically related to the notion of change, novelty, reform, or an idea perceived anew. Various facts, processes, or phenomena of technical, organisational, social, and psychological nature are
regarded as innovative. Until the present moment, the notion of innovation introduced into economic sciences by J. A. Schumpeter in the early 20th century, has been evolving in response to changes occurring in various
interpreting data concerning innovation developed by
manual, innovation is understood as an implementation of a new materially improved product (a good or service), process, new marketing methodology, or a new method of organisation with respect to business practices, organisation of the place of work or relations with the
range of novelties is introduced - from the global scale novelties to the novelties only from the point of view of a particular company/plant (Matusiak K. B., 2011).
service which is completely new or whose functional characteristics or intended uses, which they are to serve, have been considerably improved. This encompasses in particular improvements in technical characteristics, applied components and materials, software constituting product integral part, and also improvements facilitating product use, i.e. the so-called user-friendliness (Matusiak K. B., 2011).
with respect to:
patterns and packaging – e.g. changes in the form and appearance of the product which do not affect its technical and functional parameters or such changes of packaging of products like food, beverages, cleaning agents, cosmetics where packaging
aim of these changes is to make the product more attractive to the potential buyers;product and service sale methodology – these changes include most importantly new sale channels, with the exclusion of logistical methods
system, direct sale or granting product licence, and application of new concepts of product presentation (e.g. sale of furniture in the specially arranged according to topics rooms);product and services’ promotion and advertisements, e.g. the so-called product placement, i.e. showing
programmes; the so-called branding or introducing an entirely new symbol, or brand, to win a new market or giving a new image to the product;
introducing a personalised information system, e.g. through the use of loyalty cards to harmonise product presentation with the individual customer needs;
___________________________2 Opinions of experts and practitioners obtained during personal interviews, literature studies, analysis of articles, announcements, and press releases.3 In 2005, the historically lowest milk consumption level was noted in Poland.
M. Chadrzynski Product and Marketing Innovation on the Yoghurt Market in Poland
161
Economic Science for Rural Development No. 32, 2013
ISSN 1691-3078
methods (strategies) for determining product and
method of differentiating product and service prices depending on the demand (if the demand is low, the price is also low).
Marketing innovation may concern both new and old (previously implemented) products of a particular company. It may be developed by the surveyed company or just adapted by it to its actual needs, or invented by another company or institution. The purpose of marketing innovation is to better satisfy customer needs, open new markets, or change the position of the products of a particular company on the current market in an attempt to increase the value of the sold production. For a change of the marketing methods to be regarded as a marketing innovation, it must be a part of a new marketing strategy of a particular company - a strategy that is materially different from the marketing concept and strategies applied by the company so far. It is a characteristic feature of marketing innovation distinguishing it from other changes in marketing instruments applied by a particular company (Matusiak K. B., 2011).
Taking into account changes in the production structure and consumption of dairy products, an emphasis needs to be put on the fact that the innovative activity is focused on these groups of products that achieve the highest production and consumption growth indicators. The greatest number of innovative activities can be observed in such dairy categories as liquid milk, milk beverages, white cheeses, and most importantly yoghurts.
Producers of dairy products have introduced completely new groups and product lines deriving from changes in product composition and various types of improvements from the point of view of their usefulness as well as intended use and functional characteristics of the products. These changes also concerned packaging - both patterns/shapes and offer of the product in varied base weights and capacities. Additionally, various advertising and promotional campaigns concerning individual product groups intended for the
and youth, active people who are concerned with their health, active men, and weight-watching women were launched. There were also major changes concerning the use of sales channels, e.g. expanded cooperation with large-format stores. Furthermore, it has to be pointed out that certain products are specially dedicated to the
special basic weight of the Jogobella products is applied,
in Piatnica (Piatnica Regional Dairy Plant), or a range
(Mlekovita Dairy Plant).The largest number of innovative activities
was undertaken in the yoghurt product and liquid consumption milk groups. Unquestionably, it had to do with the adaptation of the product structure to the changing needs of the consumers. In the yoghurt group, other categories can be distinguished such as drinking yoghurts, natural yoghurts, fruit yoghurts, creamy and
breakfast yoghurts, and hybrids of the main categories. The yoghurt market in Poland has been dominated by two international producers, i.e. Danone with 40% market share and Zott, the owner of the Jogobella brand, whose share is estimated at 20%. The third major yoghurt producer is a Polish capital company - Bakoma. Despite domination of the previously mentioned three producers, the number of companies interested in participation in this attractive yoghurt market is growing. It has to be mentioned that in 2010, Polmlek noted a 10% growth of yoghurt and milk deserts sale. This company has introduced the so-called functional yoghurts4, which were quite popular with consumers. Furthermore, the supply of yoghurts without sugar and
Group has introduced low fat (weight control) products. Their sale in 2010 (as it is the case with Polmlek) has
It is anticipated that fermented beverages, especially drinking yoghurts, are the most promising areas where innovation should be implemented. One of the inventions is introduction of probiotics as one of the ingredients. Unquestionable leaders in this area are Danone and Zott with such brands as Actimel and Activia. The native dairy sector also offers innovative products in this
(Mlekpol
Dairy Plant) has the following brands in its offer: Milko,
(Jogo Lodz Dairy Plant) Jogo – the
(OSM) Krasnystaw (Krasnystaw Regional Dairy Plant) – (Koscian Regional Dairy
Plant) (Wart Regional
Dairy Plant) – Milk – probiotic yoghurts. Additionally, Mlekovita and Bakoma developed innovative products enriched with B and D group vitamins and calcium for young consumers (children). In addition, anti-cholesterol products have appeared on the market such as Benecol
As far as the innovative activities in the natural yoghurt segment are concerned, the producers have focused on the changes in the composition of the base product. On a marketing level, emphasis was put on the message intended for a potential consumer focusing on health properties of the product (probiotic bacteria
increased immunity) and application of varied modern packaging. It is worth noting that natural yoghurts have substituted fatty gravies and cream.
The product range in this segment is continually enriched with new solutions. This concerns functioning of the natural yoghurt with or without sugar on the market, which can be eaten with a spoon, or in a drinkable form, with an addition of crop grains or in the so-called light
products from ecological farms. The leaders in this area are Danone and Zott. Among the Polish producers, worth mentioning are such companies as Bakoma, Bacha, SM Mlekpol (Mlekpol Dairy Plant) and LSM Jogo (Jogo Lodz
Dairy Plant), OSM Krasnystaw (Krasnystaw Regional
Dairy Plant), OSM Nowy Dwor Gdanski (Nowy Dwor
___________________________4 Functional products are products which due to application of food additives have additional effect on human
organism in comparison with their traditional counterparts (Gorski J., 2012). Functional food meaning such food products that in addition to their basic task, i.e. nutrition, have other psychological or physiological effect on
M. Chadrzynski Product and Marketing Innovation on the Yoghurt Market in Poland
Economic Science for Rural Development No. 32, 2013
ISSN 1691-3078
162
Gdanski Dairy Plant) and SSM Jana (Jana Dairy Plant). The innovative activities in this product group focus on such elements as being made of natural ingredients and application of modern packaging, health features and
2012).Yoghurts with fruits are one of the leading dairy
categories. Zott’s Jogobella line has a considerable share
Group.
into the basic composition of the product were initiated already in 1990s. Additionally, marketing activities concerning introduction of new packaging were initiated with respect to both shapes (pots, buckets, bottles), base product weight and advertising spots informing of
Through the introduction of yoghurts with extra large fruit pieces, Zott built a strong market position. Danone is also placed among market leaders with its offer of yoghurts with fruits at the bottom of the pot and the Ale
(What Fruit!) brand as well as Bakoma offering the Polskie Smaki (Polish Flavours) product line.
Yoghurts with fruits are but one of the leading dairy categories. In the period from February 2009 to January 2010, the quantitative share of products that can be eaten with a spoon was 72.5%, while the value share was at the level of 72.7 million (Gorska J., 2011).
A novelty introduced to the market by the producers is a range of the so-called bio products, which are made of the milk of cows from ecological farms; these products contain pieces of fruit also produced by ecological farms. Olma, EkoLukta, and Granarolo offer such products.
In addition to the bio products, novelties gaining in popularity are fruit yoghurts from goat milk supplied by Agro Danmis. The LSM Jogo (Jogo Lodz Dairy Plant) offers Jogo Max 0% fat products to its consumers. Undeniably, in the probiotic product range, Danone with its Activia occupies the leading position. The new trends in this segment include yoghurts with the fruit mousse -
(7 Crops Men)
In the group of creamy yoghurts, the innovative activities are aimed at changing the composition of the
Danone has the largest product range in this segment; it supplies, among other things, such products
(Creamy Sponge Finger)
and Kremowy Wafelkowy (Creamy Wafer) yoghurts and a broad range of Fantasia yoghurts available in
yoghurts with fruits at the bottom of the pot in various
Another important producer on the creamy yoghurt market is Müller - a German company offering Jogurty Mix (Yoghurt Mix). Bakoma offers a wide range of
Plant) supplies creamy yoghurts from Arabella line,
while Mlekpol offers Augustowski yoghurt in coffee
A new category in this segment are spicy yoghurts, which can be used as additions to meat and vegetable
fresh cucumber and garlic, while Zott and Mevgal have
Among product categories referred to as breakfast yoghurts, innovative activities have been focused on a change of the base product, i.e. mainly additions, base weight and package shape.
The market for these products can be divided into three categories: fruit yoghurts; natural yoghurts with grains; yoghurts in packaging with an additional container
Danone, which is perceived as the largest producer in this segment, offers novelty natural yoghurts with
and Fantasia line yoghurts with an addition of
Zakrecony Mix (Twisted Mix)
corn covered with chocolate. The health products offered by the company include Activia with musli and
plum, and cranberry. Additionally, the Activia product line is distinguished on the market with a special packaging - the shape and style of the bottles attracts attention of consumers.
Bakoma has introduced a wide range of fruit yoghurts (7 Crops) in varied weights
of 150 g, 170 g, and 270 g. This category includes a composition of various crops such as wheat, barley,
novelty is introduction of the 7 crops yoghurts in drinking version.
(Jogobella 8 Crops).
yoghurts with fruits and in various musli combinations. The Polmlek Group delivers drinking yoghurts with crop grains and an addition of collagen while Okregowa
(Lowicz Regional Dairy
Plant) offers yoghurt with honey and crop grains
Taking into account all the materials of which the packaging is made, plastics dominates the market. A novelty in this area is the so-called biodegradable plastic developed by the researchers from Malaysia during the International Invention, Innovation and Technology Exhibition (ITEX) organised in Kuala Lumpur in 2009. A biodegradable variety of plastic is made of fruit waste (banana skin, rambutan, or cempedak). The fruit plastic is 10% cheaper in comparison with traditional plastics, it degrades faster in natural environment, and its durability is estimated at up to do 2 years in the optimum conditions, if it is not in contact with soil or water
the Norwegian company - Time Tempa testing innovative labels that identify durability (shelf life) of the products. The label is stuck to the packaging and accompanies the product from storehouse up to the point of distribution. Due to chemical reactions, it provides information on
M. Chadrzynski Product and Marketing Innovation on the Yoghurt Market in Poland
163
Economic Science for Rural Development No. 32, 2013
ISSN 1691-3078
ConclusionFurthermore, the purpose of the paper was to identify
and present in a synthetic manner actions undertaken with respect to introduction of product and marketing innovations by the dairy sector companies in Poland. The conducted analyses allow formulating the following conclusions.1.
2. Large international groups together with big dairy plants with Polish capital dominate the innovative dairy product offer. This fact, among other things is a result of high capital consumption of innovative activities, which is not only linked with the product as such but also with marketing. It is generally acknowledged that the innovative nature of the entire dairy industry in Poland is on a low level. In discussions, experts point out that the main barrier is
of the dairy plants - this particularly concerns small
that innovative activity should focus on the question of cost lowering, improved quality of health aspects of the products.
3. Innovative activities concerning innovative dairy products such as yoghurts focus mainly on the changes of composition of the basic product and use of additives. It can be said that the dairy products’ enhancement is one of the best developed areas of innovation in the food industry. American researchers who observed this phenomenon in the 1930s of the last century, jointly declared that milk and its products are perfect media for this purpose. The changes also concern the form in which the product is marketed. There are distinguished yoghurts eaten with a spoon and drinking yoghurts. Additions include pieces of fruits, musli, crop
concerns introduction of health components such as: probiotics, vitamins, antioxidants, sterols, and omega - 3 acids. There is a wide range of products including additions stimulating immunity, digestive and weight-watching processes, or having an anti-cholesterol effect (e.g. Benecol yoghurts).
4. The innovative activities also consist in the development of new product categories, which are hybrids of its own kind. A good example of it can be a line of drinking yoghurts with an addition of fruits, priobiotic bacteria, and omega – 3 acids marketed
products with an addition of aloes, cranberry, and pomegranate and lychee with limette. Mlekpol offers the Milko drinking yoghurt lines with an addition of
5. Development of an innovative product without informing consumers of its existence does not bring the desired effect in the form of measurable sales revenues. It seems necessary to inform potential buyers of the existence of the product, its unique features in all aspects with special emphasis of the health aspects. Beside information, communication with the consumer is also required, as it provides companies with product feedback on the functional aspect of their products. Marketing innovation
concerns organisation of advertising campaigns, market segmentation (e.g. drinking yoghurts are intended for active consumers from large agglomerations, women), container patters and
that occur at the intersection of a product and a marketing innovation concern the base weight of the marketed products. The companies also offer large
aspect (possibility to consume them during a trip, excursion, or at work). It can be observed that availability of varied packaging results into increased demand for the product.
6. In pursuit of obtaining the largest possible income, companies combine the exposition of unique product features with considerable resources allocated to marketing. This obviously concerns activities of large companies and groups of companies (Mlekovita, Mlekpol, Polmlek Group, Krasnystaw Dairy Plant, and others). Smaller market participants have to target regional and local markets.
7. Based on the performed analyses and market observations, it can be concluded that companies operating in the milk processing sector will continue to introduce innovative products focusing on the changes of the base product ingredients and application of additives in one of the products. Particular attention will be focused on health aspects and effects. It is evident that communication with customers, observing their new needs, and responding to them by developing products satisfying these needs gain in importance.
8. Market observations allow to conclude that companies should direct their innovative activities towards products with the lowest amount of preservatives and additives possible, such additives being perceived by the consumers as unhealthy. With regard to packaging, companies should focus on the application of environment-friendly packaging, especially the one made from biodegradable materials.
9. The scale of company’s operation is a limitation to the individualised consumer approach. Large companies tend to focus on increasing the production volume
changing market as the process involves high costs of technological lines, personnel, etc. Therefore,
changing market needs are more likely to emerge in this market segment.
Bibliography1. Bioplastic Packaging from Fruit Peel? (2012).
Retrieved: NEWS/831/. Access: 25.01.2012.
2. Bugala, A. (2012). Cheese Market in Poland Develops,
Consumption Still Below the EU Average. Retrieved: http://ksow.pl/rynki-rolne/news/entry/3342-rynek-
. Access: 28.10.2012.
3. Consumption of Milk and Its Processing; A Gradual
Growth of Consumption. (2012). Retrieved: http://
M. Chadrzynski Product and Marketing Innovation on the Yoghurt Market in Poland

Economic Science for Rural Development No. 32, 2013
ISSN 1691-3078
164
. Access: 27.10.2012.
4. Domanski, T., Bryla, P. (2010): Food Products
Marketing, PWE, Warsaw.5. Garbarski, L. (ed.) (2011): Marketing: Key Notions
and Practical Applications, PWE, Warsaw.6. Gorska, J. (2011). Yoghurts with Pieces of Fruits.
Fruit as a Success Maker. Milk Forum. Trade., No. 1 (44), pp. 46-48.
7. Gorski, J. (2010). Dairy Vitamins and Minerals. Milk
Forum. Business .,No. 1 (07).8. Gorski, J. (2009). The Driving Force of Innovation.
Milk Forum. Trade., No. 2 (33).9. Gorski, J
Milk Forum. Trade., No. 2 (39), pp. 24-30.10. Gorski, J. (2012). Functional Products: Fashion
and Hope for the Future. Milk Forum. Trade.,
No. 1 (50).11. Information Bulletin of the Ministry of Agriculture
and Rural Development, No. 1-2/2010.12. Jablonska – Urbaniak, T. (ed.) (2010): Agriculture
and Food Economy in Poland, Ministry of Agriculture and Rural Development, Warsaw. pp. 22-25.
13. P. (2010). Abundance of Flavour and Health. Milk Forum. Trade., No. 3 (40), pp. 38-43.
14. P. (2010). In A Yoghurt and Fruity Fashion. Milk Forum. Trade., No. 5 (42), pp. 30-32.
15. Matusiak, K. B. (ed.) (2011): Innovation and
Technology Transfer. Dictionary, Polish Agency for Enterprise Development, Warsaw, pp. 106-107, 110-112.
16. Milk market – status and prospects, No. 43
Agricultural and Food Economics - National Research Institute], Warsaw, pp. 8, 11.
17. Norway: Innovative Labelling. (2012). Retrieved: .
Access: 25.01.2012.18. Piekut, M. (2010). Not Only for Breakfast. Milk
Forum. Trade., No. 4 (41), p. 56.19. Piekut, M. (2010). Yoghurt Delight. Milk Forum.
Trade., No. 6 (43), pp. 44-45.20. Production of Industrial Products in 2011, (2012),
GUS [ ], Warsaw, July 2012. Retrieved: http://www.stat.gov.pl/gus/5840_792_PLK_HTML.htm. Access: 28.10.2012.
21. J. (2012). Growing Consumption of
Yoghurts in Poland, [in:] Electronic Agricultural
Magazine
Library in Warsaw, Warsaw. Retrieved: http://rme.cbr .ne t .p l / index .php?opt ion=com_content&view=art ic le&id=125:ronie-spoycie-jogurtow-w-polsce&catid=51:rolnictwo-w-unii-europejskiej&Itemid=91. Access: 28.10.2012.
22. Purchase and Prices of Agri-products in the 2011
year, (2012), GUS [ ], Warsaw. Retrieved: http://www.stat.gov.pl/cps/rde/xbcr/gus/rl_skup_ceny_produktow_rolnych_2011.xls. Access: 26.11.2012.
23. Socha, A. (2002) Probiotics and
Prebiotics as an Example of Functional Food,
pp. 15-18.
24. A. (2010). Nature in a Pot. Milk
Forum. Trade., No. 2 (39), pp. 52-57.25. R. (2012). An interview with the
Mlekpol President: We Need Economic Priorities. Retrieved:
. Access: 23.10.2012.
M. Chadrzynski Product and Marketing Innovation on the Yoghurt Market in Poland

165
Economic Science for Rural Development No. 32, 2013
ISSN 1691-3078
M. Gebska Consumer Perception and Willingness to Pay for The Welfare of Livestock During Long-Distance Transportation
___________________________1 [email protected] 2 Eggs bearing number 0 – organic, 1 – free range, 2 – barn , 3 – caged
CONSUMER PERCEPTION AND WILLINGNESS TO PAY FOR THE WELFARE OF LIVESTOCK DURING LONG-DISTANCE TRANSPORTATION
Monika Gebska1, PhDWarsaw University of Life Sciences, Poland
Abstract. The aim of this paper was to determine the level of awareness of consumers in terms of welfare of farm animals during long-distance transportation, and to examine the expectations of consumers in this regard. The
The research results indicate that the price was one of the main criteria determining the selection of meat and meat products. It was found that Polish consumers did not pay attention to the conditions or level of welfare of farm animals during long-term transportation when making decisions with regard to the purchase of meat. Key words: consumer, willingness to pay, animal welfare, transport, campaign. JEL code: Q110
IntroductionDecisions of consumers when purchasing products
aspects include the price, origin, brand, trademarks and, of course, the quality attributes such as taste, colour, smell etc. Numerous research projects also indicate that the interest of consumers – particularly those of the Western Europe – in safety of food, including the production technology, is growing. Therefore, the ethical aspect of use of animals for production of food is becoming
animals, that is, the conditions of breeding, feeding, and taking care of animals on farms, during transportation and slaughter. The results of research conducted by The European Food Safety Authority in 2010 show that 64% of European consumers are concerned with farm animal welfare. According to a 10-point scale, the respondents assigned to it the average score of 7.8 (Special Eurobarometer 354, 2010). In 2005, interest in animal welfare in the context of its impact on food safety was reported by only 60% consumers. Differences in the level of consumer interest in the issue have been presented in Figure 1 (Special Eurobarometer, 2010).
Most consumers having concerned with the issue of welfare were recorded in Luxemburg (81%), Portugal, Denmark (76%) and Italy (75%), and the least – in Romania (49%), Bulgaria (48%), and Hungary (44%). The data indicate that in countries, which became Member States of the European Union after 2004, a lesser number
level of concern has increased since 2005, particularly, in Finland (66%; +18), Lithuania (58%; +16), and Luxembourg (81%; +15) (Special Eurobarometer 354, 2010).
According to the research results, the increasing number of consumers is taking into account the aspect of animal welfare in their purchase decisions. In Great
on free range. In France, in the year 2006, more than
62% broilers on the market were bred in accordance with
(BBFAW, 2012). Nevertheless, demand for products obtained from
animals bred on the improved welfare conditions is still limited. In many countries of the Eastern Europe, consumers have no access to such products or this access is very limited. Another barrier is caused by the lack of knowledge on the breeding methods and the resulting level of welfare of animals. The situation is worsened by the lack of information concerning the maintenance system on the product labels. An exception in this regard is the case of consumer eggs, marked with a numerical code from 0 to 3, specifying the system of breeding of laying hens2
barrier, since the prices of animal products obtained from animals bred on these improved conditions are much higher in comparison with the prices of products obtained from animals bred in the conventional systems (Gebska M., 2012; Gebska M., Malak-Rawlikowska A., 2012; Majewski E. et al., 2012). Raising of welfare standards results in additional costs throughout the entire food chain, and the chain participants should be able to regain these from the market. In order for this to be possible, the consumers must be aware of this fact and ready to bear the additional costs.
However, many data indicate that consumers are rather unwilling to cover the additional costs, resulting from the improvement of animal welfare, although they declare such readiness (Napolitano et al., 2008; Schröder, McEachern, 2004; Tawse, 2010). Their willingness to pay a higher price depends on the economic situation and level of awareness of the
is consumer income and awareness of animal welfare, the higher is their willingness to pay for products coming from animals bred on improved welfare conditions. As a result, most consumers purchase such products very rarely or they do not purchase them at all (Webster A., 2001), and only 10% (Schröder M.,
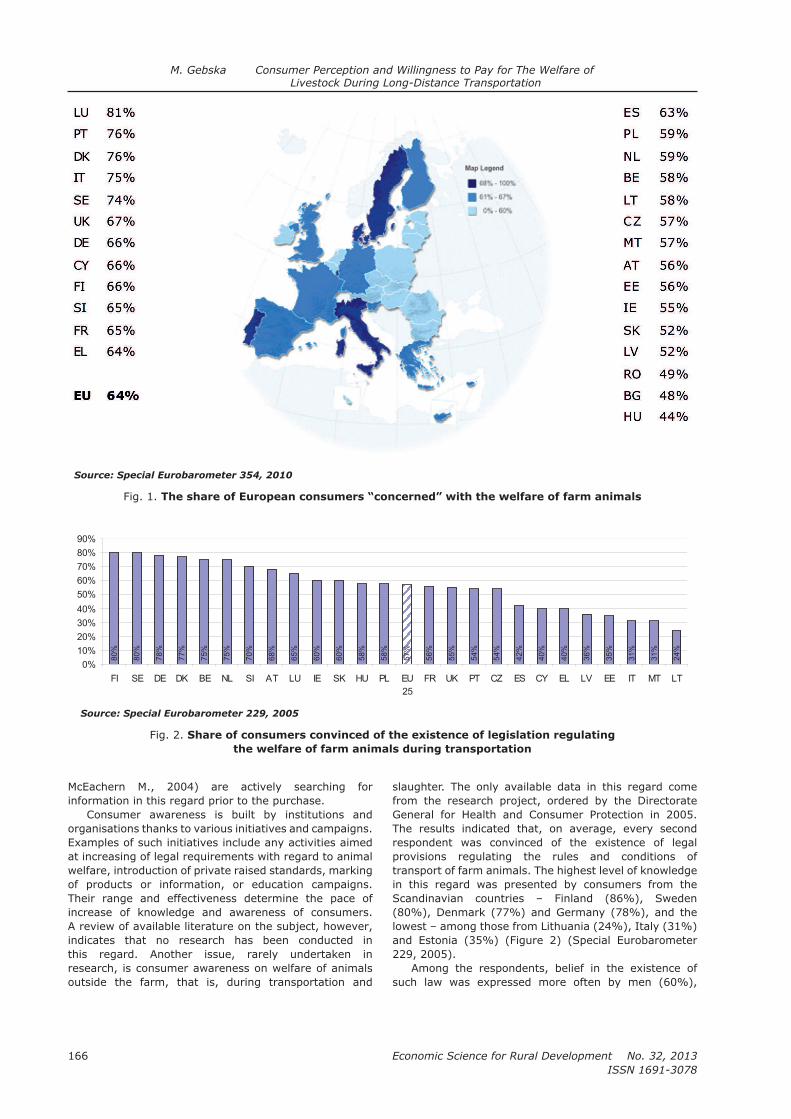
Economic Science for Rural Development No. 32, 2013
ISSN 1691-3078
166
McEachern M., 2004) are actively searching for information in this regard prior to the purchase.
organisations thanks to various initiatives and campaigns. Examples of such initiatives include any activities aimed at increasing of legal requirements with regard to animal welfare, introduction of private raised standards, marking of products or information, or education campaigns. Their range and effectiveness determine the pace of increase of knowledge and awareness of consumers. A review of available literature on the subject, however, indicates that no research has been conducted in this regard. Another issue, rarely undertaken in research, is consumer awareness on welfare of animals outside the farm, that is, during transportation and
slaughter. The only available data in this regard come from the research project, ordered by the Directorate
The results indicated that, on average, every second respondent was convinced of the existence of legal provisions regulating the rules and conditions of transport of farm animals. The highest level of knowledge in this regard was presented by consumers from the Scandinavian countries – Finland (86%), Sweden (80%), Denmark (77%) and Germany (78%), and the lowest – among those from Lithuania (24%), Italy (31%) and Estonia (35%) (Figure 2) (Special Eurobarometer 229, 2005).
Among the respondents, belief in the existence of such law was expressed more often by men (60%),
Fig. 1. The share of European consumers “concerned” with the welfare of farm animals
80%
80%
78%
77%
75%
75%
68%
65%
60%
60%
58%
58%
57%
56%
55%
54%
54%
42%
40%
40%
36%
35%
31%
31%
24%
70%
0%
10%
20%
30%
40%
50%
60%
70%
80%
90%
FI SE DE DK BE NL SI AT LU IE SK HU PL EU
25
FR UK PT CZ ES CY EL LV EE IT MT LT
Fig. 2. Share of consumers convinced of the existence of legislation regulating
the welfare of farm animals during transportation
M. Gebska Consumer Perception and Willingness to Pay for The Welfare of Livestock During Long-Distance Transportation
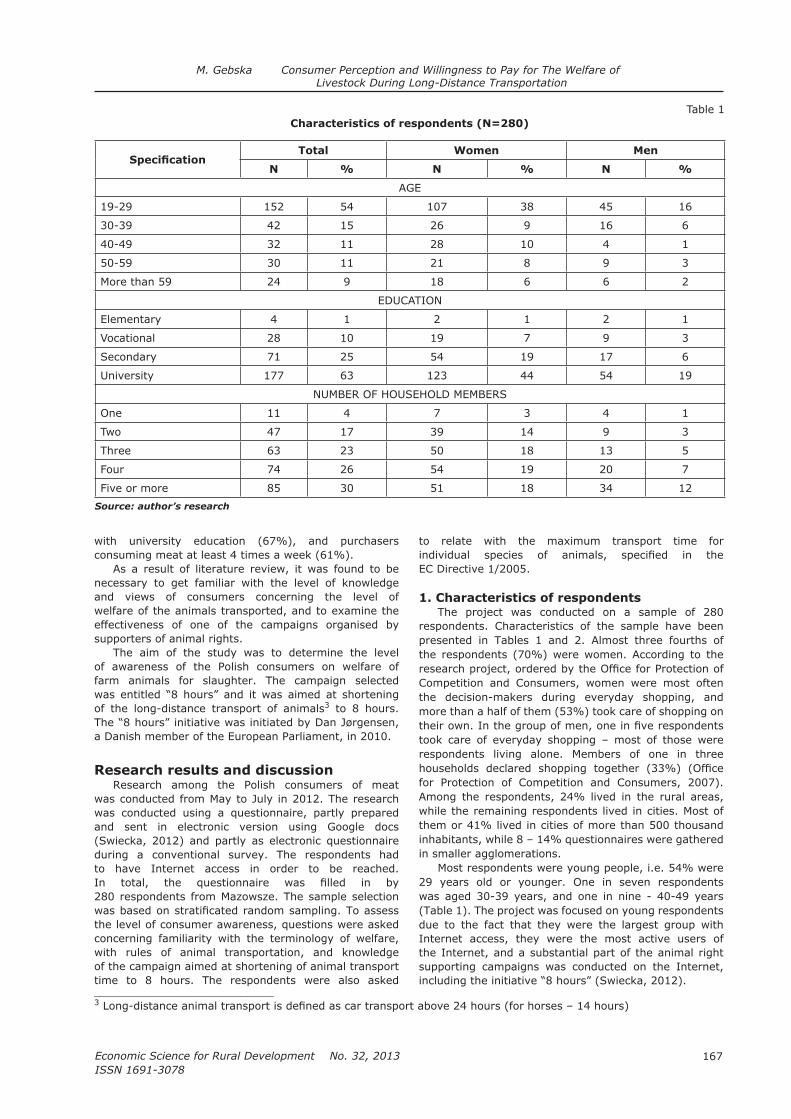
167
Economic Science for Rural Development No. 32, 2013
ISSN 1691-3078
with university education (67%), and purchasers consuming meat at least 4 times a week (61%).
As a result of literature review, it was found to be necessary to get familiar with the level of knowledge and views of consumers concerning the level of welfare of the animals transported, and to examine the effectiveness of one of the campaigns organised by supporters of animal rights.
The aim of the study was to determine the level of awareness of the Polish consumers on welfare of farm animals for slaughter. The campaign selected
of the long-distance transport of animals3 to 8 hours.
a Danish member of the European Parliament, in 2010.
Research results and discussionResearch among the Polish consumers of meat
was conducted from May to July in 2012. The research was conducted using a questionnaire, partly prepared and sent in electronic version using Google docs (Swiecka, 2012) and partly as electronic questionnaire during a conventional survey. The respondents had to have Internet access in order to be reached.
the level of consumer awareness, questions were asked concerning familiarity with the terminology of welfare, with rules of animal transportation, and knowledge of the campaign aimed at shortening of animal transport time to 8 hours. The respondents were also asked
to relate with the maximum transport time for
1. Characteristics of respondentsThe project was conducted on a sample of 280
presented in Tables 1 and 2. Almost three fourths of the respondents (70%) were women. According to the
the decision-makers during everyday shopping, and more than a half of them (53%) took care of shopping on
took care of everyday shopping – most of those were respondents living alone. Members of one in three
Among the respondents, 24% lived in the rural areas, while the remaining respondents lived in cities. Most of them or 41% lived in cities of more than 500 thousand inhabitants, while 8 – 14% questionnaires were gathered in smaller agglomerations.
Most respondents were young people, i.e. 54% were 29 years old or younger. One in seven respondents was aged 30-39 years, and one in nine - 40-49 years (Table 1). The project was focused on young respondents due to the fact that they were the largest group with Internet access, they were the most active users of the Internet, and a substantial part of the animal right supporting campaigns was conducted on the Internet,
Table 1Characteristics of respondents (N=280)
Total Women Men
N % N % N %
AGE
19-29 152 54 107 38 45 16
30-39 42 15 26 9 16 6
40-49 32 11 28 10 4 1
50-59 30 11 21 8 9 3
More than 59 24 9 18 6 6 2
Elementary 4 1 2 1 2 1
Vocational 28 10 19 7 9 3
Secondary 71 25 54 19 17 6
University 177 63 123 44 54 19
NUMBER OF HOUSEHOLD MEMBERS
One 11 4 7 3 4 1
Two 47 17 39 14 9 3
Three 63 23 50 18 13 5
Four 74 26 54 19 20 7
Five or more 85 30 51 18 34 12
Source: author’s research
___________________________3
M. Gebska Consumer Perception and Willingness to Pay for The Welfare of Livestock During Long-Distance Transportation
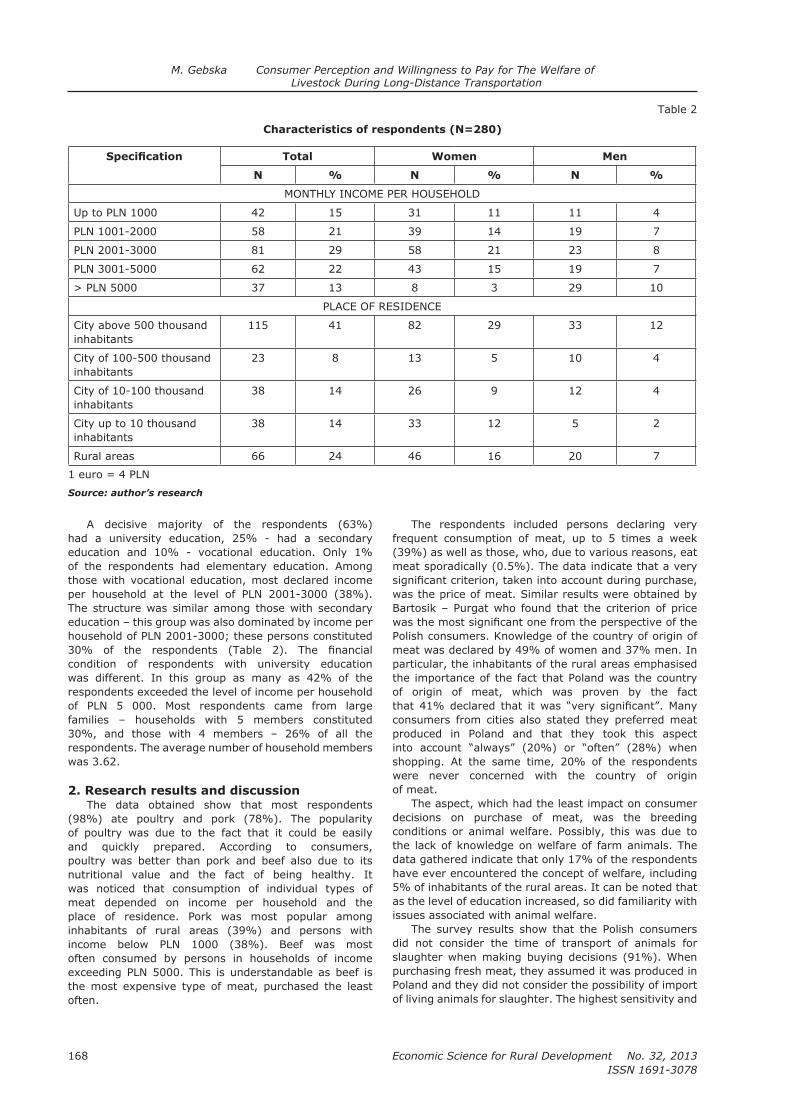
Economic Science for Rural Development No. 32, 2013
ISSN 1691-3078
168
A decisive majority of the respondents (63%) had a university education, 25% - had a secondary education and 10% - vocational education. Only 1% of the respondents had elementary education. Among those with vocational education, most declared income per household at the level of PLN 2001-3000 (38%). The structure was similar among those with secondary education – this group was also dominated by income per household of PLN 2001-3000; these persons constituted
condition of respondents with university education was different. In this group as many as 42% of the respondents exceeded the level of income per household of PLN 5 000. Most respondents came from large families – households with 5 members constituted 30%, and those with 4 members – 26% of all the respondents. The average number of household members was 3.62.
2. Research results and discussion The data obtained show that most respondents
(98%) ate poultry and pork (78%). The popularity of poultry was due to the fact that it could be easily and quickly prepared. According to consumers, poultry was better than pork and beef also due to its nutritional value and the fact of being healthy. It was noticed that consumption of individual types of meat depended on income per household and the place of residence. Pork was most popular among inhabitants of rural areas (39%) and persons with income below PLN 1000 (38%). Beef was most often consumed by persons in households of income exceeding PLN 5000. This is understandable as beef is the most expensive type of meat, purchased the least often.
The respondents included persons declaring very frequent consumption of meat, up to 5 times a week (39%) as well as those, who, due to various reasons, eat meat sporadically (0.5%). The data indicate that a very
was the price of meat. Similar results were obtained by Bartosik – Purgat who found that the criterion of price
Polish consumers. Knowledge of the country of origin of meat was declared by 49% of women and 37% men. In particular, the inhabitants of the rural areas emphasised the importance of the fact that Poland was the country of origin of meat, which was proven by the fact
consumers from cities also stated they preferred meat produced in Poland and that they took this aspect
shopping. At the same time, 20% of the respondents were never concerned with the country of origin of meat.
The aspect, which had the least impact on consumer decisions on purchase of meat, was the breeding conditions or animal welfare. Possibly, this was due to the lack of knowledge on welfare of farm animals. The data gathered indicate that only 17% of the respondents have ever encountered the concept of welfare, including 5% of inhabitants of the rural areas. It can be noted that as the level of education increased, so did familiarity with issues associated with animal welfare.
The survey results show that the Polish consumers did not consider the time of transport of animals for slaughter when making buying decisions (91%). When purchasing fresh meat, they assumed it was produced in Poland and they did not consider the possibility of import of living animals for slaughter. The highest sensitivity and
Table 2
Characteristics of respondents (N=280)
Total Women Men
N % N % N %
Up to PLN 1000 42 15 31 11 11 4
PLN 1001-2000 58 21 39 14 19 7
PLN 2001-3000 81 29 58 21 23 8
PLN 3001-5000 62 22 43 15 19 7
> PLN 5000 37 13 8 3 29 10
inhabitants115 41 82 29 33 12
inhabitants23 8 13 5 10 4
inhabitants38 14 26 9 12 4
inhabitants38 14 33 12 5 2
Rural areas 66 24 46 16 20 7
1 euro = 4 PLN
Source: author’s research
M. Gebska Consumer Perception and Willingness to Pay for The Welfare of Livestock During Long-Distance Transportation

169
Economic Science for Rural Development No. 32, 2013
ISSN 1691-3078
awareness of transport times was shown by persons aged 40-49 years. The elder population – aged 59 or more – did not consider this at all.
or Special Eurobarometer, awareness of the problem of welfare of animals in the Polish society is relatively high.
hypothesis. Perhaps the knowledge of the food supply chain among the consumers is very low; in particular, they may not be aware of what is going on with the animals, before the meat is consumed. Sometimes this fact is explained by a sense of guilt – when purchasing meat, they do not want to remember where the meat comes from. To stimulate changes in consumer behaviour, it is necessary to remind them how food is being produced
by consumers who often visit farms or have their own animals (Special Eurobarometer 229, 2005).
was found to be very low – only 8% of the respondents had heard of it. The data obtained show a correlation between familiarity with the campaign and the age of respondents.
Women displayed a more emotional attitude towards ethical issues associated with the time of transport of animals – 104 of them considered the activities aimed at
to conclude that as the level of education grows, the consumers are increasingly sensitive to the need for activities aimed at shortening the animal transport time to 8 hours.
A decisive majority of respondents, after getting familiar with the rules of the Regulation 1/20054 regulating the maximum time of transport of animals, considered them inhumane (Swiecka, 2012). The consumers showed similar attitudes towards the time of transport of pigs, cattle, and horses, declaring that amendment to the existing law were necessary, as at
present, the legal provisions allow the transport times to be too long. Shortening of the animal transport time to 8 hours would result in limiting of import of animals due to the limitations introduced in the maximum time of transport of animals for slaughter. As a result of these limitations, most livestock would be probably transported only within the domestic territory. Inhabitants of the rural areas should be particularly concerned with supporting of domestic production, which gives them workplaces and – in many cases – the only source of income; in fact, only 51% of them supported the concept of shortening of the transport time. On the one hand, the respondents declared the need to shorten the animal transport time, considering the existing regulations to be inhumane; on the other hand, they showed little willingness to bear the costs of such activity (Table 3).
The data presented in Table 3 indicate that 43% of the respondents expressed no willingness to pay a higher price for meat, considering that the prices of this product are already very high. The household income of these respondents was at the lowest level of up to 2000 PLN/month (27%) and up to 3000 PLN/month (27%), while the average income per person was
purchase of meat. Persons with secondary education were willing to accept a price increase by 10%, and those with university education – even by 20-30%; income per person amounted to 1640 PLN/month and 2400 PLN/month, respectively.
The respondents were asked to assess the factors providing animals with favourable conditions during transport by assigning to them scores from 0 to 3.
water and feed, and ventilation and temperature control (Figure 3).
In order to ensure animal welfare, 6% of the respondents suggested intensifying road inspections during transport to make sure that the legislation is followed, while 2% of them pointed to the necessity of
Table 3Consumer willingness to pay for meat at a price increased due to the shortening of
animal transport time to 8 hours depending on gender and education
No.
Total Gender Education
N % Female Male ElementaryVoca-
tional
Secon-
daryUniversity
1. No, meat is already expensive
119 43 72 47 4 18 34 63
2. Yes, by no more than 10%
97 35 79 18 0 5 19 73
3. Yes, by no more than 20% 24 9 14 10 0 2 2 20
4. Yes, by no more than 30%
9 3 9 0 0 0 3 6
5. Yes, the price is
to me31 11 26 5 0 3 13 15
Source: author’s research
___________________________4 The acceptable transport time according to the Regulation 1/2005 is: for pigs - 24 h, for cattle - 29 h, for
horses - 14 h. After this time, it is necessary to provide a 24-hour rest, before the animals can be transported further to the destination.
M. Gebska Consumer Perception and Willingness to Pay for The Welfare of Livestock During Long-Distance Transportation
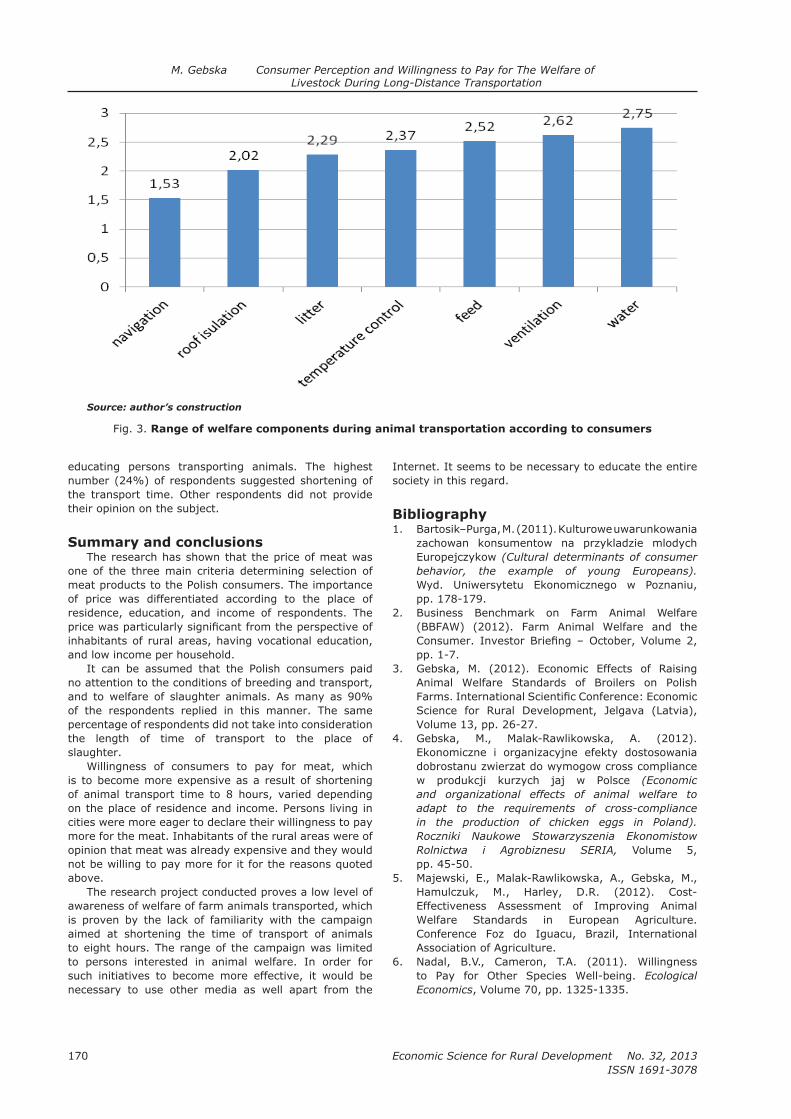
Economic Science for Rural Development No. 32, 2013
ISSN 1691-3078
170
educating persons transporting animals. The highest number (24%) of respondents suggested shortening of the transport time. Other respondents did not provide their opinion on the subject.
Summary and conclusionsThe research has shown that the price of meat was
one of the three main criteria determining selection of meat products to the Polish consumers. The importance of price was differentiated according to the place of residence, education, and income of respondents. The
inhabitants of rural areas, having vocational education, and low income per household.
It can be assumed that the Polish consumers paid no attention to the conditions of breeding and transport, and to welfare of slaughter animals. As many as 90% of the respondents replied in this manner. The same percentage of respondents did not take into consideration the length of time of transport to the place of slaughter.
Willingness of consumers to pay for meat, which is to become more expensive as a result of shortening of animal transport time to 8 hours, varied depending on the place of residence and income. Persons living in cities were more eager to declare their willingness to pay more for the meat. Inhabitants of the rural areas were of opinion that meat was already expensive and they would not be willing to pay more for it for the reasons quoted above.
The research project conducted proves a low level of awareness of welfare of farm animals transported, which is proven by the lack of familiarity with the campaign aimed at shortening the time of transport of animals to eight hours. The range of the campaign was limited to persons interested in animal welfare. In order for such initiatives to become more effective, it would be necessary to use other media as well apart from the
Internet. It seems to be necessary to educate the entire society in this regard.
Bibliography1. Bartosik–Purga, M. (2011). Kulturowe uwarunkowania
(Cultural determinants of consumer
behavior, the example of young Europeans).
pp. 178-179.2. Business Benchmark on Farm Animal Welfare
(BBFAW) (2012). Farm Animal Welfare and the
pp. 1-7.3. Gebska, M. (2012). Economic Effects of Raising
Animal Welfare Standards of Broilers on Polish
Science for Rural Development, Jelgava (Latvia), Volume 13, pp. 26-27.
4. Gebska, M., Malak-Rawlikowska, A. (2012).
(Economic
and organizational effects of animal welfare to
adapt to the requirements of cross-compliance
in the production of chicken eggs in Poland). Roczniki Naukowe Stowarzyszenia Ekonomistow
Rolnictwa i Agrobiznesu SERIA, Volume 5, pp. 45-50.
5. Majewski, E., Malak-Rawlikowska, A., Gebska, M.,
Effectiveness Assessment of Improving Animal Welfare Standards in European Agriculture.
Association of Agriculture.6.
to Pay for Other Species Well-being. Ecological
Economics, Volume 70, pp. 1325-1335.
Source: author’s construction
Fig. 3. Range of welfare components during animal transportation according to consumers
M. Gebska Consumer Perception and Willingness to Pay for The Welfare of Livestock During Long-Distance Transportation
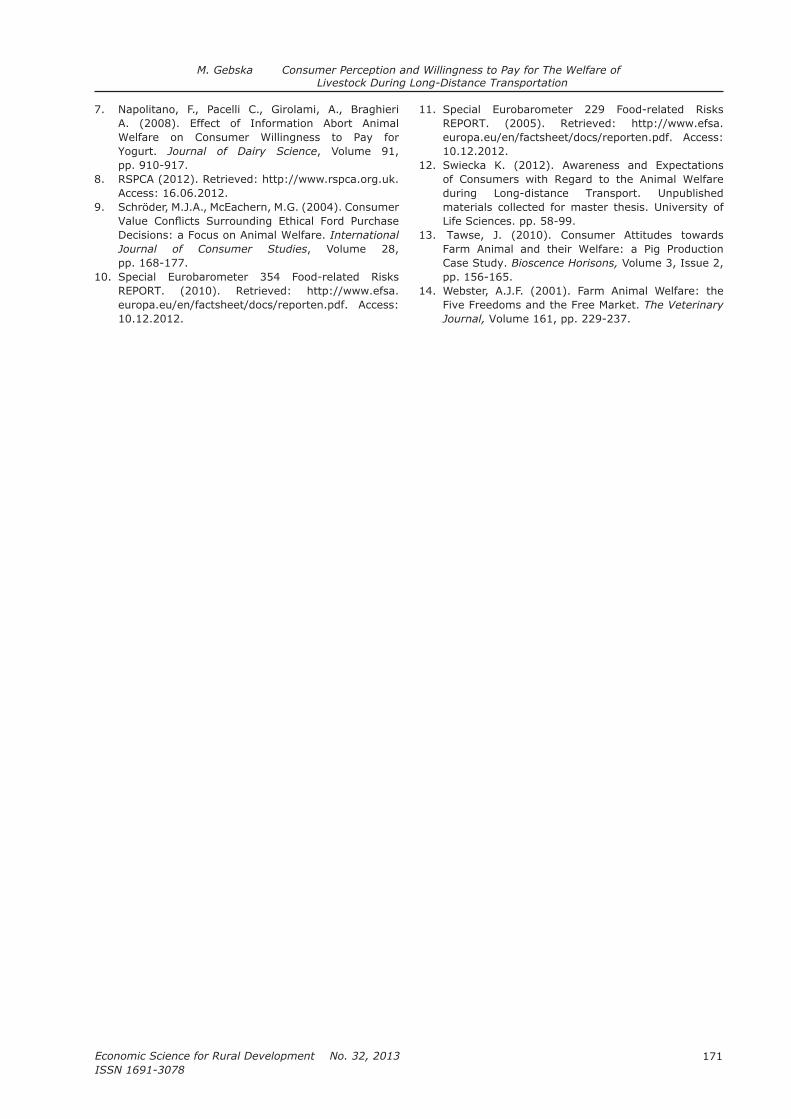
171
Economic Science for Rural Development No. 32, 2013
ISSN 1691-3078
7. A. (2008). Effect of Information Abort Animal
Yogurt. Journal of Dairy Science, Volume 91, pp. 910-917.
8. http://www.rspca.org.uk. Access: 16.06.2012.
9.
Decisions: a Focus on Animal Welfare. International
Journal of Consumer Studies, Volume 28, pp. 168-177.
10. Special Eurobarometer 354 Food-related Risks REPORT. (2010). Retrieved: http://www.efsa.europa.eu/en/factsheet/docs/reporten.pdf. Access: 10.12.2012.
11. Special Eurobarometer 229 Food-related Risks REPORT. (2005). Retrieved: http://www.efsa.europa.eu/en/factsheet/docs/reporten.pdf. Access: 10.12.2012.
12. Swiecka K. (2012). Awareness and Expectations
during Long-distance Transport. Unpublished materials collected for master thesis. University of Life Sciences. pp. 58-99.
13. Farm Animal and their Welfare: a Pig Production
Bioscence Horisons, Volume 3, Issue 2, pp. 156-165.
14. Webster, A.J.F. (2001). Farm Animal Welfare: the Five Freedoms and the Free Market. The Veterinary
Journal, Volume 161, pp. 229-237.
M. Gebska Consumer Perception and Willingness to Pay for The Welfare of Livestock During Long-Distance Transportation

Economic Science for Rural Development No. 32, 2013
ISSN 1691-3078
172
R. Prokeinova, T. Chrenko Consumption of Foodstuff – Better Indicator of the Sustainability
(Case Study About Slovakia)
___________________________1 E-mail address: Department of Statistics and Operation Research Faculty of Economics and Management Slovak University of Agriculture in Nitra Tr.A. Hlinku 2, 949 76 Nitra, Slovakia
CONSUMPTION OF FOODSTUFF – BETTER INDICATOR OF THE SUSTAINABILITY (CASE STUDY ABOUT SLOVAKIA)
Renata Prokeinova1, PhD, Ing.; Tomas Chrenko, Ing. Slovak University of Agriculture in Nitra
Abstract. The debate on sustainable consumption has highlighted a variety of tensions between the pursuit of wellbeing and the need to remain within ecological limits. The aim of the paper is to analyse situation in Slovakia and highlight the aspects of consumer decisions. We would like to state that the sustainability of the country is much easier to measure than counting footprint or
identifying sustainability and environmental performance. In the view of the economic situation in Slovakia, it could be said that the population tends to sustainable consumption as expenses keep growing. Analysis shows that the increase in prices for food and other items of daily life affect population with lower income level. They buy less food products; and from the economics viewpoint of the sustainability, it seems like a positive effect.The aim of the paper is to analyse consumption of foodstuff in Slovakia and highlight the aspects of consumer decisions. Key words: consumption, expenditure, sustainability.JEL code: A11, E21
Introduction The debate on sustainable consumption has
highlighted a variety of tensions between the pursuit of wellbeing and the need to remain within ecological limits (Reisch, Ropke, 2004; Defra, 2005; EEA, 2005; Jackson,
The idea of sustainable consumption is the possibility
2005; Jackson, 2008). This hypothesis has informed both conceptual and empirical responses to consumerism over several decades and underpins popular movements for
1998; Hamilton, 2003; Hamilton, 2003; Hamilton, Mail, 2003; Schor, 1998). The underlying suggestion is that less resource intensive lives might, in fact, be equally
terms (Kasser, 2002). However, this hypothesis raises a number of fundamental questions.
People in rich countries have consumption patterns that require more land, water, and fuel - fresh tropical fruit all year round, exotic coffee, large quantities of meat
over-large portions, and there is more food wastage. The growing middle class emerging in countries such as
meat consumption per capita from 1985 has risen up
Paper, 2008).What is the main reason for less level of consumption?
Is our consumption unsustainable?The aim of the paper is to analyse consumption of
the foodstuff in Slovakia and highlight the aspects of consumer decisions. We would like to show that if people
have lower income level, they consume less foodstuff. If they consume less foodstuff, then we do not need to produce huge agriculture production.
Research results and discussion
is studied by many other social sciences. Economists are particularly interested in the relationship between consumption and income, and therefore, in economics, the consumption function plays a major role (Paluchova, 2010).
of the Slovak Republic, is divided into basic departments.Food and soft drinks are all the costs associated
with the purchase of food and non-alcoholic beverages in the business network.
Alcoholic beverages and tobacco expenditures on alcoholic beverages, tobacco, and tobacco products.
Clothing and footwear are buying textile goods, footwear, and textile haberdashery (hard haberdashery included expenses for personal items), including their construction and repair. Housing, water, electricity, gas,
general, payments for the use of cooperative apartment; expenditures for purchases of goods and services for the construction and maintenance of housing; payments for electricity, gas, hot water and heat, other fuel, water, sewerage, and other expenses for services related to housing.
Furnishings, household equipment and routine household maintenance expenses include the purchase
household textiles and tableware; household utensils and cutlery; household investment nature; various kitchen

173
Economic Science for Rural Development No. 32, 2013
ISSN 1691-3078
R. Prokeinova, T. Chrenko Consumption of Foodstuff – Better Indicator of the Sustainability (Case Study About Slovakia)
Source: www.statistics.sk
Fig. 1. Total consumption in Slovakia in 1992-2011
utensils and equipment; costs for producing those goods and their repair, including expenses for marketing; gardening, craft equipment; goods and services for cleaning etc.
Health expenditure for pharmaceutical preparations and products, medical goods; for services provided by medical staff in hospitals and beyond, including those of different therapists. Set up transportation expenses
Meat
Eggs
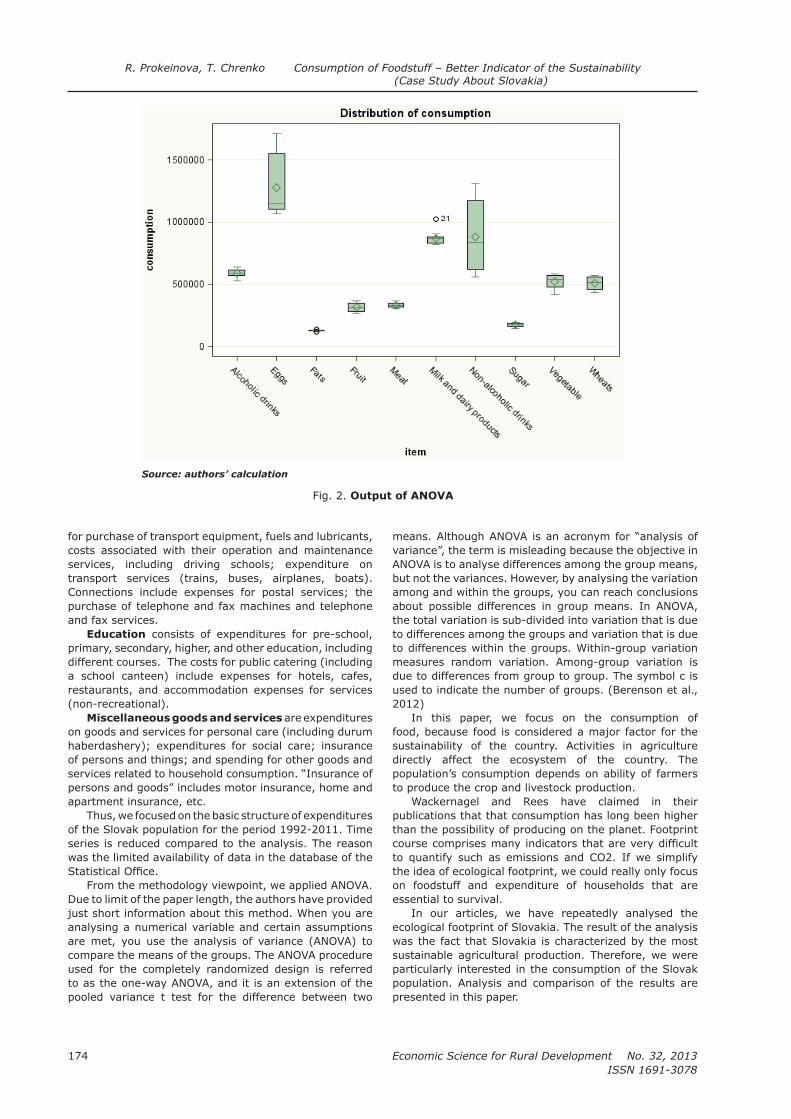
Economic Science for Rural Development No. 32, 2013
ISSN 1691-3078
174
R. Prokeinova, T. Chrenko Consumption of Foodstuff – Better Indicator of the Sustainability
(Case Study About Slovakia)
for purchase of transport equipment, fuels and lubricants, costs associated with their operation and maintenance services, including driving schools; expenditure on transport services (trains, buses, airplanes, boats).
purchase of telephone and fax machines and telephone and fax services.
Education consists of expenditures for pre-school, primary, secondary, higher, and other education, including different courses. The costs for public catering (including a school canteen) include expenses for hotels, cafes, restaurants, and accommodation expenses for services (non-recreational).
Miscellaneous goods and services are expenditures on goods and services for personal care (including durum haberdashery); expenditures for social care; insurance of persons and things; and spending for other goods and
apartment insurance, etc.Thus, we focused on the basic structure of expenditures
of the Slovak population for the period 1992-2011. Time series is reduced compared to the analysis. The reason was the limited availability of data in the database of the
From the methodology viewpoint, we applied ANOVA. Due to limit of the paper length, the authors have provided just short information about this method. When you are analysing a numerical variable and certain assumptions are met, you use the analysis of variance (ANOVA) to compare the means of the groups. The ANOVA procedure
to as the one-way ANOVA, and it is an extension of the pooled variance t test for the difference between two
ANOVA is to analyse differences among the group means, but not the variances. However, by analysing the variation among and within the groups, you can reach conclusions about possible differences in group means. In ANOVA, the total variation is sub-divided into variation that is due to differences among the groups and variation that is due to differences within the groups. Within-group variation measures random variation. Among-group variation is due to differences from group to group. The symbol c is used to indicate the number of groups. (Berenson et al., 2012)
In this paper, we focus on the consumption of food, because food is considered a major factor for the sustainability of the country. Activities in agriculture directly affect the ecosystem of the country. The population’s consumption depends on ability of farmers to produce the crop and livestock production.
Wackernagel and Rees have claimed in their publications that that consumption has long been higher than the possibility of producing on the planet. Footprint
the idea of ecological footprint, we could really only focus on foodstuff and expenditure of households that are essential to survival.
In our articles, we have repeatedly analysed the ecological footprint of Slovakia. The result of the analysis
sustainable agricultural production. Therefore, we were particularly interested in the consumption of the Slovak population. Analysis and comparison of the results are presented in this paper.
Source: authors’ calculation
Fig. 2. Output of ANOVA
175
Economic Science for Rural Development No. 32, 2013
ISSN 1691-3078
R. Prokeinova, T. Chrenko Consumption of Foodstuff – Better Indicator of the Sustainability (Case Study About Slovakia)
foodstuffs that are observed in terms of consumption. As one single graph for the period 1992-2011 would be most illustrative, we decided to present consumption of foods.
After looking at all the graphs, we can say that the total annual per capita consumption of basic food is decreasing. Even the consumption of alcoholic beverages is declining, however, on the other hand, the consumption of soft drinks has increased.
In terms of sustainability theory, we could conclude that it is a positive phenomenon. Furthermore, we can conclude that if we consume less food, farmers do not have so much pressure on agricultural production by
Historical data seem to indicate that in 1992, there was recorded a surplus food given that the population was 5 306 539 in 1992. In 2011, no consumption of food has decreased, while the population has increased slightly to 5 398 384.
of consumption of selected foods for this period. From a methodological point of view, we used ANOVA. Test
difference in the consumption of selected foods. That
in the table of descriptive characteristics. The major changes have been recorded for eggs and non-alcoholic beverages.
then we should apply the test for multiple comparisons.
paired comparisons. Nevertheless, the group was created on the basis of similarity values.
Basically, these groups correspond to the Box Plot chart. Eggs are a separate group. Subsequently, we see a group Milk and Non-alcoholic beverages. The outcomes suggest that, relatively the same amount has been purchased.
Another group consists of alcoholic beverages, vegetables, and wheat. Meat is bought in the same quantity as fruit. The last group consists of sugar and fats.
One can question how it is possible to ascertain the state of consumption. We assume that all residents are environmentally conscious and do not follow their food consumption. Thus, we focused on the basic structure of expenditures of the Slovak population for the period 1998-2011. Time series is reduced compared to the analysis. The reason was the limited availability of data
The basic structure consists of expenses: food and non-alcoholic beverages; alcoholic beverages; tobacco and narcotics; clothing and footwear; housing, water, electricity, gas and other fuels; furnishings, household equipment and routine maintenance of the house; health; transport; communications; culture and recreation; education; restaurants and hotels; miscellaneous goods and services.
In the chart, we can follow the development of costs by usage. It is clear that spending has increased in some
Table 1Output of the test for multiple comparisons
Tukey Grouping Mean N item
A 1280282 20 Eggs
B 881271 20 Non-alcoholic drinks
B
B 868171 20 Milk and dairy products
588598 20 Alcoholic drinks
522238 20 Vegetable
511567 20 Wheat
D 332396 20 Meat
D
D 315051 20 Fruit
E 173248 20 Sugar
E
E 127410 20 Fats
Source: authors’ calculation

Economic Science for Rural Development No. 32, 2013
ISSN 1691-3078
176
R. Prokeinova, T. Chrenko Consumption of Foodstuff – Better Indicator of the Sustainability
(Case Study About Slovakia)
areas by more than 100%. In particular, the food and non-alcoholic beverages and housing, water, electricity, gas and other fuels. Household consumption also changes due to the changes in prices.
We can see several long-term trends manifested in the consumer behaviour. One of the theorists, who
empirical material, was the Prussian statistician Ernst Engel (1821-1896). In his research, Engel concluded that if household income increases, the general tendency is manifested by the decline in the share of expenditure on food in the total household expenditure (Engel’s law).
Engel later expanded his investigation to include other groups of household expenditures (e.g. rent, clothing) and examined their development in relation to increasing household income. The current economic
theory explores these questions in detail by each household consumption item.
Keynes assumed the operation of the basic psychological law that income increases as consumption increases absolutely, but its share of the income decreases. The situation in Slovakia does not correlate with either theory. The situation in Slovakia describes a condition that could be called a crisis. Yet,
social crisis caused by political decisions and economic transformation of the 90s. The effects of transformation of the Slovak economy are only now beginning to appear.
The second possible variant of behaviour may be such that people buy more expensive products, which could be tuned to higher spending and smaller quantities
almost 60% of people have less than the average salary
Fig. 3. Total expenditure per inhabitant during the period 1998-2011
Food and non-alcoholic
beverages
Alcoholic beverages,
tobacco and narcotics
Clothing and footwear
Housing, water,
electricity, gas and…
Furnishings, household
equipment and…
Health
Transport
Communications
Recreation and culture
Education
Restaurants and hotels
Miscellaneous goods
and services
1998
Food and non-alcoholic
beverages
Alcoholic beverages,
tobacco and narcotics
Clothing and footwear
Housing, water,
electricity, gas and…
Furnishings, household
equipment and…
Health
Transport
Communications
Recreation and culture
Education
Restaurants and hotels
Miscellaneous goods
and services
2011
Fig. 4a.

177
Economic Science for Rural Development No. 32, 2013
ISSN 1691-3078
in Slovakia, and just few percent of people earning well could distort the amount of the average salary. The question of the future is: what is the actual price for sustainable consumption?
Residents of each country are sensitive to prices and costs, especially for food and housing, which are essential to life. In detail, we focused on the comparison between 1998 and 2011. Applying sun-ray charts and pie charts, we concluded that the spending has increased in almost all areas.
ConclusionsFinally, we would like to state that the sustainability
of the country could be easier to measure than counting footprint or other indicators focusing on different
sustainability and environmental performance.From the view of the economic situation in Slovakia,
it could be concluded that the population tends to sustainable consumption as expenses are growing. The present analysis shows that the increase in prices for food and other items of daily life alongside with low growth of
Bibliography 1. Berenson, M. et al. (2012). Basic Business Statistics:
2. Defra, 2005. Securing the Future—Delivering UK Sustainable Development Strategy. Department for the Environment, Food and Rural Affairs. The
3. Environment. EEA report no 11/2005. European
4.
pp. 619–643.
5.
6.
Discussion Paper, vol. 50. The Australia Institute,
7. Income and Expenditure of the Households in http://www.
statistics.sk/pls/elisw/MetaInfo.explorer?cmd=go&s=1002&sso=2&so=40 Access: 28.01.2013
8. Less? Is there a Double Dividend in Sustainable
9. Jackson, T., (2006). Earthscan Reader in
James, London.10.
Lifestyles. In: Gardner, G., Prugh, T. (Eds.), State of the World 2008. Worldwatch Institute,
11. Jackson, T., Papathanasopoulou, E., Bradley, P.,
to Functional Household Needs: A Pilot Framework for
June 2006.12. Kasser, T., (2002). The High Price of Materialism.
13. Miller, T. (1996). Explaining Keynes’ Theory
economic-truth.co.uk/content-essays/bsc/keynesconsumption.pdf. Access: 23.01.2013
14. produktu: Slovensko v kontexte vnimania slovenskymi respondentmi (Image of the country of
origin: Slovakia in the context of the perception of
Slovak respondents). In: Marketing a komunikace. ISSN 1211-5622. vol. 4, pp. 24-25.
15. Reisch, L., Ropke, I. (2004). The Ecological
16. Riggins, T. (2011). Frederick Engels on the Theoretical Development of Modern Socialism. Retrieved: http://www.politicalaffairs.net/frederick-engels-on-the-theoretical-development-of-modern-socialism. Access:28.01.2013
17. Samuelson, Nordhaus. (1998). Economy. Engels Law, Engels Theory. ISBN: 808044059X
Fig. 4b. Comparison of the total expenditure in 1998 and 2011, in %
R. Prokeinova, T. Chrenko Consumption of Foodstuff – Better Indicator of the Sustainability (Case Study About Slovakia)
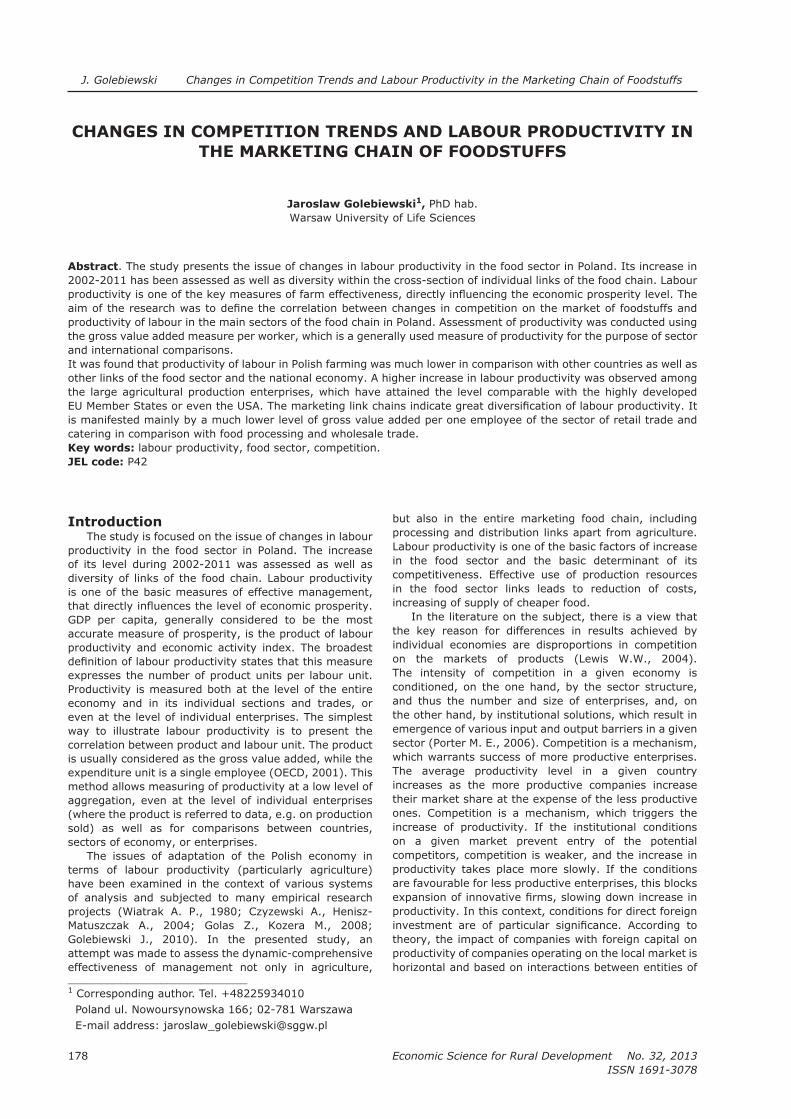
Economic Science for Rural Development No. 32, 2013
ISSN 1691-3078
178
J. Golebiewski Changes in Competition Trends and Labour Productivity in the Marketing Chain of Foodstuffs
___________________________1 Tel. +48225934010
E-mail address: [email protected]
CHANGES IN COMPETITION TRENDS AND LABOUR PRODUCTIVITY IN THE MARKETING CHAIN OF FOODSTUFFS
Jaroslaw Golebiewski1, PhD hab.Warsaw University of Life Sciences
Abstract. The study presents the issue of changes in labour productivity in the food sector in Poland. Its increase in 2002-2011 has been assessed as well as diversity within the cross-section of individual links of the food chain. Labour
productivity of labour in the main sectors of the food chain in Poland. Assessment of productivity was conducted using the gross value added measure per worker, which is a generally used measure of productivity for the purpose of sector and international comparisons.It was found that productivity of labour in Polish farming was much lower in comparison with other countries as well as other links of the food sector and the national economy. A higher increase in labour productivity was observed among the large agricultural production enterprises, which have attained the level comparable with the highly developed
is manifested mainly by a much lower level of gross value added per one employee of the sector of retail trade and catering in comparison with food processing and wholesale trade. Key words: labour productivity, food sector, competition.JEL code: P42
IntroductionThe study is focused on the issue of changes in labour
productivity in the food sector in Poland. The increase of its level during 2002-2011 was assessed as well as diversity of links of the food chain. Labour productivity is one of the basic measures of effective management,
GDP per capita, generally considered to be the most accurate measure of prosperity, is the product of labour productivity and economic activity index. The broadest
expresses the number of product units per labour unit. Productivity is measured both at the level of the entire economy and in its individual sections and trades, or even at the level of individual enterprises. The simplest way to illustrate labour productivity is to present the correlation between product and labour unit. The product is usually considered as the gross value added, while the
method allows measuring of productivity at a low level of aggregation, even at the level of individual enterprises (where the product is referred to data, e.g. on production sold) as well as for comparisons between countries, sectors of economy, or enterprises.
The issues of adaptation of the Polish economy in terms of labour productivity (particularly agriculture) have been examined in the context of various systems of analysis and subjected to many empirical research
Golebiewski J., 2010). In the presented study, an attempt was made to assess the dynamic-comprehensive effectiveness of management not only in agriculture,
but also in the entire marketing food chain, including processing and distribution links apart from agriculture. Labour productivity is one of the basic factors of increase in the food sector and the basic determinant of its competitiveness. Effective use of production resources in the food sector links leads to reduction of costs, increasing of supply of cheaper food.
In the literature on the subject, there is a view that the key reason for differences in results achieved by individual economies are disproportions in competition on the markets of products (Lewis W.W., 2004). The intensity of competition in a given economy is conditioned, on the one hand, by the sector structure,
the other hand, by institutional solutions, which result in emergence of various input and output barriers in a given
which warrants success of more productive enterprises. The average productivity level in a given country increases as the more productive companies increase their market share at the expense of the less productive
increase of productivity. If the institutional conditions on a given market prevent entry of the potential competitors, competition is weaker, and the increase in productivity takes place more slowly. If the conditions are favourable for less productive enterprises, this blocks
productivity. In this context, conditions for direct foreign
theory, the impact of companies with foreign capital on productivity of companies operating on the local market is
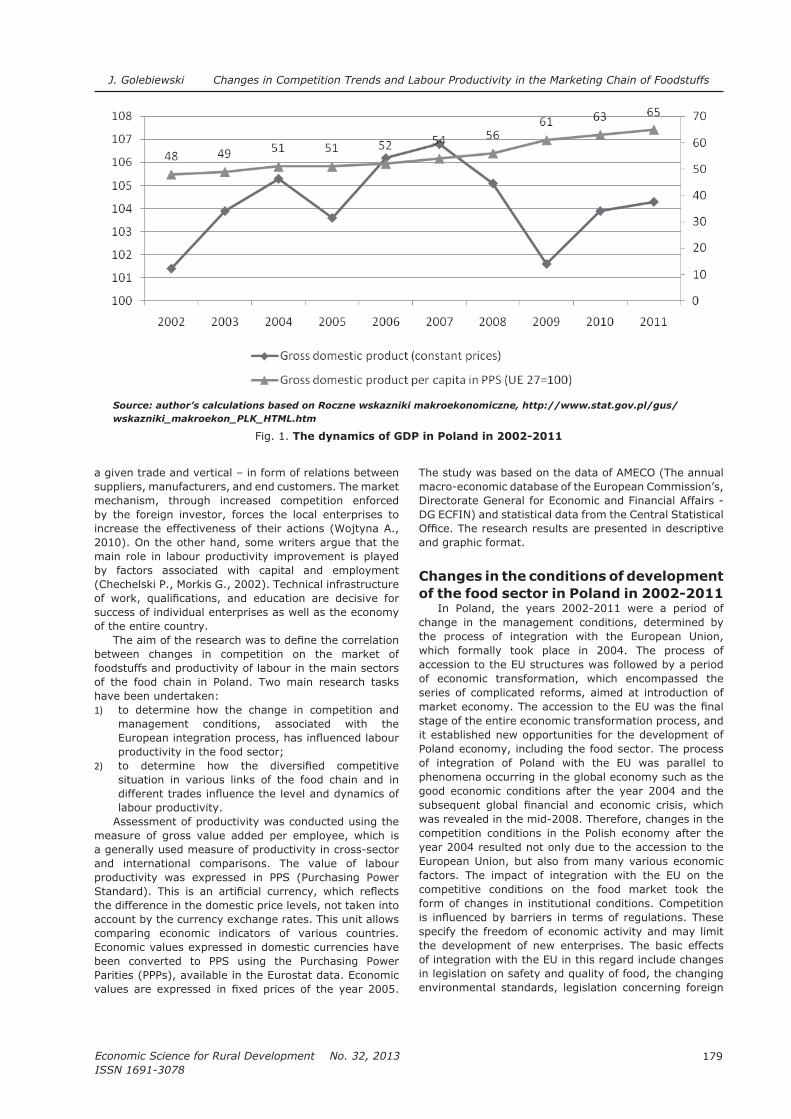
179
Economic Science for Rural Development No. 32, 2013
ISSN 1691-3078
a given trade and vertical – in form of relations between suppliers, manufacturers, and end customers. The market mechanism, through increased competition enforced by the foreign investor, forces the local enterprises to increase the effectiveness of their actions (Wojtyna A., 2010). On the other hand, some writers argue that the main role in labour productivity improvement is played by factors associated with capital and employment
success of individual enterprises as well as the economy of the entire country.
between changes in competition on the market of foodstuffs and productivity of labour in the main sectors of the food chain in Poland. Two main research tasks have been undertaken:1) to determine how the change in competition and
management conditions, associated with the
productivity in the food sector;2)
situation in various links of the food chain and in
labour productivity.Assessment of productivity was conducted using the
measure of gross value added per employee, which is a generally used measure of productivity in cross-sector and international comparisons. The value of labour productivity was expressed in PPS (Purchasing Power
the difference in the domestic price levels, not taken into account by the currency exchange rates. This unit allows comparing economic indicators of various countries. Economic values expressed in domestic currencies have been converted to PPS using the Purchasing Power Parities (PPPs), available in the Eurostat data. Economic
Directorate General for Economic and Financial Affairs -
and graphic format.
Changes in the conditions of development
of the food sector in Poland in 2002-2011In Poland, the years 2002-2011 were a period of
change in the management conditions, determined by the process of integration with the European Union, which formally took place in 2004. The process of accession to the EU structures was followed by a period of economic transformation, which encompassed the series of complicated reforms, aimed at introduction of
stage of the entire economic transformation process, and it established new opportunities for the development of Poland economy, including the food sector. The process of integration of Poland with the EU was parallel to phenomena occurring in the global economy such as the good economic conditions after the year 2004 and the
was revealed in the mid-2008. Therefore, changes in the competition conditions in the Polish economy after the year 2004 resulted not only due to the accession to the European Union, but also from many various economic factors. The impact of integration with the EU on the competitive conditions on the food market took the
specify the freedom of economic activity and may limit the development of new enterprises. The basic effects of integration with the EU in this regard include changes in legislation on safety and quality of food, the changing environmental standards, legislation concerning foreign
Fig. 1. The dynamics of GDP in Poland in 2002-2011
J. Golebiewski Changes in Competition Trends and Labour Productivity in the Marketing Chain of Foodstuffs
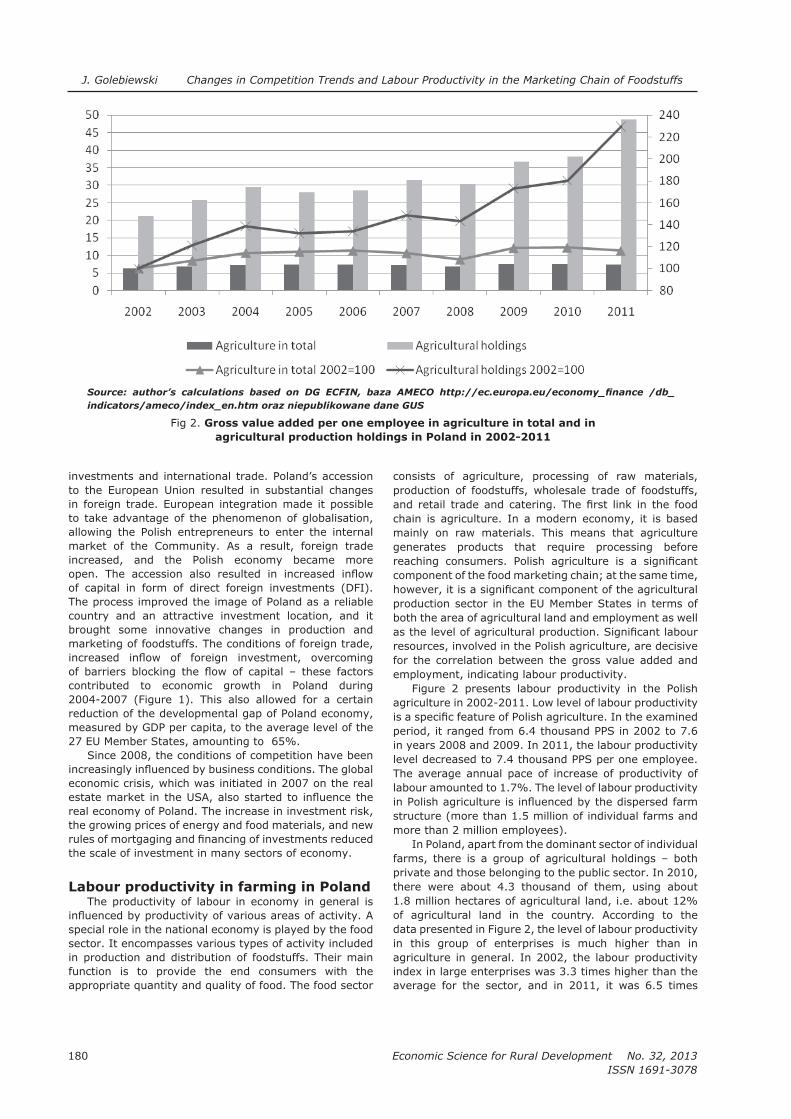
Economic Science for Rural Development No. 32, 2013
ISSN 1691-3078
180
investments and international trade. Poland’s accession to the European Union resulted in substantial changes in foreign trade. European integration made it possible to take advantage of the phenomenon of globalisation, allowing the Polish entrepreneurs to enter the internal
increased, and the Polish economy became more
of capital in form of direct foreign investments (DFI). The process improved the image of Poland as a reliable country and an attractive investment location, and it brought some innovative changes in production and marketing of foodstuffs. The conditions of foreign trade,
contributed to economic growth in Poland during 2004-2007 (Figure 1). This also allowed for a certain reduction of the developmental gap of Poland economy, measured by GDP per capita, to the average level of the 27 EU Member States, amounting to 65%.
Since 2008, the conditions of competition have been
economic crisis, which was initiated in 2007 on the real
real economy of Poland. The increase in investment risk, the growing prices of energy and food materials, and new
the scale of investment in many sectors of economy.
Labour productivity in farming in PolandThe productivity of labour in economy in general is
special role in the national economy is played by the food sector. It encompasses various types of activity included in production and distribution of foodstuffs. Their main function is to provide the end consumers with the appropriate quantity and quality of food. The food sector
consists of agriculture, processing of raw materials, production of foodstuffs, wholesale trade of foodstuffs,
chain is agriculture. In a modern economy, it is based mainly on raw materials. This means that agriculture generates products that require processing before
component of the food marketing chain; at the same time,
production sector in the EU Member States in terms of both the area of agricultural land and employment as well
resources, involved in the Polish agriculture, are decisive for the correlation between the gross value added and employment, indicating labour productivity.
Figure 2 presents labour productivity in the Polish agriculture in 2002-2011. Low level of labour productivity
period, it ranged from 6.4 thousand PPS in 2002 to 7.6 in years 2008 and 2009. In 2011, the labour productivity level decreased to 7.4 thousand PPS per one employee. The average annual pace of increase of productivity of labour amounted to 1.7%. The level of labour productivity
structure (more than 1.5 million of individual farms and more than 2 million employees).
In Poland, apart from the dominant sector of individual farms, there is a group of agricultural holdings – both private and those belonging to the public sector. In 2010, there were about 4.3 thousand of them, using about 1.8 million hectares of agricultural land, i.e. about 12% of agricultural land in the country. According to the data presented in Figure 2, the level of labour productivity in this group of enterprises is much higher than in agriculture in general. In 2002, the labour productivity index in large enterprises was 3.3 times higher than the average for the sector, and in 2011, it was 6.5 times
J. Golebiewski Changes in Competition Trends and Labour Productivity in the Marketing Chain of Foodstuffs
Fig 2. Gross value added per one employee in agriculture in total and in
agricultural production holdings in Poland in 2002-2011
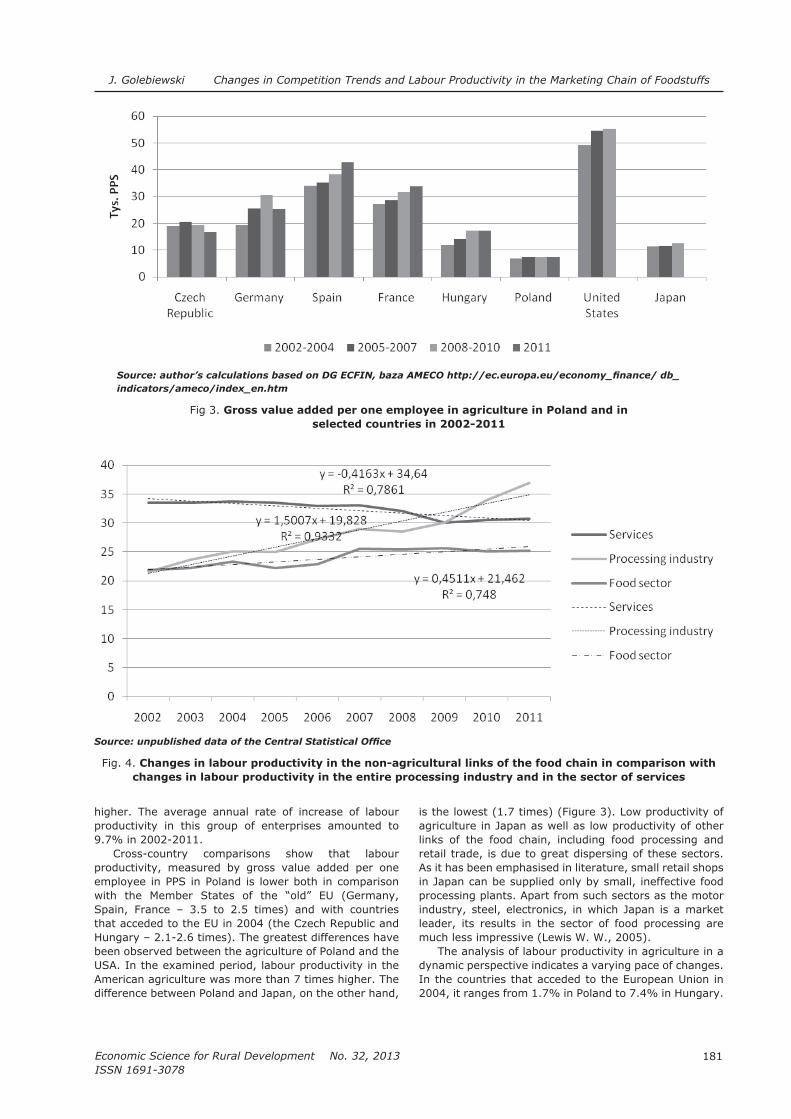
181
Economic Science for Rural Development No. 32, 2013
ISSN 1691-3078
higher. The average annual rate of increase of labour productivity in this group of enterprises amounted to 9.7% in 2002-2011.
productivity, measured by gross value added per one employee in PPS in Poland is lower both in comparison
Spain, France – 3.5 to 2.5 times) and with countries
Hungary – 2.1-2.6 times). The greatest differences have been observed between the agriculture of Poland and the USA. In the examined period, labour productivity in the American agriculture was more than 7 times higher. The difference between Poland and Japan, on the other hand,
is the lowest (1.7 times) (Figure 3). Low productivity of agriculture in Japan as well as low productivity of other links of the food chain, including food processing and retail trade, is due to great dispersing of these sectors. As it has been emphasised in literature, small retail shops in Japan can be supplied only by small, ineffective food processing plants. Apart from such sectors as the motor industry, steel, electronics, in which Japan is a market leader, its results in the sector of food processing are much less impressive (Lewis W. W., 2005).
The analysis of labour productivity in agriculture in a dynamic perspective indicates a varying pace of changes. In the countries that acceded to the European Union in 2004, it ranges from 1.7% in Poland to 7.4% in Hungary.
Fig 3. Gross value added per one employee in agriculture in Poland and in
selected countries in 2002-2011
Fig. 4. Changes in labour productivity in the non-agricultural links of the food chain in comparison with
changes in labour productivity in the entire processing industry and in the sector of services
J. Golebiewski Changes in Competition Trends and Labour Productivity in the Marketing Chain of Foodstuffs

Economic Science for Rural Development No. 32, 2013
ISSN 1691-3078
182
the dynamics ranged between 1.8% in France, 2.3% in Spain, and 4.9% in Germany. In the USA, the average annual rate of increase in labour productivity amounted to 2.9%, while in Japan it was as low as 0.1%. The changes presented thus cannot lead to the conclusion that a change in the institutional conditions on the food market and liquidation of barriers that limit competition, including international competition after the
improved labour productivity in such countries as Poland,
States (France, Spain, and Germany).
Labour productivity in non-agricultural
links of the food chain Apart from agriculture, the marketing chain of
foodstuffs consists of many sectors of food processing and distribution of foodstuffs. Figure 4 presents changes in labour productivity in non-agricultural links of the food chain (food sector) in comparison with changes of labour productivity in the entire processing industry and sector of services. The data presented indicate that the labour productivity is lower in the food sector in comparison with industrial processing in general. Moreover, in the examined period, these sectors were characterised by varying dynamics of changes in labour effectiveness.
chain. The average annual increase of labour productivity in these sectors amounted to 0.49 thousand PPS, while in the entire industry, the increase reached 1.5 thousand
PPS per employee. In 2002-2007, labour productivity in the sector of services decreased by approximately 0.42 thousand PPS each year. As a result, the difference between labour productivity in the services industry and processing industry decreased systematically. In 2009, the productivity levels became equal, while in 2010 and 2011, labour productivity in the processing industry was already higher in comparison with the sector of services.
The processing and distribution links in the marketing chain of foodstuffs encompass the industry of processing of agricultural raw materials, production of highly processed foodstuffs, wholesale of foodstuffs, retail trade and catering. The diversity among various links in terms of labour productivity is very high. It is indicated mainly by a much lower level of gross value added per one employee in the sectors of retail trade and catering in comparison with food processing and wholesale trade (Figure 5).
The reasons for such situations are associated with the structure of individual trades. The sector of foodstuff retail trade and the sector of catering are more dispersed (income per enterprise are 0.8 times higher), lower unit costs of labour per one employee (0.5 times),
and lower level of technical infrastructure of work. The value of assets per one employee in the sectors of food industry and wholesale trade is more than 2.3 times higher in comparison with retail trade and catering. This
differentiation of labour productivity in the food chain
visible differences in the dynamics of labour productivity in association with the process of integration with the Europe between individual links of food processing and distribution of foodstuffs.
Fig 5. Labour productivity in the sectors of retail trade, catering, food processing, and wholesale trade
J. Golebiewski Changes in Competition Trends and Labour Productivity in the Marketing Chain of Foodstuffs
183
Economic Science for Rural Development No. 32, 2013
ISSN 1691-3078
ConclusionsAnalysis of labour productivity has led to the following
general conclusions with regard to the marketing chain of food. 1. Labour productivity in the Polish agriculture is
much lower in comparison with other countries as well as other links of the food sector and the national economy. In 2002 – 2011, the average annual pace of increase in labour productivity in the Polish agriculture amounted to 1.7%. The level of labour productivity in agriculture
structure. A higher increase in labour productivity was recorded among large agricultural holdings, which attained a productivity level comparable to highly developed EU Member States and even the USA.
2. Links of the marketing chain are characterised by great diversity of labour productivity. This is mainly indicated by a lower level of gross value added per one employee in the sectors of retail trade and catering in comparison with food processing and wholesale trade.
3. basis to conclude that a change of institutional conditions on the food market and liquidation of barriers limiting competition, including international competition after the accession of the new Member
improvement of labour productivity in such
Only in the case of Hungary, can we speak of a
labour productivity were either comparable with
Germany) or lower.4. Institutional conditions of activity of competitive
business entities are the basic prerequisite for development and growth of the food sector. The
by factors associated with the structure of the
labour productivity and factors associated with human capital and technical infrastructure of work.
Bibliography1.
(Labour Pproductivity in Food Industry in Poland and
the EU) p. 67.
2. Rolnictwo Unii Europejskiej i Polski. Studium
rynkow rolnych (Agriculture in the EU and Poland. A
Comparative Study of the Structures of Production
and Agricultural Regulators) p. 333.
3. pracy w gospodarstwach rolnych (Strategies for
Labor Productivity on Farms). Journal of Agribusiness
and Rural Development l 1(7), pp. 73-87.4. Golebiewski, J. (2010). Efektywnosc systemow
(
Industry).
5. Lewis, W.W. (2005). Potega wydajnosci (The Power
of Effciency)
6. Measuring Productivity Measurement of Aggregate
Manual 2001, Retrieved: http://www.oecd.org/std/productivitystat ist ics/2352458.pdf. Access: 2.01.2013
7. Porter, M. E., (2006). Strategia konkurencji. Metody (Competitive
Strategy. Methods for Analyzing Industries and
Competitors).
p. 460.8.
(Relationships
between Productivity, Income and Employment in
Countries at Different Stages of Development), PWE,
J. Golebiewski Changes in Competition Trends and Labour Productivity in the Marketing Chain of Foodstuffs

Economic Science for Rural Development No. 32, 2013
ISSN 1691-3078
184
A. Grzelak Reproduction Processes in Agriculture in Poland Considering Production Types of Farms
(In The Light of The Data from Agricultural Accounting System Fadn)
___________________________*
the basis of the decision No. DEC-2011/03/B/HS4/011741 E-mail address2 As of 2010, the calculation is based on standard outputs (SO)
REPRODUCTION PROCESSES IN AGRICULTURE IN POLAND CONSIDERING PRODUCTION TYPES OF FARMS (IN THE LIGHT OF THE
DATA FROM AGRICULTURAL ACCOUNTING SYSTEM FADN)*
Aleksander Grzelak1, Dr.hab., prof. Department of Macroeconomics and Food Economy
Abstract. The main aim of the article is to evaluate the dynamics of reproduction processes taking place in Polish agriculture considering different production types in farms following the integration with the EU. It was observed that in the period of economic revival in Poland (2004-2007), farms were more active in modernising their production potentials. In the analysed period (2004-2010), farms covered by the FADN system were showing mostly narrowed reproduction, with the exception of 2004 when extended reproduction was recorded. It was observed that, in the case of farms specialising in milk production, the modernisation processes ensured extended reproduction throughout the
out positively. On the contrary, farms lacking specialisation showed assets decapitalisation. The phenomena resulted
less prone to invest. It should be noted, however, that these farms play an important role in creating welfare in rural areas understood in broader terms as well as in maintaining settlement network, stability and viability in rural areas. Key words
JEL code: Q12
1. IntroductionThe integration of the Polish economy with the EU
Member States and the fact that the agricultural sector
impact on the shaping of growth processes of farms and rural areas. The growth processes might be determined through reproduction of production assets, which in this
assets worn and torn during production. This approach results from the need to limit the analytical scope due to the complexity of reproduction issues as well as direct connections of the capital to other factors. One could conclude that recently (i.e. from the 1990s onwards) studies on reproduction processes in agriculture in Poland
studies follow the classic theories of economics concerning the analysis of growth processes from the point of view of production factors, including especially the capital and relevant investments. The article attempts to present a wider approach including the macroeconomic context of the analysed processes characteristics. The presented issue is important also in terms of different directions of adaptation processes of Polish farms, which in fact is
The main aim of the article is to evaluate the dynamics of reproduction processes taking place in Polish agriculture considering different production types of farms following the integration with the EU. The analysis was based on the data from FADN (Farm Accountancy Data Network) which takes into consideration commercial
Policy generating at least 90% of the standard gross margin (SGM)2 in a particular region or country. The analysis covers the period of 2004-2010 due to the data availability. The article attempts to reply the following research questions: Are there differences between reproduction processes of farms with different production types in Poland? What is the context of general economic trends in shaping reproduction processes? What are the development perspectives for farms considering their
issues related with the economy in general, making it possible to determine the conditions for reproduction in agriculture. At the next stage, reproduction processes were evaluated from the point of view of changes in investments and the reproduction ratio (relation of gross investments (excluding land purchases) to production assets depreciation).
2. Economic backdrop of agricultural
situation following integration with
the EUAfter integration of Poland with the EU until 2008
the general economic situation was positive (Table 1). This translated itself into the GDP dynamics, reduced unemployment and increased investment rate. The economic downturn was recorded only in 2009, mainly as a result of phenomena concerning the global crisis, while the situation improved again in 2010. The effects of the crisis phenomena affected the Polish economy to
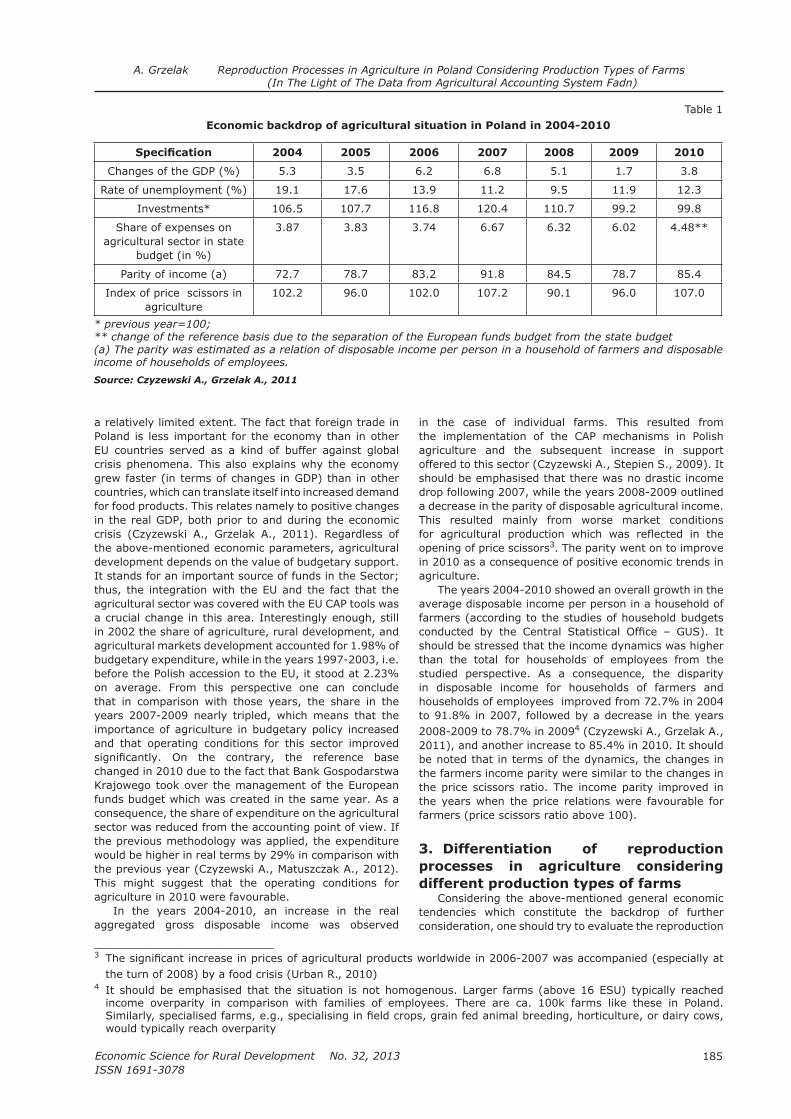
185
Economic Science for Rural Development No. 32, 2013
ISSN 1691-3078
a relatively limited extent. The fact that foreign trade in Poland is less important for the economy than in other EU countries served as a kind of buffer against global crisis phenomena. This also explains why the economy grew faster (in terms of changes in GDP) than in other countries, which can translate itself into increased demand for food products. This relates namely to positive changes in the real GDP, both prior to and during the economic
the above-mentioned economic parameters, agricultural development depends on the value of budgetary support. It stands for an important source of funds in the Sector; thus, the integration with the EU and the fact that the
a crucial change in this area. Interestingly enough, still in 2002 the share of agriculture, rural development, and agricultural markets development accounted for 1.98% of budgetary expenditure, while in the years 1997-2003, i.e. before the Polish accession to the EU, it stood at 2.23% on average. From this perspective one can conclude that in comparison with those years, the share in the years 2007-2009 nearly tripled, which means that the importance of agriculture in budgetary policy increased and that operating conditions for this sector improved
changed in 2010 due to the fact that Bank Gospodarstwa Krajowego took over the management of the European funds budget which was created in the same year. As a consequence, the share of expenditure on the agricultural sector was reduced from the accounting point of view. If the previous methodology was applied, the expenditure would be higher in real terms by 29% in comparison with
This might suggest that the operating conditions for agriculture in 2010 were favourable.
In the years 2004-2010, an increase in the real aggregated gross disposable income was observed
in the case of individual farms. This resulted from
agriculture and the subsequent increase in support
should be emphasised that there was no drastic income drop following 2007, while the years 2008-2009 outlined a decrease in the parity of disposable agricultural income. This resulted mainly from worse market conditions
opening of price scissors3. The parity went on to improve in 2010 as a consequence of positive economic trends in agriculture.
The years 2004-2010 showed an overall growth in the average disposable income per person in a household of farmers (according to the studies of household budgets
should be stressed that the income dynamics was higher than the total for households of employees from the studied perspective. As a consequence, the disparity in disposable income for households of farmers and households of employees improved from 72.7% in 2004 to 91.8% in 2007, followed by a decrease in the years 2008-2009 to 78.7% in 20094
2011), and another increase to 85.4% in 2010. It should be noted that in terms of the dynamics, the changes in the farmers income parity were similar to the changes in the price scissors ratio. The income parity improved in the years when the price relations were favourable for farmers (price scissors ratio above 100).
3. Differentiation of reproduction
processes in agriculture considering
different production types of farms
tendencies which constitute the backdrop of further consideration, one should try to evaluate the reproduction
Table 1Economic backdrop of agricultural situation in Poland in 2004-2010
2004 2005 2006 2007 2008 2009 2010
5.3 3.5 6.2 6.8 5.1 1.7 3.8
Rate of unemployment (%) 19.1 17.6 13.9 11.2 9.5 11.9 12.3
Investments* 106.5 107.7 116.8 120.4 110.7 99.2 99.8
Share of expenses on agricultural sector in state
budget (in %)
3.87 3.83 3.74 6.67 6.32 6.02 4.48**
Parity of income (a) 72.7 78.7 83.2 91.8 84.5 78.7 85.4
Index of price scissors in agriculture
102.2 96.0 102.0 107.2 90.1 96.0 107.0
* previous year=100; ** change of the reference basis due to the separation of the European funds budget from the state budget(a) The parity was estimated as a relation of disposable income per person in a household of farmers and disposable income of households of employees.
___________________________3
the turn of 2008) by a food crisis (Urban R., 2010)4 It should be emphasised that the situation is not homogenous. Larger farms (above 16 ESU) typically reached
income overparity in comparison with families of employees. There are ca. 100k farms like these in Poland.
would typically reach overparity
A. Grzelak Reproduction Processes in Agriculture in Poland Considering Production Types of Farms (In The Light of The Data from Agricultural Accounting System Fadn)
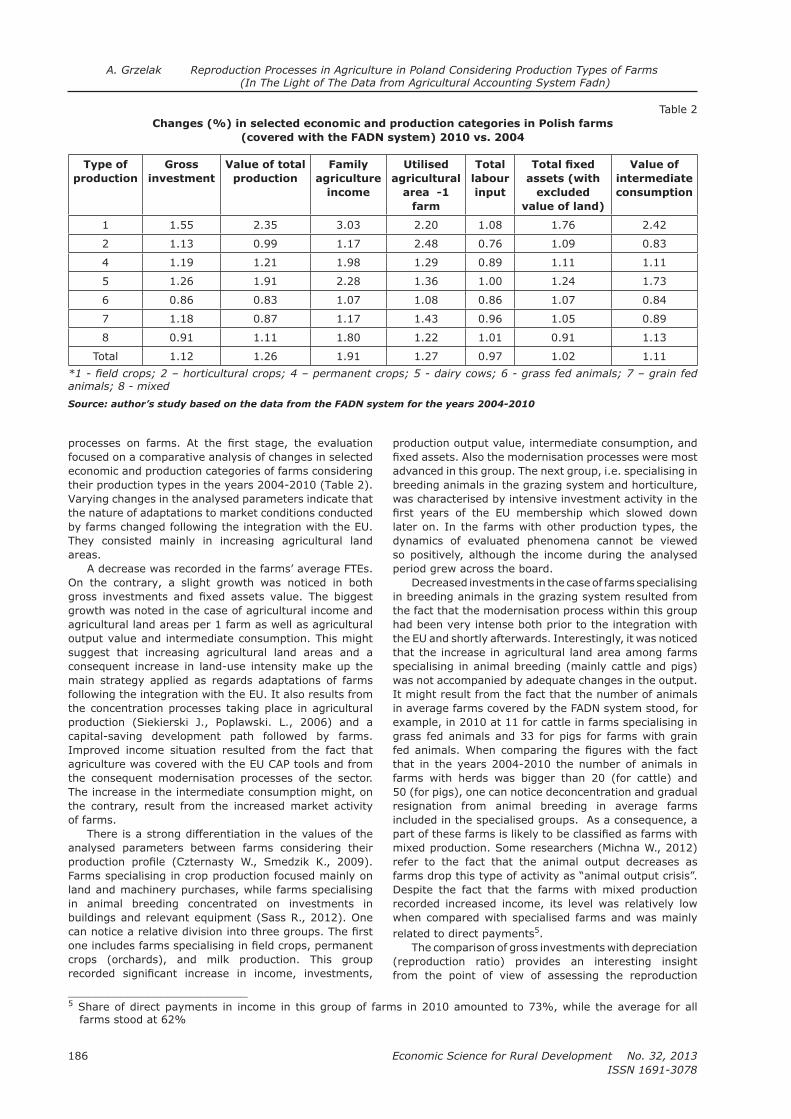
Economic Science for Rural Development No. 32, 2013
ISSN 1691-3078
186
focused on a comparative analysis of changes in selected economic and production categories of farms considering their production types in the years 2004-2010 (Table 2). Varying changes in the analysed parameters indicate that the nature of adaptations to market conditions conducted by farms changed following the integration with the EU. They consisted mainly in increasing agricultural land areas.
A decrease was recorded in the farms’ average FTEs. On the contrary, a slight growth was noticed in both
growth was noted in the case of agricultural income and agricultural land areas per 1 farm as well as agricultural output value and intermediate consumption. This might suggest that increasing agricultural land areas and a consequent increase in land-use intensity make up the main strategy applied as regards adaptations of farms following the integration with the EU. It also results from the concentration processes taking place in agricultural production (Siekierski J., Poplawski. L., 2006) and a capital-saving development path followed by farms. Improved income situation resulted from the fact that
the consequent modernisation processes of the sector. The increase in the intermediate consumption might, on the contrary, result from the increased market activity of farms.
There is a strong differentiation in the values of the analysed parameters between farms considering their
Farms specialising in crop production focused mainly on land and machinery purchases, while farms specialising in animal breeding concentrated on investments in buildings and relevant equipment (Sass R., 2012). One
crops (orchards), and milk production. This group
production output value, intermediate consumption, and
advanced in this group. The next group, i.e. specialising in
was characterised by intensive investment activity in the
later on. In the farms with other production types, the dynamics of evaluated phenomena cannot be viewed so positively, although the income during the analysed period grew across the board.
Decreased investments in the case of farms specialising
the fact that the modernisation process within this group had been very intense both prior to the integration with the EU and shortly afterwards. Interestingly, it was noticed that the increase in agricultural land area among farms specialising in animal breeding (mainly cattle and pigs) was not accompanied by adequate changes in the output. It might result from the fact that the number of animals in average farms covered by the FADN system stood, for example, in 2010 at 11 for cattle in farms specialising in grass fed animals and 33 for pigs for farms with grain
that in the years 2004-2010 the number of animals in farms with herds was bigger than 20 (for cattle) and 50 (for pigs), one can notice deconcentration and gradual resignation from animal breeding in average farms included in the specialised groups. As a consequence, a
mixed production. Some researchers (Michna W., 2012) refer to the fact that the animal output decreases as
Despite the fact that the farms with mixed production recorded increased income, its level was relatively low when compared with specialised farms and was mainly related to direct payments5.
The comparison of gross investments with depreciation (reproduction ratio) provides an interesting insight from the point of view of assessing the reproduction
Table 2Changes (%) in selected economic and production categories in Polish farms
(covered with the FADN system) 2010 vs. 2004
Type of
production
Gross
investment
Value of total
production
Family
agriculture
income
Utilised
agricultural
area -1
farm
Total
labour
input
assets (with
excluded
value of land)
Value of
intermediate
consumption
1 1.55 2.35 3.03 2.20 1.08 1.76 2.42
2 1.13 0.99 1.17 2.48 0.76 1.09 0.83
4 1.19 1.21 1.98 1.29 0.89 1.11 1.11
5 1.26 1.91 2.28 1.36 1.00 1.24 1.73
6 0.86 0.83 1.07 1.08 0.86 1.07 0.84
7 1.18 0.87 1.17 1.43 0.96 1.05 0.89
8 0.91 1.11 1.80 1.22 1.01 0.91 1.13
Total 1.12 1.26 1.91 1.27 0.97 1.02 1.11
animals; 8 - mixed
___________________________5 Share of direct payments in income in this group of farms in 2010 amounted to 73%, while the average for all farms stood at 62%
A. Grzelak Reproduction Processes in Agriculture in Poland Considering Production Types of Farms (In The Light of The Data from Agricultural Accounting System Fadn)

187
Economic Science for Rural Development No. 32, 2013
ISSN 1691-3078
process (Table 3). Trends noticeable in this comparison show moderate volatility of the ratio (18%) in the analysed period in the group of farms covered by the FADN. This means that developmental conditions in Poland following the integration with the EU facilitated stable development of agriculture, which resulted from
and from a consequent increase in support, although a large number6 of farms is not capable of replacing their production potential anyway. The highest reproduction
integration with the EU. It was a consequence of intensive investment activity of farms shortly after the integration
period of unfavourable economic situation for agriculture in the years 1998-2003 as well as of a relatively low value of production assets due to high wear and tear levels. In the following years, the level of the ratio failed to ensure extended reproduction for an average farm included in the FADN system, although the situation varied depending on
7. It is noticeable that the reproduction ratio improved with increasing agricultural income and improving price relations for the sector which also led to the phenomenon of economic rent in agriculture
the years 2006-2007 and 2010.
differences in reproduction ratios between farms. Interestingly, farms specialising in dairy production recorded extended reproduction nearly in all analysed years. This suggests intensive investment activity of the members of the group and shows that modernisation processes were well advanced. The investments were mainly related to purchases of equipment to milk, cool and store milk, introduction of new technologies for preserving rapidly growing grass, and adapting buildings to higher phytosanitary standards. In total, milk production remained at the same level during the analysed period, while the cows average milk yield grew and the number of cows decreased (Rynek mleka..., 2010). Farms specialising in animal breeding
sub-period (2004-2007) and narrowed reproduction in the following years (2008-2010). Those farms also used the modernisation possibilities of their output potential
horticultural farms invested intensively in crops grown under covers or purchases of fruit harvesting combines and of cool stores. In total, about 37% of funds (from the
provided to farms specialising in milk production, while 50% of funds from this measure related with constructing or modernising farm buildings was used for glasshouses.
of assets started improving gradually from 2005 and it reached the stage of simple reproduction in 2010. Those
invested in production assets, i.e. purchases of combine harvesters, tractors, and sprinklers (Kagan A., 2011). The lowest level of the ratio was recorded in the case of farms with mixed production type. This might suggest assets decapitalisation in those farms.
Those farms normally operate on a small area, their
used for investments and their repayment capacity is
2011). These phenomena are a consequence (as well as later on a cause) of relatively low income in the case of smaller farms. This might also be related with higher preference of smaller farms towards consumption at the cost of pro-investment activities due to lower production scale and consequently an absolute lack of income. Their future should not be seen solely in the performance
developments in the analysed ratio unanimously in the case of farms specialising in breeding grain fed animals. It can be noticed that assets reproduction undergoes changes which is related with the so-called hog cycle.
Table 3Developments in the reproduction ratio (gross investments / depreciation) in Polish farms
(included in the FADN system) in the years 2004-2010
Years
Farms production types
1 2 4 5 6 7 8 Total
2004 91.3 117.1 92.0 113.0 107.2 101.9 88.5 105.2
2005 56.8 97.1 79.9 126.5 136.0 84.9 77.8 82.8
2006 58.0 102.1 89.0 176.8 141.0 102.0 78.8 84.8
2007 68.2 128.3 78.0 145.4 139.6 89.0 83.0 89.8
2008 85.4 78.0 74.0 120.1 88.4 73.2 65.5 69.4
2009 63.7 84.0 79.0 100.3 66.9 100.1 67.4 72.4
2010 101.1 81.0 83.0 109.0 73.6 89.6 72.1 77.5
animals; 8 - mixed
___________________________6 W. Michna estimates that there are ca. 90% of farms like these in Poland (Michna W., 2011)7
A. Grzelak Reproduction Processes in Agriculture in Poland Considering Production Types of Farms (In The Light of The Data from Agricultural Accounting System Fadn)
Economic Science for Rural Development No. 32, 2013
ISSN 1691-3078
188
This means that investment processes are activated
should be expected that in the case of farms with this
in the years 2011-2012 owing to the fact that the farms are forced to adapt to new requirements concerning environmental protection and animal welfare until the end of 20128. It concerns limiting ammonia emission from animal breeding and extending farm houses for piglets and pigs. This might encourage small farms with small production scale to resign from this type of production further deepening polarisation processes.
4. ConclusionsThe conducted study leads to the following conclusions.
1. During the period of the most favourable economic trends (2004-2007) in Poland farms were more eager to modernise their production potentials
ratio. It might initially suggest that macroeconomic conditions are important from the point of view of
of membership was most important as the dynamics of those processes was clearly most intense. It was
from a slowdown in agriculture in the years 1998-
in 2004 as a consequence of increased share of budgetary expenditure on agriculture, as the
consisted in the need for animal breeding farms to adapt to stricter phytosanitary standards. On the contrary, investments like these, while supporting more pro-ecological activities, do not result directly in increased income. If the same labour and land resources are maintained, positive income developments depend not only on investments but
a particular year. Therefore, the development of agricultural farms in the economic sense expressed with increased income is, in many instances, the easiest to achieve by means of purchasing land.
2. During the analysed period (2004-2010) one could mainly notice on average narrowed reproduction in farms covered by the FADN system. Extended reproduction was recorded only in 2004. Despite the above, the scope of investment processes in agriculture during the period should be viewed positively. It led to improvements in terms of
agricultural production, environment protection and OHS. There are many differences in this respect
specialising in milk production, the modernisation processes resulted in extended reproduction during the analysed period which was accompanied by increased investments suggesting a positive growth potential.
3. Also farms specialising in horticulture and animal
In the following years, the level of investments no longer facilitated renewal of production assets. In the case of horticultural farms as well as permanent
high capital intensity of production hindered their development. It was noticed that the reproduction trends among the group of farms specialising in grass fed animals were related with the so-called hog cycle. On the contrary, one could notice a clear decapitalisation of assets in the case of farms lacking specialisation. The phenomena resulted from limited ability of these farms to generate a surplus which
limited production scale as well as low propensity to investments.
4. Based on the remarks, one should not conclude unanimously that future development of agriculture and rural areas will be limited only to farms with clear output specialisation, although they surely play an important role on the food market (Sapa A., 2009). Farms are operating under higher market risk and higher exposure to market trends. Owing to a different operating philosophy, farms with mixed production limit the risk, while they can also specialise in food production with increased quality standards, try to operate in the form of groups gathering other farmers, or perform functions related with the so-called countryside welfare (Brelik A., 2003), maintaining settlement network, stability and viability in rural areas. In contrast, maintaining narrowed reproduction in those units leads to accelerated polarisation processes in agriculture and may result in increased rate of unused production resources. It is less likely that capital and land resources should move automatically from those farms to farms with clear output specialisation. In many cases, the status of farm lands is changed into residential areas9. Additionally, purchasing small plots from smaller farms is not really attractive due to relatively high cultivation unit costs. Therefore, the problem has also a social dimension and it concerns issues such as non-agricultural development of rural areas
agriculture.
Bibliography1.
Stan i szanse rozwoju gospodarstw towarowych
uznanych za slabe ekonomicznie (State and
development prospects of market farms deemed
economically weak). Zagadnienia Ekonomiki Rolnej (Issues of Agricultural Economics), No 1, pp. 81-104.
2. Brelik, A. (2003). Agro-tourism and Country Tourism
Chance for Development of Enterprise in Rural Areas
of Western Pomerania Region. In: Economic Science for Rural Development, Proceedings, Jelgava, pp. 145-150.
3. Effect of the
Integration into the EU on the Economic Results of
Different Types of Individual Farms in Poland. In: Economic Science for Rural Development: Finances,
___________________________8 9 This might suggest a decrease in the total UR area by ca. 5% in the years 2004-2010
A. Grzelak Reproduction Processes in Agriculture in Poland Considering Production Types of Farms (In The Light of The Data from Agricultural Accounting System Fadn)
189
Economic Science for Rural Development No. 32, 2013
ISSN 1691-3078
Taxes, Investment and Support Systems. Book Series: Economic Science for Rural Development, Proceedings, Issue: 20. Jelgava, pp. 126-132.
4. Rolnictwo w
Polsce na tle sytuacji ogolnoekonomicznej kraju w
okresie kryzysu 2007-2009. (Agriculture in Poland
on background of the all-economic situation of the
country during the crisis 2007-2009).
,
5. Sfera realna
versus socjalna (KRUS) w krajowym budzecie rolnym
Polski w dlugim okresie (Real versus social sphere
in the Polish national agricultural budget in the long
run) .
6. Role of Decoupling
in the System of CAP Financial Support. Dilemmas
and Recommendations. In: Economic Science for Rural Development: Book Series: Economic Science for Rural Development, Proceedings, Issue: 18. Jelgava, p. 205.
7. Changes in
the Mechanism of the Common Agricultural Policy
and the Polish Expectations. Ekonomista, No 4, pp. 433-449.
8. Controversies Concerning the
Rent of Land From Classical Economics to Modern
Times. Ekonomista, No 2, pp. 228-239.9. Ocena procesow reprodukcji w
gospodarstwach rolnych w Polsce po integracji z
UE w swietle danych systemu rachunkowosci rolnej
FADN (Evaluation of reproduction processes of farms
in Poland after integration with the EU in the light of
the data from agricultural accounting system FADN). Journal of Agribusiness and Rural Development, No 2, p. 62.
10. Kagan, A. (2011). Efektywnosc produkcyjno-
ekonomiczna przedsiebiorstw rolnych na tle
procesow restrukturyzacyjnych ze szczegolnym
uwzglednieniem spolek, w ktorych prawa z udzialow
wykonuje Agencja (of agricultural enterprises on the background of the
restructuring process with particular emphasis on
companies in which the rights of the shares carries
Agency).11. Michna, W. (2011). Dotychczasowe proby
restrukturyzacji wsi i rolnictwa (So far attempts
of restructure agriculture and rural areas). (w:)
Wybrane problemy wizji rozwoju wsi i rolnictwa w
pierwszej polowie XXI wieku . (Some problems of the vision of rural development and agriculture in
IERiGZ, pp. 19-20.12. Rynek mleka (Milk Market) (2011). Stan i
perspektywy (Status and prospects). IERiGZ, pp. 5, 8-14.
13. Sapa, A. (2009). Food Security in the Developing
Countries within the Globalisation Process. In: Economic Science for Rural Development: Primary
Series: Economic Science for Rural Development. Proceedings, Issue: 19. Jelgava, pp. 289-292.
14. Sass, R. (2012). Wplyw kierunku inwestowania
na efekty produkcyjno-ekonomiczne gospodarstw
rolnych w podregionie bydgoskim
direction of investment on economic-production
results of farms in subregion Bydgoszcz). Journal of Agribusiness and Rural Development, No 3, p. 229.
15. Siekierski, J., Poplawski, L. (2006). Globalisation
Processes in Polish Agribusiness. In: Economic
Science for Rural Development. Proceedings, Issue: 10. Jelgava, pp. 123-128.
A. Grzelak Reproduction Processes in Agriculture in Poland Considering Production Types of Farms (In The Light of The Data from Agricultural Accounting System Fadn)
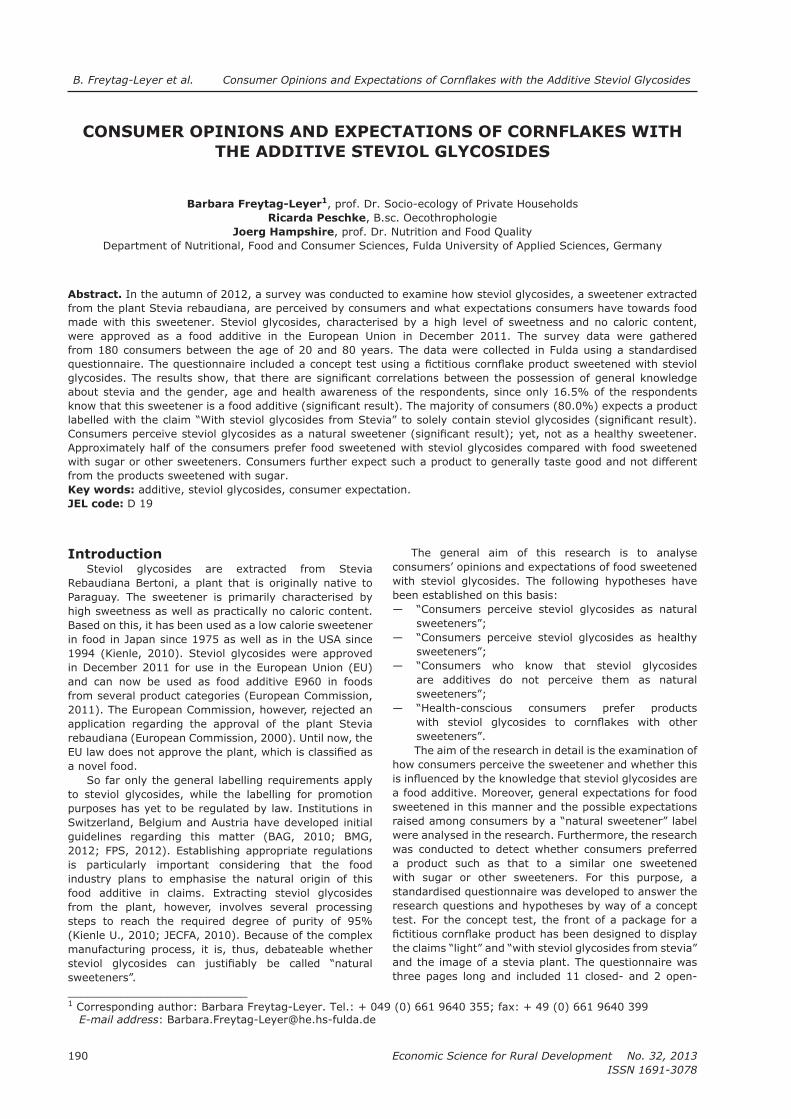
Economic Science for Rural Development No. 32, 2013
ISSN 1691-3078
190
B. Freytag-Leyer et al.
CONSUMER OPINIONS AND EXPECTATIONS OF CORNFLAKES WITH THE ADDITIVE STEVIOL GLYCOSIDES
Barbara Freytag-Leyer1, prof. Dr. Socio-ecology of Private HouseholdsRicarda Peschke, B.sc. Oecothrophologie
Joerg Hampshire, prof. Dr. Nutrition and Food Quality
Abstract. In the autumn of 2012, a survey was conducted to examine how steviol glycosides, a sweetener extracted from the plant Stevia rebaudiana, are perceived by consumers and what expectations consumers have towards food made with this sweetener. Steviol glycosides, characterised by a high level of sweetness and no caloric content, were approved as a food additive in the European Union in December 2011. The survey data were gathered from 180 consumers between the age of 20 and 80 years. The data were collected in Fulda using a standardised
about stevia and the gender, age and health awareness of the respondents, since only 16.5% of the respondents
Approximately half of the consumers prefer food sweetened with steviol glycosides compared with food sweetened
from the products sweetened with sugar.Key words: additive, steviol glycosides, consumer expectation.JEL code: D 19
___________________________1 E-mail address: [email protected]
Introduction Steviol glycosides are extracted from Stevia
Rebaudiana Bertoni, a plant that is originally native to Paraguay. The sweetener is primarily characterised by high sweetness as well as practically no caloric content. Based on this, it has been used as a low calorie sweetener in food in Japan since 1975 as well as in the USA since 1994 (Kienle, 2010). Steviol glycosides were approved in December 2011 for use in the European Union (EU) and can now be used as food additive E960 in foods
application regarding the approval of the plant Stevia
a novel food. So far only the general labelling requirements apply
to steviol glycosides, while the labelling for promotion purposes has yet to be regulated by law. Institutions in
guidelines regarding this matter (BAG, 2010; BMG, 2012; FPS, 2012). Establishing appropriate regulations is particularly important considering that the food industry plans to emphasise the natural origin of this food additive in claims. Extracting steviol glycosides from the plant, however, involves several processing steps to reach the required degree of purity of 95%
manufacturing process, it is, thus, debateable whether
The general aim of this research is to analyse consumers’ opinions and expectations of food sweetened with steviol glycosides. The following hypotheses have been established on this basis:
—
—
—are additives do not perceive them as natural
—
The aim of the research in detail is the examination of how consumers perceive the sweetener and whether this
a food additive. Moreover, general expectations for food sweetened in this manner and the possible expectations
were analysed in the research. Furthermore, the research was conducted to detect whether consumers preferred a product such as that to a similar one sweetened with sugar or other sweeteners. For this purpose, a standardised questionnaire was developed to answer the research questions and hypotheses by way of a concept test. For the concept test, the front of a package for a
and the image of a stevia plant. The questionnaire was three pages long and included 11 closed- and 2 open-
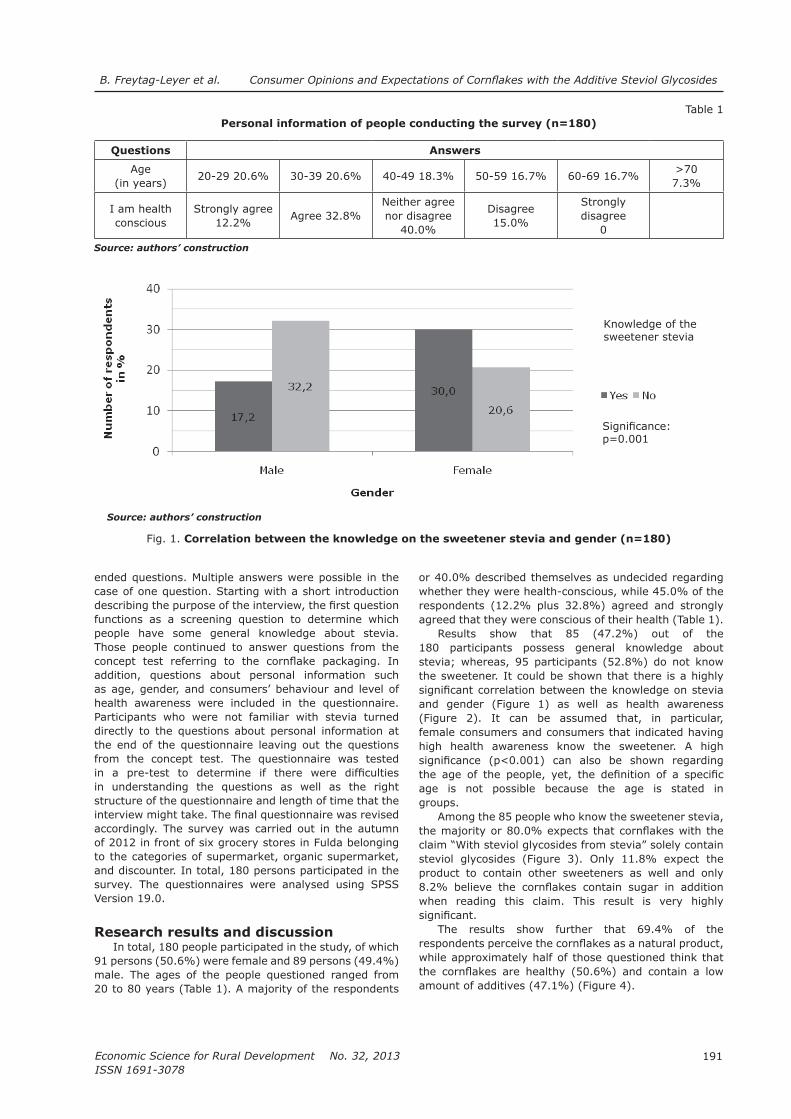
191
Economic Science for Rural Development No. 32, 2013
ISSN 1691-3078
B. Freytag-Leyer et al.
ended questions. Multiple answers were possible in the case of one question. Starting with a short introduction
functions as a screening question to determine which people have some general knowledge about stevia. Those people continued to answer questions from the
addition, questions about personal information such as age, gender, and consumers’ behaviour and level of health awareness were included in the questionnaire. Participants who were not familiar with stevia turned directly to the questions about personal information at the end of the questionnaire leaving out the questions from the concept test. The questionnaire was tested
in understanding the questions as well as the right structure of the questionnaire and length of time that the
accordingly. The survey was carried out in the autumn of 2012 in front of six grocery stores in Fulda belonging to the categories of supermarket, organic supermarket, and discounter. In total, 180 persons participated in the survey. The questionnaires were analysed using SPSS Version 19.0.
Research results and discussionIn total, 180 people participated in the study, of which
91 persons (50.6%) were female and 89 persons (49.4%) male. The ages of the people questioned ranged from 20 to 80 years (Table 1). A majority of the respondents
or 40.0% described themselves as undecided regarding whether they were health-conscious, while 45.0% of the respondents (12.2% plus 32.8%) agreed and strongly agreed that they were conscious of their health (Table 1).
Results show that 85 (47.2%) out of the 180 participants possess general knowledge about stevia; whereas, 95 participants (52.8%) do not know the sweetener. It could be shown that there is a highly
and gender (Figure 1) as well as health awareness (Figure 2). It can be assumed that, in particular, female consumers and consumers that indicated having high health awareness know the sweetener. A high
age is not possible because the age is stated in groups.
Among the 85 people who know the sweetener stevia,
steviol glycosides (Figure 3). Only 11.8% expect the product to contain other sweeteners as well and only
when reading this claim. This result is very highly
The results show further that 69.4% of the
while approximately half of those questioned think that
amount of additives (47.1%) (Figure 4).
Table 1 Personal information of people conducting the survey (n=180)
Questions Answers
Age (in years)
20-29 20.6% 30-39 20.6% 40-49 18.3% 50-59 16.7% 60-69 16.7%>707.3%
I am health conscious
Strongly agree12.2%
Agree 32.8%Neither agree nor disagree
40.0%
Disagree 15.0%
Strongly disagree
0
Source: authors’ construction
Source: authors’ construction
Fig. 1. Correlation between the knowledge on the sweetener stevia and gender (n=180)
p=0.001
Knowledge of the sweetener stevia
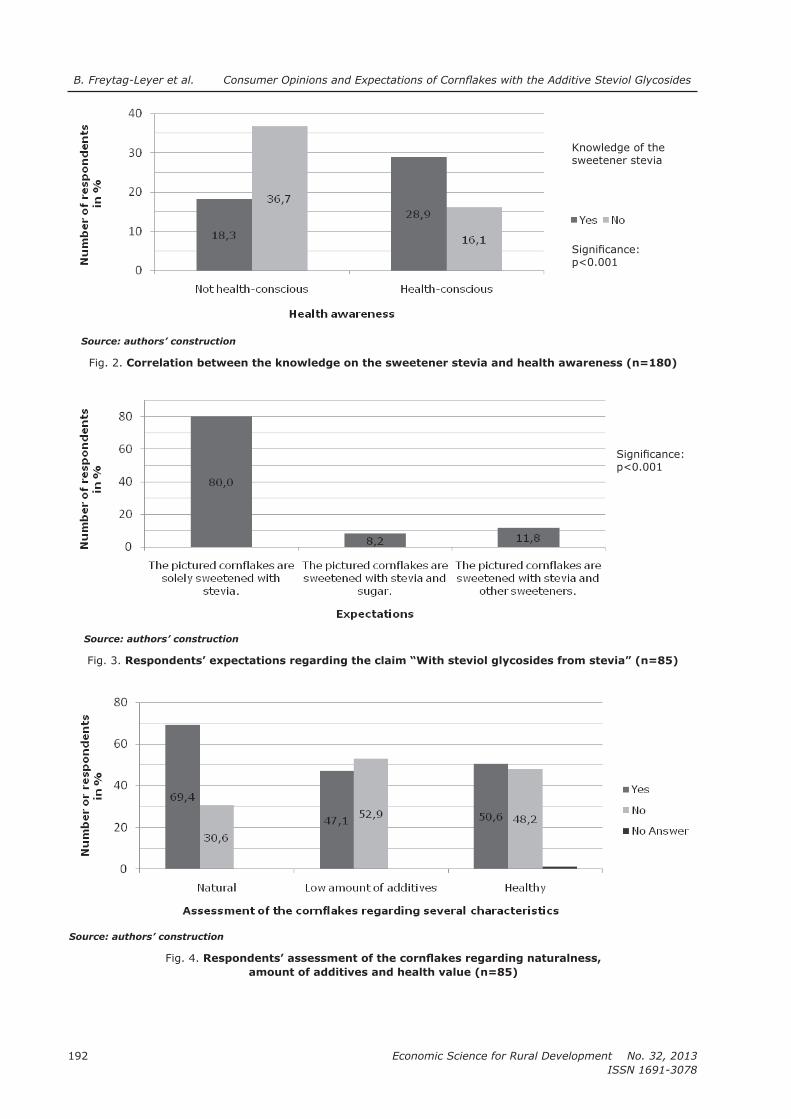
Economic Science for Rural Development No. 32, 2013
ISSN 1691-3078
192
B. Freytag-Leyer et al.
Source: authors’ construction
Fig. 2. Correlation between the knowledge on the sweetener stevia and health awareness (n=180)
p<0.001
Knowledge of the sweetener stevia
Source: authors’ construction
Fig. 3. Respondents’ expectations regarding the claim “With steviol glycosides from stevia” (n=85)
p<0.001
Source: authors’ construction
Fig. 4.
amount of additives and health value (n=85)

193
Economic Science for Rural Development No. 32, 2013
ISSN 1691-3078
B. Freytag-Leyer et al.
Regarding this topic, the following hypothesis was
as natural sweeteners. The test shows with high
assumed that consumers perceive steviol glycosides as natural but not as healthy sweeteners.
The study also shows that 45.9% of the participants are not sure if steviol glycosides are additives or not, whereas, 37.6% of the participants do not think that steviol glycosides are additives, only 16.5% know that this sweetener is an additive (Figure 5). This result is
It has been hypothesised that consumers who know that steviol glycosides are additives do not perceive them as natural sweeteners. No statement can be given as to whether the hypothesis is right or wrong, since this hypothesis only applies to eight (9.4%) respondents.
Moreover, it has been determined whether
results show that 55.3% of the questioned people
sweetened with sugar, while 21.2% do not prefer it and 23.5% do not know if they prefer it or not (Figure 6). The products are preferred mainly because of the lower caloric content (15.0%) or because the respondents want to avoid sugar (13.0%).
Similar results can be shown regarding preference to
The reasons for this preference are that the
are healthier (15.0%) and more natural (11.0%) or because they want to avoid other sweeteners (7.0%).
In this context, it has been hypothesised that health-conscious consumers prefer products
for this hypothesis.
Source: authors’ construction
Fig. 5. Respondents’ assessment of the statement “Steviol glycosides are additives” (n=85)
p=0.003
Source: authors’ construction
Fig. 6.

Economic Science for Rural Development No. 32, 2013
ISSN 1691-3078
194
B. Freytag-Leyer et al.
Among the 85 people who know the sweetener stevia, the majority or 67.7% stated that they expected the
sweetened with sugar. The introduced hypotheses are evaluated in the
It can be
assumed that consumers perceive steviol glycosides
as natural sweeteners can be corroborated out of the four proposed hypotheses. In contrast, the hypotheses
can neither be corroborated nor rejected, since it applies to only eight of the respondents.
In conclusion, the study shows that steviol glycosides are perceived as a natural sweetener. However, it could
by the knowledge that steviol glycosides are food additives. The perception of steviol glycosides as natural sweeteners is also a reason why the respondents prefer a product sweetened with stevia to a product sweetened
thus, represents a buying motive for consumers that can
fact prove to be an effective method for the food industry to set their products apart from competitive products sweetened with other sweeteners, which are often assessed negatively.
because the majority (80.0%) of the consumers expect such a product solely to contain steviol glycosides and no other sweetener. The emphasis on the natural origin
Source: authors’ construction
Fig. 7.
Source: authors’ construction
Fig. 8.
195
Economic Science for Rural Development No. 32, 2013
ISSN 1691-3078
B. Freytag-Leyer et al.
of the sweetener or the image of a stevia plant without the indication that the products contain the additive steviol glycosides can be seen as false declaration of the characteristics of the product. A guideline aimed
correct way to claim a product such as this has yet to
Belgium and Austria offer a good basis to formulate such regulations (BAG, 2010; BMG, 2012; FPS, 2012).
Conclusions, proposals,
recommendations1.
question of consumer perception and expectations regarding steviol glycosides.
2. The study shows that steviol glycosides are perceived as a natural sweetener.
3. The hypothesis that consumers perceive steviol glycosides as healthy sweeteners could not be
4. It is of interest to determine the effect of different claims and packaging designs for further studies.
5. The consumers’ expectations regarding the sensory attributes of a product sweetened with steviol glycosides could be evaluated in further studies.
Bibliography1.
Retrieved: http://www.bag.admin.ch/themen/lebensmittel/04861/04972/ index.html. Access: 27 December 2012.
2. BMG (Bundesministerium für Gesundheit Österreich) (2012). Leitlinie über die täuschungsfreie
Retrieved: http://www.bmgf.gv.at/cms/home/
27 December 2012.
3.
Placing on the Market of Stevia Rebaudiana Bertoni: Plants and Dried Leaves as a Novel Food or Novel
Retrieved: http://eur-lex.europa.eu/LexUriServ/LexUriServ.do? uri=OJ:L:2000:061:0014:0014:EN:PDF. Access: 27 December 2012.
4. Regulation (EU) No 1131/2011 of 11 November
No 1333/2008 of the European Parliament and
Retrieved: http://eur-lex.europa.eu/LexUriServ/ LexUriServ.do?uri=OJ:L:2011:295:0205:0211:EN:PDF. Access: 27 December 2012.
5. Safety and Environment, FPS Economy, Federal
Zoetstof steviolglycosiden – Etikettering en reclame - Versie 2. Retrieved: http://www.favv.be/levensmidde len/et ike t ter ing/_documents/ 2012-05-14_Guidelinesetiketteringreclamesteviolglycosiden-REV05-2012NL.pdf. Access: 27 December 2012. English Translation: Sweeteners Steviol Glycosides. Labelling and Advertising. Retrieved:
pdfs/348_org.pdf. Access 27 December 2012. 6.
Additives) (2010). Steviol Glycosides - Prepared at
http://www.fao.org/ag/agn/jecfa-additives/specs/ monograph10/additive-442-m10.pdf. Access: 27 December 2012.
7. Kienle, U. (2010). Ein Naturstoff macht
Lebensmittelsicherheit, Volume 5, Issue 2, pp. 199–203.
Economic Science for Rural Development No. 32, 2013
ISSN 1691-3078
196
B. Rivza, L. Grinevica Long-Term Unemployment Problems in Latvia Between Forty and Preretirement Age
LONG-TERM UNEMPLOYMENT PROBLEMS IN LATVIA
BETWEEN FORTY AND PRERETIREMENT AGE
Baiba Rivza, Dr.habil.oec, professor; Liva Grinevica1, MBA
Abstract. Long-term unemployment in Latvia and other countries of Europe has recently increased due to the world’s global economic instability. Long-term unemployment is a topical problem in all regions of Latvia that are affected by various economic and social aspects. Therefore, it is substantial to explore and analyse factors, tendencies, and dynamics of economic activities of the unemployed in order to get an idea on options for unemployment risk reduction.
that at the beginning of 2013 the level of unemployment will decline to 8.6%, which is close to the average level of unemployment in the developed European countries such as Austria, Germany, Belgium, and others. However, this forecast is not reliable due to high long-term unemployment rate in Latgale region as well as in other rural regions of Latvia forcing inhabitants to leave the state for searching work elsewhere.This article investigates the relationship between people within the group between 40 and pre-retirement age and differences of regional economic factors by analysing theoretical assumptions of various authors. The aim of the paper is to identify long-term unemployment and to determine solutions for this age group. Key words: long-term unemployment, age structure, regional economic differences, time-series analysis.JEL code: J64
IntroductionDifferences in theoretical and empirical long-
since the 1980s by such researchers as O. M. Levin-Waldman, Machin, Manning, K. Doogan, B. Decreuse,
term unemployment on individuals in the age group
factors. The main indicators of long-term unemployment in that age group are education and health.
The hypothesis of the research: effective
integration in the labour market and reduction of long-term unemployment in the age group between 40 and preretirement age will increase competitiveness of Latvia’s national economy within the context of the Baltic States.
The aim of the research is to show the necessity
between 40 and preretirement. The following research tasks were set in order
to achieve the aim:
1) of other researchers on long-term unemployment by monographic method;
2) to characterise and analyse factors that affect long-term unemployment;
3) to determine the main problems of long-term unemployment;
4) to calculate the growth rate of the unemployment level at preretirement age;
5) to work out recommendations for solving this problem.
to 2011 will be applied for different age groups of pre-retirement age to describe the long-term unemployment situation in Latvia.
Longer unemployment periods leave serious impact on the individual as well as on the overall economy.
literature are available focusing on the unemployment’s impact on individual’s well-being with such effects as low self-esteem, health problems, and higher suicide numbers.
Some authors stress destructive impacts on the economy caused by the high rate of long-term unemployment. Many of these studies focus on
the upward pressure on wages from the supply side is likely to be higher in the presence of a high proportion of long-term unemployment within total unemployment (Machin and Manning, 1999).
Research results and discussion
term unemployment indicates that a substantial section of the labour force is in surplus to the requirements of local employers. This surplus may nevertheless coexist
According to Junankar, the long-term unemployed usually have lower exit probability compared with other job seekers for two reasons. Firstly, employers often treat unemployment duration as a negative signal. Employers consider that the unemployed shall be hopeless, thus, they are jobless for a longer time. Secondly, the long-term unemployed lose their skills, become dejected, and drop out of the labour market (Junankar P. N., 2011).
unemployment as a 12 months period or longer when a person is unemployed, the unemployed not only lose their skills, they lose motivation, they fall ill. In crude economic terms, human capital is being depreciated. There is also
___________________________1 E-mail: [email protected]

197
Economic Science for Rural Development No. 32, 2013
ISSN 1691-3078
a mass of misery and suffering. These people often live in poverty, they have lost their self-respect and dignity; they accept the verdict of the labour market with mixture of resentment and resignation (Junankar P. N., 2011).
unemployment varies across countries and across international statistical agencies, ranging between
average minimum duration, namely 9 months, are used
into a long-term unemployment spell. One of the reasons for such a threshold is that it also corresponds to the
due to the fact that employers tend to be more reluctant to hire someone unemployed for more than 9 months
It is necessary to solve the problem of long-term
— the demand for labour; — the supply of labour; — the functioning of the labour market.
In a pure neoclassical economics, the demand for labour is independent of aggregate demand (Junankar P. N., 2011).
The global economic crisis is the most serious reason that made important changes on the labour market in 2009 when many job seekers became long-term unemployed. In 2008, the long-term unemployment rate increased in several Member States of the European Union like Ireland, Spain; the Baltic States had the same trend. The economic crisis has had a greater impact on the population groups such as ethnic minorities, promoting the risk of increased long-term unemployment.
According to Marksoo and Tammaru, the labour markets function regionally, while education, age and ethnicity are the key individual variables that shape labour market outcomes. Long-term unemployment explains much of the continuing problem of social exclusion in some rural areas. The long-term unemployed have
job mismatch, which is made by geographical differences
(Marksoo U., Tammaru T., 2011). Likewise, if there is a high degree of urbanisation,
there are higher chances of getting trapped in a long-
Gender also has an important role. Women have less favourable prospects in the labour market as they often combine work with family duties and childcare. The unemployment rate for females in many European countries is higher than the one for men. Females would
males because of long periods that are led at home
The relationships between education and unemployment are explained partly by the signalling and screening theories. These studies suggest that employers hire workers on the basis of imperfect information about their real productivity levels transmitted through their
proxy for performance. In addition to education level, other relevant factors for determining the probability
of entering or exiting unemployment are related with the individual’s labour market biography. Individuals with more and best experience are more attractive to employers as they can potentially invest less in their
The most important factor behind the increase of long-term unemployment relates with the increase of unemployment duration among low-educated people and people without diverse and big work experience. The unemployment rate is generally higher among individuals with lower education level. Less skilled workers have
longer unemployment spells. As a result, they are disproportionately represented among the long-term unemployed (Marksoo U., Tammaru T., 2011).
Long-term structural labour market problems suggest that substantial mismatches between the skills and aspirations of job losers (especially the long-term unemployed), and the skill requirements and compensation packages of new job openings are likely to emerge as the economy recovers from the global economic crisis. Many job losers from sectors such as
well as gaining the training and education required for the new jobs available in the growing (primarily service)
In many European countries, poor health, chronic diseases, and lifestyle factors are associated with being the long-term unemployed or out of the labour market
General economic conditions on the regional level also affect substantially the transition rate from and to unemployment. Factors such as regional differences in industry composition, neighbours’ effects affecting the equilibrium rate of unemployment and aggregate demand, and institutional settings have an important role in explaining regional unemployment patterns
that the occurrence of a high proportion of long-term unemployment is an evidence of profound dysfunction in the local labour market area. Studies on unemployment differentials that take into account the regional perspective and use simultaneous modelling are based on the hypothesis that regional unemployment both affects and is affected by regional factors of labour supply,
According to Marksoo and Tammaru (2011), older people are more likely to remain unemployed after losing their job. Among older workers, those losing their jobs in traditional industrial sectors are particularly vulnerable to long-term unemployment (Marksoo U., Tammaru T., 2011). This kind of situation is widespread in Latvia in
the previous one because young people with better technological knowledge are more marketable.
Various public policies for solving the unemployment problem have been developed on the basis of Veblen’s theory of unemployment. That theory is of excellent quality and better suited than other theories of employment such as the Keynesin theory, the innovation
B. Rivza, L. Grinevica Long-Term Unemployment Problems in Latvia Between Forty and Preretirement Age
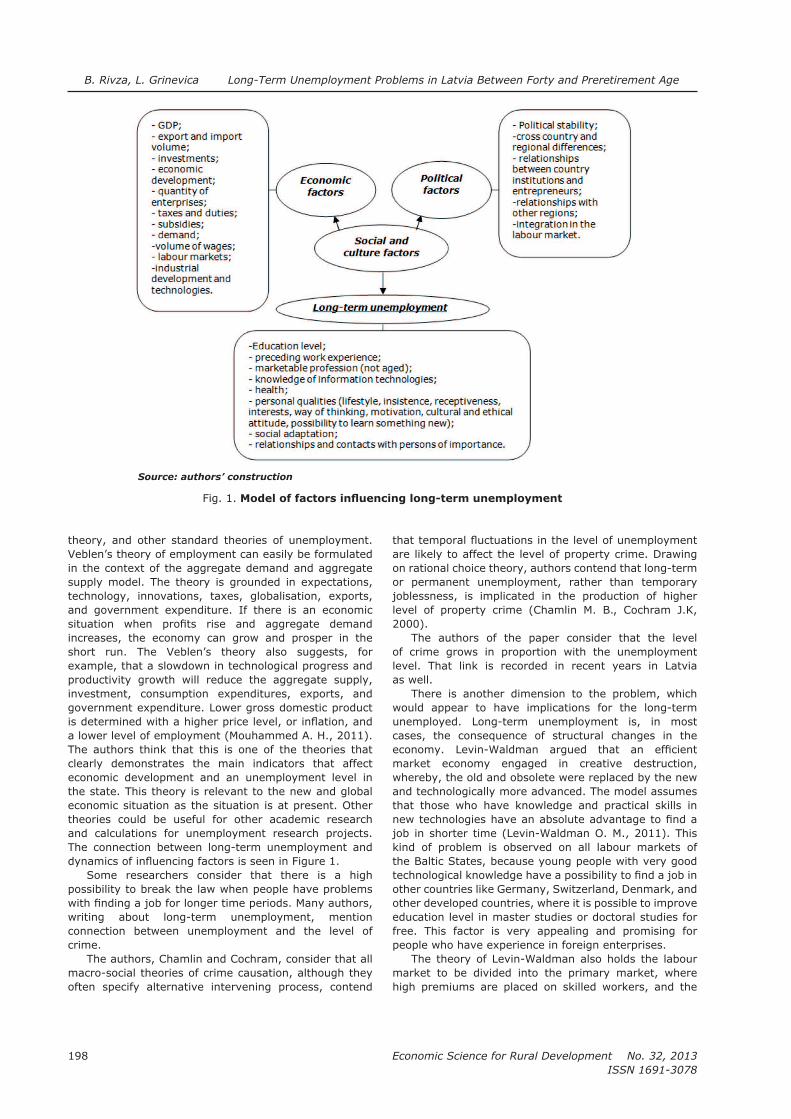
Economic Science for Rural Development No. 32, 2013
ISSN 1691-3078
198
theory, and other standard theories of unemployment. Veblen’s theory of employment can easily be formulated in the context of the aggregate demand and aggregate supply model. The theory is grounded in expectations, technology, innovations, taxes, globalisation, exports, and government expenditure. If there is an economic
increases, the economy can grow and prosper in the short run. The Veblen’s theory also suggests, for example, that a slowdown in technological progress and productivity growth will reduce the aggregate supply, investment, consumption expenditures, exports, and government expenditure. Lower gross domestic product
a lower level of employment (Mouhammed A. H., 2011). The authors think that this is one of the theories that clearly demonstrates the main indicators that affect economic development and an unemployment level in the state. This theory is relevant to the new and global economic situation as the situation is at present. Other theories could be useful for other academic research and calculations for unemployment research projects. The connection between long-term unemployment and
Some researchers consider that there is a high possibility to break the law when people have problems
writing about long-term unemployment, mention connection between unemployment and the level of crime.
macro-social theories of crime causation, although they often specify alternative intervening process, contend
are likely to affect the level of property crime. Drawing on rational choice theory, authors contend that long-term or permanent unemployment, rather than temporary joblessness, is implicated in the production of higher
2000).
The authors of the paper consider that the level of crime grows in proportion with the unemployment level. That link is recorded in recent years in Latvia as well.
There is another dimension to the problem, which would appear to have implications for the long-term unemployed. Long-term unemployment is, in most cases, the consequence of structural changes in the
market economy engaged in creative destruction, whereby, the old and obsolete were replaced by the new and technologically more advanced. The model assumes that those who have knowledge and practical skills in
job in shorter time (Levin-Waldman O. M., 2011). This kind of problem is observed on all labour markets of the Baltic States, because young people with very good
other developed countries, where it is possible to improve education level in master studies or doctoral studies for free. This factor is very appealing and promising for people who have experience in foreign enterprises.
The theory of Levin-Waldman also holds the labour market to be divided into the primary market, where high premiums are placed on skilled workers, and the
Source: authors’ construction
Fig. 1.
B. Rivza, L. Grinevica Long-Term Unemployment Problems in Latvia Between Forty and Preretirement Age

199
Economic Science for Rural Development No. 32, 2013
ISSN 1691-3078
secondary market where unskilled workers are trapped in the lowest-wage service sector of the economy. Structural changes in the economy, which have resulted in less skilled workers being laid off, will inevitably result in their being unemployed longer because their skills no longer match the needs of new employers. This no doubt contributes to long-term unemployment as does changing economies. Employers better require workers with new skills because
(Levin-Waldman O. M., 2011). This situation is also very popular in the Baltic States because effectiveness
main resources of these countries are wood, peat and rapeseed for oil. These industries must be developed more than they are developed today because then new job opportunities will emerge for people from the countryside.
Long-term unemployment could reveal a mismatch between labour market policy and labour market conditions. Lewin-Waldman notes that in many countries, active labour market programmes focus on particular sets of barriers to employment like lack of motivation, lack of job search skills, and lack of marketable skills. Many of these programmes have been shown to be ineffective in reaching their intended goals.
One reason, why they may be ineffective is that people participating in such programmes may actually be expected to reduce their job search activity while they are in the programme. Better they choose to study than to search a job because it is easier. Also these individuals can get grants for studies.
Secondly, the reason that such programmes might be viewed as ineffective is that participation might be interpreted by employers that participants are less likely to be productive.
Thirdly, the reason for their ineffectiveness may
programmes. Available programmes may not meet the needs of the unemployed (Levin-Waldman O. M., 2011).
The problem of Latvia is that more than a half of the
to attend programmes of the State Employment Agency, because there is possibility to receive grants. This kind of problem makes programmes ineffective and it is the main reason why there is a necessity to solve these problems on the government’s level. There is a positive experience, for example, in Estonia and other European countries where it is possible to get access to unemployment problems on the government’s level.
Source: statistical data of the Central Statistical Bureau of Latvia, 2012
Fig. 2. The unemployed as a proportion of economically active population in Latvia, %
Source: authors’ calculations based on statistical data of the Central Statistical Bureau of Latvia
Fig. 3. Absolute growth of chain (%) from 2001 to 2011 in Latvia
B. Rivza, L. Grinevica Long-Term Unemployment Problems in Latvia Between Forty and Preretirement Age

Economic Science for Rural Development No. 32, 2013
ISSN 1691-3078
200
European countries principally exercise four categories of activities:
— Training, which is intended to increase human capital;
— supplemental employment programmes in the public sector;
— private sector schemes; —
To lower the risk of long-term unemployment as well as to lower the rate of unemployment, many
And yet, in many cases, evaluations have only shown that at best they only have small positive effects on participating individuals (Levin-Waldman O. M., 2011).
In some European countries, as Estonia, there are
wage insurance, which subsidises worker earnings when the wage they receive on their new job is less than that of their old job. Besides, there is possibility to get health insurance if you are registered in the State Employment Agency. Therefore, the formal registration of the unemployed is encouraged and the statistical data of unemployment are more realistic than in Latvia.
The lump statistical data on the proportion of the unemployed and dynamic changes in ten years period will be analysed to get a better view of an unemployment situation in Latvia at the preretirement age.
Table 1The growth rate of chain in different age groups from 2001 to 2011 in Latvia
Year
Unemployed as proportion
of economically active
population (%)
Absolute growth of chain (%) Growth rate of the chain T
(%)
45-49 50-54 55-59 45-49 50-54 55-59 45-49 50-54 55-59
2001 13.2 13.4 12.5
2002 8.3 11.5 10.4 -4.90 -1.90 -2.10 0.63 0.86 0.83
2003 10.7 11.7 8.5 2.40 0.20 -1.90 1.29 1.02 0.82
2004 8.9 11.9 10.1 -1.80 0.20 1.60 0.83 1.02 1.19
2005 7.9 11 9.2 -1.00 -0.90 -0.90 0.89 0.92 0.91
2006 7 6.1 7 -0.90 -4.90 -2.20 0.89 0.55 0.76
2007 5.4 5.9 5.4 -1.60 -0.20 -1.60 0.77 0.97 0.77
2008 7 6.7 7.8 1.60 0.80 2.40 1.30 1.14 1.44
2009 15.8 14.5 14.7 8.80 7.80 6.90 2.26 2.16 1.88
2010 17.1 17.8 16.8 1.30 3.30 2.10 1.08 1.23 1.14
2011 13.9 14.1 17.3 -3.20 -3.70 0.50 0.81 0.79 1.03
Source: author’s calculations based on statistical data of the Central Statistical Bureau of Latvia
Table 2The growth rate of base in different age groups from 2001 to 2011 in Latvia
Year
Unemployed as proportion
of economically active
population (%)
Absolute growth of base (%) Growth rate of the base T
(%)
45-49 50-54 55-59 45-49 50-54 55-59 45-49 50-54 55-59
2001 13.2 13.4 12.5
2002 8.3 11.5 10.4 -4.9 -1.9 -2.1 0.63 0.86 0.83
2003 10.7 11.7 8.5 -2.5 -1.7 -4 0.81 0.87 0.68
2004 8.9 11.9 10.1 -4.3 -1.5 -2.4 0.67 0.89 0.81
2005 7.9 11 9.2 -5.3 -2.4 -3.3 0.6 0.82 0.74
2006 7 6.1 7 -6.2 -7.3 -5.5 0.53 0.46 0.56
2007 5.4 5.9 5.4 -7.8 -7.5 -7.1 0.41 0.44 0.43
2008 7 6.7 7.8 -6.2 -6.7 -4.7 0.53 0.5 0.62
2009 15.8 14.5 14.7 2.6 1.1 2.2 1.2 1.08 1.18
2010 17.1 17.8 16.8 3.9 4.4 4.3 1.3 1.33 1.34
2011 13.9 14.1 17.3 0.7 0.7 4.8 1.05 1.05 1.38
Source: authors’ calculations based on statistical data of the Central Statistical Bureau of Latvia
B. Rivza, L. Grinevica Long-Term Unemployment Problems in Latvia Between Forty and Preretirement Age

201
Economic Science for Rural Development No. 32, 2013
ISSN 1691-3078
The analysis of dynamic series of chain and growth of basis are used to review the statistical data on the unemployed as a proportion of economically active population.
The data obtained in the study were statistically processed by the MS Excel program. The chain and basis growth were calculated for three groups of age and years from 2001 to 2011. Formulas of dynamic rows are used in the research.
data, long-term unemployment in Latvia as a percentage of total unemployment rate in the age group between 50 and 64 were 68.1% for males and 61.6% for females (Long-term Unemployment, 2012). In 2010, the number of the unemployed between the age of 55 and 59 likely to be long-term unemployed was slightly more than in the age group 45 to 54.
In the context of sustained employment growth, the ratio between the long-term unemployed and all unemployed has increased sharply between 2008 and 2011.
There was a lower long-term unemployment level from 2005 to 2008 than it is now, and it was from 2001 to 2004 (Figure 2). It is explainable by the economic development after Latvia’s independency when manufacturing was developed. Nowadays, large companies of Latvia have been sold to Danes, Norwegians, Russians, and others.
According to Figure 3, the absolute growth of chain from 2008 to 2010 has increased in all age groups of the preretirement age. There was a drop with positive impact from the end of 2010 when there were better chances to be employed in the age groups of 45 to 49 and 50 to 54. This can be explained by higher proportion of individuals not being registered in the State Employment
Table 1 shows that there is an increase of the unemployment level in all age groups from 2009 to 2011. The results of the study indicate that the absolute growth of chain of job seekers proportion in case of economically active population (in the age group from 45 to 49) in 2002 has decreased to -4.9%, while the number has already grown to 8.8% in 2009. In 2011, there is a decrease of absolute growth of chain in the age groups from 45 to 49 and from 50 to 54, thus, proving the previous result.
According to the table, a potential risk to lose work increases at the preretirement age. In addition, the growth rate of chain has increased from 2008 to 2010. In 2011, there was a smaller increase than in the previous years due to the economic stagnation.
According to the statistical data, in 2001, there is a positive trend when the absolute growth of base has decreased in all groups of age compared with the period of 2009-2011. In the past years (from 2008 to 2011), the absolute growth of base grew rapidly from 0.62% to 1.38%. From 2009 to 2011, the growth rate of the base (T) has increased in all groups of age. It could be explained by employers’ disinclination to employ older people or people at the preretirement age. They better choose to employ young people with new knowledge and skills than the people with the Soviet Union education. Besides, one of the main conditions, why employers give preference to younger people than older, is that young people demand lower salaries.
Conclusions, proposals,
recommendations1. The growth rate of the base has increased in
all groups of age from 2009 to 2011. It could be explained by employers’ disinclination to employ older people or people at the preretirement age without competent knowledge of technologies and languages.
2. In other European countries (for example, in Estonia),
job losers like wage insurance which subsidises worker earnings when the wage they receive in their new job is less than that of their old job. That kind of insurance offers a way of assisting with the psychological support to changing labour market conditions and to upgrade job search incentives. It will be useful to take that kind of experience in Latvia as well.
3. Investments are necessary in order to expand the development of high-quality employment programmes to be warranted as a crucial additional tool for improving the labour market prospects of being employed at the preretirement age.
4.
work with a wage exceeding the minimum wage. The government should improve the environment of entrepreneurship.
5. Many individuals between 40 and the preretirement age have large experience and it is challenging to start a new business. There are many possibilities to take a loan from banks for start-up entrepreneurship, including entrepreneurship in the countryside.
6. It is necessary to improve the work of the State Employment Agency, concentrating on the preretirement age group, providing job search assistance and effective job training systems.
7. It is necessary to pay attention to the group of preretirement age, improving the education level of the unemployed and developing possibility of obtaining new professions free, for example, by improving language and technological skills.
Bibliography1.
in Unemployment Duration and Labour Force Attachment. Bureau of labour Statistics. Princeton University and NBER, pp. 1-60.
2.
Florida. Vol. 16, No. 4, pp. 443-455.3. Doogan, K. (2005). Long-term Employment
and the Restructuring of the Labour Market in Europe. Time & Society. London. Vol. 14, No. 1, pp. 65-87.
4. Economic Activities, Employment Level, Proportion
Latvia. Retrieved: http://data.csb.gov.lv. Access: 08.12.2012.
B. Rivza, L. Grinevica Long-Term Unemployment Problems in Latvia Between Forty and Preretirement Age

Economic Science for Rural Development No. 32, 2013
ISSN 1691-3078
202
5.
6.
the study of Labour. Germany. No. 6057, pp. 3-50.7.
Great Recession. Testimony for the Joint Economic
8.
for a More Radical Policy. Employment Policy Research Network. The state University of New Jersey, pp. 1-45.
9. Long-Term Unemployment (2012). EEO Network
10. Markso, U., Tammaru, T. (2011). Long-term Unemployment in Economic Boom and Bust:
Vol. 15(65/60)3, pp. 215-234.
11. Mouhammed, A. H. (2011). Veblen’s Theory of Unemployment and Public Policies. International Research Journal of Finance and Economics. Euro Journals Publishing, Inc. USA. Issue 70, pp. 218-226.
12. Schmillen, A., Moller, J. (2012). Distribution and Determinants of Lifetime Unemployment. Labour Economics. Germany. Vol. 19, pp. 33-47.
B. Rivza, L. Grinevica Long-Term Unemployment Problems in Latvia Between Forty and Preretirement Age

203
Economic Science for Rural Development No. 32, 2013
ISSN 1691-3078
M. Zafarullah Khan Bridging the Knowledge Gap of Possessed and Required Professional
___________________________1
BRIDGING THE KNOWLEDGE GAP OF POSSESSED AND REQUIRED PROFESSIONAL COMPETENCIES OF PAKISTAN’S
AGRICULTURE EXTENSION OFFICERS
Muhammad Zafarullah Khan1, PhD/ Post Doc
Faculty of Rural Social SciencesThe University of Agriculture, Peshawar
Abstract. Professionalism is a matter of attitude and behaviour. It embraces not just knowing how to do your job, but also demonstrating a willingness to learn, cooperate and get well with others, showing respect, and living up to their commitments. To become professional in your task as an extensionist, it is like other life skills, which you learn; you do
role in the development of agriculture in the country. This study was conducted in Khyber Pakhtunkhwa (Pakistan) and
mailed a questionnaire to collect the data from all (111) AEOs. The study detected that the use of neat and clean dress
use of clean dress were on the bottom. Both possessed and required levels of competencies were scaled from one
background. Key words:
JEL code: Q16
Introduction
criteria have been discussed by sociological investigators (Hall, 1968; Moore, 1970; Goode, 1960; Friedson, 1970). Generally speaking, most would agree with Moore
a sense of calling or commitment or service orientation;
in recent years, when there has been so much concern for professionalism within the ranks of education at all levels of the educational system.
In recent years, enhancing professionalism in agricultural and applied communications has been an important topic of discussion. Developing strategies
administering academic programmes in agricultural communications and agricultural journalism. However, more information is needed on the overall professionalism process, how it has been used in other disciplines, and what factors should be considered in applying it to agricultural communications.
Despite its declining share in Gross Domestic Product (GDP), agriculture is still the single largest sector of
Pakistan economy, contributing 21 percent to GDP and employing 44 percent of the workforce. More than two-thirds of Pakistan population live in rural areas, and their livelihood continues to revolve around agriculture and allied activities directly or indirectly. Empirical evidence suggests that higher growth in agriculture on a sustained basis had a lasting impact on poverty reduction in Asia in the 1970s and the 1980s (GoP, 2008).
Since independence of Pakistan, the Government
production over many decades and attempted to
yet this has always proved to be fragile due to communication gap between farmers and agriculture extension agents, despite the fact that we have a well-established extension and research system. The accountability for transferring of agricultural technology and providing technical supervision to farmers for improving agricultural practices to increase agricultural productivity lies on Agricultural Extension Department.
agricultural products has always been ascribed to
(Urooba, 2001; Idrees, 1994; Ahmad, 1993; Iqbal,
Muhammad, 1981).The growth performance of agriculture over the last
six years has been of a volatile nature – ranging from

Economic Science for Rural Development No. 32, 2013
ISSN 1691-3078
204
1.5 percent to 6.5 percent. However, agriculture performed poorly in 2007-2008, growing at 1.5 percent against the target of 4.8 percent. The poor performance of agriculture can be attributed to an poor performance of major crops and forestry, registering negative growth of 3.0 percent and 8.5 percent, respectively. Major crops, accounting for 34 percent of agriculture and 7.1 percent of GDP, suffered because of poor progress of wheat and cotton and less than satisfactory performance of rice crop.
performed impressively in 2007-2008. Minor crops accounting for 12 percent in the agriculture value added posted a growth of 4.9 percent against the negative growth of 1.3 percent last year (GoP, 2008).
This gap between the potential yields and the actual yields is attributed to farmers’ lack of awareness
knowledge to agricultural practices. Extension workers can now be found throughout the country, yet the results still are not satisfactory. This is due
non-motivated extension agents throughout the country. In order to study the professionalism of the
study was carried out to examine existing levels of
(AEOs) and to assess the required level of professional competencies needed by AEOs for their job performance in professionalism.
Materials and methodsThis study was conducted in Khyber Pakhtunkhwa
Province in Pakistan and total number of
study. Both primary and secondary data were used in the study area. Primary data were collected through a carefully prepared and pre-tested questionnaire. Secondary data were obtained through published sources. The Questionnaires were provided to
meetings were conducted at Divisional Level through the management of Agriculture Extension Department, the questionnaire was explained to them and they were
selected competencies of AEOs. Several researchers have followed this approach in the past (Ali, 1991; Randavary and Vaughn, 1991; Najjingo et al., 1991 and Easter, 1985). The Likert scale was used to capture the level and intensity of professional competencies. Scaling for possessed and required competencies was
average, high and very high. The author assessed
Table 1Mean SD and rank of self-perceived professional competency level required and possessed by AOs
Competency Required level perceived Level possessed
The ability to: Mean SD Rank Mean SD Rank
Use neat and clean dress 4.514 0.7244 1 4.045 0.802 1
Value/like extension work 4.505 0.6161 2 3.811 0.919 2
View extension work as a long career 4.369 0.7738 3 3.721 0.936 3
4.342 0.6808 4 3.369 0.934 4
Identify professional agri-extension societies in Pakistan 4.243 0.7771 5 3.063 0.984 5
Average 4.395 3.602
Source: Field survey
Table 2Mean of self-perceived professional competency level required and
possessed by AOs with training need and its rank regarding professionalism
CompetencyRequired level
perceived
Level
possessed
Training
need Rank
The ability to: Mean Mean Diff = LR-LP
Identify professional agri-extension societies in Pakistan 4.243 3.063 1.1802 1
Identify professional agri-extension 4.342 3.369 0.9730 2
Value/like extension work 4.505 3.811 0.6937 3
View the extension work as alife long career 4.369 3.721 0.6486 4
Use neat and clean dress 4.514 4.045 0.4685 5
Average 4.395 3.602 0.793
Source: Field survey
M. Zafarullah Khan Bridging the Knowledge Gap of Possessed and Required Professional
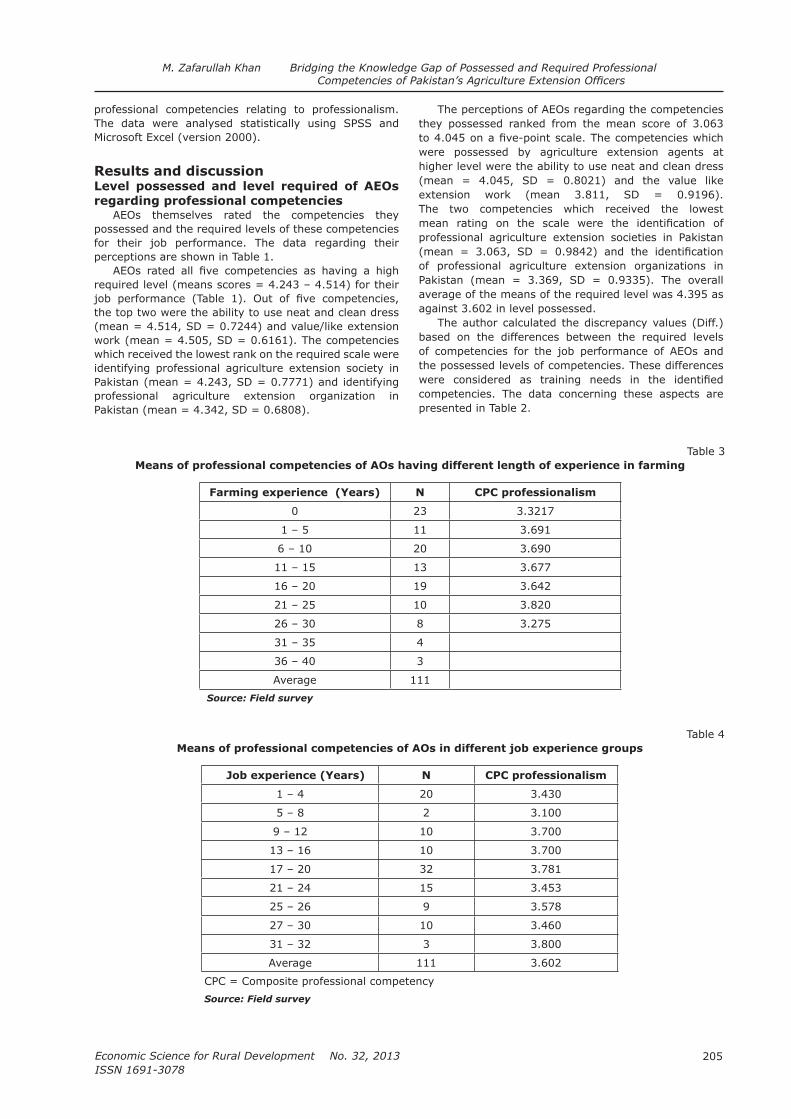
205
Economic Science for Rural Development No. 32, 2013
ISSN 1691-3078
professional competencies relating to professionalism. The data were analysed statistically using SPSS and Microsoft Excel (version 2000).
Results and discussionLevel possessed and level required of AEOs regarding professional competencies
AEOs themselves rated the competencies they possessed and the required levels of these competencies for their job performance. The data regarding their perceptions are shown in Table 1.
required level (means scores = 4.243 – 4.514) for their
the top two were the ability to use neat and clean dress (mean = 4.514, SD = 0.7244) and value/like extension work (mean = 4.505, SD = 0.6161). The competencies which received the lowest rank on the required scale were identifying professional agriculture extension society in Pakistan (mean = 4.243, SD = 0.7771) and identifying
Pakistan (mean = 4.342, SD = 0.6808).
The perceptions of AEOs regarding the competencies they possessed ranked from the mean score of 3.063
were possessed by agriculture extension agents at higher level were the ability to use neat and clean dress (mean = 4.045, SD = 0.8021) and the value like extension work (mean 3.811, SD = 0.9196). The two competencies which received the lowest
professional agriculture extension societies in Pakistan
Pakistan (mean = 3.369, SD = 0.9335). The overall average of the means of the required level was 4.395 as against 3.602 in level possessed.
The author calculated the discrepancy values (Diff.) based on the differences between the required levels of competencies for the job performance of AEOs and the possessed levels of competencies. These differences
competencies. The data concerning these aspects are presented in Table 2.
Table 3 Means of professional competencies of AOs having different length of experience in farming
Farming experience (Years) N CPC professionalism
0 23 3.3217
1 – 5 11 3.691
6 – 10 20 3.690
11 – 15 13 3.677
16 – 20 19 3.642
21 – 25 10 3.820
26 – 30 8 3.275
31 – 35 4
36 – 40 3
Average 111
Source: Field survey
Table 4 Means of professional competencies of AOs in different job experience groups
Job experience (Years) N CPC professionalism
1 – 4 20 3.430
5 – 8 2 3.100
9 – 12 10 3.700
13 – 16 10 3.700
17 – 20 32 3.781
21 – 24 15 3.453
25 – 26 9 3.578
27 – 30 10 3.460
31 – 32 3 3.800
Average 111 3.602
Source: Field survey
M. Zafarullah Khan Bridging the Knowledge Gap of Possessed and Required Professional

Economic Science for Rural Development No. 32, 2013
ISSN 1691-3078
206
The discrepancy values (Table 2) between the required levels for the job performance of AEOs and the level of these competencies possessed by them were considered as training needs of AEOs in these competencies. Out of
societies in Pakistan (Diff. = 1.1802) and identifying
(Diff. = 0.9730). The training needs with lowest required levels included: 1) use of neat and clean dress (Diff. = 0.4685); 2) view the extension work as a life long carrier (Diff. = 0.6486). The difference based on
for all competencies was ranging from the lowest value (0.4685) to the highest value (1.1802). It means that
Table 2. Rural and agricultural development is integral to any strategy to alleviate poverty and promote broad-based growth in Khyber Pakhtunkhwa. Therefore, the AEOs need to be competitive and well equipped with the modern trends.
Length of experience in farming versus professional competencies of AEOs
professional competencies of AEOs having different length of experience in farming (Table 3). The lowest value (3.275) was observed for the respondents with 26-30 year of farming experience, whereas high value (3.691) was observed for those with 1-5 years of farming experience.
Analysis of job experience versus professional competencies of AEOs
Differences for professional competencies in
revealed in (Table 4). Table 4 shows that the minimum value (3.453) was observed for the respondents’ group with 21-24 years of framing experience, while the maximum value (3.800) was observed for those with
that professionalism is increasing by having personal experience in farming.
Table 5 Means of professional competencies of AOs in different age groups
Age group (Years) N CPC professionalism
25–28 8 3.300
29–32 12 3.450
33–36 4 3.450
37–40 10 3.560
41–44 21 3.886
45–48 18 3.544
49–52 10 3.540
53–56 17
57–60 11
Source: Field survey
Source: author’s calculations
Fig.1: Comparison between existing and expected levels of professional competencies of AOs
M. Zafarullah Khan Bridging the Knowledge Gap of Possessed and Required Professional

207
Economic Science for Rural Development No. 32, 2013
ISSN 1691-3078
Analysis of age versus professional competencies of AEOs
professional competencies of AEOs in different age groups (Table 5). The minimum vale (3.300) was observed for the age group of 25-28 years, and the maximum (3.886) was observed for the age group of 41-44 years in the area of professionalism.
Comparison between existing and expected competencies
The existing and expected professional competencies possessed by AEOs are shown by a web-radar in Figure 1. The difference between the required and possessed levels of professional competencies is based on their WAI values, as depicted in Figure 1.
Factors associated with professional competencies
demographic factors such as age, job experience,
with professionalism, while domicile, previous experience in farming, and attendance of irregular training programmes have negative relationship with professionalism. One of the previous studies also reveals that extension specialists are one of the preliminary sources of awareness and information for the country agents (Shih and Evans, 1991).
Among the associated factors shown in table 6,
family background (0.212)
ConclusionsBased on the present study, the following conclusions
were drawn by the author. — The study found that AEOs lack essential skills of
professionalism. — AEOs are unaware of the latest professional trends
and are not conversant with agricultural extension
Table 6 Factors associated with professional competencies
Factors (independent)
Age 0.171 0.073
Job experience 0.119 0.212
0.370** 0.000
0.007 0.944
Family background 0.212* 0.026
Domicile -0.064 0.507
Previous experience in farming -0.038 0.693
Attendance of irregular training programme
-0.173 0.070
Source: Field survey
— AEOs have high expectations to get better professional skills.
—competencies of AEOs.
— The demographic characteristics like age, job experience, farming experience, and the place of origin have no effect on technical competency.
Recommendations This paper has given a broad overview in difference
between the expected and existing levels in professional
recommended that
need based in-service training in two competencies of professionalism, including professionalism in Agriculture
Extension Societies in Pakistan.
their professional knowledge, so that they could deliver modern technology to the farming communities more effectively.
Bibliography1. Ahmad, M. (1993). Evaluation of the Working
Extension Field Staff for the Development of
Agri. Faislabad, Pakistan.2.
Agricultural Eextension Field Assistant in Faisalabad District, Punjab, Pakistan. Doctoral dissertation, University of Minnesota, the USA.
3. Easter, G.W. (1985). Assessment of Professional
Doctoral Dissertation Pennsylvania State University, the USA.
4. Friedson, E . (1970). The Profession of Medicine.
5. Goode, W. (1960), Professions: Encroachment,
Psychology, Sociology and Medicine. American Psychological Review, 25, December, pp. 902-914.
M. Zafarullah Khan Bridging the Knowledge Gap of Possessed and Required Professional

Economic Science for Rural Development No. 32, 2013
ISSN 1691-3078
208
6. Government of Pakistan, 2008. Agricultural Statistics of Pakistan, Ministry of Food, Agriculture and Livestock, Economic Wing, Islamabad. pp. 18-67.
7. Hall, R. (1968). Professionalism and
February, 33(1), pp. 92-104.8. Hayat, A. (1982). An Evaluation of Working Punjab
Extension and Agricultural Development Project, Sargodha District. M.Sc. (H) Agril. Ext. Thesis, Univ. Agric. Faisalabad, Pakistan.
9. Hussain, A. (1983). An Appraisal of the Working Image of Extension Field Staff as Perceived by
(Agr. Ext.) thesis, Univ. Agric., Faisalabad, Pakistan.
10. Idrees, M. (1994). Agril. Extension Problems and Future Strategies. J. Rural Develop. Admin. 26(41) pp. 135-141.
11. Iqbal, M.A. (1990). A study into the Working
Vt Programmes in D.G. Khan District. M.Sc. (H) Agril. Extension thesis, Univ. Agric. Faisalabad, Pakistan.
12. Moore, W. (1970). The Professions: Roles and Rules. New York: The Russell Sage Foundation.
13. Muhammad, S. (1981). An Evaluation of Working Agriculture Department (Extension) as Perceived by
the Farmers of University Project Area, Shah Kot, District Sheikhupura. M.Sc. (H) Agri. Ext. Thesis, Univ. Agric. Faisalabad, Pakistan.
14. An Assessment of the Technical and Professional
St. Louis., Mo. 15.
Extension Activities of Agriculture Department in Tehsil Shaker Garh District Sialkot. M.Sc. (H) Agril. Extension thesis, Univ. Agric. Faisalabad, Pakistan.
16. Randavary, S. and Vaughn, P.R.. (1991). Self
Possessed by Agricultural Extension Worker in the Western Region of Thailand. A Multivariate Technique Approach. The Informer Association for Inter. Agric. Ext. Edu. 7 (1), pp. 19-26.
17. Shih, W. and Evans, J.F.. (1991). Where Field Staff Gets Information. Journal of Extension[Online].34(1). Available: http://www.joe.org/joe/1991fall/a5.html.
18. Urooba, P. (2001). Main Factors Affecting Extension Activities. A case study of Malakand agency M.Sc thesis Deptt. of Agric. Extension Education and
Peshawar, Pakistan.
M. Zafarullah Khan Bridging the Knowledge Gap of Possessed and Required Professional

209
Economic Science for Rural Development No. 32, 2013
ISSN 1691-3078

Economic Science for Rural Development No. 32, 2013
ISSN 1691-3078
210
Nr. 32Editor – in-chief Aija Eglite
Printed and bound in Drukatava Ltd.Spilvas street 9, Marupe,
Latvia