Economic Impact of Dyspepsia in Rural and Urban Malaysia
15
JNM Journal of Neurogastroenterology and Motility Original Article 43 J Neurogastroenterol Motil, Vol. 18 No. 1 January, 2012 pISSN: 2093-0879 eISSN: 2093-0887 http://dx.doi.org/10.5056/jnm.2012.18.1.43 ⓒ 2012 The Korean Society of Neurogastroenterology and Motility J Neurogastroenterol Motil, Vol. 18 No. 1 January, 2012 www.jnmjournal.org Economic Impact of Dyspepsia in Rural and Urban Malaysia: A Population-Based Study Sanjiv Mahadeva, 1 * Hematram Yadav, 2 Simon M Everett 3 and Khean-Lee Goh 1 1 Division of Gastroenterology, Department of Medicine, Faculty of Medicine, University of Malaya, Kuala Lumpur, Malaysia; 2 Division of Community Medicine, Faculty of Medicine, International Medical University, Kuala Lumpur, Malaysia; and 3 Department of Gastroenterology, Leeds General Infirmary, Leeds, United Kingdom ㅋ Background/Aims The economic impact of dyspepsia in regions with a diverse healthcare system remains uncertain. This study aimed to estimate the costs of dyspepsia in a rural and urban population in Malaysia. Methods Economic evaluation was performed based on the cost-of-illness method. Resource utilization and quality of life data over a specific time frame, were collected to determine direct, indirect and intangible costs related to dyspepsia. Results The prevalences of dyspepsia in the rural (n = 2,000) and urban (n = 2,039) populations were 14.6% and 24.3% respectively. Differences in socioeconomic status and healthcare utilisation between both populations were considerable. The cost of dys- pepsia per 1,000 population per year was estimated at USD14,816.10 and USD59,282.20 in the rural and urban populations respectively. The cost per quality adjusted life year for dyspepsia in rural and urban adults was USD16.30 and USD69.75, respectively. Conclusions The economic impact of dyspepsia is greater in an urban compared to a rural setting. Differences in socioeconomic status and healthcare utilisation between populations are thought to contribute to this difference. (J Neurogastroenterol Motil 2012;18:43-57) Key Words Asia; Dyspepsia; Health; Population; Quality-adjusted life years Received: October 9, 2011 Revised: December 5, 2011 Accepted: December 9, 2011 CC This is an Open Access article distributed under the terms of the Creative Commons Attribution Non-Commercial License (http://creativecommons. org/licenses/by-nc/3.0) which permits unrestricted non-commercial use, distribution, and reproduction in any medium, provided the original work is properly cited. *Correspondence: Sanjiv Mahadeva, MD Division of Gastroenterology, Department of Medicine, Faculty of Medicine, University of Malaya, 50603 Kuala Lumpur, Malaysia Tel: +60-3-7949-2299, Fax: +60-3-7960-2673, E-mail: [email protected] Financial support: This study was supported by Center for Economic Development and Ethnic Research (CEDER), University of Malaya. Conflicts of interest: None. Introduction Dyspepsia, a collection of symptoms referable to the upper gastrointestinal tract (GI), is a global concern. It is known to have a prevalence rate ranging from 14%-30% in both the West and in Asia. 1-4 This would be a major problem if dyspepsia resulted in the reduction of the life span of individuals with the condition. However, as the majority of cases have functional disease, dys- pepsia is rarely fatal. 5 Nevertheless, dyspepsia has been shown to exert a significant impact on health-related quality of life 6 in lieu of its chronic, relapsing natural history 7 and the lack of effective
-
Upload
khangminh22 -
Category
Documents
-
view
0 -
download
0
Transcript of Economic Impact of Dyspepsia in Rural and Urban Malaysia

JNM Journal of Neurogastroenterology and Motility Original Article
43
J Neurogastroenterol Motil, Vol. 18 No. 1 January, 2012 pISSN: 2093-0879 eISSN: 2093-0887http://dx.doi.org/10.5056/jnm.2012.18.1.43
ⓒ 2012 The Korean Society of Neurogastroenterology and Motility
J Neurogastroenterol Motil, Vol. 18 No. 1 January, 2012www.jnmjournal.org
Economic Impact of Dyspepsia in Rural and Urban Malaysia: A Population-Based Study
Sanjiv Mahadeva,1* Hematram Yadav,2 Simon M Everett3 and Khean-Lee Goh1
1Division of Gastroenterology, Department of Medicine, Faculty of Medicine, University of Malaya, Kuala Lumpur, Malaysia; 2Division of Community Medicine, Faculty of Medicine, International Medical University, Kuala Lumpur, Malaysia; and 3Department of Gastroenterology, Leeds General Infirmary, Leeds, United Kingdom
ㅋ
Background/AimsThe economic impact of dyspepsia in regions with a diverse healthcare system remains uncertain. This study aimed to estimate the costs of dyspepsia in a rural and urban population in Malaysia.
MethodsEconomic evaluation was performed based on the cost-of-illness method. Resource utilization and quality of life data over a specific time frame, were collected to determine direct, indirect and intangible costs related to dyspepsia.
ResultsThe prevalences of dyspepsia in the rural (n = 2,000) and urban (n = 2,039) populations were 14.6% and 24.3% respectively. Differences in socioeconomic status and healthcare utilisation between both populations were considerable. The cost of dys-pepsia per 1,000 population per year was estimated at USD14,816.10 and USD59,282.20 in the rural and urban populations respectively. The cost per quality adjusted life year for dyspepsia in rural and urban adults was USD16.30 and USD69.75, respectively.
ConclusionsThe economic impact of dyspepsia is greater in an urban compared to a rural setting. Differences in socioeconomic status and healthcare utilisation between populations are thought to contribute to this difference. (J Neurogastroenterol Motil 2012;18:43-57)
Key WordsAsia; Dyspepsia; Health; Population; Quality-adjusted life years
Received: October 9, 2011 Revised: December 5, 2011 Accepted: December 9, 2011CC This is an Open Access article distributed under the terms of the Creative Commons Attribution Non-Commercial License (http://creativecommons.
org/licenses/by-nc/3.0) which permits unrestricted non-commercial use, distribution, and reproduction in any medium, provided the original work is properly cited.
*Correspondence: Sanjiv Mahadeva, MDDivision of Gastroenterology, Department of Medicine, Faculty of Medicine, University of Malaya, 50603 Kuala Lumpur, MalaysiaTel: +60-3-7949-2299, Fax: +60-3-7960-2673, E-mail: [email protected]
Financial support: This study was supported by Center for Economic Development and Ethnic Research (CEDER), University of Malaya.Conflicts of interest: None.
IntroductionDyspepsia, a collection of symptoms referable to the upper
gastrointestinal tract (GI), is a global concern. It is known to have a prevalence rate ranging from 14%-30% in both the West and in
Asia.1-4 This would be a major problem if dyspepsia resulted in the reduction of the life span of individuals with the condition. However, as the majority of cases have functional disease, dys-pepsia is rarely fatal.5 Nevertheless, dyspepsia has been shown to exert a significant impact on health-related quality of life6 in lieu of its chronic, relapsing natural history7 and the lack of effective

Sanjiv Mahadeva, et al
44 Journal of Neurogastroenterology and Motility
therapy for symptom control.8
While health-related quality of life is one method of examin-ing the impact of dyspepsia, the financial costs or the economic burden that it incurs is another. To date, very few studies have made an attempt to estimate the true economic impact of dyspepsia. Some studies have not made an actual cost analysis, but have implied the economic burden of dyspepsia by doc-umenting healthcare utilization and loss of productivity.9-11 The true cost of any disease or condition is known to broadly consist of direct medical costs, ie, the cost of the treatment, medical con-sultation and hospitalization etc, used in the management of an individual, and indirect costs, which include costs to the patient and society as a result of loss of employment. The latter is gen-erally implied by the amount of time off work, usually measured in days, resulting from the illness/condition. Additional in-tangible costs of dyspepsia, as a result of its’ impact on quality of life, is further often neglected in economic analyses, as this data is difficult to obtain.
The actual cost of dyspepsia, from both health-service costs and loss of productivity will inevitably vary from different parts of the globe, depending on local health-care costs and labour wages. To date, there is a lack of data on the economic impact of dyspep-sia in Asia, the world’s most populous continent. Healthcare pro-vision in many parts of Asia is diverse, with significant differences and disparities between urban and rural areas. Malaysia is a de-veloping, multi-ethnic Asian country of 26 million residents, comprising of 3 major distinct ethnic groups, namely Malays (51%), Chinese (27%) and Indians (8%).12 Almost half (44%) of the population reside in rural areas and the ethnic distribution be-tween urban and rural population is distinctly varied.12 The gov-ernment of Malaysia does not have a health insurance care system provision for all. It has a subsidised public healthcare system, which is the same for both rural and urban areas, but there are differences in delivery.13 The private healthcare system is mostly paid by individuals “out of pocket,” ie, by cash. Some adults have insurance, but that is entirely dependent on the individual and not compulsory for all.
We had previously conducted epidemiological studies on dyspepsia in both representative rural and urban populations in this country and these results have been reported elsewhere.2,3 The aim of the present study is to estimate the costs of dyspepsia in both rural and urban populations over a 12-month period, uti-lising data from the population survey.
Materials and MethodsThis study used a cost-of-illness method to calculate the cost
to society as a result of dyspepsia.14 A cost-of-illness analysis is a descriptive type of study, relating all costs to a specific disease or event. Cost-of-illness studies use either a prevalence-based or an incidence-based approach. A prevalence-based, “bottom-up” es-timate of cost-of-illness was performed. The “bottom-up” ap-proach usually starts from a selected sub-population with the ac-tual disease and all costs related to the disease are estimated and then extrapolated to the national level. Costing for dyspepsia was calculated on the principle of collecting information on resource consumption and multiplying each resource (quantity) with a unit cost (price). Costs were classified into 3 standard categories of di-rect, indirect and intangible costs.15
Study DesignLocal institutional ethics approval was obtained prior to the
commencement of the study. Details of the study design have been reported previously.2,3 Essentially, a cross-sectional survey was conducted in representative populations in both rural and ur-ban areas within Malaysia between January and October 2007. A population-based stratified sampling method was used to in-dentify households for the survey.16 The district of Kuala Langat, in the state of Selangor, with a population of 30,009 residents dis-tributed among 9 villages, was chosen for the rural survey as the population in this region was typical of the socio-demographics of rural Malaysia.12 For the urban component of the study, Taman Tun Dr Ismail, a residential area with an estimated population of 25,000 residents situated within the heart of Kuala Lumpur, was selected as the population that typified the ethnic and socio-dem-ographic pattern of urban Malaysia.12
Dyspepsia was defined according to the Rome II criteria.17 A modified version had previously been translated into the local Malay language (using standard procedures) and validated in a group of Malaysian patients as part of a pan-Asian study on func-tional GI diseases.18 A structured questionnaire, which included the modified Rome II questions and the EQ-5D (EuroQol, Rotterdam, Netherlands), was used to obtain data in this study (Appendix, see page 51-57).
Direct and Indirect Costing ValuationDirect costs were calculated based on the actual items spent
on healthcare. Consultation practices related to dyspepsia alone

Economic Impact of Dyspepsia
45Vol. 18, No. 1 January, 2012 (43-57)
Table 1. Cost of Dyspepsia-Related Medications and Medical Resources in Malaysia in 2007/2008
Unit cost of medical resources Malaysian currency RM (USD)
Western medicine (range per month) Antacid 43.20-54.00 (13.95-17.40)H2RA 14.40-25.20 (4.65-8.15)PPI 160.8-175.0 (51.90-56.45)Pro-motility 63.0-68.0 (20.30-21.90)Simethicone 18.90 (6.10)
Complimentary medicine (range per month) Western herbal 24.0-54.0 (7.75-17.50)Traditional Malay 24.0-39.60 (7.75-12.80)Traditional Chinese 57.0-63.0 (18.40-20.30)Traditional Indian 15.0-18.0 (4.85-5.80)
Medical resources Family practitioner visit 75.00 (24.20)Specialist physician visit 150.00 (48.40)Hospital admission/day 200.00 (64.50)Emergency room visit 150.00 (48.40)
H2RA, H2 receptor antagonist; PPI, proton-pump inhibitor.
was assessed by determining the frequency and type of facility visited over a 3-month period. The time frame of 3 months was chosen in accordance with published literature to minimize recall bias among respondents. Data on regular consumption of medi-cation for dyspeptic symptoms, either bought over-the-counter or prescribed, over a 3-month period was obtained in the question-naire. To overcome the recognized limitation of public knowl-edge for drug names, a colour pictorial of tablets (with names) commonly utilized for various GI disorders, designed by this in-stitution’s pharmacy department, was used by data collectors. The usage of traditional/complementary medicines were addi-tionally enquired and documented. The cost of Western drugs for dyspepsia were based on pharmaceutical retail prices as out-lined in the Drug Index of Medical Specialities.19 The cost of tra-ditional Eastern medicines used locally for dyspeptic symptoms were obtained from local suppliers (Table 1). Costs of primary and secondary care consultations, investigation procedures and hospital admissions were based on the Malaysian Medical Association 2002/4 procedural code book.
Indirect costs in this study were based on loss of earnings due to work absenteeism as a result of dyspepsia symptoms over a 3-month period. Costs due to premature mortality or retirement as a result of dyspepsia was not included, as dyspepsia has a negli-ble impact on mortality and is not known to cause long-term disability.
Intangible CostsDyspepsia is recognized to have a significant impairment of
health-related quality of life in various populations globally.3,6 As
quality of life is an intangible measure of cost, it is often omitted from economic evaluations of chronic diseases. In this study, we used a locally translated20 and validated21 version of the EQ-5D (EuroQol) instrument to determine a composite utility value for various domains of health.22 Based on a 3-month definition of dyspepsia, the utility scores of the EQ-5D were used as an esti-mate of the number of quality-adjusted life years (QALYs). By imputing a monetary value on each QALY, an estimate of the in-tangible costs due to dyspepsia was obtained.
Statistical MethodsAll data was collected and analysed using the Statistical
Package for Social Sciences (SPSS version 16; SPSS Inc., Chicago, IL, USA). The total cost of dyspepsia was obtained by summing up the direct and indirect costs. As data for costings were collected for a 3-month period, total dyspepsia cost per year was obtained by extrapolation to 12 months. The cost per QALY for dyspepsia was calculated using the formula: cost per QALY = total cost over 12 months/QALY.15 Continuous data were ex-pressed as means with standard deviation or medians with inter-quartile range where appropriate. Analysis of continuous para-metric data was performed with the Student’s t test. Statistical significance was assumed with a P-value of < 0.05.

Sanjiv Mahadeva, et al
46 Journal of Neurogastroenterology and Motility
Table 2. Socioeconomic Status of Both Rural and Urban Study Population
Rural population (n = 2,000) Urban population (n = 2,039)
Age (mean ± SD [range], yr) 40.4 ± 15.3 (17-92) 40.5 ± 11.8 (17-95)Gender (male:female) 1:1.7 1:1.3Ethnicity (n [%]) Malay 1,580 (79.0) 923 (45.3) Chinese 152 (7.6) 774 (38.6) Indian 251 (12.6) 269 (13.2)Marital status (n [%]) Married 1,506 (75.4) 1,434 (70.5)Education (n [%]) None 141 (7.1) 10 (0.5) Primary (at least 6 yr) 526 (26.3) 28 (1.4) Secondary (at least 12 yr) 1,162 (58.1) 731 (35.9) Tertiary (at least 15 yr) 168 (8.4) 1,265 (62.2)Occupation (n [%]) Professional 142 (7.1) 965 (47.3) Non-professional 758 (37.9) 573 (28.1) Unemployed/retired/housewife 988 (49.7) 501 (24.6)Monthly income USD (n [%]) < 300 738 (64.9) 114 (5.6) 301-600 339 (29.8) 365 (17.9) 601-999 47 (4.1) 330 (16.2) > 1,000 14 (1.2) 728 (35.7)Housing type (n [%]) Detached (bungalow) 1,264 (63.4) 197 (9.7) Semi-detached 183 (9.2) 199 (9.8) Terrace/link 551 (27.6) 974 (47.8) Condominium 0 669 (32.8)No. of people per house (n [%]) ≤ 5 683 (34.3) 1,360 (66.7) > 5 1,311 (65.7) 680 (33.3)
Results
Socioeconomic Status of Rural and Urban Population
The study in both rural and urban populations was con-ducted between January and December 2007, and the demo-graphic details have been reported separately before.2,3 In the ru-ral area, complete data was collected on a total of 2,000/2,260 (88.5%) adults from a total number of 1,642 homes. The mean age of interviewees was 40.4 ± 15.3 years, 1,255 (62.7%) adults were female, 329 (16.5%) held professional or semi-skilled jobs and the mean income per month was RM1,044.20 ± 727.45 (USD316.40 ± 220.44). In the urban area, the mean age of in-terviewees was 40.5 ± 11.8 years, 1,137 (55.7%) adults were fe-
male, 1,516 (74.3 %) held professional or semi-skilled jobs and the mean income per month was RM4,665.20 ± 4,402.25 (USD1,504.90 ± 1,420.10). The socioeconomic status of both study populations are described in Table 2.
Cost of Dyspepsia in the Rural PopulationDyspepsia was prevalent in 292 (14.6%) of adults in the rural
population. Over a 3-month period, 130/292 (44.5%) adults con-sumed medications regularly, for a minimum period of 4 weeks. Of these, 78 adults consumed over-the-counter medications, while the rest used medical prescriptions. The type of pharma-ceutical and herbal compounds consumed included the follow-ing: antacids (n = 112), H2 receptor antagonists (n = 8), west-ern herbal (n = 2), anti-spasmodic (n = 2), traditional Malay preparation (n = 4) and traditional Chinese preparation (n = 2). Details of the traditional medications that were used by our local

Economic Impact of Dyspepsia
47Vol. 18, No. 1 January, 2012 (43-57)
Table 3. Details of Traditional Herbal Remedies Consumed by Malaysian Population
Trade name Contents
Traditional Malay Herbal Preparation “Cap Minyak Angin” Eugenia aromatica oil (English translation - Cymbopogon citratus oil “Oil for relieving wind”) Eucalyptus oil
CamphorZingiber officinale rhizomePiper nigrum herbs
“Pukul Angin” Zingiber officinale rhizome (English translation - Nigella sativa semen “Wind beater”) Trachyspermum ammi semen
Usnea barbata herbsTrigonella foenum graecum semenAllomorphia malacensis rhizomesAllium sativum herbsCassia angustifolia foliumPimpinella anisum fructus
Traditional Chinese Herbal Preparation “Chi-Kit Teck Aun” Pericarpium citri rhizome or “Po Chai” Radix angelicae
Arecae semenAtractylodis rhizomeCitri fructusAsari herbsPogostemonis herbsMenthae oleumRadix glycyrrhizaeChaenomelis fructusAmomi fructusRadix aucklandiaePoria
Figure 1. Type of healthcare facility utilized for dyspepsia symptoms over a 3-month period.
Figure 2. Work absenteeism due to dyspepsia symptoms in both ruraland urban populations.
population are highlighted in Table 3. One hundred and twenty (41.4%) adults with dyspepsia required at least one visit to a med-ical practitioner/hospital as a result of dyspepsia in the 3-month period prior to the study (Fig. 1). The majority of adults with dyspepsia consulted practitioners in rural health clinics (n = 53), with a small number attending private general practitioners. The median number of consultations over the 3-month period was 1 (range 1-3). None of the patients reported having sophisticated investigations such as endoscopy or radiological imaging.
One hundred and thirty-eight out of 292 adults with dyspep-sia were in employment during the period of study. During the 3 months prior to the period of study, 42/138 (30.4%) adults with dyspepsia reported having to miss work due to dyspepsia. Dyspepsia resulted in a median of 1 (range 1-7, total 84) day off work over a 3-month period in the (n = 2,000) rural sample pop-
ulation studied (Fig. 2).Based on the cumulative costs from both societal and health
service perspectives, the cost of dyspepsia in the rural population studied over a 3-month period was USD7,408.05 (Table 4). Extrapolating the data over a 12-month period, the total cost of dyspepsia per 1,000 adults per year in a rural Malaysian pop-ulation was estimated at USD14,816.10. The mean EQ-5D util-ity score in the rural population with dyspepsia was 0.91 ± 0.07. Hence, the QALY associated with dyspepsia was estimated at 0.91 and the cost per QALY for an adult with dyspepsia in the rural population was USD16.30.
Cost of Dyspepsia in Urban PopulationDyspepsia was prevalent in 496 (24.3%) adults in the urban
population. Two hundred and fifty-eight out of 496 (52.0%)

Sanjiv Mahadeva, et al
48 Journal of Neurogastroenterology and Motility
Table 4. Costing for Dyspepsia in Both Rural and Urban Population
Rural population Urban population P-value
Medications (prescribed + OTC) USD2,756.25 USD7,904.55 < 0.001Medical consultation (including investigations) USD3,533.35 USD9,598.35 < 0.001Loss of income from work absenteeism USD1,118.45 USD12,716.25 < 0.001Total (3 mo) USD7,408.05 USD30,219.10 < 0.001Annual cost per 1,000 population USD14, 816.10 USD59,282.20 < 0.001Cost per QALY USD64.42 USD 282.30 < 0.001
OTC, over the counter; QALY, quality-adjusted life year.
adults with dyspepsia required medication regularly, for a mini-mum period of 4 weeks, to control their symptoms over a 3-month period. Of these, 157/258 bought over the counter drugs whilst the rest used medical prescriptions. The type of pharmaceutical and herbal compounds consumed were as fol-lows: antacids (n = 195), H2 receptor antagonists (n = 19), pro-ton pump inhibitors (n = 21), prokinetics (n = 4), anti-spas-modic (n = 6), simethicone (n = 4), traditional Malay prepara-tions (n = 12), traditional Chinese preparations (n = 20) and Western herbal preparations (Spirolina [micro-algae]), “Cat’s claw” [Uncaria tomentosa], “Elm bark” [Ulmus fulva] and garlic pearls) (n = 8).
One hundred and fourty-two (28.7%) adults with dyspepsia required at least one visit to a medical practitioner/hospital as a re-sult of dyspepsia in the 3-month period prior to the study (Fig. 1). The majority of adults with dyspepsia consulted private gen-eral practitioners (n = 98), with a minority attending govern-ment-run primary care clinics. All 29 patients who had visited private institutions were investigated with upper GI endoscopy and abdominal ultrasound scans, in addition to routine blood testing. The median number of consultations over the 3-month period was 1 (range 1-3).
One hundred and one (21.1%) adults with dyspepsia in the urban population reported having to miss work due to dyspepsia over a 3-month period. Dyspepsia resulted in a total of 349 days (median 2 days, interquartile range 1-4) off work over a 3-month period (Fig. 2). The total cumulative direct and indirect cost of dyspepsia over a 3-month period was calculated at USD30,219.10 (Table 4). Extrapolating the data over a 12-month period, the to-tal cost of dyspepsia per 1,000 adults per year among urban dwellers was estimated at USD59,282.20. The mean EQ-5D utility score in the urban population with dyspepsia was 0.85 ± 0.17. Hence the QALY associated with dyspepsia was estimated at 0.85 and the cost per QALY for an adult with dyspepsia in the urban population was USD69.75.
DiscussionThe method of economic evaluation used in this study has
several advantages. Firstly, a prevalence-based, rather than an in-cidence-based approach, accounts for all cases in a given year and the estimate can be compared to measures of total annual health care expenditure. Secondly, a “bottom-up” rather than a “top- down” approach for cost estimation enables an in-depth inves-tigation of the patient sample as this method starts from a selected sub-population with the actual disease and all costs related to the disease are estimated and then extrapolated to the national level.23 The main potential disadvantage of this method is that the sample selected has to be representative and prevalence figures have to be accurate to enable a reasonable estimate for extrapolation of cost-ings to the population at large. Nevertheless, economic evalua-tions of other diseases have demonstrated that a “bottom-up” ap-proach provides a more realistic estimate of the cost of a disease to society compared to a “top-down” approach.24
In this population-based study of representative rural and ur-ban Asian communities, we have demonstrated that the direct and indirect costs of dyspepsia was an estimated USD14,816.10 per 1,000 population in rural Malaysia, whilst the figure was USD59,282.20 per 1,000 population in urban Malaysia, during the financial year of 2007/2008. The difference in economic im-pact of dyspepsia between rural and urban Malaysians appears to be multi-factorial. For one, the prevalence of dyspepsia was sig-nificantly higher in the urban (24.3%) compared to the rural (14.6%) population. Epidemiological differences between both populations are the most likely cause for this difference in prevalence. A higher proportion of ethnic Indians and Chinese in the urban population, known to have more organic disease and Helicobacter pylori infection compared to ethnic Malays,25,26 is thought to be a major contributing factor for this difference.3 This aside, urban adults with dyspepsia had greater drug con-sumption and more work absenteeism (349 days urban vs 84 days

Economic Impact of Dyspepsia
49Vol. 18, No. 1 January, 2012 (43-57)
rural) over a 3-month period. The latter factor was additionally compounded by the higher mean monthly incomes among urban adults (USD1,504.90 ± 1,420.10 urban vs USD316.40 ± 220.44 rural), resulting in a greater economic impact from days lost from working.
Rural adults with dyspepsia had a higher medical con-sultation rate compared to urban dyspeptics. However, the cost of medical consultation was higher in urban patients due to the dif-ferences in healthcare provision between rural and urban areas. Rural health care in this country consists of highly subsidised small community clinics run by community nurses, and larger ru-ral health clinics which are staffed by a single medical officer to-gether with a team of paramedical staff.27 In contrast, primary healthcare in urban Malaysia largely consists of privatized gen-eral practitioner clinics and many have direct access to specialist physician clinics in the community.13 As previously mentioned, subsidised healthcare systems are similar in both rural and urban areas, but the delivery of this healthcare is different.
The impact of dyspepsia among urban, as compared to rural, adults with dyspepsia was not only evident in total costings alone. Dyspepsia resulted in a significant cost per QALY difference among urban dyspeptics when compared to their rural counter-parts. To our knowledge, no study has demonstrated this dis-parity of intangible costs within nor between different popula-tions. The exact explanation for this observation is uncertain at present. The nature of the Rome II questionnaire precluded any assessment of dyspepsia symptom severity or frequency among the study population. Both factors have been shown to influence dyspepsia-related consultation practices28 and it is possible that dyspepsia symptoms were more severe among urban compared to rural adults with dyspepsia. Recent clinical trials in primary care have demonstrated that appropriate initial therapy can increase the cost per QALY gained in dyspepsia.29 Urban adults with dys-pepsia in this study had lower medical consultation rates and tended to self-medicate more, when compared to rural dyspeptics. It is hence possible that the cost per QALY lost for dyspepsia among urban adults may have been a reflection of less effective therapy in this group of patients.
Several community-based studies in the West have made similar evaluations of the economic impact of dyspepsia. In Sweden, investigators estimated that a 30% prevalence of dyspep-sia resulted in a USD113,630.00 per 1,000 population economic burden back in 1991.30 In a British study of 5,056 adults aged 40-49 years from 36 primary care centres, a 38% prevalence of dyspepsia was estimated to cost USD64,000 per 1,000 pop-
ulation for the period of 1992-1994.31 A recent retrospective anal-ysis of payroll data, adjudicated health insurance medical and prescription claims collected over a 4-year study period from more than 300,000 employees in the U.S. estimated that func-tional dyspepsia alone cost USD10,000,133.00 per 1,000 employees.32 Taking inflation into account and the fact that the recent U.S. study was not community-based (hence only captur-ing data on adults in employment), it is apparent that dyspepsia in this Asian population cost far less than in the West, although no direct comparisons have been made to date. Although differences in healthcare systems and socioeconomic status clearly exist be-tween Asian and Western countries,33 additional factors such as cultural attitudes to healthcare seeking behavior may additionally contribute to lower costs of dyspepsia in the East.
Several limitations in this study need to be highlighted. Recall bias, as a consequence of relying on patients’ reports and not medical records, may have under or over estimated the costs of dyspepsia in both rural and urban populations. The natural history of dyspepsia is known to remit and relapse over a period of time, with symptoms even resolving in a minority of patients.7,34 Depending on the natural history of dyspeptic patients in this study sample, a 12-month extrapolation of 3 months’ worth of costing may again have either been over or under estimated. Although, a single time frame utility score of the EQ-5D was used to determine QALYs in this study, “discounting” was em-ployed to minimize inaccuracies in tangible costs.15
In summary, we have demonstrated that direct, indirect and intangible costings for dyspepsia are considerable in a representa-tive population in Asia. The economic consequences of dyspepsia are significantly greater in urban compared to rural adults with the condition. Differences in healthcare utilization, self-medi-cation practices and socioeconomic status are partly responsible for these differences. This study provides data on the impact of dyspepsia in the Asian region which may be useful for healthcare planners and for investigators assessing more cost-effective meas-ures in the management of dyspepsia.
References1. Yang SY, Lee OY, Bak YT, et al. Prevalence of gastroesophageal re-
flux disease symptoms and uninvestigated dyspepsia in Korea: a pop-ulation-based study. Dig Dis Sci 2008;53:188-193.
2. Mahadeva S, Yadav H, Rampal S, Goh KL. Risk factors associated with dyspepsia in a rural Asian population and its impact on quality of life. Am J Gastroenterol 2010;105:904-912.
3. Mahadeva S, Yadav H, Rampal S, Everett SM, Goh KL. Ethnic variation, epidemiological factors and quality of life impairment asso-
Sanjiv Mahadeva, et al
50 Journal of Neurogastroenterology and Motility
ciated with dyspepsia in urban Malaysia. Aliment Pharmacol Ther 2010;31:1141-1151.
4. Ghoshal UC, Singh R, Chang FY, et al. Epidemiology of unin-vestigated and functional dyspepsia in Asia: facts and fiction. J Neurogastroenterol Motil 2011;17:235-244.
5. Thomson AB, Barkun AN, Armstrong D, et al. The prevalence of clinically significant endoscopic findings in primary care patients with uninvestigated dyspepsia: the Canadian Adult Dyspepsia Empiric Treatment - Prompt Endoscopy (CADET-PE) study. Aliment Pharmacol Ther 2003;17:1481-1491.
6. El-Serag HB, Talley NJ. Health-related quality of life in functional dyspepsia. Aliment Pharmacol Ther 2003;18:387-393.
7. Ford AC, Forman D, Bailey AG, Axon AT, Moayyedi P. Initial poor quality of life and new onset of dyspepsia: results from a longi-tudinal 10-year follow-up study. Gut 2007;56:321-327.
8. Tack J, Talley NJ, Camilleri M, et al. Functional gastroduodenal disorders. Gastroenterology 2006;130:1466-1479.
9. Haycox A, Einarson T, Eggleston A. The health economic impact of upper gastrointestinal symptoms in the general population: results from the Domestic/International Gastroenterology Surveillance Study (DIGEST). Scand J Gastroenterol 1999;231:38-47.
10. Severens JL, Laheij RJ, Jansen JB, Van der Lisdonk EH, Verbeek AL. Estimating the cost of lost productivity in dyspepsia. Aliment Pharmacol Ther 1998;12:919-923.
11. Lu CL, Lang HC, Chang FY, et al. Prevalence and health/social im-pacts of functional dyspepsia in Taiwan: a study based on the Rome criteria questionnaire survey assisted by endoscopic exclusion among a physical check-up population. Scand J Gastroenterol 2005;40:402- 411.
12. Department of Statistics Malaysia. Population distribution and basic demographic characteristics. The 2000 Population and Housing Census of Malaysia. Putrajaya: Department of Statistics 2000.
13. Noor Ghani S, Yadav H. Health care in Malaysia. Kuala Lumpur: University of Malaya Press 2008.
14. Hodgson TA, Meiners MR. Cost-of-illness methodology: a guide to current practices and procedures. Milbank Mem Fund Q Health Soc 1982;60:429-462.
15. Drummond MF, O'Brien B, Stoddart GL, Torrance GW. Methods for the economic evaluation of health care programmes. 2nd ed. Oxford: Oxford Medical Publications 1997.
16. Moors DS. The basics of statistics. New York: W.H. Freeman & Co. 2000.
17. Drossman DA, Corazziari E, Talley NJ, Thompson WG, Whitehead WE. ROME II: the functional gastrointestinal disorders. 2nd ed. Lawrence: Allen Press Inc. 2000.
18. Kwan AC, Bao TN, Chakkaphak S, et al. Validation of Rome II cri-teria for functional gastrointestinal disorders by factor analysis of symptoms in Asian patient sample. J Gastroenterol Hepatol 2003;18:
796-802.19. MediMedia. Drug Index of Medical Specialities. 2006.20. Herdman M, Fox-Rushby J, Rabin R, Badia X, Selai C. Producing
other language versions of the EQ-5D. In: Brooks R, Rabin R, de Charro F, eds. The measurement and valuation of health status using EQ-5D: a European perspective. Dordrecht: Kluwer Academic Publishers 2003:183-190.
21. Mahadeva S, Wee HL, Goh KL, Thumboo J. The EQ-5D (Euroqol) is a valid generic instrument for measuring quality of life in patients with dyspepsia. BMC Gastroenterol 2009;9:20.
22. Brooks R. EuroQol: the current state of play. Health Policy 1996;37: 53-72.
23. Tolpin HG, Bentkover JD. Economic costs of illness: decision mak-ing applications and practical considerations. In: Scheffler R, Rossiter L, eds. Advances in health economic and health service resources. Greenwich (CT): JAI Press 1983:165-197.
24. Henriksson F, Fredrikson S, Masterman T, Jönsson B. Costs, qual-ity of life and disease severity in multiple sclerosis: a cross-sectional study in Sweden. Eur J Neurol 2001;8:27-35.
25. Goh KL, Parasakthi N. The racial cohort phenomenon: seroepidemi-ology of Helicobacter pylori infection in a multiracial South-East Asian country. Eur J Gastroenterol Hepatol 2001;13:177-183.
26. Kang JY, Wee A, Math MV, et al. Helicobacter pylori and gastritis in patients with peptic ulcer and non-ulcer dyspepsia: ethnic differences in Singapore. Gut 1990;31:850-853.
27. Ariff KM, Teng CL. Rural health care in Malaysia. Aust J Rural Health 2002;10:99-103.
28. Ford AC, Forman D, Bailey AG, Cook MB, Axon AT, Moayyedi P. Who consults with dyspepsia? Results from a longitudinal 10-yr follow-up study. Am J Gastroenterol 2007;102:957-965.
29. Delaney BC, Qume M, Moayyedi P, et al. Helicobacter pylori test and treat versus proton pump inhibitor in initial management of dyspep-sia in primary care: multicentre randomised controlled trial (MRC- CUBE trial). BMJ 2008;336:651-654.
30. Nyrén O, Lindberg G, Lindström E, Marké LA, Seensalu R. Economic costs of functional dyspepsia. Pharmacoeconomics 1992; 1:312-324.
31. Moayyedi P, Mason J. Clinical and economic consequences of dys-pepsia in the community. Gut 2002;50(suppl 4):iv10-iv12.
32. Brook RA, Kleinman NL, Choung RS, Melkonian AK, Smeeding JE, Talley NJ. Functional dyspepsia impacts absenteeism and direct and indirect costs. Clin Gastroenterol Hepatol 2010;8:498-503.
33. Wagstaff A, Moreno-Serra R. Europe and central Asia's great post-communist social health insurance experiment: Aggregate im-pacts on health sector outcomes. J Health Econ 2009;28:322-340.
34. Agréus L. Natural history of dyspepsia. Gut 2002;50(suppl 4):iv2- iv9.

Economic Impact of Dyspepsia
51Vol. 18, No. 1 January, 2012 (43-57)
Appendix. Gastrointestinal Symptoms Questionnaire
For office use
A. Q1. Demographic data: Name: Address: Contact No. Age: years Sex: 1 Male
2 Female Married: 1 Yes Children: 1 Yes 2 No 2 No Ethnic: 1 Malay
2 Chinese3 Indian4 Other; specify:
Q2. Social Background: Education level: 1 Primary
2 Secondary3 University4 None
Occupation: 1 Government sector2 Private sector3 Self-employed4 Unemployed
Smoking habit (daily): 1 Not at all2 Less than 1 cigarette3 1 cigarette 4 2 to 5 cigarettes5 6 to 10 cigarettes6 11 to 20 cigarettes7 More than 20 cigarettes
Drinking habit: Drink alcohol everyday 1 Yes2 No
Drinking Practice: (please tick in the relevant column)
Type of alcohol None 1 glass/day 2 glass/day 3 or more glass/day
1. Beer
2. Whisky
3. Brandy
4. Other; specify
Q3. Have you had any significant medical illness in the past or at present?1 Yes2 No
If the answer is yes, please specify in the following space:

Sanjiv Mahadeva, et al
52 Journal of Neurogastroenterology and Motility
Q4. Please state the amount of chilli that you normally eat:1 None2 Not very hot3 Moderate (3 times/week)4 Very hot
B. Q5. In the past 12 months, was there a time when you kept getting pain or discomfort in your abdomen? (Discomfort includes
feelings of early satiety, fullness, distension, nausea and retching. Do not count cramps or pain with menstrual periods)1 Yes If yes, please answer the questions 6-92 No If no, please go to Question 10
Q6. In the past 12 months, did this pain or discomfort keep happening over a period of 12 weeks or longer? (Note : 12 weeksof pain or discomfort did not need to be consecutive and there were symptoms at least 1 day per week)
1 Yes2 No
Q7. Please look at Diagram 1. In the past 12 months, was this pain or discomfort in your abdomen usually over: (Tick oneanswer)
1 Area A/B2 Area C/D3 All areas4 Others: please mark in the diagram
Diagram 1. Site of abdominal pain
Q8. Was pain or discomfort the most predominant symptom?1 Pain2 Discomfort3 Both4 Others
If pain was the predominant symptom, did it occur almost daily in the past 6 months?1 Yes2 No
Q9. In the past 12 months, would you say that: (Please tick yes or no for each item) a. The pain or discomfort was made better by having a bowel movement (passing stool).
1 Yes2 No
b. You had more bowel movements than usual when this pain or discomfort began.1 Yes2 No
Economic Impact of Dyspepsia
53Vol. 18, No. 1 January, 2012 (43-57)
c. You had fewer bowel movements than usual when this pain or discomfort began .1 Yes2 No
d. You had harder bowel movement (stools) than usual when this pain or discomfort began.1 Yes2 No
e. You had looser bowel movement (stools) than usual when this pain or discomfort began.1 Yes2 No
Please note: when we say often, we mean presence of symptoms in 12 weeks out of 12 months.
Q10. In the past 12 months, would you say that: (Please tick yes or no for each item) a. You often had more than 3 bowel movements each day.
1 Yes2 No
b. You often had fewer than 3 bowel movements each week.1 Yes2 No
c. Your stools were often very lumpy and hard (Type 1 or 2 in stool chart below).1 Yes2 No
d. Your stools were often very loose or watery (Type 6 or 7 in stool chart below).1 Rarely2 Sometimes (less than 25% of the time)3 Often (more than 25% of the time)4 Usually (more than 75% of the time)
Type Form of stool
1 Separate hard lumps, like nuts
2 Sausage shaped, but lumpy
3 Like a sausage, but with cracks on its surface
4 Like a sausage or snake, smooth and soft
5 Soft blobs with clear cut edges
6 Fluffy pieces with ragged edges; a mushy stool
7 Watery, no solid pieces
Bristol Stool Form Scale
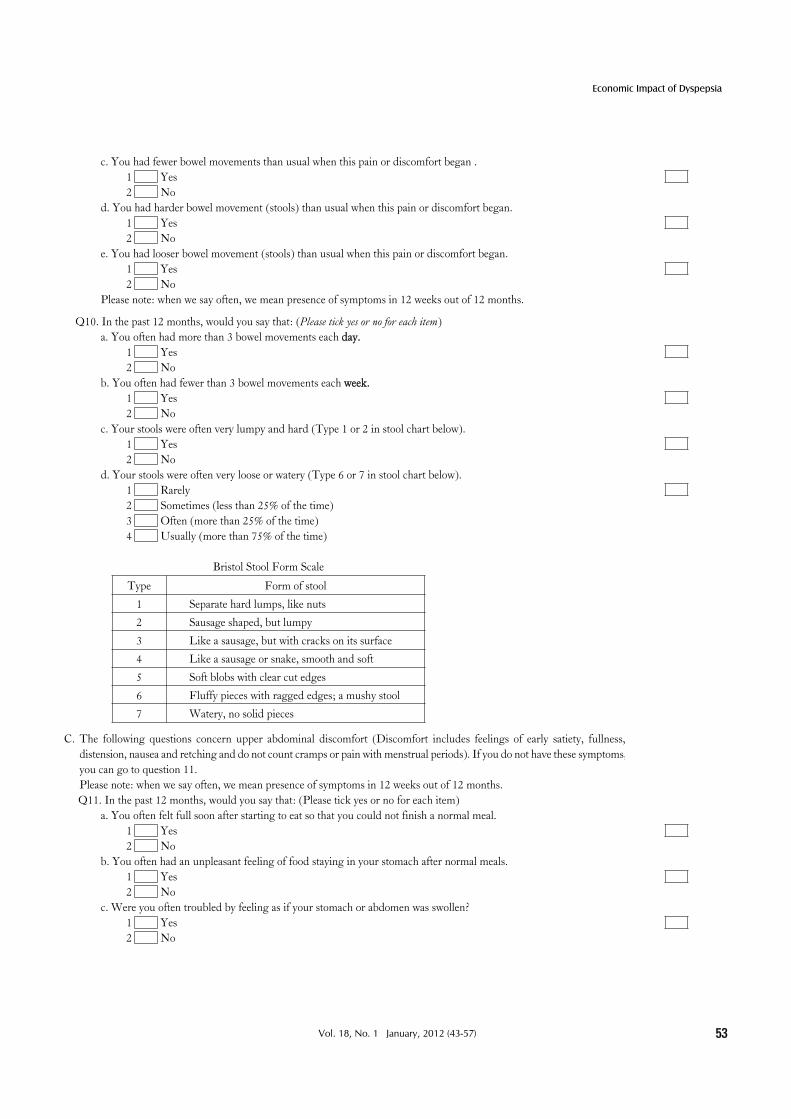
C. The following questions concern upper abdominal discomfort (Discomfort includes feelings of early satiety, fullness, distension, nausea and retching and do not count cramps or pain with menstrual periods). If you do not have these symptoms,you can go to question 11.Please note: when we say often, we mean presence of symptoms in 12 weeks out of 12 months.
Q11. In the past 12 months, would you say that: (Please tick yes or no for each item) a. You often felt full soon after starting to eat so that you could not finish a normal meal.
1 Yes2 No
b. You often had an unpleasant feeling of food staying in your stomach after normal meals.1 Yes2 No
c. Were you often troubled by feeling as if your stomach or abdomen was swollen?1 Yes2 No

Sanjiv Mahadeva, et al
54 Journal of Neurogastroenterology and Motility
If the answer is yes, please show the area of abdominal distension in Diagram 2.1 Area A/B2 Area C/D3 All areas4 Others
Diagram 2. Area of abdominal distension
d. Did you need to loosen your belt or clothes?1 Yes2 No
e. You often had a feeling of nausea (wanting to vomit)?1 Yes2 No
If the answer is yes, how many times you had nauseated in a week for the past 12 months?1 None2 1-3 times3 4-10 times4 More than 10 times
f. Did you often have vomiting?1 Yes2 No
If the answer is yes, how often do you vomit in a week for the past 12 months?1 None2 1-3 times3 4-10 times4 More than 10 times
g. Did you often have retching? (heaving as if to vomit but not vomiting)?1 Yes2 No
If the answer is yes, how often do you retching in a week for the past 12 months?1 None2 1-3 times3 4-10 times4 More than 10 times
h. Did you often release air from the mouth with a loud noise?1 Yes2 No

Economic Impact of Dyspepsia
55Vol. 18, No. 1 January, 2012 (43-57)
If the answer is yes, did this noise bother you?1 Yes2 No
D. The following questions are on symptoms from the throat or chest. If you do not have these symptoms, please go to question 12.Please note: when we say often, we mean presence of symptoms in 12 weeks out of 12 months.
Q12. In the past 12 months, (Please tick yes or no for each item) a. Did you often have pain or discomfort over the center of the chest?
1 Yes2 No
If yes, was the pain or discomfort of a burning character? 1 Yes2 No
b. Did you often have a bitter or sour tasting fluid coming into your throat or mouth?1 Yes2 No
c. Was there often a sensation of food sticking, lodging or passing abnormally through the upper chest?1 Yes2 No
d. Was there often a feeling of a lump or foreign body in the throat?1 Yes2 No
If yes, was the sensation present between meals?1 Yes2 No
E. The following questions are on various bowel symptoms and if you do not feel like answering these questions, you can just leave them empty.Please note: when we say often, we mean more than 25% of the time or occasions.
Q13. In the past 12 months, would you say that: (Please tick yes or no for each item) a. You often needed to strain a lot to have a bowel movement?
1 Yes2 No
b. After finishing a bowel movement, you often felt there was still stool that needed to be passed.1 Yes2 No
c. You often experienced an urgent need to have a bowel movement that made you rush or hurry to a toilet.1 Yes2 No
d. You often saw mucus (like sticky nasal discharge) in your stools.1 Yes2 No
e. You often had difficulty in passing stool as if there was something blocking the way.1 Yes2 No
f. You rely on special manoeuvers for bowel opening.1 Yes2 No
If yes, please state the manoeuver in the space below: g. In the last year, when you had constipation or diarrhoea, did you accidentally leak or pass stool for more than 1 time
in a month?1 Yes2 No

Sanjiv Mahadeva, et al
56 Journal of Neurogastroenterology and Motility
If the answer was yes, how much stool did you accidentally lose ? Would you say the amount was more than 2 teaspoonful?
1 Yes2 No
h. In the last year, did you have more than one episode of aching pain or pressure in the anal canal or rectum?1 Yes2 No
If the answer was yes, how long did the pain last? 1 Less than 20 minutes2 More than 20 minutes
i. Did the pain or discomfort occurred in at least 12 weeks out of 12 months?1 Yes2 No
j. Did you have abdominal discomfort after drinking milk or eating dairy products such as cheese? 1 Yes2 No
F. Medical utilization Q14. In the last 3 months, have you used medication for your gastric or bowel problems?
1 Yes2 No If no, please go to Question 15
If yes, did you buy the medication yourself?1 Yes2 No
What was the name of the medication & how long did you use it for? (i) Drug 1: used for days/weeks/months (ii) Drug 2: used for days/weeks/months (iii) Drug 3: used for days/weeks/months (iv) Traditional med 1: used for days/weeks/months (v) Traditional med 2: used for days/weeks/months
Q15. In the last 3 months, did you have to see a doctor for your gastric or bowel symptoms?1 Yes2 No If no, please go to Q16
If yes, how many visits did you make in the last 3 months to your : (i) Local doctor (GP)/clinic (ii) Specialist clinic (iii) Local hospital/emergency unit
G. Lifestyle/work involvement Q16. In the last 3 months, has your gastric or bowel symptoms made you miss work?
1 Yes2 No If no, please go to Q16
If Yes, how many days off work have you had in the last 3 months? days
Q17. In the last 3 months, has your gastric or bowel symptoms made you miss out on social functions with friends or family?1 Yes2 No
If Yes, how many days off work have you had in the last 3 months? times

Economic Impact of Dyspepsia
57Vol. 18, No. 1 January, 2012 (43-57)
H. Quality of life (EQ-5D) Q18. Please indicate in each part which statement best describes your health state today. Do not pick more than 1 choice in each category. a. Mobility (i) I have no problems in walking about (ii) I have some problems in walking about (iii) I am confined to bed b. Self-Care (i) I have no problems with self care (ii) I have some problems washing or dressing myself (iii) I am unable to wash or dress myself c. Usual activities (eg work, study, housework, family or leisure activities) (i) I have no problems performing my usual activities (ii) I have some problem performing my usual activities (iii) I am unable to perform my usual activities d. Pain/discomfort (i) I have no pain or discomfort (ii) I have moderate pain or discomfort (iii) I have extreme pain or discomfort e. Anxiety/Depression (i) I have not anxious or depressed (ii) I am moderately anxious or depressed (iii) I am extremely anxious or depressed
f. Imagine the scale here to be a thermometer and 100 is the best state and 0 is the worst state of health you feel in. Pleasemark the level of health you feel today.