6. Conceptual Design
124
Transmission Project Preparatory Survey Phase III Final Report (Advanced Release) 6-1 6. Conceptual Design 6.1. Overhead Transmission Line Design Concept The design concept, including the following criteria focused on cost reduction, will be implemented based on the information collected and organized. The details of each criterion will be discussed with the counterpart organization based on the results of the field survey. For the 500kV Pharyargyii ~ Sar Ta Lin transmission line, in order to systematically connect the Pharyargyii ~ Hlaingthaya transmission line to the Pharyargyii Substation in the future, the same equipment specifications were implemented considering system reliability and O&M for the 500kV transmission system. The 230kV transmission line will also be matched with the existing transmission line in Yangon city, so that the equipment specifications will not conflict, for reasons of system reliability and O&M. In addition, if the transmission line is heavily loaded with current flow, the application of low-loss conductor technology will be considered. Normal ACSR Conductor Low-loss Conductor Figure 6.1-1 Normal ACSR Conductor and Low-loss Conductor 6.2. 500kV Transmission Line Design Overview of Transmission Line Route The route connecting Pharyargyii Substation and Sar Ta Lin Substation has an approximate route distance of 70km. Most of the route is along the river side. Figure 6.2-1 Route of 500kV Pharyargyii S/S – Sar Ta Lin S/S Design Conditions The basic design conditions are as mentioned below. Pharyargyii-Sar Ta Lin 500kV T/L Route Pharyargyii S/S Sar Ta Lin S/S
-
Upload
khangminh22 -
Category
Documents
-
view
1 -
download
0
Transcript of 6. Conceptual Design
Transmission Project Preparatory Survey Phase III
Final Report (Advanced Release)
6-1
6. Conceptual Design
6.1. Overhead Transmission Line Design Concept The design concept, including the following criteria focused on cost reduction, will be implemented
based on the information collected and organized. The details of each criterion will be discussed with
the counterpart organization based on the results of the field survey. For the 500kV Pharyargyii ~ Sar
Ta Lin transmission line, in order to systematically connect the Pharyargyii ~ Hlaingthaya transmission
line to the Pharyargyii Substation in the future, the same equipment specifications were implemented
considering system reliability and O&M for the 500kV transmission system. The 230kV transmission
line will also be matched with the existing transmission line in Yangon city, so that the equipment
specifications will not conflict, for reasons of system reliability and O&M. In addition, if the
transmission line is heavily loaded with current flow, the application of low-loss conductor technology
will be considered.
Normal ACSR Conductor Low-loss Conductor
Figure 6.1-1 Normal ACSR Conductor and Low-loss Conductor
6.2. 500kV Transmission Line Design
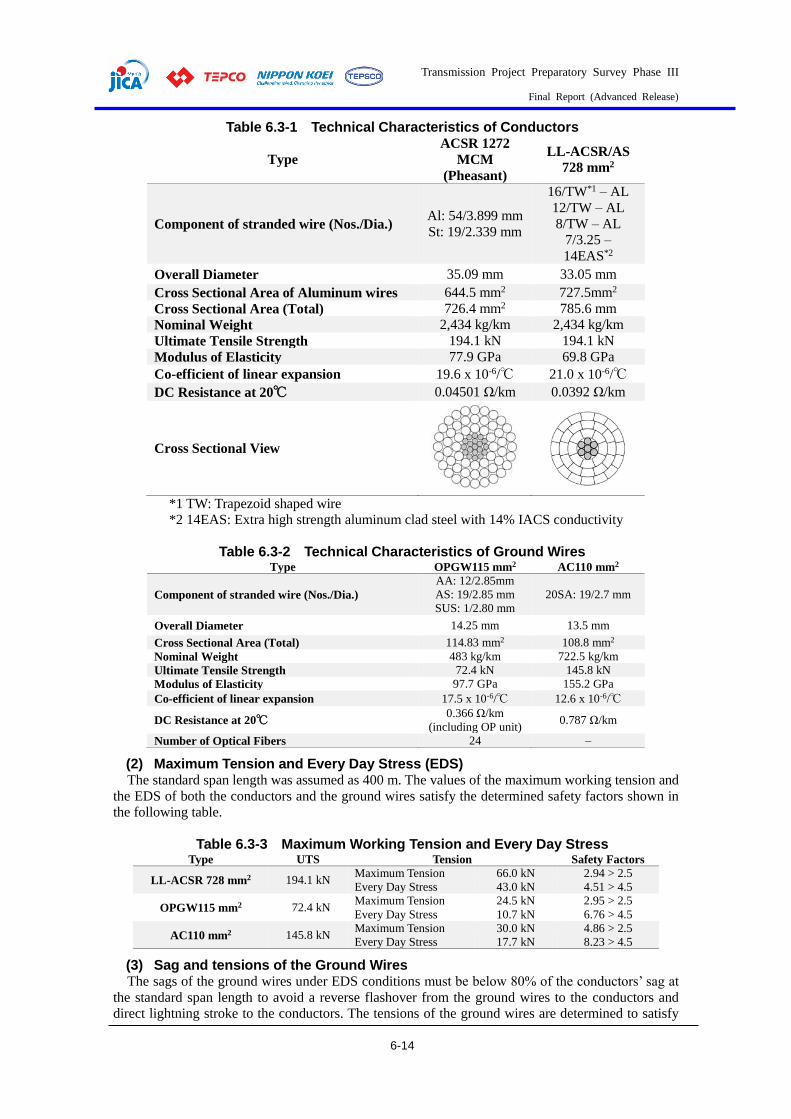
Overview of Transmission Line Route The route connecting Pharyargyii Substation and Sar Ta Lin Substation has an approximate route
distance of 70km. Most of the route is along the river side.
Figure 6.2-1 Route of 500kV Pharyargyii S/S – Sar Ta Lin S/S
Design Conditions The basic design conditions are as mentioned below.
Pharyargyii-Sar Ta Lin 500kV T/L
Route
Pharyargyii S/S
Sar Ta Lin
S/S

Transmission Project Preparatory Survey Phase III
Final Report (Advanced Release)
6-2
(1) Ambient Temperature Maximum air temperature 46 ºC
Minimum air temperature 10 ºC
Annual average temperature 27 ºC
(2) Conductor Temperature Maximum temperature 75 ºC
Minimum temperature 10 ºC
(3) Wind Velocity Maximum wind velocity 35 m/s
(4) Wind Pressure Tower 2,150 Pa
Conductor 900 Pa
Ground wire 970 Pa
Insulator 900 Pa
(5) Stringent (the most severe design) Conditions and EDS (Every Day Stress) Conditions
Conductors: Condition Temperature Wind Tension
Stringent 15 ºC 900 Pa 40.0% UTS
EDS 27 ºC Still air 22.2% UTS
Ground Wires: Condition Temperature Wind Tension
Stringent 15 ºC 970 Pa 40.0% UTS
EDS 27 ºC Still air 22.2% UTS
*UTS: Ultimate Tension Strength
(6) Pollution Level Medium (IEC standard); 34.7 mm/kV
(7) Other conditions assumed Maximum humidity 100%
(8) Voltage Level for Insulation Design Lightning Impulse Withstand Voltage 1, 550 kV
Switching Impulse Withstand Voltage 1,175 kV
Maximum System Voltage 550 kV
(9) Air Clearance Normal condition (D1) 4,700 mm
Normal wind condition (D2) 4,200 mm (swing angle: 15º - 20º)
Maximum wind condition (D3) 1,900 mm (max. swing angle: 60º)
(10) Safety Factors Required minimum safety factors for the transmission line facilities were determined as
follows.
(a) Towers
1.6 to yield strength of the material under normal conditions (= stringent conditions)
1.3 to yield strength of the material under broken-wire conditions (= normal conditions +
one ground wire or one phase conductor breakage)
(b) Conductor/Ground wire
2.5 to UTS (Ultimate Tensile Strength) for stringent conditions
4.5 to UTS for Everyday Stress (EDS) condition at average temperature in still air at
supporting point
(c) Insulator string
2.5 to RUS (Rated Ultimate Strength) for maximum working tension at supporting point
(d) Foundation
2.0 under normal conditions

Transmission Project Preparatory Survey Phase III
Final Report (Advanced Release)
6-3
1.5 under broken wire conditions
Conductor and Ground Wire Design
(1) Conductor and ground wire The results from power flow system analysis showed that 4 bundles of ACSR 468 mm2 (Drake) for
conductors are appropriate for the project. Therefore, ACSR 468 mm2 for conductor and OPGW 115
mm2 and AS 110 mm2 for ground wire are applied. The technical characteristics of the conductor and
ground wires are shown in the following tables.
Table 6.2-1 Technical Characteristics of Conductor Type ACSR 468 ASTM (Drake)
Component of stranded wire (Nos./Dia.) Al: 26/4.442 mm
St: 7/3.454 mm
Overall Diameter 28.13 mm
Cross Sectional Area of Aluminum wires 402.8 mm2
Cross Sectional Area (Total) 468.6 mm2
Nominal Weight 1,628 kg/km
Ultimate Tensile Strength 140.2 kN
Modulus of Elasticity 76.0 GPa
Co-efficient of linear expansion 19.1 x 10⁻⁶/℃
DC Resistance at 20℃ 0.07167 Ω/km
Table 6.2-2 Technical Characteristics of Ground Wires Type OPGW115 mm2 AC110 mm2
Component of stranded wire (Nos./Dia.)
AA: 12/2.85 mm
AS: 19/2.85 mm
SUS: 1/2.80 mm
20SA: 19/2.7 mm
Overall Diameter 14.25 mm 13.5 mm
Cross Sectional Area (Total) 114.83 mm2 108.8 mm2
Nominal Weight 483 kg/km 722.5 kg/km
Ultimate Tensile Strength 72.4 kN 145.8 kN
Modulus of Elasticity 97.7 GPa 155.2 GPa
Co-efficient of linear expansion 17.5 x 10⁻⁶/℃ 12.6 x 10⁻⁶/℃
DC Resistance at 20℃ 0.366 Ω/km
(including OP unit) 0.787 Ω/km
Number of Optical Fibers 24 –
(2) Maximum Tension and Every Day Stress (EDS) The standard span length was assumed as 450 m. The values of the maximum working tension and
the EDS of both the conductor and the ground wires satisfy the determined safety factors shown in the
following table.
Table 6.2-3 Maximum Working Tension and Every Day Stress Type UTS Tension Safety Factors
ACSR 468 mm2
(Drake) 140.2 kN
Maximum Tension 53.2 kN 2.63 > 2.5
Every Day Stress 31.0 kN 4.52 > 4.5
OPGW115 mm2 72.4 kN Maximum Tension 26.5 kN 2.73 > 2.5
Every Day Stress 11.6 kN 6.24 > 4.5
AC110 mm2 145.8 kN Maximum Tension 32.0 kN 4.55 > 2.5
Every Day Stress 18.8 kN 7.75 > 4.5
(3) Sag and tensions of the ground wires The sags of the ground wires under EDS conditions must be below 80% of the conductors’ sag at
the standard span length to avoid a reverse flashover from the ground wires to the conductors and
direct lightning stroke to the conductors. The tensions of the ground wires are determined to satisfy
the safe separation of conductors and ground wires in the mid-span.
(4) Standard Span Length The standard span length between towers is 450 m

Transmission Project Preparatory Survey Phase III
Final Report (Advanced Release)
6-4
(5) Right of Way (ROW) The right of way of the 500kV transmission line is assumed to be 60.96m
Insulator Design
(1) Insulator type and size The insulator unit applied to the transmission line is a standard disc type porcelain insulator with
ball and socket, complying with IEC 60305. 210kN type insulators are applied for the suspension
towers and 300kN type insulators are applied for the tension towers. The technical characteristics of
the insulators are shown in the following table
Table 6.2-4 Technical Characteristics of the Insulator Rated Ultimate Strength 210 kN 300 kN
IEC Designation U210B U300B
Shell Diameter 280 mm 320 mm
Unit Spacing 170 mm 195 mm
Nominal Creepage Distance 405 mm 505 mm
Ball & Socket Coupling 20 mm 24 mm
(2) Number of insulator units per string The number of insulator units per string is 30 units for the suspension towers and 26 units for the
tension towers.
(3) Determination of Number of Insulator Strings per set The determinations of the number of insulators per string are as shown below.
Contamination design
Contamination level: Medium
Creepage distance per voltage: 34.7 mm/kV
Highest Voltage, Um:
500 kV × 1.2/1.1 ≒ 550 kV
Total Insulator Creepage Distance:
550 kV ÷ √3 × 34.7 mm/kV ≒ 11,100 mm
Number of insulator units:
U210B: 11,100 mm ÷ 405 mm = 27.41 ≒ 28 units/string
U300B: 11,100 mm ÷ 505 mm = 21.98 ≒ 22 units/string
Lightning Impulse Withstand Voltage
Taking highest voltage, Um = 550 kV
Horn gab distance is 4,200 mm as specified by DPTSC in MYP8 project. However, referring to
IEC60071-1-2006, standard rated lightning impulse withstand voltage at 550 kV is 1,550 kV
and minimum horn gap distance is 3,100 mm. The ratio of horn gap distance to length of
insulator string length (Z/Zo) is decided as 85% from standard practices across the world.
Number of insulator units:
U210B: 4,200 mm ÷ 0.85 ÷ 170 mm = 29.06 ≒ 30 units/string
U300B: 4,200 mm ÷ 0.85 ÷ 195 mm = 25.33 ≒ 26 units/string
Switching Impulse Withstand Voltage (SIWV)
Given, Surge multiplier: 2.0; Insulation deterioration coefficient: 1.1; Withstand voltage
coefficient: 1/0.85
50% Switching Surge Flashover Voltage, V50:
V50 = Um × √2 ÷√3 × 2.0 × 1.1 × 1/0.85 = 1162.3 kV
Horn gap distance without flashover in V50:
V50 = k × 1080 × ln(0.46d+1); where k: gap factor = 1.32
d = 2.74 m
Number of insulator units:
U210B: 2,740mm ÷ 0.85 ÷ 170 mm = 18.96 ≒ 19 units/string
U300B: 2,740mm ÷ 0.85 ÷ 195 mm = 16.53 ≒ 17 units/string

Transmission Project Preparatory Survey Phase III
Final Report (Advanced Release)
6-5
Table 6.2-5 Determination of Number of Insulators per Strings
Type of
Insulator
Contamination
Level
Number of Insulators by
Contamination
Design
Lightningt
Impulse
Withstand
Voltage
Switching
Impulse
Withstand
Voltage
Result
U210B Medium 28 30 19 30
U300B Medium 22 26 17 26
(4) Mechanical Strength of Tension Insulator For the suspension towers, the number of insulator strings per set is either single or double 210kN
insulators, which was determined in accordance with the transmission line crossing places. For the
tension towers, the number of insulator strings per set is double the 300kN insulator. The tension
insulators must satisfy the safety factor at RUS for maximum working tension at the standard span of
450 m, as follows.
Table 6.2-6 Tension Insulator Assembly
Conductor Maximum Tension
(Span length: 450m) Insulator Tension Safety Factor
ACSR 468 mm2
"Drake'' 212.8kN (53.2kN × 4)
Double strings 600kN
(300kN × 2) 2.81 > 2.5
(5) Tension Insulator Assembly Insulator assembly fittings also have to maintain the same strength as the insulators.
Table 6.2-7 Tension Insulator Assembly
Conductor Maximum Tension
(Span length: 450m) Insulator Tension Safety Factor
ACSR 468 mm2
"Drake'' 212.8kN (53.2kN × 4)
Double strings 600kN
(300kN × 2) 2.81 > 2.5
(6) Ground Clearance The most severe state for the ground clearance of the conductors will occur when the conductor’s
temperature rises to 75 ºC under still air conditions. The minimum height of the conductor above
ground at the 500 kV level is determined as per the below.
Table 6.2-8 Minimum Height of the Conductor above Ground Classification Applied areas for the project Clearance
Areas where people rarely enter, such as
mountains, forests, waste fields, etc.
Bush lands, forests, grass land and narrow
rivers 11.0 m
Area where people enter or will enter
frequently
Paddy fields with mosaic of croplands,
general roads and wide rivers 14.0 m
River crossing 20.0 m
Determination of Tower Configuration
(1) Electrical Clearance
Table 6.2-9 Swing Angle and Insulation Clearance
Normal Middle Abnormal
Wind velocity 0 to 10 m/s 10 to 20 m/s 20 to 35 m/s
Swing angle of suspension strings (Type DA) 0 to 15 deg 15 to 20 deg 20 to 60 deg
Swing angle of tension strings without
jumper loop (Type DB) 0 to 15 deg 15 to 20 deg 20 to 60 deg
Swing angle of tension strings with jumper
loop (Type DC, DD, DE) 0 to 15 deg N/A N/A
Clearance 4,700 mm 4,200 mm 1,900 mm
(2) Length of String Set and Drop of Jumper Loop Length of the suspension string set and drop of jumper loop are estimated as follows.

Transmission Project Preparatory Survey Phase III
Final Report (Advanced Release)
6-6
Table 6.2-10 Length of Suspension String Set and Drop of Jumper Loop Type Determination Length
Length of suspension string set
for U210B
170 mm × 30 units+1,535 mm (fitting length) + 65 mm
(margin) 6,700 mm
Length of tension string set for
U300B
195 mm × 26 units+2,050 mm (fitting length) + 80 mm
(margin) 7,200 mm
Drop of jumper loop for tension
string set
4,700 mm (normal insulation distance) × 1.2+200 mm
(half of length between conductors) + 60 mm (margin) 5,900 mm
Length of support insulator
string set for DC, DD
170 mm × 30 units + 1,250 mm (fitting length) + 50 mm
(margin) 6,400 mm
(3) Clearance Diagram Clearance diagrams of suspension insulator string and drop of jumper loop are shown as follows.
Suspension Tension
Type DA Type DB Type DC, DD, DE
Figure 6.2-2 Clearance Diagram
(4) Clearance to Ground and Obstacles Clearances above ground and to each obstacle are determined as follows, including some errors
which might happen in drawings, survey, and construction.
Table 6.2-11 Clearances to Ground and Obstacles Object Conditions Clearance
Ground (Mountains or forest area)
At maximum conductor
temperature of 75 ºC
11.0 m
Ground (Paddy field) 14.0 m
River crossing (Above highest water level) 20.0 m
Road 15.0 m
Railway 16.0 m
Trees (Rubber plants, etc.) 7.0 m
Distribution line (including pole) 8.0 m
Transmission line (including tower) –
66 kV transmission line 9.0 m
132 kV transmission line 9.0 m
230 kV transmission line 9.0 m
Other 7.0 m
Towers
(1) Type of Towers (a) Type DA
Suspension type tower on a straight section of the line or on a section of the line with a
horizontal deviation angle up to 3 degrees with suspension insulator sets.
(b) Type DB
Tension type tower on a section of the line with a horizontal deviation angle up to 20
degrees with tension insulator sets.
(c) Type DC
Tension type tower on a section of the line with a horizontal deviation angle from 20
degrees to 40 degrees with tension and jumper suspension insulator sets.

Transmission Project Preparatory Survey Phase III
Final Report (Advanced Release)
6-7
(d) Type DD
Tension type tower on a section of the line with a horizontal deviation angle from 40
degrees up to 60 degrees with tension and jumper suspension insulator sets.
(e) Type DE
Tension type tower used at the terminal of the line with tension insulator sets having
jumper insulator sets where required with a horizontal angle up to 40 degrees.
Table 6.2-12 Tower Types and the Applied Conditions Type Position of Use Angle of Deviation [deg.] String Type
DA Straight line 0 – 3 Suspension
DB Angle 4 – 20 Tension
DC Angle 21 – 40 Tension
DD Angle 41 – 60 Tension
DE Terminal 0 – 40 Tension
(2) Design Span The design of all towers will provide for the following wind spans and weight spans.
Table 6.2-13 Design Span Tower Type Wind Span [m] Weight Span [m]
DA 450 700
DB 450 700
DC 450 700
DD 450 700
DE 450 350
(3) Maximum Sag Calculation and Standard Height of Towers Conductor temperature: 75 deg.
Wind pressure: still air
Table 6.2-14 Maximum Sag and Standard Height of Towers Suspension type Tension type
Maximum conductor sag 15.3 m 15.3 m
Insulator length 6.7 m -
Ground Clearance 14.0 m 14.0 m
Standard height of tower above
ground
(below bottom cross arm)
36.0 m 29.5 m

Transmission Project Preparatory Survey Phase III
Final Report (Advanced Release)
6-8
(4) Shape of Tower
Figure 6.2-3 Type DA Tower Figure 6.2-4 Type DB Tower
Figure 6.2-5 Type DC Tower Figure 6.2-6 Type DD Tower

Transmission Project Preparatory Survey Phase III
Final Report (Advanced Release)
6-9
Figure 6.2-7 Type DE Tower
(5) Unit Weight of Towers The unit weights of types of towers for different extension lengths are shown below.
Table 6.2-15 Unit Weight of the Towers (Estimated)
Tower extension [m] Unit weight of towers [ton]
DA DB DC DD DE
0 42.9 48.3 60.0 64.1 70.0
+3 46.7 50.9 65.7 67.1 –
Tower Foundations
(1) Tower load condition The foundation loads that are transmitted from each tower at ±0.0 m extension
Table 6.2-16 Tower Load Conditions ( 2 cct 500 kV)
Quantities of the Transmission Line Materials
(1) Number of Towers and Total Weight of Towers The assumed tower types, number of towers and the tower weight for the transmission lines are
summarized in the following table.
Table 6.2-17 Numbers of Towers and Tower Weight
Tower type Extension
[m]
Unit weight
[ton]
No. of towers
[unit]
Total weight
[ton]
Tower type Compressive load
[kN]
Tensile load
[kN]
DA 1393.6 1090.2
DB 1909.5 1573.7
DC 2671.2 2266.6
DD 3228.4 2803.6
DE 2554.0 2031.4

Transmission Project Preparatory Survey Phase III
Final Report (Advanced Release)
6-10
DA: Suspension
(Horizontal angle: 0 – 3 deg.)
0.0 42.9 117 5019.3
+3.0 46.7 5 233.5
Subtotal 122 5252.8
DB: Tension
(Horizontal angle: 3 – 20 deg.)
0.0 48.3 4 193.2
+3.0 50.9 2 101.8
Subtotal 6 295.0
DC: Tension
(Horizontal angle: 20 – 40 deg.)
0.0 60.0 9 540.0
+3.0 65.7 4 262.8
Subtotal 13 802.8
DD: Tension
(Horizontal angle: 40 – 60 deg.)
0.0 64.1 6 384.6
+3.0 67.1 3 201.3
Subtotal 9 585.9
DE: Dead-end
(Horizontal angle: 0 – 40 deg.) 0.0 70.0 2 140.0
Subtotal 2 140.0
Total 152 7076.5
(2) Quantities of Conductors and Ground Wire The quantities of conductors and ground wires for the transmission line are computed by
multiplying the numbers of conductors or ground wires by the route length, and multiplying that
number by 1.05 for the sag allowance and margin for stringing work.
Table 6.2-18 Quantities of Conductors and Ground Wire
Conductor/Ground wire type No. of
bundles
No. of
phases
No. of
circuits
Route length
[km]
Line length
[km]
LL-ACSR 728 mm2 4 3 2 70.0 1764.0
OPGW115 mm2 1 – 1 70.0 73.5
AC110 mm2 1 – 1 70.0 73.5
(3) Quantities of Insulators and Insulator Assemblies The quantities of insulators and insulator assemblies for the transmission line are computed from
the number of suspension and tension towers, considering the number of strings.
Table 6.2-19 Quantities of Insulators and Insulator Assemblies
Insulator
type Tower type
Assembly
type
No. of
insulators
per set [pcs]
No. of
strings per
tower [set]
No. of
towers
[unit]
Subtotal
of strings
[set]
Subtotal of
insulators
[pcs]
U210B Suspension
Double 54 6 5 30 1620
Single 26 6 117 702 18252
Jumper support Single 26 6 22 132 3432
Total number for U210B 864 23304
U300B Tension Double 60 12 28 336 20160
Dead-end Double 60 12 2 24 1440
Total number for U300B 360 21600
(4) Quantities of Foundation Concretes Quantities of reinforced concrete of the foundations for 5 types of 500kV towers based on dfferent
geological type are summarized in the following table.
Table 6.2-20 Quantities of Foundation Concretes Type of
foundation Tower type Geological type
Unit concrete
[m3]
No. of tower
[unit]
Total concrete
[m3]
Pile
DA Standard 44.0 73 3212.0
Flood area 42.8 31 1326.8
DB Standard 45.6 2 91.2
Flood area 43.6 1 43.6
DC Standard 59.2 7 414.4
Flood area 63.6 4 254.4
DD Standard 96.8 4 387.2

Transmission Project Preparatory Survey Phase III
Final Report (Advanced Release)
6-11
Flood area 108.4 2 216.8
DE Standard 53.6 1 53.6
Subtotal 125 6000.0
Pad
DA – 86.6 18 1558.8
DB – 131.1 3 393.3
DC – 179.0 2 358.0
DD – 219.1 3 657.3
DE – 163.8 1 163.8
Subtotal 27 3131.2
TOTAL 152 9131.2
6.3. 230kV Transmission Line Design
Overview of Transmission Line Route The 230kV transmission line routes are described below and shown in Figure 6.3-1 and Figure 6.3-2.
The route connecting Sar Ta Lin Substation to Hlawga Substation has an approximate route
length of 17km. The overhead transmission line branches into underground line 5km before
Hlawga Substation due to there being a populated residential area around Hlawga Substation.
The towers used in this route are 4 circuit transmission towers.
The route connecting Sar Ta Lin Substation to East Dagon Substation has an approximate
route length of 19km. The towers used in this route are 2 circuit transmission towers.
Figure 6.3-1 230kV Sar Ta Lin S/S – Hlawga S/S and Sar Ta Lin S/S – East Dagon Transmission Line Route Map
The route connecting Hlawga Substation to East Dagon Substation has an approximate route
length of 22km. The overhead transmission line branches into underground line 5km before
Hlawga Substation due to there being a populated residential area around Hlawga Substation.
The new 2 circuit transmission towers will be constructed in the same position as the existing
one circuit transmission towers.
Sar Ta Lin-Hlawga 230kV T/L Route
Sar Ta Lin-East Dagon 230kV T/L Route
Sar Ta Lin
S/S
Hlawga S/S
East Dagon S/S

Transmission Project Preparatory Survey Phase III
Final Report (Advanced Release)
6-12
Figure 6.3-2 230kV Hlawga S/S – East Dagon S/S Transmission Line Route Map
Design Conditions The basic design conditions are as mentioned below.
(1) Ambient Temperature
Maximum air temperature 46 ºC
Minimum air temperature 10 ºC
Annual average temperature 27 ºC
(2) Conductor Temperature
Maximum temperature 75 ºC
Minimum temperature 10 ºC
(3) Wind Velocity Maximum wind velocity 35 m/s
(4) Wind Pressure Tower 2,150 Pa
Conductor 900 Pa
Ground wire 970 Pa
Insulator 900 Pa
(5) Stringent (the most severe design) Conditions and EDS (Every Day Stress) Conditions
Conductors: Condition Temperature Wind Tension
Stringent 15 ºC 900 Pa 40.0% UTS
EDS 27 ºC Still air 22.2% UTS
Ground Wires: Condition Temperature Wind Tension
Stringent 15 ºC 970 Pa 40.0% UTS
EDS 27 ºC Still air 22.2% UTS
*UTS: Ultimate Tension Strength
(6) Pollution Level Heavy (IEC standard); 43.3 mm/kV
(7) Other Conditions Assumed Maximum humidity 100%
Hlawga-Thaketa 230kV T/L Route
Hlawga S/S
Thaketa S/S

Transmission Project Preparatory Survey Phase III
Final Report (Advanced Release)
6-13
(8) Voltage Level for Insulation Design Lightning Impulse Withstand Voltage 1, 050 kV
Switching Impulse Withstand Voltage 460 kV
Maximum System Voltage 245 kV
(9) Air Clearance Normal condition (D1) 2,480 mm
Normal wind condition (D2) 1,760 mm (swing angle: 10º - 30º)
Maximum wind condition (D3) 550 mm (max. swing angle: 60º)
(10) Safety Factors Required minimum safety factors for the facilities of the transmission line were determined as
follows.
(a) Tower
1.6 to yield strength of the material under normal conditions (= stringent conditions)
1.3 to yield strength of the material under broken-wire conditions (= normal conditions +
one ground wire or one phase conductor breakage)
(b) Conductor/Ground wire
2.5 to UTS (Ultimate Tensile Strength) for stringent conditions
4.5 to UTS for Everyday Stress (EDS) conditions at average temperature in still air at
supporting point
(c) Insulator string
2.5 to RUS (Rated Ultimate Strength) for maximum working tension at supporting point
(d) Foundation
2.0 under normal conditions
1.5 under broken wire conditions
Conductor and Ground Wire Design
(1) Conductor and ground wire The results of the power flow system analysis showed that 2 bundles of ACSR 1272MCM 644 mm2
(Pheasant) conductor are appropriate for the project. However, since a large amount of current is
expected to flow in the three 230kV T/L in the future, the LL-ACSR 782mm2 conductors, which have
13% lower loss in conductivity and the same weight and outer shape as Pheasant, is applied. Therefore,
LL-ACSR 782mm2 for conductors, and OPGW 115 mm2 and AS 110 mm2 for ground wire, are applied.
The technical characteristics of the conductors and ground wires are shown in the following tables.
Transmission Project Preparatory Survey Phase III
Final Report (Advanced Release)
6-14
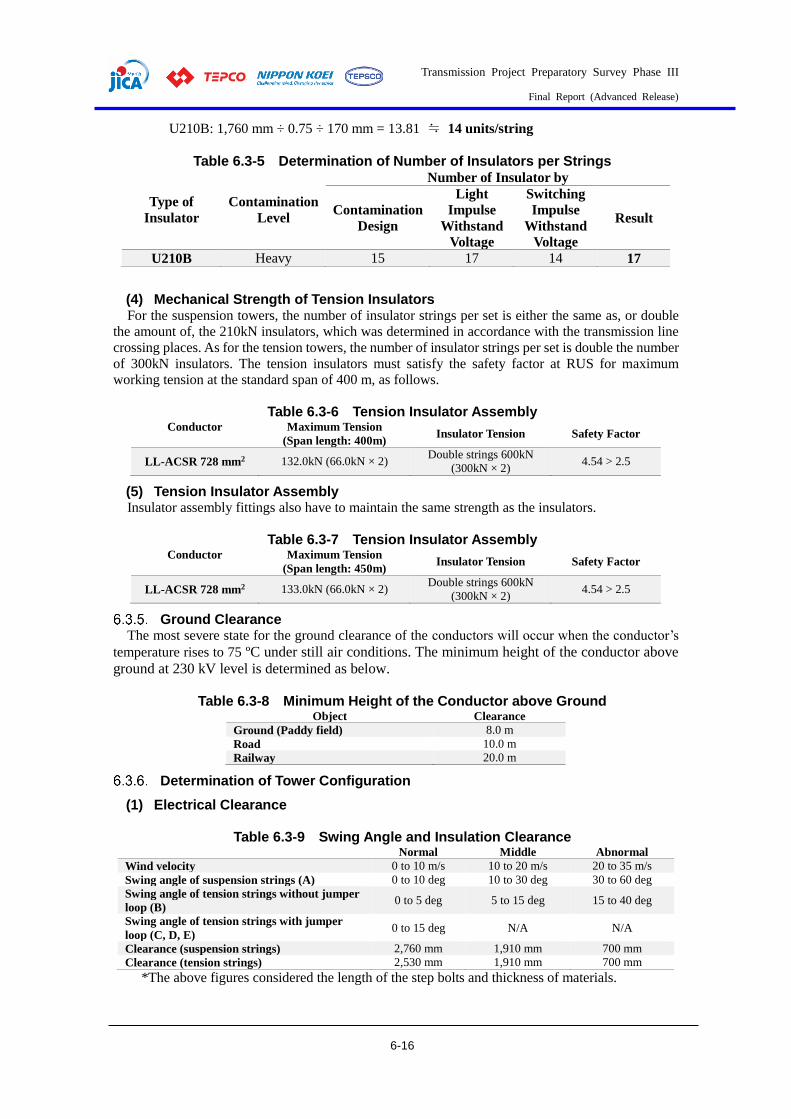
Table 6.3-1 Technical Characteristics of Conductors
Type
ACSR 1272
MCM
(Pheasant)
LL-ACSR/AS
728 mm2
Component of stranded wire (Nos./Dia.) Al: 54/3.899 mm
St: 19/2.339 mm
16/TW*1 – AL
12/TW – AL
8/TW – AL
7/3.25 –
14EAS*2
Overall Diameter 35.09 mm 33.05 mm
Cross Sectional Area of Aluminum wires 644.5 mm2 727.5mm2
Cross Sectional Area (Total) 726.4 mm2 785.6 mm
Nominal Weight 2,434 kg/km 2,434 kg/km
Ultimate Tensile Strength 194.1 kN 194.1 kN
Modulus of Elasticity 77.9 GPa 69.8 GPa
Co-efficient of linear expansion 19.6 x 10⁻⁶/℃ 21.0 x 10⁻⁶/℃
DC Resistance at 20℃ 0.04501 Ω/km 0.0392 Ω/km
Cross Sectional View
*1 TW: Trapezoid shaped wire
*2 14EAS: Extra high strength aluminum clad steel with 14% IACS conductivity
Table 6.3-2 Technical Characteristics of Ground Wires Type OPGW115 mm2 AC110 mm2
Component of stranded wire (Nos./Dia.)
AA: 12/2.85mm
AS: 19/2.85 mm
SUS: 1/2.80 mm
20SA: 19/2.7 mm
Overall Diameter 14.25 mm 13.5 mm
Cross Sectional Area (Total) 114.83 mm2 108.8 mm2
Nominal Weight 483 kg/km 722.5 kg/km
Ultimate Tensile Strength 72.4 kN 145.8 kN
Modulus of Elasticity 97.7 GPa 155.2 GPa
Co-efficient of linear expansion 17.5 x 10⁻⁶/℃ 12.6 x 10⁻⁶/℃
DC Resistance at 20℃ 0.366 Ω/km
(including OP unit) 0.787 Ω/km
Number of Optical Fibers 24 –
(2) Maximum Tension and Every Day Stress (EDS) The standard span length was assumed as 400 m. The values of the maximum working tension and
the EDS of both the conductors and the ground wires satisfy the determined safety factors shown in
the following table.
Table 6.3-3 Maximum Working Tension and Every Day Stress Type UTS Tension Safety Factors
LL-ACSR 728 mm2 194.1 kN Maximum Tension 66.0 kN 2.94 > 2.5
Every Day Stress 43.0 kN 4.51 > 4.5
OPGW115 mm2 72.4 kN Maximum Tension 24.5 kN 2.95 > 2.5
Every Day Stress 10.7 kN 6.76 > 4.5
AC110 mm2 145.8 kN Maximum Tension 30.0 kN 4.86 > 2.5
Every Day Stress 17.7 kN 8.23 > 4.5
(3) Sag and tensions of the Ground Wires The sags of the ground wires under EDS conditions must be below 80% of the conductors’ sag at
the standard span length to avoid a reverse flashover from the ground wires to the conductors and
direct lightning stroke to the conductors. The tensions of the ground wires are determined to satisfy

Transmission Project Preparatory Survey Phase III
Final Report (Advanced Release)
6-15
the safe separation of conductors and ground wires in the mid-span.
(4) Standard Span Length The standard span length between towers is 400 m.
(5) Right of Way (ROW) The right of way for the 230kV transmission line is assumed to be 45.72m.
Insulator Design
(1) Insulator type and Size The insulator unit applied to the transmission line is a standard disc type porcelain insulator with
ball and socket, complying with IEC 60305. 210kN type insulators are applied for the suspension
towers and the tension towers. The technical characteristics of the insulators are shown in the following
table.
Table 6.3-4 Technical Characteristics of the Insulators Rated Ultimate Strength 210kN
IEC Designation U210B
Shell Diameter 280 mm
Unit Spacing 170 mm
Nominal Creepage Distance 405 mm
Ball & Socket Coupling 20 mm
(2) Number of insulator Units per String The number of insulator units per string is 17 units for the suspension towers and 15 units for the
tension towers.
(3) Determination of number of Insulator Strings per Set The determinations of the number of insulators per string are as shown below.
Contamination design
Contamination level: Heavy
Creepage distance per voltage: 43.3 mm/kV
Highest Voltage, Um:
230 kV × 1.15/1.1 ≒ 241 kV
Total Insulator Creepage Distance:
241 kV ÷ √3 × 43.3 mm/kV ≒ 6,025 mm
Number of insulator units:
U210B: 6,025 mm ÷ 405 mm = 14.88 ≒ 15 units/string
Light Impulse Withstand Voltage
Taking highest voltage, Um = 241 kV ≒ 245 kV
Referring to IEC60071-1-2006, standard rated lightning impulse withstand voltage at 245 kV
is 1,050 kV and minimum horn gap distance is 2,100 mm. The ratio of horn gap distance to
length of insulator string length (Z/Zo) is decided as 75% from normal practice in the world.
Number of insulator units:
U210B: 2,100 mm ÷ 0.75 ÷ 170 mm = 16.47 ≒ 17 units/string
Switching Impulse Withstand Voltage (SIWV) Given, Surge multiplier: 3.3; Insulation deterioration coefficient: 1.1; Withstand voltage
coefficient: 1/0.9
50% Switching Surge Flashover Voltage, V50:
V50 = Um × √2 ÷√3 × 3.3 × 1.1 × 1/0.9 = 793.6 kV
Horn gap distance without flashover in V50:
V50 = k × 1080 × ln(0.46d+1); where k: gap factor = 1.24
d = 1.76 m
Number of insulator units:
Transmission Project Preparatory Survey Phase III
Final Report (Advanced Release)
6-16
U210B: 1,760 mm ÷ 0.75 ÷ 170 mm = 13.81 ≒ 14 units/string
Table 6.3-5 Determination of Number of Insulators per Strings
Type of
Insulator
Contamination
Level
Number of Insulator by
Contamination
Design
Light
Impulse
Withstand
Voltage
Switching
Impulse
Withstand
Voltage
Result
U210B Heavy 15 17 14 17
(4) Mechanical Strength of Tension Insulators For the suspension towers, the number of insulator strings per set is either the same as, or double
the amount of, the 210kN insulators, which was determined in accordance with the transmission line
crossing places. As for the tension towers, the number of insulator strings per set is double the number
of 300kN insulators. The tension insulators must satisfy the safety factor at RUS for maximum
working tension at the standard span of 400 m, as follows.
Table 6.3-6 Tension Insulator Assembly Conductor
Maximum Tension
(Span length: 400m) Insulator Tension Safety Factor
LL-ACSR 728 mm2 132.0kN (66.0kN × 2) Double strings 600kN
(300kN × 2) 4.54 > 2.5
(5) Tension Insulator Assembly Insulator assembly fittings also have to maintain the same strength as the insulators.
Table 6.3-7 Tension Insulator Assembly Conductor
Maximum Tension
(Span length: 450m) Insulator Tension Safety Factor
LL-ACSR 728 mm2 133.0kN (66.0kN × 2) Double strings 600kN
(300kN × 2) 4.54 > 2.5
Ground Clearance The most severe state for the ground clearance of the conductors will occur when the conductor’s
temperature rises to 75 ºC under still air conditions. The minimum height of the conductor above
ground at 230 kV level is determined as below.
Table 6.3-8 Minimum Height of the Conductor above Ground Object Clearance
Ground (Paddy field) 8.0 m
Road 10.0 m
Railway 20.0 m
Determination of Tower Configuration
(1) Electrical Clearance
Table 6.3-9 Swing Angle and Insulation Clearance Normal Middle Abnormal
Wind velocity 0 to 10 m/s 10 to 20 m/s 20 to 35 m/s
Swing angle of suspension strings (A) 0 to 10 deg 10 to 30 deg 30 to 60 deg
Swing angle of tension strings without jumper
loop (B) 0 to 5 deg 5 to 15 deg 15 to 40 deg
Swing angle of tension strings with jumper
loop (C, D, E) 0 to 15 deg N/A N/A
Clearance (suspension strings) 2,760 mm 1,910 mm 700 mm
Clearance (tension strings) 2,530 mm 1,910 mm 700 mm
*The above figures considered the length of the step bolts and thickness of materials.

Transmission Project Preparatory Survey Phase III
Final Report (Advanced Release)
6-17
(2) Length of String Set and Drop of Jumper Loop The length of the suspension string set and drop of jumper loop are estimated as follows.
Table 6.3-10 Length of Suspension String Set and Drop of Jumper Loop Type Determination Length
Length of suspension string set
for U210B 170mm × 17units+1,080mm (fitting length) 3,970mm
Length of tension string set for
U210B 170mm × 17units+1,035mm (fitting length) 3,925mm
Drop of jumper loop for tension
string set 2,480mm* × 1.2+100mm (influence of slope) 3,080mm
Length of support insulator
string set for C, D, 4C, E 170mm × 17units+785mm (fitting length) 3,675mm
*Air clearance (Normal conditions): 2,480mm
(3) Clearance Diagram Clearance diagrams of suspension insulator strings and drop of jumper loop are shown below.
Suspension Tension
A B, 4B C, D, E, 4C
Figure 6.3-3 Clearance Diagram
Towers
(1) Types of Towers (a) Type A
Suspension type towers on straight sections of the line or on sections of the line with a
horizontal deviation angle up to 3 degrees with suspension insulator sets.
(b) Type 4A
4 circuits Suspension type tower on straight sections of the line or on sections of the line
with a horizontal deviation angle up to 3 degrees with suspension insulator sets.
(c) Type B
Tension type tower on sections of the line with a horizontal deviation angle up to 20
degrees with tension insulator sets.
(d) Type 4B
4 circuits tension type tower on sections of the line with a horizontal deviation angle up to
20 degrees with tension insulator sets.
(e) Type C
Tension type tower on sections of the line with a horizontal deviation angle from 20
degrees to 40 degrees with tension and jumper suspension insulator sets.
(f) Type 4C
4 circuits tension type tower on sections of the line with a horizontal deviation angle from
20 degrees to 40 degrees with tension and jumper suspension insulator sets.
(g) Type D
Tension type tower on sections of the line with a horizontal deviation angle from 40
degrees up to 60 degrees with tension and jumper suspension insulator sets.
Transmission Project Preparatory Survey Phase III
Final Report (Advanced Release)
6-18
(h) Type E
Tension type tower used at the terminal of the line with tension insulator sets having
jumper insulator sets where required, with a horizontal angle up to 40 degrees.
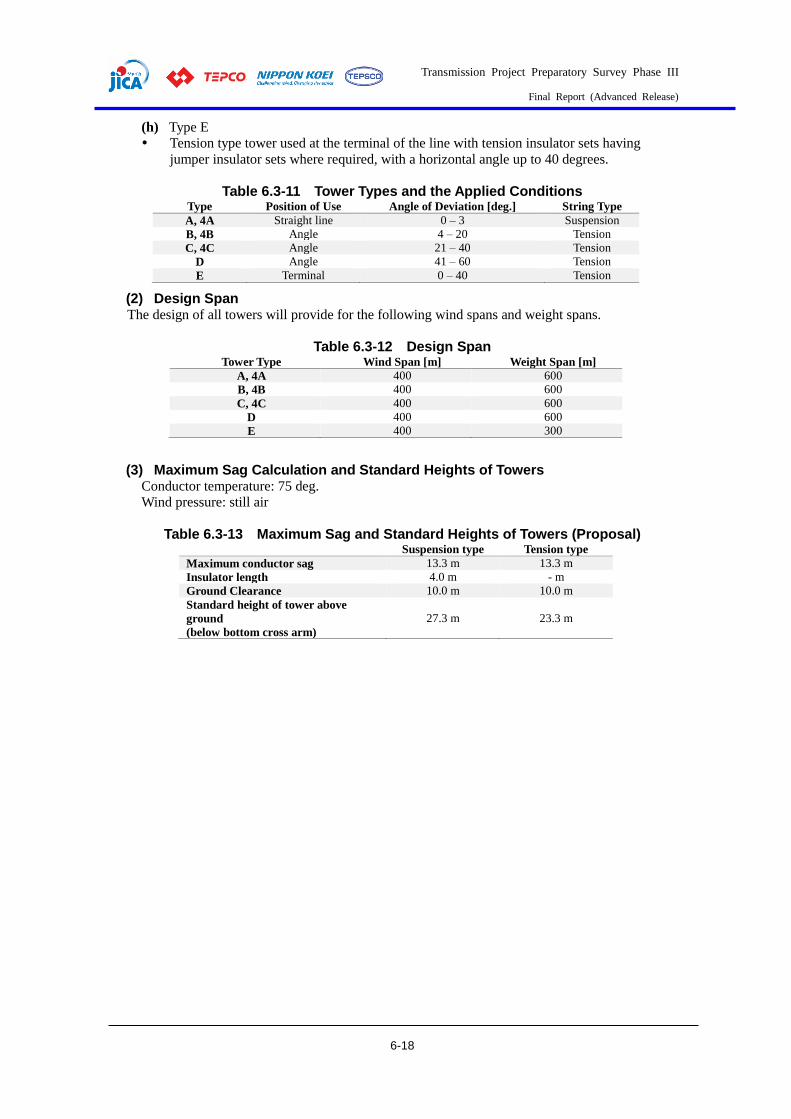
Table 6.3-11 Tower Types and the Applied Conditions Type Position of Use Angle of Deviation [deg.] String Type
A, 4A Straight line 0 – 3 Suspension
B, 4B Angle 4 – 20 Tension
C, 4C Angle 21 – 40 Tension
D Angle 41 – 60 Tension
E Terminal 0 – 40 Tension
(2) Design Span The design of all towers will provide for the following wind spans and weight spans.
Table 6.3-12 Design Span Tower Type Wind Span [m] Weight Span [m]
A, 4A 400 600
B, 4B 400 600
C, 4C 400 600
D 400 600
E 400 300
(3) Maximum Sag Calculation and Standard Heights of Towers Conductor temperature: 75 deg.
Wind pressure: still air
Table 6.3-13 Maximum Sag and Standard Heights of Towers (Proposal) Suspension type Tension type
Maximum conductor sag 13.3 m 13.3 m
Insulator length 4.0 m - m
Ground Clearance 10.0 m 10.0 m
Standard height of tower above
ground
(below bottom cross arm)
27.3 m 23.3 m

Transmission Project Preparatory Survey Phase III
Final Report (Advanced Release)
6-19
(4) Shape of Tower
Figure 6.3-4 Type A Tower Figure 6.3-5 Type B, C, D Tower
Figure 6.3-6 Type E Tower

Transmission Project Preparatory Survey Phase III
Final Report (Advanced Release)
6-20
Figure 6.3-7 Type 4A Tower Figure 6.3-8 Type 4B, 4C Tower
(5) Unit Weight of Towers The unit weights of towers for different extension lengths are shown below.
Table 6.3-14 Unit Weight of the 2 Circuit Towers
Tower extension
[m]
Unit weight of towers [ton]
A B C D E
0 23.8 32.0 38.3 42.2 48.4
+3 28.3 38.7 45.9 51.8 –
Table 6.3-15 Unit Weight of the 4 Circuit Towers
Tower extension
[m]
Unit weight of towers [ton]
4A 4B 4C
0 58.4 87.3 116.3

Transmission Project Preparatory Survey Phase III
Final Report (Advanced Release)
6-21
Tower Foundations
(1) Tower load conditions The foundation loads that are transmitted from each tower at ±0.0 m extension
Table 6.3-16 Tower Load Conditions (2 cct 230 kV)
Table 6.3-17 Tower Load Conditions (4 cct 230 kV)
Tower type Compressive load
[kN]
Tensile load
[kN]
4A 1619.9 1135.3
4B 2686.2 2016.8
4C 3960.1 3148.5
Quantities of the Transmission Line Materials
(1) Number of Towers and Total Weight of Towers The assumed tower types, number of towers and the tower weight for the transmission line are
summarized in the following table.
Table 6.3-18 Numbers of Towers and Tower Weight (Sar Ta Lin S/S to East Dagon S/S)
Tower type Extension
[m]
Unit weight
[ton]
No. of towers
[unit]
Total weight
[ton]
A: Suspension
(Horizontal angle: 0 – 3 deg.)
0.0 23.8 33 785.4
+3.0 28.3 1 28.3
Subtotal 34 813.7
B: Tension
(Horizontal angle: 3 – 20 deg.)
0.0 32.0 2 64.0
+3.0 38.7 – –
Subtotal 2 64.0
C: Tension
(Horizontal angle: 20 – 40 deg.)
0.0 38.3 2 76.6
+3.0 45.9 1 45.9
Subtotal 3 122.5
D: Tension
(Horizontal angle: 40 – 60 deg.) 0.0 42.2 4 168.8
+3.0 51.8 – –
Subtotal 4 168.8
E: Dead-end
(Horizontal angle: 0 – 40 deg.) 0.0 48.4 2 96.8
Subtotal 2 96.8
Total 45 1265.8
Table 6.3-19 Numbers of Towers and Tower Weight (Sar Ta Lin S/S to Hlawga S/S)
Tower type Extension
[m]
Unit weight
[ton]
No. of towers
[unit]
Total weight
[ton]
4A: Suspension
(Horizontal angle: 0 – 3 deg.) 0.0 58.4 33 1927.2
Subtotal 33 1927.2
4B: Tension
(Horizontal angle: 3 – 20 deg.) 0.0 87.3 3 261.9
Subtotal 3 261.9
4C: Tension
(Horizontal angle: 20 – 40 deg.) 0.0 116.3 5 581.5
Subtotal 5 581.5
Tower type Compressive load
[kN]
Tensile load
[kN]
A 642.5 494.4
B 996.2 771.0
C 1438.0 1131.7
D 1855.1 1524.8
E 2122.3 1668.4

Transmission Project Preparatory Survey Phase III
Final Report (Advanced Release)
6-22
E: Dead-end
(Horizontal angle: 0 – 40 deg.) 0.0 48.4 4 193.6
Subtotal 4 193.6
Total 45 2964.2
Table 6.3-20 Numbers of Towers and Tower Weight (Hlawga S/S to Thaketa S/S)
Tower type Extension
[m]
Unit weight
[ton]
No. of towers
[unit]
Total weight
[ton]
A: Suspension
(Horizontal angle: 0 – 3 deg.)
0.0 23.8 38 904.4
+3.0 28.3 4 113.2
Subtotal 42 1017.6
B: Tension
(Horizontal angle: 3 – 20 deg.)
0.0 32.0 4 128.0
+3.0 38.7 – –
Subtotal 4 128.0
C: Tension
(Horizontal angle: 20 – 40 deg.)
0.0 38.3 1 38.3
+3.0 45.9 – –
Subtotal 1 38.3
D: Tension
(Horizontal angle: 40 – 60 deg.)
0.0 42.2 – –
+3.0 51.8 – –
Subtotal – –
E: Dead-end
(Horizontal angle: 0 – 40 deg.) 0.0 48.4 4* 193.6
Subtotal 4 193.6
Total 51 1377.5
*2 type E towers branch to Kyaikkasan S/S.
(2) Quantities of Conductors and Ground Wire The quantities of conductors and ground wires for the transmission line are computed by
multiplying the numbers of conductors or ground wires by the route length, and multiplying that
number by 1.05 for the sag allowance and margin for stringing work.
Table 6.3-21 Quantities of Conductors and Ground Wire Conductor/Ground wire
type
No. of
bundles
No. of
phases
No. of
circuits
Route length
[km]
Line length
[km]
LL-ACSR 728 mm2
Sar Ta Lin – East Dagon
T/L 2 3 2 19.0 239.4
Sar Ta Lin – Hlawga T/L 2 3 4 17.0 428.4
Hlawga – Thaketa T/L 2 3 2 17.0 214.2
Total 882.0
OPGW115 mm2
Sar Ta Lin – East Dagon
T/L 1 – 1 19.0 19.95
Sar Ta Lin – Hlawga T/L 1 – 1 17.0 17.85
Hlawga – Thaketa T/L 1 – 1 17.0 17.85
Total 55.65
AC110 mm2
Sar Ta Lin – East Dagon
T/L 1 – 1 19.0 19.95
Sar Ta Lin – Hlawga T/L 1 – 1 17.0 17.85
Hlawga – Thaketa T/L 1 – 1 17.0 17.85
Total 55.65
(3) Quantities of Insulators and Insulator Assemblies The quantities of insulators and insulator assemblies for the three transmission lines are computed
from the number of suspension and tension towers considering the number of strings.

Transmission Project Preparatory Survey Phase III
Final Report (Advanced Release)
6-23
Table 6.3-22 Quantities of Insulators and Insulator Assemblies
Insulator
type Tower type
Assembly
type
No. of
insulators
per set [pcs]
No. of
strings per
tower [set]
No. of
tower
[unit]
Subtotal
of strings
[set]
Subtotal of
insulators
[pcs]
Sartalin – East Dagon T/L
U210B
Suspension Double 34 6 1 6 204
Single 17 6 33 198 3366
Jumper support Single 17 6 9 54 918
Tension Double 34 12 9 108 3672
Dead-end Double 34 12 2 24 816
Subtotal 390 8976
Sartalin – Hlawga T/L
U210B
Suspension Double 34 12 1 12 408
Single 17 12 32 384 6528
Jumper support Single 17 12 9 108 1836
Tension Double 34 24 8 192 6528
Dead-end Double 34 12 4 48 1632
Subtotal 744 16932
Hlawga – Thaketa T/L
U210B
Suspension Double 34 6 4 24 816
Single 17 6 38 228 3876
Jumper support Single 17 6 5 30 510
Tension Double 34 12 5 60 2040
Dead-end Double 34 12 4 48 1632
Subtotal 390 8874
TOTAL 1524 34782
(4) Quantities of Foundation Concretes Quantities of reinforced concrete of the foundations for different types of 230kV towers based on
dfferent transmission lines are summarized in the following table.
Table 6.3-23 Quantities of Foundation Concretes Type of
foundation Tower type
Unit concrete
[m3]
No. of tower
[unit]
Total concrete
[m3]
Sartalin – East Dagon T/L
Pile
A 43.6 34 1482.4
B 44.0 2 88.0
C 45.6 3 136.8
D 45.6 4 182.4
E 45.6 2 91.2
Subtotal 45 1980.8
Sartalin – Hlawga T/L
Pile
4A 45.6 33 1504.8
4B 45.6 3 136.8
4C 150.0 5 750.0
E 45.6 4 182.4
Subtotal 45 2574.0
Hlawga – Thaketa T/L
Pile
A 43.6 42 1831.2
B 44.0 4 176.0
C 45.6 1 45.6
D 45.6 0 0.0
E 45.6 4 182.4
Subtotal 51 2235.2
TOTAL 141 6790.0
Table 6.3-24 Total Quantities of Insulators
Insulator type Total No. of insulators [pcs]
U210B 18462
U300B 9600

Transmission Project Preparatory Survey Phase III
Final Report (Advanced Release)
6-24
Obstacle Limitation Surface The height of the towers within the obstacle limitation surface of Yangon International Airport are
shown in Figure 6.3-9 and the height limitation of obstacles is illustrated in Figure 6.3-10. The height
of the towers (Hlawga – Thaketa T/L) within the 2.0% slope area must be within 60m and the height
of the towers (Sar Ta Lin – Hlawga T/L) within the horizontal area must be within 150m.
Figure 6.3-9 Obstacle Limitation Surface of Yangon International Airport
Figure 6.3-10 Illustration of the Limitation Surface
6.4. Design of Foundations
Soil Conditions Most of the 500 kV and 230 kV TL routes are Alluvium, which is new and relatively soft. Therefore,
pile foundations will be applied for most of the towers. In addition, we judged that pile foundations
were appropriate based on the results of boring logs shown in Figure 3.3-6 to Figure 3.3-11. It is
necessary to conduct a detailed soil investigation at each TL tower position before implementing the
detailed design to determine the type of each tower foundation and the depth of the support layer.
(1) Soil Conditions for Pile Foundations The concept for the supporting layer of pile foundations is in accordance with the Basic Design in
"500kV TRANSMISSION LINE BETWEEN PHARYARGYII AND HLAING THARYAR FOR
NATIONAL POWER TRANSMISSION NETWORK DEVELOPMENT PROJECT PHASE I". A

Transmission Project Preparatory Survey Phase III
Final Report (Advanced Release)
6-25
supporting layer should be a clay layer for which the N-value is 20 or more, or a sand layer, gravel or
rock for which the N-value is 30 or more.
The depth of supporting layer is BH1 (21.0m), BH2 (30.0m), BH3 (40.5m*), BH4 (28.5m), BH5
(40.5m*) and BH6 (40.5m*) based on boring logs shown in Figure 3.3-6 to Figure 3.3-11, and the
average depth is 33.5m. Here, the depths of 40.5 m in three logs - BH3, BH5 and BH6 - are considered
to be almost enough to satisfy the supporting conditions.
In addition, the following boring logs from near East Dagon SS, published on the website, were
referenced. The data source is "The Project for the Improvement of Water Supply, Sewerage and
Drainage System in Yangon City Vol IV Water Supply System Feasibility Study, Appendix". The depth
of the supporting layer is 33.0 m.
From the above results, the supporting layer depth of pile foundations in the Alluvium was estimated
to be about 33.0 m.
Figure 6.4-1 Location of Boring Logs near East Dagon SS
East Dagon S/S

Transmission Project Preparatory Survey Phase III
Final Report (Advanced Release)
6-26
Figure 6.4-2 Soil Conditions of Pile Foundation (1/5)

Transmission Project Preparatory Survey Phase III
Final Report (Advanced Release)
6-27
Figure 6.4-3 Soil Conditions of Pile Foundation (2/5)

Transmission Project Preparatory Survey Phase III
Final Report (Advanced Release)
6-28
Figure 6.4-4 Soil Conditions of Pile Foundation (3/5)

Transmission Project Preparatory Survey Phase III
Final Report (Advanced Release)
6-29
Figure 6.4-5 Soil Conditions of Pile Foundation (4/5)

Transmission Project Preparatory Survey Phase III
Final Report (Advanced Release)
6-30
Figure 6.4-6 Soil Conditions of Pile Foundation (5/5)

Transmission Project Preparatory Survey Phase III
Final Report (Advanced Release)
6-31
(2) Soil Conditions for Pad and Chimney Foundations Near Phayargi S/S, near the middle of the TL route between Pharyargyii S/S and Sar Ta Lin S/S is
the Irrawaddy Formation, which is relatively solid from Miocene to Pliocene. The TL route near
Phayargi S/S is shown in Figure 6.4-7. The TL route between Phayargi S/S and Sar Ta Lin S/S is
shown in Figure 6.4-8.
According to basic design in “500kV TRANSMISSION LINE BETWEEN PHARYARGYII AND
HLAING THARYAR FOR NATIONAL POWER TRANSMISSION NETWORK DEVELOPMENT
PROJECT PHASE I”, most of the tower foundations on Irrawaddy were Pad and Chimney, and the
soil conditions of this Irrawaddy were applied for Type II in Table 6.4-1.
Table 6.4-1 Classification of Foundations
Figure 6.4-7 Geology Near Phayargi S/S
Paddy field
4
IV
high
Paddy field
1 2 3
III
fewsubsoil water
15
10
0
100
130
Foundation type
Yielding bearing capacity
Unit weight of soil
Angle of repose
(kN/m3)Wc
w
θ
(kN/m3)
(゜)
24
14
0
200300
20
16
24
250
Unit weight of concrete
750 400
Underground water level lowfew
subsoil water
Land use
(kN/m2)
We
30
II
Hilly area, Solid farm
Soft farm
I
Yielding bearing capacity for lateral force wf
Selective number for calculation
(kN/m2)
18
24
600
Irrawaddy
Alluvium

Transmission Project Preparatory Survey Phase III
Final Report (Advanced Release)
6-32
Figure 6.4-8 Geology between Phayargi S/S and Sar Ta Lin S/S
Loads Conditions for Pile Foundations The tower load conditions for 230kV TL are shown in Table 6.4-2 and those for 500kV TL are
shown in Table 6.4-3.
Legends by tower angle are shown below.
A: 0°~3° (Suspension)
B: 3°~20° (Tension)
C: 21°~40° (Tension)
D: 41°~60° (Tension)
E: 0°~40° (Terminal)
Table 6.4-2 Tower load conditions for 230kV TL
Irrawaddy
Alluvium

Transmission Project Preparatory Survey Phase III
Final Report (Advanced Release)
6-33
Table 6.4-3 Tower load conditions for 500kV TL
Results of Foundation Design The specifications and shape of the foundations need to be determined through a detailed design
based on the soil investigation results at each tower before construction. The basic design for the
foundations was conducted based on the current geological and loading conditions. In addition, the
depth of the support layer for the pile foundations was assumed to be 33m, where the N value becomes
24 or more in cohesive soil based on “Soil Conditions of Pile Foundation (4/5) in Table 6.4-4.
(1) Pile Foundations for 500kV (2 circuits) The dimensions of the pile foundations for 500kV (2 circuits) are shown in Table 6.4-4.

Transmission Project Preparatory Survey Phase III
Final Report (Advanced Release)
6-34
Table 6.4-4 Dimensions of the pile foundations for 500 kV (2 circuits)
(2) Pile Foundations for 230kV (2 circuits) The dimensions of the pile foundations for 230kV (2 circuits) are shown in Table 6.4-5.
DA DB DC DD DE
(a) m 0.60 0.75 0.75 0.75 0.75
(b) m 0.85 1.00 1.00 1.00 1.00
(f') m 0.50 0.50 0.50 0.50 0.50
(h1) m 1.50 1.50 1.50 1.50 1.50
(B) m 3.20 3.20 3.70 4.80 3.50
(t) m 1.00 1.00 1.00 1.00 1.00
(H) m 2.00 2.00 2.00 2.00 2.00
Length (L) GL-m 34.00 34.00 34.00 34.00 34.00
Diameter (D) mm 800 800 800 800 800
No. of Piles (n) - 4 4 4 4 4
Pad
Depth of Pad Bottom
Pile
Chimney
Tower Type

Transmission Project Preparatory Survey Phase III
Final Report (Advanced Release)
6-35
Table 6.4-5 Dimensions of the pile foundations for 230kV (2 circuits)
A B C D E
(a) m 0.55 0.60 0.75 0.75 0.75
(b) m 0.80 0.85 1.00 1.00 1.00
(f') m 0.50 0.50 0.50 0.50 0.50
(h1) m 1.50 1.50 1.50 1.50 1.50
(B) m 3.20 3.20 3.20 3.20 3.20
(t) m 1.00 1.00 1.00 1.00 1.00
(H) m 2.00 2.00 2.00 2.00 2.00
Length (L) GL-m 34.00 34.00 34.00 34.00 34.00
Diameter (D) mm 800 800 800 800 800
No. of Piles (n) - 4 4 4 4 4
Pile
Chimney
Pad
Depth of Pad Bottom
Tower Type

Transmission Project Preparatory Survey Phase III
Final Report (Advanced Release)
6-36
(3) Pile Foundations for 230kV (4 circuits) The dimensions of the pile foundations for 230kV (4 circuits) are shown in Figure 6.4-6.
Table 6.4-6 Dimensions of the pile foundations for 230kV (4 circuits)
4A 4B 4C
(a) m 0.75 0.75 0.75
(b) m 1.00 1.00 1.00
(f') m 0.50 0.50 0.50
(h1) m 1.50 1.50 1.50
(B) m 3.20 3.20 5.50
(t) m 1.00 1.00 1.20
(H) m 2.00 2.00 2.20
Length (L) GL-m 34.00 34.00 34.00
Diameter (D) mm 800 800 800
No. of Piles (n) - 4 4 4
Chimney
Pad
Depth of Pad Bottom
Pile
Tower Type

Transmission Project Preparatory Survey Phase III
Final Report (Advanced Release)
6-37
(4) Pad and Chimney Foundations for 500kV (2 Circuits) The dimensions of Pad and Chimney foundations for 500kV (2 circuits) are shown in Table 6.4-7.
Table 6.4-7 Dimensions of the Pad and Chimney foundations for 230kV (4 circuits)
DA DB DC DD DE
II II II II II
(a) m 0.60 0.80 0.80 0.80 0.80
(b) m 1.20 1.40 1.40 1.50 1.40
(f') m 0.50 0.50 0.50 0.50 0.50
(h1) m 3.50 3.60 3.90 4.00 3.80
(B) m 4.30 5.30 6.30 7.00 6.00
(t) m 1.00 1.00 1.00 1.00 1.00
(H) m 4.00 4.10 4.40 4.50 4.30
Geological Type
Chimney
Pad
Depth of Pad Bottom
Tower Type

Transmission Project Preparatory Survey Phase III
Final Report (Advanced Release)
6-38
6.5. Preliminary Design for Underground Transmission Lines
Design for Burial Method There are, in general, two types of underground transmission line systems: direct burial and duct
burial. The optimal construction method will be selected in consideration of economy, construction
period, surrounding environment, etc.
In particular, the duct burial method is effective for narrow roads in urban areas in order to prevent
traffic jams and avoid disturbing daily life, as it does not require a prolonged excavation because it
can be backfilled on the same day after excavating and installing duct pipes. The duct burial method
is basically examined at the preliminary design stages.
Source: JICA survey team
Figure 6.5-1 Overview of direct burial method and duct burial method
Source: JICA survey team
Figure 6.5-2 Overview of duct burial method
Source: JICA survey team
Figure 6.5-3 Horizontal Directional Drilling Method

Transmission Project Preparatory Survey Phase III
Final Report (Advanced Release)
6-39
Table 6.5-1 Evaluation of direct burial and duct burial method Direct burial Duct HDD
Length of one driving ◎
None
◎
None
△
Less than 1000m
Shaft Not needed Not needed Need for connection to next duct
Temporary Yard ◎
Dairy yard
◎
Dairy yard
△
Wide and Long Period (HDD
machine at start and end site)
Workability
△
Backfilling can
only be done after
installing the cable
◎
Backfilling can be done after
installing duct (the same day)
◎
No backfill
Maintenance ○
◎
Cable replacement is possible
in the event of an accident or
expansion
◎
Cable replacement is possible in
the event of an accident or
expansion
Cost (at the time of an
accident) △ ◎ ◎
Overall Evaluation ○ ◎ ○
Note: ◎---Very good, ○----Good, △----Not suitable Source: JICA survey team
Direct burial method and Duct burial method are evaluated via the items of workability,
maintenance, and cost (at the time of an accident) etc. The duct burial method does not require a
prolonged excavation because it can be backfilled on the same day after excavating and installing duct
pipes. After commissioning of the power cable, cable replacement in an accident and replacement of
old cables can be performed in the duct without digging the road. The duct burial method is more
advantageous than the direct burial method in terms of workability, maintenance and so on. The HDD
method is applied for crossing rivers and railways, which present difficulties in digging the road.
Design of Ducts The recommended material for duct pipes is Polyester Concrete Fiberglass Reinforced
Plastic Pipe (PFP), which is widely used in Japan for multi-pipe conduit.
Source: Kurimoto web site and so on
Figure 6.5-4 Overview of HDPE duct (right) and PFP duct (left)

Transmission Project Preparatory Survey Phase III
Final Report (Advanced Release)
6-40
Source: kurimoto web site
Figure 6.5-5 Overview of PFP duct
This table shows an evaluation of HDPE duct and PFP duct.
Table 6.5-2 Evaluation of HDPE duct and PFP duct
HDPE PFP
Workability ◎
Workers can carry one.
Easy handling by worker
Unit of straight length: 10m
Easy duct to duct connection
Weight: around 17kg/m
(nominal diameter: 250mm)
〇
Workers can carry one.
Heavier than HDPE
Unit of straight length: 2m
Weight: around 31kg/m (nominal diameter:
250mm)
Maintenance ◎ ◎
Strength △ Weaker than PFP and it has
never been used with pipe clieats.
◎ Resilient to outer damage with polycon
Fiber Reinforced and widely used with
pipe clieats in Japan.
Cost ◎ 〇
Overall
Evaluation △ ◎
Source: JICA survey team
Note: ◎---Very good, ◯----Good, △----Not suitable
HDPE ducts are more advantageous in terms of workability and cost. However, in this project nine
pipes will be arranged in horizontal 3 rows and vertical 3 rows with pipe clieats, so the recommended
material for duct pipes is Polyester Concrete Fiberglass Reinforced Plastic Pipe (PFP).
Design of Manholes and Joint Bays There are two types of cable connection construction methods for underground transmission lines:
the joint bay method (generally used abroad) and the manhole method (generally used in Japan). The
manhole method is expensive in terms of the initial construction costs, but maintenance costs can be
reduced by adopting the manhole system integrally with the duct pipe method, because cable
replacement in an accident and replacement of old cables can be performed from the manhole neck.
The manhole method is also effective for narrow roads in urban areas in terms of preventing traffic
jams and avoiding disturbances to daily life, because all maintenance work can be performed from the
Transmission Project Preparatory Survey Phase III
Final Report (Advanced Release)
6-41
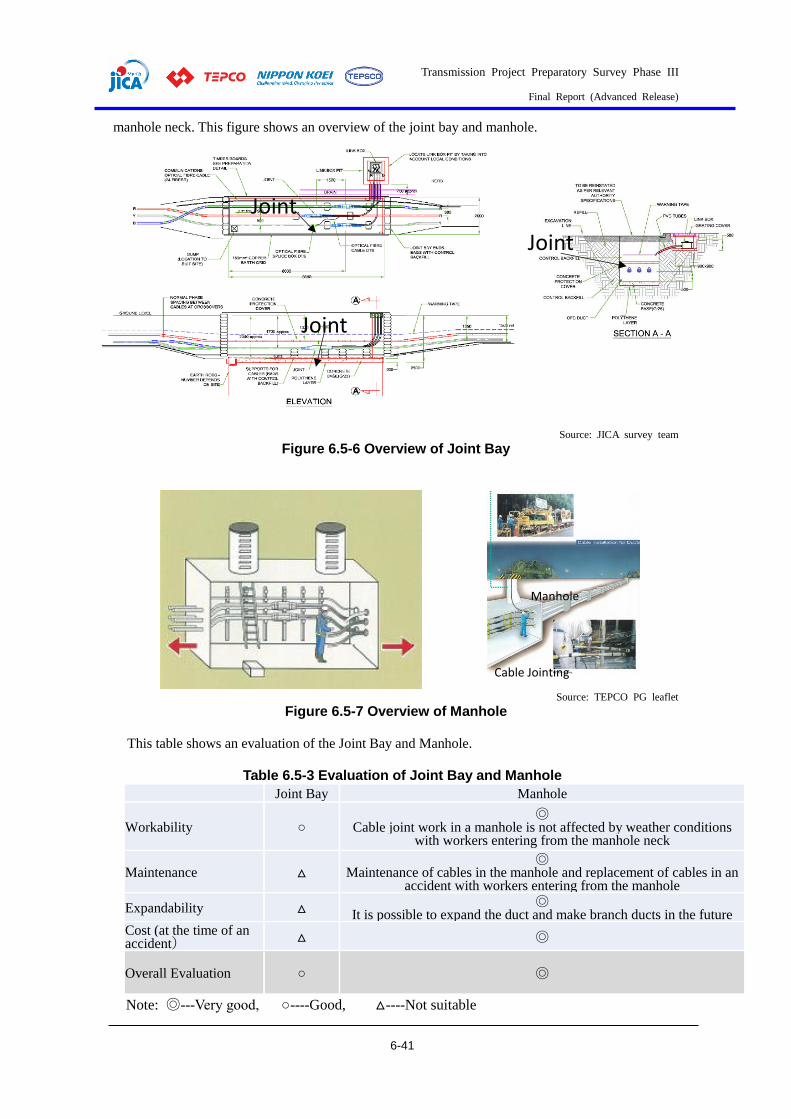
manhole neck. This figure shows an overview of the joint bay and manhole.
Source: JICA survey team
Figure 6.5-6 Overview of Joint Bay
Source: TEPCO PG leaflet
Figure 6.5-7 Overview of Manhole
This table shows an evaluation of the Joint Bay and Manhole.
Table 6.5-3 Evaluation of Joint Bay and Manhole Joint Bay Manhole
Workability ○ ◎
Cable joint work in a manhole is not affected by weather conditions with workers entering from the manhole neck
Maintenance △ ◎
Maintenance of cables in the manhole and replacement of cables in an accident with workers entering from the manhole
Expandability △ ◎ It is possible to expand the duct and make branch ducts in the future
Cost (at the time of an accident) △ ◎
Overall Evaluation ○ ◎
Note: ◎---Very good, ○----Good, △----Not suitable
Joint
Joint
Joint
Manhole
Cable Jointing

Transmission Project Preparatory Survey Phase III
Final Report (Advanced Release)
6-42
Source: JICA survey team
The Manhole method is superior to the Joint Bay method in terms of workability and maintenance,
with the maintenance staff entering the manhole through manhole neck. With a manhole, it is possible
to expand the duct and make branch ducts in the future, so the Manhole method is superior to the Joint
Bay method in terms of expandability.
After commissioning of the power cable, cable replacement in an accident and replacement of old
cables can be performed in the duct without digging the road. The duct burial method is more
advantageous than the direct burial method in terms of workability, maintenance and so on.
The manhole method is expensive in terms of the initial construction costs, but maintenance costs
can be reduced by adopting the manhole system integrally with the duct pipe method, because cable
replacement in an accident and replacement of old cables can be performed from the manhole neck
without digging the road. Furthermore, if a manhole is made in a precast system, manufactured at a
local plant and installed at the site using a truck crane, the construction period can be significantly
shortened, and it is also possible to reduce the impact of construction on the surrounding environment.
Figure 6.5-8 Overview of precast manhole
The features of precast manholes are as follows.
Molding concrete with reinforced rod into precast manhole in factory
Each piece of precast manhole is connected with a bolt at the construction site
Attach rubber packing along the Jointing
Waterproof treatment to the surface of molding concrete
Jointing with mortar at the construction site
Design of Cable The recommended material for the 230kV Cable is cross-linked polyethylene insulated vinyl sheath
cable (XLPE cable), which is the dominant material used abroad.
Cable conductor size is calculated via required transmission capacity after confirmation of
conditions. The optimal cable specification is selected taking the employer’s needs, site conditions
and so on into consideration. This figure shows two types of cable, with aluminum sheath and lead
sheath.

Transmission Project Preparatory Survey Phase III
Final Report (Advanced Release)
6-43
Source: JICA survey team
Figure 6.5-9 Typical cross-section of Extra High Voltage cable with different metallic sheath (left figure: lead sheath, right figure: Aluminum sheath)
This table shows an evaluation of cable specifications with different metallic sheaths.
Table 6.5-4 Evaluation of cable specifications with different metallic sheaths
Type of metallic sheath Lead alloy Extruded corrugated
Aluminum
Short-current of
Xx kA - y second
○: Additional copper wire layer is
required ◎
Continuous Current Capacity ◎ ◎
Water Impermeability ◎ ◎
Corrosion in Water ◎: Steady ○:Sensitive
Flexibility ◎ ◎:Required annular
shaped corrugation
Weight of Cable ○: (As 100%)
◎: (Approx.60- 70%)
[Less Cable pulling tension,
compared to lead sheath]
Mechanical Protection ○ ◎
Cost ○ (As 100%) ◎:(Approx.80-90%)
Environmental Effects △:Toxic ◎
Overall Evaluation ○ ◎
Note: ◎---Very good, ○----Good, △----Not suitable Source: JICA survey team
For the cable, there are concerns about corrosion in terms of sensitivity to water, but the cable can
be covered by an outer sheath. In view of the permissible short circuit current, cable with an extruded
corrugated aluminum sheath is more advantageous than lead sheath in terms of workability (30% less
weight than lead sheath) and cost (approximately 10 – 20 % less than lead sheath).
Preliminary Design
(1) Basic Conditions for Design
Basic Conditions (Common Items) This table shows the basic conditions for the preliminary design. The route for the underground
transmission line is shown in Chapter 3. Required transmission capacity is in accordance with Chapter
1.
Transmission Project Preparatory Survey Phase III
Final Report (Advanced Release)
6-44
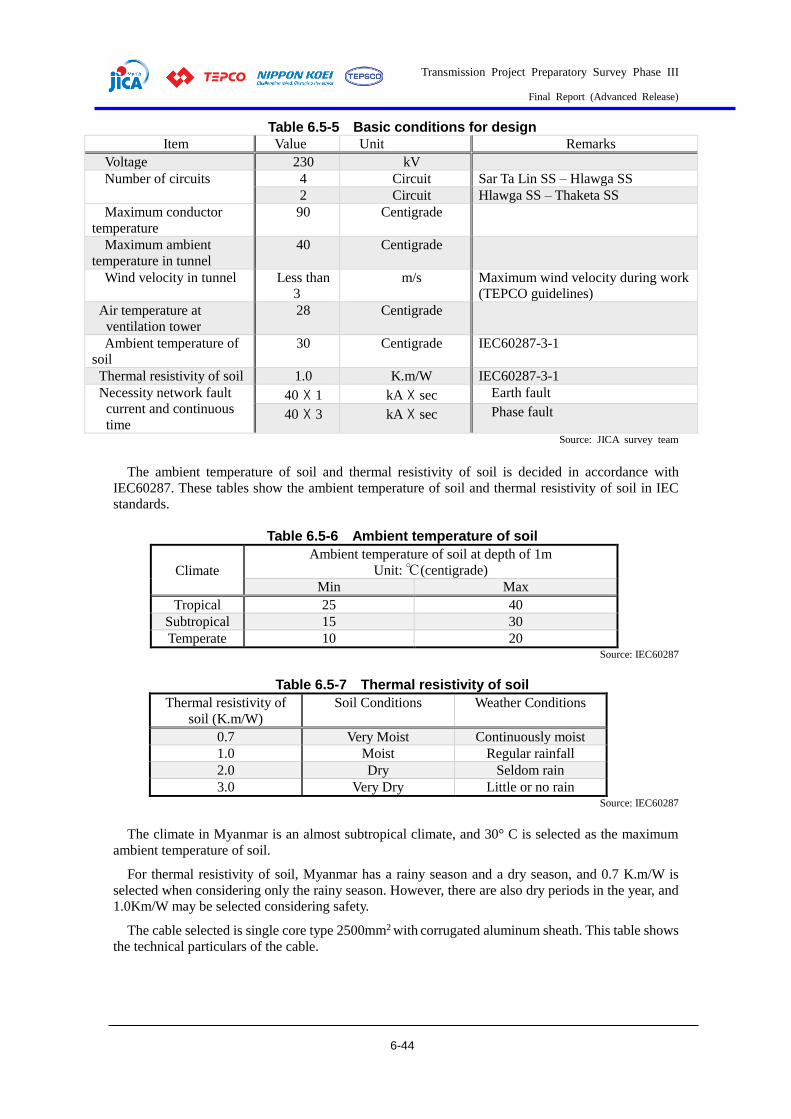
Table 6.5-5 Basic conditions for design
Item Value Unit Remarks
Voltage 230 kV
Number of circuits 4 Circuit Sar Ta Lin SS – Hlawga SS
2 Circuit Hlawga SS – Thaketa SS
Maximum conductor
temperature
90 Centigrade
Maximum ambient
temperature in tunnel
40 Centigrade
Wind velocity in tunnel Less than
3
m/s Maximum wind velocity during work
(TEPCO guidelines)
Air temperature at
ventilation tower
28 Centigrade
Ambient temperature of
soil
30 Centigrade IEC60287-3-1
Thermal resistivity of soil 1.0 K.m/W IEC60287-3-1
Necessity network fault
current and continuous
time
40 ☓ 1 kA ☓ sec Earth fault
40 ☓ 3 kA ☓ sec Phase fault
Source: JICA survey team
The ambient temperature of soil and thermal resistivity of soil is decided in accordance with
IEC60287. These tables show the ambient temperature of soil and thermal resistivity of soil in IEC
standards.
Table 6.5-6 Ambient temperature of soil
Climate
Ambient temperature of soil at depth of 1m
Unit: ℃ (centigrade)
Min Max
Tropical 25 40
Subtropical 15 30
Temperate 10 20 Source: IEC60287
Table 6.5-7 Thermal resistivity of soil
Thermal resistivity of
soil (K.m/W)
Soil Conditions Weather Conditions
0.7 Very Moist Continuously moist
1.0 Moist Regular rainfall
2.0 Dry Seldom rain
3.0 Very Dry Little or no rain Source: IEC60287
The climate in Myanmar is an almost subtropical climate, and 30° C is selected as the maximum
ambient temperature of soil.
For thermal resistivity of soil, Myanmar has a rainy season and a dry season, and 0.7 K.m/W is
selected when considering only the rainy season. However, there are also dry periods in the year, and
1.0Km/W may be selected considering safety.
The cable selected is single core type 2500mm2 with corrugated aluminum sheath. This table shows
the technical particulars of the cable.

Transmission Project Preparatory Survey Phase III
Final Report (Advanced Release)
6-45
Table 6.5-8 Technical Particulars of the selected 230kV 1C Cable
Item Unit Particulars
Conductor
Size mm2 2500
Material - Copper
Shape - Segmental Compact round
Diameter mm 62.2
Thickness of conductor shielding mm 1.5
Thickness of insulation mm 22
Thickness of semi-conductive layer mm 2
Alu
min
um
sh
eath
Thickness of swellable layer mm 1.9
Diameter over the cable core mm 117
Thickness of Al-sheath mm 2.5
Average diameter of Al-sheath mm 126.52
External diameter of Al-sheath mm 136.04
Thickness of PE jacket layer mm 5
Outside diameter of cable mm 151
Estimated unit weight of cable Kg/m 36
DC conductor resistance at 20℃ Ω/km 0.0072
Electro-static capacitance at 20℃ μF/km 0.25
Source: JICA survey team
Calculation of transmission capacity for cable conductor size Calculation in normal operation is carried out in accordance with IEC60287. Calculation of short
circuit rating is carried out based on IEC60949.
The necessary conditions for the design are as follows:
1) Number of circuits
2) Continuous current rating (MVA/circuit or ampere)
3) Ambient temperature of soil (degrees centigrade)
4) Thermal resistivity of soil
5) Necessity network fault current and continuous time (kA, sec)
Design for ducts and tunnels The study team uses the “duct burial system” in sections of 2 circuits between branch towers to the
NH3 road, for every underground transmission line, taking the results of the calculation of
transmission capacity into consideration. This is identified as an appropriate distance between ducts
(cables).
The study team uses the “tunnel system” in sections of more than 4 circuits between the MH3 road
to Hlawga substation, taking the results of the calculation of transmission capacity into consideration.
This is identified as an appropriate distance between cables in a tunnel. A ventilation system is applied
for tunnels, with ventilation towers to secure the state temperature in tunnels. The interval between
ventilation towers is around 500m.

Transmission Project Preparatory Survey Phase III
Final Report (Advanced Release)
6-46
Source: JICA survey team
Figure 6.5-10 Conceptual diagram of Underground transmission system
Manhole design Manhole design is carried out after the decision on cable conductor size via a calculation of the
required transmission capacity. Manhole design is carried out in accordance with the permissible
bending radius of cable (15D: D is the overall diameter of the cable). The necessary manhole size is
also decided.
(2) Results of the Calculation of the Capacities based on the Power Flow in 2027 This sections shows the results of the calculation of the capacities based on the following
assumptions of the power flows in 2027 (Figure 1.5-13).
Sar Ta Lin SS – Hlawga SS: 770 MVA for 4 circuits
Hlawga SS – Thaketa SS: 430 MVA for 2 circuits
Results of calculation (Duct burial system) This table shows the results of the calculation in accordance with IEC60287, with a cable conductor
size of 2500mm2. Other conditions are as follows:
Depth of duct from ground: 1.2m
Distance ducts: 345mm (manufacturer’s standard)
Table 6.5-9 Result (Duct system: Sar Ta Lin - Hlawaga)
Source: JICA survey team
The number of circuits is 4. Conductor temperature is 42 centigrade at normal operation to around
Operational conditions Transmission
capacity
(MVA/circuit)
Number of
circuits
Total
(MVA)
Conductor
temperature
(Centigrade)
Normal 200 2 400 42
N-1 622 1 622 90
Transmission Project Preparatory Survey Phase III
Final Report (Advanced Release)
6-47
400MVA/2 circuits of each route. This result is good because it is less than 90 centigrade. In the case
of N-1 operation, the result of the calculation is 622MVA at 90 centigrade conductor temperature. This
result is good as it is more than 400MVA, which is the required transmission capacity.
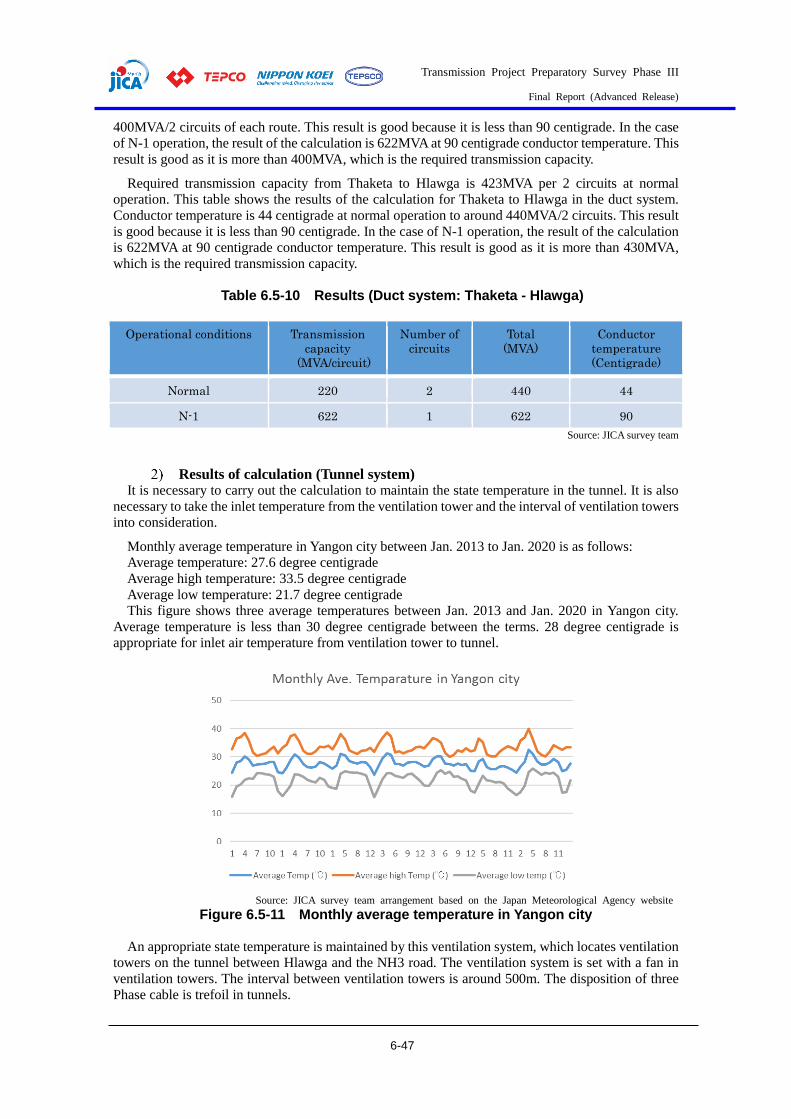
Required transmission capacity from Thaketa to Hlawga is 423MVA per 2 circuits at normal
operation. This table shows the results of the calculation for Thaketa to Hlawga in the duct system.
Conductor temperature is 44 centigrade at normal operation to around 440MVA/2 circuits. This result
is good because it is less than 90 centigrade. In the case of N-1 operation, the result of the calculation
is 622MVA at 90 centigrade conductor temperature. This result is good as it is more than 430MVA,
which is the required transmission capacity.
Table 6.5-10 Results (Duct system: Thaketa - Hlawga)
Source: JICA survey team
Results of calculation (Tunnel system) It is necessary to carry out the calculation to maintain the state temperature in the tunnel. It is also
necessary to take the inlet temperature from the ventilation tower and the interval of ventilation towers
into consideration.
Monthly average temperature in Yangon city between Jan. 2013 to Jan. 2020 is as follows:
Average temperature: 27.6 degree centigrade
Average high temperature: 33.5 degree centigrade
Average low temperature: 21.7 degree centigrade
This figure shows three average temperatures between Jan. 2013 and Jan. 2020 in Yangon city.
Average temperature is less than 30 degree centigrade between the terms. 28 degree centigrade is
appropriate for inlet air temperature from ventilation tower to tunnel.
Source: JICA survey team arrangement based on the Japan Meteorological Agency website
Figure 6.5-11 Monthly average temperature in Yangon city
An appropriate state temperature is maintained by this ventilation system, which locates ventilation
towers on the tunnel between Hlawga and the NH3 road. The ventilation system is set with a fan in
ventilation towers. The interval between ventilation towers is around 500m. The disposition of three
Phase cable is trefoil in tunnels.
Operational conditions Transmission
capacity
(MVA/circuit)
Number of
circuits
Total
(MVA)
Conductor
temperature
(Centigrade)
Normal 220 2 440 44
N-1 622 1 622 90

Transmission Project Preparatory Survey Phase III
Final Report (Advanced Release)
6-48
1) Results for normal operation (Power flow in 2027, Figure 1.5-13)
This table shows the results of the calculation for the tunnel system.
Table 6.5-11 Results (Tunnel system: Sar Ta Lin - Hlawga)
Table 6.5-12 Tunnel (Tunnel system: Hlawga –Thaketa)
Source: JICA survey team
In conditions of maximum tunnel temperature, 40 degree centigrade, conductor temperature is less
than 90 degree centigrade. This result secures the required transmission capacity of 200MVA and
220MVA.
The next step is to carry out calculations for required wind velocity in conditions of 500m intervals
of ventilation towers to maintain less than 40 degree centigrade in the tunnel.
Table 6.5-13 Wind velocity in tunnel (Normal operation)
Source: JICA survey team
Source: JICA survey team
Figure 6.5-12 Interval of ventilation towers and Air Temp. (1.1 m/s)
Required wind velocity in tunnels is 1.1m/s to maintain less than 40 degree centigrade in tunnels.
The next calculation is for N-1 operation.
Operational
conditions
Transmission
capacity
(MVA/circuit)
Number of
circuits
Total
(MVA)
Conductor
temperature
(deg. C)
Normal 200 4 800 47
Operational
conditions
Transmission
capacity
(MVA/circuit)
Number of
circuits
Total
(MVA)
Conductor
temperature
(Centigrade)
Normal 220 2 440 48
Operational conditions Transmission
capacity
(MVA/route)
Total heat loss
(W/cm)
Required wind
velocity
(m/s)
Sar Ta Lin – Hlawga 800 1.1 1.1
Thaketa - Hlawga 440 0.6

Transmission Project Preparatory Survey Phase III
Final Report (Advanced Release)
6-49
2) Results for N-1 conditions (Sar Ta Lin – Hlawga) (Power flow in 2027, Figure 1.5-13)
This table shows the results of the calculation in the case of N-1 conditions (Sar Ta Lin – Hlawga).
Table 6.5-14 Results of calculation for N-1 (Sar – Hlw) in 2027
Source: JICA survey team
Table 6.5-15 Wind velocity in tunnel (N-1 Sar - Hlw)
Source: JICA survey team
Source: JICA survey team
Figure 6.5-13 Interval of ventilation towers and Air Temp. (N-1 Sar - Hlw)
Conductor temperature is 50 centigrade and less than 90 centigrade in the case of N-1 conditions.
Required wind velocity in tunnels is 1.4m/s to maintain less than 40 degree centigrade in tunnels, with
500m intervals between ventilation towers.
3) Results for N-1 conditions (Thaketa – Hlwaga) (Power flow in 2027, Figure 1.5-13)
This table shows the results of the calculation in the case of N-1 conditions (Thaketa – Hlwaga).
Conditions Transmission
capacity
(MVA)
Circuits Conductor
temperature
(Centigrade)
Sar Ta Lin – Hlawga
(N-1)
4 circuits --> 3 circuits
800 3 50
Thaketa – Hlawga 440 2 48
Line Transmission
capacity
(MVA/route)
Total heat loss
(W/cm)
Required wind
velocity (m/s)
Sar Ta Lin – Hlawga
(N-1)
4 circuits --> 3 circuits
800 1.4 1.4
Thaketa - Hlawga 440 0.6

Transmission Project Preparatory Survey Phase III
Final Report (Advanced Release)
6-50
Table 6.5-16 Results of calculation for N-1 (Tha – Hlw) in 2027
Table 6.5-17 Wind velocity in tunnel (N-1 Tha - Hlw)
Source: JICA survey team
Source: JICA survey team
Figure 6.5-14 Interval of ventilation towers and Air Temp. (N-1 Tha - Hlw)
Conductor temperature is 62 centigrade and less than 90 centigrade in the case of N-1 conditions.
Required wind velocity in tunnels is 1.5m/s to maintain less than 40 degree centigrade in tunnels, with
500m intervals between ventilation towers.
(3) Results of the calculation of the capacities based on the power flow in 2030
Study for normal conditions 230kV underground transmission lines capacities are calculated based on the power flow in 2030
(Figure 1.5-14).
1) Normal conditions in 2030
Sra Ta Lin – Hlawga: 1492MVA (373MVA×4 circuits)
Thaketa – Hlawga: 777MVA (388MVA×2 circuits)
◎Results of calculation (Duct burial system)
Permissible transmission capacity is 527MVA per circuit at 90 centigrade in normal operation for
the duct burial system.
Conditions Transmission
capacity
(MVA)
circuit Conductor
temperature
(Centigrade)
Sar Ta Lin – Hlwaga 800 4 47
Thaketa – Hlwaga
(N-1)
2 circuits --> 1 circuit
440 1 62
Line Transmission capacity
(MVA)
Total heat loss
(W/cm)
Required wind
velocity (m/s)
Sar Ta Lin - Hlwaga 800 1.1
1.5 Thaketa - Hlawga
(N-1)
2 circuits --> 1 circuit
440 1.1

Transmission Project Preparatory Survey Phase III
Final Report (Advanced Release)
6-51
Table 6.5-18 Results of calculation for Duct burial system
Source: JICA survey team
Sar Ta Lin – Hlwaga 373MVA < 527MVA
Thaketa – Hlwaga 388MVA < 527MVA
This figure (527MVA) is enough to meet the demand (373MVA and 388MVA) in normal
operation in 2030 for the duct burial system.
◎Results of calculation (Tunnel system)
This table shows the results of the calculation for cables with trefoil formation in the tunnel
system.
Table 6.5-19 Results of calculation for Tunnel system (trefoil)
Source: JICA survey team
The required velocity to keep the temperature in the tunnel below 40 centigrade is 3.1 m/ s, which
exceeds the allowable wind speed in the tunnel of 3.0 m/s.
Cable spacing is secured between conductor axes of more than the Cable Diameter and a
recalculation was carried out to reduce the total heat loss generated from the cable in the tunnel.
The cable spacing is 200 mm.
Table 6.5-20 Results of calculation for Tunnel system (phase separation)
Source: JICA survey team
This result is enough to meet the demand (1492MVA and 777MVA) in normal operation in 2030
for the tunnel system. Temperature in the tunnel is 40 centigrade. Required wind velocity is 2.2m/s.
◎Results
These results are enough to meet the power flow in 2030 in normal operation for the duct burial
sections and tunnel sections.
Sra Ta lin – Hlawag: 1492MVA (373MVA×4 circuits)
Conditions Permissible
transmission
capacity
(MVA/circuit)
Number of
circuits
Total
capacity
(MVA)
Conductor
temperature
(Centigrade)
Normal 527 2 1054 90
Name of line Transmission
capacity
(MVA)
Total heat loss
(W/cm)
Temperature in tunnel
(Centigrade)
Required wind
velocity (m/s)
Sar Ta Lin – Hlwaga 1492 3.3 40.0 3.1
Thaketa – Hlawga 777 1.8
Name of line Transmission
capacity
(MVA)
Total heat loss
(W/cm)
Required wind
velocity(m/s)
Sar Ta Lin – Hlwaga 1492 2.3 2.2
Thaketa – Hlawga 777 1.2

Transmission Project Preparatory Survey Phase III
Final Report (Advanced Release)
6-52
Thaketa – Hlwaga: 777MVA (388MVA×2 circuits)
Sar Ta Lin – Hlwaga in the case of N-1 conditions 230kV underground transmission line capacities are calculated in the case of N-1 for the Sar Ta Lin
– Hlwaga line.
Source: JICA survey team
Figure 6.5-15 Conceptual diagram of Underground transmission system (N-1 Sar – Hlw)
◎Results of calculation (Duct burial system)
This table shows the permissible transmission capacity for N-1 conditions in duct sections.
Table 6.5-21 Results of calculation in Duct for N-1 (Sar – Hlw)
Source: JICA survey team
Permissible transmission capacity is 622MVA per circuit in the case of N-1 (Sar Ta Lin – Hlwaga)
◎Results of calculation (Tunnel system)
This table shows the permissible transmission capacity of Sar Ta Lin (3 circuits) in the case of
N-1 conditions with an indication of the transmission capacity for the Thaketa - Hlwaga line (2
circuits), which is installed in the same tunnel as the Sar Ta Lin – Hlwaga line. Wind velocity is
2.9m/s.
Condition Permissible
transmission
capacity
(MVA/circuit)
Conductor
temperature
(Centigrade)
N-1 622 90
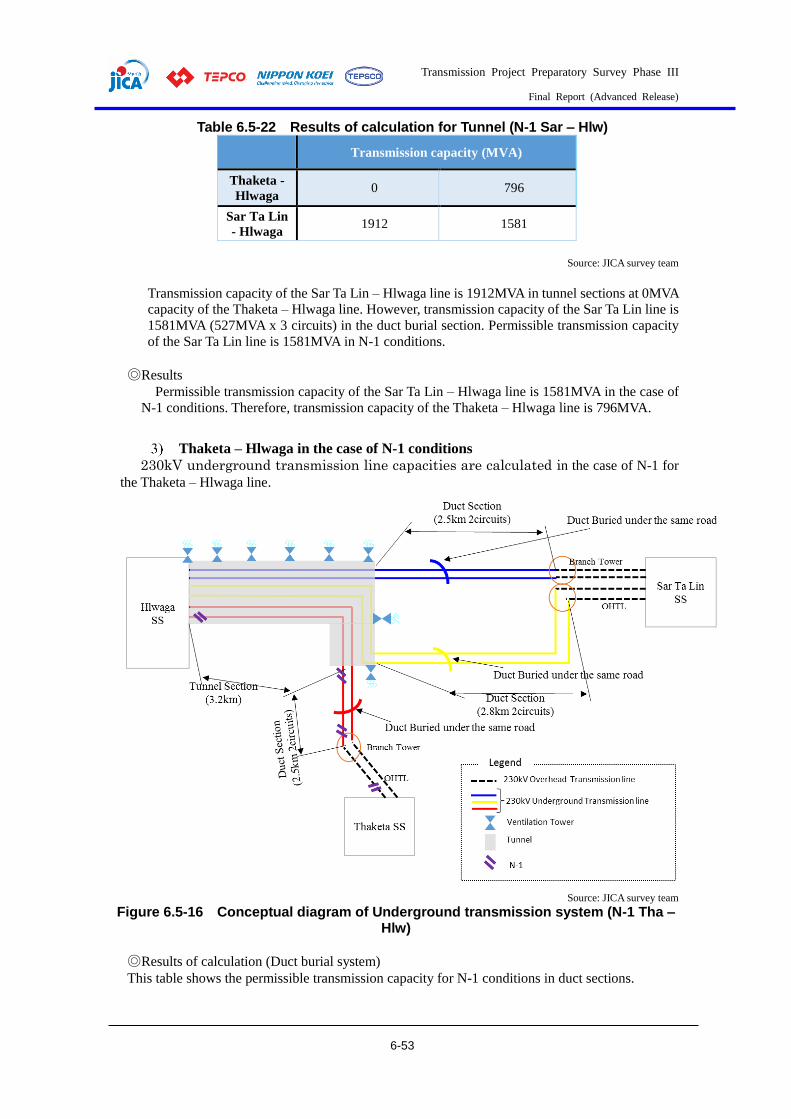
Transmission Project Preparatory Survey Phase III
Final Report (Advanced Release)
6-53
Table 6.5-22 Results of calculation for Tunnel (N-1 Sar – Hlw)
Transmission capacity (MVA)
Thaketa -
Hlwaga 0 796
Sar Ta Lin
- Hlwaga 1912 1581
Source: JICA survey team
Transmission capacity of the Sar Ta Lin – Hlwaga line is 1912MVA in tunnel sections at 0MVA
capacity of the Thaketa – Hlwaga line. However, transmission capacity of the Sar Ta Lin line is
1581MVA (527MVA x 3 circuits) in the duct burial section. Permissible transmission capacity
of the Sar Ta Lin line is 1581MVA in N-1 conditions.
◎Results
Permissible transmission capacity of the Sar Ta Lin – Hlwaga line is 1581MVA in the case of
N-1 conditions. Therefore, transmission capacity of the Thaketa – Hlwaga line is 796MVA.
Thaketa – Hlwaga in the case of N-1 conditions
230kV underground transmission line capacities are calculated in the case of N-1 for
the Thaketa – Hlwaga line.
Source: JICA survey team
Figure 6.5-16 Conceptual diagram of Underground transmission system (N-1 Tha – Hlw)
◎Results of calculation (Duct burial system)
This table shows the permissible transmission capacity for N-1 conditions in duct sections.

Transmission Project Preparatory Survey Phase III
Final Report (Advanced Release)
6-54
Table 6.5-23 Results of calculation in Duct for N-1 (Tha – Hlw)
Source: JICA survey team
Permissible transmission capacity is 622MVA per in the case of N-1 (Thaketa – Hlwaga).
◎Results of calculation (Tunnel system)
This table shows permissible transmission capacity for the tunnel system.
Permissible transmission capacity is 828MVA per circuit at maximum conductor temperature.
Table 6.5-24 Results of calculation of permissible transmission capacity for Tunnel
Source: JICA survey team
This table shows permissible transmission capacity for the Thaketa – Hlwaga line (1 circuit)
in the case of N-1 conditions, with an indication of the transmission capacity for the Sar Ta Lin
line (4 circuits), which is installed in the same tunnel as the Thaketa – Hlwaga line. Wind velocity
is 2.9m/s.
Table 6.5-25 Results of calculation for Tunnel (N-1 Tha – Hlw)
Transmission capacity (MVA)
Sar Ta Lin -
Hlwaga 1418 1492
Thaketa -
Hlwaga 828 777
Source: JICA survey team
Permissible transmission capacity for the Thaketa – Hlwaga line is 828MVA in N-1 conditions.
Then transmission capacity of the Sar Ta Lin line is 1418MVA.
◎Results
Permissible transmission capacity of the Thaketa – Hlwaga line is 828MVA in the case of N-1
conditions. Then transmission capacity of the Sar Ta Lin line is 1418MVA. The figure of 828MVA
is defined for tunnel sections. In actual fact, the permissible transmission capacity of the Thaketa
– Hlwaga line in the case of N-1 conditions is 622MVA because of the limited transmission
capacity of 622MVA in duct sections.
This figure shows the ventilation system to meet the power flow in 2030. Ventilation fans may
be required for each ventilation tower.
Condition Permissible
Transmission
Capacity
(MVA/circuit)
Conductor
temperature
(Centigrade)
N-1 622 90
Permissible
transmission capacity
(MVA/circuit)
Conductor
temperature
(Centigrade)
828 90

Transmission Project Preparatory Survey Phase III
Final Report (Advanced Release)
6-55
Figure 6.5-17 Example of ventilation system (cross section)
Source: JICA survey team
Figure 6.5-18 Example of ventilation system (plane figure)
(4) Design for short and ground fault currents The study team calculates for short and ground currents in accordance with IEC 60949. The below
two tables show the other conditions.
Table 6.5-26 Basic conditions (Short fault) for conductor
Item Unit Description Remarks
S mm2 2500 for copper conductor
θf deg. C 250 final temperature
θi deg. C 90 initial temperature
Table 6.5-27 Basic conditions (Ground fault)
for metallic sheath
Item Unit Description Remarks
S mm2 1820 for aluminum sheath
θf deg. C 150 final temperature
θi deg. C 85 initial temperature
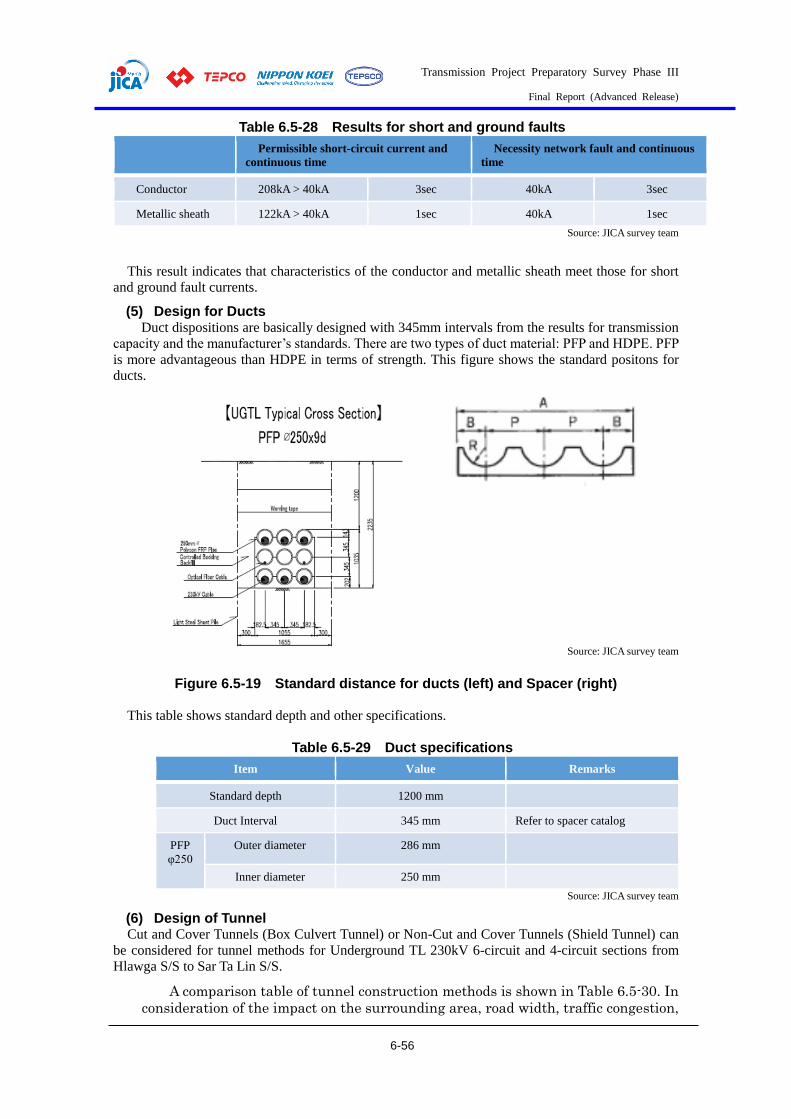
Transmission Project Preparatory Survey Phase III
Final Report (Advanced Release)
6-56
Table 6.5-28 Results for short and ground faults
Permissible short-circuit current and
continuous time
Necessity network fault and continuous
time
Conductor 208kA > 40kA 3sec 40kA 3sec
Metallic sheath 122kA > 40kA 1sec 40kA 1sec
Source: JICA survey team
This result indicates that characteristics of the conductor and metallic sheath meet those for short
and ground fault currents.
(5) Design for Ducts Duct dispositions are basically designed with 345mm intervals from the results for transmission
capacity and the manufacturer’s standards. There are two types of duct material: PFP and HDPE. PFP
is more advantageous than HDPE in terms of strength. This figure shows the standard positons for
ducts.
Source: JICA survey team
Figure 6.5-19 Standard distance for ducts (left) and Spacer (right)
This table shows standard depth and other specifications.
Table 6.5-29 Duct specifications
Item Value Remarks
Standard depth 1200 mm
Duct Interval 345 mm Refer to spacer catalog
PFP
φ250
Outer diameter 286 mm
Inner diameter 250 mm
Source: JICA survey team
(6) Design of Tunnel Cut and Cover Tunnels (Box Culvert Tunnel) or Non-Cut and Cover Tunnels (Shield Tunnel) can
be considered for tunnel methods for Underground TL 230kV 6-circuit and 4-circuit sections from
Hlawga S/S to Sar Ta Lin S/S.
A comparison table of tunnel construction methods is shown in Table 6.5-30. In
consideration of the impact on the surrounding area, road width, traffic congestion,

Transmission Project Preparatory Survey Phase III
Final Report (Advanced Release)
6-57
noise and vibrations from the 230kV 6-circuit and 4-circuit sections, Non-Cut and
Cover Tunnels (Shield Tunnel) are proposed. A cross section of a Shield Tunnel with
jointing cables in the tunnel is shown in Source: JICA survey team
Figure 6.5-20.
Table 6.5-30 Comparison table of tunnel construction methods
Source: JICA survey team
Source: JICA survey team
Figure 6.5-20 Cross section of Shield Tunnel
Per the survey results for the existing buried underground TL from Hlawga S/S to Sar Ta Lin S/S,
the following existing buried facilities were confirmed on the underground TL route. The detailed
report on existing facility investigation for the underground TL route is to be referred attached “Final
Report for Route Study and Geological Survey for Transmission Lines under The Republic of the
Union of Myanmar National Power Transmission Network Development Project - Preliminary Survey
& Site Survey for Underground Transmission line on Phase III project”.

Transmission Project Preparatory Survey Phase III
Final Report (Advanced Release)
6-58
The vicinity of Hlawga S/S
・Φ14” Gas Pipe (Steel) Depth = 6 feet; Crossing Pyay Road
・Φ30” and Φ14” Gas Pipe (Steel) Depth = 6 feet; Buried on the sidewalk of Brochan Road
Source: JICA survey team
Figure 6.5-21 Existing facilities in the vicinity of Hlaga S/S
The vicinity of the middle of Hlaga S/S and No. 3 Main Road
・Φ60” Water Pipe (Steel) Depth = 1.7m; Crossing Brochan Road
・Φ30” Gas Pipe (Steel) Depth = 0.7m; Crossing Brochan Road
・Φ30” and Φ14” Gas Pipe (Steel) Road Level; Buried on the sidewalk of Brochan Road
・Φ32” Water Pipe (HDPE) Depth?; Buried on the sidewalk of Brochan Road
・Φ24” Water Pipe (Ductile) Depth?; Buried on the sidewalk of Brochan Road
Source: JICA survey team
Figure 6.5-22 Existing facilities in the vicinity of the middle of Hlaga S/S and No. 3 Main Road
The vicinity of the intersection of Brochan Road and No. 3 Main Road
・Φ30” Gas Pipe (Steel) Depth?; Crossing No. 3 Main Road

Transmission Project Preparatory Survey Phase III
Final Report (Advanced Release)
6-59
・Φ24” Water Pipe (Ductile) Depth?; Buried on the sidewalk of Brochan Road
・Φ48” Water Pipe Depth?; Crossing Brochan Road
・Water Valve and Manholes; Buried on the sidewalk of Brochan Road
Source: JICA survey team
Figure 6.5-23 Existing facilities in the vicinity of the intersection of Brochan Road and No. 3 Main Road
The schematic longitudinal section of the Shield Tunnel is shown inSource: JICA survey team
Figure 6.5-24. The boring logs for Hlawga S/S shown in Figure 3.3-28 are adopted. The
groundwater level is estimated to be 4.1m below the ground surface, and the target soil for the Shield
Tunnel is sandy soil with an N value of about 8. The depth of tunnel is determined to be 5.0m
considering existing facilities and the impact on the ground surface due to tunnel excavation.
It will be necessary to consider the results of surveys on existing buried facilities and the results
regarding the cable installation method at the detailed design stage.
Source: JICA survey team
Figure 6.5-24 Longitudinal section of Shield Tunnel
(7) Design for Manholes
Manhole design is carried out in accordance with the permissible bending radius of cable (15D: D
is the overall diameter of cable -> around 2300mm). This figure shows a Manhole for a cable joint of
2 circuits and 6 circuits.
Manhole for 2 circuits: length 12.5(m) height 3.4(m) width: 2.1(m)
Manhole for 6 circuits: length 15(m) height 5.7(m) width: 2.5(m)

Transmission Project Preparatory Survey Phase III
Final Report (Advanced Release)
6-60
A cable joint is fabricated in each manhole in each section of ducts (2 circuits).
Source: JICA survey team
Figure 6.5-25 Standard type of manhole (2 circuits)
Source: JICA survey team
Figure 6.5-26 Standard type of manhole (6 circuits)
The tunnel for 6 circuits is built using the shield method. A cable joint is fabricated in a tunnel (6
circuits).
Source: JICA survey team
Figure 6.5-27 Cable joint in Tunnel
Joint Box
Around 130m/3 circuits

Transmission Project Preparatory Survey Phase III
Final Report (Advanced Release)
6-61
Figure 6.5-28 Cable joint in tunnel (cross section)
(8) Overall construction schedule for transmission line This figure shows a tentative schedule for civil and cable work. Civil construction is the first step.
Cable installations are implemented after civil work for the section of duct as soon as possible. Then,
cable installations in the tunnel are implemented after the civil work for the shield tunnel.
Source: JICA survey team
Figure 6.5-29 Overall construction schedule for cable
Source: JICA survey team
Figure 6.5-30 Overall construction schedule for civil work
Joint Box for 1
Phase
(Month)
Item 1 2 3 4 5 6 7 8 9 10 11 12 13 14 15 16 17 18 19 20 21 22 23 24 25 26 27 28
Civil work
Survey and Design
Preparation for work
Installation for cable (Duct) 3teams
Fabrication for cable joint(Duct) 1team/circuit
Inatallation(Tunnel) 3teams
Fabrication for cable joint(Duct) 1team/circuit
Incidential work
Final site test
(month)
Item 1 2 3 4 5 6 7 8 9 10 11 12 13 14 15 16 17 18 19 20 21 22 23 24
Design
Preparation for work
Starting Shaft1
Starting Shaft2
Arriving Shaft1
①Shield Tunnel (2.3km)
②Shield Tunnel0 (0.9km)
Ventolaton Tower
Cable work
Restoratiojn for road
BuildingBuilding
Building
shoring
shoring
shoring

Transmission Project Preparatory Survey Phase III
Final Report (Advanced Release)
6-62
6.6. Substations
General The JICA Survey Team has visited the candidate substation sites and confirmed the availability and
technical viability of the new constructions and extensions, and carried out basic designs for each
substation as described in the subsequent sections.
Design Concepts The following concepts shall be applied to the design of substations to maximize their functions:
(1) General Concept Daily operation and maintenance (O&M) shall be performed safely and in accordance with
approved procedures.
The connection shall be made as simple as possible without affecting the required
performance from installed substation equipment.
If a fault occurs in a substation, the extent of the fault’s impact shall be kept to a minimum,
and the necessary switching operation for shifting loads to other substations shall be
performed immediately, without delay or trouble.
Design considerations must include facilitating future reinforcement and/or augmentation,
when necessary.
Design must be technically and economically feasible.
(2) Type of Substation The standard substation in Myanmar is, in principle, an outdoor type with conventional equipment.
An outdoor type substation is a substation with major facilities, such as main transformers, switchgear
instruments, etc. installed in the open air.
Other options for switchgear are gas-insulated switchgear (GIS) or Hybrid gas-insulated switchgear
(H-GIS). A GIS system requires only 15% of the space necessary for an air-insulated switchgear (AIS)
system, and an H-GIS system, to be applied to Pharyargyii substation in Phase 2, requires 70%. The
costs for the GIS system and buildings, however, are twice those of the AIS system. The GIS system
is mostly suitable for areas with space constraints, such as city centers, industrial areas, etc. or areas
with high air pollution levels.
The basic design considers AIS systems for outdoor, as well as GIS or H-GIS systems depending
on installation requirements and site conditions.
(3) Busbar Arrangement Currently, a one and a half circuit breaker arrangement for 500 kV switchgear and
double busbar arrangement for 230 kV switchgear are employed for the substation
systems in Myanmar, including the Phase 2 project. Therefore, the busbar arrangement
shall be carefully decided considering the following:
- Existing busbar arrangement (in case of extension)
- Supply reliability and security
- Operational performance and flexibility
- Capital costs
- Maintenance and repair requirements
- Space requirements Source: JICA SURVEY TEAM
Figure 6.6-1 One and a Half CB Arrangement
(4) Main Transformers The main transformers which will be installed in the new 500 kV substation are of an
oil-immersed type with on-load tap changer. Three units with single phase transformer (auto
transformer) and with star-star-delta (Y-Y-Δ) winding connections are applied for the main
transformers. Natural oil circulation and natural air cooling (ONAN) conventions and/or a natural oil
circulation and forced air cooling (ONAF) system is applied for the cooling system of the main
transformers.
The unit capacity and number of units of main transformers in a substation are determined
DS
CB
DS
DS
CB
DS
DS
CB
DS
Busbar #1
Busbar #2

Transmission Project Preparatory Survey Phase III
Final Report (Advanced Release)
6-63
comprehensively taking into account the results of the system analysis in Chapter 1.
(5) Short-Circuit Fault Current Capacity Short-circuit fault current capacity for substation facilities will be determined via the results of the
system analysis. However, in the case of expansion of an existing substation, the rated short-circuit
fault current shall be the same as that of the existing substation or the transmission feeder of the
connected substation.
(6) Transmission Line Protection Protection relays for 500 kV and 230 kV transmission lines are designed with dual protection in
accordance with existing facilities in Myanmar, as follows:
500 kV Transmission Line Protection
Main Protection 1 : Differential Relay (87)
Main Protection 2 : Distance Protection (21)
Back-up Protection : Overcurrent and ground fault protection (50/51N)
230 kV Transmission Line Protection
Main Protection 1 : Differential Relay (87)
Main Protection 2 : Distance Protection (21)
Back-up Protection : Overcurrent and ground fault protection (50/51N)
(7) Control Equipment We understand that there is a vision to collect all data/information from power plants and substations
in Myanmar at the National Control Center (NCC) located in Nay Pyi Taw, and there is a guiding
principle that the equipment for collecting data/information shall be based on IEC 61850. Under these
circumstances, we will propose to configure the Substation Automation System (SAS) based on IEC
61850 after careful confirmation of the intentions and planning by the Myanmar side.
Source: JICA Survey Team
Figure 6.6-2 System Configuration of Substation based on IEC 61850
(8) Tele-protection system Optical telecommunication via OPGW for the main system and Power Line Communication (PLC)
as a back-up system are used in Myanmar. Therefore, the telecommunication system in this Project is
basically an Optical telecommunication system with OPGW, and a PLC system will also be considered,
if necessary.
(9) Other Concepts 1) Earthing system
In the switchyard of the new substation, an underground earthing system should be properly laid in
the form of a meshed grid. In the case of extension of an existing substation, the new earthing system
should connected the existing system.
Station Level Control
Bay Level Control
Process Level Control
Ethernet Switch
ICU
VT CT
MU
VT CTCB
ICU
CB
IEDBay Controller IED IEDBay Controller IED
SCADA CPU GatewayWork
StationNCC
InternetSystem Configuration of
SCADA Based on IEC61850
- Pos s ib le to a c hi ev e th e
u n i f i e d p r o te c t i o n o f e a c h
substation in NCC by digitalizing
all signals from facility level in
substation to high-order system.
- Easy interface because all
signals including measured value
and communication between all
devices are connected in digital
telecommunication network
IED: Intelligent Electronic Device
MD: Merging Unit
ICU: Intelligent Control Unit
CB: Circuit Breaker
CT: Current Transformer
VT: Voltage Transformer
Ethernet Switch
MU
IEC61850 Process Bus
IEC61850 Station Bus

Transmission Project Preparatory Survey Phase III
Final Report (Advanced Release)
6-64
All equipment installed in a substation should be connected to an earthing system effectively.
Resistance of the earthing system shall be designed based on IEEE 80.
2) Countermeasures for disasters
i) Dust Pollution
For substations constructed in areas affected by dust contamination, appropriate countermeasures
shall be taken into account in the design based on the level of pollution.
ii) Lightning
For the protection of substation equipment from lightning, appropriate measures shall be taken in
the design of the substation to achieve the required network reliability and site-specific conditions.
iii) Fire
Appropriate measures shall be taken to protect operators and equipment from fire or explosions
and, in the worst situations, to localize the fire to within a limited area.
iv) Earthquakes
The effect of earthquakes will be considered in the basic design of substations.
3) Considerations for environment
i) Noise
Include in the planning of a substation, which is to be newly constructed or expanded, necessary
measures to limit noise to within reasonable levels.
ii) Vibration
Include in the planning of a substation, which is to be constructed or expanded, necessary
measures to limit the vibration levels in the substation to within the country-recognized standard
values.
iii) Harmony with environment
For a substation that is to be constructed or expanded, special attention should be given to the
protection of the natural environment in the surrounding areas, and to the presentation of the living
environment, such as sunshine, scenery, radio interference, etc., as well as harmony with the regional
community.
Design Criteria
(1) Applicable Standards The design, materials, manufacture, testing, inspection and performance of all electrical and
electromechanical equipment shall comply with the latest revision of the International Electrotechnical
Commission Standards (IEC), as listed below:
IEC 60044-1 Instrument transformers – Part 1: Current transformers
IEC 60044-1 Instrument transformers – Part 5: Capacitor voltage transformers
IEC 60071 Insulation coordination
IEC 60076 Power transformers
IEC 60099-4 Surge arresters – Part 4: Metal-oxide surge arresters without gaps for a.c.
systems
IEC 60265-2 High-voltage switches – Part 2: High-voltage switches for rated voltage of
52 kV and above
IEC 60694 Common specifications for high-voltage switchgear and control gear
standards
IEC 61850 Communication network and systems in substations
IEC 62271-100 High-voltage switchgear and control gear – Part 100: High-voltage
alternative-current circuit breakers
IEC 62271-102 High-voltage switchgear and control gear – Part 102: Alternative-current
disconnectors and earthing switch
IEC 62271-203 High-voltage switchgear and control gear – Part 203: Gas-insulated metal
-enclosed switchgear for rated voltage above 52 kV
In cases where IEC standards are not applicable to the conditions, international standards such as
ANSI, ASTM, BS, JIS, JEC and JEM will be applied.
(2) Insulation Co-ordination Insulation co-ordination for the design of 500 kV, 230 kV, 66 kV and 33 kV equipment are as

Transmission Project Preparatory Survey Phase III
Final Report (Advanced Release)
6-65
follows:
(1) Nominal system voltage 500 kV 230 kV 66 kV 33 kV
(2) Rated voltage (Highest voltage) 525 kV 245 kV 69 kV 36 kV
(3) Rated frequency 50 Hz 50 Hz 50 Hz 50 Hz
(4) Insulation levels
Rated short-duration power
frequency withstand voltage
(r.m.s)
80 kV
Rated lightning impulse
withstand voltage (peak value)
1,550 kV 750 kV 350 kV 195 kV
Minimum clearance of phase-to-
earth
4,100 mm 2,100 mm 700 mm 400 mm
Standard clearance of phase-to-
earth
8,000 mm 2,600 mm 1,000 mm 500 mm
Minimum clearance of phase-to-
phase
5,400 mm 3,000 mm 1,100 mm 600 mm
Standard clearance of phase-to-
phase
8,000 mm 4,000 mm 1,500 mm 900 mm
Sar Ta Lin New 500 kV Substation
(1) Location and Current Situation As described in Chapter 2.6, Sar Ta Lin substation will be constructed at latitude 17° 03’ 50” north
and longitude 96° 17’ 28” east on the northern side of the YCDC area. The location map of the new
Sar Ta Lin 500 kV substation is referred to in Figure 2.6-1 and Figure 4.2-4.
Although the land acquisition will be conducted on the initiative of DPTSC, the current situation of
the land is a farm, as shown in the following pictures:
Source: JICA Survey Team
Figure 6.6-3 Photos of Planned Location for Construction of Sar Ta Lin Substation
(2) Scope of Work for the Project The JICA Study Team carried out a site survey and basic design for construction of the new 500 kV
substation considering future expansion and augmentation of the substation.
(3) Busbar Arrangement and Layout 1) Busbar Arrangement
Since the new Sar Ta Lin 500 kV substation will play a significant role in supplying power to
Yangon City, the configuration of the 500 kV switchgear, as a backbone facility, must be reliable.
Therefore, the JICA Survey Team adopted a one and a half circuit breaker arrangement, the same as
the Pharyargyii substation. As for 230 kV switchgear, a double busbar arrangement is adopted
considering expandability and reliability.
2) Layout
In order to avoid influence on surrounding residences, Sar Ta Lin Substation will be constructed

Transmission Project Preparatory Survey Phase III
Final Report (Advanced Release)
6-66
within land of approx. 530 m x 450 m, as shown in Annexure-6-4-2.
(4) Equipment Procurement and Quantities In this Project, 500 kV switchgear with eight bays of transmission line, three bays of main
transformer having a capacity of 500 MVA per each unit, two bays of 500 kV shunt reactors and 230
kV switchgears with eight bays of transmission lines, three bays of transformers and bus coupler bays
are to be installed in Sar Ta Lin new 500 kV substation. The drawings in Appendix 6-4-1 show the
basic design of new 500 kV substation.
- DWG No. MY-TLP3-NS-SLD_01 Single Line Diagram (Appendix 6-4-1)
1) 500 kV Substation Facility
i) Ten units, including spares for 500/230/33 kV, 166.7 MVA and single-phase main
transformer with on-load tap changer (OLTC)
ii) Two units of 500 kV shunt reactor, 100 MVar
iii) 500 kV switchgear in one and a half circuit breaker arrangement
The 500 kV switchgear in one and a half circuit breaker scheme includes eight (8) transmission
line bays and three (3) transformer bays
- 500 kV GCB 24 sets
- 500 kV DS/ES 60 sets
- 500 kV CT 60 sets
- 500 kV VT 13 sets
- 500 kV CVT 8 sets
- 420 kV SA 12 sets
- Line trap 16 sets
- 500 kV busbar 1 lot (One and a Half CB arrangement)
The associated gantry structures for the above system shall be supplied and installed.
The associated steel support structures and foundations for the above equipment with all
necessary connecting materials shall be supplied and installed.
The connection work between the dead-end towers, associated gantry structures and the
above equipment shall be carried out and all necessary materials for the work such as power
conductors, tension insulator sets, fittings, post insulators, connectors, accessories, power and
control cables, etc. shall be supplied and installed.
The above equipment shall be properly earthed with underground earthing mesh and all
necessary materials such as earthing conductors shall be supplied.
2) 230 kV Switchgear
i) 230 kV double busbar scheme switchgear
The 230 kV double busbar scheme includes eight (8) transmission line bays, three (3) transformer
bays and one (1) bus coupler bay.
- 230 kV GCB 12 sets
- 230 kV DS/ES 11 sets
- 230 kV DS 22 sets
- 230 kV CT 12 sets
- 230 kV CVT 13 sets
- 196 kV SA 11 sets
- Line trap 16 sets
- 230 kV busbar 1 lot (Double busbar scheme)
The associated gantry structures for the above system shall be supplied and installed.
The associated steel support structures and foundations for the above equipment with all
necessary connecting materials shall be supplied and installed.
The connection work between the dead-end towers, associated gantry structures and the
above equipment shall be carried out and all necessary materials for the work such as power
conductors, tension insulator sets, fittings, post insulators, connectors, accessories, power and
control cables, etc. shall be supplied and installed.
The above equipment shall be properly earthed with underground earthing mesh and all
necessary materials such as earthing conductors shall be supplied.
3) Installation of Control and Protection panels
Transmission Project Preparatory Survey Phase III
Final Report (Advanced Release)
6-67
Protection relay panel
- Main transformer protection relay panel 3 panels
- 500 kV shunt reactor protection relay panel 2 panels
- 500 kV transmission line protection relay panels 8 panels
- 500 kV busbar protection relay panels 2 panels
- 230 kV transmission line protection relay panels 8 panels
- 230 kV busbar protection relay panels 2 panels
Control panel
- Main transformer primary side control panel 3 panels
- Main transformer OLTC panels 3 panels
- 500 kV shunt reactor control panel 2 panels
- 500 kV transmission line control and synchronizing panel 8 panels
- 230 kV transmission line control and synchronizing panel 8 panels
SCADA (SAS)
- Remote control and monitoring system 1 lot
The associated power and control cables with necessary accessories shall be supplied and
installed.
All necessary meters including ammeters, voltmeters and watt-hour meters, etc. shall be
supplied and installed.
SCADA system shall be designed with control, monitoring and measuring of 500 and 230 kV
switchyard, 500/230/33 kV main transformers, 500 kV shunt reactors and 33 kV switchgear
4) Installation of communication equipment
The following optical-fiber telecommunication equipment shall be supplied and installed.
- Optical distribution frame (ODF) for connection and 24 core optical fiber cable
- Patch cables connecting ODF with synchronous transport module -1 (STM-1) and
multiplexer
- Supply STM-1 and multiplexer with multi channels of not less than 2 Mbit/s interface.
- Optical fiber splicing boxes (i.e., for termination of OPGW on the steel gantry structure in
the substation)
5) Miscellaneous electrical equipment
- Indoor type 500 kVA auto start module type diesel generator set with associated
switchgear, power cables and fuel tank
- 400 V AC distribution switchboard equipped with double-throw breaker including
necessary cables and accessories
- 110 V DC system including two sets of 110 kV battery banks, two sets of chargers, and
one set of distribution boards
- 50 V DC system including two sets of 50 V batteries, two sets of chargers, and one set of
distribution board
- Earthing system covering the new substation area including earthing rods, conductors, etc.
- Overhead substation shield wire system including shield wires and supporting structures
for protection against lightning
- Outdoor substation lighting system
6) Civil and building work
The associated civil and building work for the above work shall be carried out as follows:
- Cleaning, cutting, filling, leveling and compacting of the new substation area
- Excavation and backfilling as required
- Gravelling of the complete additional substation area
- Construction of external security fences
- Construction of station service road
- Construction of gantries for 500 kV and 230 kV switchyards
- Construction of steel structures and equipment support
- Construction of concrete foundations for all equipment
- Construction of oil pit from main transformers and shunt reactors
- Construction of drainage pit and conduit
- Construction of cable pit

Transmission Project Preparatory Survey Phase III
Final Report (Advanced Release)
6-68
- Construction of a complete substation control building with control room, 33 kV cubicle
room, office, workshop, storage room, battery room, kitchen, toilet, etc.
- Construction of guard house for security personnel beside the main gate
- Supply and installation of air conditioning and ventilation equipment for the substation
building
- Supply and installation of water well and storage facility and wastewater and septic tank
facility
- Supply and installation of firefighting equipment associated with air conditioning system
for the control building
- All necessary materials for the above work such as concrete, aggregate, reinforcements,
accessories, etc. shall be supplied.
6) Other work
- Spare parts for at least 5 years of operation
- Tools and erection accessories as required
- Complete documentation for operation and maintenance
- Training for DPTSC staff at manufacturer’s factory and at site
(5) Specifications of Major Equipment 1) 500/230/33 kV Main transformer
i) Type
Single-phase, oil-immersed type, outdoor and ONAN/ONAF cooling type with on-load-tap
changing device, designed in accordance with IEC 60076 and 60289.
ii) Ratings Rated power 166.7 MVA (ONAN/ONAF)
Rated frequency 50 Hz
Rated voltage ratio 500/230/33 kV
Vector group notation YNa0d11
Short circuit impedance About 12.0 %
Rated insulation level HV LV
a) Rated short-duration power-frequency withstand voltage (r.m.s.
value) 750 kV 395 kV
b) Rated lightning impulse withstand voltage (peak value) 1,550 kV 750 kV
iii) On-load tap changing equipment (OLTC)
- Step: ±8 x 1.25 %
- Number of taps: 17 taps
2) 500 kV Shunt Reactor
i) Type
Three-phase, oil-immersed type, outdoor and ONAN cooling type shall be designed in accordance
with IEC 60076 and 60289.
ii) Ratings Rated voltage 500 kV
Rated 100 MVA
Rated frequency 50 Hz
Rated insulation level at HV side (LI&PF)/current To be determined in Final Report
3) Gas Insulated Switchgear
i) Type
The GIS or H-GIS shall be metal-enclosed, three-phase busbar and switchgear type, for outdoor
use, and filled with SF6 insulation gas.
ii) Circuit breaker Rated voltage 500 kV
Rated main busbar normal current 6,000 A
Rated feeder normal current 2,500 A
Rated frequency 50 Hz
Rated short-circuit breaking current 40 kA, 1 sec.
Rated interrupting time less than or equal to 3 cycle

Transmission Project Preparatory Survey Phase III
Final Report (Advanced Release)
6-69
Rated operating sequence O - 0.3 sec. - CO - 3 min. - CO
Rated closing operation voltage DC 110 V
Rated control voltage DC 110 V
Rated insulation level
a) Rated short-duration power-frequency withstand voltage (r.m.s.
value) 750 kV
b) Rated lightning impulse withstand voltage (peak value) 1,550 kV
The circuit breakers shall be suitable for single-pole tripping and rapid auto-reclosing, provided
with a motor-operated spring mechanism, and shall comply with the related IEC
standards/recommendations.
The circuit breakers shall be equipped with an operation mechanism for DC and the mechanism
shall ensure uniform and positive closing and opening.
iii) Disconnectors and earthing switches Rated voltage 500 kV
Rated normal current 2,500 A
Rated frequency 50 Hz
Rated short-circuit withstand current 40 kA, 1 sec.
Rated control voltage DC 110 C
Rated insulation level
a) Rated short-duration power-frequency withstand voltage (r.m.s.
value) 750 kV
b) Rated lightning impulse withstand voltage (peak value) 1,550 kV
The disconnectors and earthing switch shall both be motor-operated and provided with a manual
operating mechanism.
Motor-operated disconnectors and earthing switch shall be designed with three-pole operation and
the motor shall be operated on DC auxiliary power.
iv) Current transformer Highest system voltage 525 kV
Rated frequency 50 Hz
Rated insulation level
a) Rated short-duration power-frequency withstand voltage (r.m.s.
value) 750 kV
b) Rated lightning impulse withstand voltage (peak value) 1,550 kV
Rated current ratio
2,500-1,250 A : 1 A(TL and
busbar)
1,000A : 1A (SS)
Accuracy classes 5P20 for protection, Class 0.2 for
metering
v) Voltage transformer Highest system voltage 525 kV
Rated frequency 50 Hz
Voltage ratio 500 𝑘𝑉
√3:110 𝑉
√3:110 𝑉
√3
Accuracy classes 3P+0.5
Rated insulation level
a) Rated short-duration power-frequency withstand voltage (r.m.s.
value) 750 kV
b) Rated lightning impulse withstand voltage (peak value) 1,550 kV
4) Air Insulated Switchgear
i) Circuit breaker
The 230 kV circuit breakers shall be SF6 gas type, with three-pole collective arrangement and for
outdoor use. The circuit breakers shall be suitable for single-pole tripping and rapid auto-reclosing,
provided with a motor-operated spring mechanism, and shall comply with the related IEC
standards/recommendations. Rated voltage 230 kV
Rated feeder normal current 2,000 A
Rated frequency 50 Hz
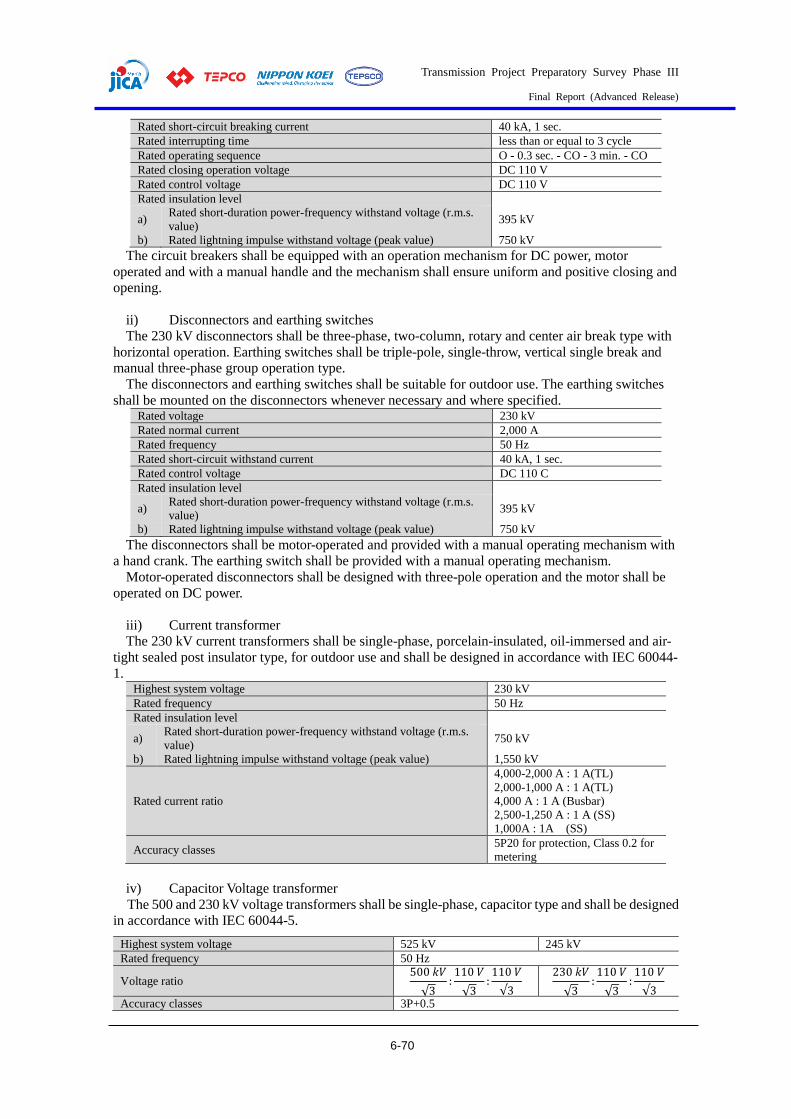
Transmission Project Preparatory Survey Phase III
Final Report (Advanced Release)
6-70
Rated short-circuit breaking current 40 kA, 1 sec.
Rated interrupting time less than or equal to 3 cycle
Rated operating sequence O - 0.3 sec. - CO - 3 min. - CO
Rated closing operation voltage DC 110 V
Rated control voltage DC 110 V
Rated insulation level
a) Rated short-duration power-frequency withstand voltage (r.m.s.
value) 395 kV
b) Rated lightning impulse withstand voltage (peak value) 750 kV
The circuit breakers shall be equipped with an operation mechanism for DC power, motor
operated and with a manual handle and the mechanism shall ensure uniform and positive closing and
opening.
ii) Disconnectors and earthing switches
The 230 kV disconnectors shall be three-phase, two-column, rotary and center air break type with
horizontal operation. Earthing switches shall be triple-pole, single-throw, vertical single break and
manual three-phase group operation type.
The disconnectors and earthing switches shall be suitable for outdoor use. The earthing switches
shall be mounted on the disconnectors whenever necessary and where specified. Rated voltage 230 kV
Rated normal current 2,000 A
Rated frequency 50 Hz
Rated short-circuit withstand current 40 kA, 1 sec.
Rated control voltage DC 110 C
Rated insulation level
a) Rated short-duration power-frequency withstand voltage (r.m.s.
value) 395 kV
b) Rated lightning impulse withstand voltage (peak value) 750 kV
The disconnectors shall be motor-operated and provided with a manual operating mechanism with
a hand crank. The earthing switch shall be provided with a manual operating mechanism.
Motor-operated disconnectors shall be designed with three-pole operation and the motor shall be
operated on DC power.
iii) Current transformer
The 230 kV current transformers shall be single-phase, porcelain-insulated, oil-immersed and air-
tight sealed post insulator type, for outdoor use and shall be designed in accordance with IEC 60044-
1. Highest system voltage 230 kV
Rated frequency 50 Hz
Rated insulation level
a) Rated short-duration power-frequency withstand voltage (r.m.s.
value) 750 kV
b) Rated lightning impulse withstand voltage (peak value) 1,550 kV
Rated current ratio
4,000-2,000 A : 1 A(TL)
2,000-1,000 A : 1 A(TL)
4,000 A : 1 A (Busbar)
2,500-1,250 A : 1 A (SS)
1,000A : 1A (SS)
Accuracy classes 5P20 for protection, Class 0.2 for
metering
iv) Capacitor Voltage transformer
The 500 and 230 kV voltage transformers shall be single-phase, capacitor type and shall be designed
in accordance with IEC 60044-5.
Highest system voltage 525 kV 245 kV
Rated frequency 50 Hz
Voltage ratio 500 𝑘𝑉
√3:110 𝑉
√3:110 𝑉
√3
230 𝑘𝑉
√3:110 𝑉
√3:110 𝑉
√3
Accuracy classes 3P+0.5

Transmission Project Preparatory Survey Phase III
Final Report (Advanced Release)
6-71
Rated insulation level
a) Rated short-duration power-frequency withstand
voltage (r.m.s. value) 750 kV 395 kV
b) Rated lightning impulse withstand voltage (peak
value) 1,550 kV 750 kV
v) Surge Arresters
The 420 and 196 kV surge arresters shall be gapless, metal-oxide, outdoor and heavy duty type.
The arresters shall be designed in accordance with IEC 60099-4.
Rated voltage (r.m.s. value) 420 kV 196 kV
Rated frequency 50 Hz
Nominal discharge current 10 kA 10 kA
Long-duration discharge class Class 3 (Table-5, IEC 60099-4)
Pressure-relief current 40 kA
Rated insulation levels for insulators
a) Rated short-duration power-frequency
withstand voltage (r.m.s. value) 750 kV 395 kV
b) Rated lightning impulse withstand voltage
(peak value) 1,550 kV 750 kV
East Dagon Substation
(1) Location and Current Situation 1) Location
As shown in the following figure, the East Dagon S/S is located at latitude 16° 57’ 02” north and
longitude 96° 16’ 43” east in the East Dagon Township of Yangon City.
Source: JICA Survey Team by using Google Earth
Figure 6.6-4 Location Map of East Dagon Substation
2) Current situation
The East Dagon substation has been operating since 2016 and consists of the following
equipment:
230 kV Gas insulated switchgear (Manufacturer: Hyundai)

Transmission Project Preparatory Survey Phase III
Final Report (Advanced Release)
6-72
Double busbar scheme
Two (2) transmission line bays to Thaketa substation and Thanlyin substation, one
circuit for each
Two (2) transformer bays
Bus coupler
Two (2) sets of 230/66/11 kV main transformers (Manufacturer: Hyundai)
Rated capacity: 125 MVA
OLTC: 17 taps
Cooling method: ONAF/ONAN
Impedance: 12.328 %
66 kV Gas insulated switchgear (Manufacturer: Hyundai)
Double busbar scheme
Eight (8) transmission line bays
Two (2) transformer bays
Bus coupler
11 kV switchgear
Station service facilities
Source: JICA Survey Team
Figure 6.6-5 Photos of Current East Dagon Substation
The arrangement of control and protection panels for 230 and 66 kV switchgear in the control
room is shown in Figure 6.6-6 below. After examination, the JICA Survey Team confirmed that there
is enough space for installation of additional panels in the case of expansion of switchgear in the
Project.
Source: JICA Survey Team
Figure 6.6-6 Layout of Control Room in East Dagon Substation
6
5
4
3
2
1
12
11
10
9
8
7
18
17
16
15
14
13
20
19
21
24
23
22
11,800
8,53
0
800
800
800
800
800
800
800
800
800
800
800
800
830 830 830
800
800
800
600
600
600
800
800
1,02
0
2,000
2,63
0
2,63
0
Panel List:1. 230/66/11 kV Transformer No.2 Control & Protection Panel2. 230 kV Transmission Line No.2 (Tharketa) Control & Protection Panel 3. 230 kV Bus Coupler Control & Protection Panel4. 230 kV Transmission Line No.1 (Thanlyin) Control & Protection Panel5. 230/66/11 kV Transformer No.2 Control & Protection Panel6. 230 kV Busbar Differential Protection Panel
7. 66 kV Transmission Line Control & Protection Panel No.88. 66 kV Transmission Line Control & Protection Panel No.79. 66kV Transformer Control & Protection Panel No.210. 66 kV Transmission Line Control & Protection Panel No.611. 66 kV Transmission Line Control & Protection Panel No.512. 66kV Bus Coupler Control & Protection Panel13. 66 kV Transmission Line Control & Protection Panel No.414. 66 kV Transmission Line Control & Protection Panel No.315. 66kV Transformer Control & Protection Panel No.116. 66 kV Transmission Line Control & Protection Panel No.217. 66 kV Transmission Line Control & Protection Panel No.118. 66kV Busbar Differential Protection Panel
19. Remote Control Panel No.220. Remote Control Panel No.121. Under Frequency Protection Panel22. Central Processing Module23. East Dagon S/S Fault Recording System No.124. East Dagon S/S Fault Recording System No.2
:Available Space for Panel Installation in Phase 3
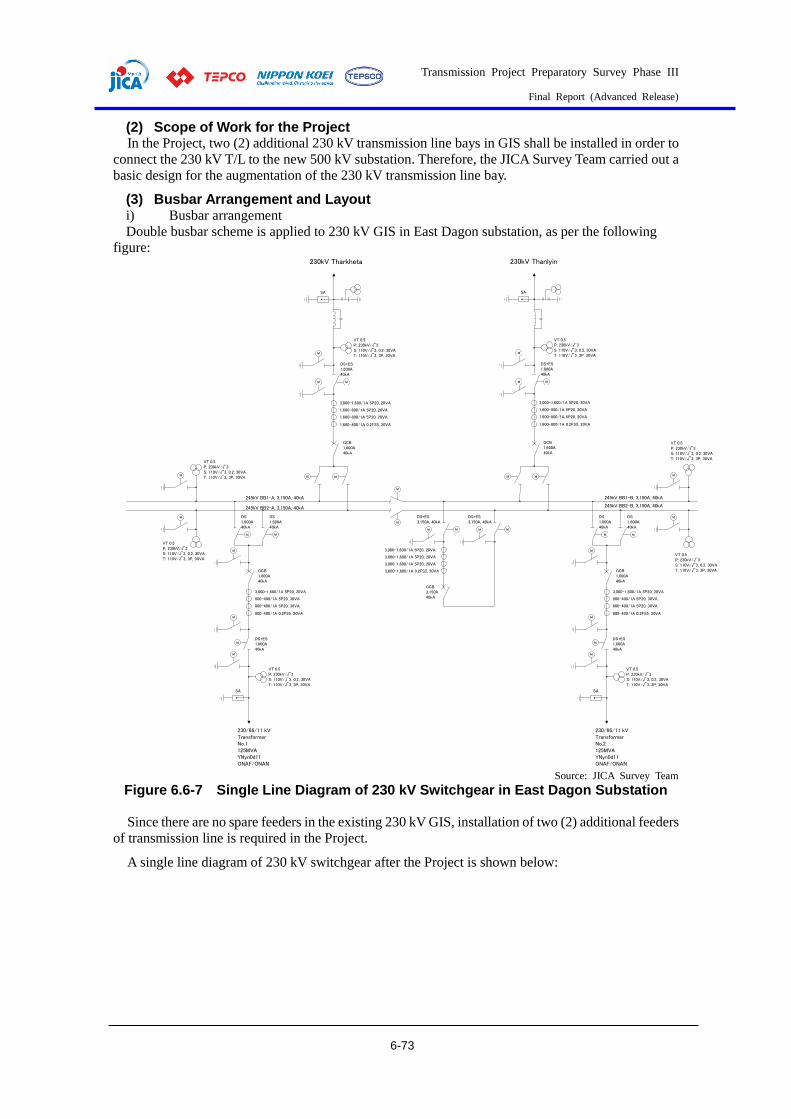
Transmission Project Preparatory Survey Phase III
Final Report (Advanced Release)
6-73
(2) Scope of Work for the Project In the Project, two (2) additional 230 kV transmission line bays in GIS shall be installed in order to
connect the 230 kV T/L to the new 500 kV substation. Therefore, the JICA Survey Team carried out a
basic design for the augmentation of the 230 kV transmission line bay.
(3) Busbar Arrangement and Layout i) Busbar arrangement
Double busbar scheme is applied to 230 kV GIS in East Dagon substation, as per the following
figure:
Source: JICA Survey Team
Figure 6.6-7 Single Line Diagram of 230 kV Switchgear in East Dagon Substation
Since there are no spare feeders in the existing 230 kV GIS, installation of two (2) additional feeders
of transmission line is required in the Project.
A single line diagram of 230 kV switchgear after the Project is shown below:
M
DS1,600A40kA
M
DS1,600A40kA
GCB 1,600A 40kA
800-400/1A 5P20, 30VA
800-400/1A 0.2FS5, 20VA
800-400/1A 5P20, 30VA
3,000-1,600/1A 5P20, 20VA
M
M
M
DS+ES3,150A, 40kA
M
GCB 3,150A 40kA
230/66/11 kV Transformer No.2125MVAYNyn0d11ONAF/ONAN
MDS+ES1,600A40kA
M
VT 0.5P: 230kV/ 3S: 110V/ 3, 0.2, 30VAT: 110V/ 3, 3P, 30VA
SA
M
DS1,600A40kA
M
DS1,600A40kA
GCB 1,600A 40kA
800-400/1A 5P20, 30VA
800-400/1A 0.2FS5, 20VA
800-400/1A 5P20, 30VA
3,000-1,600/1A 5P20, 20VA
M
M
230/66/11 kV Transformer No.1125MVAYNyn0d11ONAF/ONAN
MDS+ES1,600A40kA
M
VT 0.5P: 230kV/ 3S: 110V/ 3, 0.2, 30VAT: 110V/ 3, 3P, 30VA
SA
3,000-1,600/1A 5P20, 20VA
3,000-1,600/1A 5P20, 20VA
3,000-1,600/1A 5P20, 20VA
3,000-1,600/1A 0.2FS5, 20VA
M
DS+ES3,150A, 40kA
M
M M
GCB 1,600A 40kA
1,600-800/1A 5P20, 20VA
1,600-800/1A 0.2FS5, 20VA
1,600-800/1A 5P20, 20VA
3,000-1,600/1A 5P20, 20VA
M
DS+ES1,600A40kA
M
M
VT 0.5P: 230kV/ 3S: 110V/ 3, 0.2, 30VAT: 110V/ 3, 3P, 30VA
SA
230kV Tharkheta
M M
GCB 1,600A 40kA
M
DS+ES1,600A40kA
M
M
VT 0.5P: 230kV/ 3S: 110V/ 3, 0.2, 30VAT: 110V/ 3, 3P, 30VA
SA
230kV Thanlyin
1,600-800/1A 5P20, 20VA
1,600-800/1A 0.2FS5, 20VA
1,600-800/1A 5P20, 20VA
3,000-1,600/1A 5P20, 20VA
245kV BB1-A, 3,150A, 40kA
245kV BB2-A, 3,150A, 40kA
M
M
M
M
VT 0.5P: 230kV/ 3S: 110V/ 3, 0.2, 30VAT: 110V/ 3, 3P, 30VA
VT 0.5P: 230kV/ 3S: 110V/ 3, 0.2, 30VAT: 110V/ 3, 3P, 30VA
M
M
VT 0.5P: 230kV/ 3S: 110V/ 3, 0.2, 30VAT: 110V/ 3, 3P, 30VA
VT 0.5P: 230kV/ 3S: 110V/ 3, 0.2, 30VAT: 110V/ 3, 3P, 30VA
245kV BB1-B, 3,150A, 40kA
245kV BB2-B, 3,150A, 40kA

Transmission Project Preparatory Survey Phase III
Final Report (Advanced Release)
6-74
Source: JICA Survey Team
Figure 6.6-8 Single Line Diagram of 230 kV Switchgear in East Dagon Substation After the Project
2) Layout
There is unused space of approx. 30 m at the east side of the existing 230 kV GIS, as per the
following figure. This is sufficient to install four (4) additional GIS feeders including spares for the
Project.
M
DS1,600A40kA
M
DS1,600A40kA
GCB 1,600A 40kA
800-400/1A 5P20, 30VA
800-400/1A 0.2FS5, 20VA
800-400/1A 5P20, 30VA
3,000-1,600/1A 5P20, 20VA
M
M
M
DS+ES3,150A, 40kA
M
GCB 3,150A 40kA
230/66/11 kV Transformer No.2125MVAYNyn0d11ONAF/ONAN
MDS+ES1,600A40kA
M
VT 0.5P: 230kV/ 3S: 110V/ 3, 0.2, 30VAT: 110V/ 3, 3P, 30VA
SA
M
DS1,600A40kA
M
DS1,600A40kA
GCB 1,600A 40kA
800-400/1A 5P20, 30VA
800-400/1A 0.2FS5, 20VA
800-400/1A 5P20, 30VA
3,000-1,600/1A 5P20, 20VA
M
M
230/66/11 kV Transformer No.1125MVAYNyn0d11ONAF/ONAN
MDS+ES1,600A40kA
M
VT 0.5P: 230kV/ 3S: 110V/ 3, 0.2, 30VAT: 110V/ 3, 3P, 30VA
SA
3,000-1,600/1A 5P20, 20VA
3,000-1,600/1A 5P20, 20VA
3,000-1,600/1A 5P20, 20VA
3,000-1,600/1A 0.2FS5, 20VA
M
DS+ES3,150A, 40kA
M
M M
GCB 1,600A 40kA
1,600-800/1A 5P20, 20VA
1,600-800/1A 0.2FS5, 20VA
1,600-800/1A 5P20, 20VA
3,000-1,600/1A 5P20, 20VA
M
DS+ES1,600A40kA
M
M
VT 0.5P: 230kV/ 3S: 110V/ 3, 0.2, 30VAT: 110V/ 3, 3P, 30VA
SA
230kV Tharkheta
M M
GCB 1,600A 40kA
M
DS+ES1,600A40kA
M
M
VT 0.5P: 230kV/ 3S: 110V/ 3, 0.2, 30VAT: 110V/ 3, 3P, 30VA
SA
230kV Thanlyin
1,600-800/1A 5P20, 20VA
1,600-800/1A 0.2FS5, 20VA
1,600-800/1A 5P20, 20VA
3,000-1,600/1A 5P20, 20VA
245kV BB1-A, 3,150A, 40kA
245kV BB2-A, 3,150A, 40kA
M
M
M
M
VT 0.5P: 230kV/ 3S: 110V/ 3, 0.2, 30VAT: 110V/ 3, 3P, 30VA
VT 0.5P: 230kV/ 3S: 110V/ 3, 0.2, 30VAT: 110V/ 3, 3P, 30VA
M
M
VT 0.5P: 230kV/ 3S: 110V/ 3, 0.2, 30VAT: 110V/ 3, 3P, 30VA
VT 0.5P: 230kV/ 3S: 110V/ 3, 0.2, 30VAT: 110V/ 3, 3P, 30VA
245kV BB1-B, 3,150A, 40kA
245kV BB2-B, 3,150A, 40kA
GCB 1,600A 40kA
DS+ES1,600A40kA
VT 0.5P: 230kV/ 3S: 110V/ 3, 0.2, 30VAT: 110V/ 3, 3P, 30VA
SA
230kV Sar Ta Line SS (2)
1,600-800/1A 5P20, 20VA
1,600-800/1A 0.2FS5, 20VA
1,600-800/1A 5P20, 20VA
3,000-1,600/1A 5P20, 20VA
M
MM
M M
GCB 1,600A 40kA
DS+ES1,600A40kA
VT 0.5P: 230kV/ 3S: 110V/ 3, 0.2, 30VAT: 110V/ 3, 3P, 30VA
SA
230kV Sar Ta Lin SS (1)
1,600-800/1A 5P20, 20VA
1,600-800/1A 0.2FS5, 20VA
1,600-800/1A 5P20, 20VA
3,000-1,600/1A 5P20, 20VA
M
MM
M M
Scope of This Project
GCB 1,600A 40kA
DS+ES1,600A40kA
VT 0.5P: 230kV/ 3S: 110V/ 3, 0.2, 30VAT: 110V/ 3, 3P, 30VA
Spare
1,600-800/1A 5P20, 20VA
1,600-800/1A 0.2FS5, 20VA
1,600-800/1A 5P20, 20VA
3,000-1,600/1A 5P20, 20VA
M
MM
M M
GCB 1,600A 40kA
DS+ES1,600A40kA
VT 0.5P: 230kV/ 3S: 110V/ 3, 0.2, 30VAT: 110V/ 3, 3P, 30VA
Spare
1,600-800/1A 5P20, 20VA
1,600-800/1A 0.2FS5, 20VA
1,600-800/1A 5P20, 20VA
3,000-1,600/1A 5P20, 20VA
M
MM
M M
Expansion of 230 kV GIS
Existing 66kV TL
Existing 66kV TL
Existin
g 66kV
TL
230 kV Underground CableTo Existing 230 kV GIS
Gantry Structure for 230 kV TL
230 kV TL to Sar Ta Lin 500 kV SS – 2 cct
About 30 m

Transmission Project Preparatory Survey Phase III
Final Report (Advanced Release)
6-75
Source: JICA Survey Team
Figure 6.6-9 Layout of 230 kV Switchgear in East Dagon Substation
3) Method of Expansion for 230 kV GIS
When the 230 kV GIS is extended in the Project, it is desirable to connect additional bays to the
existing GIS via the optimum method in order to reduce the power outage time at the substation to the
minimum. The method of expansion obtained from the original manufacturer is attached in Appendix
6-4-6.
(4) Equipment Procurement and Quantities In this Project, two (2) additional bays are installed in the East Dagon substation. The drawings in
Appendix 6-4-3 show the basic design of East Dagon substation.
- DWG No. MY-TLP3-ED-SLD_02 Single Line Diagram (Appendix 6-4-3)
1) Expansion of 230 kV switchgear
i) 230 kV GIS transmission line bay
- 245 kV feeder 4 feeders
- GIS local control panel 4 panels
- Cable head (GIS) 2 sets
ii) 230 kV outdoor switchgear
- 245 kV CVT 6 sets
- Line trap 4 sets
- Cable head (AIS) 2 sets
- 196 kV SA 3 sets
The associated gantry structures for the above system shall be supplied and installed.
The associated steel support structures and foundations for the above equipment with all
necessary connecting materials shall be supplied and installed.
The connection work between the dead-end towers, associated gantry structures and the
above equipment shall be carried out and all necessary materials for the work such as power

Transmission Project Preparatory Survey Phase III
Final Report (Advanced Release)
6-76
conductors, tension insulator sets, fittings, post insulators, connectors, accessories, power and
control cables, etc. shall be supplied and installed.
The above equipment shall be properly earthed with underground earthing mesh and all
necessary materials such as earthing conductors shall be supplied.
iii) Extension of protection and control panels
Protection relay panel
- 230 kV transmission line protection relay panels 2 panels
Control panel
- 230 kV transmission line control and synchronizing panel 4 panels
SCADA system
- Modification of existing SCADA system
The associated power and control cables with necessary accessories shall be supplied and
installed.
All necessary meters including ammeters, voltmeters and watt-hour meters, etc. shall be
supplied and installed.
2) Civil and building work
Cleaning, cutting, filling, leveling and compacting around additional GIS and 230 kV T/L
terminal tower.
Excavation and backfilling as required
3) Other work
- Spare parts for at least 5 years of operation
- Tools and erection accessories as required
- Complete documentation for operation and maintenance
- Training for DPTSC staff at manufacturer’s factory and at site
(5) Specifications of Major Equipment 1) Gas insulated switchgear
i) Type
The GIS shall be metal-enclosed, three-phase busbar and switchgear type, for outdoor use, and
filled with SF6 insulation gas.
ii) Circuit breaker Rated voltage 245 kV
Rated main busbar normal current 3,150 A
Rated feeder normal current 1,600 A
Rated frequency 50 Hz
Rated short-circuit breaking current 40 kA, 1 sec.
Rated interrupting time less than or equal to 3 cycle
Rated operating sequence O - 0.3 sec. - CO - 3 min. - CO
Rated closing operation voltage DC 110 V
Rated control voltage DC 110 V
Rated insulation level
a) Rated short-duration power-frequency withstand voltage (r.m.s.
value) 395 kV
b) Rated lightning impulse withstand voltage (peak value) 750 kV
The circuit breakers shall be suitable for single-pole tripping and rapid auto-reclosing, provided
with a motor-operated spring mechanism, and shall comply with the related IEC
standards/recommendations.
The circuit breakers shall be equipped with an operation mechanism for DC power, motor
operated and with a manual handle and the mechanism shall ensure uniform and positive closing and
opening
iii) Disconnectors and earthing switches Rated voltage 245 kV
Rated normal current 1,600 A
Rated frequency 50 Hz
Rated short-circuit withstand current 40 kA, 1 sec.
Rated control voltage DC 110 C
Rated insulation level

Transmission Project Preparatory Survey Phase III
Final Report (Advanced Release)
6-77
a) Rated short-duration power-frequency withstand voltage (r.m.s.
value) 395 kV
b) Rated lightning impulse withstand voltage (peak value) 750 kV
The disconnectors and earthing switch shall both be motor-operated and provided with a manual
operating mechanism.
Motor-operated disconnectors and earthing switch shall be designed with three-pole operation and
the motor shall be operated on DC auxiliary power.
iv) Current transformer Highest system voltage 245 kV
Rated frequency 50 Hz
Rated insulation level
a) Rated short-duration power-frequency withstand voltage (r.m.s.
value) 395 kV
b) Rated lightning impulse withstand voltage (peak value) 750 kV
Rated current ratio 3,000-1,600 A : 1 A
1,600-800 A : 1 A
Accuracy classes 5P20 for protection, Class 0.2 for
metering
v) Voltage transformer Highest system voltage 245 kV
Rated frequency 50 Hz
Voltage ratio 230 𝑘𝑉
√3:110 𝑉
√3:110 𝑉
√3
Accuracy classes 3P+0.2
Rated insulation level
a) Rated short-duration power-frequency withstand voltage (r.m.s.
value) 395 kV
b) Rated lightning impulse withstand voltage (peak value) 750 kV
2) Capacitor voltage transformer
i) Type
The 230 kV voltage transformers shall be single-phase, capacitor type and shall be designed in
accordance with IEC 60044-5.
ii) Ratings Highest system voltage 245 kV
Rated frequency 50 Hz
Voltage ratio 230 𝑘𝑉
√3:
110 𝑉
√3:110 𝑉
√3
Accuracy classes 3P, 0.2
Rated insulation level
a) Rated short-duration power-frequency withstand
voltage (r.m.s. value) 395 kV
b) Rated lightning impulse withstand voltage (peak
value) 750 kV

Transmission Project Preparatory Survey Phase III
Final Report (Advanced Release)
6-78
3) 196 kV Surge Arrester
The 196 kV surge arresters shall be gapless, metal-oxide, outdoor and heavy duty type. The
arresters shall be designed in accordance with IEC 60099-4
Rated voltage (r.m.s. value) 196 kV
Rated frequency 50 Hz
Nominal discharge current 10 kA
Long-duration discharge class Class 3 (Table-5, IEC 60099-4)
Pressure-relief current 40 kA
Rated insulation levels for insulators
a) Rated short-duration power-frequency
withstand voltage (r.m.s. value) 395 kV
b) Rated lightning impulse withstand voltage
(peak value) 750 kV
Hlawga Substation
(1) Location and Current Situation 1) Location
As shown in the following figure, the Hlawga S/S is located at latitude 16° 58’ 54” north and
longitude 96° 07’ 35” east in the Mingaladon Township of Yangon City. Because the Hlawga
substation is surrounded by a national park and military reservation, it is required to expand and/or
augment the substation within the existing land.
Source: JICA Survey Team Editing Google Earth
Figure 6.6-10 Location Map of Hlawga Substation
2) Current situation
The Hlawga substation has been operating since 1960 and consists of the following equipment:
230 kV Air insulated switchgear
Single busbar scheme
Three (3) transmission line bays to Shwedaung substation, Tharyagone substation and
Thaketa substation
Four (4) transformer bays

Transmission Project Preparatory Survey Phase III
Final Report (Advanced Release)
6-79
Three (3) 230 kV Capacitor banks, 50 MVar x 2 and 20 MVar x 1
One (1) 230/66/11 kV main transformer
Rated capacity: 125 MVA
Three (3) 230/33/11 kV main transformer
Rated capacity: 100 MVA
66 kV switchgear
Single busbar scheme
Three (3) transmission line feeders
One (1) transformer feeder
33 kV switchgear
Double busbar scheme
Thirty (30) transmission line feeders
Six (6) transformer feeders
11 kV switchgear
Station service facilities
Source: JICA Survey Team
Figure 6.6-11 Photos of Current Hlawga Substation
(2) Scope of Work for the Project In the Project, the existing 230 kV switchgear is upgraded to a GIS system, including expansion
for the connection of four (4) circuits to the new Sar Ta Lin 500 kV substation in order to secure the
reliability of equipment in future. In addition, the JICA Survey Team conducted the basic design in
consideration of future expansion since there are several plans to extend the 230 kV facilities.
In accordance with the discussion with DPTSC, the number of feeders in the GIS system
constructed via the Project will be 17, as below. In this connection, the transmission line feeder to
Tharyagone substation is not counted in the upgrade to GIS because the power flow of this line after
the Project will be low.
Transmission Line feeders 11 bays
To Sar Ta Lin substation 4 bays
To Thaketa substation 2 bays
To Wartayar substation 2 bays
To Shwedaung substation 1 bay
Spare 2 bays
Transformer feeders 4 bays 230/33/11 kV, 150 MVA transformer 3 bays
230/66/11 kV, 125 MVA transformer 1 bay
Bus coupler 2 bays
(3) Busbar Arrangement and Layout i) Busbar arrangement
A single busbar arrangement is applied to the 230 kV switchgear in Hlawga substation, as shown in
the following figure. Although 230 kV capacitor banks are installed for voltage control, it is assumed
that these capacitor banks were necessary when Hlawga substation started operation due to there not

Transmission Project Preparatory Survey Phase III
Final Report (Advanced Release)
6-80
being enough supply lines. Therefore, our design considered removing these capacitor banks because
it seems they will not be necessary for the Project’s implementation.
Source: DPTSC
Figure 6.6-12 Single Line Diagram of 230 kV Switchgear in Hlawga Substation
A single line diagram after the Project is shown below. Because Hlawga substation doesn’t have
enough space for the full installation of GIS with the required feeders above, we planned to conduct
the upgrading work step by step as below:
First step: Installation of GIS as far as possible in available space
Second step: Changing the connection of the 230kV transmission line feeders in AIS which
have been already prepared in GIS
Third step: Removal of the non-used 230 kV AIS and installation of remaining feeders of GIS
Fourth step: Changing the connection of remaining transmission feeder in AIS to GIS
Source: JICA Survey Team
Figure 6.6-13 Single Line Diagram of 230 kV Switchgear in Hlawga Substation after the Project
2) Layout
As shown in Figure 6.6-14, when considering the connection of transmission lines currently planned
to Wartayar substation with two circuits, East Dagon substation with one circuit and Thaketa
substation with one circuit, there is only space of approx. 27 m x 35 m on the southern side of the 230
kV switchgear. Therefore, installation of GIS shall be separated into two phases.
500-1000/1/1/1/1/1
A
GCB
1250 A
230 kV, 50 MVAR Cap Bank (1) 230 kV, 25 MVAR Cap Bank (2)
200-400/5/5/5 A
GCB 3150 A
200-400/5/5/5 A 350-700/5/5/5 A
GCB
1250 A
400-800/1/1/1 A
GCB
3150 AGCB 3150 A
230kV Shwedaung 230kV Tharyargone230 kV, 50 MVAR Cap Bank (3)
150-300/5/5/5 A
GCB 3150 A
Bus Section D/S
800A
GCB
1250 A
300-600/1/1/1/1/1 A
125 MVA
230/66/11 kV Bank
1000-2000/1/1/1/1/1 A
GCB
1600 A
250-500/5/5/5A
100 MVA
230/33/11 kV
Bank (1)
GCB 3150 A
GCB
2000 A
2000/5/5/5 A
250-500/5/5/5A
GCB 3150 A
100 MVA
230/33/11 kV
Bank (2)
GCB
2000 A
2000/5/5/5 A
( -162.0 MW)
(-7.4 MW)
(- 170.2 MW)
(- 0.2 MW)
(1304.0 A) (1260.0 A)
250-500/5/5/5 A
GCB
1250 A
100 MVA
230/33/11 kV
Bank (4)
GCB
2500 A
2000/5/5/5 A
(1117.0 A)
GCB
1250 A
200-400/1/ 1/
1A
GCB
1250 A
200-400/1/ 1/1A
GCB
1250 A
66/0.11kV
GCB 1250 A
200-400/1/1/1A
M
M
VT 0.5
P: 230kV/ 3
S: 110V/ 3, 0.2, 30VA
T: 110V/ 3, 3P, 30VA
VT 0.5
P: 230kV/ 3
S: 110V/ 3, 0.2, 30VA
T: 110V/ 3, 3P, 30VA
MM
M
M
M
SA
Spare
M M
GCB
1,250A
40kA
M
DS+ES
1,250A
40kA
M
M
SA
Thaketa SS (1)
M
DS+ES
2,000A, 40kA
GCB
2,000A
40kA
2,000-1,000/1/1/1 A
M
DS+ES
2,000A, 40kA
M
M M
GCB
1,250A
40kA
M
DS+ES
1,250A
40kA
M
M
SA
Thaketa SS (2)
MM
M
M
M
SA
230/33/11 kV, 150MVA
TR(1)
M M
GCB
1,250A
40kA
M
DS+ES
1,250A
40kA
M
M
SA
M M
GCB
1,250A
40kA
M
DS+ES
1,250A
40kA
M
M
SA
Sar Ta Lin (2) Sar Ta Lin (1)
M
M
DS
2,000A, 40kA
DS
2,000A, 40kAMM
M
M
M
SA
230/33/11 kV, 150MVA
TR(2)
M M
GCB
1,250A
40kA
M
DS+ES
1,250A
40kA
M
M
SA
Sar Ta Lin (3)
MM
DS+ES
2,000A, 40kA
GCB
2,000A
40kA
2,000-1,000/1/1/1 A
M
DS+ES
2,000A, 40kA
MM
M M
GCB
1,250A
40kA
M
DS+ES
1,250A
40kA
M
M
SA
Sar Ta Lin (4)
M M
GCB
1,250A
40kA
M
DS+ES
1,250A
40kA
M
M
SA
Wartayar (1)
M M
GCB
1,250A
40kA
M
DS+ES
1,250A
40kA
M
M
SA
Wartayar (2)
MM
M
M
M
SA
230/66/11 kV,
125MVA
TR(3)
MM
M
M
M
SA
230/33/11 kV, 150MVA
TR(4)
M M
GCB
1,250A
40kA
M
DS+ES
1,250A
40kA
M
M
SA
Shwedaung
M M
GCB
1,250A
40kA
M
DS+ES
1,250A
40kA
M
M
SA
Spare
M
M
VT 0.5
P: 230kV/ 3
S: 110V/ 3, 0.2, 30VA
T: 110V/ 3, 3P, 30VA
VT 0.5
P: 230kV/ 3
S: 110V/ 3, 0.2, 30VA
T: 110V/ 3, 3P, 30VA
245kV BB1-A, 3,150A, 40kA
245kV BB2-A, 3,150A, 40kA
245kV BB1-B, 3,150A, 40kA
245kV BB2-B, 3,150A, 40kA
New 230 kV GIS (2nd
Phase)
New 230 kV GIS (1st Phase)

Transmission Project Preparatory Survey Phase III
Final Report (Advanced Release)
6-81
Source: JICA Survey Team from DPTSC Drawing
Figure 6.6-14 Layout of 230 kV Switchgear in Hlawga Substation Before the Project
Source: JICA Survey Team from DPTSC Drawing
Figure 6.6-15 Layout of 230 kV Switchgear in Hlawga Substation After the Project
The available space after connection of the current planned transmission lines as mentioned above
will be approximately 27 m x 35 m. The JICA Survey Team judged that a 230 kV GIS with a double
busbar scheme having six feeders, which requires 15.5 m x 7.4 m dimensions, can be installed in that
available space.

Transmission Project Preparatory Survey Phase III
Final Report (Advanced Release)
6-82
Source: JICA Survey Team
Figure 6.6-16 Necessary Dimensions of 230 kV GIS with Double Busbar (Reference)
Source: JICA Survey Team
Figure 6.6-17 Single Line Diagram of GIS in Hlawga Substation after 1st Phase
(4) Equipment Procurement and Quantities In this Project, 230 kV GIS is installed in the Hlawga substation as an upgrade, instead of the
existing AIS. The drawings in Appendix 6-4-5 and 6-4-6 show the basic design of Hlawga
substation.
- DWG No. MY-TLP3-HG-SLD_02 Single Line Diagram (Appendix 6-4-5)
- DWG No. MY-TLP3-HG-LYT_01 Layout Drawing (Appendix 6-4-6)
1) Installation of 230 kV switchgear
i) 230 kV GIS of double busbar scheme
M
M
VT 0.5
P: 230kV/ 3
S: 110V/ 3, 0.2, 30VA
T: 110V/ 3, 3P, 30VA
VT 0.5
P: 230kV/ 3
S: 110V/ 3, 0.2, 30VA
T: 110V/ 3, 3P, 30VA
MM
M
M
M
SA
M M
GCB
1,250A
40kA
M
DS+ES
1,250A
40kA
M
M
SA
Thaketa SS (1)
M
DS+ES
2,000A, 40kA
GCB
2,000A
40kA
2,000-1,000/1/1/1 A
M
DS+ES
2,000A, 40kA
M
M M
GCB
1,250A
40kA
M
DS+ES
1,250A
40kA
M
M
SA
Thaketa SS (2)
MM
M
M
M
SA
230/33/11 kV, 150MVA
TR(1)
M M
GCB
1,250A
40kA
M
DS+ES
1,250A
40kA
M
M
SA
M M
GCB
1,250A
40kA
M
DS+ES
1,250A
40kA
M
M
SA
Sar Ta Lin (2) Sar Ta Lin (1)
M
245kV BB1-A, 3,150A, 40kA
245kV BB2-A, 3,150A, 40kA
Existing 230 kV Busbar
DS
(Existing)
New 230 kV GIS (1st Phase)
M
M
DS
2,000A, 40kA

Transmission Project Preparatory Survey Phase III
Final Report (Advanced Release)
6-83
The 230 kV GIS with double busbar scheme includes eleven (11) transmission line bays, four (4)
transformer bays and two (2) bays for bus coupler.
- 230 kV GCB 17 sets
- 230 kV DS/ES 19 sets
- 230 kV DS 30 sets
- 230 kV CT 19 sets
- 500 kV VT 19 sets
- 196 kV SA 11 sets
Connection with the existing busbar
The associated gantry structures for the above system shall be supplied and installed.
The associated steel support structures and foundations for the above equipment with all
necessary connecting materials shall be supplied and installed.
The connection work between the existing equipment, underground transmission lines and
the above equipment shall be carried out and all necessary materials for the work such as
cable head, connectors, accessories, power and control cables, etc. shall be supplied and
installed.
The above equipment shall be properly earthed with underground earthing mesh and all
necessary materials such as earthing conductors shall be supplied.
iii) Extension of protection and control panels
Protection relay panel
- 230 kV transmission line protection relay panels 11 panels
- 230 kV transformer feeder protection relay panels 4 panels
- 230 kV busbar coupler protection relay panels 2 panels
- 230 kV GIS busbar protection relay panels 2 panels
Control panel
- 230 kV transmission line control and synchronizing panel 11 panels
- 230 kV busbar connection control and synchronizing panel 2 panels
SCADA System
- Modification of existing SCADA system
The associated power and control cables with necessary accessories shall be supplied and
installed.
All necessary meters including ammeters, voltmeters and watt-hour meters, etc. shall be
supplied and installed.
2) Civil and building work
Cleaning, cutting, filling, leveling and compacting around new GIS
Excavation and backfilling as required
3) Other work
- Spare parts for at least 5 years of operation
- Tools and erection accessories as required
- Complete documentation for operation and maintenance
- Training for DPTSC staff at manufacturer’s factory and at site
- Partial removal of existing AIS

Transmission Project Preparatory Survey Phase III
Final Report (Advanced Release)
6-84
(5) Specifications of Major Equipment 1) Gas insulated switchgear
i) Type
The GIS shall be metal-enclosed, three-phase busbar and switchgear type, for outdoor use, and
filled with SF6 insulation gas.
ii) Circuit breaker Rated voltage 245 kV
Rated main busbar normal current 3,150 A
Rated feeder normal current 1,250 A
Rated frequency 50 Hz
Rated short-circuit breaking current 40 kA, 1 sec.
Rated interrupting time less than or equal to 3 cycle
Rated operating sequence O - 0.3 sec. - CO - 3 min. - CO
Rated closing operation voltage DC 110 V
Rated control voltage DC 110 V
Rated insulation level
a) Rated short-duration power-frequency withstand voltage (r.m.s.
value) 395 kV
b) Rated lightning impulse withstand voltage (peak value) 750 kV
The circuit breakers shall be suitable for single-pole tripping and rapid auto-reclosing, provided
with a motor-operated spring mechanism, and shall comply with the related IEC
standards/recommendations.
The circuit breakers shall be equipped with an operation mechanism for DC and the mechanism
shall ensure uniform and positive closing and opening.
iii) Disconnectors and earthing switches Rated voltage 245 kV
Rated normal current 1,250 A
Rated frequency 50 Hz
Rated short-circuit withstand current 40 kA, 1 sec.
Rated control voltage DC 110 C
Rated insulation level
a) Rated short-duration power-frequency withstand voltage (r.m.s.
value) 395 kV
b) Rated lightning impulse withstand voltage (peak value) 750 kV
The disconnectors and earthing switch shall both be motor-operated and provided with a manual
operating mechanism.
Motor-operated disconnectors and earthing switch shall be designed with three-pole operation and
the motor shall be operated on DC auxiliary power.
iv) Current transformer Highest system voltage 245 kV
Rated frequency 50 Hz
Rated insulation level
a) Rated short-duration power-frequency withstand voltage (r.m.s.
value) 395 kV
b) Rated lightning impulse withstand voltage (peak value) 750 kV
Rated current ratio
2,000-1,000 A : 1 A (busbar)
1,600-800 A : 1 A (TL and
busbar connection)
Accuracy classes 5P20 for protection, Class 0.2 for
metering

Transmission Project Preparatory Survey Phase III
Final Report (Advanced Release)
6-85
v) Voltage transformer Highest system voltage 245 kV
Rated frequency 50 Hz
Voltage ratio 230 𝑘𝑉
√3:110 𝑉
√3:110 𝑉
√3
Accuracy classes 3P+0.2
Rated insulation level
a) Rated short-duration power-frequency withstand voltage (r.m.s.
value) 395 kV
b) Rated lightning impulse withstand voltage (peak value) 750 kV
2) 196kV Surge arrester
The 196 kV surge arresters shall be gapless, metal-oxide, outdoor and heavy duty type. The
arresters shall be designed in accordance with IEC 60099-4
Rated voltage (r.m.s. value) 196 kV
Rated frequency 50 Hz
Nominal discharge current 10 kA
Long-duration discharge class Class 3 (Table-5, IEC 60099-4)
Pressure-relief current 40 kA
Rated insulation levels for insulators
a) Rated short-duration power-frequency
withstand voltage (r.m.s. value) 395 kV
b) Rated lightning impulse withstand voltage
(peak value) 750 kV
Thaketa Substation
(1) Location and Current Situation 1) Location
As shown in the following figure, the Thaketa S/S is located at latitude 16° 48’ 42” north and
longitude 96° 13’ 33” east in the Thaketa Township of Yangon City.
Source: JICA Survey Team Editing Google Earth
Figure 6.6-18 Location Map of Hlawga Substation

Transmission Project Preparatory Survey Phase III
Final Report (Advanced Release)
6-86
2) Current Situation
Thaketa substation, including 230 kV equipment, is upgraded under ‘Urgent Rehabilitation and
Upgrade Project Phase 1 (hereinafter referred to as “MY-P2 Project”)’ with a Japanese ODA Loan.
Facility configuration after rehabilitation and upgrade in MY-P2 will be as follows:
230 kV Air insulated switchgear
Single busbar scheme
Two (2) transmission line bays to Hlawga substation and Thanlyin substation
Four (4) transformer bays
Two (2) 230/66/11 kV main transformers
Rated capacity: 200 MVA
Two (2) 230/33/11 kV main transformers
Rated capacity: 100 MVA
66 kV switchgear
Double busbar scheme
Nineteen (19) transmission line feeders
Two (2) transformer feeders
Two (2) bus couplers
33 kV switchgear
Double busbar scheme
Thirteen (13) transmission line feeders
two (2) transformer feeders
One (1) bus coupler
11 kV switchgear
Station service facilities
Source: JICA Survey Team
Figure 6.6-19 Photos of Current Hlawga Substation
(2) Scope of Work for the Project In the Project, one bay of 230 kV switchgear including line protection panel in Thaketa substation
is added, corresponding to augmentation of the existing 230 kV transmission line from one circuit to
two circuits. Replacement of existing 230 kV switchgear for the transmission line feeder to Hlawga
substation is not considered in the Project because this equipment will be rehabilitated in the MY-P2
Project.
(3) Busbar Arrangement and Layout 1) Busbar arrangement
The busbar arrangement of 230 kV AIS in Thaketa substation will be a single busbar arrangement,
the same as the existing configuration, even after the Project.

Transmission Project Preparatory Survey Phase III
Final Report (Advanced Release)
6-87
Source: MY-P2 Project
Figure 6.6-20 Single Line Diagram of 230 kV Switchgear in Thaketa Substation Before the Project
The single line diagram of 230 kV switchgear after the Project is shown in the following figure. The
space for additional 230 kV switchgear to be installed in the Project can be secured on the west side
of the existing transmission line bay to Hlawga substation.
Source: JICA Survey Team
Figure 6.6-21 Single Line Diagram of 230 kV Switchgear in Thaketa Substation After the Project
2) Layout
As stated above, the additional 230 kV transmission line bay to Hlawga substation will be installed
on the west side of the rehabilitated transmission line bay.
LA10kA
Hlawga (Additional)
ES DS2000A
500-1000/1/1/1ACTGCB
2000ADS
2000A
LTCVT

Transmission Project Preparatory Survey Phase III
Final Report (Advanced Release)
6-88
Source: MY-P2 Project
Figure 6.6-22 Layout of 230 kV Switchgear in Thaketa Substation After the Project
(4) Equipment Procurement and Quantities In the Project, one (1) additional 230 kV transmission line bay is installed in Thaketa substation.
The drawing in Appendix-6-4-7 shows the basic design of Thaketa substation.
- DWG No. MY-TLP3-TK-SLD_02 Single Line Diagram (Appendix 6-4-7)
1) Expansion of 230 kV switchgear
i) 230 kV switchgear of single busbar arrangement
- 230 kV GCB 1 set
- 230 kV DS/ES 1 set
- 230 kV DS 1 set
- 230 kV CT 1 set
- 230 kV CVT 1 set
- 196 kV SA 1 set
- Line trap 2 sets
The associated gantry structures for the above system shall be supplied and installed.
The associated steel support structures and foundations for the above equipment with all
necessary connecting materials shall be supplied and installed.
The connection work between the dead-end towers, associated gantry structures and the
above equipment shall be carried out and all necessary materials for the work such as power
conductors, tension insulator sets, fittings, post insulators, connectors, accessories, power and
control cables, etc. shall be supplied and installed.
The above equipment shall be properly earthed with underground earthing mesh and all
necessary materials such as earthing conductors shall be supplied.
ii) Expansion of Control and Protection panel
Protection relay panel
- 230 kV transmission line protection relay panels 1 panel
Control panel
- 230 kV transmission line control and synchronizing panel 1 panel
SCADA system
- Modification of existing SCADA system
DPTSC agreed that this space is usedfor construction of 230kV T/L bayfor additional circuit to HlawgaSubstation
Hlawga SS (2)Hlawga SS (1)
66kV T/L
Thanlyn SSEast Dagon SS

Transmission Project Preparatory Survey Phase III
Final Report (Advanced Release)
6-89
The associated power and control cables with necessary accessories shall be supplied and
installed.
All necessary meters including ammeters, voltmeters and watt-hour meters, etc. shall be
supplied and installed.
2) Civil and building work
- Cleaning, cutting, filling, leveling and compacting around additional 230 kV
switchgear
- Excavation and backfilling as required
3) Other work
- Spare parts for at least 5 years of operation
- Tools and erection accessories as required
- Complete documentation for operation and maintenance
(5) Specifications of Major Equipment 1) Air Insulated Switchgear
i) Circuit Breaker
The 230 kV circuit breakers shall be SF6 gas type, with a three-pole collective arrangement and
for outdoor use. The circuit breakers shall be suitable for single-pole tripping and rapid auto-
reclosing, provided with a motor-operated spring mechanism, and shall comply with the related IEC
standards/recommendations.
Rated voltage 230 kV
Rated feeder normal current 2,000 A
Rated frequency 50 Hz
Rated short-circuit breaking current 40 kA, 1 sec.
Rated interrupting time less than or equal to 3 cycle
Rated operating sequence O - 0.3 sec. - CO - 3 min. - CO
Rated closing operation voltage DC 110 V
Rated control voltage DC 110 V
Rated insulation level
a) Rated short-duration power-frequency withstand voltage (r.m.s.
value) 395 kV
b) Rated lightning impulse withstand voltage (peak value) 750 kV
The circuit breakers shall be equipped with an operation mechanism for DC power motor operated
and manual handle, and the mechanism shall ensure uniform and positive closing and opening.
ii) Disconnectors and earthing switches
The 230 kV disconnectors shall be three-phase, two-column, rotary and center air break type with
horizontal operation. Earthing switches shall be triple-pole, single-throw, vertical single break and
manual three-phase group operation type.
The disconnectors and earthing switches shall be suitable for outdoor use. The earthing switches
shall be mounted on the disconnectors whenever necessary and where specified. Rated voltage 230 kV
Rated normal current 2,000 A
Rated frequency 50 Hz
Rated short-circuit withstand current 40 kA, 1 sec.
Rated control voltage DC 110 C
Rated insulation level
a) Rated short-duration power-frequency withstand voltage (r.m.s.
value) 395 kV
b) Rated lightning impulse withstand voltage (peak value) 750 kV
The disconnectors shall be motor-operated and provided with a manual operating mechanism with
a hand crank. The earthing switch shall be provided with a manual operating mechanism.
Motor-operated disconnectors shall be designed with three-pole operation and the motor shall be
operated on DC power.
iii) Current transformer

Transmission Project Preparatory Survey Phase III
Final Report (Advanced Release)
6-90
The 230 kV current transformers shall be single-phase, porcelain-insulated, oil-immersed and air-
tight sealed post insulator type, for outdoor use and shall be designed in accordance with IEC 60044-
1. Highest system voltage 230 kV
Rated frequency 50 Hz
Rated insulation level
a) Rated short-duration power-frequency withstand voltage (r.m.s.
value) 750 kV
b) Rated lightning impulse withstand voltage (peak value) 1,550 kV
Rated current ratio 500-1,000A : 1/1/1A)
Accuracy classes 5P20 for protection, Class 0.2 for
metering
iv) Capacitor Voltage transformer
The 500 and 230 kV voltage transformers shall be single-phase, capacitor type and shall be designed
in accordance with IEC 60044-5. Highest system voltage 245 kV
Rated frequency 50 Hz
Voltage ratio 230 𝑘𝑉
√3:110 𝑉
√3:110 𝑉
√3
Accuracy classes 3P+0.5
Rated insulation level
a) Rated short-duration power-frequency withstand
voltage (r.m.s. value) 395 kV
b) Rated lightning impulse withstand voltage (peak
value) 750 kV
v) 196 kV Surge Arresters
The 196 kV surge arresters shall be gapless, metal-oxide, outdoor and heavy duty type. The
arresters shall be designed in accordance with IEC 60099-4. Rated voltage (r.m.s. value) 196 kV
Rated frequency 50 Hz
Nominal discharge current 10 kA
Long-duration discharge class Class 3 (Table-5, IEC 60099-4)
Pressure-relief current 40 kA
Rated insulation levels for insulators
a) Rated short-duration power-frequency withstand
voltage (r.m.s. value) 395 kV
b) Rated lightning impulse withstand voltage (peak
value) 750 kV
6.7. Work and Procurement Plan
Work Plan
(1) Procedure for Changing-over to GIS in Hlawga Substation As stated above, it is necessary to install GIS in 2 phases due to the limited current space for
upgrading the existing 230 kV switchgear to GIS in Hlawga substation. In addition, since Hlawga
substation plays an important role in supplying power to Yangon City, the changing-over work to GIS
shall be conducted maintaining the operation of existing transmission lines as much as possible.
Therefore, the JICA Survey Team proposes to change over to GIS in four (4) steps, as described below:
1) Step-1: Installation of GIS (1st Phase) in available space
In Step-1, GIS with six (6) line feeders, of which one is for connection with the existing busbar,
and one bus coupler shall be installed in the available space of approximately 27 m x 32 m.
The details of GIS feeders to be installed in Step-1 are as below:
Transmission line feeder
To Sar Ta Lin substation x 2
To Thaketa substation including additional circuit x 2
Transformer feeder
230/33/11 kV 150 MVA main transformer x 1
Bus connection feeder to existing busbar x 1

Transmission Project Preparatory Survey Phase III
Final Report (Advanced Release)
6-91
Bus coupler for GIS in Step-1
In Step-1, the JICA Survey Team also recommends constructing the cable trench in advance of the
next step to lay the cable connecting from GIS to transformer, because the GIS in Hlawga substation
is designed to connect by cable from GIS to each piece of equipment like transformers and
overhead/underground transmission lines.
Source: JICA Survey Team
Figure 6.7-1 Layout of 230 kV Switchgear in Hlawga Substation (Step-1)
Source: JICA Survey Team
Figure 6.7-2 Single Line Diagram of 230 kV GIS in Hlawga Substation (Step-1)
2) Step 2: Changing the connection from GIS in Step-1 to Related Equipment
In Step-2, the connection between GIS installed in Step-1 and related equipment shall be conducted.
All transmission line feeders in GIS installed in Step-1 are connected by cables to Hlawga substation
from underground transmission lines. For transformers, it is recommended to install the cable head
230 kV GIS by 7 feeders includingbus coupler bay is installed incurrent available space.
New cable trench for 230kVpower cables shall be installedprior to Step-2.
Installation of Cable HeadBushing at the existing CVTposition
M
M
VT 0.5
P: 230kV/ 3
S: 110V/ 3, 0.2, 30VA
T: 110V/ 3, 3P, 30VA
VT 0.5
P: 230kV/ 3
S: 110V/ 3, 0.2, 30VA
T: 110V/ 3, 3P, 30VA
MM
M
M
M
SA
M M
GCB
1,250A
40kA
M
DS+ES
1,250A
40kA
M
M
SA
M
DS+ES
2,000A, 40kA
GCB
2,000A
40kA
2,000-1,000/1/1/1 A
M
DS+ES
2,000A, 40kA
M
M M
GCB
1,250A
40kA
M
DS+ES
1,250A
40kA
M
M
SA
MM
M
M
M
SA
M M
GCB
1,250A
40kA
M
DS+ES
1,250A
40kA
M
M
SA
M M
GCB
1,250A
40kA
M
DS+ES
1,250A
40kA
M
M
SA
M
245kV BB1-A, 3,150A, 40kA
245kV BB2-A, 3,150A, 40kA
New 230 kV GIS (1st Phase)
M
M
DS
2,000A, 40kA

Transmission Project Preparatory Survey Phase III
Final Report (Advanced Release)
6-92
with bushing at the position of existing surge arresters and to connect the circuit from underground
cables to overhead conductors.
Furthermore, for the connection with the existing busbar, it is also recommended to install the cable
head with bushing in from of disconnectors, currently for CVT, and to connect with the existing busbar
for synchronization with the existing 230 kV system.
After all changing-over has been completed, non-used existing AIS connected to Thaketa substation
and Tharyagone substation shall be removed.
Source: JICA Survey Team
Figure 6.7-3 Layout of 230 kV Switchgear in Hlawga Substation (Step-2)
Connecting power cables fortransmission lines from 230kV GISthough cable trench
Connecting power cables forbusbar and TR (1) from 230kVGIS though cable trench
Remove of existing AIS switchgearafter connection the power cablefrom 230kV
Installation of Cable HeadBushing at surge arresterposition
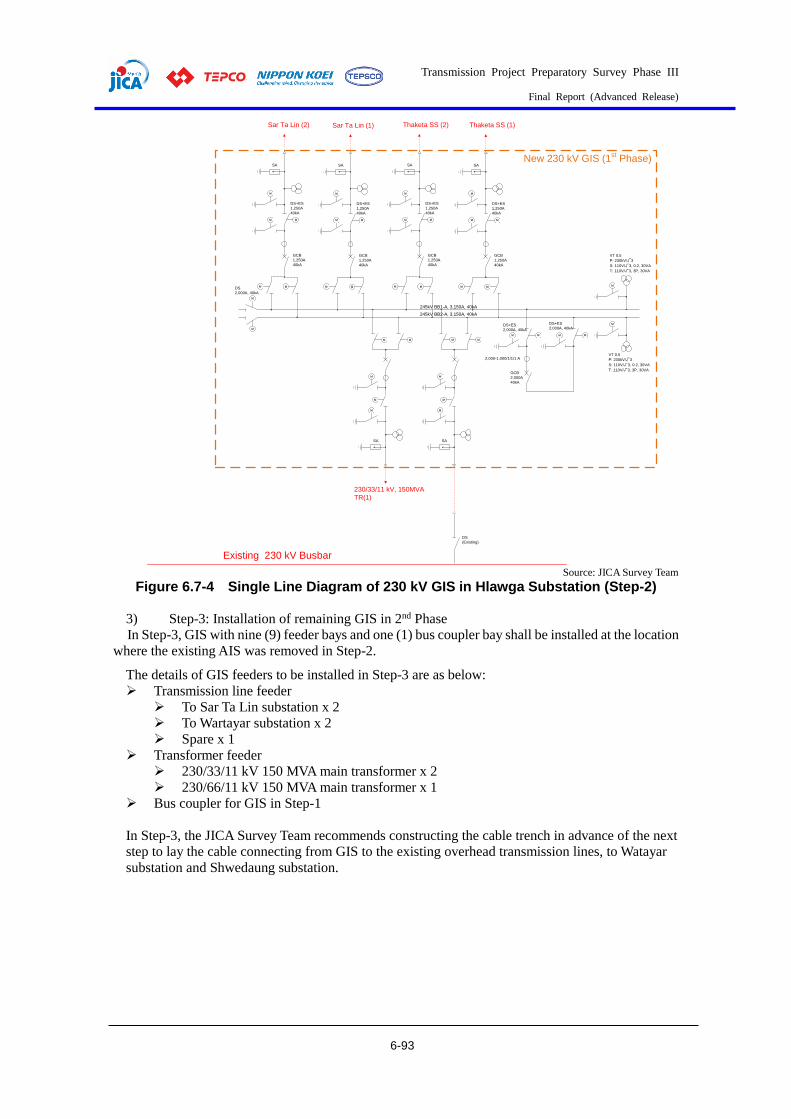
Transmission Project Preparatory Survey Phase III
Final Report (Advanced Release)
6-93
Source: JICA Survey Team
Figure 6.7-4 Single Line Diagram of 230 kV GIS in Hlawga Substation (Step-2)
3) Step-3: Installation of remaining GIS in 2nd Phase
In Step-3, GIS with nine (9) feeder bays and one (1) bus coupler bay shall be installed at the location
where the existing AIS was removed in Step-2.
The details of GIS feeders to be installed in Step-3 are as below:
Transmission line feeder
To Sar Ta Lin substation x 2
To Wartayar substation x 2
Spare x 1
Transformer feeder
230/33/11 kV 150 MVA main transformer x 2
230/66/11 kV 150 MVA main transformer x 1
Bus coupler for GIS in Step-1
In Step-3, the JICA Survey Team recommends constructing the cable trench in advance of the next
step to lay the cable connecting from GIS to the existing overhead transmission lines, to Watayar
substation and Shwedaung substation.
M
M
VT 0.5
P: 230kV/ 3
S: 110V/ 3, 0.2, 30VA
T: 110V/ 3, 3P, 30VA
VT 0.5
P: 230kV/ 3
S: 110V/ 3, 0.2, 30VA
T: 110V/ 3, 3P, 30VA
MM
M
M
M
SA
M M
GCB
1,250A
40kA
M
DS+ES
1,250A
40kA
M
M
SA
Thaketa SS (1)
M
DS+ES
2,000A, 40kA
GCB
2,000A
40kA
2,000-1,000/1/1/1 A
M
DS+ES
2,000A, 40kA
M
M M
GCB
1,250A
40kA
M
DS+ES
1,250A
40kA
M
M
SA
Thaketa SS (2)
MM
M
M
M
SA
230/33/11 kV, 150MVA
TR(1)
M M
GCB
1,250A
40kA
M
DS+ES
1,250A
40kA
M
M
SA
M M
GCB
1,250A
40kA
M
DS+ES
1,250A
40kA
M
M
SA
Sar Ta Lin (2) Sar Ta Lin (1)
M
245kV BB1-A, 3,150A, 40kA
245kV BB2-A, 3,150A, 40kA
Existing 230 kV Busbar
DS
(Existing)
New 230 kV GIS (1st Phase)
M
M
DS
2,000A, 40kA

Transmission Project Preparatory Survey Phase III
Final Report (Advanced Release)
6-94
Source: JICA Survey Team
Figure 6.7-5 Layout of 230 kV Switchgear in Hlawga Substation (Step-3)
Source: JICA Survey Team
Figure 6.7-6 Single Line Diagram of 230 kV GIS in Hlawga Substation (Step-3)
4) Step-4: Changing the connection from GIS in Step-3 to Related Equipment
In Step-4, the connection between the GIS installed in Step-3 and related equipment shall be
conducted. For transformers, it is recommended to install the cable head with bushing at the position
of the existing surge arresters and to connect the circuit from underground cables to overhead
conductors, the same as Step-2.
For connection to overhead transmission lines, it is also recommended to install the cable head with
bushing at the position of existing surge arresters and to connect with overhead transmission lines
from the cable trench.
After all changing-over has been completed, non-used existing AIS shall be removed. Then, the
upgrade to GIS will be completed.
Expansion of 230kV GIS in AIS spaceafter removal
New cable trench for 230kVpower cables shall be installedprior to Step-4.
M
M
VT 0.5
P: 230kV/ 3
S: 110V/ 3, 0.2, 30VA
T: 110V/ 3, 3P, 30VA
VT 0.5
P: 230kV/ 3
S: 110V/ 3, 0.2, 30VA
T: 110V/ 3, 3P, 30VA
MM
M
M
M
SA
M M
GCB
1,250A
40kA
M
DS+ES
1,250A
40kA
M
M
SA
Thaketa SS (1)
M
DS+ES
2,000A, 40kA
GCB
2,000A
40kA
2,000-1,000/1/1/1 A
M
DS+ES
2,000A, 40kA
M
M M
GCB
1,250A
40kA
M
DS+ES
1,250A
40kA
M
M
SA
Thaketa SS (2)
MM
M
M
M
SA
230/33/11 kV, 150MVA
TR(1)
M M
GCB
1,250A
40kA
M
DS+ES
1,250A
40kA
M
M
SA
M M
GCB
1,250A
40kA
M
DS+ES
1,250A
40kA
M
M
SA
Sar Ta Lin (2) Sar Ta Lin (1)
M
M
DS
2,000A, 40kA
DS
2,000A, 40kAMM
M
M
M
SA
M M
GCB
1,250A
40kA
M
DS+ES
1,250A
40kA
M
M
SA
Sar Ta Lin (3)
MM
DS+ES
2,000A, 40kA
GCB
2,000A
40kA
2,000-1,000/1/1/1 A
M
DS+ES
2,000A, 40kA
MM
M M
GCB
1,250A
40kA
M
DS+ES
1,250A
40kA
M
M
SA
Sar Ta Lin (4)
M M
GCB
1,250A
40kA
M
DS+ES
1,250A
40kA
M
M
SA
M M
GCB
1,250A
40kA
M
DS+ES
1,250A
40kA
M
M
SA
MM
M
M
M
SA
MM
M
M
M
SA
M M
GCB
1,250A
40kA
M
DS+ES
1,250A
40kA
M
M
SA
M M
GCB
1,250A
40kA
M
DS+ES
1,250A
40kA
M
M
SA
Spare
M
M
VT 0.5
P: 230kV/ 3
S: 110V/ 3, 0.2, 30VA
T: 110V/ 3, 3P, 30VA
VT 0.5
P: 230kV/ 3
S: 110V/ 3, 0.2, 30VA
T: 110V/ 3, 3P, 30VA
245kV BB1-A, 3,150A, 40kA
245kV BB2-A, 3,150A, 40kA
245kV BB1-B, 3,150A, 40kA
245kV BB2-B, 3,150A, 40kA
New 230 kV GIS (2nd
Phase)
Existing 230 kV Busbar
DS
(Existing)
New 230 kV GIS (1st Phase)

Transmission Project Preparatory Survey Phase III
Final Report (Advanced Release)
6-95
Source: JICA Survey Team
Figure 6.7-7 Layout of 230 kV Switchgear in Hlawga Substation (Step-4)
Source: JICA Survey Team
Figure 6.7-8 Single Line Diagram of 230 kV GIS in Hlawga Substation (Step-4)
Connecting power cables fortransmission lines from 230kV GISthough cable trench
Connecting power cables forbusbar and TR (2) to (4) from230kV GIS though cable trench
Removal of existing AISswitchgear after connection ofthe power cable from 230kV GIS
Installation of Cable HeadBushing at surge arresterposition
M
M
VT 0.5
P: 230kV/ 3
S: 110V/ 3, 0.2, 30VA
T: 110V/ 3, 3P, 30VA
VT 0.5
P: 230kV/ 3
S: 110V/ 3, 0.2, 30VA
T: 110V/ 3, 3P, 30VA
MM
M
M
M
SA
Spare
M M
GCB
1,250A
40kA
M
DS+ES
1,250A
40kA
M
M
SA
Thaketa SS (1)
M
DS+ES
2,000A, 40kA
GCB
2,000A
40kA
2,000-1,000/1/1/1 A
M
DS+ES
2,000A, 40kA
M
M M
GCB
1,250A
40kA
M
DS+ES
1,250A
40kA
M
M
SA
Thaketa SS (2)
MM
M
M
M
SA
230/33/11 kV, 150MVA
TR(1)
M M
GCB
1,250A
40kA
M
DS+ES
1,250A
40kA
M
M
SA
M M
GCB
1,250A
40kA
M
DS+ES
1,250A
40kA
M
M
SA
Sar Ta Lin (2) Sar Ta Lin (1)
M
M
DS
2,000A, 40kA
DS
2,000A, 40kAMM
M
M
M
SA
230/33/11 kV, 150MVA
TR(2)
M M
GCB
1,250A
40kA
M
DS+ES
1,250A
40kA
M
M
SA
Sar Ta Lin (3)
MM
DS+ES
2,000A, 40kA
GCB
2,000A
40kA
2,000-1,000/1/1/1 A
M
DS+ES
2,000A, 40kA
MM
M M
GCB
1,250A
40kA
M
DS+ES
1,250A
40kA
M
M
SA
Sar Ta Lin (4)
M M
GCB
1,250A
40kA
M
DS+ES
1,250A
40kA
M
M
SA
Wartayar (1)
M M
GCB
1,250A
40kA
M
DS+ES
1,250A
40kA
M
M
SA
Wartayar (2)
MM
M
M
M
SA
230/66/11 kV,
125MVA
TR(3)
MM
M
M
M
SA
230/33/11 kV, 150MVA
TR(4)
M M
GCB
1,250A
40kA
M
DS+ES
1,250A
40kA
M
M
SA
Shwedaung
M M
GCB
1,250A
40kA
M
DS+ES
1,250A
40kA
M
M
SA
Spare
M
M
VT 0.5
P: 230kV/ 3
S: 110V/ 3, 0.2, 30VA
T: 110V/ 3, 3P, 30VA
VT 0.5
P: 230kV/ 3
S: 110V/ 3, 0.2, 30VA
T: 110V/ 3, 3P, 30VA
245kV BB1-A, 3,150A, 40kA
245kV BB2-A, 3,150A, 40kA
245kV BB1-B, 3,150A, 40kA
245kV BB2-B, 3,150A, 40kA
New 230 kV GIS (2nd
Phase)
New 230 kV GIS (1st Phase)
Transmission Project Preparatory Survey Phase III
Final Report (Advanced Release)
7-1
7. Project Implementation Policy
7.1. Safety of Construction Work Substation work under the Project includes extension of three existing substations. As most of the
field work will be carried out under live conditions or tentative de-energized conditions at the existing
facilities in the substations, the contractors for the Project should proceed carefully and always work
paying full attention to the possibility of workers’ accidents, damage to the existing facilities,
unscheduled system supply interruptions, etc. Transmission line work over a long distance will cover
various kinds of operations, such as on high towers, in deep foundation excavated pits, with special
stringing tools, or frequent travelling on major roads/small village roads, etc. There are many
opportunities for fatal accidents and damage to public facilities. It has been observed that local workers
take little care in such construction work, working without any safety tools to protect themselves. To
prevent unexpected accidents, terms for the safety work should be specified in the contract documents.
7.2. COVID-19 Infection Prevention Measures It may be necessary to take the following measures during the construction period to prevent
COVID-19 infections.
- Wearing a mask.
- Face shields.
- Daily physical condition and hygiene management (habitual actions such as checking body
temperature, checking physical condition, hand washing, and frequent disinfection).
- If someone is not feeling well, ask him/her to leave the work area and take a rest or PCR test if
necessary.
- Maintain distance between each worker whenever possible.
- Temperature checks and alcohol disinfection by guards at the guard gates of new substation
construction sites and consulting offices (temperature checks and disinfection will have to be
conducted several times, each time the workers move).
- Reduction of meetings for all workers (limiting the number of people in meetings and
communicating information through instructions from the work manager).
- Separate work areas and the creation of a process schedule that avoids the proximity of each work
area (limit the number of workers in the substation building and allocate them to outdoor work, etc.).
- Installation of air cleaners in the field office.
- Limit the number of people moving vehicles.
Depending on the situation regarding the spread of infections, station a doctor at the construction
site and conduct PCR testing at the site.
7.3. Contract Management In terms of contract management considering the particular conditions in the Project, the items to
be taken into consideration are as below:
(1) Force Majeure (referring to GC G.37 in “Plant”) As represented by the recent spread of COVID-19 infections, there are cases in which the contractor
is forced to suspend work due to force majeure even in an ODA project. Although there are concerns
that such suspension will have a significant impact on the completion time of the planned project, if
the Employer (DPTSC in this case) forcibly demands that the contractor accelerate the construction
work when the construction is resumed, it is necessary to have a common understanding that the
project should be completed securing safety management and quality assurance, and allow an
extension to the construction period as necessary.
(2) Extension of Time for Completion (referring to GC H.40 in “Plant”) When the contract package is divided between transmission line and substation as in this project,

Transmission Project Preparatory Survey Phase III
Final Report (Advanced Release)
7-2
there is a concern that a delay in either one will affect the completion time of the other. At such time,
it will be necessary to consider extending the construction period as needed, but it is necessary to sort
out in advance who is responsible for such delay and the period of influence for each area of work.
Therefore, it is important to coordinate the processes and work between each package during
implementation of the Project.
(3) Contractor’s Claim of Time for Completion (referring to GC I.44 in “Plant”) In the transmission line construction project, land negotiation and land acquisition will be carried
out by the Employer. In this case, it is assumed that the land acquisition process will run into trouble
during the construction of the transmission line, and the construction work will have to be interrupted.
In the past, there was a case whereby the Employer was reluctant to charge the costs during the waiting
period of the contractor. On the other hand, there was also a case whereby the contractors, who were
unfamiliar with the contracts, did not charge for the costs themselves. Therefore, it is considered
necessary to properly raise issues in order to carry out the project in a way that the contractor will not
be disadvantaged.
7.4. Anti-graft Plan In order to realize transparent procurement in PQ and bidding, it is necessary to clarify the
evaluation criteria on the premise that a quantitative evaluation is performed at each evaluation with
consultant support. In addition, if any unnatural corrections are made to the bid evaluation report
prepared and supported by the consultant, the consultant should discuss and confirm the content with
the Employer, and consider discussing with JICA, if necessary.
In order to carry out transparent procurement procedures, it is recommended to comply with
transparent international standards such as the JICA guidelines. The JICA guidelines "Chapter 2:
Guidelines for Procurement under Japanese ODA Loans, Section 1.06 Corrupt or Fraudulent
Practices" are quoted below.
Source: JICA
7.5. Actions concerning Gender Necessary actions concerning gender to be proposed in each phase of the implementation stage in
this project are as below:
Transmission Project Preparatory Survey Phase III
Final Report (Advanced Release)
7-3
(1) Before Construction Construction of the access road for work considering easy access for daily activities (drinking
water, washing and farming etc.)
(2) Construction Period Equal work and pay
Employment promotion for women who want to work in cooking and material carrying work
Preparation of toilets, shower rooms and bedrooms by gender at accommodation and site
Arrangement of female supervisor at the site for female workers
Technical transfer of maintenance work for female staff in new substation
(3) After Construction Indirect improvement of the lives of women and children and their safety due to stable power
supply by strengthening the power grid

Transmission Project Preparatory Survey Phase III
Final Report (Advanced Release)
8-1
8. Project Implementation System
8.1. Suggestions for Configuring the Project Implementation and Operation and Maintenance Systems
Confirmation of Project Implementation System The MOEE organizational chart is shown in Figure 8.1-1. The Execution Agency (E/A) for the
Project will be assigned to DPTSC, which is in charge of the construction of transmission and
substation facilities above 132 kV, as per Phase 1 and Phase 2.
Source: MOEE
Figure 8.1-1 Organizational Chart of MOEE
There are three departments in DPTSC, the management department, Power Transmission Projects
Department (PTP) and Power System Department (PSD). Of these, PTP prepares the bidding
documents and manages the project during construction. Figure 8.1-2 shows the organization of
DPTSC.
Source: MOEE Figure 8.1-2 Organizational Chart of DPTSC
Capabilities of Each Department Related to the Project and its Role in the Project
The capabilities and roles of each department shown in Figure 8.1-2 are described below.
(1) Management Department 1) Financial Department
Management of budget and allocation to PTP
Reporting to Ministry of Planning and Finance (MOPE)
Confirmation of payment conditions
2) Material Planning Department (Yangon and Nay Pyi Taw)
Work for Custom Duties during Loading at port
Storage of materials
Director General
Deputy Director General
Deputy Director General
Deputy Director General
Administration Department
Finance Department
Material Planning
Department
Power Transmission Projects Department
(PTP)
Power Transmission Projects (Southern)
Office
Power Transmission Projects (Northern)
Office
Power System Department
(PSD)
Primary Substation
Projects
Transmission Line

Transmission Project Preparatory Survey Phase III
Final Report (Advanced Release)
8-2
Confirmation of quantity of materials
(2) Power Transmission Projects Department (PTP) 1) Project Implementation Branch
Planning for fuel supply and construction materials for transmission line and substation
projects
Evaluation of cost estimations for transmission line and substation projects
2) Design and Planning Branch
Preparation of design, BOQ and specifications and quality management
Preparation of bidding documents
Materials inspections
Technical and price evaluation for bidding
System analysis
3) Civil Branch
Management of civil work in transmission line and substation projects
Reporting on work progress
Inspection of civil work in each project
4) Power Transmission Projects (Southern) Office
Site management for transmission line and substation projects
Management of quality and performance
Coordination with region for land acquisition and reserved forest areas in project
Reporting to MORR on environmental and social impacts
(3) Power System Department (PSD) 1) Transmission Line Branch
Operation and maintenance for 230/132/66/33 kV transmission lines
Procurement of necessary materials for operation and maintenance
2) Primary Substation Branch
Operation and maintenance of 230 kV and 132 kV primary substations
Procurement of necessary materials for operation and maintenance
Execution Department for each Component Based on the capabilities and roles of each department mentioned in Chapter 10.2.2, the execution
department for the Project is shown in Table 8.1-1.
Table 8.1-1 Execution Department for each Component in the Project
Department Management PTP PSD
Branch Financial Material PIB Design Civil PTPO T/L S/S
Design X X
Bidding
Documents
X X X
Bidding
Evaluation
X
Contract
Negotiation
X X
Drawing
Approval
X X
Installation and
Work
Management
X X X X X
Individual
Inspection
X X
Commissioning
Test
X
O&M X X Source: JICA Survey Team

Transmission Project Preparatory Survey Phase III
Final Report (Advanced Release)
8-3
Organizational Structure of Executing Agency and main related Organizations (Organizational Chart)
The organizational chart of the “Power System Department”, which maintains and manages the
transmission and substation facilities, including the numbers of standard personnel, is shown below.
Figure 8.1-3 Organizational Chart of Power System Department
Table 8.1-2 Standard Numbers of Personnel for each Organization
Number of
personnel Remarks
System Planning (NPT) 57
National Control Center (NPT) 68
Load Dispatch Center (YGN) 68
SCADA and communications (NPT) 60
Substation (NPT) 20
System Protection and Testing (NPT) 45
System Protection and Testing (YGN) 45
Mobile Team (NPT) 58
Primary Substation 2,829 41 x 69 substations
Transmission Line (NPT) 20
Line Office (each regional) 2,055 137 x 15 offices
Total (Standard) 5,325
Total (Real) 3,994 5,325 x 75%
The actual working number of personnel is about 75% of the standard number, and the total number
of working personnel who operate, maintain and manage the transmission and substation facilities is
about 4,000. The standard number of personnel at the 500kV substation is assumed to be 67.
<O&M in substations> All substations above 132kV are manned, and the standard number of personnel in each substation
is 41 people. Since a new 500kV substation will be constructed in this project, it will be necessary to
increase the number of new substation personnel by 67 people x 75%. In addition, in order to carry
National Control Center (NPT)
(Director) 68
System Planning (NPT)
(Director) 57
Load Dispatch Center (YGN)
(Director) 68
Substation (NPT) (Director)
20
Transmission Line (NPT)
(Director) 20
SCADA and communications (NPT), (Director)
60
Primary Substation
Substation head: AD
41/substation
Mobile Team (NPT)
Section head: DD
58
System Protection and Testing
(YGN) Section head: DD
45
System Protection and Testing
(NPT) Section head: DD
45
Line Office (each regional) Office head: AD
137/office Total: 15 offices
Power System Department (DDG)
(Operation and Maintenance)
Admin/Finance/Materials Planning
(DDG)
Power Transmission Project (DDG)
(Design and Implementation)
Department of Power Transmission and System Control (DG)

Transmission Project Preparatory Survey Phase III
Final Report (Advanced Release)
8-4
out expansion work at three substations, it is considered necessary to increase the number of personnel
at each substation by about two.
<O&M for transmission facilities> The transmission line maintenance area is divided into 15 regions, as shown below, and transmission
maintenance offices in each region carry out the maintenance. The standard number of personnel at
each transmission line maintenance office is 137. New transmission lines will be constructed via this
Project, but all lines are within the maintenance area of the Kamarnat Transmission Line Maintenance
Office (the office outlined in red). For this reason, it is considered necessary to increase the number of
new personnel for transmission line O&M by 34, equivalent to 25% of the standard 137 personnel at
Kamarnat Transmission Line Maintenance Office.
Figure 8.1-4 Each Transmission Line Maintenance Office’s Area of Operations
The organization involved in the construction for this project is the “Power Transmission Project”.
The organizational chart of the “Power Transmission Project” is shown below.

Transmission Project Preparatory Survey Phase III
Final Report (Advanced Release)
8-5
Figure 8.1-5 Organizational Chart of Power Transmission Project
Project Implementation Unit (PMU) The following is a description of the project implementation structure for this project (Phase III)
with reference to the structure of the currently operating project (Phase I). In Phase I, there were two
substations, Meikhtila Substation and Taungoo Substation, and the Deputy Project Manager managed
each substation. In Phase III, the project will be divided into substation and transmission lines
according to the package. Since this project also includes the upgrade and expansion of 230kV, it is
further divided into 500kV and 230kV. The underground transmission lines will be included in the 230
kV transmission section. The draft structure table is shown below.
Project Director Office (Northern) Naypyitaw, (Director)
45
Project Planning & Design Branch Naypyitaw, (Director)
35 (DDG)
Power Transmission Project (Civil) Branch
Naypyitaw, (Director) 25
Project Implementation Branch Naypyitaw, (Director)
30
Power Transmission Project (Deputy Director General)
Project Director Office (Southern) Naypyitaw, (Director)
45
PM Office (Civil), (Northern) Naypyitaw, (Deputy Director)
60
PM Office (Civil), (Southern) Naypyitaw, (Deputy Director)
60
PM Office (1), Shwesaryan (Deputy Director)
120
PM Office (2), Meiktila (Deputy Director)
120
PM Office (3), Mandalay (Deputy Director)
120
PM Office (1), Yangon (Deputy Director)
120
PM Office (2), Tharyargone (Deputy Director)
120
PM Office (3), Shwe Taung (Deputy Director)
120
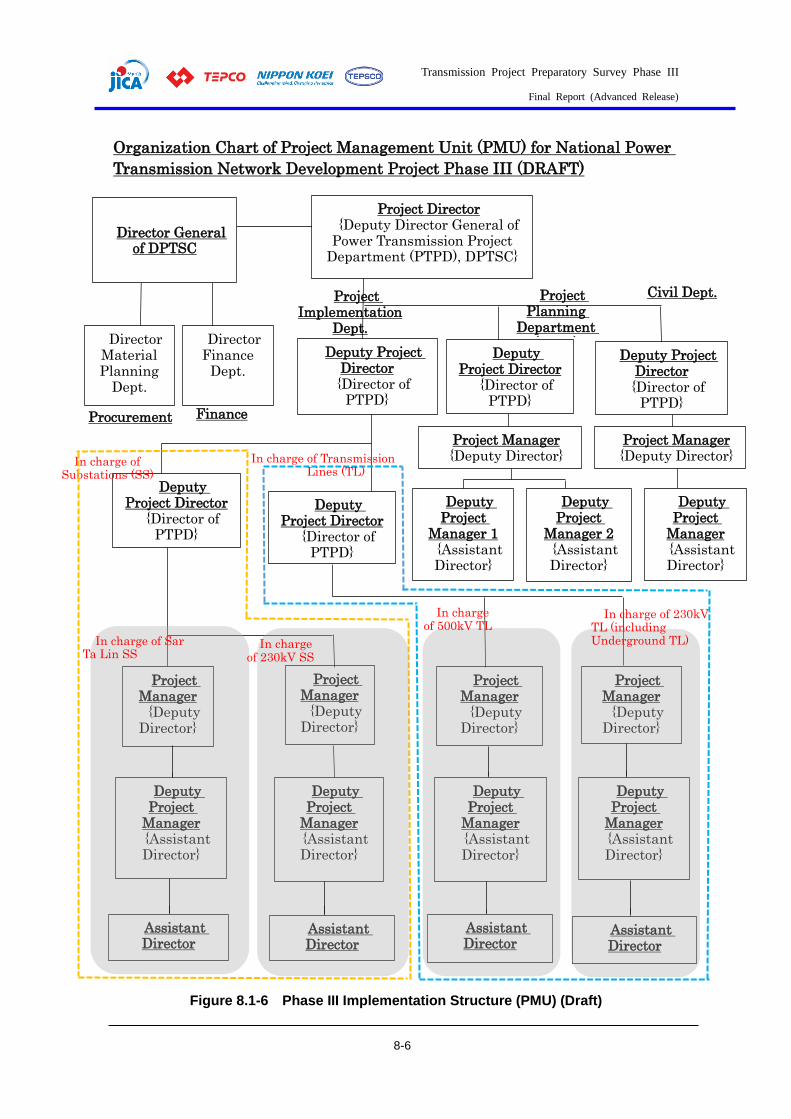
Transmission Project Preparatory Survey Phase III
Final Report (Advanced Release)
8-6
Organization Chart of Project Management Unit (PMU) for National Power
Transmission Network Development Project Phase III (DRAFT)
Figure 8.1-6 Phase III Implementation Structure (PMU) (Draft)
Project Director {Deputy Director General of
Power Transmission Project Department (PTPD), DPTSC}
Deputy Project Director {Director of
PTPD}
Deputy Project Director
{Director of PTPD}
Deputy Project Director {Director of
PTPD}
Project Planning
Department (Dept.)
Civil Dept.
Project Manager {Deputy Director}
Deputy Project
Manager {Assistant Director}
Project Manager {Deputy Director}
Deputy Project
Manager 1 {Assistant Director}
Deputy Project
Manager 2 {Assistant Director}
Director General of DPTSC
Director Material Planning
Dept.
Director Finance
Dept.
Procurement Finance
Deputy Project Director
{Director of PTPD}
Deputy Project Director
{Director of PTPD}
Project Manager
{Deputy Director}
Deputy Project
Manager {Assistant Director}
Assistant Director
Project Manager
{Deputy Director}
Deputy Project
Manager {Assistant Director}
Assistant Director
Project Manager
{Deputy Director}
Deputy Project
Manager {Assistant Director}
Assistant Director
Project Manager
{Deputy Director}
Deputy Project
Manager {Assistant Director}
Assistant Director
Project Implementation
Dept.
In charge of Substations (SS)
In charge of Transmission Lines (TL)
In charge of 230kV SS
In charge of 500kV TL
In charge of 230kV TL (including Underground TL) In charge of Sar
Ta Lin SS

Transmission Project Preparatory Survey Phase III
Final Report (Advanced Release)
9-1
9. Evaluation of the Project
9.1. Quantitative Evaluation
Benefits The following two ideas can be considered as benefits from the implementation of this project.
(1) Reduction of Transmission Line Losses By comparing the power flow in 2030 with and without this project, the transmission line losses
across the whole system are calculated as follows. In this calculation, thermal power generations in
Yangon city are assumed to be the same.
Figure 9.1-1 Comparison of the Power Flow in 2030 with and without this Project
Thus, a comparison of the power transmission line losses for the two is as follows.
Table 9.1-1 Comparison of Transmission Line Losses with without Difference
Outside 109.6 MW 127.3 MW
Area 64.4 MW 134.6 MW
Total 174.0 MW 261.9 MW 87.9 MW
In the 2030 grid configuration, there will be an 87.9 MW transmission line loss difference during
peak hours. If the power transmission losses are reduced, the difference will help curtail power
generation at thermal power plants, and the implementation of this project will create benefits.
(2) Reduction of Thermal Power Generation in Yangon city Without this project, transmission capacity from the northern hydropower and China, which have
low power generation costs, to Yangon city will be limited due to a transmission capacity bottleneck.
For this reason, contracts with rental thermal power plants in Yangon City, where power generation
costs are high, must be extended. By implementing this project, it will be possible to increase the
amount of power transmitted from the low-cost northern hydropower and China to Yangon city, and
avoid extending contracts with rental thermal power plants.
The following shows a comparison of power flow in 2030 with and without this project. In the case
with this project, the contracts with rental thermal power plants have not been extended, so the supply
capacities in Yangon city have decreased and the amount of power transmission from the north has
increased.
With this Project Without this Project
(Source: JICA Survey Team)
(Source: JICA Survey Team)

Transmission Project Preparatory Survey Phase III
Final Report (Advanced Release)
9-2
Figure 9.1-2 Comparison of the Power Flow in 2030 with and without this Project (change in operating amount of thermal power in Yangon city)
In the case without this project, part of the power flow from the north to the 500 kV PYG substation
will be transmitted to the 230 kV Kamarnat substation, but most of the power will be transmitted once
to the 500 kV HLT substation and electricity will be supplied to Yangon city from it. However, the 500
kV HLT substation receives 1,390 MW of electricity from the west and there is a limit on the
transmission capacity that can be supplied to the 230 kV system from the 500 kV HLT substation. As
a result, the power flow from the north into the 500 kV PYG substation must be limited. For this reason,
there will be a shortage of power in the city and it will be necessary to increase the amount of power
generated by thermal power plants, including rental thermal power plants in Yangon city, which have
a high generation cost.
Table 9.1-2 Comparison of Supply Capacity in 2030
With this Project Without this
Project
Supply From outside of Yangon city 5,555 MW 3,723 MW
From thermal power plants in Yangon
city 2,429 MW 4,199 MW
Demand Demand in substations 7,706 MW 7,706 MW
Transmission losses etc. 278 MW 216 MW
By implementing this project, it will be possible to stop rental thermal power plants (Phase I, II:
1,770 MW).
<Evaluation of the transmission line loss increase>
As the power supply inside the city is stopped, and power is transmitted from the northern area, this
increases the overall transmission line losses. In this case, the transmission line losses between the two
are compared as follows, resulting in an increase in transmission line losses of 206.5 MW.
Table 9.1-3 Comparison of Transmission Line Losses (change in operating amount of thermal power in Yangon city)
with without Difference
Outside 239.0 MW 127.3 MW
Area 229.4 MW 134.6 MW
Total 468.4 MW 261.9 MW - 206.5 MW
With this Project Without this Project
(Source: JICA Survey Team)
(Source: JICA Survey Team)
(Source: JICA Survey Team)

Transmission Project Preparatory Survey Phase III
Final Report (Advanced Release)
9-3
Based on the calculation method described in the previous section, the decrease in annual benefits
(2020 value) due to the increase in transmission line losses is as follows.
206.5MW x 0.553 x 8760 x 185.0 Kyat/kWh = 185,064 million Kyat (123.4 million USD)
<Overall benefits (2020 value)> The benefits are expected to be 505,718 million Kyat (337.1 million USD) annually in terms of fuel
cost savings by stopping high fuel cost rental thermal power plants (1,770 MW) and switching to low-
cost hydropower and imports from the neighboring countries. The increase in fuel costs due to an
increase in transmission line losses results in an annual increase of 185,064 million Kyat (123.4 million
USD). The shutdown of high-cost rental thermal power plants has a significant effect on reducing fuel
costs, and the total benefits are 320,654 million Kyat (213.8 million USD) per year. Greater benefits
can be expected than those that result only from the reduction of transmission line losses as described
in the previous section.
EIRR and FIRR
(1) FIRR DPTSC, the implementing agency for the Project, is in charge of the construction and management
of the transmission network as an internal agency of MOEE, but it does not receive revenue from the
transmission business; MOEE earns revenue by selling electricity procured from power generators
through DPTSC's transmission network. The revenue from the transmission business, i.e. DPTSC's
business revenue, can be regarded as the revenue from the sale of MOEE's electricity minus the
payment to the power producers.
In general, the benefits of transmission lines are as follows, and the revenues of transmission
projects are also derived from benefits 1 to 3.
1. Increase in revenue from sales of electricity due to increased power transmission
2. Reduction of power generation costs by reducing transmission losses
3. Reduction of power generation costs through procurement of cheaper power sources by
changing the power supply composition (in this case, since it involves an increase or decrease in
transmission losses, the increase or decrease in transmission losses is counted as an increase or
decrease in power generation costs)
In the FIRR calculation, the following approach was used to calculate the increase in business
income.
1. Increase in revenue from sales of electricity due to increased power transmission.
Considering the emergency power supply, the amount of electricity supplied to Yangon will not
change with or without the implementation of the project, and the revenue from the sale of electricity
by 1 will not change.
2. Reduction of power generation costs by reducing transmission losses.
Transmission losses will be reduced by the implementation of the project, resulting in higher
financial revenues, as payments to the power producers will be reduced.
3. Reduction of power generation costs through procurement of cheaper power sources by changing
the power supply composition.
This effect is excluded from the increase in financial revenue, as the scope of implementation by
the project to achieve this effect is considered to be limited.
Therefore, the only change in financial revenue due to the implementation of the project is the
reduction of payments to the power generation companies due to the reduction of transmission losses
in 2.
FIRR is calculated as follows by simply evaluating the transmission line loss reduction effect as the
benefit gained from implementing this project. FIRR = 5.6%.

Transmission Project Preparatory Survey Phase III
Final Report (Advanced Release)
9-4
Table 9.1-4 FIRR Calculation Sheet
2020 FIRR (Base Case) 5.6%
NPV -163.8
B/C 0.6 million USD
Maintenance Personnel
-6 2020 0.00 0.00 0.00 0.00
-5 2021 6.31 6.31 0.00 (6.31)
-4 2022 94.09 94.09 0.00 (94.09)
-3 2023 154.73 154.73 0.00 (154.73)
-2 2024 188.33 188.33 0.00 (188.33)
-1 2025 157.52 157.52 0.00 (157.52)
0 2026 32.51 32.51 0.00 (32.51)
1 2027 1.70 1.14 2.84 52.52 49.68
2 2028 1.70 1.14 2.84 52.52 49.68
3 2029 1.70 1.14 2.84 52.52 49.68
4 2030 1.70 1.14 2.84 52.52 49.68
5 2031 1.70 1.14 2.84 52.52 49.68
6 2032 1.70 1.14 2.84 52.52 49.68
7 2033 1.70 1.14 2.84 52.52 49.68
8 2034 1.70 1.14 2.84 52.52 49.68
9 2035 1.70 1.14 2.84 52.52 49.68
10 2036 1.70 1.14 2.84 52.52 49.68
11 2037 1.70 1.14 2.84 52.52 49.68
12 2038 1.70 1.14 2.84 52.52 49.68
13 2039 1.70 1.14 2.84 52.52 49.68
14 2040 1.70 1.14 2.84 52.52 49.68
15 2041 1.70 1.14 2.84 52.52 49.68
16 2042 1.70 1.14 2.84 52.52 49.68
17 2043 1.70 1.14 2.84 52.52 49.68
18 2044 1.70 1.14 2.84 52.52 49.68
19 2045 1.70 1.14 2.84 52.52 49.68
20 2046 1.70 1.14 2.84 52.52 49.68
21 2047 1.70 1.14 2.84 52.52 49.68
22 2048 1.70 1.14 2.84 52.52 49.68
23 2049 1.70 1.14 2.84 52.52 49.68
24 2050 1.70 1.14 2.84 52.52 49.68
25 2051 1.70 1.14 2.84 52.52 49.68
26 2052 1.70 1.14 2.84 52.52 49.68
27 2053 1.70 1.14 2.84 52.52 49.68
28 2054 1.70 1.14 2.84 52.52 49.68
29 2055 1.70 1.14 2.84 52.52 49.68
30 2056 1.70 1.14 2.84 52.52 49.68
NPV 417.86 254.05 -163.81
(at 10% Discount Rate)
Financial
Benefit (B)
Net
(B) - (C)Year
O&M costs
Operation
Activities
Construction
Total Costs
(C)
Construction
Work
Financial Costs (C)

Transmission Project Preparatory Survey Phase III
Final Report (Advanced Release)
9-5
(2) EIRR The EIRR calculation takes into account the change in the power supply mix, i.e., cheaper power
supply procurement by avoiding the extension of emergency power supply contracts, and the
associated increase in transmission losses; the Local Currency portion is considered non-tradable
goods, and the project cost converted from the price of the non-tradable goods by SFC is used.
In terms of the benefits gained from implementing this project, the EIRR is calculated as follows
by evaluating the fuel cost reduction effect of avoiding the extension of contracts with rental thermal
power plants in Yangon City. The EIRR is 21.4%.
Table 9.1-5 EIRR Calculation Sheet
(Source: JICA Survey Team)
2020 FIRR (Base Case) 21.4%
NPV 1,988.4
B/C 75.3 million USD
Maintenance Personnel
-6 2020 0.00 0.00 0.00 0.00
-5 2021 6.18 6.18 0.00 (6.18)
-4 2022 92.61 92.61 0.00 (92.61)
-3 2023 152.47 152.47 0.00 (152.47)
-2 2024 185.49 185.49 0.00 (185.49)
-1 2025 155.08 155.08 0.00 (155.08)
0 2026 32.00 32.00 0.00 (32.00)
1 2027 1.70 1.14 2.84 213.77 210.93
2 2028 1.70 1.14 2.84 213.77 210.93
3 2029 1.70 1.14 2.84 213.77 210.93
4 2030 1.70 1.14 2.84 213.77 210.93
5 2031 1.70 1.14 2.84 213.77 210.93
6 2032 1.70 1.14 2.84 213.77 210.93
7 2033 1.70 1.14 2.84 213.77 210.93
8 2034 1.70 1.14 2.84 213.77 210.93
9 2035 1.70 1.14 2.84 213.77 210.93
10 2036 1.70 1.14 2.84 213.77 210.93
11 2037 1.70 1.14 2.84 213.77 210.93
12 2038 1.70 1.14 2.84 213.77 210.93
13 2039 1.70 1.14 2.84 213.77 210.93
14 2040 1.70 1.14 2.84 213.77 210.93
15 2041 1.70 1.14 2.84 213.77 210.93
16 2042 1.70 1.14 2.84 213.77 210.93
17 2043 1.70 1.14 2.84 213.77 210.93
18 2044 1.70 1.14 2.84 213.77 210.93
19 2045 1.70 1.14 2.84 213.77 210.93
20 2046 1.70 1.14 2.84 213.77 210.93
21 2047 1.70 1.14 2.84 213.77 210.93
22 2048 1.70 1.14 2.84 213.77 210.93
23 2049 1.70 1.14 2.84 213.77 210.93
24 2050 1.70 1.14 2.84 213.77 210.93
25 2051 1.70 1.14 2.84 213.77 210.93
26 2052 1.70 1.14 2.84 213.77 210.93
27 2053 1.70 1.14 2.84 213.77 210.93
28 2054 1.70 1.14 2.84 213.77 210.93
29 2055 1.70 1.14 2.84 213.77 210.93
30 2056 1.70 1.14 2.84 213.77 210.93
NPV 26.77 2015.19 1988.41
(at 10% Discount Rate)
Economic
Benefit (B)
Net
(B) - (C)
O&M costsTotal Costs
(C)
Operation
Year Activities
Construction
Construction
Work
Economical Costs (C)

Transmission Project Preparatory Survey Phase III
Final Report (Advanced Release)
9-6
In the above calculation, the unit price for power received from the neighboring countries is assumed
to be 80% of rental thermal power plants, but if it is assumed to be 90% of rental thermal power plants,
the benefit will be reduced to 99.15 million USD, and EIRR = 18.1%.
9.2. Reducing Greenhouse Gas Emissions The implementation of the project is expected to reduce greenhouse gas emissions from the fuel
combustion of thermal power because implementing the project will make it possible to avoid the
extension of thermal power contracts for the emergency power supply in Yangon City, and will
enable the supply of power to Yangon City through hydropower in the north and transmission from
other countries. However, the power supply from inside the city will be shut down and power will
come from the north, increasing the overall transmission losses.
The greenhouse gas emission reduction amount was calculated by subtracting the increase in
emissions due to increased transmission losses from the greenhouse gas emission reduction by
replacing the electricity supplied by emergency power sources in Yangon before the project with
hydropower sources in the north and power sources from other countries after the project. The
format of the JICA Support Tool for Change Measures was used as the calculation tool. The amounts
of power supply and transmission losses used for the comparison before and after the
implementation of the project were calculated in accordance with the previous section. The CO2
reductions were calculated under the following conditions.
Electricity will be supplied by an emergency power source before the project is implemented
(natural gas with an emission factor of 56,100 kg/TJ (Appendix 2 of the Support Tool)
assuming 35% efficiency)
After the implementation of the project, the following power sources will be used to supply
electricity
3 months of rainy season: supply from northern hydropower, and neighboring countries'
hydropower
9 months of dry season: supplied by neighboring countries (emission factor for grid
electricity is 672 g-CO2/kWh, which is the Asian average)
The result was a reduction of 615,703 tCO2/year. The calculation table is shown in Table 9.2-1.

Transmission Project Preparatory Survey Phase III
Final Report (Advanced Release)
9-7
Table 9.2-1 -Calculation Table for Greenhouse Gas Emissions Reduction
(Source: Format of the JICA Climate Change Support Tool)
12. Transmission System Efficiency Improvement
Project Name
Country
Emission ReductionValue Unit
ERy Emission reduction 615,703 tCO2/year
BEy Baseline emissions 6,441,799 tCO2/year
PEy Project emissions 5,826,096 tCO2/year
Input *Input only orange cell
Parameter Description Value Unit
Amount of electricity from power sources (emergency generators) in base line in year y 11,163.7 GWh/year
Amount of electricity from power sources (hydropower) during wet seasons in the project in year y 2,790.9 GWh/year
Amount of electricity from power sources (from other countries) during dry seasons in the project in year y 8,372.8 GWh/year
Increase in transmission line losses in the project in year y 1,000.3 GWh/year
National Power Transmission Network Development Project Phase III
Myanmar
Calculations
Value Unit
615,703 tCO2/year
6,441,799 tCO2/year
Amount of electricity from power sources in base line in year y 11,163.7 GWh/year
CO2 emission factor of electricity (emergency generators) 0.577 tCO2/MWh
Power generation effiency of emergency generators 35%
Effective CO2 Emission Factor (kg/TJ) Natural Gas 56,100.0 kg/TJ
5,826,096 tCO2/year
Amount of electricity from power sources during wet seasons in the project in year y 2,790.9 GWh/year
CO2 emission factor of electricity (hydro) 0.0 tCO2/MWh
Amount of electricity from power sources during dry seasons in the project in year y 8,372.8 GWh/year
CO2 emission factor of electricity (other countries Asia) 0.672 tCO2/MWh
Increase in transmission line losses in the project in year y 1,000.3 GWh/year
CO2 emission factor of loss 0.266 tCO2/MWh
Baseline emission
Project emission
Emission reduction
Table Default Values
Effective CO2 Emission Factor (kg/TJ) (Natural Gas) 56,100 kg/TJ
Power generation effiency of emergency generators 0.35
CO2 emission factor of electricity (Hydropower) 0 tCO2/MWh
CO2 emission factor of electricity (From other countries) 0.672 tCO2/MWh
CO2 emission factor of electricity (Myanmar) 0.266 tCO2/MWh

Transmission Project Preparatory Survey Phase III
Final Report (Advanced Release)
9-8
9.3. Performance Effectiveness Indicators
(1) Performance Effectiveness Indicators The performance indicators are set as the availability (%) of the new 500 kV transmission lines, 230
kV transmission lines, and 500 kV substations to be built under the Project at maximum load and the
amount of power sent at the end of transmission lines in 2028, after the Project starts operation. The
performance effectiveness indicators are shown in Table 9-1.
Table 9-1Operational Effectiveness Indicators Number of
lines/units
Rated capacity
of equipment
(MVA)
2028
Maximum
load (MW)
Target value 1
Operating rate
at maximum
load
Target value 2
Amount of
electricity at
transmission end
(GWh/year)
500 kV Pharyargyii -
Sartalin transmission line
2 4,420
1,451 33%. 7,888
500 kV Sartalin
Substation 500 kV/230
kV Transformer
3 1,500 1,445 96%. 7,862
500 kV Sartalin
Substation - 230 kV
Hlawga Substation
4 1,492 i 914 61%. 4,844
500 kV Sartalin
Substation - 230 kV East
Dagon Substation
2 1,391 333 24%. 1,712
230 kV Hlawga
Substation - 230 kV
Thaketa Substation
2 777 ii 517 67%. 2,400
(2) Calculation of Each Indicator Each indicator was calculated according to the results of the power flow calculation for 2028 shown
in Figure 9.3-1 Power Flow Diagram in 2028 after completion of . The power factor is assumed to
be 90%.
During peak demand Off-peak demand Figure 9.3-1 Power Flow Diagram in 2028 after completion of Phase III
The operating rate of facilities at maximum load is given by
Operating rate at maximum load (%) = Maximum load (MW) / Rated capacity (MVA) x Power
Factor
Note that for the sections between the 500 kV Sartalin substation and 230 kV Hlawga substation,

Transmission Project Preparatory Survey Phase III
Final Report (Advanced Release)
9-9
and between the 230 kV Hlawga substation and 230 kV Thaketa substation, the capacity of these
sections is equal to the capacity of the underground line section because the capacity of the
underground line section is smaller than the capacity of the overhead line section.
The amount of energy sent at the end of the transmission line (GWh/year) was estimated using the
following method.
Off-peak demand was set at 50% of maximum demand.
The annual amount of energy transmitted was the average of the energy transmitted during
maximum and off-peak demand.
The power generated in Yangon during off-peak demand was assumed to be the same as the
power generated during peak demand. The reasons are given below.
In the power supply operation for one day in April 2019 shown in Figure 9.3-2, thermal
power plants have hardly changed their output, and the supply-demand balance is
maintained by adjusting the output of hydroelectric power plants. For this reason, it was
assumed that there would be no adjustment of thermal power output during the day or
night.
In the plans for this project, the thermal power plants in Yangon are almost at full output,
and yet the project is considering transmitting the necessary power from the north. On the
other hand, during the rainy season, the amount of electricity that can be generated by the
hydroelectric power plants is higher, so there is a possibility that surplus electricity from
the north can be transmitted to Yangon, thereby reducing the amount of electricity
generated by the thermal power plants. However, the appropriateness of the additional
transmission lines needed to curb the output of the thermal power plants in Yangon during
the rainy season is considered to be something to be explored after the implementation of
this project, which is urgently needed to ensure stable supply in Yangon. The
appropriateness of these additional transmission lines will be considered by taking into
account the type of contracts with thermal power plant IPPs (feed-in tariff, etc.), the
development plans for hydropower plants, the amount of electricity that can be generated
during the wet and dry seasons, and the costs of generation and transmission lines. For
this reason, in this project, the same amount of power generated was assumed for the wet
and dry seasons without anticipating any change in the amount of power generated by
thermal power plants during the wet and dry seasons.
Therefore, it was assumed that the power generated in Yangon would be the same during
both peak and off-peak demand.
Figure 9.3-2 One-day Operation of Power Generation in April 2019

Transmission Project Preparatory Survey Phase III
Final Report (Advanced Release)
9-10
(3) Voltage Drops and Transmission Loss Indexing As described in 1.5.4, the voltage in the city center tends to decrease in the Yangon City 230 kV
system, and power capacitors need to be installed to improve voltage drops. In order to improve the
voltage drop issue, power capacitors should be installed on the load side of Yangon's 230 kV system
at Thaketa, Ahlone, and Thanlyin, or on the lower 66 kV and 33 kV systems. However, the load power
factor assumed in this planning study is 90%, which is an approximate setting, and the distribution of
grid voltage can only be approximately calculated. Therefore, in order to study the effective amount
and location of power capacitors to be installed, it is considered that this matter should be studied in
detail by monitoring the load power factor, power flow, and voltage during actual operation after the
completion of Phase III. Therefore, voltage drop was not adopted as an indicator for this project. After
the completion of Phase II, it will be necessary to investigate the degrees of voltage drops, the
magnitudes of power flows in the transmission lines, the magnitudes of loads in the substations, the
power factors of the loads, and the power generated, to study the locations and the capacities of the
capacitors to be installed. It should be noted that power capacitors can be installed within about two
years of planning.

Transmission Project Preparatory Survey Phase III
Final Report (Advanced Release)
10-1
10. Preliminary Data Collection Survey for Plan for Power Grid Extension to Mawlamyaing
10.1. Outline of the Survey A preliminary data collection survey was conducted for the Yangon region, particularly on the
expansion of the bulk power transmission lines between Yangon and Mawlamyaing. This chapter
presents an overview of the survey. The results will be reported separately in February 2021.
In Myanmar, there is an urgent need to improve the bulk power transmission lines in the northern,
western and southeastern regions of the country, with Yangon at the center. The 500 kV system from
the north to the Yangon area is already under construction in Phase I/II, and there is an urgent need to
improve the power transmission network to the southeast.
Mawlamyaing is a city located about 300 km southeast of Yangon, with plans for an industrial park
in the vicinity. A power plant is planned in the Dawei district (Kanbouk) in the south. In addition, an
interconnected transmission line from Thailand is planned at Myawaddy, on the border with Thailand,
northeast of Mawlamyaing. Since there is only a single circuit line of 230 kV between Mawlamyaing
and Pharyargyi, which does not meet the N-1 requirement, and the load is getting heavier, a new 230
kV transmission line with double circuits is currently planned to be built by DPTSC. In addition, a
230 kV transmission line with double circuits between Mawlamyaing and Myawaddy was recently
constructed.
10.2. Data Collection on System Configuration
Current Status and Plans for System Configuration
(1) Current Status of Grid Structure The system diagram from Pharyargyi to the southeast, obtained from DPTSC, is shown in Figure
10.2-1. 500 kV and 230 kV systems are planned from Pharyargyi to the southeast.
Source: left: obtained from DPTSC, November 2018; right: prepared by the JICA Survey Team.
Figure 10.2-1 System Map of the Southeast from Pharyargyi

Transmission Project Preparatory Survey Phase III
Final Report (Advanced Release)
10-2
Source: Prepared by JICA Survey Team
Figure 10.2-2 System Configuration in Eastern Yangon and Southeast from Pharyargyi
(2) Consideration of Power System Planning The power flows for each section of the system from Pharyargyi to the southeast were estimated
and the adequacy of the system plan was discussed.
(3) Assumptions regarding Power Demand Based on the power demand forecast in the JICA Master Plan, the maximum demand at the district
level was assumed based on the maximum demand forecast for the region and the population ratio.
Kamarnat Sittaung
230/33/11 kV 50 MVA
Thaton.
Mawlamyaing
230/66/11 kV
150 MVA (->2x100)
Myanmar Lighting
IPP 230 MW
Myaungtagar
Thilawa
Thanlyin
Phryargyi
2 x 605 MCM
61 miles (to
Thanlyin)
2 x 605 MCM
8.4 miles (Thilawa
In/Out)
2 x 605 MCM
39.97 miles
2 x 605 MCM
36.6 miles
Tharyargone
2 x 605 MCM
58.8 miles (336.4 MCM per
side?)
2 x 605 MCM
60.25 miles
2 x 605 MCM
49.77 miles
Hlawga
Thaketa
Shewtaung
2 x 605 MCM
19.14 miles
Minhla
2 x 605 MCM
65.39 miles
2 x 605 MCM
62.96 miles
1 x 795 MCM
13.85 miles
1 x 795 MCM
94.01 miles
2 x 605 MCM
7.7 miles
2 x 605
MCM
12.4 miles
(Dagon
(East) In/Out)
Taungoo
Lawpita
Pyu
Kun
1 x 795 MCM
60.55 miles
Thaephyu
2 x 265/35 sqmm
40.28 miles
50.95 MW Myawaddy.
Kanbouk.
1,230 MW
East
Dagon
1 x 795 MCM

Transmission Project Preparatory Survey Phase III
Final Report (Advanced Release)
10-3
(4) Existing Power Supply The existing power sources connected to the transmission system are three units of EPGE's Thaton
generators, with a total capacity of 50.95 MW, and Myanmar Lighting Company's IPP, with a total
capacity of 230 MW.
New Power Plant Construction Plans MOEE is planning to build an LNG-fired power plant in Kanbauk (Dawei district).
It was noted that the power supply envisioned from DPTSC to Kanbouk is uncertain and therefore
does not need to be considered in this planning survey. Therefore, this power source will not be
considered in this survey.
There are plans for an interconnection with Thailand.
Approximate Current Forecast Approximate power flows were estimated. The direction and magnitude of the power flows vary
greatly depending on the power outputs of power sources and the amount of power demand.
Based on the approximate stability estimates, it is considered that stable transmission of electricity
may be difficult in some cases, depending on the power outputs of the power sources and the amount
of power demand, with the existing single circuit of a 230 kV line and the double circuits of a 230 kV
line.
For this reason, a new 500 kV transmission line with double circuits is to be constructed, and the
following system configuration is considered.
Existing: 230 kV 1cct Kamarnat - Mawlamyaing
New: 230 kV 2cct Kamarnat - Mawlamyaing
New: 500 kV 2cct Pharyargyi - Mawlamyaing
Source: Prepared by JICA research team
Figure 10.2-3 Recommended System Configuration
In the future, it will be necessary to examine the amount of power that can be transmitted in detail
by calculating the stability of the system, including the interconnection with Thailand.
Kamarnat Sittaung Thaton
.
Mawlamyine
Phryargyi
Myawaddy
Thailand
500 kV
230 kV
230 MW 50 MW

Transmission Project Preparatory Survey Phase III
Final Report (Advanced Release)
10-4
10.3. Data Collection on New Power Transmission Lines
Conceptual Study of Transmission Line Routes
(1) Methodology of the Study on Power Transmission Line Routes The study on the 500 kV transmission line route between Pharyargyi and Mawlamyaing, which is
the target of this project, was conducted via desk research using the latest map data, such as Google
Earth.
(2) Location of Substations The substations to be included in this project are the 500 kV Pharyargyi substation, currently under
construction, and the new 500 kV Mawlamyaing substation.
Source: Prepared by JICA research team from Google Earth
Figure 10.3-1 500 kV Mawlamyaing Substation
(3) Transmission Line Routes
Overview of Transmission Line Routes A general overview of the 500 kV transmission line route between Pharyargyi and Mawlamyaing,
which is the target of this project, is shown in Figure 10.3-2. The route is based on the south of the
existing 230 kV Kamarnat-Thaton-Mawlamyaing transmission line route, which has the shortest
distance between Pyaryargyi and Mawlamyaing and easy access roads during construction. In addition,
the planned future 230 kV Kamarnat-Thaton-Mawlamyaing transmission line route was also
considered. The existing 230 kV Kamarnat-Thaton-Mawlamyaing transmission line route is in the
north, between Mawlamyaing and the Thaton substation. In this project, the shortest route to the north
of the conservation forests around Kamarnat is proposed.

Transmission Project Preparatory Survey Phase III
Final Report (Advanced Release)
10-5
ource: Prepared by JICA research team from Google Earth
Figure 10.3-2 Overview of the Transmission Line Routes
Figure 10.3-3 Status of Conservation Forests and Other Areas near Transmission Line Routes
; New 500 kV Pharyargyii―Mawlamyaing
(210km) ; Existing 230 kV Kamarnut―Thaton― Mawlamyaing
; New 230 kV Karmanat―Pharyargyii

Transmission Project Preparatory Survey Phase III
Final Report (Advanced Release)
10-6
10.4. Data Collection for Construction and Expansion of Substations
500 kV Pharyargy Phayagyi substation is under construction in the Phase II Project and 500 kV H-GIS switchgear for
Mawlamyaing’s new 500 kV Substation, and auxiliary equipment, such as transmission line protection
panels, are also being installed in the Phase II Project. Therefore, it is not necessary to install new
equipment for 500 kV transmission lines to Mawlamyaing substation and the scope of work in the new
project will cover only the connection of 500 kV transmission lines to the gantry structures in Phayagyi
substation.
Figure 10.4-1 Layout of Phayagyi Substation under Phase II Project
500 kV Mawlamyaing
(1) Location of Substation It is necessary to secure the space for the new 500 kV substation at the northern side of the existing
Mawlamyaing 230 kV substation and construct the new 500kV substation in that space, because the
existing Mawlamyaing 230 kV substation doesn’t have sufficient space for expansion as a 500 kV
substation.
(2) Equipment configuration The new Mawlamyaing 500kV substation will use H-GIS with a one and a half circuit breaker
system for 500 kV switchgear and AIS with a double busbar system for 230 kV switchgear, in
reference to similar projects like Phase I and Phase II of the JICA project, subject to securing enough
space for the construction of H-GIS. The major equipment in the new Mawlamyaing 500 kV substation
is shown in the following table:
Sar Ta Lin S/SMawlamyaing S/SNorth Side
500kV Switchyard
230kV Switchyard

Transmission Project Preparatory Survey Phase III
Final Report (Advanced Release)
10-7
Table 10.4-1 Equipment Configuration of New Mawlamyaing 500kV Substation Equipment name Overview Remarks
500kV Switchgear
(H-GIS)
2 feeders for Pyaji substation
x 2 feeders for Daway
Power line spare x 4 feeders
500/230kV transformer connection x 2 feeders
1+1/2CB method
230kV switchgear
(AIS)
2 feeders for 230kV substations in Mauramyne
2 feeders for Myawaddy Substation
Power line spare x 4 feeders
500/230kV transformer connection x 2 feeders
Main line contact x 1
dual bus bar
system
500/230kV
transformer
Outdoor installation, single phase, oil type,
ONAF/ONAN cooling system
166.7 MVA/phase x 7
OLTC included
On-site power
supply
400/230V AC panel, 110V DC panel, 48V DC panel,
DC battery, emergency generator, internal
transformer (33/0.4kV)
Protection and
control equipment
SCADA, power line protection equipment,
transformer protection equipment, etc.
10.5. Environmental and Social Considerations
Environmental Considerations Strategy of the study is described below. The results of the study will be reported sepaetely
following further technical examination in Feburary 2021.
(1) Confirmation of the Situation regarding Protected Areas, Key Biodiversity Area and Areas Surrounding the Planned Transmission Line Route
Status of Protected Areas and Reserved Forests There are no protected areas and or Key Biodiversity Areas (KBAs) on the planned transmission
line route from Phayargy to Mawlamyaing, but there is one reserved forest, Kalama Taung Reserved
Forestassumed to be a commercial conservation forest (e.g. rubber plantation), judging by satellite
images, as shown in Table 10.5-1. According to a Forest officer ofthere, Kalama Taung Reserved
ForesForest, it is defined as a Reserved Forest for 3 purposes;: (a) commercial reserved forest; (b)
local supply reserved forest; (c) watershed or catchments protection reserved forest as described in the
Forest Law (2018). Also, it is It was also confirmed that this Reserved Forest can be modified by
following the necessary procedure. In addition, although the actual area of influence on the
environment differs depending on the impact item, protected areas/reserved forests that exist within a
range of 10 km from the project target area were identified to secure a safe margin for this survey.
Transmission Project Preparatory Survey Phase III
Final Report (Advanced Release)
10-8
Source: Forest Department of related townships (2019); Protected areas and Reserved Forests
Figure 10.5-1 Protected Areas/KBA (left) and Reserved Forests (right) near the Project Site
Status of Cultural Heritage Sites Surrounding the Project Site There are no special cultural heritage sites on the planned transmission line route from Pharyargyi
to Mawlamyaing.
(2) Outline of Environmental and Social ConsideratoinsCategories required in accordance with the JICA Guidelines for Environmental and Social Considerations
Procedures in line with the EIA Procedure (2015) in Myanmar In accordance with the EIA Procedures, stipulated in December 2015, as prepared by the Ministry
of Environmental Conservation and Forestry (the former name of the Ministry of Natural Resources
and Environmental Conservation (MONREC)), the Project can be categorized as “EIA or IEE is
required”, as shown in Table 10.5-1.
Table 10.5-1 EIA/IEE/EMP Requirements related to the Project in Myanmar
No. Type of Investment Project Size of Project
which requires IEE Size of Project which requires EIA Notes
ENERGY SECTOR DEVELOPMENT
27 Electrical Power Transmission Lines ≥ 230 kV
All sizes All activities where the Ministry requires that the Project shall undergo EIA
-
* EIA: Environmental Impact Assessment
IEE: Initial Environmental Examination
Source: Extract from EIA Procedures (2015)
Procedures in line with the JICA Guidelines for Environmental and Social
Considerations There are descriptions concerning the illustrative list of sensitive sectors, characteristics, and areas
in Appendix 3 of the JICA Guidelines for Environmental and Social Considerations (2015), and the
Project was compared/summarized with these descriptions. With regard to the number of Project-

Transmission Project Preparatory Survey Phase III
Final Report (Advanced Release)
10-9
affected people during the construction of the new substations and the development of transmission
lines, the relocation of residents, businesses, and commercial activities due to land acquisition would
be avoided to the extent possible. Therefore, it is considered that it does not fall under sensitive sectors,
characteristics, and areas in Appendix 3 of the JICA Guidelines for Environmental and Social
Considerations (2015).
Table 10.5-2 Outline of the Project’s in line with the JICA Guidelines for Environmental and Social Considerations (2010)
Category Contents Outine of the Project
1. Sensitive Sectors
(6) Power transmission and distribution lines involving large-scale involuntary resettlement, large-scale logging, or submarine electrical cables
Technically, large-scale involuntary resettlement and large-scale deforestation can be avoided
2. Sensitive Characteristics
(1) Large-scale involuntary resettlement (2) Large-scale groundwater pumping (3) Large-scale land reclamation, land development, and land clearing (4) Large-scale logging
Technically, (1) and (4) can be avoided. (2) and (3) are not applicable.
3. Sensitive Areas
(1) National parks, nationally-designated protected areas (coastal areas, wetlands, areas for ethnic minorities or indigenous peoples and cultural heritage, etc. designated by national governments)
No direct impact is expected for protected areas, cultural heritage, and or Key Biodiversity Areas (KBA). Although the planned transmission line route passes through one reserved forest, this it can be changed through appropriate procedures because if it is a Kalama Taung Reserved Forest, it which is defined as a commercial//local supply/watershed or catchments protection reserved forestcommercial reserved forest. In addition, it does not modify vulnerable areas, such as areas in danger of soil erosion, or areas with a remarkable tendency towards desertification, will not be modified.
(2) Areas that are thought to require careful consideration by the country or locality a) Primary forests or natural forests in tropical areas b) Habitats with important ecological value (coral reefs, mangrove wetlands, tidal flats, etc.) c) Habitats of rare species that require protection under domestic legislation, international treaties, etc. d) Areas in danger of large-scale salt accumulation or soil erosion e) Areas with a remarkable tendency towards desertification
Note: The numbers listed correspond to the numbers listed in Attachment 3 of the JICA Environmental and Social Considerations
Guidelines (2010).
Source: The JICA Environmental and Social Considerations Guidelines (2010), with modifications by the JICA Survey Team
Social Considerations Strategy of the study is described below. The results of the study will be reported sepaetely
following further technical examination in Feburary 2021.
(1) Satellite Photo Analysis of the Proposed Site for the 500kV Mawlamyaing Substation
The 500kV Mawlamyaing Substation (80 acres/32.4 ha) is proposed to be in Mawlamyaing District,
Mon State.
Satellite photos of the area surrounding the proposed site, as well as a close-up of the proposed site,
were collected from Google Earth. The oldest available photos were taken in the year 2002, and the
most up-to-date were taken in 2019. The latest photos, taken in July 2019, are not suitable for the
analysis since the site is covered by clouds. The photos taken in December 2018 will be used to identify
and count the assets (such as structures, trees and crops) at the site and in the area surrounding the site
to understand the significance of the impacts of the substation construction.
(2) Satellite Photo Analysis of the Proposed Route for the 500kV Transmission Line Between Pharyargyi and Mawlamyaing Substations
The proposed route for the transmission line between Pharyargyi and Mawlamyaing Substations
will be studied using satellite photos of the surrounding area collected from Google Earth. Land use
and locations of structures and towns will be analyzed to understand the types and significance of the
impacts of the transmission line construction. Advice for the detailed study of the ROW location will

Transmission Project Preparatory Survey Phase III
Final Report (Advanced Release)
10-10
be listed to avoid and minimize the negative impacts.
(3) Preliminary Alternative Study for the Substation and Transmission Line In addition to the proposed project, the no-project case, and a case with a different site will provide
three (3) alternatives for a preliminary, qualitative comparative study.
Source: JICA Study Team, Google Earth (December 2018)
Figure 10.5-2 Satellite Photos of the Proposed Substation Site and Surrounding Area
Source: JICA Study Team, Google Earth
Figure 10.5-3 Satellite Photos of the Proposed Transmission Line Route
i Capacity of four combined lines in the underground line sinusoidal section (case with increased gap between
phases) ii Capacity of two lines in the underground line conduit section
Religious school Gayng River