
High Accuracy Numerical Methods for Thermally Perfect Gas Flows with Chemistry
Upload
khangminh22Category
view
2download
0
HAL Id: hal-01936489https://hal.archives-ouvertes.fr/hal-01936489
Submitted on 27 Nov 2018
HAL is a multi-disciplinary open accessarchive for the deposit and dissemination of sci-entific research documents, whether they are pub-lished or not. The documents may come fromteaching and research institutions in France orabroad, or from public or private research centers.
L’archive ouverte pluridisciplinaire HAL, estdestinée au dépôt et à la diffusion de documentsscientifiques de niveau recherche, publiés ou non,émanant des établissements d’enseignement et derecherche français ou étrangers, des laboratoirespublics ou privés.
A Comprehensive Numerical Study on Effects of NaturalGas Composition on the Operation of an HCCI Engine
O. Jahanian, S. A. Jazayeri
To cite this version:O. Jahanian, S. A. Jazayeri. A Comprehensive Numerical Study on Effects of Natural Gas Com-position on the Operation of an HCCI Engine. Oil & Gas Science and Technology - Revue d’IFPEnergies nouvelles, Institut Français du Pétrole, 2012, 67 (3), pp.503-515. �10.2516/ogst/2011133�.�hal-01936489�

A Comprehensive Numerical Studyon Effects of Natural Gas Compositionon the Operation of an HCCI Engine
O. Jahanian* and S.A. Jazayeri
Department of Mechanical Engineering, K. N. Toosi University of Technology, P.O. Box 19395-1999, Tehran - Irane-mail: [email protected] - [email protected]
* Corresponding author
Résumé — Une étude numérique complète sur les effets de la composition du gaz naturelcarburant sur le réglage d'un moteur HCCI — Le moteur HCCI (Homogeneous ChargeCompression Ignition, ou à allumage par compression d'une charge homogène) est une idéeprometteuse pour réduire la consommation de carburant et les émissions polluantes. Le gaz naturel,considéré généralement comme un carburant propre, est un choix approprié pour les moteurs HCCIen raison de sa capacité à former avec l'air un mélange homogène. Cependant, la composition du gaznaturel influe fortement sur les caractéristiques d’auto-inflammation du mélange dans le cylindre et laperformance du moteur HCCI. Cet article met l’accent sur l’influence de la composition du gaznaturel sur le fonctionnement du moteur en mode HCCI. Six différentes compositions de gaz naturel(y compris le méthane pur) ont été examinées pour étudier les performances du moteur au moyend’un modèle thermo-cinétique zéro-dimensionnel. Le code de simulation inclut la cinétique chimiquedétaillée de la combustion du gaz naturel, y compris le mécanisme étendu de Zeldovich pour évaluerles émissions de NOx. Les résultats ont été validés par comparaison avec des données expérimentalesprovenant d’autres travaux. La richesse et le taux de compression ont été maintenus constants, maisles effets de la vitesse du moteur et de la température initiale du mélange ont été étudiés. Les résultatsmontrent que la valeur maximale de la pression dans le cylindre et la température dépendent dunombre Wobbe du carburant. En outre, la puissance indiquée du moteur est linéairement liée aunombre Wobbe du carburant. Le travail indiqué brut, la pression moyenne indiquée brute et les NOxont aussi été utilisés pour comparer les performances du moteur utilisant des carburants decompositions différentes.
Abstract — A Comprehensive Numerical Study on Effects of Natural Gas Composition on theOperation of an HCCI Engine — Homogeneous Charge Compression Ignition (HCCI) engine is apromising idea to reduce fuel consumption and engine emissions. Natural Gas (NG), usually referredas clean fuel, is an appropriate choice for HCCI engines due to its suitable capability of makinghomogenous mixture with air. However, varying composition of Natural Gas strongly affects theauto-ignition characteristics of in-cylinder mixture and the performance of the HCCI engine. Thispaper has focused on the influence of Natural Gas composition on engine operation in HCCI mode.Six different compositions of Natural Gas (including pure methane) have been considered to studythe engine performance via a thermo-kinetic zero-dimensional model. The simulation code covers thedetailed chemical kinetics of Natural Gas combustion, which includes Zeldovich extended mechanismto evaluate NOx emission. Validations have been made using experimental data from other works to
Oil & Gas Science and Technology – Rev. IFP Energies nouvelles, Vol. 67 (2012), No. 3, pp. 503-515Copyright © 2011, IFP Energies nouvellesDOI: 10.2516/ogst/2011133
ogst100033_Jahanian 6/06/12 16:01 Page 503
Oil & Gas Science and Technology – Rev. IFP Energies nouvelles, Vol. 67 (2012), No. 3504
INTRODUCTION
Recent developments in internal combustion engine technologyhave been done under consideration of two important facts;the first one is shortage of crude oil resources and its instableglobal market, the other is enhancement of environmentalregulations and tightening legislations. There are two mainstrategies to satisfy these demands: using alternative fuelsother than crude oil products and switching to promisingcombustion technologies such as HCCI engines [1-4]. Onishiet al. [5] firstly represented the main concept of HCCI in1979 for two-stroke engines. They figured out that it ispossible to reduce engine emissions and fuel consumption bycompressing a homogenous fuel/air mixture until it reachesto the auto-ignition point. This idea was named as ActiveThermo-Atmospheric Combustion (ATAC) and rapidlydeveloped by Noguchi et al [6]. They showed the advantagesof this idea for part-load conditions. Najt et al [7] utilized thisconcept in four-stroke engines and finally in 1989 Thring [8]named it as HCCI.
The HCCI combustion process verily induces a premixedfuel/air mixture into the cylinder at lean equivalence ratios[9]. The homogenous fuel/air mixture is compressed withinthe cylinder until ignition occurs. This auto-ignition makes avery rapid combustion phase where all heat is releasedapproximately in 5 to 15 Crank Angle degrees (CA). Thisrate of heat release is controlled with a highly diluted mix-tures using air or Exhaust Gas Residual (EGR). The HCCIconcept affords the use of elevated compression ratios(approximately 17-20:1), unlike in SI engines, which are sus-ceptible to knock. The combination of lean burning and highexpansion ratios contributes to high thermal efficiencies thatcan approach 45% [10]. HCCI engines have demonstratedvery low emissions of Oxides of Nitrogen (NOx) andParticulate Matter (PM), as well as high thermal efficiency atpart load. However, there are some difficulties in applyingHCCI combustion to internal combustion engines. Ignitiontiming control and homogenous mixture preparation are themain difficulties of HCCI engines [11].
Natural Gas (NG) fuel demonstrates minimal mixturepreparation requirements, and is chemically very stable. It iswell suited to the HCCI combustion concept. NG exhibits arelatively simple molecular structure, which reacts to yieldfar less intermediate compounds as well as a low carbon tohydrogen ratio that result in reduced harmful exhaust gasemissions. Its high ignition resistance when coupled with
lean fuel/air mixtures affords the use of elevated compressionratios without pre-ignition of the charge [10].
Moreover, NG is relatively less expensive in many countriesand it has supply advantages in time, over gasoline and dieselfuel. NG is favored as a clean fuel for motor vehicles espe-cially in urban areas [12]. The technical advantages ofNatural Gas include extremely low photochemical reactivity,enclosed fueling system which results in low fuel leak toatmosphere, reduced emissions resulting from cold-start andlow-temperature operation, due to the elimination of coldmixture enrichment, and possibility of using fuel efficientand lean-burn technology [12]. Typically, the NG composi-tion includes methane with small amounts of ethane,propane, butane, carbon monoxide, nitrogen, and other tracecomponents. The composition varies depending on NGsource field. This variation affects on the operation of the NGfueled engines. Many researchers, focused on this phenom-ena [13-23]. One of the major concerns with varying NGcomposition in HCCI engines is Start of Combustion (SOC).
In this paper, a zero-dimensional single zone thermo-kineticmodel is developed to simulate the operation of an HCCIengine. The model uses GRI-Mech 3.0 [24] mechanism fordetail study on NG combustion including its varying compo-sition. High computational speed, and appropriate precisionfor calculating parameters such as SOC and in-cylinder tem-perature/pressure trends are the main reasons of using thismodel. In the next sections, the developed model isdescribed. This model is validated with experimental results.The final section includes the results on engine performanceand combustion characteristics via different NG compositionsfor a Volvo TD 100 engine.
1 MODEL DESCRIPTION
In this study, a zero-dimensional single zone thermo-kineticmodel is developed. This model has been validated and used inour previous studies [2, 3, 25, 26]. We have used MATLAB®
programming environment to develop the code andCANTERA® module to gain the thermo-chemical propertiesof reacting gas mixture. The model uses detailed chemicalkinetics while neglecting the effects of transport phenomenabecause HCCI combustion process is mainly dominated bychemistry without any evidence of flame propagation.
ensure the accuracy needed for comparison study. The equivalence ratio and the compression ratioare held constant but the engine speed and mixture initial temperature are changed for comparisonstudy. Results show that the peak value of pressure/temperature of in-cylinder mixture is dependent offuel Wobbe number. Furthermore, engine gross indicated power is linearly related to fuel Wobbenumber. Gross indicated work, gross mean effective pressure, and NOx are the other parametersutilized to compare the performance of engine using different fuel compositions.
ogst100033_Jahanian 6/06/12 16:01 Page 504
O Jahanian and SA Jazayeri / A Comprehensive Numerical Study on Effects of Natural Gas Compositionon the Operation of an HCCI Engine
505
2 THERMO-KINETIC MODELING APPROACH
The model assumptions can be described as below:– the engine is a four-stroke HCCI;– only the closed cycle from Inlet Valve Closing (IVC) to
Exhaust Valve Opening (EVO) is considered in themodel;
– the whole combustion chamber is defined as a uniformtemperature/pressure zone;
– all the components in the combustion chamber are treatedas perfect gas;
– blow-by is neglected;– the fuel/air mixture at IVC is completely homogenous;– a modified Woschni model [27] calculates the heat transfer
to cylinder wall.For exact study on combustion phenomena, detail chemical
kinetics has been considered in the model. The deailedmechanism used in this paper includes 325 primary reactionswith 53 chemical species. As this mechanism covers thecombustion reactions of methane, ethane, propane, and othercomponents of NG and includes the extended Zeldovichmechanism to calculate NOx emissions, it is suitable forinvestigation on NG combustion, especially with varyingcomposition such as ethane and propane.
2.1 Governing Equations
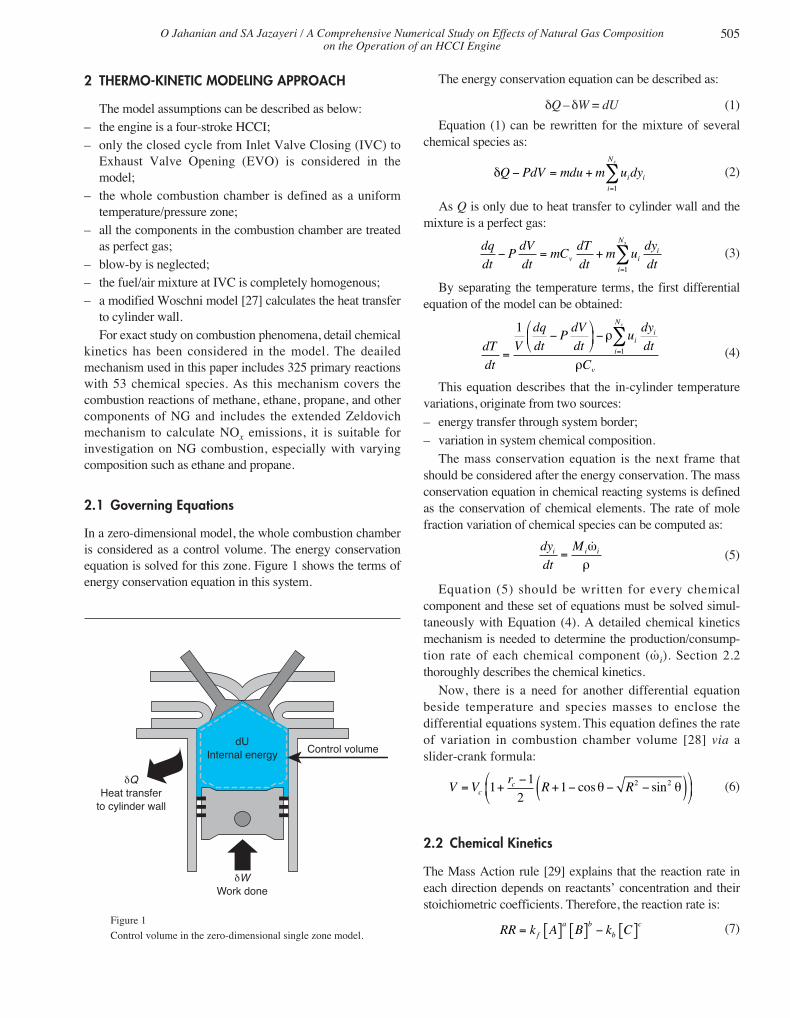
In a zero-dimensional model, the whole combustion chamberis considered as a control volume. The energy conservationequation is solved for this zone. Figure 1 shows the terms ofenergy conservation equation in this system.
The energy conservation equation can be described as:
δQ – δW = dU (1)
Equation (1) can be rewritten for the mixture of severalchemical species as:
(2)
As Q is only due to heat transfer to cylinder wall and themixture is a perfect gas:
(3)
By separating the temperature terms, the first differentialequation of the model can be obtained:
(4)
This equation describes that the in-cylinder temperaturevariations, originate from two sources:– energy transfer through system border;– variation in system chemical composition.
The mass conservation equation is the next frame thatshould be considered after the energy conservation. The massconservation equation in chemical reacting systems is definedas the conservation of chemical elements. The rate of molefraction variation of chemical species can be computed as:
(5)
Equation (5) should be written for every chemicalcomponent and these set of equations must be solved simul-taneously with Equation (4). A detailed chemical kineticsmechanism is needed to determine the production/consump-tion rate of each chemical component (ω· i). Section 2.2thoroughly describes the chemical kinetics.
Now, there is a need for another differential equationbeside temperature and species masses to enclose thedifferential equations system. This equation defines the rateof variation in combustion chamber volume [28] via aslider-crank formula:
(6)
2.2 Chemical Kinetics
The Mass Action rule [29] explains that the reaction rate ineach direction depends on reactants’ concentration and theirstoichiometric coefficients. Therefore, the reaction rate is:
(7)RR k A B k Cf
a b
b
c= [ ] [ ] − [ ]
V Vr
R Rcc= +
−+ − − −( )⎛
⎝⎜
⎞
⎠⎟1
1
21 2 2cos sinθ θ
dy
dt
Mi i i=�ω
ρ
dT
dt
V
dq
dtP
dV
dtu
dy
dt
C
ii
i
N
v
s
=
−⎛
⎝⎜
⎞
⎠⎟ −
=
∑1
1
ρ
ρ
dq
dtP
dV
dtmC
dT
dtm u
dy
dtv ii
i
Ns
− = +=
∑1
δQ PdV mdu m u dyi i
i
Ns
− = +=
∑1
δQHeat transfer
to cylinder wall
δWWork done
dUInternal energy Control volume
Figure 1
Control volume in the zero-dimensional single zone model.
ogst100033_Jahanian 6/06/12 16:01 Page 505
Oil & Gas Science and Technology – Rev. IFP Energies nouvelles, Vol. 67 (2012), No. 3506
Symbol [A] means the molar concentration of the compo-nent A, and the rate constant k is determined by Arrheniusrelation [29] in Equation (8). Indices f and b represent forwardand backward direction in an equilibrium reaction:
(8)
Each mechanism consists some primary reactions whichare either simple or with third body. A simple primary reac-tion can be assumed as:
(9)
For each simple primary reaction, the reaction rate equa-tion turns to:
(10)
Some primary reactions need a third body to be done. Asthe concentration of the third body effects the reaction rate, itdiffers from Equation (10) and should be written as:
(11)
The third body concentration includes the concentrationsof all species due to their enhance factor. Therefore, the reac-tion rate for these types of primary reactions is:
(12)
The coefficients can be obtained from different sourcesdescribing reaction mechanisms [30]. So the production/consumption rate of each chemical component can becalculated as:
(13)
2.3 Heat Transfer Model
For defining dq/dt, it is common to use Woschni heattransfer model for traditional internal combustion engines,but due to rapid combustion period of HCCI engines, a modi-fied relation [27] has been used in this paper. This modifiedmodel describes:
(14)
where the convection heat transfer coefficient is:
(15)h L P T S f P
f P
p= +
=
− −129 8 2 280 2 0 8 0 73 0 8. ( . ( ))
( )
. . . .
33 34 10 4. ( )× −− V T
PVP Pd r
r r
mot
dq
dthA T Tw= −( )
�ω υ υk i k i k i
i
N
RRR
= −( )=
∑ ' ", ,
1
RR a TB k Si k i k
k
N
f i k
k
sk i= [ ]
⎛
⎝⎜
⎞
⎠⎟× [ ] −
= =
∑ , ,
' ,
1 1
υNN
b i k
k
Nsk i
s
k S∏ ∏[ ]⎛
⎝⎜
⎞
⎠⎟
=
,
" ,υ
1
υ υ' ", ,k i i
k
N
k i i
k
N
S TB S TBs s
+ += =
∑ ∑�1 1
RR k S k Si f i k
k
N
b i k
k
Nk i
sk i
s
= [ ] − [ ]= =
∏,
'
,
", ,υ υ
1 1
∏∏
υ υ' " , , ...,, ,k i i
k
N
k i i
k
N
RS S i Ns s
�= =
∑ ∑ =1 1
1 2
k A TE
R TAra
u
=−⎛
⎝⎜
⎞
⎠⎟β exp
3 SELECTION OF NG COMPOSITIONS
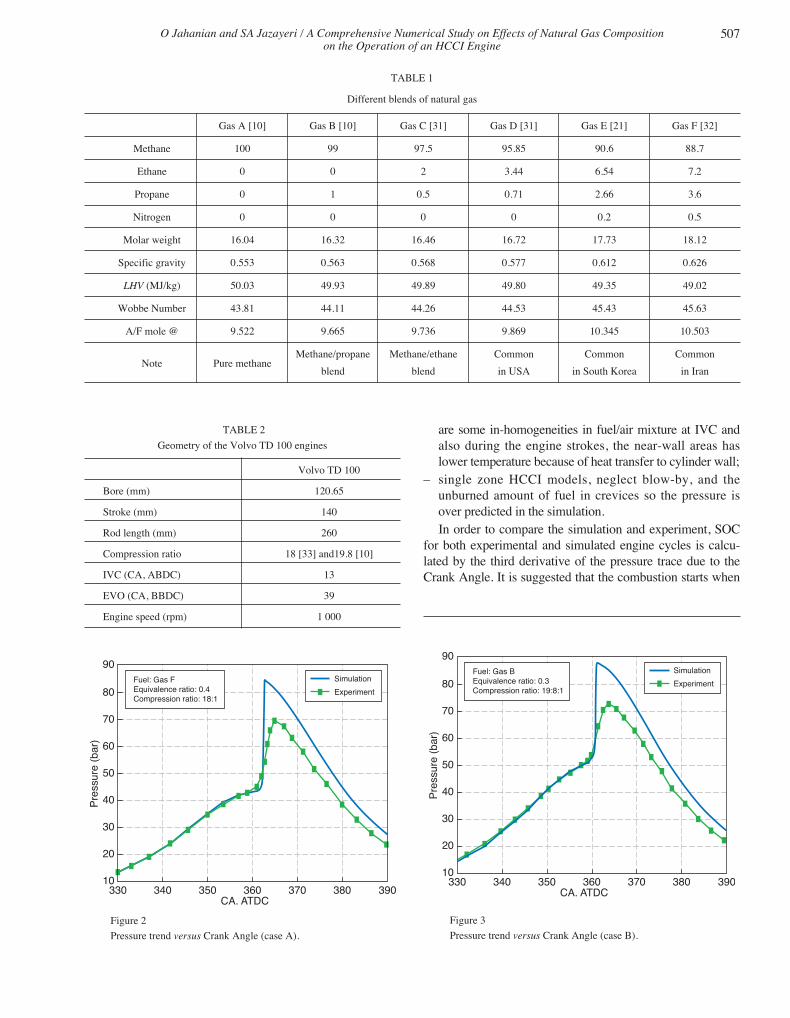
Six different kinds of NG having various compositions areselected to investigate the operations of an HCCI enginecharacteristic. These kinds include three common composi-tions used in Iran, South Korea, and USA, besides two blendsof light hydrocarbons, and pure methane gas for comparison.The different NG compositions are referred to as Gas A, B,C, D, E, and F in this paper. The compositions of these gasesare tabulated in Table 1. The table also includes molarweight, specific gravity, Low Heating Value (LHV), WobbeNumber (WN), and stoichiometric Air/Fuel ratio of the fuels.The procedure for calculating values in Table 1 is describedin Appendix A.
4 MODEL VALIDATION
The developed zero-dimensional single zone model has beenvalidated in previous work for two types of engineCaterpillar 3500 and Volvo TD 100 using “Gas A” and “GasB” as fuel [3]. As studies of this paper have been done forsingle cylinder Volvo TD 100 engine, the simulation codehas been calibrated by setting the parameters for this engineand two other comparisons for different fuel compositionsand operational conditions have been presented to ensure themodel accuracy. The engine’s geometry is shown in Table 2.
In case A, the engine is operating at 18:1 compression ratioand using “Gas F” as fuel with equivalence ratio of 0.4. Theexperimental data for this case is obtained from Reference[33]. The compression ratio is set to 19.8:1 for case B using“Gas B” as fuel with equivalence ratio of 0.3. This set up isselected due to experimental data of Reference [10]. “Gas B”and “Gas F” are chosen as the fuel, in purpose to cover thefull range of NG composition in this study. Furthermore, anoptimized mechanism is needed to trace the NG compositioneffects. “GRI-Mech 3.0 is an optimized mechanism designedto model Natural Gas combustion, including NO formationand re-burn chemistry. The optimization process is designedto provide sound basic kinetics, which also furnish the bestcombined modeling predictability of basic combustion prop-erties. Improvements were made in the categories of updatingthe kinetics with recent literature results, including some, newand improved target experiments to the optimization, expand-ing the mechanism and target selection, and examining thesensitivity to the thermodynamics” [24].
Figures 2 and 3 show the pressure trends in these twocases. As shown in Figures 2 and 3, the model can predict theoperational conditions of an HCCI engine with acceptableuncertainty. Similar to all single zone models, the peak cylin-der pressure is higher than the experimental results. This isbecause of:– the homogeneity of combustion chamber is the main
assumption of single zone models. But in real cases, there
ogst100033_Jahanian 6/06/12 16:01 Page 506
O Jahanian and SA Jazayeri / A Comprehensive Numerical Study on Effects of Natural Gas Compositionon the Operation of an HCCI Engine
507
TABLE 2
Geometry of the Volvo TD 100 engines
Volvo TD 100
Bore (mm) 120.65
Stroke (mm) 140
Rod length (mm) 260
Compression ratio 18 [33] and19.8 [10]
IVC (CA, ABDC) 13
EVO (CA, BBDC) 39
Engine speed (rpm) 1 000
are some in-homogeneities in fuel/air mixture at IVC andalso during the engine strokes, the near-wall areas haslower temperature because of heat transfer to cylinder wall;
– single zone HCCI models, neglect blow-by, and theunburned amount of fuel in crevices so the pressure isover predicted in the simulation. In order to compare the simulation and experiment, SOC
for both experimental and simulated engine cycles is calcu-lated by the third derivative of the pressure trace due to theCrank Angle. It is suggested that the combustion starts when
Figure 2
Pressure trend versus Crank Angle (case A).
TABLE 1
Different blends of natural gas
Gas A [10] Gas B [10] Gas C [31] Gas D [31] Gas E [21] Gas F [32]
Methane 100 99 97.5 95.85 90.6 88.7
Ethane 0 0 2 3.44 6.54 7.2
Propane 0 1 0.5 0.71 2.66 3.6
Nitrogen 0 0 0 0 0.2 0.5
Molar weight 16.04 16.32 16.46 16.72 17.73 18.12
Specific gravity 0.553 0.563 0.568 0.577 0.612 0.626
LHV (MJ/kg) 50.03 49.93 49.89 49.80 49.35 49.02
Wobbe Number 43.81 44.11 44.26 44.53 45.43 45.63
A/F mole @ 9.522 9.665 9.736 9.869 10.345 10.503
Note Pure methaneMethane/propane Methane/ethane Common Common Common
blend blend in USA in South Korea in Iran
380 390370360350340330
Pre
ssur
e (b
ar)
90
10
20
30
40
50
60
70
80
CA. ATDC
Simulation
Experiment
Fuel: Gas FEquivalence ratio: 0.4Compression ratio: 18:1
380 390370360350340330
Pre
ssur
e (b
ar)
90
10
20
30
40
50
60
70
80
CA. ATDC
Simulation
Experiment
Fuel: Gas BEquivalence ratio: 0.3Compression ratio: 19:8:1
Figure 3
Pressure trend versus Crank Angle (case B).
ogst100033_Jahanian 6/06/12 16:01 Page 507
Oil & Gas Science and Technology – Rev. IFP Energies nouvelles, Vol. 67 (2012), No. 3508
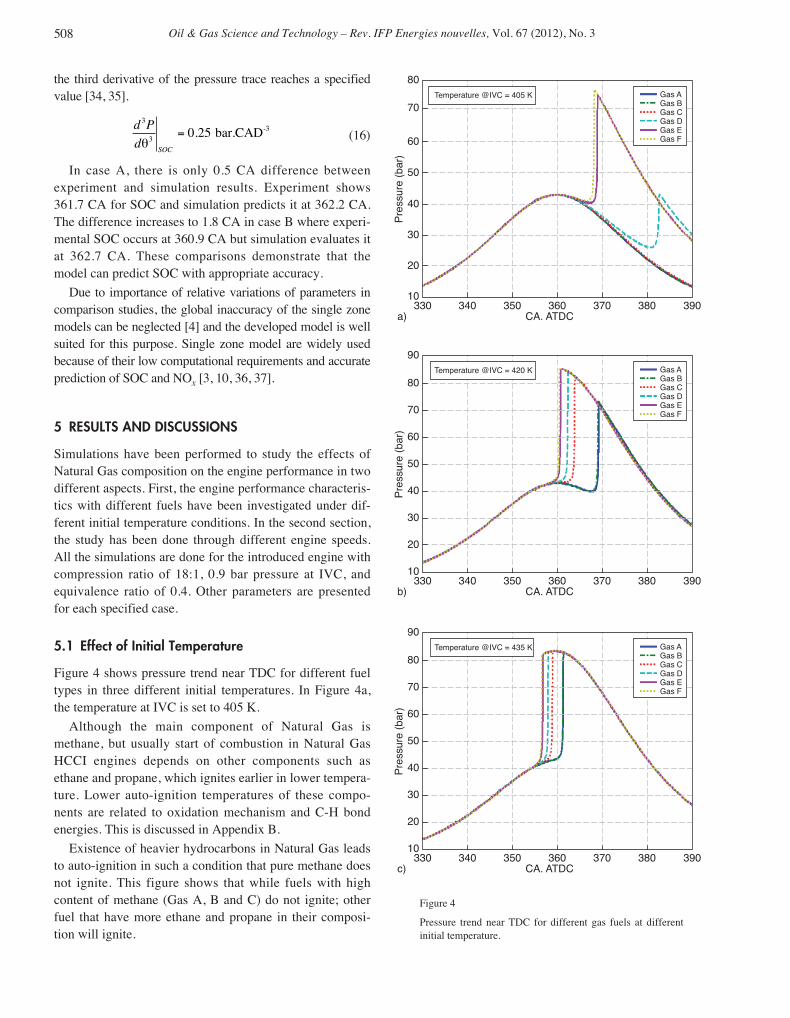
the third derivative of the pressure trace reaches a specifiedvalue [34, 35].
(16)
In case A, there is only 0.5 CA difference betweenexperiment and simulation results. Experiment shows361.7 CA for SOC and simulation predicts it at 362.2 CA.The difference increases to 1.8 CA in case B where experi-mental SOC occurs at 360.9 CA but simulation evaluates itat 362.7 CA. These comparisons demonstrate that themodel can predict SOC with appropriate accuracy.
Due to importance of relative variations of parameters incomparison studies, the global inaccuracy of the single zonemodels can be neglected [4] and the developed model is wellsuited for this purpose. Single zone model are widely usedbecause of their low computational requirements and accurateprediction of SOC and NOx [3, 10, 36, 37].
5 RESULTS AND DISCUSSIONS
Simulations have been performed to study the effects ofNatural Gas composition on the engine performance in twodifferent aspects. First, the engine performance characteris-tics with different fuels have been investigated under dif-ferent initial temperature conditions. In the second section,the study has been done through different engine speeds.All the simulations are done for the introduced engine withcompression ratio of 18:1, 0.9 bar pressure at IVC, andequivalence ratio of 0.4. Other parameters are presentedfor each specified case.
5.1 Effect of Initial Temperature
Figure 4 shows pressure trend near TDC for different fueltypes in three different initial temperatures. In Figure 4a,the temperature at IVC is set to 405 K.
Although the main component of Natural Gas ismethane, but usually start of combustion in Natural GasHCCI engines depends on other components such asethane and propane, which ignites earlier in lower tempera-ture. Lower auto-ignition temperatures of these compo-nents are related to oxidation mechanism and C-H bondenergies. This is discussed in Appendix B.
Existence of heavier hydrocarbons in Natural Gas leadsto auto-ignition in such a condition that pure methane doesnot ignite. This figure shows that while fuels with highcontent of methane (Gas A, B and C) do not ignite; otherfuel that have more ethane and propane in their composi-tion will ignite.
d P
dSOC
3
30 25
θ= . bar.CAD-3
380 390370360350340330
Pre
ssur
e (b
ar)
80
10
70
60
50
40
30
20
CA. ATDC
Temperature @IVC = 405 K Gas AGas BGas CGas DGas EGas F
380 390370360350340330
Pre
ssur
e (b
ar)
90
10
20
30
40
50
60
70
80
CA. ATDC
Temperature @IVC = 420 K Gas AGas BGas CGas DGas EGas F
380 390370360350340330
Pre
ssur
e (b
ar)
90
10
20
30
40
50
60
70
80
CA. ATDC
Temperature @IVC = 435 K Gas AGas BGas CGas DGas EGas F
a)
b)
c)
Figure 4
Pressure trend near TDC for different gas fuels at differentinitial temperature.
ogst100033_Jahanian 6/06/12 16:01 Page 508
O Jahanian and SA Jazayeri / A Comprehensive Numerical Study on Effects of Natural Gas Compositionon the Operation of an HCCI Engine
509
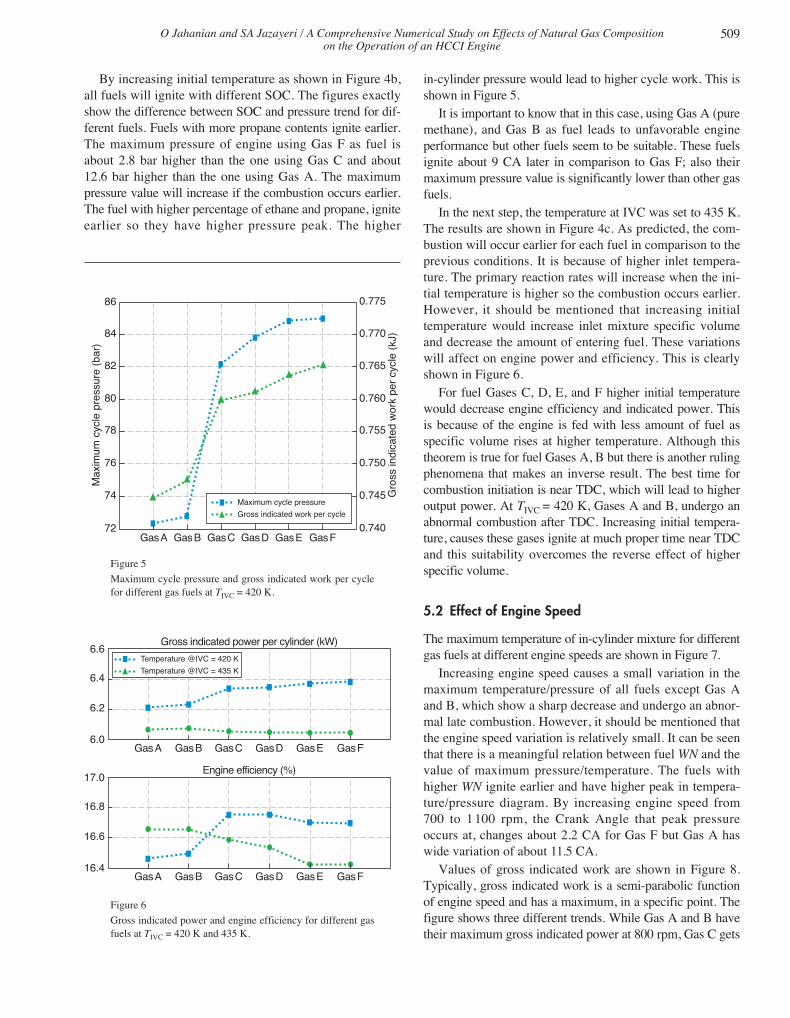
By increasing initial temperature as shown in Figure 4b,all fuels will ignite with different SOC. The figures exactlyshow the difference between SOC and pressure trend for dif-ferent fuels. Fuels with more propane contents ignite earlier.The maximum pressure of engine using Gas F as fuel isabout 2.8 bar higher than the one using Gas C and about12.6 bar higher than the one using Gas A. The maximumpressure value will increase if the combustion occurs earlier.The fuel with higher percentage of ethane and propane, igniteearlier so they have higher pressure peak. The higher
in-cylinder pressure would lead to higher cycle work. This isshown in Figure 5.
It is important to know that in this case, using Gas A (puremethane), and Gas B as fuel leads to unfavorable engineperformance but other fuels seem to be suitable. These fuelsignite about 9 CA later in comparison to Gas F; also theirmaximum pressure value is significantly lower than other gasfuels.
In the next step, the temperature at IVC was set to 435 K.The results are shown in Figure 4c. As predicted, the com-bustion will occur earlier for each fuel in comparison to theprevious conditions. It is because of higher inlet tempera-ture. The primary reaction rates will increase when the ini-tial temperature is higher so the combustion occurs earlier.However, it should be mentioned that increasing initialtemperature would increase inlet mixture specific volumeand decrease the amount of entering fuel. These variationswill affect on engine power and efficiency. This is clearlyshown in Figure 6.
For fuel Gases C, D, E, and F higher initial temperaturewould decrease engine efficiency and indicated power. Thisis because of the engine is fed with less amount of fuel asspecific volume rises at higher temperature. Although thistheorem is true for fuel Gases A, B but there is another rulingphenomena that makes an inverse result. The best time forcombustion initiation is near TDC, which will lead to higheroutput power. At TIVC = 420 K, Gases A and B, undergo anabnormal combustion after TDC. Increasing initial tempera-ture, causes these gases ignite at much proper time near TDCand this suitability overcomes the reverse effect of higherspecific volume.
5.2 Effect of Engine Speed
The maximum temperature of in-cylinder mixture for differentgas fuels at different engine speeds are shown in Figure 7.
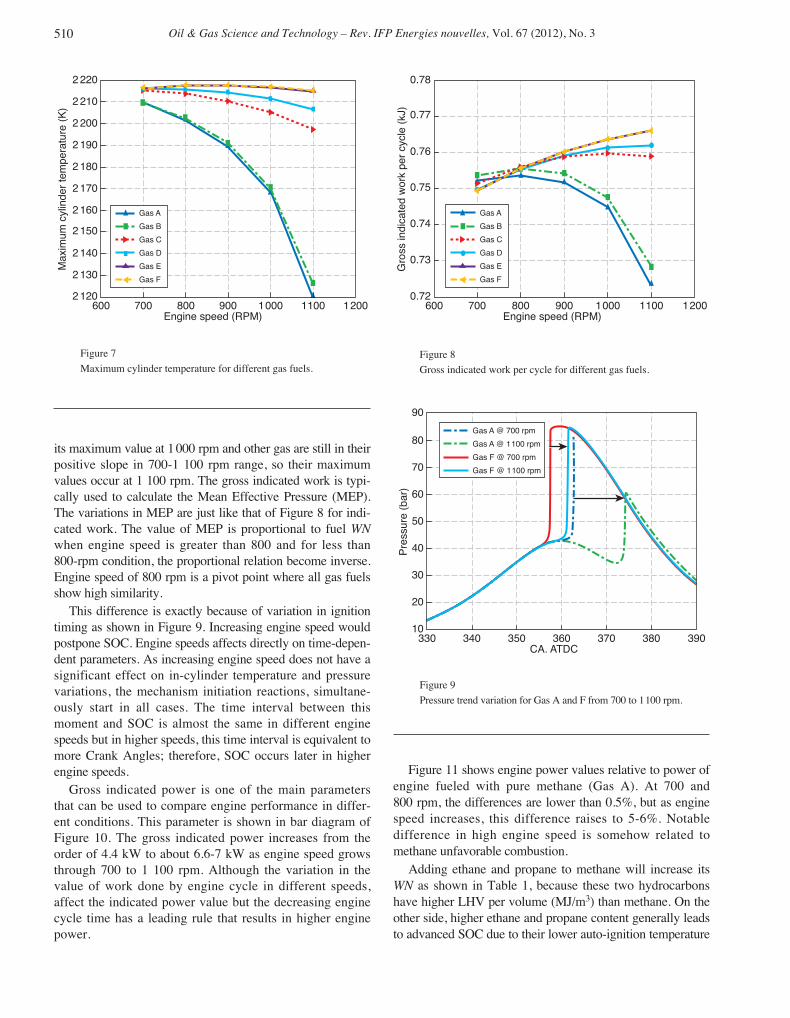
Increasing engine speed causes a small variation in themaximum temperature/pressure of all fuels except Gas Aand B, which show a sharp decrease and undergo an abnor-mal late combustion. However, it should be mentioned thatthe engine speed variation is relatively small. It can be seenthat there is a meaningful relation between fuel WN and thevalue of maximum pressure/temperature. The fuels withhigher WN ignite earlier and have higher peak in tempera-ture/pressure diagram. By increasing engine speed from700 to 1100 rpm, the Crank Angle that peak pressureoccurs at, changes about 2.2 CA for Gas F but Gas A haswide variation of about 11.5 CA.
Values of gross indicated work are shown in Figure 8.Typically, gross indicated work is a semi-parabolic functionof engine speed and has a maximum, in a specific point. Thefigure shows three different trends. While Gas A and B havetheir maximum gross indicated power at 800 rpm, Gas C gets
Gas FGas EGas DGas CGas BGas A
Max
imum
cyc
le p
ress
ure
(bar
)
86
72
Gro
ss in
dica
ted
wor
k pe
r cy
cle
(kJ)0.770
0.775
84
0.76582
0.76080
0.75578
0.75076
0.745
0.740
74Maximum cycle pressure
Gross indicated work per cycle
Figure 5
Maximum cycle pressure and gross indicated work per cyclefor different gas fuels at TIVC = 420 K.
Gas A
Gross indicated power per cylinder (kW)
Gas B Gas C Gas D Gas E Gas F
6.2
6.0
6.6
6.4
Gas A
Engine efficiency (%)
Gas B Gas C Gas D Gas E Gas F
16.6
16.4
17.0
16.8
Temperature @IVC = 420�K
Temperature @IVC = 435�K
Figure 6
Gross indicated power and engine efficiency for different gasfuels at TIVC = 420 K and 435 K.
ogst100033_Jahanian 6/06/12 16:01 Page 509
Oil & Gas Science and Technology – Rev. IFP Energies nouvelles, Vol. 67 (2012), No. 3510
its maximum value at 1 000 rpm and other gas are still in theirpositive slope in 700-1 100 rpm range, so their maximumvalues occur at 1 100 rpm. The gross indicated work is typi-cally used to calculate the Mean Effective Pressure (MEP).The variations in MEP are just like that of Figure 8 for indi-cated work. The value of MEP is proportional to fuel WNwhen engine speed is greater than 800 and for less than800-rpm condition, the proportional relation become inverse.Engine speed of 800 rpm is a pivot point where all gas fuelsshow high similarity.
This difference is exactly because of variation in ignitiontiming as shown in Figure 9. Increasing engine speed wouldpostpone SOC. Engine speeds affects directly on time-depen-dent parameters. As increasing engine speed does not have asignificant effect on in-cylinder temperature and pressurevariations, the mechanism initiation reactions, simultane-ously start in all cases. The time interval between thismoment and SOC is almost the same in different enginespeeds but in higher speeds, this time interval is equivalent tomore Crank Angles; therefore, SOC occurs later in higherengine speeds.
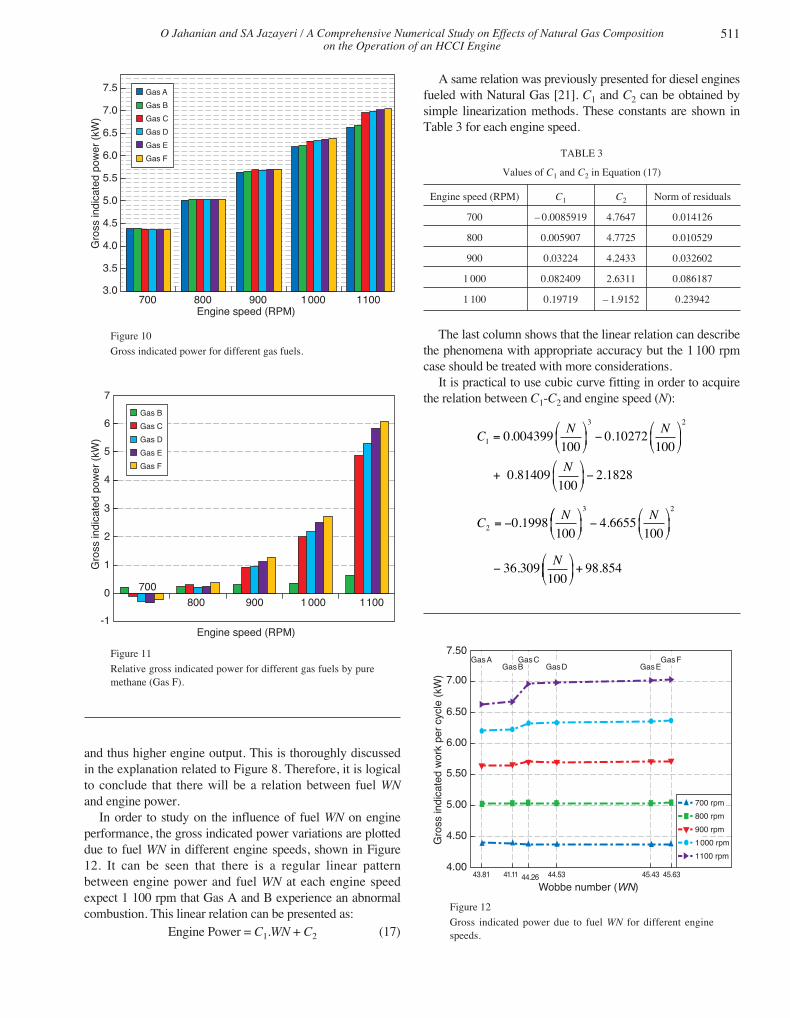
Gross indicated power is one of the main parametersthat can be used to compare engine performance in differ-ent conditions. This parameter is shown in bar diagram ofFigure 10. The gross indicated power increases from theorder of 4.4 kW to about 6.6-7 kW as engine speed growsthrough 700 to 1 100 rpm. Although the variation in thevalue of work done by engine cycle in different speeds,affect the indicated power value but the decreasing enginecycle time has a leading rule that results in higher enginepower.
Figure 11 shows engine power values relative to power ofengine fueled with pure methane (Gas A). At 700 and800 rpm, the differences are lower than 0.5%, but as enginespeed increases, this difference raises to 5-6%. Notabledifference in high engine speed is somehow related tomethane unfavorable combustion.
Adding ethane and propane to methane will increase itsWN as shown in Table 1, because these two hydrocarbonshave higher LHV per volume (MJ/m3) than methane. On theother side, higher ethane and propane content generally leadsto advanced SOC due to their lower auto-ignition temperature
Gas A @ 700 rpm
Gas A @ 1100 rpm
Gas F @ 700 rpm
Gas F @ 1100 rpm
380 390370360350340330
Pre
ssur
e (b
ar)
90
10
20
30
40
50
60
70
80
CA. ATDC
Figure 9
Pressure trend variation for Gas A and F from 700 to 1100 rpm.
700 1200800 900 1000 1100600
Max
imum
cyl
inde
r te
mpe
ratu
re (
K)
2 220
2 120
2 130
2 140
2 150
2 160
2 170
2 180
2 190
2 200
2 210
Engine speed (RPM)
Gas A
Gas B
Gas C
Gas D
Gas E
Gas F
120011001000900800700600
Gro
ss in
dica
ted
wor
k pe
r cy
cle
(kJ)
0.78
0.72
0.77
0.76
0.75
0.74
0.73
Engine speed (RPM)
Gas A
Gas B
Gas C
Gas D
Gas E
Gas F
Figure 8
Gross indicated work per cycle for different gas fuels.
Figure 7
Maximum cylinder temperature for different gas fuels.
ogst100033_Jahanian 6/06/12 16:01 Page 510
O Jahanian and SA Jazayeri / A Comprehensive Numerical Study on Effects of Natural Gas Compositionon the Operation of an HCCI Engine
511
and thus higher engine output. This is thoroughly discussedin the explanation related to Figure 8. Therefore, it is logicalto conclude that there will be a relation between fuel WNand engine power.
In order to study on the influence of fuel WN on engineperformance, the gross indicated power variations are plotteddue to fuel WN in different engine speeds, shown in Figure12. It can be seen that there is a regular linear patternbetween engine power and fuel WN at each engine speedexpect 1 100 rpm that Gas A and B experience an abnormalcombustion. This linear relation can be presented as:
Engine Power = C1.WN + C2 (17)
A same relation was previously presented for diesel enginesfueled with Natural Gas [21]. C1 and C2 can be obtained bysimple linearization methods. These constants are shown inTable 3 for each engine speed.
The last column shows that the linear relation can describethe phenomena with appropriate accuracy but the 1 100 rpmcase should be treated with more considerations.
It is practical to use cubic curve fitting in order to acquirethe relation between C1-C2 and engine speed (N):
Gas A
Gas B
Gas C
Gas D
Gas E
Gas F
700 800 900 1000 1100
Gro
ss in
dica
ted
pow
er (
kW)
3.0
7.5
7.0
6.5
6.0
5.5
5.0
4.5
4.0
3.5
Engine speed (RPM)
Figure 10
Gross indicated power for different gas fuels.
Gas B
Gas C
Gas D
Gas E
Gas F
Gro
ss in
dica
ted
pow
er (
kW)
-1
6
7
5
4
3
2
1
0
Engine speed (RPM)
700
800 900 1 000 1100
Figure 11
Relative gross indicated power for different gas fuels by puremethane (Gas F).
43.81 41.11 44.26 44.53 45.43 45.63
Gro
ss in
dica
ted
wor
k pe
r cy
cle
(kW
)
7.50
4.00
7.00
6.50
6.00
5.50
5.00
4.50
Wobbe number (WN)
Gas AGas B
Gas CGas E
Gas FGas D
700 rpm
800 rpm
900 rpm
1000 rpm
1100 rpm
Figure 12
Gross indicated power due to fuel WN for different enginespeeds.
TABLE 3
Values of C1 and C2 in Equation (17)
Engine speed (RPM) C1 C2 Norm of residuals
700 – 0.0085919 4.7647 0.014126
800 0.005907 4.7725 0.010529
900 0.03224 4.2433 0.032602
1 000 0.082409 2.6311 0.086187
1 100 0.19719 – 1.9152 0.23942
CN N
1
3 2
0 004399100
0 10272100
=⎛
⎝⎜
⎞
⎠⎟ −
⎛
⎝⎜
⎞
⎠⎟. .
+⎛
⎝⎜
⎞
⎠⎟ −
= −
0 81409100
2 1828
0 19981002
. .
.
N
CN⎛⎛
⎝⎜
⎞
⎠⎟ −
⎛
⎝⎜
⎞
⎠⎟
−⎛
⎝
3 2
4 6655100
36 309100
.
.
N
N ⎜⎜
⎞
⎠⎟+ 98 854.
ogst100033_Jahanian 6/06/12 16:01 Page 511
Oil & Gas Science and Technology – Rev. IFP Energies nouvelles, Vol. 67 (2012), No. 3512
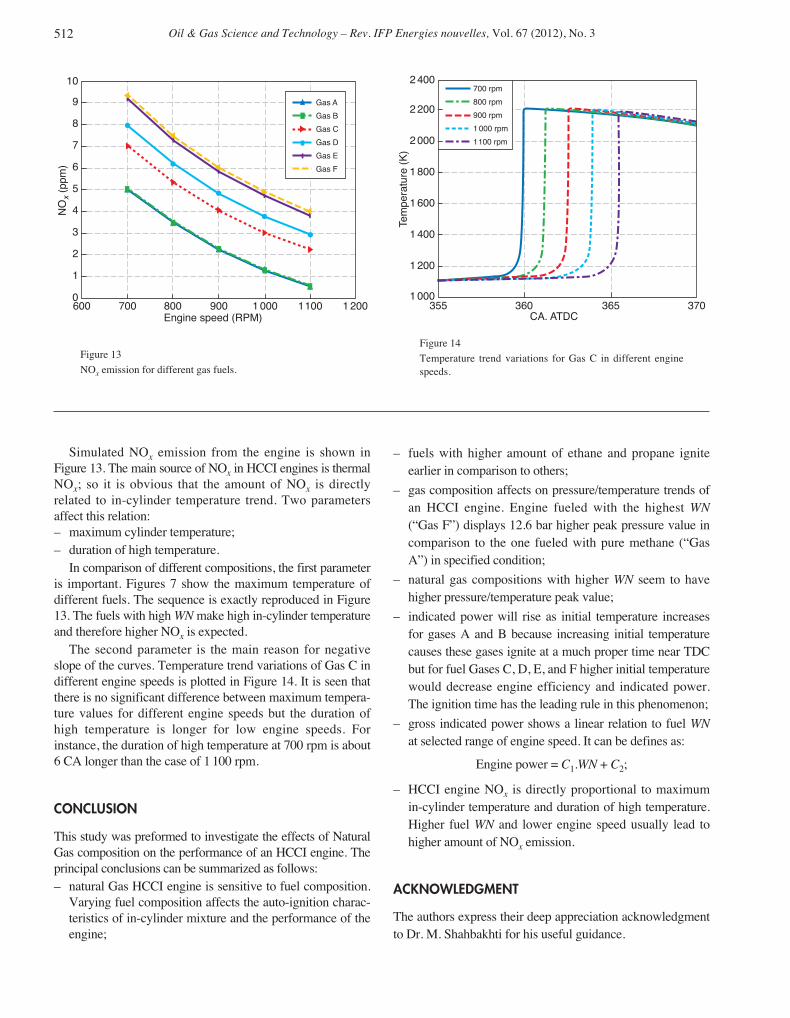
Simulated NOx emission from the engine is shown inFigure 13. The main source of NOx in HCCI engines is thermalNOx; so it is obvious that the amount of NOx is directlyrelated to in-cylinder temperature trend. Two parametersaffect this relation:– maximum cylinder temperature;– duration of high temperature.
In comparison of different compositions, the first parameteris important. Figures 7 show the maximum temperature ofdifferent fuels. The sequence is exactly reproduced in Figure13. The fuels with high WN make high in-cylinder temperatureand therefore higher NOx is expected.
The second parameter is the main reason for negativeslope of the curves. Temperature trend variations of Gas C indifferent engine speeds is plotted in Figure 14. It is seen thatthere is no significant difference between maximum tempera-ture values for different engine speeds but the duration ofhigh temperature is longer for low engine speeds. Forinstance, the duration of high temperature at 700 rpm is about6 CA longer than the case of 1 100 rpm.
CONCLUSION
This study was preformed to investigate the effects of NaturalGas composition on the performance of an HCCI engine. Theprincipal conclusions can be summarized as follows:– natural Gas HCCI engine is sensitive to fuel composition.
Varying fuel composition affects the auto-ignition charac-teristics of in-cylinder mixture and the performance of theengine;
– fuels with higher amount of ethane and propane igniteearlier in comparison to others;
– gas composition affects on pressure/temperature trends ofan HCCI engine. Engine fueled with the highest WN(“Gas F”) displays 12.6 bar higher peak pressure value incomparison to the one fueled with pure methane (“GasA”) in specified condition;
– natural gas compositions with higher WN seem to havehigher pressure/temperature peak value;
– indicated power will rise as initial temperature increasesfor gases A and B because increasing initial temperaturecauses these gases ignite at a much proper time near TDCbut for fuel Gases C, D, E, and F higher initial temperaturewould decrease engine efficiency and indicated power.The ignition time has the leading rule in this phenomenon;
– gross indicated power shows a linear relation to fuel WNat selected range of engine speed. It can be defines as:
Engine power = C1.WN + C2;
– HCCI engine NOx is directly proportional to maximumin-cylinder temperature and duration of high temperature.Higher fuel WN and lower engine speed usually lead tohigher amount of NOx emission.
ACKNOWLEDGMENT
The authors express their deep appreciation acknowledgmentto Dr. M. Shahbakhti for his useful guidance.
365 370360355
Tem
pera
ture
(K
)
2 400
1 000
1 200
1 400
1 600
1 800
2 000
2 200
CA. ATDC
700 rpm
800 rpm
900 rpm
1 000 rpm
1100 rpm
Figure 14
Temperature trend variations for Gas C in different enginespeeds.
600 700 1 200800 900 1 000 1100
NO
x (p
pm)
10
0
1
2
3
4
5
6
7
8
9
Engine speed (RPM)
Gas A
Gas B
Gas C
Gas D
Gas E
Gas F
Figure 13
NOx emission for different gas fuels.
ogst100033_Jahanian 6/06/12 16:01 Page 512
O Jahanian and SA Jazayeri / A Comprehensive Numerical Study on Effects of Natural Gas Compositionon the Operation of an HCCI Engine
513
REFERENCES
1 Shahangian N., Keshavarz M., Jazayeri S.A. (2009) Analysis ofHCCI Engine Operation with Diesel Like Fuels, Oil Gas Sci.Technol. 64, 4, 521-532.
2 Jahanian O., Jazayeri S.A. (2010) The Effects ofUsing Formaldehyde as an Additive on the Performance of anHCCI Engine Fueled with Natural Gas, ASME InternationalMechanical Engineering Congress & Exhibition (IMECE2010),Vancouver, Canada, November 12-18.
3 Jahanian O., Jazayeri S.A. (2009) A Comprehensive Study onNatural Gas HCCI Engine Response to Different InitialConditions via a Thermo-Kinetic Engine Model, ASME InternalCombustion Engine Division Fall Technical Conference(ICEF2009), Lucerne, Switzerland, September 27-30.
4 Morsy M.H. (2007) Ignition Control of methane FueledHomogenous Charge Compression Ignition Engines UsingAdditives, Fuel 86, 533-540.
5 Onishi S., Hong Jo S., Shoda K., Kato S. (1979) Active Thermo-Atmosphere Combustion (ATAC) – A New Combustion Processfor Internal Combustion Engines, SAE paper 790501.
6 Noguchi M., Tanaka T., Takeuchi Y. (1979) A Study onGasoline Engine Combustion by Observation of IntermediateReactive Products during Combustion, SAE paper 790840.
7 Najt P.M., Foster D.E. (1983) Compression-IgnitedHomogenous Charge Combustion, SAE paper 830264.
8 Thring R.H. (1989) Homogenous Charge Compression-Ignition(HCCI) Engines, SAE paper 892068.
9 Ryan T.W., Callahan T. (1996) Homogenous ChargeCompression Ignition of Diesel Fuel, SAE paper 961160.
10 Fiveland S.B., Christensen M., Johansson B., Hiltner J., MaussF., Assanis D.N. (2001) Experimental and Simulated ResultsDetailing the Sensitivity of Natural Gas HCCI Engines to FuelComposition, SAE paper 2001-01-3609.
11 Stanglmaier R.H., Roberts C.E. (1999) Homogenous ChargeCompression Ignition (HCCI): Benefits, Compromises, andFuture Engine Applications, SAE paper 1999-01-3682.
12 Alizadeh Attar A. (1997) Optimization and Knock Modeling of aGas Fueled Spark Ignition Engine, PhD Thesis, the University ofCalgary Alberta.
13 Clark N.N., Mott G.E., Atkinson C.M., deJong R.J., AtkinsonR.J., Latvakosky T., Traver M.L. (1995) Effect of FuelComposition on the Operation of a lean-Burn Natural GasEngine, SAE paper 952560.
14 King S. (1992) The Impact of Natural Gas Composition on FuelMetering and Engine Operational Characteristics, SAE paper920593.
15 Kubesh J., King S.R., Liss W.E. (1992) Effect of GasComposition on Octane Number of Natural Gas Fuels, SAEpaper 922359.
16 Blazek C.F., Freeman P., Bailey B.K., Colucci C. (1994) FuelComposition Effects on Natural Gas Vehicle Emissions, 207thACS National Meeting-Division of Fuel Chemistry, San Diego,USA, March 13-17.
17 Sakai T. (1996) Effect of Natural Gas Composition on EnginePerformance and Exhaust Emissions, Jidosya Kennkyu 18, 1,23-26.
18 Matthews R., Chiu J., Hilden D. (1996) CNG Composition inTexas and the Effects of Composition on Emissions, FuelEconomy, and Driver-Ability of NGV’s, SAE paper 962097.
19 Lee Y., Kim G. (1999) Effect of Gas Compositions on FuelEconomy and Exhaust Emissions of Natural Gas Vehicles,KSAE 7 8, 123-131.
20 Min B.H., Chung J.T., Kim H.Y., Park S.S. (2002) Effects ofGas Composition on the Performance and Emissions ofCompressed Natural Gas Engines, KSME 16, 2, 219-226.
21 Kim K., Kim H., Kim B., Lee K., Lee K. (2009) Effect ofNatural gas Composition on the Performance of a CNG Engine,Oil Gas Sci. Technol. 64, 2, 199-206.
22 Landau M. (2005) Paper Study on the Effect of Varying FuelComposition on Fuel Supplied to Detroit Diesel Gas Engines,Southern California Gas Company Technical Report 2005.
23 Salaun M., Kouakou A., Da Costa S., Da Costa P. (2009)Synthetic Gas Bench Study of a Natural Gas VehicleCommercial Catalyst in Monolithic Form: On the Effect of gasComposition, Appl. Catal. B: Env. 88, 386-397.
24 Smith G.P., Golden D.M., Frenklach M., Moriarty N.W.,Eiteneer B., Goldenberg M., Bowman C.T., Hanson R.K., SongS., Gardiner Jr W.C., Lissianski V.V., Qin Z., GRI 3.0Mechanism, Gas Research Ins t i tu te , avai lable a t :http://www.me.berkeley.edu/gri_mech.
25 Jahanian O., Jazayeri S.A. (2009) A Numerical Investigation onthe Effects of H2O2 and CH2O Additives on the Performance ofan HCCI engine Fueled with Natural Gas, 6th InternationalConference of Internal Combustion Engine (ICICE2009),Tehran, Iran, November 17-19 (in Persian).
26 Jahanian O., Jazayeri S.A. (2009) A Thermo-Kinetic ModelBase Study on Natural Gas HCCI Engine Response to DifferentInitial Conditions, III International Congress on CombustionEngines, Opole, Poland, June 22-24.
27 Chang J., Guralp O., Filipi Z., Assanis D., Kuo T.W., Najt P.,Rask R. (2004) New Heat Transfer Correlation for an HCCIEngine Derived from Measurements of Instantaneous SurfaceHeat Flux, SAE paper 2004-01-2996.
28 Heywood J.B. (1988) Engine Design and Operating Parameters,in Internal Combustion Engine Fundamentals, McGraw-HillBook Company, Singapore.
29 Kuo K.K.Y. (1986) Review of Chemical Kinetics, in Principlesof Combustion, John Wiley & Sons, Inc., Singapore.
30 http://homepages.vub.ac.be/~akonnov/science/mechanism/texts/mech04.txt
31 Flowers D., Aceves S., Westbrook C.K., Smith J.R., Dibble R.(2001) Detailed Chemical Kinetic Simulation of Natural GasHCCI Combustion: Gas Composition Effects and Investigationof Control Strategies, J. Eng. Gas Turbine. Power 123, 433-439.
32 Nouri R., Mohsenian Rad A.F. (2009) A Study on the Effects ofUsing CNG on the Efficiency of Internal Combustion Engines,2nd Conference & Exhibition on CNG & related Industries,Tehran, Iran, 26-27 July - Data by Iranian Fuel ConservationCompany (IFCO) – (In Persian).
33 Christensen M., Johansson B. (1999) Homogenous ChargeCompression Ignition with Water Injection, SAE paper 1999-01-0182.
34 Shahbakhti M., Koch C.R. (2007) Thermo-Kinetic CombustionModeling of an HCCI Engine to Analyze Ignition Timing forControl Applications, 2007 Spring Technical MeetingCombustion Institute/Canadian Section, Banff, Canada, May13-16.
35 Checkel M.D, Dale J.D. (1986) Computerized Knock DetectionFrom Engine Pressure Records, SAE paper 860028.
ogst100033_Jahanian 6/06/12 16:01 Page 513
Oil & Gas Science and Technology – Rev. IFP Energies nouvelles, Vol. 67 (2012), No. 3514
36 Fiveland S.B., Assanis D.N. (2002) Development and Validationof a Quasi-Dimensional Model for HCCI Engine Performanceand Emissions Studies under Turbocharged Conditions, SAEpaper 2002-01-1757.
37 Wang Z., Shuai S.J., Wang J.X., Tian G.H., An X.L. (2006)Modeling of HCCI Combustion: From 0D to 3D, SAE paper2006-01-1364.
38 Liss W.E. (1993) Fuel Issues for Gas Engine and NGVs,Windsor Workshop on Alternative Fuels, Gas Research InstitutePublication, pp. 441-461.
39 Quelch G.E., Gallo M.M., Schaefer III H.F. (1992) Aspects ofthe Reaction Mechanism of Ethane Combustion. Conformationsof Ethylperoxy Radical, J. Am. Chem. Soc. 114, 8239-8247.
40 Sanderson R.T. (1971) Chemical Bonds and Bond Energy,Academic Press, USA.
Final manuscript received in March 2011Published online in November 2011
Copyright © 2011 IFP Energies nouvellesPermission to make digital or hard copies of part or all of this work for personal or classroom use is granted without fee provided that copies are not madeor distributed for profit or commercial advantage and that copies bear this notice and the full citation on the first page. Copyrights for components of thiswork owned by others than IFP Energies nouvelles must be honored. Abstracting with credit is permitted. To copy otherwise, to republish, to post onservers, or to redistribute to lists, requires prior specific permission and/or a fee: Request permission from Information Mission, IFP Energies nouvelles,fax. +33 1 47 52 70 96, or [email protected].
ogst100033_Jahanian 6/06/12 16:01 Page 514
O Jahanian and SA Jazayeri / A Comprehensive Numerical Study on Effects of Natural Gas Compositionon the Operation of an HCCI Engine
515
APPENDIX A: THERMODYNAMIC PROPERTIES
LHV of a gaseous mixture can be obtained by Equation (18)where i represents the mass fraction of component xi. LHV oflight hydrocarbons are listed in Natural Gas handbooks.Nitrogen has zero heating value [37]:
(18)
Specific Gravity (SG) is the ratio of the gas density to theair density. It can be calculated as:
(19)
Wobbe Number (WN) is especially an important parameterin NG fuels. It is a measure of energy flow rate through anorifice [38] and defines the chemical energy that will flowthrough an orifice with a given pressure drop. It is calculatedby dividing the volume heating value of the fuel by thesquare root of specific gravity:
(20)
To describe natural gas characteristics based on its energycontent, WN is used. WN increases when the content of thenon-methane hydrocarbon increases. This increase resultsfrom the higher densities of the non-methane hydrocarbons.The WN decreases when the inert gases concentration rises.Different WN causes change in stoichiometric A/F ratiowhich affects equivalence ratio. Equivalence ratio is of primaryimportance in the engine operation.
APPENDIX B: COMBUSTION KINETICS REVIEW
Alkane combustion is initiated by abstraction of a hydrogenatom from the alkane (RH) to form the alkyle radical (R⋅ ) andhydrogen radical (H⋅ ) [39]:
RH → R⋅ + H⋅ (21)
These radicals propagates the combustion reaction withoxygen (O⋅ ) and hydroxyl (O⋅ H) radicals. These radicals aremainly produced via:
(22)
O 2O
H + O OH + O2
2
→
→
�
� � �
WNLHV
SG=
ρ.
SGM
MM
air
air= = kg.mol–128 97.
LHV x LHVi i= ∑
For CH4, C2H6 and C3H8, the initiation reactions are:
(23)
The main propagation reactions are:
(24)
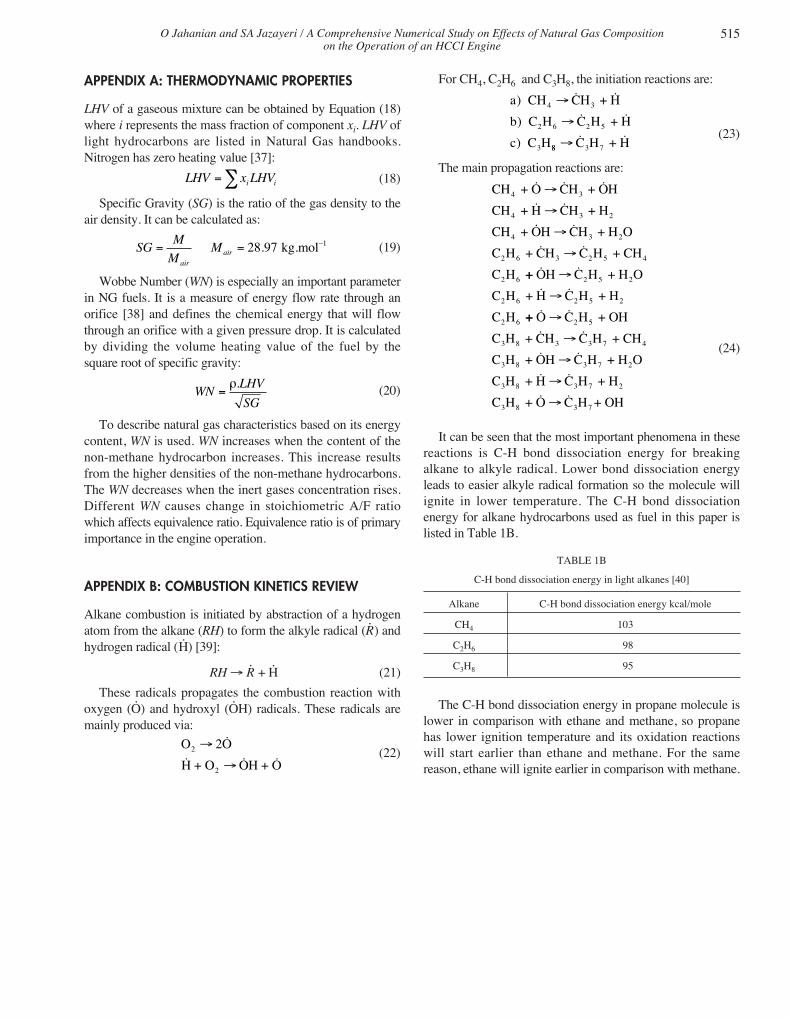
It can be seen that the most important phenomena in thesereactions is C-H bond dissociation energy for breakingalkane to alkyle radical. Lower bond dissociation energyleads to easier alkyle radical formation so the molecule willignite in lower temperature. The C-H bond dissociationenergy for alkane hydrocarbons used as fuel in this paper islisted in Table 1B.
TABLE 1B
C-H bond dissociation energy in light alkanes [40]
Alkane C-H bond dissociation energy kcal/mole
CH4 103
C2H6 98
C3H8 95
The C-H bond dissociation energy in propane molecule islower in comparison with ethane and methane, so propanehas lower ignition temperature and its oxidation reactionswill start earlier than ethane and methane. For the samereason, ethane will ignite earlier in comparison with methane.
CH + O CH + OH
CH + H CH + H
CH +
4 3
4 3 2
4
� � �
� �→
→�� �
� �OH CH + H O
C H + CH C H + CH
C H
3 2
2 6 3 2 5 4
2 6
→
→
++ OH C H + H O
C H + H C H + H
C H
2 5 2
2 6 2 5 2
2 6
� �
� �→
→
++ O C H + OH
C H + CH C H + CH
C H
2 5
3 8 3 3 7 4
3 8
� �
� �→
→
+ OH C H + H O
C H + H C H + H
C H
3 7 2
3 8 3 7 2
3 8
� �
� �→
→
+ O C H + OH3 7� �→
a CH CH + H
b C H C H + H
c C H
4 3
2 6 2 5
3
)
)
)
→
→
� �
� �
88 3 7C H + H→ � �
ogst100033_Jahanian 6/06/12 16:01 Page 515
Copyright © 2022 FDOKUMEN