Numerical modeling and assessment of natural gas pipeline ...
11
Vol:.(1234567890) Petroleum Science (2020) 17:268–278 https://doi.org/10.1007/s12182-019-00400-5 1 3 ORIGINAL PAPER Numerical modeling and assessment of natural gas pipeline separation in China: the data from Henan Province Jian‑zhong Xiao 1,2 · Wei‑cheng Kong 1,2 · Xiao‑lin Wang 1,2 · Ming Li 1,2 Received: 10 October 2018 / Published online: 4 November 2019 © The Author(s) 2019 Abstract China’s natural gas market is focusing on price reform and aims to reconstruct vertically integrated industrial chains in the future. Based on the mixed complementarity problem model of gas markets with nodes in Henan Province, China, as an example, this paper applies numerical modeling to simulate the effects of social welfare and equilibrium prices on nodes in two scenarios: pipeline integration and pipeline separation. The findings reveal the following: (1) Pipeline separation yields greater overall social welfare than pipeline integration, with the welfare shifting from gas producers to consumption markets. (2) Pipeline separation lowers the equilibrium consumption prices by driving competition among gas supply sources. (3) Pipeline separation will increase the contribution of natural gas to primary energy. Keywords Natural gas · Market equilibrium · Mixed complementarity problem · Pipeline separation · Pipeline integration 1 Introduction China has become one of the world’s largest natural gas con- sumers and importers, with the amount of imported pipeline gas and liquefied natural gas (LNG) reaching one-quarter of Chinese natural gas consumption and with increasing quanti- ties of domestic gas production from areas far from demand centers. One key energy policy objective in China is increas- ing the contribution of natural gas to the energy mix (China National Energy Administration 2014). The Chinese govern- ment has introduced a series of policies to encourage domes- tic and international gas supply expansion and efficient gas use, including a pilot natural gas pricing reform and long- distance pipeline reform. Currently, China has established gas pipeline networks covering the entire country, and the total long-distance pipeline length in China reached 77.0 thousand kilometers at the end of 2017 (Electronics and Telecommunications Research Institute 2018). According to China’s oil and gas pipeline medium- and long-term network plan issued in 2017, the natural gas long-distance pipeline is expected to exceed 104 thousand kilometers by 2020 and 163 thousand kilometers by 2025, with an annual growth rate of 9.8% (China National Development and Reform Commission 2017). Traditionally, the natural gas pipeline network in China is dominated by three state-owned companies: China National Petroleum Corporation (CNPC), China Petrochemical Cor- poration (SINOPEC) and China National Offshore Oil Corporation (CNOOC) (Xu et al. 2017). Recently, it was proposed that energy companies provide more transparency regarding their pipeline operations, including selling assets to nonstate investors and owners allowing fair access to their networks for all producers and consumers. In this respect, the natural gas market structure in China is undergoing significant change. However, in the process of pipeline reform, an important issue is whether owner- ship unbundling and/or mandatory separation is a feasi- ble policy initiative. Studies have shown that ownership unbundling increases social welfare by fostering competi- tion for downstream and upstream markets, thus reducing the risk of vertical foreclosure and lower retail prices (Laf- font and Tirole 1994). Similar research on China suggests that ownership unbundling is more conducive to promoting the efficiency of natural gas transmission compared with a Edited by Xiu-Qin Zhu * Jian-zhong Xiao [email protected] 1 School of Economics and Management, China University of Geosciences, Wuhan 430074, Hubei, China 2 Resources and Environment Economic Research Center, China University of Geosciences, Wuhan 430074, Hubei, China
-
Upload
khangminh22 -
Category
Documents
-
view
0 -
download
0
Transcript of Numerical modeling and assessment of natural gas pipeline ...

Vol:.(1234567890)
Petroleum Science (2020) 17:268–278https://doi.org/10.1007/s12182-019-00400-5
1 3
ORIGINAL PAPER
Numerical modeling and assessment of natural gas pipeline separation in China: the data from Henan Province
Jian‑zhong Xiao1,2 · Wei‑cheng Kong1,2 · Xiao‑lin Wang1,2 · Ming Li1,2
Received: 10 October 2018 / Published online: 4 November 2019 © The Author(s) 2019
AbstractChina’s natural gas market is focusing on price reform and aims to reconstruct vertically integrated industrial chains in the future. Based on the mixed complementarity problem model of gas markets with nodes in Henan Province, China, as an example, this paper applies numerical modeling to simulate the effects of social welfare and equilibrium prices on nodes in two scenarios: pipeline integration and pipeline separation. The findings reveal the following: (1) Pipeline separation yields greater overall social welfare than pipeline integration, with the welfare shifting from gas producers to consumption markets. (2) Pipeline separation lowers the equilibrium consumption prices by driving competition among gas supply sources. (3) Pipeline separation will increase the contribution of natural gas to primary energy.
Keywords Natural gas · Market equilibrium · Mixed complementarity problem · Pipeline separation · Pipeline integration
1 Introduction
China has become one of the world’s largest natural gas con-sumers and importers, with the amount of imported pipeline gas and liquefied natural gas (LNG) reaching one-quarter of Chinese natural gas consumption and with increasing quanti-ties of domestic gas production from areas far from demand centers. One key energy policy objective in China is increas-ing the contribution of natural gas to the energy mix (China National Energy Administration 2014). The Chinese govern-ment has introduced a series of policies to encourage domes-tic and international gas supply expansion and efficient gas use, including a pilot natural gas pricing reform and long-distance pipeline reform. Currently, China has established gas pipeline networks covering the entire country, and the total long-distance pipeline length in China reached 77.0 thousand kilometers at the end of 2017 (Electronics and
Telecommunications Research Institute 2018). According to China’s oil and gas pipeline medium- and long-term network plan issued in 2017, the natural gas long-distance pipeline is expected to exceed 104 thousand kilometers by 2020 and 163 thousand kilometers by 2025, with an annual growth rate of 9.8% (China National Development and Reform Commission 2017).
Traditionally, the natural gas pipeline network in China is dominated by three state-owned companies: China National Petroleum Corporation (CNPC), China Petrochemical Cor-poration (SINOPEC) and China National Offshore Oil Corporation (CNOOC) (Xu et al. 2017). Recently, it was proposed that energy companies provide more transparency regarding their pipeline operations, including selling assets to nonstate investors and owners allowing fair access to their networks for all producers and consumers.
In this respect, the natural gas market structure in China is undergoing significant change. However, in the process of pipeline reform, an important issue is whether owner-ship unbundling and/or mandatory separation is a feasi-ble policy initiative. Studies have shown that ownership unbundling increases social welfare by fostering competi-tion for downstream and upstream markets, thus reducing the risk of vertical foreclosure and lower retail prices (Laf-font and Tirole 1994). Similar research on China suggests that ownership unbundling is more conducive to promoting the efficiency of natural gas transmission compared with a
Edited by Xiu-Qin Zhu
* Jian-zhong Xiao [email protected]
1 School of Economics and Management, China University of Geosciences, Wuhan 430074, Hubei, China
2 Resources and Environment Economic Research Center, China University of Geosciences, Wuhan 430074, Hubei, China

269Petroleum Science (2020) 17:268–278
1 3
vertically integrated operation system (Dong et al. 2018). In contrast, Lewis (2007) argues that ownership unbundling does not seem feasible because unbundling gas pipelines implies completely relinquishing control of relevant assets at national and local levels. Such unbundling and its implica-tions have proven to involve a difficult political process in EU and US gas market liberalization (Xu et al. 2017). Thus, in this study, we agree that ownership unbundling is not a feasible solution.
Certain studies on gas pipeline separation reveal the importance of fair access (David and Percebois 2004; Vazquez et al. 2012). Experiences in liberalized markets indicate that the exclusivity (i.e., that it is relatively easy to physically exclude individuals from using gas infrastructure) and subtractability (i.e., the use of network infrastructure decreases the available capacity) of private pipelines are a source of severe transaction costs (Hallack and Vazquez 2014).
Based on these considerations, the current market struc-ture in China requires further research. The numerical simu-lation model developed in this paper, termed CNGASMOD, represents a contribution to this research. It simulates stra-tegic behavior within the demand and supply structures, particularly gas pipelines. The static version of the model presented in the paper studies interaction behavior among market agents by analyzing the market-clearing price and social welfare as a mixed complementarity problem. The paper is structured as follows: Sect. 2 presents a review of the literature. Section 3 describes the modeling and scenario setting for the natural gas market and is followed by an anal-ysis of results in Sec. 4. Section 5 presents conclusions and policy suggestions.
2 Literature review
The main purpose of regional natural gas market modeling is to analyze the impact of policy, external shock and infra-structure developments on markets. Because of the success of natural gas market reform in the USA and Europe, many scholars have studied these two markets. For the US natural gas market, based on the Stoner’s (1969) research, O’Neill et al. (1979) provided a model consisting of several objec-tive functions with a set of linear and nonlinear constraints. Subsequently, to determine the optimal method to reassign the available gas supply to consumers under different sce-narios, such as low pipeline capacity and supply disruption, several researchers have developed models based on their predecessors’ research (Gabriel et al. 2005; Growitsch et al. 2014). The National Energy Modeling System (NEMS), led by the Energy Information Administration (EIA), contains a separate subsystem for modeling the US natural gas mar-ket, the Natural Gas Transmission and Distribution Module
(NGTDM) (Gabriel et al. 2001). Gabriel et al. (2005) noted the existence of Nash–Cournot competition in the North American natural gas market and used the mixed comple-mentarity problem (MCP) to assess the impact of market power.
For the European natural gas market, Golombek et al. (1995) used a numerical model to examine the long-term impact of a radical liberalization of the West European natu-ral gas markets and found that the process of liberalization can increase upstream competition and economic welfare. The EUGAS model developed by Perner and Seeliger (2004) is used to study the optimization problem of the long-term supply in the European gas market. The numerical EUGAS model relies on linear programming (LP). Boots et al. (2004) constructed the GASTALE model from the perspective of successive oligopoly. In a further development of GAST-ALE, Egging and Gabriel (2006), Egging and Holz (2016) added features such as demand seasonality, a storage sec-tor and transmission pipeline capacities. The agents of this model include producers, a transmission system operator and storage operators, and market power exertion is accom-modated in the interaction between producers and demand sectors.
Other models for the European market include NATGAS (Zwart and Mulder 2006) and GASMOD (Holz et al. 2008). The NATGAS model (Zwart 2009) analyzes the strategic interactions between upstream producers and downstream arbitragers, simulates liquefied natural gas (LNG) price variation under different scenarios and studies changes in equilibrium prices and import volumes. Traditionally, the GASMOD model is used for numerical simulations of three market scenarios: Cournot competition in both (i.e., upstream and downstream) markets, perfect competition in both markets and Cournot competition in the upstream mar-ket with a downstream market in perfect competition.
The EU gas model is unique in its combination of a high level of detail regarding the actors in the natural gas mar-kets and the representation of market power according to the Nash–Cournot setting. Thus, a shift can be observed to more advanced modeling approaches, such as mixed com-plementarity problems, following the preliminary study by Gabriel et al. (2009). Egging et al. (2010) further developed the model, creating the first version of the World Gas Model (WGM). This model covered the entire world and multi-ple periods while providing a detailed representation of the LNG supply chain and facilitating endogenous infrastruc-ture expansions. Another example is the Gas Market Model (COLUMBUS) developed by Hecking and Panke (2012). The distinctive feature of the WGM and COLUMBUS mod-els is that they explicitly model the market power of agents.
Because of the complexity of the interrelations in the global gas market, Growitsch et al. (2014) use a programmed MCP equilibrium model and simulate the blockage of LNG

270 Petroleum Science (2020) 17:268–278
1 3
flows through the Strait of Hormuz. This approach enables consideration of the oligopolistic nature and asymmetry of the gas supply. Devine et al. (2016) present a new approach for solving energy market equilibria that extends the clas-sical Nash–Cournot approach to solving stochastic MCPs. Xu et al. (2017) investigate third-party access regulatory issues in China’s natural gas industry applying an oligopolis-tic equilibrium model based on the mixed complementarity problem.
Table 1 provides an overview of the equilibrium natural gas market models published in the public domain.
The cited literature illustrates that the bottom-up mod-eling method of MCP approaches can well depict the struc-tural features of the natural gas market and the behaviors of players within nodes. Thus, such approaches are widely applied in research on the natural gas markets in Britain, the USA and the European Union.
Most of the literature creates objective functions and con-straint conditions for each market player in the framework of MCP, derives the equivalent Karush–Kuhn–Tucker (KKT) conditions and uses GAMS as a system programming tool. The literature has focused on Western economies, whereas the modeling of China’s natural gas market is comparatively limited. This paper examines the regional natural gas market in Henan Province in Central China using an MCP model to simulate the natural gas market equilibrium.
The contributions of this research are threefold: (1) This study is potentially the first market modeling to address the interaction between market agents and equilibrium in the Chi-nese natural gas market. (2) The impact of China’s natural
gas market restructuring on node price and social welfare is described. (3) This study also serves as an additional reference for market players, including policymakers, as they develop their market liberalization policies.
3 Equilibrium model for the Chinese natural gas market
We now establish the KKT conditions in terms of agent behav-ior in a monopoly. This interpretation enables one to formu-late the different assumptions of imperfect competition. In this paper, these assumptions refer to gas supply fields, oil–gas companies, distributors, pipeline operators and gas-using cit-ies in Henan Province. During the modeling, producers and consumption markets are nodes connected with natural gas pipelines.
3.1 Scenario 1: Pipeline integration
A pipeline network is currently integrated in China’s natural gas industry, whereby three state-owned companies manage the transportation and sale of pipelines. In this scenario, the players involved in the current market are producers, distribu-tors and gas-using cities. The logical structure of market play-ers is shown in Fig. 1.
According to the characteristics of each player, the equilib-rium model is as follows.
3.1.1 Producer behavior
Producers sell natural gas to distributors for profit. The pro-ducers’ objective function is profit maximization, and the cor-responding constraint conditions are as follows:
(1)
maxqn→p
(
pn→p − cn)
⋅ qn→p
s.t. qn→p ≥ 0;
qn→p ≤ wn⊥𝛼w
Table 1 Overview of natural gas model characteristics
Model Type Coverage Market power Nodes
NEMS LP USA, CAN No 15GASMOD MCP EU Yes 6GASTALE MCP EU Yes 19NATGAS LP EU No 11WGM MCP World Yes 41COLUMBUS MCP World Yes 215
Oil-Gas company A
Oil-Gas company B
Gas field A
Gas field B
Pipeline Abelonging to
Gas-using city
Pipeline Bbelonging to
Fig. 1 Logical structure of market players in the integrated pipeline transport scenario
271Petroleum Science (2020) 17:268–278
1 3
where pn→p is the prices at which distributors purchase natu-ral gas, cn denotes the marginal exploitation costs of natural gas production, qn→p represents the amount of natural gas producers sell to distributors and wn is the capacity of the gas fields, that is, their capacity constraints. �w is the shadow prices under the gas field capacity constraints.
3.1.2 Natural gas distributor behavior
Natural gas transportation and sales are the main businesses for distributors, who obtain profits by purchasing gas at lower prices and selling it to gas-using cities at higher prices. They use their own pipelines during transportation, and rents are required when the pipelines of other companies are used. Similarly, others pay rents when borrowing the pipelines of the distributors. Natural gas distributors aim for profit maximization. The corresponding objective function and constraint conditions are as follows:
where qp→n is the amount of natural gas distributors sell to downstream gas-using cities, pc is the final consumer price in gas-using cities, flownm refers to the natural gas flow from node n to node m, purchp←n denotes the amount of natural gas distributor p purchases from producer n, TCnm is the marginal transport costs of natural gas, �n is the dual vari-able of flow conservation and �pipe represents the shadow prices under the transportation constraints.
(2)
maxqp→n
qn→p
flownm
(
∑
n
pcqp→n −
∑
n
pn→p ⋅ purchp←n −
∑
flownm ⋅ TCnm
)
s.t. purchp←n +
∑
m
flownm = qp→n +
∑
m
flownm⊥𝜑n
qp→n ≥ 0
flownm ≥ 0
flownm ≤ flownm⊥𝛼pipe
3.1.3 Consumer behavior
Consumers buy natural gas from natural gas distributors. This paper examines the market’s response to price from an industrial perspective, with a focus on the reconstruction of vertically integrated industrial chains and thus regardless of substitution between different energy commodities; there-fore, we simplify the consumer to construct a linear function, and other models also assume demand to be a linear func-tion (Zwart 2009; Xu et al. 2017). In addition, the demand functions for each gas-using city are assumed to be simple linear functions:
Equation (3) shows the supply–demand balance between dis-tributors and gas-using cities, where a and b are the intercept and elasticity of the demand functions, respectively.
3.1.4 Market‑clearing conditions
As an indispensable part of an MCP model, market-clearing conditions are essentially the balance between supply and demand. They are stated as follows:
Equation (4) shows the supply–demand balance between producers and distributors.
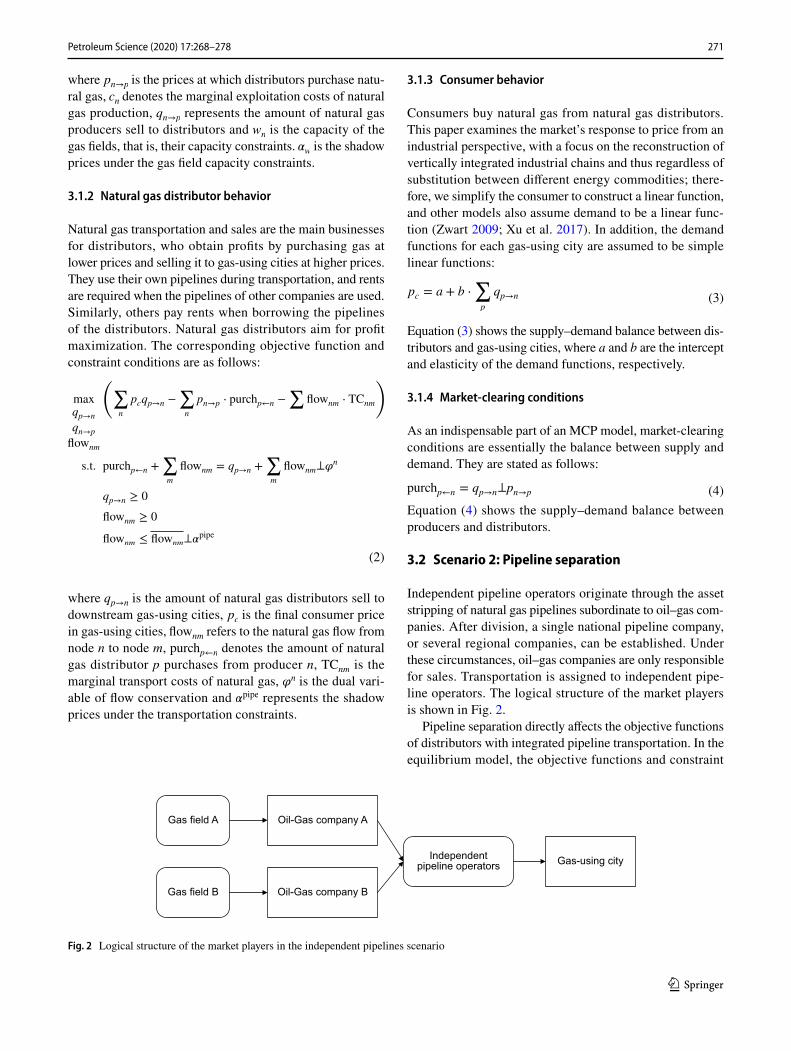
3.2 Scenario 2: Pipeline separation
Independent pipeline operators originate through the asset stripping of natural gas pipelines subordinate to oil–gas com-panies. After division, a single national pipeline company, or several regional companies, can be established. Under these circumstances, oil–gas companies are only responsible for sales. Transportation is assigned to independent pipe-line operators. The logical structure of the market players is shown in Fig. 2.
Pipeline separation directly affects the objective functions of distributors with integrated pipeline transportation. In the equilibrium model, the objective functions and constraint
(3)pc = a + b ⋅∑
p
qp→n
(4)purchp←n = qp→n⊥pn→p
Oil-Gas company A
Oil-Gas company B
Gas field A
Gas field B
Independentpipeline operators Gas-using city
Fig. 2 Logical structure of the market players in the independent pipelines scenario

272 Petroleum Science (2020) 17:268–278
1 3
conditions of the producers (Eq. 1) and gas-using cities (Eq. 3) exhibit no variation with the addition of pipeline operators. The equilibrium model is as follows.
3.2.1 Natural gas distributors
Oil–gas companies obtain profits by purchasing gas from producers at lower prices and selling it to independent pipe-line operators at higher prices. However, they must pay pipeline rents during the transportation process. The profit maximization function and constraint conditions of natural gas distributors are as follows:
where tfeenm represents the transport fees paid to independ-ent pipeline operators by distributors, xpnm is the amount of natural gas distributors purchase from producers and sell to gas-using cities and flownm is the gas flow between nodes n and m.
3.2.2 Independent pipeline operators
Independent pipeline operators seek to obtain a reasonable profit by selling the right to use their pipeline networks. The profit maximization function and constraint conditions are as follows:
4 Data and results
4.1 Data
Prior to 2011, the pricing mechanism for the natural gas market was cost-plus pricing. The Chinese government determined the price at natural gas terminals based on the average cost of the natural gas producers plus a reason-able profit rate. Cost-plus pricing played a positive role in increasing the contribution of natural gas to the energy mix and in pipeline network construction. However, in this
(5)
maxxpnmflownm
(
xpnm ⋅ pc − xpnm ⋅ pn→p −
∑
nm
(
tfeenm ⋅ flownm
)
)
s.t. flownm ≥ 0
xpnm ≥ 0⌊
∑
m≠n
xpnm −
∑
m≠n
flownm
⌋
+
⌊
∑
m≠n
flownm −
∑
m≠n
xpnm
⌋
= 0
(6)
maxZnm
(
tfeenm ⋅ Znm − TCnm ⋅ Znm)
s.t. Znm ≤ flownm
(
�pipe)
Znm ≥ 0
method, supply and demand are ignored, and the price of natural gas is relatively lower than other energy resources, resulting in excessive development of the natural gas con-sumer market. With the development of pipeline networks, it has become increasingly difficult to distinguish natural gas flows between gas fields and gas-using cities, meaning it is difficult to determine the price of natural gas in different gas-using cities. In 2011, the National Development and Reform Commission of the People’s Republic of China piloted net-back pricing for natural gas in Guangxi and Guangdong Provinces. Natural gas prices began to be linked to alterna-tive energy prices and to be promoted nationwide in 2013. This policy will make it easier to calculate the consumer price of natural gas. Therefore, in this paper, 2010 and 2015 are selected as research time points.
(1) Upstream production and costDomestic upstream gas production has a long history of
oligopoly and is currently monopolized by three dominant companies: China National Petroleum Corporation (CNPC), China Petroleum and Chemical Corporation (SINPEC) and China National Offshore Oil Corporation (CNOOC). Nota-bly, the first two have 90% of the supply share. Since data on the cost, price and volume of imported natural gas are difficult to obtain and the companies themselves do not make such data public, a simplified approach was adopted during the research.
Henan mainly purchases gas from diverse sources, such as Lunnan in the Tarim Basin, Yulin and the Zhongyuan Oil Field that belongs to CNPC and Horgos from Turkmen. Here, the analyzed data on gas field output were drawn from CNPC annual reports. The production costs are calculated using cost-plus pricing. The ex-factory price of natural gas is the production cost plus a reasonable profit. Considering the reasonable profit of 12% allowed by oil–gas industrial countries, the production costs can be indirectly obtained by multiplying the ex-factory prices disclosed by regula-tory departments by 88%. The data on the ex-factory prices of natural gas are adopted from the Notice on Natural Gas Prices in West–East Transmission by the China National Development and Reform Commission (CNDRC) and the Adjustment Table of Benchmark Ex-factory/First-Station Prices of Domestic Onshore Natural Gas of 2010. Table 2 lists gas field production, wellhead prices and production costs.
(2) Natural gas pipelinesLocated in Central China, Henan Province is an impor-
tant region because of the convergence that occurs there of critical long-distance pipelines, such as the First West–East Gas Pipeline, the Second West–East Gas Pipeline, the Third West–East Gas Pipeline, the Sichuan-East Branch Gas Pipe-line and the Yima Pipeline. These pipelines provide Henan Province with imported gas from Middle Asia and domestic gas, which flows to the main consumer region, including

273Petroleum Science (2020) 17:268–278
1 3
South and East China. The data on contract quantity, the pipeline capacity of oil–gas companies and Henan Prov-ince in 2010 and 2015 are from the Outline of Natural Gas Development and Utilization Plan for Henan Province
(2011–2020). Similar to the production cost of gas fields, the pipeline transport fee equals 88% of the prices issued by CNDRC.
(3) Gas-demand citiesGas-demand cities can be grouped as nodes in accord-
ance with the following three requirements. First, the pipe-lines enter the first city located in Henan Province. Second, the node cities are the intersections between trunk lines and branch lines. Finally, the consumption cities receive the product. As required, the nodes selected in the natural gas market in Henan Province include Boai, Xuedian, Pingding-shan, Sanmenxia, Kaifeng, Huaiyang, Anyang and Qingfeng (Fig. 3). Table 3 lists gas-demand quantities, price and elas-ticity for nodes in 2015.
4.2 Simulation results
As discussed, we assume that China’s natural gas market is an oligopolistic market. Thus, this paper simulates scenarios of imperfect competition in upstream markets. Although the scenario of pipeline separation seems realistic, the
Table 2 Domestic production quantities, prices and costs for domes-tic producers in 2010/2015
Sources: Notice on Natural Gas Prices in West–East Transmission by the CNDRC; Adjustment Table of Benchmark Ex-factory/First-Sta-tion Prices of Domestic Onshore Natural Gas
Output, 109 m3 Wellhead price, CNY/m3
Production cost, CNY/m3
Lunnan 18.4/25 0.48/0.79 0.49/0.695Horgos 35/31.1 2.27/2.27 2/2Yulin 2.4/4 0.71/0.94 0.62/0.827Zhongyuan Oil Field
(Dongpu Depres-sion)
0.4/0.38 0.71/0.94 0.62/0.827
AnyangQingfeng
Puyang
Heze
Shangqiu
Xuzhou
Lixing
GuangshanXinyang
Suizhou
Zaoyang
TangheXinyeProvincial pipeline
CNPC pipeline
Yima pipeline
Sinopec pipeline
The border line of Henanprovince
City in Henan province
City outsides Henan province
ZhumadianNanyang
Luohe
Pingdingshan
Xuedian
Luoyang
Yichuan
Sanmenxia
The second westto east pipeline
The third west toeast gas pipeline
The first west to east pipeline
Boai
Kaifeng
Huaiyang
Xuch
ang
Zhengzhou
Fig. 3 Gas pipelines and nodes in the regional natural gas market, Henan (China)

274 Petroleum Science (2020) 17:268–278
1 3
unbundling of the China’s natural gas sector is assumed to lead to a competitive market in the future.
4.2.1 Equilibrium revenue for market agents
(1) Upstream producersAs discussed in Introduction, China’s gas producers are
state-owned enterprises. For them, attaining public targets is more important than profit maximization and supply secu-rity. According to the results, we compared the earnings of companies at the same time points in different scenarios (Fig. 4).
As shown in Fig. 4, under the same scenario, two companies had far more earnings in 2015 than 2010, and CNPC displayed more significant growth. In the case of the integrated pipeline scenario, the earnings of CNPC and Sinopec increase by 1.93 times and 1.8 times, respectively. However, in the comparison (i.e., pipeline separation)
scenario, the corresponding profit variations were 0.20 times and 0.13 times. The main reason for these results is that CNPC owns the West–East Gas Pipelines, which supply natural gas to Henan Province. The amount of gas supplied by CNPC was nearly 3.5423 bcms in 2010 and increased to 13.1215 bcms in 2015. Sinopec supplied 1.0733 bcms in 2010 and 2.5612 bcms in 2015. In 2010, Sinopec accounted for 17.23% of the gas supply market in Henan Province, and for all earnings growth in 2015, its market share decreased to 9.7%. If the market structure is assumed to consist of an oligopoly of upstream gas pro-ducers, price discrimination by oil and gas producers is allowed, and these producers will collect a larger share of the margins on end-use prices.
Compared across the two scenarios, both companies exhibit a significant decrease in earnings, particularly CNPC: The earnings of CNPC and Sinopec decrease by 79.71% and 57.27%, respectively. In 2015, the correspond-ing figures were 89.94% and 78.95%. The decrease can be attributed to the deregulation of the right to pipeline transportation and the mandatory separation of pipelines, according to which oil–gas companies no longer own pipelines and must pay independent pipeline operators transportation fees. In Henan Province, CNPC owned the First West–East Gas Pipeline, the Second West–East Gas Pipeline and other cross-country pipelines, which together extend 1407.6 km, approximately 2.8 times the length of Sinopec’s system. In the case of unbundling the transmis-sion pipeline, when independent pipeline companies are separated, the result will be weaker market power and a sharp decrease in earnings.
(2) Independent pipeline operatorsThe earnings of independent pipeline operators reflect
the transfer of profits from integrated companies to inde-pendent pipeline operators along the industrial chain. These earnings can potentially be explained by the regime of legal
Table 3 Gas-demand quantities, price and elasticity for nodes in 2015 (for brevity, the elastic calculation process is omitted)
The consumption market does not distinguish whether the gas is used for industry, power generation or households. The gas consumption amount is the total gas demand, and the demand elasticity is calcu-lated based on the demand function
Gas consump-tion, 104 m3
Demand elasticity Gas price, CNY/m3
Boai 18794.35 − 0.134 2.05Xuedian 3719 − 0.048 2.25Sanmenxia 10861.4 − 1.344 2.19Pingdingshan 9366 − 0.29 2.19Kaifeng 5362 − 0.333 2.25Anyang 19359 − 0.297 2.24Huaiyang 6852.6 − 0.07 2.14Qingfeng 5781.45 − 0.2 2.1
5.212
1.991
15.249
2.3801.497 1.611
4.147
1.818
Scenario 1 Scenario 20
2
4
6
8
10
12
14
16
Equ
ilibr
ium
reve
nue
for u
pstre
ampr
oduc
er, b
illio
n yu
an (C
NY
)
Equ
ilibr
ium
reve
nue
for u
pstre
ampr
oduc
er, b
illio
n yu
an (C
NY
)
CNPC
20102015
Scenario 1 Scenario 20
2
4
6
8
10
12
14
16
Sinopec
20102015
(a) (b)
Fig. 4 Earnings of gas producers under different scenarios in 2010 and 2015

275Petroleum Science (2020) 17:268–278
1 3
regulation, according to which the transmission and incum-bent firms are legally separated but part of the same eco-nomic corporation. That is, the firms strategically maximize the joint profits of the corporative group. Independent pipe-line operators optimize the transportation capacity of the entire natural gas pipeline network and reduce the scarcity of pipeline network resources. The consumer can choose the lowest price among the multiple gas source competi-tors, and the producers can choose the route with the lowest transportation cost.
(3) Downstream marketNext, we compare the changes in earnings of the down-
stream market under the two scenarios. As shown in Fig. 5, earnings increased 2.64 times and 2.29 times in 2015 in the two scenarios. Pipeline separation resulted in a more significant increase. In 2010, the Henan section of No. 2 West–East Gas Pipeline had not yet been constructed. There-fore, Sanmenxia, Lushan and Nanyang exhibit an absence of consumption surplus. The same conclusions can be drawn from both scenarios. The top three cities in terms of con-sumer surplus were Xuedian, Huaiyang and Qingfeng in 2010 and Xuedian, Huaiyang and Boai in 2015, with the top two unchanged. A city in the vicinity of Zhengzhou in Henan Province, Xuedian, consumes substantially more gas than other areas. During the period 2010–2015, a shift of the gas-using hot spot from Puyang in southeast Henan to Boai in northwest Henan occurred. During market integration, the difference in the consumer prices of each city could be
attributed to the difference in transportation fees. Obviously, pipeline separation increased competition by decreasing to a certain degree the difference in transportation fees caused by the diversification of suppliers, resulting in lower end-user prices for natural gas. Therefore, the earnings for the downstream market in scenario 2 are higher than those in scenario 1.
As shown in Fig. 6, the overall social welfare of sce-nario 1 in 2010 was 9.4612 billion yuan (CNY), and the overall social welfare of scenario 2 was 14.9806 billion yuan (CNY), which was 1.59 times the former. The overall social welfare of scenario 1 in 2015 was 38.4384 billion yuan (CNY), and the overall social welfare of scenario 2 was 64.7513 billion yuan (CNY), which was 1.68 times the former. Pipeline separation causes social welfare shifts from upstream to downstream, and the increase in social welfare in the midstream and downstream is larger than the loss of social welfare in the upstream. In addition, with the expan-sion of the scale of the market, third-party access to social benefits increases.
The upstream and midstream are monopolized by CNPC, Sinopec and CNOOC, who use their respective pipeline net-works for gas transmission. This arrangement limits con-sumers with respect to selecting the most reasonable gas source. Monopoly companies acquire the social benefits of downstream users. China’s natural gas prices are regulated by the National Development and Reform Commission, and distortions in demand and supply result in welfare losses.
0.247
1.666
0.152
0.247
0.311
0.272
0.694
0.476
1.667
5.614
0.290
0.883
0.767
0.900
3.503
1.174
0.592
4.873
0.915
0.547
1.126
0.685
2.262
1.461
5.849
11.003
1.343
2.688
2.456
2.940
10.711
3.992
Xuedian
Boai
Sanmenxia
Pingdingshan
Kaifeng
Anyang
Huaiyang
Qingfeng
0 2 4 6 8 10 12
Equilibrium revenue for consumptioncities, billion yuan (CNY)
Equilibrium revenue for consumptioncities, billion yuan (CNY)
Scenario 1
0 2 4 6 8 10 12
20152010
20152010
City
Xuedian
Boai
Sanmenxia
Pingdingshan
Kaifeng
Anyang
Huaiyang
Qingfeng
City
(a) Scenario 2(b)
Fig. 5 Consumer earnings

276 Petroleum Science (2020) 17:268–278
1 3
The pipeline integration of the natural gas market together with government restrictions on gas prices fixes overall social welfare at a low level. Direct trading between certain producers and consumers becomes a reality with the intro-duction of a third party. As production and consumption are stimulated in such a market-driven mode, overall social wel-fare increases. As demonstrated by the presented evidence, competition between gas sources intensifies when rational allocation occurs after pipeline separation, eliminating price discrimination, improving resource utilization and increas-ing social welfare.
4.2.2 Prices
Figure 7 presents the equilibrium prices in the downstream market for selected cities and for each simulation scenario. As can be observed, the equilibrium gas price is more stable in scenario 1, with an integrated pipeline. When pipelines are divided, as in scenario 2, the equilibrium prices of con-sumption reduce. In 2010, when there was pipeline separa-tion, prices in gas-distributing cities decreased by at least one unit. In 2015, in the same scenario, gate prices in the cities (excluding Sanmenxia, which experienced a relatively smaller decrease) decreased by two units. Pipeline separa-tion is confirmed to provide the downstream gas-distributing cities more supplier options, thus accounting for the general trend of price decline. For consumers, pipeline separation means lower gas prices.
5 Conclusions
This paper presents a mixed complementarity model of the regional natural gas market in China and analyzes the wel-fare changes of multiple market players along the natural gas chain. We used CNGASMOD for the numerical simula-tions with reference data for the base years 2010 and 2015. Through the modeling of the natural gas market in Henan Province, this paper analyzes the welfare changes of market players (i.e., producers, distributors and consumers) along the industrial chain of natural gas in two scenarios: the demand price elasticity of the downstream market and the equilibrium price of natural gas.
9.461
14.981
38.438
64.751
Scenario 1 Scenario 20
7.5
15.0
22.5
30.0
37.5
45.0
52.5
60.0
67.520102015
Soc
ial w
elfa
re, b
illio
n yu
an (C
NY
)
Fig. 6 Overall social welfare in 2010 and 2015
1.0
1.2
1.4
1.6
1.8
2.0
2.2
2.4
2.6
2.8
1.2
1.5
1.8
2.1
2.4
2.7
3.0(b)
City
(a)
Pric
e of
nod
es c
ities
, CN
Y/m
3
City
Pric
e of
nod
es c
ities
, CN
Y/m
3
Xuedia
nBoa
i
Sanmen
xia
Pingdin
gsha
n
Kaifen
g
Anyan
g
Huaiya
ng
Qingfen
g
Xuedia
nBoa
i
Sanmen
xia
Pingdin
gsha
n
Kaifen
g
Anyan
g
Huaiya
ng
Qingfen
g
Scenario 1Scenario 2Reference price
Scenario 1
Reference priceScenario 2
Fig. 7 Consumer prices of nodes (in a 2010, b 2015). Note: The reference price for natural gas is the real price in each year. The prices in Sce-narios 1 and 2 are the equilibrium prices of consumption

277Petroleum Science (2020) 17:268–278
1 3
We observe that gas prices tend to be lower with unbun-dling than with ownership integration. The quantities are larger and prices lower in the scenarios with pipeline separa-tion compared with the pipeline integration scenario. This result translates into higher welfare, which has critical impli-cations for the market organization of China’s natural gas sector.
There are three conclusions as follows: (1) Pipeline sepa-ration yields greater overall social welfare than pipeline inte-gration, with the welfare shifting from oil–gas producers to consumption markets. (2) Pipeline separation lowers equilib-rium consumption prices by driving competition among gas supply sources. It was found that for a consumer city at the pipeline network connection point, the revenue growth rate is faster than for other consumer cities because it can more easily choose natural gas from different supplies. (3) Pipe-line separation increases the contribution of natural gas to primary energy. Consumers can obtain natural gas at a lower price in the pipeline separation scenario, which encourages increased natural gas consumption.
Experience in OECD countries indicates that without effective pipeline separation, reforms typically fail to achieve their targets. Thus, pipeline separation has been an essential condition for effective wholesale pricing reform and to pro-vide the necessary incentives for domestic production and competition. In 2016, the CNDRC issued measures for the administration of natural gas pipeline transmission pricing, which should encourage natural gas transmission compa-nies to open their pipeline capacity to third-party compa-nies, thereby increasing utilization and achieving excess return. In addition, effective separation of the management and accounting of natural monopolies, as well as gas supply and trading, are crucial to ensuring pipeline separation and efficient regulation.
Acknowledgements The authors gratefully acknowledge the support provided by the National Natural Science Foundation of China under Grant Nos. 71673257 and 71804167.
Open Access This article is distributed under the terms of the Crea-tive Commons Attribution 4.0 International License (http://creat iveco mmons .org/licen ses/by/4.0/), which permits unrestricted use, distribu-tion, and reproduction in any medium, provided you give appropriate credit to the original author(s) and the source, provide a link to the Creative Commons license, and indicate if changes were made.
References
Boots MG, Rijkers FAM, Hobbs BF. Trading in the downstream European gas market: a successive oligopoly approach. Energy J. 2004;25:73–102. https ://doi.org/10.2307/41323 043.
China National Development and Reform Commission. Notice on printing and distributing the medium and long-term oil and gas pipeline network plan. 2017. http://www.ndrc.gov.cn/zcfb/zcfbt
z/20170 7/t2017 0712_85436 3.html (in Chinese). Accessed 19 May 2017.
China National Energy Administration. Energy development strategy action plan (2014–2020). National Energy Administration of China. 2014. http://www.nea.gov.cn/2014-12/03/c_13383 0458.htm (in Chinese). Accessed 3 Dec 2014.
David L, Percebois J. Access pricing on gas networks and capacity release markets: lessons from North American and European experiences. Energy Stud Rev. 2004;12:125–42. https ://doi.org/10.15173 /esr.v12i2 .456.
Devine MT, Gabriel SA, Moryadee S. A rolling horizon approach for stochastic mixed complementarity problems with endogenous learning: application to natural gas markets. Comput Oper Res. 2016;68:1–15. https ://doi.org/10.1016/j.cor.2015.10.013.
Dong J, Sha S, Li X, et al. Ownership unbundling of natural gas transmission networks in China. J Clean Prod. 2018;195:145–53. https ://doi.org/10.1016/j.jclep ro.2018.05.173.
Egging RG, Gabriel SA. Examining market power in the European natural gas market. Energy Policy. 2006;34:2762–78. https ://doi.org/10.1016/j.enpol .2005.04.018.
Egging R, Holz F, Gabriel SA. The world gas model: a multi-period mixed complementarity model for the global natural gas mar-ket. Energy. 2010;35:4016–29. https ://doi.org/10.1016/j.energ y.2010.03.053.
Egging R, Holz F. Risks in global natural gas markets: investment, hedging and trade. Energy Policy. 2016;94:468–79. https ://doi.org/10.1016/j.enpol .2016.02.016.
Electronics and Telecommunications Research Institute. Develop-ment report of oil and gas industry at home and abroad. Beijing: Petroleum Industry Press; 2018.
Gabriel SA, Kydes AS, Whitman P. The national energy mod-eling system: a large-scale energy-economic equilibrium model. Oper Res. 2001;49:14–25. https ://doi.org/10.1287/opre.49.1.14.11195 .
Gabriel SA, Kiet S, Zhuang J. A mixed complementarity-based equi-librium model of natural gas markets. Oper Res. 2005;53:799–818. https ://doi.org/10.1287/opre.1040.0199.
Gabriel SA, Zhuang J, Egging R. Solving stochastic complementarity problems in energy market modeling using scenario reduction. Eur J Oper Res. 2009;197:1028–40. https ://doi.org/10.1016/j.ejor.2007.12.046.
Golombek R, Gjelsvik E, Rosendahl KE. Effects of liberalizing the natural gas markets in Western Europe. Energy J. 1995;16:85–111. https ://doi.org/10.5547/ISSN0 195-6574-EJ-Vol16 -No1-6.
Growitsch C, Hecking H, Panke T. Supply disruptions and regional price effects in a spatial oligopoly—an application to the Global Gas Market. Rev Int Econ 2014;22:944–75. https ://doi.org/10.1111/roie.12138 .
Hallack M, Vazquez M. Who decides the rules for network use? A ‘common pool’ analysis of gas network regulation. J Inst Econ. 2014;10:493–512. https ://doi.org/10.1017/S1744 13741 40000 71.
Hecking H, Panke T. COLUMBUS: a global gas market model. EWI working paper. 2012. http://hdl.handl e.net/10419 /74405 . Accessed 6 Dec 2012.
Holz F, Hirschhausen CV, Kemfert C. A strategic model of European gas supply (GASMOD). Energy Econ. 2008;30:766–88. https ://doi.org/10.1016/j.eneco .2007.01.018.
Laffont JJ, Tirole J. Access pricing and competition. Eur Econ Rev. 1994;38:1673–710. https ://doi.org/10.1016/0014-2921(94)90046 -9.
Lewis D. A bundle of woe. Power Eng. 2007;21:22–5. https ://doi.org/10.1049/pe:20070 403.
O’Neill RP, Williard M, Wilkins B, et al. A mathematical programming model for allocation of natural gas. Oper Res. 1979;27:857–73. https ://doi.org/10.1287/opre.27.5.857.

278 Petroleum Science (2020) 17:268–278
1 3
Perner J, Seeliger A. Prospects of gas supplies to the European market until 2030—results from the simulation model EUGAS. Util Pol-icy. 2004;12:291–302. https ://doi.org/10.1016/j.jup.2004.04.014.
Stoner M. Steady-state analysis of gas production. Transmission and distribution systems. Paper SPE. 1969.
Vazquez M, Hallack M, Glachant JM. Designing the European gas market: more liquid and less natural? Econ Energy Environ Policy. 2012;1:25–38. https ://doi.org/10.5547/2160-5890.1.3.3.
Xu J, Hallack M, Vazquez M. Applying a third party access model for China’s gas pipeline network: an independent pipeline operator
and congestion rent transfer. J Regul Econ. 2017;51:72–97. https ://doi.org/10.1007/s1114 9-017-9316-z.
Zwart GTJ. European natural gas markets: resource constraints and market power. Energy J. 2009;30:151–65. https ://doi.org/10.5547/ISSN0 195-6574-EJ-Vol30 -NoSI-10.
Zwart G, Mulder M. NATGAS: a model of the European natural gas market. CPB Netherlands Bureau for Economic Policy Analysis. 2006.