
Comprehensive Plan - Cumberland RI
230
-
Upload
khangminh22 -
Category
Documents
-
view
0 -
download
0
Transcript of Comprehensive Plan - Cumberland RI


ACKNOWLEDGEMENTS
William S. Murray, Mayor
TOWN COUNCIL, 2016 E. Craig Dwyer, President Peter J. Bradley Arthur Lambi, Jr. Joshua R. Call-Fregeau James E. Scullin Scott R. Schmitt Robert G. Shaw, Jr.
PLANNING BOARD, 2016 David Coutu, Chair
Roy Cos Roy Costa, Jr. Harry MacDonald Isabel Reis Kenneth Bush Maria Vracic Richard A. Aubin Christopher A. Butler Gregory G. Scown
CUMBERLAND PLANNING DEPARTMENT
Jonathan Stevens, Director Josh O’Neill, Town Planner
Celeste Beauparlant, Planning Clerk
The Town wishes to thank those directly assisting this update of the Comprehensive Plan:
2014 TOWN OFFICIALS Dan McKee, Mayor James Higgins, Town Council Manuel DaCosta, Town Council Jeffrey Kearns, Town Council ELECTED OFFICIALS Jim McLaughlin, State Representative DIVISION OF STATEWIDE PLANNING Kevin Nelson Chelsea Siefert Caitlyn Greeley ZONING BOARD John McCoy Nicholas Goodier CONSERVATION COMMISSION Alex Marszalkowski Briscoe Lang Gus Uht
TOWN STAFF Robert Mitchell, School Superintendent Thomas Hefner, Town Solicitor Frank Stowik, Highway Director Sandra Giovanelli, Town Clerk Brian Silvia, Finance Director Celeste Dyer, Library Director Chris Champi, Water Department Superintendent Robert Anderson, Director of Public Works
David Carr, Sewer Department Superintendent Sean Thompson, Rescue Department Director John Desmarais, Police Department Kelley Nickson Morris, former Planning Director Liz Lemire, Dir., Children, Youth, and Learning Office George Stansfield, Chief of Staff Pattie Acquaviva-Aubin, former Tax Assessor Ken Mallette, Tax Assessor Leon Drury, Senior Services Director Mike Crawley, Recreation Department Director Jennifer Durken, Staff Assistant Chris Alger, Town Solicitor Eugene Jeffers, former Public Works Director Kim Berard, Public Works Administrative Assistant MASON ASSOCIATES (Consultants) David Westcott Christopher Mason Nancy Letendre Katie Goodrum (independent)
CUMBERLAND LAND TRUST Joe Palithorpe Randy Tuomisto
FRANKLIN FARM PRESERVATION ASSOCIATION Julie Guerin Pamela Thurlow Denise Mudge
CITIZEN REPRESENTATIVES Deborah Vine-Smith Alice Clemente

2016 | Cumberland Comprehensive Plan | iii
TABLE OF CONTENTS EXECUTIVE SUMMARY ......................................................................................................................................... 7
1. HOUSING AND NEIGHBORHOODS ............................................................................................................. 9
Introduction .......................................................................................................................................................... 10
Cumberland: Its People ......................................................................................................................................... 11 Neighborhoods ..................................................................................................................................................... 14
Housing .................................................................................................................................................................. 17
Housing Affordability ........................................................................................................................................... 19
Housing Programs ................................................................................................................................................ 24
Housing Growth Management ............................................................................................................................ 25
Opportunities for Producing Affordable Housing ............................................................................................ 26
Production of LMI Housing Units ...................................................................................................................... 26
Housing Goals ....................................................................................................................................................... 29
Housing Action Items .......................................................................................................................................... 30
2. ECONOMIC DEVELOPMENT ......................................................................................................................... 33
Introduction .......................................................................................................................................................... 34
Inventory ............................................................................................................................................................... 34
Need for Employment Opportunities, Goods, and Services ............................................................................ 37
Economic Development Programs ..................................................................................................................... 38
Industrial Parks and Enterprise Sites ................................................................................................................. 39
Broad Street Regeneration Action Plan .............................................................................................................. 47
Other Cumberland Village Business Corridor Districts ................................................................................... 50
Opportunity Space................................................................................................................................................ 50
Enhancement of Agriculture ................................................................................................................................ 51 Economic Development Summary, Opportunities, and Constraints ............................................................. 52
Economic Development Goals ............................................................................................................................ 53
Economic Development Action Items ................................................................................................................ 54
3. NATURAL RESOURCES ................................................................................................................................... 55
Introduction .......................................................................................................................................................... 56
Natural Resource Inventory ................................................................................................................................. 56
Natural Resources Opportunities and Threats .................................................................................................. 70
Natural Resources Goals ....................................................................................................................................... 71 Natural Resources Action Items ........................................................................................................................... 71
4. CULTURAL, HISTORIC, AND SCENIC RESOURCES .............................................................................. 73
Introduction .......................................................................................................................................................... 74
Historic Sites and Districts .................................................................................................................................. 75
Cultural Resources ................................................................................................................................................ 78
Scenic Resources ................................................................................................................................................... 79
Threats and Opportunities .................................................................................................................................. 82
Historic, Cultural, and Scenic Resources Goals ................................................................................................. 83
Historic, Cultural, and Scenic Resources Action Items .................................................................................... 83
5. PUBLIC FACILITIES AND SERVICES........................................................................................................... 85
Introduction ......................................................................................................................................................... 86
Town Administration ........................................................................................................................................... 87
Education ............................................................................................................................................................... 87
Library ................................................................................................................................................................... 96
Senior Services ...................................................................................................................................................... 97
Emergency Management .................................................................................................................................... 99
Police Department ............................................................................................................................................... 99
Cumberland Fire District ................................................................................................................................... 100

2016 | Cumberland Comprehensive Plan | iv
Rescue Services ................................................................................................................................................... 102
Water Supply ....................................................................................................................................................... 102
Sanitary Sewer ..................................................................................................................................................... 109
Energy .................................................................................................................................................................... 111 Solid Waste & Recycling ..................................................................................................................................... 113
Public Services and Facilities Goals ................................................................................................................... 114
Public Services and Facilities Action Items....................................................................................................... 115
6. RECREATION AND OPEN SPACE .............................................................................................................. 117
Introduction ......................................................................................................................................................... 118
Active Recreation ................................................................................................................................................. 119
Open Space ........................................................................................................................................................... 122
Issues and Opportunities ................................................................................................................................... 129
Open Space and Recreation Goals .....................................................................................................................130
Recreation and Open Space Action Items ........................................................................................................ 131 7. TRANSPORTATION........................................................................................................................................ 133
Introduction ......................................................................................................................................................... 134
Roads and Traffic ................................................................................................................................................. 134
Public Transportation ........................................................................................................................................ 140
Freight Rail .......................................................................................................................................................... 142
Bikeways and Walkways .................................................................................................................................... 142
Opportunities and Issues .................................................................................................................................... 143
Transportation Goals .......................................................................................................................................... 144
Transportation Action Items ............................................................................................................................. 144
8. NATURAL HAZARDS ..................................................................................................................................... 147
Introduction ........................................................................................................................................................ 148
Floods ................................................................................................................................................................... 148
Hazard Mitigation Plan and Mitigation Grant Activities ............................................................................... 150
Natural Hazards Profile ...................................................................................................................................... 152
Issues and Threats .............................................................................................................................................. 154
Natural Hazard Goals .......................................................................................................................................... 155
Natural Hazard Action Items ............................................................................................................................. 155
9. LAND USE .......................................................................................................................................................... 157
Introduction ........................................................................................................................................................ 158
Historic Land Use ............................................................................................................................................... 158
Impact of Modern Development ....................................................................................................................... 159
Vision for the Future .......................................................................................................................................... 160
Land Use Analysis Categories ............................................................................................................................. 161 Future Land Use ..................................................................................................................................................163
Best Practices for Managing Growth .................................................................................................................163
Design Guidelines ............................................................................................................................................... 165
Directing Development and Density ................................................................................................................ 167
Recommended Zoning Changes ....................................................................................................................... 169
Land Use Goals .................................................................................................................................................... 171 Land Use Action Items ........................................................................................................................................ 171
10. IMPLEMENTATION ...................................................................................................................................... 172
APPENDIX A: HOUSING DATA .......................................................................................................................... 1
APPENDIX B: CUMBERLAND’S VISION USING THE PAST TO ENRICH THE FUTURE .................... 1
APPENDIX C: NATURAL RESOURCES .............................................................................................................. 1
APPENDIX D. TRANSPORTATION .................................................................................................................... 1
APPENDIX E. NATURAL HAZARDS PROFILE ................................................................................................ 1
2016 | Cumberland Comprehensive Plan | v
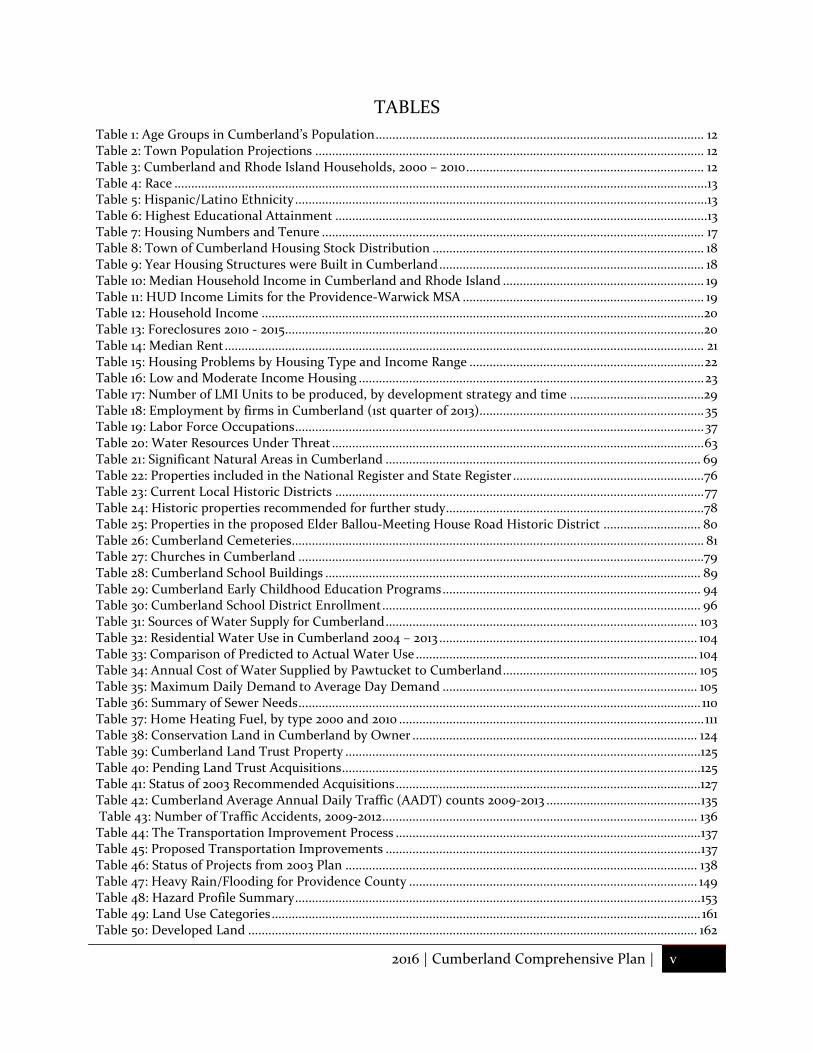
TABLES
Table 1: Age Groups in Cumberland’s Population .................................................................................................. 12
Table 2: Town Population Projections .................................................................................................................... 12
Table 3: Cumberland and Rhode Island Households, 2000 – 2010 ....................................................................... 12
Table 4: Race ............................................................................................................................................................... 13
Table 5: Hispanic/Latino Ethnicity ........................................................................................................................... 13
Table 6: Highest Educational Attainment ............................................................................................................... 13
Table 7: Housing Numbers and Tenure .................................................................................................................. 17
Table 8: Town of Cumberland Housing Stock Distribution ................................................................................. 18
Table 9: Year Housing Structures were Built in Cumberland ............................................................................... 18
Table 10: Median Household Income in Cumberland and Rhode Island ............................................................ 19
Table 11: HUD Income Limits for the Providence-Warwick MSA ........................................................................ 19
Table 12: Household Income .................................................................................................................................... 20
Table 13: Foreclosures 2010 - 2015 ............................................................................................................................. 20
Table 14: Median Rent ............................................................................................................................................... 21 Table 15: Housing Problems by Housing Type and Income Range ...................................................................... 22
Table 16: Low and Moderate Income Housing ....................................................................................................... 23
Table 17: Number of LMI Units to be produced, by development strategy and time ........................................29
Table 18: Employment by firms in Cumberland (1st quarter of 2013)................................................................... 35
Table 19: Labor Force Occupations .......................................................................................................................... 37
Table 20: Water Resources Under Threat ............................................................................................................... 63
Table 21: Significant Natural Areas in Cumberland .............................................................................................. 69
Table 22: Properties included in the National Register and State Register ......................................................... 76
Table 23: Current Local Historic Districts .............................................................................................................. 77
Table 24: Historic properties recommended for further study ............................................................................. 78
Table 25: Properties in the proposed Elder Ballou-Meeting House Road Historic District ............................. 80
Table 26: Cumberland Cemeteries ........................................................................................................................... 81 Table 27: Churches in Cumberland .........................................................................................................................79
Table 28: Cumberland School Buildings ................................................................................................................ 89
Table 29: Cumberland Early Childhood Education Programs ............................................................................. 94
Table 30: Cumberland School District Enrollment ............................................................................................... 96
Table 31: Sources of Water Supply for Cumberland ............................................................................................. 103
Table 32: Residential Water Use in Cumberland 2004 – 2013 ............................................................................. 104
Table 33: Comparison of Predicted to Actual Water Use .................................................................................... 104
Table 34: Annual Cost of Water Supplied by Pawtucket to Cumberland .......................................................... 105
Table 35: Maximum Daily Demand to Average Day Demand ............................................................................ 105
Table 36: Summary of Sewer Needs ........................................................................................................................ 110
Table 37: Home Heating Fuel, by type 2000 and 2010 ........................................................................................... 111 Table 38: Conservation Land in Cumberland by Owner ..................................................................................... 124
Table 39: Cumberland Land Trust Property .......................................................................................................... 125
Table 40: Pending Land Trust Acquisitions ........................................................................................................... 125
Table 41: Status of 2003 Recommended Acquisitions ...........................................................................................127
Table 42: Cumberland Average Annual Daily Traffic (AADT) counts 2009-2013 .............................................. 135
Table 43: Number of Traffic Accidents, 2009-2012 .............................................................................................. 136
Table 44: The Transportation Improvement Process ........................................................................................... 137
Table 45: Proposed Transportation Improvements .............................................................................................. 137
Table 46: Status of Projects from 2003 Plan ......................................................................................................... 138
Table 47: Heavy Rain/Flooding for Providence County ...................................................................................... 149
Table 48: Hazard Profile Summary ......................................................................................................................... 153
Table 49: Land Use Categories ................................................................................................................................ 161 Table 50: Developed Land ...................................................................................................................................... 162

2016 | Cumberland Comprehensive Plan | EXECUTIVE SUMMARY vi
Table 51: Population and Dwelling Unit Projections Based on Total Build Out, 1990-2000 ........................... 163
Table 52: Cumberland and Rhode Island Households, 2000 – 2010 ....................................................................... 3
Table 53: Housing Tenure and Ownerships ..............................................................................................................4
Table 54: Foreclosures 2010 - 2013 .............................................................................................................................. 5
Table 55: Town of Cumberland Housing Stock Distribution .................................................................................. 5
Table 56: Year Housing Structures were built in Cumberland ............................................................................... 5
Table 57: Soils with Severe Septic System (OWTS) Limitations............................................................................. 1 Table 58: Prime Agricultural Soils ............................................................................................................................. 2
Table 59: Rare Species in Cumberland ...................................................................................................................... 3
Table 60: Vertebrates ..................................................................................................................................................4
Table 61: Breeding Bird Species ..................................................................................................................................4
Table 62: Migratory Bird Species in Cumberland .................................................................................................... 5
Table 63: Rare Plant Species ....................................................................................................................................... 5
Table 64: Functional Classification System .............................................................................................................. 1 Table 65: 2014 Functional Classification Mileage ..................................................................................................... 1 Table 66: Recent Heat Waves in Rhode Island ........................................................................................................ 2
Table 67: Earthquakes in Rhode Island, 1925-present ............................................................................................. 3

2016 | Cumberland Comprehensive Plan | 1. HOUSING AND NEIGHBORHOODS 7
EXECUTIVE SUMMARY
Located in the northeast corner of Rhode Island, the Town of Cumberland is a New England bedroom community of 33,700 living within its 28.4 square miles. Town government is generally regarded as well-managed, its public schools enjoy a tradition of excellence, and its residential tax rate is well below the state median.
Notable for its historic mills and mill villages of the American Industrial Revolution located along the Blackstone River, Cumberland experienced rapid post World War II suburban growth that fundamentally changed the Town. The demand for new suburban, single family housing remains strong because of its commuting proximity to Boston and Providence, easy access to Interstates 95 and 295, and the recovering economy. From south to northeast, the Town’s development changes from urban to suburban and then rural.
Cumberland’s key challenges are: limiting suburban residential development; protecting community character and natural resources; enhancing a sense of civic identity beyond that of a “bedroom community”; and increasing the availability of affordable housing.
Cumberland’s commercial and industrial tax base is not adequate to offset the anticipated additional cost to taxpayers of continued rapid suburban growth. Future commercial and industrial development opportunities are limited. The community opposes becoming a regional shopping or manufacturing center, wishing to avoid adverse impacts on traffic circulation and the environment.
The Town maintains a high level of municipal services and educational quality. It has invested heavily in its schools and is in the process of creating a new municipal public safety building. However, rapid suburban residential growth has put a severe stress on Town schools and services. This growth challenges the Town’s ability to provide quality schools and services while keeping the tax rate under control. Cumberland’s open space, traffic circulation, and quality of life are also at stake.
If Cumberland’s rural land continues to be developed at current rates, the Town’s charm will erode, traffic will increase, and capacity to deliver municipal services will be stressed. Unless the Town creates clear, definitive standards and thresholds for new development, it is expected that the current pace and character of development will limit the Town’s choices in charting its own destiny.
The Cumberland Comprehensive Plan 2016-2036 includes specific actions to effectively manage growth. New amendments to the Zoning Code and Land Development Regulations and vigilant application of the Town’s existing regulations, as articulated in this Plan, must be implemented to meet the needs of the entire community.
This Plan examines the physical, cultural, social, demographic, and economic characteristics of a community. The Plan determines how these factors, individually and in combination with each other, will influence the future development of Cumberland. The Plan then specifies strategies that are consistent with the development capacities of the community and with the desires of its residents.
Having an adequate supply of affordable housing is the other major challenge to Cumberland, indeed, for most of Rhode Island as well as towns and cities throughout the Northeast. The cost of housing remains a significant barrier to upward mobility for many as rent rates remain high and living wages are not keeping up. The Plan includes a number of actions the Town and its non-profit affordable housing partners can implement to increase the percentage of affordable housing in Cumberland.

2016 | Cumberland Comprehensive Plan | 1. HOUSING AND NEIGHBORHOODS 8
Cumberland’s original Comprehensive Plan dates to 1991 and was last updated in 2003. This Plan replaces the 2003 Plan. Development of this Plan included data collection, analysis of issues, formulation of goals and policies, and synthesis of recommendations leading to the articulation of the goals. This process included the direct involvement of Town departments, boards and commissions, and the larger resident community through a series of public workshops dedicated solely to updating the Plan. Differences and similarities between citizens’ needs in 2003 and 2016 are identified throughout the text where appropriate.
This 2016 Plan has been developed in cooperation with the Rhode Island Division of Statewide Planning, which, as specified in RIGL 45-22.2, is authorized to administer guidance and approve all municipal comprehensive plans in Rhode Island. This Plan utilizes a 20 year planning horizon in its discussion of Plan elements and its outlooks for goals, policies, and action items to be implemented by this Plan. These standards are due to a change in the State Planning and Land Use that went into effect in 2011. Comprehensive Plans must now be updated and re-adopted every ten years. In addition, five years after a municipality adopts an updated Comprehensive Plan, it must file an informational report to the Division of Statewide Planning on the status of the Comprehensive Plan Implementation Program. Comprehensive Plans serve as the foundation for municipal zoning.
There are nine plan elements, which are topical chapters such as housing, land use, and public facilities and services. Each element includes: an inventory of existing conditions and resources, furnishing the starting point for evaluating Cumberland's options for the future; a statement describing how Cumberland has changed since 2003; findings presenting a summary of the research, data collection and analysis; goals; and action items to achieve the stated goals.
The final section specifies what actions the Town will take to attain its goals. Implementation strategies include a hierarchical ranking of priority, timelines, and assignment of responsibility. Goals and action items are meant to provide clear direction, but should be re-evaluated and adjusted periodically with appropriate community input to reflect accomplishments or changing circumstances.
It is important to note that Rhode Island is among a relatively few states where the comprehensive plan is the foundation of the zoning code and development regulations. Once this Plan is adopted, the Town will need to revise its Zoning Ordinance and Development Regulations accordingly, to ensure consistency with the goals and actions of the Plan.

2016 | Cumberland Comprehensive Plan | 1. HOUSING AND NEIGHBORHOODS 9
1. HOUSING AND NEIGHBORHOODS
Subdivision off Pound Road ca. 1995

2016 | Cumberland Comprehensive Plan | 1. HOUSING AND NEIGHBORHOODS 10
Introduction
Cumberland is committed to the equitable provision of safe and affordable housing opportunities for existing and future residents. This section identifies housing needs and outlines strategies by which the Town can address these needs while ensuring that it retains local control over land use decisions in keeping with the unique character of the community.
This section serves as Cumberland’s Housing Production Plan as required by RI Gen Laws § 45-22.2-6(b)(6) to meet the housing needs of low and moderate income households. The plan sets forth progress already made and the steps intended to achieve the State’s ten percent (10%) goal for Low and Moderate Income (LMI) housing units as a proportion of year-round housing in Cumberland. These steps will help fulfill housing needs locally and in support of the state’s overall efforts to provide affordable housing to all its residents.
The housing goals, objectives, and action items in this section consider public hearing comments, the health and safety of existing residents, environmental protection, the goal of providing a variety of housing options affordable to all residents of the Town, and the protection of neighborhood character.
This section includes the following information.
• A demographic profile of Cumberland
• A description of housing supply emphasizing the prevailing housing stock, its past trends, recent growth and costs. This is accomplished through a discussion of residential development as measured by the type, quantity and location of residential construction; a description of the supply of public housing in Cumberland; and a discussion of the physical condition of the housing stock.
• A assessment of housing demand and affordability including a review of historic and current patterns of occupancy, ability to pay for housing, and the socio-demographic characteristics which are unique to Cumberland. This process includes an analysis of housing tenure characteristics; an assessment of household income; an analysis of affordability in the owner-occupied and residential rental market sectors; and an assessment of the current and future demographic demand for housing.
• An inventory and description of the existing or planned housing programs and policies and their focus and strengths in terms of meeting the housing needs of the Town of Cumberland.
• Goals and strategies: programmatic and policy responses to the housing needs identified. The most pressing and important issues are translated into community goals.
Housing Needs in Rhode Island While detailed housing and demographic information will be provided below, the following excerpt of the Apr. 28, 2016 Providence Journal article “Housing needs report a ‘clarion call’ for R.I.” by Christine Dunn briefly summarizes statewide housing needs.
A recent report on future housing needs in the state is a “clarion call” for everyone in Rhode Island to work together to avoid a housing crisis similar to those now existing in Boston and New York…. The “Projecting Future Housing Needs Report” conducted by HousingWorks RI at Roger Williams University for Rhode Island Housing, released April 6…said rising housing costs for both renters and owners in the Ocean State means that affordability problems are now “mainstream.”
About 3,500 units of new housing yearly, at prices affordable to millennials and retired adults, are necessary to meet the needs of Rhode Islanders through 2025, the report said, but
2016 | Cumberland Comprehensive Plan | 1. HOUSING AND NEIGHBORHOODS 11
this level of building is more than triple recent levels of production in the state. The report also found that Rhode Island’s rental vacancy rate was 4.4 percent in 2015, far below the national rate of 6.7 percent, another sign that high demand and low supply is pushing rental costs up.
Although the state’s population is projected to grow just 3 percent to 5 percent from 2015 to 2025, a 12 to 13 percent increase in the number of households is anticipated, driven by a growing population and simultaneous decline in household size, the report said. Young adults and seniors will account for most of the projected household growth. Up to 75 percent of the new households will have incomes below 80 percent of the area median income.
State Planning Act Requirements According to the Rhode Island Comprehensive Planning and Land Use Regulation Act, the Housing Element must include the identification of existing housing patterns, an analysis of existing and forecasted housing needs, and identification of areas suitable for future housing development or rehabilitation. The plan must include an affordable housing program that meets the requirements of § 42-128-8.1, the "Comprehensive Housing Production and Rehabilitation Act of 2004" and chapter 45-53, the "Rhode Island Low and Moderate Income Housing Act" (the LMI Act). The plan must include goals and policies that further the goal of subdivision 45-22.2-3(c)(3)1 and implementation techniques that identify specific programs to promote the preservation, production, and rehabilitation of housing” (R.I. Gen Laws § 45-22.2-6(b)(6)).
This element has been created in accordance with the standards provided by the Division of Planning in the document “Interim Guidance for Comprehensive Plan Review.” This set of state standards requires the inclusion of data including but not limited to the breakdown of housing unit types, the age and condition of units, and the concentration of housing throughout the community. The standards require assessment of the community’s unique affordable housing needs, suitable housing options, better housing stock, and housing vulnerable to future natural disasters.
Cumberland: Its People
The following demographic information was provided by the Rhode Island Division of Statewide Planning for 2015.
Population trends provide important information in regard to future housing trends. Census Bureau data show that Cumberland’s population has increased since 2000 when the town had 31,840 residents. The Rhode Island Department of Labor and Training estimated that the population of Cumberland grew steadily from July 2000 through July 2009, reaching roughly 33,506. A steady increase continued through July 2013 to bring the most recent count of residents to just over 34,000. The population is expected to increase in the years ahead. The age of Cumberland’s population affects both the type and tenure of existing and future housing demand. According to Census data, the Town saw an increase in the median age from 39.3 to 42.5 years from 2000 to 2010. The 45 to 54 age cohort increased by 1,264 people or about 78 percent. While the overall population is getting older, the largest number increase among age groups from 2000-2010 was in the 15 to 19 year old bracket, which grew by 274 people or 87 percent. According to American Community Survey 5 year estimates, the median age of Cumberland’s population is leveling off, with an estimated median age of 41.9 years in 2012.
1 R.I. Gen Laws § 45-22.2-3(c)(3)1 (3) To promote the production and rehabilitation of year-round housing and to preserve government subsidized housing for persons and families of low and moderate income in a manner that: considers local, regional, and statewide needs; achieves a balance of housing choices for all income levels and age groups; which recognizes the affordability of housing as the responsibility of each municipality and the state; takes into account growth management and the need to phase and pace development in areas of rapid growth; and which facilitates economic growth in the state.

2016 | Cumberland Comprehensive Plan | 1. HOUSING AND NEIGHBORHOODS 12
The increasing median age of the population is largely attributable to resident “baby boomers,” the generation born after World War II, who are aging in place. Waiting lists for elderly and disabled public subsidized housing have grown markedly in the last decade, and the demand is expected to increase. Displacement of elderly and disabled residents could occur if an adequate supply of affordable housing is not available. Elderly and disabled residents on fixed incomes are more vulnerable to rental market changes and affected by increasing demand for rental units among a younger, more mobile population. Further, elderly and disabled homeowners on fixed incomes may face challenges maintaining properties.
Table 1: Age Groups in Cumberland’s Population
Age group # %
Under 5 years 1,468 4%
5 to 9 years 2,010 6%
10 to 14 years 2,505 7%
15 to 19 years 2,144 6%
20 to 24 years 1,546 5%
25 to 34 years 3,705 11%
35 to 44 years 4,834 14%
45 to 54 years 5,938 18%
55 to 59 years 2,225 7%
60 to 64 years 1,874 6%
65 to 74 years 2,670 8%
75 to 84 years 1,886 6%
85 years + 900 3%
Table 2: Town Population Projections
2020 2025 2030 2035 2040
34,712 35,804 36,775 37,548 38,074
Source: RI Statewide Planning
Average household size has decreased since 2000, following trends in the state and country. Smaller household sizes are associated with increased demand for smaller housing units.
Table 3: Cumberland and Rhode Island Households, 2000 – 2010
2000
Cumberland 2010
Cumberland %
Change
2000 Rhode Island
2010 Rhode Island
% Change
Total Population 31,840 33,506 +5.23% 1,048,319 1,052,567 +0.4%
Total Households 12,198 13,143 +7.75% 408,424 413,600 +1.3%
Average Number of Persons per Household
2.59 2.53 2.6 2.5
Source: U.S. Census 2000 and 2010

2016 | Cumberland Comprehensive Plan | 1. HOUSING AND NEIGHBORHOODS 13
Cumberland is not racially diverse, at 93% White and 96% Non-Latino.
Table 4: Race
Race # %
White 31,468 93%
Black 522 2%
Native American
39 .1%
Asian 1,266 2%
Other 431 1%
Two or more races
445 1%
Table 5: Hispanic/Latino Ethnicity
Hispanic/Latino Identity
# %
Latino 1,266 4%
Non-Latino 32,439 96%
Table 6: Highest Educational Attainment
Education level # %
Less than 9th grade 1,054 4%
Grade 9-12 1,566 7%
HS or equivalency 5,814 24%
Some college 4,396 18%
Associate degree 2,432 10%
Bachelor’s degree 5,390 22%
Master’s degree 2,886 12%
Professional degree 343 1%
Doctoral degree 151 1%
In March 2016, Rhode Island Monthly published the following socioeconomic profile of Cumberland residents which was created by the GIS/demographic data company ESRI in their “Tapestry Segmentation” analysis of Rhode Island.
“Cumberland’s rustic miles in northern Rhode Island are dominated by Parks and Rec types [practical suburbanites who saved to buy homes in well-established neighborhoods, still working in comfortable jobs and approaching retirement], followed by Savvy Suburbanites [empty nesters or still have adult children, well-read foodies who enjoy good wine, exercise regularly and enjoy golf and skiing] and Comfortable Empty Nesters [live in small towns and suburbs, transitioning from raising kids to retirement work in government, health care or manufacturing], with Home Improvement [busy married couples paying down student loans and second mortgages, shop at warehouse stores, like to watch the DIY Network], In Style [professional couples who work hard and don’t have kids, live urbane lifestyles and support the arts, like to travel and are always connected by smartphones], Golden Years [active independent seniors living outside cities, stay busy visiting museums, going to concerts, exercising, and going online for everything], Bright Young

2016 | Cumberland Comprehensive Plan | 1. HOUSING AND NEIGHBORHOODS 14
Professionals [young active married couples, work white collar jobs, concerned about the environment, rent movies from Netflix and go to bars and clubs for fun]. Small Town Simplicity [young families and seniors who live in small towns, tend to be conservative, avoid debt, have a vegetable garden and repair own trucks and ATVs] and Front Porches [diverse young families with kids, many single parents, rent and work blue-collar jobs, cook at home to save money] rounding out the population.
Cumberland residents are civically engaged, with nearly 50 percent voting in an election over the past twelve months, just shy of the number of the adults who bought athletic shoes over the last year. They’re looking forward to retirement if they’re not already there, with more than 9,000 adults invested in a 401(k) or an IRA. And Cumberlandites are nearly six times more likely to give to religious organizations as political groups.”
Neighborhoods
The 2003 Comprehensive Plan identified Planning Districts to help localize planning effects to distinctive areas of the Town. The districts corresponded to Census tracts. For 2016, the Town has revised the planning districts to loosely correspond to historic neighborhoods in order to better analyze housing development potential. The revised districts are described below and pictured on the Neighborhoods Map.
Valley Falls/Lonsdale Located in the southern section of Cumberland and bordered by the City of Central Falls, this district includes a substantial American Industrial Revolution mill village community surrounded by single- and multi-family residences. At 7.3 people per acre, this district is the most densely settled within the Town and the most urban in character. Potential for new housing is limited to redevelopment of existing structures (mills being the most obvious) and infill. This neighborhood also contains a higher concentration of low and moderate income population than most other Cumberland neighborhoods and, due to the age of the existing housing stock, has higher housing rehabilitation needs.
Valley Falls is the home to a well-established community of Portuguese Americans with a long history in the Town dating to the 1910s. By the 1920s, the community was sufficiently established to build the Lusitania Club, the Portuguese School, and Fatima Church.
Berkeley Originally a mill village on the Blackstone River, this neighborhood is characterized by mixed land uses: medium to high density residential development with industrial uses along the river and commercial uses along Route 122. Some of the industrial properties are underutilized and may offer potential for provision of affordable housing through adaptive reuse and/or redevelopment. There are also gravel and quarry operations that, although currently still operating, may eventually provide land for future redevelopment when their natural resources have been exhausted.
USGS map of Lonsdale/Valley Falls 1949
Berkeley Village ca. 1870

2016 | Cumberland Comprehensive Plan | 1. HOUSING AND NEIGHBORHOODS 15
Monastery Heights Located in south central Cumberland between High Street and Diamond Hill Road, this neighborhood was transformed after World War II to suburban single family residences on medium to small lots. The most notable feature of the neighborhood is the Monastery, a 530-acre wooded tract obtained by the town from the Cistercian Monks in the 1960s and 1970s and the site of the Town’s Library. Although this neighborhood is suburban, there is room for additional housing units on infill lots and on a few remaining undeveloped and forested tracts.
Ashton Another historic mill village on the Blackstone, this district is characterized by mixed land uses with medium to high density residential development. Housing in Ashton generally grades from repurposed mill housing in multi-family structures near the mills on the western part of the district to suburban single family homes on the east. There is some land available in this neighborhood for infill development and, like Berkeley, this neighborhood includes existing or former industrial properties that may be suited to housing by adaptive reuse and/or redevelopment.
Ashton Viaduct Bridge ca. 1935
Arnold Mills Located along the eastern edge of Cumberland abutting Attleboro, this area is characterized by single-family residential development, suburban to rural in character. The neighborhood includes the historic village of Arnold Mills, and large reservoirs that provide public water for the Pawtucket water system. This area has experienced a great deal of growth over the past decade and remains under significant development pressure. There is a significant amount of land available to build houses, so the Town must take appropriate precautions to protect the public water supply sources.
Thompson Hill This neighborhood straddles Diamond Hill Road north of Route I-295. The eastern part is characterized by single family homes on lots of 15,000 to 20,000 square feet. The area was largely developed in the 1960’s and 70’s with streets set in 90 degree grids and single family tract housing typical of that era. The western part of this neighborhood is more rural, with single family homes on large lots surrounded by forest. Extension of the suburban development in the eastern part of the neighborhood offers significant potential for new housing development.
Monastery of Our Lady of the Valley (rendering ca. 1925)
Arnold Mills Fourth of July parade ca. 1940

2016 | Cumberland Comprehensive Plan | 1. HOUSING AND NEIGHBORHOODS 16
Lippitt Estates In the 1930s, this area was a popular summer vacation destination comprised of summer homes, a golf course, private beach, and a summer stock theatre. President William Howard Taft reputedly vacationed here, as he was related to the Lippitt family. Evidence of this once-thriving resort still survives. This single-family residential neighborhood begun in the 1950s has experienced slow growth and infill in the recent past. There are many pre-existing non-conforming vacant lots. Some of the lots in this development are served by an old, undersized water main. New structures are not allowed to tie in to this utility, and therefore the development potential is correspondingly
constrained. While unlikely any time soon, if new water collectors were installed so service met utility standards, it is likely that a number of these non-conforming lots would be developed.
North Cumberland Located in the northeastern-most corner of Cumberland, this neighborhood is primarily composed of single family homes on large lots. While still retaining much of its historic rural character, since the 1980s this area has developed rapidly, with larger, more expensive homes. There is still land that could be built upon, and care must be taken to protect the quality of the waters needed for public water supply.
Diamond Hill This is one of Cumberland’s most sparsely populated neighborhoods, characterized by large homes on large lots surrounded by forest. Development is inhibited by a lack of roads, public water, and sewer service. While suitable for additional development, density must be limited to ensure adequate well water supply and use of state-approved on-site wastewater treatment systems.
Grant Mills This neighborhood, located along the northern border of Cumberland just west of Miscoe Lake, is characterized by low-density rural development. Predominantly single family homes on large lots surrounded by woodlands, this area has capacity for additional development subject to the same restrictions as the Diamond Hill Neighborhood.
Ballou District Located in the northwest corner of Cumberland along West Wrentham Road, the Ballou District is characterized by low-density rural development, although part of the Highland Industrial Park also occupies the southern part of this neighborhood. This area contains the highest concentration of
Lippitt Estates subdivision proposal 1936
Diamond Hill Ski Area advertisement, ca. 1962
Grant Mills circa 1960
Elder Ballou Meeting House (HABS HAER, ca. 1935)

2016 | Cumberland Comprehensive Plan | 1. HOUSING AND NEIGHBORHOODS 17
Cumberlandite, a mineral unique to Cumberland. There are extensive farmlands located along Elder Ballou Meeting House Road that offer the potential for new housing development, but care must be taken to preserve important agricultural land in the process.
Cumberland Hill A predominantly residential area with single-family homes and some recent condominium development. This district has the second highest population density in Cumberland. Development in the neighborhood began shortly after World War II, with most of the housing constructed in the 1950s and 1960s. This area has limited potential for additional development, primarily lot infill and redeveloping of existing quarries and gravel operations.
Housing
Units and Tenure The following table provides a detailed look at the total number of housing units, both owner-occupied and renter-occupied, for Cumberland and its surrounding area for 2000 and 2010. Cumberland had 13,936 housing units in 2010, an increase of 1,364 since 2000. 96% were occupied. The number of year-round housing units, on which LMI unit threshold is based, was nearly identical at 13,345.
Owner occupancy as a percentage of total housing in Cumberland decreased from 2000 to 2010 from 74% to 70%, or 4%. The percentage of units occupied by renters rose from 22.5% in 2000 to 24.4% in 2010. Seasonal units continued to be a negligible share of total units at only 0.3%.
Table 7: Housing Numbers and Tenure
Unit Tenure Cumberland % Northern Mkt Area % Rhode Island %
Total Units
2000 12,572 100% 51,303 100% 439,837 100%
2010 13,791 100% 55,041 100% 463,388 100%
% Increase
2000-2010 9.7% 7.2 5.4
Occupied Units
2000 12,198 97% 49,339 96.2% 408,424 92.9%
2010 13,143 95% 50,916 92.6% 413,600 89.3%
Owner Occupied
2000 9,360 74% 29,797 58.1% 245,156 60.0%
2010 9,770 70% 31,573 57.4% 250,952 54.2%
Renter Occupied
2000 2,838 22.5% 19,542 38.1% 163,268 40.0%
2010 3,373 24.4% 19,343 35.1% 162,648 35.1%
Vacant Units
2000 347 2.7% 1,964 3.8% 31,413 7.1%
2010 648 4.6% 4,125 7.5% 49,788 10.7%
Seasonal Units
2000 36 0.3% 157 0.3% 12,988 3.0%
2010 53 0.3% 228 0.4% 17,077 3.7%
Source: U.S. Census 1990, 2000, and 2010
Beers map (ca. 1870)

2016 | Cumberland Comprehensive Plan | 1. HOUSING AND NEIGHBORHOODS 18
Structure Types Single family detached homes are the most common housing type (66.8%), as seen in the table below. Records of building permits issued by the Town show that 87% of the new housing stock since 2005 consisted of single family homes (461 units) and 13% or 69 were new multi-family units. Based on the number of building permits issued between January 2010 and June 2014, most of the recent residential development has occurred in the northern part of the town and single family new construction is dominant.
Table 8: Town of Cumberland Housing Stock Distribution
Structure Type # %
Total # Units 13,676 100.0%
Single Family Home 9,136 66.8%
1 Unit Attached (e.g. condo) 623 4.6%
2-4 Units 1,883 13.7%
5-9 Units 608 4.5%
10 or more units 1,410 10.3%
Mobile home 16 0.1%
Boat, RV, van, etc. 0 0.0%
Source: 2008-2012 ACS 5-year estimates
Age of Housing The median age of a Cumberland housing in it is 48 years, or built in in 1967. The following data on the age of existing residential structures refers to when a building was first constructed, not when it may have been remodeled or added on to, or converted.
Table 9: Year Housing Structures were Built in Cumberland
Year Built # of Units % of Total Units 2010 or later 21 .2%
2000-2009 1,324 9.7%
1990-1999 1,813 13.3%
1980-1989 1,891 13.8%
1970-1979 1,344 9.8%
1960-1969 2,095 15.3%
1950-1959 1,039 14.2%
1940-1949 656 4.8%
1939 or earlier 2,593 19.0% Total housing units 13,676 100%
Source: 2008-2012 ACS 5-year estimates
While the housing stock is in relatively good overall condition, the large numbers of older residential units could pose future code compliance and rehabilitation problems and demographic trends suggest increasing numbers of older occupants who may be less able to cope with the maintenance and upkeep of their homes.

2016 | Cumberland Comprehensive Plan | 1. HOUSING AND NEIGHBORHOODS 19
Housing Affordability
The cost of housing continues to raise concerns for the residents of Cumberland. The lack of options for Cumberland’s young adults who recently graduated high school or college and who wish to live in Town is an on-going issue.
Housing affordability is also an issue for existing residents and especially to first time home buyers. Rising rental costs are believed to have an even greater impact on affordability because the increases are spread throughout the rental housing stock in a relatively short time period. Housing resale prices, on the other hand, are limited in their direct impact by the small number of sales transactions relative to the owner occupied housing stock and the tempering effect of built up equity enjoyed by buyers who are already home owners.
Household Income and Affordable Housing Target Levels The income level of Cumberland’s population affects housing affordability. The 2000 Census indicated that the town’s median income was $54,656 in 1999, an increase of 34.3 percent over the 1990 level of $40,683. According to the American Community Survey 2010 - 2014 5-Year Estimates, the annual income needed to afford the median home price in Cumberland was $80,359, 26% higher than the state median income of $67,552. The median household income over the last decade has risen well above the rate of inflation, from $54,656 to $71,106.
Table 10: Median Household Income in Cumberland and Rhode Island
Year Cumberland Rhode Island 1990 $40,683 $32,181
2000 $54,656 $42,090
2014 estimate $72,610 $56,361
% Change 1990-2000 34.3 30.8
% Change 2000-2010 34.2 33
80% of Median $58,088 $45,089
50% of Median $36,305 $28,181
30% of Median $21,783 $16,908
Source: U.S. Census 1980, 1990, 2000 and 2010 substituted ACS Estimate Data 2010-2014 Median Income in the Past 12 Months (2014 Inflation-Adjusted Dollars)
Affordable housing programs target low-income and medium-income households. Each year the U.S. Department of Housing and Urban Development (HUD) calculates Area Family Median Incomes (AFMI) by family size for the Providence-Fall River-Warwick Metropolitan Statistical Area.
Table 11: HUD Income Limits for the Providence-Warwick MSA
Income Category
Persons in Family
1 2 3 4 5 6 7 8
Extremely Low $15,300 $17,500 $20,160 $24,300 $28,440 $32,580 $36,730 $40,890 Very Low $25,500 $29,150 $32,800 $36,400 $39,350 $42,250 $45,150 $48,050
Low $40,800 $46,600 $52,450 $58,250 $62,950 $67,600 $72,250 $76,900
Source: HUD FY2016 Income Limits Documentation System
The FY 201604 income cutoffs for residents to qualify for federal/state subsidized affordable housing are shown in the table above.
2016 | Cumberland Comprehensive Plan | 1. HOUSING AND NEIGHBORHOODS 20
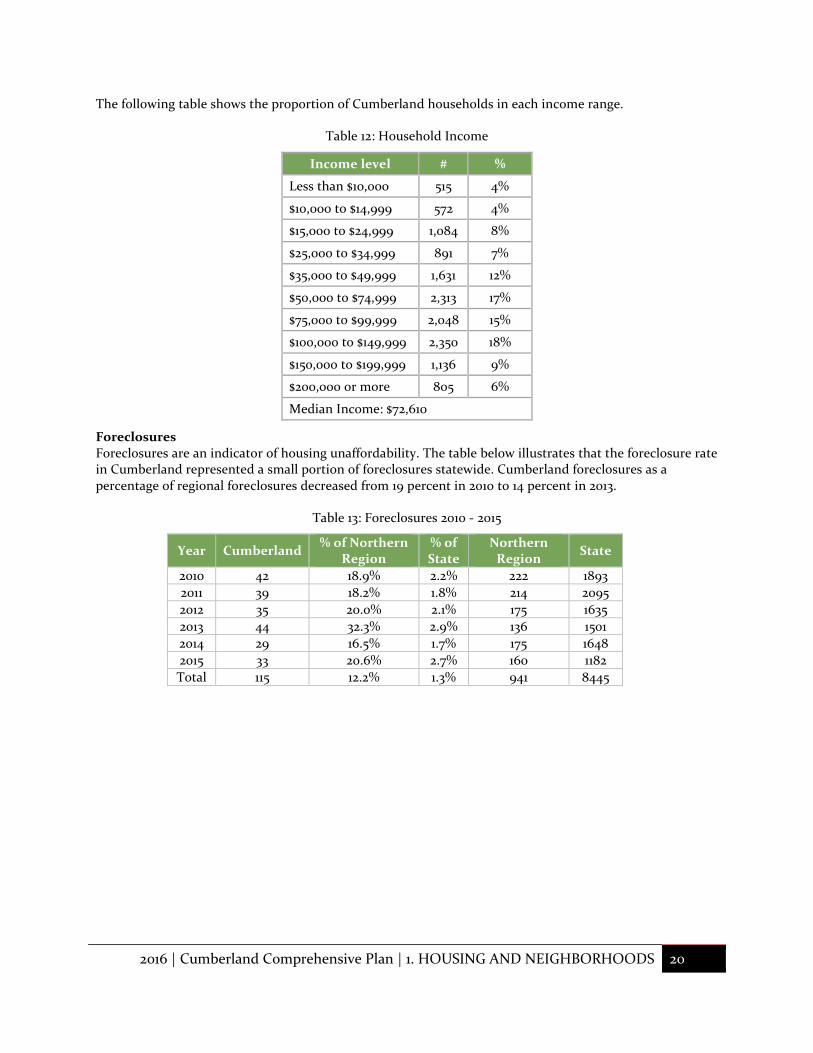
The following table shows the proportion of Cumberland households in each income range.
Table 12: Household Income
Income level # %
Less than $10,000 515 4%
$10,000 to $14,999 572 4%
$15,000 to $24,999 1,084 8%
$25,000 to $34,999 891 7%
$35,000 to $49,999 1,631 12%
$50,000 to $74,999 2,313 17%
$75,000 to $99,999 2,048 15%
$100,000 to $149,999 2,350 18%
$150,000 to $199,999 1,136 9%
$200,000 or more 805 6%
Median Income: $72,610
Foreclosures Foreclosures are an indicator of housing unaffordability. The table below illustrates that the foreclosure rate in Cumberland represented a small portion of foreclosures statewide. Cumberland foreclosures as a percentage of regional foreclosures decreased from 19 percent in 2010 to 14 percent in 2013.
Table 13: Foreclosures 2010 - 2015
Year Cumberland % of Northern
Region % of State
Northern Region
State
2010 42 18.9% 2.2% 222 1893
2011 39 18.2% 1.8% 214 2095
2012 35 20.0% 2.1% 175 1635
2013 44 32.3% 2.9% 136 1501
2014 29 16.5% 1.7% 175 1648
2015 33 20.6% 2.7% 160 1182
Total 115 12.2% 1.3% 941 8445

2016 | Cumberland Comprehensive Plan | 1. HOUSING AND NEIGHBORHOODS 21
Housing Costs The 2010 Median Home Value in Cumberland was $234,419. The Median Sales price has fluctuated dramatically from $163,000 in 2000, to $324,950 in 2005, to $248,000 in 2010, to $278,000 in 2015. Median rents were as follows in the table.
Table 14: Median Rent
Year 1 bedroom 2 bedroom 3 bedroom
2005 $1,100 $1,124
2006 $962 $1,056 $1,219
2007 $909 $1,044
2008 $882 $1,254
2009 $926 $1,170 $1,564
2010 $907 $1,067 $1,381
2011 $906 $1,115 $1,504
2012 $888 $1,107 $1,306
2013 $849 $1,131 $1,359
2014 $924 $1,223 $1,627
According to Rhode Island Housing, the maximum sales price in 2015 for an LMI home in Cumberland at 80% of Median Income was $192,301. The cost to build such a home was estimated at $240,445. The difference, $48,144, amounts to the contribution of the developers and the Town.
Housing Cost Burdens Almost a third (31%) of households in Cumberland are housing cost-burdened, meaning they are paying more than 30% of their income on housing: 4,1435 households. Almost 13% of the total, or 1,6855, are “severely” cost-burdened, meaning that they are paying more than 50% of their income on housing.
The following table provides the total number of households who would qualify for Low and Moderate Income Housing under the Act at each income range and the percentage experiencing a housing problem. Using the number of households experiencing problems, we can estimate the appropriate mix of affordable housing necessary to meet the future needs for family housing, elderly housing, and other housing types.
The total number of households which may qualify for housing under existing subsidy programs is more than 4,175. Out of the 2,170 elderly households, 1,310 or 60% are experiencing a housing problem. Thus there is a future need for affordable housing for the elderly. 1,91 or 63.9% of total cost-burdened and severely cost-burdened households in Cumberland with incomes less than 100% Household Annual Median Family Income (HAMFI) own their own homes. Other subsidized units in group homes, other supported living facilities, and for residents with special needs make up 15.7% of the households in the community, or 2,100 households. In summary, these statistics would seem to indicate that Cumberland requires an additional 176 elderly units, requires an additional 271 family units for 2 to 4 persons, and has a present need for 95 other units.
However, the CHAS data include more than financial hardship. In fact, four types of housing problems, including kitchen problems, plumbing problems, overcrowding, and financial problems are included without differentiation. This makes it difficult to draw any specific conclusions regarding financial need and need for more affordable housing. Further, the CHAS data are estimates based on a very small sample size which largely results in margins of error greater than 25% of the estimate and, according to state policy,

2016 | Cumberland Comprehensive Plan | 1. HOUSING AND NEIGHBORHOODS 22
cannot be used unless no other sources are available. In some cases, the error of the estimate is actually equal to or greater than the estimate itself. For example, the estimate of 15 large families owning with a very low income has a margin of error of plus or minus 23 families. In summary, the CHAS data are not particularly useful in determining the need for affordable housing in Cumberland, leaving Cumberland to make its own determinations as to the local level of housing need.
Table 15: Housing Problems by Housing Type and Income Range
Household by Type &
Income
Renters Owners Total
Elderly Small
Family Large
Family Other All Elderly
Small Family
Large Family
Other All
Extremely Low Income (0%-30% HAMFI)
240 270 0 240 695 305 45 4 90 405 1,100
% With any housing problems
50% 89% - 56% 71% 100% 56% 100% 78% 100% 82%
Very Low Income (31-50% HAMFI)
485 35 10 130 665 410 50 15 40 515 1,180
% With any housing problems
78% 57% 100% 92% 80% 74% 70% 100% 88% 75% 78%
Other Low Income (51-80% HAMFI)
95 310 15 160 580 635 480 130 70 1,315 1,895
% With any housing problems
16% 34% 100% 50% 37% 29% 75% 88% 86% 55% 49%
80% or more HAMFI
250 560 20 550 1,385 1,570 4,730 575 820 7,700 9,085
% with any housing problems
14% 13% - 6% 10% 11% 21% 29% 35% 21% 19%
Total Households
1,070 1,175 45 1,080 3,375 2,920 5,305 724 1,020 9,970 13,345
Source: CHAS data, 2009-1310
Low and Moderate Income (LMI) Housing Inventory Public housing in Cumberland is centered on One Mendon Road, a high-rise public housing development for the elderly with 176 units administered by the Cumberland Housing Authority (CHA). In addition, there are 88 units designated for elderly residents under the HUD Section 1 New Construction program at One Flat Street, called Riverside Village. Apart from the two high-rise developments, there is a variety of subsidized housing currently available in different locations in Cumberland, funded through a variety of funding methods. These currently only offer rental opportunities.
Valley Affordable Housing’s early success with acquiring and rehabilitating existing housing stock, then making it available as affordable housing, was the model for the Town’s housing rehabilitation program. The Town has a productive partnership with the CHA and Valley Affordable Housing. The partnership has resulted in the creation of affordable units and in the effective channeling of funds to low- and moderate-income citizens for housing purposes. The Town anticipates continuing to partner with CHA and VAH as well as finding other non-profits to partner with in order to create additional affordable units within the context of 100% affordable housing rehabilitation or new construction.

2016 | Cumberland Comprehensive Plan | 1. HOUSING AND NEIGHBORHOODS 23
The table below shows the current supply of affordable housing units in Cumberland. The 843 affordable units identified in the table represent 6.14 percent of Cumberland’s housing stock in 2016. According to 2010 Census data, the Town of Cumberland has 13,791 housing units. Reducing that number by 53 to account for seasonal units, the Town’s housing inventory for the purpose of determining the 10% share is 13,738 units. According to Rhode Island Housing Resource Commission tabulation, the Town of Cumberland’s LMI inventory as of October 3, 2016 consisted of 843 units or 6.14% of year round housing units. Thus the LMI inventory gap is 3.86% or 530 units.
The 1991 Land Use Element estimated that another 3,879 units could be built on land zoned for residential development (and otherwise buildable, i.e., without natural constraints). Between 1990 and 2000, 1,355 units were constructed, leaving another 2,524 that could be built. These units (2,524) are very close to the number of potential new units identified by the Blackstone River Valley Heritage Corridor Commission (BRVHCC) in their year 2000 buildout analysis, 2,453 units. (See further discussion in Land Use Element.)
Using the mean of the total potential new housing units predicted by the three available build-out analyses, Cumberland should expect to construct an additional 3,492 housing units to reach build-out. Adding those to the current 13,738 indicates there would be a total of 17,230 housing units at build-out. The need for affordable housing at build-out would then be 10%, or 1,723 units. Adding 350 units (14.3% of projected future units) to the current deficit of 530 affordable units gives a total of 880 LMI units that the Town must produce over the next 25 years to reach their 10% goal. Therefore, on average, Cumberland should construct a minimum of 32 new affordable units annually. A more realistic outcome is discussed in the Affordable Housing Production Strategies in this chapter. Cumberland currently has 622 elderly, 161 family, and 60 subsidized units in group homes, other supported living facilities and special needs residences. CHAS statistics suggest that the Town of Cumberland requires an additional 176 units for the elderly, 271 family units for two to four persons, and 95 special needs units.
Table 16: Low and Moderate Income Housing
Classification Name Type Tenure
Location # units
Elderly Bear Hill Village RIH Section 8 rental 156 Bear Hill Road 125
Elderly Chimney Hill RIH Section 8 rental 2065 Mendon Road 130
Elderly Jenks Woods HUD 202 rental 25 Flat Street 61
Elderly Riverside Village CAP rental 1 Flat Street 88
Elderly 1 Mendon Road I & II Public Housing rental 1 Mendon Road 176
Elderly Valley View Housing/Waterfall Estates
HUD 202 rental 10 Manville Road 42
Family Berkeley Village/Woodward Street
RIH Family rental 4 Woodward Street 30
Family Dexter Street RIH Family Homeownership
289 Dexter Street 1
Family Factory Street RIH Family rental 7 Factory Street 32
Family Main Street, Phase 3 RIH Family rental 25-27 Main Street 32
Family Carpenter Street RIH Family rental 26 Carpenter Street 2 Family Main Street, Phase 1 RIH Family Rental 30-32 Main Street 4
Family Main Street, Phase 2 RIH Family Rental 14-16 Main Street 3
Family Main Street, Phase 2 RIH Family Rental 33-35 Main Street 4

2016 | Cumberland Comprehensive Plan | 1. HOUSING AND NEIGHBORHOODS 24
Family Ashton Village RIH Family Rental 14 Front Street 53
Special Needs Group Home Beds Group Home Beds
N/A N/A 53
Special Needs Mendon Road RIH Special Needs
Rental 2510 Mendon Road 7
LMIH Total 843
In addition to the units listed above, there are a number of units that are built, under construction, or approved and pending construction. The town is also cooperating with developers on additional projects that will include affordable units. However, developers have yet to commence with the approval process with local boards. The table below summarizes the affordable units that have been constructed and/or approved in Cumberland since 2010. Significant affordable housing units completed since 2010 include two at Carpenter Street and 53 at Ashton Village.
Housing Programs
Existing housing programs and policies can be categorized as either “affordability programs” or “preservation programs.”
Residential Property Tax Exemptions The most widely used affordability programs in Cumberland are those involving property tax exemptions for designated homeowners authorized by RIGL §44-3-13.4. The elderly tax exemption currently permits a $7,500 reduction of the assessed value of residential properties owned by residents over the age of 65. In 2001, there were 2,123 properties receiving this exemption. In 2013 that number increased to 2,370 based on a change in the eligible number of residences. This program is projected to increase to approximately 2,617 participants by 2025, a roughly 10% increase.
The blind or 100 percent physically disabled exemption In 2001, there were an additional 32 properties receiving a $7,500 reduction in their assessed value under this program. A senior deferment program defers payment on increase in taxes until the time the properties are sold. Because Cumberland, like Rhode Island as a whole, has an aging population, many of whom live on fixed incomes, this age and income restricted program is expected to become more popular every year it is in place.
Rental Assistance Programs The other focus of housing affordability programs is the direct subsidy and support of affordable housing for elderly and low-income residents. These are programs funded through HUD and administered by the CHA and other nonprofit housing development agencies. There are a total of 580 housing units in Cumberland designated for elderly tenants and another 355 low-income renters are receiving rental assistance in the form of subsidized rents or rental vouchers as provided under HUD's Section 8 program.
Federal and State Subsidy Programs Rhode Island Housing’s HOME program has also been instrumental in housing rehabilitation. Valley Affordable Housing has effectively made use of all the programs Rhode Island Housing has to offer.
CDBG Housing Rehabilitation Program and Other State Programs The first major housing preservation program in Cumberland was funded through a $153,000 Community Development Block Grant that made approximately $105,000 available to homeowners in the form of direct grants and loans for major repairs and rehabilitation. The program required that rehabilitation projects in historic areas or projects designated as historic properties conform to restrictions stipulated by the Rhode Island Historic Preservation Commission. The program was eventually modified to a rehabilitation program for low to moderate-income property owners whose properties no longer must be of historic value. This

2016 | Cumberland Comprehensive Plan | 1. HOUSING AND NEIGHBORHOODS 25
program helps stabilize Cumberland’s housing stock in general. As of 2003, over 50 existing homes had benefited from the CDBG Housing Rehabilitation Program.
Cumberland Historic Rehabilitation Property Tax Credit The Town provides a property tax credit for restoration projects located within historic districts. The program permits a 20% property tax credit up to a maximum of $450.
Homelessness
Although the Rhode Island Coalition for the Homeless lists several shelter resources in the Blackstone Valley for the homeless, there are currently none in Cumberland. The Blackstone Valley Advocacy Center in Pawtucket provides some assistance services to the homeless and has received CDBG funds from Cumberland, but there are currently no shelter or support services for homelessness in Town.
Housing Growth Management
Cumberland has a tradition as a residential community with safe and attractive neighborhoods. However, the progressive development of vacant land, demographic shifts, and residential market pressures could adversely impact the safety, appearance, and accessibility of residential areas and individual housing units.
Cumberland’s proximity to Boston and Providence transportation routes is a significant development force. At the same time, diminution of developable land will cause continued tensions between regional pressures for growth and local development constraints. Residential growth could cause localized increases in vehicular traffic.
Development sites north of Interstate 295 continue to be the most likely targets for future development. These areas, especially Agricultural Zones, are also the most vulnerable to environmental impacts of residential growth. Costs of public services in these areas are extremely high because they are located outside of the current villages and subdivision tracts where services are already available. Cumberland's rural character is often perceived by developers as an indication that a large amount of land is available and suitable for development. This could result in speculative acquisition of vacant parcels and may ultimately lead to more confrontational pressures to relax environmental standards.
Housing developers are likely to respond to the scarcity of available land and its high cost by developing more expensive projects for an affluent regional market. However, the Town must develop ways to ensure that the production of housing by type and tenure is consistent with the demographic needs of the community.
Contrary to the Town’s policy of directing new development toward the existing population centers and neighborhoods with water and sewer service, new homes have been developed throughout Cumberland’s northern rural areas. Few, if any, units have been proposed under the Low and Moderate Income Housing Act comprehensive permit process. At present, the Town has no Inclusionary Housing ordinance to help LMI units keep pace with overall housing growth.
Cumberland has a history of speculative housing development as opposed to development responding to local needs. Faced with numerous subdivisions and several large multi-family (rental and condominium) projects in the early 2000s, the Town placed a cap on building permits in order to establish methods by which to better manage growth and to try to keep residential growth at no more than 1% a year. Under present economic conditions, enforcement of the cap has not proved necessary.
The Town had two Planned Unit Developments (PUDs) approved prior to 2003, one with 162 units and the other with 195 units. Their average density is approximately 5,000 square feet per unit. In 2003, there was approximately 400 acres of vacant land along, and adjacent to, Mendon Road, the town’s primary mixed use

2016 | Cumberland Comprehensive Plan | 1. HOUSING AND NEIGHBORHOODS 26
corridor, in close proximity to water and sewer utilities. This land has been targeted for future residential development.
Opportunities for Producing Affordable Housing
There are several initiatives Cumberland could undertake to improve affordable housing opportunities. The Town is actively engaging non-profit housing partners to identify and evaluate existing structures or sites potentially feasible for affordable housing. Site streetscape improvements, signage, crosswalks, and other amenities should be strategically installed to maximize affordable housing opportunities, especially if such improvements enhance safety for children and older residents. The Zoning Code and Development Regulations could be amended to encourage development of affordable housing, including density bonuses, in designated areas by reducing dimensional standards such as setbacks, site coverage and height; and increasing density in those planning districts with available public facilities and services. The Town’s inventory of buildable parcels may have the potential to be developed for affordable housing, and tax sale properties may also have potential for affordable housing.
For the past three decades, Cumberland has applied for CDBG funding for low and moderate-income housing rehabilitation assistance, and worked with Cumberland Housing Authority and other affordable housing partners to maximize availability of state and federal resources, including but not limited to Federal Low Income Housing Tax Credits (LIHTC). The Town could adjust its tax assessment basis for qualified affordable housing.
It seems appropriate that state policies should permit local Section 8 certificates managed by housing authorities and community development corporations to be counted toward the “official” inventory of LMI housing in the community, something for which Cumberland and its partners might advocate.
Further, the Town could consider ordinance amendments relating to new development that provides for density bonuses for LMI units, developer payments to a community land trust for large-scale development, and permitting LMI-restricted land development projects specifically designed for seniors, to include rental and handicapped accessible units.
Production of LMI Housing Units
Update on Previous Strategies for Affordable Housing The 2003 Cumberland Comprehensive Plan listed a series of strategies enumerated as goals, policies, and actions for meeting the 10% affordable housing mandate that was just being formulated at that time in the general assembly. The 2003 Plan discussed several possible Planned Unit Developments to generate 300 affordable units. The 2003 Plan also discussed revisions to the zoning and subdivision regulations as well as support for Comprehensive Permits and support for housing subsidy programs for low income individuals. For a number of reasons, these strategies did not fully succeed and where not implemented in the fashion envisioned in the 2003 Plan. The large number of proposed Planned Unit Developments largely did not go forward due to the bursting of the national and local housing bubble in 2007 and subsequent severe economic recession of 2008. Many developments that were in the planning stages from 2006-2008 were frozen and not continued forward. Although the passing of the Tolling statute by the General Assembly in 2009 which froze permit approvals and planning board approvals has continued year after year (and was extended for another year to June 30, 2017), most of the development plans subject to the Tolling have not come back for additional approval.

2016 | Cumberland Comprehensive Plan | 1. HOUSING AND NEIGHBORHOODS 27
Although the 2003 Comprehensive Plan supported the objective of Comprehensive Permits, in practice the Towns elected and appointed officials have opposed Comprehensive Permits that have come before the Planning Board since the 2003 Plan. This process has been contentious and has provoked local officials to see Comprehensive Permitting as an infringement upon local control of government. Additionally, Inclusionary Zoning had met with similar opposition from elected officials and has been discussed and debated since the 2003 Plan, but not implemented. Current Town officials understand the need for Inclusionary Zoning as one tool to meet affordable housing goals, and the Planning Department is hopeful that Inclusionary Zoning will be implemented in the near future. While the Town has had some very notable recent successes in creating and partnering in affordable housing projects, such as the Ashton Village affordable housing project, the issues noted above prevented the full implementation of the housing strategies from the 2003 Comprehensive Plan.
2016 Strategies for Affordable Housing This housing section serves as Cumberland’s Affordable Housing Production Plan, a ‘strategic’ plan for the production of Low and Moderate-Income Housing Units as defined in the Low and Moderate Income Housing Act (RI Gen Laws §45-53-1 et seq). It satisfies the requirement of R.I. Gen Laws §45-22.2-6(b)(6).
The Town of Cumberland must comply with the Low and Moderate Income Housing Act (RIGL 45-53), which promotes the development of low and moderate income housing throughout the state. The Act requires that at least 10 percent of Cumberland’s housing units shall be affordable to residents, shall be income restricted for at least 30 years, and shall be developed with the assistance of a federal, state or municipal subsidy program. Housing units meeting this requirement are referred to as “LMI qualified housing” or “LMI units.” For clarification, affordable rental units are those which are priced at a maximum for those earning less than or equal to 80% of the area median income while affordable homeowner units are those which are priced at a maximum for those earning less than or equal to 120% of the area median income.
This Production Plan sets forth four implementation strategies for producing LMI units and assigns a projected number of LMI units, their type, and their tenancy to each strategy. The outcome of each production strategy is estimated both in the short term (five years) and in the long term (ten, twenty, and even thirty years). The units generated reflect Cumberland’s proportional unmet housing needs as described above. Should the areas listed above be developed or redeveloped as specified for LMI housing, the Town would more than satisfy the State’s requirement.
Strategy 1: Inclusionary Zoning The town should adopt an inclusionary zoning ordinance requiring a minimum of 20% LMI units for all land developments and subdivisions involving the creation of five or more dwelling units, or a payment to a community housing trust fund equal to the difference between the price of a finished housing unit within the development and the price of what an affordable unit would be.
This strategy particularly addresses the inclusionary requirement for subdivisions and land development projects within low density residential zoning districts and will target the need for affordable homeownership opportunities in town. Over the period from 1997 to 2012, 1,707 single family new housing units were produced in the Town.2 If the Town continues to produce at an average of 100 units per year, with the 20% inclusionary requirement this strategy will provide 20 LMI units per year over 20 years.
2 www.city-data.com/city/Cumberland-Rhode-Island.html

2016 | Cumberland Comprehensive Plan | 1. HOUSING AND NEIGHBORHOODS 28
Strategy 2: Planned Unit Developments Cumberland should revise its zoning ordinance to require the production of LMI units on 25% of land within any Planned Unit Development. The requirement for inclusion of LMI units in all Planned Unit Development is designed to create low to moderate priced rental and homeownership units in conjunction within mixed use development. Four Potential Planned Unit Development locations have been identified which may include housing totaling 512 acres, with 128 acres reserved for LMI production. The town assumes that one PUD will be developed in the community over the next twenty years. If an increased density of six units per acre is part of this strategy, it will yield 266 units.
Strategy 3: Senior Residential Communities The Town should revise the zoning ordinance and subdivision regulations to permit LMI restricted land development projects specifically designed for seniors, to include rental and handicap accessible units. This strategy will specifically target the specific need for elderly housing. A significant density bonus (up to 30%) will be offered to developers for this type of housing, combined with a requirement that at least 25% of the units qualify as LMI units. As a result, the mandatory inclusionary requirements need not apply to this use. This strategy will require consideration of environmental constraints and will include specific recommendations on areas that could support units within this strategy. This use will be allowed by special use permit in the medium density residential zoning districts. There are 35 undeveloped buildable acres in the medium density residential zones throughout town. If ten (10) percent of the undeveloped land is assumed to be available for senior residential communities with an increase in density of 30%, the applicable density would be approximately 6 units per acre. This would account for 21 new units - of which 50 % or 10 will be LMI units.
Strategy 4: Mill Conversion The Town should prepare a master plan for the conversion of mill complexes to mixed use land developments that include low- and moderate-income housing as well as light industry, office, and supporting service uses. This redevelopment strategy is designed to create needed rentals for families of two to four persons. Priority will be given to mill complexes supported by sewer and water and located within proximity to an elementary school.
There are two mill complexes that have been identified as possible candidates for this type of conversion. The Ann & Hope Mill complex consists of several floors of vacant industrial space. If 200,000 sq ft over two floors of this structure is developed as LMI housing, it is estimated that approximately 235 units of a modest size (range 550 sf GFA to 1100 sf GFA) could be developed. Corning Mill off Mendon Road, in which the Town has a property interest, consists of approximately 9.5 acres of land. While the existing building is unsuitable for residential redevelopment, a mixed use master plan that dedicates 40% of the land area to LMI housing units at a density of 70 units per acre would yield 266 LMI units.
The following table shows the time frame for implementation of each strategy to achieve LMI unit production goals.

2016 | Cumberland Comprehensive Plan | 1. HOUSING AND NEIGHBORHOODS 29
Table 17: Number of LMI Units to be produced, by development strategy and time
Development strategy Year 1
to 5 Year 6 to
10 Year 11
to 15 Year 16 to
20 20-Year
Total
Inclusionary zoning 100 100 100 100 400
Planned unit developments 50 60 70 86 266
Senior residential communities 0 2 3 5 10
Ann & Hope Mill conversion 0 0 235 0 235
Corning Mill conversion 0 0 0 266 266
subtotal 154 162 418 469 1,211
Existing LMI units 798 952 1,114 1,532 2,001
Running total of LMI units 952 1,114 1,532 2,001 2,001
Total anticipated housing units 14,240 14,740 15,240 15,740 15,740
10% Goal 1,420 1,474 1,524 1,574 1,574
% LMI units achieved 6.68 7.56 10.05 12.71 12.71
Housing Goals
*See the Implementation Element for a synopsis of Goals and Action Item implementation schedule, priority, and responsibilities.
Goals and actions for the housing element have been developed on the basis of the empirical data inventory, projections, and the needs assessment. Cumberland aims to establish a range of housing options particularly for the identified demographics of aging baby boomers, small families (two to four persons), and persons with disabilities. The Town will strive to retain the diversity of its residents by providing both rental and homeownership opportunities at a variety of prices. Town programs and regulatory efforts will provide appropriate housing opportunities in the community with a focus on infill development, redevelopment in the mill districts, and the rehabilitation of existing housing units. Current and prospective residents should find a range of housing types available including: single-family homes in our existing neighborhoods; traditional village oriented housing in our suburban districts; attractive multi-family housing; apartments integrated with commercial uses; and housing for seniors and persons with disabilities.
Goal: Increase the amount of affordable housing in Cumberland from 6.145% to 10% by 2036
Goal: Identify and evaluate suitable affordable housing sites.
Goal: Ensure that new development in Cumberland is context-sensitive and in sympathy with the surrounding natural and historic landscapes.
Goal: Accommodate the elderly and disabled in housing development
Goal: Focus housing development to where we currently live and where we have supporting infrastructure
Goal: Build to the highest level of design.
2016 | Cumberland Comprehensive Plan | 1. HOUSING AND NEIGHBORHOODS 30
Housing Action Items
The following action items will implement Cumberland’s housing goals. They identify locations that will sustain future development and define the relationship between residential growth, economic vitality, environmental quality, and the capacity of existing and future infrastructure.
H1. Actively engage non-profit housing partners to identify and evaluate existing structures or sites potentially feasible for affordable housing.
H2. Strategically site streetscape improvements, signage, crosswalks, and other amenities to maximize affordable housing opportunities.
H3. The Town should search its inventory of Town-owned land to identify buildable parcels potentially suitable for the development of affordable housing by the Cumberland Housing Authority or other affordable housing development partners.
H4. Amend the Zoning Code and Land Development & Subdivision Regulations to encourage development of affordable housing in designated areas by reducing dimensional standards such as setbacks, site coverage and height; by increasing density in those planning districts with available public facilities and services; and by including density bonuses.
H5. Apply annually for additional CDBG funding for low- and moderate-income housing rehabilitation assistance and other state and federal programs promoting affordable housing deemed effective and affordable by the Town and its non-profit housing partners.
H6. Continue exempt affordable housing from the Town’s 1% building cap, revisiting the effectiveness of this strategy within five years.
H7. Work with Cumberland Housing Authority and other affordable housing partners to maximize availability of state and federal resources, including but not limited to Federal Low Income Housing Tax Credits (LIHTC).
H8. Promote use of Federal and State Historic Tax Credits to help finance restoration and adaptive reuse of qualified historic structures to facilitate affordable housing.
H9. Base the tax assessment for affordable residential properties on unit acquisition cost rather than “highest and best” market value; and price affordable rental units based on the property's previous years' gross scheduled rental income.
H10. Work with non-profit affordable housing partners to advocate for state housing policies and programs that will permit local Section 8 certificates managed by housing authorities and community development corporations to be counted toward the “official” inventory of LMI housing in the community.
H11. Coordinate with local community land trusts to acquire and hold properties subject to foreclosure, short sale, or tax sale for the purpose of creating affordable housing.
H12. Amend the Zoning Ordinance to allow comprehensive permit proposals that provide 50% or more LMI units to be granted a density increase of up to “one step” in the underlying zoning district, if they meet a particular need outlined in at least one of the LMI strategies contained in the affordable housing production plan, provided that the planning and design of the proposed development shall not be inconsistent with the goals and policies of the other elements of this Comprehensive Plan, and the site has adequate infrastructure, such as water, sewer, storm-water controls, roads, etc.

2016 | Cumberland Comprehensive Plan | 1. HOUSING AND NEIGHBORHOODS 31
H13. Amend the Land Development & Subdivision Regulations to require either the inclusion of 20% LMI units in all land developments and subdivisions involving the creation of five (5) or more dwelling units, or a payment to a community housing land trust fund equal to the difference between the price of a finished housing unit within the project and the price of what an affordable unit would be.
H14. Amend the Zoning Ordinance and Land Development & Subdivision Regulations to permit LMI restricted land development projects specifically designed for seniors, including rental and handicapped accessible units.
H15. Amend the Zoning Code to be consistent with the Land Development & Subdivision Regulations in establishing enforceable standards for fencing and vegetated buffers within zoning districts to protect residential properties from industrial, commercial, and other incompatible uses.
H16. Amend the Zoning Code and Land Development & Subdivision Regulations to encourage the restoration and adaptive re-use of mill complexes for mixed uses by reducing restrictions such as parking requirements, setbacks, site coverage, and height.
H17. Create a Neighborhoods Map based on original plats and on the evolution of neighborhoods over time as a means of identifying historic boundaries of neighborhoods.
H18. Apply/advocate for ADA federal and state funding for access and safety improvements for residential units occupied by elderly and disabled tenants/owners.
H19. Continue property tax exemptions to disabled and elderly homeowners in order to promote neighborhood stability.
H20. Extend existing property tax relief eligibility for the elderly and disabled to include landlords who provide rental units that are occupied by elderly and certified disabled tenants.
H21. Amend the Land Development & Subdivision Regulations to include design standards for new housing developments to remove physical barriers for people with disabilities and allow “aging in place” within the same dwelling unit or development.

POU ND RD
DIAMOND HILL RDTORR EY R D
HINE
S RD
W W
RENT
HAM RD
RAWSON RD
NATE WHIPPLE HWY
HIGH ST
PINE SWAMP RD
MARSHALL AVHILLTOP RD
DEXTER ST
MENDON RD
CURR
AN R
D
BROAD ST
ANGEL
L RD
MENDON RD
STAPLES RD
SUMNER B R OWN RD
W RENTH
AM R
D
BURNT SWAMP RD
RESERVOIR R D
ABBOTT RUN VALLEY RD
LIT T L E POND C O UNTY RDLIPPIT T AV
SCOT
T RD
ALBION RD
FARM DR
MANVILLE HILL RD
HIGHLAND CORPORA
TE DR
TOWER HILL RD
ELDER BALO U MEETING HOUSE RD
KAY ST
MART IN ST
HIGHLAND AV
BE AR HI LL RD
N ATTLEBORO RD
DIAMOND HILL
CUMBERLAND HILL
ARNOLD MILLS
ASHTON
VALLEY FALLS
BALLOU DISTRICT
MONESTARY HEIGHTS
GRANTS MILLS
THOMPSON HILL
BERKELEY
NORTHCUMBERLAND
LIPPITTESTATES
WOONSOCKET
LINCOLN
CENTRAL FALLS
TOWN OF CUMBERLANDComprehensive Plan, 2016
MAP H-1
NEIGHBORHOODDISTRICTS
RHODE ISLAND
Prepared by:Town of Cumberland Planning Department
Mason & Associates, Inc.
µMap Sources:
0 0.5 10.25Miles
CT
MARI
Map Locus
LEGENDNeighborhood Districts
Major Roads (Class 1 & 2)
Minor Roads (Class 3 & 4)
0 10.5Kilometers
This map is for general planning use; featurelocations are approximate and not legally authoritative. The Town of Cumberlandmakes no warranty, express or implied,related to the accuracy of this map.


2016 | Cumberland Comprehensive Plan | 2. ECONOMIC DEVELOPMENT 33
2. ECONOMIC DEVELOPMENT

2016 | Cumberland Comprehensive Plan | 2. ECONOMIC DEVELOPMENT 34
Introduction
This element identifies economic development policies and strategies that will address the well-being of Cumberland’s residents in both a local and regional economic context. It includes analysis of the local economy, assessing its strengths and weaknesses in terms of the scope and character of the local employment base, the relationship between the local labor force and local opportunities for employment, and current and future needs of the community. An inventory and analysis of existing and planned economic development sites and programs is also included.
Several data collection and analysis methods were used, including an empirical review of historic economic trends and participatory research involving both the public and recognized experts. Detailed information is contained in three sections of the inventory: Economic Base and Labor Force; Need for Employment Opportunities, Goods, and Services; and Sites and Programs for Economic Development
The State Planning Act requires that this section include “the identification of economic development policies and strategies, either existing or proposed by the municipality, in coordination with the land use plan element. These policies should reflect local, regional, and statewide concerns for the expansion and stabilization of the economic base and the promotion of quality employment opportunities. The policies and implementation techniques must be identified for inclusion in the implementation program element.” The State Planning Act also requires consistency with State Guide Plan Element: Rhode Island Rising, The State Economic Development Plan ; Report #121.
Inventory
This section examines the current and historic economic environment in Cumberland. The economic research is based on several key economic indicators: an analysis of the local economic base; an analysis of Cumberland's labor force, an assessment of the relationship between local employment and the economic well-being of Cumberland's residents, and projections of the future labor force and employment.
Economic Base One way to understand Cumberland’s economic base is to look at the mix of industries by studying the historic employment trends in various economic sectors. The locally available employment levels were then compared to the employment characteristics of Cumberland’s residents, based on US Census data. The employment trends of firms in Cumberland have paralleled those of the State over recent decades. In some instances, however, the variance in employment levels has been greater at the local level, suggesting that the local economic environment is more susceptible than the State to economic shifts.
As shown in the table below, the employment base for firms in Cumberland in 2013 is dominated by three sectors: Services (35% of total employment), Manufacturing (19%), and Wholesale and Retail Trade plus Transportation & Warehousing (22%).

2016 | Cumberland Comprehensive Plan | 2. ECONOMIC DEVELOPMENT 35
Table 18: Employment by firms in Cumberland (1st quarter of 2013)
Economic sector Employment % of
total
Total
wages in sector
Median hourly wage per employee
Manufacturing 1,588 19% 18,159,230 $20.87
Government 1,116 15% $16,580,101
Health Care & Social Assistance
990 11% 7,548,428 $30.12
Retail Trade 893 10% 5,381,338 $10.82
Wholesale Trade 679 8% 9,443,559 $28,66
Accommodation & Food Services
610 7% 1,945,562 $15.55
Construction 529 6% 11,489,238 $19.37
Transportation & Warehousing
520 6% 4,451,159 $19.94
Professional & Technical Services
212 2% 4,803,099 $36.26
Educational Services 206 2% 498,166 $30.05
Administrative & Waste Mgt.
204 2% 1,315,119 $16.55
Information 130 1% 850,177 $31.49
Finance & Insurance 157 2% 2,020,432
Real Estate & Rental & Leasing
100 1% 1,086,394 $29.03
Arts, Entertainment, & Recreation
65 1% 298,607 $10.44
Other services 522 7% 3,412,530 $15.29
TOTALS 9,430 100%
Source: Rhode Island Department of Labor & Training, Quarterly Census of U.I.-Covered Employment and Wages, City and Town Quarterly Report 2013 First Quarter. Data compiled September 2013. (Totals do not
include the few firms for which data was not listed due to confidentiality)
The Quarterly Census of Employment and Wages (QCEW) is developed through a cooperative program between the State of Rhode Island and the US Bureau of Labor Statistics. QCEW, also known as ES-202, provides monthly employment and quarterly wages by industry, location, and size of employer. The QCEW program derives its data from quarterly tax reports submitted by employers subject to Rhode Island's Unemployment Insurance law. This information is supplemented with data collected from government agencies and businesses with multiple locations.
Economic Trends Cumberland's employment trends have approximated those of the State over recent decades. In some instances, however, there are indications that the variance in employment levels has been greater at the local level, suggesting that the local economic environment is more susceptible than the State to economic shifts.

2016 | Cumberland Comprehensive Plan | 2. ECONOMIC DEVELOPMENT 36
According to Rhode Island Department of Labor and Training data, in 2013 the average annual wage paid in the manufacturing sector was $43,409; while service employment paid an average of $41,184 and Wholesale and Retail only $41,184. The trends in the employment categories as a percentage of total economic base between 1990 and 2010 are shown in the figure below. The decline in manufacturing employment is clearly shown as a continuous trend which began in the early 1980s and continued right up to 2010. Recent data from the Department of Labor and Training has shown that manufacturing has experienced a slight uptick in the last few years, but is not expected to reach the share of total employment that the industry had in the 1980s. Much of the employment lost in the manufacturing sector has been replaced by employment increases in the service sectors. Meanwhile, employment in the trade sector has remained fairly constant over this period, ranging from 20 to 25 percent of the local employment base.
There has, however, been a shift in the relative importance of wholesale versus retail trade: employment of wholesale workers has declined while that of retail employees has increased. In addition to the changes in the three major categories of employment, there has been an increase in other categories of employment. The “other” category in Figure 1 consists of agriculture, forestry, & fisheries; construction; transportation, communication, & public utilities; and finance, insurance, & real estate.
The increase in the importance of these categories as a percentage of Cumberland’s economic base represents a diversification of industries located in Cumberland. This increase is not a result of an increased number of businesses in any one category.
Figure 1: Industry Trends
Industry Trends
0
5
10
15
20
25
30
35
40
45
50
1990 2000 2010
Year
Perc
en
t o
f E
mp
loym
en
t
Manufacturing
Wholesale & Retail Trade
Services
Other
Labor Force Out of a total population of 33,506 residents in 2010, 22,136 were of working age (18 to 65). Those among the working age population who are actually working or actively seeking work comprise the labor force. This definition recognizes the reality that not all people of working age are in the labor force. Some are handicapped, ill, temporarily injured, totally unskilled, going to school, have family responsibilities, or have ceased looking for work (for various reasons, such as frustration with the system and giving up hope). Even though Cumberland’s population may remain relatively level or grow slightly from year to year, the people working and those seeking work will fluctuate with the tides of prosperity or recession. Thus we often see in the data trend lines that the labor force usually declines during a recession.
In 1990, Cumberland's labor force consisted of 16,127 people. By 2000, Cumberland’s labor force reached 17,179 persons. And finally, by 2010, the labor force reached 18,588 persons. In this twenty-year period, the

2016 | Cumberland Comprehensive Plan | 2. ECONOMIC DEVELOPMENT 37
percent of the population 16 years and older, identified as part of the labor force, remained close to 70 percent.
The table below shows the composition of the labor force in 1990, 2000, and 2010 by major occupational category. The table indicates that the employment trends of Cumberland’s population are similar to that of the economic base: the importance of manufacturing as an occupation in Cumberland continued its multi-decade decline while service industries continue to be the largest share of the major occupational categories in Cumberland.
Table 19: Labor Force Occupations
OCCUPATION % Labor Force
1990 % Labor Force
2000 % Labor Force
2010
Services 34.3 44.8 43.3
Wholesale & Retail Trade 22.8 17.8 18.8
Manufacturing 28.7 17.3 15
Finance, Insurance, & Real Estate 5.9 7.7 8.7
Construction 1.3 5.1 4.8
Transportation, Utilities, & Communication
6.6 7 3.8
Agriculture, Forestry, Fisheries, & Mining
0.3 0.2 1
Source: U.S. Census 1990-2010
Need for Employment Opportunities, Goods, and Services
Employment opportunities Recent statistics (2010) have placed Cumberland's labor force at 18,588 persons of which 17,715 were employed. This equates to an unemployment rate of 5.4 percent, and represents an increase in unemployment from 3.7 percent in 2000 and is equal to the unemployment rate of 5.4 percent in 1990.
Cumberland’s economy has shifted over time from community employment, where local jobs provide a critical economic resource to the local population, to regional employment, where local jobs are likely to be filled by non-resident employees while the vast majority of the labor force commutes out of town to work. Manufacturing sector employment levels are decreasing while service and retail employment, which has comparatively lower wages, is rising.
Cumberland’s original 1991 Plan assumed that in addition to this inherent shift away from reliance on local employment, demographic trends would further reduce the local demand for employment. The growth patterns and estimated age distribution of the population at that time suggested that the local labor supply (persons between the ages of 16 and 65) would not increase over the next 20 years without significant population in-migration, and that such local shifts were not considered to be likely given the physiographic constraints to growth in Cumberland.
However, Cumberland’s population has increased, through both natural increase and in-migration. Cumberland’s local labor force has grown along with the population as a whole. However, this population increase has not created significant demand for new local employment opportunities. Town residents primarily view the Town as a bedroom community, a place to live rather than a place to work.

2016 | Cumberland Comprehensive Plan | 2. ECONOMIC DEVELOPMENT 38
In addition, the residents recognize the traffic and environmental costs of expanding the economic base, and while revenues from business are greatly valued, there is a limit to how much new commercial and industrial activity the Town wishes to see.
Commercial and Industrial Development Since 1991, surveys show residents are satisfied with their regional access (including Lincoln and Attleboro) to commercial goods, services, and shopping. They are clear: they do not want more land in Town converted to commercial or industrial uses, especially further commercial sprawl along transportation routes. If such development is necessary, it should be clustered as part of an existing village or neighborhood.
With Cumberland’s aging population, the demand for health care services will likely increase. An aging population will place a demand on the public sector (human services and public assistance programs) and the private market's ability to furnish appropriate goods and services.
Economic Development Programs
In order to promote economic development at the local level, a community needs programs that foster economic growth as well as future sites for new economic activity. This section summarizes government services currently available.
Expedited Permit Coordination Many businesses cite the challenges in getting state and municipal permits for plans for expansion and new development. In recent years RIDEM and other State regulatory agencies have been making progress in removing bureaucratic impediments to development with programs to expedite and coordinate permit approvals. The Cumberland Planning Department has a similar ambition for those with legitimate development plans seeking permit approval. To be competitive, it is critical that Town government make its own permitting process easier to understand and to navigate.
One step in that direction is to publish a simple user’s guide to the permitting process. The Town website should contain economic development data and permitting guidance that ultimately directs businesses to the Department of Planning and Community Development, who should work closely with the RI Commerce Corporation and others to specify sites ripe for development or redevelopment, and make sure the Zoning Map is appropriately updated.
The primary contact person for business expansions is the Director of Planning and Community Development. Almost all business expansions need Planning Board review and approval. The Director coordinates these reviews and has the experience working with diverse state agencies to help businesses navigate the process. Some expansions may also need approval from the Zoning Board. These approvals are coordinated by the Zoning Enforcement Officer, who works in the Building Department.
Just as every building should have two entries, so too should a bureaucratic system. A second key contact point for economic development is the Mayor’s Office. The Mayor’s Executive Assistant has extensive experience in the business sector and in government troubleshooting complex problems.
To document progress towards the Town’s goal of helping every business quickly, the Town should maintain a tracking file for each business applicant, which will show the date of first contact, the steps taken, and the dates for each step. The tracking summary should be updated and made available to each applicant monthly, and could be reviewed by the Mayor monthly.
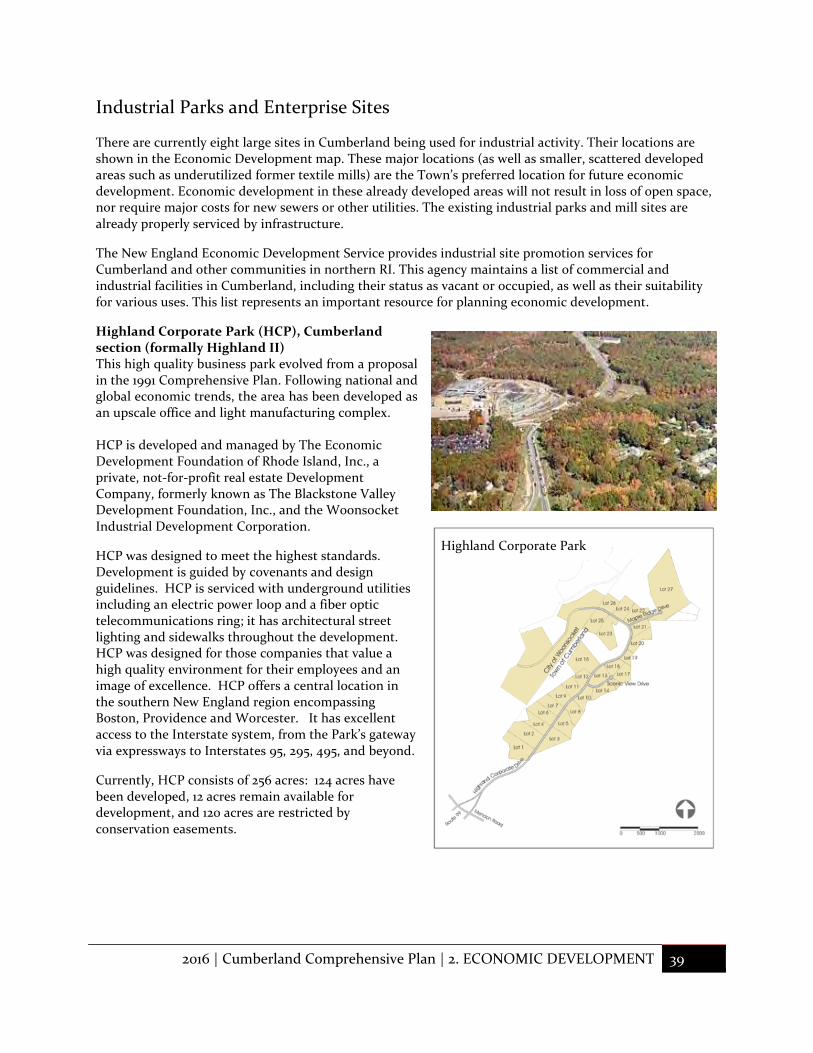
2016 | Cumberland Comprehensive Plan | 2. ECONOMIC DEVELOPMENT 39
Industrial Parks and Enterprise Sites
There are currently eight large sites in Cumberland being used for industrial activity. Their locations are shown in the Economic Development map. These major locations (as well as smaller, scattered developed areas such as underutilized former textile mills) are the Town’s preferred location for future economic development. Economic development in these already developed areas will not result in loss of open space, nor require major costs for new sewers or other utilities. The existing industrial parks and mill sites are already properly serviced by infrastructure.
The New England Economic Development Service provides industrial site promotion services for Cumberland and other communities in northern RI. This agency maintains a list of commercial and industrial facilities in Cumberland, including their status as vacant or occupied, as well as their suitability for various uses. This list represents an important resource for planning economic development.
Highland Corporate Park (HCP), Cumberland section (formally Highland II) This high quality business park evolved from a proposal in the 1991 Comprehensive Plan. Following national and global economic trends, the area has been developed as an upscale office and light manufacturing complex. HCP is developed and managed by The Economic Development Foundation of Rhode Island, Inc., a private, not-for-profit real estate Development Company, formerly known as The Blackstone Valley Development Foundation, Inc., and the Woonsocket Industrial Development Corporation.
HCP was designed to meet the highest standards. Development is guided by covenants and design guidelines. HCP is serviced with underground utilities including an electric power loop and a fiber optic telecommunications ring; it has architectural street lighting and sidewalks throughout the development. HCP was designed for those companies that value a high quality environment for their employees and an image of excellence. HCP offers a central location in the southern New England region encompassing Boston, Providence and Worcester. It has excellent access to the Interstate system, from the Park’s gateway via expressways to Interstates 95, 295, 495, and beyond.
Currently, HCP consists of 256 acres: 124 acres have been developed, 12 acres remain available for development, and 120 acres are restricted by conservation easements.
Highland Corporate Park

2016 | Cumberland Comprehensive Plan | 2. ECONOMIC DEVELOPMENT 40
Numark Industries Tiffany Hart Companies
As of 2010, the HCP had 381,013 square feet of industrial space, 132,120 square feet of office space, and 47,000 square feet of flex space. Also, 340,000 square feet of office space are under construction and a flex building with 20,000 square foot is in the planning stages. More recently, a major residential development has been approved and is currently under construction. “Highland Hills” is comprised of 200 units in four buildings on 30 acres.
CVS is a major tenant of the Park, along with such other major firms as Johnson & Johnson, Procter & Gamble, and Tiffany’s. Numerous high tech firms have also chosen this Business Park as a prime location for business and retaining a quality workforce.
This site is located in the Woonsocket/Cumberland Enterprise Zone, which offers state tax credits to companies that create full-time jobs for Rhode Island residents (see more details in Program Section above). Twelve acres remain available for development.
HCP is a site of major significance for Cumberland’s economic future, by virtue of its sizeable acreage as well as the outstanding quality of the work environment, which will attract high quality firms with high wages and salaries.
Martin Street Industrial Area This area is located immediately north and south of Martin Street, between Mendon Road and the Blackstone River. This site is bounded on the north by the Ashton Park Industrial Area, to the east by mixed use development and Mendon Road and to the south by Martin Street. The site is approximately 115 acres in size.
This site has a wide range of commercial and industrial uses, including a manufacturer of high tech instrumentation and a dance studio, as well as warehousing, distribution, older manufacturing facilities, and gravel extraction (currently owned by Fleet Construction Co, Inc.).
There is little room for expansion of industrial activity at the developed lots in this industrial area, due to the natural constraints of the Blackstone River’s floodplain, poor truck access, and the lack of space for expansion (most of the lots are at the maximum lot coverage permitted by zoning). Some of the few vacant parcels that remain are located in the Blackstone River floodplain/floodway, which precludes future large-scale development.
Martin St. Industrial Area
Highland Park Businesses

2016 | Cumberland Comprehensive Plan | 2. ECONOMIC DEVELOPMENT 41
However, the existing gravel extraction operation, owned by Fleet, has only a one story office building and a repair/garage facility in the front section and outdoor storage in the back of the property. This large 37 acre site could eventually be converted to light manufacturing and/or a business park.
Much of the Martin Street area is adjacent to the railroad line. A 2009 rail transit study found commuter transit to be feasible. In the future, when passenger rail is added to this line, a local stop at Martin Street would encourage redevelopment of this area for mixed uses, including offices.
The area’s proximity to the Blackstone River, to the Blackstone Bike Path on the Lincoln side of the river, and easy access to a future walking/jogging trail on the Cumberland side of the river, all serve to enhance this area’s potential for a future revitalization.
Cumberland Industrial Park (Diamond Hill Industrial Park) This 68 acre site is located east of Diamond Hill Road at a prime location visible from Interstate 295. Current uses include several manufacturing facilities, three trucking companies, and a self-storage facility. The site is now entirely developed, but vacancies occur from time to time. Okonite recently consolidated its operations to this site, expanding the existing building and transferring their remaining Cumberland operations from Martin Street. The company is entirely employee-owned.
The site is ideally located immediately adjacent to an interchange and close to the Chapel Four Corners commercial center. It is a short drive from the Town’s best residential areas and recreational amenities. Consequently, this is an ideal location for high tech manufacturing, research, and offices, which provide more jobs, higher wages, and higher tax assessments than the current trucking, warehousing and self-storage spaces. Additional development should carefully consider traffic impacts.
160 Bear Hill Road This large industrial property is located on the other side of I-295, southeast of the Cumberland Industrial Park. The 11.5 acre site contains a 151,037 square foot building built in 1967 (Tax Assessor ID #: 017-0010-000). It is owned by Dean Acquisition. Current occupants are Gorwood Systems, which stores and processes microfilms and documents, as well as a number of small firms.
This site also has a prime location; it could be visible from I-295 with selective trimming of the trees in the buffer of I-295. It is close to the Chapel Four Corners commercial center and also within a short drive of the Town’s best residential areas and recreational amenities. Consequently, this is an ideal location for high tech manufacturing, research, and offices.
Figure 1: Cumberland Industrial Park North
Figure 2: 160 Bear Hill Road

2016 | Cumberland Comprehensive Plan | 2. ECONOMIC DEVELOPMENT 42
The current tenants provide good jobs for Cumberland residents and should be encouraged to remain. One interim use would be for a high tech incubator, where start-up firms share staff, tele-conference rooms, etc.
In the long run, the northern part of the building would be an excellent location for a high tech research facility and/or high quality office building with 3 to 4 floors to take advantage of visibility from I-295. Here too, the Town needs to motivate current and future property owners to upgrade this site, by offsetting the cost of demolition and waste disposal with a tax assessment phase-in schedule that has good terms.
National Grid Site This site is located off Mendon Road, near the I-295 exit. It is currently an office park for the National Grid Company (which acquired Valley Gas). The site (outlined in yellow below) has approximately 62.5 acres according to Tax Assessor records, and is currently unoccupied.
In case of a future consolidation of corporate offices, this site would become available for re-use. The site has convenient access to I-295 and is appropriately buffered from nearby residential areas. The hilly terrain and bedrock near the surface enhance the beauty of the site on one hand, but also impose increased costs for building any new large structures here. The Blackstone Sewer Interceptor is within 1/8 mile of the site.
Existing office/industrial structures on the site account for approximately 40 percent of the total area, leaving an estimated 38 acres for expansion. Despite the natural constraints, the site’s location and buffering from the residential areas to the south give it ideal potential for economic redevelopment if the current occupant ever vacates the site. Possible future uses could include an office or business park for firms that would appreciate its beautiful, park-like environment.
In the long run, the Town should consider the relationship of this property with the Ashton School at 130 Scott Road, which abuts the northern edge of the National Grid properties. For example, if the school is determined in the future to be surplus to Town needs, then the school property should be combined with the National Grid properties in order to create a larger business park, with the critical mass that would be needed to attract a major firm. Alternatively, if future needs include another middle school, then part of the National Grid property might provide the needed room for expansion.
Cumberland Industrial Park South
Figure 3: National Grid Site

2016 | Cumberland Comprehensive Plan | 2. ECONOMIC DEVELOPMENT 43
Lynch & Sons Inc.
This 110 acre site is located off Mendon Road, opposite Martin Street. It is used for gravel excavation by J. H. Lynch & Sons Inc. If and when this gravel operation ceases, the site has a prime location on Mendon Road and proximity to a possible future transit stop on Martin Street. This prime location gives the site unique opportunities for re-use, such as high quality mixed use planned development that would encompass both commercial space and residential uses. There is a narrow entrance on Mendon Rd., so traffic impacts would have to be accommodated. Commercial uses could include incubator space and office space for medical offices. Residential uses could include age-restricted housing and life-care housing (assisted living facilities). These residential uses would benefit from the relative proximity to Landmark Hospital in Woonsocket. This mix of uses would provide jobs for Cumberland residents, as well as augment the tax base, while minimizing any adverse impact on the Town’s budget. It also borders the extensive Monastery Conservation area, which includes Cumberland’s library and senior center (to the north and east of the site, beyond the north circle in the aerial photo at right).
Ann & Hope Way This site includes the Ann & Hope Mill, industrial buildings to the southwest along the Blackstone River, plus the small commercial area near the bridge at the southeast corner of Mendon Road (formerly a carwash).
This industrial site was formerly all part of the Lonsdale Mill. Now the site is in diverse ownership. Current uses include office space and warehouse storage, plus a retail outlet for the Ann & Hope stores (northwest of the railroad tracks). Other buildings southwest of the railroad tracks are located include auto body shops and a donut shop.
Ann and Hope Way

2016 | Cumberland Comprehensive Plan | 2. ECONOMIC DEVELOPMENT 44
Possible future uses could include a neighborhood business center that includes stores and medical offices serving the neighborhood on the first floor. Artist studios or incubator space for new business start-ups, together with loft housing could be on upper floors and in other nearby buildings.
The views of the Blackstone River and the Lonsdale Conservation Area make this site an ideal location for offices and for residences. The possible future reactivation of rail transit and a transit stop at this location, add to the future attractiveness of this site for a business location and residential uses.
Valley Falls Mills Corridor This site encompasses the historic mills that were once the economic engine for Valley Falls. The C-shaped corridor follows the east bank of the Blackstone River from south of John Street and Geldard Street at the site of Bill’s Auto Parts, Inc., an auto salvage and recycling operation. The site was once home to the Rhode Island Perkins Horseshoe Company, one of America’s largest makers of horseshoes in the latter 1800s and included an iron smelter.
Adjacent to and south of Bill’s Auto Parts is The Fair, a retail and wholesale store for hardware, lumber, and home repair supplies. At this time, this property is proposed as the site of a new Blackstone Valley Prep High School. The industrial corridor includes the land and buildings between Titus and Meeting Streets, now occupied by Texcel Inc., which manufactures textile machinery. As the river bends eastward, the corridor’s hallmark site is occupied by the historic Cadillac Mills and Naushon Mills, on the south side of Meeting Street. Some of the structures are National Historic Register eligible, but are in need of stabilization and restoration.
This economic corridor is enhanced by the Blackstone Bike Path (green line on above map). The Bike Path links this area to points north on the Blackstone River. In the future, RIDOT plans to continue it across the Broad Street bridge into Central Falls, and then on into Providence. The possible future reactivation of rail transit on the P&W Railroad and a transit stop being located only three blocks away will add to the future attractiveness of this site for business.
Valley Falls Mills Corridor
Lonsdale Mill (ca. 1888) now known as the Ann and Hope Mill

2016 | Cumberland Comprehensive Plan | 2. ECONOMIC DEVELOPMENT 45
Mill Citadel at River Bend This industrial area is considered a keystone for regional economic revitalization. It is located on Ralco Way and Turner Street, in the southern-most part of Cumberland, where the Blackstone River makes a major bend southward again, and where Cumberland adjoins Attleboro, almost touches Pawtucket, and faces Central Falls across the river.
At first glance, this area looks small, but its key significance for Cumberland’s future economic vitality becomes apparent when one includes the huge mill complexes immediately across the border in Attleboro.
This area starts where Mill St. crosses the railroad tracks and the road becomes Ralco Way. Here, the historic brick Pump Station 3 offers a wonderfully scenic view of the river. Ralco Way then runs along the river.
The majority of the land in Cumberland is used for industrial purposes, such as Ralco Equipment Co. (heavy duty truck repair) and for parking on land owned by the American Insulated Wire Corp. A few older homes are interspersed in this section. Across the road, the land drops steeply down to the Blackstone River (still in Cumberland). Just across the town border, in Attleboro, the road changes
names and becomes Turner Street. On the left is a large mill complex owned by American Insulated Wire Corp. The parking lot on the west side of the brick building is still in Cumberland. The old brick mill building abuts the town line with Attleboro. This site was vacated in 2009, but it has been renovated by the owner for future reuse.
Further west on Turner Street is a large open space – once the flood plain of the stream that flows from Cranberry Pond, under the metal salvage yards, and into the Blackstone River. This site has been filled with large mounds of gravel and other excavated material (designated by red circle below). Next on Turner Street is the site of a substantial mill complex, on a hill between the bend in Turner Street and I-95, which was demolished in 2015-16. This site is currently owned by the ACS Auxiliaries Group.
Mill Citadel at River Bend
River Bend bird’s eye view looking northeast
Riverbend Aerial Photograph

2016 | Cumberland Comprehensive Plan | 2. ECONOMIC DEVELOPMENT 46
This complex was occupied until recently by the ACS’ Cumberland Engineering division, which made plastics recycling equipment. The site was vacated in 2009.
The mill complex had huge brick buildings from the 1890s and early 1900s that stood on a bluff overlooking the Blackstone River to the west and I-95 to the east.
The entire River Bend area has an outstanding location. It has Interstate access via two exit ramps off I-95, which are relatively close. A spur of the Providence & Worcester railroad passes along the north edge of this area. The Blackstone River flows along the west side, offering open space access.
Scenic views down to the river and over the skyline of Central Falls and Pawtucket make the area especially attractive. The attractiveness of the area can be augmented simply in two ways.
First, extend the Bike Path from Broad Street, along the roads on top of the bluff (Ralco & Turner), to this area, and then via Branch Avenue to Pawtucket, where a planned extension will continue to Providence.
Second, build a nature walk below the bluff, along the river’s shore, using the existing dirt road, which is also the ROW for the main water supply pipe belonging to the Pawtucket Water Board. This river walk should be extended one day to reach down to Slater Mill in Pawtucket, up to the Lonsdale Marsh – and in the long run, up to the Ann & Hope area.
With these enhancements, the mill buildings will become prime, attractive sites for a mix of uses: high tech firms, offices, medical facilities, and housing built to various stages of improvement, so as to appeal to diverse market segments, ranging from artists to upscale families.
At present there may not be sufficient demand by private firms or by buyers/renters of private dwellings to use all of the floor space in these mill complexes. Hence, to avoid vacant buildings, two alternative options to consider for some of the mill buildings would be: an assisted living facility, which would provide both jobs and taxes; or affordable housing for families or for seniors, to be developed by a non-profit organization. This use has the advantage that it would leverage federal grants (HUD Section 202) to revitalize this area, while still paying taxes.
The rail line in back of the American Insulated Wire building is a future asset. If oil prices escalate, then the access to rail freight will make this area very attractive to industrial users. Alternatively, rail transit could be activated on this line, which will add to the future attractiveness of this site as a location for high tech businesses, offices, and for residential uses.
At the heart of this vision is a renewed identity for the region – one that highlights the delight of living and working along the Blackstone River and its future network of river walks and linear open spaces. With proper redevelopment, it will become a high quality place to work and live.
View toward Central Falls at sunset

2016 | Cumberland Comprehensive Plan | 2. ECONOMIC DEVELOPMENT 47
P& W Railroad (narrow dark red line) Bike Path, existing (thick green line) Redevelopment sites (shown in light purple) Riverwalk (future segments are shown by blue lines) Amtrak (thick, light red line) Bike Path (future extensions are shown by thin green line)
Valley Falls ca. 1900 Broad Street, Valley Falls ca. 1885
Broad Street Regeneration Action Plan
Since 2007 the municipal staffs of Cumberland, Central Falls, and Pawtucket; the Blackstone Valley Tourism Council (BVTC); and Progresso Latino have been focused designating Broad Street as a commercial corridor for revitalization. In 2008, a National Parks Service Preserve America grant funded a “Broad Street Regeneration Action Plan” to increase local participation in preserving cultural and natural heritage assets and support the creation of development principles that encourage a revitalized local economy. This plan identified several opportunities and challenges noted with planning to improve local business and economic growth along Broad Street:
Opportunities There still exist stretches of Broad Street where the integrity of the historic architecture and urban fabric remains. Historic structures are being reused and renovated. There is broad cultural diversity in the three
River Bend and Valley Falls Redevelopment plan

2016 | Cumberland Comprehensive Plan | 2. ECONOMIC DEVELOPMENT 48
communities that represents potential for new approaches and new ideas for old problems. There are civic, cultural, and historic attractions that bring outside residents to the area, especially the Blackstone River and the remnants of the American Industrial Revolution.
There are active and successful public-private partnerships bringing together organizations and their capacities to Broad Street that provide social building blocks for economic growth and improved quality of life. All these positives should be built upon as economic development planning continues in the years ahead.
Challenges The dense residential neighborhoods are in the lower-income brackets and about one quarter of the residents do not have high school education. Access to employment, affordable safe housing, and health services is limited. Business owners work hard to be successful entrepreneurs and bring their culture to the area through their ethnic restaurants and local shops, but they face obstacles because of language and cultural differences. These challenges, combined with the fact that many of the business owners do not own the buildings they occupy and therefore cannot make the improvements they would like, are obstacles to creating a vibrant small business corridor along Broad St.

2016 | Cumberland Comprehensive Plan | 2. ECONOMIC DEVELOPMENT 49
Broad Street Regeneration Plan
A Broad Street Overlay District? One of the central proposals of the Broad Street Regeneration Initiative was a three-community zoning overlay district. The Broad Street Overlay District (BSOD) would be a series of uniform zoning proposals that would be adopted by all three municipalities within their zoning codes. The district would provide the communities with the tools to establish the land use controls and design guidelines needed to reach the overall vision of Broad Street. In order to establish the district, each community would have to adopt the Broad Street Regeneration Action Plan as part of its local comprehensive plan, then draft zoning ordinance amendments for implementation.
A BSOD would implement design guidelines for buildings, signs, and streetscape and pedestrian improvements. It would promote historic preservation and establish context-sensitive zoning for Broad Street. These guidelines would be based on the sketches prepared for the nodes of Broad Street as they represent the interventions of the Action Plan. The overlay district would also establish requirements unique to Broad Street such as parking requirements, outdoor seating, and design review. The BSOD should be drafted to allow each community to implement policies and program that reflect individual community

2016 | Cumberland Comprehensive Plan | 2. ECONOMIC DEVELOPMENT 50
needs, but also maintain consistency throughout Broad Street. Its purpose would be to encourage future development and redevelopment within the existing context of Broad Street: multi-use, multi-story buildings built to the sidewalk in an architectural style that complements surrounding buildings. Projects within the BSOD should have parking strategies that reduce single-occupancy vehicles and promote walking, transit, and biking to and within Broad Street.
The Town of Cumberland as of early 2016 has not implemented the concepts proposed in the Broad Street Overlay District concept. The three communities of Cumberland, Pawtucket, and Central Falls should re-visit this concept in the years ahead to continue to foster a regional and collaborative approach to Broad St., which is important to the overall health and vitality of the southernmost neighborhoods of Valley Falls.
Other Cumberland Village Business Corridor Districts
The commercial district villages of Valley Falls, Berkeley, Ashton, Cumberland Hill, Diamond Hill, and Lonsdale have a distinct character based on their historical layouts, streetscape features, and architecture. Such character should be recognized for its cohesive elements and new development should not arbitrarily detract from that character.
Opportunity Space
In 2014, Cumberland joined a regional coalition of Rhode Island municipalities in a grant funded program to market vacant and underutilized publicly owned parcels. This project is known as “Opportunity Space” and was partially funded through grants from the Rhode Island Foundation, the Pawtucket Foundation, and the Sunlight Foundation. Opportunity Space is a centralized online information hub and marketplace for government-owned real estate. This regional coalition includes the Cities of Providence, Pawtucket, Central Falls, and the Town of Cumberland.
Opportunity Space is a tool for city and town departments to analyze and coordinate the use of government owned real estate towards achieving policy goals. On the website, with its easy-to-search, map-based interface, the general public can explore which properties are government-owned and how they are managed and used. Additional filters enable users to search by neighborhood, zoning, government owner, size, or keywords such as street or common name.
For each property designated as an “opportunity,” the managing agency or person is identified, as well as the disposition process, which can include direct sale, sealed bid auction, or a Request for Proposals (RFP). Any additional information, research, or incentives the government has commissioned relevant to individual parcels is available for download directly from the property’s profile page. Among the four participating communities, 2,040 parcels are listed on the site. The listings include government buildings, vacant lots, schools, and small slivers of land. The website for this initiative is located at http://beta.opportunityspace.org
Number of Government-owned* parcels in each participating municipality: Providence 959 Cumberland 749 Pawtucket 244 Central Falls 88 TOTAL 2040
*Includes municipal, state, federal, and quasi -governmental agencies

2016 | Cumberland Comprehensive Plan | 2. ECONOMIC DEVELOPMENT 51
Enhancement of Agriculture
Farming and related businesses have traditionally been important sectors of the Cumberland economy. Yet Cumberland lost half of its agricultural lands in just 16 years, with agricultural uses declining from 1,132 acres to 572 acres from 1995 to 2011. Much of this loss is due to the general decline of dairy farming in Cumberland, formerly a staple of local agriculture, and to the conversion of former to residential subdivisions. Historical loss of large dairy farms is, to some extent, now being offset by new growth in smaller scale farming. Rhode Island’s agricultural sector is growing; in numbers of farms, numbers of farmers, total acreage, revenue and product diversity3. According to the US Census of Agriculture, the number of farms in the state grew by 42% between 2002 and 2007, which is 10 times higher than the national average rate of growth, with the largest growth in farms that are less than five acres in size. A study of agriculture and plant based industries in Rhode Island in 2015 identified 3,327 farms and plant related businesses that provided 15,826 jobs and contributed 2.5 billion to the state economy that year4. Local growth in agriculture may be attributed to the sprouting interest in agro-tourism, a mechanism for both active farming and natural resource protection. Further supporting and strengthening Rhode Island’s agricultural sector will only enhance the sector’s overall economic impact. The Important Farmlands Soils Map shows important farmland soils in Cumberland. These include prime farmland soils, soils of statewide importance and soils of local importance. Significant concentrations of farmland soils occur in the northern, less developed parts of Cumberland. Farmland soils in more developed parts of the town are no longer available for large scale agriculture, but may still provide opportunities for small scale agriculture in association with residential uses. Small scale agriculture does not show up as a large part of local employment because, as practiced in Cumberland, it is predominantly family-owned and operated. Farmers and their families often do not list themselves as employees. Agriculture is, however, a significant contributor to the local economy. A 2010 study of the economic contribution of agriculture by the University of Connecticut5 found that each dollar in sales generated by the agricultural industry creates up to an additional dollar’s worth of economic activity. Local farmers are increasingly engaged in creative finance arrangements such as Community Supported Agriculture (CSA), Farm Share programs, Pick Your Own (PYO), farm stand sales, and farm related tourism activities such as harvest festivals, hay rides, corn mazes, farm tours and related activities that serve to increase revenues while at the same time enhancing local tourism. Organic farming is also increasing in popularity locally, as consumers demonstrate a willingness to pay a premium for locally grown organic crops. Many local farmers sell wholesale and several local restaurants, grocers, and florists have begun to work with local farmers in “farm to table” and “farm to shop” agreements that benefit both the farms and the retailers. The Cumberland Farmers Market is a popular attraction providing shopping opportunities for residents and tourists alike and providing ready access to fresh locally grown food during the season. Prominent local agricultural operations6 include Bascombe Farm on Old West Wrentham Road, producing fruit, vegetables, and Christmas trees; Bradley Farm on Curran Road, producing pork and beef for wholesale; Diamond Hill Vineyards, producing fruit, wines and liquors; the historic Franklin Farm on Abbott Run Valley Road where community gardens produce fresh vegetables for local families and the Rhode Island Food Bank; Friendly Farm on Burnt Swamp Road, producing fruit, vegetables, herbs, nursery
3 http://www.growsmartri.org/issues/agriculture/ 4 http://www.dem.ri.gov/programs/agriculture/documents/GreenUpdate_Web.pdf 5 vii Rigoberto Lopez, “Economic Impacts of Connecticut’s Agricultural Industry,” University of Connecticut, September 2010,
http://today.uconn.edu/?p=21744. 6 http://www.farmfresh.org/food/search.php?q=Cumberland

2016 | Cumberland Comprehensive Plan | 2. ECONOMIC DEVELOPMENT 52
plants, cut flowers, and wool for wholesale; Phantom Farms on Diamond Hill Road, producing fruits vegetables, nursery plants, flowers, apple cider, and baked goods; Rabbits Dance Farm on Jencks Road, producing organic garlic and produce; and Sandy Beach Farm on Kern Boulevard, producing organic produce available at their farm stand and at local restaurants. Chapter 30 Planning and Development, Article VIII: Agriculture, affirms local support for RIGL G.L. 1956, § 2-23.1-1, et seq., making preservation and expansion of agriculture avowed goals of the town as well as the state. Article VIII requires advanced notification to local farmers before implementation of:
(a) Changes of the zoning and/or permitted uses of land used for farming, (b) Designation or amendment of the designation of land use for farming in the
Comprehensive Plan or land use ordinances, (c) Changes in the manner of the taxation of real and personal property used for farming (d) Regulation of water use for farming purposes, and (e) Control of noise and hours of operation of machinery and equipment used in farming
The town also recently amended the Zoning Code to encourage agriculture. Article 7: Agriculture permits, in addition to the principal agricultural activities conducted on farms, retail sales of farm and farm-related products. It allows farm retail sales activities, outdoor sales of farm products, construction of retail sales buildings, expands allowed uses of farm buildings, eases sign restrictions, and permits parking and access to improve the business climate for local agricultural businesses. In addition, recognizing that high property taxes can be a barrier to agricultural expansion, the town amended the tax code to provide an exemption for qualifying farmland. The exemption sets an assessed value of $500 per acre for qualified farmland in the A-1 and A-2 zones, irrespective of appraised value.
Economic Development Summary, Opportunities, and Constraints
Cumberland's employment base is currently dominated by three industrial sectors: services, wholesale/retail trade, and manufacturing. The importance of manufacturing has steadily declined over the past thirty years, while employment in the service sector has increased. In addition, diversification of industries has occurred as employment outside the three main sectors has increased.
Cumberland's economy has shifted from community employment where local jobs provided a critical economic resource to the local population, to a pattern of regional employment of the labor force. Cumberland's labor force and future demand for local employment are not expected to greatly increase.
The Town’s economic base has consistently shifted away from industrial production toward commercial (retail and office-based) services during the last thirty years. The majority of development over the past decade has been residential, rather than commercial or industrial; several potential industrial sites were in fact committed to residential uses. Because of the potential conflict with residential land use as well as environmental constraints, there appear to be few if any options for future industrial sites beyond those identified in the inventory. In addition, due to recent changes in land use, surrounding growth and economic activity, the development of new industrial operations or expansion of existing sites will require strict performance controls to mitigate their impacts on the community. The Highland Corporate Park represents the most promising site for future industrial development.
Commercial development in Cumberland has sprawl along Mendon and Diamond Hill Roads. Creating neighborhood commercial districts and encouraging the use of Planned Unit Developments can protect Cumberland's aesthetic character. Significant buffers should be required between industrial and commercial development adjacent to residential uses or environmentally-sensitive areas. The reuse of

2016 | Cumberland Comprehensive Plan | 2. ECONOMIC DEVELOPMENT 53
closed textile mills for commercial purposes should be encouraged, so as to preserve Cumberland’s open space.
Economic Development Goals
*See the Implementation Element for synopsis of Goals and Action Item implementation schedule, priority, and responsibilities.
Goal: Promote an economic climate which increases quality job opportunities and overall economic well-being of each municipality and the state. (State Planning Act)
Goal: Promote greater diversification of the types of industries located within the Town.
Goal: Encourage local involvement in the development of a town-wide economic strategy.
Goal: Promote and assist in the growth of existing businesses when such expansion is deemed important to the economic development goals of the community.
Goal: Encourage the redevelopment and the use of existing vacant economic assets, including industrial properties and mill buildings where economically feasible.
Goal: Develop neighborhood economic development strategies that promote harmony between economic and residential interests and protect community and neighborhood quality and values. Discourage speculative development in inappropriate locations that is functionally incompatible with community needs. Encourage infill redevelopment and economic activity which minimizes environmental impacts and infrastructure demands.
Goal: Preserve agriculture in historically farmed areas of Cumberland and encourage expansion of a
vibrant agricultural sector that includes farms, agricultural-support services, and other plant related businesses.

2016 | Cumberland Comprehensive Plan | 2. ECONOMIC DEVELOPMENT 54
Economic Development Action Items
E1. Work with the RI Commerce Corporation, Northern RI Chamber of Commerce, RIDEM Division of Agriculture and others to attract economic development which diversifies and ultimately strengthens and expands Cumberland’s tax base.
E2. Use the New England Economic Development Corporation’s inventory of currently vacant, developable commercial and industrial space as a method of targeting specific sites for economic development initiatives.
E3. Include an economic development marketing page on the Town’s website, promoting Cumberland’s strengths as a business location. The Town should produce a companion developers' guide which will clearly explain the permitting procedures and available sites in Cumberland.
E4. Where appropriate, amend the Zoning Map to reflect present commercial, industrial and agricultural uses.
E5. Amend zoning code and land development regulations to pre-screen and guide new large-scale economic development proposals, considering siting logistics, site development, scope, buffers, screening and other impacts in order to minimize displacement and inverse impact on smaller existing businesses.
E6. Provide historic mill building adaptive reuse with the maximum regulatory relief.
E7. In cooperation with Central Falls and Pawtucket, update 2008 Broad Street Rejuvenation Plan, for coordinated signage, improvements and CDBG and other grant opportunities to reinforce the “Main Street” qualities of Broad Street, from Mendon Road to downtown Pawtucket.
E8. Identify Village Business Districts having a distinct, historical physical identity, and consider creating new zoning districts which encourage business development keeping with the character of the District and discourage new development which promotes sprawl and a radical change in architectural continuity. These include, Valley Falls, Berkeley, Ashton, Cumberland Hill, Diamond Hill and Lonsdale.

POU ND RD
DIAMOND HILL RDTORR EY R D
HINE
S RD
W W
RENT
HAM RD
RAWSON RD
NATE WHIPPLE HWY
HIGH ST
PINE SWAMP RD
MARSHALL AVHILLTOP RD
DEXTER ST
MENDON RD
CURR
AN R
D
BROAD ST
ANGEL
L RD
MENDON RD
STAPLES RD
SUMNER B R OWN RD
W RENTH
AM R
D
BURNT SWAMP RD
RESERVOIR R D
ABBOTT RUN VALLEY RD
LIT T L E POND C O UNTY RDLIPPIT T AV
SCOT
T RD
ALBION RD
FARM DR
MANVILLE HILL RD
HIGHLAND CORPORA
TE DR
TOWER HILL RD
ELDER BALO U MEETING HOUSE RD
KAY ST
MART IN ST
HIGHLAND AV
BE AR HI LL RD
N ATTLEBORO RD
?Í
Añ
Aâ
AØ
Aá
AØ
AÛ
%&b(
Aè
Aá
Aß
AØ
Aà
AØAá
Aá
Aã
Aâ
AÛ
!"̀$
Diamond Hill Reservoir
Arnold Mills Reservoir
Sneech Pond
Blackstone River
Miscoe Lake
Rawson Pond
Robin Hollow
Reservoir
Little Pond
Carls Pond
Howard Pond
Richards Pond
RIVER BEND
VALLEY FALLSMILLS CORRIDOR
ANN AND HOPE CENTER
MARTIN STREET AREA
LYNCH ANDSONS, INC.
NATIONAL GRID SITE
CUMBERLANDINDUSTRIAL PARK
HIGHLANDCORPORATE PARK
ASHTON PARKWAY
WOONSOCKET
LINCOLN
CENTRAL FALLS
TOWN OF CUMBERLANDComprehensive Plan, 2016
MAP ECON-1
ECONOMICDEVELOPMENT SITES
RHODE ISLAND
Prepared by:Town of Cumberland Planning Department
Mason & Associates, Inc.
µMap Sources:
0 0.5 10.25Miles
CT
MARI
Map Locus
LEGENDEconomic Development Sites
Ann and Hope Center
Ashton Parkway
Cumberland Industrial Park
Highland Corporate Park
Lynch and Sons Inc.
Martin Street Area
National Grid Site
River Bend
Valley Falls Mills Corridor
Major Roads (Class 1 & 2)
Minor Roads (Class 3 & 4)
0 10.5Kilometers
This map is for general planning use; featurelocations are approximate and not legally authoritative. The Town of Cumberlandmakes no warranty, express or implied,related to the accuracy of this map.

2016 | Cumberland Comprehensive Plan | 3. NATURAL RESOURCES 55
3. NATURAL RESOURCES
Rawson Pond

2016 | Cumberland Comprehensive Plan | 3. NATURAL RESOURCES 56
Introduction
This element identifies and assesses Cumberland’s significant natural resources and evaluates how development impacts each component of the natural environment. Methods for protecting and managing natural resources are identified.
According to the R.I. Comprehensive Planning and Land Regulation Act, the Natural and Cultural Resource Element “shall provide an inventory of the significant natural resource areas such as water, soils, prime agricultural lands, natural vegetation systems, wildlife, wetlands, aquifers, coastal features, flood plains and other natural resources and the policies for the protection of and management of such areas. The policies and implementation techniques must be identified for inclusion in the implementation program element."
The Act also requires consistency with State Guide Plan Elements: 110 Goals & Policies; 121 State Land Use Policies and Plan; 131 Cultural Heritage & Land Management Plan; 156 Urban and Community Forests; 162 Rivers Policy & Classification Plan; 731 Nonpoint Source Pollution Management Plan
Natural Resource Inventory
Cumberland’s natural resources can be broken into three major categories: geologic, hydrologic, and ecologic resources. Geologic resources include surficial geology, topography, and soils. Hydrologic resources are surface water and groundwater, wetlands, and floodplains. Ecologic resources include species as well as habitats located in Cumberland. This section inventories each of these resources and documents potential threats stemming from human activities.
Geology
The geologic and topographic features of Cumberland were formed or modified by glacial processes. During the last continental glaciation a thick sheet of ice covered most of the region. This ice, moving slowly in a southeasterly direction, transported soil and rock fragments thereby obliterating existing landforms and creating a completely new landscape. New valleys were gouged out and drumloidal hills were formed by the ice. Deposits ranging from glacial till and drift containing large boulders to fine grained deposits of silt and clay were created by the moving ice and later modified by extensive meltwater and the wind. Glacial features have been further modified by post glacial geologic processes such as erosion, weathering, redeposition of soils by wind and water, and the effects of vegetation forming cumulose soils (peat and organic silts) in depressions and along water courses.
Surficial Deposits The surficial geology of Cumberland was mapped in 1949 by the United States Geological Survey (USGS) and has not been updated since. The base topographic survey used for the mapping is the Pawtucket Quadrangle at a scale of one inch to the mile (fifteen minute series). The Pawtucket Quadrangle covers most of the Town of Cumberland. Characteristics of surficial geology in Cumberland include till, bedrock, outwash, and minerals.
Most of the Town of Cumberland is composed of till, a material which was deposited with little or no sorting and compacted to form dense deposits not suited to groundwater storage. Till, typically 10 to 20 feet thick, mantles the bedrock surface in the upland areas of the Town. Most of this till forms an uneven mantle or ground moraine. This is found over large areas on Thompson Hill, and on both sides of Mendon Road on Cumberland Hill.

2016 | Cumberland Comprehensive Plan | 3. NATURAL RESOURCES 57
Bedrock outcrops are scattered throughout the Town and are particularly evident north and south of Sneech Pond Road between Mendon and Diamond Hill Roads. Much of the bedrock is calcareous based, which reduces the acidity of overlying soils. This unique chemical makeup supports plant communities that are found exclusively within this region.
Outwash is material that was deposited by glacial meltwater with much sorting and stratification by grain size. Because of this stratification, outwash deposits often contain significant layers of coarse-grained material suited to groundwater storage. A major area of outwash is found in north Cumberland near the Pawtucket Reservoir. This area is mostly developed by the residential neighborhood of Diamond Hills.
The principal mineral resources in the Town of Cumberland are sand and gravel deposits. There are several sand and gravel excavations along Abbott Valley and Blackstone Valley. In addition, an investigation conducted in 1937 identified mine holes containing iron, copper, titanium, zinc, and tungsten. The extent of these mineral deposits was quite small and would not be profitable to extract under present circumstances. In addition, the igneous rock Cumberlandite, can be found in Iron Hill. This black, heavy, magnetic rock is found nowhere else in the world, and has been designated as Rhode Island’s State Rock.
Topography Topography is the form of the earth's surface, in particular the changes in elevation of the surface. The topography of Cumberland includes landforms such as hills, valleys, and plains. The Town’s elevation ranges from a low elevation of 10 feet above mean sea level (MSL) near the Blackstone River to a height of over 547 feet above MSL at Beacon Pole Hill.
There are approximately 12,000 acres of steep slopes (15 percent or greater) located throughout the Town. These were identified from USGS and Soil Conservation Service maps. The most extensive concentrations of steeply sloping land are in the central section of the Town and along the banks of the Blackstone River. Steep slopes are protected in Cumberland’s Subdivision Regulations because their disturbance will result in soil erosion and other environmental problems.
Soils Soils are the surface layers of the earth. They are usually created by modification of surficial geologic material by the weather and climatic conditions. Soils are composed of gaseous, water, organic, and rock constituents. Variations in these constituents give soil a set of physical characteristics. The physical characteristics of soil determine their ability to support weight, susceptibility to erosion and failure in sloping terrain, capacity to receive and transmit water, and economic value (particularly for agriculture).
Soil types within the Town were mapped and analyzed by the Natural Resources Conservation Service (NRCS). The accompanying Soil Constraints to Development Map shows soils with development constraints as well as farmland soils whose physical characteristics make them highly suitable for crop production. Farmland soils are important for their resource potential.
Cumberland has 3,374 acres of prime agricultural soils, or about 18 percent of total land area. Some of these soils are currently being used for agricultural purposes; however, a much greater percentage of these soils have been lost to development. Table58 in Appendix C identifies the types of farmland soils within the Town and shows their extent of surface coverage. The acreage totals are broken down by Prime Farmland acres and acres of Statewide Importance.
Impact of Geology on Land Use
Surficial geology and land use
Characteristics of surficial geology impact land use planning because they affect land use suitability. For instance, bedrock can result in higher excavation costs if a large amount of drilling, blasting, and disposal or

2016 | Cumberland Comprehensive Plan | 3. NATURAL RESOURCES 58
processing is required to excavate rock. Areas with shallow depths to bedrock indicate areas not suited to individual on-site sewerage disposal systems. Areas of organic soil deposits, on the other hand, may contain considerable depths of organic material that must be removed and replaced with gravel for construction. Deep foundations are generally required if structures are built in areas of swamp deposits. Deep foundations (consisting of piling, caissons, etc.) invariably cost more than shallow foundations. Organic soil deposits may also indicate areas of wetlands, which are also protected by the Town’s Subdivision Regulations and by the Rhode Island Freshwater Wetland Act.
Topography and land use Steep slopes of 15 percent or more can affect land use by increasing the amount of excavation and filling required for construction. This, in turn, can affect the stability of a development. Steep slopes are also very susceptible to erosion, particularly if vegetation is removed during construction.
Soils and land use Soils with severe limitations for supporting individual subsurface wastewater disposal systems (septic systems or OWTS) have important consequences for development. Development in these areas may lead to contamination of surface or groundwater resources if sanitary sewers are not available. However, providing sewerage can lead to denser development than is desired. According to the NRCS mapping, there are over 9,772 acres of soils whose characteristics impose severe limitations for individual sewage disposal systems in Cumberland; this constitutes over 53 percent of the Town's total land area. As shown in Figure V-2, the majority of these soils are located in the northern portion of Town, where sanitary sewers are limited and the majority of recent development has taken place. Table 579 in Appendix C identifies these soils and their limitations. The Town has a Soil Erosion and Sediment Control Ordinance in place; however, more can be done to further preserve important soils.
Hydrology
Hydrology consists of interactions between surface and groundwater. Wetlands usually occur as a transitional area between surface water and dry upland areas, or in areas where groundwater is near or at the land’s surface. Floodplains also occur alongside surface water bodies. This section inventories the type, quality, and quantity of these resources. Potential threats to these natural resources are summarized in the final section.
Groundwater is water that saturates geologic or soil formations, generally in pore spaces between soil particles or fractures in bedrock. Groundwater aquifers are important as a source of drinking water. In addition, groundwater discharges to the surface maintain base flow in streams and rivers and contributes water to lakes, ponds, and wetlands.
Aquifers An aquifer is a formation of soils or rock with the capability of storing large volumes of water. An aquifer can be composed of consolidated material such as limestone rock or unconsolidated material such as sand and gravel. The Rhode Island Department of Environmental Management (DEM) has mapped the State’s aquifers and their associated recharge areas. DEM’s definition of a significant aquifer is one that has a saturated thickness (distance between water table and base of an aquifer) of greater then forty feet and a transmissivity (potential water yield) greater than 4,000 square feet per day. Two significant aquifers meeting this definition are located in the Town of Cumberland: The Blackstone River Valley and Abbott Run Aquifers. The location of these aquifers is illustrated on the accompanying Groundwater Map.
Blackstone River Valley Aquifer: From the Massachusetts line to Ashton, the Blackstone River aquifer is very narrow, averaging less than 500 feet in width and 40 feet or more in thickness. Much of the thickest and most transmissive portion of the aquifer is located beneath the river. The maximum known thickness of the aquifer in this part of the river valley is 70 feet and the maximum transmissivity is 17,600 square feet per day (ft2/d). From Ashton to Valley Falls Pond, the aquifer has a maximum known thickness and transmissivity

2016 | Cumberland Comprehensive Plan | 3. NATURAL RESOURCES 59
of 165 feet and 44,000 square feet per day respectively. The saturated volume of about 4 billion cubic feet is estimated to contain six billion gallons of water. The Cumberland Water District has several wells located in this aquifer.
Abbott Run Valley Aquifer: Downstream of the Abbott Run and Happy Hollow Pond Surface Water reservoirs, this stratified-drift aquifer covers 4.5 square miles and has a saturated thickness of up to 80 feet. Saturated volume of the aquifer is about four billion cubic feet.
Groundwater Quality The Rhode Island Department of Environmental Management (RIDEM) has classified the groundwater in Rhode Island locations based on its suitability for public drinking water purposes. The groundwater in Cumberland is classified as GAA, GA, and GB, as seen in the accompanying Surface Waters Map. Areas classified as GAA are known to be suitable for drinking water use, and are afforded the highest level of protection by State regulations. In Cumberland, these are areas of stratified drift alongside the Blackstone and Abbott Run River. The majority of Cumberland’s groundwater is classified as GA, which is also assumed suitable for consumption. A small area in the southern tip of Cumberland is classified as GB, groundwater that is known or presumed not to be suitable for drinking without prior treatment.
Part of the Blackstone River Valley Aquifer located under the 500-acre Peterson/Puritan, Inc. Superfund site is classified as non-attaining. This classification is given to areas were groundwater quality is known or presumed to be out of compliance with classification standards, and is assigned to specific locations where groundwater contamination has occurred. In this case, contamination is a result of 1974 railcar accident and the subsequent spill of 6,000 gallons of solvent. There are also other small areas of non-attaining groundwater associated with Superfund sites and leaking underground storage tanks (LUSTs). The State’s goal for non-attainment areas is for compliance with classification standards; the location of these non-attaining areas is shown in the accompanying Groundwater Map.
Groundwater Quantity The level of a water table varies both over the course of a single year as well as from one year to the next. Generally, the water table is at its highest in the spring, and drops to its lowest point in the fall. The depth below the earth’s surface to the water table is affected by groundwater recharge and discharge. Groundwater recharge generally occurs in areas of permeable soil, where there is a zone of aeration above the water table. Amount of recharge is based on amount of precipitation and permeability of soils. Volume of recharge to the groundwater supply is reduced by impervious surface, which allows precipitation to run directly into surface water bodies without replenishing groundwater supplies. Discharge occurs in areas where groundwater becomes surface water, such as springs and seeps, as well as some ponds and rivers, where it maintains water levels. When groundwater is removed through the action of major wells discharge may be reduced or the water table lowered, thereby negatively impacting surface water bodies.
Surface Water Cumberland’s surface water includes 1,026 acres of rivers, streams, lakes and ponds. These areas, and their tributary watersheds, were identified to assess potential impacts of land use on water quality. Identification of water resources was conducted using Rhode Island Geographic Information System (RIGIS), and maps. Watershed boundaries were plotted using the topographic information supplied on the USGS maps to interpret drainage area limits and was then compared with State's GIS watershed delineation. The accompanying Surface Waters Map illustrates the surface water areas and their watershed boundaries. The largest watershed involves the Blackstone River and Pawtucket Reservoirs. The Sneech Pond watershed is also identified, as it is the source of Cumberland's public water supply.

2016 | Cumberland Comprehensive Plan | 3. NATURAL RESOURCES 60
The Rhode Island DEM has identified high quality surface waters throughout the State. These “special resource protection waters” are significant in terms of their ecological or recreational value. Several ponds, brooks, and rivers in Cumberland are included on DEM’s list of special resource protection waters.
• Reservoirs: Diamond Hill and Pawtucket (Arnold Mills)
• Ponds: Happy, Robin Hollow, Sneech, and Valley Falls
• Brooks: Abbott Run, Ash Swamp, Crookfall, East Sneech, and Longbrook
Although these water resources are currently of high quality, they are at risk from a variety of pollution sources. Pathogens, nutrients, and heavy metals are all potential sources of contamination. Other surface water bodies, including the Blackstone River and Valley Falls Ponds, have already been negatively impacted by human activity.
Stormwater Stormwater, also known as runoff or drainage, occurs when rainfall or snow-melt flows over ground surfaces. Development creates impervious surfaces like roadways, sidewalks, parking lots, and building roof tops that impede the natural percolation of water into the ground. When the stormwater cannot be absorbed through the ground, it runs off over impervious surfaces and is channeled through storm systems such as catch basins and funneled into bodies of water.
Stormwater runoff is a significant source of pollution to the Blackstone River and its tributaries, particularly in the more urbanized areas of Woonsocket, Lincoln, and Cumberland. The majority of stormwater in the watershed’s other two urban centers, Pawtucket and Central Falls, is discharged into Combined Sewer Overflows and is treated before being discharged into a body of water. Throughout the non-CSO portion of the watershed, storm drainage systems collect, concentrate, and route polluted runoff from streets and highways directly to the river, untreated. Stormwater from privately owned property such as parking lots and commercial and industrial areas may be discharged into municipal or state owned drainage systems or may be conveyed directly to the Blackstone River via overland flow, stormwater pipes, or other conveyances.
Rhode Island Stormwater Design Manual The Rhode Island Stormwater Design Manual offers best management practices for decreasing flooding as well as reducing pollutants in storm water runoff, particularly during construction phases. The Manual requires no net increase in storm water runoff and further requires that any runoff must be treated on-site before being discharged. Low impact design (LID) strategies are recommended as a comprehensive approach to both managing runoff and minimizing its hydrological impacts. These strategies include minimizing impervious surfaces in developments and using natural filtration systems such as rain gardens. In light of the historic flooding of March 2010, these strategies are particularly important. The Land Development and Subdivision Regulations reference the use of the Manual for stormwater design and calculations for all development applications.
The Manual requires 11 minimum standards to be met to protect water and habitat quality from development. These standards are the following: 1: LID Site Planning and Design Strategies; 2: Groundwater Recharge; 3: Water Quality; 4: Conveyance and Natural Channel Protection; 5: Overbank Flood Protection;
Diamond Hill Reservior

2016 | Cumberland Comprehensive Plan | 3. NATURAL RESOURCES 61
6: Redevelopment and Infill Projects; 7: Pollution Prevention; 8: Land Uses with Higher Potential Pollutant Loads; 9: Illicit Discharges; 10: Construction Erosion and Sedimentation Control; 11: Stormwater Management System; Operation and Maintenance.
Wetlands Generally speaking, wetlands are areas where water covers the soil or is near the surface of the soil for varying periods of time during the year. Wetlands commonly occur between uplands and water bodies such as lakes, rivers, and streams; however, many wetlands may be isolated, separate features in the landscape. For legal purposes, wetlands in Rhode Island are divided into a number of categories, all with specific definitions found in the Freshwater Wetlands Act and the Rules and Regulations. The Act and the Rules define several ecological wetland types to be protected – vegetated wetlands (such as swamps, marshes, and bogs) and open or flowing water bodies (such as ponds, rivers, and streams). In addition, the Act and Rules protect certain upland areas adjacent to vegetated wetlands and water bodies. These areas are also legally considered “wetlands” and are defined as perimeter wetlands, riverbank wetlands, and floodplains.
Rhode Island’s vegetated wetlands include swamps, marshes, bogs, emergent wetlands, shrub wetlands, and forested wetlands. Water from rain, snowmelt, or groundwater is necessary to sustain these wetlands and is the controlling factor in the development of wetland soils and plants. Vegetated wetlands may have standing surface water or a water table that is underground but close to the surface at least part of the year. The water levels may fluctuate with seasonal changes and the wetland soils may be alternately wet and dry. The frequent wetting and drying make these wetland soils distinctly different from upland soils. The plants that develop and thrive in these wetlands have special adaptations. Only those plants that can withstand the low oxygen levels in the saturated soils can survive.
Rhode Island’s other wetlands include flowing and standing water wetlands, floodplains, and perimeter and riverbank wetlands. Flowing and standing water wetlands include rivers, streams, intermittent streams, ponds, special aquatic sites, and areas subject to storm flowage. Floodplain wetlands are those areas that are flooded during a 100-year storm. Floodplain wetlands may be adjacent to rivers and streams or they may be isolated. Perimeter wetlands and riverbank wetlands are upland areas adjacent to swamps, marshes, bogs, ponds, rivers, and streams. For regulatory purposes, that area of land within 50 feet of a swamp, marsh, bog, or pond is considered “perimeter wetland.” That area of land within 100 feet of both sides of a river or stream less than 10 feet wide and that area of land within 200 feet of a river or stream 10 feet wide or greater are called “riverbank wetlands.” When left in an undisturbed condition, these upland areas can minimize the effects of development on wetlands and protect wetland functions and values.
Wetlands perform functions and provide values that no other areas in the landscape do. They reduce flood and storm damages, protect and improve water quality, provide important fish and wildlife habitat, and support hunting, fishing, and other recreational activities. Functions include:
• Flood Protection: Wetlands help control floodwaters by storing water during periods of heavy rain or snowmelt. The slow release of floodwaters from wetlands to streams and rivers effectively reduces the risk of flooding downstream. When wetlands are altered or filled, their ability to temporarily hold floodwaters may be reduced and may result in costly loss of property and endangerment of lives.
• Surface and Groundwater Protection: Wetlands provide key links in the water cycle. They are important in maintaining stream flow during periods of drought by storing water during rainy periods and slowly releasing it, thereby keeping streams flowing when they might otherwise be dry. This also reduces stress to plant and animal communities in and around streams. In addition, some wetlands help maintain a pathway for surface water to recharge groundwater reservoirs that many people rely on for drinking water.

2016 | Cumberland Comprehensive Plan | 3. NATURAL RESOURCES 62
• Water Quality Protection: Wetland plants and soils can store, filter, and naturally treat nutrients and other stormwater pollutants that would otherwise reach rivers, streams, and lakes. This helps keep streams and rivers clean enough to support wildlife, provides high quality water to reservoirs, and ensures high value recreation areas for fishing and swimming. Wetlands also shade the flowing water in streams and rivers, thereby keeping it cool in the hot summer months. Because cool stream water contains more oxygen than warm water, it is much more valuable for trout and other sport fish.
• Recreation and Aesthetics: Wetlands support a wide range of recreational activities. Swimming, fishing, boating, ice skating, and water skiing are entirely water dependent. Other activities like hiking, bird watching, and nature study are not dependent on the presence of water, but are enhanced by and often focused around wetlands. The quality of these recreational activities depends a great deal on the health of the wetland system.
• Wildlife and Wildlife Habitat: Many animals, most obviously fish, depend entirely on wetlands to survive. Other animals live most of their lives in upland areas but depend on wetlands for breeding. Many mammals, amphibians, reptiles, and birds depend on wetlands for feeding, nesting, migration stopovers, or for wintering habitat. Even small wetlands like vernal pools that appear dry much of the time are crucial to the survival of certain species.
Wetlands within the Town were identified using the latest state RIGIS data available. The accompanying Surface Water Map shows the wetlands within the Town, as of (2014). There are 1,988 acres of vegetated wetlands as well as 1,085 acres of open water wetlands for a total wetlands acreage of 3,072.
Large concentrations of wetlands can still be found in northern Cumberland along Pine Swamp and Ash Swamp. Another concentration is in the central section of Town associated with Little Pond, Scott Brook, and Long Brook. Both the Lonsdale Marshes and Ash Swamp have been identified by DEM as Special Resource Protection Waters. The location of wetlands in Cumberland is shown in the accompanying Surface Waters Map.
Floodplains and FEMA Flood Mapping Floodplains are areas adjacent to rivers, streams, and surface water bodies which are susceptible to flooding during periods of excessive water runoff. During normal stream flow, water is carried within the channel; in times of high runoff, water overflows its banks and spills into the floodplain. The floodway is the central portion of the floodplain that contains the river and enough of the surrounding land to enable floodwaters to pass. No development should occur within the floodway.
The 100-year floodplain includes all the land area that will be flooded during a 100 year flood event. A 100-year flood is a base flood that has a one percent chance of occurring in any year. Over a long period of time, such a flood is projected to occur once every 100 years on the average. The 100-year flood boundary, or the 100-year floodplain, is usually the area identified for development restrictions. Within the Town of Cumberland, floodplain areas are found adjacent to most large watercourses and water bodies. The largest floodplains within the Town are those associated with the Blackstone River. The floodplains within the Town have been mapped by the Federal Emergency Management Agency (FEMA); they can be seen in the accompanying Flood Zones Map.
There have been several major initiatives at the federal and State level in recent years that have influenced how the National Flood Insurance Program (NFIP) impacts homeowners within and outside regulatory floodplains and how much flood insurance costs for residential and commercial structures. While major Federal changes take place, FEMA and the USGS produced new flood insurance rate maps (FIRMS) for the Narragansett Bay watershed that became effective in 2015. The floodplain figures below show the impact of these changes in Cumberland. In most cases, the new maps have been updated with better resolution aerial

2016 | Cumberland Comprehensive Plan | 3. NATURAL RESOURCES 63
photography and satellite imagery, particularly land elevations determined by LIDAR, which allows for more accurate determination of extents of regulatory flood hazards areas. These areas known previously as “100 year flood zones” are now referred to as “1 percent annual chance flood zones”. The new flood maps were adopted by local ordinance and became effective as of September 23, 2015 by a 6-0 Ordinance Amendment vote of the Town Council.
The federal Biggert-Waters Flood Insurance Reform Act of 2012 (BW-12) extended the National Flood Insurance Program (NFIP) for five years, while requiring significant program reform. The law required changes to all major components of the program, including flood insurance, flood hazard mapping, grants, and the management of floodplains. Many of the changes are designed to make the NFIP more financially stable, and ensure that flood insurance rates more accurately reflect the real risk of flooding.
The federal Homeowner Flood Insurance Affordability Act of 2014 repealed and modified certain provisions of the Biggert-Waters Flood Insurance Reform Act and makes changes to other aspects of the program not covered by that Act. Many provisions of the Biggert-Waters Flood Insurance Reform Act remain and are still being implemented. The new law lowers the recent rate increases on some flood insurance policies and implements a surcharge on all policyholders. The Act also repeals certain rate increases that have already gone into effect and provides for refunds to those policyholders.
Threats to Water Resources
The Town’s 2003 Stormwater Management Program Plan and 1999 Drinking Water Protection Plan document specific threats to Cumberland’s Water Resources. These are described below, along with more general causes of impairment identified in DEM’s 2012 Integrated Water Quality Monitoring and Assessment Report Section 305(b) State of the State’s Waters Report and Section 303(d) List of Impaired Waters as well as the latest information on the Peterson Puritan Superfund Site.
Table 20: Water Resources Under Threat
Source: RI Department of Environmental Management
Groundwater Pollution Sources of groundwater pollution include agriculture, construction, resource extraction, and land disposal. Specific threats to groundwater in Cumberland include 44 Leaking Underground Storage Tanks (18 active, 7 inactive, 19 soil removal only); septic systems (nitrates, bacteria, viruses, toxics); leachate from the (closed) Cumberland Municipal Landfill and 500-acre Peterson/Puritan, Inc. Superfund Site (solvents); storage and application of road salt, pesticides, and fertilizers (nitrogen).
Surface Water Pollution
Land use can affect both the quantity and quality of water resources. Quality impacts include the impacts of runoff carrying oil and grease, heavy metals, tire particles and de-icing compounds (salts) from driveways and
Class Resource Cause Priority Ranking B1 Blackstone River Biodiversity impacts, pathogens, TMDL Completed 2013 Cu, Pb, hypoxia, nutrients, ammonia B1 Valley Falls Pond Biodiversity Impacts, Pb, Pathogens, algal Targeted (2002-2004) growth/CHL-A, anoxia, Phosphorus A Ash Swamp Brook Pathogens High (2003-2005) A Abbot Run Brook Biodiversity impacts, Pb, (Cd) Medium (2008-2012) A Long Brook Pathogens Medium (2008-2012) A Robin Hollow Pond Pathogens Low (2012+) A East Sneech Brook Pathogens (2002) 2012+

2016 | Cumberland Comprehensive Plan | 3. NATURAL RESOURCES 64
parking areas to the water bodies. Quantity impacts include changes in local hydrology that can result from increases in impervious area and the resulting installation of drainage structures, as well as water withdrawals from public and private wells. Alterations in topography caused by cut and fill alternations undertaken for construction may also affect local hydrology. Degraded water quality can also affect the ambient water temperature of a water body which has dramatic negative implications for fish and other aquatic wildlife. The multiple aspects of surface water pollution should be taken into account during the development review process.
Wetlands The value of wetlands has not been fully appreciated until recent years. Conversion of wetlands to dry lands by draining, dredging, and filling was responsible for estimated loss of almost 40 percent of Rhode Island wetlands between the 1880s and 1980s. In 1970 the Rhode Island Freshwater Wetland Act was passed, which afforded most of these areas protection against conversion. Other threats have become more important over recent years. One of these threats is modification of the hydrologic regime – either increasing or decreasing the length of time a wetland is saturated or flooded or the amount of flooding. Moderate changes in hydrology may change the vegetation of a wetland and therefore its suitability for specific wetland dependent wildlife. More drastic changes may convert wetland to upland or deepwater habitat. Another major threat to wetlands is changes in land use and associated pollution; runoff from impervious surface presents many of the same dangers to wetlands as to surface water bodies.
Water Quality Regulation
The Federal Clean Water Act authorizes the Environmental Protection Agency (EPA) to regulate stormwater pollution by designating certain categories of stormwater discharges as requiring Clean Water Act permits. For example, EPA may require permits for discharges which contribute to violations of water quality standards, or which are needed to implement a "total maximum daily load" (TMDL) for an impaired water body. The Rhode Island Department of Environmental Management (DEM) and EPA established a TMDL for discharges of pathogens and trace metal impairments into the Blackstone River watershed. A TMDL Study is a report of water body and pollutant specific studies that specify the amount of a pollutant that a water body can receive and still meet water quality standards. The study identifies corrective actions necessary to improve water quality and restore designated uses.
Mandated by the Clean Water Act, the Total Maximum Daily Load (TMDL) program requires quantifiable goals to be set for water bodies not meeting water quality standards. Only one TMDL has been completed which impacts Cumberland and that is the Blackstone River TMDL completed in 2013. Additional impairments to several water bodies have been identified by the State and priorities for TMDL development have been established; these can be seen in Table 120.
Town actions to protect water quality
The Town should support the goals and actions of the Blackstone River Watershed Council’s Blackstone River Watershed Action Plan. Where possible, the Town should incorporate best management practices (BMP) for drainage infrastructure servicing streets, municipal property and schools. Further, individual septic systems should be designed and sited so as not to contaminate water resources and aquifers.
Peterson/Puritan Superfund Site Proposed Cleanup Plan In the summer of 2014, the Environmental Protection Agency (EPA) presented a Proposed Plan for the cleanup of the Peterson Puritan Superfund site, a summary of which is below: The Proposed Plan presents EPA's plan for addressing contaminated floodplain soils, sediment, and groundwater within OU 2 of the Site and also follows a presumptive containment approach for addressing the large volumes of wastes, including hazardous waste, disposed of in both landfills and associated debris fields within the OU 2 boundary and immediate floodplain of the Blackstone River. This Plan includes the

2016 | Cumberland Comprehensive Plan | 3. NATURAL RESOURCES 65
J.M. Mills Landfill, the Nunes Parcel, and an island between the two areas called the "Unnamed Island" (all of which operated for a time as a single landfill and disposal Facility) where contamination from the landfill operations came to be located within the floodplain of the Blackstone River. The Site is also within the Blackstone River Valley National Heritage Corridor. The plan generally includes the following components:
• Design and construct a Resource Conservation and Recovery Act (RCRA) Subtitle C (hazardous waste) cap on both the J.M. Mills Landfill and Nunes Parcel;
• Remove buildings/structures located on the Nunes Parcel (to facilitate cap construction);
• Consolidate associated debris fields and contaminated soils under the constructed cap(s);
• Consolidate (under the constructed cap(s)) contaminated soil from riverbank and floodplain and provide appropriate riverbank restoration;
• Excavate and consolidate under the constructed caps on-site waste and soil exceeding cleanup levels from the Unnamed Island;
• Excavate (to a depth of approximately one foot) sediment exceeding cleanup standards (called “Preliminary Remediation Goals” (PRGs)) from site ponds for consolidation on-site (under constructed cap(s)), and apply a subaqueous cover where PRG exceedances in deeper sediments may remain; and
• Implement long-term monitoring (e.g, groundwater, surface water, sediment, and performance monitoring for cap effectiveness) where contamination will be left on-site, administer land use restrictions (called “institutional controls”) to prevent use of groundwater on-site and restrict disturbance of components of the cleanup (landfills, the sediment cover, monitoring wells), and conduct statutorily required five-year reviews.

2016 | Cumberland Comprehensive Plan | 3. NATURAL RESOURCES 66
FEMA Flood Insurance Rate Mapping

2016 | Cumberland Comprehensive Plan | 3. NATURAL RESOURCES 67
FEMA Flood Insurance Rate Mapping

2016 | Cumberland Comprehensive Plan | 3. NATURAL RESOURCES 68
The Town of Cumberland had some concerns with the EPA Proposed Plan relating to the size and design of the proposed RCRA C Caps on the J.M. Mills Landfill and the Nunes Parcel as well as the Town’s participation in the design, engineering, and implementation of the EPA Cleanup Plan as we are the Host Community for this Superfund Site. With these concerns in mind, the Town hired GZA GeoEnvironmental Inc. (GZA) to assist in formulating the official comments from the Town of Cumberland, which were submitted to the EPA on January 22, 2015 in response to the EPA Proposed Plan. Using the engineering expertise and design experience of the GZA staff, the Town focused on two areas of general concern which revolved around 1) using an alternative cap for the landfills known as an Evapotranspiration Cap or ET Cap which would have a more aesthetically pleasing surface cover and less height; and 2) Establishing a formalized plan for the Town’s close participation in this process going forward. The two general comments discussing these two aspects in the Town’s letter to the EPA are shown below:
“The Town is the most significant non-PRP Stakeholder in the Superfund process for the JM Mills/OU2 Site closure. As “Community Acceptance” is one of the primary remedial option evaluation criteria, it is important that the Town continue to be involved in the review process as the design details are developed (during the Record of Decision [ROD] development and Remedial Design [RD]). We understand that EPA has provided assurances that the Town will be involved in the future as key site closure and reuse decisions are made. This continued involvement should be formally memorialized in a written plan to ensure that key design deliverables are properly vetted and receive public input in a timely fashion.” “The Proposed Plan as written is prescriptive, and we believe that this will limit the capping options available to the remedial designers which could reduce the opportunity for future use as recreational open space. We recommend revising the language in the Proposed Plan (and subsequently the ROD and Statement of Work [SOW]) to allow for significantly more flexibility in the RD phase of the project. We believe the Proposed Plan, as written, stifle the application of evolving science and engineering solutions in waste site closure, ignores ‘green’ and ‘low-impact’ considerations, and may leave the remediated areas in a barren state compared to the adjacent natural riverbank habitat.”
Other areas of concern addressed in our official comments to the EPA were design flexibility, additional information on ET cap alternatives, addressing height concerns of the proposed caps in relation to surface elevation, landfill gas control, future land use, recreational activity, community impacts, floodplain impacts, and site access. As of early 2016, the design and engineering phase of the EPA Proposed Plan has not yet commenced. The Town should remain an engaged and active participant in negotiating the remedial action plans.
Areas of Ecological Significance
Significant natural sites are areas in the State where unique or valuable natural resources exist. The accompanying Natural Heritage Areas Map identifies the natural areas of particular interest for rare species habitat and exemplary plant communities as well as wetland areas and surface water bodies. Table 5912 in Appendix C lists rare species found in Cumberland.
Town actions promoting ecological sustainability There are a number of actions the Town might take to protect and enhance natural sites. Land preservation strategies include: the Town or Town agencies purchasing or negotiating the acquisition of easements, fee simple interest, or development rights for ecologically-sensitive areas; and preserving farmland by working with the RI Agricultural Preservation Commission in acquiring development rights or encouraging farmers to participate in the Farm, Forest and Open Space taxation program.

2016 | Cumberland Comprehensive Plan | 3. NATURAL RESOURCES 69
Significant natural sites in Cumberland Significant sites include:
Ash Swamp Brook, Ash Swamp, Pine Swamp, Scott Brook, Lippitt Estates, and Long Brook. Together, these areas constitute one of the most significant natural systems in Cumberland. The circumneutral (lime based) soils are highly unusual in Rhode Island, which has mostly acidic soils. These soils support exemplary plant communities and rare species habitat. Land in this area is owned by both the Town and private individuals. Areas surrounding Long Brook and Scott Brook areas have been acquired by the Town and the Cumberland Land Trust under the State's Open Space Grant Program in past years.
Lonsdale Marsh (Valley Falls Pond). This is considered one of the most valuable freshwater wetlands in Rhode Island according to the R.I. Natural Heritage Program. The area’s habitat diversity, which includes several wetland types, supports at least five state-listed species of birds. This site is owned in part by the State and the Town.
Several other sites in Cumberland contain rare plant species and are ecologically significant natural areas. If not already preserved in their entirety, these areas are top priorities for protection. Lands adjacent to these areas are equally important and every effort should be made to protect them as well. The sites and their locations are shown in the following table.
Mapping and monitoring rare species A list of rare species found in Cumberland compiled by the Rhode Island Natural Heritage Program in 2014 is included in the Appendix. In addition to those rare species listed, there are many other birds and wildlife commonly found in the Town. The Appendix lists vertebrates, birds that breed in Town, and migratory birds found in Cumberland.
The Town should continue to work with RIDEM Natural Heritage Program to map and monitor rare native plant and wildlife communities, and use these findings as a basis for targeting land protection or acquisition.
Urban Forestry
There are many village areas, commercial strips, subdivisions, and streetscapes in Cumberland which over time have lost most if not all of their street trees. Trees provide more than aesthetic beauty – they add to property values, calm traffic, and provide shade on hot days. Cumberland has an unfilled position of Tree Warden, whose duties include advocating for inclusion of hearty tree and shrub species to be included in road reconstruction projects, securing grants for urban forestry projects, and negotiating the trimming of
Table 21: Significant Natural Areas in Cumberland
Name Location Pine Swamp Lands south and north of Rte. 121, Cook Road to Wrentham Catamint Brook Tower Hill Road to Diamond Hill State Park extension Diamond Hill Town Park Both Sides of Diamond Hill Road Sneech Pond Reservoir Lands and streams surrounding reservoir Long Brook Diamond Hill Road west to Little Pond County Road Nate Whipple Wetlands Pound Road to Nate Whipple Highway Scott Brook Surrounding Area Millers Oak Conservation Area Hines Road to North Attleboro line Valley Falls Marsh Southern Cumberland – Blackstone River to Lonsdale marsh

2016 | Cumberland Comprehensive Plan | 3. NATURAL RESOURCES 70
trees on Town property. The Town should fill this position with a licensed arborist. Further, the Town should implement the Valley Falls Urban Forest Master Plan, which includes planting street trees on Broad Street.
Natural Resources Opportunities and Threats
The analysis of natural resources within the Town was undertaken to identify the bountiful resources that need protection in order to maintain the Town’s character and quality of life. Additionally, certain environmental constraints will limit particular types of development. It can also be used to identify where natural conditions are appropriate for particular kinds of activity. The long-range development plan must consider natural conditions as they relate to limiting or encouraging particular kinds of development. The following is a summary assessment of the natural resources within the Town of Cumberland. This summary provides a basis for identifying the specific goals and policies for natural resource management.
Geology The surficial geology of the Town is a product of glaciation and consists primarily of till. There are also major areas of outwash containing sand and gravel; these areas are important for groundwater resources. Large areas of the Town have soil properties which severely limit the use of Individual Sewage Disposal Systems. High water tables, shallow depth to bedrock, and slow permeability are typical soil properties. Calcareous bedrock called “greenstone” is located in the northern and central portions of the Town of Cumberland.
There are 3,374 acres of prime agricultural soils in Cumberland and 9,772 acres of soils with Severe OWTS Limitations. Large areas of the Town are occupied by steep slopes. Prominent topographic features are associated with Diamond Hill, Brush Hill, Bear Hill, Copper Mine Hill, Thompson Hill and the bluffs along the banks of the Blackstone River.
Hydrology Cumberland has extensive surface and ground water resources. Two highly productive, stratified drift ground water aquifers are located in the Town. These aquifers serve as a source for public water supply. The Blackstone Valley and Abbott Run Valley aquifers are used by the Pawtucket and Cumberland water supply systems. The Pawtucket Water Supply Board has its wells in the Abbott Run aquifer and the Cumberland Water system has its wells in both the Blackstone and Abbott Run aquifers.
The Blackstone River and the Pawtucket Reservoir systems are the largest watersheds within the Town. The Pawtucket Reservoir watershed contains many surface water bodies including Diamond Hill Reservoir, Arnold Mills Reservoir, Rawson Pond, Howard Pond, Robin Hollow Pond, and Happy Hollow Pond. The entire northeast part of the Town drains to the Pawtucket Reservoir system.
Ecology Several significant natural sites in Cumberland provide habitat for a variety of the State’s rare native animals. These include State listed freshwater mollusks, odonates, tiger beetles, grebe, southern flying squirrel, northern leopard frog, the ringed boghaunter dragonfly, and the American brook lamprey. Other species found in the Town include the marbled and spotted salamander, wood frog, marsh wren, hermit and wood thrush, oriole, bluebird, wild turkey and herons. Occurring mammals include the coyote and fisher.

2016 | Cumberland Comprehensive Plan | 3. NATURAL RESOURCES 71
Natural Resources Goals
*See the Implementation Element for synopsis of Goals and Action Item implementation schedule, priority, and responsibilities. State Planning Act goals are :“To promote orderly growth and development that recognizes the natural characteristics of the land, its suitability for use, and the availability of existing and proposed public and/or private services and facilities.” ; “To promote the protection of the natural, historic and cultural resources of each municipality and the State.” “To promote the preservation of the open space and recreational resources of the municipality and state.”; “To encourage the use of innovative development regulations and techniques that promote the development of land suitable for development while protecting our natural, cultural, historical and recreational resources and achieving a balanced pattern of land uses
Goal: Acquire, protect, and manage property, both institutional development and open space, for recreation, protecting the environment, and enhancing community character.
Goal: Protect and actively manage trees, significant vegetative species, and natural wildlife habitat throughout Town. Goal: Important natural resource areas, including wetlands, wildlife habitats, groundwater aquifers and salt marshes, will be protected. Goal: Our natural resource systems, sensitive water resources and natural habitat will be preserved and protected for future generations
Natural Resources Action Items
N1. Support the goals and strategies of RIDEM and Blackstone River Watershed Council’s ‘Blackstone River Watershed Action Plan. This Plan protects water quality, and includes a commitment to work with the Narragansett Bay Estuary Program to install fish ladders for spawning fish species, and other ecological improvement projects.
N2. Preserve farms, sensitive ecological areas, watershed areas, and special natural resource areas through fee simple land purchase, conservation easements, or purchase of development rights.
N3. Partner with the State Agricultural Land Preservation Commission for the purchase of development rights to agricultural land.
N4. Encourage land owners to participate in the Town’s Farm, Forest, and Open Space taxation program (see RIGL 44-3-32.2).
N5. Promote the sustainable use of municipal, state and National parks and other open spaces within Cumberland. Strategies should support local businesses catering to users.
N6. Incorporate Best Management Practices, where feasible, by retrofitting outdated drainage facilities within municipal and school parking lots and local streets, to limit stormwater runoff and enhance water quality. Develop watershed plans as needed to prioritize projects.
N7. Work with RIDEM Natural Heritage Program to map and monitor rare native plant and wildlife communities, and recommend targeting areas for compatible land use management or land acquisition.

2016 | Cumberland Comprehensive Plan | 3. NATURAL RESOURCES 72
N8. Fill the staff position of Tree Warden, authorized to plan or approve all tree and shrub planting, trimming, and management on municipal property, including utility maintenance work.
N9. Implement the Valley Falls Urban Forest Master Plan.
N10. The Town should remain an engaged and active participant in negotiating specifications for the Peterson Puritan remedial action plan.

WOONSOCKET
LINCOLN
CENTRAL FALLS
TOWN OF CUMBERLANDComprehensive Plan, 2016
MAP NR-1
GEOLOGYRHODE ISLAND
Prepared by:Town of Cumberland Planning Department
Mason & Associates, Inc.
µMap Sources:
0 0.5 10.25Miles
CT
MARI
Map Locus
0 10.5Kilometers
This map is for general planning use; featurelocations are approximate and not legally authoritative. The Town of Cumberlandmakes no warranty, express or implied,related to the accuracy of this map.
LEGENDBedrock Geology
PnBr - Bedrock UnitSurficial GeologyFEATURE
OUTWASH
TILL
Town Boundary
Major Roads (Class 1 & 2)
Minor Roads (Class 3 & 4)
Lakes & Ponds
Ch Hoppin FormationDZc cumberlanditeDZgd gabbro/dioriteMDca alkali-feldspar granite of CumberlandPnbpo Pondville ConglomeratePnbr Rhode Island formationPnbw Wamsutta FormationTd diabaseTvq vein quartzZbm greenstone, amphibolite, serpentiniteZbq quartziteZbs epidote and biotite schistZbu undifferentiated rockZdg Dedham GraniteZefg fine-grained graniteZefv felsic volcaniclastic rocksZeg graniteZegd granodioriteZem mafic/intermediate rock
Bedrock Units:
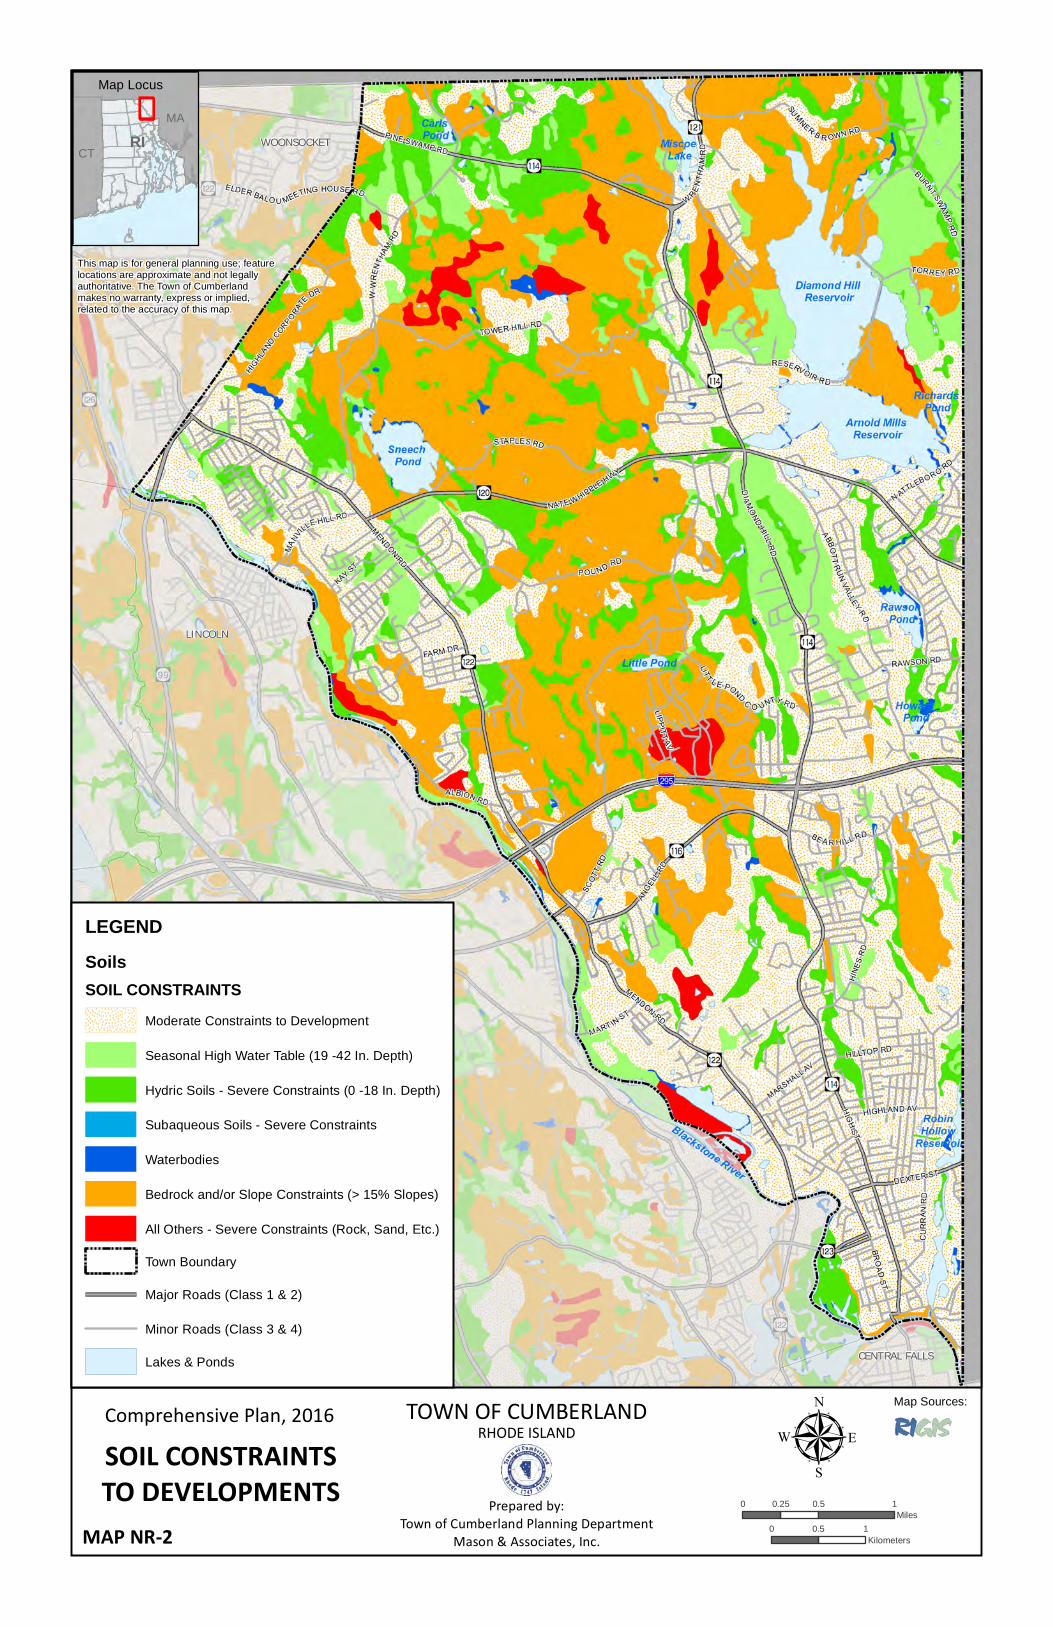
WOONSOCKET
LINCOLN
CENTRAL FALLS
TOWN OF CUMBERLANDComprehensive Plan, 2016
MAP NR-2
SOIL CONSTRAINTSTO DEVELOPMENTS
RHODE ISLAND
Prepared by:Town of Cumberland Planning Department
Mason & Associates, Inc.
µMap Sources:
0 0.5 10.25Miles
CT
MARI
Map Locus
LEGENDSoilsSOIL CONSTRAINTS
Moderate Constraints to Development
Seasonal High Water Table (19 -42 In. Depth)
Hydric Soils - Severe Constraints (0 -18 In. Depth)
Subaqueous Soils - Severe Constraints
Waterbodies
Bedrock and/or Slope Constraints (> 15% Slopes)
All Others - Severe Constraints (Rock, Sand, Etc.)
Town Boundary
Major Roads (Class 1 & 2)
Minor Roads (Class 3 & 4)
Lakes & Ponds
0 10.5Kilometers
This map is for general planning use; featurelocations are approximate and not legally authoritative. The Town of Cumberlandmakes no warranty, express or implied,related to the accuracy of this map.

WOONSOCKET
LINCOLN
CENTRAL FALLS
TOWN OF CUMBERLANDComprehensive Plan, 2016
MAP NR-3
IMPORTANTFARM SOILS
RHODE ISLAND
Prepared by:Town of Cumberland Planning Department
Mason & Associates, Inc.
µMap Sources:
0 0.5 10.25Miles
CT
MARI
Map Locus
LEGENDSoilsAgricultural Importance
Prime Farmland
Statewide Important
Town Boundary
Major Roads (Class 1 & 2)
Minor Roads (Class 3 & 4)
Lakes & Ponds
0 10.5Kilometers
This map is for general planning use; featurelocations are approximate and not legally authoritative. The Town of Cumberlandmakes no warranty, express or implied,related to the accuracy of this map.
NRCS

WOONSOCKET
LINCOLN
CENTRAL FALLS
TOWN OF CUMBERLANDComprehensive Plan, 2016
MAP NR-4
SLOPESRHODE ISLAND
Prepared by:Town of Cumberland Planning Department
Mason & Associates, Inc.
µMap Sources:
0 0.5 10.25Miles
CT
MARI
Map Locus
LEGENDTopographyTopographic Contour Interval
10 Feet
50 Feet
100 Feet
Major Roads (Class 1 & 2)
Minor Roads (Class 3 & 4)
Lakes & Ponds
Town Boundary
0 10.5Kilometers
This map is for general planning use; featurelocations are approximate and not legally authoritative. The Town of Cumberlandmakes no warranty, express or implied,related to the accuracy of this map.

POU ND RD
DIAMOND HILL RDTORR EY R D
HINE
S RD
W W
RENT
HAM RD
RAWSON RD
NATE WHIPPLE HWY
HIGH ST
PINE SWAMP RD
MARSHALL AVHILLTOP RD
DEXTER ST
MENDON RD
CURR
AN R
D
BROAD ST
ANGEL
L RD
MENDON RD
STAPLES RD
SUMNER B R OWN RD
W RENTH
AM R
D
BURNT SWAMP RD
RESERVOIR R D
ABBOTT RUN VALLEY RD
LIT T L E POND C O UNTY RDLIPPIT T AV
SCOT
T RD
ALBION RD
FARM DR
MANVILLE HILL RD
HIGHLAND CORPORA
TE DR
TOWER HILL RD
ELDER BALO U MEETING HOUSE RD
KAY ST
MART IN ST
HIGHLAND AV
BE AR HI LL RD
N ATTLEBORO RD
Diamond Hill Reservoir
Arnold Mills Reservoir
Sneech Pond
Blackstone River
Miscoe Lake
Rawson Pond
Robin Hollow
Reservoir
Little Pond
Carls Pond
Howard Pond
Richards Pond
HappyHollow Pond
Long Brook
Scott Brook
East Sneech Brook
Millers R iver
Catamint Brook
Ash Swamp Brook
Abbot Run
Whipple Brook
Abbot Run
Abbot R
un
Burnt Swamp Brook
Monaste
ry Br
ook
Blacksto ne River
Abbott Run Watershed
Peters River-Blackstone River Watershed
Moshassuck River Watershed
WOONSOCKET
LINCOLN
CENTRAL FALLS
TOWN OF CUMBERLANDComprehensive Plan, 2016
MAP NR-5
SURFACE WATERRHODE ISLAND
Prepared by:Town of Cumberland Planning Department
Mason & Associates, Inc.
µMap Sources:
0 0.5 10.25Miles
CT
MARI
Map Locus
LEGENDLakes & Ponds
Rivers and Streams
Major Watershed Boundary
Vegetated Wetlands
Hydric Soils
Major Roads (Class 1 & 2)
Minor Roads (Class 3 & 4)
0 10.5Kilometers
This map is for general planning use; featurelocations are approximate and not legally authoritative. The Town of Cumberlandmakes no warranty, express or implied,related to the accuracy of this map.
Map Sources:RIDEM

WOONSOCKET
LINCOLN
CENTRAL FALLS
TOWN OF CUMBERLANDComprehensive Plan, 2016
MAP NR-6
GROUNDWATERRHODE ISLAND
Prepared by:Town of Cumberland Planning Department
Mason & Associates, Inc.
µMap Sources:
0 0.5 10.25Miles
CT
MARI
Map Locus
LEGENDAquifers
Groundwater Recharge Areas
Community Wellhead Protection Areas
Non-Community Wellhead Protection Areas
#0 Leaking Underground Storage Tanks
!. Solid Waste Sites
"/ CERCLIS (Superfund) Sites
Town Boundary
Rivers & Streams
Major Roads (Class 1 & 2)
Minor Roads (Class 3 & 4)
0 10.5Kilometers
This map is for general planning use; featurelocations are approximate and not legally authoritative. The Town of Cumberlandmakes no warranty, express or implied,related to the accuracy of this map.
RIDEM

Long Brook
Scott Brook
East Sneech Brook
Millers R iver
Catamint Brook
Ash Swamp Brook
Abbot Run
Whipple Brook
Abbot Run
Abbot R
un
Burnt Swamp Brook
Monaste
ry Br
ook
Blacksto ne River
WOONSOCKET
LINCOLN
CENTRAL FALLS
TOWN OF CUMBERLANDComprehensive Plan, 2016
MAP NR-7
FLOOD ZONESRHODE ISLAND
Prepared by:Town of Cumberland Planning Department
Mason & Associates, Inc.
µMap Sources:
0 0.5 10.25Miles
CT
MARI
Map Locus
LEGENDFLOOD HAZARD AREAS (FEMA)Flood Zone / % Annual Flood Hazard / Recurrence Interval
AE / 1% / 100-Year (with Elevation)
A / 1% / 100-Year
X / 0.2% / 500-Year
Rivers & Streams
Town Boundary
Major Roads (Class 1 & 2)
Minor Roads (Class 3 & 4)
0 10.5Kilometers
This map is for general planning use; featurelocations are approximate and not legally authoritative. The Town of Cumberlandmakes no warranty, express or implied,related to the accuracy of this map.
FEMA

Long Brook
Scott Brook
East Sneech Brook
Millers R iver
Catamint Brook
Ash Swamp Brook
Abbot Run
Whipple Brook
Abbot Run
Abbot R
un
Burnt Swamp Brook
Monaste
ry Br
ook
Blacksto ne River
WOONSOCKET
LINCOLN
CENTRAL FALLS
TOWN OF CUMBERLANDComprehensive Plan, 2016
MAP NR-8
IMPERVIOUS COVERRHODE ISLAND
Prepared by:Town of Cumberland Planning Department
Mason & Associates, Inc.
µMap Sources:
0 0.5 10.25Miles
CT
MARI
Map Locus
LEGENDImpervious Cover
Major Watershed Boundary
Lakes & Ponds
Rivers and Streams
Vegetated Wetlands
Town Boundary
Major Roads (Class 1 & 2)
Minor Roads (Class 3 & 4)
0 10.5Kilometers
This map is for general planning use; featurelocations are approximate and not legally authoritative. The Town of Cumberlandmakes no warranty, express or implied,related to the accuracy of this map.

Long Brook
Scott Brook
East Sneech Brook
Millers R iver
Catamint Brook
Ash Swamp Brook
Abbot Run
Whipple Brook
Abbot Run
Abbot R
un
Burnt Swamp Brook
Monaste
ry Br
ook
Blacksto ne River
WOONSOCKET
LINCOLN
CENTRAL FALLS
TOWN OF CUMBERLANDComprehensive Plan, 2016
MAP NR-9
NATURAL HERITAGEAREAS
RHODE ISLAND
Prepared by:Town of Cumberland Planning Department
Mason & Associates, Inc.
µMap Sources:
0 0.5 10.25Miles
CT
MARI
Map Locus
LEGENDNatural Heritage Areas
Lakes & Ponds
Rivers and Streams
Vegetated Wetlands
Town Boundary
Major Roads (Class 1 & 2)
Minor Roads (Class 3 & 4)
0 10.5Kilometers
This map is for general planning use; featurelocations are approximate and not legally authoritative. The Town of Cumberlandmakes no warranty, express or implied,related to the accuracy of this map.

2016 | Cumberland Comprehensive Plan | 4. CULTURAL, HISTORIC, AND SCENIC RESOURCES
73
4. CULTURAL, HISTORIC, AND SCENIC RESOURCES
Berkeley Mill (ca. 1873) adaptive re-use project

2016 | Cumberland Comprehensive Plan | 4. CULTURAL, HISTORIC, AND SCENIC
RESOURCES
74
Introduction
Cumberland’s identity is derived from its hilly wooded uplands, numerous streams, broad fertile valleys, and the sharply defined Blackstone River Valley, a setting overlaid by a rich record of human settlement. Historic mill villages, farms, scattered individual buildings, scenic roads, rural landscapes, stone walls, and sites characterize the Town’s physical development. Their form, location, and interrelationship embody the story of Cumberland's people.
Originally occupied by the Nipmuc, Wampanoag, and Narragansett Native American tribes, Cumberland’s first European settler is reputed to be William Blackstone, who left Boston in 1635 to escape religious intolerance. Over the next 200 years, the area was steadily settled, an agricultural community that also had mining, grist and saw mills, and iron manufacturing. The first cotton mills were built in the early 1800s. With the completion of the Blackstone Canal in 1828 and the Providence and Worcester Railroad in 1847, commerce increased dramatically. The mill villages of Ashton (1867), Berkeley (1872) and Lonsdale (1860, 1886), transformed the Blackstone Valley into a manufacturing center of national significance.
As the birthplace of the American Industrial Revolution, many of the original textile mills that first tapped the Blackstone River’s power still exist. Although Blackstone River Valley’s importance as a center of industry has declined since the early twentieth century, great efforts have been made to reclaim the Blackstone’s ecological and cultural heritage.
The majority of Cumberland’s cultural resources are associated with its origin as a series of industrial mill villages associated with the Blackstone River. Perhaps most obvious are the historic structures still in existence throughout the Town. However, additional resources also exist and are included in this inventory.
Heritage Park on the Blackstone River. The Park includes remnants of an old mill, original waterway sluices, and
interpretive signage. A fish ladder is planned.
The 1986 National Heritage Corridor Act created the John H. Chafee Blackstone River Valley National Heritage Corridor and Commission, leading to significant federal investment in the Valley’s historic and cultural heritage over the next 20 years. The Corridor Commission transferred management responsibilities to the nonprofit organization it created in October 2011 – the Blackstone Heritage Corridor, Inc. This 501 (c) (3) nonprofit raises funds for and assists in carrying out the work of the Commission. By leveraging public funds with private dollars, Blackstone Heritage Corridor, Inc. enables the Corridor to take on larger, more far reaching projects and to achieve greater results.

2016 | Cumberland Comprehensive Plan | 4. CULTURAL, HISTORIC, AND SCENIC
RESOURCES
75
In 2015, thanks to the efforts of the Rhode Island Congressional delegation, especially Senator Jack Reed and Congressman David Cicilline, the John H. Chafee Blackstone River Valley National Heritage Corridor became a National Park. The National Park Service (NPS) is presently conducting a management program for the new National Park, including working with the states and municipalities. Other initiatives of note include the effort to complete the Blackstone River Bikeway, and to secure funds and awareness for the preservation of historic structures complementing the Park’s creation. It is noted that the proposed FY17 Rhode Island state budget proposes a bond referendum allocating $10M to complete the Blackstone Bikeway.
The Federal government owns and manages only a few parcels in the National Park, unlike more traditional National Parks. The NPS instead is working in partnership with the state governments of Rhode Island and Massachusetts, local municipalities, businesses, nonprofit historical and environmental organizations, educational institutions, many private citizens, and the Corridor Commission to protect the Valley's special identity and prepare for its future.
State Planning Act Requirements According to the R.I. Comprehensive Planning and Land Regulation Act, the Natural and Cultural Resource Element “shall include policies for the protection of the historic and cultural resources of the municipality and the State." The Act also requires consistency with State Guide Plan Elements: 110 Goals & Policies; 131 Cultural Heritage & Land Management Plan; 140 Historic Preservation.
Historic Sites and Districts
The Rhode Island Historical Preservation Commission (now the Rhode Island Historical Preservation and Heritage Commission, or RIHPHC) inventoried Cumberland’s historic resources in their 1990 publication, Historic and Architectural Resources of Cumberland, Rhode Island, which was updated in 1998. This section draws on the information contained in this document. In addition, the Public Archaeology Laboratory, Inc. prepared a Historic Preservation Plan for Cumberland's Historic District Commission in 1990. This plan provides technical information and sets forth goals, implementation strategies, and priorities to protect Cumberland's historical and cultural resources. For a more detailed discussion on the historical resources and goals and implementation strategies for historical preservation for the Town of Cumberland, the Historical Preservation Plan should be consulted. The locations of Cumberland’s historic sites and districts are illustrated in the accompanying Historic Sites Map.
National and State Register Historical Properties A total of four historic districts (comprising 274 properties) and an additional twelve individual properties in Cumberland have been listed in the National Register of Historic Places and Rhode Island State Register of Historic Places. Listed resources include the Town's best-preserved villages, four eighteenth and nineteenth century houses (including one farm), a nineteenth century church, and a prehistoric archaeological site. For the most part, nominations have been prepared by the RIHPHC as staff time and state-wide programming priorities have allowed. The Sassafras Archaeological Site was discovered by archaeologists conducting a study for the Rhode Island Department of Transportation (RIDOT) on the proposed replacement of the Albion Bridge.

2016 | Cumberland Comprehensive Plan | 4. CULTURAL, HISTORIC, AND SCENIC
RESOURCES
76
Table 22: Properties included in the National Register and State Register
Structure or District Location
Arnold Mills Historic District (35 properties)
Ashton Historic District (76 properties)
Berkeley Mill Village Historic District (96 properties)
Lonsdale Historic District (67 properties)
Furnace Carolina Site (RI-2045) Abbott Run
Metcalf-Franklin Farm 142 Abbott Run Valley Rd.
Sassafras Archaeological Site, (RI-55) Albion Road
Patterson Brothers House and Store 159 Broad Street (Demolished 1998)
Whipple-Jenckes House 8 Fairhaven Rd. (Formerly 2500 Diamond Road)
St. Joseph’s Church Complex (c. 1872, 1888) 1301-1317 Mendon Road
Lewis Tower House (1825) 2199 Mendon Road
Luke Jillson House (c. 1752 et seq.) 2510 Mendon Road
Burlingame/Noon House (c. 1800 et seq.) 3261 Mendon Road
John Cole Farm (c.1775) Reservoir Road
Ballou-Weatherhead House Tower Hill Road
Tower-Flagg Barn Complex 100 Abbott Run Valley Road
Historic mill housing, Ashton Village Berkeley Village streetscape
Local Historic Districts The Cumberland Historic District Commission (HDC) was established in 1987 by the Town under Title 45, Chapter 24.1 of the General Laws of Rhode Island. The HDC is empowered with responsibilities to safeguard the Town's heritage. Cumberland is a State Certified Local Government, which allows the Town to apply for federal 50 percent matching grants to be used in survey and planning projects within local historic districts. The following are currently designated Local Historic Districts.

2016 | Cumberland Comprehensive Plan | 4. CULTURAL, HISTORIC, AND SCENIC
RESOURCES
77
Table 23: Current Local Historic Districts
Locally Designated Historic Districts
Ashton Historic Overlay District
Tower Hill Road Historic Overlay District
Old West Wrentham Road Historic Overlay District
Lonsdale Historic Overlay District
Upper Scott Road Historic Overlay District
Diamond Hill Road Historic Overlay District
Town Hall Historic Overlay District
Arnold Mills Historic Overlay District, (Captain John Walcott House (1720)
Arnold Mills homes on Sneech Pond Road date to the mid-1800s
Historic Bridges In 1987 RIDOT conducted a statewide inventory and evaluation of historic bridges under its jurisdiction. As a result, five nineteenth-century bridges and one twentieth-century highway bridge in Cumberland have been formally determined eligible for National Register listing:
Bridges Eligible for National Historic Register Listing
Arnold Mills Bridge, 1886, Sneech Pond Road (Arnold Mills Historic District)
Church Street Bridge, 1881, Church Street
Ashton Viaduct, 1934-1945, George Washington Highway (partially within the Ashton Historic District)
Rawson Road Bridges, c. 1886, Rawson Road
Howard Road Bridge, c. 1886, Howard Road
Properties recommended for further study Along with the historic properties currently listed in the National Register of Historic Places and the State Register, a number of individual buildings and districts have been evaluated as eligible for listing. As new research is conducted, as the Town changes physically, and as perceptions of the community's history and what cultural properties are worth saving evolve, other potential candidates for the Registers may be identified. The

2016 | Cumberland Comprehensive Plan | 4. CULTURAL, HISTORIC, AND SCENIC
RESOURCES
78
following is a list of districts, structures, and sites in the Town of Cumberland currently identified as deserving consideration for entry in the National Register and State Register.
Table 24: Historic properties recommended for further study
Properties
Abbott Run Early Industrial Sites Archaeological District
Diamond Hill Village Historic District
Rawson Road/Abbott Run Historic District
Valley Falls Historic District
Squire Senior Nicholson Hose/”Grayrock” (1920), 130 Angell Road
Cumberland Town Hall (1894), 45 Broad Street
John F. Clark House (1884), 91 Broad Street
Commercial Building (Late 19th century), 159 Broad Street
St. Patrick’s Church, Rectory, Convent, and Parochial School (1861, et seq., 1936), 285 Broad Street (currently site of Blackstone Valley Prep ES1)
G. Whipple Commercial Block (late 19th century), 3782 Diamond Hill Road
Hixon Homestead/Maple Shade Farm (17th century, et seq.), 109 Hines Road
Dormition of the Virgin Mary Orthodox Church (1908), 55 Fountain Street
Former Post Office (late 19th century), 12-16 Mill Street
Miller House (c. 1797), Tower Hill Road
Nine Men’s Misery Site, The Monastery
Old West Wrentham Road Historic District
Tower Hill Road Historic District
Follett/Carpenter House and Farm (c. 1800), 44 Angell Road
Grant’s Mill (c. 1818), 8 Wrentham Road
Proposed Elder Ballou Road Local Historic District A new local historic district is being proposed as part of the update of this plan. If enacted, the “Elder Ballou Road Local Historic District” comprises nearly 60 acres and includes historic farms, cemeteries, stone walls, and mining operations.
Proposed Elder Ballou Road Historic District: Diagram and Aerial View

2016 | Cumberland Comprehensive Plan | 4. CULTURAL, HISTORIC, AND SCENIC
RESOURCES
79

2016 | Cumberland Comprehensive Plan | 4. CULTURAL, HISTORIC, AND SCENIC
RESOURCES
80
Table 25: Properties in the proposed Elder Ballou-Meeting House Road Historic District
Map Description Plat/Lot# Site Features/Description
1 Elder Ballou Historic Cemetery #28
None listed 1 acre +
The cemetery is an acre+ and shows no ownership on Town records. For the last 8 years it has been maintained by Michael Scalzi, former member of the Conservation Commission and current board member of the Blackstone River Watershed Council (BRWC). Many gravesites carry the names of historic settlers of Cumberland.
2 Cumberlandite Site 51-31 3.75 acre
Town owned site since 1/5/2001. This is the only known source of the State Rock Cumberlandite. Road frontage is 573 feet. Mining of iron was active in the mid-19th century. A few local historians have documented the sites history.
3 Conservation Land Owned by Econ. Dev. Foundation
51-59 42.5 acres
Diverse wooded wetland that abuts Woonsocket to the West and the Elder Ballou Cemetery to the East. Road frontage is a very significant 950 feet lined with a stone wall from the Cemetery #28 to the Woonsocket City line. The site has historic stonewalls along with remnants of a narrow gauge rail bed system that moved the Cumberlandite from the iron mining site into Woonsocket.
4 Whipple Cemetery #27
No plat Est. ¼ acre
A small second historic cemetery of about ¼ acre is across the street from the main Elder Ballou Cemetery and abutting Town Gainsborough property (old Vadenais farm)
5 Gainsborough Town Owned
50-209 7.32 acres
This lot serves as informal parking for cemetery visitors with significant frontage on the North side of Elder Ballou Meeting House Road. This is one of many lots called Gainsborough, which the Town acquired in the 1990’s to avoid a major development. This lot surrounds cemetery lot #27. The total acreage of Gainsborough is estimated at about 90 acres and was once a dairy farm owned recently by the Vadenais family.
6A 6B 6C 6D 6E 6F
Gainsborough Town owned
6 lots 50-174 50-173 50-172 50-171 50-170 50-169
All Gainsborough paper streets 1.24 acres Malloy Road 0.99 acres Malloy Road 0.59 acres Malloy Road 0.71 acres Malloy Road 0.63 acres Bryon Road 0.57 acres Bryon Road

2016 | Cumberland Comprehensive Plan | 4. CULTURAL, HISTORIC, AND SCENIC
RESOURCES
81
Historic Cemeteries As recommended in the 1991 Comprehensive Plan and 2003 Comprehensive Plan, Cumberland’s historic cemeteries have been located and identified. While some of these properties are located on private property, others are Town owned and are maintained by the Department of Public Works. These cemeteries not only contain the graves of Cumberland’s earliest citizens, but also contain examples of funerary art from different periods and are an important historical record of the Town’s past. The following cemeteries have been identified in Cumberland.
Table 26: Cumberland Cemeteries
Cemetery Location
St. Patrick’s Cemetery High Street
St. John’s Ukrainian Cemetery Hewes Street
Cumberland Cemetery Dexter Street
Old Indian Cemetery Dexter Street
St. Basil’s Cemetery Curran Road
Mt. Calvery Cemetery Curran Road
Blackstone Lot Broad Street
St. Joseph’s Cemetery Mendon Road
Ballou Cemetery Mendon Road
St. John’s Episcopal Cemetery Ashton/Mendon
Our Lady of Atonement Diamond Hill Rd
Nine Men’s Misery Cemetery Diamond Hill Rd
Brown-Bartlett Cemetery Mendon Road
Bartlett Cemetery Mendon Road
Carpenter Lot Mendon Road
Weeden Cemetery Nate Whipple Hy
Staples Family Lot Nate Whipple Hy
Pickering & Staples Lot Nate Whipple Hy
Peck Cemetery (Arnolds Mills)
Abbott Run V. Rd.
Metcalf Cemetery Abbott Run V. Rd
Quaker Cemetery Abbot Run V. Rd
Evergreen Cemetery Nate Whipple Hy
Arnolds Mills Cemetery Nate Whipple Hy
Old Diamond Hill Cemetery Reservoir Road
New Diamond Hill Cemetery Reservoir Road
Weatherhead Family Lot Mayflower Drive
No Name Cemetery (not located)
Torrey Road
Cemetery Location
Cook-Carpenter Lot Apache Lane
Wilkinson Cemetery & Tomb Angell Road
Wilcox Family Lot (not located/developed)
Manville Hill Road
Elder Ballou Meeting House Cem.
Whipple Cemetery
Scott Lot W. Wrentham Rd
Kimball Lot Kimball St., Willis
Dr.

2016 | Cumberland Comprehensive Plan | 4. CULTURAL, HISTORIC, AND SCENIC
RESOURCES
77
Development impacts on historic resources Historic buildings and village scapes, scenic vistas, and attractive road corridors contribute enormously to Cumberland’s charm, quality of life, and property values. The integrity of these assets is frequently challenged by new development with architectural styles, massing, and settings that are in conflict with established patterns.
Given that so much has already been lost, it is important that historic buildings be protected, restored, and adaptively reused as a first priority, and not degraded or demolished. New construction within historic districts or adjacent to historic or scenic properties should be designed with a sensitivity to context, especially as it relates to size, architectural style, massing, setbacks, landscape features and ability to synthesize with surroundings. Amendments to the Zoning Code and Development Regulations could address this, and should refer to scenic and historic resource inventories that are registered in the Town and State GIS databases, and on the Town website.
The Town could do more to enhance gateways and public spaces, with public art, landscape vegetation and other place-making elements. These include signature street signs in historic districts and monument signs at municipal facilities. Further, a plaque program for period structures both within the local historic districts of Cumberland and/or listed on the National Register should be considered.
Gateway and public art, and Town signage enhancements: “Chocolateville” historic marker in Central Falls, historic house plaque, and East Greenwich municipal campus sign
Pawtucket (l) and Central Falls (r) stylized street signs in historic districts have distinctive features while Cumberland (center) signs do not
Other potential historic resource enhancements relate to the new National Park designation for the Blackstone River Valley and also the adaptive reuse of the historic Neves building next to Town Hall.

2016 | Cumberland Comprehensive Plan | 4. CULTURAL, HISTORIC, AND SCENIC
RESOURCES
78
Cultural Resources
In addition to Cumberland’s rich historical resources, Cumberland’s cultural resources include various cultural events and groups, as well as many churches. Some of these resources have been in existence for many years, while others are fairly new.
The Arnold Mills Fourth of July Parade has been held annually since 1927; it is preceded by a road race and followed by a “Concert on the Green” in front of the Arnold Mills United Methodist Church. Every Victory Day weekend, a three-day Cumberlandfest, which includes food, entertainment, crafts and fireworks, is held at Diamond Hill Town Park. This festival is the Blackstone Valley’s largest summer family celebration. Cumberlandfest is currently celebrating its 27th year as of the writing of this Comprehensive Plan update.
In Valley Falls, several annual events take place in celebration of the area’s prominent Portuguese population. These include a parade and procession held each June at the Lusitania Club for the Feast of St. John, the largest Day of Portugal Celebration in Rhode Island, which has been supported by the Town in recent years, and the yearly Our Lady of Fatima feast and procession are held at the church of the same name.
In addition to these outdoor summer celebrations and parades, the Town has the Blackstone River Theater on Broad Street, which conducts plays and art classes throughout the year. The Blackstone River Theater is non-profit cultural art center, whose focus is on cultural events and programs specific to the Blackstone River Valley which highlight the heritage of the region. The Theater presents music concerts, folk dances, children’s events, as well as other special events. The Theater recently renewed its lease with the Town of Cumberland for another 15 years. Since re-opening in late 2000, the Blackstone River Theater has now seen more than 89,000 audience members attend more than 1,800 events. The Blackstone River Theater also rents out its space for private, corporate and nonprofit functions and maintains a rotating art gallery showcasing works by local visual artists.
The Arnold Mills Community House also hosts cultural events throughout the year. These events involve arts and crafts as well as painting.
Since 2009 the Town’s Public Library has hosted a local artist each month at the Hayden Art Gallery. Artists hang their works and hold an Artist Meet and Greet to discuss their work. In 2015 the Library began to hold a summer concert series on the front lawn. These free concerts appeal to families, who are encouraged to bring blankets and chairs to enjoy the music. Local food trucks provide a late dinner or snack. The Library plans to expand the concert series in 2016.
The Town’s Parks and Recreation Department began a “Winterfest” celebration at Diamond Hill Park in November and December 2015. It includes a display of Christmas trees, each sponsored by Cumberland residents. Winterfest also provides children’s activities, including train rides on a recently purchased train. Other events in the Town include Touch-a-Truck held at Diamond Hill Park and Public Safety Day held at the public safety offices, both sponsored by the local public safety officials.
Religious Resources
A number of religious institutions of various denominations are located in Cumberland, some of which were identified in previous sections. The following is a list of Churches located within the Town.

2016 | Cumberland Comprehensive Plan | 4. CULTURAL, HISTORIC, AND SCENIC
RESOURCES
79
Table 27: Churches in Cumberland
Denomination Names
Baptist Blackstone Valley Baptist Church, Fellowship Baptist
Catholic Our Lady of Fatima, St. Aidan's Church, St. Joan's Church, St. John Baptist, Mary Vianney, St. Joseph's Church, St. Patrick's Church
Episcopal Emmanuel Episcopal Church, St. John's Episcopal Church
Methodist Arnold Mills United Methodist Church, Cumberland Community Methodist Church
Orthodox Dormition of the Virgin Mary
Presbyterian Calvin Presbyterian Church
Other Blackstone Valley Church of Christ, Providence Zen Center
United Church of Christ
Four Corners Community Chapel
These religious and cultural resources bind the community and improve its quality of life. As the community becomes more and more developed, it is these resources that will remain constant to Cumberland and that will give it a sense of place.
Scenic Resources As another means to preserve the Town’s character, scenic roadways designations may be adopted in accordance with the RI Scenic Roadways Board application process managed by RIDOT. Scenic roadway designation requires RIDOT to consider scenic qualities of a road corridor when designing reconstruction improvements. The Conservation Commission has already initiated such a conversation, suggesting the following roadways for this designation: Diamond Hill, Pine Swamp, Nate Whipple, West Wrentham, and Sumner Brown. These meet the criteria of having natural, historical, cultural, archeological, recreational, and visual value. The Town should submit applications for each road, based on a public hearing and affirmative vote by the Town Council. Further, every effort should be made to control excessive signage and visual clutter that detracts from Cumberland’s historic and aesthetic charm. The Zoning Office should robustly enforce the municipal sign regulations.
Town Owned Historic Properties
The Metcalf/Franklin Farm is important remnant of Cumberland and Rhode Island’s history. The site was saved from being developed as house lots when the Town of Cumberland (with financial assistance from the RI Department of Environmental Management and RI Water Resources Board Water Quality Protection Fund) purchased the fields and Barns in 1994 to provide water quality protection and production, and the Farm House and garage in 2005. The Historic Metcalf-Franklin Farm Preservation Association (HMFFPA), the successor to the Friends of the Franklin Farm Management Committee established in the 2006 Conservation and Management Plan, is a volunteer-based 501 (c) 3 non-profit organization and oversees day to day operations. The land on which it resides is community open space.

2016 | Cumberland Comprehensive Plan | 4. CULTURAL, HISTORIC, AND SCENIC
RESOURCES
80
Located on 67.38 acres on both sides of Abbot Run Valley Road and west of Rawson Pond, Franklin Farm includes a 19th century barn, 20th century farmhouse and garage, 21st century community garden, and existing stone walls, open fields and pastures, and woodland. The farm core where the buildings are located contains most of the historic farming activities and buildings and the outer acreage that contains hayfields, woodlands and hiking trails.
Franklin Farm preserves an agricultural heritage that spans several centuries, including New England farming technologies and organizational patterns of farm design that have evolved from organic and scattered to designed and formalized. This significant historical site is listed on the National Register of Historic Places. The Town intends to work closely with HMFFPA to preserve and farm the land, provide educational and celebratory programs and events, and restore and adaptively reuse its structures so that present future generations can
appreciate Cumberland’s agricultural heritage.
In 2016 the Town received a State Preservation grant from the Rhode Island Historic Preservation and Heritage Commission in the amount of $150,000 for phase 1 of the rehabilitation and reuse of the Franklin Farm farmhouse. The Town is matching this grant with $150,000 for a total project balance of $300,000 for
phase 1 of the project which entails the architecture and engineering of the exterior and interior work to make the farmhouse a town museum and meeting space as well as the completion of all the exterior work. Phase 2 will consist of the final interior work to finish the project. Phase 1 of the Franklin Farm farmhouse rehabilitation project began in June of 2016 and is scheduled to be complete by June 2018. Phase 2 of the project will then commence. It is expected that by 2020 the farmhouse will be completely rehabilitated and open as a Town museum and meeting space as described in the 2006 Management Plan for the property as well as the 2015 Master Plan for Franklin Farm.
First Floor Plans for Rehabilitation project; 2016
Franklin Farm farmhouse; Fall 2016

2016 | Cumberland Comprehensive Plan | 4. CULTURAL, HISTORIC, AND SCENIC
RESOURCES
81
The Town of Cumberland has been seeking to rehabilitate Town Hall through a series of initiatives aimed at energy efficiency as well as historic preservation. As mentioned in the following section on Public Facilities and Services, the Town has already begun a process of engaging the assistance of the Office of Energy
Resources and the University of Rhode Island to help conduct energy audits of Town facilities including Town Hall. These audits began in 2014 through the Rhode Island Public Energy Partnership (RIPEP) and continue to this day. In 2016 the Town began replacing lights in Town Hall with energy efficient lights and would like to replace the windows at Town Hall with energy efficient windows that meet the requirements of the Secretary of the Interior Standards for the Treatment of Historic Properties.
Designed by William R. Walker & Son architects and completed in 1894, Town Hall is listed on the National Register of Historic Places and is included within a local historic district. The structure is a three story, cross-gable, classic Colonial Revival brick structure featuring carved terra cotta decorative motifs in the gable ends. Its central, wooden, three tiered clock tower with cupola is a major institutional presence on Broad Street and the newly-designated Blackstone River Valley National Historical Park. In the Spring of 2016 the Planning Department submitted a grant request to the Champlin Foundations for the replacement of the 22 non-historic 20th Century aluminum windows facing Broad Street, including the 2 tower windows and a bank of 4 windows facing south. The aluminum units would be replaced
with solid wood window sash and frames (preferably mahogany) to resemble the original units, with quality hardware, Low E insulating glass, simulated divided lites, and weatherstripping. All work will be done in accordance Secretary of the Interior Standards for the Rehabilitation of Historic Buildings. The Town plans two additional phases in order to completely replace all of the building’s 55 windows.
The Champlin grant request was not funded, but the Town hopes to achieve funding for these windows replacements either through a State Preservation Grant or bond funding in future rounds. It is expected that it would cost $150,000 to replace the 22 windows and another $200,000 to finish replacing all of the windows.

2016 | Cumberland Comprehensive Plan | 4. CULTURAL, HISTORIC, AND SCENIC
RESOURCES
82
Threats and Opportunities
Cumberland's historic buildings, villages, archaeological sites, country roads, rural landscapes, stone walls, and burying grounds are a significant record of the Town's history. Once lost, they cannot be recovered, and their loss alters the character and quality of the community. The major threat to Cumberland's cultural resources is unsympathetic and uncontrolled development.
Cumberland has four historic districts comprising 274 properties. Twelve properties have been individually listed on the National and State Registers of Historic Places. Additional buildings and areas are eligible for listing on the National Register. There are also 34 historical cemeteries distributed throughout Cumberland. Cemeteries include both small family plots as well as larger burial grounds, some of which are associated with a nearby church.
Cumberland's varied historic engineering structures include dams and water canal systems associated with the numerous mills primarily along the Blackstone River and Abbott Run, and a fine collection of five iron-truss bridges erected in the 1880's, four located on Abbott Run and one in Valley Falls. In addition, there are several late nineteenth-century stone-arch bridges, the monumental Ashton Viaduct highway bridge (1934-45), and, in the northeast corner of Town, the Diamond Hill and Arnold Mills Reservoirs, both major civil engineering works built in the late nineteenth and early twentieth century.
Contrast on Broad Street: restored John F. Clark House (1882) Queen Anne
versus vinyl cladding, which obscures historic architectural details
The analysis of past preservation activities in Cumberland reveals that important steps have been taken by Cumberland to safeguard this valuable heritage. Yet, in order to adequately protect the Town's cultural resources, additional actions are required. Preservation planning is a dynamic process rather than a static goal to be achieved once and for all.
While for the purposes of preservation planning Cumberland's survey is current, it should not be considered final. In particular, comprehensive building-by-building inventories do not exist for Cumberland Hill or Valley Falls, The Town's early-twentieth-century, summer resort, and suburban residential developments have not been studied in detail, and recorded data on prehistoric and historic archaeological sites is limited. In addition, as time passes, new properties may be identified which deserve inclusion in the

2016 | Cumberland Comprehensive Plan | 4. CULTURAL, HISTORIC, AND SCENIC
RESOURCES
83
Inventory. In order to sustain a preservation planning process, the Town needs to continually update and expand this crucial database.
Along with the historic properties currently listed in the National Register of Historic Places (NR) and the State Register, a number of individual buildings and districts have been evaluated as eligible for listing. Research and nomination preparation remains to be done for these properties, as well as evaluation of additional properties.
There are important benefits from properties being listed on the National Register or within a local historic district. NR-listed structures potentially qualify for Federal Historic Tax Credits, equal to up to 20% of the cost of exterior restoration of a historic structure. Studies show that historic listing increases property values and the display of historic plaques contributes to neighborhood character.
Historic, Cultural, and Scenic Resources Goals
*See the Implementation Element for synopsis of Goals and Action Item implementation schedule, priority, and responsibilities. State Planning Act Goals include “To promote the protection of the natural, historical and cultural resources of each municipality and the state” and “To encourage the use of innovative development regulations and techniques that promote the development of land suitable for development while protecting our natural, cultural, historical and recreational resources and achieving a balanced pattern of land uses.”
Cumberland sets out the following major goal:
Goal: Protect and enhance the quality and utility of Cumberland’s cultural, historic, and scenic resources.
Historic, Cultural, and Scenic Resources Action Items
C1. Amend the Land Development & Subdivision Regulations to require the adverse effects of development on adjacent historical, cultural and scenic resources be avoided or minimized.
C2. Enact a Demolition Delay Ordinance in order to give the Town a window during which a means may be found to protect and preserve threatened historic structures.
C3. The Zoning Code and Land Development & Subdivision Regulations should refer to the Secretary of the Interior’s Standards for Rehabilitation as best practices for conserving historic structures.
C4. Work with RI Historical Preservation and Heritage Commission to create a Local Historic District GIS data layer showing the parcel and district boundaries.
C5. Request the RI Historical Preservation and Heritage Commission update its 1998 Inventory of Historical and Architectural Resources.
C6. Adopt scenic areas registry and incorporate protections within Planning Board review process, including significant view sheds and smaller scenic areas important at the village level.
C7. Create new standard and aesthetic sign design for Municipal properties, gateways, cultural and recreational sites and destinations, including new Town signature sign design for wayfinding and identifying municipal facilities.
2016 | Cumberland Comprehensive Plan | 4. CULTURAL, HISTORIC, AND SCENIC
RESOURCES
84
C8. Install public art, landscape vegetation, historic plaques and other place-making elements at gateways and public spaces.
C9. Include on the Town website descriptions of historical, cultural and recreational resources of the Town.
C10. Establish additional local and National Register historic districts and sites, including the proposed Elder Ballou local historic district.
C11. The Historic District Commission should initiate a plaque program for period structures that are individually listed or located within local and/or National Historic Districts.
C12. Negotiate cooperative agreements with RIDEM and National Park Service on planning partnerships, cost-shares for future investment, education and outreach, and tourism relating to the new Blackstone Valley National Park, including recognizing value of Ashton Village as a specific site of interest.
C13. Decide on adaptive reuse and restoration program of the Neves Building adjacent to Town Hall. Install public art, landscape vegetation and other place-making elements at gateways and public spaces.
C14. The Town should continue to work toward the preservation and rehabilitation of the barn and farmhouse at Franklin Farm as well as Town Hall. These are two vitally important Town owned historic properties that have received RIHPHC grant funding over the years and should continue to be a priority for town historic preservation efforts.

S
S
S
S
S
SS
S
S
SS
S
SSS
SS
SS
S
SS
S
S
S
S
S
S
S
S
S
S
S
SS
S
S
SS
BURLINGAME-NOON HOUSE
WHIPPLE-JENCKES
HOUSE
TOWER-FLAGG BARN COMPLEX
BALLOU-WEATHERHEAD
HOUSE
LEWIS TOWER HOUSE
LUKE JILLSONHOUSE
SASSAFRASS SITE
ST.JOSEPH'S CHURCH COMPLEX
PATTERSON BROTHERS HOUSE AND STORE
METCALF-FRANKLINFARM
ASHTON H.O.D.
ARNOLD MILLS
LONSDALE H.O.D.
BLACKSTONE CANAL
BERKELEY MILL VILLAGE
ARNOLD MILLS
JOHN COLE FARM
ELDER BALLOUH.O.D. (Proposed)
UPPER SCOTTROAD H.O.D.
TOWER HILL ROAD H.O.D.OLD WEST WRENTHAM ROAD H.O.D.
CAPTAIN JOHNWALCOTT HOUSE(ARNOLD MILLS
H.O.D.)
DIAMOND HILLROAD H.O.D.
ASHTON
TOWN HALL H.O.D.
LONSDALE
FURNACE CAROLINA SITE
BLACKSTONE CANAL
BLACKSTONE CANAL
GRANTS MILL
OLD WEST WRENTHAM
ROAD H.D.
"GRAY ROCK"
ASHTON VIADUCT
TOWN HALL
VALLEY FALLS H.D.
ABBOTT RUNEARLY INDUSTRIAL
SITES
CHURCH ST. BRIDGE
HOWARD ROAD BRIDGE
JOHN F. CLARK HOUSE
RAWSON ROAD BRIDGES
MILLER HOUSE
G. WHIPPLECOMMERCIAL
BLOCK
NINE MEN'SMISERY SITE
FORMERPOSTOFFICE
NAUSHON COMPANY PLANT(NRHP Nomination Pending)
HIXONHOMESTEAD/MAPLE SHADEFARM
ST. PATRICK'S CHURCH COMPLEX
FOLLET/CARPENTERHOUSE & FARM
ARNOLD MILLSBRIDGE
DORMITION OF THEVIRGIN MARY
ORTHODOX CHURCH
DIAMOND HILLVILLAGE H.D.
TOWER HILL ROAD H.D.
RAWSON RD. /ABBOTT RUN H.D.
COMMERCIAL BUILDING 159 BROAD ST.
WOONSOCKET
LINCOLN
CENTRAL FALLS
TOWN OF CUMBERLANDComprehensive Plan, 2016
MAP CR-1
HISTORIC SITESRHODE ISLAND
Prepared by:Town of Cumberland Planning Department
Mason & Associates, Inc.
µMap Sources:
0 0.5 10.25Miles
CT
MARI
Map Locus
LEGENDTown Historic Overlay Districts (H.O.D.)
National Register Historic Districts
!( National Register Historic Sites
Candidate Sites
S Cemeteries
Town Boundary
Lakes & Ponds
Major Roads (Class 1 & 2)
Minor Roads (Class 3 & 4)
0 10.5Kilometers
This map is for general planning use; featurelocations are approximate and not legally authoritative. The Town of Cumberlandmakes no warranty, express or implied,related to the accuracy of this map.
RIHPHC

2016 | Cumberland Comprehensive Plan | 5. PUBLIC FACILITIES AND SERVICES 85
5. PUBLIC FACILITIES AND SERVICES

2016 | Cumberland Comprehensive Plan | 5. PUBLIC FACILITIES AND SERVICES 86
Introduction
The ability of public facilities and services to meet the needs of a community’s population is directly related to the community’s rate of growth and population change. Furthermore, the demand for specific services is dependent on the impact of change on a variety of functional areas of the community. The comprehensive planning process, therefore, must respect this relationship by providing the framework within which to forecast and anticipate the future demands of a community. Similarly, it is necessary to assess the community's ability to supply services at a level that is consistent with the stated goals of the community both now and in the future.
In 2003, the information contained in the Public Facilities and Services Element was based on interviews with Town Officials and research of technical documents. Similar methods were employed in this update: Department representatives and/or Commission members were interviewed concerning their respective public service activities, and both technical publications and facility plans were reviewed. The exception is the community survey; for this update the Town did not conduct a community survey. Previous surveys and workshop have shown a high level of satisfaction with the quality of community services, however, the Town is aware that new facilities may be needed in the years due to the age and location of existing facilities. To that end, a discussion of a new Public Safety Building as well as a new location for Town Hall is included in this chapter.
There is a growing recognition that the availability of services, such as water and sewer, has a direct impact on increased traffic and residential activity. The Town has been actively trying to manage growth for the past few years so that the costs of services remain reasonable for taxpayers. In this chapter, the current availability of water and sewer services are analyzed and future projections are made so that the Town of Cumberland can plan wisely for future service investments that will keep pace with growth and support an appropriate pace of economic development.
This section contains a description of each of Cumberland's services and facilities; locations of these facilities can be seen in the accompanying Public Facilities map. For each service and facility, personnel and equipment is inventoried. In addition, issues related to the facility or service are discussed, including issues identified in the original 1991 Plan as well as new issues that have arisen over the past decade since the 2003-2004 Plan.
State Planning Act Requirements According to the R.I. Comprehensive Planning and Land Use Regulation Act, the Services and Facilities Element shall "Provide an inventory of existing and forecasted needs for facilities and services used by the public such as, but not limited to, educational facilities, public safety, water, sanitary sewers, libraries and community facilities. The Policies and implementation techniques must be identified for inclusion in the implementation program element."
The Act also requires consistency with: State Guide Plan Elements: #721 Rhode Island Water 2030 and Report #119, Solid Waste 2038: Rhode Island Comprehensive Solid Waste Management Plan.

2016 | Cumberland Comprehensive Plan | 5. PUBLIC FACILITIES AND SERVICES 87
Figure 4 Town Hall (1894). Neves building (ca. 1900) next door is in need of re-use
Town Administration
Town Hall (1894), located in Valley Falls, has a very charming historical façade, but the building’s size and internal layout create challenges to the administration of government. Within the two-story brick structure are the following offices: Mayor, DPW, Planning, Council chambers, Clerk, Tax Collector, Tax Assessor, Finance and Human Resources. There are no meeting rooms. In recent years, there has been an interest in constructing a modern Town government building or campus closer to the geographical center of Town.
An additional challenge facing Town government, which could be addressed by a new facility, is the management of data and archival materials. Cumberland has been slow to embrace the Geographic Information System (GIS) database, and a paper-based record keeping system for processing land use records is cumbersome, prone to mistakes, and not readily available to users and the public. Paper records accumulate in the Town archives. This is an area which is ripe for improvement.
Also in 2014, Cumberland voters approved a referendum question consolidating the independent Fire Districts into one. At the appropriate time, it might make sense to determine if the Cumberland Fire District should become a department of the Town.
Education
Cumberland is committed to working cooperatively with the public schools, private schools, and other education providers including adult education and ESL programs, in meeting facility needs, fostering a safe and healthy school environment, and recognizing, the critical role that all types of education play in Cumberland’s vitality and character. Cumberland public educational facilities are shown on the Public Services and Facilities Map included in this Plan update.
In recent years, the Cumberland public schools have become renowned for instruction quality and staff talent, with a reputation for producing smart, ambitious, creative, and well-rounded graduates. A relatively high number go on to some of the nation’s best colleges, universities, and technical schools. In 2015, 92% of the graduating class enrolled in a two or four year school. Student achievement in both mathematics and reading over the past five years led Rhode Island Department of Education to laud Cumberland’s K-12 program, citing the district as one of just five districts statewide making “significant progress” in academic achievement.

2016 | Cumberland Comprehensive Plan | 5. PUBLIC FACILITIES AND SERVICES 88
Empowering students to become successful in a 21st century economy requires multiple approaches at all grade levels. To that end, all 6th, 7th, and 8th grade students are provided laptops to use during the day and at home at night, ensuring students obtain the skills necessary to succeed in high school, college, and beyond. In 2015, both middle schools implemented a robust Science, Technology, Engineering, and Math (STEM) program to foster and develop 21st century skills. All efforts are being made to become as green and paperless as possible. In 2012, Cumberland began its full-day kindergarten program. In addition, school officials have worked to connect the entire continuum of education, improving and refining special education and expanded advanced placement programs, ensuring every student receives quality instruction with appropriate rigor.
Cumberland High School has implemented state-of-the-art biomedical science classes, providing students with a head start from their peers in neighboring high schools. The classes are part of an ambitious expansion of science, technology, and engineering classes at CHS, exposing students to a variety of career paths. Thanks to a progressive approach that focuses on the social and emotional well-being of each student, CHS’s community is one of inclusiveness and camaraderie that is uncommon at most other high schools.
The district has an award-winning fine arts program and a strong and successful athletic program, ensuring every student
from kindergarten through graduation has the opportunity to learn and explore a wide variety of educational offerings on their individual path to success.
Cumberland’s professional educators focus on intellectual curiosity, high expectations for all, a community of inclusiveness, and an appreciation for the community. This approach is found in the “Learning for All” model at the Ashton School, the “Focus on Community” at Community School. It is also found in the “Opportunity for All” model at B.F. Norton, the priority of modeling learning with real world skills and opportunities as demonstrated at Cumberland’s two middle schools, Joseph L. McCourt Middle School and North Cumberland Middle School. And it is found in the “Focus on You” approach to student success at CHS.
Most impressive when considering the progressive actions of the district is that all has been accomplished with the lowest per pupil expenditure ($12,294) of any school district in Rhode Island. The School Committee and administrative leaders continue to provide a high-quality, progressive education to all students at a pragmatic price. In 2012, the Mayor, Town Council, Superintendent, and School Committee approved a Declaration of Education that included the following:
“Cumberland has made transformational changes to the way it delivers public education to its citizens. Cumberland families have more quality public school options than ever before, diverse and affordable after-school learning programs, and opportunities for the town’s youth to have a meaningful role on civic life through the Cumberland Youth Commission.
The Cumberland Public School District has displayed a renewed commitment to best practices such as expanded instructional time, more effective outcomes-based assessment and higher expectations for student achievement. This commitment is embodied by concrete new initiatives being proposed and implemented by district leadership which include full-day kindergarten, an After School Proficiency Center (ASPC), “Saturday School” for high school students needing additional support, a more progressive district grading policy, and a Comprehensive Assessment System that provides real-time feedback on student educational progress.
Valley Falls High School ca. 1900

2016 | Cumberland Comprehensive Plan | 5. PUBLIC FACILITIES AND SERVICES 89
On November 4, 2010, Cumberland voters passed a referendum encouraging municipal and school governing bodies to collaborate more thoroughly and purposefully for the betterment of all Cumberland students, families and taxpayers. We acknowledge and support this directive…
We commit to recapture Cumberland’s place among the very best public education systems in Rhode Island. We further commit to ensuring that our students are competitive with students across New England, the nation and the world… we will work together to foster a culture of innovation, collaboration and increased awareness of learning opportunities for all community members who live in the Town of Cumberland.”
Public School District
The Cumberland School Department currently operates five elementary schools, two middle schools, and one high school. Table 2836 identifies the schools, the year of original construction and any additions, site acreage, and the type of school. Elementary schools serve Pre-Kindergarten through fifth grade, middle schools serve sixth through eighth grades, and the high school serves grades nine through twelve.
Since the original Comprehensive Plan was adopted, the B.F. Norton Elementary School was constructed and Central and St. Patrick’s Middle Schools were closed. The School at the Monastery is currently leased by the Northern Rhode Island Collaborative, and is used as a special education school for several towns.
Table 28: Cumberland School Buildings
School Most Recent Renovation Acres Type
Ashton 2,008 9.3 Elementary
B.F. Norton 1994 Elementary
Community 1,998 4.4 Elementary
Cumberland Hill 2,007 17 Elementary
Garvin Memorial 1,998 7.8 Elementary
McCourt 2,002 18.4 Middle
N. Cumberland 1,994 34.7 Middle
High School 2,010 26.5 High
Source: Sodexo Facility Capital Action Plan (FCAP), 2011
The Ashton School The Ashton elementary school has approximately 250 students, of which 31 are receiving special education services and 17 are receiving English Language Acquisition Services. Staffing includes a principal, 1 school secretary, 2 custodians, 1 nurse, .5 speech therapist, 2.5 days of guidance, 2.0 days of psychological services, 1.5 day of social worker services, 2 special educators, 2.0 teacher assistants, 1.5 reading specialists, 1 math interventionist, 1 English as a Second Language teacher and 12 full time classroom teachers for grades K-5. The students receive 1 day of library services every other week, and weekly instruction in music, art and physical education.
The Cumberland Preschool Center is located at Ashton School. There are approximately 100 children attending in four inclusion classrooms and one specialized class. Staffing includes a director, 5 early childhood special education teachers, 1.5
Building Type: Elementary School Built 1966, renovated 2008 Gross Square Feet: 37,957 Current Replace Value: $7,591,400

2016 | Cumberland Comprehensive Plan | 5. PUBLIC FACILITIES AND SERVICES 90
speech therapists, .5 school psychologist, and 6 paraprofessionals. Thirty additional children have walk-in speech services. The Child Outreach Office is also part of the Preschool Center.
B. F. Norton Elementary School B. F. Norton is the only elementary school in the district that serves the English Language Learner (ELL) population. The enrollment at B. F. Norton is approximately 430 students of which 75 receive special education services. Fifty of the 430 students are identified as ELL. Staffing includes a principal, 1 building secretary, 2.5 custodians, 1 guidance counselor, 2 days of library, 2.5 days of psychological services, 3 full time reading specialists, 2.0 math interventionist, 1 speech therapist, 1 nurse, 1 occupational therapist, 1 day of social worker services, 6 special educators, 9.5 teacher assistants, and 21 full time teachers for grades K-5. The students also receive instruction in music, art and physical education.
The Community School Community School is the largest elementary school in the district with a March 2014 enrollment of approximately 585 students. Of these, 73 receive special education services and four are English Language Learners. Staffing includes a principal, 1.0 building secretaries, 3.0 custodians, 1 guidance counselor, .5 librarian, 1 nurse, .5 psychologist, 1 speech services, 1.5 reading specialist, 1.0 math interventionist, 5 special education teachers, .5 ELL teacher, eight teacher assistants, and 27 teachers for grades K-5. The students also receive instruction in music, art and physical education.
The Cumberland Hill Elementary School The enrollment at John J. McLaughlin Cumberland Hill School (JJM) is approximately 350 students. Of these, 58 receive special education services and 11 receive ELL services. Additional students receive interventions services. Staffing includes a principal, 1 building secretary, 2.5 custodians, 2.5 days of guidance counselor and 2 days of library, 1 nurse, 2.5 days of psychological services, 1.5 reading specialists, and 2.5 days of social worker services, 1 speech language pathologist, 1 math interventionist, 4 special educators, 1.5 physical education teachers, .5 Adaptive Physical Education teachers, .5 ELL teacher, 6 teacher assistants, 2 part time KG assistants, 1 part time lunch monitor and 17 full time teachers for grades KG-5. The students also receive instruction in music, art and physical education.
Building Type: Elementary School Built 1889, renovated 1994 Gross Square Feet: 55,752 Current Replace Value: $7,591,400
Built 1961, renovated 1998 Gross Square Feet: 82,506 Current Replace Value: $16,411,200
Built 1954, renovated 2007 Gross Square Feet: 48,763 Current Replace Value: $9,762,600

2016 | Cumberland Comprehensive Plan | 5. PUBLIC FACILITIES AND SERVICES 91
The Garvin School The enrollment at Garvin Memorial School is approximately 400 students, of which 58 receive special education services. Staffing includes a principal, 1 building secretary, 2 custodians, 5 guidance counselors, 5 librarians, 5 psychologist, 8 speech therapist, 2 reading specialist, 1 nurse, and 1 day of social worker services, 1 math interventionist, 5 special educators, 7 teacher assistants, and 18 full time teachers for grades K-5. The students also receive instruction in music, art and physical education.
McCourt Middle School McCourt Middle School staffing includes a principal, 1 assistant principal, 2 school counselors, 1.5 secretaries, 3.0 custodians. 25.50 full time teachers, 1 math interventionist, 2 reading interventionist, 1 instructional technology coach, 1 speech therapist, 1 nurse, 1 school psychologist, .3 social workers, 7 special educators, 2.0 physical education teachers, 1 health educator, .6 ELL teacher and 5 teacher assistants. Currently, approximately 450 students are enrolled at the school of which 72 receive special education services.
North Cumberland Middle School North Cumberland Middle School serves students in grades 6-8 in the northern section of Cumberland, and is currently providing educational services to all students from predominantly JJM Cumberland Hill School and Community School. North Cumberland Middle School students are served by a professional staff of a principal, 1 assistant principal, 1.5 office secretaries, 3.0 custodians, 2 guidance counselors, 1.0 math interventionist, 1.0 reading interventionist, 32 full time teachers and 3 part time teachers, 1 nurse, 1 psychologist, .3 social worker, 3.7 physical education/health teachers, 7 special
educators, 1 technology coach, and 7 teacher assistants, all supporting a learning environment for the approximately 690 students at North Cumberland Middle School of which 72 receive special education services.
Built 1920, renovated 1998 Gross Square Feet: 33,122 Current Replace Value: $6,624,400
Built 1967, renovated 2002 Gross Square Feet: 71,079 Current Replace Value: $15,992,775
Built 1971 , renovated 1994 Gross Square Feet: 63,215 Current Replace Value: $14,223,375

2016 | Cumberland Comprehensive Plan | 5. PUBLIC FACILITIES AND SERVICES 92
Cumberland High School There are approximately 1400 students enrolled in grades 9-12 of which 209 receive special education services. The administration consists of a principal and two 2 assistant principals. Two Deans of Discipline work to improve student culture. Additionally, the faculty consists of 7 physical education/health teachers, 90 classroom teachers, 1 ELL Teacher, 1.2 speech therapist, 1 nurse, 2 librarians, 6 guidance counselors, 20 special education teachers, .4 social worker, 1.0 psychologists, 6.75 secretaries and clerks, 9.0 custodians, 15 teacher assistants, and 1 job coach.
Blackstone Valley Prep Mayoral Academy Public Charter Schools
BVP is an intentionally diverse network of tuition-free public schools chartered by the Rhode Island Department of Education (RI DOE). As a growing network that is part of the Charter School Growth Fund portfolio, BVP offers a high quality public school choice to the families of Central Falls, Cumberland, Lincoln, and Pawtucket and currently serves nearly 1,000 scholars in grades K-8. BVP's mission is to prepare every scholar for success in college and the world beyond.
BVP is home to a "commended" elementary school (only 9% of all schools in RI have earned this distinction from the RI DOE) and a "leading" middle school. Data from the New England Common Assessment Program shows dramatic results for scholars in both math and reading, on par with the best districts in the state.
Founded in 2009 with a team of nine staff members and 76 kindergarten students, Blackstone Valley Prep Elementary became the first mayoral academy in Rhode Island. Now in its fourth year of operation, Blackstone Valley Prep Mayoral Academy has grown
to three schools serving approximately 770 scholars. Growth thus far has been relatively slow and carefully calculated with a focus on program quality.
Motivated to do more, BVP plans to expand to offer another 2,100 seats. BVP will accomplish this by growing the three current schools to scale and opening the doors to an additional four schools by 2017-2018 for a total of three elementary schools and three middle schools feeding into one high school. This level of expansion will allow for greater saturation within the Blackstone Valley – specifically, within the four communities BVP currently serves. This means that by 2020, BVP will serve 15% of the students from the four sending communities in the Blackstone Valley.
Built 1961, renovated 2010 Gross Square Feet: 314,845 Current Replace Value: $76,750,000
Blackstone Valley Prep School
Kindergarten through 4th grade Built 1975, renovated 2013 Gross Square Feet: 35,500 Current Replace Value: $76,750,000
BVP Fatima (Elementary School)
Built 1975, renovated 2012 Gross Square Feet: 18,500; Modular Classrooms: 6,500

2016 | Cumberland Comprehensive Plan | 5. PUBLIC FACILITIES AND SERVICES 93
To expand with the best interest of the scholars served in mind, BVP must maintain the same rigorous academic program for which it has become known. To do so, BVP will need to be strategic around the additional resources provided to each of the school-level teams, as well as build the capacity of the network team that supports them.
While schools continue to grow to scale, a new BVP school will launch annually beginning in the fall of 2014 and ending in 2017. BVP Middle School 2 will open with grade 5 in August 2016. BVP Middle School 3 will opens with grade 5 in August 2017. Also worth noting: BVP Elementary
School 3 will launch with two grades (K-1) thus reducing the time required to reach scale. With all BVP schools launched by 2017, the BVP network of schools will be fully scaled by the fall of 2023 and serving more than 2,800 scholars.
Statewide Public Charter Schools
There are several statewide charter schools whose enrollment is open to any Rhode Island and Cumberland resident. An exhaustive list is not included in this Comprehensive Plan update. Some Cumberland students attend Beacon and Highlander charter schools.
Independent School and Education Programs
There are a number of educational programs in Cumberland providing services for pre-school, after school activities for school aged students, summer educational programs, as well as adult education programs and ESL programs. These programs are provided in Town through both for profit and not for profit entities concerned with providing Cumberland’s residents with lifelong learning opportunities. Several of these programs are described in detail below as well as a list of current Early Childhood Education programs.
Early childhood education had been a growing part of the holistic approach to education in Cumberland for many years. There are at least 13 early education programs operating in Cumberland today. In 2013, the Rhode Island Department of Education (RIDE) updated standards for the approval of pre-school and kindergarten programs. This document, entitled “Comprehensive Early Childhood Education Programs: Standards for Approval of Pre-School and Kindergarten Programs,” is available online at the Rhode Island Department of Education website. These updated standards set forth parameters for establishing early childhood education programs and an annual recertification process with RIDE. The Standards establish rules for Physical Facilities; Health, Safety, and Nutrition; Enrollment and Staffing; Staff Qualifications and Ongoing Professional Development; Administration; Curriculum; Child Assessment; and Family Engagement.
Blackstone Valley Prep Demand

2016 | Cumberland Comprehensive Plan | 5. PUBLIC FACILITIES AND SERVICES 94
Table 29: Cumberland Early Childhood Education Programs
Program Type Address Cumberland Kindergarten Schools Out Private 690 Nate Whipple Highway
MercyMount Country Day School Private 35 Wrentham Rd.
Emmanuel Nursery School Private 120 Nate Whipple Highway
Highland Child Care Center Private 1509 Mendon Rd.
Academy Little Children Child Care Center Private 35 Industrial Rd.
Neighborhood Nursery Private 2550 Diamond Hill Rd.
Paintbox Pre-School Private 321 High St.
Cherry Blossom Journey School Private 3191 Mendon Rd.
Four Corners YMCA Early Learning Center Private 160 Bear Hill Rd. Kids Play Private 1725 Mendon Rd.
Dr. Day Cares 200 Angell Rd.
The Cumberland Office of Children Youth and Learning Public 1464 Diamond Hill Rd.
Cumberland Pre-School Center at B.F Norton Public 364 Broad St.
Cumberland supports improvement of early childhood education opportunities for Cumberland residents. In the early childhood years, children develop the foundation upon which subsequent development in all domains of learning is built. These early years are crucial to a child’s healthy growth and development.
Office of Children, Youth, and Learning (OCYL) The Mayor’s Office of Children, Youth, and Learning is a service provider whose mission is to help foster a comprehensive learning environment for children in the first two decades of their lives while promoting civic engagement. OCYL programs serve more than 1,000 children annually, representing 20% of Cumberland’s preschool and school age population.
Highly engaging educational programs are primarily offered in three major initiatives. Early Childhood Education includes Art, Literacy, Music, Number Sense, and Science. Children engage in essential early learning experiences that are aligned with RI Early Learning Standards. Learning experiences are playful, developmentally appropriate, and skill based, setting a foundation for lifelong learning and school readiness. Teachers are RI Certified in classrooms with a low teacher/student ratio of 1:6-8.
The STEAMshop offers afterschool and summer learning in Science, Technology, Engineering, Art, and Math. Student centered learning opportunities involve exploring and creating with open-ended prompts using a variety of materials
and tools. Students are empowered to use their creativity and natural curiosity to ask questions, solve problems and continuously examine, interact with and interpret the world.
Backpack to Briefcase programs empower teens to take charge of their future. They give teens access to civic engagement opportunities where they are able to try out and develop various leadership roles, learn personal responsibility, and explore and prepare for college and career while becoming agents of change in their own lives. Programs include College and Career Readiness, unpaid internships and volunteer opportunities, a year-round Youth Commission, and the Cumberland Leadership Academy summer camp in partnership with the School District and Charter Schools.
OCYL participants

2016 | Cumberland Comprehensive Plan | 5. PUBLIC FACILITIES AND SERVICES 95
The OCYL is located in the three story former Novitiate building located behind the Public Library on the Monastery Grounds. The first floor houses two classroom spaces and registration desk, the second floor houses all preschool classrooms and a teacher resource room and the third floor houses offices, meeting spaces and workrooms. The entire building has access to technology whether in classrooms, meeting spaces, or offices.
OCYL would like to accomplish the following for the facility: an annual HVAC maintenance and repair plan, replacement of 40 vinyl windows, and efficiencies to decrease utility expenses determined by an energy audit. Additional future needs include replacing exterior doors, a preservation plan, and replacement plans for an aging boiler.
Project Learn Since 1985, Project LEARN’s mission has been to enable adult learners at all levels of literacy to acquire the knowledge and skills necessary to build strong families and to become effective members of the community. Classes are offered to those lacking basic reading skills or those seeking to earn their GED. Those with limited English skills may join an English as a Second Language class. Classes are held are in Woonsocket, Central Falls, and Cumberland. The program receives and annual allocation from the Town’s CDBG funds.
Project Learn keeps records of individuals who contact them with an interest in classes and notify them when class registrations are conducted in the fall, winter, and spring. Project Learn also receives student referrals from local businesses and other community based organizations. All students are administered a state mandated reading assessment which helps determine the class placement.
Project Learn is recognized for its work with learning-disabled students, including those with dyslexia. In order to ensure appropriate placement for each student, Project Learn has developed informal reading inventories and assessments that identify individuals who need a structured, multi-sensory reading program such as the Wilson Reading Program. Project Learn interviews candidates in depth to determine any barriers to participation and to review their personal history.
Performance outcomes for the Cumberland Adult Literacy Program are consistent with the requirements and goals of the Rhode Island Department of Education, Adult Education Division. Class participants are asked to set goals that include improved literacy skills, employment, job retention, GED achievement, entering post-secondary or job training.

2016 | Cumberland Comprehensive Plan | 5. PUBLIC FACILITIES AND SERVICES 96
Table 30: Cumberland School District Enrollment
School Name PK KG KF 1 2 3 4 5 6 7 8 9 10 11 12 SP Other Total
BF Norton Elementary
0 0 54 75 68 72 79 84 0 0 0 0 0 0 0 0 0 432
Garvin Elementary
0 0 58 66 69 68 64 71 0 0 0 0 0 0 0 0 0 396
Community Elementary
0 0 84 92 80 111 93 112 0 0 0 0 0 0 0 0 0 572
JJM Cumberland Hill
0 0 46 67 54 59 53 60 0 0 0 0 0 0 0 0 0 339
Ashton Elementary
0 0 43 39 43 38 43 42 0 0 0 0 0 0 0 0 0 248
Cumberland High
0 0 0 0 0 0 0 0 0 0 0 396 274 298 321 9 0 1,301
Joseph L. McCourt Middle
0 0 0 0 0 0 0 0 146 157 149 0 0 0 0 0 0 452
North Cumberland Middle
0 0 0 0 0 0 0 0 240 211 234 0 0 0 0 0 0 685
Cumberland Preschool Center
81 0 0 0 0 0 0 0 0 0 0 0 0 0 0 0 0 89
Outplacement Setting
27 0 4 5 9 10 6 3 11 7 10 17 9 9 17 3 0 147
Library
The Edward J. Hayden Library opened in 1975 at the Monastery site. The original building is a former Cistercian Monastery. The Library houses approximately 83,773 books and periodicals; 5,954 audio works; 10,390 DVDs; and 844 video games, toys, and puzzles.
The Library has 11 full-time staff including the Director, Assistant Director/Technology Coordinator, Administrative Assistant, Reference Services Coordinator, Adult Services Coordinator, Children’s Services Coordinator, Children’s Assistant, Young Adult/Reference Librarian, Circulation Supervisor, Technical Services/Homebound Librarian and Facility Manager. The Library also has 23 part-time positions.
The Cumberland Library is a member of the statewide library consortium, Ocean State Libraries, giving Cumberland patrons access to over 5.5 million items statewide. The Library also collaborates in purchasing digital books, which are accessible through the consortium’s RI Ezone website. There are currently over 45,000 titles available through a single vendor for download including ebooks, audiobooks, music and streaming video. Circulation of downloadable materials has increased steadily over the past four years.
In March of 2000, the Library opened an addition housing the Children’s Room, Circulation, and Adult Collections, giving the library a total of 55,210 square feet. The new addition gave the library more flexibility
The Town Library, 1464 Diamond Hill Road.
Source: Cumberland Scholl Department May, 2015.

2016 | Cumberland Comprehensive Plan | 5. PUBLIC FACILITIES AND SERVICES 97
for technology, incorporating 170 data drops as well as building-wide wifi. The original part of the building houses seven meeting rooms for use by the library’s programs, town departments, and local community groups. The Children’s Room has its own program room and the other library programmers use the available meeting spaces. There are seven PCs in the children’s room for public use. The second floor has a computer room with 10 PCs as well as an additional 10 machines for the public. The second floor also houses the local history room and three small rooms for quiet study. There is also a room for teens to gather and play video games, work on projects, or do other activities.
In November 2015 the Library received a Champlin Foundations grant to expand the Teen Center and add a family restroom to the Children’s Room. The Library also received a grant from the Rockwell Levy Foundation and the Cumberland Library Fund to update data cabling.
Library Goals and Objectives
Become a greener library The library already does a great deal of reducing, reusing, and recycling. They reuse paper for scrap, frequent the Resources for RI Education site for recycled materials for crafts, and recycle our paper and discarded books. They have also installed programmable thermostats throughout the building and motion sensor lights in restrooms. They took advantage of a program offered through RISE to install energy saving lights and ballasts at a discount to save even more energy dollars. They have also installed film on the windows to retain heat and prevent fading on the book covers and labels. The Library would like to continue this practice and investigate using solar power for our electricity. They have a large flat roof that is high enough to avoid any trees that would provide shade. Savings from solar power could be put into providing more programs and materials.
Create a Makerspace A makerspace is a place for library patrons to try new ideas and equipment. Examples include 3D printers, video and music editing, screen printing, conversion of old VHS, cassettes and vinyl records and craft classes. Possibilities include converting the library’s current computer room for this use, but for a larger space we would look at renovating the third floor of the old Monastery. This space would need extensive work to move duct work and electrical, but would provide a large area for an idea studio as described. Being able to hold about 200 people, it would provide ample room for computers, machines and classroom space. The Library’s computer room is now set to become part of the Teen Center.
Serve as an information Center for Small Businesses The library is ideally located and suited to convene education and information gatherings organized to strengthen Cumberland’s small business community, and to encourage small businesses to access databases and access business literacy training.
Senior Services
Twenty percent of Cumberland residents are seniors. Their number has increased from 6,473 in 2000 to 7,252 in 2010. Cumberland residents over 75 years make up 8.5% of the population.
Senior Center The Cumberland Senior Center opened in 1991. The Center provides a variety of services, including a reduced-price lunch program, senior van excursions, a pool room, a meeting room, a Town gazebo, and activities including art, exercise, education, and health.
There are five senior high rise apartments in Cumberland: Bear Hill, One Mendon Road, Chimney Hill, Riverside Village, and Flat Street. More than 500 seniors reside there.

2016 | Cumberland Comprehensive Plan | 5. PUBLIC FACILITIES AND SERVICES 98
Senior Center membership has grown steadily, from 603 in 2003 to 780 today. Many of these members serve as volunteers for the Center, which provides a rich variety of activities such as parties, day trips (Foxwood Bingo, Pawsox games, bowling, Mohegan Sun, shopping malls, museums, cinemas, and restaurants), longer trips (Atlantic City, Daytona Beach, Albany Tulip Festival, and the Thimble Islands), and regularly scheduled classes, programs and forums.
Ongoing Activities include the pool room, Busy Fingers, weight training, Hi-Lo-Jack, body and brain fitness, aqua aerobics, art class, free blood pressure screening, yoga,
bridge club, cribbage club, Scrabble club, movies & popcorn, strength training, fitness classes, table tennis, Bingo, meditation, Sunshine Club, and free notary public services. A variety of senior health and safety services are also available:
Vial of Life This CVS program has participants keep a plastic medicine bottle that contains a standard form with medical information (filled out by the participant) such as doctor's name, address and phone; medical conditions; and prescriptions. The bottle is kept in the right top shelf of the refrigerator. A magnetized sticker is placed on the outside door of the refrigerator to alert assisting parties of the medical information contained inside.
R.U.O.K. Program Seniors may provide information for an automated calling system that contacts the participant at a designated time; if the person does not respond, a police officer is dispatched to their residence.
Elderly Affairs Program Initiated in 1992 by the Cumberland Police Department, this program consists of an Elderly Affairs Officer/Police Senior Advocate who develops programs for education and protection of Cumberland’s seniors and serves as a liaison with social service organizations including the R.I. Department of Elderly Affairs.
Alzheimer’s Alert Program Participants register their name, address, and photograph with the Police Department so that they can be identified and returned home safely if they suffer memory loss
Lines for Life In 2002, the Cumberland Police Department distributed cellular phones programmed to dial only 911 to interested seniors.
Senior Services Goals and Objectives
Cumberland sees a need for more public transportation. RIPTA service is less extensive in suburban communities like Cumberland. Seniors need transportation for grocery shopping, medical services, occasional trips to the mall, and to get to and from the Senior Center. Those who are physically challenged or disabled present additional needs.
The Senior Center’s five-year plan also seeks funds for a part-time social worker, coordinating with Meals on Wheels, instituting a formal evaluation plan of the program and activities via an automated sign-in mechanism, and instituting a computer training program. They envision a new, bigger building in the future.
Senior Services, 1464 Diamond Hill Rd.


2016 | Cumberland Comprehensive Plan | 5. PUBLIC FACILITIES AND SERVICES 100
has become severely outdated and was not originally built to house the extent of administration, dispatching, operations, investigations, and detention/evidence that is currently required for daily operations.
The Town is designing and building a new public safety facility. The current Police Department headquarters is in violation of state and federal laws for compliance with the Americans with Disabilities Act (ADA) as well as fire codes. There is no public area in the police department, the restrooms are too small to allow entrance for wheelchairs, and the wiring in the building is so poor that half the lights in the building do not work. Another pressing problem for the department is that the salley port where handcuffed individuals are brought into the building for processing is not large enough to fit rescue vehicles and can barely fit current police vehicles.
A Space Needs Analysis was commissioned by the Police Department and the Rescue Department and conducted by Kaestle Boos Associates, Inc. in September of 2012 to determine what square footage would be needed for a new Public Safety Facility that would house the operations of the Police Department and Rescue Services. This study determined that a new combined Public Safety Facility would require 20,000 square feet for a main building and outside auxiliary storage facility. Voters approved a $12.5M bond referendum measure to fund the project. The proposed facility has an estimated project cost of $13,160,400. Included below is a rendering of one idea for what a new Public Safety Facility might look like given the square footage of the Kaestle Boos Associates report. The site of the new facility is to be at the site of the old police station, which will be dismantled, and has ample parking for future use.
Police Goals and Objectives
The most important goal is completing a new consolidated Public Safety Complex. Other goals include: maintaining CALEA accreditation through proof of compliance with standards; complying with new training procedures and the Homeland Security Act; and achieving any objectives in the Department’s five-year strategic plan that has not been implemented, including the recruitment of an additional police dispatcher and improving parking at the Police Department.
Cumberland Fire District
In 2015, Cumberland's previous fire districts (Cumberland, Cumberland Hill, North Cumberland, and Valley Falls) were consolidated into a single district, chartered as the Cumberland Fire District. The District is composed of four fire stations strategically located throughout the town. The Department consists of 52 people: 1 Fire Chief, 3 Deputy Fire Chiefs, 4 Captains, 12 Lieutenants and 32 Fire Fighters continuously manning 3 engine companies and 1 ladder company. The Department responds to approximately 4,600 alarms per year, and operates on a four platoon, 24-hour rotating schedule. The Department does not track turnout time or response time beyond the information maintained as part of the NFIRS reporting system. The total response area is 28 square miles, protecting 33,500 residents, as well as another 8,000 employees traveling into Cumberland on a daily basis.
Station 1, 555 High St Station 1 was once part of a thriving industrial area that included Central Falls and Pawtucket. Station 1’s response district covers a dense urban area which contains a variety of residential, commercial, industrial, and institutional sites. Notable among them are: the City of Pawtucket water treatment facility; the Providence and Worcester Railroad “Cumberland Switch” freight yard on whose rails are parked hazardous cargo including ethanol and other chemicals; several old mill complexes that have been subdivided into many small light industry uses; a nursing home; and the Cumberland Housing Authority’s eight-story One Mendon Road residential affordable housing for the elderly and disabled. The response district also responds to river distress calls on the Blackstone River, which is part of the Blackstone River National Heritage Corridor. Three members staff the Engine company and are assigned to this Station.

2016 | Cumberland Comprehensive Plan | 5. PUBLIC FACILITIES AND SERVICES 101
The Station 1 service area is nearly fully served by fire hydrants. In areas of the district that are not served by hydrants, the department relies on tanker task forces provided through a mutual aid agreement. Overall, the water supply distribution is reported to be good and the system in place is reliable.
Station 2, 1530 Mendon Road The Cumberland Fire District consists largely of historic mill housing, single family homes, multistory tenements, and commercial businesses. Locations presenting unique challenges include: a National Grid LNG facility (high pressure transmission line); light industrial occupancies; and the Boys and Girls Club. The Martin St industrial complex includes manufacturing, warehousing and the rehabilitation of a four story complex into high quality offices. A construction facility also has its regional headquarters on Martin St. A regional asphalt company and site developer occupies over 45 acres of quarry and asphalt processing equipment on Mendon Road, operating 24 hours a day during the paving season.
The easterly side of this service area includes the Monastery property, occupying 530 acres of nature land, with walking trails, scenic overlooks. The response district also covers the Blackstone River, part of the Blackstone River National Heritage Corridor. Interstate Route 295 traverses the District, a major trucking transportation route, requiring preparation in the event of an incident involving hazardous waste.
The Station is assigned a Ladder Truck and a brush truck, the normal shift staffing of three firefighters allows only the Ladder Company to be in service all the time. The other apparatus are in reserve available to be deployed in the event of a significant incident by off-duty personnel who must be recalled back to duty at overtime compensation. The call firefighters are part-time paid employees who respond to augment full-time personnel for significant incidents. They are not dispatched to respond directly to each incident.
Station 4, 3502 Mendon Road The response district is approximately eight square miles and serves 11,000. This area includes historic mill housing, several residential developments from the 1940s, 50s, and 60s, a 1990’s residential development that incorporated truss construction, a number of recently-built single-family homes and some multifamily residences. The north end of the district is occupied by an industrial park consisting of Cumberland’s largest buildings, densely occupied by daytime employees. Most recently, multistory high-end, low density residential is being developed.
Some locations present unique challenges, including a quarry that uses explosives and extreme heavy equipment as well as an industrial park that manufactures, stores, and distributes pharmaceuticals, text books, and medical supplies. Additionally, within the district are four high-rise type housing buildings for the elderly, three of which are six stories, and the House of Compassion which houses special needs tenants. The response district also covers the Blackstone River. This service area is nearly fully served by fire hydrants. In areas of the district that are not served by hydrants, the department relies on tanker task forces provided through a mutual aid agreement. Overall, the water supply distribution is reported to be good and the system in place is reliable.
The station is staffed with an Engine company staffed by three firefighters continuously, as well as having a reserve engine, a brush truck and the air supply trailer housed in the building. The auxiliary apparatus are manned by callback personnel, or as additional response vehicles with assigned personnel.
Station 4 is also designated as the headquarters station, housing the Fire Chief, the Deputy Fire Chiefs, the Fire Prevention office, and the tax office which generates and collects the funds for the operation of the independent Fire District.
Station 5, 55 Arnold Mills Road The District serves an area of approx. 10 square miles and 8,100. The area consists of a mix of older single-family residences, some multistoried tenements, and newer single family homes. This district is probably the least industrialized in Cumberland, but nevertheless presents unique challenges, including: an

2016 | Cumberland Comprehensive Plan | 5. PUBLIC FACILITIES AND SERVICES 102
industrial park that includes a stone-cutting facility; numerous trucking companies and a wire manufacturing facility; three nursing homes (including the 98 bed Mount St. Rita Health Center) and faces the most significant wildland-urban interface problem in the Town. The town-owned Diamond Hill Park is the site of numerous events in the summer with large volume turnout of guests and residents attending.
The on-duty members staff an engine company and have a ladder company (quint), and brush truck. The auxiliary apparatus are manned by callback personnel, or as additional response vehicles with assigned personnel.
Approximately seventy-five percent of the district is served by fire hydrants. In areas of this service area that are not served by hydrants, the department relies on tanker task forces provided through a mutual aid agreement, The water supply situation is relatively good and the hydrant system is generally reliable.
Rescue Services
The Town has two rescue companies. One is located in Ashton next to the Ashton Fire Station on Mendon Road; the other is located at the Valley Falls Fire Station. The rescue companies operate a total of four vehicles, two of which are fully telemetry capable for direct communications with area hospitals. Both frontline ambulances are equipped with four-wheel drive for rough and off-road rescue as well as severe weather use. In addition, there is a dive rescue team.
Rescue Services is staffed with 20 personnel, all of whom are trained at the paramedic level. The equipment types are as follows: Two frontline pieces; one 2013 F-450, one 2015 F-450, and one spare
vehicle, a Ford E 450. The department also has a 2004 Ford Expedition designated as a non-transport ambulance and a 2015 Ford Explorer assigned to administration and recognized as another non-transport vehicle for the department.
Water Supply
The Cumberland Water Department (CWD) services 22,300 Cumberland residents. The remainder are served by the Pawtucket Water Supply Board (PWSB).
CWD services and maintains five water storage tanks with a total storage capacity of 11 million gallons. CWD obtains water from five sources of supply, the largest being the PWSB. On average, approximately 2.6 million gallons of water per day are distributed, with a peak daily rate of 6 million gallons. The peak daily demand has historically been as high as 7 million gallons per day but has declined over the last several years in part due to the loss of several large commercial/industrial customers.
Sources The public water supply for the Town of Cumberland is drawn from gravel packed wells, Sneech Pond Reservoir, the Pawtucket Reservoir, and Woonsocket Reservoir. The existing interconnection between Cumberland and Woonsocket is located adjacent to 2100 Highland Corporate Drive, and is designed to deliver up to 2 million gallons per day (MGD) once the upgrades have been made to the Woonsocket
The Rescue Department Located at 1512 Mendon Rd.
Water Treatment Plant, 76 Nate Whipple Highway

2016 | Cumberland Comprehensive Plan | 5. PUBLIC FACILITIES AND SERVICES 103
system that coincide with a new station being constructed. The existing station operates as a source of supply up to 0.36 MGD. The location on the new metering station is at the intersection of Mendon Road and the exit side of Highland Corporate Drive.
Water is distributed via the CWD and the PWSB. CWD provides water service to customers north of Marshall Avenue, while the PWSB owns and operates the water distribution system south of Marshall Avenue. The PWSB sources consist of a series of surface water reservoirs located within the Town of Cumberland. The water supply and distribution system is illustrated in the accompanying Public Facilities Map; Table 317 lists sources, yield, and capacity of CWD’s water supply. Capacity is defined as the amount of water which an individual site is either permitted for or capable of producing. Yield is the amount of water which is actually produced at an individual site based on an annual average.
Table 31: Sources of Water Supply for Cumberland
Description Operating
Status Type
Yield (MGD)
Capacity (MGD)
Manville #1 Active Gravel-packed 0.43 1.0
Manville #2 Active Gravel-packed 0.37 1.0
Abbott Run #1 Active Gravel-packed 0.0
Abbott Run #2 Active Gravel-packed 0.0
Abbott Run #3 Active Gravel-packed 0.30 0.64
Sneech Pond Active Filter Plant 0.88 1.2
Marshall Ave. Active PWSB
Connection 0.32 4.5
Highland Corporate Drive Active Woonsocket Connection 0.36 2.0
Total 2.66 12.3
Source: Superintendent of Cumberland Water Department, 2016
Two of Cumberland’s wells are currently inactive. The Lenox Street well was taken out of service in 1979 due to organic contamination. The Martin Street well was taken out of service in 1970 due to volatile organic chemicals and high iron and manganese levels. The Abbott Run well site is comprised of three wells. Abbott Run #1 was taken out of service in 1985 when Abbott Runs #2 and #3 were installed in 1985. Abbott Run #1 had experienced a diminished yield due to the collapse of the well screen. CWD is in the process of reactivating Abbott Run #1, all required permits have been acquired, a new liner screen, pump and motor have been installed, piping upgrades within the building will be completed this year and the well be replaced to service. Abbott Run #1 being returned to service will increase the yield at the site by 0.20 MGD.
Water Consumption CWD provides service to residential, commercial, industrial, and governmental users. Residential use consumes by far the most of the water supply (81% percent). The chart below shows water consumption by category in 2013.

2016 | Cumberland Comprehensive Plan | 5. PUBLIC FACILITIES AND SERVICES 104
2013 Water Use by User Category
0%
20%
40%
60%
80%
100%
Residential Commercial Industrial Government
Residential
Commercial
Industrial
Government
Source: Superintendent of Cumberland Water Department, 2014
Average Daily Demand The adequacy of water supply is determined by its ability to satisfy average daily demand (ADD), and is determined by the amount of water which is consumed within a distribution system over a 24 hour period. All water which is consumed by residential users over a 24 hour period is considered the residential average day demand. Average daily consumption per resident is expressed in gallons per capita per day (GPCD) and is calculated by dividing the residential average day demand by the estimated population served. Over the past decade, CWD’s average GPCD has ranged from 75.9 to 62.6. CWD encourages water conservation through public education, availability of water conservation kits and use of an inclining block rate for water consumption, all of which contribute towards attaining the goal of 60 GPCD for the water system. As previously mentioned, residential use accounts for the majority of water consumption; a more detailed analysis of residential water use can be seen in the following table.
Table 32: Residential Water Use in Cumberland 2004 – 2013
2004 2005 2006 2007 2008 2009 2010 2011 2012 2013 AVG
Annual Use* 474 529 597 614 561 596 527 523 526 492 543.9
Average Daily Use* 1.30 1.45 1.64 1.68 1.54 1.64 1.44 1.44 1.44 1.35 1.49
Service Connections 7292 7434 7751 7820 7867 7864 7906 7914 7742 7856 7745
GPCD 62.7 68.1 74.4 75.8 71.2 75.9 66.5 64.3 67.6 62.6 68.9 *in millions of gallons (MG)
Source: Cumberland Water Department, 2014
The original Comprehensive Plan forecasted water demand from 1990 to 2010 in order to determine the adequacy of the water supply. These predictions were based on the population forecasts conducted in the 1991 Plan. As previously noted, population has increased at a higher rate than predicted. The following table compares actual water use in 2010 to previous estimates. Daily water consumption in 2010 exceeded the previous Plan’s estimate by over 1,000,000 gallons.
Table 33: Comparison of Predicted to Actual Water Use
2010 Water Use 2010 Estimate 2020 Estimate
Poulation 33,557 31,740 35,265
Population Serviced 22,497 21,321 24,012
Daily Water Use (G) 2,697,254 1,599,070 2,039,972
Source: Cumberland Water Department, 2014
The 1991 Plan also forecasted increases in industrial and commercial water use; these were predicted to increase at a rate of one percent per year based on historical water use records for land uses in those categories. Instead, water use in these categories has actually declined over the past decade. In 2010 combined

2016 | Cumberland Comprehensive Plan | 5. PUBLIC FACILITIES AND SERVICES 105
industrial, commercial, and governmental average use was just 0.23 MGD, a decrease from 0.45 MGD in 1987 (2000 estimate was 0.51 MGD).
The long range plan of the Cumberland Water Department is to become totally self-sufficient, meeting 100% of the average daily demand with water coming only from wells located in Cumberland and operated by the Cumberland Water Department. CWD will achieve this through upgrades to its existing wells and pumping facilities as well as construction of new production wells within the Town. Cumberland has used water supplied by the PWSB for many years due to the inability of Cumberland owned and operated facilities to meet the average daily demand for our users. The Table below indicates annual costs of the Pawtucket water supplied to the system from the years 2005 – 2012. While the cost has varied considerably from year to year, the average cost for the period has been $1.3 million per year. CWD has found that for each additional 100 gallons per minute (GPM) which is produced at the existing well sites, there is a savings of $200,000.00 per year from water that is either purchased from the PWSB or produced at the Sneech Pond Water Treatment Plant.
Table 34: Annual Cost of Water Supplied by Pawtucket to Cumberland
Year Cost of Pawtucket Water Supply Provided Water
Percent Change from Previous Year
2005 $1,269,678.69 -
2007 $1,607,158.73 +27%
2008 $1,823,683.49 +13%
2009 $1,415,765.84 -22%
2010 $1,448,989.98 +2%
2011 $1,156,337.27 -20%
2012 $524,724.33 -55%
Source: Superintendent of Cumberland Water Department, 2014
Maximum Daily Demand This measure is used to determine the adequacy of the peak capability of pumping and transmission facilities. The maximum daily demand (MDD) is the largest volume of water used over a single 24 hour period. It is determined from water use records and is expressed as a ratio of the average daily use. Generally, maximum daily demand, ranges from 1.4 to 2.0 of the average daily demand, according to the American Water Works Association. In the year 2013 the maximum daily demand was 1.9 times the average daily demand. The table below illustrates the ADD, MDD, and the ratio between the two over the last 10 years.
Table 35: Maximum Daily Demand to Average Day Demand
2004 2005 2006 2007 2008 2009 2010 2011 2012 2013 AVG
MDD (MGD) 5.3 5.2 5.8 5.2 5.5 5.4 4.6 5.2 4.5 4.4 5.11
ADD (MGD) 2.65 2.66 2.81 2.76 2.96 2.63 2.69 2.34 2.30 2.3 2.61
Ratio 2.0 2.0 2.1 1.9 1.9 2.1 1.7 2.2 2.0 1.9 2.0
Source: Superintendent of Cumberland Water Department, 2014
Water Supply Issues
In 1991 CWD’s average daily capacity of 3.36 MGD was not capable of meeting the maximum daily demand of 4.29 MGD. Capacity of the water supply has been increased to 9.36 MGD, greater than the maximum daily demand of 7 MGD, and is 3.5 times greater than average daily demand. However, this increase in capacity was accomplished by
A historic reservoir map

2016 | Cumberland Comprehensive Plan | 5. PUBLIC FACILITIES AND SERVICES 106
increasing reliance on water purchased from the Pawtucket Water Supply Board. As population increased, the associated demand for increased water may further stress the water supplies.
Issues identified in the previous iterations of the Plan relating to fire flow deficiencies in industrial areas have since been resolved due to reinforcement of the distribution system. The 1991 Plan stated that the water level in the Copper Mine tank lagged behind the low service tanks due to insufficient pipe capacity between the high and low service areas, this would be increased if a proposed connection to Woonsocket was implemented in the high service area, and that new sources of supply would be best located in the low service area where they are most needed. The construction of the connection to Woonsocket began in 2010 and completed in 2014. Increased production at the Manville and Abbott Run well sites has led to increased service levels throughout the distribution system.
CWD has experienced increased demand in the northern section of its service area, roughly from Interstate 295 northwards, and decreased demand in the southern section of its service area over the last 10 years. This geographical shift in water consumption has driven the need for additional sources of supply in the northern section of the service area which has been partially achieved through both the increased yield at the Manville and Abbott Run well sites and the completion of the connection to the City of Woonsocket. The Marshall Avenue pumping facility is adequate to service the southern end of the distribution system however inadequate piping prohibits the transmission of water to the northern section. CWD has entered into a consent agreement with the Rhode Island Department of Environmental Management (RIDEM) to eliminate the discharge of filter backwash and sedimentation basin decant water to Sneech Pond at the Sneech Pond Water Treatment Facility or attain compliance with the terms of the facilities RIPDES permit by 2016.
CWD is actively pursuing the exploration of new well sites at several Town-owned properties within the northern section of its service area with the ultimate goal of closing the Sneech Pond Water Treatment Plant and the use of purchased water from the PWSB or the WWD to be supplemental for maximum daily demand or emergency use only. Extensive 2 ½ “ test well work has been completed at the Franklin and Schofield Farm well sites and CWD will be moving forward with the long term pumping tests at the two sites.
In 2005, 29 percent of the total volume supplied was non-account use. In 2011 CWD completed the installation of a fixed base automatic meter reading system and a system wide water meter replacement project. Non account use water in 2012 had decreased to 13.4% and then increased slightly to 15.5% in 2013. CWD believes that the increase in non-account use water was due to production meter error and in 2014 all production meters where tested and calibrated restoring their accuracy within the acceptable range.
The distribution piping is generally well looped; however, there are some areas which consist of small diameter pipe, much of which is unlooped. A looped system is more reliable and is preferred over a dead-ended system, since looped pipe can supply water for consumption and fire protection from more than one direction and it also prevents water from stagnating as may occur in a dead-ended pipe where circulation is limited. This is especially important in Cumberland where high levels of iron and manganese exist in the groundwater sources. Stagnation of water allows these constituents to come out of solution. This precipitate will become re-suspended when flushing hydrants, resulting in numerous consumer complaints. In the past decades progress has been made in improving looping of the water system.
From 2005 to 2013 the Cumberland Water Department has initiated many capital improvement projects to increase the capacity and efficiency of the system as demand for water has grown. In 2007 CWD implemented a $2 million dollar upgrade of the Water Treatment Plant which eliminated a 2005-2006 TOC Violation and brought many of the unit treatment processes up to current standards. In 2007 CWD also completed its first year of system wide unidirectional flushing. In 2009, The Town Council approved borrowing of $5.75 million from RICWFA to complete an interconnection with the City of Woonsocket, cleaning of water mains on Diamond Hill Road, Hillside Road and Mason Drive, system wide replacement of water meters and installation of a fixed antenna automatic meter reading system (AMR). This contract

2016 | Cumberland Comprehensive Plan | 5. PUBLIC FACILITIES AND SERVICES 107
was awarded in 2010 and work began in 2010. In 2011 reconditioning and repair of the Manville wells resulted in a 28% increase in production at the site. In 2012, reconditioning and repair investments made at Manville and Abbot Run well sites result in an annual yield of 377 million gallons, an overall increase of 36% from the previous year. These infrastructure improvements have allowed the Water Department to keep pace with increasing demand.
Future plans for improving Cumberland’s water supply include:
2016
• Council awards contract to R.P. Iannuccillo & Sons Construction for the Fisher Road Water Storage Tank Replacement and work begins on the project.
• CWD will advertise bid specifications for upgrades to the Girard Road pumping station and begin work upon approval of the contract by the Town Council.
• CWD employees complete piping upgrades at the Abbott Run well site allowing Abbott Run #1 will be returned to service increasing the site’s available yield by .20 MGD.
• CWD will begin working towards the full automation of its pumping and storage facilities, reviewing purchase and lease options for implementation.
• Installation of emergency generators is completed at the Girard Road Booster Station, Manville and Abbott well sites allowing CWD to adequately supply its customers with potable water and fire protection during prolonged power outages.
• CWD will advertise for requests for proposals of the design, bidding assistance and construction services for the new production wells at Franklin and Schofield Farms upon receipt of wetlands and withdrawal permits from RIDEM.
• Design of the new production wells at Franklin and Schofield Farms will begin upon Town Council approval and CWD will work with all stakeholders to develop appropriate designs of the new facilities.
• CWD will submit its fully updated Water Supply System Management Plan (WSSMP) to the Rhode Island Water Resources Board.
• CWD will submit a 20 year Infrastructure Replacement Plan (IFR Plan) with the WSSMP outlining the future needs of the department.
• Construction of the new Fisher Road Water Storage Tank and associated upgrades is completed.
2017
• CWD will advertise bid specifications for new production wells at Franklin and Schofield Farm sites and begin construction upon Town Council approval.
• CWD will continue working towards the full automation of its pumping and storage facilities.
• CWD will work towards purchasing properties which will enhance watershed protection for sources of supply.
• CWD will work towards replacing critical infrastructure within the distribution system.
• Construction of new production wells will be completed at the Franklin and Schofield Farm sites and will be placed in service upon RIDOH approval.
2018
• CWD will work towards replacing critical infrastructure within the distribution system.

2016 | Cumberland Comprehensive Plan | 5. PUBLIC FACILITIES AND SERVICES 108
• CWD will advertise bid specifications for upgrading the transmission main from the Manville Well sites to the Girard Road Booster Station and begin work upon Town Council approval.
• CWD will continue to work towards increasing total system capacity through upgrades to existing interconnections with other systems.
• CWD will continue working towards the full automation of its pumping and storage facilities.
• CWD will advertise bid specifications for a new transmission and distribution facility and begin construction upon Town Council approval.
2019
• CWD will advertise bid specifications for upgrading the transmission main between the Girard Road Booster Station and Mendon Road and begin construction upon Town Council approval.
• CWD will advertise bid specifications for the rehabilitation of the Highland Park Water Storage Tank.
• CWD will continue working towards replacing critical infrastructure within the distribution system.
• CWD will continue working towards the full automation of its pumping and storage facilities.
• CWD will upgrade the pumping equipment and associated piping at the Manville Well sites to allow for more flexibility and redundancy at the sites.
2020
• CWD will begin and complete the rehabilitation of the Highland Park Water Storage Tank upon Town Council approval.
• CWD will continue working towards replacing critical infrastructure within the distribution system.
• CWD will complete the full automation of its pumping and storage facilities.
• CWD will advertise bid specifications for the purchase and installation of an emergency generator at the Angell Road Booster Station and begin work upon Town Council approval.
2021
• CWD will continue working towards replacing critical infrastructure within the distribution system.
• CWD will submit permit applications for new production wells at the Abbott Run and Manville well sites.
• CWD will evaluate the need to move forward with the construction of a residuals handling system at the Sneech Pond Water Treatment allowing for the plant to become a seasonal redundant source of supply.
• CWD will move forward with the residuals handling system at the Sneech Pond Water Treatment Plant and advertise bid specifications if the evaluation proves to be beneficial for the water system.
Protecting the quality of CWD water resources There is always an interest in protecting the CWD’s present and future water sources from potential degradation and contamination. The CWD continues to pursue the acquisition of strategically-located properties. Consideration also should be given to enacting overlay zoning districts in areas within watersheds or zones of contribution that where certain land uses could jeopardize CWD and Pawtucket Water Authority water supplies. For this and additional reasons, Pawtucket might be approached about having a Cumberland representative on its Board of Directors.

2016 | Cumberland Comprehensive Plan | 5. PUBLIC FACILITIES AND SERVICES 109
Emergency water system At one time, the Towns of Cumberland and Lincoln were interconnected in order to provide a back-up water supply in the event of an emergency. Both communities might want to revisit whether this infrastructure may have future value.
Conservation The Cumberland Water Department (CWD) is equipped with tools to encourage water conservation throughout the town. CWD has educational programs designed for the public at large and elementary schools, distributes water-saver kits, and free leak surveys for its customers. CWD is also updating their website to include irrigation data to inform customers of efficient outdoor water use practices. Commercial, industrial, and large residential customers are offered these same services. In the case of drought, CWD will also use its Drought Response Plan to inform the public.
Sanitary Sewer
Inventory The Town has a municipally owned and operated wastewater collection system that is connected to three Narragansett Bay Commission (NBC) interceptors. The Blackstone Valley Interceptor follows the Blackstone River from the Woonsocket City line, the Abbott Run Valley Interceptor serves eastern Cumberland as far north as Interstate 295, and the Highland Industrial Park Interceptor that runs from the industrial park along the Blackstone River each convey the wastewater to treatment facilities at Bucklin Point. The NBC jurisdiction encompasses all municipalities whose wastewater enters the Narragansett Bay.
The accompanying Water Supply and Sewer Services Map illustrates the areas in Cumberland that are currently provided with sanitary sewer service. As this figure demonstrates, approximately 33 percent of Cumberland's total land area has sewer service; this is roughly the same as 2003 when the Plan was last updated. This represents service for roughly 5,916 acres of land. The rest of the Town is serviced with Individual Sewage Disposal Systems (ISDS).
A Town ordinance requires ties-ins to the sewer system, however, this ordinance is not often enforced. The Town should consider strengthening this ordinance. If a property can be serviced with an ISDS, perhaps this should be encouraged rather than tie-ins and extensions to the sewer system, which may in turn result in the development of more land for residential purposes as well as the reduction of water available for recharge to aquifers.

2016 | Cumberland Comprehensive Plan | 5. PUBLIC FACILITIES AND SERVICES 110
Table 36: Summary of Sewer Needs
Source: Cumberland Sewer Department 2016
In 1983 a Facilities Plan was prepared for the Town, and was updated in 1993. This Plan examined the wastewater disposal needs for all areas in the Town. In this study, a priority ranking for areas to be sewered was developed based on soil conditions, septic system failures, and land use densities. The table below lists these areas and their priority ranking from each of the two plans, and now reflects several areas that were prioritized in previous iterations of the Town Comprehensive Plan which have since been completed.
Sewer Issues The Cumberland municipal wastewater system is approaching capacity with a few densely-developed areas slated for extensions in the next few years. Further expansion will be very expensive and not achieve the economy of scale of previous phases. Such extensions should be very carefully planned, and areas with little capacity for ISDS systems should be discouraged from over development, especially if located within watersheds containing public water supplies.
The Step I - Facilities Study for the Cumberland Sanitary Sewer program and its 1993 reaffirmation identified areas where sewer service should be provided. Sanitary sewer extensions attract considerable attention and deliberation by town officials and residents because most of Cumberland’s land area is located within watersheds or “zone of contribution” of sources of municipal water supply. The Town should be extremely cautious in planning sanitary sewer extensions. Priority should be given to siting extensions in those areas where septic systems are likely to have the most adverse impact to public health.
There are no immediate plans to expand Cumberland’s sanitary sewer system. Wastewater management alternatives such as on-site wastewater treatment (OWTS) or individual septic systems, and water conservation should therefore be encouraged.
Number Area Name 2004 Need 2016 Need 1 Valley Falls High Completed 2 “ “ High Completed 3 England Street High Completed 4 Marshall, Alan, Pocasset Aves. High Completed 5 Ashton-Berkeley High High 6 “ “ Low Low 7 Angell Road Moderate Moderate 8 Monastery Heights Moderate Moderate 9 Chapel Area Moderate Completed 10 Orchard Drive Moderate Moderate 11 Lippitt Estates Low Low 12 Broadview High Completed 13 Industrial Park Moderate Completed 14 Diamond Hill Road (remaining) Moderate Moderate 15 “ “ Low Low 16 “ “ Moderate Moderate 17 “ “ Low Low 18 Arnolds Mills Low Low 19 “ “ Low Low 20 “ “ Low Low 21 Diamond Hill Low Low 22 “ “ Low Low 23 Cumberland Hill (remaining) High High 24 Rolling Acres (remaining) High Completed 25 West Sneech Brook High Completed 26 “ “ Moderate Moderate 27 West Sneech Brook Moderate Moderate 28 Forest Dale High High 29 “ “ High High

2016 | Cumberland Comprehensive Plan | 5. PUBLIC FACILITIES AND SERVICES 111
Energy
Clearly, when it comes to climate change, the best policy is “think globally, act locally”. The Town government, schools, businesses, industry and individuals should be doing all they can to reduce carbon-emitting energy consumption and increasing reliance on renewable energy, including hydroelectric sources. The State requires that this portion of the plan include “goals that embody the state’s goals for energy and policies to support each goal”; “actions that address assessing amount of energy being used or if assessment is already complete, include actions that address conserving and efficiently using energy”; and “actions that address zoning policies and siting standards for renewable production facilities.”
As of 2010, 90% of Cumberland homes used natural gas or oil. From 2000 to 2010, there was an increase in the use of utility gas and a decrease in fuel oil and electricity.
Table 37: Home Heating Fuel, by type 2000 and 2010
Fuel Percent Occupied Units (2000) Percent Occupied Units (2010)
Utility gas 46.5% 52.9%
Bottled, tank, or LP gas 1.8% 0.7%
Electricity 5.6% 4.6%
Fuel oil, kerosene 45.7% 40.6%
Coal or coke 0.0% 0.0%
Wood 0.4% 0.8% Solar energy 0.0% 0.0%
Other fuel 0.2% 0.2%
Source: 2000 U.S. Census and American Community Survey 2010 5-Year Estimates
The Town recently began partnering with the Office of Energy Resources (OER) through the Rhode Island Public Energy Partnership Program (RIPEP) to analyze current energy usage in Town owned facilities and assess the possibilities for funding energy efficiency projects to reduce consumption. The RIPEP process allows communities to work with the State and National Grid to analyze energy use and fund energy efficiency projects in town owned building through “on bill financing”. Below are two graphs showing energy use in certain town owned buildings that were compiled in order for the town to narrow down its selected building for the scoping studies.

2016 | Cumberland Comprehensive Plan | 5. PUBLIC FACILITIES AND SERVICES 112
Energy Use Intensity and Energy Cost per Square Foot by Building
0
50,000
100,000
150,000
200,000
250,000
Building Average Energy Use Intensity, 2010-2012
Source: RIPEP 2014
Town Sustainability Efforts While much has been done to make municipal and school buildings more energy-efficient, a fresh perspective should be considered, including Town officials working with the RI State Energy Office and the Rhode Island Commerce Corporation to fund renewable energy and energy efficiency projects in which financing could be leveraged by anticipated cost savings from the reduction of use or production of energy. The Conservation Commission could play a role here, working with Town staff. Street lighting is a classic opportunity, where the Town purchases the lights and poles from National Grid, financed through a non-profit third party, retrofits light elements with LED’s, installs directed light “dark sky” fixtures, and ends up paying less and consuming less. New development would also be held to the similar lighting specifications, as well as LEED green building design standards.

2016 | Cumberland Comprehensive Plan | 5. PUBLIC FACILITIES AND SERVICES 113
Renewable Energy Wind, solar, geothermal, and hydroelectric energy generation technology has advanced to the point that small or moderate scale installations are now becoming viable investments for home owners, businesses, government, and owners of vacant or potentially developable sites. Cumberland should be open to such energy sources to reduce carbon emissions, make Rhode Island more energy sustainable, and help save the planet from climate change.
With appropriate siting and vegetative buffers, it is possible to mitigate the impact of solar installations. The Zoning Code and Land Development Regulations at present do not allow commercial solar production installations, and should. The Code and Regulations should create standards for screening or assimilating this architecture as much as possible into the surrounding neighborhood fabric.
It would appear that such installations should be sited in Industrial zones and on institutional, Commercial, and Residential sites only if appropriate in scale and context-sensitive to the fabric of the surrounding neighborhoods. Agricultural-zoned land might be considered if the Town believes the value of renewable energy outweighs the value of the capacity to generate locally-grown produce and other agricultural products. It would be inappropriate for land to be cleared of vegetation to create a pad for a solar installation.
The Town should pursue accessing locally-generated solar power at a rate lower than market, and/or locating its own solar energy installations on institutional sites, where appropriate.
Smaller-scale solar panel installations for homes and businesses should be context-sensitive, not out of scale for the property, and regulated so that most if not all electricity is consumed on site. All solar energy installations, regardless of scale, will still need to meet dimensional regulations and other performance standards necessary to protect public health, safety, or welfare.
It is recommended that solar energy facilities be regulated in a tiered system based on the area of the proposed facility and the rated energy capacity. The Zoning Code and Land Development Regulations should define Solar Energy Systems as “Major”,” Medium”, and “minor”.
Solid Waste & Recycling
The Town provides solid waste and recycling pick-up services through a private contractor who collects and hauls solid waste and recyclables to Rhode Island Resource Recovery in Johnston. While service is generally available to residential dwellings with four or fewer units per buildings, a number of condominium communities also receive town trash and recycling collection services. Commercial properties contract on their own a private company to handle their trash and recycling needs.
Cumberland also provides a yard waste collection program with its contracted hauler and provides a yard waste dumpster and a drop off for scrap metal and rigid plastics at the Town highway garage facility during the summer months. This is critical keeping the Town’s tipping fee tonnage down.
Rhode Island Resource Recovery offers a special municipal rate for disposal of solid waste and has placed a cap on the amount of solid waste the Town may dispose of at a subsidized rate $32 per ton. This cap is adjusted annually, and is currently 10,172 tons for FY2016 down from 10,224 for FY2015. Solid waste exceeding the cap allotment then is charged a higher tip fee. The goal of the Town is not to exceed the yearly cap allotment. Municipal tip fees are expected to increase in FY17.
In order to minimize solid waste tip fees, Cumberland has taken aggressive actions to reduce solid waste generation and has implemented a number of new programs to achieve this goal. The Town hired a part-time Recycling Coordinator to educate and implement recycling programs to residents and municipal employees. Beginning January 2013, the Town also started an automated Recycling collection program and

2016 | Cumberland Comprehensive Plan | 5. PUBLIC FACILITIES AND SERVICES 114
distributed larger recycling carts to all serviced under the Town program. These larger carts allow for greater recycling capacity which is needed as the State now allows more plastic containers to be accepted in the Recycling program.
Recycling awareness has improved at all public schools. All schools recycle in their lunchrooms and classrooms, and in 2015 started a food scrap collection program in addition to recycling, reducing waste even further. Cumberland High School was awarded a State Recycling Award in May 2014. Increased recycling knowledge and awareness has helped the Town currently recycle 3,799 tons during FY15 reach a Recycling Rate of over 27.2%, which is the highest rate to date.
The Town can also divert additional waste from the solid waste tonnages in a variety of other ways. This includes educating residents on using community drop offs, taking part in one-day recycling events, and recycling at parks and Town events. These recycling options have assisted in reducing the Town’s yearly municipal solid waste amounts. Further, starting a recycling program offered to commercial businesses would increase yields and add a new valuable service to Cumberland’s business community.
The town offers a variety of diversion programs to further reduce our municipal solid waste amounts. Diversions amounts are programs for items that can be recycled, but not in the standard recycle cart curbside pick-up program. Cumberland has seasonal drop offs in town for rigid plastic, yard waste, and scrap metal. This option is offered during our spring, summer and fall season at our town garage, and offer year round drop off for used motor oil at this location. Cumberland also offers a year round pick-up service through our contracted hauling company which assists our community in diverting white goods (appliances and large metal items). Additionally, collection boxes for the diversion of hard covered books, textiles are offered in various locations throughout the town. The town also started a food scrap diversion program in 2015 from 9 schools in our community and offer a mattress program for residents to divert and recycle their waste mattresses and box springs. Annually Cumberland hosts an Eco-Depot collection through RIRRC for household hazardous waste and in 2016 also included e-waste. These programs have been very successful and helped our community in 2015 reach a recycling rate of 28.4% and an overall diversion rate of 35.1%. Finally, when it comes to municipal trash collection services, there is an ongoing need to increase recycling efficiency and discourage dumping of material unacceptable for curbside pickup.
Public Services and Facilities Goals
*See the Implementation Element for synopsis of Goals and Action Item implementation schedule, priority, and responsibilities. State Planning Act Goals related to public services and facilities include “Promote orderly growth and development that recognizes the natural characteristics of the land, its suitability for use and the availability of existing and proposed public and/or private services and facilities.”

2016 | Cumberland Comprehensive Plan | 5. PUBLIC FACILITIES AND SERVICES 115
Goal: Increase efficiency and sustainability of services.
Goal: Protect and enhance Cumberland’s public water and sewer facilities.
Goal: Increase recycling rate from 27% to 35% within 10 years.
Goal: Promote sustainability in energy production and use.
Public Services and Facilities Action Items
P1. Find location options and determine feasibility for a new Town Hall.
P2. Improve processing services, decision-making accuracy and transparency, and making clear permitting and land development petitioning process by digitizing important records, integrating records to a GIS-based system available on-line, and organizing Town archives to enable easy retrieval of important information.
P3. Determine whether the new consolidated Fire District should become a municipal entity.
P4. Conservation Commission is to study Town sustainability efforts, and make recommendations to the Planning Board and Mayor.
P5. Pursue acquisition of streetlights from National Grid, to include maintenance program that saves money and does not impact DPW staff. Use savings from streetlight acquisition to convert streetlights, including parking lot lighting, to LED and cut-off fixtures. Convert streetlights/parking lot lighting to cut off (“dark sky”) fixtures.
P6. Use savings from streetlight acquisition to convert streetlights, including parking lot lighting, to LED and cut-off fixtures. Convert streetlights/parking lot lighting to cut off (“dark sky”) fixtures.
P7. For new development, amend Zoning Code and Land Development & Subdivision Regulations to require cut off lighting on residential properties. Set standards for outdoor lighting to limit light pollution in scenic areas.
P8. Integrate LEED green building design standards and sustainable development practices into Town development regulations.
P9. Amend the Zoning Code to define solar energy production systems in the following tiered system: Solar Energy System, Major: An Active Solar Energy System that occupies more than 40,000 square feet of surface area (equivalent to a rated nameplate capacity of about 250kW DC or greater). Allow Major Solar Installations by special use permit in Industrial and Agricultural zones with specific performance standards for height, fencing and vegetative screening, lot coverage, preservation of agricultural top soil, signage, utility poles, removal, noise, bonding, removing existing vegetation, access. Solar Energy System, Medium: An Active Solar Energy System that occupies more than 1,750 but less than 40,000 square feet of surface area (equivalent to a rated nameplate capacity of about 10 - 250 kW DC). Allowed by special use permit. Solar Energy System, Minor: An Active Solar Energy System that occupies 1,750 square feet of surface area or less (equivalent to a rated nameplate capacity of about 10 kW DC or less). Minor Solar Installations on residential and commercial properties for the primary purpose of generating power for up to 125% used on site, providing performance standards are met.

2016 | Cumberland Comprehensive Plan | 5. PUBLIC FACILITIES AND SERVICES 116
P10. The Town should pursue accessing locally-generated solar power at a rate lower than market, and/or siting its own solar energy installations, where appropriate, on parcels or structures with institutional use. Historic areas such as Franklin Farm should be excluded.
P11. Enact a Watershed Protection Ordinance, creating a Water Quality Protection Zone.
P12. Enact a Waste Water Management District ordinance within the Cumberland and Pawtucket Reservoir Watershed to monitor and regulate septic system maintenance.
P13. Continue to acquire properties that are in close proximity to reservoirs and reservoir tributaries to protect public drinking water supplies for the future.
P14. Request that a Cumberland representative serve on the Pawtucket Water Authority Board.
P15. Re-establish emergency water system interconnections with Lincoln and Woonsocket.
P16. Update the water supply management plan, including an assessment and water conservation element.
P17. Manage and conserve essential potable water resources in times of emergencies and/or shortages
P18. Ensure adequate water supply for any new planned areas of growth
P19. Support major public water supplier demand management initiatives
P20. Identify locations for sanitary sewer expansion to service those areas where wastewater disposal needs cannot be met by individual on-site systems, and determine phasing schedule for installation.
P21. Reduce solid waste amounts, by improving existing recycling programs and initiating new diversion programs. Design Town composting program for yard waste and organics.
P22. Strengthen existing recycling education program for residents, Cumberland Schools and municipal buildings to improve recycling amounts and increase food scrap diversion for goal of waste reduction to reduce tipping fee costs.
P23. Ensure recycling is available at all community parks and events, and offer a variety of one day recycling events to educate and engender support for additional recycling opportunities.
P24. Start a recycling program offered to commercial businesses.
P25. Assure trash contractor’s contract specifications are in sync with the Town’s solid waste reduction programs.
P26. Amend Town ordinances and regulations to strengthen and clearly state enforcement thresholds for illegal dumping and for material unacceptable for curbside pickup.
P27. Coordinate with abutting communities as part of the annual review of the Comprehensive Plan implementation on land use, open space, transportation, economic development, natural hazards and other multijurisdictional planning issues.

Valley FallsFire Department / Rescue 2
PublicLibrary
CumberlandPolice
Department
North CumberlandFire Department
Cumberland HillFire Department
CumberlandFire District /
Rescue 1
John J. McLaughlinCumberland Hill School
MercymountCountry Day School
North CumberlandMiddle School
EmmanualNursery School
Cherry Blossom Early Enrichment
SchoolCumberlandHigh School
Ashton School
CommunitySchool
The NeighborhoodNursery
Hand in HandChristianPreschool
Academy for LittleChildren of Cumberland
Four CornersYMCA Early
Learning Center
Garvin MemorialSchool
Joseph L. McCourtMiddle School
B.F. NortonElementary School
PaintboxSchool
Blackstone Valley PrepMayoral Academy Cumberland
Pre-SchoolCenterCumberland
Town Hall
Senior Center
Public Works
AnimalControl
CumberlandWater
CumberlandParks &
Recreation
Public Works
WOONSOCKET
LINCOLN
CENTRAL FALLS
TOWN OF CUMBERLANDComprehensive Plan, 2016
MAP S&F-1
PUBLIC FACILITIESRHODE ISLAND
Prepared by:Town of Cumberland Planning Department
Mason & Associates, Inc.
µMap Sources:
0 0.5 10.25Miles
CT
MARI
Map Locus
LEGENDñ Town Hall
²³F Fire Station
²³P Police Station
å School (Public or Private)
Æc Library
²³d Public Works
²³S Senior Center
²³Í Animal Control
²³Þ Cumberland Water
²³o Parks and Recreation
Major Roads (Class 1 & 2)
Minor Roads (Class 3 & 4)
0 10.5Kilometers
This map is for general planning use; featurelocations are approximate and not legally authoritative. The Town of Cumberlandmakes no warranty, express or implied,related to the accuracy of this map.

WOONSOCKET
LINCOLN
CENTRAL FALLS
Pawtucket Water District
Cumberland Water District
TOWN OF CUMBERLANDComprehensive Plan, 2016
MAP S&F-2
WATER SUPPLY &SEWER SERVICE
RHODE ISLAND
Prepared by:Town of Cumberland Planning Department
Mason & Associates, Inc.
µMap Sources:
0 0.5 10.25Miles
CT
MARI
Map Locus
LEGENDWater Supply District
Water Supply Lines
!!
! !
!!
!!
Sewer Service Areas
Sewer Lines
Town Boundary
Major Roads (Class 1 & 2)
Minor Roads (Class 3 & 4)
Lakes & Ponds
0 10.5Kilometers
This map is for general planning use; featurelocations are approximate and not legally authoritative. The Town of Cumberlandmakes no warranty, express or implied,related to the accuracy of this map.

2016 | Cumberland Comprehensive Plan | 6. RECREATION AND OPEN SPACE 117
6. RECREATION AND OPEN SPACE
Open hayfield, West Wrentham Road.

2016 | Cumberland Comprehensive Plan | 6. RECREATION AND OPEN SPACE 118
Introduction
Cumberland is a community that greatly values its recreational and open space resources. The Town has devoted a significant amount of resources and energy to protect and manage these areas, and acknowledges that much more must still be done. Cumberland’s remaining farms and fields are as integral to its character as are its historic mill villages. The diverse landscape, i.e., densely populated neighborhoods as well as wide expanses of forests and fields, makes it difficult to articulate a single goal for open space protection and recreation investment, rather a series of goals, policies, and actions will be needed to implement the desired outcomes over the next twenty years of this plan’s long term vision. Often, the need for soccer fields competes with funds available for wildlife habitat protection. Sometimes, the situation becomes complicated when a single parcel of land can lend itself to both uses. In these instances, it becomes vital that an organizational framework exists in order to provide structure to the conversations that must take place. This element is an attempt to document Cumberland’s recreational and open space resources and needs, and offers guidance as to how communications between different stakeholders can be improved to promote thoughtful decision-making. This section inventories recreation facilities located in Cumberland, describes changes since the 2003 Plan, and assesses future recreational needs. Recreational facilities fall into two general categories: active recreation, which typically requires specific facilities, and passive recreation such as walking, hiking running, kayaking, and bird-watching which generally occurs in a natural setting requiring minimal maintenance. These two categories are not mutually exclusive; some facilities may provide opportunities for both types of recreation. Typical Active Recreation Facilities
• Playlots: Neighborhood play areas intended for children of pre-school age. They are essentially a substitute for home backyard areas and are normally provided in areas with high population density.
• Playgrounds: Neighborhood play areas for the recreational needs of the 5 to 12 year age group. They may include apparatus areas, field areas for games and informal play activities; passive areas; and areas for court games.
• Playfields: Areas which usually serve more than one neighborhood and provide varied forms of activities for young people and adults. They include facilities for a wide variety of recreational opportunities.
• Special Areas: Areas developed for a special use such as a municipal beach, golf course, etc.
Typical Passive Recreation Facilities
• Neighborhood Park. Areas primarily for sitting and quiet relaxation; may be in conjunction with a playground or playfield.
• Major Parks or Reservations. Large parks which provide for a variety of recreational opportunities, with large areas left in their natural state.
• Linear Parks. Areas used for recreational travel, usually build on natural corridors such as utility easements, rights of way, or river valleys, and function to link other recreational facilities.
Open Space/Conservation Open Space and Conservation areas provide a variety of benefits to Cumberland’s residents. While they may provide opportunities for passive recreational use, this is not their primary function; in fact, some are unsuitable for direct human use. Rather, they provide indirect benefits such as protection of both surface and groundwater resources, wildlife habitat, and aesthetic value.

2016 | Cumberland Comprehensive Plan | 6. RECREATION AND OPEN SPACE 119
According to the State Guide Plan Element A Greener Path, undeveloped conservation or “Greenspace Areas” are “essential to life in Rhode Island today and in the future. These are areas necessary to protect the unique natural resources of the community”.
The concept of a “greenspace network” is a connected area that consists of land and water that is dedicated to, or otherwise encumbered in resource conservation. A “greenspace network” encompasses both tracts of wooded open space and public parks. This network should comprise areas such as beaches, ball fields, and bike paths as well as watersheds areas, protected farmlands and maintained trail systems. A “greenspace network is the backdrop against which quality communities are developed. This network should enhance and protect land for wildlife and rare species as well as provide expanded opportunities for public access. Protecting large tracts of contiguous green space will prevent the gradual fragmentation and conversion of forest and agricultural land to other uses, which has been a common occurrence in suburban towns outlining the urban core in Rhode Island.
The Open Space Section inventories both public and private open space in Cumberland, details parcels of land that have been protected since the original Comprehensive Plan, and sets forth Cumberland’s Open Space acquisition priorities for the future.
According to the R.I. Comprehensive Planning and Land Use Regulation Act, the Open Space and Recreational Element shall include “an inventory of recreational resources, open space areas and recorded access to such resources and areas. The element shall also contain an analysis of forecasted needs and policies for the management and protection of such resources and areas. The policies and implementation techniques must be identified for inclusion in the implementation program element." The Act also requires Consistency with State Guide Plan elements: 110 Goals and Policies, 121 State Land Use Policies and Plan, 152 State’s Comprehensive Outdoor Recreation Plan (SCORP), 155 Greenspace & Greenways, 161 Forest Resources Management Plan.
Active Recreation
The Town’s recreational facilities are listed below and are illustrated on the accompanying Open Space and Recreation Map.
Indoor 1. Ashton School (cafeteria/all purpose room) 2. B.F. Norton School (gymnasium, cafeteria) 3. Community School (gymnasium, cafeteria) 4. Cumberland High School (gymnasium, auditorium) 5. Cumberland Hill School (auditorium) 6. Cumberland Middle School (gymnasium) 7. Garvin School (all purpose room, cafeteria) 8. North Cumberland Middle School (gymnasium, cafeteria) 9. Transitional School (gymnasium, cafeteria)
Playgrounds 1. Ashton School 2. Community School 3. Cumberland Hill School 4. Monastery 5. Garvin School 6. BF Norton School 7. Blackstone Valley Prep ES1 8. Blackstone Valley Prep ES2
Basketball Courts 1. Ashton School 2. Community School 3. Garvin School (2-1/2 courts) 4. Tucker Field 5. Cumberland Hill
Tennis Courts 1. Tucker Field - 5
Walking/Jogging
1. Monastery - 1.1 mile walking/jogging trail 2. Tucker Field Track - 1/4 mile track
Soccer/Football 1. Cumberland High School (practice soccer) 2. Cumberland Hill (soccer) 3. Tucker Field (football/soccer) 4. Diamond Hill Park
Indoor Pools 1. Boys & Girls Club of Cumberland and Lincoln

2016 | Cumberland Comprehensive Plan | 6. RECREATION AND OPEN SPACE 120
2. Cumberland High School
Parks
1. Diamond Hill Park 2. Monastery
3. Valley Falls Heritage Park 4. Moran Family Park 5. Blackstone Memorial Park 6. Veterans Memorial Park
Ball Fields 1. Diamond Hill Park 1 little league field (Diamond Hill Road), 1 softball field, and 2 soccer fields 2. Bentlly Razee 1 little league field 1 Babe Ruth field; 1 soft ball field 3. Razee Field 1 little league field (on Nate Whipple Hwy. behind Masonic Lodge) headed towards Attleboro 4. Garvin Field 1 little league field (on Diamond Hill Road behind the Garvin School and Police Station) 5. High Street Field 1 little league field (High Street next to Valley Falls Fire Station) 6. Vets Memorial Park 1 little league field (Broad Street behind B.F. Norton School) 7. Berkeley Oval (at bottom of Martin Street next to Animal Shelter) 8. Tucker Field 1 hardball field , 1 softball field, 1 soccer field, 1 football field, 1 basketball fields (Mendon Rd.) 9. Farm Drive 1 little league field (also used for C.H.S. girls softball team), 1 baseball field - C.H.S. 1 baseball/football practice field (both fields can be reached from the parking lot at C.H.S.) 10. Ashton School 1 little league/instructional field (Scott Road next to Ashton School) 11. Cumberland Hill School McLaughlin Field (205 Manville Hill Road), 1 little league field, 1 soccer field
Changes since 2003 Several park renovations and upgrades have been installed in recent years. Tucker Field received major upgrades including paving, laying down new synthetic turf, a new track surface, lighting, and drainage work. This work was partially funded by a $200,000 DEM recreation acquisition and development grant secured by the Department of Planning and Development, which also secured another $200,000 DEM grant in 2014 to improve the park and ballfield behind B.F Norton Elementary School. The project will rededicate the park as Valley Falls Veterans Memorial Park to emphasize the original intent of the park as a memorial to Cumberland’s war veterans as well as make ballfield improvements for use by the school and the neighborhood.
The Town has just installed $35,000 in DEM-funded improvements to the Monastery Trail system with water bars to divert water off the trails and doggy disposal bag stations, and adding new gravel and stone dust to the hiking trails.
Cumberlandfest Cumberlandfest is a summer event that takes place at Diamond Hill Park every August which includes games, live music, fireworks, and arts and crafts. The event has been going on for twenty four years and has helped raise funds to support local youth sports programs. Cumberlandfest is an all-volunteer organization with a 501c tax status. This event has the distinction of being one of the
largest outdoor summer recreational and entertainment events in northern RI. In recent years, Cumberlandfest has drawn over 5,000 attendees throughout the three day event and has continued to use Diamond Hill Park as its venue. The Town will continue to work with the organizers of this event to assure this event continues its decades-long tradition.
Cumberland Fest Logo

2016 | Cumberland Comprehensive Plan | 6. RECREATION AND OPEN SPACE 121
Blackstone River Bikeway The Blackstone River Bikeway is a 48-mile bi-state facility connecting New England’s second and third largest population centers of Providence and Worcester. The bikeway is located along both banks of the Blackstone River in North Smithfield, Woonsocket, Lincoln, and Cumberland.
Much of the trail is located on the island formed by the canal and the river. The bike path has associated parking facilities at the north and south ends of the project. A pedestrian bridge providing access across the river exists under the Route 116 Bridge. Bicyclists and walkers alike heavily use the trail.
The Bikeway began as an idea in the early 1980s and moved towards implementation in the early to mid-1990s. This section has been designated as an official section of the 2,600 mile East Coast Greenway. In Rhode Island, the Bikeway is constructed by the RIDOT and will be owned and managed by the RIDEM. There are over fourteen miles of Bikeway either completed or under construction in the project area in Rhode Island, which is known as the Blackstone River & Canal State Park. The Blackstone River Canoe Trail also passes through the project area.
The State FY17 Budget as proposed includes $10M bond referendum component to complete the Blackstone Bikeway through Providence, Central Falls and Cumberland. The Town should support passage of this bond and be a partner in this excellent initiative.
Active Recreation Priorities There is a sustained demand for active recreation, especially mini-parks and playgrounds in densely-developed Valley Falls and Lonsdale/Berkeley. Cumberland has regional community Park at the Monastery, Tucker Memorial Field, and Diamond Hill Town Park and there are many isolated fields. Sports organizations cite the need for additional playing fields.
A centrally located athletic complex is needed. Cumberland intends to be an active partner in planning additional Blackstone River Bikepath improvements. The community recognizes the Blackstone’s heritage, natural
habitat and recreational value as critical to Cumberland’s quality of life.
Existing active recreational facilities would benefit from the development of new passive recreation opportunities. Tucker Field is particularly well suited for hiking trails and better spectator amenities. The (closed) Cumberland Landfill and an unnamed island on the Blackstone River are areas that could potentially be developed for recreational use. Cumberland is working with EPA on an Action Plan for one Superfund site that could result in increased passive recreation opportunities.
Blackstone River Bikepath

2016 | Cumberland Comprehensive Plan | 6. RECREATION AND OPEN SPACE 122
Town-owned land between Manville Hill Road, Plant Street and Branch Avenue should be developed to satisfy the recreational needs of the nearby, dense residential neighborhood.
Future Active Recreational Needs
• New playground equipment installed at Tucker Field Complex, McCourt Middle School, and the Monastery.
• New recreational facilities located at or adjacent to schools should be designed and installed with multiple purpose uses in mind.
• New multi-field sports complex in the northern part of Town. If deed restrictions allow, a new complex could be located in the vicinity of Gainesboro Commons/Schofield Farm. This would be a complex of open grass fields and no structures or concession stands that could be tailored to a variety of uses seasonally. The Parks and Recreation department offered Deerfield Park in Smithfield as a successful example of such a complex. Existing fields are so heavily used that, by the time the fall soccer season starts the grass is badly damaged and the fields are mostly mud.
• Perform the following improvements at Diamond Hill Town Park: renovate Ski Lodge; convert the impaired wetland in front of the performing arts pavilion into a lawn area for audiences; refresh the Park entrance to make more safe, distinctive and beautiful and improve public access between Diamond Hill State and Town Parks. New basketball and tennis courts. Demand is especially high in the southern part of town where demand is high and space is at a premium.
• An outdoor skating park. Such a park is needed to replace the one that had been located at Currier Park. Over the long term the goal should be two skate parks (one in the north and one in the southern part of the town.
• Epheta Park Improvements Small scale neighborhood oriented improvements with landscaping such as tennis courts and/or a multi-use grass play field on the flat part of the park along with walking paths on the balance of the property.
• Lighting at Tucker Field. Provide lighting for the remaining unlit field at the Tucker complex (3-5 year timeframe).
• A second turf field. Install turf on one of the fields at Diamond Hill as a way of extending play and meeting recreation needs of the expanding population, especially in the northern part of town (10-15 year timeframe).
Open Space
Existing Open Space Currently, there are 73 properties comprising a land area of approximately 4,732 acres dedicated to open space, recreation, and conservation purposes in the Town of Cumberland. Of that amount, 2,312 acres are Town-owned, 1,640 acres are owned by the Pawtucket Water Supply Board; and 333 are owned by the State of Rhode Island. The remaining acreage is owned by private environmental groups such as the Cumberland Land Trust, homeowners associations, and individuals. Beyond pursuing an aggressive acquisition program, the Town continues to use its Conservation Development provisions of the Zoning Ordinance to preserve open space as part of its subdivision approval process. Additionally, as evidence of the Town’s interest in preserving open space, the Town Council passed a Resolution that sets aside a fixed amount annually from the State’s Conveyance fees towards open space acquisition. The Open Space account is established as Chapter 30 Article IV of the Code of Ordinances. The language regarding how it is funded is as follows:

2016 | Cumberland Comprehensive Plan | 6. RECREATION AND OPEN SPACE 123
(a)
Funds to the account shall be deposited on an annual basis commencing on October 31, 2004, and shall be collected through the real estate conveyance tax established pursuant to G.L. 1956, § 44-25-1. The amount of the annual funding shall be the greater of $100,000 or 33% of the funds received by the Town of Cumberland from the conveyance tax for the prior fiscal year. To the extent that any funds presently on deposit were funds derived from the real estate conveyance tax on and after October 31, 2004, those funds shall be transferred to the general fund on a one-time basis upon the passage of this act.
(b)
All real estate tax revenue collected by the Town shall be realized as revenue associated with the general fund. Each year an amount not less than $100,000 shall be listed in the proposed annual general fund budget provided by the Mayor to the Town Council. This amount shall be listed in the expenditure budget as an appropriated transfer to the open space fund. The transfer of this amount, as calculated per the requirements of this section, is required to be executed no later than October 31 of the following fiscal year. Funding shall be suspended retroactive to July 1, 2009, until July 1, 2012.
Impact fees are also collected, which should serve to help the Town maintain or increase its current population to protected open space ratio. Below is a summary of these parcels as well as those parcels associated with the schools.
All open space owned by the Town of Cumberland and the State of Rhode Island is generally available to the public for passive recreational uses. In addition, the nature preserves held by the private Cumberland Land Trust, Inc. are accessible to the public. Table 3826 lists Open Space areas available for public use; the location of each of these properties is illustrated in the accompanying Open Space and Recreation Map.
Management Plans have been prepared for several town-owned properties. There should be a management plan for each parcel such that the uses allowed and prohibited are unambiguous. These plans will delineate specific future uses and provide specific definitions of active versus passive recreation. Conservation easements or preservation rights that are articulated in the plans should be visible on the ground with signage.
Major Open Space Acquisitions since 2003 Since the 2003 Comprehensive Plan, open space owned by the Town or by the Land Trust has increased, however, the total number of acreage identified as Open Space has decreased since 2003 from 5,055 acres to 4,731 acres. While the Town increased its Open Space holdings from 2,191 acres to 2,312 acres, private held open space land decreased from 477 acres in 2003 to only 70 acres today. This, plus a more accurate counting of DEM acreage led to the decrease in overall numbers from the 2003 Plan even though the Town and the Land Trust have acquired more open space since 2003. The decrease in privately held Open Space only adds to the importance of the land preserved as Open Space by the Town and the Cumberland Land Trust.

2016 | Cumberland Comprehensive Plan | 6. RECREATION AND OPEN SPACE 124
Table 38: Conservation Land in Cumberland by Owner
Town of Cumberland Acres
Abbot Run 3.77 Ash Swamp 95.44
Ashton School 6.92 Blackstone Memorial Park 0.24
Blackstone River 32.17 Canning Street 4.41
Countryside Drive 3.39 Cumberlandite 3.95
Currier Playground 1.29
Diamond Hill / Lawrence 40.15 Diamond Hill Park 137.64
East Sneech Brook 13.22
East Sneech Brook / McGrath 14.54
Empire Street 1.89 Epheta House 27.91
Franklin Farm 67.92
Vadnais Farm 78.11 Georgiana Drive 2.02
High Street Field 2.57 Hines Farm / Millers Oak 121.03
Hopkins Terrace 0.72 Lambert 57.51
Lippitt Estates Conservation Area 50.80
Long Brook 144.89
Lonsdale Co 1.70 Manville Dam 2.10
Millers River 0.79 Monastery 475.00
Moran Park 0.57
NF 0.69 Old Quarry 2.54
Old Well 44.32
Schofield Farm 62.69 Scott Brook 139.66
Sneech Pond 69.05
Sneech Pond Road 4.89 Tower Hill Historic 5.56
Tucker Field 112.10 Valley Falls Heritage Park 2.28
Valley Marsh 35.94 Valley Stream 5.36
West Sneech Brook 9.03 Total = 1,886.75
RIDEM Acres
Carls Pond 11.28 Diamond Hill Reservation 285.29 New England Homes 31.56
Valley Marshes 5.56
Other 0.29 Total = 333.98
Cumberland Schools Acres
Cumberland High School 8.34
Cumberland Hill School 8.77 Cumberland Middle School 11.89 Garvin School 5.39
North Cumberland Middle School 23.72 Norton School 3.81
Total = 61.91
Cumberland Water Dept.
Acres
Abbot Run 7.85
Berkeley Oval 4.95 Franklin Street 0.44
Lanesville Road 0.87
Lenox Street 1.81 Lippitt Avenue 0.24
New River Road 67.66
Sneech Pond 302.02 Staples Road 18.77
Walnut Street 0.20 Water Tank 20.31
Wildwood Street 0.16
Total = 425.28
Pawtucket Water Supply Board
Acres
Abbot Run 66.95
Abbott Run 6.35 Arnold Mills Reservoir 297.31
Blackstone River 4.06
Burnt Swamp Brook 115.62 Crowell Street 0.36
Diamond Hill Reservoir 323.94
Grants Mills 33.32 Happy Hollow Pond 83.84
Howard Pond 1.92 Lanesville Road 2.13
Nate Whipple Highway 4.81
Pratt 33.55 Rawson Road 5.14
Robin Hollow Pond 58.70
Torrey Road 0.51 Total = 1,038.51
City of Woonsocket Acres
Iron Rock Brook Conservation Area 0.09
Cumberland Land
Trust Acres
Atlantic White Cedar Swamp 38.82 Bowen Wildlife Preserve 21.12
Brush Hill 8.29
Darby Donation 2.18 East Sneech Brook / Bessette 15.40 East Sneech Brook / Podgurski 77.28
High Rock Farm Preserve 64.33
James J Bland Preserve 22.06 Jane Woods Donation 2.44
Lawton Property 1.57
Lippitt Estates / Rowbottom 24.09
Lippitt Estates Conservation Area 0.38
Lippitt Estates Smith Farm 25.68
Mello Property 3.57 NF 0.70
Ottis Smith Farm 3.90
Silvie's Brook Conservation Area 0.72
Stierheim Donation 0.65 Total = 313.18
Privately Owned Sites Acres ASRI Lippitt Estates Conservation Area 0.62 ASRI McKenzie Wildlife Refuge 15.60
Lauren Woods 4.34 Lippitt Estates Conservation Area 18.31 Carr Property 26.28
Iron Rock Brook Conservation Area 0.86
Mathew Drive Conservation Easement 4.18
Total = 70.20
Source: RIGIS Open Space Data

2016 | Cumberland Comprehensive Plan | 6. RECREATION AND OPEN SPACE 125
Table 39: Cumberland Land Trust Property
Property Name Location Acres Lots
Bowen Geddes Sneech Brook Angell Road 20 3
Mellow Long Brook Little Pond County Rd. 4 1
Brush Hill Ash Brook Nate Whipple Hwy 7.5 1
High Rock Farm Scott brook Scott Road 73 2
Otis Smith Rowbottom Long Brook Scott Road 54 4
Tenreiro Sneech Brook Gold Star Drive 40 1
Kaback Bland Sneech Brook Nate Whipple Hwy 23.5 1
Burlingame Long Brook Pound Road 84 1
Arnold Mills Reservoir Hidden Meadow Drive 11.5 2
Nadeau Long Brook Abby Drive 0.7 1
Anonymous Sneech Brook Nate Whipple Hwy 2.6 1 Irving Dark Long Brook Lippitt Avenue 0.2 1
Stierheim Miscoe Lake Wrentham Road 0.6 1
Darby Sneech Brook Nate Whipple Hwy 2 1
Marzocchi Sylvre Brook Thomas Leighton Blvd 0.6 1
Bonvouoir Long Brook Leigh Road 0.1 1
Lawton at Scott Brook Scott Road at Bruce Dr. 1.4 1
Total 348.7 25
Source: Cumberland Land Trust 2014
The 2003 Plan recommended the acquisition of 1,799.2 specific acres of land. The town continues to make progress in acquiring the properties for conservation and open space and the Table below shows the continued progress in our long range acquisition strategy. Also, other properties were acquired that weren’t targeted, but were valuable and otherwise became available. Some remaining acreage from the Town’s targeted list is still available for open space acquisition. Table 4038 shows the current 2014 status of open space properties recommended by the Town’s 2003 Plan.
Table 40: Pending Land Trust Acquisitions
Property Name Acres Lots
Lippitt Estates Long Brook 5.8 1 Blackstone River Watershed 12.0 1
Lippitt Estates Long Brook 17.6 1
Total 35.4 3
Source: Cumberland Land Trust 2014
Open Space Priorities
While no specific method for determining priorities for open space acquisition has been developed as of yet, current priorities include expansion of The Cumberland Greenway, creation of a pedestrian trail system, and acquisition of land adjacent to existing protected properties. Ideally, the current population to open space acreage should be maintained as the Town’s population continues to grow.
Cumberland possesses valuable natural areas which provide an opportunity for open space preservation and acquisition. Areas which should be targeted for acquisition include agricultural lands, wetlands, land in drinking water supply watersheds, river and stream corridors, and areas of groundwater recharge. Focus areas for protection in Cumberland identified by the State are those

2016 | Cumberland Comprehensive Plan | 6. RECREATION AND OPEN SPACE 126
containing lime-based ‘greenstone’ supporting rare species. These areas should be acquired for the protection of biodiversity in the State. Designated Rare Species Habitats have been identified in Cumberland by the Natural Heritage Program. These areas are detailed in the Natural Resources section of this plan and should also be acquired.
Use of Monastery land is of particular interest. The library and senior services are located at the main entrance on Diamond Hill Road. Public Works has a garage in the vicinity, and the area adjacent to the entrance road has space that functions as a Veterans memorial. A large parking area services these facilities, as well as for those using the extensive trail system on the property.
The Cumberland Conservation Commission, in concert with the Recreation Department, has developed a trail marking system. The Highway Department maintains the trails, cutting brush and trees where needed and recently installed gravel and stone dust in certain places. The property is protected from development by a conservation easement resolution passed by the Town Council in 2004. A State statute enacted since then has made the resolution binding, ensuring the balance of site will remain open space. However, this situation did not deter someone from developing a BMX bike track in a remote corner of the Monastery property, which the Highway Department has since removed, restoring the area to its natural condition. The Monastery Management Plan, which was first written in 2004, should be updated.
Monastery (RIGIS)

2016 | Cumberland Comprehensive Plan | 6. RECREATION AND OPEN SPACE 127
Table 41: Status of 2003 Recommended Acquisitions
Name Acres 2003 Status 2014 Status Blackstone River Valley 280 3.5 Acres acquired (Town) unknown
Diamond Hill Town Park
75 75 acres acquired (Town) Completed
The Monastery N/A Not yet developed. No additional Monastery Land planned for purchase
Geddes Farm 32 17.4 acre Cluster Open Space Not complete Angell Farm Remains a high priority Not complete
Hines Farm 130 28.6 acres Cluster Open Space
Conservation Management Plan in Place 2004
Long Brook 150 90.8 acres acquired (Town) Remaining easements pending; Longbrook LLC Subdivision
Abbott Run 100 Not yet acquired Not complete Lippitt Estates 32 32 acres acquired (Town) Completed
Scott Pond (was Scott Brook & Mill Pond)
160 98.5 acres acquired (Town) Completed
Diamond Hill Vineyards
33 Remains a high priority DEM purchased the Development Rights
Phantom Farm 15 Remains a high priority
Franklin Farm 65.4 65.4 acres acquired (Town) Town Owned, Management Plan
West Wrentham Road 300 92 acres acquired (Town – Highland/Blackall)
Not complete
Nate Whipple Wetland (East Sneech Brook)
335 40 acres acquired (Land Trust)
Not Complete
Rosetti Land 182 Preserved Unknown
Diamond Hill Park Expansion
400 262 acres acquired (State) Not complete
Miscoe Lake 550 51 acre Cluster Open Space 2 acres acquired (Town)
Not complete
Emerson Property 215 Includes part of Wagner Trail Completed 2011
The Cumberland Greenway The Cumberland Greenway is a vision plan to create one contiguous area of open space from the Monastery to Diamond Hill State Park. The Central Artery of the Cumberland Greenway presently consists of Tucker Field, the Scott Brook Conservation Area, the Baskin Property, the Brown and Rowbottom Properties, Lippitt Estates, and the Long Brook Conservation Area. This community-wide greenway system connects forests, watersheds, riparian corridors, wildlife habitats, parks and recreation areas. Expanding this area through acquisition of nearby properties is a top priority for the Town. This goal is related to the concept of a “greenspace network” discussed above that would increase open space usage and investment in Cumberland for the benefit of wildlife habitat and passive recreation for users.

2016 | Cumberland Comprehensive Plan | 6. RECREATION AND OPEN SPACE 128
The Cumberland Greenway
Cumberland Greenway Pedestrian Trail System Several hiking/pedestrian trails currently exist in Cumberland. However, their use is greatly limited by their lack of interconnection. Extending this system and creating linkages between open space parcels and important destinations is a priority for the Town. In addition to mapping the existing formal and informal trails (and primary and secondary corridors) on these and other open space properties, the Town needs to have the equipment and labor to properly maintain these trails, develop consistent design standards and a financing program for maintenance and extensions.
Specific opportunities for creating such a trail system exist at: Diamond Hill State Park Extension; NCMS/Ash Swamp/Tower Hill Estates/Caetano Open Space/Staples Rd. area; Lippitt Estates Conservation Area; Scott Pond Conservation Area; Longbrook Conservation Area; and Blackall Conservation Area
Cumberland Water Supply Access Road for New Well The Cumberland Water Department is currently planning on placing a new well on land adjacent to the Franklin Farm and Rawson Pond. The site where a future well is planned currently lacks land available for an access road. The Town is currently exploring purchasing roughly 8 acres of and across nine separate parcels of land that are both privately owned and publicly owned (Pawtucket Water Supply). If purchased, this land would become Town property solely for the purpose of adding to the Town’s drinking water supply system.
The Warner Trail This 34-mile long trail, created prior to WWII, extends from Canton, MA to Diamond Hill State Park and connects public parcels including Town forests and private property. It enters Cumberland from Wrentham in the northeast corner of the State. Acquisition of parcels along the

2016 | Cumberland Comprehensive Plan | 6. RECREATION AND OPEN SPACE 129
trail through fee simple and conservation easements and to extend the trail to the Blackstone Heritage Corridor as recommended in the Trails and Greenways, A Vision for the Blackstone River Valley (2003) is a priority.
Property Contiguous to Existing Open Space Preserving open space adjacent to existing open space allows for the creation of large, contiguous tracts of land that are more valuable for protecting wildlife habitat than having smaller, non-contiguous tracts. Maintenance of the remaining contiguous forest canopy is equally important. In addition, expanding existing open space areas is an important step for creating a North and South Artery of The Cumberland Greenway. Parcels such as Angell Farm, Phantom Farm, Pratt property and the Emerson Property are of great importance for preservation as farmland and open space. Protecting our public drinking water supplies for the future through acquisition of lands adjacent to Town and Pawtucket Water Supply lands including reservoir tributaries is also a top priority.
Threat of Gradual Parcelization Subdivision, the breaking up of large parcels into smaller parcels (parcelization), and the conversion of forestland are threatening the economic and ecological integrity of much of Rhode Island’s forests. Subdivision and land conversion can negatively affect plant and animal species, wildlife habitat, water quality, recreational access, and the ability of forests to sequester and store carbon. They can also affect the contiguous ownership, management, and viability of forest parcels to contribute to the region’s rural economy.
The subdivision of land itself has implications, regardless of whether it will lead to development. Smaller parcel sizes may diminish the economic efficiency of management for agriculture or forestry; more owners with different objectives may make large-scale habitat management more difficult; more owners may threaten continued public access for recreation; and certain ecological services may be affected. In addition, new subdivisions may indicate emerging market trends, such as where more subdivisions are likely to occur and where land values are likely to rise, thereby making forest management and acquisition of land for forestry or ecological services unlikely.
Strengthening the Conservation Development regulations could help direct disturbances away from sensitive areas, trails open to the public, and viewsheds; and set aside critical areas of contiguous open space. Further, the Regulations could specify a minimum alteration of the natural landscape.
The Town should continue to work with entities like the Land Trust, the Department of Environmental Management (DEM) and other interested parties in long range planning and regulatory enforcement that preserves large tracts of contiguous open space for conservation. The Town has increased its holdings of Open Space since the 2003 Comprehensive Plan and will continue to improve upon land use efforts to mitigate the effects of gradual parcelization.
Issues and Opportunities
Mini-Parks/Playgrounds These active recreational facilities are geared toward serving small local areas. Cumberland has only five playgrounds and no mini-parks. This is generally not problematic in areas of large-lot single-family residential development, however, these facilities should be provided in areas of denser, multi-family development such as Valley Falls, Lonsdale, and Berkeley.
Major Parks Community Parks and Reservations in Cumberland include the Town-owned Diamond Hill Park, Tucker Memorial Field, and the Monastery, as well as the State-owned Diamond Hill Reserve. While individually these areas do not serve all the functions generally considered necessary for a major park,

2016 | Cumberland Comprehensive Plan | 6. RECREATION AND OPEN SPACE 130
together they do meet the community’s needs. The Town-owned properties should be focus areas for improvements, so that they can better benefit Cumberland’s population. Cumberland’s population is aging and recreational programs and facilities should be planned for this changing population. This should include incorporation of passive recreation opportunities at Tucker Field; as well as recognition of the Town’s growing elderly citizenry in the Town’s ongoing phased implementation of a renovation to Diamond Hill Park. The outdoor theatre in Diamond Hill Town Park is a great resource in the summer, but is in need of renovations.
Linear Park The Blackstone Valley National Park offers a valuable open space, recreational, historic/architectural preservation and tourism opportunity to the Town, as well as the other nineteen communities which make up the Corridor. The Town is continuing to work with the EPA on the Proposed Action Plan for the cleanup of the Peterson Puritan Superfund Site and will advocate for improved access and recreational opportunities as the site is remediated in the years ahead.
Open Space/Conservation Cumberland possesses valuable natural areas that provide a unique opportunity for open space preservation and acquisition. Open Space acquisition continues to be a priority that receives a lot of attention in Town as community assets like Diamond Hill Park and the Monastery grow in their use for recreational activity and for preservation of natural resources and habitat usage. The Town continues to show its willingness to preserve Cumberland's material resources by purchasing land and using it for open space as indicated in the updates shown above. The Town will continue to explore both DEM grant funding for Open Space acquisition as well as Bond referendums in the years ahead.
The connectivity of greenway space continues to be a strategy utilized in this Comprehensive Plan and the Town will work with the Land Trust and other partners to realize the creation of a contiguous trail and open space network in the center of town.
Open Space and Recreation Goals
Based on the inventory and analysis of the previous sections, goals and policies for open space and recreation have been formulated.
Rhode Island State Planning Act Goals. “To promote orderly growth and development that recognizes the natural characteristics of the land, its suitability for use and the availability of existing and proposed public and/or private services and facilities.”; “To promote the protection of the natural, historic and cultural resources of each municipality and the state.”; “To promote the preservation of the open space and recreational resources of each municipality and the state.” “To encourage the use of innovative development regulations and techniques that promote the development of land suitable for development while protecting our natural, cultural, historical and recreational resources and achieving a balanced pattern of land uses.”
*See the Implementation Element for synopsis of Goals and Action Item implementation schedule, priority, and responsibilities.
Goal: Acquire more open space for passive recreation.
Goal: Maintain a sustainable, high-quality parks and recreation system that reflects the unique identity of our community.

2016 | Cumberland Comprehensive Plan | 6. RECREATION AND OPEN SPACE 131
Goal: Ensure that recreation facilities are state-of-the-art and meet the needs of all residents
Recreation and Open Space Action Items
R1. Install approx. $100K (from a recreational grant bond fund or from the capital budget) in playground equipment at Tucker Field and McCourt Middle School.
R2. Coordinate the construction of new school facilities to include multiple purpose recreational areas for both school and Town use.
R3. Generate a plan for developing trails and other connections between recreational open space areas.
R4. Create standards for trail markers, park signage and other improvements needed to create a consistent, high-quality system of open space, trails and parks throughout Town.
R5. Promote the sustainable use of municipal, state and National parks and other open spaces within Cumberland. Strategies should support local businesses catering to users.
R6. Maintain priority potential acquisitions based on specific selection criteria and/or an open space ranking system.
R7. In order to create a large area of contiguous open space from the Monastery to Diamond Hill Park called the "Cumberland Greenway" coordinate efforts to identify and acquire tracts of land that will enlarge and connect existing protected parcels.
R8. Consistent with State statutes, amend the Land Development & Subdivision Regulations to require a mandatory set aside for open space which consists of potentially buildable land, rather than wetland or other areas with building constraints.
R9. Amend the Zoning Code and Land Development & Subdivision Regulations to specify evaluation and protection standards, including siting of building envelopes, for natural features and cultural characteristics, including significant woodlands and special trees.
R10. Town Council should approve a referendum for additional funds for the preservation of open space.
R11. Update the Monastery Management Plan
R12. Perform the following improvements at Diamond Hill Town Park: renovate Ski Lodge; convert the impaired wetland in front of the performing arts pavilion into a lawn area for audiences; refresh the Park entrance to make more safe, distinctive and beautiful and improve public access between Diamond Hill State and Town Parks.
R13. If deed restrictions allow, develop new utility sports fields in the vicinity of Gainesboro Commons/Schofield Farm.

kjkj
kj
kj
kj
kj
kjkj
kj
kj
kj
kjkj
kj
kj
kj
kj
kj
kj
kj
kj
kj
kj
Monastery
Sneech Pond
Tucker Field
Ash Swamp
Pratt
Lambert
Long Brook
Diamond Hill Park
BlackhallAmaral
Schofield Farm
New River Road
Franklin Farm
Robin Hollow Pond
Burnt Swamp Brook
Fanning WildernessArea - Valley Marsh
Burnt Swamp Brook
High Rock Farm Preserve
East Sneech Brook / (Podgurski)
Gainsborough Commons
Epheta House
Blackstone River
Water Tank
Abbot Run
Grants Mills
Diamond Hill / Lawrence
Carr Property
Scott Brook
Staples Road
Atlantic White Cedar Swamp
Hines Farm / Millers Oak
Lippit Estates Smith Farm
Grants Mills
James J Bland Preserve
Lippit Estates / Rowbottom
Bowen Wildlife Preserve
Brush Hill
AbbotRun
North Cumberland Middle School
Scott Brook
McKenzie Wildlife Refuge
East Sneech Brook
(Bessette)
(McGrath)
Ashton School
Valley Stream
CumberlandMiddleSchool
LaurenWoods
Berkeley Oval
Cumberland High School
Abbot Run
Tower HillHistoric
Cumberlandite
B.F.Norton School
Sneech Pond Road
Ottis Smith Farm
Old Quarry
HappyHollowPond
West Sneech Brook
Manville Dam
Darby Donation
Lonsdale Co
Georgiana Drive
Jane Woods DonationMathew Drive Conservation
Easement
Valley Falls Heritage Park
Nate Whipple Highway
Millers River
Lanesville Road
Lippit Estates Conservation Area
Torrey Road
Canning Street
Lippit Estates Conservation Area
Empire Street
Silvie'sBrook
ConservationArea
Lippet Avenue
BlackstoneMemorial Park
Franklin, Lenox,
Walnut, & Wildwood
Streets
Arnold Mills Reservoir
Cumberland Hill School
Lanesville Road
Moran Park
Hopkins Terrace
StierheimDonation
Garvin School
Rawson Road
Emerson
Bentley Field
Razee Field
HighStreetField
Boys and Girls Club
Belliveau
Old Well
Iron Rock BrookConservation Area
Fatima ChurchField
Diamond Hill Reservoir
Veterans Memorial Park
CommunitySchool
Blackstone Valley Prep ES1
Blackstone Valley Prep ES2
Diamond Hill Reservation
Carls Pond
New EnglandHomes
Valley Marshes
Emerson
Emerson
WOONSOCKET
LINCOLN
CENTRAL FALLS
TOWN OF CUMBERLANDComprehensive Plan, 2016
MAP OS&R-1
OPEN SPACE &RECREATION
RHODE ISLAND
Prepared by:Town of Cumberland Planning Department
Mason & Associates, Inc.
µMap Sources:
0 0.5 10.25Miles
CT
MARI
Map Locus
LEGENDState Conservation Lands
State Conservation Land - Hunting / Fishing Allowed
Local Conservation Lands
Local Conservation Land for Recreation
kj Recreation Sites
Town Boundary
Major Roads (Class 1 & 2)
Minor Roads (Class 3 & 4)
Lakes & Ponds
0 10.5Kilometers
This map is for general planning use; featurelocations are approximate and not legally authoritative. The Town of Cumberlandmakes no warranty, express or implied,related to the accuracy of this map.


2016 | Cumberland Comprehensive Plan | 7. TRANSPORTATION 133
7. TRANSPORTATION
Northern Rhode Island railroad network, ca. 1880

2016 | Cumberland Comprehensive Plan | 7. TRANSPORTATION 134
Introduction
A series of hilly north-south ridge lines has determined the layout of Cumberland’s roadways and railways. Mendon Road and Diamond Hill Road are the major north/south corridors and lay within river valleys. Mill villages dating to the American Industrial Revolution are located on the Blackstone River in the southern and western edges of Town have narrow roads and tight urban patterns characteristic of the period. Otherwise, Cumberland is noted for suburban development and large expanses of open fields, woodlands and wetlands as one moves northward and eastward from the Blackstone River.
Continued residential development in this bedroom community has had the consequence of exacerbating an already high level of congestion during peak periods, especially on the two north/south highways, and interchanges with Interstate 295.
Development along Diamond Hill Road and Mendon Road is another significant concern. New commercial development requiring additional curb cuts impede traffic flow. The temptation to “improve” congested roadways by widening roads and installing new controls comes at a great cost: it is disruptive and very expensive, compromises the historic charm of a road corridor, discourages walking and bicycling, and ends up encouraging more sprawl and vehicular traffic.
This element will describe and analyze Cumberland’s highways, railways, and bicycling/pedestrian accommodations.
According to the R.I. Comprehensive Planning and Land Use Regulation Act, the Circulation Element “Shall consist of the inventory and analysis of existing and proposed major circulation systems, street patterns, and any other modes of transportation in coordination with the land use element”. The policies and implementation techniques must be identified for inclusion in the implementation program element. The Act also requires consistency with State Guide Plan Elements: #661 State Rail Plan 2014; 121 State Land Use Policies and Plan; #611 Transportation 2035; # 620Transportation System Management Plan; 621 Policy Statement: Public Transit; and 661 Freight Rail Plan.
Roads and Traffic
Functional Classification Roads and highways throughout the state are grouped into classes or systems that are based upon the road's intended character of service. The method of classification assumes that all roads serve two basic functions: direct access to property and travel mobility. Distinctions are made as to the varying degrees that a road accomplishes these basic functions. Appendix D describes the functional classification system. Appendix D also shows the functional classification of roads and highways in Cumberland according to Highway Functional Classification System for the State of Rhode Island, 2005-2015.
Traffic Volumes Traffic volumes are generally measured by annual 24-hour average daily traffic counts (AADT); this data is collected by the Rhode Island Department of Transportation (RIDOT). While traffic volume does not remain constant, AADT’s do not distinguish between peak and off-peak hours. It simply establishes a road’s total volume of vehicle traffic of a highway or road for a year divided by 365 days.
The table below shows the AADT for Cumberland roads conducted by the RIDOT between 2009 and 2013. Long term traffic count data for Cumberland is available for only a few locations. A review of all available 24 hour or greater traffic volume counts indicate that Mendon Rd. and Diamond Hill Rd. experience the most

2016 | Cumberland Comprehensive Plan | 7. TRANSPORTATION 135
volume of all the areas included in the RIDOT traffic counts. Classified as Principle Arterials, this is not surprising.
Table 42: Cumberland Average Annual Daily Traffic (AADT) counts 2009-2013
Traffic Count Site Road Segment Date Conducted ADT AADT
122 Mendon Rd. Between Marshall & Martin September, 2012 13,797 14,300
114 Diamond Hill Rd. West of Curran Rd. 2009 NA 13,900
121 Wrentham Rd. Between Fisher and Highland Rd. May, 2009 7,308 7,700
114 Pine Swamp Rd. West of West Wrentham Rd May, 2013 9,805 10,700
W. Wrentham Rd. South of 114 Pine Swamp Rd. October, 2012 3,241 3,500
I-295 NB On Ramp From southwest of 114 July, 2009 2,606 2,900
I-295 SB On Ramp From southwest of 114 July, 2009 8,456 9,500 I-295 NB Off Ramp To southwest 114 July, 2009 7,038 7,900
I-295 SB Off Ramp To southwest 114 July, 2009 2,562 2,900
120 Nate Whipple Highway Between Mendon Rd. and Staples Rd. August, 2012 7,137 8,000
Marshall Avenue Between Mendon and High St. August, 2012 5,997 6,700
123 Dexter St. Minerva & RI/MA S/L May, 2009 14,267 15,000
114 Broad St. Between Dexter and Chambers St.
114 High St. Between Blackstone and Highland
Source: Rhode Island Department of Transportation, 8/14
Traffic count data is extremely important to municipalities and the State for long term transportation and land use planning as well as transportation funding. AADT’s are used to determine Federal funding for maintaining and improving highways. Every state annually submits a Highway Performance Monitoring System (HPMS) report describing a sampling of road segments in that state, which establishes Vehicle Miles Traveled (VMT) by multiplying the length of the road segment by the AADT. VMT is one-third of the factor for Interstate Maintenance Funding (IM), thirty five percent of the factor for National Highway System Funding (NHS), forty percent of the factor for Surface Transportation Program Funding (STP), and one-third of the factor for Highway Safety Improvement Program (HSIP) funding.
Traffic Accidents The Cumberland Police Department collects and maintains traffic accident data. Table 433 shows number of traffic accidents per year from 2009-2012, revealing a 9 percent decrease over that period. The accident rate decreased sharply between 1991 and 2003, but less so in the last decade.
The 2003 Comprehensive Plan identified Cumberland’s most dangerous intersections: Mendon Road at I-295, Chapel Four Corners (Diamond Hill Rd/Angell Road), (similarly identified in the 1991 Plan), and Diamond Hill Road at I-295. Other accident-prone locations included intersections along Mendon and Diamond Hill Roads, and several intersections with Broad Street.

2016 | Cumberland Comprehensive Plan | 7. TRANSPORTATION 136
Table 43: Number of Traffic Accidents, 2009-2012
Source: Cumberland Police Department Annual Reports 2009-2012
It should continue to be a priority for the Town of Cumberland to conduct traffic studies of these intersections where high vehicle accident rates occur and implement safety measures to limit accident rates. There are several types of “traffic calming” techniques that the Town could implement at these intersections that are common in New England such as: raised pedestrian crosswalks; speed tables, traffic circles and roundabouts; raised landscape medians; and visually reducing lane widths.
Of special concern is pedestrian safety, especially for children and seniors. Specific sites in need of additional safety enhancements are: Broad Street (at Town Hall); Mendon Road (at Cumberland High School), One Mendon Road; Marshall Avenue; and West Highland School.
Road Improvements The Rhode Island Department of Administration Statewide Planning Program is responsible for the development of a biennial Transportation Improvement Program (TIP). The TIP lists those projects which the state intends to work on during a four year period; Figure 33 shows the planning process used in implementing transportation projects.
Police Department Crash Data 2009 - 2012
905
851
842
824
780
800
820
840
860
880
900
920
2009 2010 2011 2012
Years
An
nu
al
Cra
sh
Vo
lum
e

2016 | Cumberland Comprehensive Plan | 7. TRANSPORTATION 137
Table 44: The Transportation Improvement Process
Source: 2013 – 2016 Transportation Improvement Program
Several projects are currently included for funding in Cumberland. Table 345 summarizes the projects for Cumberland that were included in the 2013-2016 TIP. Preliminary projects have no associated target date.
In January, 2016 Cumberland submitted its project priorities for consideration for the 2017-2025 TIP. These include four New Project Applications for roadway/drainage projects. The highest priority projects submitted by Cumberland to the State are: Intersection Safety Improvements (including signal upgrades) to Route 114 between Bear Hill and I-295; Resurfacing Route 114, Broad Street (Mendon Road to the Blackstone River); Newall Bridge, Route 114, Diamond Hill Road at East Branch of Sneech Brook; and Howard Road Bridge, Route 114 at Abbott Run River.
Table 45: Proposed Transportation Improvements
Projects TIP Program Est. Cost Recommendation
2012 State Traffic Commission C-2 Mendon Rd. at Davenport’s Restaurant
State Traffic Commission (STC)
NA TS-Recommended
Blackstone Canal Enhancement Program $.40M EN- Recommended
Blackstone River Bicycle Facility Segment 3A-Pawtucket Landing to Branch Street
Bike/Pedestrian Program NA BP – Recommended S&D
Blackstone River Bicycle Facility Segment 3B- Branch Street Cumberland Town Hall
Bike/Pedestrian Program NA BP-Recommended S &D
Broad Street Improvements Study and Development Program
NA SD - Recommended
Hazard Elimination North – Contract 3 High Street at Dexter
Highway Safety Improvement Program (HSIP)
NA TS - Recommended
Hazard Elimination North – Contract 4 Mendon Rd. at Scott Rd.
Highway Safety Improvement Program (HSIP)
NA TS-Recommended
Howard Road Bridge #459 Bridge and Immediate Approaches
Bridge Program $1M BR - Recommended
I-295 Safety and Lighting Contract – 2E Route 7 to MA State Line
Interstate Program $4M IN – Recommended FUT
Manville Landing Enhancement Program NA Funded though Earmark
Newel Bridge #204 Bridge Program $1.5M BR - Recommended
Park East Drive Pavement Management Program
$2.9M PM – Recommended FUT
Source: Projects Included in RI 2013-2016 Transportation Improvement Program, Revised November 21, 2013, Statewide Planning Program, RI Department of Administration
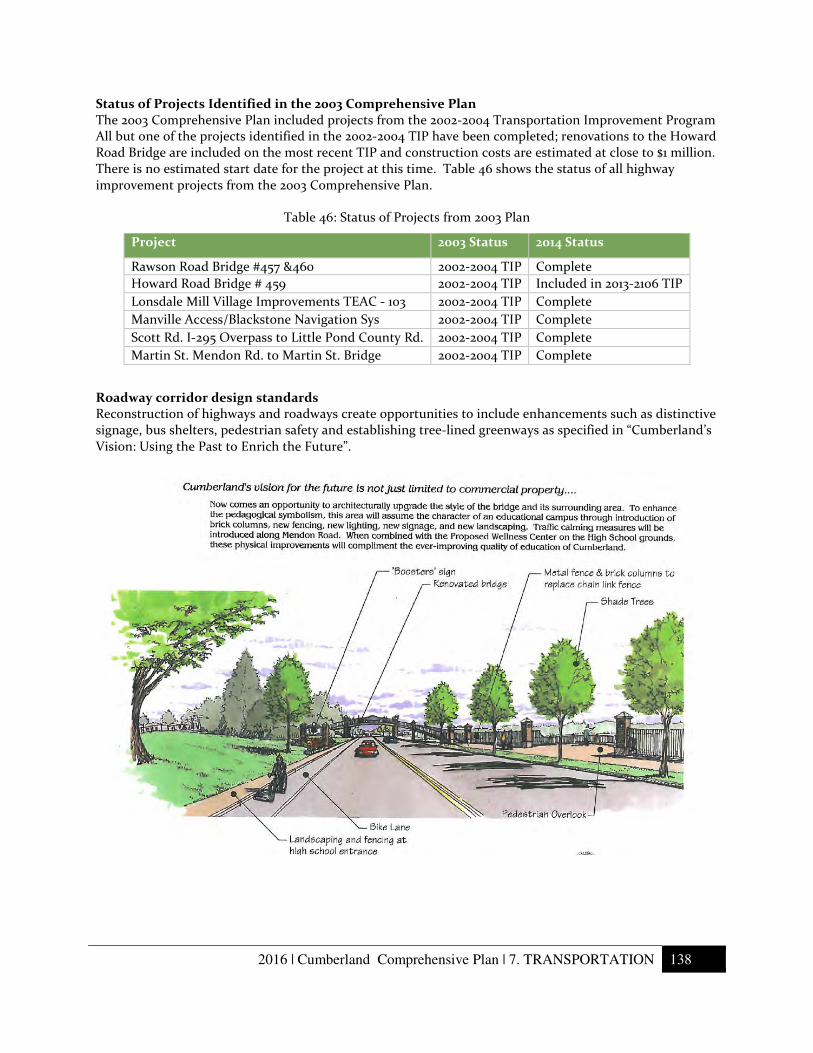
2016 | Cumberland Comprehensive Plan | 7. TRANSPORTATION 138
Status of Projects Identified in the 2003 Comprehensive Plan The 2003 Comprehensive Plan included projects from the 2002-2004 Transportation Improvement Program All but one of the projects identified in the 2002-2004 TIP have been completed; renovations to the Howard Road Bridge are included on the most recent TIP and construction costs are estimated at close to $1 million. There is no estimated start date for the project at this time. Table 46 shows the status of all highway improvement projects from the 2003 Comprehensive Plan.
Table 46: Status of Projects from 2003 Plan
Project 2003 Status 2014 Status
Rawson Road Bridge #457 &460 2002-2004 TIP Complete
Howard Road Bridge # 459 2002-2004 TIP Included in 2013-2106 TIP
Lonsdale Mill Village Improvements TEAC - 103 2002-2004 TIP Complete
Manville Access/Blackstone Navigation Sys 2002-2004 TIP Complete
Scott Rd. I-295 Overpass to Little Pond County Rd. 2002-2004 TIP Complete
Martin St. Mendon Rd. to Martin St. Bridge 2002-2004 TIP Complete
Roadway corridor design standards Reconstruction of highways and roadways create opportunities to include enhancements such as distinctive signage, bus shelters, pedestrian safety and establishing tree-lined greenways as specified in “Cumberland’s Vision: Using the Past to Enrich the Future”.

2016 | Cumberland Comprehensive Plan | 7. TRANSPORTATION 139
Pavement Management Road maintenance and repairs should be performed as much as possible on a predictable, methodical schedule. Considering the importance of quality roadways for commerce, safety and quality of life, a multi-year pavement management program should be considered. A pavement management program would be dependent on the planning and issuance of bonds for street paving improvements. Pavement improvements in 2016 include the repaving or total reconstruction of roadways for forty-two local and secondary streets.
The implementation of a multi-year pavement management program also consists of on-going coordination with the Rhode Island Department of Transportation to periodically review and identify state-owned or state-maintained roadways within the Town that warrant rehabilitation or other improvements due to deteriorated pavement, safety issues, or poor drainage conditions. The Town will continue to participate in the Transportation Improvements Program (TIP), as administered by the State Planning Council and RIDOT, for this purpose.
Complete Streets Complete Streets is a term for streets designed so that they are safe for children, walkers, public transportation passengers, skateboarders and bicyclists. Complete streets are notable for: sidewalks, bike lanes (or wide paved shoulders), special bus lanes, comfortable and accessible public transportation stops, frequent and safe crossing opportunities, median islands, accessible pedestrian signals, curb extensions, narrower travel lanes, roundabouts, and more. A “complete” street in a rural area will look quite different from a “complete” street in a highly urban area, but both are designed to balance safety and convenience. Middletown, Newport, Pawtucket, Portsmouth, and Providence have adopted “Complete Streets” ordinances.
Repaving projects create Complete Street opportunities. Cumberland should institute a multi-year pavement management program, and where possible, narrow vehicular lanes slightly, shifting the edge stripe to create more room for cyclists. The timing of traffic lights can be changed to better accommodate pedestrians.

2016 | Cumberland Comprehensive Plan | 7. TRANSPORTATION 140
A first phase of instituting a Complete Street program would identify road sections in need of traffic calming and increasing safety. Town departments would specify specific new installation features appropriate for the area, and include these when maintenance or reconstruction work is scheduled. New development should incorporate Complete Street standards.
Highway Signage There has been a proliferation of commercial signage on Cumberland’s roadways. While signage is important for economic development, excessive signage can be a distraction to the point of presenting a danger. At the same time, allowances should be made for certain brand franchise sign specifications (including internally-lit signs), if reasonable and context-sensitive. Cumberland updated its sign ordinance in 2015 to address digital technology. However it would be desirable for the Town to enact additional performance standards for brightness and allowing the ordinance to conform with RIDOT safety regulations, including “dwell” time for digital signs.
New Development New subdivisions and commercial development present opportunities to enhance transportation safety, efficiency, and beauty. Amending the Development Regulations should be considered to address two specific desired outcomes. First, where appropriate, road connections should be made between subdivisions, condominiums and such developments. This would allow more access by public safety services. Second, it should be required that the streets of new subdivisions be completed to the point that they can be plowed, before houses are built. There are currently circumstances where houses have been sold to new owners, who discover to their chagrin the road to their new home is practically unserviceable. Strengthening the Development Regulations would allow Town officials to enforce a higher standard.
Public Transportation
According to the RI Statewide Planning Division, only 1.8% of Cumberland’s residents 16 and over use public transit for commuting purposes, while 6.1% of the total population do not have a private vehicle. The Town should work with RIPTA to increase this percentage.
Bus Service Three Rhode Island Public Transportation Authority (RIPTA) bus routes provide regular service in Cumberland along two routes. The bus routes are as follows:
• Route 71 (Broad Street): Provides access to downtown Pawtucket, Central Falls, the entire segment of Broad St. in Cumberland. This route begins in downtown Pawtucket at the Pawtucket Transit Center and ends at the Stop and Shop Supermarket Plaza on Mendon Rd./Route 122.
• Route 75 (Dexter Street/Lincoln Mall): Provides access to downtown Pawtucket, Lonsdale Avenue, and Mendon Rd. in Cumberland as it winds its way along Rt 116 through Lincoln to the Lincoln Mall.
In 2003 there were two additional routes that provided additional service to Cumberland residents on a limited service to Lincoln and Woonsocket, these were routes 88 and 90. These routes are no longer in service. The current RIPTA bus routes are shown in the accompanying Transportation/Circulation map.
Paratransit/Elderly Transportation The Cumberland Senior Center owns and operates a van transportation service for members of the Center. Transportation for regional workshops, meal sites, medical treatment, and purposes is also available to segments of the elderly and disables population from operators including:
• Northwest Transportation Services (Woonsocket)
• Blackstone Valley Chapter, RIARC (Pawtucket)

2016 | Cumberland Comprehensive Plan | 7. TRANSPORTATION 141
• Comprehensive Older Adult Services, Inc. (Pawtucket)
• R.I. Chapter of the National Multiple Sclerosis Society (Cranston)
• United Cerebral Palsy of R.I. (Pawtucket)
• RIPTA - RIDE Program (ADA Complementary Paratransit Service)
Commuter Rail While no commuter railroads or stations are located within Cumberland itself, commuter rail service to Boston via the Massachusetts Bay Transit Authority (MBTA) is close by in Attleboro, South Attleboro, and Providence. Amtrak service, including the Acela Express, is available at Providence Station as well.
Rhode Island’s 2014 State Rail Plan (Report 117) calls for “Blackstone Valley Passenger Service”, adding a new commuter rail service from Pawtucket/Central Falls to Woonsocket. This is important because the State is formally adopted this initiative after many years of study by advocates, including the cities of Pawtucket and Woonsocket.
The proposed intrastate commuter rail service dovetails with several projects already underway, in the planning stages, or previously studied, including a Pawtucket station on the MBTA commuter rail line. The proposed service would traverse 25 miles: 11 miles on the P&W line between Woonsocket and Pawtucket and 14 miles on Amtrak’s NEC from Pawtucket to Warwick as depicted below in Figure 34.
Four service options were reviewed. Option 1 provides 17 daily round trips between Woonsocket and Warwick with 17 connections to MBTA commuter rail at Pawtucket. Option 2 includes adjustments to allow 14 South County trains to make direct connections between Cranston and Boston. Options 1A and 2A assume a 100 percent increase in freight service along the shared portions of the corridor, which would require dropping one midday passenger rail trip.
The study, conducted in 2009, identified the following requirements for moving forward: complete South County Commuter Rail Phase I to T.F. Green Airport and associated improvements to NEC infrastructure (opened in 2010); establish a Pawtucket Station for commuter rail service to Boston; and continue discussion with Providence & Worcester Railroad regarding support for passenger service between Woonsocket and Pawtucket. Another study conducted in 2009, Rhode Island Intrastate Commuter Rail: Feasibility Study, also examines the potential for commuter rail in the Woonsocket, Pawtucket, and Cumberland areas. A potential in location for a Cumberland commuter station would be at Ann and Hope Way. A parking lot of approximately 300 spots would require nearly 49,000 sq. ft. of space. A total of 1,248o new riders are forecasted to use rail transit from the Woonsocket-Pawtucket Corridor to Providence and Woonsocket and Cumberland to Boston. Adding an intrastate rail service linking Woonsocket and Warwick via Providence would provide additional transportation options within Rhode Island, which would be readily accessible to approximately two-thirds of the state’s residents. The Rhode Island Intrastate Commuter Rail study recommends that the intrastate service be developed in cooperation with the P&W, Amtrak, and MBTA. Early action items could include collaboration with the P&W to use “existing passenger rolling stock to offer…service between Woonsocket and Warwick,” but only add stations in Cumberland and Olneyville “as local interest and funding permit.” The study offers more insight into the details of these potential investments. Further, the Town wants to work with the Providence and Worcester Railroad in ensuring adequate accounting of hazardous cargo travelling through the Town and on hazard mitigation plans.

2016 | Cumberland Comprehensive Plan | 7. TRANSPORTATION 142
Potential Woonsocket Rail Service, RI State Rail Plan (Report 117) March, 2014 P&W Railroad Network in New England, RI State Rail Plan (Report 117) March, 2014.
Freight Rail
The Providence and Worcester (P&W) railroad provides the only interstate freight service in Rhode Island; one of its principal yard operations known as “Cumberland Switch” is located in Valley Falls.
Rhode Island does not have any operating Class I freight railroads. The last Class I railroad to operate in the state was the Consolidated Rail Corporation (Conrail) which sold its lines within Rhode Island to the Providence & Worcester Railroad (P&W) in 1982. P&W is a Class II or regional railroad which comprises approximately 516 miles and operates in Massachusetts, Rhode Island, Connecticut, and New York. The P&W Railroad owns and operates 29.3 miles in Rhode Island plus 8.9 miles of rail line owned by the State of Rhode Island. P&W also has trackage rights over Amtrak’s Northeast Corridor line from Providence to New York City.
The P&W main freight rail line generally follows the historic Blackstone River/Canal route (see Transportation/Circulation Map). Several spurs and sidings provide direct rail access to industries along the route.
The Wrentham Industrial Track was originally part of the R.I. Mining Railroad Company and later became part of the Rhode Island and Massachusetts Railroad with service from Valley Falls to Franklin, Massachusetts. The entire northern part of this route from Adamsdale to Franklin in Massachusetts was abandoned in 1941. The P & W. granted permission from the Interstate Commerce Commission, abandoned the Wrentham line when it became unprofitable.
Bikeways and Walkways
According to the RI Division of Statewide Planning, only 1.2 percent of Cumberland residents 16 and over commute by bicycle or walking. The Town should continue to work with DEM, RIPTA and other agencies to promote biking and walking.

2016 | Cumberland Comprehensive Plan | 7. TRANSPORTATION 143
Cumberland’s system of pedestrian walkways or bike paths began in 1991, when plans were introduced for a linear bike path along the Blackstone River, a bikeway along Route 116, and hiking trails for just north of Albion bridge and expansion of an informal trail system. Especially with major initiatives by the National Park Service, RIDEM and RIDOT, significant pedestrian and bicycle enhancement projects have been completed.
Blackstone River Bikepath, Ashton
The Blackstone River Bikepath The Blackstone River Bikeway is a 48-mile bi-state facility connecting Providence and Worcester, and runs along both banks of the Blackstone River through North Smithfield, Woonsocket, Lincoln, and Cumberland. Much of the trail is located on the land between the canal and the river. Dedicated parking lots are available at the north and southernmost ends. A pedestrian bridge under the Route 116 bridge provides access across the river. The trail is heavily used.
Planning began in the early 1980’s and the most recent projects completed by RIDOT around 1995. The Rhode Island Department of Environmental Management (DEM) owns and maintains the bike path and adjacent parkland, known as the Blackstone River & Canal State Park. The Blackstone River Canoe Trail also passes through the area. The bikeway is designated as an official section of the 2,600 mile East Coast Greenway. Notably, the FY17 Rhode Island state budget as proposed contains a bond referendum item including $10M to complete the Blackstone Bikepath.
An important opportunity to further enhance cycling and commuting alternatives to the automobile comes with a proposal for a $10M bond investment in completing the Blackstone Bikepath. This referendum item is expected to be before the voters in November, 2016. Cumberland should strongly back this measure.
Opportunities and Issues
Interestingly, while traffic volume on Diamond Hill Road and Mendon Road have increased considerably in recent years, traffic accidents have actually decreased. This is probably due to improved vehicle safety technology, state and local investments in signage and signaled traffic intersections, as well as traffic calming infrastructure improvements.
With one exception, all of the projects submitted under the Transportation Improvement Program (TIP) included in the 2003 Comprehensive Plan were completed as of 2014.

2016 | Cumberland Comprehensive Plan | 7. TRANSPORTATION 144
The design of roadways, when development projects or reconstruction provides chances of improvement, should be seen as an opportunity for traffic calming, planting of trees, softening the road edges, improving pedestrian, bus rider, and bicycling amenities, and making stretches of roadway more beautiful and in keeping with historic proportions.
Cumberland’s bike path and pedestrian walkway networks have grown remarkably since 2003. The Blackstone River Bike path from North Smithfield to Cumberland, almost completed, is heavily used by recreational and commuter cyclists. The emerging Cumberland Greenway Trail System (identified in the Open Space Element), is a high priority for the Town.
The 2014 State Rail Plan updated recommends commuter rail service between Woonsocket to Providence, including a station at the Pawtucket/Central Falls line. Cumberland should remain involved in developing these plans.
Transportation Goals
*See the Implementation Element for synopsis of Goals and Action Item implementation schedule, priority, and responsibilities.
State Planning Act Goals relevant to transportation are: To promote orderly growth and development that recognizes the natural characteristics of the land, its suitability for use and the availability of existing and proposed public and/or private services and facilities; To promote an economic climate which increases quality job opportunities and overall economic well-being of each municipality; To encourage the use of innovative development regulations and techniques that promote the development of land suitable for development while protecting our natural, cultural, historical and recreational resources and achieving a balanced pattern of land uses.
Goal: Make all modes of transportation safer, more efficient and better maintained.
Transportation Action Items
T1. Institute a multi-year pavement management program for Town roads, which is based on road condition, safety benefits, volume, and type of use, and coordination with RIDOT, especially as it relates to periodic review and rehabilitation for existing roads and future projects considered as part of the Transportation Improvement Plan process.
T2. Amend Land Development & Subdivision Regulations to require that a new subdivision roadways with the exception of the top or surface course must be completed, including drainage and services, to the satisfaction of the DPW Director and Engineer, prior to the construction of any building.
T3. For safety purposes, amend the Land Development & Subdivision Regulations to encourage connecting adjacent subdivisions, condominiums or other such development, but only where appropriate.
T4. Amend the Zoning and Land Development & Subdivision Regulations to include design specifications in "Cumberland's Vision: Using the Past to Enrich the Future", to transform the Town's transportation corridors into tree-lined greenways.
T5. For safety purposes, outdoor advertising, ie: commercial signage, shall strictly conform to the zoning code. Consistent with State regulations, digital LED signs shall not project intermittent light but once every 10 seconds. Such signs shall not be brighter than the ambient light of the area.

2016 | Cumberland Comprehensive Plan | 7. TRANSPORTATION 145
T6. Amend the Zoning Code to allow internally-lit business signs on Diamond Hill Road, from Country Hill Road and Little Pond County Road.
T7. Enhance pedestrian safety by installing crosswalks, sidewalks and other traffic enhancements as applicable, along Broad Street in the vicinity of Town Hall; on Mendon Road at the Cumberland High School; along Highland Avenue from High Street in the vicinity of the McCourt Middle School; and the High Street-Marshall Avenue intersection.
T8. Work to pass 2016 state bond referendum proposal including $10M for Blackstone bike path improvements, and advocate for new bike path installation for sections of Central Falls and Cumberland presently along municipal streets.
T9. Encourage investment in bicycling and mass transit as an alternatives to commuting by automobiles.
T10. Install wayfinding signs directing pedestrians and bicyclists from Blackstone Bike Path to local destinations.

WOONSOCKET
LINCOLN
CENTRAL FALLS
!G
!G
!G
!G
TOWN OF CUMBERLANDComprehensive Plan, 2016
MAP CIR-1
TRANSPORTATION /CIRCULATION
RHODE ISLAND
Prepared by:Town of Cumberland Planning Department
Mason & Associates, Inc.
µMap Sources:
0 0.5 10.25Miles
CT
MARI
Map Locus
LEGEND1 Interstate Highway & Expressway
2 Arterial Roadways
3 Collector Roadway
4 Local Roadway
Railroad
Bike Path
RIPTA Bus Route 2009
! RIPTA Bus Stop 2009
Town of Cumberland
0 10.5Kilometers
This map is for general planning use; featurelocations are approximate and not legally authoritative. The Town of Cumberlandmakes no warranty, express or implied,related to the accuracy of this map.
Valley Falls Detail
RISPP


2016 | Cumberland Comprehensive Plan | 8. NATURAL HAZARDS 147
8. NATURAL HAZARDS

2016 | Cumberland Comprehensive Plan | 8. NATURAL HAZARDS 148
Introduction
Natural hazards, including floods, hurricanes, forest fires, blizzards, tornadoes, wreak havoc on the built environment in unpredictable ways. Disasters occur when people and structures are adversely affected by these naturally occurring events. The degree of impact of natural hazards on communities is largely a function of land use planning decisions, which either increase or decrease the social, economic and health consequences of natural hazard events.
Hazard Mitigation consists of practices and actions that reduce the exposure to and detrimental effects of natural hazards. This would include: preventing development within areas prone to hazards (such as floodplains, steep slopes, and coastal areas): requiring new development to use low impact design methods (LID) to prevent alterations of existing natural features. Hazard Mitigation also includes addressing critical infrastructure needs such as: utilities (electricity, and other power supplies), telecommunication, the water supply (drinking water, waste water/sewage, stemming of surface water), public health (hospitals and ambulances), transportation systems, financial services, and security services (police and military). Developing specific mitigation strategies is a vital part of any local Hazard Mitigation plan including focusing the strengths and resources of the community in preventing higher costs as a result of future natural hazards.
Floods
Cumberland is a flood-prone community in which cultural, historical and economic resources are at risk. Several Blackstone River dams, within Cumberland as well as upstream, pose a potential significant risk. The Arnold Mills Dam on the Pawtucket Reservoir, listed as a high hazard by the State, poses a major risk to the Arnold Mills.
The Blackstone River flows south along the western border of Cumberland, and eventually into Narragansett Bay. The Blackstone River contains both “A” and “V” flood zones. An A-zone is an area that has a 1% risk of inundation in any given year, but not subject to velocity wave impact. A V-zone is a velocity zone that is subject to breaking wave action. Several smaller streams and brooks that run through the Town are also susceptible to flooding during periods of heavy rain, a potential threat to both residential and industrial property. Critical facilities located within flood zones, such as nursing homes, present a particular challenge to reducing risk.
The scale of a storm determines the impact of the flood. Cumberland has identified areas prone to flooding and has developed projects and plans to reduce the impact of future flooding. Flooding has been one of the most extensive natural hazards in Cumberland in recent decades. In March of 2010, records amounts of rainfall caused the Blackstone River to overrun its banks and cause millions of dollars in damage throughout Town.

2016 | Cumberland Comprehensive Plan | 8. NATURAL HAZARDS 149
Table 47: Heavy Rain/Flooding for Providence County
Date Rainfall Comments 1997 November 11 2.54” No Damage Reported
1998 February 18 2-3” Flooding in poor drainage areas
1998 February 23 2” Flooding in poor drainage areas
1998 March 8 2-4” Scattered power outages, Flood-prone properties flooded, Flooding in poor drainage areas, Blackstone River reached 10.3’ at Woonsocket, Several Parking areas flooded
1998 June 13 7-8” Minor flooding along Blackstone River reaching 9.14’, Cass pond in Woonsocket flooded
1999 September 10
3-5” Flooding in poor drainage areas
1999 September 16
2-5” Trees downed, Scattered power outages, flooding in low-lying areas; poor drainage areas
2003 March 29 2-3” Flooding in poor drainage areas
2003 May 26 2.4” Flooding in poor drainage areas
2004 April 14 2-4” Roads closed in low lying areas
2005 October 15 2.5” – 4.5” 500 evacuations across the region; over $340K in damage reported
2006 June 7 2” to 4” Over $20K damage reported
2007 March 2 2” to 3” Significant urban/small stream flooding; roads closed and cars stranded
2010 March 30 5.71” Blackstone River crested at 14.4 feet
2011 September 8 4” to 6” Flooding in poor drainage areas
Source: National Climate Data Center; 2016 Cumberland Hazard Mitigation Plan
In the period March 12-31, 2010 Rhode Island experienced a series of torrential rain events affecting every corner of the state. The Pawtuxet River crested at 14.98 feet, breaking the previous 1982 record of 14.5 feet. The Blackstone crested at 14.4 feet, 2.4 feet above its Moderate flood stage.
When the Blackstone River threatened to isolate the One Mendon Road senior housing complex, Cumberland officials declared a mandatory evacuation of its 200 residents. Police evacuated residents in daylight while wheeled vehicles could still get to the building.
Mendon Road was closed to through-traffic from Broad Street to the Lincoln town line. Flooding collapsed a section of Nate Whipple Highway near the North Cumberland Middle School, a road section just rebuilt with $3 million in federal stimulus money.
The flooding caused $1 million in damage at Hope Global, a 125-year-old textile company that makes products such as straps for automotive companies and shoelaces for the military and employs about 300 people in its factory located close to the Blackstone. Only five years earlier, another flood caused $6 million in damage.
2010 Flooding at the Ashton Mill

2016 | Cumberland Comprehensive Plan | 8. NATURAL HAZARDS 150
Hazard Mitigation Plan and Mitigation Grant Activities
Cumberland adopted its Town Hazard Mitigation Plan on August 11, 2011. A Hazard Mitigation Plan identifies natural hazards affecting the town and the risks they present to property in terms of potential losses. The plan also identifies measures currently in place and those that could be implemented in the future to mitigate such natural disasters. Categories of natural hazards that are usually addressed in a hazards mitigation plan are: flooding, wind, fire, ice and snow events, and earthquake.
In order to be eligible for certain FEMA mitigation grant programs a municipality must be a member of the National Flood Insurance Program (NFIP) and have an adopted and FEMA approved local Hazard Mitigation Plan. Local Hazard Mitigation Plans must be updated every 5 years and approved by FEMA. Cumberland’s current Hazard Mitigation Plan is effective until November of 2016, when it will then expire. The Department of Planning and Community Development staff applied for and received a $20,000 grant from FEMA in June of 2014 to updates its current local Hazard Mitigation Plan.
In addition to the Hazard Mitigation Plan grant, the Planning Department has completed a Floodplain property buyout and demolition project at 35 Wildwood St. This hazard mitigation project was funded through two federal grants; a FEMA Hazard Mitigation Grant Program grant (HMGP) in the amount of $222,158 and a Disaster Recovery Community Development Block Grant (CDBG-DR) in the amount of $79,053 and counts as the required 25% match for the FEMA HMGP grant for the project. These funds were available because of the historic March 2010 floods that impacted communities throughout Rhode Island. The land is now open space and the Town is considering a future use as a potential community garden.
In May of 2015 the Town of Cumberland was awarded a hazard mitigation grant in the amount of $10,000 to purchase and install an emergency generator at the Town’s Rescue Department at 1512 Mendon Rd. The Rescue Department has been without an emergency generator for their facility for several years. In December of 2015 the new generator was installed at their facility and has been tested and running in 2016. This hazard mitigation grant is now in the process of being closed out.
Army Corps of Engineers Flood Feasibility Study. In 2008 the New England District conducted a Section 905(b) Reconnaissance Study of the Blackstone River flooding from October of 2005 and it’s impact upon the communities of Woonsocket, Lincoln, Cumberland, and Central Falls to determine whether there was a Federal (Army Corps) interest in participating in a detailed cost shared Feasibility Study to improving flood risk management along the Blackstone River in Rhode Island. The reconnaissance study resulted in the finding that there is a Federal interest in continuing the study into the Feasibility phase, specifically for the Berkeley Industrial Park in the town of Cumberland. The Army Corps of Engineers moved forward with a Flood Feasibility Study which was funded with money from the Army Corps of Engineers as well as local match from State of Rhode Island CDBG-DR funds as well as local funds from the Town of Cumberland.
In June of 2014, the Army Corps of Engineers published, “Blackstone River at Cumberland, Rhode Island, Flood Risk Management Feasibility Study”. The study addressed the impacts of flooding on Martin Street business along the Blackstone River and proposed costs of flood mitigation measures such as levees and hard armoring along the Blackstone to protect these businesses. The findings of the Army Corps report stated that the estimated costs of flood control measures along the Blackstone River could not meet the Cost/Benefit procedures for any of the projects to move forward as they would be too costly for the Army Corps to justify. The findings stated that, “no cost effective, implementable plan was identified to manage flood risk within the study area: and therefore closed out the Federal action.
After this determination, the Town of Cumberland applied to the State Division of Planning for CDBG-DR funds for flood mitigation assistance for Hope Global to elevate their company’s critical business equipment above the base flood elevation. In January of 2015 the Town was awarded a $1,525,000 grant award through the Community Development Block Grant-Disaster Recovery Program (CDBG-DR) to assist Hope Global with flood mitigation. This project is ongoing as of 2016.

2016 | Cumberland Comprehensive Plan | 8. NATURAL HAZARDS 151
The New England District began the Flood Mitigation Feasibility Study in November 2011 with the Rhode Island Department of Administration serving as the non-federal sponsor for the project. A project kickoff meeting was held on Dec. 14, 2011 at the Cumberland Town Hall to describe the scope of the Feasibility Study. A coordinated site visit was conducted on Jan. 18, 2012 involving project stakeholders from Federal, state and local agencies as well as non-governmental organizations. Plan formulation, design alternative development, economic analysis and hydrologic and hydraulic studies are currently underway by the New England District study team as part of this project and proposals to protect Hope Global from future catastrophic floods are being reviewed by stakeholders.
FEMA Mitigation Grant Programs
FEMA currently has three mitigation grant programs: the Pre-Disaster Mitigation (PDM) Program, the Flood Mitigation Assistance (FMA) Program, and the Hazards Mitigation Grant Program (HMGP). Generally, the PDM and FMA grant programs are useful when making improvements before disaster events occur. The HMGP grant programs are generally available after a major disaster declaration is made. Each program is described in detail below.
Pre-Disaster Mitigation Program (PDM) The PDM Program was authorized by § 203 of the Stafford Act. Funding for the program is provided through the National Pre-Disaster Mitigation Fund to assist states, local governments, and Indian tribal governments in implementing cost-effective hazard mitigation activities that complement a comprehensive mitigation program. FEMA’s aim in funding these plans and projects is supposed to reduce overall risks to the population and structures, while also reducing reliance on funding from actual disaster declarations. PDM grants are awarded on a competitive basis and without reference to state allocations, quotas, or other formula-based allocation of funds.
All applicants must be participating in the National Flood Insurance Program (NFIP) if they have been identified through NFIP as having a special Flood Hazard Area (A Flood Hazard Boundary Map [FHBM] or Flood Insurance Rate Map [FIRM] has been issued).
In addition, the local governments and Indian tribal governments applying for PDM funds through the states will have to have an approved local mitigation plan prior to the approval of local mitigation project grants. States will also be required to have an approved standard state mitigation plan in order to receive PDM funds for state or local mitigation projects after November 1, 2004. Therefore, the development of state and local multiple-hazard mitigation plans is key to maintaining eligibility for future PDM funding.
The Flood Mitigation Assistance (FMA) Program provides funding to assist states and communities in implementing measures to reduce or eliminate the long-term risk of flood damage to buildings, manufactured homes, and other structures insurable under the National Flood Insurance Program (NFIP). Three types of grants are available under FMA: planning, project, and technical assistance grants. FMA planning grants are available to states and communities to prepare flood mitigation plans. NFIP-participating communities with approved flood mitigation plans can apply for FMA project grants. FMA project grants are available to states and NFIP-participating communities to implement measures to reduce flood losses. Ten percent of the project grant is made available to states as a technical assistance grant. These funds may be used by the state to help administer the program. Communities receiving FMA planning and project grants must be participating in the NFIP. An example of eligible FMA projects includes the elevation, acquisition, and relocation of NFIP- insured structures. Funding for the program is provided through the National Flood Insurance Fund, and FMA is funded at $20 million nationally on average. States are encouraged to prioritize FMA project grant applications that include repetitive loss properties. The FY2013 FMA emphasis encouraged states and communities to address target repetitive loss properties identified in the agency’s repetitive loss strategy. These include structures with four or more losses and structures with two or more losses in which

2016 | Cumberland Comprehensive Plan | 8. NATURAL HAZARDS 152
cumulative payments have exceeded the property value. State and communities are also encouraged to develop plans that address the mitigation of these target repetitive loss properties.
Hazard Mitigation Grant Program (HMGP) Authorized under section 404 of the Stafford Act, the Hazard Mitigation Grant Program (HMGP) provides grants to states and local governments to implement long-term hazard mitigation measures after a major disaster declaration. The purpose of the program is to reduce the loss of life and property due to natural disasters and to enable mitigation measures to be implemented during the immediate recovery from a disaster declaration. Hazard Mitigation Grant Program funding is only available in states following a presidential disaster declaration.
Eligible applicants include state and local governments, Native American tribes or other tribal organizations, and certain private nonprofit organizations.
Individual homeowners and businesses may not apply directly to the program; however, a community may apply on their behalf. HMGP funds may be used to fund projects that may reduce or eliminate the losses from future disasters. Projects must provide a long term solution to a problem – for example, elevation of a home to reduce the risk of flood damages as opposed to buying sandbags and pumps to fight the flood. In addition, a project’s potential savings must be more than the cost of implementing the project. Funds may be used to protect either public or private property or to purchase property that has been subjected to, or is in danger of, repetitive damage.
Natural Hazards Profile
The State Comprehensive Plan “Standards and Guidance” (2014) states “Comprehensive plans and hazard mitigation plans should be reciprocal” (information contained within the Town hazard mitigation plan should serve as the basis for addressing natural hazards in the comprehensive plan). Conversely, the goals, policies, and implementation program of the comprehensive plan can reinforce the strategies detailed within the hazard mitigation plan. The Natural Hazards Profile (see Appendix “E”) is largely drawn from the existing analysis in the Town’s 2011 hazard mitigation plan.
Hazard Profile Summary The Hazard Profile Summary Table below lists the specific hazards that can affect Cumberland along with specifics regarding frequency of occurrence, magnitude, (% of community affected), speed of onset (warning time), seasonal patterns, and possible affects to the community and risk priority. The Hazard Mitigation Committee reviewed the previous table and made minor adjustments as well as added a few more hazards.
Earthquakes in New England

2016 | Cumberland Comprehensive Plan | 8. NATURAL HAZARDS 153
Table 48: Hazard Profile Summary
Hazard Frequency* Magnitude** Speed
of Onset
Seasonal Pattern
Possible Affects Risk
Priority***
Heavy Rains/
Flooding
Highly Likely
Critical 12-24hrs Spring and
Summer
Flooding, property damage, roads closed,
dams breached
High
Nor’easter Snowstorm
Highly Likely
Critical 12-24 hrs.
Winter Power outages, poor travel conditions, School/businesses
closed
High
Ice Storm Possible Critical 12-24hrs Winter Limited Water use, Power outages, poor
travel conditions, downed tree limbs, Schools businesses
closed
High
Wind Event Highly Likely
Critical 12-24hrs Any Season
Property Damage, power outages,
downed trees and limbs
High
Hurricane Likely Limited 24+ hrs June-Nov Flooding, downed trees, power outages, property damage, loss
of life
Medium
Wildfire Possible Limited to Negligible
Minimal Any Season
Property and Environmental
Damage
Medium
Tornado Possible Critical Minimal Summer, Spring,
Fall
Downed trees, power outages, property
damage, loss of life
Medium
Extreme Heat
Likely Limited 24+ Summer Power Outages, Loss of life, Limited water
use
Medium
Drought Possible Critical 24+ Summer, Fall
Loss of water supply, increased Fire Hazards
Medium
Hail Possible Negligible Minimal Summer Property Damage Low
Lightning Highly Likely
Negligible 6-12hrs Spring, Summer,
Fall
Property Damage, Fire Low
Earthquake Possible Critical Minimal Any Season
Loss of Life, property damage, power
outages
Low
*Highly likely= near 100% probability within the next year; Likely=between 10% and 100% probability within the next year or at least one chance in the next 10 years, Possible=between 1% and 10% probability within the next year or at least one chance in the next 100 years, unlikely=less than 1% probability in next 100 years. **Catastrophic=more than 50% of community affected; Critical=25% to 50% affected; Limited= 10% to 25% affected, Negligible=Less than 10% affected. *** Risk Priority is based on historical damage, safety of the population, property protection and consistency with Town-wide goals and objectives.

2016 | Cumberland Comprehensive Plan | 8. NATURAL HAZARDS 154
National Flood Insurance Program (NFIP) Cumberland gained entrance to the National Flood Insurance Program (NFIP) in 1980. NFIP flood maps were most recently updated in 2015. New Preliminary Flood Maps were made available to the Town of Cumberland in the Spring of 2015 through the FEMA RiskMap process. The new flood maps were adopted by local ordinance and became effective as of September 23, 2015 by a 6-0 Ordinance Amendment vote of the Town Council. The Town currently has eleven repetitive loss structures. Cumberland has also begun to implement the NFIP’s Community Rating System (CRS), a voluntary incentive program that recognizes and encourages community floodplain management activities exceeding minimum NFIP requirements.
Future Conditions: Impacts of Climate Change Extensive research performed by the Intergovernmental Panel on Climate Change shows Rhode Island’s climate is changing, and the impacts will be far-reaching. Although the state is working to reduce its contributions to climate change, some changes cannot be prevented. Expected changes include: increasing weather extremes, hotter, drier summers and wetter winters with increasing rainfall and rain intensity. There is also an expectation of secondary hazards, including: increased chance of wildland/urban interface fires, heat waves, insect infestation, drought, potable water shortages, flooding, erosion and landslides and sea level rise.
It has been scientifically established that air temperatures are rising (global mean temperature has increased 1.33°F over the last 100 years; in the US Northeast 1.5°F since 1900, and 1.7°F in Rhode Island between 1905 to 2006); and oceans are warming (globally, oceans have been warming consistently over the past 50 years, with 2007 as the warmest year on record, in the waters off the coast of southern New England average temperatures have increased by about 2.2°F since the 1970s, and in Narragansett Bay, winter surface temperatures have risen 4°F since the 1960s.
This warming process is expected to accelerate from now through the year 2100. The increased warming from climate change threatens human health and well-being in many ways, including: impacts from increased extreme weather events, wildfires, decreased air quality, threats to mental health, and illnesses transmitted by food, water, and disease carriers such as mosquitoes and ticks. Some of these health impacts are already underway in the United States. Public health actions, especially preparedness and prevention, can do much to protect people from some of the impacts of climate change. Early action provides the largest health benefits. As threats increase, our ability to adapt to future changes may be limited.
Scientists expect the Northeast climate to warm approximately 0.5˚F every ten years over the next several decades. This rate is more than three times faster than the warming experienced during the twentieth century. In Rhode Island, scientists project that average annual temperatures will be 1.9˚F higher by the 2020s when compared with the 1970-1999 average and 2.9˚F higher by the 2040s.
These projections are based on calculations that take into account human contributions to the accumulation of greenhouse gasses. Being man-made, these projections could be tempered, should efforts be made at reducing greenhouse contributions. While such efforts could slow warming, the impacts are expected to continue for decades.
Issues and Threats
Cumberland has experienced several significant natural disaster events since 2003, including major flooding events in 2005 and 2010, tropical storm Irene in 2011 and Hurricane Sandy in 2012. Such events have inspired a Town Hazard Mitigation Plan and its connection to this Comprehensive Plan. Cumberland has partnered with federal agencies including the Army Corps of Engineers and the Department of Housing and Urban Development (HUD) to plan for future hazard mitigation projects as well as analyze the economic, social, and environmental impact of future potential mitigation projects. The Town is currently in the process of completing a floodplain property buyout and is updating its Hazard Mitigation Plan.
2016 | Cumberland Comprehensive Plan | 8. NATURAL HAZARDS 155
The impact of Climate Change will exacerbate current trends with warming temperatures and a wetter cyclical rain pattern resulting in more recurring flooding events and impacts upon growing seasons and species diversity in flora and fauna. The Resilient Rhode Island Act, based on a 2014 report A Resilient Rhode Island: Being Practical about Climate Change, mandates statewide strategies be developed to deal with the environmental, social and economic contingencies of climate change in local communities (see http://www.resilientri.org/). The Act created an Executive Climate Change Coordinating Council and an Advisory Board, charged with assessing, integrating, and coordinating climate change efforts throughout state agencies and work with municipalities to support the development of sustainable and resilient communities. The Council is supposed to implement programs to achieve energy savings in state and municipal buildings to reduce greenhouse gases, reduce expenditures on energy, and stimulate economic and job development; and encourages municipalities to incorporate climate change adaptation into local hazard mitigation plans and, when feasible, into hazard mitigation projects. The Town will work with the Council to that end.
Cumberland should coordinate its long term infrastructure and capital planning to assure disaster avoidance in the decades to come, including expanding its GIS database to include properties and streets prone to repeated flooding. Back up public safety and public water and sewer facilities should have emergency power available in event of a natural disaster.
Further, development standards should be strengthened to reflect the new impacts of climate change.
Natural Hazard Goals
*See the Implementation Element for synopsis of Goals and Action Item implementation schedule, priority, and responsibilities.
Goal: Reduce the risk of destruction from storms and other natural hazards.
Natural Hazard Action Items
NH1. Use GIS to inventory all Town Critical Infrastructure
NH2. Public Works Department will apply for funding to purchase and install back-up generators to power the public safety facilities, and water and sewer pumping stations during times of power loss.
NH3. Establish a priority list of repetitive flood streets.
NH4. Amend the Zoning Code and Land Development & Subdivision Regulations so that new construction is designed for a 50 year flood event.
NH5. For development, minimize impervious surfaces and review and if appropriate, reduce lot coverage percentages.

Valley FallsFire Department / Rescue 2
PublicLibrary
CumberlandPolice
Department
North CumberlandFire Department
Cumberland HillFire Department
CumberlandFire District /
Rescue 1
John J. McLaughlinCumberland Hill School
NorthCumberland
Middle School
CumberlandHigh School
Ashton School
CommunitySchool
Garvin MemorialSchool
Joseph L. McCourtMiddle School
B.F. NortonElementary School
CumberlandTown Hall
Public Works
CumberlandWater
CumberlandParks &
Recreation
Public Works
WOONSOCKET
LINCOLN
CENTRAL FALLS
Shelter
Shelter
TOWN OF CUMBERLANDComprehensive Plan, 2016
MAP NH-1
NATURAL HAZARDS& MITIGATION
RHODE ISLAND
Prepared by:Town of Cumberland Planning Department
Mason & Associates, Inc.
µMap Sources:
0 0.5 10.25Miles
CT
MARI
Map Locus
LEGENDCritical Facilities & Infrastructureñ Town Hall
²³P Police Station
²³F Fire Station
n Public School
Æc Library
²³d Public Works
²³Þ Cumberland Water
k Sewer Pumping Stations
Electric Transmission Lines
Gas Pipeline
Evacuation Routes
Major Roads (Class 1 & 2)
Minor Roads (Class 3 & 4)Dams - Risk Category"/ High / Significant
") OtherFlood Hazard Areas
Flood Zones (FEMA)
0 10.5Kilometers
This map is for general planning use; featurelocations are approximate and not legally authoritative. The Town of Cumberlandmakes no warranty, express or implied,related to the accuracy of this map.

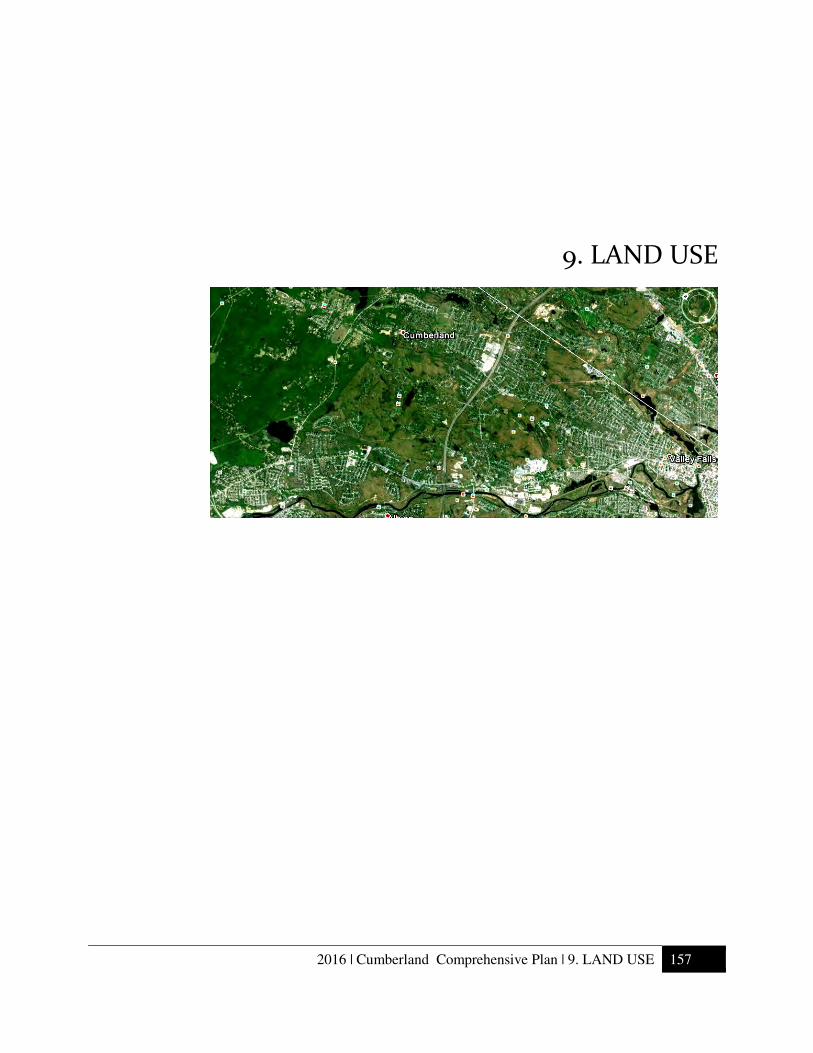
2016 | Cumberland Comprehensive Plan | 9. LAND USE 157
9. LAND USE

2016 | Cumberland Comprehensive Plan | 9. LAND USE 158
Introduction
Land use is the principal focus of the comprehensive planning process. It integrates all of the other elements of the Plan. This element describes historic and existing land uses in Cumberland and proposes a pattern of future land uses. These proposed future land uses are then compared to the existing zoning ordinance to identify inconsistencies, areas where the zoning ordinance may have to be amended to achieve the proposed future land uses.
Historic Land Use
Cumberland's natural environment greatly influenced the way in which the community was developed. Hilly, wooded uplands, numerous streams and ponds, and the Blackstone River all contributed to Cumberland’s pattern of development. Early European settlers established small farms and agricultural settlements in the seventeenth and early eighteenth centuries. Gristmills for grinding grain grown on the farms and sawmills for processing forest timber into lumber were erected along the rivers and streams. In the eighteenth and nineteenth centuries, Cumberland evolved from its colonial beginnings as a series of scattered agricultural settlements to form established hamlets centered around a church, a mill, or a shop. Cumberland's rich mineral deposits and readily available water power led to the establishment of early industries. Iron ore was mined and manufactured at several locations in Cumberland until the time of the American Revolution. Granite was quarried at Diamond Hill and coal was mined in Valley Falls. The industrial use of waterpower transformed the western and southern sections of Cumberland into mill villages which still retain their names today: Ashton, Berkeley, and Lonsdale.
The first cotton mill, erected around 1800 at Robin Hollow, was followed by a second at nearby Happy Hollow around 1818. Originally isolated, they became connected with larger markets with the completion of the Blackstone Canal in 1828 and the Providence & Worcester Railroad in 1847, which linked them to the length of the Blackstone Valley and to the regional urban centers of Providence and Worcester. A smaller railroad line completed in 1877 connected the eastern part of Cumberland to Franklin, Massachusetts.
In the eastern part of Cumberland, along Abbott Run, a machine shop was erected in 1825 at the small hamlet of Arnold Mills. Saw and grist mills continued in operation at Grants Mill and other scattered locations in the agricultural uplands. Granite quarrying near Diamond Hill, as well as less profitable coal, copper, and other mineral mining acted as a catalyst for development in that area. Massive railroad and roadway bridges built over the Blackstone River, and smaller iron truss bridges built on secondary roads, helped connect different hamlets of the Town.
Berkeley Mill (1873)
The heavily industrialized village of Woonsocket Falls, located in the northwest corner of Cumberland, became a separate Town in 1867. This shifted the political center of town from Cumberland Hill to Valley

2016 | Cumberland Comprehensive Plan | 9. LAND USE 159
Falls, where the present Town Hall was built in 1894. In the late nineteenth and twentieth centuries, Valley Falls emerged as the Cumberland’s largest and most densely developed village. The Great Depression marked the end of the American Industrial Revolution era for the Blackstone River Valley mills, and ever since there has been a quest to adaptively re-use these historic structures in an economically and socially beneficial way. There have been successes, including converting the Ashton Mill into condominiums in the early 2000’s and a recent conversion of the Berkeley Mill (ca. 1873) into upscale offices. Others, including the Naushon Mill are vacant. The Anne and Hope Mill, survive on occupancy of a number of small business tenants. The Cadillac Mill still houses industrial uses.
The advent of the automobile era in the 1920’s spurred a transformation of the Cumberland’s roadways continuing into the 1980’s, and included new east-west thoroughfares of Nate Whipple Highway and Interstate I-295. In the post-World War II era Major arterial roads such as Mendon Road and Diamond Hill Road have attracted intense commercial development, especially in nodes adjacent to I-295. This has created drive time traffic congestion and safety concerns.
Impact of Modern Development
The wide availability of automobiles since World War II has profoundly transformed land use in Cumberland, from a landscape of forests, fields and mill villages to the sprawling commuter community it is today. A convenient distance from a strong Boston economy and with relatively modest real estate prices, Cumberland has been subject to a sustained demand for new residential housing close to the I-295 corridor.
Subdivision built around 1980, notable for uniform period “Raised Ranch” architecture and no street trees
Subdivisions and condominium complexes proliferate, increasingly onto farmland or squeezed onto land subject to wetlands, ledge, poor drainage, steep slopes and other development constraints. This new development often features engineering and landscape installations that significantly alter the once-appealing character of the area. Many believe that such alterations should be minimized and designed to preserve the natural integrity of the land.
Subdivisions approved before the mid-1990s can lock in development which significantly alters the natural landscape. Town officials are bound by these plan specifications, unless there are issues with delivery of water or sewer service, or public safety is compromised.

2016 | Cumberland Comprehensive Plan | 9. LAND USE 160
Subdivisions approved before 1994 gives Town little control over radical transformation of natural landscape
While present state and municipal regulations are more effective in mitigating impacts of development, additional improvements articulated within this Plan should be adopted by the Town.
St. Patrick’s Church (ca. 1890) and Broad Street today, notable for vinyl clad period buildings, infill and vacant lots.
Cumberland’s urban villages are also suffering a loss of character. The original village main streets such as Broad Street and Mendon Road at Ashton and Berkeley have lost much of their historic charm because many of the original structures fronting on these “main streets” were torn down and replaced by a hodge-podge of modern commercial architecture set back from the road. Also detracting from the historic fabric is the proliferation of vinyl siding and window replacement which alter and obscure architectural detail of many nineteenth century houses and commercial buildings. Over the years, street trees have been lost and not replaced.
Blackstone River State Bikeway, part of the new Blackstone Valley National Park
Vision for the Future
At the same time, there is hope. Congress in 2015 designated a new National Park for the Blackstone River Valley. The National Park Service, Blackstone River Valley National Heritage Corridor Commission, RIDEM and others seek to integrate environmental stewardship, historic preservation, cultural celebration, tourism, and physical linkages to the new National Park. Cumberland should take full advantage of this new initiative to declare that the Town’s links to its past should be enhanced and not compromised.

2016 | Cumberland Comprehensive Plan | 9. LAND USE 161
In the last decade, Cumberland has made remarkable progress in preserving open space. Partnering with the Cumberland Land Trust, the Town should continue to acquire development rights or other tools effective in precluding development, and build a contiguous trail network in the process.
As Cumberland approaches build-out, the Town faces important choices. In this element land use policies are considered and Action Items at the end of this chapter specify the means to achieve the direction the Town needs to take to direct development that will occur.
The Town wants to provide housing options for an aging population and add to the stock of affordable housing. The non-commercial tax base needs to grow. Community character and sensitive environmental areas need to be preserved as pressure mounts to build in areas without adequate infrastructure. Municipal, school and recreational facilities should have adequate space and development. Having lost half of its Agricultural land in just the last sixteen years, farming should be supported and encouraged.
Land Use Analysis Categories
State GIS land use data for 1988, 1995, and 2011 is based on interpretation of aerial photographs and by using analysis software. It is inexact science because aerial photographs are often shot at different scales and land use classifications differed. In addition, land use has continued to change since these data were analyzed. The tables below describe changes in developed land over the past 26 years, but should only be understood as a general measurement of change. Since the adoption of the 2004 Comprehensive Plan Update, the Town has actually experienced more residential growth, and placed more land into conservation. The RIGIS 2011 data does not accurately reflect these changes since 2004.
As such, the date summaries below will be prefaced with some cautionary explanations. Because of the different methodologies used in classifying land use in Rhode Island, and because the State Planning System’s classification system is more detailed than is necessary for identifying major trends in land use in town, information from these three studies has been combined into several general categories so that information can be more easily compared. These categories are further generalized into Agricultural, Developed, and Open Space Categories. Definitions of these categories are shown in Table 496, while land use as of 2011 is illustrated in the accompanying Existing Land Use map.
Table 49: Land Use Categories
Category Definition
Developed Land
Consists of residential, commercial, industrial, infrastructure, developed recreation, institutions, cemeteries, quarries, waste disposal areas, and vacant land located in urban areas.
Agricultural Includes tillable cropland, pasture, orchards, turf farms, and nurseries.
Open Space Land and water permanently protected from Development Vacant Land Land and water that is currently undeveloped or is developed for certain recreational
uses such as golf courses but has no permanent protection from future development.
Developed Land As shown in the table above, Developed Land consists of several different categories. While developed land as a whole has increased over the 1988-2011, from 33 percent to roughly 34 percent of Cumberland’s land area, not all categories of developed land have grown to the same degree.

2016 | Cumberland Comprehensive Plan | 9. LAND USE 162
Table 50: Developed Land
Land Use
1988 1995 2011
Acres % Land Acres % Land Acres % Land
Residential 4,533 25.1 4,784 26.5 4,821.04 26.62
Commercial 287 1.6 294 1.6 243.90 1.35
Industrial 280 1.5 314 1.7 252.52 1.39
Commercial/industrial mixed 0 0.0 7 0.0 0 0
Institutional 218 1.2 222 1.23 140.88 0.78
Transportation and Utilities 417 2.3 429 2.4 415.05 2.3
Recreational 134 0.7 149 0.8 137.15 0.75
Urban, Open and Cemeteries 67 0.4 103 0.6 129.55 0.71
Total 5,936 33 6,302 35 6,140 33.9
Source: GIS Analysis, Mason and Associates (2014)
Agricultural Cumberland lost half of its agricultural lands in just 16 years. Declining from 1,132 acres to 572 acres from 1995 to 2011, agricultural land is a premium. Initiatives such as Farm Fresh Rhode Island and the Food to Table movement places an increasing value on agricultural land, as sustainability and availability of local food sources has become an important economic development and consumer priority. Clearly, farms, pastures, and orchards that remain in northern Cumberland are at risk.
Residential Between 1960 and 2011, land consumed by residential use increased 58%, from 2,836 acres to 4,821 acres. The build out analyses reveals that between 2,500 and 4,000 new residential units could be built, increasing Cumberland’s population 19 percent, from 33,500 to 40,000.
Most residential development will take place north of I-295. Development in this area is not in the Town’s best interest. This area is in a public drinking water supply source watershed, and conversion of fields and woodlands run contrary to the conservation goals of the Town.
Residential land use can be broken into three categories based on population density: low density, less than 0.5 units/acre; medium density, 0.5-4 units/acre; and high density, greater than 4 units/acre. Most of the residential growth between 1988 and 2011 occurred in the medium density residential category.
Open Space and Recreation In the face of intense development pressure, over 2,000 acres of land have been preserved in the past ten years, bringing the total acreage of protected land to over 5,000 acres.
Commercial Strip configuration proliferates along Mendon Road and Diamond Hill Road to a lesser degree. Retail and office uses such as stores, service stations and professional office buildings has remained fairly constant in recent years. Commercial land use occupies approximately 243 acres of land in Cumberland.
Industrial Between 1988 and 2011 the percentage of Cumberland’s industrially-developed land (such as manufacturing plants, warehouses and processing facilities, and sand and gravel extraction operations) remained constant. Over 250 acres of land in Cumberland were devoted to industrial use. Major concentrations of industrial land use occur along the Blackstone River and at the intersection of I-295 and Diamond Hill Road. New industrial development is still taking place at the Highland Corporate Park.

2016 | Cumberland Comprehensive Plan | 9. LAND USE 163
Institutional Institutional use has remained at one percent between 1988 to 2011. This land use includes public, educational, health, correctional, and religious facilities.
Undeveloped As of 2011, 9,855 acres were categorized as forest, brush land, water, wetland, and rock outcrops.
Future Land Use
This 2016 update of the Comprehensive Plan projects future land use that promotes sustainability, community character, economic progress, and protecting and enhancing the quality of life in Cumberland. The accompanying “Future Land Use 2036” Map and Land Use 2036 documents Cumberland’s optimal land use for the next twenty years.
Build-out Analysis The latest available build-out analysis projects Cumberland’s maximum population to be almost 42,000. Build-out analyses in 1990, the mid-1990’s and in 2000 each established the amount of land considered buildable in each zoning district, by subtracting land already developed and land not buildable (such as water and wetlands). Zoning regulations were then applied to determine the maximum number of units that could be built. Finally, the average number of residents per household was used to determine potential number of new residents at the build-out scenario. Because each study used different methods and assumptions results cannot be directly compared. However, the projections ended up being very similar. In addition, it must be noted that these build-out analyses represent conservative estimates of the development potential of the remaining vacant land in Cumberland. Because Cumberland’s current zoning regulations allow for higher development densities in areas serviced by sanitary sewers and municipal water, if so extended the maximum population would be higher than these projections.
Table 51: Population and Dwelling Unit Projections Based on Total Build Out, 1990-2000
Year Source New Residential
Units Additional Residents
Maximum Population
1990 Maguire Group 3,879 9,697 38,531
1995 Town of Cumberland
4,145 10,362 39,400
2000 BRVNHCC 2,453 10,057 41,897
The projected increase in population brings additional demand for infrastructure and services. Subdivision of land and construction of new housing will reduce the amount of open space and result in more children, eligible to enroll in Cumberland’s schools. Population increases put greater pressure on natural resources, especially drinking water quality and capacity. At build-out, additional water consumption could be as much as 750,000 gallons per day and as much as 25 tons of additional solid waste would be generated every year. Traffic congestion would correspondingly increase.
Best Practices for Managing Growth
Cumberland has tried a balanced approach that assures continue economic growth opportunities while preserving important assets such as large contiguous areas of open space and forest. However, with each new residential subdivision, Cumberland loses a little more of its open space and historic character. New housing also increases demand on services and infrastructure. The Town asks:

2016 | Cumberland Comprehensive Plan | 9. LAND USE 164
• How do we better manage the pace of growth?
• How do we ensure that future development is attractive, functional, and environmentally sound?
• How do we get the developers to contribute to support the infrastructure improvements necessary to support new development?
What are the best practices for managing growth?
• Adequate Public Facilities Standards – Allows growth in areas properly serviced by facilities and infrastructure, while prohibiting growth where facilities are inadequate.
• Rate of Growth Phased Programs – Establishes a set rate of growth based on studies that examine the community’s ability to absorb the impacts of growth.
• Growth Caps – Limits the amount of development that may occur in a year through caps on building permits issued.
• Impact/Conveyance fees – Requires new development to absorb the costs of municipal costs associated with the new development.
• Acquiring Open Space – Acquiring land so that it cannot be developed.
• Zoning – Using innovative techniques such as cluster subdivisions to reduce and manage growth
Securing open space
Since 2004 the Town has instituted an annual cap on building permits and also preserved over 1,500 acres (through purchase, easement, or the creation of conservation management plans):
The Monastery 525 acres Sneech Pond 330 acres Emerson Property 215 acres Blackall Property 119 acres Hines Farm 119 acres Staples Property 90 acres Franklin Farm 65 acres Anthony Lawrence Wildlife Preserve 60 acres Pratt Property 50 acres McGrath Property 17 acres Total 1590 acres

2016 | Cumberland Comprehensive Plan | 10. IMPLEMENTATION 165
Design Guidelines
After the 2003-2004 Comprehensive Plan was completed, “Cumberland’s Vision: Using the Past to Enrich the Future” established new design guidelines for Cumberland. The following schematic renderings show the elements of the design guidelines:
Figure 5: Mendon Rd./Rt.99 Gateway Vision at Grade

2016 | Cumberland Comprehensive Plan | 10. IMPLEMENTATION 166

2016 | Cumberland Comprehensive Plan | 10. IMPLEMENTATION 167
Future Land Use Category Definitions
The Town of Cumberland utilized RIGIS 2011 Land Use coverage GIS data for its 2011 Existing Land Use Map and 2036 Future Land Use Map. The definitions of these land use layers are derived from the short definitions provided by the GIS Metadata with the state data set. The Town of Cumberland Planning Department has defaulted to the Metadata descriptions as the starting point for our future land use categories, and then expanded upon those definitions where necessary. The following list consists of the definitions of the Town of Cumberland’s land use categories for the 2036 Future Land Use Map.
Low Density Residential
Less than 1 house per acre. Most of this future land use will take place in our A-1 and A-2 Agricultural Zoning Districts. Medium Density Residential 1 to 4 houses per acre. Most of this future land use will take place in our R-1 Zoning District. High Density Residential Greater than 4 houses per acre. Most of this future land use will take place in our R-2 and R-3 Residential Zoning Districts. Note – The classification of existing residential development is based on the size of the maintained yard area around the house, not the size of the lot. Existing housing density by lot will be lower where substantial portions of a lot remain undeveloped. Commercial Sales of products and services. Most of this future land use will take place in our C-1 and C-2 Commercial Zoning Districts. Industrial Manufacturing, design, and assembly. Most of this future land use will take place in our I-1 and I-2 Industrial Zoning Districts. Mixed Use Commercial/residential mixed use and commercial industrial mixed use. Most of this future land use will take place within Commercial or Industrial Zoning districts. The intent of this future land use category is to identify the parcels that have former historic mill sites that could be candidates for adaptive reuse for a mix of residential apartments and commercial or industrial uses. Some of these sites have been noted above in the Housing and Economic Development sections of this Comprehensive Plan. This future land use category is expected to be flexible in that it identifies areas of current or potential mixed uses which are compatible with smart growth principles that tailor choices that are appropriate for individual settings.

2016 | Cumberland Comprehensive Plan | 10. IMPLEMENTATION 168
Institutional Schools, hospitals, churches, and government buildings. Most of this future land use category will consist of land owned by the Town of Cumberland and dedicated to Town governmental functions such as public schools, libraries, recreation and athletic facilities, Town Hall and Public Safety facilities. This category is meant to overlap with the proposal to create a new Institutional Zoning District. Transportation and Utilities Public roads, railroads, water and sewage treatment, waste disposal, power lines, transportation terminals and docks. Cemeteries Land used or dedicated to the burial of the dead, including crematoriums, mausoleaums, and maintenance facilities. Developed Recreation All recreation land used for current and planned public recreational programming Agriculture Pasture, cropland, orchards, groves, nurseries, confined feeding operations, idle agriculture and abandoned fields and orchards. This future land use category is small as a portion of overall land use, but important as development pressure continues to erode the remaining working farms in Town. Undeveloped/Unprotected Vacant land, brushland, deciduous forest, softwood forest, mixed forest, beaches, sandy areas, rock outcrops, mines, quarries, and gravel pits, transition areas and mixed barren areas. In our Future Land Use Map, much of the forested undeveloped land is overtaken by residential development under current regulations. Water All surface water, rivers, lakes, and ponds. Wetland Areas identified as wetlands using the RIGIS wetlands dataset interpreted from 1988 aerial photography. Conservation
State, local, or non-profit conservation land.

2016 | Cumberland Comprehensive Plan | 10. IMPLEMENTATION 169
Directing Development and Density
The Zoning Ordinance continues to allow for conservation developments and planned unit developments. Design Guidelines have been developed since the 2003 Comprehensive Plan and are included in this section. A Technical Review Committee comprised of the Planning, Building, Engineering, Highway, Sewer, Water and Public Works offices review all subdivision and land development proposals to determine impacts upon water and sewer infrastructure, road building, public safety, and school enrollment. The Town continues to enforce existing ordinances pertaining to Soil Erosion and Sediment Control and Stormwater Runoff. Subdivision Regulations now also require plans that specify how these are to be handled on-site. Copies of the Zoning Map, Existing Land Use Map, and Future Land Use 2035 Maps are included at the end of this Plan section.
Element 1 “Housing and Neighborhoods”, Element 3 “Natural Resources, Element 4 “Cultural, Historic and Scenic Resources”, Element 6 “Recreation and Open Space”, and Element 7 “Transportation” promote policies intended to protect community character, conserve open space and sensitive environmental resources, and ensure orderly installation of infrastructure. Related action items specify important amendments to the Zoning Code and Development Regulations necessary to achieve tangible results.
Additionally, the Town should resist the temptation to rezone properties to allow significant intensification and/or increase in density. Whereas there is a stated need for certain housing, exceptions should be made for affordable housing and housing for the elderly and/or disabled.
Recommended Zoning Changes
In addition to the proposed zoning changes/or areas that ought to be considered for rezoning as described below, the accompanying “Future Land Use 2035 Map” illustrates the following areas:
• Low Density Residential allows single family homes on lots of 2 acres or more
• Medium Low Density Residential allows single family homes on lots of 1 to 2 acres
• Medium Density Residential allows residential housing on 1 to ¼ acres lots
• Protected Lands are under protected ownership or restrictive easements
Cumberland’s Zoning Ordinance has been amended several times since the original 1991 Plan. As a result, zoning is now substantially in conformance with the previous iterations of this Comprehensive Plan. Additional changes to zoning will be necessary in order to bring the zoning into conformance with the new Future Land Use 2036 map. These include some recommendations carried over from the 2004 Comprehensive Plan. Recommended updates include:
1. Modify zoning at Highland Corporate Park to allow for both commercial and industrial mixed uses, and have this reflected in the land used table of the Zoning Code.
2. Some residentially-zoned properties that have longstanding industrial uses no longer appropriate for residential development should be rezoned industrial. The areas referred to are near the end of Curran Rd.

2016 | Cumberland Comprehensive Plan | 10. IMPLEMENTATION 170
3. All publicly owned land is currently zoned as Open Space. Although an Open Space category is not specifically defined in the Zoning Ordinance, this may not be appropriate for land with schools and other public buildings on it. It is recommended that a “Public” category be created in the Zoning Ordinance for government owned property and that future versions of the Zoning Map should show these as zoned “Public”.
4. On Assessor’s Plat (AP) 1, the land between Abbott, Titus and High Street is zoned Industrial-1 when it is used almost entirely for residential purposes. This might be rezoned to Residential-3.
5. Between the railroad right of way and Curran Road, on Assessor’s Plat 5, the property is primarily used for single-family residential homes and thus should probably be rezoned Residential-1 and not Residential-2. The railroad right of way should be zoned “Public” rather than Residential-2
6. On Assessor’s Plat 6; lot 3 should probably be zoned Residential-2 instead of Commercial-1, as the property is surrounded by residential development and there is a house located on lot 3. There is a similar issue on Assessor’s Plat 10, where a lot on High Street is currently zoned Commercial-1, but should perhaps be considered for Residential-2 zoning.
7. Assessor’s Plat 18, lot 549 adjacent to the Miller’s Brook Subdivision is currently Agricultural-2, but based on the results of a recent legal case should probably be zoned Residential –1.
8. On Assessor’s Plat 27 between lots 23 and 27 there are a series of mixed commercial and residential uses along Diamond Hill Road. The east side of Diamond Hill should be rezoned C-1, and the west side rezoned R-1.
9. Several lots along Mendon Road on Assessor’s Plat 58 are currently zoned Industrial but in fact are being used for buildings with commercial activities on the ground floor and residential on the top floors. The Town should consider rezoning this area to reflect the actual uses, as mixed uses should be encouraged in this older, densely populated neighborhood.
10. The Jenna Way residential subdivision located off of Abbot Run Valley Road and adjacent to I-295 is shown as Zoned Industrial. The zoning designation should be changed to residential use.
11. The Berkeley Commons PUD shows up as C-2 General Commercial on the most recent Zoning Map, however, the development is primarily residential. Mixed use commercial and residential development is allowed under C-2 Zoning, but for a large development to show as C-2 on the Zoning Map it can be confusing when the actual development is residential as shown on the Existing Land Use map should be R-3.
12. Assessors Plat 16, lots 33-38 and 729 is vacant land on Mendon Road zoned C-1, and as commercial is not readily viable at that site, it is better suited for high density residential R-3.
13. The zoning designations for Chapel Four Corners should be reviewed to see if current zoning is still effective for the Town’s desired outcomes. A “Village Business” C-1 designation may be more appropriate should commercial development expand in this section of Town.

2016 | Cumberland Comprehensive Plan | 10. IMPLEMENTATION 171
Land Use Goals
*See the Implementation Element for synopsis of Goals and Action Item implementation schedule, priority, and responsibilities. Goal: Implement Land Use reforms. Goal: Sustain our municipality’s high quality of life and preserve its unique attributes Goal: Create walkable neighborhoods and a connected transportation network for all modes and people of all ages
Land Use Action Items
L1. Amend the text and map of the Zoning Ordinance so that it conforms with the Future Land Use Map 2036.
L2. Evaluate amending zoning of areas where established uses, such as commercial uses in a residential zone, are non-conforming.
L3. Refrain from granting zone changes representing a “significant” intensification and density increase (with the exception of appropriate affordable housing).
L4. Amend the zoning Code and Land Development & Subdivision Regulations to be consistent with “Cumberland’s Vision: Using the past to enrich the future”.
L5. The clearing of land for development should be restricted only to what is absolutely necessary for building envelopes, lawn areas, roads/infrastructure and septic leach fields. The Planning Board shall take a conservative approach in approving the clearing of natural vegetation on site and Site Plans shall specify enforceable limits of disturbance. Every effort shall be made to preserve significant trees, perimeter vegetation and other features such as stone walls and steep slopes existing prior to development. The clearing of raw land for development shall strictly follow Town-approved Soil Erosion and Sedimentation Control Plans or be subject to enforcement.”

?Í
Añ
Aâ
AØ
Aá
AØ
AÛ
%&b(
Aè
Aá
Aß
AØ
Aà
AØAá
Aá
Aã
Aâ
AÛ
!"̀$
Diamond Hill Reservoir
Arnold Mills Reservoir
Sneech Pond
Blackstone River
Miscoe Lake
Rawson Pond
Robin Hollow
Reservoir
Little Pond
Carls Pond
Howard Pond
Richards Pond
POU ND RD
DIAMOND HILL RDTORR EY R D
HINE
S RD
W W
RENT
HAM RD
RAWSON RD
NATE WHIPPLE HWY
HIGH ST
PINE SWAMP RD
MARSHALL AVHILLTOP RD
DEXTER ST
MENDON RD
CURR
AN R
D
BROAD ST
ANGEL
L RD
MENDON RD
STAPLES RD
SUMNER B R OWN RD
W RE NTHA
M RD
BURNT SWAMP RD
RESERVOIR R D
ABBOTT RUN VALLEY RD
LIT T L E POND C O UNTY RDLIPPITT AV
SCOT
T RD
ALBION RD
FARM DR
MANV
ILLE HILL RD
HIGHLAND CORPORA
TE DR
TOWER HILL RD
ELDER BALO U MEETING HOUSE RD
KAY ST
MART IN ST
HIGHLAND AV
BE AR HI LL RD
N ATTLEBORO RD
WOONSOCKET
LINCOLN
CENTRAL FALLS
TOWN OF CUMBERLANDComprehensive Plan, 2016
MAP S-1
2011 AERIALPHOTOGRAPH
RHODE ISLAND
Prepared by:Town of Cumberland Planning Department
Mason & Associates, Inc.
µMap Sources:
0 0.5 10.25Miles
CT
MARI
Map Locus
LEGENDTown Boundary
0 10.5Kilometers
This map is for general planning use; featurelocations are approximate and not legally authoritative. The Town of Cumberlandmakes no warranty, express or implied,related to the accuracy of this map.

WOONSOCKET
LINCOLN
CENTRAL FALLS
TOWN OF CUMBERLANDComprehensive Plan, 2016
MAP LU-1
EXISTING 2011LAND USE
RHODE ISLAND
Prepared by:Town of Cumberland Planning Department
Mason & Associates, Inc.
µMap Sources:
0 0.5 10.25Miles
CT
MARI
Map Locus
LEGENDLow Density Residential
Medium Low Density Residential
Medium Density Residential
Medium High Density Residential
High Density Residential
Commercial
Industrial
Mixed Use
Institutional
Transportation & Utilities
Cemeteries
Developed Recreation
Agricultural
Undeveloped/Unprotected
Water
Wetland
Protected Lands
0 10.5Kilometers
This map is for general planning use; featurelocations are approximate and not legally authoritative. The Town of Cumberlandmakes no warranty, express or implied,related to the accuracy of this map.
Residential Density Classification:High Density Residential: 8 or more houses per acreMedium High Density Residential: 4 - 8 houses per acreMedium Density Residential: 1 to 4 houses per acreMedium Low Density Residential: 1 house per 1 - 2 acresLow Density Residential: < 1 house per 2 acresNote: The classification of existing residentialdevelopment is based on the size of the maintained yardarea around the house, not the size of the lot. Existinghousing density by lot will be lower where substantialportions of a lot remain undeveloped.

WOONSOCKET
LINCOLN
CENTRAL FALLS
TOWN OF CUMBERLANDComprehensive Plan, 2016
MAP LU-2
EXISTINGZONING
RHODE ISLAND
Prepared by:Town of Cumberland Planning Department
Mason & Associates, Inc.
µMap Sources:
0 0.5 10.25Miles
CT
MARI
Map Locus
LEGENDZoning Districts
A-1 Agricultural - Low Density
A-2 Agricultural - Medium Density
C-1 Limited Commercial
C-2 General Commercial
I-1 Light Industrial
I-2 General Industrial
O-S Open Space
R-1 One Household - Low Density
R-2 Two Household - Medium Density
R-3 Multi-Household Dwelling
Town Historic Overlay Districts
Major Roads (Class 1 & 2)
Minor Roads (Class 3 & 4)
0 10.5Kilometers
This map is for general planning use; featurelocations are approximate and not legally authoritative. The Town of Cumberlandmakes no warranty, express or implied,related to the accuracy of this map.
Zoning Districts are from 2012 GIS mappingby AppGeo; an update to this GIS mappingis underway. Historic Overlay Districts arefrom Town GIS maps with the addition ofsome new parcels.
AppGeo

WOONSOCKET
LINCOLN
CENTRAL FALLS
TOWN OF CUMBERLANDComprehensive Plan, 2016
MAP LU-3
FUTURELAND USE 2036
RHODE ISLAND
Prepared by:Town of Cumberland Planning Department
Mason & Associates, Inc.
µMap Sources:
0 0.5 10.25Miles
CT
MARI
Map Locus
LEGENDLow Density Residential
Medium Density Residential
High Density Residential
Commercial
Industrial
Mixed Use
Institutional
Transportation & Utilities
Cemeteries
Developed Recreation
Agricultural
Undeveloped/Unprotected
Water
Wetland
Conservation
0 10.5Kilometers
This map is for general planning use; featurelocations are approximate and not legally authoritative. The Town of Cumberlandmakes no warranty, expressed or implied,related to the accuracy of this map.
Residential Density Classification:High Density Residential: > 4 houses per acreMedium Density Residential: 1 to 4 houses per acreLow Density Residential: < 1 house per acreNote: The classification of existing residential developmentis based on the size of the maintained yard area around thehouse, not the size of the lot. Existing housing density by lotwill be lower where substantial portions of a lot remainundeveloped.

Allow Commercial & Industrial Mixed Uses at Highland Corporate Park
Rezone Berkeley Commons PUD to R-3 to Reflect Primary Use
Review Zoning Designations at Chapel Four Corners for
Potential Village Business C-1
Rezone to R-1 to Reflect Existing Use (or Public for Railroad Right-of-Way)
Rezone to R-3 to Reflect Existing Use
Change Jenna Way Subdivision to Residential Zone
Rezone to R-3 to Reflect Site Suitability
Rezone to R-1 to Refelct Existing Use
Rezone to R-2 to Refelect Existing Use
Rezone to R-2 to Refelect Existing Use
Rezone to Reflect Existing Mixed Residential &
Commercial Uses
Rezone to Industrial to Reflect Existing Use
Rezone East Side to C-1, West Side to R-1
WOONSOCKET
LINCOLN
CENTRAL FALLS
TOWN OF CUMBERLANDComprehensive Plan, 2016
MAP LU-4
PROPOSED ZONING CHANGES
RHODE ISLAND
Prepared by:Town of Cumberland Planning Department
Mason & Associates, Inc.
µMap Sources:
0 0.5 10.25Miles
CT
MARI
Map Locus
LEGENDProposed Zoning Changes
Existing ZoningPrimary Zone
A-1 Agricultural - Low Density
A-2 Agricultural - Medium Density
C-1 Limited Commercial
C-2 General Commercial
I-1 Light Industrial
I-2 General Industrial
O-S Open Space
R-1 One Household - Low Density
R-2 Two Household - Medium Density
R-3 Multi-Household Dwelling
Water
0 10.5Kilometers
This map is for general planning use; featurelocations are approximate and not legally authoritative. The Town of Cumberlandmakes no warranty, expressed or implied,related to the accuracy of this map.
See text for complete description of recommended zoning changes.

2016 | Cumberland Comprehensive Plan | 10. IMPLEMENTATION 172
10. IMPLEMENTATION

2016 | Cumberland Comprehensive Plan | 10. IMPLEMENTATION 173
Cumberland has completed a lengthy process to revise the Comprehensive Community Plan, but much work remains to be done for the Plan to be successful: new regulations and policies; zoning revisions; planning studies; funding for capital projects. These details are spelled out in this Implementation Plan — a framework to move forward the Plan’s goals, objectives, policies and actions over the next decade.
ID Goals & Actions Priority Responsible Party Timeframe
1. Housing and Neighborhoods
H1 Actively engage non- profit housing partners to identify and evaluate existing structures or sites potentially feasible for affordable housing.
H Planning Department, Non-Profit Housing Partners, Housing Advisory Board
ongoing
H2 Strategically site streetscape improvements, signage, crosswalks and other amenities to maximize affordable housing opportunities.
M Planning Department, Building Office, CDBG, RIDOT, DPW, Cumberland Housing Authority, Non-Profit Housing Partners
1 - 3 years
H3 The Town should search its inventory of Town-owned land for the purpose of identifying buildable parcels potentially suitable for the development of affordable housing by the Cumberland Housing Authority or other affordable housing development partners.
M Planning Department, Assessors Office, CHA, Mayor, Non-Profit Housing Partners
1-3 years
H4 Amend the Zoning Code and Land Development & Subdivision Regulations to encourage development of affordable housing, including density bonuses, in designated areas by reducing dimensional standards such as setbacks, site coverage and height; and increasing density in those planning districts with available public facilities and services.
H Planning Department, Building Office, Non-Profit Housing Partners, Mayor, Planning Board, Town Council
Within 1 year
H5 Apply annually for additional CDBG funding for low and moderate-income housing rehabilitation assistance and other state and federal programs promoting affordable housing deemed effective and affordable by the Town and its non-profit housing partners.
H
Planning Department, Cumberland Housing Authority, Mayor
Ongoing
H6 Continue to support exempting affordable housing from the Town’s 1% building cap, revisiting its effectiveness within 5 years.
H Planning Department, Mayor, Building Official, Solicitor
Ongoing
H7 Work with Cumberland Housing Authority and other affordable housing partners to maximize availability of state and federal resources, including but not limited to Federal Low Income Housing Tax Credits (LIHTC).
M Planning Department, Cumberland Housing Authority, Non-Profit Affordable Housing Partners
Ongoing

2016 | Cumberland Comprehensive Plan | 10. IMPLEMENTATION 174
ID Goals & Actions Priority Responsible Party Timeframe
H8
Promote use of Federal and State Historic Tax Credits to help finance restoration and adaptive reuse of qualified historic structures to facilitate affordable housing.
M Planning Department, RI Historic Preservation and Heritage Commission, Cumberland Housing Authority, non-profit affordable housing partners
Ongoing
H9 Continue to base the tax assessment for affordable residential properties: on unit acquisition cost rather than “highest and best” market value; and affordable rental units on the property's previous years' gross scheduled rental income.
M Assessor’s Office, Planning Department, Mayor
2- 5 years
H10 Work with non-profit affordable housing partners to advocate for state housing policies and programs that will permit local Section 8 certificates managed by housing authorities and community development corporations to be counted toward the “official” inventory of LMI housing in the community.
M Planning Department, Cumberland Housing Authority, Non-Profit Affordable Housing Partners, Planning Board, Mayor, Town Council
ongoing
H11 Coordinate with local community land trusts to acquire and hold properties subject to foreclosure, short sale or tax sale for the purpose of creating affordable housing.
M Planning Department, Cumberland Housing Authority, non-profit affordable housing partners
ongoing
H12 Amend the Zoning Ordinance to allow comprehensive permit proposals that provide 50 percent or more LMI units to be granted a density increase of up to “one step” in the underlying zoning district, if they meet a particular need outlined in any one or more of the LMI strategies contained in the affordable housing production plan, provided that the planning and design of the proposed development shall not be inconsistent with the goals and policies of the other elements of this Comprehensive Plan, the site has adequate infrastructure, such as water, sewer, storm-water controls, roads, etc.
M
Planning Department, Cumberland Housing Authority, non-profit affordable housing partners, Mayor, Planning Board, Town Council,
1-5 years
H13 Amend the Land Development & Subdivision Regulations to require the inclusion of 20% LMI units in all land developments and subdivisions involving the creation of five (5) or more dwelling units, or a payment to a community housing land trust fund equal to the difference between the price of a finished housing unit within the project and the price of what an affordable unit would be.
M
Planning Department, Planning Board, Mayor, Town Council
1 - 5 years
H14 Amend the Zoning Ordinance and Land Development & Subdivision Regulations to permit LMI restricted land development projects specifically designed for seniors, to include rental and handicapped accessible units.
M Planning Department, Planning Board, Mayor, Town Council
1 - 5 years

2016 | Cumberland Comprehensive Plan | 10. IMPLEMENTATION 175
ID Goals & Actions Priority Responsible Party Timeframe
H15 Amend Zoning Code to be consistent with the Land Development & Subdivision Regulations in establishing enforceable standards for vegetated buffers and transition zones within zoning districts to prevent industrial, commercial and other incompatible uses adversely impacting abutting residential properties.
H Planning Department, Mayor, Planning Board, Town Council
Within 1 year
H16 Amend the Zoning Code and Land Development & Subdivision Regulations to encourage the restoration and adaptive re-use of mill complexes for mixed uses by reducing restrictions such as parking requirements, setbacks, site coverage and height.
H Planning Department, Building Office Planning Board, Mayor, Town Council
Within 1 year
H17 Create Neighborhoods Map based on original plats and evolution of neighborhoods over time, as means of identifying historic boundaries of neighborhoods.
L Historic District Commission, Library, Planning Department
1-3 years
H18 Apply/advocate for ADA federal and state funding for access and safety improvements for residential units occupied by elderly and disabled tenants/owners.
M
Planning Department, Mayor ongoing
H19 Continue property tax exemptions to disabled and elderly homeowners, promoting neighborhood stability.
M Mayor, Town Council Ongoing
H20 Enact extended property tax relief eligibility for elderly and disabled to include landlords who provide rental units that are occupied by elderly and certified disabled tenants
M Planning Department, Planning Board, Mayor, Town Council
Ongoing
H21 Amend the Land Development & Subdivision Regulations to include design standards which remove physical barriers for people with disabilities and allow ‘aging in place’ within the same dwelling unit or development for new housing developments.
M
Town Council, Planning Board, Mayor's Office, Planning Department
1 - 5 years
2. Economic Development
E1 Work with the RI Commerce Corporation, Northern RI Chamber of Commerce and others to attract economic development which diversifies and ultimately strengthens and expands Cumberland’s tax base.
H Planning Department, RI Commerce Corporation, Northern RI Chamber of Commerce
On-going
E2 Use the New England Economic Development Corporation’s inventory of currently vacant, developable commercial and industrial space as a method of targeting specific sites for economic development initiatives.
M
Planning Department Ongoing

2016 | Cumberland Comprehensive Plan | 10. IMPLEMENTATION 176
ID Goals & Actions Priority Responsible Party Timeframe
E3 Include an economic development marketing page on the Town’s website, promoting Cumberland’s strengths as a business location the Town should produce a companion developers' guide which will clearly explain the permitting procedures and available sites in Cumberland.
H
Planning Department, Mayor ongoing
E4 Where appropriate, amend the Zoning Map to reflect present commercial and industrial uses.
H Planning Department, Planning Board, Mayor, Town Council
1 - 3 years
E5 Pre-screen and guide new large-scale economic development proposals, considering siting logistics, site development, scope, buffers, screening and other impacts in order to minimize displacement and inverse impact on smaller existing businesses.
M
Planning Department, Mayor ongoing
E6 Provide historic mill building adaptive reuse with the maximum regulatory relief.
M Planning Department, Public Works Department, Mayor
1-2 years
E7 In cooperation with Central Falls and Pawtucket, update 2008 Broad Street Rejuvenation Plan, for coordinated signage, improvements and CDBG and other grant opportunities to reinforce the “Main Street” qualities of Broad Street, from Mendon Road to downtown Pawtucket.
M Planning Department, Planning Board, Mayor, Central Falls, Pawtucket, RIDOT, Office of Housing and Community Development
1-5 years
E8 Identify Village Business Districts having a distinct, historical physical identity, and consider creating new zoning districts which encourage business development keeping with the character of the District and discourage new development which promotes sprawl and a radical change in architectural continuity. These include, Valley Falls, Berkeley, Ashton, Cumberland Hill, Diamond Hill and Lonsdale.
H
Planning Department, Planning Board, Mayor
ongoing
3. Natural Resources
N1 Support the goals and strategies of RIDEM and Blackstone River Watershed Council’s ‘Blackstone River Watershed Action Plan’ to protect water quality, including working with the Narragansett Bay Estuary Program to install fish ladders for spawning fish species, and other ecological improvement projects.
M Mayor, Conservation Commission, Open Space Commission, Planning Board, Planning Department, RIDEM, Blackstone Watershed Council
1 - 5 years
N2 Preserve farms, sensitive ecological areas, watershed areas, and special natural resource areas through fee simple land purchase, conservation easements, or purchase of development rights.
H Cumberland Land Trust, Nature Conservancy, DEM Agricultural Land Preservation Commission, Planning Department, other land conservation
On-going

2016 | Cumberland Comprehensive Plan | 10. IMPLEMENTATION 177
ID Goals & Actions Priority Responsible Party Timeframe
NGO’s, Conservation Commission, Planning Board
N3 Partner with the State Agricultural Land Preservation Commission for the purchase of development rights to agricultural land.
H Planning Department, Conservation Commission, Cumberland Land Trust, Historic Metcalf Franklin Farm Preservation Association.
On-going
N4 Encourage land owners to participate in the Town’s Farm, Forest, and Open Space taxation program (see RIGL 44-3-32.2).
M Planning Department, Assessor’s Office, Conservation Commission, large landowners,
ongoing
N5 Promote the sustainable use of municipal, state and National parks and other open spaces within Cumberland. Strategies should support local businesses catering to users.
M Planning Department, Recreation Department, Conservation Commission, Planning Board, Mayor.
1 - 5 years
N6 Incorporate Best Management Practices, where feasible, by retrofitting outdated drainage facilities within municipal and school parking lots and local streets, to limit stormwater runoff and enhance water quality.
M Planning Department, DPW, School Department, RIDEM, Mayor
1-3 years
N7 Work with RIDEM Natural Heritage Program to map and monitor rare native plant and wildlife communities, and recommend targeting areas for compatible land use management or land acquisition.
M Conservation Commission, Cumberland Land Trust, Planning Board, Open Space Commission, RIDEM
ongoing
N8 Fill the staff position of Tree Warden, authorized to plan or approve all tree and shrub planting, trimming, and management on municipal property, including utility maintenance work.
H DPW, Planning Department, Conservation Commission, Planning Board, Mayor, Town Council
1-5 years
N9 Implement the Valley Falls Urban Forest Master Plan.
H Planning Department, DPW, Mayor 1-3 years
N10 The Town should remained an engaged and active participant in negotiating specifications for the Peterson Puritan remedial action plan.
H Planning Department, Mayor, RIDEM, EPA
ongoing
4. Cultural, Historic and Scenic Resources
C1 Amend the Development Regulations to require the adverse effects of development on adjacent historical, cultural and scenic resources be avoided or minimized.
M Planning Department, Building Office, Historic District Commission, Planning Board, Mayor, Town Council
1 - 3 years

2016 | Cumberland Comprehensive Plan | 10. IMPLEMENTATION 178
ID Goals & Actions Priority Responsible Party Timeframe
C2 Enact a Demolition Delay Ordinance in order to give the Town a window during which a means may be found to protect and preserve threatened historic structures.
H Planning Department, Building Office, Historic District Commission, RI Historical Preservation and Heritage Commission, Planning Board, Mayor, Town Council
1 - 3 years
C3 The Zoning Code and Land Development & Subdivision Regulations should refer to the Secretary of the Interior’s Standards for Rehabilitation as best practices for conserving historic structures.
M Planning Department, Historic District Commission, Planning Board, Mayor, Town Council
1-5 years
C4 Work with RI Historical Preservation and Heritage Commission to create a Local Historic District GIS data layer showing the parcel and district boundaries.
H Planning Department, RIHPHC Within 1 year
C5 Request the RI Historical Preservation and Heritage Commission update its 1998 Inventory of Historical and Architectural Resources.
H Planning Department, Historic District Commission.
1-3 years
C6 Adopt scenic areas registry and incorporate protections within Planning Board review process, including significant view sheds and smaller scenic areas important at the village level.
M Planning Department, Planning Board, RIDOT
1-3 years
C7 Create new standard and aesthetic sign design for Municipal properties, gateways, cultural and recreational sites and destinations, including new Town signature sign design for wayfinding and identifying municipal facilities.
M Planning Department, Public Works, Mayor, Town departments
1-3 years
C8 Install public art, landscape vegetation and other place-making elements at gateways and public spaces.
M
Planning Department, DPW, Mayor 1-5 years
C9
Include on the Town website descriptions of historical, cultural and recreational resources of the Town.
H Planning Department, Mayor’s office, Blackstone Valley Tourism Council, Historic District Commission, Cumberland Land Trust, Conservation Commission, Recreation Department.
1 - 3 years
C10
Establish additional local and National Register historic districts and sites, including the proposed Elder Ballou local historic district.
M Planning Department, Historic District Commission, RI Historic Preservation and Heritage Commission, Mayor, Planning Board, Town Council
ongoing
C11 The Historic District Commission should initiate a plaque program for period structures that are individually listed or located within local and/or National Historic Districts.
M Historic District Commission, Planning Department

2016 | Cumberland Comprehensive Plan | 10. IMPLEMENTATION 179
ID Goals & Actions Priority Responsible Party Timeframe
C12 Negotiate cooperative agreements with RIDEM and National Park Service on planning partnerships, cost-shares for future investment, education and outreach, and tourism relating to the new Blackstone Valley National Park, including recognizing value of Ashton Village as a specific site of interest.
H Planning Department, Historic District Commission, Planning Board, Mayor, Town Council
1-5 years
C13 Decide on adaptive reuse and restoration program of the Neves Building adjacent to Town Hall.
H Planning Department, Historic District Commission, Mayor, DPW
1-3 years
5. Public Facilities and Services
P1 Find location options and determine feasibility for a new Town Hall.
M Planning Department, Mayor, Planning Board
1-5 years
P2 Improve processing services, decision-making accuracy and transparency, and making clear permitting and land development petitioning process by digitizing important records, integrating records to a GIS-based system available on-line, and organizing Town archives to enable easy retrieval of important information.
M Town Clerk, Assessor’s office, Planning Department, Building Department, Town Engineer, DPW, Finance, Mayor
1-3 years
P3 Determine whether the new consolidated Fire District should become a municipal entity.
M Mayor, Finance Department, Fire Department, Town Council
1 - 5 years
P4 Conservation Commission is to study Town sustainability efforts, and make recommendations to the Planning Board and Mayor.
M Conservation Commission, Planning Board, Mayor, Town Council
1-3 years
P5 Pursue acquisition of streetlights from National Grid, to include maintenance program that saves money and does not impact DPW staff.
M DPW, Mayor, Town Council 1-3 years
P6 Use savings from streetlight acquisition to convert streetlights, including parking lot lighting, to LED and cut-off fixtures. Convert streetlights/parking lot lighting to cut off (“dark sky”) fixtures.
H DPW, Mayor, Town Council, Finance Department, School Department
1-3 years
P7 For new development, amend Zoning Code and Development Regulations set new standards to require cut off lighting on residential properties.
M Planning Department, Planning Board, Mayor, Town Council
1-3 years
P8 Integrate LEED green building design standards and sustainable development
practices into Town development regulations.
M Planning Department, Building Office Mayor, Planning Board, Town Council
1 - 3 years
P9 Amend the Zoning Code to define solar energy production systems in the following tiered system:
Planning Department, Planning Board, Mayor, Town Council

2016 | Cumberland Comprehensive Plan | 10. IMPLEMENTATION 180
ID Goals & Actions Priority Responsible Party Timeframe
Solar Energy System, Major: An Active Solar Energy System that occupies more than 40,000 square feet of surface area (equivalent to a rated nameplate capacity of about 250kW DC or greater). Allow Major Solar Installations by special use permit in Industrial and Agricultural zones with specific performance standards for height, fencing and vegetative screening, lot coverage, preservation of agricultural top soil, signage, utility poles, removal, noise, bonding, removing existing vegetation, access. Solar Energy System, Medium: An Active Solar Energy System that occupies more than 1,750 but less than 40,000 square feet of surface area (equivalent to a rated nameplate capacity of about 10 - 250 kW DC). Allowed by special use permit. Solar Energy System, Minor: An Active Solar Energy System that occupies 1,750 square feet of surface area or less (equivalent to a rated nameplate capacity of about 10 kW DC or less). Minor Solar Installations on residential and commercial properties for the primary purpose of generating power for up to 125% used on site, providing performance standards are met.
P10 The Town should pursue accessing locally-generated solar power at a rate lower than market, and/or siting its own solar energy installations, where appropriate, on parcels or structures with institutional use. Historic areas such as Franklin Farm should be excluded.
M Planning Department, Mayor, DPW, appropriate department directors
1-3 years
P11
Enact a Watershed Protection Ordinance, creating a Water Quality Protection Zone.
M Cumberland and Pawtucket Water Departments, Planning Department, Mayor, Blackstone Watershed Council, Conservation Commission, Planning Board, Town Council
1 - 5 years
P12
Enact a Waste Water Management District ordinance within the Cumberland and Pawtucket Reservoir Watershed to monitor and regulate septic system maintenance.
L Cumberland and Pawtucket Water Departments, Sewer Office, Planning Department, Mayor, Conservation Commission, Blackstone Watershed Council, Planning Board, Town Council
3 - 5 years
P13 Continue to acquire properties that are in close proximity to reservoirs and reservoir tributaries to protect public drinking water supplies for the future.
M Cumberland and Pawtucket Water Departments, Planning Department, RIDEM, Planning Board, Conservation Commission, Cumberland Land Trust
ongoing

2016 | Cumberland Comprehensive Plan | 10. IMPLEMENTATION 181
ID Goals & Actions Priority Responsible Party Timeframe
P14 Request that a Cumberland representative serve on Pawtucket’s Water Authority Board.
M Mayor, Cumberland and Pawtucket Water Authority
1 - 5 years
P15 Re-establish emergency water system interconnections with Lincoln.
M Cumberland Water Department, Mayor, Lincoln Water Department, Woonsocket Water Department
1 - 5 years
P16 Update the water supply management plan, including an assessment and water conservation element.
M Water Department 1 - 5 years
P17 Manage and conserve essential potable water resources in times of emergencies and/or shortages
M Water Department 1 - 5 years
P18 Ensure adequate water supply for any new planned areas of growth M Water Department 1 - 5 years
P19 Support major public water supplier demand management initiatives M Water Department 1 - 5 years
P20 Identify locations for sanitary sewer expansion to service those areas where wastewater disposal needs cannot be met by individual on-site systems, and determine phasing schedule for installation.
L Sewer Office, Planning Department, Mayor, Planning Board
5 - 10 years
P21 Reduce solid waste amounts by improving existing recycling programs and initiating new diversion programs. Design Town composting program for yard waste and organics.
L Recycling Coordinator, School Department, Finance Director, DPW
5-10 years
P22 Strengthen existing recycling education program for residents, Cumberland Schools and municipal buildings to improve recycling amounts and increase food scrap diversion for goal of waste reduction to reduce tipping fee costs.
M Recycling Coordinator, School Department, DPW
ongoing
P23 Ensure recycling is available at all community parks and events, and offer a variety of one day recycling events to educate and engender support for additional recycling opportunities.
H Recycling Coordinator, Recreation Department, DPW
Within 1 year
P24 Start a recycling program offered to commercial businesses.
M Recycling Coordinator, School Department, DPW
1-5 years
P25 Assure trash contractor’s contract specifications are in sync with all objectives of the Town’s solid waste reduction programs.
M Recycling Coordinator, Finance Department, DPW
1-3 years
P26 Amend Town ordinances and regulations to strengthen and clearly state enforcement thresholds for illegal dumping and for material unacceptable for curbside pickup.
M Recycling Coordinator, DPW, Finance Department, Mayor, Town Council
1-5 years

2016 | Cumberland Comprehensive Plan | 10. IMPLEMENTATION 182
ID Goals & Actions Priority Responsible Party Timeframe
P27 Coordinate with abutting communities as part of the annual review of the Comprehensive Plan implementation on land use, open space, transportation, economic development, natural hazards and other multijurisdictional planning issues.
M
Planning Department 2-5 years
6. Recreation and Open Space R1 Install approx. $100K (from a recreational grant bond fund or from the capital budget)
in playground equipment at Tucker Field and McCourt Middle School
M Recreation Department, Planning Department, Mayor
5 - 10 years
R2 Coordinate the construction of new school facilities to include multiple purpose recreational areas for both school and Town use.
M Mayor, School Department, Recreation Department, Planning Department
On going
R3 Generate a plan for developing trails and other connections between recreational open space areas and Cumberland Land Trust properties.
H Recreation Department, Conservation Commission, Cumberland Land Trust, Planning Department
On going
R4 Create standards for trail markers, park signage and other improvements needed to create a consistent, high-quality system of open space, trails and passive parks throughout town.
H Planning Department, Recreation Department, Conservation Commission, Cumberland Land Trust
On going
R5 Promote the sustainable use of municipal, state and National Parks and other open spaces within Cumberland. Strategies should support local businesses catering to users.
M
Planning Department, Mayor On going
R6 Maintain priority potential acquisitions based on specific selection criteria and/or an open space ranking system.
M Planning Department, Conservation Commission, Open Space Commission, Recreation Department,
1-3 years
R7 In order to create a large area of contiguous open space from the Monastery to Diamond Hill State Park called the "Cumberland Greenway" coordinate efforts to identify and acquire tracts of land that will enlarge and connect existing protected parcels.
M Planning Department, Conservation Commission, Open Space Commission, Cumberland Land Trust
5 - 10 years
R8 Consistent with State statutes, amend the Land Development Regulations to require a mandatory set aside for open space which consists of potentially buildable land, rather than wetland or other areas with building constraints.
L Planning Department, Planning Board, Mayor, Town Council
5 - 10 years
R9 Amend the Zoning Code and Land Development & Subdivision Regulations to specify evaluation and protection standards, including citing of building envelopes, for natural features and cultural characteristics, including significant woodlands and special trees.
M Planning Department, Planning Board, Mayor, Town Council
1 - 5 years

2016 | Cumberland Comprehensive Plan | 10. IMPLEMENTATION 183
ID Goals & Actions Priority Responsible Party Timeframe
R10 Town Council should approve referendum for additional funds for the preservation of open space.
M Mayor, Town Council, voters 1-3 years
R11 Update the Monastery Management Plan
H Planning Department, Recreation Department, Conservation Commission, Monastery Alliance
1-3 years
R12 Provide the following improvements at Diamond Hill Town Park: renovate Ski Lodge; convert the impaired wetland in front of the performing arts pavilion into a lawn area for audiences; refresh the Park entrance to make more safe, distinctive and beautiful and improve public access between Diamond Hill State and Town Parks.
H
Mayor, Planning Department, Recreation Department
1-3 years
R13 If deed restrictions allow, develop new utility sports fields in the vicinity of Gainesboro Commons/Schofield Farm.
M Mayor, Planning Department, Recreation Department
1-5 years
7. Transportation
T1 Institute a multi-year pavement management program for Town roads, which is based on road condition, safety benefits, volume, and type of use.
L Mayor, DPW, Town Council 1 - 5 years
T2 Amend Land Development & Subdivision Regulations to require that a new subdivision roadways with the exception of the top or surface course must be completed, including drainage and services, to the satisfaction of the DPW Director and Engineer, prior to the construction of any dwelling.
H Planning Department, Planning
Board, Mayor, Town Council 1-3 years
T3 For safety purposes, amend the Land Development & Subdivision Regulations to encourage connecting adjacent subdivisions, condominiums or other such development, where appropriate.
L Planning Department, Planning Board, Mayor, Town Council
T4 Amend the Zoning and Land Development & Subdivision Regulations to include design specifications in "Cumberland's Vision: Using the Past to Enrich the Future", to transform the Town's transportation corridors into tree-lined greenways.
M Planning Department, Planning Board, Mayor, Town Council
1 - 5 years
T5 For safety purposes, outdoor advertising, ie: commercial signage, shall strictly conform to the zoning code. Amend the Zoning Code to be consistent with State regulations so digital LED signs shall not project intermittent light but once every 10 seconds. Signs shall not be brighter than ambient light conditions.
M Planning Department, Zoning Office, Planning Board, Mayor, Town Council.
1-3 years

2016 | Cumberland Comprehensive Plan | 10. IMPLEMENTATION 184
ID Goals & Actions Priority Responsible Party Timeframe
T6 Amend the Zoning Code to allow internally-lit business signs on Diamond Hill Road, from Country Hill Road and Little Pond County Road.
M
Planning Department, Planning Board, Mayor, Town Council
1-3 years
T7 Enhance pedestrian safety by installing enhancements on Broad Street at Town Hall, on Mendon Road at Cumberland High School, One Mendon Road, Marshall Ave top and bottom at lights, West Highland School, as well as other appropriate sites.
H
Planning Department, DPW, RIDOT, Mayor
1-3 years
T8 Work to pass 2016 state bond referendum proposal including $10M for Blackstone bike path improvements, and advocate for new bike path installation for sections of Central Falls and Cumberland presently along municipal streets.
M DPW, Mayor, Planning Department, Conservation Commission, Blackstone Valley Tourism Council, Blackstone River Watershed Council, RIDEM, Central Falls
ongoing
T9
Encourage investment in bicycling and mass transit as an alternative to commuting and traveling by gas and diesel powered automobiles.
H Mayor, Planning Department, Conservation Commission, Planning Board, DPW, Coalition for Transportation Choices, Grow Smart RI, RIDOT, RIPTA
ongoing
T10 Install wayfinding signs directing pedestrians and bicyclists from Blackstone Bike Path to local destinations.
M Planning Department, Planning Board, Mayor, Conservation Commission, NPS, RIDEM
1-5 years
8. Natural Hazards
NH1 Use GIS to inventory all Town Critical Infrastructure H Planning Department 1-3 years
NH2 Public Works Department will apply for funding to purchase and install back-up generators to power the public safety facilities, and water and sewer pumping stations during times of power loss.
M
DPW, Mayor 1 - 5 years
NH3 Establish a priority list of repetitive flood streets.
M Planning Department, DPW, Engineer, Mayor
1 - 5 years
NH4 Amend the Zoning Code and Land Development & Subdivision Regulations so that new construction is designed for a 50 year flood event.
M Planning Department, FEMA, Mayor, Planning Board, Town Council
1 - 5 years

2016 | Cumberland Comprehensive Plan | 10. IMPLEMENTATION 185
ID Goals & Actions Priority Responsible Party Timeframe
NH5 For development, minimize impervious surfaces and review and if appropriate, reduce lot coverage percentages.
M Planning Department, Planning Board, Mayor, DPW, Town Council
1-5 years
9. Land Use
L1 Amend the text and map of the Zoning Ordinance so that it conforms with the Future Land Use Map 2036.
H Planning Department, Planning Board, Zoning Board
Upon amendment of Code
L2 Evaluate amending zoning of areas where established uses, such as commercial uses in a residential zone, are non-conforming.
M Planning Department, Planning Board 1-3 years
L3 Refrain from granting zone changes representing a significant intensification and density increase (with the exception of appropriate affordable and/or senior and disabled housing).
H Planning Department, Planning Board, Town Council
ongoing
L4 Amend the zoning Code and Land Development & Subdivision Regulations to be consistent with “Cumberland’s Vision: Using the past to enrich the future”
M Planning Department, Planning Board, Town Council
1-3 years
L5 The clearing of land for development should be restricted only to what is absolutely necessary for building envelopes, lawn areas, roads/infrastructure and septic leach fields. The Planning Board shall take a conservative approach in approving the clearing of natural vegetation on site and Site Plans shall specify enforceable limits of disturbance. Every effort shall be made to preserve significant trees, perimeter vegetation and other features such as stone walls and steep slopes existing prior to development. The clearing of raw land for development shall strictly follow Town-approved Soil Erosion and Sedimentation Control Plans or be subject to enforcement.”
H
Planning Department, Town Engineer, Building Department, Planning Board
ongoing

2016 | Cumberland Comprehensive Plan | APPENDIX A A-1
APPENDIX A: HOUSING DATA
1. State Policy and Land Use Legislation The Rhode Island Comprehensive Planning and Land Use Regulation Act (RI General Laws, Title 45, Chapter 22.2) directs all municipal comprehensive planning efforts. With regard to housing, the Act provides the following goal:
“To promote a balance of housing choices, for all income levels and age groups, and which recognizes the affordability of housing as the responsibility of each municipality and the state.”
The State Guide Plan is composed of several sections, or elements. Element 421, the State Housing Plan, and Element 423, the Rhode Island Five Year Strategic Housing Plan: 2006-2010, Five Thousand in Five Years make specific recommendations for housing in Rhode Island which the Cumberland plan must take into consideration. One of the principal goals of these plans is to increase the availability of low and moderate housing for State residents. In this regard, a threshold requirement of 10% is delegated to local governments through the “Low and Moderate Income Housing Act” (R.I. General Laws, Title 45, Chapter 53).
State Guide Plan Goal 1-1-5 Affordability Goal 1-1-5 encourages every municipality to provide an adequate number of housing units for residents with severe cost burdens and special needs. Described in the State Guide Plan Overview7, the housing policies of the State of Rhode Island require:
• the use of reliable population and housing statistics in the periodic update of housing proposals;
• diversity of housing types and affordability;
• housing assistance for different racial, ethnic, and special population groups;
• the protection of historic and other essential aspects of neighborhoods that provide identity and character;
• the promotion of ground water protection, watershed management, and flooding abatement;
• support for the best use and maintenance of existing housing stock;
• Encouragement of new housing construction, in proximity to planned or existing infrastructure; and,
• support the expansion of neighborhoods relative to a closer relationship with local and regional needs.
The State Housing Plan8 provides several Strategies and Recommendations local communities are urged to consider in their activities and plans that affect the provision of housing. However, no specific actions are required. The recommendations on housing affordability include:
• The consideration of property tax incentives to encourage housing diversity and neighborhood maintenance;
• The consideration of appropriate zoning changes to allow smaller residential lot sizes as infill for densely developed areas where there are adequate public utilities and services;
• The use of innovative development and subdivision tools to increase affordability by reducing land and construction costs;
• make vacant “building” and “lot” homesteading programs an affordable housing initiative; and
7 State Guide Plan Overview, Statewide Planning Program, p. 1.2. 8 State Housing Plan, State Guide Plan Element 421, March 2000, p. 5.7.

2016 | Cumberland Comprehensive Plan | APPENDIX A A-2
• Encourage an adequate amount of land for the construction of multifamily housing where there is a need.
The Low and Moderate Income Housing Act Low and Moderate Income Housing Act (R.I. General Laws, 45-53) was enacted in 1991 to address the need for cities and towns in the state to provide opportunities for the establishment of housing affordable to individuals and families of low and moderate income. The Act establishes a ten percent minimum threshold for such housing in each city and town, including Cumberland. As of July 29, 2013 (the latest report available) the Housing Resources Commission reported that 5.80 percent of the housing units in Cumberland could be considered “affordable” to persons of low and moderate income and qualify under the Act.
The Act, along with several companion statutes, was substantially amended in 2004 to provide for the provision of safe and affordable housing in accordance with a 5-year strategic plan for housing. The “Comprehensive Housing Production and Rehabilitation Act of 2004” required newly-created Rhode Island Housing Resources Commission to develop a Strategic Plan for Housing which was published in June of 2006. Affordable Housing Production Plan Amendments to the “Rhode Island Comprehensive Plan and Land Use Regulation Act” (R.I. General Laws title 45, Chapter 22.2) in 2011 requires that the Comprehensive Plan include an affordable housing program that meets the requirements of RI General Laws § 42-128-8.1 and chapter 45-53. To address the requirement communities adopt a strategic production plan addressing the specific requirements of the Low and Moderate Income Housing Act with respect to affordability issues. The “Affordable Housing Production Plan” must be consistent with other provisions of the housing element and with other elements of the Comprehensive Plan which affect housing. An Affordable Housing Production Plan must also identify specific steps that the municipality will take to increase the supply of low and moderate income housing and identify resources to be used in this regard.
Census and Housing Data Inventory This section provides brief highlights of demographic, economic and housing data for the Town of Cumberland, Rhode Island. Local, state and federal sources were used to compile this data with the greater proportion of statistics coming from the 2000 and 2010 decennial Census. State compilations of the Census and CHAS data were also consulted. Population and Growth Projections
Cumberland’s population has grown steadily over the past half-century, typical of most Rhode Island suburban communities. As highway development provides easier access to undeveloped areas outside of the older urban core communities of Providence and Woonsocket, housing construction steadily proceeds in the suburban areas. Table 5148 compares population growth in the Northern Market Area to that of Cumberland.
The Northern RI Market Area as defined by Statewide Planning is comprised of five communities: Smithfield, North Smithfield, Woonsocket, Cumberland and Lincoln. This market area grew at an overall rate of 48.9 percent between 1990 and 2010, but the range of growth varies greatly. For example, Cumberland’s population grew by 5.2% percent during that period, while Woonsocket lost almost 18 percent of its population.

2016 | Cumberland Comprehensive Plan | APPENDIX A A-3
The number of households equals the number of occupied housing units in a census unit. In Cumberland, the number of households increased 7.75% from 2000 to 2010 – slightly more than six times the increase in households statewide for the same period.
Table 52: Cumberland and Rhode Island Households, 2000 – 2010
2000
Cumberland 2010
Cumberland %
Change
2000 Rhode Island
2010 Rhode Island
% Change
Total Population
31,840 33,506 +5.23% 1,048,319 1,052,567 +0.4%
Total Households
12,198 13,143 +7.75% 408,424 413,600 +1.3%
Average Number of Persons per Household
2.59 2.53 2.6 2.5
Source: U.S. Census 2000 and 2010
Homeless and Special Needs Populations - Cumberland’s Report The Rhode Island Emergency Shelter Information Project tracks the usage of shelters, nights stayed in shelters and the overall statewide homeless rate to assess the homeless situation in the state. The Project’s [year] report shows a slight decrease in the number of unduplicated shelter clients and total shelter nights in Rhode Island shelters from the previous year, but still indicates a marked increase in homelessness between 2000 and 2010. For example, in the reporting year of 2007-2008, 6,437 clients utilized shelters. This compares to 5,686 in 2002 - 2003 and 4,466 in 1999-2000. Similarly, 218,858 nights of shelter were provided by Rhode Island’s shelter system in 2008-20099 as compared with 192,000 in 2002-2003 and 134,540 in 1999-2000. The RI Emergency Food and Shelter Board also surveys shelter clients to determine the last place of residence for each individual. These numbers provide some indication of the homeless need in the Northern Market Area in general and Cumberland specifically. In [year] Twenty (20) clients reported the Town of Cumberland as their last place of residence as compared with Eleven (11) in 2002-2003. Seven hundred thirty seven (737) individual clients claimed to originate from towns in the Northern Market Area. The total number statewide for 2008-2009 was 6,437 with Providence reporting the most clients at 2,109. There is no homeless shelter in the Town of Cumberland and the Woonsocket Shelter, operated by Community Care Alliance, is the closest shelter available to area homeless people. Special need populations in Rhode Island consist of the frail elderly, veterans, persons with physical, mental or developmental disabilities, substance abuse problems and HIV/AIDS persons.10 The 2010–2015 Consolidated Plan discusses special needs populations from a statewide perspective. The State’s frail elderly population is expected to increase as the population 75 years and older grows, which will increase the demand for assisted living facilities and nursing home beds. U.S Census of 2010 indicates that Cumberland ranks 13th in the state for the size of its elderly population of which 2,246 individuals reported disabilities. Other disabled people, people living with HIV/AIDS, and persons transitioning from prison, psychiatric
9 Ibid, Page 2. 10 Rhode Island Consolidated Plan 2010 – 2015. Rhode Island Housing and Mortgage Finance Corporation, January 15, 2010.

2016 | Cumberland Comprehensive Plan | APPENDIX A A-4
and/or substance abuse treatment program represent a growing population of special needs individuals. Statewide, there has been a rise in the number of people living with AIDS from 203 cases in 1993 to 1,881 in 2010.11
Cumberland Housing Description Housing Availability The following table presents data to provide a detailed look at the total number of housing units, both owner-occupied and renter-occupied units, for Cumberland and its surrounding area for 2000 and 2010. The data suggest that Cumberland has seen a change in owner-occupancy of local housing stock over the past decade with an increase of 410 units or 4.3% from 2000 to 2010. The percentage of units occupied by renters rose from 19.5% in 1990 to 21.6% in 2000 and then fell slightly to 20.7% in 2010. In addition, an increase in seasonal units witnessed in 2000 continued in 2010.
Table 53: Housing Tenure and Ownerships
Cumberland % Northern Market Area % Rhode Island %
Total Units
2000 12,572 100 51,303 100 439,837 100
2010 13,791 100 55,041 100 463,388 100
% Increase
2000-2010 9.7% 7.2 5.4
Occupied Units
2000 12,198 97 49,339 96.2 408,424 92.9
2010 13,143 95 50,916 92.6 413,600 89.3
Owner-Occupied
2000 9,360 74 29,797 58.1 245,156 60.0
2010 9,770 70 31,573 57.4 250,952 54.2
Renter Occupied
2000 2,838 22.5 19,542 38.1 163,268 40.0
2010 3,373 24.4 19,343 35.1 162,648 35.1
Vacant Units
2000 347 2.7 1,964 3.8 31,413 7.1
2010 648 4.6 4,125 7.5 49,788 10.7
Seasonal Units
2000 36 .3 157 0.3 12,988 3.0
2010 53 .3 228 0.4 17,077 3.7
Source: U.S. Census 1990, 2000, and 2010
Foreclosures Table 545 below illustrates that the foreclosure rate in Cumberland represented a small portion of foreclosures statewide 1-1.5%. Cumberland foreclosures as a percentage of regional foreclosures ranged from 18.9 percent in 2010 to 14.1 percent in 2013.
11 2010 HIV/AIDS Epidemiologic Profile with Surrogate Data (http://www.health.ri.gov/publications/epidemiologicalprofiles/2010HIVAIDSWithSurrogateData.pdf)

2016 | Cumberland Comprehensive Plan | APPENDIX A A-5
Table 54: Foreclosures 2010 - 2013
Year Cumberland % of Northern Region % of State Northern Region State
2010 42 18.9% 2.2% 222 1893
2011 39 18.2% 1.8% 214 2095 2012 34 20% 2.1% 170 1617
2013 Total 115 12.2% 1.3% 941 8445
Unit Distribution The most common housing type in Cumberland is a single family detached home. As shown below in Table 5546.
Table 55: Town of Cumberland Housing Stock Distribution
Unit Type 2012 % of 2012
Total # Units 13,676 100% Single Family Home 9,136 66.8%
1 Unit Attached (e.g. Condo)
623 4.6%
2-4 Units 1883 13.7% 5-9 Units 608 4.5%
10 or more units 1410 10.3%
Mobile home 16 0.1% Boat, RV, van, etc. 0 0%
Source: 2008-2012 ACS 5-year estimates
Age of Housing Data on “Year Structure Built” was obtained for both occupied and vacant housing units). ‘Year Structure Built’ refers to when the building was first constructed, not when it was remodeled, added to, or converted. The data relate to the number of units built during the specified periods that were still in existence at the time of enumeration of the 2010 Census.
Table 56: Year Housing Structures were built in Cumberland
Year Number of Units % of Total Units 2010 or later 21 .2%
2000-2009 1,324 9.7%
1990-1999 1,813 13.3%
1980-1989 1,891 13.8%
1970-1979 1,344 9.8% 1960-1969 2,095 15.3%
1950-1959 1,039 14.2% 1940-1949 656 4.8%
1939 or earlier 2,593 19.0%
Total Housing Units
13,676 100%
Source: 2008-2012 ACS 5-year estimates

2016 | Cumberland Comprehensive Plan | APPENDIX B B-1
APPENDIX B: CUMBERLAND’S VISION USING THE PAST TO ENRICH THE FUTURE

2016 | Cumberland Comprehensive Plan | APPENDIX C C-1
APPENDIX C: NATURAL RESOURCES
Table 57: Soils with Severe Septic System (OWTS) Limitations
Map Unit Symbol Map Unit Name Acres Restrictions2
AfA Agawam fine sandy loam, 0 to 3 % slopes 171 Poor Filter
AfB Agawam fine sandy loam, 3 to 8 % slopes 6 Poor Filter
BrA Broadbrook silt loam, 0 to 3 % slopes 10 Percs Slowly
BrB Broadbrook silt loam, 3 to 8 % slopes 27 Percs Slowly
CaD Canton-Charlton-Rock outcrop complex, 15 to 35 % slopes 567 Bedrock; Slope
CB Canton-Urban land complex 718 Large Stones
CC Canton-Urban land complex, very rocky 38 Bedrock; Slope
ChD Canton And Charlton very stony fine sandy loams, 15 to 25 % slopes 254 Slope; Large Stones
Dc Deerfield loamy fine Sand 12 Wetness; Poor Filter
Du Dumps 70 Subsides; Landfill
EfA Enfield silt loam, 0 to 3 % slopes 4 Poor Filter
FeA Freetown, mucky peat, 0 to 2 % slopes 517 Ponding; Subsides
HkA Hinckley gravelly sandy loam, 0 to 3 % slopes 88 Poor Filter
HkC Hinckley gravelly sandy loam, rolling 848 Poor Filter
HkD Hinckley gravelly sandy loam, hilly 76 Poor Filter; Slope
MmA Merrimac sandy loam, 0 to 3 % slopes 269 Poor Filter
MmB Merrimac sandy loam, 3 to 8 % slopes 268 Poor Filter
MU Merrimac-Urban land complex 643 Poor Filter
NeB Newport silt loam, 3 to 8 % slopes 23 Percs Slowly; Wetness
PaA Paxton fine sandy loam, 0 to 3 % slopes 295 Percs Slowly; Wetness
PaB Paxton fine sandy loam, 3 to 8 % slopes 430 Percs Slowly; Wetness
PbC Paxton very stony fine sandy loam, 8 to 15 % slopes 72 Percs Slowly
PD Paxton-Urban land complex 238 Percs Slowly
Pk Pits, quarries 35 Bedrock; Poor Filter
Pp Pootatuck fine sandy loam 105 Flooding; Wetness; Poor Filter
Rc Raypol silt loam 20 Wetness; Poor Filter
Re Ridgebury fine sandy loam 299 Wetness; Percs Slowly
Rf Ridgebury, Whitman, And Leicester stony fine sandy loams 877 Wetness; Percs Slowly
Rp Rock outcrop-Canton complex 240 Bedrock; Poor Filter
Ru Rippowam fine sandy loam 110 Flooding; Wetness; Poor Filter
Sb Scarboro mucky sandy loam 65 Ponding; Poor Filter
ScA Scio silt loam, 0 to 3 % slopes 9 Wetness; Poor Filter
Ss Sudbury sandy loam 66 Wetness; Poor Filter
StA Sutton fine sandy loam, 0 to 3 % slopes 115 Wetness
StB Sutton fine sandy loam, 3 to 8 % slopes 51 Wetness
SuB Sutton very stony fine sandy loam, 0 to 8 % slopes 118 Wetness
SvB Sutton extremely stony fine sandy loam, 0 to 8 % slopes 23 Wetness
SwA Swansea mucky peat, 0 to 2 percent slopes 149 Ponding; Subsides
W Water 1,127 Subaqueous Soil
Wa Walpole sandy loam 128 Wetness; Poor Filter
WgA Windsor loamy sand, 0 to 3 % slopes 12 Poor Filter
WgB Windsor loamy sand, 3 to 8 % slopes 147 Poor Filter
WhA Woodbridge fine sandy loam, 0 to 3 % slopes 57 Wetness; Percs Slowly
WhB Woodbridge fine sandy loam, 3 to 8 % slopes 341 Wetness; Percs Slowly
WoB Woodbridge very stony fine sandy loam, 0 to 8 % slopes 33 Wetness; Percs Slowly
Total Acres = 9,772
Notes 1. Suitability for on-site septic absorption fields identified as "Severe" (RIGIS 1996, NRCS/RIGIS 2014 soils map
update). Multitaxa soil map units (complexes) with dual ratings such as SV (slight for Canton, severe for bedrock) not included, nor are disturbed soils such as pits and filled land which may also pose severe constraints to onsite wastewater treatment systems.
2. Restrictions of soil to support traditional septic systems (RIGIS 1996, NRCS/RIGIS 2014 soils map update).

2016 | Cumberland Comprehensive Plan | APPENDIX C C-2
Table 58: Prime Agricultural Soils
Map Unit Symbol*
Map Unit Name
Prime Farmland
Acres
Statewide Important
Acres AfA, AfB Agawam fine sandy loam 178
Bh Bridgehampton silt loam 8 BrA, BrB Broadbrook silt loam 37
CdA, CdB Canton And Charlton fine sandy loams 1,106
CdC Canton And Charlton fine sandy loams 115
Dc Deerfield loamy fine Sand 12 EfA Enfield silt loam 4
HkA, HkC Hinckley gravelly sandy loam, rolling 936
MmA, MmB Merrimac sandy loam 537
NaB Narragansett silt loam 12 NeB Newport silt loam 23
PaA, PaB Paxton fine sandy loam 725 Pp Pootatuck fine sandy loam 105
Rc Raypol silt loam 20
Re Ridgebury fine sandy loam 299
Ru Rippowam fine sandy loam 110
ScA Scio silt loam 9
Ss Sudbury sandy loam 66
StA, StB Sutton fine sandy loam 166
Wa Walpole sandy loam 128 WgA, WgB Windsor loamy sand 159
WhB Woodbridge fine sandy loam 398 Total Acres 3,374 1,779

2016 | Cumberland Comprehensive Plan | APPENDIX C C-3
Table 59: Rare Species in Cumberland
Genus Species Common Name Last
Observed
Saxifraga virginiensis Early Saxifrage 1992
Asclepias quadrifolia Four-leaved Milkweed 1993
Cypripedium calceolus Large Yellow Lady's-slipper, Moccasin-flower, or Golden Slipper, Whip-poor-will Shoes
2007
Isoetes riparia River-, Riverbank-, or Shore-quillwort 1992
Cryptotaenia canadensis Honewort, Wild Chervil 1992
Penstemon digitalis Tall White or Foxglove Beard-tongue 1992
Matteuccia struthiopteris Ostrich Fern 2006
Lampetra appendix American Brook Lamprey 1990
Atrytonopsis hianna Dusted Skipper 1991
Corydalis sempervirens Pale or Tall Corydalis, Rock-harlequin 2006
Aralia racemosa Wild Spikenard, Life-of-man 2005
Hedeoma pulegioides American Pennyroyal, Pudding-grass 1993
Triosteum aurantiacum Wild Coffee, Feverwort, Horse-gentian 1992
Triosteum aurantiacum Wild Coffee, Feverwort, Horse-gentian 1992
Helianthus divaricatus Woodland-sunflower 1995
Panax quinquefolius Wild or American Ginseng, Sang 2007
Triosteum aurantiacum Wild Coffee, Feverwort, Horse-gentian
Atrytonopsis hianna Dusted Skipper 1993
Botrychium simplex Dwarf or Little Grapefern, Least Moonwort 1984
Anemonella thalictroides Rue-anemone 2003
Agalinis tenuifolia Common Agalinis, Slender Gerardia 1991
Hottonia inflata Featherfoil, Water-violet 2006
Geranium bicknellii Bicknell's Geranium 1992
Saxifraga virginiensis Early Saxifrage 1982
Corallorhiza maculata Spotted Coral-root 2005
Solidago flexicaulis Zigzag or Broad-leaved Goldenrod 1985
Asclepias exaltata Poke or Tall Milkweed 1993
Corydalis sempervirens Pale or Tall Corydalis, Rock-harlequin 2006
Sanguinaria canadensis Bloodroot, Red Puccoon 1992
Conopholis americana Squaw-root, Cancer-root 2005
Rich Red Maple - Ash Swamp
Cicindela rufiventris Red-bellied Tiger Beetle 1995
Cicindela rufiventris Red-bellied Tiger Beetle 1994
Atlantic White Cedar Swamp 1988
Cornus rugosa Round-leaved Dogwood 1992
Corallorhiza odontorhiza Late or Autumn Coral-root 2005
Aeshna mutata Spatterdock Darner 2002
Source: RI Natural Heritage Program Rare Species Listing 2014, Paul Jordan DEM

2016 | Cumberland Comprehensive Plan | APPENDIX C C-4
Table 60: Vertebrates
Table 61: Breeding Bird Species
Amphibians Reptiles Mammals Mammals (cont) Spotted Salamander Snapping Turtle White-tailed Deer Meadow Vole Marbled Salamander Painted Turtle Short-tailed Weasel Muskrat Dusky Salamander Spotted Turtle Meadow Jumping Mouse Norway Rat Two-lined Salamander Stinkpot Star-nosed Mole House Mouse Four-toed Salamander Northern Black Racer Little Brown Myotis Coyote Red-spotted Newt Northern Ringneck Snake Big Brown Bat Red Fox Redback Salamander Eastern Milk Snake Eastern Cottontail Raccoon American Toad Northern Water Snake New England Cottontail Mink Spring Peeper Northern Brown Snake Eastern Chipmunk Striped Skunk Gray Tree Frog Eastern Garter Snake Woodchuck River Otter Bullfrog Eastern Smooth Green Snake Gray Squirrel Opossum Green Frog Red Squirrel Masked Shrew Pickerel Frog Southern Flying Squirrel Short-tailed Shrew Wood Frog White-footed Mouse
Green-backed Heron Hairy Woodpecker Wood Thrush Northern Oriole Canada Goose Downy Woodpecker Hermit Thrush Common Grackle Mallard Eastern Kingbird Veery Brown-headed Cowbird American Black Duck Great Crested Flycatcher Eastern Bluebird Scarlet Tanager Wood Duck Eastern Phoebe Blue-Gray Gnatcatcher Northern Cardinal Turkey Vulture Least Flycatcher Cedar Waxwing Rose-breasted Grosbeak Red-tailed Hawk Eastern Wood Pewee European Starling Indigo Bunting Broad-winged Hawk Tree Swallow Yellow-throated Vireo Purple Finch American Kestrel Bank Swallow Red-Eyed Vireo House Finch Ruffed Grouse Rough-winged Swallow Warbling Vireo American Goldfinch Killdeer Barn Swallow Black-and-White Warbler Rufus-sided Towhee American Woodcock Blue Jay Yellow Warbler Savannah Sparrow Spotted Sandpiper Common Crow Pine Warbler Chipping Sparrow Rock Dove Black-capped Chickadee Prairie Warbler Field Sparrow Mourning Dove Tufted Titmouse Ovenbird Swamp Sparrow Yellow-billed Cuckoo White-breasted Nuthatch Louisiana Water thrush Field Sparrow Black-billed Cuckoo Red-breasted Nuthatch Common Yellowthroat Swamp Sparrow Eastern Screech Owl Brown Creeper American Redstart Song Sparrow Great Horned Owl House Wren House Sparrow Mute Swan Chimney Swift Northern Mockingbird Bobolink Virginia Rail Belted Kingfisher Gray Catbird Eastern Meadowlark Sora Northern Flicker Brown Thrasher Red-Winged Blackbird Marsh Wren Red-Bellied Woodpecker American Robin Orchard Oriole

2016 | Cumberland Comprehensive Plan | APPENDIX C C-5
Table 62: Migratory Bird Species in Cumberland
Table 63: Rare Plant Species
Pied-billed Grebe Double-crested Cormorant Great Blue Heron (w) Great Egret Black-crowned Night Heron Canada Goose (w) Green-winged Teal Northern Pintail Blue-winged Teal American Pigeon Ring-necked Duck Common Goldenly Bufflehead Hooded merganser Common Merganser (w) Ruddy Duck Osprey Bald Eagle (w) – rare Greater Yellowlegs Common Snipe Ring-billed Gull (w) Herring Gull (w) Great Black-backed Gull (w) w-Remain in area during winter as long as open water persists.
Genus Species Common Name Last
Observed Caulophyllum thalictroides Blue Cohosh 2005
Matteuccia struthiopteris Ostrich Fern 1990
Stylurus Spiniceps Arrow Clubtail 2003
Ranunculus flabellaris Yellow Water-crowfoot or Buttercup 1987
Ranunculus flabellaris Yellow Water-crowfoot or Buttercup 1993
Ranunculus flabellaris Yellow Water-crowfoot or Buttercup 1992
Equisetum sylvaticum Wood- or Woodland-horsetail 1992
Viola pubescens Downy Yellow Violet, Smooth Yellow Violet, Yellow Forest-violet 1990
Saxifraga pensylvanica Swamp-saxifrage 2006
Saxifraga pensylvanica Swamp-saxifrage 2002
Acer pensylvanicum Striped Maple, Moosewood 1987
Williamsonia Lintneri Ringed Boghaunter 2001
Lilium canadense Canada Lily, Wild Yellow Lily 2004
Coeloglossum Viride Bracted or Long-bracted Green Orchis, Frog-orchis 2007
Phegopteris connectilis Long or Northern Beech-fern 2004
Zizia Aurea Common Golden Alexanders 1985
Zizia Aurea Common Golden Alexanders 1992
Platanthera Psycodes Small Purple Fringed Orchid 2006
Liparis Loeselii Yellow, Bog-, or Loesel's Twayblade, Fen-orchid
Platanthera hyperborea Leafy Northern Green Orchis, Tall Northern Bog-orchid 2007
Utricularia Gibba Humped Bladderwort 1985
Hepatica americana Round-lobed Hepatica, Liverleaf, Liverwort 1992
Anemonella thalictroides Rue-anemone 1992
Corallorhiza Trifida Early, Pale, or Northern Coral-root
Rhynchospora macrostachya 1986
Platanthera Flava Tubercled or Pale Green Orchis/orchid 2004

2016 | Cumberland Comprehensive Plan | APPENDIX D D-1
APPENDIX D. TRANSPORTATION
Table 64: Functional Classification System
Classification Function Description Federal -Aid
Eligibility Jurisdiction
Interstate Principal Arterial
Roadways comprising the Dwight D. Eisenhower National System of Interstates and Defense Highways which are designed with physical barriers separating directional travel lanes to provide the highest level of travel mobility and do not provide direct property access.
Eligible State
Other Freeway and Expressway
Principal Arterial
Designed similarly to interstates but may vary regionally and are not designated as part of the interstate system.
Eligible State
Other Principal Arterial
Roadways serving major metropolitan centers and corridor travel through rural areas which allow direct property access.
Eligible State
Minor Arterial Minor Arterial
Provide service for moderate-length travel and smaller geographic areas than principal arterials; may allow interconnections between principal arterials and carry local bus routes in urban settings while spaces at intervals consistent with population density in rural settings.
Eligible State
Major Collector Collector Typically offer more mobility than minor collectors by generally providing a combination of longer lengths and interval spacing, lower connection driveway densities, higher speed limits and average traffic volumes and more travel lanes; average traffic volumes and interval spacing are more significant factors in designating a rural major collector.
Eligible Municipal
Minor Collector Collector Typically offer more access than major collectors by generally providing shorter lengths and interval spacing, higher connection driveway densities, lower speed limits and average traffic volumes and less travel lanes; average traffic volumes and interval spacing are more significant factors in designating a rural major collector.
Eligible (urban only)
Municipal
Local Collector Roadways generally designated by default (not receiving classification as an arterial, major collector or minor collector) which are generally intended for short travel, low traffic volumes and providing a high level of access.
Ineligible Municipal
Table 65: 2014 Functional Classification Mileage
Interstates (Urban)
Segment name from to miles Exit 10 (containing two geographically separate roads)
0.73
Exit 11 (containing two geographically separate roads)
0.67
I-295 LINCOLN TOWN LINE NORTH ATTLEBORO TL 3.146
I-295 on ramp, northbound 0.85
I-295 on ramp, southbound 0.77
Total 6.16

2016 | Cumberland Comprehensive Plan | APPENDIX D D-2
Other Freeways and Expressways (Urban)
Segment name miles Woonsocket Industrial Highway (State Highway 99)
0.635
Other Arterials (Urban)
Segment name from to miles
Broad Street Central Falls TL Mendon Rd 1.52 Dexter Street Broad Street Mass State Line 0.78
Diamond Hill Road High Street Wrentham Road 6.11 George Washington Highway Lincoln TL Mendon Road 0.14
Mendon Road Lincoln TL Woonsocket CL 7.32 High Street 1.123
Pine Swamp Road 2.14 Total 20.25
Minor Arterials (Urban)
Segment name from to miles Angell Road Mendon Road Diamond Hill Road 1.69
Ann and Hope Way 0.28 Church Street 0.12
Diamond Hill Road 0.08 John Street Lincoln TL Broad Street 0.36
Manville Hill Road New River Road Mendon Road 0.76
Marshall Avenue Mendon Road Diamond Hill 0.58 Nate Whipple Highway Mendon Road Massachusetts SL 4.32
West Wrentham Road Mendon Road Pine Swamp Road 2.55 Wrentham Road 0.97
Total 11.71

2016 | Cumberland Comprehensive Plan | APPENDIX D D-3
Table 65: 2014 Functional Classification Mileage continued
Major Collectors (Urban) Segment name from to miles Abbott Run Valley Road Mass. State line Nate Whipple Highway 2.54
Abbott Street 0.28
Albion Road School St. Mendon Road 0.75 Bear Hill Road Diamond Hill Rd Abbott Run Valley Road 1.33
Blackstone Street Broad St High Street 0.3 Chambers Street Broad Street 0.33
Elder Ballou Meeting House Road Woonsocket CL West Wrentham Rd 0.38 England Street Dexter Street Highland Avenue 0.47
High Street Dexter Street Mill Street 0.88 Highland Avenue High Street England Street 0.45
Highland Corporate Drive 1.73 Hillside Road Diamond Hill Rd Abbott Run Valley Road 0.69
Hines Road High Street Bear Hill Road 1.42
Leigh Road I-295 Pine Road 1.19 Little Pond County Road Lippitt Avenue Nate Whipple Highway 1.41
Martin Street Lincoln TL Mendon Road 0.48 Mill Street Broad Street 0.42
Myrtle Street 0.17 North Attleboro Road Nate Whipple Highway Massachusetts SL 0.63
Prospect Street 0.06 Total 17.815
Minor Collectors (Urban)
Segment name from to miles Kay Street Mount Pleasant Mendon Road 0.48
Mount Pleasant View Avenue Kay Street Manville Road 0.40 Total 0.88

2016 | Cumberland Comprehensive Plan | APPENDIX E E-1
APPENDIX E. NATURAL HAZARDS PROFILE
Severe Storms: Hurricane/Hail/Lightning/Wind Event and Tornados. A hurricane is a monolithic storm event marked by circular wind and rain flow configuration of 100 miles or more in width that travels several thousand miles, usually in a northerly direction. A hurricane is tropical cyclone with wind speeds exceeding 74 miles per hour. The hurricane season is between June 30 and November 1.
A thunderstorm is formed from a combination of moisture, rapidly rising warm air and a force capable of lifting air such as a warm and cold front, a sea breeze or a mountain. All thunderstorms contain lightning, which is an electrical discharge that results from the buildup of positive and negative charges within a thunderstorm. Thunderstorms may occur singly, in clusters or in lines. Thus, it is possible for several thunderstorms to affect one location in the course of a few hours. Some of the most severe weather occurs when a single thunderstorm affects one location for an extended time.
A tornado is a violent windstorm characterized by a twisting, funnel-shaped cloud. It is spawned by a thunderstorm (or sometimes as a result of a hurricane) and produced when cool air overrides a layer of warm air, forcing the warm air to rise rapidly. The damage from a tornado is a result of the high wind velocity and wind-blown debris. Tornado season is generally March through August, although tornadoes can occur at any time of year. Severe storms in Cumberland can cause severe property damage, including damage to building rooftops and windows, vehicles, fences, signs, utility lines, and trees. Serious injuries or fatalities do not typically occur in Cumberland; however, injuries have been documented within the past as a result of such events. Severe windstorms can result in power outages, disruptions to transportation corridors and equipment, restricted workplace access, significant property damage, injuries, loss of life, and the need to shelter and care for individuals impacted by the events.
Nor’easter/Snowstorm. A northeast coastal storm (known as a nor’easter) is a large counter-clockwise wind circulating around a low pressure center. Traveling up the eastern United States with horizontal storm speed is about 25 miles per hour, a storm’s radius can be as large as 1000 miles. Sustained winds of 10-40 mph may be perforated with gusts of up to 70 mph. Typically occurring once or twice per year in winter months, a nor’easter lasts between twelve hours and three days. Occurring in New England once or twice annually, nor’easters cause flooding, various degrees of wave and erosion-induced damage to structures, and erosion of natural beaches, dunes and coastal bluffs. The erosion of coastal features commonly results in greater potential for damage to shoreline development from subsequent storms. While an individual hurricane may be more severe than a typical nor’easter, Rhode Island has suffered more accumulative damage from nor’easters because they occur more frequently.
Ice Storm. “Ice storm” describes occasions when a storm event results in significant accumulations of ice and freezing rain, often accompanied by fierce winds. Ice storms result from the accumulation of freezing rain, which is rain that becomes super-cooled and freezes upon impact with cold surfaces. Freezing rain most commonly occurs in a narrow band within a winter storm that is also producing heavy amounts of snow and sleet in other locations. Among the most devastating of winter weather phenomena, ice storms create dangerous conditions resulting in vehicular accidents, power and communication system failures, and walking hazards. Further, repair and emergency response service delivery are seriously compromised by slippery conditions. The greatest threat from ice storms is to essential utility and transportation systems, also known as lifelines. It coats power and communications lines, trees, highways, bridges and other paved surfaces. Ice-weighted wires, antennae, and structures holding them can break and collapse. Downed trees and limbs can also damage lines and block transportation routes.

2016 | Cumberland Comprehensive Plan | APPENDIX E E-2
Extreme Cold. In Rhode Island, extreme cold is considered below -18C or zero F. Prolonged exposure to the cold can cause frostbite or hypothermia and prolonged exposure can be life threatening. Infants and elderly are most susceptible. Certain medications, medical conditions or consumption of alcohol can also make people more susceptible to the cold. Another risk common with extreme cold come from house fires and carbon monoxide poisoning associate with the use of supplemental light and heating devices (wood, kerosene, etc. for heat, and fuel
burning lanterns or candles).
Winter weather health risks. Winter storms, ice storms and extreme cold can adversely affect people, some more than others. Those persons 65 years of age or more are especially vulnerable. National Oceanic and Atmospheric Administration (NOAA) has produced data on winter weather fatalities associated with winter weather. Of deaths related to exposure to cold: 50% were over 60 years old, over 75% were male and about 20% occur in the home. Of winter deaths related to ice and snow: about 70% occur in automobiles, 25% of the people were caught out in the storm and the majority were males over 40 years old dying of heart attacks from snow shoveling.
Extreme Heat/ Drought. Extreme heat is a condition where temperatures hover 10 degrees or more above the average regional high temperature, lasting for several weeks. Humid or muggy conditions, which add to the dis--comfort of high temperatures, occur when a "dome" of high atmospheric pressure traps hazy, damp air near the ground. Excessively dry and hot conditions can provoke dust storms and low visibility. Droughts occur when a long period passes without substantial rainfall. A drought combined with a heat wave can be very dangerous. Extreme heat temperatures may also lead to serious health problems, including heat stroke, heat exhaustion, or sunburn (Center for Disease Control 2004). Older adults, young children, those infirmed or overweight are more susceptible to extreme heat. Heat-related illnesses can be induced by stagnant atmospheric conditions and poor air quality.
As asphalt and concrete surfaces store heat longer and gradually release heat at night, this can produce higher nighttime temperatures known as the “urban heat island effect.” Heat islands develop when a large fraction of the natural land cover in an area is replaced by built surfaces that trap incoming solar radiation during the day and then re-radiate it at night. This slows the cooling process thereby keeping nighttime air temperatures high relative to temperatures in less urbanized areas (NJDEP, 2004). Consequently, people living in urban areas may be at greater risk from the effects of a prolonged heat wave. Cumberland is vulnerable to extreme heat due to a significant number of elderly residents and a high percentage of homes and apartments not equipped with air conditioners.
Table 66: Recent Heat Waves in Rhode Island
year description
2010 The weather pattern for July 2010 was dominated by the North Atlantic High over much of the eastern and southern United States. Causing a heat wave to blanket the State of Rhode Island, July temperatures averaged warmer than normal along most of the country east of the Mississippi River. With July 2010 ranking as the warmest July between 1895 – 2010, it was a record for Rhode Island.
2008 June of 2008 saw a heat wave lasting three days with temperatures soaring above 95 degrees, breaking records set the previous year.
2007 In August 2007, a heat wave gripped Rhode Island sending temperatures above 90 degrees, lasting for 2 days.
1999 The summer of 1999 saw a devastating heat wave and drought in the eastern United States. Rainfall shortages resulted in the worst drought on record for Maryland, Delaware, New Jersey, and Rhode Island.
Wind Chill Factors

2016 | Cumberland Comprehensive Plan | APPENDIX E E-3
Earthquakes. Earthquakes are vibrations caused by the movement of the Earth’s crustal plates. The Earth’s crust is, on average, approximately 45 miles thick and consists of several plates that slide over a partially molten layer of the planet. Rhode Island is located in a subduction zone, characterized by oceanic plates sinking underneath continental plates.12 In subduction zones, the crust builds up tension, which eventually releases with violent force. The resulting vibration causes distortion and uplift of the surface crust and may be extremely damaging.
Rhode Island has a 2% chance that an earthquake with a peak horizontal acceleration of 50 km above Magnitude will occur within the next 50 years. A G is the average acceleration produced by gravity at the earth’s surface (9.80665 meters per second squared). This measurement describes ground shake during earthquakes. The impact of an earthquake in Cumberland could be devastating. All structures in
Table 67: Earthquakes in Rhode Island, 1925-present
date point of origin magnitude/impact
1925 February 28 St. Lawrence River region Intensity V affects felt on Block Island and in Providence, Intensity IV effects felt in Charlestown
1929 November 19 Grand Banks Newfoundland Moderate vibrations felt on Block Island and on Chepachet, Newport, Providence and Westerly
1935 November 1 Quebec, Canada A magnitude of 6.25 with intensity IV felt on Block Island and in Providence and Woonsocket
1940 December 20, 24 Lake Ossipee, NH Intensity V affects knocked pictures off walls in Newport. Intensity IV affects were felt at Central Falls, Pascoag, Providence and Woonsocket. Intensity I-III effects were felt at Kingston, New Shoreham and Wakefield
1944 September 4 Massena, NY Intensity I-III was reported in Kingston, Lonsdale, Providence, Wakefield and Woonsocket
1963 October 16 Massachusetts coast A magnitude 4.5 quake caused Intensity V to be felt in Chepachet with reports of some cracked plaster. There were also reports of rattling windows and dishes and rumbling earth sounds. Other Northern RI locations felt the tremor but with less intensity.
1965 December 7 Unknown Windows and doors shook in Warwick and furniture and small objects moved in Bristol
1967 February 2 Unknown A magnitude 2.4 created Intensity V effects in Middletown, Newport, North Kingston and Jamestown. No Damage reported.
1973 February 3 Unknown Explosion like or sonic boom noises were heard throughout RI and houses and windows shook, but nothing was reported by seismographs
1973 June 14 Western Maine Intensity IV effects felt at Charlestown and Intensity I-III felt at Bristol, E. Providence, Harmony and Providence
2003 October 6 West Warwick A magnitude of 1.8 caused minor shaking, no damage reported
2015 July 22 Providence Magnitude 2.3 caused minor shaking and no damage.
Modified Mercalli Intensity levels, noted with “Intensity” and a Roman numeral, are defined as follows: I Not felt except by a very few under especially favorable conditions; II Felt only by a few persons at rest, especially on upper floors of buildings; III Felt quite noticeably by persons indoors, especially on upper floors of buildings. Many people do not recognize it as an earthquake. Standing motor cars may rock slightly. Vibrations similar to the passing of a truck. Duration estimated; IV Felt indoors by many, outdoors by few during the day. At night, some awakened. Dishes, windows, doors disturbed; walls make cracking sound. Sensation like heavy truck striking building. Standing motor cars rocked noticeably; V Felt by nearly everyone; many awakened. Some dishes, windows broken. Unstable objects overturned. Pendulum clocks may stop; and VI Felt by all, many frightened. Some heavy furniture moved; a few instances of fallen plaster. Damage slight.
Source: US Geological Survey; Earthquake History of Rhode Island
12 Lynn S. Fichter, “Plate Tectonic Theory: Plate Boundaries and Interplate Relationships,” James Madison University Department of Geology & Environmental Science. 31 Earthquake Hazards Program, “National Seismic Hazard Maps-2008,” U.S. Geological, Surveyhttp://gldims.cr.usgs.gov/nshmp2008/viewer.htm

2016 | Cumberland Comprehensive Plan | APPENDIX E E-4
Cumberland’s buildings are potentially vulnerable to seismic ground shaking. Historic buildings, constructed of unreinforced masonry, are at particular risk. It is unknown how much risk there is to Cumberland’s critical facilities and infrastructure. Design and construction determines the ability to withstand seismic shaking. Municipal building codes do not specifically require seismic proofing.
Wildfires. Forest Fires are another risk in parts of Cumberland because of large dense forested areas such as Diamond Hill Park and areas surrounding the Pawtucket Reservoir. Also at risk are large open space parcels, most of which abut residential neighborhoods. A fire in any of these areas could quickly overwhelm local resources, threatening nearby homes.