Catalytic Wet Air Oxidation of Phenol in a Trickle Bed Reactor
Upload
khangminh22Category
view
0download
0
Numerical Study of a Water Gas Shift Fixed Bed Reactor
Operating at Low Pressures
Wail El-Bazi1,*, Mustapha Bideq2, Abderrahim El-Abidi2, Said Yadir2, Bajil Ouartassi3
1Laboratory of Process Engineering, Computer Science and Mathematics, Department of Process Engineering,
National School of Applied Sciences, Sultan Moulay Slimane University, Bd Béni Amir, BP 77, 25000, Khouribga,
Morocco. 2Laboratory of Materials, Processes, Environment and Quality (LMPEQ), National School of Applied Sciences,
Cadi Ayyad University, Route Sidi Bouzid BP 63, 46000 Safi, Morocco. 3Laboratory of Process Engineering, Computer science and Mathematics, Department of Computer Science and
Mathematics, National School of Applied Sciences, Sultan Moulay Slimane University, Bd Béni Amir, BP 77,
25000, Khouribga, Morocco.
Bulletin of Chemical Reaction Engineering & Catalysis, 17 (2) 2022, 304-321
Abstract
Today, hydrogen has become one of the most promising clean energy. Several processes allow obtaining hydrogen,
among them there is the Water Gas Shift (WGS) reaction. On an industrial scale, WGS reaction takes place at
high pressure [25–35 bar]. At high pressure, the cost of the process rises due to the energy consumed by compres-
sion, and the reduction in the lifetime of the equipment and the catalyst. At low pressures, catalyst lifetime can
reach many years and the energy cost is reduced. It is for this reason that we are interested in modelling and sim-
ulation of a WGS converter operating at low pressures close to atmospheric pressure. In this work, a numerical
study was conducted in order to determine the conditions allowing good rector operating at low pressure. A num-
ber of drawbacks of the process were identified. These drawbacks are essentially the non-negligible pressure drops
and the strong intraparticle diffusion resistances. The prediction of the concentrations and the reaction rate with-
in the pellet showed that the active zone of the pellet is located near the particle surface. It has also been shown
that the resistances to interfacial mass and heat transfer are insignificant. The study of pressure effect showed
that the pressure increase reduces the required catalyst mass to achieve equilibrium. Finally, this work revealed
that the decrease in temperature and the increase in the concentrations of the reactants by increasing their fluxes,
make it possible to increase the effectiveness factor of the catalyst and the conversion of carbon monoxide.
Copyright © 2022 by Authors, Published by BCREC Group. This is an open access article under the CC BY-SA
License (https://creativecommons.org/licenses/by-sa/4.0).
Keywords: Diffusion resistances; Effectiveness factor; Fixed bed; Orthogonal collocation; Thiele’s modulus
How to Cite: W. El-Bazi, M. Bideq, A. El-Abidi, S. Yadir, B. Ouartassi (2022). Numerical Study of a Water Gas
Shift Fixed Bed Reactor Operating at Low Pressures. Bulletin of Chemical Reaction Engineering & Catalysis,
17(2), 304-321 (doi: 10.9767/bcrec.17.2.13510.304-321)
Permalink/DOI: https://doi.org/10.9767/bcrec.17.2.13510.304-321
bcrec_13510_2022 Copyright © 2022, ISSN 1978-2993; CODEN: BCRECO
Available online at BCREC website: https://bcrec.id
Research Article
1. Introduction
Hydrogen is an ideal fuel due to its high-
energy content and its compatibility with the
environment. In order to generate this molecule
from fossil fuels, biomass or synthesis gas
* Corresponding Author.
Email: [email protected] (W. El Bazi);
Telp: +212-61-4869374
Received: 26th January 2022; Revised: 26th February 2022; Accepted: 4th March 2022
Available online: 9th March 2022; Published regularly: June 2022
(syngas), the WGS uses hydrogen from water
steam and carbon monoxide [1]. This reaction is
generally carried out in the presence of catalysts
based on metals, such as Cu, Fe, Ni, Pd, Pt, Rh
and Ru [2]. Metal oxides based on iron oxide or
copper oxide are also used in the catalysis of
this reaction [3].
In order to increase the conversion of carbon
monoxide present in this balanced reaction,
Bulletin of Chemical Reaction Engineering & Catalysis, 17 (2), 2022, 305
Copyright © 2022, ISSN 1978-2993
manufacturers are implementing WGS in two
fixed bed adiabatic catalytic reactors connected
in series and comprising an intercooler [4]. In
the first reactor, the reaction is carried out at
high temperature (350–450 °C) in the presence
of catalysts based on iron oxide and chromi-
um(III) oxide (Cr2O3) [3]. In order to displace
the equilibrium, the second reactor operates at
lower temperatures (180–300 °C). Under these
low temperature conditions, the catalysts used
are based on copper or copper oxide with alumi-
na oxide promoters (Al2O3). The promoters keep
the catalyst from sintering [5]. This reaction is
present in many industrial processes such as:
DME synthesis [6], the Fischer-Tropsch Pro-
cess [7], ammonia production [3], methanol
synthesis [8] and Steam gasification processes
[5]. Typically, WGS is carried out on an indus-
trial scale at pressures between 25 and 35 bar
[9].
Several researches have been interested in
studying the chemical kinetics of this reaction.
The mathematical expressions obtained corre-
sponding to HT or LT catalysts often take the
form of a power law model comprising a factor
β taking into account the reverse reaction [10–
15]. This power law is widely used in modelling
and simulation studies, which are effective
tools in the design, diagnosis and optimization
of WGS reactors operation. The literature is
rich in a large number of works interested in
the numerical study of these converters using
several phenomenological models.
The least mathematically complicated mod-
els are the mono-dimensional pseudo-
homogeneous steady state models. These mod-
els do not take into account the limitations of
inter and intraparticle transfer phenomena,
that is why they are rather suitable for low vol-
ume reactors with small diameter catalytic pel-
lets (<0.5 mm) [15]. Maklavany et al. [16] de-
veloped a pseudo-homogeneous model with axi-
al dispersion to study the behavior of a small
isothermal reactor operating at low pressures
(1.2 - 1.65 bar) and at low temperatures. In this
study, a multi-objective optimization led to the
determination of the optimal operating condi-
tions giving a significant increase in hydrogen
productivity [16].
It should be noted that the fixed bed reac-
tors found in industry have large volumes and
large diameter catalytic pellets [15]. Under
these conditions, the resistances to inter and
intraparticle transfer of mass and heat should
be taken into account. To diagnose, size and
predict the behavior of these converters, the
mono-dimensional heterogeneous model offers
great precision for the design of reactors oper-
ating in steady state [17]. Many authors have
adopted this model for the study of WGS reac-
tors operating at medium and high pressures
[4,18–20]. These works have shown that gener-
ally, the catalytic pellet can be considered iso-
thermal, but the limitations to the intraparti-
cle transfer of mass cannot be neglected [4]. It
was also shown that choosing an optimal tem-
perature profile allows significant improve-
ments in the conversion of carbon monoxide
[18]. This model can correctly describe the be-
haviour of industrial reactors despite the pres-
ence of H2S in the reaction mixture [19]. The
use of the optimization rate Ro in thermal
management and in the design of the reactor
allows considerably reducing the catalytic
masses [20]. Another study was interested in
reactors operating at low pressures [1-4 atm]
and temperatures compared this model to 2D-
model. In this paper, it has been found that ra-
dial gradients of mass and heat can be neglect-
ed and that the 1D heterogeneous model is suf-
ficient for steady-state considerations [21].
When steady state is not achieved, the use
of a dynamic model to describe the behavior of
the reactor is necessary. Other conditions re-
quire the use of more than one-dimensional
models, such as: the non-adiabaticity of the re-
actor, the extreme exothermicity of the reac-
tion [18,22], or even, when the reaction is pro-
duced in a membrane reactor [23]. To study
these cases, other works adopting more com-
plex heterogeneous models were carried out
[15,23-25]. These studies highlighted the risk
associated with the possible overheating of cat-
alysts when starting up the industrial unit be-
fore reaching steady state [15], they show that
the location of a cooler inside the catalytic bed
affects carbon monoxide conversion [24], and
that one-dimensional models are not suitable
for the membrane reactor [23]. Thanks to the
3D model developed, it was also possible to pre-
dict the partial pressure distribution of hydro-
gen and carbon monoxide in the longitudinal
and radial direction of a cylindrical part of the
reactor [25].
Other numerical studies were conducted in-
dependently of the reactor as the Levent's theo-
retical study, which was carried out on a spher-
ical iron oxide-chromia catalyst pellet under
high pressure and temperature conditions.
This study revealed that the intraparticle tem-
perature gradients are much smaller than the
interfacial temperature gradients. At the same
time, it has been shown that the mass transfer
limitations within the pellet should not be ne-
glected when the temperature exceeds 600 K
[26].
Bulletin of Chemical Reaction Engineering & Catalysis, 17 (2), 2022, 306
Copyright © 2022, ISSN 1978-2993
Those simulation and modelling studies al-
lowed a better prediction of the reactors behav-
iour and important optimization in their de-
sign. However, there are not many papers in
literature that have focused on studying the be-
havior of large-scale WGS reactors operating at
pressures approaching atmospheric pressure.
In fact, operating at this pressure conditions
can be useful, for instance in the steam gasifi-
cation process to recover the syngas leaving the
gasification reactor at low pressure [5]. In addi-
tion, operating at low pressures reduces energy
consumption due to the compression and in-
creases considerably the lifetime of the catalyst
[27,28]. At the same time, under these condi-
tions, the pressure drops compared to the inlet
pressure are not negligible [5,28], the catalytic
activity is disadvantaged [4,5,29] and the intra-
particular diffusion is governed by the Knudsen
regime [30,31]. Therefore, an in-depth numeri-
cal study of the behavior of reactors operating
at low pressure allowing the prediction of the
evolution of the various parameters in the Bulk
phase and inside the catalytic pellet is of great
importance. This kind of study makes it possi-
ble to define the operating conditions and the
characteristics of the catalyst and the reactor
necessary for the implementation of large-scale
WGS converters operating at pressures slightly
above atmospheric pressure. This work carried
out does adequately meet these purposes.
To achieve these objectives, several one-
dimensional models have been developed
(rigorous heterogeneous model, heterogeneous
model adopting the Thiele’s approach, and
pseudo-homogeneous model). To validate the
rigorous model that we have developed, we
compared the results obtained with the experi-
mental and numerical results that exist in the
literature.
The pseudo-homogeneous model was used to
predict the behavior of the installation without
the limitations to transfer phenomena and
Thiele’s approach was exploited in order to
evaluate the possibility of predicting the behav-
ior of the reactor in the simplest way.
In this study, we are interested in the eval-
uation of mass and heat transfer resistances
and their impact on the behavior of the con-
verter. In order to determine the active zone in
the pellet when the pressure level is low, the
intraparticle concentration and reaction rate
profiles were predicted for different axial posi-
tions in the reactor.
Finally, in order to study the effects of some
operating parameters on the yield of the pro-
cess, we have been interested in the effects of
the pressure, the temperature and the flow
rate of reactants on the effectiveness factor of
the catalyst and on various parameters at the
outlet of the reactor.
2. Chemical Kinetics and Characteristics
of the Catalyst
The WGS reaction is expressed by the equa-
tion:
(1)
The expression of intrinsic chemical kinetics
adopted here is proposed by Keiski et al. [12]:
(2)
With:
(3)
(4)
where −rCO is the rate of the WGS reaction
(mol.kg−1.s−1), Rg is the universal gas constant
(8.3144 J.K−1.mol−1), Ci is the concentration of
species i (mol.m−3), and Ke is the equilibrium
constant of the WGS reaction. The catalyst
used is based on Fe3O4-Cr2O3, the properties of
this catalyst are given in Table 1 [12].
3. Process and Modeling
3.1 Process Description
The catalytic reactor considered is an adia-
batic multi-tubular fixed bed reactor. These
tubes are packed with the catalyst and fed with
a reaction mixture with a flow of 2670.61
kg.h−1. This flux was chosen to study a feed
flux of real order of magnitude, because it cor-
responds to one of the total fluxes feeding the
pilot reactors as reported by van Dijk et al. [19]
and Rosner et al. [20].
Particle
diameter
(dP, m)
Shape
Density
of solid
(ρs, kg.m−3)
Thermal conductivity
of solid
(λS, W.m−1.K−1)
Intragranular
porosity
(εC)
Average
pore size
(dpore, m)
Pore
tortuosity
(τ)
210−3 Spherical 1945 0.3 0.48 910−9 4
Table 1. Catalyst characteristics.
12 2 2 (298 ) 41.2kJ.molR KCO H O CO H H −+ + = −
( )2
0.54 0.166578.5123714.5exp 1CO CO H O
g
r C CR T
−
− = −
2 2
2
1CO H
CO H O e
C C
C C K =
4577.8exp 4.33eK
T
= −

Bulletin of Chemical Reaction Engineering & Catalysis, 17 (2), 2022, 307
Copyright © 2022, ISSN 1978-2993
The characteristics of the reactor and the
specifications of the feed streams are presented
in Table 2. To study the effect of temperature
on the behaviour of the reactor, other simula-
tions were carried out for other feed tempera-
tures, while keeping the other operating condi-
tions and the same characteristics of the reac-
tor (Table 2).
The composition chosen corresponds well to
that studied to establish the kinetic expression
that we used in this paper and which is pre-
sented in Equation (2) [12], the H2O/CO ratio
and the temperatures chosen also enter into
the range of H2O/CO ratios and temperatures
tested for the establishment of this kinetic ex-
pression [12]. In addition, this composition is in
perfect agreement with that of the gas stream
at the outlet of a gas reforming reactor derived
from coal or biomass characterized by signifi-
cant hydrogen fractions [23]. The choice of the
high H2O/CO ratio is motivated also by practi-
cal reasons. Indeed, when the H2O/CO ratio is
low, there is formation and deposition of carbon
on the pellets leading to a deactivation of the
catalyst, which is not taken into account in the
models developed [32].
In order to evaluate the effect of the pres-
sure on the behavior of the reactor, other simu-
lations were carried out for different values of
the feed pressure (P0 = 9.87 atm, P0 = 4.93
atm), while keeping the other operating condi-
tions and the same characteristics of the reac-
tor (Table 2).
The study of the effect of the reactants flow
rates on the process required the realization of
other simulations for other reactants feed-
streams, while the other operating conditions,
the H2O/CO ratio (H2O/CO = 5) and the charac-
teristics of the reactor have not been changed
(Table 2).
In order to validate the rigorous model de-
veloped, we carried out other simulations tak-
ing into account the operating conditions, the
characteristics of the reactors and the size of
the catalyst pellets as reported by Marin et al.
[23] and Sanz et al. [32].
3.2 Modelling
The calculation code used to solve this prob-
lem has been developed under Matlab soft-
ware.
3.2.1 Assumptions and justifications
We have considered that the catalyst pellets
are isothermal, because it was verified that
[26,33]:
(5)
where, ΔTmax is the maximum temperature var-
iation between the center and the surface of
the pellet (K), ΔHR is the enthalpy of the WGS
reaction (J.mol−1), De,CO is the effective diffusion
coefficient of CO (m2.s−1), CCOs is CO concentra-
tion at the surface particle (mol.m−3), CCOf is
CO concentration in the bulk phase (mol.m−3),
and λe is the effective thermal conductivity
(J.m−1.s−1.K−1)
We can calculate the axial dispersion coeffi-
cient of CO (DCO,ax, m2.s−1) by using equation
[34]:
(6)
where, εb is the porosity of the catalytic bed, Re
is the Reynolds number, ScCO is the Schmidt
number of CO, and us is the superficial velocity
(m.s−1).
It has been found that Re>10,
(Lt/DCO,ax)>300 and the reactor is known to be
adiabatic. Under these conditions, we can ne-
glect the two modes of dispersion (axial and ra-
dial) [33]. Therefore, the use of one-
dimensional models without dispersions and
neglecting intraparticle temperature gradients
is acceptable.
3.2.2 Catalyst pellet model
a. Rigorous model
The tortuous pores contained in the catalyst
pellets are sites of diffusive mass transfer and
chemical reaction. The intraparticle mass bal-
ance equations are written [6]:
Fixed bed reactor
Number of tubes (Nt) 317
Diameter of tube (Dt, m) 0.09
Length of tube (Lt, m) 1
Feed stream of species i (Fi,0, mol.s−1)
FN2,0 7.097
FH2,0 19.337
FH2O,0 12.095
FCO2,0 4.977
FCO,0 2.419
Feed stream operating conditions
Feed temperature (T0, K) 650
Feed pressure (P0, Pa) 121560
Table 2. Characteristics of the reactor and
the feed stream taken into account in the
simulation.
,,max
. .. .0.02
R e CO COfR e CO COs
e e
H D CH D CT K
=
, 0.5Re.
b bCO ax s p
CO
D u dSc
= +
Bulletin of Chemical Reaction Engineering & Catalysis, 17 (2), 2022, 308
Copyright © 2022, ISSN 1978-2993
For the reactants:
(7)
where, De,i is the effective diffusion coefficient
of species i (m2.s−1), r is the particle radial coor-
dinate (m), and Fpres is the pressure scale-up
factor.
For the products:
(8)
In the center of the particle, the concentrations
of the reactants are minimal whereas the con-
centrations of the products are maximal. We
can then express the boundary conditions equa-
tions corresponding to this intraparticle posi-
tion (r = 0) as follows:
(9)
The pellet is surrounded by a film where
convective transfers of mass and heat take
place. One can then establish the equations of
the boundary conditions corresponding to the
surface of the particle (r = R) as follows:
(10)
(11)
where, KC,i is the mass-transfer coefficient of
species i (m.s−1), Ci,f is the species i concentra-
tion in the bulk phase (mol.m−3), Ci,s is the spe-
cies i concentration at the surface particle
(mol.m−3), h is the heat-transfer coefficient
(J.s−1.m−2.K−1), Ap is the particle surface (m2), Ts
is the temperature of the surface of the pellet
(K), Tf is the temperature of the bulk gas (K), ṝ is the apparent reaction rate (mol.kg−1.s−1), Vp
is the particle volume (m3), ɳs is the Particle ef-
fectiveness factor, and rCOs is the reaction rate
under surface conditions (mol.kg−1.s−1).
At steady state, the rate of reactant con-
sumption within the particle is equal to the
rate of mass fluxes transferred from the Bulk
to the particle exterior surface [30]. We can
then arrive at the following equation valid for
the reactants:
(12)
where, R is the particle radius (m).
For the products, we use the following equa-
tion:
(13)
The intraparticle and the surface of the cat-
alyst concentrations of the various chemical
species involved in the reaction, as well as the
surface temperature are obtained by solving
the system of Equations (7)–(10) and Equation
(12) applied to carbon monoxide. To perform
this resolution, we adopted the orthogonal col-
location method, which is the most suitable
technique for this kind of differential equations
(diffusion-reaction) [35]. Resolutions are done
using different numbers of internal collocation
points. The concentrations obtained corre-
sponding to the points of collocation (internal,
in the center of the pellet and at the surface of
the pellet) are exploited to estimate the reac-
tion rates within and at the surface of the par-
ticle, which makes it possible to calculate the
overall effectiveness factor (ɳe) using the equa-
tion [30]:
(14)
where, rCOf is the reaction rate under Bulk con-
ditions (mol.kg−1.s−1), which is calculated using
the Bulk phase concentrations and tempera-
ture:
(15)
b. Generalized Thiele’s model
This approach is adopted by some authors
to study the behavior of fixed bed catalytic re-
actors. For example, the WGS reactors [24], or
even the converters of dehydrogenation of 1-
Butene into Butadiene [36]. This model can be
relatively misleading in the case of the inter-
mediate regime [37], but remains relatively
less complicated mathematically than the rig-
orous model.
Thiele's modulus ( s) is expressed by the fol-
lowing equation [37]:
(16)
The particle effectiveness factor is calculated
using the mathematical expression:
(17)
It is possible to make some simplifications to
express CH2O, CCO2 and CH2 according to CCO
[36].
2, 2
10i
e i s pres CO
dCdD r F r
dr drr
− =
( )0 0idCr
dr= =
( ) ( ), , , ,i
C i i f i s e i
dCK C C D r R
dr− = =
( )p s f s pres r p
s COs s pres r p
hA T T r F H V
r F H V
− =
=
( ) ( ),i
s f e i r
dCh T T D r R H
dr− = − =
( ) ( ),i
s f e i r
dCh T T D r R H
dr− = =
2
0
1( ).4
.
R
e CO
COf p
r r r drr V
=
2 2
2
2
0.54 0.166578.512 13714.5exp 1
CO f H f
COf pres COf H Of
g f COf H Of e
C Cr F C C
R T C C K
−− = −
( )
,
,
0.5
,
6
2CO s
CO eq
COs
sC
e CO CO COC
dpr
D r dC
−
= −
( )1 1 1
tanh 3 3s
s s s
= −
2, 2
10i
e i s pres CO
dCdD r F r
dr drr
+ =
Bulletin of Chemical Reaction Engineering & Catalysis, 17 (2), 2022, 309
Copyright © 2022, ISSN 1978-2993
- for H2O:
(18)
- for the products:
(19)
Dividing Equation 12 or 13 over Equation 10
expresses Ci,s in terms of Ci,f, Ts, and Tf.
- for the reactants, we have the following ex-
pression:
(20)
- for the products, we use the equation:
(21)
To calculate the overall effectiveness factor
from the particle one, we use the expression:
(22)
Equations (11) and (16)–(22) are used in an it-
erative calculation in order to be able to calcu-
late ɳe. The calculation of CCO,eq is done by solv-
ing the equation rCO = 0 using the Newton-
Raphson’s method.
3.2.3 Fixed-bed reactor model
a. One-dimensional heterogeneous model [38]:
The equations of the model are derived from
the continuity equation for the key component,
CO, and the steady-state system energy bal-
ance, as follows:
Mass balance:
(23)
where, XCO is the carbon monoxide conversion,
Z is the reactor axial coordinate (m), ρB is the
apparent density of the bed (kg.m−3), and S is
the reactor tube cross section (m2).
Energy balance for an adiabatic reactor:
(24)
where, Cpi is the heat capacity at constant pres-
sure of species i (J.mol−1.K−1), and T is the tem-
perature (K).
The validation of the rigorous model re-
quired the establishment of an energy balance
for an isoperibolic reactor:
(25)
where, hw is the wall heat transfer coefficient
(W.m−2.K−1), and Tw is the wall temperature
(K).
The pressure drop along the bed is evaluated
by using Ergun’s equation:
(26)
where, P is the pressure (Pa), f is the friction
factor, and ρ is the density of fluid (kg.m−3).
To perform the numerical resolution, we
first divide the axial length of the reactor tube
into 200 sections. At the inlet of each section,
the effectiveness factor is calculated
(paragraph 3.2.2). Subsequently, this factor is
introduced into the ordinary differential Equa-
tions (23) and (24) for an adiabatic reactor, or
into the ordinary differential Equations (23)
and (25) for an isoperibolic reactor. The ODE
system (Equations (23), (24), and (26)) for an
adiabatic reactor, or the ODE system
(Equations (23), (25), and (26)) for an isoperi-
bolic reactor was solved by the RK4 method.
Through this procedure, the effectiveness fac-
tor corresponding to each section is determined
and therefore the effectiveness factor profile
along the installation, as well as the carbon
monoxide conversion profile, temperature pro-
file and pressure profile. The validation of the
rigorous model required also the study of an
isothermal reactor. In this case, the Equations
(24) and (25) were not used.
b. Mono-dimensional pseudo-homogeneous
model [38]:
The System of ordinary differential equa-
tions related to this model is the same as that
presented in the previous paragraph, but with
ɳe = 1. Therefore, the numerical method used is
the same, but without the need to calculate the
effectiveness factor.
3.2.4 Complementary equations
Table 3 shows the formulas and equations
used for the estimation of the other parameters
corresponding to the models studied.
4. Results and Discussion
4.1 Estimation of the Effectiveness Factor and
Determination of Resistance Limiting Transfer
Phenomena
Figure 1 shows the profiles of the overall ef-
fectiveness factor ɳe, along the reactor using
the rigorous model and adopting different
numbers of internal collocation points. We no-
tice that the 3 profiles are close and that the ef-
( ),, ,
,
e COi i s CO s CO
e i
DC C C C
D= + −
( ), ,
,
i s i f s f
C i r
hC C T T
K H= + −
( ), ,
,
i s i f s f
C i r
hC C T T
K H= − −
,
, ,
s CO se
CO f CO f
r r
r r
= =
,0
e CO pres BCO
CO
r F SdX
dZ F
−=
i pi e R CO pres B
dTFC H r F S
dZ =
( )i pi e R CO pres B w t w
dTFC H r F S h D T T
dZ = − −
2s
p
udPf
dZ d
= −
( )2 2
2
,, ,
,
e COH O H O s CO CO s
e H O
DC C C C
D= + −
Bulletin of Chemical Reaction Engineering & Catalysis, 17 (2), 2022, 310
Copyright © 2022, ISSN 1978-2993
Diffusion coefficients
(27) if 1 > dpore with: (28) [30,31]
where, Mi is the molecular weight of species i (kg.mol−1), l is the mean free path (m), NA is the Avoga-
dro constant (6.02214076×10²³ mol−1), and σ is the average diameter of molecules (m).
(29) [18]
where, Di,m is the molecular diffusion coefficient in the gas mixture (m2.s−1), Di,j is the binary diffusion
coefficient (m2.s−1), and yi is the mole fraction of component i. The formulas related to the calculation
of Di,j are available in [18].
Thermal conductivities
(30) [39]
where, λg is the gas-mixture thermal conductivity (J.m−1.s−1.K−1), and Pr is the Prandtl number.
with: (31) [16]
where, λi is the thermal conductivity of species i (J.m−1.s−1.K−1). The expressions of λi according to the
temperature are detailed in [15].
Viscosities
(32) [16]
where, µ is the dynamic gas-mixture viscosity (kg.m−1.s−1), and µi is the dynamic viscosity of species i
(kg.m−1.s−1). The expressions of µi according to the temperature are given in [15].
Heat capacities
(33) with: (34) [33]
where, Cp is the specific heat capacity of the gas mixture (J.kg−1.K−1), and Mm is the molecular weight
of the gas mixture (kg.mol−1). The expressions of Cpi according to the temperature are detailed [15].
Flow rates and velocities
(35), (36) [28]
(37), (38) with: (39) [33]
where, G is the superficial mass velocity (kg.m−2.s−1).
Dimensionless numbers
(40), (41) (42) [33]
Table 3. Correlations and auxiliary equations.
0.5
4, 4850 10Ce i pore
i
TD d
M
− =
2 2
g
A
R TlPN
=
( )
1
, 1,,
1N i
i m i j i ji j
yD y
D
−
=
= −
10.75 Pr Re
0.139 0.0339 6.667
Ce g C C
C g
−= + +
− +
3
3
i i iig
i ii
y M
y M
=
1
1
N i ii
N j
jji
y
My
M
=
=
=
i pi
p
m
y CC
M=
m i iM y M=
,0 ,0reactant i CO COF F F X= − ,0 ,0product i CO COF F F X= +
1
n i ii
FMG
S== s
Gu
= 1
i n
i iig
Py M
R T
=
==
.Re
pG d
= Pr
p
g
C
=
,
i
i m
ScD
=
Bulletin of Chemical Reaction Engineering & Catalysis, 17 (2), 2022, 311
Copyright © 2022, ISSN 1978-2993
Bed porosity
(43) [19]
Mass and heat transfer coefficients
(44) [33]
(45) [30]
Molar concentration of species i
(46) [28]
Pressure scale-up factor
(47) [15]
Bed density
(48) [38]
Heat of reaction
(49) [15]
Friction factor
with: a = 1.75 and b = 150 (50) [38]
Catalytic mass Corresponding to a longitudinal position Z
(51) [28]
where, w is the mass of catalyst (kg).
Resistances to external heat and mass transfer
(52), (53) [30]
where, fe is the fraction of resistance to external mass transfer, and e is the fraction of resistance to
external heat transfer.
Table 3. …. (continued)….
2
2
2
0.38 0.07 1
t
p
B
t
p
D
d
D
d
− = + −
23 0.41 0.454
Re .iC s i
B
K u Sc
− −=
2 23 31.2 Pr
iC i ph K Sc C−
=
ii
g
y PC
R T=
( )0.5
250( )
P atm
presF P atm
−
=
( )1B B s = −
( )2 2 2
4, , , ,298
4.12 10T
R p CO p H p CO p H OH C C C C dT = − + + − −
3
1 1
Re
B B
B
f a b
− − = +
( ) . . Bw Z S Z =
COf COs
e
COf
C Cf
C
−=
s f
e
f
T T
T
−=

Bulletin of Chemical Reaction Engineering & Catalysis, 17 (2), 2022, 312
Copyright © 2022, ISSN 1978-2993
fectiveness factor profiles corresponding to 7
and 8 points are almost identical. In the rest of
this work, we adopt the results corresponding
to 8 internal collocation points.
From this figure, there is a decrease in the
effectiveness factor along the installation until
the equilibrium is reached (Z ≈ 0.245 m), where
this factor stabilizes at a value of 0.156. This
drop in ɳe, which signifies an increase in re-
sistances to transfer phenomena, may be due to
several reasons, such as: the increase of tem-
perature or even the evolution of the concentra-
tions of the different chemical species involved
in the reaction along the reactor. We are going
to explain this decrease in the effectiveness fac-
tor in more detail later in this paper.
In order to determine the resistances to the
transfer phenomena responsible for these low
values of ɳe, we first evaluated the resistances
to the mass transfer and interparticle heat. To
do this, we estimated the profile of fe and e
along the reactor (Figures 2 and 3).
Figure 2 shows that fe at the inlet of the re-
actor has a low value which is less than 610−3
and decreases further when moving forward in
the reactor to the longitudinal position of 0.3,
where fe becomes zero and keeps this value
through the installation. e also follows the
same trend, but with an even lower value at
the reactor inlet (αe ≈ 3.3510−4) and canceling
out at the same longitudinal position as before.
The decrease in fe and e, and therefore, the de-
crease in the concentration and interparticle
temperature gradients, is the consequence of
approaching the equilibrium (chemical and
thermodynamic) by advancing in the reactor.
These very low values of fe and e indicate that
the resistances to interparticle transfer of mass
and heat are negligible. In addition, the grain
has been shown to be isothermal, which results
in the absence of heat transfer resistances
within the pellet. Therefore, the system is dom-
inated by intraparticle diffusional resistances.
4.2 Validation of the Proposed Model
In order to validate the rigorous heterogene-
ous model developed, we proceeded to the com-
parison of the results obtained with the experi-
mental and numerical results we found in the
literature, under similar operating conditions.
The first comparison was made with the exper-
imental study conducted by Sanz et al. [32],
which is carried out on a laboratory fixed-bed
isothermal reactor. We took into consideration
all the operating conditions and the character-
istics of the catalyst and the reactor, which are
detailed in reference [32]. For the catalytic par-
ticle model, we used our spherical grain model, Figure 1. Overall effectiveness factor (ηe) vs.
reactor length (Z(m)).
Figure 2. Fraction of resistance to external
mass transfer (fe) vs. reactor length (Z(m)).
Figure 3. Fraction of resistance to external
heat transfer (e) vs. reactor length (Z(m)).
Bulletin of Chemical Reaction Engineering & Catalysis, 17 (2), 2022, 313
Copyright © 2022, ISSN 1978-2993
considering that the diameter is that of the
equivalent sphere to the cylindrical particle
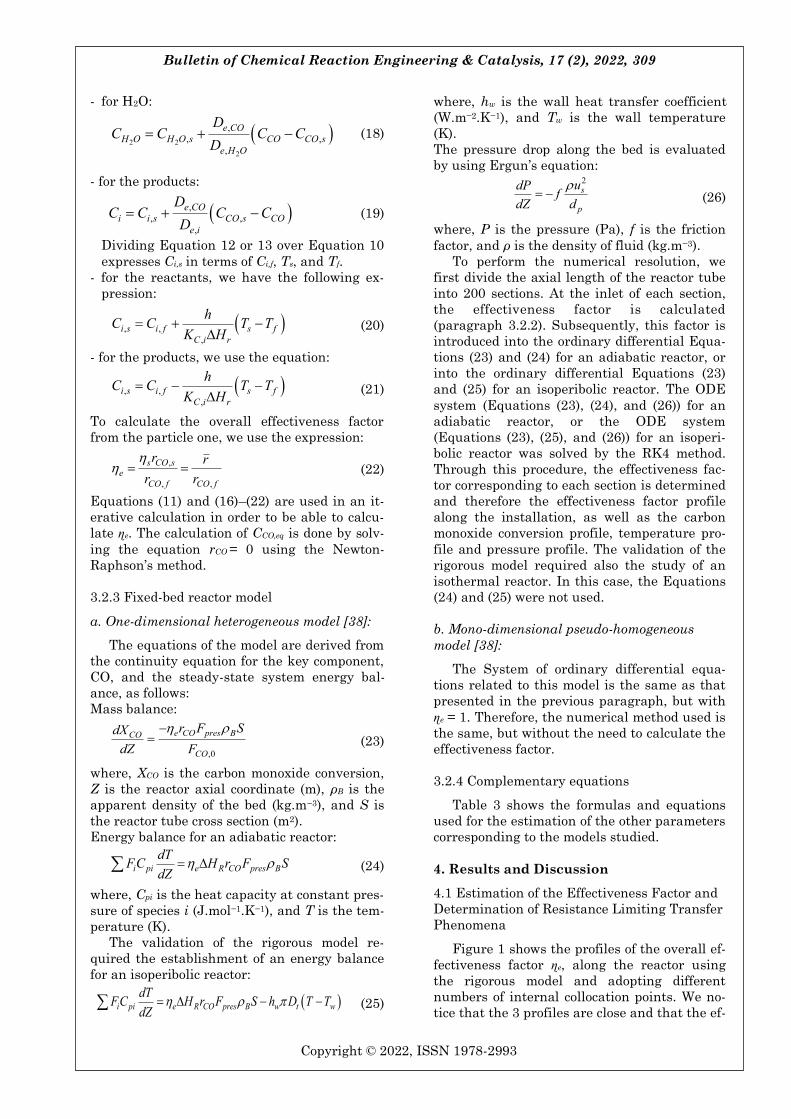
used in the study [32]. Figure 4 presents the
experimental conversions and those obtained
by simulation for a temperature of 623 K, a ra-
tio H2O/CO = 1 and for different (GHSV) (the
ratio of the feed volumetric flow rate at stand-
ard conditions to the total catalyst volume).
Figure 4 shows the good agreement between
the experimental results of reference [32] and
those of the numerical simulation that we ob-
tained, and this, despite the fact that the pro-
posed model relatively overestimates XCO (the
average difference compared to the experiment
is 11%). This overestimation can be explained
by several reasons, such as: (a) The fact that
the reactor of the laboratory studied does not
behave like an ideal plug reactor, given the ex-
istence of dispersive phenomena not taken into
account by the model developed; (b) The fact
that the model does not take into account the
possible reduction in catalytic activity due to
the formation of carbon on the catalyst. The
probability of this hypothesis is not negligible,
especially since the H2O/CO ratio imposed in
the experimental study is low (H2O/CO = 1)
[32].
The second comparison was made with the
numerical study carried out by Marin et al. [23]
who studied the case of an isobaric isoperibolic
pilot reactor. We took into account all the oper-
ating conditions and the characteristics of the
catalyst and the reactor detailed in [23]. Figure
5 shows the profile of the carbon monoxide con-
version along the reactor obtained by Marin et
al. [23] and this we obtained in the present
study. According to the same figure, the differ-
ence between the two curves is acceptable even
if our model slightly underestimates XCO com-
pared to the numerical study of Marin et al.
[23] (an average difference of −7%). The differ-
ence between the two results can be explained
by the difference between the models used to
predict the intraparticle concentration and
temperature profiles in each of the two studies.
In fact, unlike our study in which a rigorous
heterogeneous mono-dimensional model was
adopted, in the study of Marin et al. [23], the
model used is heterogeneous non-rigorous
mono-dimensinal based on an expression of the
apparent reaction rate taking into account re-
sistances to intraparticle mass and heat trans-
fers [23]. To conclude, this comparative study
shows that there is a good agreement between
the results found in the literature and those
obtained by using the proposed model in this
study. Figure 4. Comparison of simulation results of
this study with experimental results of Sanz’s
et al. [32] study.
Figure 5. Comparison of simulation results of
this study with simulation results of Marin’s
et al. [23] study. Figure 6. CO conversion (XCO) vs. reactor
length (Z(m)).
Bulletin of Chemical Reaction Engineering & Catalysis, 17 (2), 2022, 314
Copyright © 2022, ISSN 1978-2993
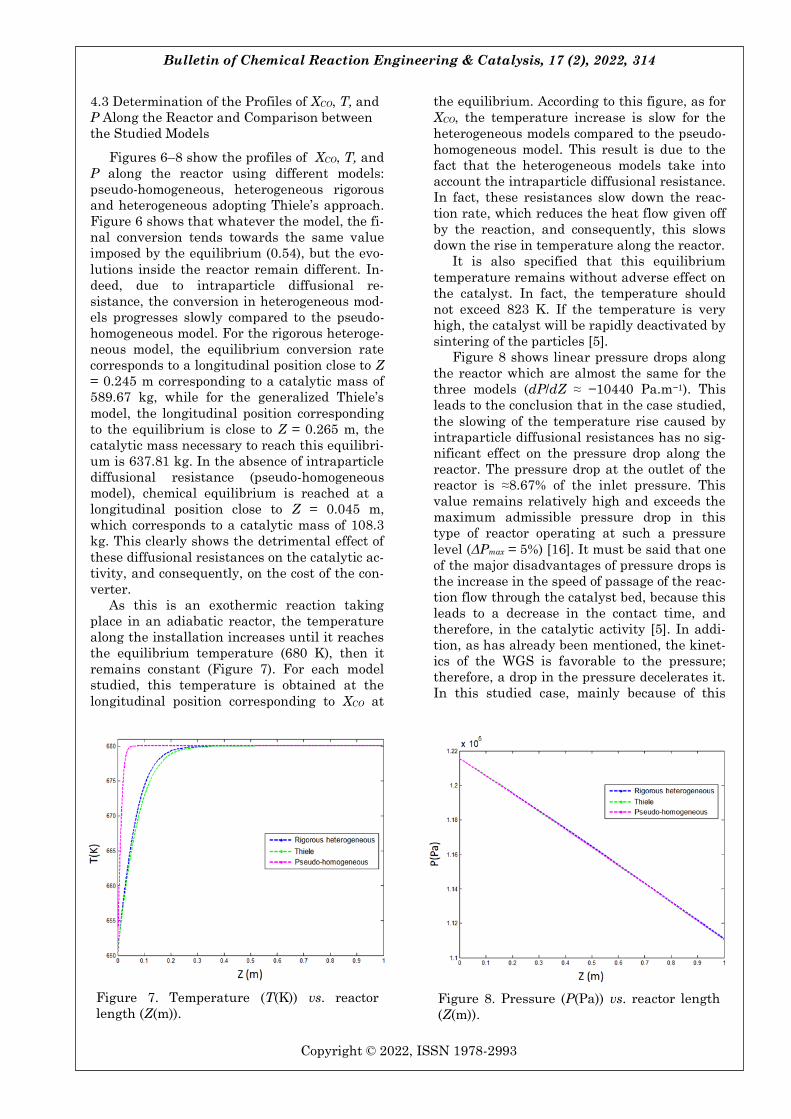
4.3 Determination of the Profiles of XCO, T, and
P Along the Reactor and Comparison between
the Studied Models
Figures 6–8 show the profiles of XCO, T, and
P along the reactor using different models:
pseudo-homogeneous, heterogeneous rigorous
and heterogeneous adopting Thiele’s approach.
Figure 6 shows that whatever the model, the fi-
nal conversion tends towards the same value
imposed by the equilibrium (0.54), but the evo-
lutions inside the reactor remain different. In-
deed, due to intraparticle diffusional re-
sistance, the conversion in heterogeneous mod-
els progresses slowly compared to the pseudo-
homogeneous model. For the rigorous heteroge-
neous model, the equilibrium conversion rate
corresponds to a longitudinal position close to Z
= 0.245 m corresponding to a catalytic mass of
589.67 kg, while for the generalized Thiele’s
model, the longitudinal position corresponding
to the equilibrium is close to Z = 0.265 m, the
catalytic mass necessary to reach this equilibri-
um is 637.81 kg. In the absence of intraparticle
diffusional resistance (pseudo-homogeneous
model), chemical equilibrium is reached at a
longitudinal position close to Z = 0.045 m,
which corresponds to a catalytic mass of 108.3
kg. This clearly shows the detrimental effect of
these diffusional resistances on the catalytic ac-
tivity, and consequently, on the cost of the con-
verter.
As this is an exothermic reaction taking
place in an adiabatic reactor, the temperature
along the installation increases until it reaches
the equilibrium temperature (680 K), then it
remains constant (Figure 7). For each model
studied, this temperature is obtained at the
longitudinal position corresponding to XCO at
the equilibrium. According to this figure, as for
XCO, the temperature increase is slow for the
heterogeneous models compared to the pseudo-
homogeneous model. This result is due to the
fact that the heterogeneous models take into
account the intraparticle diffusional resistance.
In fact, these resistances slow down the reac-
tion rate, which reduces the heat flow given off
by the reaction, and consequently, this slows
down the rise in temperature along the reactor.
It is also specified that this equilibrium
temperature remains without adverse effect on
the catalyst. In fact, the temperature should
not exceed 823 K. If the temperature is very
high, the catalyst will be rapidly deactivated by
sintering of the particles [5].
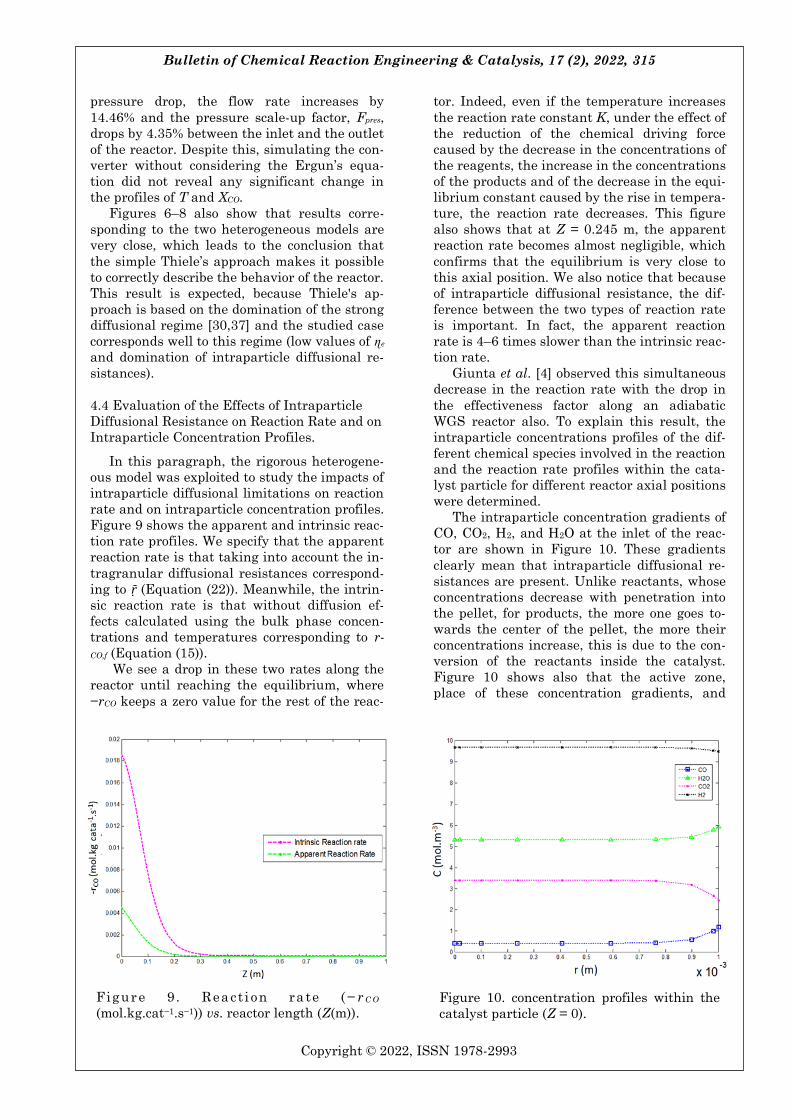
Figure 8 shows linear pressure drops along
the reactor which are almost the same for the
three models (dP/dZ ≈ −10440 Pa.m−1). This
leads to the conclusion that in the case studied,
the slowing of the temperature rise caused by
intraparticle diffusional resistances has no sig-
nificant effect on the pressure drop along the
reactor. The pressure drop at the outlet of the
reactor is ≈8.67% of the inlet pressure. This
value remains relatively high and exceeds the
maximum admissible pressure drop in this
type of reactor operating at such a pressure
level (ΔPmax = 5%) [16]. It must be said that one
of the major disadvantages of pressure drops is
the increase in the speed of passage of the reac-
tion flow through the catalyst bed, because this
leads to a decrease in the contact time, and
therefore, in the catalytic activity [5]. In addi-
tion, as has already been mentioned, the kinet-
ics of the WGS is favorable to the pressure;
therefore, a drop in the pressure decelerates it.
In this studied case, mainly because of this
Figure 7. Temperature (T(K)) vs. reactor
length (Z(m)). Figure 8. Pressure (P(Pa)) vs. reactor length
(Z(m)).
Bulletin of Chemical Reaction Engineering & Catalysis, 17 (2), 2022, 315
Copyright © 2022, ISSN 1978-2993
pressure drop, the flow rate increases by
14.46% and the pressure scale-up factor, Fpres, drops by 4.35% between the inlet and the outlet
of the reactor. Despite this, simulating the con-
verter without considering the Ergun’s equa-
tion did not reveal any significant change in
the profiles of T and XCO.
Figures 6–8 also show that results corre-
sponding to the two heterogeneous models are
very close, which leads to the conclusion that
the simple Thiele’s approach makes it possible
to correctly describe the behavior of the reactor.
This result is expected, because Thiele's ap-
proach is based on the domination of the strong
diffusional regime [30,37] and the studied case
corresponds well to this regime (low values of ɳe
and domination of intraparticle diffusional re-
sistances).
4.4 Evaluation of the Effects of Intraparticle
Diffusional Resistance on Reaction Rate and on
Intraparticle Concentration Profiles.
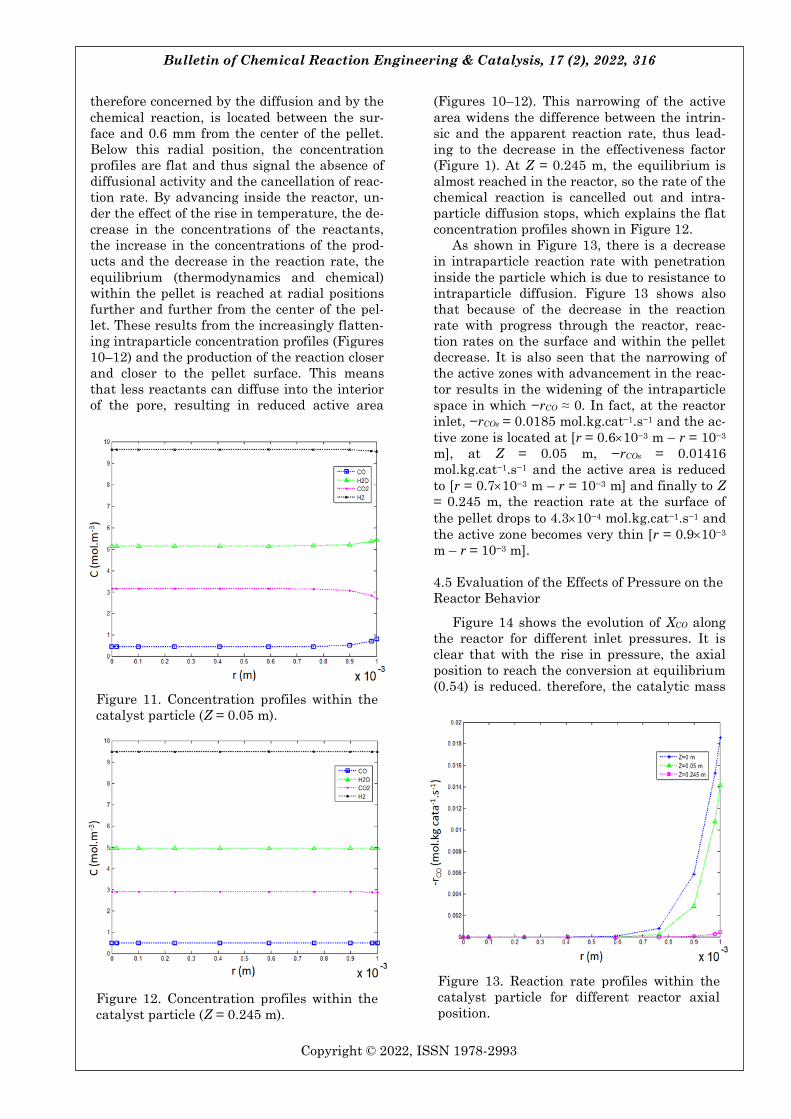
In this paragraph, the rigorous heterogene-
ous model was exploited to study the impacts of
intraparticle diffusional limitations on reaction
rate and on intraparticle concentration profiles.
Figure 9 shows the apparent and intrinsic reac-
tion rate profiles. We specify that the apparent
reaction rate is that taking into account the in-
tragranular diffusional resistances correspond-
ing to ṝ (Equation (22)). Meanwhile, the intrin-
sic reaction rate is that without diffusion ef-
fects calculated using the bulk phase concen-
trations and temperatures corresponding to r-
CO,f (Equation (15)).
We see a drop in these two rates along the
reactor until reaching the equilibrium, where
−rCO keeps a zero value for the rest of the reac-
tor. Indeed, even if the temperature increases
the reaction rate constant K, under the effect of
the reduction of the chemical driving force
caused by the decrease in the concentrations of
the reagents, the increase in the concentrations
of the products and of the decrease in the equi-
librium constant caused by the rise in tempera-
ture, the reaction rate decreases. This figure
also shows that at Z = 0.245 m, the apparent
reaction rate becomes almost negligible, which
confirms that the equilibrium is very close to
this axial position. We also notice that because
of intraparticle diffusional resistance, the dif-
ference between the two types of reaction rate
is important. In fact, the apparent reaction
rate is 4–6 times slower than the intrinsic reac-
tion rate.
Giunta et al. [4] observed this simultaneous
decrease in the reaction rate with the drop in
the effectiveness factor along an adiabatic
WGS reactor also. To explain this result, the
intraparticle concentrations profiles of the dif-
ferent chemical species involved in the reaction
and the reaction rate profiles within the cata-
lyst particle for different reactor axial positions
were determined.
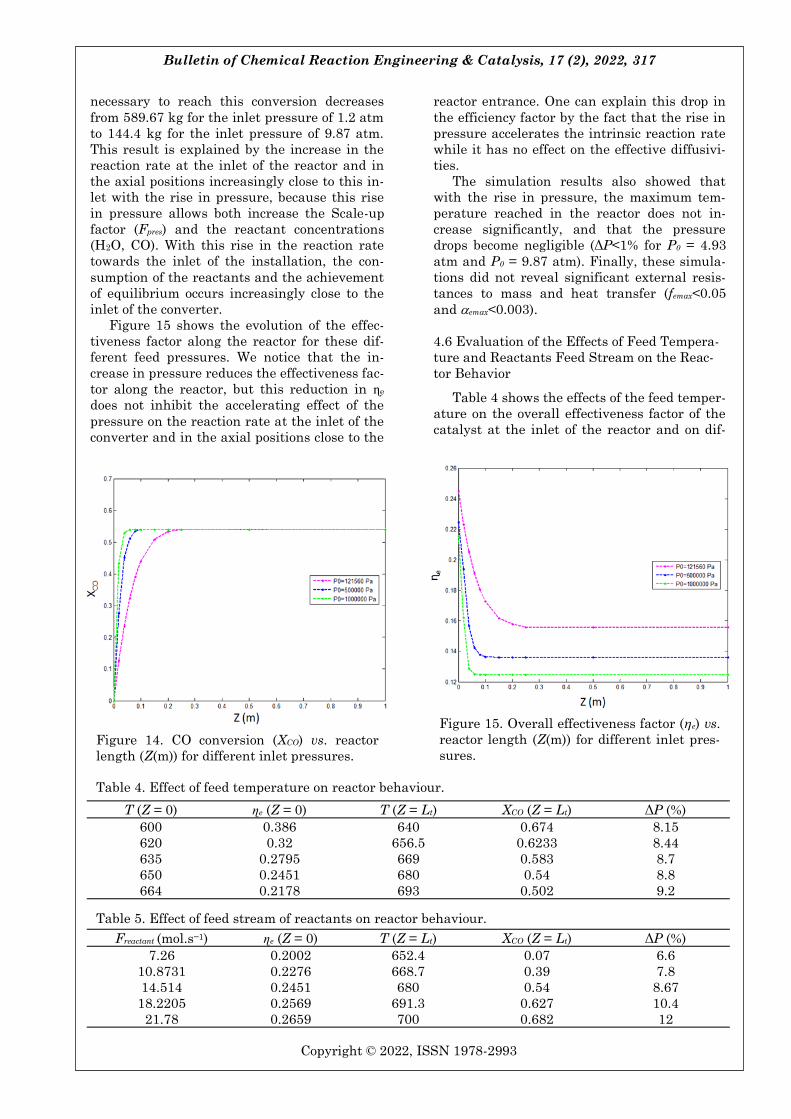
The intraparticle concentration gradients of
CO, CO2, H2, and H2O at the inlet of the reac-
tor are shown in Figure 10. These gradients
clearly mean that intraparticle diffusional re-
sistances are present. Unlike reactants, whose
concentrations decrease with penetration into
the pellet, for products, the more one goes to-
wards the center of the pellet, the more their
concentrations increase, this is due to the con-
version of the reactants inside the catalyst.
Figure 10 shows also that the active zone,
place of these concentration gradients, and
Figure 9 . Rea cti on ra te ( − r C O
(mol.kg.cat−1.s−1)) vs. reactor length (Z(m)). Figure 10. concentration profiles within the
catalyst particle (Z = 0).
Bulletin of Chemical Reaction Engineering & Catalysis, 17 (2), 2022, 316
Copyright © 2022, ISSN 1978-2993
therefore concerned by the diffusion and by the
chemical reaction, is located between the sur-
face and 0.6 mm from the center of the pellet.
Below this radial position, the concentration
profiles are flat and thus signal the absence of
diffusional activity and the cancellation of reac-
tion rate. By advancing inside the reactor, un-
der the effect of the rise in temperature, the de-
crease in the concentrations of the reactants,
the increase in the concentrations of the prod-
ucts and the decrease in the reaction rate, the
equilibrium (thermodynamics and chemical)
within the pellet is reached at radial positions
further and further from the center of the pel-
let. These results from the increasingly flatten-
ing intraparticle concentration profiles (Figures
10–12) and the production of the reaction closer
and closer to the pellet surface. This means
that less reactants can diffuse into the interior
of the pore, resulting in reduced active area
(Figures 10–12). This narrowing of the active
area widens the difference between the intrin-
sic and the apparent reaction rate, thus lead-
ing to the decrease in the effectiveness factor
(Figure 1). At Z = 0.245 m, the equilibrium is
almost reached in the reactor, so the rate of the
chemical reaction is cancelled out and intra-
particle diffusion stops, which explains the flat
concentration profiles shown in Figure 12.
As shown in Figure 13, there is a decrease
in intraparticle reaction rate with penetration
inside the particle which is due to resistance to
intraparticle diffusion. Figure 13 shows also
that because of the decrease in the reaction
rate with progress through the reactor, reac-
tion rates on the surface and within the pellet
decrease. It is also seen that the narrowing of
the active zones with advancement in the reac-
tor results in the widening of the intraparticle
space in which −rCO ≈ 0. In fact, at the reactor
inlet, −rCOs = 0.0185 mol.kg.cat−1.s−1 and the ac-
tive zone is located at [r = 0.610−3 m – r = 10−3
m], at Z = 0.05 m, −rCOs = 0.01416
mol.kg.cat−1.s−1 and the active area is reduced
to [r = 0.710−3 m – r = 10−3 m] and finally to Z
= 0.245 m, the reaction rate at the surface of
the pellet drops to 4.310−4 mol.kg.cat−1.s−1 and
the active zone becomes very thin [r = 0.910−3
m – r = 10−3 m].
4.5 Evaluation of the Effects of Pressure on the
Reactor Behavior
Figure 14 shows the evolution of XCO along
the reactor for different inlet pressures. It is
clear that with the rise in pressure, the axial
position to reach the conversion at equilibrium
(0.54) is reduced. therefore, the catalytic mass Figure 11. Concentration profiles within the
catalyst particle (Z = 0.05 m).
Figure 12. Concentration profiles within the
catalyst particle (Z = 0.245 m).
Figure 13. Reaction rate profiles within the
catalyst particle for different reactor axial
position.
Bulletin of Chemical Reaction Engineering & Catalysis, 17 (2), 2022, 317
Copyright © 2022, ISSN 1978-2993
necessary to reach this conversion decreases
from 589.67 kg for the inlet pressure of 1.2 atm
to 144.4 kg for the inlet pressure of 9.87 atm.
This result is explained by the increase in the
reaction rate at the inlet of the reactor and in
the axial positions increasingly close to this in-
let with the rise in pressure, because this rise
in pressure allows both increase the Scale-up
factor (Fpres) and the reactant concentrations
(H2O, CO). With this rise in the reaction rate
towards the inlet of the installation, the con-
sumption of the reactants and the achievement
of equilibrium occurs increasingly close to the
inlet of the converter.
Figure 15 shows the evolution of the effec-
tiveness factor along the reactor for these dif-
ferent feed pressures. We notice that the in-
crease in pressure reduces the effectiveness fac-
tor along the reactor, but this reduction in ɳe
does not inhibit the accelerating effect of the
pressure on the reaction rate at the inlet of the
converter and in the axial positions close to the
reactor entrance. One can explain this drop in
the efficiency factor by the fact that the rise in
pressure accelerates the intrinsic reaction rate
while it has no effect on the effective diffusivi-
ties.
The simulation results also showed that
with the rise in pressure, the maximum tem-
perature reached in the reactor does not in-
crease significantly, and that the pressure
drops become negligible (ΔP<1% for P0 = 4.93
atm and P0 = 9.87 atm). Finally, these simula-
tions did not reveal significant external resis-
tances to mass and heat transfer (femax<0.05
and emax<0.003).
4.6 Evaluation of the Effects of Feed Tempera-
ture and Reactants Feed Stream on the Reac-
tor Behavior
Table 4 shows the effects of the feed temper-
ature on the overall effectiveness factor of the
catalyst at the inlet of the reactor and on dif-
Figure 14. CO conversion (XCO) vs. reactor
length (Z(m)) for different inlet pressures.
Figure 15. Overall effectiveness factor (ηe) vs.
reactor length (Z(m)) for different inlet pres-
sures.
T (Z = 0) ɳe (Z = 0) T (Z = Lt) XCO (Z = Lt) ΔP (%)
600 0.386 640 0.674 8.15
620 0.32 656.5 0.6233 8.44
635 0.2795 669 0.583 8.7
650 0.2451 680 0.54 8.8
664 0.2178 693 0.502 9.2
Table 4. Effect of feed temperature on reactor behaviour.
Freactant (mol.s−1) ɳe (Z = 0) T (Z = Lt) XCO (Z = Lt) ΔP (%)
7.26 0.2002 652.4 0.07 6.6
10.8731 0.2276 668.7 0.39 7.8
14.514 0.2451 680 0.54 8.67
18.2205 0.2569 691.3 0.627 10.4
21.78 0.2659 700 0.682 12
Table 5. Effect of feed stream of reactants on reactor behaviour.
Bulletin of Chemical Reaction Engineering & Catalysis, 17 (2), 2022, 318
Copyright © 2022, ISSN 1978-2993
ferent parameters at outlet (conversion of CO,
temperature, percentage of pressure drop re-
ported to the inlet pressure. Table 5 shows the
effect of the reactants feed stream on the same
parameters. It should be noticed that in all the
simulations presented in this section, equilibri-
um is reached before reaching the outlet of the
rector, i.e. the XCO (Z = Lt) and T (Z = Lt) pre-
sented in these two tables correspond to XCO
and T in the equilibrium.
According to Table 4, the higher the feed
temperature is, the lower the effectiveness fac-
tor at the inlet of the reactor is. This result is
due to the fact that the rise in temperature
causes an increase in the reaction rate constant
K, while the effect of temperature on the effec-
tive diffusivities is not significant. This result
is consistent with the results of several studies
found in the literature on the effect of tempera-
ture on effectiveness factor [40,41]. According
to Table 4, the rise in temperature causes a de-
crease in the conversion at the outlet of the re-
actor, because, according to Le Chatelier's prin-
ciple [30], to oppose the increase in tempera-
ture, the equilibrium is shifted in the direction
of the reverse reaction, which leads to the con-
version drop. It is also noticed that the temper-
atures at the outlet of the reactor, mentioned in
the table, remain bearable by the catalyst and
that the rise in temperature does not have a
great influence on the pressure drop in the re-
actor.
According to Table 5, it can be observed that
the effectiveness factor increases with the in-
crease of the reactants feed streams. In fact,
this rise in reactants flow rates is accompanied
by a rise of the reactants concentration. Under
these conditions, the consumption of the reac-
tants requires larger active zones to reach equi-
librium within the pellet, which leads to the in-
crease in ɳe. The rise in reactants concentra-
tions increases the reaction rate at the inlet of
the reactor. Because of this increase, the con-
version and the temperature required for the
cancellation out of the reaction rate, and there-
fore, for the achievement of the equilibrium,
rise as shown in Table 5. It can also be seen
that these temperatures remain bearable by
the catalyst. Finally, as in agreement with
Ergun’s equation, the increase in the feed vol-
ume flow rate, and hence the increase in the
superficial velocity, leads to an increase in the
pressure drop in the reactor.
The simulation results presented in this
paragraph did not reveal significant interfacial
resistances to mass and heat transfer, as fe does
not exceed 6.610−3 and e does not exceed
510−4. Other parameters can also affect the
process performance such as the thermal re-
gime in the reactor, the size and shape of the
catalytic particle and the composition of the
catalyst.
5. Conclusion
This work constitutes a numerical study fo-
cusing on the modelling and simulation of a
WGS adiabatic catalytic reactor operating at
low pressures (1.2–1.097 atm). Through this
study, we were able to evaluate the behaviour
of this converter when the pressure level is
close to atmospheric pressure. The rigorous
model developed for this study has been vali-
dated with experimental and simulation re-
sults published in the literature. Under the
conditions of low pressures studied, the re-
sistances to interfacial mass and heat transfer
are very low and the rise in temperature in the
reactor is bearable by the catalyst. On the oth-
er hand, the pressure losses exceed the tolera-
ble limit and the intraparticle diffusion re-
sistances are important. In this case of strong
diffusional regime domination, the effective-
ness factor of the catalyst is low, and therefore,
the catalytic mass necessary to achieve the de-
sired carbon monoxide conversion is high. This
study showed that even if the increase in pres-
sure causes a decrease in the effectiveness fac-
tor, the higher the pressure, the more the cata-
lytic mass necessary to achieve the conversion
at equilibrium is reduced. This study also re-
vealed that it is possible to reduce the intra-
particle diffusional limitations and to improve
the process yield by acting on the feed temper-
ature and on the reactants feed stream. For a
good improvement of reactors operating at low
pressures, the egg-shell catalyst can be ex-
plored. In fact, thanks to this catalyst, it is pos-
sible to have a large particle size which reduce
the pressure drops. At the same time, given
that it has been shown that the diffusional re-
sistances are strong, that a large part of the
volume of the catalytic particle is inactive and
that the active intraparticle zone concerned by
the diffusion and by the chemical reaction is lo-
cated close to the surface, the use of the egg-
shell technique, allows to reduce catalyst us-
age, and the intraparticle diffusional resistanc-
es thanks to the thin active catalytic layer coat-
ing the inert spherical support characterising
this type of catalyst. As a perspective for this
study, it seems very useful to model and simu-
late a WGS converter operating at low pres-
sures in the presence of this type of catalyst.
Bulletin of Chemical Reaction Engineering & Catalysis, 17 (2), 2022, 319
Copyright © 2022, ISSN 1978-2993
Acknowledgement
The authors would like to acknowledge the
Moroccan Ministry of Higher Education, Scien-
tific Research and Innovation.
References
[1] Chen, W.H., Lin, M.R., Jiang, T.L., Chen,
M.H. (2008). Modeling and simulation of hy-
drogen generation from high temperature and
low-temperature water gas shift reactions. In-
ternational Journal of Hydrogen Energy, 33,
6 6 4 4 – 6 6 5 6 . D O I :
10.1016/j.ijhydene.2008.08.039.
[2] Callaghan, C.A. (2006). Kinetics and Cataly-
sis of the Water-Gas-Shift Reaction: A Micro-
kinetic and Graph Theoretic Approach. Ph.D.
Dissertation, Department of Chemical Engi-
neering, Worcester Polytechnic Institute.
[3] Smith, R.J., Loganathan, M., Shantha,M.
S.(2010). A Review of the Water Gas Shift
Reaction Kinetics. International Journal of
Chemical Reactor Engineering, 8, 1–32. DOI:
10.2202/1542-6580.2238.
[4] Giunta, P., Amadeo, N., Laborde, M. (2006).
Simulation of a low temperature water gas
shift reactor using the heterogeneous mod-
el/application to a pem fuel cell. Journal of
Power Sources, 156, 489–496. DOI:
10.1016/j.jpowsour.2005.04.036.
[5] Lang, C. (2016). Développement de cataly-
seurs pour la réaction de conversion du gaz à
l’eau dans le cadre de la production d’hydro-
gène par vapogazéification de la biomasse.
Ph.D. Dissertation, Institut de Chimie et Pro-
cédés pour l'énergie, l'environnement et la
santé, Strasbourg University.
[6] Lee, S.B., Cho, W., Park, D.K., Yoon, E.S.
(2006). Simulation of fixed bed reactor for di-
methyl ether synthesis. Korean Journal of
Chemical Engineering, 23, 522–530. DOI:
10.1007/BF02706789.
[7] Raje ,A., Inga, J. R., Davis, B.H. (1997). Fisch-
er-Tropsch synthesis: process considerations
based on performance of iron-based catalysts.
Fuel, 76, 273–280. DOI: 10.1016/S0016-
2361(96)00185-8.
[8] Skrzypek, J., Lachowska, M., Grzesik, M.,
Słoczyński, J., Novak, P. (1995). Thermody-
namics and kinetics of low-pressure methanol
synthesis. The Chemical Engineering Jour-
nal, 58, 101–108. DOI: 10.1016/0923-
0467(94)02955-5.
[9] Schumacher, N., Boisen, A., Dahl,S., Go-
khale,A., Kandoi,S., Grabow, L., Dumesic, J.,
Mavrikakis, M., Chorkendorff, I. (2005).
Trends in Low-Temperature Water-Gas Shift
Reactivity on Transition Metals. Journal of
C a t a ly s i s , 2 2 9 , 2 6 5 –2 7 5 . D O I :
10.1016/j.jcat.2004.10.025.
[10] Bohlbro, H. (1964). The kinetics of the Water-
Gas Conversion IV. Influence of Alkali on the
Rate Equation. Journal of Catalysis, 3, 207–
215. DOI : 10.1016/0021-9517(64)90168-X.
[11] Keiski, R.L., Salmi, T., Pohjola, V.J. (1992).
Development and verification of a simulation
model for a non-isothermal water gas-shift re-
actor. The Chemical Engineering Journal, 48,
17–29. DOI: 10.1016/0300-9467(92)85003-R.
[12] Keiski, R.L., Desponds, O., Chang, Y.F., So-
morjai, G.A. (1993). Kinetics of the water-gas
shift reaction over sevral alkane activation
and water-gas shift catalyst. Applied Cataly-
sis A: General, 101, 317–338. DOI:
10.1016/0926-860X(93)80277-W.
[13] Koryabkina, N.A., Phatak, A.A., Ruettinger,
W.F., Farrauto, R.J., Ribeiro, F.H. (2003).
Determination of kinetic parameters for the
water-gas-shift reaction on copper catalysts
under realistic conditions for fuel cell applica-
tions. Journal of Catalysis, 217, 233–239.
DOI: 10.1016/S0021-9517(03)00050-2.
[14] Hla, S.S., Park, D., Duffy, G.J., Edwards,
J.H., Roberts, D.G. (2009). Kinetics of high-
temperature water-gas shift reaction over two
iron-based commercial catalysts using simu-
lated coal-derived syngases. Chemical Engi-
neering Journal, 146, 148–154. DOI
:10.1016/j.cej.2008.09.023.
[15] Adams, T.A., Barton, P.I. (2009). A dynamic
two-dimensional heterogeneous model for
water gas shift reactors. International Jour-
nal of Hydrogen Energy, 34, 8877–8891. DOI:
10.1016/j.ijhydene.2009.08.045.
[16] Maklavany, D.M., Shariati, A., Nikou,
M.R.K., Roozbehani, B. (2017). Hydrogen Pro-
duction via Low Temperature Water Gas
Shift Reaction: Kinetic Study, Mathematical
Modeling, Simulation and Optimization of
Catalytic Fixed Bed Reactor using gPROMS.
Chemical Product and Process Modeling. 12,
20160063. DOI: 10.1515/cppm-2016-0063.
[17] Hwang, S., Smith, R. (2004). Heterogeneous
catalytic reactor design with optimum tem-
perature profile I: application of catalyst dilu-
tion and side-stream distribution. Chemical
Engineering Science, 59, 4229–4243. DOI:
10.1016/j.ces.2004.05.037.
Bulletin of Chemical Reaction Engineering & Catalysis, 17 (2), 2022, 320
Copyright © 2022, ISSN 1978-2993
[18] Elnashaie, S.S.E.H., Alhabdan, F.M. (1989).
Mathematical modelling and computer simu-
lation of industrial Water-Gas Shift Convert-
ers. Mathematical and Computer Modelling,
12, 1017–1034. DOI: 10.1016/0895-
7177(89)90208-2.
[19] van Dijk, H.A.J., Cohen, D., Hakeem, A.A.,
Makkee, M., Damen, K. (2014). Validation of
a water–gas shift reactor model based on a
commercial FeCr catalyst for pre-combustion
CO2 capture in an IGCC power plant. Interna-
tional Journal of Greenhouse Gas Control, 29,
82–91. DOI: 10.1016/j.ijggc.2014.07.005.
[20] Rosner, F., Rao, A., Samuelsen, S. (2020). Wa-
ter gas shift reactor modelling and new di-
mensionless number for thermal manage-
ment/design of isothermal reactors. Applied
Thermal Engineering, 173, 1–19. DOI:
10.1016/j.applthermaleng.2020.115033.
[21] Francesconi, J.A., Mussati, M.C., Aguirre,
P.A. (2007). Analysis of design variables for
water-gas-shift reactors by model-based opti-
mization. Journal of Power Sources, 173, 467–
477. DOI: 10.1016/j.jpowsour.2007.04.048.
[22] Davis, M.E., Davis, R.J. (2003). Fundamen-
tals of Chemical Reaction Engineering. Edi-
tion. New York: McGraw-Hill Companies.
[23] Marin, P., Diez, F.V., Ordonez, S. (2012).
Fixed bed membrane reactors for WGSR-
based hydrogen production: Optimisation of
modelling approaches and reactor perfor-
mance. International Journal of Hydrogen
E n e r g y , 3 7 , 4 9 9 7 – 5 0 1 0 . D O I :
10.1016/j.ijhydene.2011.12.027.
[24] Saw, S.Z., Nandong, J. (2016). Simulation and
control of water-gas shift packed bed reactor
with inter-stage cooling. IOP Conf. Series:
Materials science and Engineering, 121, 1–10.
DOI: 10.1088/1757-899X/121/1/012022.
[25] Soit, A.C., Dumbrava, I., Sandu, V.C., Cor-
mos, A.M. (2019). Modelling and Simulation
of Water Gaz Shift Reactor Using Comsol
Multiphysics. Studia UBB Chemia, LXIV, 4,
19–29. DOI: 10.24193/subbchem.2019.4.02.
[26] Levent, M. (2001). Water–gas shift reaction
over porous catalyst: temperature and reac-
tant concentration distribution. International
Journal of Hydrogen Energy, 26, 551–558.
DOI: 10.1016/S0360-3199(00)00116-6.
[27] Hallac, B.B. (2014). Kinetic Experimental and
Modeling Studies on Iron-Based Catalysts
Promoted with Lanthana for the High-
Temperature Water-Gas Shift Reaction Char-
acterized with Operando UV-Visible Spectros-
copy and for the Fischer-Tropsch Synthesis.
Ph.D. Dissertation, Department of Chemical
Engineering, Brigham Young University.
[28] El Bazi, W., El-Abidi, A., Kadiri, M.S., Yadir,
S. (2018). Modeling and Simulation of a Wa-
ter Gas Shift Reactor operating at a low pres-
sure. International Journal of Innovation En-
gineering and Science Research, 2, 47–57.
[29] Atwood, K., Arnold, M.R., Appel, E.G. (1950).
Water-Gas Shift Reaction. Effect of Pressure
on Rate over an Iron- Oxide-Chromium Oxide
Catalyst. Industrial & Engineering Chemis-
t r y , 4 2 , 1 6 0 0 – 1 6 0 2 . D O I :
10.1021/ie50488a038.
[30] Villermaux, J. (1993). Génie de la réaction
chimique. Edition. Paris: Tec & Doc Lavoi-
sier.
[31] Ducamp, J., Bengaouer, A., Baurens, P., Fe-
chete, I., Turek, P.T., Garin, F. (2018). Statu
quo sur la methanation du dioxyde de car-
bone: une revue de la littérature. Comptes
Rendus Chimie, 21(3–4), 427–469. DOI:
10.1016/j.crci.2017.07.005.
[32] Sanz, R., Calles, J.A., Alique, D., Furones, L.,
Ordonez, S., Marin, P. (2015). Hydrogen pro-
duction in a Pore-Plated Pd-membrane reac-
tor: Experimental analysis and model valida-
tion for the Water Gas Shift reaction. Inter-
national Journal of Hydrogen Energy, 40,
3 4 7 2 – 3 4 8 4 . D O I :
10.1016/j.ijhydene.2014.11.120.
[33] Santacesaria, E., Tesser, R. (2018). The
Chemical Reactor from Laboratory to Indus-
trial Plant : A Modern Approach to Chemical
Reaction Engineering with Different Case
Histories and Exercises. Edition. Cham:
Springer.
[34] Wakao, N., Kaguei. S., Funazkri, T. (1979).
Effect of fluid dispersion coefficients on parti-
cle-to-fluid heat transfer coefficients in
packed-beds – Correlation of Nusselt num-
bers. Chemical Engineering Science, 34, 325–
336. DOI: 10.1016/0009-2509(79)85064-2.
[35] Villadsen, J.V., Stewart, W.E. (1967). Solu-
tion of boundary-value problems by orthogo-
nal collocation. Chemical Engineering Sci-
ence, 22, 1483–1501. DOI: 10.1016/0009-
2509(67)80074-5.
[36] Dumez, F.J., Forment, G.F. (1976). Dehydro-
genation of 1-Butene into Butadiene. Kinet-
ics, Catalyst Coking, and Reactor Design. In-
dustrial & Engineering Chemistry Process De-
sign and Development, 15, 291–301. DOI:
10.1021/i260058a014.
[37] Forment, G.F., Bischoff, K.B., Wilde, J.D.
(2010). Chemical Reactor Analysis and De-
sign. Edition. Hoboken: John Wiley & Sons,
Inc.
Bulletin of Chemical Reaction Engineering & Catalysis, 17 (2), 2022, 321
Copyright © 2022, ISSN 1978-2993
[38] Missen, R.W., Mims, C.A., Saville, B.A.
(1999). Introduction to Chemical Reaction En-
gineering And Kinetics. Edition. Danvers:
John Wiley & Sons.
[39] Mendes, D., Chibante, V., Mendes, A. Madei-
ra, L.M. (2010). Determination of the Low-
Temperature Water-Gas Shift Reaction Ki-
netics Using a Cu-Based Catalyst. Industrial
& Engineering Chemistry Research, 49,
11269–11279. DOI: 10.1021/ie101137b.
[40] Zhang, L., Zhang, H.T., Ying, W.Y., Fang,
D.Y. (2014). The Simulation of an Industrial
Fixed Bed Reactor for Methanol Dehydration
to Dimethyl Ether. Energy Sources, Part A:
Recovery, Utilization, and Environmental Ef-
f e c t s , 3 6 , 2 1 6 6 – 2 1 7 4 . D O I :
10.1080/15567036.2012.750404.
[41] Chabot, G., Guilet, R., Cognet, P., Gourdon,
P. (2015). A mathematical modeling of cata-
lytic milli-fixed bed reactor for Fischer–
Tropsch synthesis: Influence of tube diameter
on Fischer-Tropsch selectivity and thermal
behavior. Chemical Engineering Science, 127,
72–83. DOI: 10.1016/j.ces.2015.01.015.
Copyright © 2022 FDOKUMEN