Catalytic Wet Air Oxidation of Phenol in a Trickle Bed Reactor
196
Catalytic Wet Air Oxidation of Phenol in a Trickle Bed Reactor: Kinetics and Reactor Modelling Dissertation presented by Athanasios Eftaxias To obtain the degree: Doctor in Chemical Engineering of the Rovira i Virgili University Escola T` ecnica Superior de Enginyeria Qu´ ımica Departament d’Enginyeria Qu´ ımica Universitat Rovira i Virgili Tarragona December 2002
-
Upload
khangminh22 -
Category
Documents
-
view
0 -
download
0
Transcript of Catalytic Wet Air Oxidation of Phenol in a Trickle Bed Reactor

Catalytic Wet Air Oxidation of Phenol ina Trickle Bed Reactor:
Kinetics and Reactor Modelling
Dissertation presented by
Athanasios Eftaxias
To obtain the degree:Doctor in Chemical Engineeringof the Rovira i Virgili University
Escola Tecnica Superior de Enginyeria QuımicaDepartament d’Enginyeria Quımica
Universitat Rovira i VirgiliTarragona
December 2002


Universitat Rovira i VirgiliEscola Tecnica Superior d’Enginyeria Quımica
Catalytic Wet Air Oxidation of Phenol
in a Trickle Bed Reactor:Kinetics and Reactor Modelling
Memoria presentada por
Athanasios Eftaxias
para optar al Grado deDoctor en Ingenierıa Quımica
Tesis dirigida por el Dr. Frank Stuber
Miembros tribunal de tesis
Presidente Dr. Manel PochSecretario Dr. Jaume JiraltVocalesDr. Fernando BeltranDr. Henri DelmasDr. Faical LarachiSuplentesDr. Josep FontDr. Agusti Fortuny
Evaluadores externos (Doctorado Europeo)Dra. Isabelle PolaertDra. Styliani Agatzini-Leonardou
Diciembre 2002

iv

El Dr. Frank Stuber, Professor Titular del Departament d’Enginyeria Quımica de l’EscolaTecnica Superior d’Enginyeria Quımica, de la Universitat Rovira i Virgili de Tarragona,
Faig constar que el present treball, amb el tıtol
CATALYTIC WET AIR OXIDATION OF PHENOL IN A TRICKLE BEDREACTOR: KINETICS AND REACTOR MODELLING,
que presenta el doctorand n’ ATHANASIOS EFTAXIAS per optar al grau de Doctor enEnginyeria Quımica, ha estat dut a terme sota la meva immediata direccio, i que tots elsresultats obtinguts son fruit del treball i l’analisi realitzat per l’esmentat doctorand.
I per a que es faci saber i tingui els efectes que correspongui, signo aquesta certificacio.
Tarragona, 2 decembre de 2002
Dr. Frank StuberProfessor Titular d’Enginyeria Quımica

vi

Acknowledgements
This work owes a lot to the ideas, suggestions, help and encouragement of many people, to whom I wouldlike to express my sincere gratitude.
In the first place, to my supervisor Dr. F. Stuber for his patience, guidance and critical spirit throughout this time. Definitely, I will miss his questions and observations from now on.
Within the Chemical Reaction Engineering & Process Intensification Group, to Dr. J. Font who,through numerous discussions, clarified many of my doubts. Furthermore, to Dr. A. Fortuny, who helpedme to overcome many laboratory obstacles and to Dr. A. Fabregat who has been attendant to providethe material support necessary for the realisation of this work.
I am also indebted to Dr. F. Larachi for his attention and hospitality during and beyond my visitat his research group. His advice has been highly appreciated.
I would also like to acknowledge the kindness of Dr. M. Poch, Dr. J. Giralt, Dr. F. Beltran, Dr. H.Delmas and Dr. F. Larachi, for accepting to participate in the examining committee of this PhD. thesis,as well as Dr. J. Font and Dr. A. Fortuny who are the substitute members of the committee. Also I amthankful to Dr. I. Polaert and Dr. S. Agatzini for accepting to elaborate the reports that enabled thiswork to opt for European PhD. award, and for their comments regarding the manuscript.
Of course I cannot forget of my classmates. In the first place those with whom I shared laboratory,G. Sahin, M. Paradowska (and her nordic spirit), and M.E. Suarez, or office Dr. A. Morato, A. Manyesand X. Rodrıguez. Although we have often discussed about pumps during the coffee break, not alwayswe were drinking coffee and not always we were talking about pumps.
Also I would like to mention those people that still ask me “when are you going to be around?” :Bassilis, Stelios, Xristos, Giorgos, Argiris and also Demitris and Giannis.
Evidently, my brothers and my parents are also asking the same question. Their encouragement hasbeen very important for me.
Last, but not least, Silvia, Tarragona would not have been so pleasant without her.
vii

viii

ResumenEl tratamiento y el reciclaje de efluentes acuosos es de maximo interes para conseguir un desarrollosostenible de las actividades humanas. La necesidad de aprovechar en un futuro cercano las aguasresiduales de procesos industriales de un modo eficaz ha reforzado la investigacion sobre metodos debajo coste para su recuperacion, dado que las tecnologıas existentes ya no son universalmente aplicables.La oxidacion catalıtica por vıa humeda (CWAO) es uno de los procesos emergentes mas prometedoresparticularmente para el tratamiento de aguas contaminadas con materia organica, en concentracionesmedio altas, y/o biotoxica. Sin embargo, la implementacion del metodo es adecuada siempre que se use uncatalizador activo y estable. Con este proposito, la actividad catalıtica y la estabilidad del carbon activose ha comprobado en la CWAO usando como compuesto modelo el fenol. En condiciones de temperaturay presion moderadas el carbon activo ha demostrado ser un material catalıtico barato, que a la vez, esestable, mas activo en la conversion de fenol, ademas produciendo menor cantidad de productos deoxidacion parcial toxicos que los catalizadores soportados convencionales. Durante la CWAO del fenol,numerosos productos intermedios se forman, por lo que el conocimiento de la cinetica de su oxidaciones fundamental para el diseno, modelizacion y escalado fiable del proceso a escala de planta piloto oincluso industrial. Debido a la insuficiencia de los clasicos metodos de optimizacion para llevar acabo laestimacion de parametros en modelos de alta complejidad, el uso de algoritmos estocasticos se ha probadocon exito, permitiendo el desarrollo de modelos cineticos mas avanzados que los que se implementanactualmente en el campo de la CWAO. El desarrollo de modelos cineticos complejos es escaso en laliteratura actual, ası como los estudios que tratan los aspectos quımicos y de ingenierıa del proceso de laCWAO. Sin embargo, hay una necesidad clara para el desarrollo simultaneo de los aspectos quımicos yde ingenierıa de la tecnologıa. Consequentemente, en paralelo se ha enfocado en la modelizacion de unreactor de goteo (TBR), segun el estado de arte actual en el campo de estos reactores. Es demostradoque estos reactores son mas adecuados que los reactores agitados con catalizador en suspencion para laCWAO de compuestos organicos que tienden a reacciones de polimerisacion en fase liquida. Ademasse han probado dos distintos modos de operacion, con flujo de gas y liquido cocorriente descendiente oascendiente, y se ha demostrado que la primera forma de operacion es la mas adecuada para este sistema.A continuacion un modelo fenomenologico para el TBR ha sido desarrollado y programado. El modeloimplementa la cinetica previamente obtenida, y ademas se ha puesto enfasis en la incorporacion de losefectos de mojado, y de transferencia de materia. La operacion no isotermica se ha estudiado tambienpara investigar la posibilidad de operar de modo autotermico, disminuyendo asi los costes de operaciondel proceso. La validacion del modelo fenomenologico con los datos experimentales obtenidos en el TBRdel laboratorio ha sido favorable. Posteriormente, este modelo ha sido utilizado como una herramientafiable para el escalado del proceso. Los resultados obtenidos de la modelizacion del escalado permitenla extraccion de recomendaciones sobre el diseno y la operacion de unidades industriales, haciendo masfiable la aplicacion del metodo a escala industrial.
ix

x

AbstractWastewater treatment and re-use of industrial process water is a critical issue for the suitable developmentof human activities. The need for effective water recycling has reinforced the research on tailoredlow cost pollution abatement since the existing solutions are not longer universal. In particular, theemerging Catalytic Wet Air Oxidation (CWAO) process is one of the most promising technologies forthe remediation of moderately concentrated and/or biotoxic water pollutants, when a stable and activecatalyst can be provided. To this purpose, the catalytic activity and stability of active carbon was testedin the CWAO of the target compound, phenol, at mild conditions of temperature and pressure. Theactive carbon, which is a relatively inexpensive catalytic material is shown to be stable and to yield higherphenol destruction and less toxic partial mineralisation products, compared to a widely used copper oxidecatalyst. During the CWAO of phenol, numerous partial oxidation products appeared and the knowledgeof the kinetics that control their oxidation process is fundamental for the design, modelling and scale up ofCWAO pilot plant or industrial units. Complex kinetic modelling was undertaken using both the classicalgradient based method and a stochastic algorithm termed Simulated Annealing (SA). SA was shown toperform better in the identification of multiparameter kinetic reaction schemes, allowing to improve thekinetic modelling of CWAO beyond the actual state of art in this field. Detailed kinetic analysis of CWAOis scarce in the literature and the same situation holds for engineering studies. There is a clear need forthe simultaneous development of process chemistry and engineering aspects. Consequently, we parallelyfocused on the state of art modelling of a Trickle Bed Reactor (TBR), being the priority candidateof best performing CWAO reactor. First, the ability of TBR in CWAO was affirmed by appropriateexperimental comparison of batch slurry reactor and continuous fixed bed reactors operating either in thecocurrent downflow mode (TBR), or upflow mode (FBR) of the gas and liquid flow. A phenomenologicaltransport-reaction model of the TBR was then developed and programmed. The TBR model implementsthe previously obtained oxidation kinetics and emphasis on important aspects of TBR, namely catalystwetting, and mass transfer between the phases. Non-isothermal operation is also accounted for to facethe need for autothermal operation, lowering the global process costs. The validation of the model wassuccessfully done with the available experimental data from the laboratory TBR and thus provided areliable tool for the scale up study of the CWAO process. The outcomings of this model aided scaleup, allow to give recommendation on the design and operation of industrial units, thereby making morereliable the implementation of CWAO units on an industrial level.
xi

xii

Contents
I Introduction & Methodology 1
1 Introduction 31.1 Wastewater Management . . . . . . . . . . . . . . . . . . . . . . . . . . . 31.2 Wet Air Oxidation Fundamentals . . . . . . . . . . . . . . . . . . . . . . 71.3 Catalytic Wet Air Oxidation Catalysts . . . . . . . . . . . . . . . . . . . 10
1.3.1 Active catalysts . . . . . . . . . . . . . . . . . . . . . . . . . . . . 101.3.2 Catalyst stability . . . . . . . . . . . . . . . . . . . . . . . . . . . 151.3.3 Overview . . . . . . . . . . . . . . . . . . . . . . . . . . . . . . . 16
1.4 Reaction Mechanisms & Rate Equations in WAO and CWAO . . . . . . 171.4.1 Reaction Pathways . . . . . . . . . . . . . . . . . . . . . . . . . . 171.4.2 Rate Equations & Rate Constants . . . . . . . . . . . . . . . . . . 211.4.3 Overview . . . . . . . . . . . . . . . . . . . . . . . . . . . . . . . 27
1.5 Kinetic Multiparameter Estimation . . . . . . . . . . . . . . . . . . . . . 291.5.1 Differential Methods . . . . . . . . . . . . . . . . . . . . . . . . . 291.5.2 Integral Methods . . . . . . . . . . . . . . . . . . . . . . . . . . . 301.5.3 Overview . . . . . . . . . . . . . . . . . . . . . . . . . . . . . . . 31
1.6 Multiphase Catalytic Reactors . . . . . . . . . . . . . . . . . . . . . . . . 321.6.1 Reactor Choice for the CWAO . . . . . . . . . . . . . . . . . . . . 331.6.2 Design Parameters of TBRs . . . . . . . . . . . . . . . . . . . . . 331.6.3 Trickle Bed Reactor Modelling . . . . . . . . . . . . . . . . . . . . 431.6.4 Applications of TBRs in CWAO . . . . . . . . . . . . . . . . . . . 441.6.5 Overview . . . . . . . . . . . . . . . . . . . . . . . . . . . . . . . 47
1.7 Conclusions . . . . . . . . . . . . . . . . . . . . . . . . . . . . . . . . . . 481.8 Objectives . . . . . . . . . . . . . . . . . . . . . . . . . . . . . . . . . . . 50
2 Methodology 512.1 Experimental . . . . . . . . . . . . . . . . . . . . . . . . . . . . . . . . . 51
2.1.1 Materials . . . . . . . . . . . . . . . . . . . . . . . . . . . . . . . 512.1.2 Apparatus and procedures . . . . . . . . . . . . . . . . . . . . . . 532.1.3 Analysis . . . . . . . . . . . . . . . . . . . . . . . . . . . . . . . . 55
2.2 Kinetic Multiparameter Estimation . . . . . . . . . . . . . . . . . . . . . 582.2.1 The Levenberg - Marquardt algorithm . . . . . . . . . . . . . . . 582.2.2 The Simulated Annealing Algorithm . . . . . . . . . . . . . . . . 592.2.3 Reactor and kinetic models . . . . . . . . . . . . . . . . . . . . . 60
xiii

xiv CONTENTS
2.3 TBR model . . . . . . . . . . . . . . . . . . . . . . . . . . . . . . . . . . 62
2.3.1 Pellet scale model . . . . . . . . . . . . . . . . . . . . . . . . . . . 63
2.3.2 Reactor scale model . . . . . . . . . . . . . . . . . . . . . . . . . 64
2.3.3 Numerical solution . . . . . . . . . . . . . . . . . . . . . . . . . . 66
2.4 Calculation of thermophysical and reactor properties . . . . . . . . . . . 68
2.4.1 Thermophysical property calculation . . . . . . . . . . . . . . . . 68
2.4.2 Hydrodynamic and mass transfer parameters . . . . . . . . . . . . 68
II Results and Discussion 71
3 Catalytic Performance of TBR using AC 73
3.1 Reactor performance . . . . . . . . . . . . . . . . . . . . . . . . . . . . . 73
3.1.1 Hydrodynamics and Mass Transfer . . . . . . . . . . . . . . . . . 73
3.1.2 Downflow versus Upflow operation . . . . . . . . . . . . . . . . . 77
3.1.3 Conclusions . . . . . . . . . . . . . . . . . . . . . . . . . . . . . . 80
3.2 Active Carbon Performance . . . . . . . . . . . . . . . . . . . . . . . . . 81
3.2.1 Transient Profiles . . . . . . . . . . . . . . . . . . . . . . . . . . . 81
3.2.2 Change in active carbon weight . . . . . . . . . . . . . . . . . . . 81
3.2.3 Steady state profiles of Phenol and COD . . . . . . . . . . . . . . 82
3.2.4 Intermediate compounds . . . . . . . . . . . . . . . . . . . . . . . 84
3.2.5 Conclusions . . . . . . . . . . . . . . . . . . . . . . . . . . . . . . 90
4 Kinetic Modelling of Phenol CWAO 91
4.1 Underlying reaction networks . . . . . . . . . . . . . . . . . . . . . . . . 91
4.1.1 Copper oxide reaction network development . . . . . . . . . . . . 91
4.1.2 AC reaction network development . . . . . . . . . . . . . . . . . . 94
4.2 S-A and L-M Performance . . . . . . . . . . . . . . . . . . . . . . . . . . 95
4.2.1 One-reaction network (Model 1) . . . . . . . . . . . . . . . . . . . 95
4.2.2 Five-reaction network (Model 2) . . . . . . . . . . . . . . . . . . . 98
4.2.3 Eight-reaction network (Model 3) . . . . . . . . . . . . . . . . . . 103
4.2.4 Conclusions . . . . . . . . . . . . . . . . . . . . . . . . . . . . . . 109
4.3 Kinetics over Copper Oxide . . . . . . . . . . . . . . . . . . . . . . . . . 110
4.3.1 Power Law Model . . . . . . . . . . . . . . . . . . . . . . . . . . . 110
4.3.2 Langmuir-Hinshelwood Model . . . . . . . . . . . . . . . . . . . . 112
4.3.3 Model Parameters . . . . . . . . . . . . . . . . . . . . . . . . . . 118
4.3.4 Conclusions . . . . . . . . . . . . . . . . . . . . . . . . . . . . . . 125
4.4 Kinetics over Activated Carbon . . . . . . . . . . . . . . . . . . . . . . . 126
4.4.1 Phenol degradation kinetics . . . . . . . . . . . . . . . . . . . . . 126
4.4.2 Ring compound reaction network . . . . . . . . . . . . . . . . . . 128
4.4.3 Overall Reaction Network . . . . . . . . . . . . . . . . . . . . . . 129
4.4.4 Conclusions . . . . . . . . . . . . . . . . . . . . . . . . . . . . . . 139

CONTENTS xv
5 TBR Modelling and Scale up 1415.1 Validation of the complex TBR Model . . . . . . . . . . . . . . . . . . . 141
5.1.1 Sensitivity analysis . . . . . . . . . . . . . . . . . . . . . . . . . . 1425.1.2 TBR Model validation . . . . . . . . . . . . . . . . . . . . . . . . 1445.1.3 Conclusions . . . . . . . . . . . . . . . . . . . . . . . . . . . . . . 145
5.2 Model Aided TBR scale up . . . . . . . . . . . . . . . . . . . . . . . . . 1455.2.1 Isothermal operation . . . . . . . . . . . . . . . . . . . . . . . . . 1455.2.2 Non-isothermal reactor model . . . . . . . . . . . . . . . . . . . . 1525.2.3 Conclusions . . . . . . . . . . . . . . . . . . . . . . . . . . . . . . 155
6 Conclusions and Outlook 157
Bibliografy 161
Biographical Note 171

xvi CONTENTS

List of Figures
1.1 Bifunctional reactor for aqueous phenol adsorption and active carbon regeneration in thesame unit [33]. . . . . . . . . . . . . . . . . . . . . . . . . . . . . . . . . . . . . . . . . . . 6
1.2 Suitability of water technologies according to COD contents [12]. . . . . . . . . . . . . . . 71.3 Simplified Zimpro process flow diagram. . . . . . . . . . . . . . . . . . . . . . . . . . . . . 81.4 Comparison of phenol conversion profiles at 140oC and 4.7 MPa using AC (ME) in
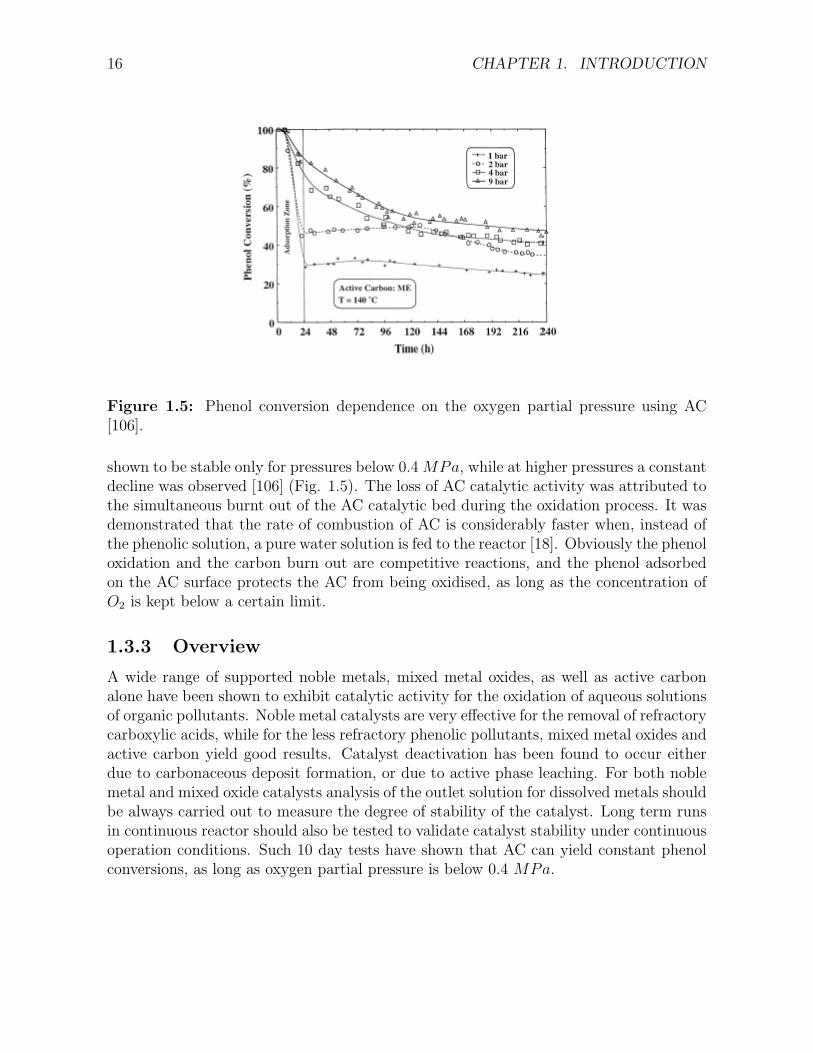
nitrogen, air and Cu0803 in air [18]. . . . . . . . . . . . . . . . . . . . . . . . . . . . . . . 131.5 Phenol conversion dependence on the oxygen partial pressure using AC [106]. . . . . . . . 161.6 Reaction network for phenol CWAO according to Devlin and Harris [119]. . . . . . . . . . 191.7 Reaction scheme for the oxidation of succinic acid. SUC: succinic acid, ACR: acrylic acid,
ACE: acetic acid. [49] . . . . . . . . . . . . . . . . . . . . . . . . . . . . . . . . . . . . . . 231.8 Packed bed reactors for gas-liquid-solid catalysed systems. (a) Trickle Bed Reactor with
cocurrent downflow; (b) trickle bed with counrercurrent flow; (c) Packed bubble-flowreactor with cocurrent upflow. [156]. . . . . . . . . . . . . . . . . . . . . . . . . . . . . . . 34
1.9 Trickle Flow in a catalyst bed [163]. . . . . . . . . . . . . . . . . . . . . . . . . . . . . . . 351.10 Effect of pressure and physical properties on trickle-to-pulse flow regime transition . . . . 361.11 Comparison between trickle bed and upflow performance. . . . . . . . . . . . . . . . . . . 371.12 Spherical catalyst particle shown as divided in three zones [178]. . . . . . . . . . . . . . . 411.13 Error in hydrodynamic parameter estimation with well established correlations [156] . . . 421.14 Phenol conversion and wetting efficiency versus liquid hourly space velocity in a random-
packed bed, or bed diluted with fines [195] . . . . . . . . . . . . . . . . . . . . . . . . . . . 45
2.1 Influence of the AC particle size on the initial rate of phenol removal [107]. . . . . . . . . 522.2 Trickle Bed Reactor and experimental set up for the CWAO of phenol . . . . . . . . . . . 532.3 Example of (a) standard solution, and (b) sample solution chromatograms. . . . . . . . . 562.4 Example of calibration curve for COD determination. . . . . . . . . . . . . . . . . . . . . 57
3.1 Comparison of downflow and upflow phenol and COD concentration profiles . . . . . . . . 783.2 4-HBA and formic acid concentration as a function of phenol conversion with upflow and
downflow operation . . . . . . . . . . . . . . . . . . . . . . . . . . . . . . . . . . . . . . . . 793.3 Transient concentration for phenol, COD and maleic acid, for a change in space time . . . 823.4 Phenol and COD conversions over AC catalyst . . . . . . . . . . . . . . . . . . . . . . . . 833.5 Parity plot among HPLC based and chemically measured COD . . . . . . . . . . . . . . . 853.6 Benzoquinone and 4-HBA concentration profiles over AC catalyst . . . . . . . . . . . . . . 863.7 Maleic, acetic and formic acid profiles over AC catalyst . . . . . . . . . . . . . . . . . . . 873.8 Possible scheme proposed for phenol CWAO over AC based on the experimentally observed
intermediate compound concentration profiles. . . . . . . . . . . . . . . . . . . . . . . . . 883.9 Ring compound and acetic acid concentration as a function of phenol conversion for
Cu0803 and AC . . . . . . . . . . . . . . . . . . . . . . . . . . . . . . . . . . . . . . . . . . 89
4.1 Preliminary reaction network for the CWAO of phenol over Cu0803 catalyst . . . . . . . . 93
xvii

xviii LIST OF FIGURES
4.2 Concentration profiles of phenol oxidation over Cu0803 catalyst for different oxygen partialpressures and temperatures for model 1 with the S-A solution . . . . . . . . . . . . . . . . 97
4.3 Model 2: Five-reaction network proposed for the CWAO of phenol over Cu0803 . . . . . . 984.4 Phenol, acetic and oxalic acid concentration profiles at 0.6 MPa for model 2 . . . . . . . 1024.5 Reaction network proposed for the CWAO of phenol over Cu0803 catalyst . . . . . . . . . 1034.6 Phenol and maleic acid concentration profiles using different objective functions . . . . . . 1074.7 Dihydric phenol, benzoquinone and formic acid concentration profiles using different ob-
jective functions . . . . . . . . . . . . . . . . . . . . . . . . . . . . . . . . . . . . . . . . . 1084.8 Concentration profiles for phenol, formic acid and malonic acid using power law or L-H
expresions . . . . . . . . . . . . . . . . . . . . . . . . . . . . . . . . . . . . . . . . . . . . . 1114.9 Concentration profiles of phenol and COD over the Cu0803 catalyst . . . . . . . . . . . . 1134.10 Concentration profiles of dihydric phenols and benzoquinone over the Cu0803 catalyst . . 1144.11 Concentration profiles of maleic and malonic acid over the Cu0803 catalyst . . . . . . . . 1154.12 Concentration profiles of acetic acid over the Cu0803 catalyst . . . . . . . . . . . . . . . . 1164.13 Concentration profiles of oxalic and formic acid over the Cu0803 catalyst . . . . . . . . . 1174.14 Concentration of dihydric phenols and benzoquinone over the Cu0803 catalyst as a func-
tion of phenol conversion . . . . . . . . . . . . . . . . . . . . . . . . . . . . . . . . . . . . . 1194.15 Concentration of maleic and malonic acid over the Cu0803 catalyst as a function of phenol
conversion . . . . . . . . . . . . . . . . . . . . . . . . . . . . . . . . . . . . . . . . . . . . . 1214.16 Concentration of oxalic and formic acid over the Cu0803 catalyst as a function of phenol
conversion . . . . . . . . . . . . . . . . . . . . . . . . . . . . . . . . . . . . . . . . . . . . . 1234.17 Concentration of COD and acetic acid over the Cu0803 catalyst as a function of phenol
conversion . . . . . . . . . . . . . . . . . . . . . . . . . . . . . . . . . . . . . . . . . . . . . 1244.18 Concentration profiles for phenol oxidation kinetics over the AC catalyst . . . . . . . . . . 1274.19 Proposed ring compound reaction schemes for the CWAO of phenol over AC. . . . . . . . 1284.20 Proposed model for the CWAO of phenol over active carbon (AC-1) . . . . . . . . . . . . 1314.21 Proposed model for the CWAO of phenol over active carbon (AC-2) . . . . . . . . . . . . 1314.22 Phenol, COD, 4-HBA and benzoquinone concentration profiles over the AC catalyst . . . 1334.23 Maleic acid, acetic acid and formic acid concentration profiles over the AC catalyst . . . . 1344.24 4-HBA and Benzoquinone concentration as a function of Phenol conversion over AC . . . 1364.25 Maleic and Acetic Acid concentration as a function of Phenol conversion over AC . . . . . 1374.26 Formic acid concentration as a function of Phenol conversion over AC . . . . . . . . . . . 138
5.1 Comparison of the kinetic and the TBR models for the a) Cu0803 and b) CA catalyst . . 1445.2 γ - ratio variation as a function of phenol concentration for different oxygen partial pres-
sures at 160oC . . . . . . . . . . . . . . . . . . . . . . . . . . . . . . . . . . . . . . . . . . 1465.3 Effect of catalyst wetting on (a) phenol conversion, (b) dissolved oxygen concentration,
along the reactor for different liquid superficial velocities . . . . . . . . . . . . . . . . . . . 1475.4 Variation of γ-ratio along the reactor for incomplete wetting . . . . . . . . . . . . . . . . . 1485.5 Phenol conversion and pressure drop as a function of particle diameter . . . . . . . . . . . 1495.6 (a) Acetic acid concentration and (b) intermediate COD, as a function of phenol conversion
calculated in the absence, or the presence of mass transfer limitations . . . . . . . . . . . 1505.7 Phenol concentration profile along the reactor considering only phenol degradation or the
detailed kinetic model . . . . . . . . . . . . . . . . . . . . . . . . . . . . . . . . . . . . . . 1515.8 Adiabatic temperature rise and phenol conversion as a function of gas superficial velocity 1535.9 Adiabatic temperature rise and phenol conversion as a function of phenol inlet concentration1545.10 Adiabatic temperature rise and phenol conversion as a function of inlet temperature . . . 155
List of Tables
1.1 Annual release of toxic phenol-like pollutants in the United States for the year 2000 [5] . . 41.2 Main industrial processes of Wet Air Oxidation . . . . . . . . . . . . . . . . . . . . . . . . 91.3 Process data of CWAO using noble catalysts . . . . . . . . . . . . . . . . . . . . . . . . . 101.4 Process data of CWAO using metal oxide catalysts . . . . . . . . . . . . . . . . . . . . . . 121.5 Infuence of the oxygen partial pressure on the carbon consumption [106]. . . . . . . . . . 141.6 Reported intermediates during oxidative or thermal decomposition of carboxylic acids . . 201.7 Kinetic parameters for WAO and CWAO of pure organic compounds following Power Law
kinetics of Eq. 1.4. . . . . . . . . . . . . . . . . . . . . . . . . . . . . . . . . . . . . . . . . 251.8 Kinetic parameters obtained in CWAO of pure organic compounds using Langmuir Hin-
shelwood kinetics . . . . . . . . . . . . . . . . . . . . . . . . . . . . . . . . . . . . . . . . . 261.9 Levels of multiphase reactor modelling [156] . . . . . . . . . . . . . . . . . . . . . . . . . . 32
2.1 Laboratory reactor operating conditions . . . . . . . . . . . . . . . . . . . . . . . . . . . . 542.2 Retention time of possible intermediates during the HPLC analysis. . . . . . . . . . . . . 552.3 Physical properties of the air-water-dissolved phenol reacting system at different temper-
atures. . . . . . . . . . . . . . . . . . . . . . . . . . . . . . . . . . . . . . . . . . . . . . . . 68
3.1 Wetting efficiency calculated with different correlations at 160oC and 0.1 MPa (AC) or0.6 MPa (Cu0803), for liquid velocities in the range of 0.04 to 0.5 mm/s. . . . . . . . . . 74
3.2 Initial oxygen reaction rates for Cu0803 and AC at 160oC based on initial phenol conver-sion measurements (C0
phen.=53.1 mmol/L . . . . . . . . . . . . . . . . . . . . . . . . . . . 753.3 Estimation of gas - liquid volumetric oxygen mass transfer coefficients for the Cu0803 and
the AC catalysts at 160oC and criteria for the existence of mass transfer limitations. . . . 763.4 Estimation of gas liquid volumetric oxygen mass transfer coefficients for the Cu0803 and
the AC catalysts at 160oC and criteria for the existence of mass transfer limitations. . . . 763.5 Kinetic Parameters for Phenol and COD degradation kinetics on active carbon . . . . . . 84
4.1 Performance of S-A and L-M for Model 1 . . . . . . . . . . . . . . . . . . . . . . . . . . . 964.2 Performance of S-A, L-M and L-M∗ for Model 2 . . . . . . . . . . . . . . . . . . . . . . . 1004.3 Frequency Factors, activation energies and reaction orders for Model 2 using S-A, L-M
and L-M* . . . . . . . . . . . . . . . . . . . . . . . . . . . . . . . . . . . . . . . . . . . . . 1014.4 Adsorption parameters for each adsorbed compound for Model 2 using S-A, L-M and L-M*1014.5 Frequency factors, activation energies and reaction orders for Model 3 using S-A and L-M*1054.6 Adsorption paramters for each adsorbed compound for Model 3 using S-A and L-M* . . . 1064.7 Average per cent error of the predicted concentrations using power law and L-H expressions1104.8 Frequency factors, activation energies and reaction orders . . . . . . . . . . . . . . . . . . 1184.9 Adsorption parameters for each adsorbed compound . . . . . . . . . . . . . . . . . . . . . 1184.10 Percentage (%) of benzoquinones reacting towards maleic acid . . . . . . . . . . . . . . . 1204.11 Kinetic and adsorption Parameters for Phenol degradation kinetics over active carbon
using L-H kinetics . . . . . . . . . . . . . . . . . . . . . . . . . . . . . . . . . . . . . . . . 1264.12 Average % errors of compounds for the AC catalyst using reaction networks AC-1 and AC-2132
xix

xx LIST OF TABLES
4.13 Frequency Factors, Activation Energies and Heat of adsoption for the CWAO of Phenolover Activated Carbon . . . . . . . . . . . . . . . . . . . . . . . . . . . . . . . . . . . . . . 135
4.14 Adsorption parameters for the CWAO of phenol over Active carbon. . . . . . . . . . . . . 135
5.1 Standard operating conditions, mass transfer and hydrodynamic parameters of the labo-ratory reactor used for the sensitivity analysis of the comprehensive TBR model. . . . . . 142
5.2 Sensitivity analysis of the TBR model, assuming oxygen as limiting reactant, for the ACcatalyst at 160oC and 0.2MPa, at a space time of 0.05 h. . . . . . . . . . . . . . . . . . . 143
5.3 Standard operating conditions for the pilot plant simulations . . . . . . . . . . . . . . . . 145

Nomenclature
Latin Charactersas Specific packing area m2/m3
A reactor section area (m2)AH heat exchange area (m2)Cj concentration of compound j (mmol/L)cp heat capacity (J/KgK)Deff
j effective diffusion coefficient of compound j (m2/s)Dad
j axial dispersion coefficient (m2/s)f external wetting efficiency (f=fd+fs)H Henry constant∆H Heat of adsorption (J/mol)∆Hv Heat of evaporation (J/mol)∆Hf
j Heat of formation of compound j (J/mol)Ea Activation energy (J/mol)f Wetting efficiencyF Vector containing the differences between experiment and modelI Unity MatrixJ jacobiank Boltzman Constantkgs gaseous oxygen-solid mass transfer coefficient (m/s)kjls j-compound liquid solid mass transfer coefficient (m/s)kgla gaseous oxygen-liquid volumetric mass transfer coefficient (s−1)(ka)ll static-dynamic liquid volumetric mass transfer coefficient (s−1)K0 Adsorption preexponential factor (L/mol)k0 Frequency factor (case dependent units)m mass (kg)m mass flow rate (Kg/s)n number of model parametersn molar flow rate (mol/s)Np, Ne, Nc Number of points, experiments, compoundsNo number of total experimental observations = NpNeNc
P total pressure in the reactor (Pa)P probabilityr particle radial dimension (m)rc column radius (m)ri ith reaction rate (mol/kg/s)rp catalyst particle diameter (m)R Universal gas constant (8.314 J/molK)Rj total production or destruction rate for compound j (mol/kg/s)S Objective function
xxi

xxii Nomenclature
Latin Characters (continued)t Time (h)T Temperature (K)Ta ambient temperature (K)T0 Reactor inlet temperature (K)UH heat exchanger overall heat transfer coefficient (W/m2K)Uw reactor to wall overall heat transfer coefficient (W/m2K)ul liquid superficial velocity (m/s)ug gas superficial velocity (m/s)V Variance MatrixV Volumetric flow rate (m3/s)x parameter setx mole fractionX conversionz reactor axial dimension (m)
Greek Charactersα oxygen orderα confidenceβ organic orderγ ratio of liquid reactant flux to gas reactant flux to the catalyst particleε liquid hold upε catalyst particle porosityη effectiveness factorλ Effective axial conductivity (W/mK)µ Levenberg Marquardt parameterρb bed density (kg/m3)ρl liquid density (kg/m3)ρg gas density (kg/m3)ρp particle density (kg/m3)σ2 varianceτ Space time (h)φ evaporation rate pro reactor length (mol/m/s)
Superscriptsd dynamic liquidg gas or dry zones static liquid∗ on catalyst surface
Subscripts0 at the entrance of the reactorb bede equilibriumH2O wateri reaction indexj compound indexO2 oxygenp particlet totalw wall

Nomenclature xxiii
AbreviationsAC Active CarbonAOP Advanced Oxidation ProcessATR Adiabatic Temperature RiseCOD Chemical Oxygen DemandCWAO (Heterogeneous) Catalytic Wet Air OxidationCu0803 Engelhard 10%CuO − γ −Al2O3 catalyst4-HBA 4-Hydroxybenzoic acidHPLC High pressure liquid chromatographyL-H Langmuir HinshelwoodL-M Levenberg MarquardtL-M* Levenberg Marquardt starting from the S-A solutionNN Neural NetworkP-L Power LawS-A Simulated AnnealingTBR Trickle Bed ReactorTPO Temperature Programmed OxidationSAE Sum of Absolute ErrorsSRSE Sum of Relative Squared ErrorsSSE Sum of Squared ErrorsWAO Wet Air Oxidation

xxiv Nomenclature

Part I
Introduction & Methodology
1


Chapter 1
Introduction
1.1 Wastewater Management
The sustainable water management is one of the critical issues to be addressed in thecoming decades. Up to date, more than half of the available freshwater is appropriated forhuman uses [1], indicating a high degree of exploitation of the existing water resources. Inthe close future, the water resources may even suffer drastic variations on a local and/orglobal level, because of the foreseen population growth and climate changes. This fact, incombination with the water pollution caused by mankind activity, makes water re-use ofoutmost importance. However, one should keep in mind that, from a global point of view,the recycling of water is not environmentally benign if high energy input technologies areused for this purpose [2]. Thus, the development of efficient wastewater technologies withlow energetic and operation costs is essential for all types of wastewater.
Wastewater can be divided into four broad categories, according to its origin, namelydomestic, industrial, public service and system loss/leakage [3]. Among these, industrialwastewaters occupy a 42.4% of the total volume and domestic a 36.4%. The types ofcontaminants that can be present in the aquatic effluents have been summarised as:
• Suspended Solids, Dissolved inorganics
• Biodegradable Organics & Nutrients
• Priority Pollutants (carcinogeneous etc.), Pathogens, Refractory (non-biodegra-dable) Organics, Heavy Metals
In particular, increasing quantities of wastewater with a high organic load result fromnumerous industrial and domestic applications. The most common depolluting technol-ogy in this case is the conventional biological treatment. However, its application becomesimpossible for streams that contain high organic load and/or bio-toxic compounds. Forexample, aqueous phenol solutions with concentrations exceeding 0.5 g/L should not betreated in biological plants, even though acclimatised cultives in laboratory tests haveperformed depollution of solutions with up to 2 g/L of phenol [4]. Phenol and phenollike compounds are frequently encountered in the end of pipe streams of several chemical
3

4 CHAPTER 1. INTRODUCTION
industries, such as petrochemical, pharmaceutical etc. The importance of these effluentsis outlined by the high quantities that are eventually rejected in the environment despitethe legislation restrictions, as shown in Table 1.1 for the United States in the year 2000[5].
Table 1.1: Annual release of toxic phenol-like pollutants in the United States for theyear 2000 [5]
Compound Emision Overall(ton/year) Ranking
Phenol 22 352,4-Dinitrophenol 11 50Catechol 8.3 59Aniline 5.8 70Hydroquinone 1.9 95Quinone 0.64 115Pentachlorophenol 0.55 120Chlorophenols 0.046 2032-Nitrophenol 0.026 2134-Nitrophenol 0.007 239
Alternative methods have been developed for the remediation of these effluents, themost important being the adsorption on activated carbon, the thermal incineration andthe liquid phase chemical oxidation. Adsorption on activated carbon is very effective fora broad range of organic pollutants. It is well known that activated carbon has a largesurface area and adsorbs significant quantities of pollutants [6], but it does not ultimatelydestroy them. An adequate strategy for the spent active carbon disposal or regenerationis required, harming strongly the operating cost of the method. Incineration is the otherwell established technology for the treatment of concentrated and toxic organic wastestreams. Organic pollutants are burnt at atmospheric pressure and high temperaturesbetween 1000oC and 1700oC [7]. Thus, incineration can offer almost complete pollutantdestruction, although at very high energy costs, because an organic load above 25% isnecessary to guarantee autothermal oxidation. Furthermore, this technique has beenaccused for the emission of toxic by-products such as dioxins and furans [8].
Liquid phase chemical oxidation methods promise to overcome the existing drawbacksof the above mentioned treatment methods by destroying the pollutant while being dis-solved in the liquid phase. Several emerging liquid phase oxidation methods can bedistinguished in terms of the different oxidants, catalysts and operating conditions se-lected. The non-catalytic Wet Air Oxidation (WAO) process uses a gaseous source ofoxygen which is the most readily available oxidant. Molecular oxygen can be dissolvedin sufficient quantities in the liquid phase, at relatively mild temperatures and pressuresabove 150oC and 2 MPa to oxidise several organic pollutants [9, 10, 11]. Alternatively,more effective, but also more expensive oxidants, like hydrogen peroxide [12, 13, 14] andozone [12, 15] have been tested, yielding good results at milder conditions.

1.1. WASTEWATER MANAGEMENT 5
The incorporation of a catalyst has also been considered in combination with alltypes of oxidants aiming to reduce the operating temperature and pressure, and/or totreat pollutants that cannot be destroyed during non-catalytic liquid phase oxidationprocesses. Homogeneous catalysts, such as copper ions in solution were very effectivein oxidising several organics when air was used as oxidant [16]. The classical Fenton’sreaction, which combines iron salts with hydrogen peroxide has also given good resultsfor various organic pollutants [17]. Nonetheless, the addition of a homogeneous catalysthas the inherent disadvantage of the posterior catalyst removal from the treated effluent,because the metal ions are pollutants themselves in the range of concentrations used.Heterogeneous catalysts, on the other hand, do not need any extra separation step andare thus more attractive. Solid catalysts, mostly noble metals and base metal oxides,have been tested in combination with all types of oxidants. Less frequently, active carbon(AC) also has been chosen as a catalyst without any additional active phase [18, 19, 20,21, 22]. The incorporation of heterogeneous catalysts has exhibited promising resultsin laboratory tests, but industrial applications have been hindered because of the lackof stable catalytic performance over sufficiently long periods. It has been demonstratedthat catalyst deactivation can take place because of the active phase leaching [23], theformation of carbonaceous deposits [24] and, to a less extent, the catalyst sintering [25].
A different way to enhance oxidation, is the application of external energy sources,such as electrical/electrochemical [26, 27], radiation [12, 28] and ultrasound [29], to formvery reactive OH· radicals. These methods seem to be mostly adequate for low flowrate and low concentration effluents and the successful removal of target pollutants hasbeen reported even at ambient conditions. Obviously, in this case the heating cost istranslated to the cost of producing the respective energy for each process. An ultimatedistinction between the different methods is based on the operating conditions. If processtemperature and pressure are higher than the critical pressure and temperature of water,then supercritical methods emerge. Supercritical processes are extremely effective, butsuffer from corrosion, salt precipitation, as well as high energy requirements [30].
It is well known that the process performance and economics strongly relies on thesound reactor selection and design. Dudukovic [31], in a critical review of the currenttrends in catalytic reactor engineering, outlines the importance of the simultaneous de-velopment of both chemistry and engineering aspects for any emerging process. A betterunderstanding of the reactor behaviour, would enable to improve the reactor operationand modelling tools, thus eventually minimising the operation costs and, more important,the scale up risks. The implementation of novel reactor concepts can result in significantimprovements in process performance. For example, in supercritical water oxidation in-novative reactor configurations, such as the MODAR and the transpiring wall reactors,overcome corrosion and salt precipitation problems [32]. To avoid multistep processes,Polaert et al. [33] have proposed a bifunctional reactor scheme for the adsorption of phe-nol over activated carbon, and the subsequent regeneration of the latter in the same unit,as shown in Fig. 1.1. TBR periodic operation, which was very effective for enhancingTBR performance [34], has also shown advantages in catalytic wet air oxidation reactions[35].

6 CHAPTER 1. INTRODUCTION
Figure 1.1: Bifunctional reactor for aqueous phenol adsorption and active carbon re-generation in the same unit [33].
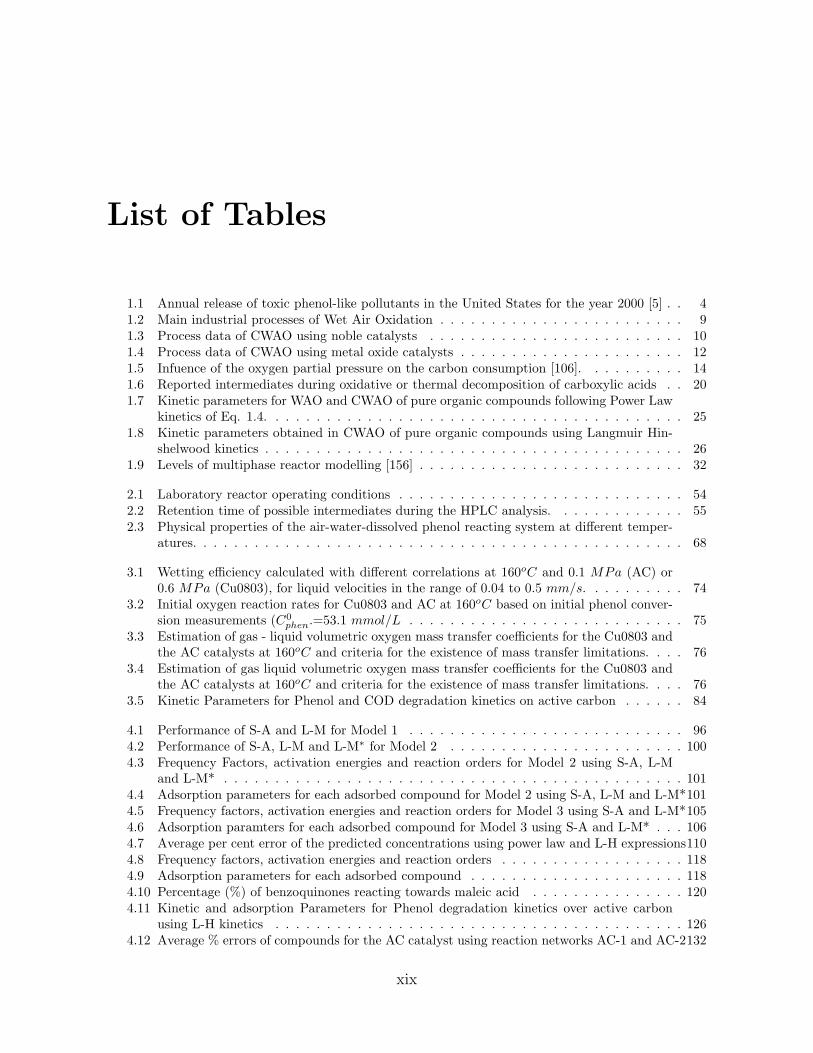
The review of the related research work done in this field, suggests that the processselection should be tailored to the composition of the effluent, the desired conversion andthe flow rate. A thorough study of the optimum range of application for each method isa rather difficult task, but future work should be driven in this direction. A first attemptby Andreozzi et al. [12], led to the technology map shown in Fig. 1.2, in which WAOappears to be the most suitable technology for wastewater containing between 20 and200 g/L of COD (Chemical Oxygen Demand). The suitability of WAO would be furtherreinforced if a heterogeneous catalyst is successfully incorporated in the process. Thus,particular emphasis has to be dedicated to the study of the Catalytic Wet Air Oxidation(CWAO) process.
1.2. WET AIR OXIDATION FUNDAMENTALS 7
Figure 1.2: Suitability of water technologies according to COD contents [12].
1.2 Wet Air Oxidation Fundamentals
The Wet Air Oxidation process was originally developed by F.J.Zimmermann and its firstindustrial applications appeared in the late 1950s [9]. Currently, there are more than 200plants operating around the world, the majority being dedicated to the treatment ofsewage sludge. Other main fields of application consist in the regeneration of activatedcarbon and the treatment of industrial wastewater [36].
According to this method, the dissolved or suspended organic matter is oxidised inthe liquid phase by some gaseous source of oxygen, that may be either pure oxygen, or air[11]. Typical operating conditions are in the range of 100-300oC and 0.5-20 MPa. Someindustrial applications, as summarised by Kolaczkowski et al. [36], Luck [13, 37] andDebellefontaine and Foussard [38], are given in Table 1.2. The main differences betweenthe distinct processes consist in the reactor type used and the incorporation, or not, of acatalyst.
The most widely spread variation is the non-catalytic Zimpro process, which uses acocurrent bubble column reactor, operating at temperatures between 147oC - 325oC andpressures of 2-21 MPa. A simplified flow diagram of the process is given in Fig. 1.3.The main components in the flow diagram are the separate gas and liquid feed lines,the heat exchanger unit, a gas liquid separator and a catalytic converter to destroy anyvolatile organics remaining in the gas phase. Alternative non-catalytic WAO processesare the Wetox process, that combines a series of agitated tank reactors, the Vertechprocess that uses the gravity to develop high pressures in a deep shaft reactor, the Kenoxprocess which incorporates novel elements like static mixing and ultrasound energy andthe oxyget process in which the liquid is fed in the reactor in form of droplets to eliminateoxygen transfer limitations.
WAO can achieve easily 90 to 95% conversion [38], which in general is not enough tomeet effluent discharge regulations. Thus, most of WAO units are followed by biological

8 CHAPTER 1. INTRODUCTION
Figure 1.3: Simplified Zimpro process flow diagram.
treatment.Despite its success in laboratory applications, catalytic WAO has yet not found the
industrial recognition met with non-catalytic WAO. The main reasons, as pointed outearlier, are that the homogeneous catalysts have to be removed in a subsequent step,while the heterogeneous catalysts have to maintain their activity for sufficiently longperiods. Homogeneous catalysts, such as Cu2+ or Fe2+ ions, are used in the Ciba-Geigy,LOPROX and WPO processes. The former uses Cu2+ ions at elevated temperatures(above 300oC) and is very successful in completely removing dioxins. In the reactor exitthe catalyst is precipitated as copper sulphide and recycled to the reactor. The othertwo processes add Fe2+, in more moderate conditions [13].
The heterogeneous Catalytic WAO (hereafter stated as CWAO) has scarcely foundindustrial applications. The NS-LC process uses a vertical monolith reactor with a Pt−Pd/T iO2−ZrO2 catalyst. The operating conditions are 220oC and 4 MPa. The Osakagas process uses a mixture of precious and base metals on titania or zirconia-titaniasupports. Typical operating conditions are 250oC and 6.86 MPa. The Kurita processuses nitrite instead of oxygen, and a similar catalyst (supported Pt), becoming moreeffective at lower temperatures, around 170oC.
Surprisingly, the industrial applications of CWAO operate at temperatures and pres-sures that are not significantly lower than those encountered in WAO. In addition, theyuse expensive noble metal catalysts. This contradicts with laboratory scale tests thathave clearly proven the superior efficiency of CWAO at significantly lower temperaturesand pressures [11], yielding less and more biodegradable partial oxidation products [39].
Given the potential of the CWAO, significant efforts have been driven in the three last

1.2. WET AIR OXIDATION FUNDAMENTALS 9
Table 1.2: Main industrial processes of Wet Air Oxidation
Process Waste type No Plants Reactor Type T (oC ) P (MPa) CatalystZimpro sewage sludge 200
spent AC 20 Bubble Column 280-325 20 noneindustrial 50
Vertech sewage sludge 1 deep shaft <280 <11 none
Wetox ns ns stirred tanks 200-250 4 none
Kenox ns ns recirculation <240 4.5 nonereactor
Oxyget ns ns tubular <300 ns nonejet
Ciba-Geigy industrial 3 - 300 ns Cu2+
LOPROX1 industrial >1 Bubble column <200 5-20 Fe2+
NS-LC ns ns Monolith 220 4 Pt− Pd/T iO2 − ZrO2
Osaka coal gasifier ns Slurry Bubble 250 7 ZrO2 or TiO2
gas coke oven Column with noble orcyanide base metals
sewage sludge
Kurita2 ammonia ns ns >100 ns supported Pt
ns: not specified1This process uses organic quinone substances to generate hydrogen peroxide2This process uses nitrite as oxidant
three decades to both develop active and stable catalysts for the process, and describethe reaction kinetics. Conversely, three phase catalytic reactor design and modelling forCWAO has received less attention, although some first trends have been reported.
An overview of the current state of art on CWAO catalysts, kinetics and reactordesign is attempted to outline both the progress done in the field of CWAO and the openkey aspects to be addressed by future research work.

10 CHAPTER 1. INTRODUCTION
1.3 Catalytic Wet Air Oxidation Catalysts
1.3.1 Active catalysts
The heterogeneous catalysts that have been employed in CWAO can be divided in twomain groups, i.e. metal oxides (as well as mixtures of them) and supported noble metals[16, 40]. Active carbon, without any deposited active phase, has also exhibited catalyticactivity [18, 19].
Noble Metals
Noble metals have been very effective in the treatment of different pollutants such asphenols [41, 42, 43, 20, 44], carboxylic acids, including refractory acetic acid, [46, 43, 45,48, 47, 50, 49, 51, 52, 53], ammonia [54, 55, 56] and kraft effluents [57, 58, 59, 60, 61].Pd, Pt and Ru have received most attention although Ir or Rh have also been tested[48, 46, 52]. Table 1.3 summarises the applications of noble metal catalysts in the CWAO.
Table 1.3: Process data of CWAO using noble catalysts
Noble Metal Support Substrate T (oC ) P MPa Ref.Pt γ −Al2O3 acetic acid >200 [53]Ru, Ir, Pd, Ag, CeO2, TiO2, ZrO2 acetic acid 200 2 [46]base metalsPt γ −Al2O3 maleic acid >120 >0.4 [62]Ru CeO2 maleic acid >160 2 [63]Ru TiO2 succinic acid >150 5 [49]Pt C carboxylic acids >20 >0.1 [45]Pt C carboxylic acids 200 0.69 [51]Pt γ −Al2O3, resin carboxylic acids 80 0.1 [64]Ir C butiric acid 200 0.69 [52]Pt, Ru, Rh TiO2, CeO2, C phenol/acrylic acid 170 2 [48]Pt γ −Al2O3 phenol > 155 2 [44]Pt, Ag, MnO2/CeO2 phenol >80 0.5 [42]Pt-Ru C phenol >35 [41]Ru C, CeO2/C phenol 160 2 [43]Pt C p-chlorophenol 170 2.6 [20]Pt, Ru, Pd, Rh CeO2 ammonia >150 2 [54]Pd C ammonia 280 2 [56]Pt SDB resin ammonia >110 <0.28 [65]Pt, Ru, Pd, Ir T iO2, CeO2, C ammonia >150 1.5 [55]Pt-Ru C trichloroethene >90 >0.2 [66]Ru TiO2, ZrO2 Kraft effluent 190 5.5 [60]Ru TiO2 Kraft effluent 190 8 [61]Pd, Pd− Pt γ −Al2O3, ALONTM Kraft Effluent >80 1.84 [57]Pd− Pt− Ce γ −Al2O3 Kraft effluent >130 > 1.5 [67, 58, 59]
From Table 1.3 it can be deduced that numerous noble metal catalysts are available,

1.3. CATALYTIC WET AIR OXIDATION CATALYSTS 11
but for different pollutants different metals may present optimum results. For example,in the case of acetic acid oxidation, Barbier et al. [46] state that the catalytic activitydecreases in the order Ru > Ir > Pd, while for the oxidation of p-chlorophenol, Qin etal. [20] found out that catalytic activity decreases in a reverse order Pt > Pd > Ru.Occasionally, synergistic effects in bimetallic catalysts improve catalyst activity and/orselectivity. Better N2 selectivity was achieved during ammonia oxidation when a mixedRu− Pd/CeO2 catalyst was used [54]. Promoters have also been used with noble metalcatalysts. An Ag promoted Pt over MnO2/CeO2 catalyst enhanced the CWAO of phenolcompared to the non promoted catalyst [42].
The noble metal support also influences significantly catalyst performance. Metaloxides, like alumina, ceria, titania and zirconia, as well as active carbon or high spe-cific area graphite have been mainly studied. In the treatment of Kraft bleach effluentsincreasing the support surface area had a positive effect on catalyst activity [60]. Thedispersion of the active phase was also shown to be important for the CWAO of phenol,as demonstrated by a comparative study of two Pt/Al2O3 catalysts prepared in differentmanners [44]. Finally, the deposition of noble metals on hydrophobic supports, i.e. cer-tain active carbons [56], or styrene divinyl benzene co-polymer [65], is very effective forthe destruction of volatile pollutants such as ammonia.
Metal Oxides
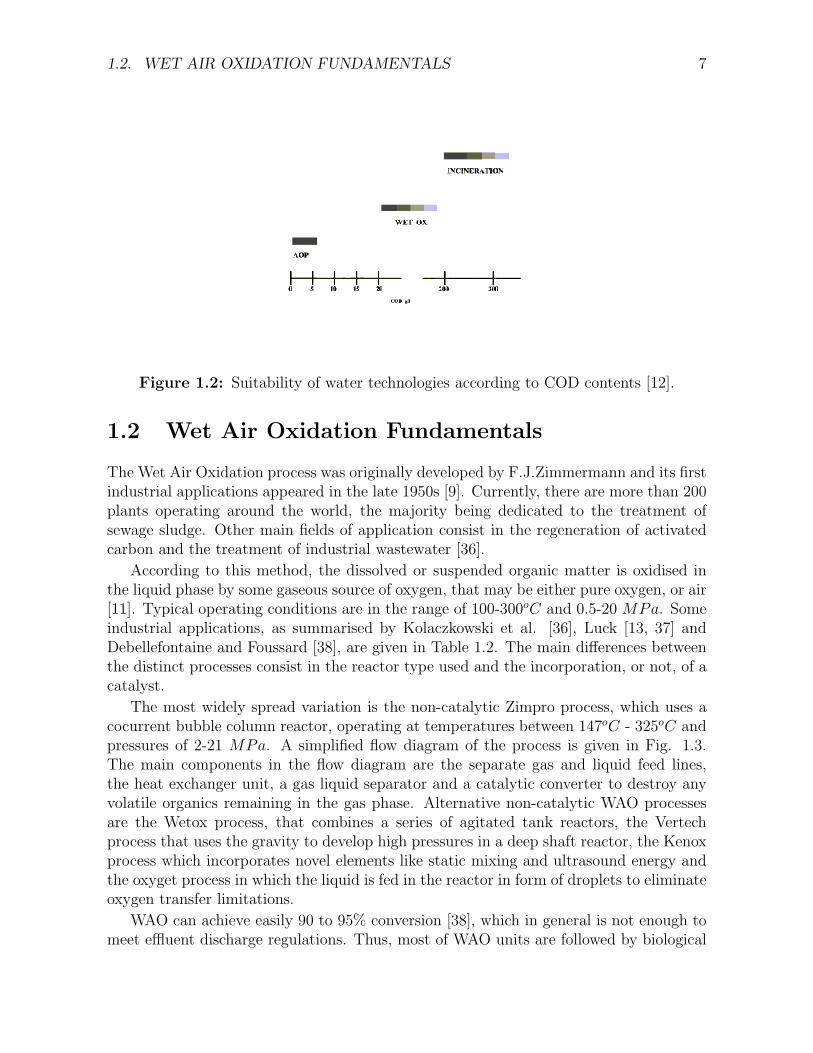
The other broad family of catalysts used in CWAO is the pure or mixed metal oxides.Copper oxide, alone or combined with other oxides, has received special attention in theCWAO of aqueous effluents [90, 98, 99, 101, 82]. Phenol was successfully oxidised by acommercial Harshaw Cu0803 T1/8 catalyst, comprising 10% copper oxide supported overalumina [90, 82]. Baldi et al. [98] and Goto and Smith [99] tested a commercial CuO/ZnOcatalyst to oxidise Formic acid while Levec et al. [101] used a catalyst combining Cu,Mn and La oxides supported on Al2O3 and ZnO to oxidise acetic acid. In the earlynineties, other commercial catalysts comprising CuO, ZnO and γ − Al2O3 [96, 81], orCoO [80, 97] were successfully employed by Pintar and Levec to oxidise phenol andsubstituted phenols.
Ceria oxide, manganese-ceria mixed oxides and promoted ceria catalysts have alsoexhibited high activities. In the eighties, Imamura and co-workers (as summarised by[16]) developed Mn/Ce oxide catalysts for the CWAO of ammonia, which proved to bevery effective for most organic compounds. De Leitenburg et al. [102] reported thatternary mixed oxides with ceria zirconia and MnOx or CuO performed better than ceria,or ceria - zirconia catalysts alone. Hamoudi et al. found that that CeO/MnO catalystscan effectively oxidise phenol [24, 87, 104] and 4-chloroguaiacol [105]. Later, Chen et al.[88] showed that a Mn/Ce ratio of 6/4 was the most active for phenol oxidation. Theperformance of the catalyst was further improved by the incorporation of potassium [86],although this modification mainly affected catalyst stability, and will be discussed later.
Metal oxide catalysts not based on copper or cerium have been tested in fewer cases.The use of ferric oxide gave reproducible results for the oxidation of acetic acid under
12 CHAPTER 1. INTRODUCTION
Table 1.4: Process data of CWAO using metal oxide catalysts
Oxide Support Substrate T (oC ) P MPa Ref.Cu/Cr oxides phenol >127 0.32 [69, 68, 70]Cu/Cr/Ba/Al oxides phenol 127 0.8 [71]Co, Fe, Mn, Zn oxides γ −Al2O3 phenol 140 0.9 [23]with Cu oxidesCuO γ −Al2O3 phenol >120 >0.6 [72, 73]CuO γ −Al2O3 phenol 140 0.9 [74]Cu/Ni/Al oxides phenol 140 0.9 [75, 76, 77, 78]CuO/ZnO/CoO cement phenol >130 7 [79]CuO/ZnO/CoO cement phenol >150 (∗) [80]CuO/ZnO γ −Al2O3 phenol >105 >0.15 [81]CuO γ −Al2O3 phenol >113 >0.44 [82]CuO/CeO2 phenol 130 0.73 [83, 84]K −MnO2/CeO2 phenol 110 0.5 [86, 85]MnO2/CeO2 phenol >80 >0.2 [24, 87, 88]CuO C phenol >160 >2.6 [89]CuO γ −Al2O3 phenol >95 >0.1 [90, 91]MnO2, Co2O3 phenol >170 >1.3 [92]Ni− oxide phenol >15 - [93]Cu/Zn/Cr/Ba/Al oxides phenol >110 >0.1 [94]MnO2, Co2O3 p-chlorophenol >170 >1.3 [95]CuO/ZnO/CoO cement p-chlorophenol >150 (∗) [97]
p-nitrophenolCuO/ZnO γ −Al2O3 p-chlorophenol >105 >0.15 [96]
p-nitrophenolCuO/ZnO formic acid >200 4 [98, 99]Fe2O3 acetic acid >252 >6.7 [100]Cu/Mn/La ZnO −Al2O3 acetic acid >250 (∗) [101]Ce/Zr/Cu oxides or acetic acid >245 >5 [102]
Ce/Zr/MnMnO/CeO acetic acid 247 1 [16]
n-butilamine 220PEG 220
pyridine 270ammonia 263
MnO2/CeO2 alcohol distilery >180 >0.5 [103]waste
∗These tests were performed in a liquid full reactor saturated with oxygen.

1.3. CATALYTIC WET AIR OXIDATION CATALYSTS 13
severe conditions (T > 250oC, P > 6.7MPa), while the copper based catalysts sufferedsevere deactivation [100]. More recently, nickel oxide catalysts have been used to removeeffectively phenol in atmospheric pressure conditions [93].
Active carbon
Most commonly, AC has been used as a catalyst support [66, 48, 43]. Only in the lasfive years, the AC without any additional active phase, was shown to possess a long termcatalytic activity in the oxidation of phenol [18, 19, 20], that could even surpass that ofa conventional copper oxide catalyst as shown in Fig. 1.4 [18]. Experiments currently inprogress in our laboratory, indicate that AC is also active in the oxidation of m-xylene,o-cresol, o-chlorophenol and aniline, while nitrophenol, sulfolane and nitrobenzene areextremely refractory.
Figure 1.4: Comparison of phenol conversion profiles at 140oC and 4.7 MPa using AC(ME) in nitrogen, air and Cu0803 in air [18].
The underlying mechanisms that are responsible for the catalytic activity of AC inCWAO are far from being well understood. To bring some light in this open aspect, arecopilation of the existing data of the CWAO of phenol over AC [18, 106, 107] is carriedout and an attempt is done to relate these results to other studied systems that employAC as a catalyst.
The most important conclusion is that the phenol oxidation over AC seems to proceedthrough the formation of a carbonaceous layer on the AC surface. It has been reportedthat during the CWAO of phenol over powdered AC in a semi batch slurry reactor it wasimpossible to balance the total carbon mass over the liquid and gas phase [107]. Also, avery low activation energy of about 40 kJ/mol was evaluated for phenol removal whichis rather comparable to the 50 kJ/mol reported for the oxidative coupling reaction ofphenol to form dimmers in the liquid phase catalysed by cuprous chloride [108]. Related
14 CHAPTER 1. INTRODUCTION
TBR studies using AC at 140oC and oxygen partial pressure ranging from 0.1 to 0.9 MPashowed an initial increase of the AC weight of 20% at 0.9 MPa. Then, the AC weight(as well as the phenol conversion) continuously decreased to result in a loss of 33% after10 days [106]. In the same run, a final reduction of the initial AC surface area of about63% occurred, most probably due to blockage of micropores by some organic deposit.
A possible explanation of these results can be deduced from related studies. Activecarbon is known to catalyse other reactions, like the SO2 oxidation [109] or the oxidativedehydrogenation of ethylbenzene [110, 111, 112, 113]. For these reactions, the AC surfacefunctional groups oxidise the substrate and are consequently reoxidised by oxygen in aredox cycle, in which the functional groups present on the AC surface participate.
In the gas phase oxydehydrogenation of ethylbenzene over AC, Pereira et al. [111, 112,113] observed conversion and AC weight evolution in 3 day long runs that are similar tothe trends observed by Fortuny et al. [106] for the CWAO of phenol. The former authorsreport the initial formation of coke deposit in the AC surface and found out by mea-surements of the total and micropore surface area that the formed coke layer completelyblocked the micropores of AC. An elemental analysis of their carbons samples indicateda temporal change in its composition, i.e. a decrease of carbon content with a corre-sponding increase of oxygen and hydrogen at higher run times. Due to this compositionchange of the coke layer, the rate of gasification progressively became dominant, as thenew oxygen containing surface groups formed with run time were shown by TPO analysisto be only effective in the coke gasification but not in its formation. Milder conditions ofoxygen pressure and temperature delayed, but not avoided, both the consumption of ACand the shift of active surface groups to groups not available for the organic redox cycle.In the case of the phenol oxidation, the application of milder conditions (lower oxygenpressure) also had a positive effect on AC weight, as shown in Table 1.5, although in thiscase the activity towards phenol oxidation remained practically constant over 10 days.
Table 1.5: Infuence of the oxygen partial pressure on the carbon consumption [106].
PO2 (MPa) 0.1 0.2 0.4 0.9Consumption (%)* -18 -3 16 33∗With respect to the initally loaded active carbon.
Two additional TBR runs of phenol oxidation were conducted at 0.9 MPa using eitherair with a phenol free feed or pure nitrogen with a phenol feed. Without phenol fed to thereactor, the combustion rate of AC is greatly enhanced leading to its total consumptionafter 9 days running. In the absence of oxygen, the phenol conversion dropped rapidlyto zero after the adsorption step and no intermediates were found in the reactor effluent.Apparently, the oxygen containing surface groups of the AC alone are not capable ofoxidising the adsorbed phenol in significant quantities.
Given the similarities between the findings of the work of Pereira et al. [111, 112, 113]and ours, the assumption of the formation of a coke-like layer and its participation inthe liquid phase oxidation of phenol seems to be reasonable. According to the work

1.3. CATALYTIC WET AIR OXIDATION CATALYSTS 15
on the oxidative dehydrogenation of ethylbenzene, a redox cycle can be figured out totake place on the formed coke layer. However, differences certainly will arise comparedto the oxidative dehydrogenation of ethylbenzene, because the oxidation of phenol iscarried out in the liquid phase and seems to follow a much more complex mechanism.For instance, the rate of combustion of the AC is greatly enhanced in the liquid phaseand the adsorption of water on the AC surface also should play an import role in thecoke formation during the CWAO of phenol.
1.3.2 Catalyst stability
Up to date, the main drawback of CWAO, preventing it from a broad industrial appli-cation, consists in the catalyst deactivation, which occurs mainly due to active phaseleaching or formation of carbonaceous deposits, during the oxidation process. The mostprominent catalysts prone to leaching of the active phase are mixed oxides catalysts.Pintar and Levec [97] performed CWAO of nitrophenol and chlorophenol over a catalystcomprising CuO, ZnO and CoO in a liquid full fixed bed reactor and detected metalions from all the above oxides in the solution. Similar trends were also observed for othercopper catalysts like CuO/γ−Al2O3 [72, 75], bimetallic copper containing catalysts [23],copper on activated carbon [114, 116] or zeolites [117]. Under continuous operation, thisdecline leads to a continuous activity loss as clearly shown in Fig. 1.4. Thus, the de-velopment of more stable metal oxide catalysts can be pointed out as a critical issue inCWAO.
Recently, metal oxide catalysts with promising behaviour have been prepared. Ale-jandre et al. [76, 77, 78] developed mixed copper, nickel and aluminium oxide catalysts,which performed without any activity loss for 15 days on stream in a Trickle Bed Reac-tor. Hocevar et al. [83, 84], prepared different CuO − CeO2 catalysts in which copperleaching was significantly reduced. For mixed Ce/Mn oxide catalysts, it was found thatmeasurable amounts of Mn could dissolve [24, 48]. Active phase leaching was also re-ported for noble metal catalysts from during the CWAO of pulp mill effluents over Pdand Pt catalysts [59, 115].
Catalyst deactivation caused by the formation of carbonaceous deposit on the catalystsurface has been observed for several types of catalysts. Ceria oxide based catalysts havebeen found to suffer from this type of catalyst deactivation during tests carried out inagitated tank reactors [24, 87]. Further work demonstrated that carbonaceous depositscould be minimised by promoting the catalyst with Pt and Ag [87, 42]. More recently,it was found that less expensive potassium can also retard such formation [85, 86]. Thecarbonaceous deposit has to be related both to the nature of the organic pollutant and thereactor type used. The enhanced formation of such deposits has been confirmed by severalauthors in slurry reactors [81, 24], with a characteristic high liquid to catalyst ratio,that promotes the homogeneous polymerisation reactions. Consequently, comparativestudies have shown that the extent of these parallel side reactions in the liquid phase aresignificantly reduced in Trickle Bed Reactors [80, 77, 107].
In the case of AC the catalytic activity during the CWAO of phenol at 140oC was
16 CHAPTER 1. INTRODUCTION
Figure 1.5: Phenol conversion dependence on the oxygen partial pressure using AC[106].
shown to be stable only for pressures below 0.4 MPa, while at higher pressures a constantdecline was observed [106] (Fig. 1.5). The loss of AC catalytic activity was attributed tothe simultaneous burnt out of the AC catalytic bed during the oxidation process. It wasdemonstrated that the rate of combustion of AC is considerably faster when, instead ofthe phenolic solution, a pure water solution is fed to the reactor [18]. Obviously the phenoloxidation and the carbon burn out are competitive reactions, and the phenol adsorbedon the AC surface protects the AC from being oxidised, as long as the concentration ofO2 is kept below a certain limit.
1.3.3 Overview
A wide range of supported noble metals, mixed metal oxides, as well as active carbonalone have been shown to exhibit catalytic activity for the oxidation of aqueous solutionsof organic pollutants. Noble metal catalysts are very effective for the removal of refractorycarboxylic acids, while for the less refractory phenolic pollutants, mixed metal oxides andactive carbon yield good results. Catalyst deactivation has been found to occur eitherdue to carbonaceous deposit formation, or due to active phase leaching. For both noblemetal and mixed oxide catalysts analysis of the outlet solution for dissolved metals shouldbe always carried out to measure the degree of stability of the catalyst. Long term runsin continuous reactor should also be tested to validate catalyst stability under continuousoperation conditions. Such 10 day tests have shown that AC can yield constant phenolconversions, as long as oxygen partial pressure is below 0.4 MPa.

1.4. REACTION MECHANISMS & RATE EQUATIONS IN WAO AND CWAO 17
1.4 Reaction Mechanisms & Rate Equations in WAO
and CWAO
To understand the CWAO process, the knowledge of the reaction kinetics is fundamental.The effort of research should focus on the establishment of both the reaction pathwaysfollowed during the oxidation reactions and the kinetic laws that can describe them. Thisknowledge, apart from giving a fundamental insight to CWAO can lead to significantimprovements in the operation and design of CWAO units. Thus, in the following weattempt to give a review of the state of art of these aspects and point out fields for furtherresearch work.
1.4.1 Reaction Pathways
Pathways of phenol oxidation
The pathways and mechanism of CWAO reactions have been studied in detail only forpure compounds. Phenol and substituted phenols are commonly encountered in industrialeffluents that are refractory to conventional biotreatment [5]. Also phenol has been shownto be more refractory than most of the substituted phenols [118], making it the ideal targetcompound for both WAO [119, 118, 120, 122, 123] and CWAO [94, 96, 81, 80, 97, 82, 90,72, 73, 106, 18, 75, 76, 104, 48, 71, 68, 69, 70] conducted either in slurry, rotating basketor fixed bed reactor.
These studies demonstrated that phenol could be readily destroyed although its oxida-tion is followed by the formation of numerous organic intermediates. It is also well knownthat phenol oxidation occurs through a free radical chain mechanism [90, 81, 124, 125],that can take place in the homogeneous phase or on the catalyst surface. A simple butaccepted mechanism for the CWAO of phenol has been proposed by [81]:
RH −OH + cat → R ·H = O + ·H − cat (1.1)
R ·H = O + O2 → RHO −OO · (1.2)
RHO −OO ·+RH −OH → ROH −OOH + R ·H = O (1.3)
In this mechanism RH − OH corresponds to phenol, R ·H = O corresponds to thephenoxy radical and RHO − OO· corresponds to the peroxy radical. Recently effortsare driven to develop more detailed radical reaction networks for the WAO of phenol,involving several tens of radical reactions, that should be more reliable in extrapolationbeyond the fitted conditions [124].
In addition to the elementary mechanisms of phenol oxidation, it is important toassess the pathway leading to the formation of carbon dioxide. The existing reactionschemes available in the literature are generally based on the pioneer work of Devlin andHarris [119]. These authors in a study of the non-catalytic WAO of phenol, carried outa thorough analysis both to identify the most important intermediate compounds and

18 CHAPTER 1. INTRODUCTION
to propose the reaction network illustrated in Fig. 1.6. In can be seen that the phenolring is firstly oxidised towards catechol and hydroquinone (hereafter joint to dihydricphenols) and benzoquinones. Subsequently, the ring breaks down forming low molecularweight carboxylic acids (< C6). Unsaturated acids, like maleic and acrylic acids seemedto be the main intermediates in the reaction path, while oxalic (including glyoxal andglyoxylic acid), formic and acetic acid were more stable, thus formed in higher quantities.Especially, acetic acid was found to accumulate in the system, so it could be consideredas an end product. Malonic acid was determined in only small amounts while succinicand propanoic acids only appear in traces, under conditions of oxygen deficit.
Studies on the catalytic aqueous phenol oxidation showed a similar intermediate dis-tribution in the presence of a solid catalyst. Ohta et al. [82] reported the formation ofcatechol, hydroquinone, maleic acid and oxalic acid, on a copper oxide catalyst. Fortunyet al. [73] using the same catalyst, identified in addition benzoquinone, malonic acid,acetic acid and formic acid. These authors calculated that the detected compounds ac-count for more than 95% of the experimentally measured COD. Pintar and Levec [81]detected dihydric phenols and small quantities of benzoquinone, using a ZnO, CuO andγ−Al2O3 catalyst in a slurry reactor. Neither maleic, nor oxalic acid were detected, butinstead acetic acid was present in considerable quantities. For this reactor it was foundthat phenol undergoes not only oxidation reaction but also polymerisation reactions inthe homogenous liquid phase. In a related study using a liquid full differential packed bedreactor they identified additionally 1,4-dioxo-2-butene and maleic acid [80], although nopolymers on the catalyst surface were detected. Oliviero et al. [43] using Ru supportedon either CeO2 or C also detected several of the compounds encountered by Devlin andHarris. They devide the detected compounds in C6: (benzoquinone and small amounts ofdihydric phenols), C4: (maleic, succinic and small amounts of fumaric acid), C3: (acrylicacid, 3-hydroxy as well as 3-oxo propionic acid and small amounts of pyruvic acid) andrefractory acetic acid. More recently Santos et al. [70], studied separately the oxidationof the main aromatic and carboxylic acid compounds mentioned above and proposed ascheme that distinguishes between the oxidation pathway of catechol, with that of hydro-quinone. These authors concluded that during catechol oxidation alone only oxalic acidis formed, while hydroquinone undergoes a complex scheme that agrees with the Devlinand Harris mechanism.
Pathways of substituted phenols oxidation
WAO of substituted phenols seems to result in a similar intermediates distribution. Pin-tar and Levec [97] reported the formation of hydroquinone, benzoquinone, 1,4-dioxo-2-butene, maleic acid and carbon dioxide during p-nitrophenol and p-chlorophenol oxida-tion. At low conversions, however, short chain carboxylic acids were not detected. Itshould be mentioned that the reported intermediates are included in the Devlin and Har-ris mechanism for phenol degradation. It was also found that the concentration of Cl−
and NO−2 /NO−
3 ions in the aqueous phase corresponds to the hydrocarbon conversionindicating that other cloro or nitro compounds are not formed.

1.4. REACTION MECHANISMS & RATE EQUATIONS IN WAO AND CWAO 19
Figure 1.6: Reaction network for phenol CWAO according to Devlin and Harris [119].

20 CHAPTER 1. INTRODUCTION
Table 1.6: Reported intermediates during oxidative or thermal decomposition of car-boxylic acids
Compound (Formula) mu ma fu su bu pr ar ae gl ox fo Refmuconic (C6H6O4) * * + + * * * [127]maleic (C4H4O4) + + + + * * * [127, 63, 62, 64]fumaric (C4H4O4) + + * * * [127]succinic (C4H6O4) + [49, 50]butyric (C4H8O2) + + [52]propionic (C3H6O2) + [128, 51]acrylic (C3H4O2) + + [127, 43]acetic (C2H4O2) [129, 131, 100, 46, 47]glyoxylic (C2H2O3) + [129, 130]oxalic (C2H2O4) + [129, 130, 45, 98, 51]formic (CH2O2) + [70]
(+): Produced under oxidative conditions. (∗): Produced also by thermal decomposition.
Qin et al. [20] studied the WAO oxidation of p-chlorophenol, and observed that inthe absence of a catalyst, stable intermediates were formed because a p-chlorophenolconversion of 73.5% corresponded to only 42.9% of TOC reduction. In CWAO, thisdifference became smaller, in general being less than 10%. These authors report theadditional formation of phenol and dichloro phenols, which were not detected in thestudy of Pintar and Levec [97]. Nevertheless, no phenol dimers were detected.
Neri et al. [126] studied the CWAO of p-coumaric acid over promoted ceria cata-lysts and they reported chain side oxidation leading to catechol, p-hydroxybenzaldehydeand p-hydroxybenzoic acid (and their hydroxylation products), as well as broken ringintermediates such as oxalic, formic and oxalacetic acid.
Pathways of carboxylic acids oxidation
The study of the WAO/CWAO of carboxylic acids is a very important issue becausethe oxidation of numerous organic compounds leads to the formation of carboxylic acids,before being mineralised to CO2 and H2O [11]. Table 1.6 summarises the carboxylicacids studied and the intermediates that were detected. In general, it should be pointedout that the studies have been performed at different conditions, resulting to differentintermediate distribution.
For carboxylic acids both the oxidative degradation and the thermal decomposition,via decarbxylation roots, should take place, explaining the different intermediates ob-served. For example, during the maleic acid thermal decomposition no acetic acid isdetected, the main product being formic acid. In an oxidative environment acetic acidis formed in quantities half of those of formic acid [129]. The presence of a catalyst alsoaffects reaction pathways of maleic acid destruction, since no acetic acid formation isreported at all for Pt/C and Pt/γ − Al2O3 catalysts [64, 62].
In general, unsaturated carboxylic acids can be oxidised or decomposed more easily
1.4. REACTION MECHANISMS & RATE EQUATIONS IN WAO AND CWAO 21
than unsaturated one. When carboxylic acids with several carbon atoms are oxidised,low molecular weight acids are formed, mainly acetic, oxalic and formic acids. Acetic acidseems that, whenever it is formed, it is oxidised more slowly than the rest of carboxylicacids. Furthermore, in acetic acid oxidation studies no significant amounts of intermedi-ates are reported. Oxalic acid has been shown to thermally decompose to formic acid, orto be oxidised towards carbon dioxide. Formic acid is usually considered to be oxidisedforming carbon dioxide, although the formation of oxalic acid to some extend has alsobeen reported [70].
Industrial effluent oxidation pathways
Industrial effluents are usually complex mixtures of several compounds, thus the possibleintermediates that can be formed during their treatment is much broader. Nevertheless,for some wastes, namely Kraft bleach plant effluents [60, 61], and alcohol distillery liquors[103, 59], it has been shown that the main intermediates are also low molecular weightcarboxylic acids among which acetic acid is the most persistent [120, 132].
1.4.2 Rate Equations & Rate Constants
The amount of efforts dedicated to identify the most probable reaction pathway of theCWAO is directly related to the sophistication of the developed reaction schemes. Usually,this gives rise to either progressively complex lumping or very detailed reaction pathways.Within these reaction schemes, it is possible to distinguish two main categories of rateequations that are used to mathematically describe the ongoing oxidation processes. Forinstance, simple power law (P-L) expressions have been typically pointed out for non-catalytic oxidation in the liquid phase, while Langmuir - Hinshelwood (L-H) expressions,including adsorption-desorption steps are necessary to describe solid catalysed oxidationreactions. These aspects are discussed in detail in the following sections.
Lumping & detail reaction schemes
Lumping schemes: The intermediates formed during WAO or CWAO reactions donot necessarily react at the same rate, some of them being even refractory to oxidationat the conditions employed. In addition, industrial effluents are mixtures of several com-pounds and their exact composition may not be well defined. Thus, there is a trend toconveniently lump intermediates in order to model the kinetics in terms of more gen-eral characteristics such as Chemical Oxygen Demand (COD) or Total Organic Carbon(TOC). This approach of direct degradation rates of the pseudo-compounds to carbondioxide has performed well (e.g. [128, 129, 127] when the refractory intermediates areonly formed in trace amounts. When this is not the case more advanced lumping strate-
22 CHAPTER 1. INTRODUCTION
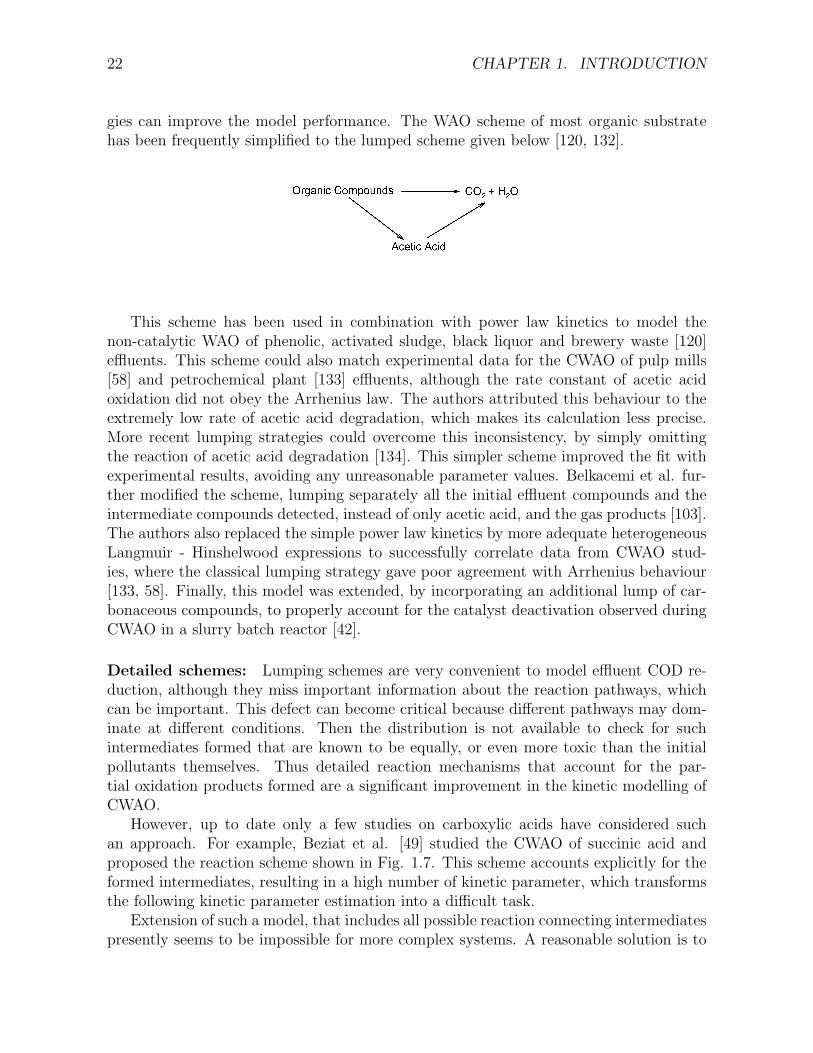
gies can improve the model performance. The WAO scheme of most organic substratehas been frequently simplified to the lumped scheme given below [120, 132].
This scheme has been used in combination with power law kinetics to model thenon-catalytic WAO of phenolic, activated sludge, black liquor and brewery waste [120]effluents. This scheme could also match experimental data for the CWAO of pulp mills[58] and petrochemical plant [133] effluents, although the rate constant of acetic acidoxidation did not obey the Arrhenius law. The authors attributed this behaviour to theextremely low rate of acetic acid degradation, which makes its calculation less precise.More recent lumping strategies could overcome this inconsistency, by simply omittingthe reaction of acetic acid degradation [134]. This simpler scheme improved the fit withexperimental results, avoiding any unreasonable parameter values. Belkacemi et al. fur-ther modified the scheme, lumping separately all the initial effluent compounds and theintermediate compounds detected, instead of only acetic acid, and the gas products [103].The authors also replaced the simple power law kinetics by more adequate heterogeneousLangmuir - Hinshelwood expressions to successfully correlate data from CWAO stud-ies, where the classical lumping strategy gave poor agreement with Arrhenius behaviour[133, 58]. Finally, this model was extended, by incorporating an additional lump of car-bonaceous compounds, to properly account for the catalyst deactivation observed duringCWAO in a slurry batch reactor [42].
Detailed schemes: Lumping schemes are very convenient to model effluent COD re-duction, although they miss important information about the reaction pathways, whichcan be important. This defect can become critical because different pathways may dom-inate at different conditions. Then the distribution is not available to check for suchintermediates formed that are known to be equally, or even more toxic than the initialpollutants themselves. Thus detailed reaction mechanisms that account for the par-tial oxidation products formed are a significant improvement in the kinetic modelling ofCWAO.
However, up to date only a few studies on carboxylic acids have considered suchan approach. For example, Beziat et al. [49] studied the CWAO of succinic acid andproposed the reaction scheme shown in Fig. 1.7. This scheme accounts explicitly for theformed intermediates, resulting in a high number of kinetic parameter, which transformsthe following kinetic parameter estimation into a difficult task.
Extension of such a model, that includes all possible reaction connecting intermediatespresently seems to be impossible for more complex systems. A reasonable solution is to

1.4. REACTION MECHANISMS & RATE EQUATIONS IN WAO AND CWAO 23
Figure 1.7: Reaction scheme for the oxidation of succinic acid. SUC: succinic acid,ACR: acrylic acid, ACE: acetic acid. [49]
select reaction networks that account only for influent reactions should be considered. Inthis view Eftaxias et al. [121] developed a model for the CWAO of phenol in a TBR thataccounts for eight compounds considering only eight reactions.
Rate Expressions
Power Law Expressions: For non-catalytic oxidation the use of power law expressionshas been typically pointed out. These equations are of the general form of Eq. 1.4.
rorg = k0 exp(−Ea/RT ) [CO2 ]α [Corg]
β (1.4)
The values of the kinetic constants following Eq. 1.4 are summarised in Table 1.7, forboth WAO and CWAO studies. For WAO usually a first order dependence on the organicsubstrate has been reported for phenol, substituted phenols [122, 118] and carboxylicacids, such as formic, oxalic, acetic and propionic acid [128, 129]. The same trends alsohold for TOC or COD lumps [120, 118, 128, 129]. Unsaturated carboxylic acids, such asacrylic maleic and fumaric acid [127] show orders close to 1.5 and the authors attributedthis fact to the existence of simultaneous reactions over two reactive centers in thesemolecules (double bond and carboxylic group), giving rise to an apparent reaction orderincrease.
Reported oxygen orders in general oscillate between 0 and 1. For phenol, Willms etal. [122] report an 0.5 order, while Joglekar et al. [118] state a first order. Shende andLevec [128, 129] give orders equal, or close to 0.5 for saturated carboxylic acids. On theother hand, for unsaturated carboxylic acids the orders could vary from 0.54 for acrylicand fumaric acid to 0.12 for maleic acid. The oxygen orders for TOC removal duringoxidation of these acids were higher ranging between 0.3 and 1.
Activation energies depend on the particular compound studied, but they generalytake values in the interval for 70 to 160 kJ/mol the CWAO usually being in the down

24 CHAPTER 1. INTRODUCTION
limit. because of the free radical nature of the phenol and substituted phenols oxidationreaction, different activation energies have been reported for the induction and rapidpropagation periods. According to Willms et al. [122] the activation energy was foundto be 94 kJ/mol and 112 kJ/mol for each step respectively, while Joglekar et al. [118]reported much lower values of 22 kJ/mol and 50 kJ/mol These later values howevershould be questioned for mass transfer problems. in general, low molecular weight car-boxylic acids are less reactive than ring compounds, resulting in high activation energies.On the other hand, thermal decomposition of unsaturated acids was found to have loweractivation energies [127].
Power law equations have also been considered in CWAO kinetic studied. The CWAOof phenol usually yields a first order dependence on the substrate [91, 72, 92], althoughOhta et al. [82] report a value of 0.44. For formic acid Baldi et al. [98] also obtaineda first order dependence, as well as Klinghoffer et al. [53] in the case of acetic acidoxidation over Pt/γ − Al2O3. On the other hand, Gallezot et al. [47] and Beziat et al.[50], claimed a zero order for acetic acid and succinic acid using Ru/C and Ru/T iO2
catalysts respectively. They justified these results by stating that these compounds arestrongly adsorbed on the ruthenium surface. Furthermore, a −0.5 acetic acid order wasobtained on a Ru/CeO2 and it was argued that on this catalyst acetic acid adsorbs evenstronger [46]. These latter findings suggest that the substrate adsorption on the catalystsurface can significantly affect the resulting reaction rate, making evident that in manyCWAO cases L-H expressions should be implemented.
For most of the above studies the oxygen order lies within 0.4 and 0.65, i.e. closeto 0.5 [46, 50, 47, 72, 82]. Nevertheless, Baldi et al. [98] obtained first order oxygendependence for the CWAO of formic acid in a liquid full fixed bed reactor operating inthe kinetic controlled regime. The reported activation energies may even vary for thesame compound and catalyst. For phenol, most authors agree in values between 85 and105 kJ/mol [82, 72, 92]. Conversely, Sadana et al. [91] reported a much higher valueof 176 kJ/mol, for the steady state period. The values reported for carboxylic acids arebetween 81 and 155 kJ/mol [98, 46, 50, 47, 53], most values being higher than those forphenol oxidation, as was the case also in the non-catalytic WAO.
Langmuir-Hinshelwood kinetics
In describing heterogeneous catalytic reactions, Langmuir - Hinshelwood expressions havebeen proven very powerful. Surprisingly, they have found less application to CWAOkinetics. A wide scenario of L-H expressions can be developed, although the most popularused in CWAO accounts for the competitive adsorption of the organics on the same activesite, omitting the existing adsorption of oxygen. The resulting expression is then givenby Eq. 1.5:
ri = k0 exp(−Ea/RT )K0 [CO2 ]
α [Corg.]β exp(−∆Horg/RT )
1 +∑
K0jCjexp(−∆Hj/RT )(1.5)
Table 1.8 summarises the kinetic parameters reported for L-H kinetics. In these studies

1.4. REACTION MECHANISMS & RATE EQUATIONS IN WAO AND CWAO 25
Table 1.7: Kinetic parameters for WAO and CWAO of pure organic compounds follow-ing Power Law kinetics of Eq. 1.4.
Compound Catalyst E(2)a α β Ref.
(kJ/mol)Succinic Acid3 Ru/T iO2 125 0.4 0 [50]Fumaric acid none 83.6 0.54 1.45 [127]Maleic acid none 99.2 0.12 1.45 [127]Maleic acid none 131.5 0 1 [62]Propionic acid none 150 0.5 1 [129]3-HPA1 none 135 0.5 1 [129]Acrylic acid none 94.3 0.54 1.5 [127]Acetic acid none 178 0.5 1 [129]Acetic acid Pt/γAl2O3 81 - 1 [53]Acetic acid Ru/C 100.5 0.65 0 [47]Acetic acid Ru/CeO2 96.6 0.5 -0.5 [46]Oxalic acid none 137 0.5 1 [129]Glyoxalic acid none 97 1 1 [129]Formic acid none 149 0.5 1 [129]Formic acid CuO/ZnO 155 1 1 [98]Phenol none 22 / 50 1 1 [118]Phenol none 94 / 112 0.5 1 [122]Phenol none 113.2 - 1 [92]Phenol CuO/γ −Al2O3 276 / 176 1 / 0.5 1 [91]Phenol CuO/γ −Al2O3 85.3 0.55 0.44 [82]Phenol CuO/γ −Al2O3 85 0.5 1 [72]Phenol MnO2 104.5 - 1 [92]Phenol Co2O3 96.3 - 1 [92]Phenol Cu2+ 85.2 - 1 [92]p-chlorophenol none 134.5 / 77 1 1 [118]p-chlorophenol none 91.9 - 1 [92]p-chlorophenol Cu2+ 75.5 - 1 [92]o-chlorophenol none 137.9/ 145 1 1 [118]m-chlorophenol none 72.1/ 130 1 1 [118]p-methoxyphenol none 157.9 / 71 1 1 [118]o-methoxyphenol none 133 / 133 1 1 [118]o-cresol none 130.4 / 190 1 1 [118]m-cresol none 86.4 / 48 1 1 [118]o-ethylphenol none 79.3 / 89 1 1 [118]2,6-dimethylphenol none 0 / 62 1 1 [118]m-xylene none 103 / 89.5 0.5 1 [122]
1 3-Hydroxypropionic acid2 when two values are given the correspond to: induction / steady state periods3 initial rate calculation

26 CHAPTER 1. INTRODUCTION
Table 1.8: Kinetic parameters obtained in CWAO of pure organic compounds usingLangmuir Hinshelwood kinetics
Compound Catalyst Ea ∆H α β product Ref.(kJ/mol) (kJ/mol) adsorption
Acetic acid Ferric oxide 87.8 ≈ 0 0.5 1 No [101]Acetic acid Cu,Mn, La - - 0.5 1 No [100]
Al,Zn oxidesSuccinic acid Ru/T iO2 - - - 1 Yes [49]Phenol CuOZnOCoO 139 -62 0.5 1 No [80]Phenol MnO2/CeO2 174 -109 - 1 Yes [104]Phenol CuO/C 78.6 - 0.5 1 No [89]p-Chlorophenol CuOZnOCoO 90 -24 0.5 1 No [97]p-Nitrophenol CuOZnOCoO 89 -18 0.5 1 No [97]
the substrate and the oxygen order have been successfully set equal to 1 and 0.5 respec-tively and have not been optimised. Several studies have considered that only the initialreactant, but not the products, adsorb on the catalysts surface. Nevertheless, it has beendemonstrated that phenol adsorption on AC can be affected by the presence of dihydricphenols or benzoquinone, in the solution [135].
With this type of equation, first order dependence on the substrate has been obtainedfor all the substrates tested, i.e. acetic acid [100, 101], succinic acid [49], phenol [80,104, 89] and substituted phenols [97]. The activation energy values of the range 78 to90 kJ/mol, although high values between 140 and 170 kJ/mol have also been reported,without any specific trend depending on the compound. The corresponding heats ofadsorption fall within the range -18 to -109 kJ/mol, although a value close to zero hasalso been reported for acetic acid oxidation over ferric oxide [100]. Among these studiesBeziat et al. [49] took into account competitive adsorption of the succinic acid oxidationproducts, while Hamoudi et al. [104] took into account adsorption of oxidation products(included as a lump), as well as carbonaceous deposits.
Synergistic Effects and Reactor Type
Synergistic effects: It is likely that the oxidation rates of pure compounds are differentwhen they are oxidised in the presence of other oxidisable compounds, which form activefree radicals. For the WAO process, it has been reported that effluent recirculation hada positive effect on pollutant abatement, because it provides a free radical environmentsince the entrance to the reactor [136]. Santos et al. [70], in a detailed study, observedthat the apparent reaction rates of phenol oxidation intermediates do not agree withthose found when they are oxidised alone. Shende and Levec claim that synergisticeffects occur depending on the conditions employed. They observed that mixtures oflow molecular carboxylic acids are oxidised with rates different from the individual whenthe oxygen partial pressure was below 2.2 MPa [129]. This fact elucidate that reactionkinetic studies performed for individual compounds cannot always be applied to describe
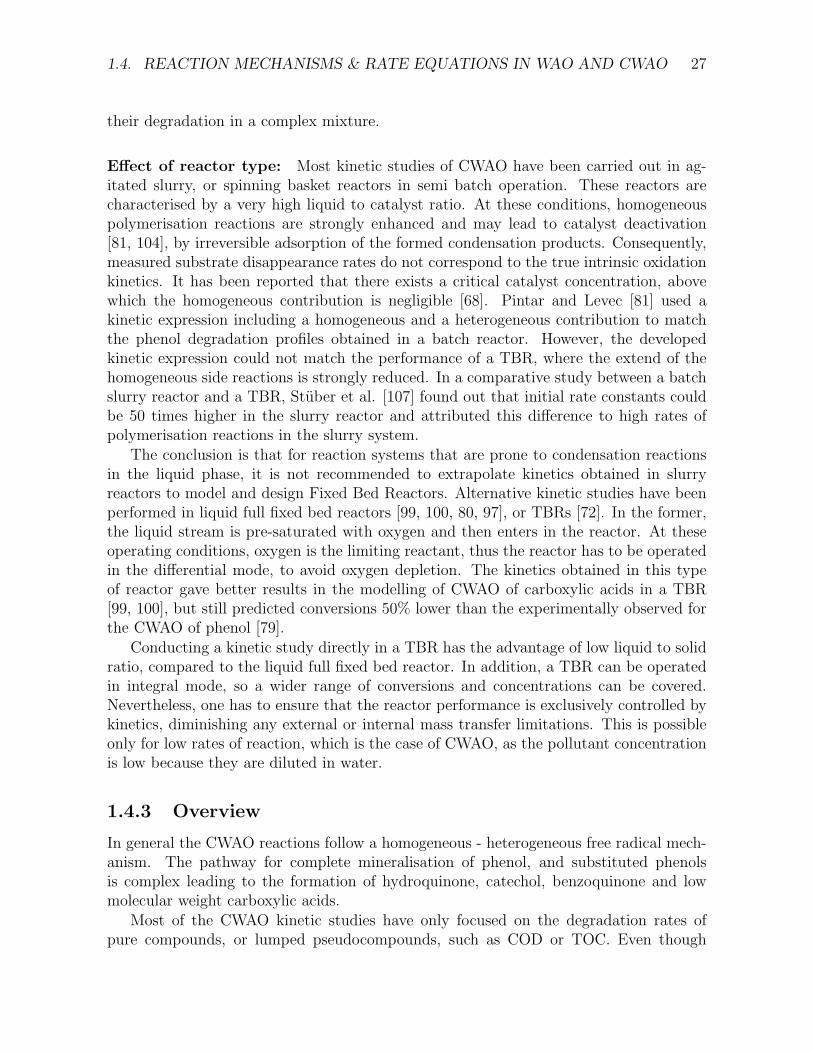
1.4. REACTION MECHANISMS & RATE EQUATIONS IN WAO AND CWAO 27
their degradation in a complex mixture.
Effect of reactor type: Most kinetic studies of CWAO have been carried out in ag-itated slurry, or spinning basket reactors in semi batch operation. These reactors arecharacterised by a very high liquid to catalyst ratio. At these conditions, homogeneouspolymerisation reactions are strongly enhanced and may lead to catalyst deactivation[81, 104], by irreversible adsorption of the formed condensation products. Consequently,measured substrate disappearance rates do not correspond to the true intrinsic oxidationkinetics. It has been reported that there exists a critical catalyst concentration, abovewhich the homogeneous contribution is negligible [68]. Pintar and Levec [81] used akinetic expression including a homogeneous and a heterogeneous contribution to matchthe phenol degradation profiles obtained in a batch reactor. However, the developedkinetic expression could not match the performance of a TBR, where the extend of thehomogeneous side reactions is strongly reduced. In a comparative study between a batchslurry reactor and a TBR, Stuber et al. [107] found out that initial rate constants couldbe 50 times higher in the slurry reactor and attributed this difference to high rates ofpolymerisation reactions in the slurry system.
The conclusion is that for reaction systems that are prone to condensation reactionsin the liquid phase, it is not recommended to extrapolate kinetics obtained in slurryreactors to model and design Fixed Bed Reactors. Alternative kinetic studies have beenperformed in liquid full fixed bed reactors [99, 100, 80, 97], or TBRs [72]. In the former,the liquid stream is pre-saturated with oxygen and then enters in the reactor. At theseoperating conditions, oxygen is the limiting reactant, thus the reactor has to be operatedin the differential mode, to avoid oxygen depletion. The kinetics obtained in this typeof reactor gave better results in the modelling of CWAO of carboxylic acids in a TBR[99, 100], but still predicted conversions 50% lower than the experimentally observed forthe CWAO of phenol [79].
Conducting a kinetic study directly in a TBR has the advantage of low liquid to solidratio, compared to the liquid full fixed bed reactor. In addition, a TBR can be operatedin integral mode, so a wider range of conversions and concentrations can be covered.Nevertheless, one has to ensure that the reactor performance is exclusively controlled bykinetics, diminishing any external or internal mass transfer limitations. This is possibleonly for low rates of reaction, which is the case of CWAO, as the pollutant concentrationis low because they are diluted in water.
1.4.3 Overview
In general the CWAO reactions follow a homogeneous - heterogeneous free radical mech-anism. The pathway for complete mineralisation of phenol, and substituted phenolsis complex leading to the formation of hydroquinone, catechol, benzoquinone and lowmolecular weight carboxylic acids.
Most of the CWAO kinetic studies have only focused on the degradation rates ofpure compounds, or lumped pseudocompounds, such as COD or TOC. Even though
28 CHAPTER 1. INTRODUCTION
sophisticated lumping strategies achieve to model well COD and deactivation kinetics,they miss important information on the pathways prevailing at each conditions, and thedistribution of intermediates of the resulting effluent.
In the modelling of CWAO reactions mainly P-L kinetics, and to a less extend L-H expressions, have been implemented. For the former rate type, first order for thesubstrate is often encountered, while the oxygen order mostly being close to 0.5. However,the applicability of power law kinetics occasionally leads to reaction orders that lackphysical sense (e.g. negative), because of adsorption onto the catalyst surface. Thus thedevelopment of detailed kinetic models, using L-H expressions, should be considered asa priority item in future research work on in the field of CWAO.

1.5. KINETIC MULTIPARAMETER ESTIMATION 29
1.5 Kinetic Multiparameter Estimation
The kinetic parameters presented previously are determined by fitting the rate expressionsto available experimental data, that can be obtained either from batch, CSTR or PlugFlow reactors. For CSTR reactor the value of reaction rate can be directly determined,from the mass balance and the known inlet and outlet concentrations as well as the appliedflow rates. Operation and control of such reactors in three phase catalytic systems canbe complicated and many experiments are necessary to cover a broad conversion range.Batch and plug flow reactors provide concentration profiles versus time for batch reactorand space time for the plug flow reactor. Batch reactors have been mainly used forCWAO kinetic studies, as they can easily handle gas-liquid-solid (catalyst) systems. Forthese reactors an adequate reactor model is used to relate the obtained concentrationprofiles with the reaction kinetics. If no mass transfer limitations exist, and assumingideal batch, or ideal plug flow operation we can obtain Eqs. 1.6 and 1.7 respectively:
dC
dt= −Ccat r (1.6)
dC
dτ= −ρl r (1.7)
The experimental data can then be related to the reaction rate by means of thedifferential or the integral method, which are briefly described below.
1.5.1 Differential Methods
According to the differential method the derivatives dC/dt or dC/dτ are first evaluatedfrom the experimental data and subsequently the reaction rate r is transformed by lin-earisation techniques. For example, the simple P-L rate equation of Eq. 1.4 can belinearised in the following way:
ln(r) = ln(k) + αln(CO2) + βln(Corg) (1.8)
ln(k) = ln(k0)− Ea/RT (1.9)
By plotting ln(r) against substrate and oxygen concentration the unknown kineticparameters k, α and β can be calculated. If data are available at different temperatures,by plotting the ln(k) versus 1/T , to obtain the well known Arrhenius plot, the calculationof the frequency factor and activation energy is possible. For more complex L-H kineticsHougen and Watson proposed an adequate linearisation procedure that is described inchemical reaction engineering textbooks [137, 138].
The advantage of differential methods is that they do not need to define a priori initialguess values for the kinetic parameters. On the other hand, the graphical determinationof the reaction rates and the two step linear regression lead to low precision estimates.Furthermore, they need a minimum calculation effort, thus they were very popular before
30 CHAPTER 1. INTRODUCTION
the computer era. However, this procedure has been criticised, as it may lead to erroneousresults [139, 140]. Thus integral methods, coupled with nonlinear regression techniquesare becoming very popular.
1.5.2 Integral Methods
According to the integral method an adequate rate equation is proposed to integrateEq. 1.6 or 1.7. Then, the involved kinetic parameters are optimised by nonlinear re-gression methods to match experimental concentration profiles. Obviously in this case,a rate equation and additionally initial guess values of kinetic parameter values have tobe postulated and model discrimination is done in terms of the best fit, the statisticalsignificance of the involved parameters and finally their physical sense.
The estimation of kinetic parameters is a very delicate task and its quality dependson how carefully the fitting strategy was planed and executed. Several fitting strategieshave been applied to study WAO or CWAO reactions. The simplest approach, is basedon linearisation techniques as discussed before, has been mainly used in pioneer CWAOstudies as for example those of Sadana and Katzer [91] and that of Baldi et al. [98] and[122, 118, 96, 81].
Because of the continuous improvements in computational power, integral methodscoupled with nonlinear parameter estimation have replaced the differential methods. Inparticular, Gradient-based methods, have been widely employed in nonlinear parameterestimation [141]. Among these methods, the Levenberg-Marquardt (L-M) algorithm, ofa quadratic convergence, is the most commonly used. The major drawback of this al-gorithm is that convergence to local minima frequently occurs when poor initial guessvalues are provided. For example, several thermodynamic parameters included in theDECHEMA data bank, which were obtained by local optimisation methods, were provednot to correspond to the best fit [142]. Although differential methods can be used toprovide initial guess parameters, it is still recommended to test several initial guess pa-rameter. However, finding of a suitable initial guess for all parameters in a complexreaction scheme is a critical, almost impossible task.
In WAO/CWAO studies the L-M, or other gradient methods, also have been widelyemployed to calculate reaction and adsorption parameters [72, 124, 59, 80, 97, 89, 104,103]. To reduce regression complexity, the non-linear regression fitting is often appliedto evaluate the apparent reaction constants for fixed temperature and oxygen partialpressures. Then, the activation energies, the heats of adsorption and the oxygen orderare calculated in a subsequent step by means of conventional linear regression.
If complex reaction networks are considered, the number of involved parameters in-creases drastically. So it is expected that the classical L-M algorithm would fail to reach areliable solution. For this reason, comparison with global optimisation methods should beconsidered. These methods permit to find the global minimum of the objective function,on cost of a significantly higher computational time. The global optimisation approachesuse either deterministic (e.g. [143, 144]) or stochastic (e.g. [145, 146, 147]) methods.Deterministic methods guarantee convergence to the global minimum within the defined

1.5. KINETIC MULTIPARAMETER ESTIMATION 31
parameter space. In general they identify the proximity of all local minima of the ob-jective function, and consequently apply a gradient method to calculate them. However,the algebra behind this process is rather complex, thus, these methods usually requireadvanced programming skills.
The stochastic methods scan randomly the entire parameter space and they theoret-ically converge to the global minimum for infinite number of function evaluations. Themain advantage of these algorithms is that they are less sensitive to the starting guessvalues compared to the classical gradient methods, and present less computational com-plexities. The application of stochastic methods for the estimation of kinetic parametersis scarce. Belohlav et al. [148] and Zamostny and Belohlav, [149] used a random searchalgorithm for the kinetic modelling of hydrogenation reactions. Moros et al. [150] andWolf and Moros [151], used a genetic algorithm to provide initial parameter guess valuesfor the subsequent application of local minimisation methods. Finally, Asprey and Naka,[139] in a review of the current state of art in kinetic parameter estimation, highlightedthe simulated annealing as a powerful algorithm with numerous applications in combina-torial optimisation and as an excellent tool for nonlinear kinetic parameter estimation. Ina more detailed comparison between this latter algorithm and the classical L-M methodEftaxias et al. [152] report that S-A is much more robust and can be used for morecomplex system that the L-M algorithm.
Thus, the inherent problems of the application of local optimisation algorithms tothe modelling of complex reaction networks, can be overcomed by global optimisationmethods. These methods, should not only achieve better mathematical solutions, butalso provide kinetic parameters with statistical significance and physical meaning. How-ever, gradient method application starting from the solution obtained by the stochasticalgorithms has to be considered, because the calculation of the gradients provides usefulinformation about the statistical significance of each of the parameters [153], as well asthe discrimination of rival models which achieve similar fits [154].
1.5.3 Overview
Traditionally kinetic constants were obtained by linearisation techniques. Nevertheless,the continuously increasing computational power makes has made possible the applica-tion of nonlinear parameter estimation methods. The L-M algorithm, which is a gradientbased method has, been widely used for this purpose in the field of WAO/CWAO, aswell as elsewhere. The application of nonlinear parameter estimation methods has beenshown to lead to more reliable estimates. Nevertheless, the classical local minimisationmethods are foreseen to fail in the development of complex reaction networks, thus theirapplication in the development of complex CWAO reaction networks may result prob-lematic. Therefore, the use of global minimisation algorithms should be tested for thedevelopment of such detailed reaction kinetic schemes.

32 CHAPTER 1. INTRODUCTION
1.6 Multiphase Catalytic Reactors
The discovery of solid catalysts and their application to chemical processes in the earlyyears of the twentieth century has led to a breakthrough of the chemical industry [138].Despite the enormous progress in understanding and describing multiphase catalytic re-actors in the last century, successful scale up, i.e. successful transfer of laboratory resultsto the design commercial units is not trivial and is mainly based on empirical approaches[155]. The complexity of the modelling of multiphase reactors comes from the fact thattheir modelling joins phenomena that take place in different length scales. Reaction ki-netics are governed by molecular phenomena, external and internal transport processesare of Eddy or particle scale, while the fluid flow patterns through the reactor occur atthe reactor scale. These phenomena can be described with different degrees of sophis-tication, as shown in Table 1.9 proposed by Dudukovic et al. [156]. Naturally, as thedegree of sophistication increases, it is more time consuming to develop and solve themodel equations. In general, it is recommended to use the same degree of sophisticationfor the different scales involved in the model.
Table 1.9: Levels of multiphase reactor modelling [156]
Molecular (reaction) scaleStriclty empirical Mechanism Based Fundamental-Elementary
Eddy or particle scale transportEmpirical Micromixing models DNS(1) CFD(2)
Empirical part of rate equation Thiele Models Rigorous
Reactor ScaleIdeal Reactors Empirical models Phenomenological models CFD modelsPFR, CSTR Axial dispersion
(1) Direct Numerical Solution (2) Computational Fluid Dynamics
The complexity of multiphase reactor modelling increases when they are used forsolid catalysed reactions between a gaseous and a liquid reactant. This situation is verycommon in industrially relevant processes, such as hydrotreating and hydrogenation [157],but recent works point out the increasing use of multiphase reactors in selective oxidation[158], and wastewater treatment processes, i.e. in the CWAO process [159, 160, 161].
Several reactor types, with different characteristics, can be used to accommodatethe solid catalyst and carry out multiphase catalytic reactions. Therefore, reactor typeselection has to be examined for each reaction system, considering catalyst type, catalystactivity and stability, reactant and product properties and interfering reactions. In thisview, the choice of a suitable reactor for the CWAO process is discussed in the first place.

1.6. MULTIPHASE CATALYTIC REACTORS 33
1.6.1 Reactor Choice for the CWAO
Four main categories of gas-liquid-solid catalytic reactors can be distinguished: agitatedslurry CSTR reactors, sparged catalyst reactors, like slurry bubble column and fluidisedbeds and finally fixed bed reactors. Mechanically agitated slurry reactors exhibit highheat and mass transfer rates, but stirring leads to high investment and operation costsand energy consumption. Furthermore, these reactors have a very low catalyst to liquidratio, thus undesired parallel reactions may be enhanced. Sparged catalyst reactorsexhibit heat transfer rates that are still higher than those of fixed bed reactors, but alsoa higher liquid to catalyst ratio. Furthermore, catalyst particles have to be separatedfrom the exit liquid stream when continuous operation is desired. Fixed bed reactorshave the lowest liquid to catalyst ratio, on cost of lower heat and mass transfer rates.
As it was shown earlier, during the CWAO of certain organic pollutants, like phenols,parallel polymerisation reactions occur when the liquid to catalyst ratio is high [107, 81].For this reason agitated slurry and sparged catalyst reactors do not seem to be adequatefor the CWAO of phenol. On the other hand, as the pollutants are diluted the intrinsicreaction rates are low, thus mass and heat transfer limitations should not be as importantas in the case of pure reaction systems, for example for hydrogenation reactions. Thesefacts suggest that fixed bed reactors are the priority choice for the CWAO of phenol.
There exist three basic modes of operation of gas - liquid - solid fixed bed catalyticreactors, depending on the direction of the gas and the liquid flow, as shown in Fig.1.8. The Trickle Bed Reactor (TBR) is characterised by the cocurent downflow of bothgas and liquid phases (shown in Fig. 1.8a), although the countercurrent operation ofliquid downflow and gas upflow, (Fig. 1.8b) may be advantageous in special cases. Thelast configuration is that of cocurrent gas and liquid upflow, then termed packed bubblecolumn (Fig. 1.8c).
The most frequently used in industry is the TBR as it allows a variety of flow regimesmaking it more flexible. Up flow reactors are used when it is necessary to assure com-plete external wetting of catalyst. Furthermore, they have been shown to permit bettertemperature control for extremely exothermic reactions [162]. Countercurrent operationallows to selectively remove by-products that may inhibit catalyst performance. Thelarge experience on the operation of TBRs in industrial hydrotreatment processes, makesthem the first choice for the performance of CWAO reactions.
1.6.2 Design Parameters of TBRs
In the TBR the liquid flows mainly over the catalyst particles in the form of rivulets,films and droplets. It is generally accepted that the liquid phase can be distinguished indynamic (moving) and static (stagnant) zones, as schematically illustrated in Fig. 1.9.Prior to the reaction that takes place on the external and internal surface of the catalystparticles, the reactants and products have to diffuse from the gas or liquid phase tothe active catalyst sites. Furthermore, the flow rates and the thermophyisical propertiesof the gas and liquid phase, influence the flow patterns, and the degree of backmixingof the liquid phase. Thus, the TBR is a result of complex interactions between the

34 CHAPTER 1. INTRODUCTION
Figure 1.8: Packed bed reactors for gas-liquid-solid catalysed systems. (a) Trickle BedReactor with cocurrent downflow; (b) trickle bed with counrercurrent flow; (c) Packedbubble-flow reactor with cocurrent upflow. [156].
intrinsic reaction kinetics, the multiphase heat and mass transfer and the gas liquidhydrodynamics.
To account for the above phenomena several models have been developed involvingseveral parameters. Such parameters are the catalyst wetting, the liquid holdup, theinterface mass transfer coefficients (gas-liquid, liquid-solid and gas-solid), the intraparti-cle effective diffusion coefficient and the axial dispersion coefficient. These parametersdepend on the hydrodynamic regime of the reactor (ie. the pattern of the gas-liquid flow)and the physical properties of the gas, liquid and solid. These parameters are discussedbelow.
Flow Regimes: Flow regimes are meant to describe the pattern of the two phase flowthroughout the reactor, which considerably influences the hydrodynamic and the transferproperties in the reactor. Several flow patterns have been proposed, and several regimemaps have been reported [164, 165, 138]. The differences between different investigationsare cause by the different conditions and fluids used in each study, especially if foamingfluids are present in the liquid phase. However, for most industrial or laboratory appli-cations of TBRs, with non-foaming liquids, operate in the in the trickle or pulse regime[165]. As already mentioned in the trickle regime the liquid trickles laminarly over thepacking. At higher liquid and/or gas liquid velocities pulsing flow appears, while for lowliquid velocities and high gas velocities the flow is in spray form.
The flow regime studies have been mainly carried at low pressure-temperature con-
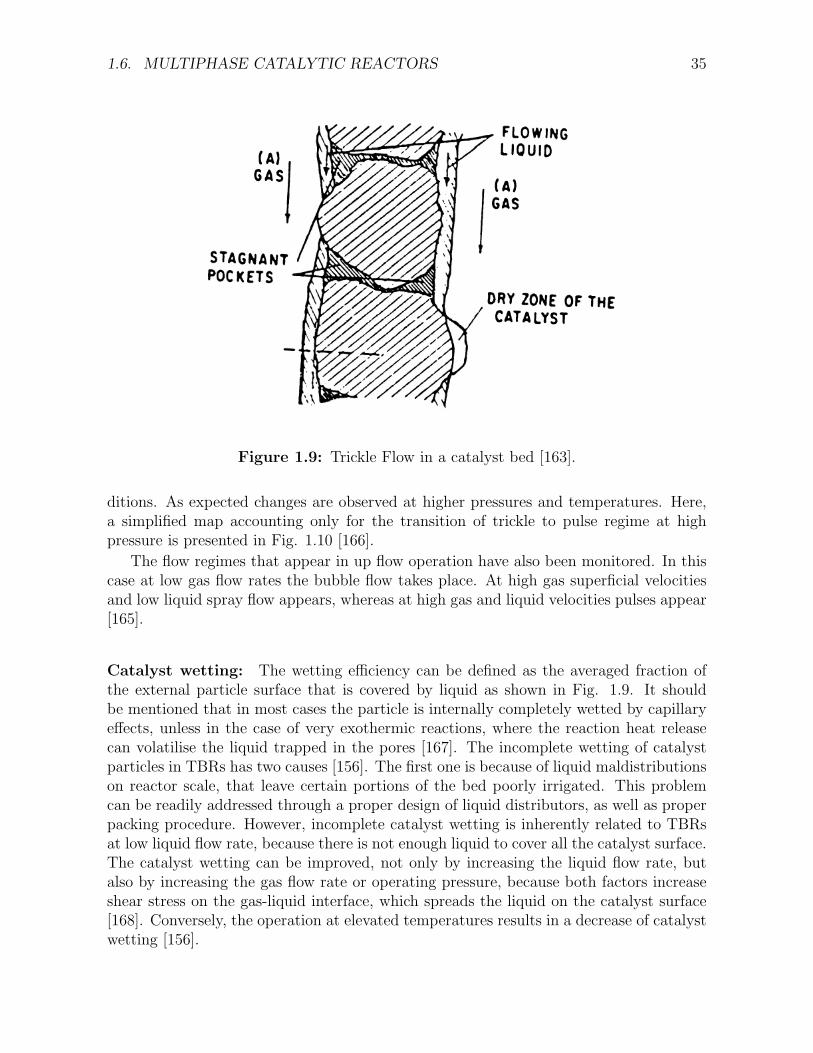
1.6. MULTIPHASE CATALYTIC REACTORS 35
Figure 1.9: Trickle Flow in a catalyst bed [163].
ditions. As expected changes are observed at higher pressures and temperatures. Here,a simplified map accounting only for the transition of trickle to pulse regime at highpressure is presented in Fig. 1.10 [166].
The flow regimes that appear in up flow operation have also been monitored. In thiscase at low gas flow rates the bubble flow takes place. At high gas superficial velocitiesand low liquid spray flow appears, whereas at high gas and liquid velocities pulses appear[165].
Catalyst wetting: The wetting efficiency can be defined as the averaged fraction ofthe external particle surface that is covered by liquid as shown in Fig. 1.9. It shouldbe mentioned that in most cases the particle is internally completely wetted by capillaryeffects, unless in the case of very exothermic reactions, where the reaction heat releasecan volatilise the liquid trapped in the pores [167]. The incomplete wetting of catalystparticles in TBRs has two causes [156]. The first one is because of liquid maldistributionson reactor scale, that leave certain portions of the bed poorly irrigated. This problemcan be readily addressed through a proper design of liquid distributors, as well as properpacking procedure. However, incomplete catalyst wetting is inherently related to TBRsat low liquid flow rate, because there is not enough liquid to cover all the catalyst surface.The catalyst wetting can be improved, not only by increasing the liquid flow rate, butalso by increasing the gas flow rate or operating pressure, because both factors increaseshear stress on the gas-liquid interface, which spreads the liquid on the catalyst surface[168]. Conversely, the operation at elevated temperatures results in a decrease of catalystwetting [156].

36 CHAPTER 1. INTRODUCTION
Figure 1.10: Effect of pressure and physical properties on trickle-to-pulse flow regimetransition: (a) water/nitrogen and water/helium systems; (b) water/nitrogen system(continuous lines) and ethyleneglycol/nitrogen system (dotted lines). Lines represent thetrends. (Taken from the review of: [166]).
The degree of catalyst wetting will have a significant effect on the achieved conversionand may condition the reactor operation. If the limiting reactant is in the liquid phasecomplete wetting enhances conversion, whereas, if the limiting reactant is in the gas phase,an incomplete wetting gives higher conversions [166]. To allow for complete wetting atgiven operating conditions of the TBR there are two possible options. 1) to operate thereactor in upflow mode and 2) to dilute the catalyst bed with fines [169]. In the formercase the complete wetting is guaranteed as the reactor is flooded with liquid and whenthe reactor operates in the bubble flow regime the gas is flowing dispersed in the form ofsmall bubbles. The latter option may not lead to 100% wetting at low liquid flow rates[170], but it has been shown that both configurations can yield similar conversions [169].
The comparison between upflow and down flow configuration for either gas or liq-uid reactant limitation is exemplarily shown in Fig. 1.11 for the hydrogenation of α-methylstyrene over Pd/γ−Al2O3. Under gas limited conditions (low hydrogen pressure)down flow operation with partial catalyst wetting resulted to higher α-methylstyrene con-versions. This behaviour is inverted at higher hydrogen pressure, where the reaction turnsliquid reactant limited and up-flow mode, results to higher conversions [169]. Khadilkaret al. [171] proposed a simple criterion to diagnose the operation mode that will achievehigher conversions. These authors defined the γ reactant flux ratio as follows:
γ =Deff
L CL
νDeffg Cg
(1.10)
Where Deff is the effective diffusion coefficient of the reactant in the catalyst particle,C is the concentration, ν the stoichiometric coefficient and g and L correspond to thegas and liquid phase respectively. According to Khadilkar et al. [171], when γ � 1, thereaction is gas-reactant limited and downflow mode is preferred, in terms of conversion.

1.6. MULTIPHASE CATALYTIC REACTORS 37
Figure 1.11: Comparison of conversion (X) at different space times tsp between trickle-bed and upflow performance for the hydrogenation of α-methylstyrene to cumene over aPd/γ − Al2O3 catalyst: (a) Gas-limited reaction; (b) liquid-limited reaction [169].
Conversely, for γ � 1, the system turns to liquid-reactant limited and the preferredoperation mode is downflow. This criterion successfully applied in situations were bothupflow and downflow operation had been tested.
Although the achievement of high reaction rates is usually desired, in certain situationsthis is not the case. For strongly exothermic reactions the reaction rate increase results tohigher temperature rise in trickle bed operation, which can lead to temperature runaway[167], while upflow operation allows for better temperature control [162, 172, 173, 174].For complex reactions, the final product distribution can also be affected by the operationmode and strategy. Stuber and Delmas [174], suggested a multistage upflow operationfor the optimisation of the selectivity, while Chaudhari et al. [173], considering a singlestage process, obtained higher selectivities in downflow operation.
Liquid hold up and pressure drop: The total liquid holdup is defined as the external(interparticle) and internal (intraparticle) fraction of the total volume of the reactoroccupied by the liquid phase. For reasons of simplicity the external holdup will be simplytermed as the liquid holdup. Liquid holdup can be further distinguished in dynamic andstatic holdup. The former corresponds to the liquid portion that flows through thereactor, while the latter is the stagnant liquid trapped in the void sections between theparticles. Pressure drop is related to liquid holdup as the latter determines the effectivevoid fraction, which is available for the gas phase, in the reactor. Dudukovic et al. [156]gave an excellent review of the qualitative dependence of liquid hold up and pressuredrop on operating conditions. Some of the most interesting trends are the following:
• At a given gas density, the two-phase pressure drop increases with gas and liquidmass fluxes, superficial velocities and liquid viscosity. Liquid holdup increases with

38 CHAPTER 1. INTRODUCTION
liquid mass flux and superficial velocity and liquid viscosity, but decreases withincreasing gas mass flux or superficial gas velocity.
• At given superficial velocities and as gas density is increased, the pressure dropincreases while the liquid holdup decreases. When the pressures of gases of differentmolecular weights are set to have equal densities, identical pressure drops occur forthe same fluid throughputs.
• Liquid holdups in PBCs in bubble flow are greater than in TBRs in trickle flow,whereas in pulse flow, they tend to be quite close in values. For design purposes,both the PBC and TBR can be treated as hydrodynamically similar in the pulseflow regime.
Liquid phase backmixing: Axial mixing can influence TBR performance in benchand pilot plant TBRs although they usually do not affect significantly performance ofcommercial units [163]. To account for axial dispersion the piston dispersion, or the pistondispersion-exchange model have been employed. The piston dispersion model considersthat that the processes provoking backmixing exhibit the same functional relationshipas the Fick Law [191]. However, the residence time distribution measurements in tricklebeds have been described more realistically by the piston dispersion exchange modelassumes mass transfer between dynamic liquid and stagnant zones [191, 177].
Mears (cited in [191, 157]) developed criteria for the estimation of axial dispersioneffects. According to these criteria, the required reactor length, (L), to particle diameter,dp, to hold the reactor length within a 5% of that calculated assuming ideal plug flow is:
L
dp
=20n
PeL
lnCfeed
Cexit
(1.11)
where PeL = dp ul/DadL , uL the liquid superficial velocity, Dad the axial dispersion coef-
ficient and n the reaction order. Gianetto and Specchia [157] state that for beds around20 times longer than the catalyst pellet size axial dispersion may be negligible.
Interphase mass transfer coefficients: Prior to the surface reaction, interphase masstransfer (also termed External diffusion) has to take place to bring the reactants to thecatalyst particle. In agreement with Fig. 1.9 these interphase resistances can occur in thetransport from gas to liquid, from liquid to solid, from gas to solid and from dynamic tostatic liquid. To model the mass transfer between phase mainly the simple 2 film theoryhas been used. This model locates all the resistances to the mass transfer in a smallinterphase layer and defines a mass transfer coefficient that correlates the concentrationdifference to the mass flux across the interphase.
For the gas to liquid resistance it can be written:
1
KLai
=1
Hkgai
+1
kLai
(1.12)

1.6. MULTIPHASE CATALYTIC REACTORS 39
Were KL, kg and kL are the overall, the gas side and the liquid side mass transfercoefficients, ai is the gas-liquid specific interphase area H being the Henry constant.
For sparingly soluble gases, like oxygen in water, Hkgai is reported to be at least oneorder of magnitude larger than kLai at the given gas and liquid rates used in TBRs [175].Thus the overall coefficient is approximately equal to the liquid side coefficient, which isthus the limiting step in the mass transfer between the gas and the liquid phase. At agiven gas density, liquid side volumetric mass transfer coefficient increases with increasinggas and liquid flow rates, as well as with increasing gas density [156].
Similarly, the liquid-solid mass transfer has been modelled in terms of the externalcatalyst surface as and a mass transfer coefficient ks. ks increases with increasing liquidsuperficial velocity, as can be judged from the correlations available in the literature[165, 166, 156]. However, these correlations do not state effect of the gas flow on ks.On the other hand, the dependence of ks on pressure is not yet understood and futureresearch work should address this open aspect [156]. For upflow operation, Stuber et al.[176] have shown that liquid solid mass transfer coefficient at high pressures increasesalso with gas velocity, at very low liquid velocities.
For incomplete wetting, direct gas to solid mass transfer is sought to be very fastcompared to the other mass transfer resistances, thus Herskowitz and Smith [175] suggestto consider equilibrium concentration on the gas-solid contact surface.
The criteria encountered in the literature for the detection of significant externalmass transfer limitations compare the volumetric mass transfer rate to the reaction rate[191, 165, 138, 157]. When the true reaction rates are not a priori known, these criteriacan be expressed in terms of the experimentally observed reaction rate (robs) that canbe obtained for example by initial reaction rate measurements. It is generally acceptedthat there are no significant external mass transfer limitations if the following inequalitieshold, both for gas-liquid (gl) and liquid-solid (ls) resistances:
αgl =robsρb
(kgla)C< 0.05 (1.13)
αls =robsρb
(klsas)C< 0.05 (1.14)
where C is the concentration of the limiting reactant in the liquid phase.
Intraparticle diffusion: Intraparticle diffusion (also termed as internal diffusion) ofreactants and products occurs in the catalyst pores. To account for internal diffusion aneffectiveness factor η can be defined as the ratio of the observed (apparent) reaction ratefor a catalyst particle, to the reaction rate that would be obtained if the concentrationof the reactants in the entire particle were those at the particle surface. In the past,several analytical approximations have been developed for the calculation of η [165, 175].Nonetheless, the increasing computational capacity of the current computers makes moreattractive the numerical solution of the simultaneous diffusion-reaction equation for thecatalyst particle [138], given below for spherical catalyst particles:
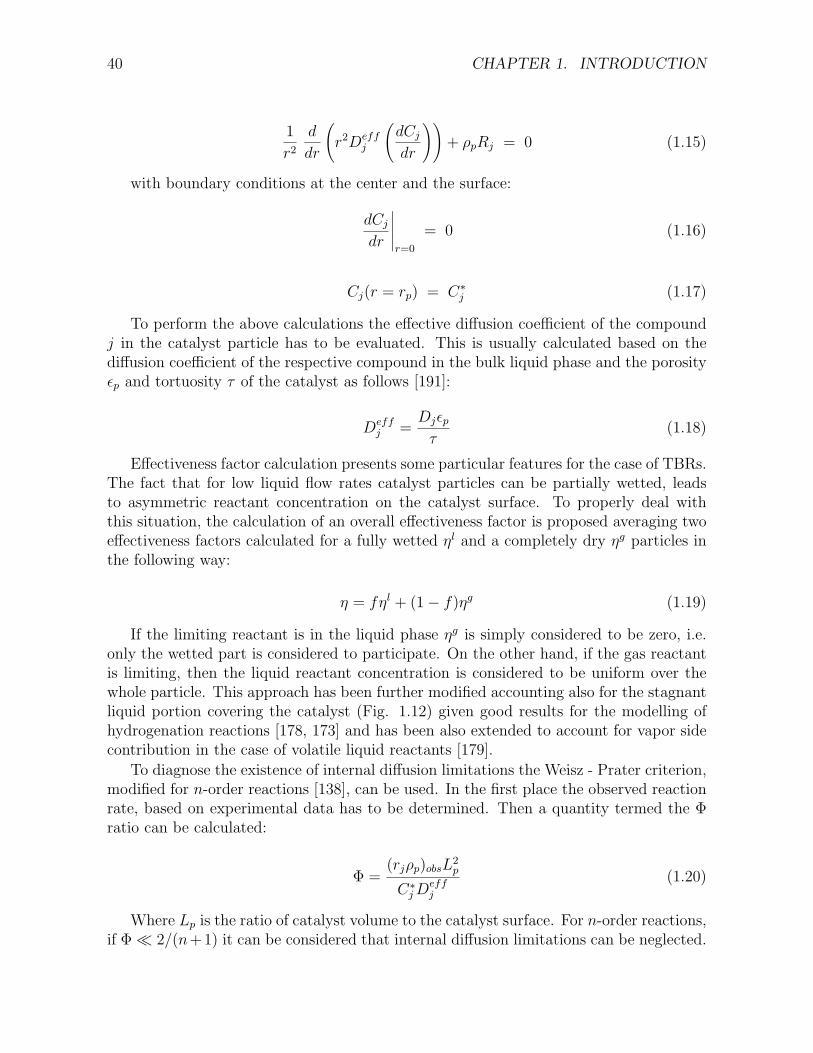
40 CHAPTER 1. INTRODUCTION
1
r2
d
dr
(r2Deff
j
(dCj
dr
))+ ρpRj = 0 (1.15)
with boundary conditions at the center and the surface:
dCj
dr
∣∣∣∣∣r=0
= 0 (1.16)
Cj(r = rp) = C∗j (1.17)
To perform the above calculations the effective diffusion coefficient of the compoundj in the catalyst particle has to be evaluated. This is usually calculated based on thediffusion coefficient of the respective compound in the bulk liquid phase and the porosityεp and tortuosity τ of the catalyst as follows [191]:
Deffj =
Djεp
τ(1.18)
Effectiveness factor calculation presents some particular features for the case of TBRs.The fact that for low liquid flow rates catalyst particles can be partially wetted, leadsto asymmetric reactant concentration on the catalyst surface. To properly deal withthis situation, the calculation of an overall effectiveness factor is proposed averaging twoeffectiveness factors calculated for a fully wetted ηl and a completely dry ηg particles inthe following way:
η = fηl + (1− f)ηg (1.19)
If the limiting reactant is in the liquid phase ηg is simply considered to be zero, i.e.only the wetted part is considered to participate. On the other hand, if the gas reactantis limiting, then the liquid reactant concentration is considered to be uniform over thewhole particle. This approach has been further modified accounting also for the stagnantliquid portion covering the catalyst (Fig. 1.12) given good results for the modelling ofhydrogenation reactions [178, 173] and has been also extended to account for vapor sidecontribution in the case of volatile liquid reactants [179].
To diagnose the existence of internal diffusion limitations the Weisz - Prater criterion,modified for n-order reactions [138], can be used. In the first place the observed reactionrate, based on experimental data has to be determined. Then a quantity termed the Φratio can be calculated:
Φ =(rjρp)obsL
2p
C∗j D
effj
(1.20)
Where Lp is the ratio of catalyst volume to the catalyst surface. For n-order reactions,if Φ � 2/(n+1) it can be considered that internal diffusion limitations can be neglected.
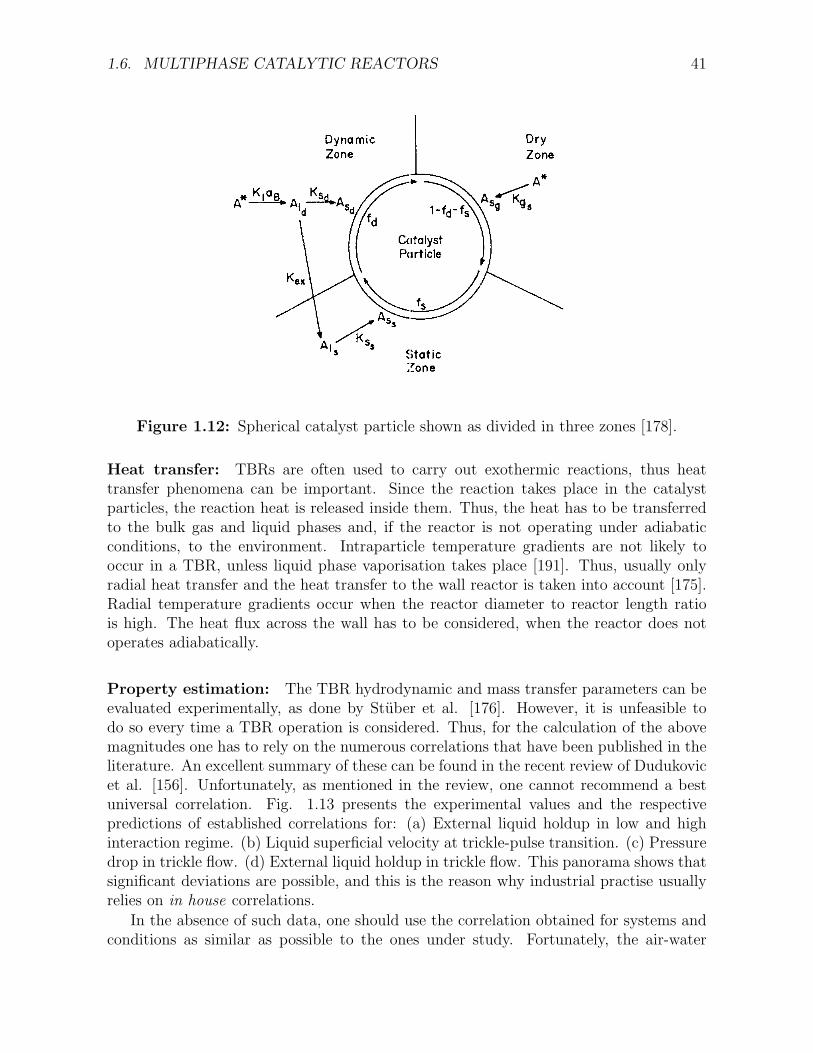
1.6. MULTIPHASE CATALYTIC REACTORS 41
Figure 1.12: Spherical catalyst particle shown as divided in three zones [178].
Heat transfer: TBRs are often used to carry out exothermic reactions, thus heattransfer phenomena can be important. Since the reaction takes place in the catalystparticles, the reaction heat is released inside them. Thus, the heat has to be transferredto the bulk gas and liquid phases and, if the reactor is not operating under adiabaticconditions, to the environment. Intraparticle temperature gradients are not likely tooccur in a TBR, unless liquid phase vaporisation takes place [191]. Thus, usually onlyradial heat transfer and the heat transfer to the wall reactor is taken into account [175].Radial temperature gradients occur when the reactor diameter to reactor length ratiois high. The heat flux across the wall has to be considered, when the reactor does notoperates adiabatically.
Property estimation: The TBR hydrodynamic and mass transfer parameters can beevaluated experimentally, as done by Stuber et al. [176]. However, it is unfeasible todo so every time a TBR operation is considered. Thus, for the calculation of the abovemagnitudes one has to rely on the numerous correlations that have been published in theliterature. An excellent summary of these can be found in the recent review of Dudukovicet al. [156]. Unfortunately, as mentioned in the review, one cannot recommend a bestuniversal correlation. Fig. 1.13 presents the experimental values and the respectivepredictions of established correlations for: (a) External liquid holdup in low and highinteraction regime. (b) Liquid superficial velocity at trickle-pulse transition. (c) Pressuredrop in trickle flow. (d) External liquid holdup in trickle flow. This panorama shows thatsignificant deviations are possible, and this is the reason why industrial practise usuallyrelies on in house correlations.
In the absence of such data, one should use the correlation obtained for systems andconditions as similar as possible to the ones under study. Fortunately, the air-water
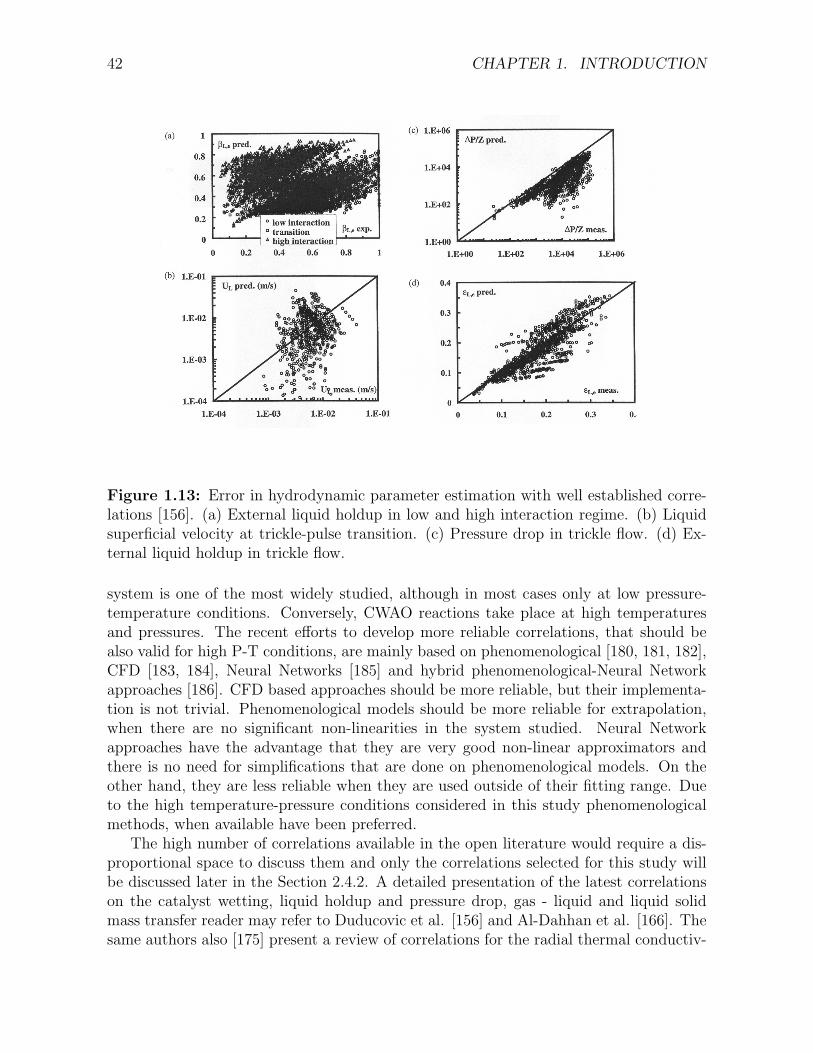
42 CHAPTER 1. INTRODUCTION
Figure 1.13: Error in hydrodynamic parameter estimation with well established corre-lations [156]. (a) External liquid holdup in low and high interaction regime. (b) Liquidsuperficial velocity at trickle-pulse transition. (c) Pressure drop in trickle flow. (d) Ex-ternal liquid holdup in trickle flow.
system is one of the most widely studied, although in most cases only at low pressure-temperature conditions. Conversely, CWAO reactions take place at high temperaturesand pressures. The recent efforts to develop more reliable correlations, that should bealso valid for high P-T conditions, are mainly based on phenomenological [180, 181, 182],CFD [183, 184], Neural Networks [185] and hybrid phenomenological-Neural Networkapproaches [186]. CFD based approaches should be more reliable, but their implementa-tion is not trivial. Phenomenological models should be more reliable for extrapolation,when there are no significant non-linearities in the system studied. Neural Networkapproaches have the advantage that they are very good non-linear approximators andthere is no need for simplifications that are done on phenomenological models. On theother hand, they are less reliable when they are used outside of their fitting range. Dueto the high temperature-pressure conditions considered in this study phenomenologicalmethods, when available have been preferred.
The high number of correlations available in the open literature would require a dis-proportional space to discuss them and only the correlations selected for this study willbe discussed later in the Section 2.4.2. A detailed presentation of the latest correlationson the catalyst wetting, liquid holdup and pressure drop, gas - liquid and liquid solidmass transfer reader may refer to Duducovic et al. [156] and Al-Dahhan et al. [166]. Thesame authors also [175] present a review of correlations for the radial thermal conductiv-

1.6. MULTIPHASE CATALYTIC REACTORS 43
ity and the wall heat transfer. Herskowitz and Smith [175] present several correlationsfor the calculation of the Peclet number, while Iliuta et al. [192] present data for theincorporation of the effect of the stagnant zones in the modelling of backmixing.
1.6.3 Trickle Bed Reactor Modelling
As already shown in Table 1.9 TBR models with different degrees of sophistication canbe developed. The simplest approach is to neglect all mass transfer resistances andconsider a pseudohomogeneous approach as proposed by Froment and Bischoff for packedbed reactors [138]. However, one has to take care to adequately adjust gas reactantconcentration in the liquid phase, to be in equilibrium with the gas phase. The modelequation is given by:
d(uL Cj)
dz−Rj ρb = 0 (1.21)
Where the uL is the liquid superficial velocity, ρb is the bed density and Rj the overallreaction rate of the compound j, which for complex reaction networks is given by thesum of all the reaction rates ri in which the compound j participates.
The assumption that mass transport is faster than chemical reaction does not holdin laboratory and industrial reactors with highly active catalysts. Thus, external andinternal resistances have to be incorporated in the model as well as axial dispersioneffects. Depending on the particularities of each case study, several models, characterisedby progressing complexity, have been proposed [99, 164, 187, 165, 157, 178].
Of special interest for the modelling of CWAO process is the model developed by Gotoand Smith [99] for the catalytic oxidation of formic acid. This isothermal one-dimensionalmodel accounts for gas-liquid-solid external mass transfer, internal diffusion limitationsand axial dispersion phenomena. The model is given by the following equations:
Reaction kinetics:
−RO2 = kO2 η CFACO2 (1.22)
Oxygen balance in the gas phase:
ugd(CO2)g
dz+ (kLag)O2 [(CO2)g/HO2 − (CO2)L] = 0 (1.23)
Oxygen balance in the liquid phase:
εlDadO2
d2(CO2)L
dz2− uL
d(CO2)L
dz+ (kLag)O2 [(CO2)g/HO2 − (CO2)L]−
(ksas)O2 [(CO2)L − (CO2)s] = 0 (1.24)
Formic acid balance in the liquid phase:
εl(DadFA
d2(CFA)L
dz2− uL
d(CFA)L
dz− (ksas)FA[(CFA)L − (CFA)s] = 0 (1.25)

44 CHAPTER 1. INTRODUCTION
Liquid particle mass transfer for Oxygen:
(ksas)O2 [(CO2)L − (CO2)s] = (−rFA) (1.26)
Liquid particle mass transfer for formic acid:
(ksas)FA [(CO2)L − (CFA)s] = (−rFA) (1.27)
The model does not consider the partial wetting, although it has been proven thatthe models that incorporate the effect of partial wetting perform better [188].
As TBRs are often used for highly exothermic reactions like hydrogenation or oxida-tion, the energy balance is required to determine the variation of the reactor tempera-ture. A general approach, here modified to account for multiple reaction systems andheat transfer across the reactor wall, is given by Gianetto and Speccia [157]:
−λd2T
dz2+ (ulρlcpl + ugρgcpg)
dT
dz=∑
rappi (−∆Hi)−
4 Uw (Tb − Tw)
dr
(1.28)
Eq. 1.28 assumes that interface heat transfer is very fast, so that all phases havethe same temperature. However, for extremely exothermic cases, temperature gradientsbetween gas/liquid and solid phases can exist, and they should be incorporated in themodel [189, 190].
Equation 1.28 does not account for the effect of liquid phase evaporation, which canbe significant for the CWAO conditions. Van Gelder et al. [193] proposed two differentapproaches to quantify the solvent evaporation effect. The first one postulates that thegas phase is saturated with solvent vapor. Then, the amount of vapor that has to beevaporated is calculated to satisfy the vapor liquid equilibria for the given conditions.The other approach considers a liquid to gas flux, with a sufficiently volumetric masstransfer coefficient. Then, taking the vapor pressure of the solvent at the gas liquidinterface equal to the saturated vapor pressure, the evaporating flux can be calculated.The latter approach requires less computational time because of a simplified numericaltreatment.
It should be pointed out that the above discussion is limited to one dimensionalapproaches that are valid for reactors with high length to diameter ratio, or when thereaction is not highly exothermic. When this is not the case, as it can be in someindustrial applications, the use one-dimensional models is not recommended [194].
1.6.4 Applications of TBRs in CWAO
The vast majority of CWAO studies, discussed in previous sections, deals with catalystperformance and reaction kinetics aspects. Less studies have focused on CWAO reactoroperation, design and modelling. The studies of Tukac and Hanika [19], Tukac et al.[195], Santos et al. [68, 69] and Stuber et al. [107] focused on experimental observationsof the TBR performance. The studies of Smith and co-workers [99, 100], Pintar et al. [79]
1.6. MULTIPHASE CATALYTIC REACTORS 45
Figure 1.14: Phenol conversion (x) and wetting efficiency (ηc) vs liquid hourly spacevelocity. Temperature 168oC , gas flow rate 38 L/H and total pressure 5 MPa. (◦)random-packed bed, (•) bed diluted with fines [195].
and Maugans and Akgerman [196] propose TBR models and compare their predictionsto experimental observations. Finally, Larachi et al. [197] and Iliuta and Larachi [198]compared different gas - liquid - solid reactors by numerical simulations. The majorfindings of these studies are summarised below:
Experimental Observations: Non-idealities in TBRs operation during CWAO reac-tions have been reported by Tukac and Hanika [195], Tukac et al. [19] and Santos et al.[68]. The former studies [195, 19] reported that phenol conversion could decrease withincreasing residence time and attributed this fact to the insufficient wetting of the cata-lyst particles. These non-idealities disappeared when they diluted the catalyst bed withinert fines, to increase catalyst wetting. Nonetheless, the obtained conversions were stillto the obtained without catalyst dilution with fines, as shown in Fig.1.14. The authorsjustified this behaviour because of the enhanced oxygen mass transfer from the gas phaseto the catalyst particle through the wet surface.
Santos et al. [68] performed experiments at different catalyst concentrations (i.e.catalyst dilution with inert particles of the same size) in a fixed bed up-flow reactor.They report the existence of a critical catalyst concentration, above which the reactionrate is of first order dependent on catalyst weight. For lower catalyst concentrations, theapparent reaction rate is no longer proportional to the catalyst concentration becausethe homogeneous contributions to the apparent reaction rate become significant.

46 CHAPTER 1. INTRODUCTION
Non-isothermal operation in CWAO reactors has been also studied by Tukac andHanika [19]. These authors used an adiabatic TBR to oxidise a 5 g/L aqueous phenolsolution. Adiabatic operation should give a temperature rise of 39oC at complete phenolconversion. Experimentally, the conversion achieved was 25%, thus a temperature rise of10oC should be expected. Although it could be expected that the temperature rise shouldbe lower, due to evaporation effects, it was found to be even higher than the expected,taking a value of 13oC. This contrasts the observations for non catalytic WAO where theATR in the reactors is significantly affected by water evaporation [38].
Modelling: Up to date only a few studies have been published aiming to predict inte-gral reactor performance [99, 100, 79, 196]. Smith and co-workers modelled the oxidationof formic acid [99] and acetic acid [100] in a TBR. The reaction kinetics used in thesestudies were previously obtained operating the same reactor in a differential mode, i.e.with low catalyst loading. The reactor model they used is given by eq.1.22 - 1.27:
The respective gas to liquid and liquid to solid mass transfer coefficients were obtainedby correlating experimental data at 25oC and 0.1 MPa and can be found in [215].The plug flow model was also considered by neglecting the axial dispersion terms. Forthe CWAO of formic acid [99], both models performed well giving errors between 0%and 5% with respect to experimental observations. As model predictions systematicallyoverpredicted conversion the authors argued that these are caused by errors in physicalproperty estimations, rather than inadequacy of the model. The relative importance oftransport resistances according to this model, in decreasing order was: gas to liquid,intraparticle diffusion, liquid to particle and axial dispersion. The authors consideredthe fact that gas to liquid resistance was more important than intraparticle diffusion asa characteristic of TBR type. For the CWAO of acetic acid [100] higher deviations wereobserved at low liquid flow rates, which the authors attributed to channelling effects.
Pintar et al. [79] used the same model for the CWAO of phenol in a TBR. They usedLangmuir Hinshelwood kinetics obtained from experiments in a differential liquid fullpacked bed reactor [80], with no internal diffusion resistances. Although they calculatedthe wetting efficiency between 0.6 and 0.7, they did not account for it in the model. Theirsimulations predicted phenol conversions more than 50% lower than the experimentalones. This could not be justified by simple mass transfer limitations, because even whenthey neglected all mass transfer resistances model prediction remained almost unaffected.To match experimental concentrations they multiplied the frequency factor of the rateequation by a factor of 3. According to the authors, this can be justified because thedirect contact between gaseous oxygen and the catalyst, produces an increase in thenumber of active sites of the catalyst.
Very recently, Maugans and Akgerman [196], presented a TBR model for the CWAO,accounting for external and internal diffusion resistances and catalyst deactivation, al-though the reasons of the latter were not investigated. The reaction kinetics they usedwere previously obtained in a slurry reactor and the model performed well and the ob-tained profiles match experimental observations. It is interesting to note that in this casethe batch kinetics were successfully transferred to the fixed bed reactor, contrary to the
1.6. MULTIPHASE CATALYTIC REACTORS 47
case of Pintar and Levec [80] and Stuber et al. [107].The issue of reactor screening has been attended from a theoretical standpoint.
Larachi et al. [197] and Iliuta and Larachi [198] modelled the performance of differentreactor types with non-deactivating and deactivating catalysts for the CWAO of phenol.They considered four different reactor types, namely Trickle Bed Reactor (TBR), PackedBubble Column (PBC), Slurry Bubble Column (SBC) and Fluidised Bed (FLB). In allsimulations the effectiveness factor was calculated by solving the diffusion-reaction equa-tion in the pellet. The TBR and PBC model equations were an extension of Equations1.23-1.27, with the incorporation of the transient terms, as well as the effect of masstransfer from the dynamic liquid to the stagnant liquid. For the SBC an additional equa-tion was added to account for the longitudinal distribution of the solids. The simulationresults indicated that under the conditions studied, the PBC outperforms the TBR, be-cause the reaction conditions CAWO was liquid reactant limited so partial wetting isharmful. Further they state that higher conversions can be achieved if the feed is dilutedbefore it enters in the reactor. Finally, it was shown that the TBR and the PBC wereless prone to catalyst deactivation, while the SBC suffered more severe deactivation thanthe FLB.
1.6.5 Overview
Trickle Bed Reactors have been widely used in the chemical industry, to bring in contactgas and liquid reactants over a solid catalyst, so they are expected to play an importantrole for the industrial application of CWAO. The modelling of these reactors is not trivialand effects occurring in molecular, pellet and reactor scale should be joint in an adequatemodel. The studies dealing with the CWAO reactor performance outline the importanceof the gas liquid mass transfer resistance. Thus, it seems that the effect of catalystwetting has to be taken into account in the modelling of CWAO processes. Finally, theissue of adiabatic operation in CWAO has not received attention, despite its significancein process economics as pointed out for the well established WAO process.

48 CHAPTER 1. INTRODUCTION
1.7 Conclusions
At the end of this literature review, we are able to extract some conclusions that arerelevant for the work on the CWAO of organic pollutants. First it can be said that theneed for effective wastewater recycling has strongly reinforced the research on low costpollution abatement methods, since the existing techniques cannot offer a global solution.Among the emergent alternative processes, the CWAO process was found to be effectivefor the treatment of several pollutants like phenols, substituted phenols, carboxylic acids,ammonia, as well as industrial effluents like kraft process liquor and alcohol distillerywastewater at moderate temperatures (100-200oC ) and pressures (0.1-5 MPa).
Up to date, industrial scale application of this process is limited mainly because ofcatalyst deactivation problems and high catalyst costs. The recent development of sta-ble catalysts is expected to realm interest for the process. Among the most promisingcatalysts, active carbon offers a less expensive alternative with a proven activity in theabatement of several phenol like compounds. Such pollutants are of special interest, be-cause they are increasingly encountered in effluents that cannot be treated in conventionalbiological treatment plants.
The pathways leading to the complete mineralisation of the treated pollutants duringWAO or CWAO processes are complex and far from being well understood. For phenolit has been shown that it is firstly oxidised towards toxic ring compounds, which conse-quently yield low molecular weight carboxylic acids. Due to the toxicity of the aromaticcompounds formed in the first step of phenol degradation, it is important to monitortheir production and destruction for the catalysts used.
Kinetic models for CWAO help to understand the elementary mechanisms of the re-action and can be consequently used for process design and optimisation. Kinetic modelsusually account only for the studied compound degradation rates or lumps of compounds.These models can be useful in predicting COD destruction profiles, but they miss im-portant information concerning the exact composition of the treated effluent. Thus, thedevelopment of detailed kinetic models, accounting for the main partial oxidation in-termediate products is an emerging aspect of future research work. In addition, thesedetailed models include more physical features of the reacting system and should be ableto better describe the behaviour of the system for a wider range of conditions. Eventu-ally, they can be used to select better mineralisation selectivity as well as to minimisetoxic compound production. Existing tools for kinetic parameter estimation may not bepowerful enough for the modelling of such complex reaction networks, so the applicationof more robust algorithms has to be considered.
It becomes evident from the literature that process engineering studies, althoughrequired for process design - optimisation, and scale-up, are still extremely scarce inthe field of CWAO. Furthermore, the recent trend is to simultaneously develop processchemistry and engineering. The important question of the choice of an adequate CWAOreactor configuration is not trivial and the answer depends on numerous factors. However,in the case of the organic wastewater pollutants, like phenolic compounds, that are proneto undergo homogeneous condensation reactions, the TBR seems to be the priority reactor

1.7. CONCLUSIONS 49
candidate, providing a very low liquid to catalyst ratio and partial catalyst wetting. Thelatter characteristics are sought to reduce homogeneous condensation reactions and toenhance the reactor performance of three phase systems, that suffer from gas - liquidmass transfer limitations. Only comprehensive diffusion - reaction models can describethe complex nature of the such systems and provide thereby useful tools for the designand scale up of CWAO processes. The renewed interest in CWAO should be the incentivefor more in depth studies to model the interactions of reaction kinetics, hydrodynamicsand heat and mass transfer occurring in multiphase processes. Especially, the study ofnon-isothermal CWAO has received extremely few attention. As in the case of the wellestablished WAO, process energetic requirements are of outmost importance for processeconomics. However, this issue is impossible to correctly address up to date becausethere is a lack of data obtained in non-isothermal conditions. Additional non-isothermalexperiments and modelling have to be conducted to assess useful information and torespond to this open aspects of CWAO.

50 CHAPTER 1. INTRODUCTION
1.8 Objectives
According to the conclusions extracted from the literature review, a combined assessmentof the process chemistry and engineering aspects is desirable for the proper establishmentof catalytic multiphase reaction systems such as the CWAO. To follow this emerging con-cept, we have concentrated the process analysis of the CWAO of phenol on three key issuesinherent to solid catalysed multiphase reaction system: catalyst choice, detailed kineticstudy and reliable reactor modelling to guide process design and scale up. Although itwas impossible to treat all of the three topics in the same extend, we attempt to meetwith our main goal, that is the development of an economic and effective treatment forthe remediation of organic loaded wastewater effluents. In particular we formulated thefollowing specific tasks related to our main goal.
1. The choice of adequate reactor and catalyst is aiming to:
• Obtain experimentally in a TBR the dependence of phenol degradation withspace time for an AC catalyst, under conditions of steady catalyst activity.
• Compare the performance of AC with that of the CuO/γ − Al2O3 catalyst,through experimental observations obtained in the same reactor and in thesame range of liquid flow rates.
• Define and adequate continuous reactor type and study the influence of thereactor operation mode on the obtained phenol conversion and intermediatecompounds formed.
2. The complex kinetic modelling is dedicated to:
• Identify the main intermediates formed during the process and monitor theirevolution.
• Consider the implementation of stochastic algorithms for the development ofkinetic models for complex reaction networks.
• Develop kinetic models accounting for the complex reaction pathways followedin the CWAO of phenol over AC and CuO/γ − Al2O3 catalysts.
3. The detailed reactor modelling is done to:
• Develop a transport - reaction TBR model, accounting for reactor hydrody-namics, mass transfer and and non-isothermal operation.
• Implement the complex kinetic model and validate the TBR model with theexperimental data available.
• Simulate the scale up of a TBR for the CWAO of phenol.

Chapter 2
Methodology
This chapter describes in detail the experimental methods used, as well as the modelsdeveloped in this work, to study the CWAO of phenol. A laboratory scale TBR, oper-ating either in downflow or upflow mode, was employed to collect data on the CWAOof phenol over Active Carbon. Parallely, a stochastic algorithm (Simulated Annealing)and a gradient based method (Levenberg - Marquardt) algorithm were implemented toproceed a complex kinetic analysis of the experimental data obtained in the downflowCWAO of phenol. Useful information on the reactor model and the optimisation strat-egy applied in the parameter estimation is also given. Based on the obtained kinetics,a complex transport-reaction TBR model, accounting both for mass transfer and reac-tor hydrodynamics, is presented. The model dedicates special emphasis to incorporateemergent items in TBR modelling like partial wetting of the catalyst particles and thenon-isothermal adiabatic operation with evaporation of water. A last part is dedicatedto the proper determination of important physical properties and the reactor operationparameters that are required in the TBR modelling of the CWAO.
2.1 Experimental
The original experimental setup has been designed and constructed by Fortuny [199] tostudy the CWAO of phenol in a cocurrent downflow TBR, over a commercial CuO/γ −Al2O3 catalyst (Harshaw Cu-0803 Engelhard). In this work similar experimental testswere carried out, but using active carbon as a catalyst. Additionally, the reactor setupwas modified to enable comparative tests of reactor performance in the cocurrent upflowmode. In the following sections specific information on materials is given and completedby the description of the experimental setup, procedures and the analytical methodsemployed.
2.1.1 Materials
Deionised water and analytical grade phenol (Aldrich) was used without any furtherpurification to prepare initial phenol solutions of 53 mmol/L (5 g/L). The gaseous
51

52 CHAPTER 2. METHODOLOGY
oxidant was compressed high purity synthetic air (Carburos Metalicos). The ActivatedCarbon was supplied by Merck (Ref. 2514) in form of 2.5 mm pellets. This AC ismanufactured from wood and possesses low ash content (3.75%). The nitrogen B.E.T.method (Micromeritics ASAP 2000) gives a specific surface area of 990 m2/g, a porevolume of 0.55 cm3/g and an average pore diameter of 1.4 nm. Phenol adsorption testsperformed elsewhere [18] showed a maximum capacity of 370 mgPh/gAC , at 20oC in oxicconditions. Phenol oxidation experiments with different AC particle sizes, carried out in abatch slurry reactor showed that internal mass transfer only becomes influent for particlesizes greater than 0.5 mm [107], as shown in Fig. 2.1. Thus, prior to each experimentalseries, the AC was crushed and sieved to obtain the 0.3 to 0.7 mm fraction (25 - 50mesh). This fraction was washed with deionised water to remove all fines and then driedat 110oC overnight, allowed to cool and stored under inert atmosphere. Finally, samplesof about 6.6 g were loaded in the reactor for each experimental set.
Figure 2.1: Influence of the AC particle size on the initial rate of phenol removal [107]in a semibatch slurry reactor. Cphen=5 g/L, mAC=2 g, T=140oC, PO2=0.55 MPa.

2.1. EXPERIMENTAL 53
2.1.2 Apparatus and procedures
The continuous oxidation of phenol was carried out in a packed bed reactor performingeither cocurrently downflow in the trickle flow regime or cocurrently upflow in the bubbleflow regime. The fixed bed reactor, consists of a SS-316 tubular reactor, 20 cm long and1.1 cm i.d., placed in a temperature controlled oven (±1oC). Independent inlet systemsfor gas and liquid feed allow working at variable liquid to gas flow rate ratios. The liquidfeed is stored in a 5 L stirred glass tank, which is connected to a high-pressure meteringpump (Eldex) that can dispense flow rates between 10 and 300 mL/h. The air oxidantcomes from a high pressure cylinder equipped with a pressure controller to maintainthe operating pressure constant. A flowmeter coupled with a high precision valve isused to measure and control the gas flow rate. The liquid and gas streams are mixedand then pass through a 1 m long heating coil placed in the oven to reach the reactiontemperature. The mixture then enters the reactor and flows along the AC bed, whichis retained between two sintered metal discs. The exited solution goes to a liquid-gasseparation and sampling system. Regularly, liquid samples were withdrawn for analysis.A sketch of the experimental set up is also illustrated in Fig. 2.2.
Figure 2.2: Trickle Bed Reactor and experimental set up for the CWAO of phenol. (1)Feed vessel, (2) Pump, (3) Flow regulator, (4) Oven, (5) Trickle Bed Reactor, (6) GasLiquid Separation System, (7) Sampler, (8) Gas Flow meter
The tests were performed at three different temperatures (120, 140 and 160oC) andtwo different oxygen partial pressures (0.1 and 0.2 MPa), changing the flow rates at

54 CHAPTER 2. METHODOLOGY
otherwise similar conditions. The liquid flow rates were ranged from 10 to 160 mL/h.Defining the space time as
τ =mcat
mL
(2.1)
it can be calculated that the flow rates used correspond to space times between 0.04 and0.6 h. The air flow rate was always set at 2.4 L/s (STP). Taking into account the phenolconversions and the liquid flow rates, the total oxygen consumption during the runs waskept below 10% of the oxygen fed, except the experiment at 160oC, 0.2 MPa and flowrate of 160 mL/h, in which an oxygen consumption of 25% was achieved.
Samples were immediately analysed to avoid changes in composition due to homoge-neous condensation reactions, catalysed by sun light. In this way it was also possible tomonitor the experiment in real time, and to ensure that steady state has been achievedafter a new space time was set by changing the liquid flow rate. The reactor was consid-ered to operate in steady state when in three consecutive samples the concentration didnot present differences beyond experimental errors. At the end of each experimental set,corresponding to five consecutive days of continuous operation, the AC was dried for 24h at 400oC under nitrogen flow to desorb physically adsorbed molecules from the activecarbon surface. Subsequently, the AC was weighted to detect any change of carbon massthat occurred during the experiments.
In Table 2.1 the operating conditions for the AC study are summarised. In this tablethe conditions used by Fortuny [199] for the study of the CWAO of phenol over theCu0803 catalyst are also presented, since the experimental data obtained in that studywill also be considered here.
Table 2.1: Laboratory reactor operating conditions
Cu0803 ACPhenol concentration (mmol/L) 53.1 53.1Oxygen partial pressure (MPa) 0.6 - 1.2 0.1 - 0.2Oxygen concentration (mmol/L) 4.6-11 0.77-1.8Total operating pressure (MPa) 3.2 - 6.6 0.7 - 1.6Temperature (oC) 120-160 120-160Space time (h) 0.1-1.0 0.04-0.6Liquid superficial Velocity (mm/s) 0.04 - 0.5 0.04 - 0.5Gas flow rate (mL/s) 2.4 2.4Gas superficial velocity (mm/s) 0.5-1.2 3.3-7.4Reactor diameter (mm) 11 11Reactor height (m) 0.2 0.2Particle average diameter (mm) 0.5 0.5Density of catalyst particle (g/L) 1030 400Catalyst load (g) 14.5 6.6Bed porosity 0.26 0.13

2.1. EXPERIMENTAL 55
2.1.3 Analysis
Liquid phase samples were analysed by means of an HPLC (Beckman System Gold)using a C18 reverse phase column (Spherisob ODS-2) to obtain the concentration profilesof phenol and intermediates. To properly separate phenol from the partial oxidationproducts, a mobile phase of variable composition was programmed at a 1 ml/min flowrate starting from 100% deionised water and ending at a 40/60% mixture of methanol anddeionised water. The detection of low molecular weight carboxylic acids was performedwith the UV absorbance method at a wavelength of 210 nm, while at the end of thesample analysis the wavelength was switched to 254 nm to detect phenol.
Single compounds were quantitatively identified by injecting pure samples of the ex-pected partial oxidation products. In Table 2.2 the approximate retention times of allthe pure compounds injected are given.
Table 2.2: Retention time of possible intermediates during the HPLC analysis.
Carboxylic Retention time Phenols Retention timeacids (min) (min)Oxalic acid 1.8 Pyrogallol 8.1Glyoxalic acid 2.0 Phloroglucinol 9.3Formic acid 2.7 Hydroquinone 11.1Maleic acid 3.2 Catechol 17.5Malonic acid 3.4 Benzoquinone 17.9Acetic acid 4.4 4-HBA 21.5Succinic acid 6.5 Phenol 22Fumaric 6.9 Salicylic acid 23Acrylic acid 8.5
Only some of these compounds were identified in the sample solutions, and weresubsequently included in the standard solutions used for calibration. An example of sucha standard solution, including the most important intermediate compounds is given inFig. 2.3a. The correspondance between standard solution peaks and those of a sampleobtained at 50% conversion is shown in Fig. 2.3b. However, in the sample solutionseveral significant peaks remain unidetified, as the were found not to correspond to anyof the compounds included in the Table 2.2. Calibration curves were established foreach intermediate detected using standard solutions that cover the composition rangeof the detected intermediates. Standard solutions were not only tested before startingthe experiment, but also periodically between samples, to correct deviations in retentiontime and/or peak area, which can be caused by small changes in flow rates, columnperformance and temperature.
The liquid stream was also immediately analysed for the remaining COD by the closedreflux colorimetric method [200], according to which the organic substances are oxidised(digested) by potasium dichromate K2Cr2O7 at 160oC in a sealed tube. When orangecolored Cr2O
2−7 is reduced, green colored Cr3+ is formed which can be detected in a spec-
trophotomer set at 600 nm. The relation between absorbance and COD concentration

56 CHAPTER 2. METHODOLOGY
Figure 2.3: Example of (a) standard solution, and (b) sample solution chromatograms.(1) Oxalic acid, (2) Formic acid, (3) Maleic acid, (4) Acetic acid, (5) Fumaric acid, (6)hydroquinone, (7) Catechol, (8) Benzoquinone, (9) 4-Hydroxybenzoic acid, (10) Phenol
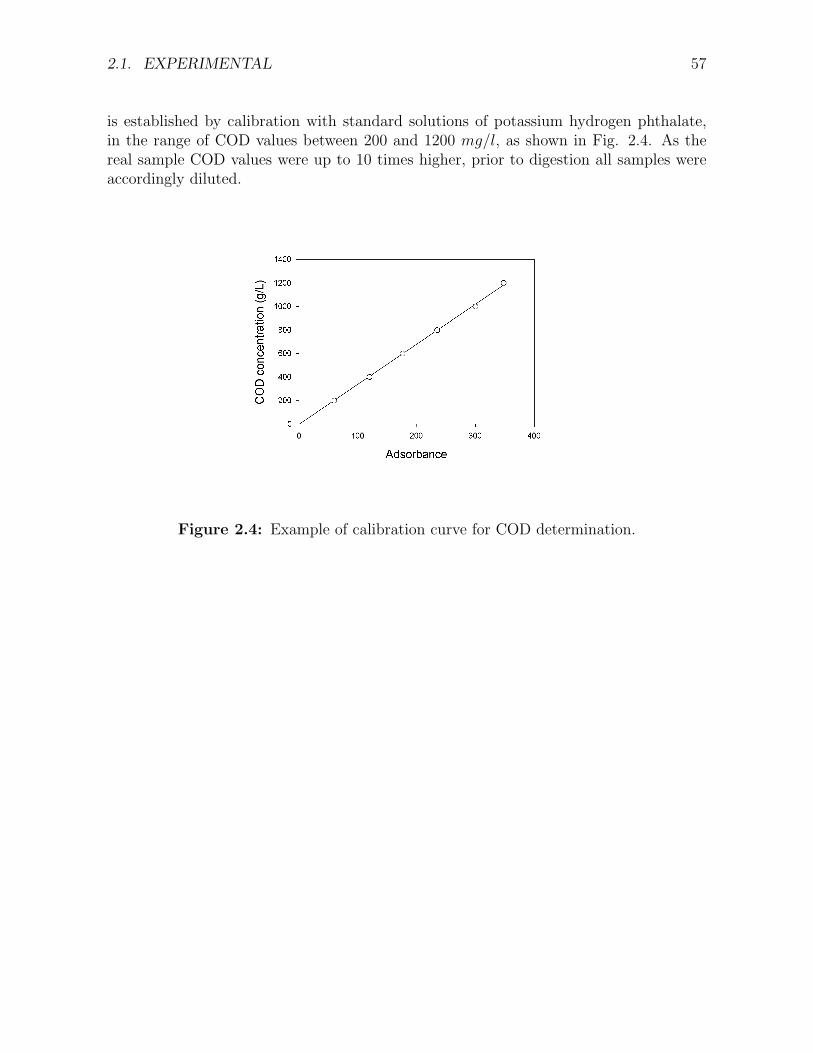
2.1. EXPERIMENTAL 57
is established by calibration with standard solutions of potassium hydrogen phthalate,in the range of COD values between 200 and 1200 mg/l, as shown in Fig. 2.4. As thereal sample COD values were up to 10 times higher, prior to digestion all samples wereaccordingly diluted.
Figure 2.4: Example of calibration curve for COD determination.

58 CHAPTER 2. METHODOLOGY
2.2 Kinetic Multiparameter Estimation
Nonlinear kinetic parameter estimation methods were used to fit the concentrations pre-dicted by the kinetic model (Cmodel
jkl ) to the concentrations experimentally observed (Cexpjkl ),
with j running over the number of compounds included in the model (Nc), k over thenumber of experiments conducted (Ne) and l over the different sample points, i.e. spacetimes (Np).This gives rise to a minimisation problem of a function S(x):
min(S(x)), x ∈ <n (2.2)
The function S is called objective function and x is a n-dimension vector containingthe n parameters to be obtained. The elements of x can be restricted to fulfil simplerestrictions imposed by the physics of the problem:
xm ≥ 0 or xm ≤ 0 (2.3)
Three different objective functions were tested in this study. Initially, the Sum ofSquared Errors (SSE), or the Sum of Relative Squared Errors (SRSE) were set as objectivefunction:
SSSE =Nc∑j=1
Ne∑k=1
Np∑l=1
(Cmodel
jkl − Cexpjkl
)2(2.4)
SSRSE =Nc∑j=1
Ne∑k=1
Np∑l=1
(Cmodel
jkl − Cexpjkl
Cexpjkl
)2
(2.5)
For the S-A algorithm the Sum of Absolute Errors (SAE) was considered:
SSAE =Nc∑j=1
Ne∑k=1
Np∑l=1
∣∣∣Cmodeljkl − Cexp
jkl
∣∣∣ (2.6)
To solve the resulting problem, the conventional L-M algorithm was first tested to as-sess its performance, in particular when complex reaction schemes are considered. Then,the simulated annealing algorithm was implemented and compared to the L-M algorithmin the kinetic modelling of the CWAO of phenol.
2.2.1 The Levenberg - Marquardt algorithm
The L-M algorithm was selected from the FORTRAN IMSL libraries, that includesthe DBCLSF subroutine, which uses a modified L-M algorithm to solve nonlinear leastsquares problems with a trust region approach [201].
For the SSE and SRSE criteria, S(x) can be expressed in terms of a vector functionF(x) with the individual components given by Eq. 2.7 and Eq. 2.8 respectively:
fw(x) = Cexpw − Cmodel
w (2.7)

2.2. KINETIC MULTIPARAMETER ESTIMATION 59
fw(x) = (Cexpw − Cmodel
w )/Cexpw (2.8)
where w runs over the total number of observations (No = NcNeNp). Then, theexpresion of S(x) results in:
S(x) = F(x)TF(x). (2.9)
The algorithm used minimises:
min0.5S(x) (2.10)
For an initial guess of the parameters x, the search direction is calculated as:
d = −(JTJ + µI)−1JTF (2.11)
where J is the Jacobian of F with respect to the free variables and µ the L-M pa-rameter. In the following step x is set to x + d and the procedure is repeated untill thegradients become zero, or the parameter space bounds are reached. The L-M parameterµ is a positive number and its value is the minimum for which the matrix (JTJ+µI) canbe inverted.
Additionally, the L-M algorithm permits a direct calculation of the variance covariancematrix V. If the experimental errors are independent and normally distributed with aconstant variance σ2 then [153]:
V = (J JT )−1σ2 (2.12)
In this case an estimator of σ2 is given by Smin/(No − n) where n is the number ofparameters.
2.2.2 The Simulated Annealing Algorithm
The stochastic algorithm selected in this study is called Simulated Annealing (S-A). Adetailed description is given in Goffe et al. [147]. The source code is freeware and wasdownloaded from www.netlib.org. The underlying concept of S-A is a random searchmethod, first applied to thermodynamic calculations for the states of n-body frozen sys-tems [202], and later used in combinatorial optimisation [203, 204]. Recently it has beenextended to continuous optimisation problems [145, 147, 146].
Simulated Annealing starts defining an objective function, which for historical reasonsis called energy (E). E does not have to be a continuous and differentiable function.First, the value of E of an initial parameter set x is calculated. Afterwards, a new set isgenerated from the previous by a random perturbation of the parameters, and the newvalue of E is calculated. If the new value of E is lower than the previous one, the newset is always accepted. In addition a new set that results in higher E values can also beaccepted with a probability P if the E is higher. The probability P is a function of anauxiliary parameter termed temperature (T ) and usually given by the Maxwell-Boltzmanndistribution, revealing the thermodynamic root of the method, although other possiblecriteria exist.

60 CHAPTER 2. METHODOLOGY
P = exp(−∆E/kT ) (2.13)
This acceptance criterion is called the Metropolis criterion and is the basis of theMonte Carlo simulations methods used in statistical physics.
In the S-A version applied here, the new parameter sets are obtained by random per-turbations of the actual set. These perturbations are calculated by adding or substractinga random fraction of a quantity termed maximum allowable step for each parameter. Thismaximum allowed step is a function of the temperature and it is adjusted internally sothat half of the movements are accepted.
The procedure, i.e. the generation of a new parameter set, followed by the controlof acceptance, is repeated for a certain number of iterations, while maintaining T con-stant. Subsequently, T is reduced and the procedure restarts, taking as initial parameterset the optimum encountered in the previous temperature. The probability that an up-hill movement is accepted decreases and vanishes as T goes to zero. Theoretically, themethod converges to the global minimum although this can only be affirmed under severalrestrictions [205].
To run the algorithm the objective function, an initial parameter set as well as initialvalues for the T and the maximum allowable step have to be provided. The T is a keyparameter in the algorithm performance and its initialisation deserves some consideration.If a too high temperature value is given to the system, then almost all movements areaccepted and the algorithm does not progress. Conversely, a very low value leads toquenching of the algorithm, which converges rapidly to a local minimum. In the presentstudy, the initial temperature was chosen in such a way that the maximum allowablestep was initially in the same order of magnitude of the parameters to be obtained, thusenabling the algorithm to scan the entire range of the possible parameter values. Thischoice resulted in a satisfactory convergence behaviour of the algorithm.
Obviously when the S-A is used, statistical errors in the parameters cannot be calcu-lated by Eq. 2.12. To overcome this drawback, errors can be estimated by assuming alinear behaviour of the errors in the region near the optimum parameter set. Then, anyset of parameters x that satisfies Eq. 2.14:
S(x) = S(xopt)[1 +
n
No − nF(n, No − n, 1− α)
](2.14)
is not statisticaly different to xopt for a confidence level of 1− α [138]. Note that inEq. 2.14 F refers to the F − distribution.
An other possibility would be to run the S-A for a high number of different initialparameter set values and calculate directly the mean xopt and its deviation [204]. Thisapproach would be more adequate for the situation described here, but its applicationwould turn out to be extremely time consuming.
2.2.3 Reactor and kinetic models
The parameter estimation was carried out by a typical integration-optimisation couplingprocedure. As the L-M algorithm is optimised for least squares minimisation, the Sum of

2.2. KINETIC MULTIPARAMETER ESTIMATION 61
Squared Errors (SSE) was chosen as the objective function for the comparison betweenthe two algorithms. The ideal plug flow pseudo-homogeneous model presented in Eq.1.21 was modified to describe the reactor in terms of the space time, instead of reactorlength, yielding:
dCj
dτ= Rjρl (2.15)
Based on the experimental observations, oxygen consumption can be neglected, thus itsbalance was not incorporated in the model equations.
The reactions were initially considered to follow simple power law kinetics:
ri = k0i exp(−Eai/RT ) xαO2
Ci (2.16)
It can be observed that in the above equation all substrate orders are set to unity,in agreement with observations in the literature, while oxygen order was left to be de-termined by the optimisation algorithm. Furthermore, oxygen concentration was incor-porated as mole fraction, to account for the temperature dependence of O2 solubility.As it will be discussed later P-L kinetics did not perform satisfactory results, thus theapplication of Langmuir-Hinshelwood kinetics was also tested. The expression selected(Eq. 2.17), considers competitive adsorption of all adsorbed species on the same site andneglects oxygen adsorption, in agreement with the findings in the literature.
ri = k0i exp(−Eai/RT )K0i Ci x
αO2
exp(−∆Hi/RT )
1 +∑
K0Cjexp(−∆Hj/RT )(2.17)
Reparameterisation of the preexponential factor was recommended for convergence,because of the extremely different orders of magnitude that existed in the frequencyfactor k0 and the adsorption pre-exponential factor K0. A simple reparameterisationconsisted in estimating the log(k0i) instead of k0i, keeping the rest of parameters withoutany transformation. The S-A algorithm achieved convergence in this way, but the L-M algorithm did not, so, a more sophisticated reparameterisation was implemented, asproposed by Buzzi-Ferraris, [140]:
k = exp(αi − bi
(1
T− 1
T ∗
))(2.18)
In this equation T ∗ is a mean value in the temperature range of the experimentaldata and was set equal to 140oC. The new calculated parameters are ai and bi. Fromthis expression the frequency factor and the activation energy (or preexponential factorand heat of adsorption in the case of adsorption constants) can be directly deduced.It should be pointed out that in all cases the parameter space was restricted to valueswith physical meaning. Thus, all parameters were considered positive, except from theheats of adsorption, which take only negative values, because of the endothermic natureof adsorption. This restriction is necessary, for more complex models to exclude themathematical solutions that give a better value of the objective function, on cost ofloosing physical meaning in the parameters optimised.

62 CHAPTER 2. METHODOLOGY
2.3 TBR model
The developed phenomenological model is based on the previous work of Rajashekharamet al. [178] on the hydrogenation of 2,4 Dinitrotoluene, and of Iliuta and Larachi [198]on the CWAO of phenol. In the present study the calculation of the effectiveness factorwas modified to address both the gas limiting reactant and the liquid limiting reactantcases. Also, the heat balance equation was incorporated and extended to account forthe evaporation of water. Thus, the model explicitly describes the following processesoccurring in the TBR:
• The oxygen concentration variation across the reactor in the gas phase.
• The oxygen, phenol and intermediates concentration variation across the reactor inthe dynamic and static liquid portions of the liquid texture.
• The catalyst partial wetting in trickle flow regime at low liquid throughputs.
• The axial dispersion in the dynamic liquid phase.
• The mass transfer across the interfaces between the gas-dynamic liquid, the dynamic- static liquid, the gas-solid, the static or dynamic liquid-solid.
• The intraparticle concentration gradients.
• The heat generation by the oxidation reaction.
• The heat consumption via the valve-effect of water evaporation.
In order to simplify the model equations and numerical treatment it is accepted andreasonable to postulate ideal behaviour of certain physical and chemical contributionsbecause of the conditions at which the CWAO of phenol takes place.
• For the gas phase, ideal gas behaviour is assumed at the given operating conditions.
• The oxygen equilibrium concentration in the liquid phase is described by the Henrylaw.
• The pressure is constant through out the reactor.
• The dissolved organics are non-volatile and the reaction takes place only in theliquid phase.
• The catalyst operates at stable activity. Catalyst deactivation either by leachingor by carbonaceous deposits does not occur.
• Parallel polymerisation or oxidation reactions in the liquid phase are marginal.

2.3. TBR MODEL 63
• The catalyst is assumed to be completely wetted internally due to capillary effects.
• The catalyst wetting and liquid hold-up are assumed to be constant through outthe reactor depth during non-isothermal operation.
• For the external gas-liquid, liquid-liquid, liquid-solid and gas-solid mass transfer,the two film model is used.
• The static portion of the liquid is not in contact with the gas phase.
• The heat transfer across the different phases (gas-liquid-solid) is rapid so that allphases have the same temperature at the same axial position.
• The water vapour-liquid equilibrium is established instantaneously.
The resulting model equations attempt to describe the whole process on three lengthscales, i.e. molecular scale (reaction kinetics), pellet scale and reactor scale. As thereaction network and the kinetics depend on the exact case study, so only the pellet scaleand the reactor scale models are presented. The reaction network of the CWAO of phenolwill be developed and discussed in Chapter 4.
2.3.1 Pellet scale model
To describe the simultaneous diffusion-reaction within the catalyst pellet, the mass bal-ance equation was solved numerically assuming spherical symmetry.
1
r2
d
dr
(r2Deff
j
(dCj
dr
))+ ρpRj = 0 (2.19)
with the following boundary conditions at the center and the surface:
dCj
dr
∣∣∣∣∣r=0
= 0 (2.20)
dCj
dr
∣∣∣∣∣r=rp
= kdjlsfd(C
dj − C∗
j )+
ksjlsfs(C
sj − C∗
j )+[kgs(1− f)(Cg
O2−H C∗
O2)]only for O2
(2.21)
Eq. 2.21 accounts for the effect of partial wetting regardless of the limiting reactant.On the cost of superimposing the diffusive fluxes coming from the different zones of theparticle, this definition gives a better flexibility as it allows the calculation of systems thatlie in-between the asymptotic cases, mainly gas limited or mainly liquid limited reactions.

64 CHAPTER 2. METHODOLOGY
A partial effectiveness factor can be defined for each of the different zones (dynamic liquid,static liquid and gas), as given below for example for the dynamic liquid:
ηdj =
3kdjlsfd(C
dj − C∗
j )
rpρpR∗j
(2.22)
The overall effectiveness factor can then be described as the sum of the partial effec-tiveness factors.
ηj = ηdj + ηs
j + ηgj (2.23)
Note that the weighting with respect to the fraction of catalyst in contact with eachphase has been included in Eq. 2.22 so it is omitted in eq. 2.23
2.3.2 Reactor scale model
The piston dispersion exchange model was used to simulate reactor performance. How-ever, for the gas phase simple plug flow is assumed, because the axial dispersion in thegas phase is usually orders of magnitude smaller than the liquid phase axial dispersion.
ugdCgO2
dz+ (kgla)
(Cg
O2
H− Cd
O2
)− ηg
O2ρpR
∗O2
= 0 (2.24)
The concentrations of reactants and products in the dynamic liquid are described bymeans of the following mass balance equation:
−Dadεdl
d2Cdj
dz2+
d(uldCdl )
dz+ (ka)jll(C
dd − Cs
j )− ηdj ρbR
∗j−[
kgla
(Cg
O2
H− Cd
O2
)]only for O2
= 0 (2.25)
The static liquid is considered to be only in contact with the dynamic liquid and thesolid. As there is no movement of this phase along the reactor the mass balance forreactants and products is reduced to the following algebraic equations:
(ka)jll(Cdd − Cs
j ) + ηsjρbR
∗j = 0 (2.26)
Finally, following the approach of Vav Gelder et al. [193] the energy balance incor-porating solvent evaporation was described considering that the gas phase is saturatedwith water vapor. The following equation results:
(ulρlcpl + ugρgcpg)dT
dz+
φ
A∆Hv −
∑ρbr
api (−∆Hi) = 0 (2.27)
The apparent rate of the ith reaction (rapi ) is calculated from the stoichiometry and
the overall formation-destruction rates (ηjR∗j ).

2.3. TBR MODEL 65
The evaporation rate φ per unit of reactor length is determined assuming that theideal gas stream is saturated in water vapor. Denoting the molar gas flow rate by nt andthe vapor molar flow rate by nH2O, the following equality must be fulfilled at any time:
nH2O
nt
=PH2Ov(T )
Pt
(2.28)
The total pressure (Pt) is marginally affected by the pressure drop throughout thecatalyst bed, thus is considered constant. The gas and the liquid feed are premixed andtherefore the gas enters already saturated in the reactor:
nH2O = ninletH2O +
∫ z
0φ(z)dz (2.29)
nt = ninlett +
∫ z
0φ(z)dz (2.30)
The total molar flow rates and the densities of both gas and liquid phases undergochanges, because of water evaporation and temperature gradients, thus the superficialvelocities have to be adjusted.
For the gas phase velocity this axial variation is calculated assuming ideal gas be-haviour.
ug =V
A=
ntRT
PA(2.31)
The derivation of Eq. 2.31 gives:
∂ug
∂z=
RT
PAφ (2.32)
For the dynamic liquid the change in the superficial velocity is both a result of densitychange and water evaporation. The mass liquid flow rate is then calculated as:
m = m(inlet) −MWH2O
∫ z
0φ(z)dz (2.33)
Defining the dynamic liquid velocity to:
ul =m
ρA(2.34)
the derivative is:∂ul
∂z=
m
A
∂
∂T
(1
ρl
)∂T
∂z(2.35)
The boundary conditions of the reactor model are the following:At the reactor entrance (z=0):
CO2g = CeqO2g (2.36)
ulC0jl = ul Cd
jl
∣∣∣z=0+
−Dadεld
∂Cdjl
∂z(2.37)

66 CHAPTER 2. METHODOLOGY
T = T0 (2.38)
At the reactor exit:∂Cd
jl
∂z= 0 (2.39)
2.3.3 Numerical solution
The set of algebraic - differential equations was discritisised with the method of orthogonalcollocation on finite elements [206, 207]. This method has been applied here to solvedifferential equations of the form:
f(y(x), y′(x), y′′(x)) = 0 (2.40)
in the interval [0,1], and subject to boundary conditions of the form
fb(y(x), y′(x)) = 0 (2.41)
at x = 0 and x = 1.In brief, according to this method the unknown solution y(x) of a differential equation
can be expressed in terms of an expansion of known orthogonal polynomials yi(x). In thisstudy the Legendre polynomials were selected. In the interval [-1,1] these polynomialsare given by the following relationships:
y1(x) = 1 (2.42)
y2(x) = x (2.43)
yn(x) =int(n/2)∑
m=0
(−1)m (2n− 2m)!
2nm!(n−m)!(n− 2m)!xn−2m (2.44)
These polynomials can be transformed to be orthogonal in an arbitrary interval [a,b]by substituting
x =b− a
2x +
b + a
2(2.45)
In our case the interval [0,1] was used, since the set of the differential equations canbe easily reparameterised to fit in this interval.
The unknown solution can be described as a function of Ncp Legendre polynomials:
y(x) =Ncp∑i=1
αiyi(x) (2.46)
The first and second derivative of the function can then be calculated as:
y′(x) =Ncp∑i=1
αiy′i(x) (2.47)
y′′(x) =Ncp∑i=1
αiy′′i (x) (2.48)
2.3. TBR MODEL 67
Given that the polynomials yi(x) are known, if y(x), y′(x) and y′′(x) are inserted inthe differential equation the only unknown quantity in the resulting algebraic system arethe Ncp coefficients αi. To evaluate these coefficients Ncp equations are needed. Theseare obtained by setting the resulting set of equations equal to zero at Ncp positions. Forthe orthogonal collocation method, these positions are defined by the two boundaries, aswell as by the routes of the y(Ncp−2) polynomial. In this study Ncp was chosen to be eight.The solution of Legendre polynomial with degree 6 was taken from Finlayson [206]. Theresulting set of algebraic equations was then solved by the Newton method as describedby Press et al. [204].
The application of the method in finite elements is straight forward. In this case thespace is divided into elements, at which the collocation method is applied. The boundaryconditions of each element, appart from that applied in the first and the last one, is simplythe continuity of the function, i.e. yj(x) = yj+1(x) and y′j(x) = y′j+1(x).
The source code for the descritisation of the differential equation system was pro-grammed in FORTRAN. The number of collocation points was 8 both for reactor andpellet. In most cases with only one element, it was possible to obtain the numerical so-lution. Nevertheless, for complete wetting or very low effectiveness factors two elementsin the reactor model were necessary to achieve convergence.

68 CHAPTER 2. METHODOLOGY
2.4 Calculation of thermophysical and reactor prop-
erties
2.4.1 Thermophysical property calculation
For the bulk liquid solution of phenol, pure water properties have been taken. The waterviscosity, surface tension, heat capacity, vapor pressure and heat of evaporation werecalculated from standard methods reported by Reid et al. [208]. The density of the gaswas calculated by the ideal gas equation of state which was found to agree well withexperimental values reported in [209] for the conditions studied. The viscosity of air wascalculated by interpolation of experimental data reported also in [209]. Phenol, oxygenand intermediate compound diffusion coefficients in water, were calculated by the WilkeChang correlation, as described in [208]. Finally, the Henry constants for oxygen in waterwere obtained from the data of Himmelblau [210]. Table 2.3 summarises the values ofthese properties for the conditions used in this study.
Table 2.3: Physical properties of the air-water-dissolved phenol reacting system atdifferent temperatures.
120oC 140oC 160oCWater density Kg/m3 943 926 907Water viscocity (Ns/m2)*104 2.41 2.06 1.80Water surface tension (N/m)*102 5.86 5.46 5.03Oxygen diffusion coefficient (m2/s)*108 1.10 1.35 1.62Phenol diffusion coefficient (m2/s)*109 5.37 6.60 7.93Air viscocity (Ns/m2)*105 2.30 2.39 2.47Henry constant (m3Pa/mol)*10−3 130 121 110Henry constant (MPa)10−3 6.83 6.25 5.53Water vapor pressure (MPa) 1.99 3.61 6.18Water specific heat(kJ/kgK) 4.24 4.28 4.33Water heat of vaporisation (kJ/kg) 2212 2153 2091
2.4.2 Hydrodynamic and mass transfer parameters
The determination of the hydrodynamic parameters of the TBR is not trivial for theCWAO operating conditions, because of the high pressure and temperature conditionsemployed. For this reason it was attempted to implement correlations that include dataat such high temperature - pressure conditions. The total external liquid hold-up, εl, andthe pressure drop is calculated using the extended Holub model [186] for trickle beds.This correlation uses a combined phenomenological - NN approach and has successfullycorrelated data obtained both at low and high pressure - temperature conditions. Thestatic liquid hold-up, εls, can be estimated from the Saez and Carbonell correlation [211],or the hydrostatic theory developed by Mao et al. [212]. Both studies have been tested
2.4. CALCULATION OF THERMOPHYSICAL AND REACTOR PROPERTIES 69
against low pressure and temperature experimental data and at low values of the EotvosNumber (Eo = ρLgd2
p/σ) both methods converge to a value of 0.05. The dynamic liquidhold-up, εld, is obtained by subtracting the static hold-up from the external holdup.
The external catalyst wetting has been shown to significantly influence TBR perfor-mance, so the wetting efficiency f is a key factor to correctly assess the reactor per-formance. For this reason three correlations were employed fo its calculation. In thefirst place the phenomenological model of Iliuta et al. [213] was employed, which hasbeen tested against the high pressure wetting efficiency measurements of the Al-Dahhanand Dudukovic [168]. Also, the empirical correlation presented by the latter authors forhigh pressure wetting was also employed. Finally, the correlation of Mills and Dudukovic(cited in [175]) was tested. The static, fs, and dynamic, fd, components of the wettingefficiency are obtained from the approximation of Rajashekharam et al. [178], i.e.
fd
fs
=εd
εs
(2.49)
The liquid phase axial dispersion coefficient, Dad, is calculated from the NN correlationpresented by Piche et al., [214]. The mass transfer coefficients between dynamic andstatic liquids, (ka)ll, are taken from the plots of Iliuta et al. [177], which have beenobtained at low pressure and temperature. The (dynamic) liquid-solid mass transfercoefficient, (kd
lsas), is evaluated from the empirical correlation proposed by Goto andSmith [215], obtained at low P-T, and which has been used in many CWAO studies[99, 79, 195], as well as the more recent correlation of Lakota and Levec [219]. In thislatter correlation the (kd
lsas), is also a function of the liquid hold up. Since the liquid holdup is affected by high pressure [166], this correlation should be more reliable. The (static)liquid-solid mass transfer coefficient, ks
lsas, is determined using the empirical correlationof Iliuta et al. [192]. The liquid-side volumetric mass transfer coefficient, (kgla), foroxygen is estimated by the correlation of Iliuta et al. [185], but . The gas-side oxygenmass transfer coefficients, kgs, across the dry pellet region is assumed to be one orderof magnitude higher than the liquid-side mass transfer coefficient in agreement with theobservations of Herskowitz and Smith [175] and Lu et al. [216]. Finally, the effectivediffusion coefficients, Deff
j , are approximated assuming a tortuosity factor equal to 3.

70 CHAPTER 2. METHODOLOGY

Part II
Results and Discussion
71


Chapter 3
Catalytic Performance of TBR usingAC
A study that aims to assess the intrinsic reaction kinetics obviously should be conducted ina reactor suitable to provide hydrodynamic and mass transfer characteristics that ensurecomplete control by the reaction kinetics. This is readily achieved in a batch type reactorby means of a rigorous stirring of the reactor mixture and a proper selection of catalystparticle size. However, the high liquid to catalyst ratio can become influent on reactionkinetics through an enhanced contribution of homogeneous side reactions. Phenol isknown to form condensation products (dimers) in the liquid phase during CWAO [81],making a solely heterogeneous kinetic study impossible in a batch slurry reactor. Theirreversible adsorption of these condensation products additionally causes coke catalystdeactivation as observed by Stuber et al. [107]. The same authors also found out thatthe reduced extent of homogeneous side reactions do not harm the catalyst performancewhen the reaction is carried out in a TBR. Thus, the CWAO kinetic study of phenol wasundertaken in a laboratory TBR at operation conditions that reduce at maximum theinfluence of hydrodynamics and mass transfer on the reaction kinetics. This assumptionwill be discussed in the following by analysing in detail the prevailing hydrodynamicsof the gas liquid flow and by experimental comparison of the performance that resultedfrom either downflow or upflow operation of the cocurrent gas - liquid flow. By doingthis, we attempt to check the kinetic model for consistency with respect to the absenceof any mass transfer limitations.
3.1 Reactor performance
3.1.1 Hydrodynamics and Mass Transfer
First, all hydrodynamic and mass transfer parameters were estimated by means of selectedliterature correlations, as described in Chapter 2.4.2. These correlations need both theoperation data, such as the gas and liquid flow rates, the type and the size of catalystparticles and the reactor dimensions, and the physical properties of the fluids.
73

74 CHAPTER 3. CATALYTIC PERFORMANCE OF TBR USING AC
Flow regime: The operating conditions for the laboratory TBR have been alreadysummarised in Table 2.1. For the conditions used the laboratory reactor operates in thetrickle regime as can be verified from Fig. 1.10. Similarly, during upflow operation teststhe reactor operates in the bubble flow regime as can be verified from the flow mapssummarised by Ramachandran and Chaudhari [165].
Catalyst wetting: For the downflow operation the wetting efficiency was calculatedto be less than unity independently of the correlation used. Table 3.1 presents the valuesobtained from three different correlations. It can be seen that the correlations of Iliutaet al. [213] and Al-Dahhan and Dudukovic [168], that have been adjusted including highpressure data, are in close agreement. These correlations give wetting efficiency valuesthat are about half those estimated by the correlation of Mills and Dudukovic (as reportedby [175]), which has been obtained at low pressure conditions. Despite these deviations,it is clear that the laboratory reactor should operate under partial wetting conditions,although the exact extend cannot be determined. The possibility that part of the catalystis not at all in contact with the liquid is not likely. If this was true, conversion at verylow liquid flow rates (high space time) would decrease, as observed by Tukac and Hanika[19], but not in our experiments.
Table 3.1: Wetting efficiency calculated with different correlations at 160oC and 0.1MPa (AC) or 0.6 MPa (Cu0803), for liquid velocities in the range of 0.04 to 0.5 mm/s.
Correlation AC1 Cu08032
Iliuta et al. [213] 0.25-0.35 0.28-0.39Al-Dahhan and Dudukovic [168] 0.23-0.49 0.23-0.49Mills and Dudukovic (reported in [175]) 0.45-0.82 0.45-0.82
Liquid Holdup: External liquid holdup is also calculated to be low, taking valuesbetween 0.06 and 0.1 according to the correlation of Iliuta et al. [186]. These valuesare in the low limit among the reported values, as can be seen from Fig. 1.13d [156].However they are not surprising, since the liquid flow rate and viscosity are low, whilethe gas density is high. All of these factors are known to have a negative effect on liquidholdup. For the static hold up, both Saez and Carbonell, as well as Mao et al. [212]estimate a value of 0.05. Unfortunately, there are no sufficient data to evaluate the effectof high temperature and pressure on this parameter.
External Mass Transfer: Under the conditions employed in this study, the dissolvedoxygen concentration ranges between 0.8 and 11 mmol/L, which is much less than thestoichiometrically required for the complete mineralisation of a 53 mmol/L phenol solu-tion. Therefore, the possibility of external mass transfer limitations of oxygen has to beaddressed prior to any kinetic analysis of the obtained results. To this purpose, the αgl

3.1. REACTOR PERFORMANCE 75
and αls criteria, defined in the introduction in Eqs.1.13 and 1.14 were now calculated inthe following way.
αgl =robsO2
ρb
(kgla)O2CeO2
< 0.05 (3.1)
αls =robsO2
ρb
(klsas)O2CeO2
< 0.05 (3.2)
According to these criteria, mass transfer limitations can be neglected when a <0.05.The maximum reaction rates are expected to occur at high temperatures and lowspace times i.e. at high liquid flow rates. When high liquid flow rates are used, phenolconversions are lower, thus phenol concentration is higher through out the reactor, com-pared to the case of lower flow rates. The robs
O2can be calculated from the experimentally
measured phenol concentration at low space time in the following way:
robsO2
=7(C0
phen − Cphen)
τρL
(3.3)
In Table 3.2 the experimentally obtained phenol concentrations, space times, and thecalculated robs
O2are given, for both catalysts considered here. It can be observed that the
initial rates are higher for the AC catalyst confirming the superiority of the AC catalyticactivity over the Cu0803 catalyst. Furthermore, for the AC catalyst the initial reactionrate at 0.2 MPa is double that at 0.1 MPa, indicating a first order reaction with respectto the oxygen concentration. This preliminary observation will be confirmed later. Onthe other hand, when the oxygen concentration changes from 0.6 to 1.2 MPa for theCu0803 catalyst, there is only slight increase in the observed reaction rate, indicating alower oxygen order.
Table 3.2: Initial oxygen reaction rates for Cu0803 and AC at 160oC based on initialphenol conversion measurements (C0
phen.=53.1 mmol/L
Catalyst Pressure Space time Cphen CeO2
robsO2
(MPa) (h) (mmol/L) (mmol/L) (mmol/kgcats)AC 0.2 0.04 38 1.8 0.81
0.1 0.06 42 0.91 0.40Cu0803 1.2 0.09 40 11 0.31
0.6 0.10 40 5.5 0.28
The gas to liquid volumetric mass transfer coefficients were calculated from the twocorrelations of Iliuta et al. [185] and Goto and Smith [215], resulting in very different(ka)gl values. It is known that (ka)gl increases at high pressures, thus the former cor-relation, which has been fitted including high pressure data, gives considerably highervalues. This means that the widely used correlation of Goto and Smith is not adequateand will lead to considerable underestimation of the gas - liquid mass transfer at highpressures. The αgl criterion using the Iliuta et al. correlation shows that gas liquid mass

76 CHAPTER 3. CATALYTIC PERFORMANCE OF TBR USING AC
transfer limitations can be slightly influent in the case of the experiments with the ACcatalyst (Table 3.3). However, as the reactor operates under partial wetting conditions,the direct gas - solid mass transfer will further diminish the weak influence of gas - liquidmass transfer limitations. For the Cu0803 catalyst these values indicate that the gas -liquid resistance should not be significant.
Table 3.3: Estimation of gas - liquid volumetric oxygen mass transfer coefficients forthe Cu0803 and the AC catalysts at 160oC and criteria for the existence of mass transferlimitations.
Catalyst Pressure (ka)gl αgl (ka)gl αgl
(MPa) (s−1) (s−1)AC 0.2 1.0 0.15 0.016 9.7
0.1 1.2 0.13 0.016 9.5Cu0803 1.2 0.82 0.027 0.016 1.4
0.6 0.87 0.045 0.016 2.5Ref. [185] [215]
The different correlations used for the liquid to solid volumetric mass transfer coeffi-cient fall within the same order of magnitude. The correlation of Lakota and Levec [219],that takes into account the liquid holdup, is sought be more accurate for high pressureextrapolation than the correlation of Goto and Smith [215]. The calculated values of theαls, with the former correlation suggest that there should be no significant liquid - solidmass transfer limitations. (Table 3.4).
Table 3.4: Estimation of gas liquid volumetric oxygen mass transfer coefficients for theCu0803 and the AC catalysts at 160oC and criteria for the existence of mass transferlimitations.
Catalyst Pressure (ka)ls αls (ka)ls αls
(MPa) (s−1) (s−1)AC 0.2 0.53 0.29 3 0.051AC 0.1 0.53 0.29 3 0.051Cu0803 1.2 0.53 0.041 1.4 0.016Cu0803 0.6 0.53 0.074 1.4 0.028Ref. [215] [219]
Concluding and taking into account the high gas to solid mass transfer rates theoxygen concentration on the catalyst surface should not be affected by mass transferlimitations in the downflow configuration for both catalysts.

3.1. REACTOR PERFORMANCE 77
Internal diffusion: To account for internal diffusion limitations the Weisz - Pratercriterion, modified for n-order reactions defined in Eq. 1.20 can be used:
Φ =robsO2
ρpd2p
36DeffO2
� 2
n + 1(3.4)
there are no internal mass transfer limitations as long as Φ � 2/(n + 1). The Φ valuesdepend on the effective diffusion coefficient, thus their exact values cannot be preciselycalculated. Assuming typical tortuosity values between 2 and 4, the Φ values rangebetween 0.19 and 0.38 for the AC catalyst and 0.06 and 0.22 for the Cu0803 catalyst.It can be seen that Φ values are low, thus internal mass transfer resistances should haveonly a slight influence. Again, due to the higher reaction rates over the AC catalyst thecriteria exhibit higher values for this catalyst. For this catalyst, according to experimentalobservation of Stuber et al. [107] in a batch agitated reactor at 140oC and 0.9 MPainternal mass transfer is not influent when for particles with same diameter used here.Furthermore, the reaction kinetics of phenol degradation over AC, that will be presentedin a following section, successfully predicted experiments carried out recently [220], athigher temperature (170oC) and oxygen partial pressure (3.4 MPa), in a different reactor.The good performance of the obtained kinetics at even higher temperatures and pressures,further supports the kinetic control of the phenol degradation in our experiments.
3.1.2 Downflow versus Upflow operation
The application of the available correlations to quantitatively describe the hydrodynam-ics and mass transfer properties of multiphase reactors, may not always yield reliableand useful information. One has to be aware of the questionable results of the corre-lations when extrapolating the correlations outside their range of validity. The typicalCWAO systems have the advantage of being very close to the well studied Air-Water-Solid multiphase system, thereby avoiding the great uncertainties related to organic andfoaming systems. Many correlations exist for this medium, and recent research effortshave been driven to high pressure and temperature systems and more reliable data arenow available.
In the case of kinetic studies conducted in a continuous multiphase reactor system,the gas liquid hydrodynamics are imperatively to be selected so that the reaction iscompletely controlled by the intrinsic kinetics and not by the kinetics of mass trans-fer. Obviously, one way to guide the selection process is to make use of appropriatecorrelations to quantify the underlying process physics, as done in the previous section.However, it is recommended to corroborate these findings by a minimum of properlydesigned experiments. For the study of phenol CWAO, an important information is todetermine whether the limiting reactant is in the gas phase or liquid phase and thenchoose the appropriate reactor configuration. To this purpose, the γ ratio (Eq. 1.10)proposed by Khadilkar et al. [171] is particularly useful.
The γ ratio in our case takes values between 17 and 34 for the AC catalyst and 3 to6 for the Cu0803, thus the limiting reactant is the oxygen in the gas phase and downflow

78 CHAPTER 3. CATALYTIC PERFORMANCE OF TBR USING AC
Figure 3.1: Comparison of down flow (empty symbols) and up flow (filled symbols)phenol and COD concentration profiles over AC catalyst at 0.2 MPa of PO2 and : a) 120and 160oC b) 140oC. (◦): 120oC , ( ): 140oC , (4): 160oC . Lines indicate trends.
operation should be preferred. These results motivated a series of experiments dedicatedto assess the reactor conversion for either coccurent downflow or upflow mode. Fromthis experimental data, one can conclude on the effects of reactor hydrodynamics, atleast with respect to the wetting efficiency and external mass transfer, which are two keyparameters for TBRs.
As predicted, the downflow operation yielded considerably higher phenol conversionsthan the upflow operation, indicating that the reaction is practically controlled by exter-nal mass transfer in the latter operation mode. The phenol concentration - space timeprofiles measured in both flow directions are plotted in Fig. 3.1. These results are in closeagreement with the work of Tukac et al. [195], comparing the phenol conversion obtainedin a normal TBR and the same catalytic bed, but diluted with fines, thus operating undercomplete catalyst wetting as in an upflow fixed bed reactor. These authors also observedthat the effect of wetting was not significant at low temperature, conversely to the trendsfound in our study. This can be attributed to the difference in the γ ratio values between

3.1. REACTOR PERFORMANCE 79
Figure 3.2: 4-HBA and formic acid concentration as a function of phenol conversionover AC at 0.2 MPa with a) downflow (empty symbols) and b) up flow (filled symbols)operation. (◦): 120oC , ( ): 140oC , (4): 160oC .
17 and 2.5 for our study and the study of Tukac et al. [195] respectively. This meansthat in our conditions the limitations of oxygen should be much more influent, even atlow phenol reaction rates.
The COD degradation profiles follow the same trends established for phenol, as canbe also seen in Fig. 3.1. For intermediate compounds, however, differences can beappreciated when their concentration is plotted against the conversion of phenol forthe two different operation modes. Exemplarily, in Fig. 3.2 the 4-HBA and formic acidconcentration profiles are presented for both operation modes. An important result is thatin downflow operation different tendencies can be observed for the different temperatures.For the same phenol conversion at higher temperature higher quantities of 4-HBA andformic acid are formed. This indicates that the activation energy for the formation of4-HBA is higher to that of its destruction. For upflow operation it is observed that 4-HBA and formic acid concentrations depend only on phenol conversion and not on thetemperature employed. Thus the formation and destruction of these compounds have

80 CHAPTER 3. CATALYTIC PERFORMANCE OF TBR USING AC
the same temperature dependence, that must be attributed to mass transfer limitations.
3.1.3 Conclusions
At the employed operating conditions the laboratory scale TBR operates under partialwetting of the catalyst as determined from literature correlations. The calculation ofgas -liquid and liquid solid mass transfer volumetric mass transfer coefficients, showedthat high pressure correlations predict higher mass transfer coefficients. Then, the avail-able criteria for the diagnostic of mass transfer limitations, based on measured apparentreaction rates, showed that external and internal transport resistances are marginal.
The γ ratio for our reaction system was calculated to be high, taking values of theorder of 17. Thus it was expected that partial wetting in downflow operation is advan-tageous compared to the upflow operation. This was experimentally verified in upflowruns at 0.2 MPa. In the plots of the intermediate compound concentration versus phe-nol conversion, it can be seen that for downflow operation temperature is influent onintermediate concentration, while for upflow operation the concentration profiles of allintermediates depend only on phenol conversion. The examined results on selectivity givefurther support to conclude that downflow operation was kinetically controlled, while up-flow is partially diffusion controlled.
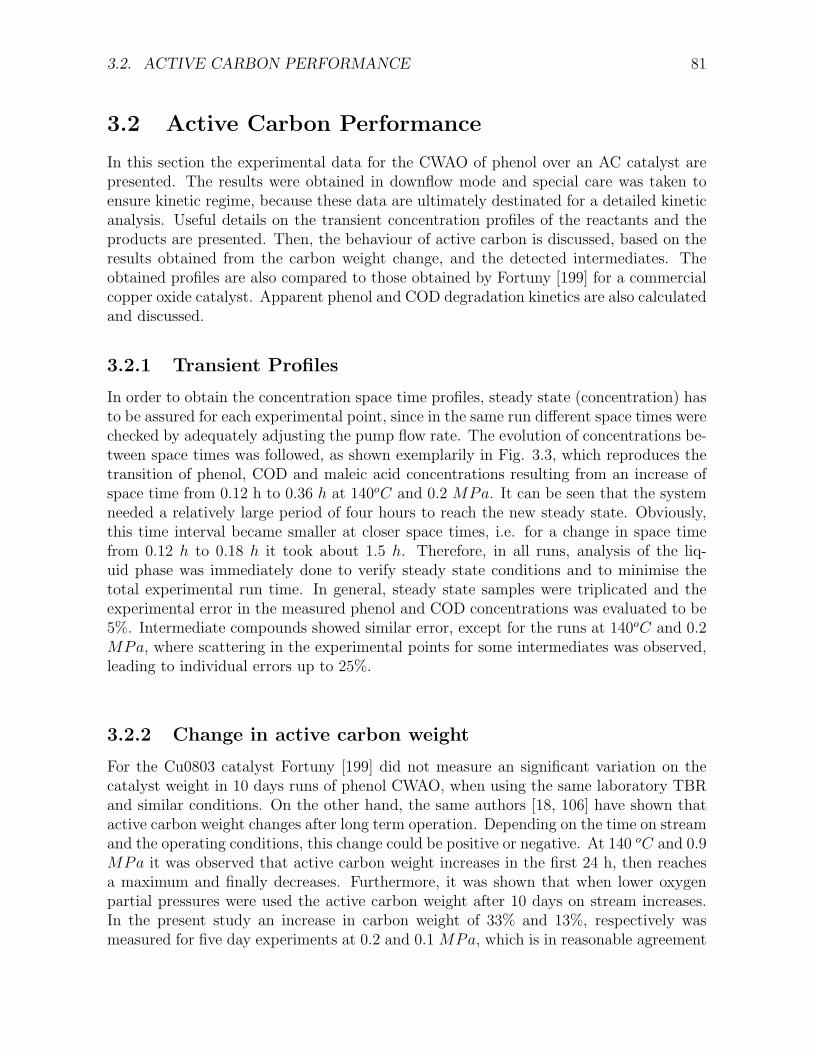
3.2. ACTIVE CARBON PERFORMANCE 81
3.2 Active Carbon Performance
In this section the experimental data for the CWAO of phenol over an AC catalyst arepresented. The results were obtained in downflow mode and special care was taken toensure kinetic regime, because these data are ultimately destinated for a detailed kineticanalysis. Useful details on the transient concentration profiles of the reactants and theproducts are presented. Then, the behaviour of active carbon is discussed, based on theresults obtained from the carbon weight change, and the detected intermediates. Theobtained profiles are also compared to those obtained by Fortuny [199] for a commercialcopper oxide catalyst. Apparent phenol and COD degradation kinetics are also calculatedand discussed.
3.2.1 Transient Profiles
In order to obtain the concentration space time profiles, steady state (concentration) hasto be assured for each experimental point, since in the same run different space times werechecked by adequately adjusting the pump flow rate. The evolution of concentrations be-tween space times was followed, as shown exemplarily in Fig. 3.3, which reproduces thetransition of phenol, COD and maleic acid concentrations resulting from an increase ofspace time from 0.12 h to 0.36 h at 140oC and 0.2 MPa. It can be seen that the systemneeded a relatively large period of four hours to reach the new steady state. Obviously,this time interval became smaller at closer space times, i.e. for a change in space timefrom 0.12 h to 0.18 h it took about 1.5 h. Therefore, in all runs, analysis of the liq-uid phase was immediately done to verify steady state conditions and to minimise thetotal experimental run time. In general, steady state samples were triplicated and theexperimental error in the measured phenol and COD concentrations was evaluated to be5%. Intermediate compounds showed similar error, except for the runs at 140oC and 0.2MPa, where scattering in the experimental points for some intermediates was observed,leading to individual errors up to 25%.
3.2.2 Change in active carbon weight
For the Cu0803 catalyst Fortuny [199] did not measure an significant variation on thecatalyst weight in 10 days runs of phenol CWAO, when using the same laboratory TBRand similar conditions. On the other hand, the same authors [18, 106] have shown thatactive carbon weight changes after long term operation. Depending on the time on streamand the operating conditions, this change could be positive or negative. At 140 oC and 0.9MPa it was observed that active carbon weight increases in the first 24 h, then reachesa maximum and finally decreases. Furthermore, it was shown that when lower oxygenpartial pressures were used the active carbon weight after 10 days on stream increases.In the present study an increase in carbon weight of 33% and 13%, respectively wasmeasured for five day experiments at 0.2 and 0.1 MPa, which is in reasonable agreement
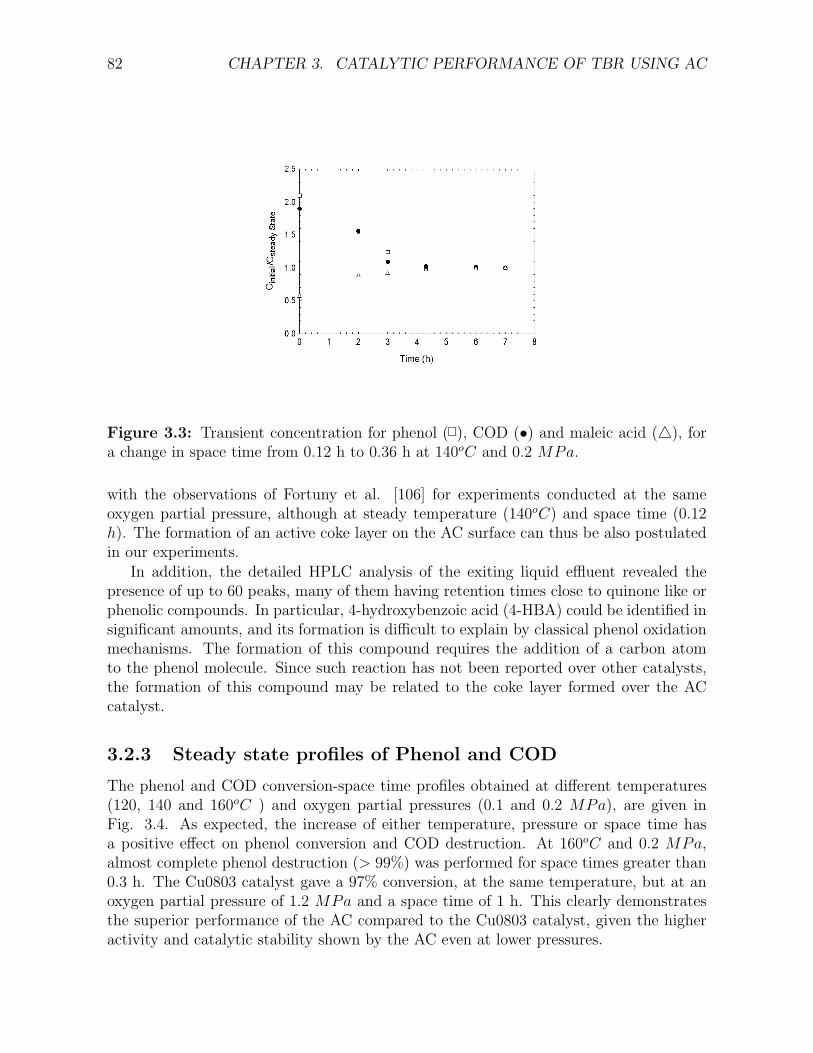
82 CHAPTER 3. CATALYTIC PERFORMANCE OF TBR USING AC
Figure 3.3: Transient concentration for phenol ( ), COD (•) and maleic acid (4), fora change in space time from 0.12 h to 0.36 h at 140oC and 0.2 MPa.
with the observations of Fortuny et al. [106] for experiments conducted at the sameoxygen partial pressure, although at steady temperature (140oC) and space time (0.12h). The formation of an active coke layer on the AC surface can thus be also postulatedin our experiments.
In addition, the detailed HPLC analysis of the exiting liquid effluent revealed thepresence of up to 60 peaks, many of them having retention times close to quinone like orphenolic compounds. In particular, 4-hydroxybenzoic acid (4-HBA) could be identified insignificant amounts, and its formation is difficult to explain by classical phenol oxidationmechanisms. The formation of this compound requires the addition of a carbon atomto the phenol molecule. Since such reaction has not been reported over other catalysts,the formation of this compound may be related to the coke layer formed over the ACcatalyst.
3.2.3 Steady state profiles of Phenol and COD
The phenol and COD conversion-space time profiles obtained at different temperatures(120, 140 and 160oC ) and oxygen partial pressures (0.1 and 0.2 MPa), are given inFig. 3.4. As expected, the increase of either temperature, pressure or space time hasa positive effect on phenol conversion and COD destruction. At 160oC and 0.2 MPa,almost complete phenol destruction (> 99%) was performed for space times greater than0.3 h. The Cu0803 catalyst gave a 97% conversion, at the same temperature, but at anoxygen partial pressure of 1.2 MPa and a space time of 1 h. This clearly demonstratesthe superior performance of the AC compared to the Cu0803 catalyst, given the higheractivity and catalytic stability shown by the AC even at lower pressures.

3.2. ACTIVE CARBON PERFORMANCE 83
Figure 3.4: Phenol and COD conversions over AC catalyst for different oxygen partialpressures and temperatures. Empty symbols indicate phenol experimental data. Filledsymbols indicate COD experimental data. (◦) 120oC, ( )140oC, (4) 160oC. Lines indi-cate kinetic model: (−) Phenol, (- -) COD.
A preliminary kinetic analysis of the phenol concentration and COD was made, bymeans of nonlinear regression, using the reactor model described in Eq. 2.15 and simplepower law kinetics (Eq. 2.16). In agreement with the findings of other studies conductedin slurry [90, 81] or TBR [73], a first reaction order for phenol or COD concentration onreaction rate was postulated. The average deviation between experimental and predictedphenol conversions was found to be only 4%. The best parameter fit is given in Table 3.5with a standard error calculated for a 95% confidence interval. The apparent activationenergy for phenol destruction over AC was found to be 70.3(±0.4) kJ/mol, and is in therange of the 85(±2) kJ/mol obtained by [73] in the same TBR using the Cu0803 catalyst.For stirred slurry reactors, intrinsic kinetic values of 85 kJ/mol [82] and 84 kJ/mol [81]for different copper oxide catalysts with similar characteristics. These values suggest thatthe AC kinetics evaluated in the TBR are very close to the intrinsic kinetics.
An unexpected order of 0.95(±0.02) on dissolved oxygen mole fraction resulted for the

84 CHAPTER 3. CATALYTIC PERFORMANCE OF TBR USING AC
Table 3.5: Kinetic Parameters for Phenol and COD degradation kinetics on activecarbon
k0 Ea α(L/kgcat h) (kJ/mol) (-)
Phenol 1013.6±0.1 70.3 ±0.4 0.95 ± 0.02COD 1012.0±0.2 60.9 ±0.6 0.87 ± 0.03
AC catalyst. A first order oxygen dependence could be readily justified by the presenceof strong oxygen mass transfer limitation, although the clear temperature dependenceof the phenol conversion and the activation energy found strongly suggests that kineticsgoverns the process. Pintar and Levec, [80], proposed that dissociative oxygen adsorptionis an elementary step during CWAO of phenol over a copper oxide catalyst and reported a0.5 oxygen order, in agreement with Sadana and Katzer, [90] and Fortuny et al. [72]. Onthe other hand, according to Sadana and Katzer [90], molecular oxygen also participatesin possible elementary steps during CWAO of phenol. Thus, a first order could resultfrom intrinsic kinetic effects involving a molecular oxygen attack of the phenol molecule.
The prediction of COD abatement (dashed lines in Fig. 3.4) are also in good agree-ment with the experimental COD data. Systematic deviations, i.e. the model over-estimates the COD conversion, are only observed for the highest COD conversions at160oC . Accumulation of refractory acetic acid in the system is the cause of this devi-ation as the model does not account for its effect on COD destruction. This effect canbe overcome by means of the complex model that will be discussed later. The activationenergy of 60.7(±0.6) kJ/mol found for COD destruction, is lower than that for phenol,although the oxygen order of 0.9 (±0.03) is close. The lower activation energy of CODreduction can be explained by the fact that most intermediates are less refractory thanphenol. Surprisingly, the destruction of phenol and most intermediates seems to dependon oxygen concentration in the same way as the oxygen orders found demonstrate. Asexpected, phenol is not completely mineralised to water and carbon dioxide and the CODreductions observed are not as large as the phenol conversions (Fig. 2). However, forphenol conversion of 99%, a high COD reduction of about 85% was achieved and it can beexpected that the AC shows a high selectivity towards the production of carbon dioxide.
For the same phenol conversion, the Cu0803 catalyst gave a similar COD conversionof 90%, which is related to lower acetic acid formation, as will be discussed later. Inorder to have a detailed insight of COD behaviour, the exit stream was also analysed todetect the main intermediate compounds from phenol oxidation.
3.2.4 Intermediate compounds
The HPLC analysis detected 15 peaks at low phenol conversions, but this number in-creased up to 60 for higher phenol conversions. Most of these peaks had no significantareas and could be associated to trace amounts of compounds resulting from the combus-

3.2. ACTIVE CARBON PERFORMANCE 85
tion of the coke layer formed or the AC itself. Among all peaks, five principal intermediatecompounds were identified, namely 4-HBA, benzoquinone, maleic acid, including its iso-mer fumaric acid, acetic acid and formic acid. Hydroquinone, catechol and oxalic acidwere also detected in trace amounts. The area corresponding to identified peaks decreasedfrom 95% (at low conversions) to 70% (at higher conversions). However, as the differ-ent areas are not equally proportional to the concentration, the identified compoundsreproduce the directly measured COD with reasonable accuracy, taking into account thecomplexity of the system and the precision of the COD analytical method. In Fig. 3.5the measured COD values and HPLC estimated COD are represented in a parity plot.Almost all the data points fall within the ±10% error range, the majority being withinthe ±5% error band. For high COD values (low phenol conversion), measured and HPLCestimated CODs are distributed uniformly along the equality line. As COD reduction in-creases, HPLC estimated COD tends to slightly underestimate measured COD, certainlydue to the detection of more unknown peaks at higher phenol conversion.
Figure 3.5: Parity plot among HPLC based and chemically measured COD
The obtained concentration-space time profiles for the five main intermediates shownin Figs 3.6 to 3.7, revealing that phenol oxidation follows a complex pathway of paralleland consecutive reactions. With the exception of acetic acid, a maximum concentrationappears for all the detected partial oxidation compounds at 160oC and 0.2 MPa. Forbenzoquinone and, surprisingly, formic acid this maximum appears fast at space timesaround 0.1 h, while 4-HBA and maleic acid reach their maximum only at a space time of0.18 h and 0.36 h respectively. Therefore, a sequential phenol oxidation scheme yieldingfirst 4-HBA and then benzoquinone is not likely. More probably, it seems that phenol

86 CHAPTER 3. CATALYTIC PERFORMANCE OF TBR USING AC
undergoes two parallel oxidation reactions to form benzoquinone and 4-HBA. If thesecompounds are expected to be the first oxidation intermediate products, they shouldrapidly reach a maximum. Formic acid, should be formed only after several consecu-tive oxidation reactions and exhibit its maximum later. This is true in the case of theCu0803 catalyst, where the formic acid maximum appears at space time twice that ofbenzoquinone. For the AC, benzoquinone and formic acid form and disappear rapidly,suggesting that there is a direct pathway from phenol, or benzoquinone, to formic acid.On the other hand, 4-HBA and maleic acid are formed and destroyed less rapidly, thusit could be speculated that maleic acid is mainly formed through 4-HBA, rather thanbenzoquinone. Finally, acetic acid should be formed following maleic acid, according tothe Devlin and Harris pathway [119]. Considering these facts the scheme shown in Fig.3.8 can be proposed. Nevertheless, this scheme has to be reaffirmed by kinetic modellingprocedures as will be done later on.
Figure 3.6: Benzoquinone and 4-HBA concentration profiles over AC catalyst for dif-ferent oxygen partial pressures and temperatures. Empty symbols indicate phenol ex-perimental data. Filled symbols indicate COD experimental data. (◦) 120oC, ( )140oC,(4) 160oC. Lines indicate trends

3.2. ACTIVE CARBON PERFORMANCE 87
Figure 3.7: Maleic, acetic and formic acid concentration profiles over AC catalyst fordifferent oxygen partial pressures and temperatures. Empty symbols indicate phenol ex-perimental data. Filled symbols indicate COD experimental data. (◦) 120oC, ( )140oC,(4) 160oC. Lines indicate trends

88 CHAPTER 3. CATALYTIC PERFORMANCE OF TBR USING AC
Figure 3.8: Possible scheme proposed for phenol CWAO over AC based on the experi-mentally observed intermediate compound concentration profiles.

3.2. ACTIVE CARBON PERFORMANCE 89
With respect to the kinetic models based on the Devlin and Harris mechanism, asignificant difference is that the phenol degradation over AC catalyst seems to occur alsothrough the formation of 4-HBA. The presence of this compound was affirmed by bothHPLC retention time and HPLC-MS analysis. The formation of this compound wouldrequire the addition of a carboxyl group to the phenol molecule. This suggests thatfunctional surface groups of the AC or the coke layer may react with adsorbed phenolspecies to form this compound. However, if these groups are not regenerated, only asmall part of phenol should be able to follow this route, as in the case that all phenolwould react towards 4-HBA a significant AC loss would be produced. Consequently, aconstant conversion decline should have been observed in the long-term runs carried outin a previous work, which is not the case.
Also, it must be pointed out that during phenol oxidation over AC, less aromatic com-pounds are formed as shown in Fig. 3.9. In total, the sum of 4-HBA, benzoquinone anddihydric phenols concentrations never exceeded 1.5 mmol/L, while the same compoundscould reach more than 3 mmol/L in the case of the copper catalyst. The evolution of4-HBA and benzoquinone with space time at 0.2 MPa and 160oC shows that AC is ableto efficiently remove both compounds.
Figure 3.9: Ring compound and acetic acid concentration as a function of phenolconversion for Cu0803 (◦) and AC (•).
In agreement with the classical phenol oxidation mechanism proposed by Devlin andHarris, (1984), typical routes for the formation of carbon dioxide or acetic acid are foundfor both catalysts, although differences do exist. In the route of carbon dioxide formationover AC, oxalic acid is only detected in trace concentrations, which are 20 times lowerthan those observed for Cu0803. Formic acid is formed in amounts similar to thoseobtained for the Cu0803 and is easily destroyed at 160oC with both catalysts. In theformation of acetic acid, maleic and malonic acids appear as common precursors comingmainly from the benzoquinone (Cu0803) or 4-HBA (AC). Although the sum of maleic

90 CHAPTER 3. CATALYTIC PERFORMANCE OF TBR USING AC
and malonic acid concentration is close for both catalysts, maleic acid was produced overAC at a rate 20 times faster, but no malonic acid could be detected. For both catalyst,acetic acid accumulates in the system and it does not undergo further apparent oxidation,since higher temperatures and pressures are usually employed to destroy this well-knownrefractory compound [46]. For the AC, acetic acid has been detected in quantities up to20 mmol/L, which is 2 to 3 times higher than those obtained for the Cu0803 catalyst, asshown in Fig. 3.9. This rise corresponds to a 7% COD increase explaining the slightlylower COD destruction value observed for the AC catalyst.
3.2.5 Conclusions
Effective phenol conversions exceeding 99% has been achieved in the CWAO of phenolover an active carbon using a continuous TBR at 160oC and 0.2 MPa of oxygen partialpressures. When compared to a commercial copper oxide catalyst, AC gives not onlyhigher conversion at lower space times and pressures, but also stable catalytic activitybeyond 10 days running. The COD removal exceeded 85% in the above conditions andis close to that obtained with a supported copper oxide catalyst. The principal phenoloxidation intermediate compounds were 4-hydroxybenzoic acid, benzoquinone, maleicacid, formic acid and acetic acid. Compared to the copper oxide catalyst, less amountof toxic and non-biodegradable aromatic compounds are formed, while the quantity ofrefractory, but biodegradable, acetic acid that accumulates in the exited stream is twicethat obtained with the copper catalyst.
A kinetic analysis for the phenol removal over AC showed strong dependence of phenoldestruction rate on temperature and oxygen concentration. The apparent activationenergy (70 kJ/mol) is somewhat lower than that reported for copper oxide catalysts inthe kinetic controlled regime. On the other hand, a first order dependence on the oxygenpartial pressure was found for AC contrasting the 0.5 order normally observed for othermetal supported catalysts. No significant diffusion limitation existing, this dependenceshould be attributed to a different elementary mechanism involving molecular oxygen inthe case of the AC catalyst. In this context, the assumed formation of a coke surfacelayer, active in the oxidation of phenol, is postulated to play an important role.

Chapter 4
Kinetic Modelling of Phenol CWAO
In this chapter the development and consolidation of complex kinetic modelling for twocase studies of phenol CWAO, over a Cu0803 catalyst and over an AC catalyst arediscussed. The developed kinetic models are aimed to account for all intermediates thathave been detected during the phenol CWAO. For the AC catalyst the experimentaldata along with a preliminary discussion on the possible reaction network have beengiven in the previous chapter. The experimental data for the Cu0803 catalyst wereobtained in the same experimental set up by Fortuny [199]. Due to the high numberof intermediates detected (5 for the AC and 8 for the Cu0803) the resulting reactionnetworks are of high complexity and the classical kinetic multiparameter approaches,based on local optimisation algorithms, may have difficulties in finding a solution. Thusprior to the discussion of the kinetic results the performance of the classical L-M algorithmand the stochastic S-A algorithm, for the kinetic modelling of the CWAO of phenol overCu0803 is compared.
4.1 Underlying reaction networks
4.1.1 Copper oxide reaction network development
During the CWAO tests over the Cu0803 catalyst, performed by Fortuny [199], severalintermediates appearing in the scheme proposed by Devlin and Harris [119] were detectedby following an exhaustive HPLC analysis of the exited stream. The analysis confirmedthat the main partial oxidation products are light carboxylic acids such as oxalic, aceticand formic. Malonic acid, maleic acid and its isomer fumaric acid, were detected in traceamounts. For simplicity, fumaric acid was included in the maleic acid concentration. Asecond clan of products in measurable amounts constitute the following ring compoundsof hydroquinone, catechol and benzoquinones. No other possible intermediates could beidentified. In order to contrast the goodness of the analytically determined composition,the HPLC based estimated COD or TOC estimates were compared with experimentallydetermined COD or TOC values. The deviations were found to be less than 5%, indicatingan acceptable closure of the carbon mass balance.
91

92 CHAPTER 4. KINETIC MODELLING OF PHENOL CWAO
The analysis of the concentration histories of these intermediates in front of thespace time showed the typical trends of a consecutive-parallel reaction pathway, whichfavourably agreed with the reaction model stated by Devlin and Harris [119]. Amongthe intermediates detected by Devlin and Harris, neither succinic nor propionic acidswere found in the study of Fortuny [199], so the corresponding pathway that producespropionic acid from maleic acid was directly removed from the proposed scheme. Thepropionic acid would only appear as a final product if the succinic acid has been formedby hydrogenation of the carbon to carbon double bond in maleic acid. This hydrogena-tion may occur in some extent only when oxygen is poorly available, which is not thecase in the current reaction conditions.
Other of the possible intermediates not detected were acrylic acid, glyoxal and gly-oxylic acid. The acrylic acid comes from decarboxylation of maleic acid and is an in-termediate in the pathway to form malonic acid and later acetic acid [119]. Since thesetwo latter were obtained, acrylic acid must have been formed in the employed conditionsbut it is believed to be very reactive, thus leading to concentrations below the HPLCdetection limit. On the other hand, since all the oxalic and the formic acid producedmight exclusively come from muconic and maleic acid, both glyoxal and glyoxylic acidmight not necessarily appear as intermediates. Notwithstanding, it can also be thoughtthat they are short-lived compounds. Glyoxylic acid is reported to be considerably morereactive than oxalic acid [128] so, unlike the latter, it could not accumulate in the system.Oxalic and formic acids were found to further degradate under the conditions studied,thus their mineralisation towards carbon dioxide and water has to be included. In addi-tion, the thermal decomposition of oxalic acid towards formic acid is a further possiblestep as it has been reported during both non catalytic [129] and homogeneous catalysed[130] WAO. From the obtained profiles, acetic acid seems to accumulate in the reactionsystem, although a slow degradation reaction cannot a priori be excluded.
Even being reduced the complexity of the reaction network compared to the Devlinand Harris mechanism, the number of possible reactions is still undefined since severalpossible paths exist for the degradation of some partial oxidation products. For instance,benzoquinones can be oxidised via 2,5-dioxo-3-hexenedioic acid, i.e. without passingthrough maleic acid. The former acid is highly reactive and has not been ever detectedas intermediate in phenol oxidation. Thus, benzoquinones could directly yield oxalicacid and/or glyoxal and/or glyoxylic acid. In turn, these two latter can form oxalicacid, formic acid, or even could be directly converted into carbon dioxide. On the otherhand, maleic acid could be either decarboxylated to yield acrylic acid or degraded byoxidation to glyoxylic and/or oxalic acid. Acrylic acid was not detected although thesubsequent oxidation products, malonic and acetic acid, were indeed obtained. Too,oxalic acid can be directly oxidised into carbon dioxide and water but can also undergodecarboxylation thus yielding formic acid. So, as can be seen, the later steps in the phenoloxidation pathway could follow different ways, some of them even at once, which leads tomultiple likely reaction pathways. Over 50 different reaction models were designed andthen tested [218]. By means of a robust predictor-corrector method [217], most of theproposed models were eliminated, while the best performning schemes were englobed in

4.1. UNDERLYING REACTION NETWORKS 93
a core reaction scheme presened in Fig. 4.1.
Figure 4.1: Preliminary reaction network for the CWAO of phenol over Cu0803 catalyst
The final model assumes that phenol firstly undergoes a hydroxylation leading tohydroquinone or catechol; a further oxidation yields the corresponding o- and p-benzo-quinone. Then, benzoquinones are degraded in two parallel pathways. In the first path,o-benzoquinone is oxidised to muconic acid which, in turn, rapidly decomposes, stoi-chiometrically yielding maleic and oxalic acid. This reaction has been observed even atroom temperature [119]. The subsequent decarboxylation of maleic acid finally producesmalonic acid. Oxygen attack to the carbon to carbon double bond of maleic acid toform oxalic acid is not considered here as a significant path. This is in disagreementwith some experimental studies [127] where oxidation of maleic acid largely prevails overthermal decomposition, although these results were obtained at more severe conditionsunder non catalytic environment. In our case, all attempts including an oxidation path-

94 CHAPTER 4. KINETIC MODELLING OF PHENOL CWAO
way from maleic to oxalic acid failed, so this option was finally rejected. The other pathto degrade benzoquinones is assumed to occur through a complex reaction network viaglyoxal or glyoxylic acid. After checking up several possibilities, we consider lumpingboth benzoquinones, which degradate yielding one molecule of oxalic acid, one moleculeof formic acid, and three molecules of carbon dioxide. Furthermore, direct oxidation stepsand thermal decomposition, were initially accepted to be the main path for oxalic acidconsumption as both steps have been reported in the literature [119, 128].
Obviously, there is a lack of information to doubtless affirm that this is the truepathway for phenol oxidation in the current experimental conditions. However, the modelis consistent with the known oxidation and decarboxylation mechanisms and permits topredict confidently the product yield in the range of conditions studied.
4.1.2 AC reaction network development
In the previous chapter a general reaction network for the CWAO of phenol over AC wasproposed (Fig. 3.8) purely based on experimental results. This scheme is particularlyuseful when selected as a starting point for the subsequent hierarchical model building,as will be shown later on in Chapter 4.4.

4.2. S-A AND L-M PERFORMANCE 95
4.2 S-A and L-M Performance
The potential of the S-A algorithm in the study of complex kinetic schemes is evalu-ated, by comparing it to the classical L-M algorithm. The analysis is done using theexperimental Cu0803 data and the developed core reaction scheme as a case study. Ahierarchical approach of parameter estimation was tested, starting from the study of onlyphenol degradation (one-reaction network), then including the principle carboxylic acids(five reaction network) and finally incorporating all detected intermediates (eight-reactionnetwork).
4.2.1 One-reaction network (Model 1)
According to this hierarchical approach the first step is to consider only the phenoldegradation reaction described by Eq. 4.1:
C6H5OH + 7 O2 → 6 CO2 + 3 H2O (4.1)
Preliminary adsorption experiments at room temperature have shown that phenoldoes not adsorb on the Cu0803 catalyst surface, therefore simple power law expressions(Eq. 2.16) were employed.
rphen = k0 exp(−Ea/RT ) xαO2
Cphen (4.2)
The total destruction rate for phenol Rphen is simply
Rphen = −rphen (4.3)
and can be substituted to the reactor model (Eq. 2.15):
dCphen
dτ= Rphenρl (4.4)
Then, given an initial guess set of the unknown parameters (k0, Ea, α) Eq. 4.4 canbe numerically integrated, and applying the S-A or the L-M algorithms optimum valuesof the desired parameters can be obtained. The values of the guess parameters set waschosen from available data in the literure. Fortuny et al. [72], using simple power lawkinetics, found an activation energy close to 85 kJ/mol and an oxygen order of 0.5 forthis reaction. These values were taken as initial guess for both algorithms. The frequencyfactor initial guess was set to 1011 (L/kgcath). In our case, simple power law expressionswere also tested (Eq. 2.16), thus only three parameters were fitted. As expected and due

96 CHAPTER 4. KINETIC MODELLING OF PHENOL CWAO
Table 4.1: Performance of S-A and L-M for Model 1
S-A L-MMinimum 1085 1086Function evalutations ≈ 105 ≈ 102
Activation energy (kJ/mol) 77.1 77.1 ± 0.4Oxygen order 0.37 0.35±0.2Frequency factor (L/kgcath) 1011.34 1011.29±0.07
to the low number of parameters involved, the two algorithms practically converged tothe same solution, shown in Table 4.1.
The obtained parameters were found to be statistically significant as can be deducedfrom the calculated errors for 95% interval of confidence. The L-M algorithm neededonly 102 function evaluations while S-A needed more than 105. This was expected asL-M algorithm is already implemented successfully for similar optimisation problems.The high quality of the fitting is exemplarily illustrated for the S-A solution in Fig.4.2. The new solution found was not exactly that of Fortuny et al. [72], using thesame experimental data set. This is due to the fact that the procedure followed in thepresent work was different, i.e. all parameters were identified simultaneously. In theformer case non-linear regression was applied to obtain the reaction constant for eachtemperature - pressure set and consequently the activation energy and reaction orderwere calculated by means of linear regression. This discrepancy is in agreement withthe given observation that linearisation results may be different from those obtained bydirect nonlinear estimation of all involved parameters [139].

4.2. S-A AND L-M PERFORMANCE 97
Figure 4.2: Concentration profiles of phenol oxidation over Cu0803 catalyst for differentoxygen partial pressures and temperatures for model 1 with the S-A solution. Symbolsindicate experimental data: (◦) 120oC, ( )140oC, (4) 160oC. Lines indicate modelpredictions: (- -) 120oC, (- · -) 140oC, (−) 160oC

98 CHAPTER 4. KINETIC MODELLING OF PHENOL CWAO
4.2.2 Five-reaction network (Model 2)
As a result of phenol degradation, a number of intermediate compounds are formed priorto the formation of carbon dioxide. There is no obvious reason why the degradationrates of these compounds are equal to that of phenol. Thus, a model accounting notonly for phenol, but also for the main intermediate compounds, should be a significantimprovement compared to the previous model.
The first step towards this detailed description of the effluent composition consistsin incorporating the main carboxylic acids formed, such as acetic acid, oxalic acid andformic acid. In addition, a lump accounting for all quinone like compounds was included,due to their elevated biotoxicity. The resulting reaction scheme is reproduced in Fig. 4.3.
Figure 4.3: Model 2: Five-reaction network proposed for the CWAO of phenol overCu0803
The very poor fitting obtained when ommiting a direct oxidation step from benzo-quinones to oxalic and formic acid evidents that this pathway has to be included in themodel. The reaction of direct oxidation of acetic acid into carbon dioxide and water didnot resulted to any considerable improvement, as its reaction rate should be negligibleat temperatures below 200oC [131, 128], so it was excluded from the network. Also the
4.2. S-A AND L-M PERFORMANCE 99
incorporation of a thermal decomposition of oxalic acid deteriorated model performance.This reaction was only encountered significant at temperatures beyond 180oC, whereasdirect oxidation into carbon dioxide was the most relevant path at lower temperatures[128].
This scheme involves five reactions and five modelled compounds. For phenol de-struction (Reaction 1 in the scheme of Fig. 4.3) simple power law equations were chosenagain:
ri = k0i exp(−Eai/RT ) xαO2
Ci (4.5)
For the destruction reactions of the intermediate compounds (Reactions 2-5 in thescheme of Fig. 4.3) L-H expressions were recommended.
ri = k0i exp(−Eai/RT )K0i Ci x
αO2
exp(−∆Hi/RT )
1 +∑
K0Cjexp(−∆Hj/RT )(4.6)
In this case the number of model parameters increases to 23. The overall destruc-tion/production rates for the five involved compounds can be directly deduced from thereaction scheme (Fig. 4.3) and are as follows:
Rphen = −r1 (4.7)
Rquin = r1 − r2 − r3 (4.8)
Racet = r2 (4.9)
Roxal = r2 + r3 − r4 (4.10)
Rform = r3 − r5 (4.11)
Because of the lack of any specific kinetic data in the literature available for thereactions considered, the same initial guess values used in Model 1 were selected for allfive reactions. Furthermore, arbitrary initial values were considered for the adsorptionconstants. In particular -6 kJ/mol was used for heat of adsorption and 101.5 for therespective preexponential factor. The L-M algorithm converged to a SSE value of 2200,while S-A reached a value of 1880, although it needed more function evaluations as shownin Table 4.2. In Fig. 4.4 the profiles obtained with the two algorithms for phenol, oxalicand acetic acid at 0.6 MPa are presented. It can be seen that the profiles obtained byS-A are better than those of L-M, although these could still be accepted.
However, the superiority of the performance of S-A is further supported from theinspection of the calculated parameters, presented in Tables 4.3 and 4.4. L-M obtained asolution in which the oxygen order for all reactions, except for phenol oxidation, as wellas the heats of adsorption of oxalic and acetic acid were zero. These results do not havephysical sense at all. On the other hand, both algorithms obtained a similar solution forthe phenol degradation reaction, which also agrees with the solution obtained in Model
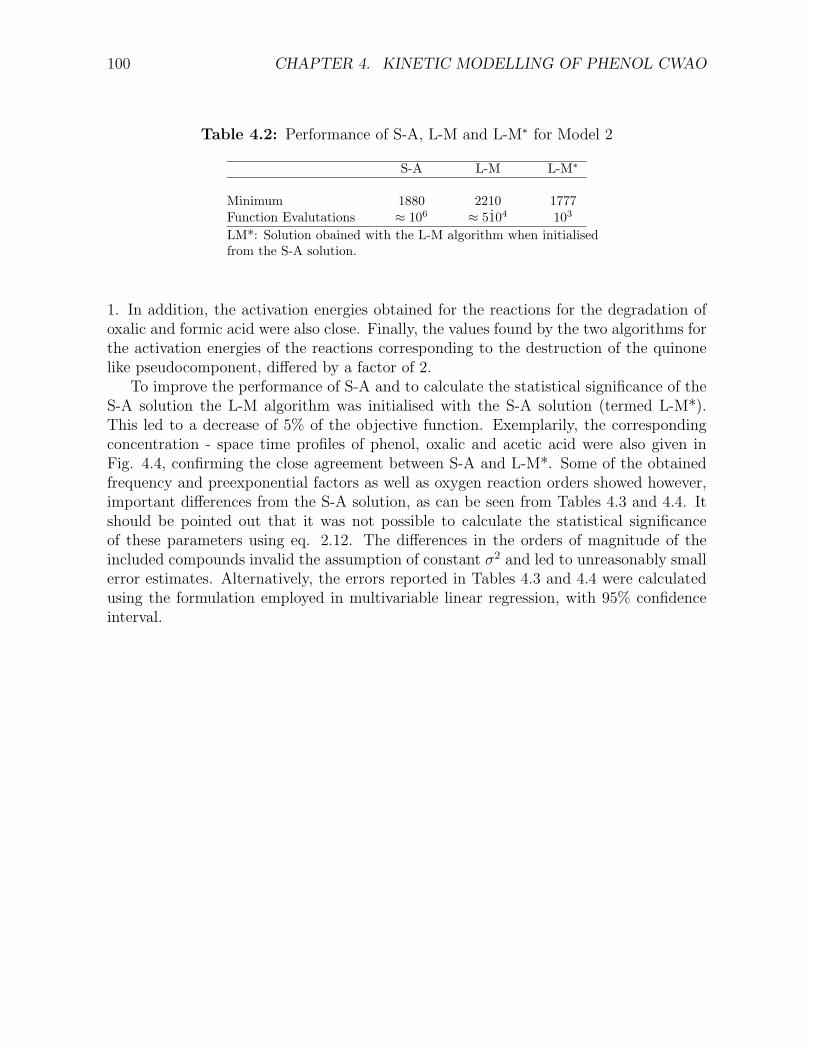
100 CHAPTER 4. KINETIC MODELLING OF PHENOL CWAO
Table 4.2: Performance of S-A, L-M and L-M∗ for Model 2
S-A L-M L-M∗
Minimum 1880 2210 1777Function Evalutations ≈ 106 ≈ 5104 103
LM*: Solution obained with the L-M algorithm when initialisedfrom the S-A solution.
1. In addition, the activation energies obtained for the reactions for the degradation ofoxalic and formic acid were also close. Finally, the values found by the two algorithms forthe activation energies of the reactions corresponding to the destruction of the quinonelike pseudocomponent, differed by a factor of 2.
To improve the performance of S-A and to calculate the statistical significance of theS-A solution the L-M algorithm was initialised with the S-A solution (termed L-M*).This led to a decrease of 5% of the objective function. Exemplarily, the correspondingconcentration - space time profiles of phenol, oxalic and acetic acid were also given inFig. 4.4, confirming the close agreement between S-A and L-M*. Some of the obtainedfrequency and preexponential factors as well as oxygen reaction orders showed however,important differences from the S-A solution, as can be seen from Tables 4.3 and 4.4. Itshould be pointed out that it was not possible to calculate the statistical significanceof these parameters using eq. 2.12. The differences in the orders of magnitude of theincluded compounds invalid the assumption of constant σ2 and led to unreasonably smallerror estimates. Alternatively, the errors reported in Tables 4.3 and 4.4 were calculatedusing the formulation employed in multivariable linear regression, with 95% confidenceinterval.

4.2. S-A AND L-M PERFORMANCE 101
Table 4.3: Frequency Factors, activation energies and reaction orders for Model 2 usingS-A, L-M and L-M*
Reaction No S-A L-M L-M∗
Frequency Factors(1)
1 1010.97±0.02 1010.84±0.02 1011.17±0.02
2 1010.70±0.04 104.02±0.06 1013.25±0.06
3 109.67±0.03 103.75±0.03 1012.22±0.03
4 1012.56±0.05 1013.87±0.05 1016.98±0.05
5 108.22±0.05 1010.91±0.05 1011.18±0.05
Activation Energy(kJ/mol)
1 75.8± 0.1 75.7± 0.1 76.5± 0.12 87.5± 0.4 40.7± 0.4 89.3± 0.43 78.8± 0.4 32.0± 0.4 83.0± 0.44 75.8± 0.2 85.8± 0.2 80.9± 0.25 54.3± 0.4 62.3± 0.4 59.1± 0.4
Oxygen Order
1 0.31± 0.004 0.28± 0.004 0.340± 0.0042 0.36± 0.01 0 1.08± 0.013 0.16± 0.02 0 0.71± 0.024 0.79± 0.01 0 0.74± 0.015 0.06± 0.01 0 0
1 The frequency factor has reaction dependent units. For reaction 1 is in (L/kgcath), while for the restof the reaction constants is in (mol/kgcath).
Table 4.4: Adsorption parameters for each adsorbed compound for Model 2 using S-A,L-M and L-M*
Compound S-A L-M L-M∗
Preexponential Factors(L/mol)
Lump 10−1.7±0.2 10−5.7±0.2 10−3.21±0.2
Oxalic Acid 103.94±0.05 10−1.73±0.05 101.65±0.05
Formic Acid 102.6±0.05 10−1.95±0.05 10−1.86±0.05
Acetic acid 104.91±0.04 103.15±0.04 108.54±0.04
Heat of adsoption(kJ/mol)
Lump −69± 2 −67± 2 −95± 2Oxalic Acid −11.5± 0.4 0.± 0.5 −7.3± 0.4Formic Acid −13.1± 0.4 −1.9± 0.4 −8.3± 0.4Acetic Acid −16.7± 0.4 0± 0.5 −0.3± 0.4

102 CHAPTER 4. KINETIC MODELLING OF PHENOL CWAO
Figure 4.4: Phenol, acetic and oxalic acid concentration profiles at 0.6 MPa for model2. Points indicate experimental data: (◦): 120oC, ( ): 140oC, (4): 160oC. (−): S-A, (--) L-M, (· · ·) L-M starting from the S-A solution

4.2. S-A AND L-M PERFORMANCE 103
4.2.3 Eight-reaction network (Model 3)
After modelling the principal compounds generated by the oxidation of phenol, the laststep is to fit all detected compounds. As p- and o- benzoquinones could no be distin-guished they were treated as a unique compound. For this reason it was also convenientto join catechol and hydroquinone concentrations. Maleic and malonic acid were insertedin the pathway leading from benzoquinones to acetic acid. The reaction pathway pro-posed is given in Fig. 4.5. Now, the total number of parameters involved raised to 38,while differences of up to three orders of magnitude existed in the concentration rangesof the compounds to be fitted.
Figure 4.5: Reaction network proposed for the CWAO of phenol over Cu0803 catalyst

104 CHAPTER 4. KINETIC MODELLING OF PHENOL CWAO
This scheme is summarised in the following reactions.
C6H5OH + 0.5O2r1→ C6H4(OH)2 (4.12)
C6H4(OH)2 + 0.5O2r2→ C6H4O2 + H2O (4.13)
C6H4O2 + 2.5O2 + H2Or3→ C4H4O4 + C2H2O4 (4.14)
C6H4O2 + 5O2r4→ CH2O2 + C2H2O4 + 3CO2 (4.15)
C4H4O4 + O2r5→ C3H4O4 + CO2 (4.16)
C3H4O4r6→ C2H4O2 + CO2 (4.17)
C2H2O4 + 0.5O2r7→ 2CO2 + H2O (4.18)
CH2O2 + 0.5O2r8→ CO2 + H2O (4.19)
For the degradation of phenol (Reaction 1) a simple power law rate expression (Eq.2.16) was considered, while for the rest of the reactions L-H expressions (Eq. 2.17)were used. In this case the overall destruction-production rates of the eight involvedcompounds are given by the following relationships.
Rphenol = −r1 (4.20)
Rdihydric phenol = r1 − r2 (4.21)
Rbenzoquinone = r2 − r3 − r4 (4.22)
Rmaleic = r3 − r5 (4.23)
Rmalonic = r5 − r6 (4.24)
Racetic = r6 (4.25)
Roxalic = r3 + r4 − r7 (4.26)
Rformic = r4 − r8 (4.27)
In the first place, the initial guess of Model 1 was extended to this model. In thiscase L-M did not converged while S-A was progressing very slowly. Thus, in order toimprove performance of both algorithms, an initial parameter set was created based on thesolution of Model 2. For the reactions that are included in both models the initial guesswas the solution previously encountered. For the reaction of dihydric quinone oxidationthe parameters were taken as intermediate values of reaction 2 and 3 of Model 2. Forthe maleic acid and malonic acid the initial guess was the solution for reaction 3 of theModel 2. This was selected because maleic acid and malonic acid destruction reactionsare expected to have activation energies lower than the rest of carboxylic acids, giventhat they appear only as traces. In this case S-A managed to converge to a reasonablesolution (objective function of 1970), while the L-M stayed far from a reasonable optimum.Further improvement was achieved when the S-A solution was fed to the L-M algorithm,resulting in a criterion of 1650. The S-A and the improved L-M* solution, mainly differedin the values of frequency and preexponential factors, as observed for model 2. Thereported errors have been also calculated by a linear approximation for 95% confidenceinterval.

4.2. S-A AND L-M PERFORMANCE 105
When the kinetic data set comprises high concentration compounds, as well as, lowconcentration compounds, the global quality of te is likely to depend on the criterionimposed on the objective function. This situation is illustrated in Fig. 4.6. The qualityof the fitting obtained from S-A using the SSE criterion was acceptable for high con-centration profiles (Fig. 4.6a), while predictions of low concentration compounds wereunacceptable (Fig. 4.6d). L-M* considerably improved maleic acid profiles, as can beseen from the same figures. In order to improve the low concentration compound estima-tion, the Relative Least Squares criterion was employed in the optimisation procedure.As a result, this caused a considerable improvement in the fitting of low concentrationprofile compounds (Fig. 4.6d), but as expected high concentration profiles were poorlypredicted (Fig. 4.6b). In this case L-M* could not improve the predicted profiles. Inan attempt to balance the counter effects of these two commonly used criterions, theminimisation of the absolute sum of errors was tested. As can be verified from Fig.4.6c and 4.6f, the predictions of high concentration profiles were then very satisfactory,maintaining the quality of the fit of low concentration profiles.
The calculated parameters with L-M* with the SSE criterion or with S-A with the SAEcriterion, are presented for S-A in Tables 4.5 and 4.6. The calculated activation energiesclalculated in both cases are close, while oxygen orders where systematically higher forthe L-M* than for the S-A solution. The obtained heats of adsorption were considerablydifferent, although this is not surprising, since these constants are less influent in thekinetic model performance, as can be judjed from their corresponding errors. Finallykinetic and adsorption preexponential factors are accordingly adjusted to balance thedifference of the rest of the temrs in the kinetic equaiton.
Table 4.5: Frequency factors, activation energies and reaction orders for Model 3 usingS-A and L-M*
Reaction k0 S-A k0 L-M* Ea S-A Ea L-M* α S-A α L-M*(1) (1) kJ/mol kJ/mol
1 1010.91±0.02 1011.17±0.2 74.9± 0.2 76.5± 1 0.311± 0.005 0.343± 0.042 108.4±0.2 1016.76±0.2 52± 1 49.6± 1 0.52± 0.04 0.88± 0.043 1011.16±0.03 1014.9±0.03 54.9± 0.2 49.2± 0.2 0.61± 0.01 1.13± 0.014 108.68±0.03 1013.07±0.03 44.7± 0.3 42.4± 0.3 0.35± 0.01 0.68± 0.015 104.72±0.02 1013.03±0.02 27± 4 24± 4 0.5± 0.1 06 104.9±0.1 102.75±0.1 52.3± 0.8 36.1± 0.8 0 07 1013.9±0.06 1022.79±0.06 91.1± 0.6 93.7± 0.6 0.80± 0.02 1.2± 0.028 109.79±0.04 1014.81±0.04 69.9± 0.4 75.0± 0.4 0.23± 0.01 0.43± 0.01
1 For reaction 1 the frequency factor is in (L/kgcath), while for the rest of the reactions is in (mol/kgcath).
In Fig. 4.6 can be apreciated that L-M* with the SSE criterion, as well as, S-A withthe SAE criterion give equally good prediction for phenol concentration. However, it S-Awith the SAE criterion performs slightly better for maleic acid. The same holds for theprofiles of the rest intermediate compounds, as can be seen exemplarily in Fig. 4.7, where

106 CHAPTER 4. KINETIC MODELLING OF PHENOL CWAO
Table 4.6: Adsorption paramters for each adsorbed compound for Model 3 using S-Aand L-M*
Compound K0 S-A K0 L-M* ∆H S-A Ea L-M*L/mol L/mol kJ/mol kJ/mol
Dihydric Phenols 10−0.2±0.2 10−7.95±0.2 −28± 1.4 −26.3± 1.4Benzoquinones 102.3±0.2 10−4.1±0.2 −2± 1 −13± 1Maleic acid 100.1±0.3 10−11.73±0.3 −40± 20 −40± 20Oxalic acid 102.2±0.07 10−5.11±0.07 −11.4± 0.5 −1.5± 0.5Malonic acid 100.7±0.2 103.79±0.2 −28± 1 0± 1Formic acid 100.6±0.1 10−2.93±0.1 −8.1± 0.4 −5.7± 0.4Acetic acid 103.7±0.1 103.14±0.1 −8.6± 0
the concentration profiles for benzoquinone, dihydric phenols, and formic acid at 1.2 MPaare presented. Thus the S-A solution obtained with SAE solution has been consideredas the best fit solution. The parameters obtained by the S-A with SSE, correspondingto phenol degradation, are similar to those calculated by Model 2. On the other hand,the parameters of reactions 3, 4, 7, and 8 of Model 3, deviate from the corresponding ofModel 2 (reactions 2, 3, 4 and 5 respectively), however, they exhibit similar tendencies.The activation energy for oxalic acid oxidation remains higher than that of formic acid.In the same manner, the activation energy of reaction 3 is higher than that of reaction 4as in Model 2. Similar behaviour is exhibited by oxygen orders.

4.2. S-A AND L-M PERFORMANCE 107
Figure 4.6: Phenol and maleic acid concentration profiles at 0.6 MPa using differentobjective functions. Experimental data: (◦) 120oC , ( )140oC , (4) 160oC . Modelpredictions: (−) S-A, (· · ·) L-M*. (a & d): SSEs, (b & e) SRSE, (c & f) SAE.

108 CHAPTER 4. KINETIC MODELLING OF PHENOL CWAO
Figure 4.7: Dihydric phenol, benzoquinone and formic acid concentration profiles at0.6 MPa using different objective functions. Experimental data: (◦) 120oC, ( )140oC,(4) 160oC. Model predictions: (−) S-A with SAE, (· · ·) L-M* with SSE.

4.2. S-A AND L-M PERFORMANCE 109
4.2.4 Conclusions
The Simulated Annealing algorithm was successfully applied to perform complex non-linear kinetic parameter estimation. The classical Levenberg-Marquardt algorithm wasclearly advantageous when only few parameters are to be optimised, and a sound initialestimate can be provided. On the other hand, only S-A was able to fit well experimen-tal data to the most detailed model, for which the L-M algorithm exhibit insuperableproblems to converge. Thus, the elevated computational cost of this algorithm is largelycompensated by its robustness. For example, the time required on a 700 MHz PC, forthe S-A to converge varied from 30 min for the simple model 1, to 10 h for the mostcomplex case. In case of complex reaction networks, a progressive model building wasfound necessary to achieve convergence within a reasonable computational time. Theobtained S-A solution can be further improved by consecutive application of the L-Malgorithm. In addition, this approach permits calculation of the statistical significanceof the parameters. Also, the form of the objective function may be of importance forthe overall quality of prediction when there exist differences in the order of magnitudeof the experimental concentrations. In such a case, S-A combined with the sum of abso-lute errors, or L-M* with SSE criterion have shown to reasonably fit both high and lowconcentration compounds.
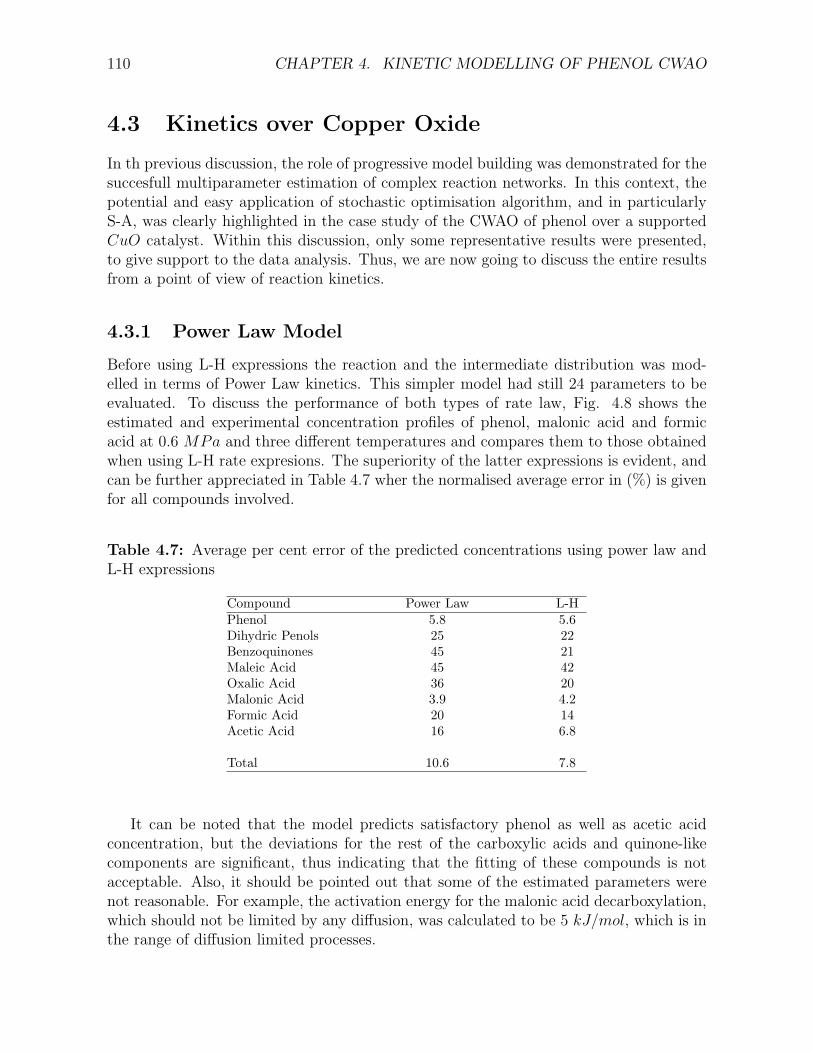
110 CHAPTER 4. KINETIC MODELLING OF PHENOL CWAO
4.3 Kinetics over Copper Oxide
In th previous discussion, the role of progressive model building was demonstrated for thesuccesfull multiparameter estimation of complex reaction networks. In this context, thepotential and easy application of stochastic optimisation algorithm, and in particularlyS-A, was clearly highlighted in the case study of the CWAO of phenol over a supportedCuO catalyst. Within this discussion, only some representative results were presented,to give support to the data analysis. Thus, we are now going to discuss the entire resultsfrom a point of view of reaction kinetics.
4.3.1 Power Law Model
Before using L-H expressions the reaction and the intermediate distribution was mod-elled in terms of Power Law kinetics. This simpler model had still 24 parameters to beevaluated. To discuss the performance of both types of rate law, Fig. 4.8 shows theestimated and experimental concentration profiles of phenol, malonic acid and formicacid at 0.6 MPa and three different temperatures and compares them to those obtainedwhen using L-H rate expresions. The superiority of the latter expressions is evident, andcan be further appreciated in Table 4.7 wher the normalised average error in (%) is givenfor all compounds involved.
Table 4.7: Average per cent error of the predicted concentrations using power law andL-H expressions
Compound Power Law L-HPhenol 5.8 5.6Dihydric Penols 25 22Benzoquinones 45 21Maleic Acid 45 42Oxalic Acid 36 20Malonic Acid 3.9 4.2Formic Acid 20 14Acetic Acid 16 6.8
Total 10.6 7.8
It can be noted that the model predicts satisfactory phenol as well as acetic acidconcentration, but the deviations for the rest of the carboxylic acids and quinone-likecomponents are significant, thus indicating that the fitting of these compounds is notacceptable. Also, it should be pointed out that some of the estimated parameters werenot reasonable. For example, the activation energy for the malonic acid decarboxylation,which should not be limited by any diffusion, was calculated to be 5 kJ/mol, which is inthe range of diffusion limited processes.
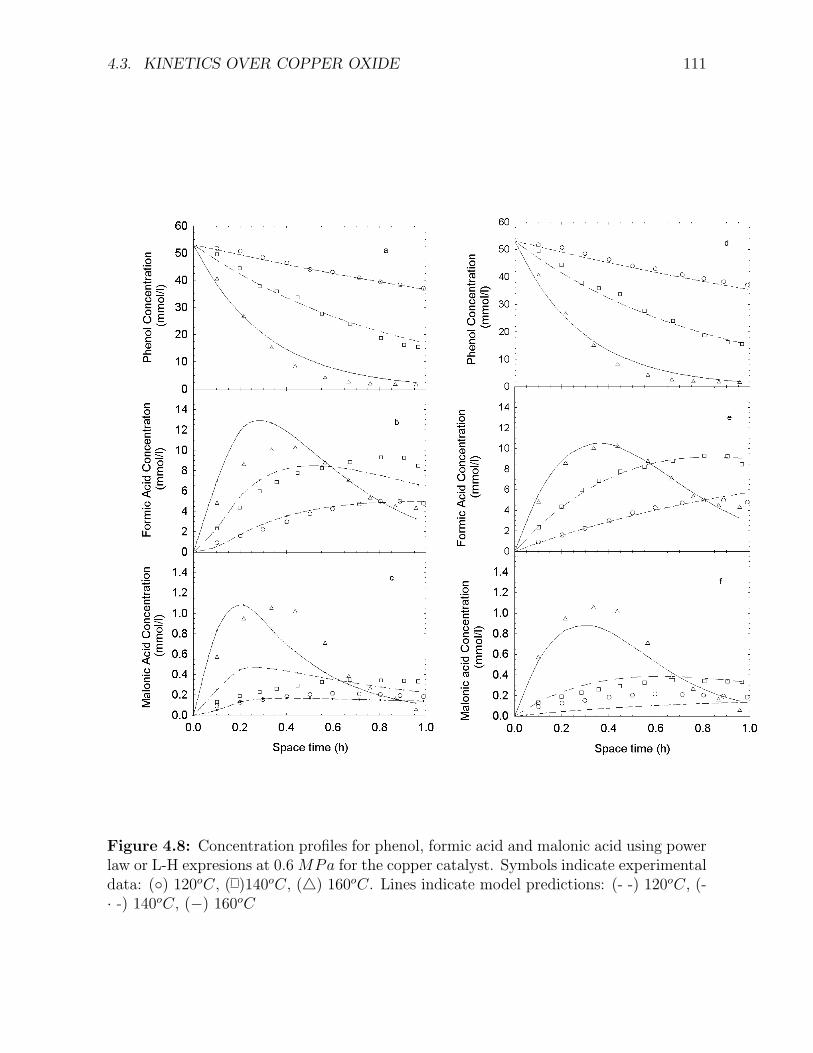
4.3. KINETICS OVER COPPER OXIDE 111
Figure 4.8: Concentration profiles for phenol, formic acid and malonic acid using powerlaw or L-H expresions at 0.6 MPa for the copper catalyst. Symbols indicate experimentaldata: (◦) 120oC, ( )140oC, (4) 160oC. Lines indicate model predictions: (- -) 120oC, (-· -) 140oC, (−) 160oC
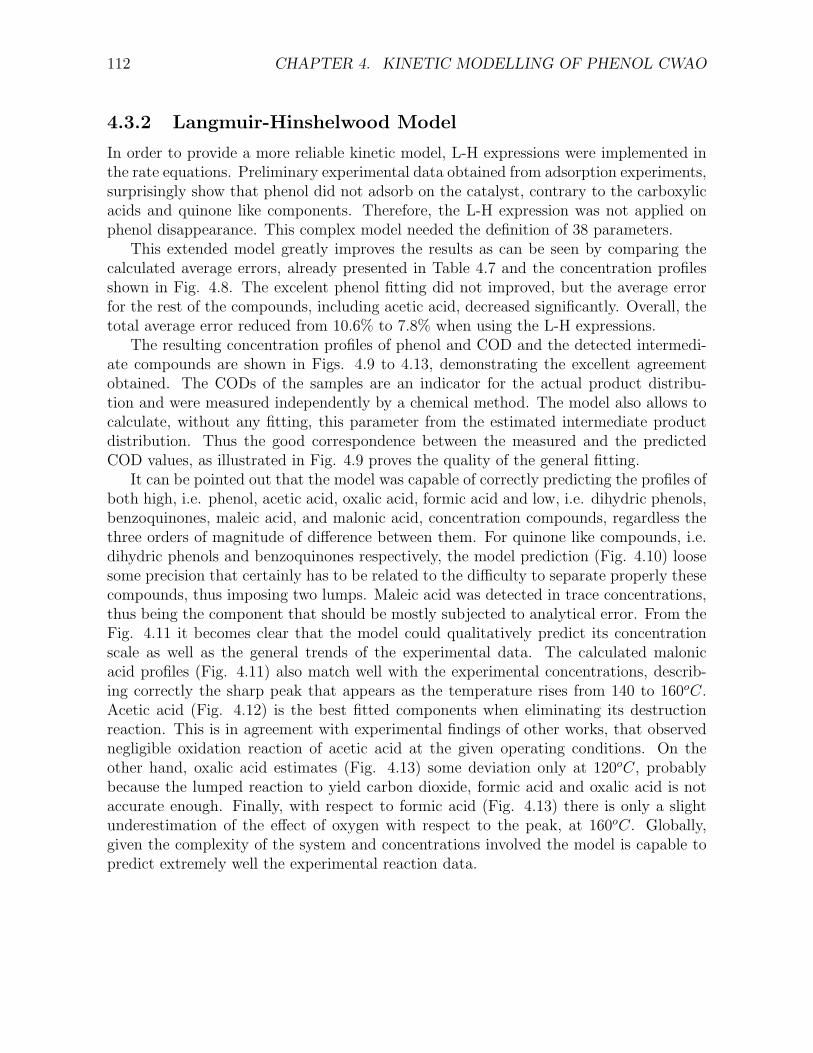
112 CHAPTER 4. KINETIC MODELLING OF PHENOL CWAO
4.3.2 Langmuir-Hinshelwood Model
In order to provide a more reliable kinetic model, L-H expressions were implemented inthe rate equations. Preliminary experimental data obtained from adsorption experiments,surprisingly show that phenol did not adsorb on the catalyst, contrary to the carboxylicacids and quinone like components. Therefore, the L-H expression was not applied onphenol disappearance. This complex model needed the definition of 38 parameters.
This extended model greatly improves the results as can be seen by comparing thecalculated average errors, already presented in Table 4.7 and the concentration profilesshown in Fig. 4.8. The excelent phenol fitting did not improved, but the average errorfor the rest of the compounds, including acetic acid, decreased significantly. Overall, thetotal average error reduced from 10.6% to 7.8% when using the L-H expressions.
The resulting concentration profiles of phenol and COD and the detected intermedi-ate compounds are shown in Figs. 4.9 to 4.13, demonstrating the excellent agreementobtained. The CODs of the samples are an indicator for the actual product distribu-tion and were measured independently by a chemical method. The model also allows tocalculate, without any fitting, this parameter from the estimated intermediate productdistribution. Thus the good correspondence between the measured and the predictedCOD values, as illustrated in Fig. 4.9 proves the quality of the general fitting.
It can be pointed out that the model was capable of correctly predicting the profiles ofboth high, i.e. phenol, acetic acid, oxalic acid, formic acid and low, i.e. dihydric phenols,benzoquinones, maleic acid, and malonic acid, concentration compounds, regardless thethree orders of magnitude of difference between them. For quinone like compounds, i.e.dihydric phenols and benzoquinones respectively, the model prediction (Fig. 4.10) loosesome precision that certainly has to be related to the difficulty to separate properly thesecompounds, thus imposing two lumps. Maleic acid was detected in trace concentrations,thus being the component that should be mostly subjected to analytical error. From theFig. 4.11 it becomes clear that the model could qualitatively predict its concentrationscale as well as the general trends of the experimental data. The calculated malonicacid profiles (Fig. 4.11) also match well with the experimental concentrations, describ-ing correctly the sharp peak that appears as the temperature rises from 140 to 160oC.Acetic acid (Fig. 4.12) is the best fitted components when eliminating its destructionreaction. This is in agreement with experimental findings of other works, that observednegligible oxidation reaction of acetic acid at the given operating conditions. On theother hand, oxalic acid estimates (Fig. 4.13) some deviation only at 120oC, probablybecause the lumped reaction to yield carbon dioxide, formic acid and oxalic acid is notaccurate enough. Finally, with respect to formic acid (Fig. 4.13) there is only a slightunderestimation of the effect of oxygen with respect to the peak, at 160oC. Globally,given the complexity of the system and concentrations involved the model is capable topredict extremely well the experimental reaction data.

4.3. KINETICS OVER COPPER OXIDE 113
Figure 4.9: Concentration profiles of phenol and COD for different oxygen partialpresures and temperatures. Symbols indicate experimental data: (◦) 120oC , ( )140oC ,(4) 160oC . Lines indicate model predictions: (- -) 120oC, (- · -) 140oC, (−) 160oC
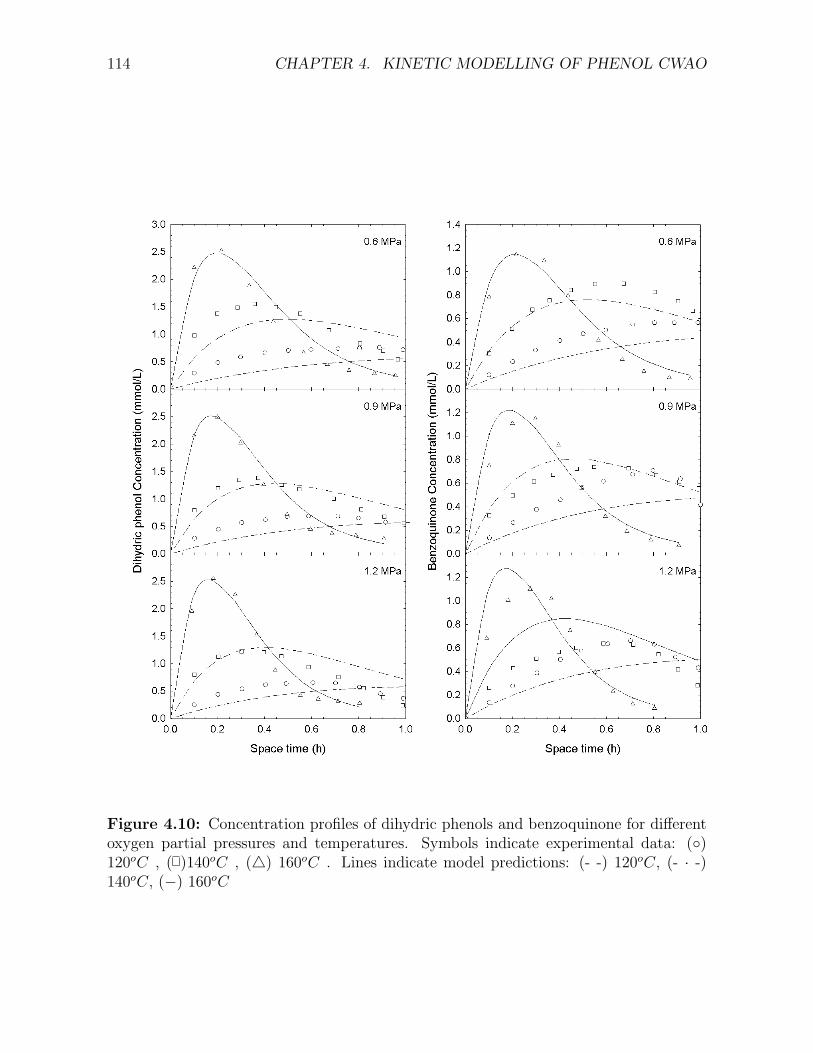
114 CHAPTER 4. KINETIC MODELLING OF PHENOL CWAO
Figure 4.10: Concentration profiles of dihydric phenols and benzoquinone for differentoxygen partial pressures and temperatures. Symbols indicate experimental data: (◦)120oC , ( )140oC , (4) 160oC . Lines indicate model predictions: (- -) 120oC, (- · -)140oC, (−) 160oC

4.3. KINETICS OVER COPPER OXIDE 115
Figure 4.11: Concentration profiles of maleic and malonic acid for different oxygenpartial pressures and temperatures. Symbols indicate experimental data: (◦) 120oC ,( )140oC , (4) 160oC . Lines indicate model predictions: (- -) 120oC, (- · -) 140oC, (−)160oC

116 CHAPTER 4. KINETIC MODELLING OF PHENOL CWAO
Figure 4.12: Concentration profiles of acetic acid for different oxygen partial pressuresand temperatures. Symbols indicate experimental data: (◦) 120oC , ( )140oC , (4)160oC . Lines indicate model predictions: (- -) 120oC, (- · -) 140oC, (−) 160oC
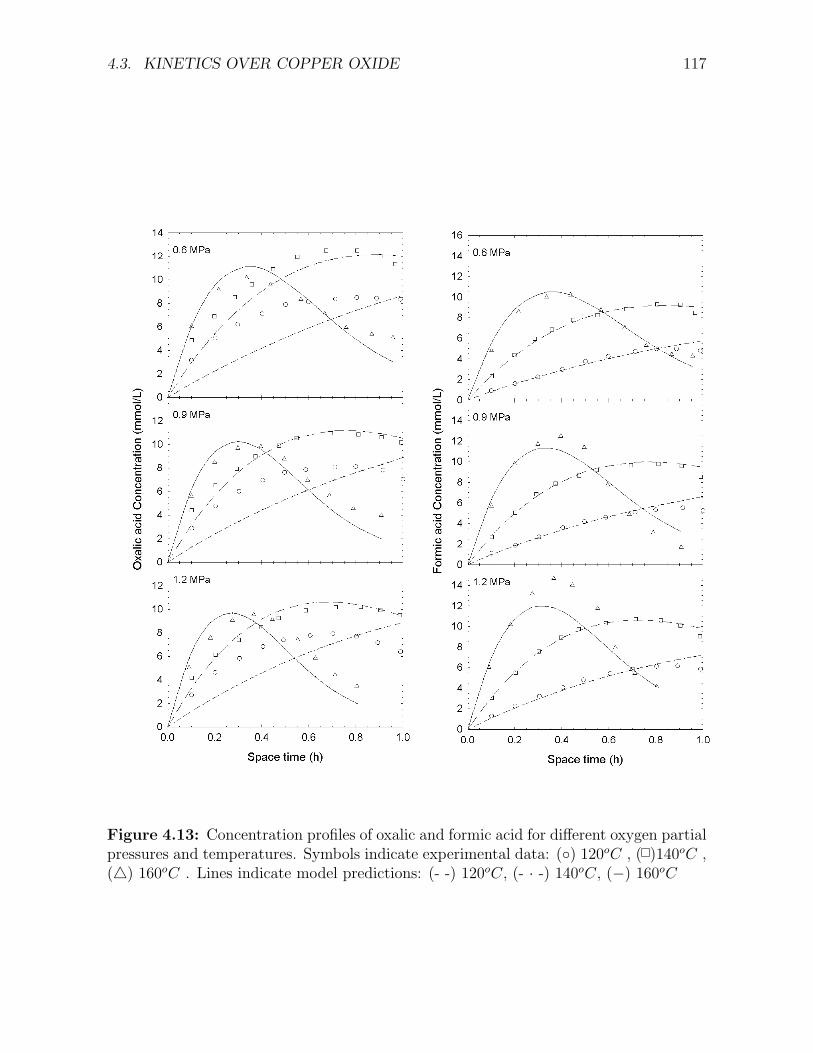
4.3. KINETICS OVER COPPER OXIDE 117
Figure 4.13: Concentration profiles of oxalic and formic acid for different oxygen partialpressures and temperatures. Symbols indicate experimental data: (◦) 120oC , ( )140oC ,(4) 160oC . Lines indicate model predictions: (- -) 120oC, (- · -) 140oC, (−) 160oC

118 CHAPTER 4. KINETIC MODELLING OF PHENOL CWAO
4.3.3 Model Parameters
In this section our aim is to extend the parameter analysis of the complex model 3 tocommend also on the physical meaning that can be attributed to the parameters obtainedby the S-A algorithm using the SAE criterion (Tables 4.8 and 4.9).
Table 4.8: Frequency factors, activation energies and reaction orders
Reaction No ko Ea α(1) kJ/mol
1 1010.91±0.02 74.9± 0.2 0.311± 0.0052 108.4±0.2 52± 1 0.52± 0.043 1011.16±0.03 54.9± 0.2 0.61± 0.014 108.68±0.03 44.7± 0.3 0.35± 0.015 104.72±0.02 27± 4 0.5± 0.16 104.9±0.1 52.3± 0.8 07 1013.9±0.06 91.1± 0.6 0.8± 0.028 109.79±0.04 69.9± 0.4 0.23± 0.011 The frequency factor has reaction dependent units:L/kgcath for reaction 1, mol/kgcath for reactions 2-8.
Table 4.9: Adsorption parameters for each adsorbed compound
Compound K0 Ea
L/mol kJ/mol
Dihydric Phenols 10−0.2±0.2 −28± 1.4Benzoquinones 102.3±0.2 −2± 1Maleic Acid 100.1±0.3 −40± 20Oxalic Acid 102.2±0.07 −11.4± 0.5Malonic Acid 100.7±0.2 −28± 1Formic Acid 100.6±0.1 −8.1± 0.4Acetic Acid 103.7±0.1 −8.6± 8.6
The activation energy for the destruction of phenol was found to be 74.9 kJ/mol. Thisvalue falls within the range of values given for the kinetic control, for example close to the85 kJ/mol [81, 96] and 84 kJ/mol [82]. On the other hand, the oxygen order (α = 0.311)differs from the one half order more usually encountered. The values estimated here arealso slightly different from those evaluated by Fortuny et al. [72] (Ea = 85 kJ/mol and α= 0.5) using the same experimental data set. This difference can be attributed to the factthat in their study the kinetic parameters were obtained only accounting for the phenoldata, whereas in this study phenol and dihydric phenol concentration were matched.

4.3. KINETICS OVER COPPER OXIDE 119
For the rest of reactions included in the reaction network none or few reports ofthe kinetic constants exist. Furthermore, the available studies have been carried outwith pure compounds, and different catalysts, so they cannot be compared in a straightmanner with the values reported in the present study. To evaluate the physical sense ofthe obtained parameters, useful information can be obtained when plotting intermediatecompound concentration versus phenol conversion, as shown in Figs. 4.14 to 4.17.
Figure 4.14: Concentration of dihydric phenols and benzoquinone over the Cu0803catalyst as a function of phenol conversion. (◦) 120oC and 0.6 MPa, ( )140oC and 0.6MPa, (4) 160oC and 0.6 MPa, (♦) 160oC and 0.9 MPa, (∇) 160oC and 1.2 MPa
Dihydric phenols were considered to oxidise forming benzoquinones. The activationenergy for this reaction was found to be 52 kJ/mol, while the oxygen order was 0.5.These values cannot be compared as, to the best of our knowledge, there is no literaturereference reporting any kinetic data for this reaction. In Fig. 4.14 it can be observed thatfor the same phenol conversion dihydric phenol concentration increases with temperature.This clearly indicates that phenol oxidation rate increases more with temperature, thandihydric phenol destruction. Thus a lower activation energy is reasonable for the dihydricphenol oxidation reaction. In the same figure it can be appreciated that the oxygen

120 CHAPTER 4. KINETIC MODELLING OF PHENOL CWAO
partial pressure has only a minor effect on the dihydric phenol concentration, for thesame phenol conversion. Therefore, the 0.5 order encountered, being close to the 0.311found for phenol, seems quite reasonable.
Several benzoquinone degradation reactions can be proposed based on the Devlin andHarris mechanism, here only two of the possible reactions. The first one leads to maleicand oxalic acids, while the second one leads to carbon dioxide, formic acid and oxalicacid. The respective activation energies were found to be 54.9 kJ/mol and 44.7 kJ/mol.This is in agreement with the benzoquinone concentration - phenol conversion profiles,also shown in Fig. 4.14, since benzoquinone concentration increases with temperature.These profiles also indicate that oxygen partial pressure is not significantly influent, sothe oxygen orders should be close to the 0.311 value obtained for phenol. However, thesewere found to be 0.61 and 0.35 for reaction 3 and 4 (see Fig. 4.5), the first one beingsignificantly higher to that of phenol. This high value is dictated from the behaviour ofthe benzoquinone oxidation products, i.e. maleic acid, oxalic acid, and formic acid, aswill be shown in the following paragraphs.
In the first place, maleic acid concentration, for the same phenol conversion, as illus-trated in Fig. 4.15, shows strong dependence on both temperature and oxygen partialpressure. It was found that the activation energy for its destruction was very low, (27kJ/mol), explaining why only trace amounts of this compound were detected. Maleicacid concentration versus phenol conversion, significantly increases with increasing oxy-gen partial pressure. This is reflected in the obtained kinetic parameters in two differentways. In the first place, due to the oxygen order difference between reaction 3 and reac-tion 4 more benzoquinones react towards maleic acid at higher oxygen partial pressures,as can seen in Table 4.10, where the percentage of benzoquinone reacting towards maleicacid is presented. Furthermore, maleic acid degradation was found to have a 0.5 oxy-gen order, i.e. its degradation rate increases less than its formation rate with increasingoxygen concentration. This oxygen order is not in agreement with Rivas et al. [62] whofound zero-order dependence on oxygen, both for non-catalytic and catalytic maleic acidoxidation. Furthermore, for the non-catalytic case they state that oxidation reaction be-come significant only above 170oC, which is higher than the highest temperature in thisstudy. Shende and Levec [127] report a very low oxygen order for the non-catalytic WAOof maleic acid. Thus, it is likely that the observed 0.5 order dependence corresponds toa limiting oxidation step in the sequence, rather than to the decarboxylation of maleicacid to acrylic acid.
Table 4.10: Percentage (%) of benzoquinones reacting towards maleic acid
Pressure Temperature(MPa) 120oC 140oC 160oC0.6 54 58 620.9 57 61 651.2 58 63 66

4.3. KINETICS OVER COPPER OXIDE 121
Figure 4.15: Concentration of maleic and malonic acid over the Cu0803 catalyst as afunction of phenol conversion. (◦) 120oC and 0.6 MPa, ( )140oC and 0.6 MPa, (4)160oC and 0.6 MPa, (♦) 160oC and 0.9 MPa, (∇) 160oC and 1.2 MPa
In the Devlin and Harris reaction scheme maleic acid can be decomposed to formacrylic acid and glyoxalic acid or oxalic acid. Here, only the pathway giving first acrylicacid and, after a large sequence of reactions, leading to malonic acid was taken intoaccount. Malonic acid exhibits a zero-order dependence on oxygen. This was expectedas this step is a simple decarboxylation [119]. In Fig. 4.15, it can be appreciated that theinfluence of of oxygen partial pressure on malonic acid concentration is not as pronouncedas to that of maleic acid. The higher malonic acid quantities obtained at higher pressuresshould be due to the enhancement of this route at higher pressures. The activation energyfor this reaction was found to be 52.3 kJ/mol, higher than that for maleic acid. Thisvalue is comparable with those reported by Mishra et al. [11] for carboxylic acids.
Oxalic acid destruction was found to have high activation energy (91.1 kJ/mol),which also falls within the reported values for carboxylic acids. Oxalic acid degradationis the only reaction included in the network found to have an activation energy higher tothat of phenol. This fact is reflected on the inverse trend exhibited by the initial oxalic

122 CHAPTER 4. KINETIC MODELLING OF PHENOL CWAO
acid profiles with phenol conversion (Fig. 4.16. For low phenol conversions higher oxalicacid concentrations are reported at lower temperatures, leading to the higher activationenergy encountered. Nevertheless, this tendency seems to be inverted at higher phenolconversions and the experimental concentrations for lower temperatures show the ten-dency to become higher with increasing temperature. This could be explained by meansof a radical reaction that prevails at higher phenol conversions, although a model includ-ing two parallel oxalic acid degradation reactions, oxidation and decarboxylation, wastested without any significant improvement of the obtained profiles and prevailing theoxidation pathway.
This step showed high dependency on oxygen, giving a 0.80 order, indicating that ox-alic acid oxidation prevails to decarboxylation. This high value should be expected, sinceat higher oxygen partial pressures, lower oxalic acid concentrations are obtained. Shendeand Mahajani [130], using a homogeneous solution of CuSO4 as catalyst, also report de-pendence on oxygen, although with a significantly lower exponent, 0.321. The calculatedorder indicates that oxalic acid is directly oxidised to give carbon dioxide, rather thanundergoing a decarboxylation to yield formic acid. This seems reasonable as Shende andLevec [129] state that decarboxylation is a very temperature sensitive reaction, report-ing that decarboxylation of oxalic acid only becomes significant at temperatures above180oC.
Formic acid was considered to be directly oxidised towards carbon dioxide. Theactivation energy estimated in this study was 69.7 kJ/mol. This values is slightly lowerto that of phenol, thus the temperature dependence of formic acid concentration onphenol conversion is minor (see Fig. 4.16). This activation energy is also lower than thatgiven for oxalic acid, being in contrast with the refractoriness noted by Shende and Levec[129] for non-catalytic WAO, although at temperatures and pressures higher than thosestudied here. Oxygen was found to have an order of 0.23 in the rate equation, which islower compared to that of phenol. Thus, even though proportionally less benzoquinonesreact towards formic acid at lower oxygen partial pressures, still, the formation of formicacid is favoured at high oxygen partial pressures. The 0.23 order found is in disagreementwith the first order dependence observed by Baldi et al. [98] and Shende and Mahajani[131]. Different experimental conditions may ex‘plain these results, since Baldi et al.[98] conducted the reaction on a similar catalyst (CuO-ZnO), but at significantly highertemperatures (200-240oC), while the Shende and Mahajani [131] authors not only carriedout the reaction at higher temperatures (150-240oC), but also using a homogeneousCuSO4 catalyst.
Acetic acid is considered as the most refractory of the carboxylic acids [11]. Thus, itwas assumed that acetic acid does not undergo any destruction reaction. The excellentagreement between predicted and experimental concentration profiles supports this as-sumption. This is further confirmed by Fig. 4.17, where it is illustrated that practicallyacetic acid concentration depends only on phenol conversion. This further evidents thatthe reactions leading to its formation are very fast compared to the phenol oxidation.The apparent lack of dependence of acetic acid concentration on the temperature or theoxygen partial pressure, is not in disagreement with the previous statements that more

4.3. KINETICS OVER COPPER OXIDE 123
Figure 4.16: Concentration of oxalic and formic acid over the Cu0803 catalyst as afunction of phenol conversion. (◦) 120oC and 0.6 MPa, ( )140oC and 0.6 MPa, (4)160oC and 0.6 MPa, (♦) 160oC and 0.9 MPa, (∇) 160oC and 1.2 MPa

124 CHAPTER 4. KINETIC MODELLING OF PHENOL CWAO
Figure 4.17: Concentration of COD and acetic acid over the Cu0803 catalyst as afunction of phenol conversion. (◦) 120oC and 0.6 MPa, ( )140oC and 0.6 MPa, (4)160oC and 0.6 MPa, (♦) 160oC and 0.9 MPa, (∇) 160oC and 1.2 MPa
benzoquinone reacts towards maleic and eventually acetic acid, because the overall devi-ation shown in Table 4.10 is within the experimental errors for acetic acid concentration.The same observations also hold for the COD profiles, reported in Fig. 4.17.
The corresponding set of optimised adsorption parameters is given in Table 4.9. Novalues in the literature being available any attempt of comparison is meaningless. How-ever, the following conclusions can be drawn. 1) All ∆H are negative and of the sameorder of magnitude. 2) Preliminary adsorption experiments have shown that adsorptiontakes place for carboxylic acids as well as for quinone like compounds, so the resultshave physical meaning. 3) The statistical confidence is higher to the calculated for thekinetic parameters, thus these parameters are less influent in the fitting than the kineticparameters.

4.3. KINETICS OVER COPPER OXIDE 125
4.3.4 Conclusions
A detailed reaction network has been proposed and validated for the Catalytic Wet AirOxidation of phenol over a CuO/γ − Al2O3 catalyst carried out in a Trickle Bed Reac-tor. The parameters of the kinetic model, 38 in number, involved in the rate equationswere obtained by non-linear multiparameter fitting using both S-A and L-M algorithms.The model is capable of matching well experimental concentration profiles not only forphenol, but also for the rest of the detected partial oxidation compounds. The obtainedparameters were found to be in reasonable agreement with those reported in the litera-ture and additionally, to match the selectivity features encountered. Overall consistenceof the selected network was demonstrated by the excellent prediction of experimentalCOD data that were not used in the fitting procedure. Thus, a clear progress in kineticmodelling of CWAO was achieved, as modelling is done currently in terms of lumpedpseudo compounds.
In particular, the use of L-H expressions had a positive effect on the quality of thefitting, since adsorption phenomena cannot be neglected in the solid catalysed reactionsystem. The influence of adsorption in the temperature range studied is less pronouncedthan the effect if temperature on reaction kinetics. This in combination with the lack ofany data of adsorption kinetics of the involved intermediates, made it difficult to discussthe physical meaning of the outcoming adsorption parameters. There is a clear need formore detailed experimental studies of CWAO that include quantitative description of theadsorption phenomena involved in the process.

126 CHAPTER 4. KINETIC MODELLING OF PHENOL CWAO
4.4 Kinetics over Activated Carbon
One of the main objectives of the study of the CWAO of phenol over the Cu0803 catalystwas to test and compare the performance of the S-A algorithm against the conventionalL-M algorithm in the multiparameter optimisation of complex reaction networks. In thispart, we are aiming to assess a reliable kinetic model of the CWAO of phenol over AC,being a stable, active and inexpensive catalytic matter at the same time. We expectthe CWAO of phenol over AC to follow more complex mechanism than over the Cu0803catalyst, because of the formation of an active coke layer, which may lead to the formationof intermediates that were not reported in previous studies.
4.4.1 Phenol degradation kinetics
The preliminary kinetic analysis of the CWAO of phenol over the AC catalyst, presentedin Chapter 3 showed that phenol degradation can be described well by simple power lawexpressions (see Fig. 3.4):
rphen = k0 exp(−Ea/RT ) xαO2
Cphen (4.28)
As phenol adsorption on the AC surface definetely takes place [18], the application of L-Hwas also tested. The equation used considers only phenol adsorption on a single catalystsite:
rphen = k0 exp(−Ea/RT )K0phen Cphen xα
O2exp(−∆Hphen/RT )
1 + K0phenCjexp(−∆Hphen/RT )(4.29)
Nevertheless, as the P-L fit was already in good agreement with experimental observation,L-H kinetics neither improved, nor deteriorated, phenol concentration profiles. This canbe seen in Fig. 4.18, where both L-H and P-L profiles are plotted. The estimated kineticparameters are presented in Table 4.11.
Table 4.11: Kinetic and adsorption Parameters for Phenol degradation kinetics overactive carbon using L-H kinetics
k0 Ea α K0 ∆H(*) (kJ/mol) (-) (L/mol) (kJ/mol)
P-L 1013.6±0.1 70.3 ± 0.4 0.95 ± 0.02L-H 1013.7±0.1 75.1 ± 0.4 0.98 ± 0.02 10−0.2±0.3 -7.4 ± 0.7
* The frequency factor is in (L/kgcat h) for power law kinetics and in (mol/kgcat h) forL-H.
It is interesting to note that for L-H kinetics the lumped frequency factor (K0 ·k0), andthe lumped activation energy (∆H + Ea) are in very close agreement with the respectiveparameters obtained with P-L kinetics. Then, taking into account that the term 1 +

4.4. KINETICS OVER ACTIVATED CARBON 127
K0 exp(−∆H/RT ) Cphen of the denominator of the L-H expression takes only valuesbetween 1 and 1.35, i.e. not significantly influent, it can be concluded that the solutionobtained with the L-H kinetic expressions is practically the same with the obtained withsimple power law kinetics. It is likely that the phenol concentrations studied are within arange in which adsorption effects cannot be quantified and simple power law kinetics canapproximate with the same accuracy the more general L-H expressions. Assuming singlesite phenol adsorption, deviations from the P-L kinetics should be expected at higherphenol concentrations.
Figure 4.18: Concentration profiles for phenol over the AC catalyst for different oxy-gen partial pressures and temperatures using P-L (- -) and L-H ( ) kinetics. Pointsexperimental data: (◦): 120oC , ( ): 140oC , 4: 160oC .

128 CHAPTER 4. KINETIC MODELLING OF PHENOL CWAO
4.4.2 Ring compound reaction network
A detailed analysis of the experimental data for the AC, suggested that phenol undergoestwo parallel reactions to form either 4-Hydroxybenzoic acid (4HBA), or benzoquinone.This assumption is now investigated in terms of kinetic modelling. The parallel phenoldegradation (scheme 3) towards benzoquinone and 4-HBA was compared to two consec-utive schemes shown in Fig. 4.19
Figure 4.19: Proposed ring compound reaction schemes for the CWAO of phenol overAC.
The Sum of Absolute Errors for each scheme was 40, 67 and 29 for schemes 1, 2 and3 respectively, indicating that the parallel scheme outerperforms the sequential ones. Forthese calculations P-L expressions were used for phenol, and L-H for benzoquinone and4-HBA. The application of P-L kinetics for all three compounds did not performed well,as a significant deterioration of the calculated profiles of the intermediate compounds wasobserved.

4.4. KINETICS OVER ACTIVATED CARBON 129
4.4.3 Overall Reaction Network
According to the hierarchical approach, several pathways were tested for the CWAO ofphenol over AC. In agreement with the observations on the aromatic ring compounds inall models the parallel phenol oxidation scheme was postulated. The first scheme (modelAC-1) was build up following the reaction network obtained for the Cu0803 catalyst, andconsequently is based on the Devlin and Harris mechanism. Benzoquinone was modelledsuch as to form both maleic acid and formic acid. For the Cu0803 catalyst in each ofthese two reactions one mole of oxalic acid is formed, while for the AC catalyst oxalic acidwas only detected in trace concentrations and it was omitted in this network. It was ob-served that the model predictions improved when the formation of 4 moles of formic acidwas postulated for each mole of benzoquinone destroyed. Formic acid was consequentlyconsidered to further oxidise towards carbon dioxide. Similarly to the Cu0803 reactionnetwork, maleic acid was considered to react forming only refractory acetic acid, whichaccumulates in the system. 4-HBA was given the possibility to disassociate to formingbenzoquinone as well as formic acid. The resulting reaction equations are listed belowand the reaction scheme is reproduced in Fig. 4.20.
C6H5OH + CO2r1→ C7H6O3 (4.30)
C6H5OH + O2r2→ C6H4O2 + H2O (4.31)
C7H6O3 + 0.5O2r3→ C6H4O2 + HCOOH (4.32)
C6H4O2 + 3O2r4→ C4H4O4 + 2CO2 (4.33)
C6H4O2 + 4O2r5→ 4HCOOH + 2CO2 (4.34)
C4H4O4 + O2r6→ C2H4O2 + 2CO2 (4.35)
HCOOH + 0.5O2r7→ CO2 + H2O (4.36)
In agreement with the previous observations for the phenol destruction (Reactions 1& 2) simple P-L expressions were postulated:
rphen = k0i exp(−Eai/RT ) xαO2
Cphen (4.37)
For the degradation reactions of the intermediates (Reactions 3-7), competitive adsorp-tion on the same active site was considered:
ri = k0i exp(−Eai/RT )K0i Ci x
αO2
exp(−∆Hi/RT )
1 +∑
K0Cjexp(−∆Hj/RT )(4.38)
For this scheme the net destruction or production rates Rj of the involved compoundsare given by the following equations:
Rphen = −r1 − r2 (4.39)
R4−HBA = r1 − r3 (4.40)

130 CHAPTER 4. KINETIC MODELLING OF PHENOL CWAO
Rbenz. = r2 + r3 − r5 − r4 (4.41)
Rmaleic = r4 − r6 (4.42)
Racetic = r6 (4.43)
Rformic = r3 + r5 − r7 (4.44)
The second scheme (model AC-2) proposed was developed from the analysis of ex-perimental concentration profiles as outlined in Chapter 3. It was observed that benzo-quinone and formic acid exhibit a maximum concentration at space times 2 or 3 timeslower than 4-HBA and maleic acid. This suggests two different schemes, one going frombenzoquinone directly to formic acid and eventually to carbon dioxide and water, and another going from 4-HBA to maleic acid and finally to refractory acetic acid. This schemeis shown in Fig. 4.21 and the corresponding equations are listed below.
C6H5OH + CO2r1→ C7H6O3 (4.45)
C6H5OH + O2r2→ C6H4O2 + H2O (4.46)
C7H6O3 + 2O2 + H2Or3→ C4H4O4 + C2H4O2 + CO2 (4.47)
C7H6O3 + 0.5O2r4→ C6H4O2 + HCOOH (4.48)
C6H4O2 + 4O2r5→ 4HCOOH + 2CO2 (4.49)
C4H4O4 + O2r6→ C2H4O2 + 2CO2 (4.50)
HCOOH + 0.5O2r7→ CO2 + H2O (4.51)
As for model AC-1, P-L expressions were postulated for reactions 1 & 2 and L-H forreactions 3-7. For this scheme the individual compound production or destruction ratesRj are given by the following relationships:
Rphen = −r1 − r2 (4.52)
R4−HBA = r1 − r3 − r4 (4.53)
Rbenz. = r2+r4 − r5 (4.54)
Rmaleic = r3 − r6 (4.55)
Racetic = r3 + r6 (4.56)
Rformic = r4 + r5 − r7 (4.57)

4.4. KINETICS OVER ACTIVATED CARBON 131
Figure 4.20: Proposed model for the CWAO of phenol over active carbon (AC-1)
Figure 4.21: Proposed model for the CWAO of phenol over active carbon (AC-2)
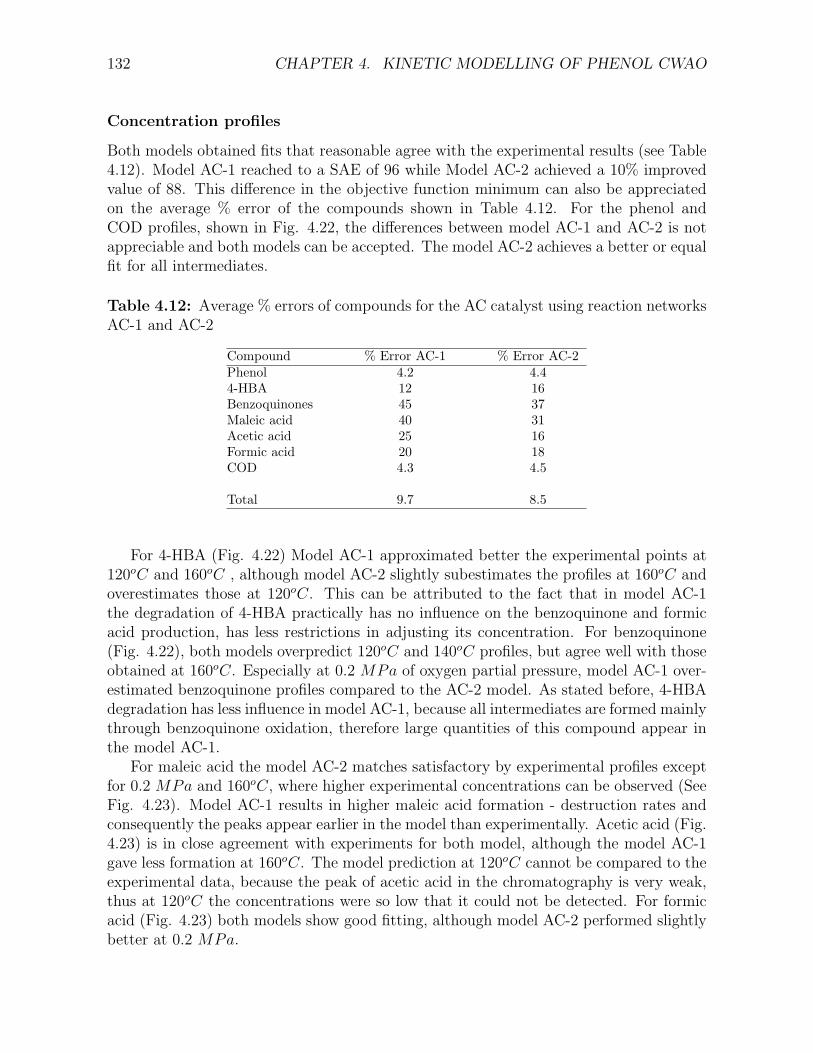
132 CHAPTER 4. KINETIC MODELLING OF PHENOL CWAO
Concentration profiles
Both models obtained fits that reasonable agree with the experimental results (see Table4.12). Model AC-1 reached to a SAE of 96 while Model AC-2 achieved a 10% improvedvalue of 88. This difference in the objective function minimum can also be appreciatedon the average % error of the compounds shown in Table 4.12. For the phenol andCOD profiles, shown in Fig. 4.22, the differences between model AC-1 and AC-2 is notappreciable and both models can be accepted. The model AC-2 achieves a better or equalfit for all intermediates.
Table 4.12: Average % errors of compounds for the AC catalyst using reaction networksAC-1 and AC-2
Compound % Error AC-1 % Error AC-2Phenol 4.2 4.44-HBA 12 16Benzoquinones 45 37Maleic acid 40 31Acetic acid 25 16Formic acid 20 18COD 4.3 4.5
Total 9.7 8.5
For 4-HBA (Fig. 4.22) Model AC-1 approximated better the experimental points at120oC and 160oC , although model AC-2 slightly subestimates the profiles at 160oC andoverestimates those at 120oC. This can be attributed to the fact that in model AC-1the degradation of 4-HBA practically has no influence on the benzoquinone and formicacid production, has less restrictions in adjusting its concentration. For benzoquinone(Fig. 4.22), both models overpredict 120oC and 140oC profiles, but agree well with thoseobtained at 160oC. Especially at 0.2 MPa of oxygen partial pressure, model AC-1 over-estimated benzoquinone profiles compared to the AC-2 model. As stated before, 4-HBAdegradation has less influence in model AC-1, because all intermediates are formed mainlythrough benzoquinone oxidation, therefore large quantities of this compound appear inthe model AC-1.
For maleic acid the model AC-2 matches satisfactory by experimental profiles exceptfor 0.2 MPa and 160oC, where higher experimental concentrations can be observed (SeeFig. 4.23). Model AC-1 results in higher maleic acid formation - destruction rates andconsequently the peaks appear earlier in the model than experimentally. Acetic acid (Fig.4.23) is in close agreement with experiments for both model, although the model AC-1gave less formation at 160oC. The model prediction at 120oC cannot be compared to theexperimental data, because the peak of acetic acid in the chromatography is very weak,thus at 120oC the concentrations were so low that it could not be detected. For formicacid (Fig. 4.23) both models show good fitting, although model AC-2 performed slightlybetter at 0.2 MPa.

4.4. KINETICS OVER ACTIVATED CARBON 133
Figure 4.22: Phenol, COD, 4-HBA and benzoquinone concentration profiles over theAC catalyst at different temperatures and pressures for the activated carbon catalyst.Circles: 120oC , Squares: 140oC , Triangles: 160oC . Lines indicate model predictions.Dash: 120oC , Dash Dot: 140oC , continuous: 160oC

134 CHAPTER 4. KINETIC MODELLING OF PHENOL CWAO
Figure 4.23: Maleic acid, acetic acid and formic acid concentration profiles at differenttemperatures and pressures for the activated carbon catalyst. Circles: 120oC , Squares:140oC , Triangles: 160oC . Lines (- -) AC-1, (−) AC-2

4.4. KINETICS OVER ACTIVATED CARBON 135
Kinetic parameters:
Optimised reaction and adsorption parameters for both models are presented in Tables4.13 and 4.14. There are no specific data available in the literature for most of thereactions considered here, but in general the obtained constants agree reasonably wellwith typical values for similar reaction systems.
Table 4.13: Frequency Factors, Activation Energies and Heat of adsoption for theCWAO of Phenol over Activated Carbon
Reaction No k0 AC-1 k0 AC-2 Ea AC-1 Ea AC-2 α AC-1 α AC-2(1) (1) (kJ/mol) (kJ/mol) (-) (-)
1 1013.88±0.02 1013.99±0.02 83.9± 0.6 75.9± 0.6 0.86± 0.02 1.05± 0.022 1013.59±0.02 1013.65±0.01 69.8± 0.6 71.9± 0.4 0.97± 0.02 0.93± 0.013 1011.88±0.02 1011.97±0.09 70.6± 0.6 69± 1 0.62± 0.02 0.79± 0.024 1012.25±0.02 - 68.2± 0.6 - 1.02± 0.02 -5 1011.38±0.02 1013.8±0.5 67.1± 0.6 70± 5 0.78± 0.02 1.0± 0.16 1011.53±0.02 1013.4±0.4 57.1± 0.6 69± 4 0.85± 0.02 1.0± 0.17 1011.99±0.02 1012.1±0.1 65.2± 0.6 67.7± 0.8 0.82± 0.02 0.77± 0.02
1 The frequency factor has reaction dependent units. For reaction 1 is in (L/kgcath), while for the restof the reaction constants is in (mol/kgcath).
Table 4.14: Adsorption parameters for the CWAO of phenol over Active carbon.
Compound K0 AC-1 K0 AC-2 ∆H AC-1 ∆H AC-2(L/mol) (L/mol) (kJ/mol) (kJ/mol)
4-HBA 103.53±0.3 104.5±0.3 −9.6± 2 −4± 2Benzoquinones 105.98±0.3 105.2±0.7 −5.1± 2 −1± 0.5Maleic acid 104.59±0.3 104.3±0.4 −0.8± 2 −1± 1Acetic acid 105.21±0.3 105.0±0.2 −5.2± 2 −4± 1Formic acid 104.51±0.3 104.0±0.1 −45.6± 2 −6± 2
As done for the Cu0803 catalyst, the experimental intermediate selectivities can beused to verify at least the relation between the values of the obtained kinetic parameters.When plotting intermediate compound concentration against phenol conversion (Figs.4.24 to 4.26) it can be observed that the temperature and pressure dependencies are notas pronounced as in the case of the Cu0803 catalyst. Thus, it should be expected that thecalculated parameters are similar for all reaction. Indeed, it can be observed in Tables4.13 and 4.14 that both models obtained similar constants, for the reactions in common,and the values do not present the same dispersion as in the case of Cu0803.
The reaction leading to the formation of 4-HBA from phenol has an activation energyof 83.9 kJ/mol for model AC-1 and 75.9 kJ/mol for model AC-2. For both models,this activation energy is higher than the corresponding to the activation energy of thereaction leading to benzoquinone (69.8 kJ/mol and 71.9 kJ/mol respectively). From

136 CHAPTER 4. KINETIC MODELLING OF PHENOL CWAO
Figure 4.24: 4-HBA and Benzoquinone concentration as a function of Phenol conversionover AC. (◦) 120oC, (( )) 140oC, 4 160oC. Filled triangles 0.1 MPa and 160oC
the obtained reaction parameters, it can be calculated that phenol is mainly destroyedtowards benzoquinone, since for model AC-1 only 7-10% of the phenol reacts towards4-HBA, while for model AC-2 this percentage is between 15-17%. For this reason thekinetic parameters of the reaction of phenol degradation to benzoquinone are very similarto those obtained when only phenol oxidation was examined.
Fig. 4.24 indicates that there is a positive effect of temperature on the obtainedconcentration of benzoquinone and 4-HBA. So the activation energies of the degradationreactions of these compounds should be lower than those of their formation from phenol.Indeed, both models give slightly lower values for the destruction reactions. In modelAC-1 the decomposition of 4-HBA towards benzoquinone and formic acid only slightlyinfluences the rest of profiles. The same reaction was found to be not influent at modelAC-2. For this model the maleic and acetic acid profiles exclusively depend on thedegradation rate of 4-HBA via reaction 3. The better profiles obtained by the modelAC-2 may indicate that the proposed route is more realistic than the classical approachthat considers the formation of these compounds mainly through the benzoquine root.Nevertheless, both models fail to predict the degradation rate of maleic acid at 160oC .The rapid degradation at this temperature is imposed in the model by the high rate offormation of acetic acid. Probably at 160oC , a different route leading to acetic acid,becomes significant.

4.4. KINETICS OVER ACTIVATED CARBON 137
Figure 4.25: Maleic and Acetic acid concentration as a function of Phenol conversionover AC. (◦) 120oC, (( )) 140oC, 4 160oC. Filled triangles 0.1 MPa and 160oC
Maleic to acetic acid activation energy was different in both models, taking a valueof 57.1 kJ/mol for model AC-1 and 69 kJ/mol for model AC-2. These values are muchhigher than that obtained for the Cu0803 catalyst, since this acid is present in higherquantities for the AC catalyst. The dependence of maleic acid concentration with phenolconversion, presented in Fig. 4.25, illustrates that the maleic acid degradation has thesame pressure and temperature dependence as its formation. Model AC-1 yields similaroxygen orders for reactions 1 and 6, but significantly different activation energies (83.9 and57.1 kJ/mol). On the other hand, model AC-2 gives better agreement for the respectiveactivation energies (72 and 69 kJ/mol). Thus, the latter values should be more reliable.Acetic acid concentration for a given phenol conversion, also shown in Fig. 4.25, seemsto be only slightly affected by oxygen partial pressure and temperature, indicating that,as also happened for the Cu0803 catalyst, the reactions leading to its formation are fast,compared to the degradation of phenol.
The obtained formic acid degradation reaction parameters are close for both models,the activation energy being 65.2 and 67.7 kJ/mol respectively, while the oxygen order was0.82 and 0.77 respectively. The positive effect of both temperature and pressure on theformic acid concentration for a given phenol conversion, as can be observed in Fig. 4.26,justifies that both activation energy and oxygen order are lower than the correspondingvalues of reaction 2. Overall, COD concentration as a function of phenol conversion (Fig.
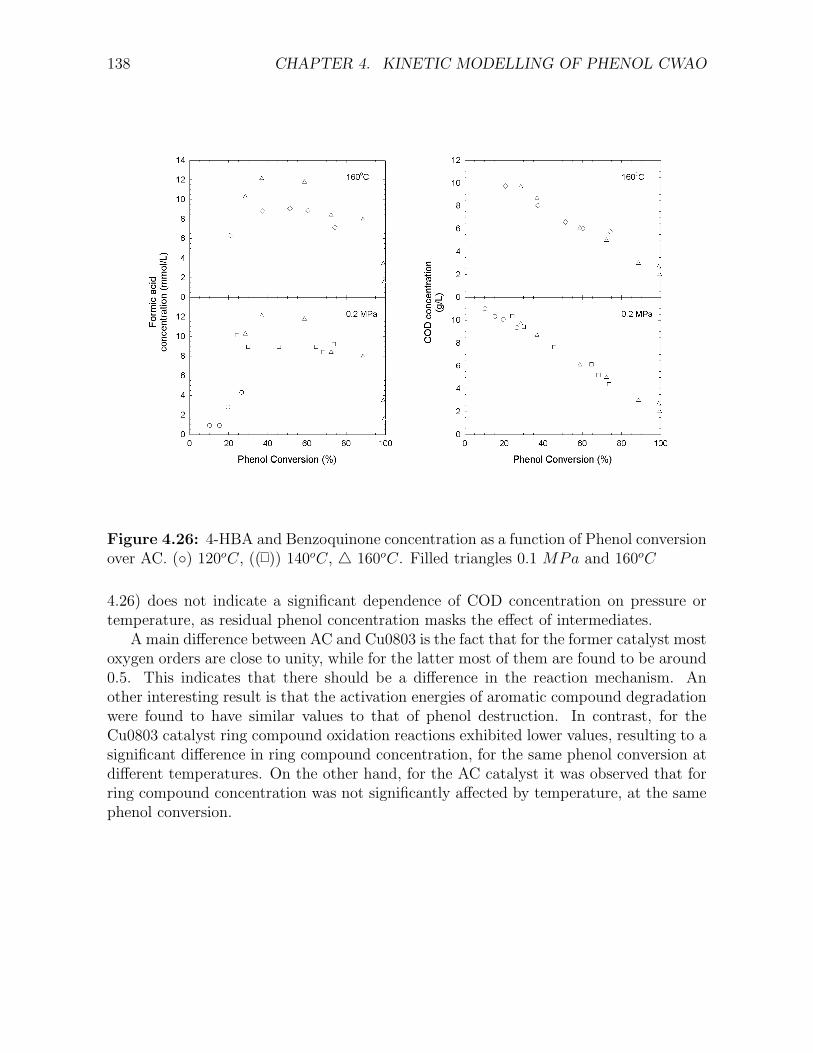
138 CHAPTER 4. KINETIC MODELLING OF PHENOL CWAO
Figure 4.26: 4-HBA and Benzoquinone concentration as a function of Phenol conversionover AC. (◦) 120oC, (( )) 140oC, 4 160oC. Filled triangles 0.1 MPa and 160oC
4.26) does not indicate a significant dependence of COD concentration on pressure ortemperature, as residual phenol concentration masks the effect of intermediates.
A main difference between AC and Cu0803 is the fact that for the former catalyst mostoxygen orders are close to unity, while for the latter most of them are found to be around0.5. This indicates that there should be a difference in the reaction mechanism. Another interesting result is that the activation energies of aromatic compound degradationwere found to have similar values to that of phenol destruction. In contrast, for theCu0803 catalyst ring compound oxidation reactions exhibited lower values, resulting to asignificant difference in ring compound concentration, for the same phenol conversion atdifferent temperatures. On the other hand, for the AC catalyst it was observed that forring compound concentration was not significantly affected by temperature, at the samephenol conversion.

4.4. KINETICS OVER ACTIVATED CARBON 139
4.4.4 Conclusions
The CWAO of phenol over AC was also shown to follow a complex parallel - consecutivereaction network. It has been suggested that phenol oxidation over AC proceeds via twoparallel reactions. The first and dominating one leads to the formation of benzoquinone,in agreement with most schemes reported in the literature. The second one leads to theformation of 4-HBA and may be related to the active coke layer formed over the AC.The reaction mechanism leading to final products, i.e. water, carbon dioxide and aceticacid needs further investigation, but the results presented here indicate the existence ofparallel roots one leading to maleic and ultimately acetic acid, and the other one leadingto formic acid which is then mineralised to CO2 and H2O.
The complexity of the phenol CWAO over AC requires further in-depth study. Phenoloxidation kinetics using more concentrated feed solution should be assessed, to determinethe validity range of the herein reported P-L kinetics, and to obtain more general L-Hexpressions. It is also important to identify the unknown phenol degradation interme-diates to refine the kinetic model. Finally, a study of the AC surface prior to and afterreaction, by means of common characterisation techniques, like BET area, TPR-TPO,FTIR, elemental analysis, etc., has to be done to elucidate the formation of the coke layeron the AC surface and its role in the mechanism of the CWAO of phenol.

140 CHAPTER 4. KINETIC MODELLING OF PHENOL CWAO

Chapter 5
TBR Modelling and Scale up
Up to date, the reaction engineering aspects of the CWAO have received little attention,considering the scarce studies available in the open literature. Nevertheless, the successfulscale up is one key element for the establishment of any emergent technology. Thus, weultimately attempt to investigate the operation of a pilot plant reactor through numericalsimulations using both the reactor kinetics and the comprehensive TBR, previously es-tablished. By doing this, we are aiming to give recommendations for a proper operationstrategy of the pilot plant destinated to carry our the CWAO of phenol. Prior to theapplication of the TBR model for the scale up of the process, a sensitivity analysis isdone and the model is subsequently validated against the experimental data obtained inthe laboratory TBR. In the following, we then present and discuss simulation results forthe pilot plant scale reactor using the kinetics obtained for the Cu0803 catalyst. Similartendencies can also be observed for the AC catalyst.
5.1 Validation of the complex TBR Model
With respect to the ideal plug flow reactor model used for the kinetic processing of thelaboratory TBR data, the comprehensive TBR model accounts for the consumption ofoxygen in the gas phase, as well as external and internal mass transfer resistances ofreactants and products. The effects of reactor hydrodynamics are also addressed, andspecial emphasis has been given to the contribution of the dry zones (catalyst wetting)in the oxygen mass transfer to the catalyst surface. The required mass transfer and hy-drodynamic parameters for the complex TBR model are calculated from the correlationspresented in Chapter 2.4. For the gas - liquid mass transfer the correlation of Iliuta et al.[185] was chosen, while for the liquid - solid mass transfer the correlations of Lakota andLevec [219] was selected. These correlations are based on high pressure data and shouldbe more reliable for the typical operation conditions of CWAO.
141

142 CHAPTER 5. TBR MODELLING AND SCALE UP
5.1.1 Sensitivity analysis
As pointed out in the introduction, the mass transfer and hydrodynamic parameters,when calculated by available correlations, are subjected to some errors. This situationis clearly demonstrated in Fig. 1.13 for different parameters. To assess the influenceof the involved parameters in the model prediction, an isothermal sensitivity analysiswas performed using the TBR model prediction and operating conditions that maximisethe phenol destruction reaction rate. The oxidation of phenol over the AC catalyst at160oC, 0.2 MPa and 0.05 h of space time was thus considered. The corresponding set ofoperating conditions, mass transfer and hydrodynamic parameters are presented in Table5.1.
Table 5.1: Standard operating conditions, mass transfer and hydrodynamic parametersof the laboratory reactor used for the sensitivity analysis of the comprehensive TBRmodel.
Operating ConditionsTemperature 160oCOxygen partial pressure 0.2 MPaTotal pressure 16 MPaInlet phenol concentration 53.1 mmol/LSpace time 0.05 hLiquid superficial velocity (uls) 0.42 mm/sGas superficial velocity ugs 3.7 mm/sReactor characteristicsReactor diameter 11 mmReactor height 0.2 mBed porosity 0.13Packing specific surface area 1.1 104 m2/m3
Catalyst characteristicsCatalyst ACCatalyst particle density ρp 400 g/LCatalyst particle diameter 0.5 mmCatalyst particle porosity 0.8Tortuosity factor 3 (assumed)Hydrodynamic parametersAxial dispersion coefficient 1.57 10−7 m2/sWetting efficiency 0.35Dynamic liquid hold up 0.05Static liquid hold up 0.05Mass transfer parametersEffective diffusion coefficients (O2/Phen.) 4.32 10−9/ 1.8 10−9 m2/sDynamic liquid - solid mass transfer coefficients (O2/Phen.) 4.33 10−4 / 2.70 10−4 m/sStatic liquid - solid mass transfer coefficients (O2/Phen.) 3.26 10−6 / 2.00 10−6 m/sStatic- dynamic liquid volumetric mass transfer coefficient 0.01 s−1
Gas - solid mass transfer coefficient 1.0 10−3 m/sGas - liquid volumetric mass transfer coefficient 1.0 s−1

5.1. VALIDATION OF THE COMPLEX TBR MODEL 143
When the parameter values presented in Table 5.1 are fed to the TBR model, areference phenol conversion of 28.5% is calculated, as shown in Table 5.2. In the first placeit can be said that the model predictions are insensitive to variations of the hydrodynamicparameters. In particular, the phenol conversion was practically the same as the referenceconversion when the axial dispersion coefficient was varied in the range of 1.57 10−8 to1.57 10−6, the wetting efficiency in the rangeof 0.2 to 0.9, the liquid holdup in the range of0.05-0.1, with different proportions between the dynamic and the static holdup. Secondly,if very high external and internal mass transfer coefficients are postulated (two ordersof magnitude higher than in Table 5.1) the phenol conversion tends to a value of 28.8%,which is also close to the reference conversion of 28.5%, indicating that the mass transferis sufficiently high. The simple kinetic model for the same case predicted 30% phenolconversion, and the slight deviation is mainly attributed to the fact that the kinetic modeldoes not account for the oxygen consumption. Note however, that the sensitivity analysisis performed for the conditions in which oxygen consumption is maximum.
Since there exists the possibility that external and internal mass transfer coefficientsare overestimated by the correlations, simulations were carried out with 10 times smallervalues. The decrease of phenol mass transfer coefficients did not alter the reference phenolconversion, as phenol is the excess reactant. For oxygen and partial catalyst wetting ,only the increase of the effective diffusion coefficients led to significantly lower conversionsof 17.0%, whereas the reduction of the gas to solid mass transfer only coefficient slightlyaffected the phenol conversion, yielding 28.1%, as shown in Table 5.2. The variation ofthe rest of parameters did not change the calculated phenol conversion.
Table 5.2: Sensitivity analysis of the TBR model, assuming oxygen as limiting reactant,for the AC catalyst at 160oC and 0.2MPa, at a space time of 0.05 h.
Parameter Phenol Phenolvaried Conversion (%) Conversion (%)
(f = 0.35) (f = 1)none (Table 5.1) 28.5 25.3Deff/10 17.0 15.7kd
ls/10 28.5 20.8ks
ls/10 28.5 20.8(ka)gl/10 28.5 13.5(ka)ll/10 28.5 25.3kgs/10 28.1 -
It can be assumed that the gas-liquid, liquid-solid and liquid-liquid mass transfercoefficients are not influent at partial catalyst wetting conditions, because of the highrates of gas-solid mass transfer, which provides sufficient quantities of oxygen on thecatalyst surface, despite the low value of the rest of external mass transfer coefficients.To study the effect of catalyst wetting, calculations were carried out assuming completecatalyst wetting, the rest of parameters being the same. The assumption of completewetting resulted in a lower phenol conversion of 25.3%, as also shown in Table 5.2. In

144 CHAPTER 5. TBR MODELLING AND SCALE UP
this case, however, predictions with decreased mass transfer parameter values lead now tosignificantly lower conversions, indicating that external mass transfer coefficients becomeinfluent. These results clearly highlight the need to account for the effect of the directgas-solid transport across the dry catalyst surface, caused by partial wetting. As a matterof fact, the correlations for the calculation of catalyst wetting show significant variationgiving values in the range of 0.25 to 0.8. However, this inconvenience is not critical inthe model prediction, as in our system, partial wetting effects become already maximumfor a f below 0.95, and thus phenol conversion does not depend on the catalyst wettingfor smaller f values.
5.1.2 TBR Model validation
The close agreement between the complex TBR model, the pure kinetic model, assumingideal plug flow and the experimental data, obtained in the laboratory reactor, was verifiedover a wide range of operating conditions. The experimental intrinsic conditions of theTBR runs are set to provide intrinsic kinetic control, thus the complex TBR modeland the kinetic model should give the same predictions. This situation is illustrated inFig. 5.1, where the phenol concentration profiles calculated with the TBR model areexemplarily presented for a) the Cu0803 catalyst at 0.6 MPa and b) the AC catalystat 0.2 MPa. The quality of the transport-reaction TBR model prediction, reinforcesboth the assumption of no mass transfer limitations in the laboratory reactor and theconfidence in the TBR model.
Figure 5.1: Comparison of kinetic (- -) and TBR (−) models for the a) Cu0803 catalystat 0.6 MPa and b) AC catalyst at 0.1 MPa. Points indicate experimental data: (◦):120oC , ( ): 140oC , (4): 160oC .

5.2. MODEL AIDED TBR SCALE UP 145
5.1.3 Conclusions
It was shown that the comprehensive transport - reaction TBR model is capable to matchexperimental results obtained in the laboratory reactor, indicating that the latter oper-ates in the kinetic controlled regime. A sensitivity analysis demonstrated that the mostinfluent parameters, at typical CWAO conditions and oxygen being the limiting reactant,are the internal diffusion coefficients and the gas-solid mass transfer coefficient. In thecase of complete wetting, i.e. for high liquid flow rates, the values of the gas-liquid andliquid solid mass transfer coefficients can also become influent. The entire results showthat the comprehensive TBR model can be used with confidence for the scale-up of theCWAO of phenol. However, one has to be aware that the overall quality of the predictionwill mainly depend on the accuracy of the key parameters (f, Deff , kgs, (ka)gl, (klsas)),as highlighted in the sensitivity study.
5.2 Model Aided TBR scale up
In the following scale up the laboratory TBR for the CWAO of phenol is simulatedand discussed, in terms of isothermal operation, to evaluate mass transfer effects, andsubsequently of adiabatic operation to account for heat release by the oxidation reaction.The scale up factor was about 40 for the catalyst weight, as well as for the gas and liquidflow rates.
Table 5.3: Standard operating conditions for the pilot plant simulations
Temperature 160oCOxygen Partial Pressure 0.6 MPaTotal Pressure (PO2 + PH2O) 1.2 MPaPhenol concentration 53 mmol/L (5 g/L)Liquid superficial Velocity 1 mm/sGas superficial velocity 8 mm/sReactor diameter 25 mmReactor Height 1.5 mDensity of catalyst particle 1030 g/LBed porosity 0.36Particle diameter 3 mm
5.2.1 Isothermal operation
The effect of mass transfer and hydrodynamic parameters on phenol conversion wasassessed using, for simplicity, the isothermal model.
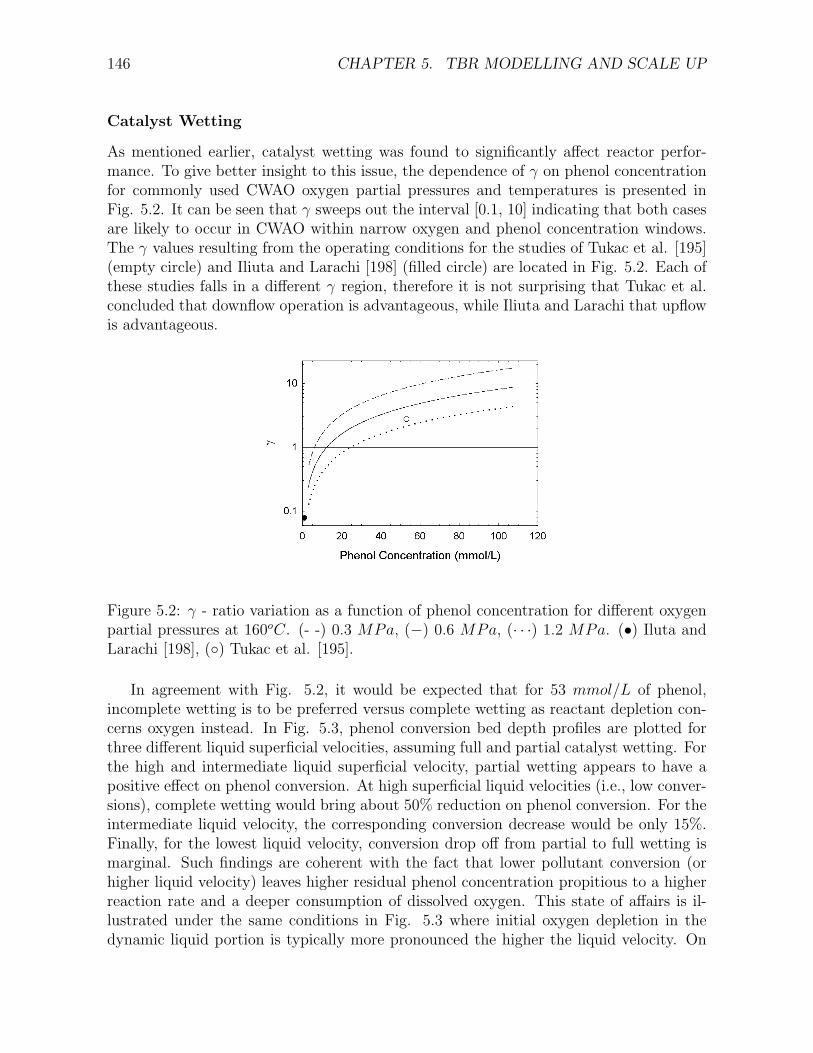
146 CHAPTER 5. TBR MODELLING AND SCALE UP
Catalyst Wetting
As mentioned earlier, catalyst wetting was found to significantly affect reactor perfor-mance. To give better insight to this issue, the dependence of γ on phenol concentrationfor commonly used CWAO oxygen partial pressures and temperatures is presented inFig. 5.2. It can be seen that γ sweeps out the interval [0.1, 10] indicating that both casesare likely to occur in CWAO within narrow oxygen and phenol concentration windows.The γ values resulting from the operating conditions for the studies of Tukac et al. [195](empty circle) and Iliuta and Larachi [198] (filled circle) are located in Fig. 5.2. Each ofthese studies falls in a different γ region, therefore it is not surprising that Tukac et al.concluded that downflow operation is advantageous, while Iliuta and Larachi that upflowis advantageous.
Figure 5.2: γ - ratio variation as a function of phenol concentration for different oxygenpartial pressures at 160oC. (- -) 0.3 MPa, (−) 0.6 MPa, (· · ·) 1.2 MPa. (•) Iluta andLarachi [198], (◦) Tukac et al. [195].
In agreement with Fig. 5.2, it would be expected that for 53 mmol/L of phenol,incomplete wetting is to be preferred versus complete wetting as reactant depletion con-cerns oxygen instead. In Fig. 5.3, phenol conversion bed depth profiles are plotted forthree different liquid superficial velocities, assuming full and partial catalyst wetting. Forthe high and intermediate liquid superficial velocity, partial wetting appears to have apositive effect on phenol conversion. At high superficial liquid velocities (i.e., low conver-sions), complete wetting would bring about 50% reduction on phenol conversion. For theintermediate liquid velocity, the corresponding conversion decrease would be only 15%.Finally, for the lowest liquid velocity, conversion drop off from partial to full wetting ismarginal. Such findings are coherent with the fact that lower pollutant conversion (orhigher liquid velocity) leaves higher residual phenol concentration propitious to a higherreaction rate and a deeper consumption of dissolved oxygen. This state of affairs is il-lustrated under the same conditions in Fig. 5.3 where initial oxygen depletion in thedynamic liquid portion is typically more pronounced the higher the liquid velocity. On

5.2. MODEL AIDED TBR SCALE UP 147
the other hand, for partially wetted catalyst, oxygen concentration in the dynamic liquidremains high, because oxygen enters in the catalyst mainly through the gas-solid inter-face. It should be mentioned that the axial decrease of oxygen concentration in the gasphase is less than 5% as gaseous O2 is in excess.
Figure 5.3: Effect of catalyst wetting on (a) phenol conversion, (b) dissolved oxygenconcentration, along the reactor for different liquid superficial velocities. (− · −) ul=0.1mm/s f=0.8, (− −) ul=0.1 mm/s f=1, (−) ul=0.2 mm/s f=0.8, (- -) ul=0.2 mm/s f=1,(· · ·) ul=1 mm/s f=0.8, (-··-) ul=1 mm/s f=1. Rest of operating conditions: Table 5.3

148 CHAPTER 5. TBR MODELLING AND SCALE UP
Fig. 5.4 presents the γ ratio bed depth-profile for the case of incomplete wetting.As expected, γ ratio stays almost constant for low conversions, whereas due to stream-wise phenol consumption, it drops off markedly the lower the liquid superficial velocity.For phenol conversions in excess of 90%, γ ratio peaks down to unity while advancingthroughout the bed. This suggests that full wetting is the preferred mode due to phenolimpoverishment. For such conversion levels to be achieved, the use of fines in the laststages of the reactor, or the use of two reactors, the second being operated up-flowconstitute potentially viable strategies.
Figure 5.4: Variation of γ-ratio along the reactor for incomplete wetting. (· · ·) ul=1mm/s, (−) ul=0.2 mm/s, (− · −) ul=0.1mm/s. Rest of operating conditions: Table 5.3
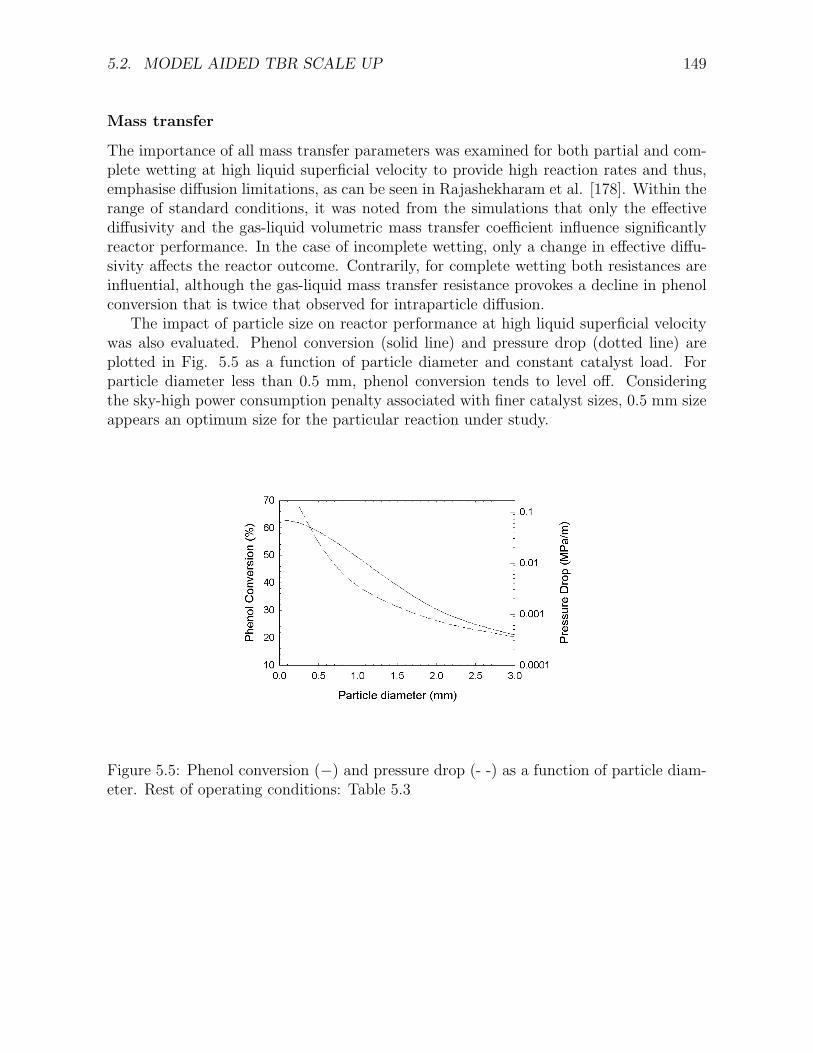
5.2. MODEL AIDED TBR SCALE UP 149
Mass transfer
The importance of all mass transfer parameters was examined for both partial and com-plete wetting at high liquid superficial velocity to provide high reaction rates and thus,emphasise diffusion limitations, as can be seen in Rajashekharam et al. [178]. Within therange of standard conditions, it was noted from the simulations that only the effectivediffusivity and the gas-liquid volumetric mass transfer coefficient influence significantlyreactor performance. In the case of incomplete wetting, only a change in effective diffu-sivity affects the reactor outcome. Contrarily, for complete wetting both resistances areinfluential, although the gas-liquid mass transfer resistance provokes a decline in phenolconversion that is twice that observed for intraparticle diffusion.
The impact of particle size on reactor performance at high liquid superficial velocitywas also evaluated. Phenol conversion (solid line) and pressure drop (dotted line) areplotted in Fig. 5.5 as a function of particle diameter and constant catalyst load. Forparticle diameter less than 0.5 mm, phenol conversion tends to level off. Consideringthe sky-high power consumption penalty associated with finer catalyst sizes, 0.5 mm sizeappears an optimum size for the particular reaction under study.
Figure 5.5: Phenol conversion (−) and pressure drop (- -) as a function of particle diam-eter. Rest of operating conditions: Table 5.3
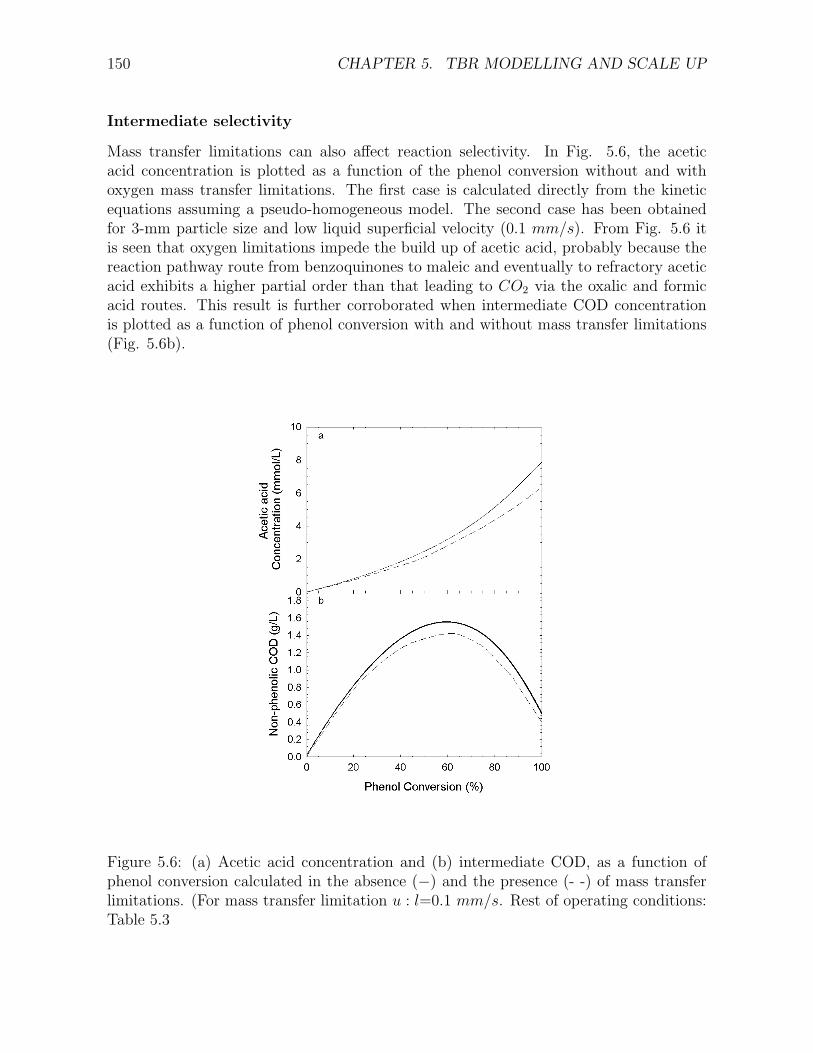
150 CHAPTER 5. TBR MODELLING AND SCALE UP
Intermediate selectivity
Mass transfer limitations can also affect reaction selectivity. In Fig. 5.6, the aceticacid concentration is plotted as a function of the phenol conversion without and withoxygen mass transfer limitations. The first case is calculated directly from the kineticequations assuming a pseudo-homogeneous model. The second case has been obtainedfor 3-mm particle size and low liquid superficial velocity (0.1 mm/s). From Fig. 5.6 itis seen that oxygen limitations impede the build up of acetic acid, probably because thereaction pathway route from benzoquinones to maleic and eventually to refractory aceticacid exhibits a higher partial order than that leading to CO2 via the oxalic and formicacid routes. This result is further corroborated when intermediate COD concentrationis plotted as a function of phenol conversion with and without mass transfer limitations(Fig. 5.6b).
Figure 5.6: (a) Acetic acid concentration and (b) intermediate COD, as a function ofphenol conversion calculated in the absence (−) and the presence (- -) of mass transferlimitations. (For mass transfer limitation u : l=0.1 mm/s. Rest of operating conditions:Table 5.3

5.2. MODEL AIDED TBR SCALE UP 151
Detailed or phenol reaction kinetics
The numerical solution of the comprehensive reaction-transport model when mass trans-fer resistances are important is obviously much more tedious than that for the singlelumping phenol consumption reaction. A simple solution to reduce numerical effort con-sists in using first the one-equation reaction model to solve for phenol consumption. Then,the corresponding COD reduction and intermediate product distributions, the pseudo-homogeneous model can be obtained for the same phenol conversion that was shownbefore to result in similar prediction of product selectivity.
Simulations using the detailed kinetic model only slightly affected phenol concentra-tion profiles, because of the slightly lower oxygen consumption due to partial oxidationof the intermediate products, as shown exemplarily in Fig. 5.7. This indicates that con-sidering reaction Eq. 4.1 as a lumping reaction is a reasonable approximation when thefocus is only on phenol conversion.
Figure 5.7: Phenol concentration profile along the reactor considering only phenol degra-dation (−), and the detailed kinetic model (- -). ul=0.2 mm/s. Rest of operatingconditions: Table 5.3

152 CHAPTER 5. TBR MODELLING AND SCALE UP
5.2.2 Non-isothermal reactor model
Like other wastewater treatment methods (WAO, incineration etc.), CWAO is carried outabove ambient temperature. From a point of view of process economics, it is essentialto exploit the heat released by the exothermic oxidation reactions. To do this, adiabaticoperation of the reactor is to be preferred, as claimed for the WAO process [38]. In thefollowing, the influence of operating or design parameters, such as inlet phenol concen-tration, gas superficial velocity, and inlet temperature on the adiabatic temperature riseand phenol conversion is studied.
At first, the influence of water evaporation at adiabatic operation conditions is ex-amined. The simulation of an adiabatic TBR showed that water evaporation can have asubstantial effect on reactor performance. In Fig. 5.8 both the adiabatic temperature rise(ATR) and phenol conversion attained with and without water evaporation are plottedas a function of gas superficial velocity. The plots are parameterised for two liquid super-ficial velocities corresponding to high (a) and low (b) phenol conversions. For a low liquidsuperficial velocity and phenol conversions above 99% (Fig. 5.8a), a temperature rise of36 - 39 K is attained neglecting evaporation. When accounting for the evaporation fluxrequired to saturate the gas phase with water at increasing temperature, the predictedATR and phenol conversion drops down to 8 - 18 K and 90%, respectively. These resultsprovide evidence that water evaporation must be accounted for in CWAO reactor designand scale up calculations. However, for high liquid superficial velocities (Fig. 5.8b), i.e.low phenol conversions, differences in ATR and phenol conversion caused by evaporationeffects are minor, the larger difference in phenol conversion being only 5%. RegardingATR, the differences are lower than those encountered at high phenol conversions andrange between 15% and 40% depending on gas superficial velocity.
It is interesting to note that there exists a maximum in the ATR with gas flow rate(see Fig. 5.8). As long as oxygen is fed in quantities up to 110% (ug = 0.5 mm/s) of thestoichiometric ratio, ATR and phenol conversion enhance strongly with increasing gasflow rate, both for high (Fig. 5.8a) and low (Fig. 5.8b) liquid superficial velocities. Afurther rise in gas flow rate only improves slightly conversion, while ATR may decreaseconsiderably, especially when water evaporation is accounted for. This observation agreeswell with the strategy employed in WAO where in most plants 110% oxygen excess isused [38]. For high phenol conversions (Fig. 5.8a) ATR peaks at 18 K and then decreasessteadily to ca. 8 K at higher superficial velocities. On the other hand, for the highliquid superficial velocity (Fig. 5.8b) the maximum is at 7.5 K and the minimum at 6K, suggesting that water evaporation is not influential for low phenol conversions. Thiscould explain why Tukac and Hanika [19] did not obtain an ATR lower to that expectedwithout evaporation effects, although it cannot explain why they reported a value evenhigher.
Another important reaction parameter to be studied is phenol inlet concentration. Forfirst order power law reaction rates with regard to the substrate, typical of CWAO, and nomass transfer limitations, higher phenol feed concentration should result in an increase inboth conversion and ATR. When external and/or internal mass transfer limitations occur,

5.2. MODEL AIDED TBR SCALE UP 153
Figure 5.8: Adiabatic temperature rise and phenol conversion as a function of gas superfi-cial velocity. (a) ul=0.2 mm/s, (b) ul=1 mm/s, Rest of operating conditions: Table 5.3.(-··-) Temperature rise neglecting evaporation, (· · ·) conversion neglecting evaporation, (--) conversion with evaporation, (−) Adiabatic temperature rise with evaporation.

154 CHAPTER 5. TBR MODELLING AND SCALE UP
Figure 5.9: Adiabatic temperature rise (−) and phenol conversion (- -) as a function ofphenol inlet concentration. ul = 0.2 mm/s, ug=0.5 mm/s. Rest of operating conditions:Table 5.3.
this might not be observed. For example in Fig. 5.9, the ATR and phenol conversionare plotted as a function of phenol feed concentration in presence of internal diffusionlimitations. In all simulations 110% oxygen excess was set by adequately adjusting theug. Phenol conversions decrease with increasing phenol concentration in the whole rangestudied. On the other hand, ATR increases sharply with phenol concentration up to30 mmol/L, and then starts to level off. This effect cannot be explained solely by thedecreasing conversion with increasing inlet phenol concentration, since, as can be deducedalso from Fig. 5.9, these magnitudes are not inversely proportional. Therefore, ATR leveloff should be attributed also to the higher evaporation rates necessary to saturate theincreasing gas flow rates used to maintain the 110% oxygen excess.
In Fig. 5.10 the effect of the effluent inlet temperature on ATR and phenol conversionis presented (the remaining operating conditions are kept the same). As expected, higherinlet temperature increases almost linearly phenol conversion. This is not true for ATRthat rises linearly between 390 and 410 K, to reach a flat maximum at 425 K and thendiminishes. At low inlet temperatures, water vapour pressure is small and heat releasedue to the reaction dominates in the heat balance, thus producing temperature rise.However, as vapour pressure increases exponentially with temperature, the heat releaseis progressively compensated by enhanced water evaporation leading to a maximum inATR and subsequently to its decrease.
Detailed calculation of the heat exchange unit to recover the heat released duringthe pollutant abatement is beyond the scope of this study. Nevertheless, preliminarycalculations considering a simple counter-current double pipe heat exchanger show thatCWAO (T0 = 433 K) requires only half of the exchange area required by WAO (T0 =553 K, [10]), to preheat the inlet stream in the inlet reactor temperature and to auto-thermally operate the plant.

5.2. MODEL AIDED TBR SCALE UP 155
Figure 5.10: Adiabatic temperature rise (−) and phenol conversion (- -) as a function ofinlet temperature. ul = 0.2 mm/s, ug=0.5 mm/s. Rest of operating conditions: Table5.3.
5.2.3 Conclusions
A comprehensive diffusion-reaction TBR model was successfully developed and validatedagainst experimental data obtained in a laboratory TBR. the developed model is capableto coherently predict the effect of the different key parameters involved in the complexCWAO of phenol. This gives support to use the model with confidence in the scale-up ofthe CWAO of phenol from a laboratory reactor to a pilot plant. The following outcomesfrom this numerical study can be pointed out.
At typical operating conditions of CWAO the oxidation of phenol may be either gasor liquid reactant limited. A sensitivity study found out that intraparticle diffusion and,under complete wetting, gas - liquid and liquid - solid mass transfer influence the reactorperformance. In agreement with experimental results reported in the literature, simula-tions showed that for a phenol solution of 53 mol/m3, phenol conversion in a bed withpartially wetted particles can double that obtained in a bed with fully wetted particles.Thus, the determination of the catalyst wetting degree is of outmost importance. Thebuild-in of a detailed reaction network, accounting explicitly for the main intermediatephenol oxidation products, only slightly altered phenol degradation profiles. For almost-complete phenol conversion non-phenolic COD can be about 20% lower when strong masstransfer limitations are present.
Non-isothermal simulations evidenced that evaporation must be taken into accountin scale up and adiabatic CWAO reactor design. Neglecting evaporation can lead to erro-neous calculation of the exit stream temperature and phenol conversion, especially at highconversions. Adiabatic Temperature Rise depends strongly on phenol inlet concentration

156 CHAPTER 5. TBR MODELLING AND SCALE UP
and the superficial velocity of the gas stream. In agreement with the observations for theWAO, its is maximum when oxygen excess is around 110%. Furthermore, during CWAOan increase in the inlet substrate concentration can produce a decrease in conversion,without any further increase in the ATR. Finally, the ATR exhibits a maximum withinlet temperature, as with increasing inlet temperature the increased phenol conversionis counterbalanced by the increased water vapour pressure, and the need to evaporatemore water to saturate the gas stream.

Chapter 6
Conclusions and Outlook
Conclusions
The ensemble of the outcomings of this work allow responding to the main objectivepostulated: the experimental and theoretical study of the CWAO of phenol using anadequate catalyst and multiphase reaction and reactor system. As a first milestone, theCWAO process employing active carbon and a TBR was proven to be a very effectivetreatment for the remedation of moderately concentrated aqueous phenol solutions. Inagreement with theoretical consideration, the CWAO of phenol was found to be consid-erably enhanced when the reactor was operated in cocurrent downflow of gas-liquid. Thegas-liquid mass transfer is often a limiting step in solid catalysed multiphase reactionsand the partial wetting of the catalyst particles, a characteristic of TBRs operating in thetrickle regime, has a significant effect on the reactor performance. However, one shouldbe aware that for non-diluted exothermic reaction systems, the heat control becomes acritical issue and upflow operation may be preferred.
The non metallic and inexpensive catalyst tested, Active Carbon, exhibited both sta-ble and considerably higher activity compared to a commonly used copper oxide catalyst.Almost complete phenol conversion (>99%) along with a COD reduction of 85% wereobtained at low space times, 160oC and low pressures oxygen partial pressures, rang-ing from 0.1 to 0.2 MPa. Ongoing experimental studies indicate that AC is also activefor a variety of toxic organic pollutants, thereby reinforcing the high potential of theCWAO-AC process for its broad application to the abatement of industrial effluents.
The second milestone certainly is the original use of a robust stochastic optimisationalgorithm in the development of more realistic kinetic models that are able to describein detail the complex parallel - consecutive reaction network of the catalytic phenoloxidation in the liquid phase. Up to date, the state of art in CWAO kinetic modellingrelies on the use of only simple phenol or COD destruction or lumped intermediatekinetics. In a first case study, using experimental data of phenol CWAO over a copperoxide catalyst, it could be demonstrated that a stochastic optimisation algorithm, termedSimulated Annealing, avoids the problems of local optima frequently encountered innonlinear multiparameter estimation when using a classical gradient based algorithmlike the Levenberg-Marquardt. The selected kinetic model for the copper oxide catalyst
157

158 CHAPTER 6. CONCLUSIONS AND OUTLOOK
accounted for all the main reaction intermediates detected and precisely predicted theirconcentration space time profiles, over the whole range of temperatures and pressuresstudied. For the AC catalyst, the experimental data indicate that phenol degradationproceeds via two distinct routes. One route is in agreement with the classical pathwaythat leads to the formation of benzoquinone, while a second route should exist to explainthe formation of the not before detected 4-HBA. It becomes clear that the mechanismof phenol over AC differs from that over the CuO catalyst. Related results suggest thatthe phenol oxidation over the AC starts via the formation of a coke layer that probablyparticipates in the reaction through a complex redox cycle. The proposed kinetic modelfor the AC did not explicitly considered this postulated redox mechanism. However itaccounted for all intermediates and successfully described the experimental intermediate- space time profiles.
In the following, the obtained kinetic model was implemented in a phenomenologicaltransport reaction model of the TBR. The model behaviour was tested through a sensi-tivity study and the reactor model was then successfully validated against the reactiondata obtained in the laboratory TBR. It can be pointed out that the correct determi-nation of all the involved key hydrodynamic and transfer parameters is a very delicatetask and when improperly done, will wipe off the benefits of a sophisticated descriptionof the underlying process chemistry and physics. The validated model allowed studyingnumerically the scale up of the laboratory TBR to a pilot scale reactor. In the scale upprocess, the partial wetting and pore diffusion were highlighted to determine the overallreactor performance at the fixed operating conditions. The feature of non-isothermal re-actor operation clearly evidenced that water evaporation at CWAO conditions cannot beneglected. As a result, the adiabatic temperature rise is drastically reduced (by a factor of2) and thereby the conversion of the target compound. The inclusion of the heat balancerevealed that the adiabatic reactor performance is optimal for a feed that contains oxygenin a 110% excess, what is in perfect agreement with the feed conditions typically used inindustrial WAO units. Summarising, the behaviour of a catalytic multiphase system is aresult of complex interactions between reaction kinetics, hydrodynamics and heat-masstransfer. A correct interpretation of the experimental observation is impossible withoutan adequate reactor model that will enable to predict the influence of the key operationparameters on the reactor performance. Thus, the disponibility of such a model is a po-tential tool to correctly guide the design and scale up of multiphase reactors minimisingexperimental efforts, that are costly, time consuming and often difficult to carry out.
Outlook
The design of multiphase reactors is shown to combine different areas of chemistry andchemical engineering and obviously it is impossible to treat all of them exhaustively inone PhD work. Thus, and in particular for the CWAO of organic pollutants, several opentopics are worth to be addressed in detail by future research work in order to improve theunderstanding and the industrial implementation of CWAO in the remediation of organicpollutants.

159
One important field of action is certainly extend the kinetic study using both the ACcatalyst and a variety of common organic pollutants, to elucidate the complex oxidationmechanism and the role of the formed coke layers in this process. In addition, parallelstudies of structural analysis of different ACs should allow characterising the AC surfaceto provide the means for the optimisation of its catalytic performance either by oxidativesurface modification, or by proper manufacturing design.
A second promising option to improve the performance and process economics ofCWAO should reinforce the study of combined processes of adsorption reaction cyclesand chemical oxidation followed by biological treatment, or the use of dynamic processeslike the periodic operation of the TBR. In this context, the development of dynamicnon-isothermal reactor model is of outmost importance to aid the design and scale up ofsuch complex processes.
In the context of modelling, one can stress on the general need of more in-depthstudies that focus on the determination of hydrodynamic and mass transfer parametersof relevant industrial reaction systems and conditions. Besides the better understandingof multiphase systems, the availability of such parameters would greatly improve thereliability of model aided design and scale up of multiphase processes.

160 CHAPTER 6. CONCLUSIONS AND OUTLOOK

Bibliography
[1] R.B. Jackson, S.R. Carpenter, C.N. Dahm, D.M. McKnight, R.J. Naiman, S.L. Postel, and S.W.Running, Water in a Changing World, http://www.epa.gov/watertrain/step9esa.html
[2] R.K. Turner, D. Pearce, I. Bateman, Environmental Economics, The Johns Hopkins UniversityPress, Baltimore, 1993, p.20
[3] METCALF and EDDY INC., Wastewater Engineering: Treatment, Disposal, and Reuse, 3rdedition, revised by: G. Tchobanoglous, F.L. Burton, McGraw-Hill, New York, 1991, p.17
[4] C.F. Foster, Biotechnology and Wastewater Treatment, Cambridge University Press, Cambridge,1985, p.303
[5] http://www.epa.gov/tri/
[6] T. C. Voice, Activated carbon adsorption, Standard Handbook of Hazardous Waste Treatmentand Disposal, H.M. Freeman (ed), McGraw-Hill, New York, 1988
[7] J.J. Santoleri, Liquid-Injection Incinerators, Standard Handbook of Hazardous Waste Treatmentand Disposal, H.M. Freeman (ed), McGraw-Hill, New York, 1988
[8] S. C. Rowat, Medical Hypotheses 52 (1999) 389.
[9] F.J. Zimmermann, Chem. Eng. 25 (1958) 117.
[10] W. M. Copa, W. B. Gitchel, Wet Oxidation, Standard Handbook of Hazardous Waste Treatmentand Disposal, H.M. Freeman (ed), McGraw-Hill, New York, 1988
[11] V. S. Mishra, V. V. Mahajani, J. B. Joshi, Ind. Eng. Chem. Res. 34 (1995) 2.
[12] R. Andreozzi, V. Caprio, A. Insola, R. Marotta, Catalysis Today 53 (1999) 51.
[13] F. Luck, Catalysis Today 27 (1996) 195.
[14] J. Barrault, M. Abdellaoui, C. Bouchoule, A. Majeste, J.M. Tatibouet, A. Louloudi, N. Papayan-nakos, N.H. Gangas, Applied Catalysis B: Environmental 27 (2000) L225.
[15] B. Legube, N. Karpel Vel Leitner, Catalysis Today 53 (1999) 61.
[16] S. Imamura, Ind. Eng. Chem. Res. 38 (1999) 1743.
[17] R.J. Bigda, Chem. Eng. Prog. 91 (1995) 62
[18] A. Fortuny, J. Font, A. Fabregat, Appl. Cat. B: Environ. (1998) .
[19] V. Tukac, J. Hanika, J. Chem. Technol. Biotechnol. 71 (1998) 262.
161

162 BIBLIOGRAPHY
[20] J. Qin, Q. Zhang, K. T. Chuang, Appl. Cat. B: Environ. 29 (2001) 115.
[21] T. Nunoura, G. H. Lee, Y. Matsumura, K. Yamamoto, Chem. Eng. Sci. 57 (2002) 3061.
[22] Y. Matsumura, T. Urase, K. Yamamoto, T Nunoura, J. Supercritical Fluids 22 (2002) 149.
[23] A. Fortuny, C. Bengoa, J. Font, A. Fabregat, J. Hazard. Mater. 64 (1999) 181.
[24] S. Hamoudi, F. Larachi and A. Sayari, J. Catal. 177 (1998) 247.
[25] Z.Y. Ding, M.A. Frisch, L. Li, E.F. Gloyna, Ind. Eng. Chem. Res. 35 (1996) 3257.
[26] D. R. Grymonpre, W. C. Finney, B. R. Locke, Chem. Eng. Sci. 54 (1999) 3095.
[27] L. Szpyrkowicz, C Juzzolino, S. N. Kaul, S Daniele, M D. De Faveri, Ind. Eng. Chem. Res. 39(2000) 3241.
[28] C. Dominguez, J. Garcia, M. A. Pedraz, A. Torres, M. A. Galan, Catalysis Today
[29] Y. G. Adewuyi, Ind. Eng. Chem. Res. 40 (2001) 4681.
[30] P. E. Savage, S. Gopalan, T. I. Mizan, C. J. Martino, E. E. Brock, AICHE J. 41 (1995) 1723
[31] M.P. Dudukovic, Catalysis Today, 48 (1999) 5.
[32] H. Schmieder, J. Abeln, Chem. Eng. Technol. 22 (1999) 11.
[33] I. Polaert, A. M. Wilhelm, H. Delmas, Chem. Eng. Sci. 57 (2002) 1585.
[34] A.T. Castellari, P.M. Haure, AIChE J. 41(6) (1995) 1593
[35] V. Tukac, J. Hanika, Unsteady State Wet Oxidation in Trickle Bed Reactor, 3rd EuropeanCongress of Chemical Engineering, 26-28 june 2001, Nurenberg, Germany
[36] S. T. Kolaczkowski, P. Plucinski, F. J. Beltran, F. J. Rivas, D. B. McLurgh, Chem. Eng. J. 73(1999) 143.
[37] F. Luck, Wet Air Oxidation: past present and future, Catalysis Today 53 (1999) 81.
[38] H. Debellefontaine, J. N. Foussard, Waste Management 20 (2000) 2
[39] J. Donlagic, J. Levec, Appl. Catal. B: Environ. 17 (1998) L1.
[40] Y.I. Matatov-Meytal, M. Sheintuch, Ind. Eng. Chem. Res. 37 (1998) 309.
[41] J. E. Atwater, J. R. Akse, J. A. McKinnis, J. O. Thompson, Chemosphere 34 (1997) 203.
[42] S. Hamoudi, A. Sayari, K. Belkacemi, L. Bonneviot, F. Larachi, Catalysis Today 62 (2000) 379.
[43] L. Oliviero, J. Barbier Jr., D, Duprez, A. Guerrero-Ruiz, B. BAchiller-Baeza, I. Rodriguez-Ramos,Appl. Cat. B: Environ. 25 (2000) 267.
[44] S-K Kim, S-K Ihm, Ind. Eng. Chem. Res. 41 (2002) 1967.
[45] P. Gallezot, N. Laurain, P. Isnard, Appl. Cat. B: Environ 9 (1996) L11.

BIBLIOGRAPHY 163
[46] J. Barbier Jr., F. Delanoe, F. Jabouille, D. Duprez, G. Blanchard, P. Isnard, J. Catal. 177 (1998)378.
[47] P. Gallezot, S. Chaumet, A. Perrard, P. Isnard, J. Catal. 168 (1997) 104.
[48] S. Duprez, F. Delano, J. Barbier, P. Isnard, G. Blanchard, Catal. Today 29 (1996) 317.
[49] J. C. Beziat, M. Besson, P Gallezot, S. Durecu, Ind. Eng. Chem. Res. 38 (1999) 1310.
[50] J. C. Beziat, M. Besson, P. Gallezot, S. Durecu, J. Catal. 182 (1999) 129.
[51] H. T. Gomes, J. L. Figueiredo, J. L. Faria, Appl. Cat. B: Environ. 27 (2000) L217.
[52] H. T. Gomes, J. L. Figueiredo, J. L. Faria, Catalysis Today 75 (2002) 23.
[53] A. A. Klingoffer, R. L. Cerro, M. A. Abraham, Catalysis Today 40 (1998) 59.
[54] J. Barbier Jr., L. Oliviero, B. Renard, D. Duprez, Catalysis Today 75 (2002) 29.
[55] R. Ukropec, B. F. M. Kuster, J. C. Schoten, R. A. van Santen, Appl. Cat. B: Environ. 23 (1999)45.
[56] H. Takayama, Q. Jiang-Yan, K. Inazu, K. Aika, Chemistry Letters (1999) 377.
[57] W. An, Q. Zhang, Y. Ma, K. T. Chuang, Catalysis Today 64 (2001) 289.
[58] Q. Zhang, K.T. Chuang, Appl. Cat. B: Environ. 17 (1998) 321.
[59] Q. Zhang, K.T. Chuang, Environ. Sci. Technol. 33 (1999) 3641.
[60] A. Pintar, M. Besson, P. Gallezot, Appl. Cat. B: Environ. 30 (2001) 123.
[61] A. Pintar, M. Besson, P. Gallezot, Appl. Cat. B: Environ. 31 (2001) 275.
[62] J. Rivas, S. T. Kolaczkowski, F. J. Beltran, D. B. McLurgh, Appl. Cat. B: Environ. 22 (1999)279.
[63] L. Oliviero, J. Barbier Jr., D. Duprez, H. Wahyu, J. W. Pnton, I. S. Metcalf, D. Mantzavinos,Apll. Cat. B: Environ. 35 (2001) 1.
[64] D-K Lee, D-S Kim, Catalysis Today 63 (2000) 249
[65] T.-L. Huang, J. M. Maccines, K. R. Cliffe, Wat. Res. 35 (2001) 2113.
[66] J. E. Atwater, J. R. Akse, J. A. McKinnis, J. O. Thompson, Appl. Cat. B: 11 (1996) L11.
[67] Q. Zhang, K.T. Chuang, Ind. Eng. Chem. Res.37 (1998) 3343.
[68] A. Santos, P. Yustos, B. Durban, F. Garcia-Ochoa, Ind. Eng. Chem. Res. 40 (2001) 2773.
[69] A. Santos, P. Yustos, B. Durban, F. Garcia-Ochoa, Environ. Sci. Technol. 35 (2001) 2828.
[70] A. Santos, P. Yustos, A. Quintanilla, S. Rodriguez, F. Garcia-Ochoa, Appl. Cat. B: Environ. 39(2002) 97.
[71] A. Santos, E. Barroso, F. Garcia-Ochoa, Catalysis Today 48 (1999) 109.

164 BIBLIOGRAPHY
[72] A. Fortuny, C. Ferrer, C. Bengoa, J. Font, A. Fabregat, Catal. Today 24 (1995) 79.
[73] A. Fortuny, C. Bengoa, J. Font, F. Castells, A. Fabregat, Catal. Today 53 (1999) 107.
[74] C. Miro, A. Alejandre, A. Fortuny, C. Bengoa, J. Font, A. Fabregat, Water Research 33 (1999)1005
[75] A. Alejandre, F. Medina, A. Fortuny, P. Salagre, J.E. Sueiras, Appl. Catal. B: Environ. 16 (1998)53.
[76] A. Alejandre, F. Medina, P. Salagre, A. Fabregat, J.E. Sueiras, Appl. Catal. B: Environ. 18 (1998)307.
[77] A. Alejandre, F. Medina, X. Rodriguez, P. Salagre, J. E. Sueiras, J. Catal. 188 (1999) 311.
[78] A. Alejandre, F. Medina, X. Rodriguez, P. Salagre, Y. Cesteros, J. E. Sueiras, Appl. Cat. B:Environ 30 (2001) 195.
[79] A. Pintar, G. Bercic, J. Levec, Chem. Eng. Sci. 52 (1997) 4143.
[80] A. Pintar, J. Levec, Ind. Eng. Chem. Res. 33 (1994) 3070.
[81] A. Pintar, J. Levec, J. Catal. 135 (1992) 345.
[82] H. Ohta, S. Goto, H. Teshima, Ind. Eng. Chem. Fundam. 19 (1980) 180.
[83] S. Hocevar, J. Batista, J. Levec J. Cata. 184 (1999) 39.
[84] S. Hocevar, U. O. Krasovec, B. Orel, A. S. Arico, H. Kim, Appl. Cat. B: Environ.28 (2000) 113.
[85] S. T. Hussain, A. Sayari, F. Larachi, J. Catal., 201 (2001) 153.
[86] S. T. Hussain, A. Sayari, F. Larachi, Appl. Cat. B: Environ. 34 (2001) 1.
[87] S. Hamoudi, F. Larachi, G. Cerrella, M. Cassanello, Ind. Eng. Chem. Res. 37 (1998) 3561.
[88] H. Chen, A. Sayari, A. Adnot, F. Larachi Appl. Cat. B: Environ. 32 (2001) 195.
[89] P. M. Alvarez, D. McLurgh, P. Plucinsky, Ind. Eng. Chem. Res. 41 (2002) 2147.
[90] A. Sadana, J.R. Katzer, J. Catal. 35 (1974) 140.
[91] A. Sadana, J.R. Katzer, Ind. Eng. Chem., Fundam. 13 (1974) 127.
[92] C. J. Chang, C.-M. Ko, K. Shih, Chem. Eng. Com. 156 (1996) 201.
[93] St. Christoskova, M. Stoyanova, Wat. Res. 35 (2001) 2073.
[94] J.F. Akyurtlu, A. Akyurtlu, S. Kovenklioglu, Catal. Today 40 (1998) 343.
[95] C. J. Chang, S-S Li, K. Shih, J. Chem. Technol. Biotechnol., 64 (1995) 245.
[96] A. Pintar, J. Levec, Chem. Eng. Sci. 47 (1992) 2395.
[97] A. Pintar, J. Levec, 49 (1994) 4391.
[98] G. Baldi, S. Goto, C. K. Chow, J. M. Smith, Ind. Eng. Chem. Proc. Des. Dev. 13 (1974) 447.

BIBLIOGRAPHY 165
[99] S. Goto, J. M. Smith, AIChE J. 21 (1974) 714.
[100] J. Levec, J. M. Smith, AIChE J. 22 (1976) 159.
[101] J. Levec, M. Herskowitz, J. M. Smith, AIChE J., 22 (1976) 919.
[102] C. de Leitenbourg, D. Goi, A. Priavera, A. trovarelli, G. Dolceti, Appl. Cat. B: Environ. 11 (1996)L29.
[103] K. Belkacemi, F. Larachi, A. Sayari, J. Catal. (2000) 224.
[104] S. Hamoudi, K. Belkacemi, F. Larachi, Chem. Eng. Sci. 54 (1999) 3569.
[105] S. Hamoudi, K. Belkacemi, A. Sayari, F. Larachi, Chem. Eng. Sci. 56 (2001) 1275.
[106] A. Fortuny, C. Miro, J. Font, A. Fabregat, Catal. Today 48 (1999) 323.
[107] F. Stuber, I. Polaert, H. Delmas, J. Font, A. Fortuny, A. Fabregat, J. Chem. Technol. Biotechnol.76 (2001) 743.
[108] P.K. Lim, A. John, P. Champakial, Ind. Eng. Chem. Process. Des. Dev. 22 (1983) 477.
[109] R.W. Coughlin, Ind. Eng. Chem. Prod. Res. Dev. 8 (1969) 12.
[110] A. Schraut, G. Emig, H. Hofmann, J. Catal., 112 (1988) 221.
[111] M.F.R. Pereira, J.J.M. Orfao, J.L. Figueiredo, Appl. Cat. A: General 184 (1999) 153.
[112] M.F.R. Pereira, J.J.M. Orfao, J.L. Figueiredo, Appl. Cat. A: General 196 (2000) 43.
[113] M.F.R. Pereira, J.J.M. Orfao, J.L. Figueiredo, Appl. Cat. A: General 218 (2001) 307.
[114] P. M. Alvarez, D. McLurgh, P. Plucinsky, Ind. Eng Chem. Res. 41 (2002) 2153.
[115] Q. Zhang, K.T. Chuang, Can. J. Chem. Eng. 77 (1999) 399.
[116] X. Hu, L. Lei, H. P. Chu, P. L. Yue, Carbon 37 (1999) 631.
[117] Q. Wu, X. Hu., P. L. Yue, X. S. Zhao, G. Q. Lu, Appl. Cat. B: Envorn. 32 (2001) 151.
[118] H.S. Joglekar, S.D. Samant, J.B. Joshi, Wat. Res. 25 (1991) 135.
[119] H.R. Devlin, I.J. Harris, Ind. Eng. Chem. Fundam. 23 (1984) 387.
[120] L. Li, P. Chen, E.F. Gloyna, AIChE J. 37 (1991) 1687.
[121] A. Eftaxias, J. Font, A. Fortuny, J. Giralt, A. Fabregat, F. Stuber, Appl. Cat. B: Environ. 33(2001) 175.
[122] R.S. Willms, A.M. Balinsky, D.D. Reible, D.M. Wetzel, D.P. Harrison, Ind. Eng. Chem. Res. 26(1987) 148.
[123] F. Vogel, J. Harf, A. Hug, P.R. von Rohr, Environ. Prog. 18 (1999) 7.
[124] F.J. Rivas, S.T. Kolaczkowski, F.J. Beltrn, D.B. McLurgh, Chem. Eng. Sci. 53 (1998) 2575.
[125] V. Tufano, Chem. Eng. Technol. 16 (1993) 186.

166 BIBLIOGRAPHY
[126] G. Neri, A. Pistone, C. Milone, S. Galvagno, Appl. Cat. B: Environ 38 (2002) 321.
[127] R.V. Shende, J. Levec, Ind. Eng. Chem. Res. 39 (2000) 40.
[128] R.V. Shende, J. Levec, Ind. Eng. Chem. Res. 38 (1999) 2557.
[129] R.V. Shende, J. Levec, Ind. Eng. Chem. Res. 38 (1999) 3830.
[130] R.V. Shende, V.V. Mahajani, Ind. Eng. Chem. Res. 33 (1994) 3125.
[131] R.V. Shende, V.V. Mahajani, Ind. Eng. Chem. Res. 36 (1997) 4809.
[132] L. Li, N. Crain, E. F. Gloyna, Water Environ. Res. 68 (1996) 841.
[133] S. H. Lin, S. J. Ho, C. L. Wu, Ind. Eng. Chem. Res. 35 (1996) 307.
[134] Q. Zhang, K.T. Chuang, AIChE J. 45 (1999) 145.
[135] I. Polaert, A. Fortuny, F. Stuber, A. Fabregat, H. Delmas, Competitive adsorption of phenoliccompounds in water on activated carbon, 14th Internacional Congress of Chemical and ProcessEngineering, 27-31 August 2000, Praha, Czech Republic
[136] M.J. Birchmeier, C.G. Hill Jr., C.J. Houtman, R.H. Atalla, I.A. Weinstock, Ind. Eng. Chem. Res.39 (2000) 55.
[137] H.S. Fogler, Elements of chemical reactor engineering, New Jersey, Prentice-Hall, 1992
[138] G. F. Froment, K. B. Bischoff, Chemical Reactor Analysis and Design, John Wiley and Sons,New York, USA, 1990, p. 403
[139] S. P. Asprey, Y. Naka, J. Chem. Eng. Japan 32 (1999) 328.
[140] G. Buzzi-Ferraris Cat. Today 52 (1999) 125.
[141] R. Fletcher, Practical methods of optimisation, Great Britain, John Wiley & Sons, 1987
[142] C. Y. Gau, M. A. Stadtherr, 94 AIChE Symp. Ser. (1999) 445.
[143] C. A. Schnepper, M. A. Stadtherr, Comp. Chem. Eng. 20 (1996) 187.
[144] W. R. Esposito, C. A. Floudas, Comp. Chem. Eng. 22 (1998) S213.
[145] A. Corana, M. Marchesi, C. Martini, S. Ridella, ACM Trans. Math. Software 13 (1987) 26 2.
[146] M. F. Cardoso, R. L. Salcedo, S. F. Azevedo, Comp. Chem. Eng. 20 (1996) 1065.
[147] W. L. Goffe, G. D. Ferrier, J. Rogers, J. Econometrics 60 (1994) 65.
[148] Z. Belohlav, P. Zamostny, P. Kluson, J. Volf, Can J. Chem. Eng. 75 (1997) 735
[149] P. Zamostny, Z. Belohlav Computers & Chemistry 23 (1999) 479.
[150] R. Moros, H. Kalies, H. G. Rex, St. Scaffarczyk, Comp. Chem. Eng. 20 (1996) 1257.
[151] D. Wolf, R. Moros, Chem. Eng. Sci. 52 (1997) 1189.
[152] A. Eftaxias, J. Font, A. Fortuny, A. Fabregat, F. Stuber, Comp. Chem. Eng. 26 (2002) 1725.

BIBLIOGRAPHY 167
[153] P.R. Bevington, D.K. Robinson, Data reduction and error analysis for the physical sciences, secondedition, McGraw-Hill, New York, 1992
[154] P. Bilardello, X. Joulia, M. Le Lann, H. Delmas, B Koehret, Comp. Chem. Eng. 17 (1993) 517.
[155] R.V. Chaudhari, Challenges in Modelling and Scale-up of Trickle Bed Reactor, Indo-French Work-shop on Trickle Bed Reactors for Cleaner and Greener Environment, K.D.P. Nigam (ed.), 7-8November 2002, Delhi, India
[156] M. P. Dudukovic, F. Larachi, P. L. Mills, Catalysis Reviews 44 (2002) 123.
[157] A. Gianetto, V. Specchia, Chem. Eng. Sci. 47 (1992) 3197.
[158] P.L Mills, R.V. Chaudhari, Catalysis Today 48 (1999) 17.
[159] S. Goto, J. Levec, J.M. Smith, Catal. Rev. Sci.-Eng. 15 (1977) 187.
[160] J. Levec, A. Pintar, Catalysis Today 24 (1995) 51.
[161] J. Levec, Chem. Biochem. Eng. Q. 11 (1997) 47.
[162] F. Stuber, Selctivity in a three phase catalytic reactor, PhD. Thesis, INP Toulouse, 1995 (infrench)
[163] G. Biardi, G. Baldi, Catalysis Today 52 (1999) 223.
[164] Y. T. Shah, Gas-Liquid-Solid Reactor Design, McGraw Hill, New York, 1979
[165] P. A. Ramachandran, R. V. Chaudhari, Three Phase Catalytic Reactors, Gordon and Breachscience publishers, 1983, New York
[166] M.H. Al-Dahhan, F. Larachi, M.P. Dudukovic, A. Laurent, Ind. Eng. Chem. Res. 36 (1997) 3292.
[167] J. Hanika, K. Sporka, V. Ruzicka, R. Pistek, Chem. Eng. Sci. 32 (1977) 525.
[168] M.H. Al-Dahhan, M.P. Dudukovic, Chem. Eng. Sci. 50(15) (1995) 2377.
[169] Y. Wu, M.R. Khadilkar, M.H. Al-Dahhan, M.P. Dudukovic, Ind. Eng. Chem. Res. 35 (1996) 397.
[170] D. Tsamatsoulis, M.H. Al-Dahhan, F. Larachi, N. Papayannakos, Chem. Eng. Comm. 185 (2001)67.
[171] M.R. Khadilkar, Y. Wu, M.H. Al-Dahhan, M.P. Dudukovic, M. Colakyan, Chem. Eng. Sci. 51(1996) 2139.
[172] C. Julcour, R. Jaganathan, R.V. Chaudhary, A.M. Wilhem, H. Delmas, Chem. Eng. Sci. 56(2)557.
[173] R.V. Chaudhari, R. Jaganathan, P.S. Mathew, C. Julcour, H. Delmas, AIChE J. 48 (2002) 110.
[174] Stuber, H. Delmas, Ind. Eng. Chem. Res.in press.
[175] M. Herskowitz, J. M. Smith, AIChE J. 29 (1983) 1.
[176] F. Stuber, A.M. Wilhem, H. Delmas, Chem. Eng. Sci. 51 (1996) 2161.
[177] I. Iliuta, F. C. Thyrion, O Muntean, Chem. Eng. Sci. 35 (1996) 4579.

168 BIBLIOGRAPHY
[178] M.V. Rajashekharam, R. Jaganathan, V. Chaudhari, Chem. Eng. Sci. 53 (1998) 787.
[179] S. Ishigaki, S. Goto, Catalysis Today 48 (1999) 31.
[180] K.D.P. Nigam, I. Iliuta, F. Larachi, Chem. Eng. Proc. 41 (2002) 365.
[181] C.S.L. Narasimha, R.P. Verma, A. Kundu, K.D.P. Nigam, AIChE J. in press
[182] A. Lakota, J. Levec, R.G. Carbonell, AIChE J. 48(4) (2002) 731.
[183] Y. Jiang, M.R. Khadilkar, M.H. Al-Dahhan, M.P. Dudukovic, AIChE J. 48(4) (2002) 701.
[184] Y. Jiang, M.R. Khadilkar, M.H. Al-Dahhan, M.P. Dudukovic, AIChE J. 48(4) (2002) 716.
[185] I. Iliuta, F. Larachi, B.P.A. Grandjean, G. Wild, Chem. Eng. Sci. 54 (1999) 5633.
[186] I. Iliuta, F. Larachi, B.P.A. Grandjean, Ind. Eng. Chem. Res. 37 (1998) 4542.
[187] A.A. El-Hisnawi, D.Sc. Thesis, Washington University, St. Louis, Missouri, 1981.
[188] Y. Wu, M.H. Al-Dahhan, M.R. Khadilkar, M.P. Dudukovic, Chem. Eng. Sci. 51 (1996) 2721.
[189] C. Julcour, F. Stuber, J.M. Le Lann, A.M: Wilhelm, H. Delmas, Chem. Eng. Sci. 54 (1999) 2391.
[190] C. Julcour, R.V. Chaudhari, J.M. Le Lann, A.M: Wilhelm, H. Delmas, Chem. Eng. Process. 41(2002) 311.
[191] C.N. Satterfield, AIChE J., 21(2) (1975) 209.
[192] I. Iliuta, F. Larachi, B.P.A. Grandjean, Chem. Eng. Sci. 54 (1999) 4099.
[193] K.B. Van Gelder, P.C. Borman, R.E. Weenink, K.R. Westerterp, Chem. Eng. Sci. , 45 (1990)3171.
[194] V. Balakotaiah, E.L. Christoforatou, D.H. West Chem. Eng. Sci. 54 (1999) 1725.
[195] V. Tukac, J. Vokal, J. Hanika, J. Chem. Techn. Biotechnol. 76 (2001) 506.
[196] C.B. Maugans, A. Akgerman, Water Research, 37 (2) (2003) 319.
[197] F. Larachi, I. Iliuta, K. Belkacemi, Catlysis Today, 64 (2001) 309.
[198] I. Iliuta, F. Larachi, Chem. Eng. Proc. 40 (2001) 175.
[199] A. Fortuny, Catalytic Oxidation of Phenolic Effluents in a Trickle Bed Reactor, PhD. Thesis,Universitat Rovira i Virgili (in catalan)
[200] L.S. Clesceri, A.E. Greenberg, R.R. Trusell, M.A. Franson, Standard methods for the examinationof water and wastewater, 17th edition, American Public Health Association and American WaterWorks Association, Washington, USA, 1989.
[201] Visual Numerics, IMSL Fortran subroutines for mathematical applications, (1997)
[202] N. Metropolis, A. Rosenbluth, M. Rosenbluth, A. Teller, E. Teller, J. Chem. Phys. 21 (1953) 1087.
[203] S. Kirkpatrik, C. D. Gellat, M. P. Vecchi, Science 220 (1983) 671.

BIBLIOGRAPHY 169
[204] W. H. Press, B. P. Flannery, S. A. Teukolsky, W. T. Vetterling, Numerical Recipes: FortranEdition, Cambridge University Press, Cambridge, UK, 1986, p. 326
[205] M. Locatelli, J. Opt. Theory and Appl. 104 (2000) 121.
[206] Finlayson, B.A., Nonlinear analysis in chemical engineering, McGraw-Hill, New York, pp. 113,1980.
[207] Constantinides, A. Applied numerical methods with personal compouters, McGraw-Hill, NewYork, 1987.
[208] R.C. Reid, J.M. Prausnitz, B.E. Pauling, The properties of gases and liquids, McGraw-Hill, NewYork, 1987.
[209] Chemical Rubber Company, CRC handbook of chemistry and physics, CRC Press, Cleveland,Ohio, 2000
[210] D. M. Himmelblau, J. Chem. Eng Data, 5 (1960) 10.
[211] A.E. Saez, R.G. Carbonell, AIChE J. 31 (1985) 52.
[212] Z-S Mao, T-Y. Xiong, J. Chen, Chem. Eng. Sci. 48(15) (1993) 2697.
[213] I. Iliuta, F. Larachi, B.P.A. Grandjean, Chem. Eng. Res. Des. 77 (1999) 759.
[214] S. Pich, F. Larachi, I. Iliuta, B.P.A. Grandjean, J. Chem. Technol. Biotechnol. 77 (2002) 989.
[215] S. Goto, J. M. Smith, AIChE J. 21 (1974) 706.
[216] P.Z. Lu, J.M. Smith, M. Herskowirtz, AIChE J. 30 (1984) 500.
[217] J. Font, A. Fabregat, Comput. Chem. Eng. 21 (1997) 719.
[218] J. Font, Personal Communication
[219] A. Lakota, J. Levec, AIChE J. 36(9) (1990) 1444.
[220] M. Paradowska, PhD Thesis, Universitat Rovira i Virgili, (In progress)

170 BIBLIOGRAPHY

Biographical Note
NAME : Athanasios EftaxiasDate of Birth : 31/08/1974
EDUCATION:
• 1992-1998: Diploma in Metallurgical Engineering, National Technical University ofAthens, Athens, Greece
• 1998-2000: Research Suficiency (Suficiencia Investigadora), Universitat Rovira iVirgili, Tarragona, Spain
PUBLICATIONS
• A. De Jong, A. Eftaxias, F. Trabelsi, F. Recasens, J. Sueiras, and F. Stuber, Sol-vent Screening for the Supercritical Hydrogenation of Polyunsaturated HydrocarbonsUsing VLE Calculations, Ind. Eng. Chem. Res. 40, 3225-3229 (2001)
• Eftaxias A., Font J., Fortuny A., Giralt J., Fabregat A., Stuber F., Kinetic Mod-elling of Catalytic Wet Air Oxidation of Phenol by Simulated Annealing, Appl.Catal. B: Environm. 33, 175-190 (2001)
• Eftaxias A., Font J., Fortuny A., Fabregat A., Stuber F., Nonlinear kinetic pa-rameter estimation using simulated annealing, Comp. Chem. Eng. 26, 1725-1733(2002)
• Eftaxias A., Font J., Fortuny A., Fabregat A., Stuber F., CWAO of phenol in aTrickle Bed Reactor using Active Carbon and CuO/γ − Al2O3: Catalytic Perfor-mance, Water Research, Submited
• Eftaxias A., F. Larachi, Stuber F., Modelling of a Trickle Bed Reactor for theCatalytic Wet Air Oxidation of Phenol, Can. J. Chem. Eng., Submited
171

172 Biographical Note
CONTRIBUTIONS IN CONGRESSES WITH PROCEEDINGS
• Eftaxias A., Font J., Fortuny A., Fabregat A., Stuber F., Catalytic Wet AirOxidation of Phenol in a Trickle Bed Reactor: A complex kinetic model, Posterpresentation, ECCE-3, Nuremberg, Germany, 2001
• Eftaxias A., , Font J., Fortuny A., Fabregat A., Stuber F., A detailed kinetic modelfor the catalytic wet air oxidation of phenol in a trickle bed reactor, Oral preseta-tion, 3rd Panhellenic Congress of Chemical Engineering, 31/05/2001-02/06/2001,Athens, Greece
• Eftaxias A., F. Trabelsi, F. Recasens, J. Sueiras, and F. Stuber, Preselectionof superciritical solvent for hydrogentation reactions via VLE calculations, PosterPresentation, II Jornadas de Ingenierıa Termodinamica, 7 - 8/ 06/2001, Tarragona,Spain
• Stuber F., Eftaxias A., M. Paradowska, M.E. Suarez, Font J., Fortuny A., Fabre-gat A., Tailored oxidation of organic pollutants in wastewater, Oral Presentation,Indo-French Workshop on Trickle Bed Reactors for Cleaner and Greener Environ-ment (Ed. K.D.P. Nigam), 7-8/11/2002, Delhi, India
• Eftaxias A., F. Larachi, Stuber F., Modelling of a Trickle Bed Reactor for theCatalytic Wet Air Oxidation of Phenol, 6th International Congress on Gas-Liquidand Gas-Liquid-Solid Reactor Engineering, 17-20/08/2003, Vancouver, Canada (ac-cepted)
VISITS IN OTHER RESEARCH GROUPS
• 25/11/2001 to 25/02/2002: Visit to the research group of Dr. F. Larachi at theDepartment of Chemical Engineering, Laval University, Quebec, Canada