7066434.pdf - UGent Biblio
211
Comparison of Magnetic Resonance Imaging and Computed Tomography for the detection of specific brain and cervical spine abnormalities in small animals Thesis submitted in fulfillment of the requirements for the degree of Doctor in Veterinary Sciences (PhD), Faculty of Veterinary Medicine, Ghent University 2016 Kaatje Kromhout Promotors Dr. I. Gielen Prof. Dr. L. Van Ham Dr. S. Bhatti Department of Veterinary Medical Imaging and Small Animal Orthopaedics Department of Medicine and Clinical Biology of Small Animals Faculty of Veterinary Medicine Ghent University
-
Upload
khangminh22 -
Category
Documents
-
view
0 -
download
0
Transcript of 7066434.pdf - UGent Biblio

Comparison of Magnetic Resonance Imaging and Computed Tomography for the
detection of specific brain and cervical spine abnormalities in small animals
Thesis submitted in fulfillment of the requirements for the degree of Doctor in Veterinary
Sciences (PhD), Faculty of Veterinary Medicine, Ghent University
2016
Kaatje Kromhout
Promotors
Dr. I. Gielen
Prof. Dr. L. Van Ham
Dr. S. Bhatti
Department of Veterinary Medical Imaging and Small Animal Orthopaedics
Department of Medicine and Clinical Biology of Small Animals
Faculty of Veterinary Medicine
Ghent University

Comparison of Magnetic Resonance Imaging and Computed Tomography for the
detection of specific brain and cervical spine abnormalities in small animals.
Kaatje Kromhout
Department of Veterinary Medical Imaging and Small Animal Orthopaedics
Department of Medicine and Clinical Biology of Small Animals
Faculty of Veterinary Medicine
Ghent University
Cover art designed by
No part of this work may be reproduced in any form without permission of the author.

“Nothing is impossible, the word itself says 'I'm possible'!” Audrey Hepburn


TABLE OF CONTENTS�
LIST OF ABBREVIATIONS 1
PREFACE 3
CHAPTER 1: GENERAL INTRODUCTION 7
1. Cross-sectional imaging techniques 9
1.1. Magnetic Resonance Imaging (MRI) 9
Basic principles 9
Low-field MRI versus high-field MRI 12
1.2. Computed Tomography (CT) 16
Basic principles 16
1.3. References 22
2. Review of roles and choices of MRI versus CT in brain and spinal
diseases in small animals 25
2.1. Introduction 25
2.2. Indications in brain and spinal diseases 25
Congenital and developmental anomalies 25
Vascular disease 28
Intracranial and spinal neoplasia 30
Inflammatory disease 31
Intervertebral disc disease and degenerative
disorders 35
Metabolic/toxic/degenerative brain disease 39
Craniospinal trauma 40
Cranial nerves, brachial and lumbosacral
plexus 42
Role of MRI and CT in the diagnostic work-up
of an epileptic veterinary patient 44

TABLE OF CONTENTS�
2.3. Conclusion 44
2.4. References 45
CHAPTER 2: SCIENTIFIC AIMS 57
CHAPTER 3: AGREEMENT BETWEEN LOW-FIELD MRI AND CT FOR
THE DETECTION OF SUSPECTED INTRACRANIAL LESIONS IN DOGS
AND CATS 61
Summary 63
Introduction 64
Materials and methods 65
Results 67
Discussion 79
References 86
CHAPTER 4: LOW-FIELD MRI AND MULTISLICE CT FOR THE
DETECTION OF CEREBELLAR (FORAMEN MAGNUM) HERNIATION
IN CAVALIER KING CHARLES SPANIELS 91
Summary 93
Introduction 94
Materials and methods 95
Results 99
Discussion 102
References 107

TABLE OF CONTENTS�
CHAPTER 5: LOW-FIELD MRI AND MULTISLICE CT FOR THE
DETECTION OF CERVICAL SYRINGOMYELIA IN DOGS 109
Summary 111
Introduction 112
Materials and methods 113
Results 117
Discussion 120
References 126
CHAPTER 6: GENERAL DISCUSSION 131
SUMMARY 163
SAMENVATTING 171
CURRICULUM VITAE 179
BIBLIOGRAPHY 183
DANKWOORD 191

TABLE OF CONTENTS�

LIST OF ABBREVIATIONS�
LIST OF ABBREVIATIONS
AOO atlanto-occipital overlapping
CH cerebellar herniation
CHL cerebellar herniation length
CSF cerebrospinal fluid
CKCS Cavalier King Charles Spaniels
CM Chiari-like malformation
CT computed tomography
CTM computed tomography myelography
DWI diffusion weighted imaging
FLAIR fluid attenuated inversion recovery
GME granulomatous meningoencephalitis
GRE gradient echo
HU Hounsfield units
HF high-field
LF low-field
MPR multiplanar reconstruction
MRI magnetic resonance imaging
�1

LIST OF ABBREVIATIONS�
MUO meningoencephalitis of unknown origin
PWI perfusion weighted imaging
SM syringomyelia
SNR signal to noise ratio
STIR short tau inversion recovery
SW syrinx width
T1WSE T1-weighted spin echo sequence
T2WSE T2-weighted spin echo sequence
WL window level
WW window width
�2

PREFACE�
�3
Preface

PREFACE�
�4

PREFACE�
Magnetic resonance imaging (MRI) and computed tomography (CT) are diagnostic
imaging procedures that are more and more used in veterinary medicine. They are
worldwide available in veterinary universities and large referral institutes. Nowadays
smaller clinics and first opinion practices are acquiring these modalities. Especially CT
machines are more readily available because the equipment and maintenance are less
expensive and operation is more user-friendly than MRI. Both cross-sectional methods
enable precise, non-invasive visualization of neuroanatomic structures and they play both
an important role in imaging neurological diseases of the brain and spinal cord. Each
modality has its specific advantages and disadvantages in detecting selected lesions. MRI is
generally considered as the modality of choice for imaging of the brain and spinal cord.
Veterinarians are often faced with a choice between MRI or CT for the optimal diagnostic
workup of their patients. This selection must be based on indications as well as knowledge
of the modalities strengths and weaknesses. In veterinary medicine there is a lack of studies
comparing MRI and CT in detecting intracranial and spinal cord lesions.
�5

PREFACE�
�6
CHAPTER 1�
�7
Chapter 1
General introduction

CHAPTER 1�
�8

CHAPTER 1�
1 ) Cross-sectional imaging techniques
1.1. Magnetic Resonance Imaging (MRI)
Basic principles
Magnetic resonance imaging uses the magnetic properties of protons to produce images.
The proton that is the most present in the body of animals and humans is hydrogen.1 Most
pathological processes result in changes of the normal tissues and cause therefore changes
in the hydrogen composition of the tissues. When the patient is positioned in an external
strong magnetic field (the MRI scanner) the hydrogen protons align with the direction of
the field. A radio frequency pulse is then transmitted with a coil which causes a
misalignment of certain protons. When the pulse is turned off the misaligned protons align
again with the magnetic field during a process called relaxation. During this process, radio
frequency energy is submitted that is captured by a receiver coil. Differences in relaxation
times (T1 and T2 relaxation2) of tissues create different signal intensities and tissue
contrast. The images created are gray scale images in which the degree of relative darkness
or lightness is referred to as intensity. Dark areas are called hypointense and light areas are
called hyperintense. Because the variations in T1 and T2 values are much greater than
variations in tissue density, MRI provides better soft tissue contrast than conventional
radiographs or CT.3 Due to a variation of radio frequency pulses and magnetic fields,
different sequences are created. The most frequently used are the T1-weighted (T1WSE)
and T2-weighted (T2WSE) spin-echo sequences (Fig. 1).
�9

CHAPTER 1�
On T1WSE images, contrast between tissues depends on differences in T1 relaxation.
Fluids have a long T1 relaxation time and are hypointense, whereas fat has a short T1
relaxation time and is hyperintense. The T1WSE images have excellent resolution, which
allows identification of anatomic structures. On T2WSE images, contrast between tissues
depends on differences in T2 relaxation times. Fluids appear strongly hyperintense and the
intensity of fat is variable on these images. T2WSE images are used to identify pathology.
Abnormal fluid collections and tissues with abnormal increased fluid content (e.g. oedema,
inflammation, neoplasia,..) will appear hyperintense4. The tissue characteristics on T1WSE
and T2WSE images are displayed in table 1.
�10
Fig. 1: Transverse (A) T1WSE and (B) T2WSE image of the normal brain
of a dog.

CHAPTER 1�
Gadolinium based contrast4 can be intravenously injected to highlight lesions and the
vascularization of tissues. Images can be acquired in three different planes (transverse,
dorsal and sagittal). No ionizing radiation is used during the examination. Disadvantages
are the long anaesthesia time (for example, a normal brain protocol will take between 45
and 60 minutes using a low-field machine) and the presence of artefacts on the images in
patient with metallic implants such as surgical screws, a skin staple and foreign bodies,…
due to the magnetic field.5 One main advantage of MRI is the ability to use different
sequences in the imaging process to facilitate the diagnosis of lesions. For example the
STIR (short tau inversion recovery) sequence is used to null the signal from fat. This
sequence offers good conspicuity of fluids and tissues with increased water content
including many pathologies which appear hyperintense on a STIR sequence without the
distraction of body fat.6 Fluid attenuated inversion recovery (FLAIR) can be obtained as a
T2W sequence. It suppresses the signal from fluid with low or no protein content such as
cerebrospinal fluid (CSF), so that it appears hypointense rather than hyperintense on the
images.
Tissue/Material T1WSE T2WSE
air black black
fat very bright bright
fluid dark bright
mineralisations/bone black black
muscle dark more dark
�11
Table 1. Tissue characteristics on MRI images

CHAPTER 1�
This sequence allows improved identification of pathologies, such as tissue edema, and aids
in identifying those lesions anatomically adjacent to areas such as a ventricle.7 Ultrafast
heavily T2-weighted sequences such as HASTE (half Fourier-acquisition single-shot turbo
spin-echo) are used to evaluate the subarachnoid space for localizing vertebral canal lesions
or spinal cord swelling comparable with a myelogram.8 T2*-weighted gradient echo
recalled sequences are valuable for their increased ability to detect the paramagnetic blood
degradation products associated with haemorrhage.9 Recent articles describe which
sequences should be used for optimal imaging of the brain and the spinal cord.10,11
Low-field MRI versus high-field MRI
Most MRI scanners used in veterinary medicine are low-field (LF) with a permanent
magnet (field strength approximately 0.2-0.4 Tesla). There are LF scanners for human use
and dedicated veterinary scanners who use adapted software and coils optimized for
veterinary patients.12 LF scanners are open systems (Fig 2.).
�12
A B
Fig. 2: The external appearance of a (A) low-field MR scanner and (B) high-field
MR scanner (photograph, The Royal Veterinary College, University of London).

CHAPTER 1�
The magnetic field is created between two horizontal discs. This is advantageous to scan
larger patients and allows easy access to the dog or cat. High-field (HF) scanners are
increasingly used in universities. They have a field strength above 1 Tesla. The magnetic
field is created by a large cylindrical gantry composed of electromagnets supercooled with
liquid helium. These are long enclosed tubular systems, which is a limitation for large
animals and creates challenges for monitoring the patients.LF scanners compared to HF are
relative low in purchase price and maintenance costs. A limitation of LF MR is the reduced
signal to noise ratio (SNR). SNR determines the appearance of the MR image. This ratio is
measured by calculating the difference in signal intensity between the area of interest (the
patient) and the background.13 SNR increases almost lineary with the field strength.14
Increased SNR is associated with improved resolution, detail and information present
within each pixel/voxel15, smaller voxel size and thinner slice thickness.12 LF MR is
therefore generally associated with longer scan times and decreased resolution leading to
less sharp, but still diagnostic images.12 Also LF MR have a smaller field of view then HF
MR, this may necessitate frequent patient repositioning when examining larger animals,
thus making it more time consuming. Older LF MR cannot provide thin slices with
sufficient SNR within a reasonable time. Nowadays all LF systems allow high-resolution
T1W three-dimensional (3D) gradient echo imaging. Data is acquired as a volume (slab),
which can then be divided into thin slices for high spatial resolution and multiplanar
reformatting. These sequences allow acquisition of isotropic (= equal intensity in all
directions) 1mm slices. Small and/or subtle contrast uptake can be detected because of the
high resolution.12 This can allow identification of small cranial nerves.16 They have and
added advantage of providing a dataset for 2D and 3D reconstructions without needing to
acquire additional imaging planes. Imaging artefacts17 affect both LF and HF magnets but
some may be pronounced more in one than the other. For example, motion artefacts (Fig. 3)
occur independently of the field strength, but require fast scanning to overcome them. HF
MR is therefore less vulnerable to motions artefacts than LF. Partial volume artefact can be
�13

CHAPTER 1�
seen when tissues of different signal become part of the same voxel.17 This appears more
frequently in LF MR imaging due to the often larger slice thickness.
Susceptibility artefact (Fig. 4) occurs when there is local alteration of the magnetic field,
e.g. because of the presence of a microchip, resulting in spatial misregistration and image
distortion. These artefacts are less marked in LF MR. 18
HF MRI scanners are more suited for advanced techniques, such as MR angiography
because of the possibility to use thinner slices and shorter acquisition time for each
sequence. In addition, the visibility of e.g. intracranial vessels is higher in HF MR
imaging.19 Also molecular imaging and MR spectroscopy require high field strengths of at
least 1 Tesla.20 Table 2 gives a summary of the main differences between LF an HF MR.
�14
Fig. 3: Motion artefact in a LF
MR system.
Fig. 4: Suspectibility artefact in
a LF MR system.

CHAPTER 1�
Low-field MR High-field MR
widespread available less available
open system closed system
0.2-0.4 Tesla > 1 Tesla
less expensive (purchase + maintenance) expensive
long imaging times (aneasthesia) shorter imaging times
low SNR high SNR
less contrast resolution excellent contrast resolution
�15
Table 2. Summary of the main differences between LF and HF MR

CHAPTER 1�
1.2. Computed Tomography
Basic principles
CT is a tomographic diagnostic technique that is based on the same x-ray principles as
conventional radiography. CT scanners (Fig. 5) are composed of a gantry, that houses an x-
ray tube and detectors. X-rays are produced by the x-ray tube that rotates 360 degrees
around the animal. When passing through the patient, the x-rays are attenuated. The amount
of attenuation depends on the density of the penetrated tissue. Opposite the x-ray tube,
detectors absorb the remaining x-rays and convert them into a digital signal. As the animal
passes through the gantry, on a sliding table, information regarding a cross section or slice
is obtained.
The contrast in CT images is the result of differences in attenuation between body tissues.
The higher the density of the tissue (e.g. bone), the higher the attenuation of the x-rays, the
brighter the tissue on the CT images (hyperattenuated or hyperdense). The lower the density
of the tissue (e.g. fluid), the lower the attenuation of the x-rays, the darker the tissues on the
CT images (hypoattenuated or hypodense).
�16
Fig. 5: Four-slice helical CT device.
CHAPTER 1�
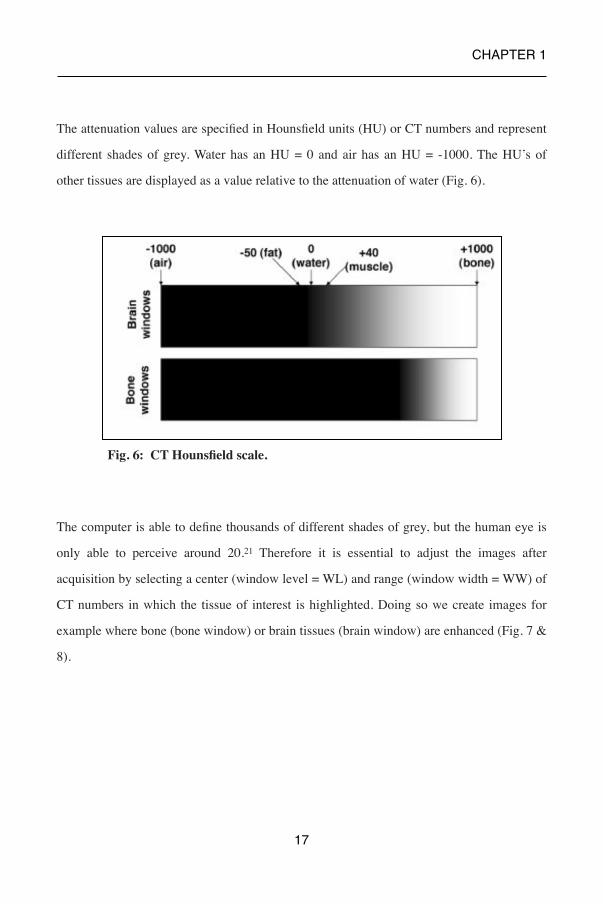
The attenuation values are specified in Hounsfield units (HU) or CT numbers and represent
different shades of grey. Water has an HU = 0 and air has an HU = -1000. The HU’s of
other tissues are displayed as a value relative to the attenuation of water (Fig. 6).
The computer is able to define thousands of different shades of grey, but the human eye is
only able to perceive around 20.21 Therefore it is essential to adjust the images after
acquisition by selecting a center (window level = WL) and range (window width = WW) of
CT numbers in which the tissue of interest is highlighted. Doing so we create images for
example where bone (bone window) or brain tissues (brain window) are enhanced (Fig. 7 &
8).
�17
Fig. 6: CT Hounsfield scale.

CHAPTER 1�
CT is superior to other cross-sectional techniques for the detection of calcification and to
evaluate the structure of bones. Iodinated contrast media can be used to increase the
contrast between normal tissue and pathologies and to visualise the vessels. Iodinated
contrast22 has more adverse effects than gadolinium based contrast23 used with MRI and
can cause vomiting, anxiety and hypotension in veterinary patients. With CT, images are
standardly acquired in transverse planes.
�18
Fig. 7: WW and WL of e.g. a bone and soft tissue window.
Fig. 8: The effect of WW and WL on CT image interpretation. CT image of the brain in
A) bone window WW= 1500 WL= 500 and B) brain window WW= 150 WL= 35.

CHAPTER 1�
With special software, reconstructions such as multiplanar reconstructions (MPR) and
volume rendering can be provided (Fig. 9 & 10).
�19
Fig. 10: Volume rendering image of a
dog with multiple skull fractures.
Fig. 9: Multiplanar reconstruction (MPR) of a Hansen Type I
disc extrusion at the level of the intervertebral lumbar space
4-5. A) Transverse image B) sagittal and C) dorsal view.

CHAPTER 1�
There are two types of CT scanners: single-slice and multislice scanners. In single-slice
scanners only one row of detectors is present and during each rotation a single slice of
anatomy is imaged. In multislice scanners several rows of detectors are present and during
rotation multiple slices of anatomy are acquired. Most modern CT scanners used in
veterinary medicine are multislice scanners. They can acquire thin slices (< 0.5mm) which
give more detail to the images and reduce artefacts such as partial volume averaging (see
supra). The acquisition time is faster with these machines. This decreases motion artefacts
and makes it possible to acquire multiphase studies (e.g. arterial, venous and portal studies).
Some artefacts such as beam hardening, which appear as dark bands or streaks adjacent to
highly attenuating structures, can influence the diagnostic value of CT. This is especially
the case in evaluation of the caudal fossa in animals due to the presence of dens temporal
bones (Fig. 11).
CT may be combined with myelography to allow visualization of the subarachnoid space,
improve accuracy in differentiating intramedullary from extradural causes of spinal cord
swelling, and determine the location of herniated disk material.
�20
Fig. 11: Beam hardening artefact at
the level of the caudal fossa.
CHAPTER 1�
CT myelography can be achieved by injecting iodinated contrast medium in the
subarachnoid space, at 25% of the regular myelographic dose.24 This allows excellent
delineation of the spinal cord. However this technique is invasive and is reported to cause
adverse effects such as seizures or neurological deterioration.25 As an example, CT
myelography has shown its effectiveness in veterinary patients in the diagnosis of brachial
plexus avulsion26 and spinal arachnoid diverticula.27
�21
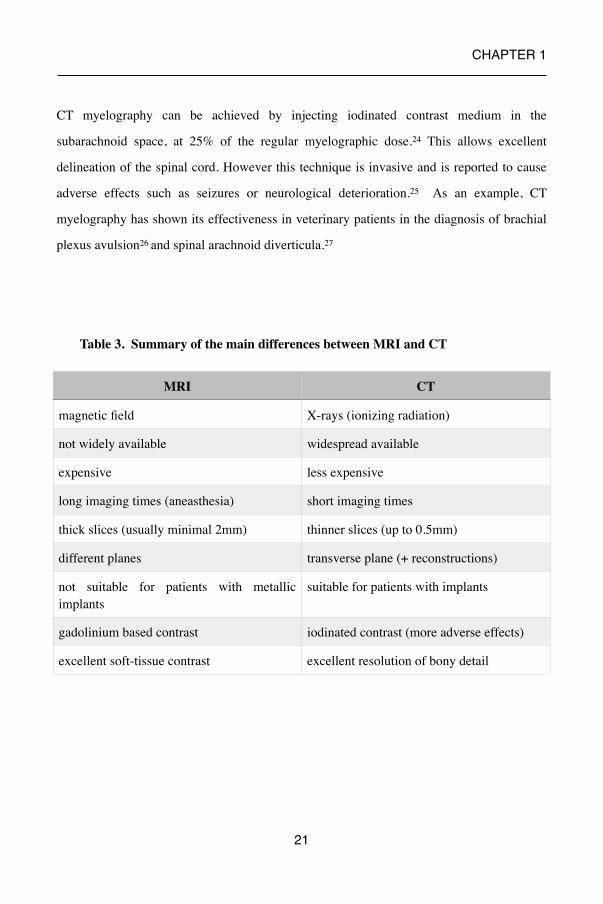
Table 3. Summary of the main differences between MRI and CT
MRI CT
magnetic field X-rays (ionizing radiation)
not widely available widespread available
expensive less expensive
long imaging times (aneasthesia) short imaging times
thick slices (usually minimal 2mm) thinner slices (up to 0.5mm)
different planes transverse plane (+ reconstructions)
not suitable for patients with metallic implants
suitable for patients with implants
gadolinium based contrast iodinated contrast (more adverse effects)
excellent soft-tissue contrast excellent resolution of bony detail

CHAPTER 1�
1.3. References
1. Westbrook C., Kaut Roth C, Talbot J. MRI in practice. Oxford (UK): Blackwell
Publishing Ltd; 2005.
2. Tidwell A.S. Principles of computed tomography and magnetic resonance imaging. In:
Thrall DE, editor. Textbook of veterinary diagnostic radiology. 5th edition. St. Louis
(MO): Saunders Elsevier; 2007. p. 50–77.
3. Edelman R.R., Warach S. Magnetic resonance imaging: first of two parts. N Engl J
Med 1993; 328:708–716.Kuriashkin IV, Losonsky JM. Contrast enhancement in
magnetic resonance imaging using intravenous paramagnetic contrast media: a review.
Vet Radiol Ultrasound 2000; 41: 4–7.
4. Hecht S., Adams W.H., Narak J. et al. Magnetic resonance imaging susceptibility
artifacts due to metallic foreign bodies. Vet Radiol Ultrasound 2011; 52: 409-414.
5. Benigni L., Lamb C.R. Comparison of fluid-attenuated inversion recovery and T2-
weighted magnetic resonance images in dogs and cats with suspected brain disease.
Vet Radiol Ultrasound 2005; 46: 287-292.
6. Eminaga S., Cherubini G.B., Villiers E. et al. STIR muscle hyperintensity in the
cervical muscles associated with inflammatory spinal cord disease of unknown origin.
J Small Anim Pract 2013; 54: 137-42.
7. Mankin J.M., Hecht S., Thomas W.B. Agreement between T2 and haste sequences in
the evaluation of thoracolumbar intervertebral disc disease in dogs.Vet Radiol
Ultrasound 2012; 53: 162-166.
8. Hammond L.J., Hecht S. Susceptibility artifacts on T2*-weighted magnetic resonance
imaging of the canine and the feline spine. Vet Radiol Ultrasound 2015; 56: 398-406.
9. Dennis R. Optimal magnetic resonance imaging of the spine. Vet Radiol Ultrasound
2011; 52 Suppl. 1: S72-S80.
10. Robertson I. Optimal magnetic resonance imaging of the brain. Vet Radiol Ultrasound
2011; 52 Suppl. 1: S15-22.
�22

CHAPTER 1�
11. Gavin P.R. Basic Physics. In: Gavin P.R., Bagley R. eds. Practical small animal MRI.
1st ed. Iowa, Wiley-Blackwell, 2009; 4-7.
12. Magee T., Shapiro M., Williams D. Comparison of High-Field-Strength Versus Low-
Field-Strength MRI of the shoulder. Am J Roentgenol 2003; 181: 1211-1215.
13. Werpy NM. Magnetic resonance imaging of the equine patient: a comparison of high
and low field systems. In: Dyson S, Orsini JA. Clinical Techniques in Equine Practice.
Philadelphia, PA: Elsevier Saunders, 2007, pp. 37–46.
14. Gonçalves R., Malalana F., McConnell J.F. et al. Anatomical study of cranial nerve
emergency and skull foramina in the horse using magnetic resonance imaging and
computed tomography. Vet Radiol Ultrasound 2015; 56: 391–397.
15. Bellon E.M., Haacke E.M., Coleman P.E., et al. MR artifacts: a review. Am J
Roentgenol 1986; 147: 1271– 1281.
16. Farahani K., Sinha U., Sinha S. et al. Effect of field strength on susceptibility artifacts
in magnetic resonance imaging. Comput Med Imaging Graph 1990; 14: 409–413.
17. Rodriguez D., Rylander H., Vigen K.K. et al. Influence of field strength on intracranial
vessel conspicuity in canine magnetic resonance angiography. Vet Radiol Ultrasound
2009; 50: 477–482.
18. Westbrook C., Kaut C., Talbot J. MRI in practice, 3rd ed. Oxford: Blackwell
Publishing Ltd, 2005.
19. Tidwell AS, Jones JC: Advanced imaging concepts: a pictorial glossary of CT and
MRI technology. Clin Tech Small Anim Pract 1999; 14: 65–111.
20. Vance A., Nelson M., Hofmeister E.H. Adverse reactions following administration of
an ionic iodinated contrast media in anesthetized dogs. J Am Anim Hosp Assoc 2012;
48: 172-175.
21. Girard N.M., Leece E.A. Suspected anaphylactoid reaction following intravenous
administration of a gadolinium-based contrast agent in three dogs undergoing
magnetic resonance imaging. Vet Anaesth Analg 2010; 37: 352-6.
�23

CHAPTER 1�
22. Sharp N.J.H., Cofone M., Robertson I. et al. Computed tomography in the evaluation
of caudal cervical spondylomyelopthy of the doberman pinsher. Vet Radiol Ultrasound
1995; 36: 100–108.
23. Barone G, Ziemer L.S, Shofer F.S, et al. Risk factors associated with development of
seizures after use of iohexol for myelography in dogs: 182 cases J Am Vet Med Assoc
1998; 220: 1499–1502.
24. Forterre F., Gutmannsbauer B., Schmall W. et al. CT myelography for diagnosis of
brachial plexus avulsion in small animals. Tierarztl Praxis K H 1988; 26: 322–329.
25. Mauler D.A., De Decker S., De Risio L. et al. Signalment, clinical presentation, and
diagnostic findings in 122 dogs with spinal arachnoid diverticula. J Vet Int Med 2014;
28: 175-81.
�24

CHAPTER 1�
2. Review of roles and choices of MRI versus CT in brain and spinal diseases in small
animals
2.1. Introduction
Magnetic resonance imaging (MRI) and computed tomography (CT) are diagnostic
imaging techniques that are widespread available for veterinary patients. Veterinarians are
often faced with the choice of which modality to use in the diagnostic workup of a patient.
This chapter offers a review of the applications of both techniques in a variety of diseases
of the brain and the spinal cord.
2.2. Indications in brain and spinal diseases
Congenital and developmental anomalies
Ventricular size in dogs or cats with hydrocephalus can be accurately assessed on CT1 and
MRI.2 Dilation of the lateral ventricles, or ventriculomegaly, is however not necessarily
associated with development of clinical signs and ventriculomegaly is commonly seen in
clinically normal brachycephalic breeds.3 Although this complicates interpretation of
imaging studies, a recent study has identified several MRI variables, which could aid in
differentiating clinically relevant from irrelevant ventricular dilation. These variables
include elevation of the corpus callosum, dorsoventral flattening of the interthalamic
adhesion and periventricular oedema.4 It is currently however unclear if these variables can
also be evaluated by CT imaging. The extent of cortical atrophy, and the presence of focal
lesions that can be observed in hydrocephalus can be seen on both techniques.5 MRI is
however more sensitive than CT in imaging small focal lesions, especially those in the
�25

CHAPTER 1�
caudal fossa.2 This region (brainstem and cerebellum) between the temporal bone is
sensitive to beam hardening artifacts on CT images which appear as dark bands or streaks
which can obscure lesions6. Both imaging methods are useful for evaluation of patients
with ventriculoperitoneal shunts after surgical placement.7 Both CT and MRI can be used
for follow-up assessments of changes in post-operative ventricular size or
ventriculoperitoneal shunt position.8 MRI characteristics of a ventriculoperitoneal shunt
associated infection have also been described.9 Cystic lesions such as intracranial intra-
arachnoid diverticula can be visualised with CT and MRI10 whereas spinal arachnoid
diverticula can be best appreciated with CT myelography and MRI.11
Given the superior imaging characteristics for bone, vertebral malformations and atlanto-
axial instability are best visualised on CT.12,13 Thoracic vertebral malformations, such as
hemivertebra, are however commonly seen in clinically normal screw-tailed brachycephalic
dogs and it has been estimated that up to 78% of clinically normal French Bulldogs have
thoracic hemivertebra and associated vertebral kyphosis.14 It is therefore important to
consider other causes for spinal dysfunction in French Bulldogs with radiological apparent
vertebral malformations. MRI offers the advantage of directly detecting spinal cord
compression or intraparenchymal lesions in these patients (Fig. 1A & B).
�26
Fig. 1A : A) Precontrast sagittal MPR CT (bone window) and B) T2WSE sagittal
MRI image of the thoracolumbar spine. A) Several vertebral malformations and a
mild kyphosis are visible at the level of T5-T10 B) a dorsal arachnoid diverticulum is
visible at the level of T10-T11 (arrow).

CHAPTER 1�
In contrast, atlanto-axial instability is typically not seen as an incidental radiological
finding. As stated above, CT is useful to assess bony changes and proves very useful for
assessment of dogs with suspected atlanto-axial instability. Atlanto-axial subluxation is
often associated with abnormalities of the dens, such as hypoplasia, aplasia or dorsal
angulation. CT is especially useful to evaluate the size and shape of the dens, detect
craniodorsal displacement of the axis, incomplete ossification, pre-operative planning and
evaluate postoperative surgical implant positioning.15 MRI provides the opportunity to
visualize secondary spinal cord compression. The ligamentous structures of the
atlantoaxial articulation have recently been described on MRI in cadaveric studies but these
structures are not well visualised in small patients.16 In multifactorial disorders, which are
associated with both bony and soft tissue abnormalities CT an MRI can be used in a
complementary matter, for example in Chiari-like malformation.17 Anatomical
abnormalities such as occipital hypoplasia and assessment of cranial over-riding of the atlas
are visible on CT.18 MRI is considered the imaging modality of choice to detect Chiari-like
malformation and syringomyelia.19,20 Generally MRI is considered the modality of choice
in dogs with suspected cervical spondylomyelopathy (CSM).21-23
�27
Fig. 1B : A) Sagittal MPR CT myelogram
(bone window) confirmed the presence of a
dorsal arachnoid diverticulum (arrow).
CHAPTER 1�
The main advantages of MRI over CT is the ability to directly visualise the spinal cord and
asses the intramedullary spinal cord changes24 which are associated with the presence of
clinical signs. Although anatomical features of CSM on MR images are similar to those in
CT, CT(-myelography) is suggested to be the most reliable imaging modality to assess
articular process abnormalities, intervertebral foraminal stenosis, narrowing of
intervertebral disc spaces and spondylosis deformans compared to low-field MRI.25 This is
also reflected in a recent study comparing non contrast CT and high-field MRI.26
Vascular disease
In haemorrhagic infarcts, acute and subacute bleedings can be readily visualized on CT
because of the hyperdense characteristics of haemorrhage compared to normal brain
parenchyma. The density gradually decreases to become isodense over days and weeks.27
Nowadays, MRI is as sensitive as CT for the detection of hyperacute intracranial
haemorrhages28 and superior for detecting subtle microbleeds and haemorrhagic
transformations.29,30 The appearance of a bleeding on MRI is dependent on the time and the
form of haemoglobine, which has variable magnetic properties.31
Gradient echo MR sequences are highly sensitive for the detection of blood products and
chronic haemorrhage, which may not be visible on CT.27 For the detection of ischemic
infarcts MRI is superior to CT (Fig. 2) due to its excellent soft tissue contrast and its ability
to detect subtle lesions.32
�28

CHAPTER 1�
These types of cerebrovascular accidents tend to have distinguishing characteristics on
conventional MRI and have been well described in recent years.33 Functional MRI
sequences, such as diffusion-weighted imaging (DWI) and perfusion-weighted imaging
(PWI) can be used to identify hyperacute lesions and to localise specific regions of
perfusion deficits.32-35 One study described the potential use of these functional MRI
sequences in differentiating neoplastic, inflammatory, haemorrhagic, and ischemic brain
diseases.36 CT has no advantages in identifying ischemic infarcts compared to MRI and is
only valuable to exclude other lesions such as intracerebral haemorrhages (i.e.
haemorrhagic infarcts). Intracranial aneurysms and cerebrovascular malformations can be
evaluated on both CT an MR images.34,37 Although a definitive diagnosis can only be made
by histopathological examination of the spinal cord, a presumptive ante-mortem diagnosis
of fibrocartilaginous embolism, the most common cause of ischaemic myelopathy in small
animals is based on a combination of characteristic clinical findings and specific MRI
abnormalities38,39 (Fig. 3).
�29
Fig. 2: A)T2WSE MRI and B) precontrast CT image at the level of the rostral
part of the cerebellum. A) A hyperintense ischemic infarct (arrow) is visible
right at the rostral part of the cerebellum. B) The lesion is not visible due to the
presence of beam hardening (streaks) (arrow).

CHAPTER 1�
CT findings of animals with ischaemic myelopathy have not yet been described and this
imaging modality is most likely not useful for obtaining a presumptive diagnosis of this
disorder.
Intracranial and spinal neoplasia
In general, MRI is superior to CT for detecting neoplastic lesions because of the superior
soft tissue contrast. MRI is more accurate in defining the extent and the morphology of the
tumor. CT is excellent for visualization of osseous lesions, which are commonly observed
in spinal neoplasia. Veterinary studies have revealed that CT imaging is less accurate than
MRI for detection of a suspected intracranial lesion.40 Although MRI will allow easy
detection of brain lesions, it is not always possible to differentiate between a neoplastic
lesion, inflammatory lesions, or a vascular lesion41, nor will MRI always allow to determine
the exact tumor type.42,43 After a presumptive diagnosis of neoplasia is made, a differential
diagnosis can be made dependent on different characteristics including: anatomic location,
distribution, CT density or MR signal characteristics, intensity and pattern of contrast
enhancement, tumor margin definition, secondary mass effects and the extent of associated
�30
Fig. 3: A) Postcontrast sagittal MPR CT (bone window) and B) sagittal STIR images
of the cervical region of a dog: A) No lesions are visible. B) A hyperintense signal is
visible in the spinal cord (black arrow). The intervertebral disc at the level of C5-C6
is less hydrated (white arrow) compared to the cranial adjacent disc. A presumptive
diagnosis of a fibrocartilaginous embolism is made.

CHAPTER 1�
oedema.44-47 Obtaining a final diagnosis requires histopathological examination of
neoplastic tissue, which can be collected during surgery or imaging guided biopsy
procedures. Imaging guided biopsies were classically obtained by CT-guided stereotactic
biopsy techniques.48-50
More recently, MRI-compatible stereotactic51 and MRI-guided free hand52 biopsy
techniques have been developed. When a tumor of the pituitary gland is suspected CT and
MRI provide comparable information.53,54 Dynamic contrast CT and MRI are frequently
used to diagnose pituitary microtumors.55,56 For the differentiation of the distribution
(intradural-extramedullary, intramedullary) of spinal cord tumors myelography is more
useful then CT and MRI.44,57
Inflammatory disease
Inflammatory brain and spinal disease can manifest as multifocal, focal or diffuse lesions.
Some diseases have signal attenuation similar to surrounding tissue and little or no contrast
uptake and therefore can be missed on CT (Fig. 4).
Hence MRI is in these cases the modality of choice. MRI sequences such as FLAIR
suppress the hyperintense signal associated with free fluid, such as CSF. This sequence
can therefore aid in differentiation of hyperintense pathological lesions (such as brain
oedema) and adjacent CSF, which have similar imaging characteristics on more
conventional T2WSE.58 When compared to T2WSE, FLAIR has also a higher sensitivity
for detecting subtle abnormalities and for lesions with multifocal localisations.59
Meningoencephalitis of unknown origin (MUO) is the most common inflammatory disorder
of the central nervous system in dogs and includes more specific disorders, such as
granulomatous meningoencephalitis (GME), necrotizing meningoencephalitis (NME), and
necrotizing leucoencephalitis (NLE).60
�31

CHAPTER 1�
�32
Fig. 4: A & C) Transverse T2WSE and B & D) postcontrast CT (brain
window) images of 2 pug dogs with a suspected meningoencephalitis of
unknown origin. Dog 1: A) Diffuse hyperintensities (arrows) are visible
bilateral in the subcortical white matter of the occipital and temporal
lobes. B) No lesions are visible. Dog 2: C) Asymmetric hyperintensities
(arrow) are visible in the cortical gray and subcortical white matter of the
parietal and temporal lobes. An asymmetric lateral ventricle is present.
(asterisk). D) Hypodense aspect at the right side of the parietal and
temporal lobes (black arrow). A midline shift is present (white arrow). An
asymmetric lateral ventricle is visible (asterisk).
CHAPTER 1�
Although several studies have reported the MRI characteristics of GME, NME or
NLE59,61-63, it is currently unknown how well these more specific disorders can be
differentiated by MRI. Furthermore, a previous study64 determined that approximately 25%
of brain MR images of dogs with inflammatory CSF revealed no abnormalities,
emphasizing that a normal brain MR image does not rule out the presence of inflammatory
disease. In agreement with the situation of intracranial neoplasia, definitive diagnosis of this
group of diseases requires histopathology.52,65
Only a few reports have described the CT and MR imaging abnormalities of non-infectious
inflammatory spinal disease. Reported abnormalities were considered non-specific.59,64,66
Although CSF analysis can support the diagnosis of inflammatory spinal disease, 10% of
affected cases may have normal CSF findings.65,67
Recently, the addition of a STIR sequence to the MRI protocol has been suggested to
improve the detection of inflammatory spinal cord disease.68 STIR suppresses the signal
from fat on T2W-like sequences69 and offers good conspicuity of fluids and tissues with
increases water content, including pathologies. In case of suspected inflammatory spinal
cord disease STIR muscle hyperintensities were detected and had a positive correlation
with inflammatory CSF changes (sensitivity 78%, specificity 92%).68 Conventional
radiographic examination is traditionally used to diagnose discospondylitis.70 Collapse of
the intervertebral disc is seen initially, followed by bone lysis centered at the vertebral
endplates, sclerosis and spondylosis. The main limitations of radiography are the delay (up
to 2 weeks) between the onset of clinical signs and detection of radiographic findings. CT is
more sensitive than radiography for identifying early endplate osteolysis.71 MRI is more
sensitive than CT for detecting soft tissue inflammation of the intervertebral disc and bone
marrow changes in affected vertebrae, which precede osteolysis.
MRI is preferred over CT in early cases where clinical signs are present but no radiographic
abnormalities are present72 (Fig. 5 & 6).
�33
CHAPTER 1�
�34
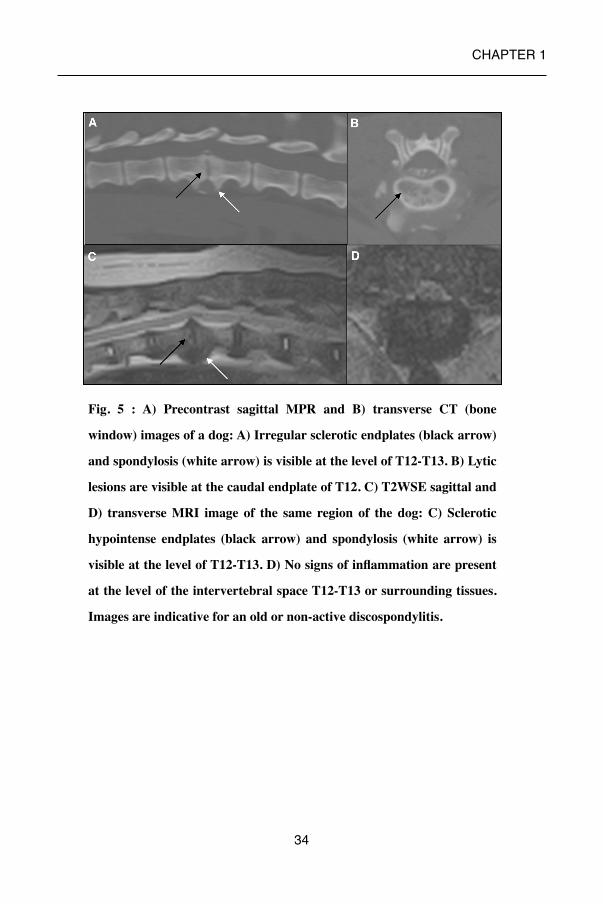
Fig. 5 : A) Precontrast sagittal MPR and B) transverse CT (bone
window) images of a dog: A) Irregular sclerotic endplates (black arrow)
and spondylosis (white arrow) is visible at the level of T12-T13. B) Lytic
lesions are visible at the caudal endplate of T12. C) T2WSE sagittal and
D) transverse MRI image of the same region of the dog: C) Sclerotic
hypointense endplates (black arrow) and spondylosis (white arrow) is
visible at the level of T12-T13. D) No signs of inflammation are present
at the level of the intervertebral space T12-T13 or surrounding tissues.
Images are indicative for an old or non-active discospondylitis.

CHAPTER 1�
Intervertebral disc disease and degenerative disorders
Intervertebral disc disease (IVDD) is the most common spinal disease of dogs (Fig. 7 & 8).
Several studies have compared the accuracy of conventional myelography, non enhanced
CT, contrast-enhanced CT and MRI for the detection of disc extrusions. Conventional CT
has been reported to be 89-100% accurate to localize the lesion.73-75 Computed tomography
has a similar sensitivity for the detection of the site of disc herniation compared to
myelography (81% versus 84%). CT had an increased sensitivity for the detection in large
dogs and chronic cases, while myelography was found to be more useful in small dogs
(<5kg).76 Overall the sensitivity of MRI is greater than CT for detection of disc herniation
(98.5 versus 88.6%).75
�35
**
Fig. 6: A) Precontrast sagittal MPR CT (bone window) and B) sagittal STIR
images of the lumbosacral region of a dog: A) Lytic endplates (black arrow) and
spondylosis (white arrow) is visible at the level of L7-S1. B) A hyperintense
signal consistent with inflammation is visible in the paravertebral soft tissues
(black asterisk) and vertebral bodies (white asterisk). Hyperintense and
abnormal shape of disc is present (black arrow). Images are indicative for an
active discospondylitis.

CHAPTER 1�
�36
*
Fig. 7: Precontrast sagittal MPR CT image (bone
window) of a dog with a disc extrusion at the level
of C5-C6. A narrowed intervertebral space is
visible (black arrow). Mineralized disc material is
present (asterisk).
Fig. 8: A) Precontrast sagittal MPR CT (soft tissue window) and B) sagittal
T2WSE images of a dog with a disc protrusion (arrow) at the level of C3-C4.

CHAPTER 1�
More specifically, MRI is more accurate to detect the site of intervertebral disc herniation
associated spinal cord compression and to differentiate between extrusions and protrusions.
75 CT may be less accurate for the detection of protrusions.74,75 In cases of hydrated nucleus
pulposus extrusion (HNPE) only MR imaging features are available.77 Acute non
compressive nucleus pulposus extrusions (ANNPE) have the same clinical characteristics
as FCE and can be presumptivly distinguished due to specific MRI characteristics.78,79 No
CT characteristics of ANNPE have been reported.
Degenerative lumbosacral stenosis (DLSS) (Fig. 9) is a relative common disorder that has a
high prevalence in large dogs, especially German Shepard dogs.80 DLSS is a multifactorial
disorder in which cauda equina compression is predominantly caused by disc protrusion.
Hypertrophy of the surrounding bony and soft tissue structures can contribute to
progressive stenosis of the lumbosacral vertebral canal.81 CT and MRI are both considered
standard diagnostic tools for DLSS. CT findings are comparable to conventional
radiography but provide extra information because of the possibility of reconstructing
transverse images in different planes as well as demonstrating the loss of epidural fat.82
This gives the ability to identify e.g. entrapped thickened nerve roots and to give more
detail of the L7-S1 intervertebral foramina.83 MR findings in dogs with DLSS are the same
as for CT84 but MRI provides more detailed information on IVD degeneration, dural sac,
and/or nerve root displacement as well as loss of epidural fat. CT is more sensitive for soft-
tissue calcifications, cortical bone spurs, and degenerative changes in the facet joints.85
Although there seems to be a high degree of agreement between findings on CT and MR for
DLSS the correlation of these features with surgical findings is only moderate.84,86 In other
degenerative diseases e.g. diffuse idiopathic skeletal hyperostosis (DISH) and spondylosis
deformans (SD) both modalities can be used.87 A recent study revealed that MRI allows
differentiation between the two by providing information about the signal intensity of new
bone.88
�37

CHAPTER 1�
�38
Fig. 9 : A) Precontrast sagittal MPR (bone window) and B) postcontrast
transverse CT (soft tissue window) images of the lumbosacral region of a dog:
A) A lumbosacral step (white arrow) and spondylosis (black arrow) is visible
at the level of L7-S1. Ventral displacement of the roof of the sacrum (asterisk)
B) Loss of epidural fat (white arrow) and disc protrusion is visible. C) T2WSE
sagittal and D) transverse MRI image of the same region of the dog: C) A
degenerative disc (black arrow) and spondylosis (black arrow) is visible at the
level of L7-S1. D) A dorsal Tarlov cyst is present (black arrow).

CHAPTER 1�
Metabolic/ toxic/ degenerative brain disease
In these diseases e.g. lysomal storage disease, mitochondrial encephalopathy, hepatic
encephalopathy, thiamine deficiency,… MRI is the modality of choice (Fig. 10). MRI
characteristics are well described and include bilateral symmetric lesions and abnormal
findings of the corpus callosum.89 In degenerative disease such as age-related degeneration,
CT and MR features are described and include enlargement of the ventricular system and
prominence of the brain cortical margins and sulci due to expansion of subarachnoid space
volume.90 MRI findings have been reported that can be used to differentiate between age
related cerebrocortical atrophy and cognitive dysfunction syndrome. 91
�39
Fig. 10 : A) T2WSE transverse MRI and B) postcontrast transverse
CT (brain window) image at the level of the thalamus of a dog. A)
Bilateral hyperintense symmetric lesions (arrows) are visible at the
thalamus. B) No lesions are visible. The images are suggestive for a
metabolic disease (osmotic myelinolysis).
CHAPTER 1�
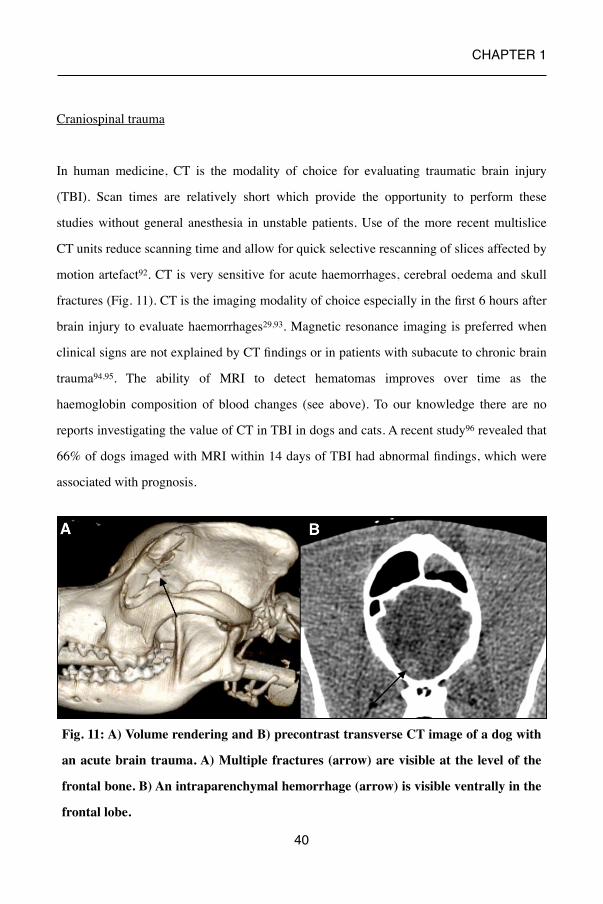
Craniospinal trauma
In human medicine, CT is the modality of choice for evaluating traumatic brain injury
(TBI). Scan times are relatively short which provide the opportunity to perform these
studies without general anesthesia in unstable patients. Use of the more recent multislice
CT units reduce scanning time and allow for quick selective rescanning of slices affected by
motion artefact92. CT is very sensitive for acute haemorrhages, cerebral oedema and skull
fractures (Fig. 11). CT is the imaging modality of choice especially in the first 6 hours after
brain injury to evaluate haemorrhages29,93. Magnetic resonance imaging is preferred when
clinical signs are not explained by CT findings or in patients with subacute to chronic brain
trauma94,95. The ability of MRI to detect hematomas improves over time as the
haemoglobin composition of blood changes (see above). To our knowledge there are no
reports investigating the value of CT in TBI in dogs and cats. A recent study96 revealed that
66% of dogs imaged with MRI within 14 days of TBI had abnormal findings, which were
associated with prognosis.
�40
Fig. 11: A) Volume rendering and B) precontrast transverse CT image of a dog with
an acute brain trauma. A) Multiple fractures (arrow) are visible at the level of the
frontal bone. B) An intraparenchymal hemorrhage (arrow) is visible ventrally in the
frontal lobe.

CHAPTER 1�
CT is an ideal modality for evaluating the extent of vertebral fractures and to observe for
bone fragments resulting from vertebral fracture into the vertebral canal.97,98
Compared to CT, survey radiographs have a sensitivity of 72% for the detection of
fractures and 77,5% for the detection of subluxation.99 MRI is considered a superior
diagnostic modality for imaging soft-tissue structures (e.g. spinal cord, nerve roots, and
intervertebral discs) and is the imaging modality of choice for evaluating parenchymal
injuries100 (Fig.12). MRI is less sensitive and specific for detecting and characterizing
vertebral fractures or subluxations. GRE sequences can be used to better delineate bone
(signal void) from surrounding soft tissues, and thin collimation and reformatted images
can aid fracture diagnosis.101 CT can be used in vertebral stabilization surgeries to define
optimal safe implant position/corridors in dogs and cats.102,103
�41
Fig. 12 : A) Precontrast transverse CT (bone window) and B) STIR transverse MRI
image of the cervical spine of a dog. A) A widened right articular facet joint (arrow) is
present at the level of C5-C6. B) A hyperintense intramedullary lesion is visible. A
subluxation is present at the level of C5-C6 with a presumed intramedullary
hemorrhage or oedema.

CHAPTER 1�
Cranial nerves, brachial and lumbosacral plexus
CT and MRI imaging of normal cranial nerves have been described.104,105 However, not all
individual cranial nerves can be identified using conventional MRI sequences used in
veterinary medicine. Image slices are thick relative to the diameter of the nerves, and subtle
abnormalities of nerves might therefore be missed.104 Sensitivity and specificity can be
increased, in detecting e.g. facial nerve abnormalities, by using specific sequences such as
volumetric interpolated breath-hold examination sequences.106 Brachial plexus avulsions
with the presence of a dural tear can be diagnosed by CT myelography.107 Conventional
MR imaging is a standard procedure used in humans to detect nerve root avulsions although
it is less reliable than CT myelography.108 In veterinary medicine conventional MRI
findings and MRI with intrathecal contrast is described in one dog.109 For the detection of
primary or secondary nerve sheath tumors both modalities can be used.110,111 STIR MR
sequences are valuable because of the ability to suppress signal from fat, making the
hyperintense neoplastic nerve lesions more noticeable.112 Masses as small as 1.0 cm can be
identified on contrast- enhanced CT scans with a single slice machine110 (Fig. 13).
�42
Fig. 13: Postcontrast transverse A) CT and B) T1WSE image at the level of C7-T1.
A & B) An enlarged right spinal nerve is visible. Images are suggestive for a
peripheral nerve sheath tumor.

CHAPTER 1�
�43
Table 1. Indications for CT and MRI in brain and spinal disease
Indication CT MRI
Congenital and developmental anomalies
x- assessment of bony
changes/abnormalities e.g. vertebral malformations,
articular process abnormalities,…
- multifactorial disease e.g. cervical
spondylomyelopathy
xxx
Vascular disease (x)acute haemorrhage
xxx
Intracranial and spinal neoplasia
x- detection of calcifications,
lytic lesions, hyperostosis,..- lesions caudal fossa can be
missed
xx
Inflammatory disease to exclude other lesions xxx
IVD and degenerative disorders
x- mineralized disc material- multifactorial disease e.g.
degenerative lumbosacral stenosis
xx
Metabolic/toxic/degenerative brain disease
to exclude other lesions xxx
Craniospinal trauma xx(x)- unstable patient- vertebral & skull fractures,
luxations,…- acute haemorrhage (< 6
hours)
xx
Cranial nerves, brachial and lumbosacral plexus
x- CT myelography (dural
tear)
xx

CHAPTER 1�
Role of MRI and CT in the diagnostic work-up of epileptic veterinary patients
MRI is the diagnostic imaging modality of choice for evaluation of the brain in animals
with seizures. MRI is indicated when a structural epilepsy is suspected or to support the
diagnosis of idiopathic epilepsy.113 Recently a standardized veterinary epilepsy-specific
MRI protocol was developed which will facilitate more detailed examination of areas
susceptible to generating and perpetuating seizures.114 MRI plays an additional role in the
detection of postictal damage of the brain. Severe seizure activity can cause reversible MR
signal changes in certain areas of the brain. In dogs, these changes have been identified
unilaterally or bilaterally, predominantly in the piriform and temporal lobes, but also in the
olfactory bulb and frontal lobe on MRI. These changes most probably represent cytotoxic
and vasogenic oedema induced by seizures.115 In human medicine, guidelines for
neuroimaging studies suggest that a CT can be the diagnostic imaging of choice in patients
with epilepsy if an MRI is not available. CT can be used in emergency situations, the
perioperative period and can be useful to assess electrode placement.116
2.3. Conclusion
Overall MRI is the modality of choice in patients with suspected lesions of the brain or the
spinal cord (table 1). CT can be used when MRI is not available or in cases where the
patient is unstable and a quick assessment is necessary such as in hyperacute traumatic
events. In some diseases both techniques can be used in a complementary matter. This is
especially true for multifactorial disorders e.g. CSM, DLSS,.. which are associated with
both bony and soft tissue abnormalities.
�44

CHAPTER 1�
2.4. References
1. Schroder H., Meyer-Lindenberg A., Nolte I. Comparative examination of the lateral
cerebral ventricles of different dog breeds using quantitative computer tomography. Berl
Munch Tierarztl 2006; 119: 506-511.
2. Adamiak Z., Jaskolska M., Pomianowski A. Low field Magnetic Resonance Imaging of
canine hydrocephalus. Pak Vet J 2012; 32: 128–130.
3. Ryan R.T., Glass E.N., Seiler G. et al. Magnetic resonance imaging findings associated
with lateral cerebral ventriculomegaly in English Bulldogs. Vet Rad Ultrasound 2013; 55:
292-299.
4. Laubner S., Ondreka N., Failing K. et al. Magnetic resonance imaging signs of high
intraventricular pressure - comparison of findings in dogs with clinically relevant internal
hydrocephalus and asymptomatic dogs with ventriculomegaly. BMC Vet Res 2015, 11: 181.
5. Thomas W.B. Diskospondylitis and other vertebral infections Vet Clin N Am-Small
2009; 30: 169-182.
6. Porat-Mosenco Y., Schwarz T., Kass P.H. Thick-section reformatting of thinly
collimated computed tomography for reduction of skull-base-related artifacts in dogs and
horses. Vet Radiol Ultrasound 2004; 45: 131-135.
7. Pomianowski A., Adamiak Z. Magnetic Resonance Imaging as a useful tool for the
selection of pharmacological and surgical treatment options for canine hydrocephalus. B Vet
I Pulawy 2012; 56: 389–391.
8. Shihab N., Davies E., Kenny P.J. et al. Treatment of hydrocephalus with
ventriculoperitoneal shunting in twelve dogs.Vet Surg 2011; 40: 477-84.
9. Platt S.R., McConnell J.F. & Matiasek Imaging diagnosis—Ventriculo-peritoneal shunt
associated infection in a dog. Vet Rad Ultrasound 2012; 53: 80-83.
10. Vernau K.M., Kortz G.D., Koblik P.D. et al. Magnetic resonance imaging and
computed tomography characteristics of intracranial intra-arachnoid cysts in 6 dogs. Vet
Radiol Ultrasound 1997; 38: 171-176.
�45

CHAPTER 1�
11. Mauler D.A., De Decker S., De Risio L. et al. Signalment, clinical presentation, and
diagnostic findings in 122 dogs with spinal arachnoid diverticula. J Vet Int Med 2014; 28:
175-81.
14. Moissonnier P., Blot S., Devauchelle P. et al. Stereotactic CT-guided brain biopsy in
the dog. J Small Anim Pract 2002; 43: 115-23.
15. Vizcaino Reces N., Stahl C., Stoffel M. et al. CT scan based determination of optimal
bone corridor for atlantoaxial ventral screw fixation in miniature breed dogs. Vet Surg 2013;
42: 819-824.
16. Middelton G., Hillmann D.J., Trichel J. et al. Magnetic resonance imaging of the
ligamentous structures of the occipitoatlantoaxial region in the dog. Vet Radiol Ultrasound
2012; 53: 545–551.
17. Marino D.J., Loughin C.A., Dewey C.W. et al. Morphometric features of the
craniocervical junction region in dogs with suspected Chiari-like malformation determined
by combined use of magnetic resonance imaging and computed tomography. Am J Vet Res
2012; 73: 105-11.
18. Cerda-Gonzales S., Olby N.J., McCullough S. at al. Morphology of the caudal fossa in
Cavalier King Charles Spaniels. Vet Radiol Ultrasound 2009; 50: 37–46.
19. Rusbridge C., Greitz D., Iskandar B.J. Syringomyelia: Current Concepts in
Pathogenesis, Diagnosis, and Treatment. J Vet Intern Med 2006; 20: 469-479.
20. Couturier J., Rault D., Cauzinille L. Chiari-like malformation and syringomyelia in
normal Cavalier King Charles spaniels: a multiple diagnositic imaging approach. J Small
Anim Practice 2008; 49: 438-443.
21. Lipsitz D., Levitski R.E., Chauvet A.E. et al. Magnetic resonance imaging features of
cervical stenotic myelopathy in 21 dogs. Vet Radiol Ultrasound 2001; 42: 20–27.
22. Da Costa R.C., Parent J., Dobson H. et al. Comparison of magnetic resonance imaging
and myelography in 18 Doberman Pinscher dogs with cervical spondylomyelopathy. Vet
Radiol Ultrasound 2006; 47: 523–531.
�46

CHAPTER 1�
23. De Decker S., Gielen I.M., Duchateau, L. et al. Low-field magnetic resonance imaging
findings of the caudal portion of the cervical region in clinically normal Doberman
Pinschers and Foxhounds. Am J Vet Res 2010; 71: 428–434.
24. Gutierrez-Quintana R., Penderis J. MRI features of cervical articular process
degenerative joint disease in Great Dane dogs with cervical spondylomyelopathy. Vet
Radiol Ultrasound 2012; 53: 304-311.
25. De Decker S., Gielen I.M., Duchateau, L. Intraobserver, interobserver and intermethod
agreement of myelography, computed tomography–myelography, and low field magnetic
resonance imaging in dogs with disc associated wobbler syndrome. J Am Vet Med Assoc
2011; 238: 1601-1608.
26. Martin-Vaquero P.M., Da Costa R.C., Drost W.M.T. Comparison of noncontrast
computed tomography and high-field magnetic resonance imaging in the evaluation of great
danes with cervical spondylomyelpathy. Vet Radiol Ultrasound 2014; 55: 496-505.
27. Hoggard N., Wilkinson I.D., Paley M.N. et al. Imaging of haemorrhagic stroke. Clin
Radiol 2002; 57: 957–968.
28. Schellinger P.D., Jansen O., Fiebach J.B. et al. A standardized MRI stroke protocol:
comparison with CT in hyperacute intracerebral hemorrhage. Stroke 1999; 30: 765–768.
29. Tidwell C.S., Chalela J.A., SAaver J.L. Comparison of MRI and CT for detection of
acute intracerebral hemorrhage. J Am Med Assoc 2004; 292: 1823-1830.
30. Fulkerson C.V., Young, B.J., Jackson N.D. et al. MRI characteristics of cerebral
microbleeds in four dogs. Vet Radiol Ultrasound 2012; 53: 389-393.
31. Parizel P.M., Makkat S., Van Miert E. Intracranial hemorrhage: principles of CT and
MRI interpretation. Eur Radiol 2001; 11: 1770-1783.
32. Heiland S. Diffusion- and perfusion-weighted MR imaging in acute stroke: principles,
methods, and applications. Imaging Decisions MRI 2003; 7: 4–12.
�47

CHAPTER 1�
33. Garosi L., McConnell J.F., Platt S.R. et al. Clinical and topographic magnetic resonance
characteristics of suspected brain infarction in 40 dogs. J Vet Int Med 2006; 20: 311–321.
34. Tidwell A.S., Robertson I.D. Magnetic resonance imaging of normal and abnormal
brain perfusion. Vet Radiol & Ultrasound 2011; 52 supplement 1: 62–71.
35. Hartmann A., Soffler C., Failing K. et al. Diffusion-weighted magnetic resonance
imaging of the normal canine brain. Vet Radiol Ultrasound 2014; 55: 592-598.
36. Sutherland-Smith J., King R., Faissler, D. et al. Magnetic resonance imaging apparent
diffusion coefficients for histologically confirmed intracranial lesions in dogs. Vet Radiol
Ultrasound 2011; 52: 142–148.
37. Tidwell A.S., Ross L.A., Kleine L.J. Computed tomography and magnetic resonance
imaging of cavernous sinus enlargement in a dog with unilateral exophtalmos. Vet Radiol
Ultrasound 1997; 38: 363-370.
38. Grunenfelder F.L., Weishaupt D., Green R. et al. Magnetic resonance imaging findings
in spinal cord infarction in three small breed dogs. Vet Radiol Ultrasound 2005; 46: 91–96.
39. De Risio L., Adams V., Dennis R. Magnetic resonance imaging findings and clinical
associations in 52 dogs with suspected ischemic myelopathy. J Vet Int Med 2007; 21: 1290–
1298.
40. Snyder J.M., Shofer F.S., Van Winkle T.J. et al. Canine intracranial primary neoplasia:
173 Cases (1986–2003). J Vet Int Med 2006; 20: 669–675.
41. Young B.D., Fosgate G.T., Holmes S.P. et al. Evaluation of standard magnetic
resonance characteristics used to differentiate neoplastic, inflammatory, and vascular brain
lesions in dogs. Vet Radiol Ultrasound 2014; 55: 399-406.
42. Young B.D., Levine J.M., Porter B.F. et al. Magnetic resonance imaging features of
intracranial astrocytomas and oligodendrogliomas in dogs. Vet Radiol Ultrasound 2011; 52:
132-141.
43. Rodena S., PumarolaM., Gaiteri L. et al. Magnetic resonance imaging findings in 40
dogs with histologically confirmed intracranial tumours. Vet J 2011; 187: 85-91.
�48

CHAPTER 1�
44. Kippenes H., Gavin P.R., Bagley R.S. Magnetic resonance imaging features of tumors
of the spine and spinal cord in dogs. Vet Radiol Ultrasound 1999; 40: 627–633.
45. Fuchs C., Meyer-Lindenberg A., Wohlsein P. et al. Computertomographic
characteristics of primary brain tumors in dogs and cats. Berl Munch Tierarztl 2003; 116:
436-42.
46. Wisner E.R., Dickinson P.J., Higgins R.J. Magnetic resonance imaging features of
canine intracranial neoplasia. Vet Radiol Ultrasound 2011; 52: S52-61.
47. Bentley R.T. Magnetic resonance imaging diagnosis of brain tumors in dogs. Vet J
2015; 205: 204-16.
48. Koblik P.D., Lecouteur, R.A., Higgings R.J et al. CT-guided brain biopsy using a
modified Pelorus Mark III stereotactic system: experience with 50 dogs. Vet Radiol
Ultrasound 1999; 40: 434-440.
49. Moissonnier P., Blot S., Devauchelle P. et al. Stereotactic CT-guided brain biopsy in the
dog. J Small Anim Practice 2002; 43: 115-23.
50. Vignoli M., Ohlreth S., Rossi F. Computed tomography-guided fine-needle aspiration
and tissue-core biopsy of bone lesions in small animals. Vet Radiol Ultrasound 2004; 45:
125-130.
51. Chen A.V., Wininger F.A., Frey S. et al. Description and validation of a magnetic
resonance imaging-guided stereotactic brain biopsy device in the dog. Vet Radiol
Ultrasound 2012; 53: 150-156.
52. Flegel T., Oevermann A., Oechtering G. et al. Diagnostic yield and adverse effects of
MRI-guided free-hand brain biopsies through a mini-burr hole in dogs with encephalitis. J
Vet Int Med 2012; 26: 969–976.
53. Auriemma E., Barthez P.Y., Van Der Vlugt-Meijer R.h. et al. Computed tomography and
low-field magnetic resonance imaging of the pituitary gland in dogs with pituitary-
dependent hyperadrenocorticism: 11 cases (2001–2003). J Am Vet Med Assoc 2009; 235:
409–414.
�49

CHAPTER 1�
54. Pollard R.E., Reilly C.M., Uerling M.R. Cross-sectional imaging characteristics of
pituitary adenomas, invasive adenomas and adenocarcinomas in dogs: 33 cases (1988–
2006). J Vet Int Med 2010; 24: 160–165.
55. Van Der Vlugt-Meijer R.H., Meij, B.P., Van Den Ingh T.S.et al. Dynamic computed
tomography of the pituitary gland in dogs with pituitary-dependent hyperadrenocorticism.
J Vet Int Med 2003; 17: 773–780.
56. Taoda T., Hara Y., Masuda H. et al. Magnetic resonance imaging assessment of pituitary
posterior lobe displacement in dogs with pituitary-dependent hyperadrenocorticism. J Vet
Med Sci 2011; 73: 725–731.
57. Drost W.T., Love N.E., Berry C.R. Comparison of radiography, myelography and
computed tomography in the evaluation of canine vertebral and spinal cord tumors in
sixteen dog. Vet Radiol Ultrasound 1996; 37: 28-33.
58. Benigni L., Lamb C.R. Comparison of fluid-attenuated inversion recovery and T2-
weighted magnetic resonance images in dogs and cats with suspected brain disease. Vet
Radiol Ultrasound 2005; 46: 287-292.
59. Cherubini G.B., Platt S.R., Anderson T.J. et al. Characteristics of magnetic resonance
images of granulomatous meningoencephalomyelitis in 11 dogs. Vet Rec 2006; 159:110–
115.
60. Talarico L.R., Schatzberg S.J. Idiopathic granulomatous and necrotising inflammatory
disorders of the canine central nervous system: a review and future perspectives. J Small
Anim Pract 2010; 51: 138–149.
61. Von Praun F., Matiasek K., Grevel V. Magnetic resonance imaging and pathologic
findings associated with necrotizing encephalitis in two Yorkshire terriers. Vet Radiol
Ultrasound 2006; 47: 260–264.
62. Adamo P.F., Adams W.M., & Steinbergh H. Granulomatous meningoencephalomyelitis
in dogs. Compendium 2007; 27: 678-690.
�50
CHAPTER 1�
63. Young B.D., Levine J.M., Fosgate G.T. et al. Magnetic resonance imaging
characteristics of necrotizing meningoencephalitis in Pug dogs. J Vet Int Med 2009; 23:
527–535.
64. Lamb C.R., Croson P.J., Cappello R. Magnetic resonance imaging findings in 25 dogs
with inflammatory cerebrospinal fluid. Vet Radiol Ultrasound 2005; 46: 17–22.
65. Tipold, A. Diagnosis of inflammatory and infectious diseases of the central nervous
system in dogs: a retrospective study. J Vet Int Med 1995; 9: 304–314.
66. Levine G. J., Cook J.R., Kerwin S.C. et al. Relationships between cerebrospinal fluid
characteristics, injury severity, and functional outcome in dogs with and without
intervertebral disk herniation. Vet Clin Path 2014; 43: 437- 446.
67. Cizinauskas S., Jaggy A., Tipold A. Long-term treatment of dogs with steroid-
responsive meningitis-arteritis: clinical, laboratory and therapeutic results. J Small Anim
Pract 2000; 41: 295-301
68. Eminaga S., Cherubini G.B., Villiers E. et al. STIR muscle hyperintensity in the
cervical muscles associated with inflammatory spinal cord disease of unknown origin. J
Small Anim Pract 2013; 54: 137-42.
69. Mulkern R.V. (2009) Fast imaging principles. In: Magnetic Resonance Imaging of the
Brain and Spine. Ed. S. W. Atlas. 4th edn. Wolters Kluver/Lippincott Williams & Wilkins,.
pp. 94-150.
70. Thomas, W.B. Hydrocaphalus in dogs and cats. Vet Clin N Am Small Anim
Pract 2010; 40: 143-159.
71. Gonzalo-Orden J.M., Altonoga J.R., Orden M.A. Magnetic resonance, computed
tomographic and radiologic findings in a dog with discospondylitis. Vet Radiol Ultrasound
2000; 41: 142-144.
72. Carrera L., Sullivan M., McConnell F. et al. Magnetic resonance imaging features of
discospondylitis in dogs. Vet Radiol Ultrasound 2011; 52: 125-131.
�51

CHAPTER 1�
73. Shimizi J., Yamada K., Mochida K. et al. Comparison of the diagnosis of intervertebral
disc herniations in dogs by CT before and after contrast enhancement of the subarachnoid
space. Vet Rec 2009; 165: 200-202.
74. Bibevski J.D., Daye R.M., Henrickson T.D. A prospective evaluation of CT in acutely
paraparetic chondrodystrophic dogs. J Am Anim Hosp Assoc 2013; 49: 363-369.
75. Cooper J.J., Young B.B., Griffin J.F. at al. Comparison between non contrast computed
tomography and magnetic resonance imaging for detection and characterization of
thoracolumbar myelopathy caused by intervertebral disk herniation in dogs. Vet Radiol
Ultrasound 2014; 55: 182-189.
76. Israel S.K., LevineJ.M., Kerwin S.C. et al. The relative sensitivity of computed
tomography and myelography for identification of thoracolumbar intervertebral disk
herniations in dogs. Vet Radiol Ultrasound 2009; 50: 246-252.
77. Manunta M.L., Evangelisti M.A., Bergknut N.et al. Hydrated nucleus pulposus
herniation in seven dogs. Vet J 2015; 203: 342-344.
78. De Risio L., Adams V., Dennia R. et al. Association of clinical and magnetic resonance
imaging findings with outcome in dogs with presumptive acute noncompressive nucleus
pulposus extrusion: 42 cases (2000–2007). J Am Vet Med Assoc 2009; 234: 495–504.
79. Fenn J., Dress R., Volk H.A. et al. Inter- and intraobserver agreement for diagnosing
presumptive ishemic myelopathy and acute noncompressive nucleus pulposus extrusion in
dogs using magnetic resonance imaging. Vet Radiol & Ultrasound, Epub 2015 Aug 25
80. Suwangkon N., Meij B.P., Voorhout G. et al. Review and retrospective analysis of
degenerative lumbosacral stenosis in 156 dogs treated by dorsal laminectomy. Vet Comp
Ortho Trauma 2008; 21: 285–293.
81. De Decker S., Wawrzenski, L.A. & Volk H.A. Clinical signs and outcome of dogs
treated medically for degenerative lumbosacral stenosis: 98 cases (2004–2012). J Am Vet
Med Assoc 2014; 245: 408-413.
�52
CHAPTER 1�
82. Ramirez O. 3rd, Thrall D.E. A review of imaging techniques for canine cauda equina
syndrome. Vet Radiol Ultrasound 1998; 39: 283–296.
83. Wood B.C., Lanz O.I., Jones J.C. et al. Endoscopic-assisted lumbosacral foraminotomy
in the dog. Vet Surg 2004; 33: 221–231.
84. Suwankong N., Voorhout G., Hazewinkel H.A. et al. Agreement between computed
tomography, magnetic resonance imaging, and surgical findings in dogs with degenerative
lumbosacral stenosis. J Am Vet Med Assoc 2006; 229: 1924-1929.
85. Sande R.D. Radiography, myelography, computed tomography, and magnetic resonance
imaging of the spine. Vet Clin N Am-Small 2011; 22: 811–831.
86. Jones J.C., Inzana K.D. Subclinical CT abnormalities in the lumbosacral spine of older
large breed dogs. Vet Radiol Ultrasound 2000; 41: 19–26.
87. Kranenburg H.C., Voorhout G., Grinwis G.C. Diffuse idiopathic skeletal hyperostosis
(DISH) and spondylosis deformans in purebred dogs: a retrospective radiographic study.
Vet J 2011; 190: 84-90.
88. Togni A., Hanenburg H.J., Morgan J.P. et al. Radiographic and MRI characteristics of
lumbar disseminated idiopathic spinal hyperostosis and spondylosis deformans in dogs. J
Small Anim Pract 2014; 55: 343-349.
89. Hasegawa D., Tamura S., Nakamoto Y. et al. Magnetic resonance findings of the corpus
callosum in canine and feline lysosomal storage diseases. Vet J 2010; 186: 166-171.
90. Pugliese M., Carrasco J.L., Gomez- Anson B. et al. Magnetic resonance imaging of
cerebral involutional changes in dogs as markers of aging: an innovative tool adapted from
a human visual rating scale. Vet J 2013; 186: 166-171.
91. Hasegawa D., Tamura S., Nakamoto, Y. et al. Magnetic resonance findings of the corpus
callosum in canine and feline lysosomal storage diseases. Vet J 2005; 186: 166-171.
92. Jones T.R., Kaplan R.T., Lane B. et al. Single- versus multi-detector row CT of the
brain: quality assessment. Radiol 2001; 219; 750–755.
�53

CHAPTER 1�
93. Enzmann D., Britt R., Lyons B. et al. Natural history of experimental intracerebral
hemorrhage: sonography, computed tomography and neuropathology. Am J Neurorad 1981;
2: 517–526.
94. Le T.H., Gean A.D. Neuroimaging of traumatic brain injury. Mt Sinai J Med 2009; 76:
145-162.
95. TBI working group. Clinical practice guideline for management of concussion/mild
traumatic brain injury. J Rehabil Res Dev 2009; 46: 1–68.
96. Beltran E., Platt S.R., McConnell J.F. et al. Prognostic value of early magnetic
resonance imaging in dogs after traumatic brain injury: 50 cases. J Vet Int Med 2014; 28:
1256-1262.
97. Vitale C. & Coates J. Acute spinal cord injury. Standards of Care: Emergency and
critical care medicine 2007; 9: 1–11.
98. Da Costa R.C., Samii V.F. Advanced imaging of the spine in small animals. Vet Clin N
Am-Small 2010; 40: 765–790.
99. Kinns J., Mai W., Seiler G. et al. Radiographic sensitivity and negative predictive value
for acute canine spinal trauma. Vet Radiol Ultrasound 2006; 47: 563-570.
100. Levine G., Levine, J., Budke C. et al. Description and repeatability of a newly
developed spinal cord injury scale for dogs. Prevent Vet Med 2009; 89: 121–127.
101. Johnson P., Beltran E., Dennis R. et al. Magnetic resonance imaging characteristics of
suspected vertebral instability associated with fracture or subluxation in eleven dogs. Vet
Radiol & Ultrasound 2012; 53, 552–559.
102. Hettlich B.F., Fosgate G.T., Levine J.M. et al. (2010) Accuracy of conventional
radiography and computed tomography in predicting implant position in relation to the
vertebral canal in dogs. Vet Surg 2010; 39: 680-687.
103. Vallefuoco R., Bedu, A.S., Manaserro M. et al. Computed tomographic study of the
optimal safe implantation corridors in feline thoracolumbar vertebrae. Vet Comp Orthop
Traumato 2013; 26: 372-378.
�54
CHAPTER 1�
104. Couturier L., Degueurce C., Ruel Y. et al. Anatomical study of cranial nerve
emergence and skull foramina in the dog using magnetic resonance imaging and computed
tomography. Vet Radiol Ultrasound 2005; 47: 375–383.
105. Gomes E., Degueurce C., Ruel Y. et al. Anatomic study of cranial nerve emergence
and associated skull foramina in cats using CT and MRI. Vet Radiol Ultrasound 2009; 50:
398–403.
106. Smith P.M., Goncalves R., Mc Connell J.F. Sensitivity and specificity of MRI for
detecting facial nerve abnormalities in dogs with facial neuropathy. Vet Rec 2012; 171: 349.
107. Forterre F., Gutmannsbauer B., Schmall W. et al. CT myelography for diagnosis of
brachial plexus avulsion in small animals. Tierarztl Praxis K H 1988; 26: 322–329.
108. Carvalho G.A., Nikkhah G., Matthies C. et al. Diagnosis of root avulsions in traumatic
brachial plexus injuries: value of computerized tomography myelography and magnetic
resonance imaging. J Neurosurg 1997; 86: 69–76.
109. Munoz A., Mateo I., Lorenzo V. et al. Imaging diagnosis: traumatic dural tear
diagnosed using intrathecal gadopentate dimeglumine. Vet Radiol Ultrasound 2009; 50:
502–505.
110. Rudich S.R., Feeney D.A., Anderson K.L. et al. Computed tomography of masses of
the brachial plexus and contributing nerve roots in dogs. Vet Radiol Ultrasound 2004; 45:
46–50.
111. Kraft S., Ehrhart E.J., Gall D. et al. Magnetic resonance imaging characteristics of
peripheral nerve sheath tumors of the canine brachial plexus in 18 dogs. Vet Radiol
Ultrasound 2007; 48: 1–7.
112. Van Es H.W. MRI of the brachial plexus. Eur Radiol 2001; 11: 325– 336.
113. De Risio L. Chapter 10. In: De Risio L, Platt S, editors. Canine and feline epilepsy.
Diagnosis and Management. 2014. p. 304–307.
114. Rusbridge C, Long S, Jovanovik J, et al. International Veterinary Epilepsy Task Force
recommendations for a veterinary epilepsy-specific MRI protocol. BMC Veterinary
Research. 2015;11: 194.
�55

CHAPTER 1�
115. Mellema L.M., Koblik P.D., Kortz G.D. et al. Reversible magnetic resonance imaging
abnormalities in dogs following seizures. Vet Radiol Ultrasound 1999; 40: 588–595.
116. Kuzniecky RI. Neuroimaging of Epilepsy: Therapeutic Implications. NeuroRx. 2005;
2: 384-393.
�56

CHAPTER 2�
�57
Scientific aims

CHAPTER 2�
�58
CHAPTER 2�-
-CT and MRI are both cross-sectional imaging techniques used to visualize lesions of the
brain, spinal cord and vertebral structures. In general MRI is considered the modality of
choice because of its better contrast resolution and therefore better evaluation of soft tissue
lesions. CT has its advantages due to the ability to better evaluate the bony structures. In
human medicine comparative studies between both modalities in neurological diseases
have been published. At present, veterinary medicine lacks these kinds of studies.
Because CT is more and more available in veterinary clinics and practices, the general aim
of this of this work was to determine whether CT can be used as an alternative to MRI.
The aim of the first part of this research project was to see if there is an agreement between
low-field MRI and CT in detecting suspected intracranial lesions in dogs and cats.
The aim of the second part was to determine if there was an agreement between low-field
MRI and multislice CT in detecting specific brain and cervical spine abnormalities:
- detection of cerebellar (foramen magnum) herniation in Cavalier King Charles Spaniels,
- detection of cervical syringomyelia in dogs.
-
�59

CHAPTER 2�
�60

CHAPTER 3�
�61
Chapter 3
Agreement between low-field MRI and
CT for the detection of suspected
intracranial lesions in dogs and cats
Adapted from: I.Gielen*, K. Kromhout*, P. Gavin, L. Van Ham, I. Polis, H. van Bree.
Agreement between low-field MRI and CT for the detection of suspected intracranial
lesions in dogs and cats. Journal of the American Veterinary Medical Association 2013;
243:367-375.
* contributed equally to the study

CHAPTER 3�
�62

CHAPTER 3�
Summary
The objective of this study was to determine if there is agreement between CT and MRI for
enabling detection of intracranial lesions in cats and dogs.
The CT and MR images of 51 dogs and 7 cats with suspected intracranial lesions were
evaluated during a 2-year-period. Radiologists evaluated the images without awareness of
subject identity. Agreement between methods was assessed for the ability to detect solitary
or multiple lesions, selected lesions characteristics (via the Cohen k statistic), and lesion
dimensions (via Bland-Altman plots).
CT and MRI had substantial agreement for detection of lesions and whether the lesions
were solitary or multiple. The presence of mass effect and contrast agent enhancement,
which were considered principal diagnostic imaging signs, had almost perfect agreement,
with a lower degree of agreement attained for identifying enhancement patterns and aspects
of lesion margins. Agreement was substantial to almost perfect for lesion visualization in
most anatomic brain regions, but poor for identifying lesion dimensions.
Degrees of agreement between CT and MRI for the detection and characterization of
intracranial lesions ranged from poor to almost perfect, depending on the variable assessed.
More investigation is needed into the relative analytic sensitivity and possible
complementarities of CT and MRI in the detection of suspected intracranial lesions in dogs
and cats.
�63

CHAPTER 3�
Introduction
Computed tomography and MRI are both used in the detection of various intracranial
lesions in humans and other animals. Each method has specific advantages and
disadvantages in lesion characterization, but the method used is not chosen solely on the
basis of a patient’s neurological history, general condition, and suspected lesion type.
Indeed, equipment availability and economic considerations also factor into that choice.
Relative to MRI evaluations, CT examinations are faster and therefore require a shorter
duration of anesthesia, the examinations are less costly, and CT scanners are more readily
available in veterinary practices than MRI equipment.
Magnetic resonance imaging is considered superior to CT for visualizing pathologic
changes in the brain because its analytic sensitivity for identifying soft tissue alterations is
greater.1 It is also the modality of choice for imaging lesions in specific anatomic locations
such as the cerebellopontine angle. Lesions in certain anatomical locations such as the
brainstem and cerebellum commonly fail to be identified when CT is used because of
beam-hardening artifacts associated with the technique.2,3 On the other hand, CT is more
sensitive than MRI for visualizing bony changes such as osteolysis and hyperostosis.4
In humans, comparative studies5-10 have shown that CT and MRI can be used in a
complementary manner in the diagnosis of intracranial lesions. In veterinary medicine, CT
and MRI have been extensively used for the detection of brain lesions.3,11-19 In a study20 in
which CT, MRI, and myelography were evaluated for their usefulness in the diagnosis of
vertebral disc herniation in dogs, MRI was deemed the superior imaging modality.
However, to our knowledge, CT and MRI have not yet been compared for their usefulness
in detecting intracranial lesions. The purpose of the study reported here was to
prospectively evaluate the degree of agreement between CT and MRI for identification and
characterization of lesions in cats and dogs with suspected intracranial pathologic change.
�64

CHAPTER 3�
Materials and methods
Animals⎯Between January 2008 and March 2010, for a predetermined period of 2 weeks
every 2 months, all cats and dogs with suspected intracranial disease that were evaluated
through the Department of Veterinary Medical Imaging and Small Animal Orthopaedics of
the Faculty of Veterinary Medicine, Ghent University were included in the study.
Intermittent 2-week study periods at 2 month intervals were chosen for reasons of
feasibility because continuous inclusion and examination of all cats and dogs evaluated
would have interfered with daily patient care. The use of predefined periods at fixed
intervals was an attempt to minimize selection bias.
After medical histories were obtained and a complete clinical evaluation including
neurologic examination was performed, dogs and cats with a suspected intracranial lesion
underwent MRI of the brain as part of the diagnostic work-up. Those patients evaluated
during the predetermined 2-week inclusion periods also subsequently underwent CT of the
brain on the same day. Owner consent was obtained prior to the examinations.
MRI protocol⎯Dogs and cats were anesthetized and positioned in dorsal recumbency,
with their heads placed in a head or wrist coil for humans. Protocols included T2-weighted
precontrast spin echo imaging in transverse and sagittal planes (repetition time, 3,500 to
6,100 milliseconds; echo time, 120 milliseconds), T1-weighted precontrast transverse and
sagittal and postcontrast transverse spin echo imaging (repetition time, 400 to 800
milliseconds; echo time, 17 milliseconds), and transverse FLAIR imaging (repetition time,
1,000 to 1,150 milliseconds; echo time, 100 milliseconds). Four-millimeter-thick
contiguous slices were chosen (image matrix, 512 X 512). Postcontrast images were
obtained immediately after IV injection of 0.3 mL of contrast mediumb (469.01 mg of
gadopentetate dimeglumine/mL)/kg (0.14 mL/lb). Mean examination time was 90 minutes/
subject.
�65

CHAPTER 3�
CT protocol—Dogs and cats were anesthetized and positioned in dorsal recumbency.
Computed tomographic transverse images in 4-mm-thick slices were obtained by use of a
standard algorithm with a third-generation helical single-slice CT scannerc (image matrix,
512 X 512) before and immediately after IV administration of 2 mL of contrast mediumd
(62.24 g of iopromid)/kg (0.9 mL/lb). Mean examination time was 20 minutes/subject.
Image analysis—Images were reviewed with a DICOM (ie, Digital Imaging and
Communications in Medicine) viewer.e Scans with patient information removed were
evaluated by 2 experienced radiologists (IG and PG). The images were provided as CD-
ROM’s each containing a separate randomized sequence of studies of a particular
diagnostic procedure (CT or MRI). All CT images were reviewed in a brain window
(window width, 80 HU to 150 HU; window level, 40 HU to 75 HU). Adjustments of the
window width and level were made by the radiologists to allow better visualization. The
following parameters were evaluated: presence (vs absence) of an intracranial lesion, lesion
pattern (solitary or multiple), lesion localization (lobe or region), aspect of margins (well or
ill defined), pre- and postcontrast size of the lesion’s mass effect, and presence (vs absence)
and pattern of enhancement (homogeneous, heterogeneous, or ring enhancement).
Statistical analysis—Agreement between CT and MRI in allowing detection of intracranial
lesions and their characteristics was calculated through calculation of the Cohen κ, with the
degree of agreement defined as suggested elsewhere21 (0.81 to 1.00, almost perfect
agreement; 0.61 to 0.80, substantial agreement; 0.41 to 0.60, moderate agreement; 0.21 to
0.40, fair agreement; 0.20 to 0.0, slight agreement; and ≤ 0, no agreement). For k values,
confidence intervals and P values (reflecting the probability that the estimated k was due to
chance) are reported. Lesion dimensions as measured via CT and MRI were compared by
means of Bland-Altman analysis.22 Results are reported as bias and P values as well as
limits of agreement.f
�66

CHAPTER 3�
Results
Animals⎯Seven cats (4 males and 3 females; median age, 107 months [range, 66 to 168
months]) and 51 dogs (38 males and 13 females; median age, 77 months [range, 2 to 170
months]) were included in the study. Dog breeds included Labrador Retriever (n=6),
German Shepherd Dog (5), Maltese (4), American Staffordshire Terrier (4), Staffordshire
Bull Terrier (3), mixed breed (3), and 2 each of English Bulldog, Pug, French Bulldog,
Boxer, and Border Collie as well as 1 each of various other breeds. Cat breeds were
European Shorthair (n=6) and Persian (1). Clinical signs detected or reported by owners at
the initial evaluation varied, the most common of which were seizures, paresis or paralysis,
behavioral change, head tilt, apathy, drowsiness, strabismus, nystagmus, and ataxia.
Imaging⎯One or more intracranial lesions were detected in 38 of 58 cats and dogs either
by CT, MRI, or both. In 30 of these 38 patients, the lesions were seen through both
modalities (Fig. 1). Seven lesions detected by MRI were not detected by CT, and 1 lesion
detected on CT was not visible on MRI images (k = 0.72), reflecting substantial agreement
(Table 1). Three of 7 patients with lesions that were detectable on MRI but not seen on CT
were judged to have infarctions (2-month-old female Maltese evaluated for intention tremor
and right vestibular strabismus, 2.5-year-old male Staffordshire Bull Terrier evaluated for
circling to the right, signs of apathy, head pressing, and decrease in proprioception, and 7-
year-old male Staffordshire Bull Terrier evaluated for seizures), 2 to have oedema (9-year-
old mixed-breed dog with seizures and 2-year-old male Pug with seizures, signs of apathy,
and tetraparesis), and 2 to have diffuse inflammatory lesions (6-year-old male Welsh
Springer Spaniel with signs of apathy and 7-month-old male German Shepherd Dog with
seizures). The 1 patient with a lesion that was detectable via CT but not via MRI was a 4-
year-old male Maltese evaluated for seizures; the lesion seen on CT images was a contrast
agent−enhanced multifocal lesion of suspected inflammatory origin (Fig. 2).
�67

CHAPTER 3�
�68
Fig. 1: Postcontrast transverse T1-weighted MRI (A) and postcontrast CT (B)
images of the head of a dog with suspected intracranial lesions, as obtained at the
level of the temporal lobe. Multiple homogeneously enhanced lesions are visible in
both lateral ventricles (arrows) in both images.
Fig. 2: Transverse T2-weighted MRI (A) and postcontrast CT (B) images of the head
of a dog with suspected intracranial lesions. A) No lesion is visible in the parietal and
temporal lobes; however, the lateral ventricles are asymmetric, with the left ventricle
larger than the right (arrow). B) Multiple small hyperdense lesions (arrows) are
visible in the telencephalon and diencephalon.
CHAPTER 3�
Images for the 30 patients with intracranial lesions visible via both MRI and CT were
compared with respect to general lesion characteristics (Table 1). A mass effect was seen in
27 of these patients with each modality (κ = 1), reflecting perfect agreement between MRI
and CT. Four of 30 patients had multiple lesions and 24 had solitary lesions visible through
both imaging modalities (κ = 0.76), reflecting substantial agreement. However, only 16
lesions were interpreted as well defined and 5 as ill defined through both CT and MRI (κ =
0.37), reflecting fair agreement only.
�69

CHAPTER 3�
Characteristic CT MRI
CT and
MRI κ 95% CI
P
value
Space-occupying
lesion
31 37 30 0.72 0.54–0.9 <
0.001
Mass effect 27 27 27 1 1–1 <
0.001
Solitary (vs multiple)
lesion
26 24 24 0.76 0.45–1.07 <
0.001
Well- (vs ill-) defined
lesion
16 25 16 0.37 0.1–0.64 0.009
�70
Table 1: Number of cats and dogs (n = 58) with suspected intracranial disease in
which space-occupying lesions were detected via CT and MRI and degree of
agreement between imaging modalities for lesion detection and general imaging
characteristics of detected lesions (30).
CI = Confidence interval.
Degrees of agreement were assessed as follows: almost perfect, 0.8 < κ ≤ 1; substantial,
0.6 < κ ≤ 0.8; moderate, 0.4 < κ ≤ 0.6; fair, 0.2 < κ ≤ 0.4; slight, 0.2 < κ < 0, and no ≤ 0.

CHAPTER 3�
Images obtained by CT and MRI were compared with respect to the described anatomic
localization of the intracranial lesions, revealing almost perfect agreement between the
modalities for lesions located in the cerebrum (κ = 0.86) and the occipital lobe (κ = 1) and
substantial agreement for lesions in the frontal lobe (κ = 0.79), parietal lobe (κ = 0.79), and
cerebellum (κ = 0.67), and the intraventricular region (κ = 0.67; Table 2). The degree of
agreement was moderate for lesions in the temporal lobe (κ = 0.53), fair for lesions in the
brainstem (κ = 0.38) (Fig. 3), and slight for lesions in the piriform region (κ = 0) (Fig. 4).
�71
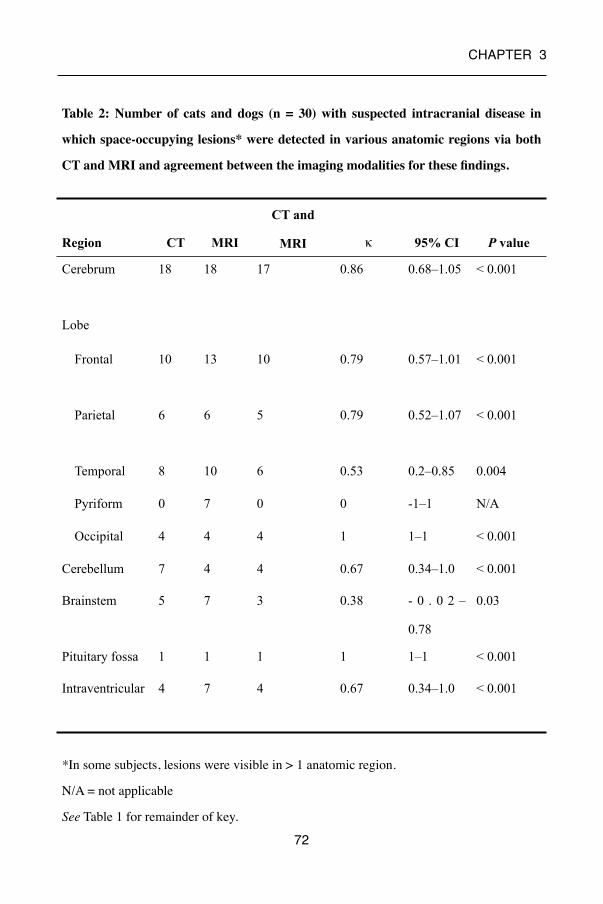
CHAPTER 3�
Region CT MRI
CT and
MRI κ 95% CI P value
Cerebrum 18 18 17 0.86 0.68–1.05 < 0.001
Lobe
Frontal 10 13 10 0.79 0.57–1.01 < 0.001
Parietal 6 6 5 0.79 0.52–1.07 < 0.001
Temporal 8 10 6 0.53 0.2–0.85 0.004
Pyriform 0 7 0 0 -1–1 N/A
Occipital 4 4 4 1 1–1 < 0.001
Cerebellum 7 4 4 0.67 0.34–1.0 < 0.001
Brainstem 5 7 3 0.38 - 0 . 0 2 –
0.78
0.03
Pituitary fossa 1 1 1 1 1–1 < 0.001
Intraventricular 4 7 4 0.67 0.34–1.0 < 0.001
�72
Table 2: Number of cats and dogs (n = 30) with suspected intracranial disease in
which space-occupying lesions* were detected in various anatomic regions via both
CT and MRI and agreement between the imaging modalities for these findings.
*In some subjects, lesions were visible in > 1 anatomic region.
N/A = not applicable
See Table 1 for remainder of key.

CHAPTER 3�
�73
Fig. 3: Transverse T2-weighted MRI (A and B) and postcontrast CT (C and D) images of
the head of a dog with suspected intracranial lesions. A) A hyperintense, diffuse, ill-
defined intra-axial lesion is visible in the right thalamus (diencephalon; arrow). B) A
hyperintense, diffuse, ill-defined intra-axial lesion is visible in the brainstem
(mesencephalon; arrow). C) A hypodense intra-axial lesion (white arrow) is visible in the
right thalamus. Asymmetry of the lateral ventricles is documented, the left ventricle
being larger in size (black arrow). D) No lesion is visible at the level of the brainstem.

CHAPTER 3�
Analysis of the images obtained after contrast medium administration showed the presence
of enhancement via CT or MRI in 19 patients (Table 3). Within this group, contrast agent
enhancement was seen on both imaging modalities in 17 patients (κ = 0.86), reflecting
almost perfect agreement. However, agreement between CT and MRI was less for the
pattern of contrast agent enhancement: homogeneous, κ = 0.49; heterogeneous, κ = 0.17;
ring, κ = 1; and patchy, κ = 0.
�74
Fig. 4: Precontrast transverse T2-weighted MRI (A) and CT (B) images of the head
of a dog with suspected intracranial lesions, as obtained at the level of the piriform
lobe. A) A diffuse intra-axial hyperintensity (arrow) is visible in the right piriform
lobe. B) No lesion is visible.

CHAPTER 3�
�75
Characteristic CT MRI CT and
MRI
κ 95% CI P value
Enhancement (vs
no enhancement)
17 19 17 0.86 0.68 to 1.05 < 0.001
Homogeneous
appearance
8 8 5 0.49 0.14 to 0.84 0.007
Heterogeneous
appearance
5 7 2 0.17 0.22 to 0.57 0.33
Ring-shaped
appearance
3 3 3 1 1 to 1 < 0.001
Patchy appearance 1 0 0 0 −1 to 1 N/A
Table 3—Number of cats and dogs (n = 30) with suspected intracranial disease in
which space-occupying lesions* were detected via both CT and MRI by presence
and pattern of contrast agent enhancement and agreement between the imaging
modalities for these findings.
See Table 1 and 2 for key.

CHAPTER 3�
Finally, the CT and MRI image records were compared with respect to the dimensions of
the detected lesions (Table 4; Fig. 5). The width and height of lesions recorded on
precontrast CT images were compared with those on precontrast T1 and T2 MRI images;
the lesion dimensions obtained on postcontrast CT images were compared with those on
postcontrast T1 images. Patients with a variable number of lesions on CT and MRI and
patients with lesions that could not be measured because of diffuse characteristics on either
of set of images were excluded from this analysis. Bland-Altman plots showed that the bias
was significantly different from zero for comparisons of lesion width (P = 0.03) and length
(P = 0.02) on precontrast CT and precontrast T1 MRI images but not for the other
comparisons. The limits of agreement for all measurements revealed that the range of the
differences in dimensions between CT and MRI images was close to or > 2 cm.
�76

CHAPTER 3�
Characteristic Number
evaluated
Technique Value Technique Value
Width 17 Precontrast CT 1.64 ± 0.91 Precontrast
T1-weighted MRI
1.29 ± 0.53
18 Precontrast CT 1.59 ± 0.91 T2-weighted MRI 1.45 ± 0.74
20 Postcontrast CT 1.61 ± 0.90 Postcontrast
T1-weighted MRI
1.42 ± 0.62
10 Postcontrast
+ oedema
CT
1.72 ± 0.62 Postcontrast
T1-weighted MRI
1.35 ± 0.44
Height 17 Precontrast CT 1.95 ± 1.00 Precontrast
T1-weighted MRI
1.58 ± 0.68
18 Precontrast CT 1.93 ± 0.97 T2-weighted MRI 1.93 ± 1.10
20 Postcontrast CT 1.96 ± 1.02 Postcontrast
T1-weighted MRI
1.68 ± 0.72
10 Postcontrast + oedema
CT
2.11 ± 0.74 Postcontrast
T1-weighted MRI
1.53 ± 0.46
�77
Table 4—Comparisons of mean ± SD widths and heights (cm) of intracranial lesions
in images obtained via CT and MRI for the dogs and cats in Tables 2 and 3.
Excluded from analysis were cats and dogs with a variable number of lesions visible via
CT and MRI and lesions that could not be measured because of diffuse characteristics on
images obtained through either imaging modality.

CHAPTER 3�
�78
Fig. 5: Bland-Altman plots showing the agreement between CT and MRI
for measurement of the width (A, C, and E) and height (B, D, and F) of
intracranial lesions in dogs and cats. Analyses were performed for lesions
measured on precontrast CT versus T1 images (panels A and B; n = 17),
precontrast CT versus T2 images (panels C and D; 18), and postcontrast
CT versus T1 images (panels E and F; 20). Solid lines represent bias (with
values of P indicated), and dashed lines represent the limits of agreement.
CHAPTER 3�
Discussion
The present study was conducted to identify for the first time the degree of agreement
between CT and low-field MRI in allowing visualization of intracranial lesions and their
principal characteristics. The results indicated that agreement between the 2 imaging
modalities was substantial for identifying the presence of a lesion and whether solitary or
multiple lesions were involved. The modalities were in almost perfect agreement for
detecting the presence of a mass effect and contrast enhancement. With the exception of the
temporal and piriform lobes and the brainstem, substantial to almost perfect agreement was
also achieved for the location of the detected lesion. Lower degrees of agreement were
achieved for description of the lesion margins and for pattern of contrast agent
enhancement, whereas poor agreement was observed for measurement of lesion dimensions
via both pre- and postcontrast CT and MRI techniques.
Similar to in human radiology, the radiologic characteristics of an intracranial lesion in
veterinary species provide important information on the possible nature of the lesion3,11 and
may be used to direct the diagnostic process. Lesion anatomic location, pattern, aspect of
the margins, mass effect, and contrast agent uptake, however, may be differently interpreted
when CT is used instead of MRI or vice versa. Although the definitive diagnosis of any
intracranial lesion is obtained by histopathologic examination, the specific aim of our study
was to evaluate the agreement between CT and MRI for visualization of intracranial
lesions, irrespective of the eventual diagnosis.
Whereas substantial agreement was found between the 2 modalities CT and MRI for the
initial visualization of intracranial lesions, 7 lesions, which were detected via MRI as
suspected infarctions, oedema, or diffuse inflammatory lesions, were undetectable via CT.
Conversely, a suspected inflammatory lesion was detected via CT but not via MRI.
�79

CHAPTER 3�
These discrepancies may be clinically relevant and suggest that MRI is more useful or
reliable for detecting lesions than CT. Although a definitive diagnosis was not obtained so
the accuracy of lesion detection with either modality could not be assessed, the apparent
higher detection rate of MRI relative to CT may be attributed to the technical characteristics
of MRI. First, MRI is more sensitive than CT for detection of increasing amounts of water.
23 Second, MRI provides excellent soft tissue contrast.1 Third, MRI produces images that
are formed by using different sequences; FLAIR, for example, nullifies the signal of CSF,
allowing an interpreter to differentiate CSF from oedema. For these reasons, MRI has been
regarded as superior to CT for detection of ischemic stroke.24–26 Similarly, oedema, which
can develop in neoplastic or inflammatory and infectious diseases, can be more clearly
identified via MRI. Oedema appears as hyperintense on T2- and FLAIR-weighted MRI
sequences and hypointense on T1-weighted MRI sequences, whereas on CT images, it
appears as a hypodense region within the healthy brain parenchyma.3 Lastly, the higher
sensitivity of MRI versus CT for detection of subtle lesions27 may explain why 2 diffuse
inflammatory lesions were not identified via CT in the present study. The inflammatory
nature of these 2 lesions was confirmed after cerebral fluid analysis. On CT images, diffuse
lesions result in signal attenuation that is similar to surrounding tissue and little or no
enhancement following contrast agent infusion.2
The ability of MRI to yield images with better contrast resolution than CT28 may explain
the finding that 2 lesions identified as solitary via CT appeared as multiple via MRI.
Whether an intracranial lesion is identified as solitary or multiple can influence the
differential diagnostic process. Most intracranial tumors appear as solitary lesions and most
inflammatory and infectious diseases as multifocal lesions, although the reverse situations
may occur.17,29,30 In particular, the 2 patients with discordant CT and MRI findings were
suspected to have neoplastic disease. Despite this discordance, however, agreement
between CT and MRI was substantial with respect to identification of the lesion pattern.
�80

CHAPTER 3�
Interestingly, the single lesion that was detected via CT but not via MRI was a contrast
agent enhanced multifocal lesion, and cerebral fluid analysis supported the diagnosis of
encephalitis in the affected patient. The reason this lesion was undetectable via pre- and
postcontrast MRI images is unclear, but the interval between contrast agent injection and
image acquisition may have been too short.
Once a lesion is detected, further radiologic characterization aids in the differential
diagnosis process. Results of the present study indicated various degrees of agreement for
lesion characteristics. The presence of a mass effect is important because it indicates that
healthy brain structures are being displaced, with potential functional consequences. In this
respect, CT and MRI showed perfect agreement. As for contrast agent enhancement, 17 of
19 lesions for which enhancement was identified via MRI also had evidence of
enhancement via CT, whereas all contrast agent−enhanced lesions identified via CT were
similarly identified via MRI. Because of the presence of fenestrated capillaries, contrast
agent enhancement is considered physiologic in the meninges, choroid plexus, and pituitary
gland. However, in any other area of the brain, such enhancement is considered
pathological and results from excess vascularization or disruption of the blood-brain barrier.
This basic principle of contrast agent uptake by tissue is the same for iodinated and Gd-
DTPA contrast media and might explain the almost perfect agreement between CT and MRI
for detecting the presence of contrast agent enhancement.
However, the pattern of enhancement differed to a greater extent between the 2 imaging
modalities. Reportedly, most lesions produce a typical enhancement intensity and pattern on
CT and MRI.3,13,15,17–19 Perfect agreement was found for ring enhancement, which was
identified in 3 patients. In contrast, CT and MRI had only moderate to slight agreement for
other types of enhancement. The disagreement in enhancement parameters may have
resulted from the difference between CT and MRI in the kinetics of the visualization of
contrast agent enhancement. Whereas CT contrast media absorb x-ray photons and are
�81

CHAPTER 3�
directly visualized when the media accumulate in tissue, MRI contrast media function
indirectly by altering the local magnetic environment.31,32 In this respect, the timing of
image acquisition is critical to visualize enhancement. Whereas MRI images are typically
obtained 10 to 12 minutes after contrast medium injection,31,32 CT images may already
show evidence of enhancement during the IV medium infusion process.33 On the other
hand, gadolinium produces an amplification effect because a large number of water protons
are relaxed by a single gadolinium atom. As a consequence, with respect to the magnitude
of contrast agent response, MRI is more sensitive to the effect of gadolinium than CT is to
the effect of iodine.34 Reportedly, various technical elements may play a role in the analytic
sensitivity of post-gadolinium MRI scans for visualizing intracranial inflammatory lesions
in dogs, including the type and dose of contrast medium, timing of image acquisition, and
use of magnetization transfer.35
Only fair agreement between imaging modalities was found for interpretation of the aspect
of the margin lesion. Of 25 lesions identified as well-defined lesions via MRI, only 16 were
identified as well-defined on CT. Of 14 lesions identified as ill-defined via CT, only 5 were
identified as ill-defined via MRI. These findings suggest that MRI is better for
characterizing lesion margins as well-defined than is CT, possibly because of the inherent
ability of MRI technology to provide greater soft tissue detail.1
The Bland-Altman plot analyses of lesion dimensions indicated that CT and MRI findings
did not agree well. The bias for width and length on precontrast CT and precontrast T1-
weighted images was significantly different from zero, indicating that one of the methods
consistently led to determination of larger or smaller lesion dimensions than the other
method. For the other comparisons (ie, the precontrast CT vs T2 images and postcontrast
CT vs postcontrast T1-weighted images), the bias did not differ significantly from zero.
�82
CHAPTER 3�
More importantly, however, for all comparisons, the limits of agreement suggested that the
95% range of the differences between CT and MRI was close to or > 2 cm. Clinically, when
an intracranial lesion is present, this would be a relevant difference, and the limits of
agreement thereby indicated that overall results of CT and MRI do not agree well for
determination of lesion dimensions. For most comparisons, the lesion dimensions were on
average larger on CT images than on MRI images. Although actual lesion dimensions were
not verified on the basis of histologic assessment, the observed difference in lesion
dimensions may have been attributable to the technical properties of the imaging
techniques. As mentioned previously, MRI provides greater soft tissue detail,1 which may
allow for an improved delineation of lesions relative to CT. A poor ability to detect lesion
margins on CT images may thus lead to overestimation of the lesion size. In addition, CT
artifacts such as partial volume averaging and blooming artifacts may also cause blurring
and misinterpretation of lesion margins.36 Contrast agent is routinely used to improve
delineation of lesions and their margins.37 However, our findings suggested that use of
contrast agent did not lead to improved agreement between CT and MRI images. The
presence of perilesional oedema may have clinical implications; however, the comparison
of intrinsic lesion dimension including perilesional oedema via postcontrast CT and T1-
weighted MRI showed equally poor agreement (data not shown).
Substantial to almost-perfect agreement between CT and MRI was found for lesion
localization, except for lesions located in the temporal and piriform lobes and the
brainstem. Magnetic resonance imaging characteristically provides multiplanar images in
sagittal, dorsal, and transverse planes and is suggested to be the optimal imaging modality
for visualization of the anatomic characteristics and location of lesions.38 For example,
sagittal MRI scans provide a clear view of the delineation of intracranial structures with a
rostrocaudal orientation, such as the corpus callosum, brainstem, and cerebellar vermis.39
�83

CHAPTER 3�
Likewise, multiplanar MRI scans of the head provide a clear view of the ventricular system.
38 In contrast, CT imaging software allows for the reconstruction of 3-D images from 2-D
CT images, thereby also creating multiplanar views. Although such reconstructed views
may not yield images with the same resolution as the primary obtained image, they
facilitate the detection of lesions and their location. However, localization of brain lesions
through use of CT may be hindered by beam-hardening artifacts, whereby high-density
structures, such as the thick petrous temporal bone, prevent the CT scanner from detecting
x-rays.2 That beam hardening may obscure the ability to visualize structures in the piriform,
parietal, brainstem, and cerebellar regions. The balance between these MRI- and CT-
specific factors may explain the disagreement between CT and MRI in lesion localization.
The present study had some limitations. First, it was a descriptive study of the agreement
between 2 imaging modalities, and because it did not take the final diagnosis into account,
no conclusions could be made as to the accuracy of either technique. Second, although the
Cohen κ and Bland-Altman analyses were appropriate techniques for this type of study, the
interpretation of the degree of agreement was based on guidelines rather than on clinical
relevance. Third, a limited number of study subjects (particular cats) were used. In selected
analyses (lesion anatomic location and enhancement pattern), sample sizes were low, and κ
values should be interpreted with caution. However, for most variables assessed, confidence
intervals were acceptable, and for all but 1 variable, the P value for κ was significant. Last,
we performed 4-mm collimation CT scans, the resolution of which may be considered
inferior to the thinner collimation used in other clinical protocols. This CT collimation was
chosen to correspond to the 4-mm collimation provided by low-field MRI. We recognized
that the use of thinner collimation would have allowed for superior in-plane resolution as
well as direct comparison of sagittal plane–reformatted CT images with sagittal MR
images.
�84

CHAPTER 3�
Given the aforementioned limitations, we draw the following conclusions regarding the
clinical relevance of the study findings. In view of the clinical importance of intracranial
disease, the degree of disagreement between CT and MRI for detection of intracranial
lesions (whether solitary or multiple) should be regarded as clinically relevant, even though
κ values indicated substantial agreement. Once a lesion is detected on CT, MRI may be
considered concordant for the most diagnostically important imaging characteristics (i.e.
mass effect and contrast agent enhancement). The lesion dimensions may direct treatment,
and the poor agreement between CT and MRI may thus be clinically
relevant. Poorer agreement was also found for lesion margins and pattern of contrast agent
enhancement. Lastly, although substantial agreement between modalities was achieved for
the localization of lesions to specific anatomic brain for most regions, the degree of
agreement was highly variable, and this could influence diagnosis.
�85
CHAPTER 3�
References
1. Berquist TH, Ehman RL, King BF, et al. Value of MR imaging in differentiating benign
from malignant soft-tissue masses: study of 95 lesions. AJR Am J Roentgenol 1990;
155: 1251–1255.
2. LeCouteur RA. Current concepts in the diagnosis and treatment of brain tumours in
dogs and cats. J Small Anim Pract 1999;40:411–416.
3. Kraft SL, Gavin PR. Intracranial neoplasia. Clin Tech Small Anim Pract 1999; 14: 112–
123.
4. Tokgoz N, Oner YA, Kaymaz M, et al. Primary intraosseous meningioma: CT and MRI
appearance. AJNR Am J Neuroradiol 2005; 26: 2053–2056.
5. Brant-Zawadzki M, Badami JP, Mills CM, et al. Primary intracranial tumor imaging: a
comparison of magnetic resonance and CT. Radiology 1984; 150: 435–440.
6. Bradley WG, Waluch V, Yadley RA, et al. Comparison of CT and MR in 400 patients
with suspected disease of the brain and cervical spinal cord. Radiology 1984; 152:
695–702.
7. Carter RMS, Pretorius PM. The use of CT and MRI in the characterization of
intracranial mass lesions. Imaging 2007; 19: 173–184.
8. Chang KH, Han MC, Kim CW. Magnetic resonance imaging in neurological diseases
—comparison with computed tomography. J Korean Med Sci 1987; 2: 53–63.
9. Go JL, Zee CS. Unique CT imaging advantages. Hemorrhage and calcification.
Neuroimaging Clin N Am 1998; 8: 541–558.
10. Haughton VM, Rimm AA, Sobocinski KA, et al. A blinded clinical comparison of MR
imaging and CT in neuroradiology. Radiology 1986; 160: 751–755.
11. Troxel MT, Vite CH, Massicotte C, et al. Magnetic resonance imaging features of
feline intracranial neoplasia: retrospective analysis of 46 cats. J Vet Intern Med 2004;
18: 176–189.
�86

CHAPTER 3�
12. Gandini G, Gentilini F, Cimatti L, et al. Evaluation of the clinical signs and computed
tomographic findings in 27 dogs with intracranial space-occupying lesions (1999–
2000). Vet Res Commun 2003; 27: 399–401.
13. Kraft SL, Gavin PR, DeHaan C, et al. Retrospective review of 50 canine intracranial
tumors evaluated by magnetic resonance imaging. J Vet Intern Med 1997; 11: 218–225.
14. Sturges BK, Dickinson PJ, Bollen A, et al. Magnetic resonance imaging and
histological classification of intracranial meningiomas in 112 dogs. J Vet Intern Med
2008; 22: 586–595.
15. Thomas WB. Nonneoplastic disorders of the brain. Clin Tech Small Anim Pract 1999;
14: 125–147.
16. Tidwell AS, Jones JC. Advanced imaging concepts: a pictorial glossary of CT and MRI
technology. Clin Tech Small Anim Pract 1999; 14: 65–111.
17. Schwartz M, Lamb CR, Brodbelt DC, et al. Canine intracranial neoplasia: clinical risk
factors for development of epileptic seizures. J Small Anim Pract 2011; 52: 632–637.
18. Freeman AC, Platt SR, Kent M, et al. What is the evidence? Diagnosis of an
intracranial lesion as a meningioma on the basis of MRI characteristics. J Am Vet Med
Assoc 2011; 239: 60–62.
19. Wisner ER, Dickinson PJ, Higgins RJ. Magnetic resonance imaging features of canine
intracranial neoplasia. Vet Radiol Ultrasound 2011; 52(suppl 1): S52–S61.
20. Robertson I, Thrall DE. Imaging dogs with suspected disc herniation: pros and cons of
myelography, computed tomography, and magnetic resonance imaging. Vet Radiol
Ultrasound 2011; 52(suppl 1): S81–S84.
21. Landis JR, Koch GG. The measurement of observer agreement for categorical data.
Biometrics 1977; 33: 159–174.
22. Bland JM, Altman DG. Applying the right statistics: analyses of measurement studies.
Ultrasound Obstet Gynecol 2003; 22: 85–93.
�87

CHAPTER 3�
23. Imhof H, Rand T, Trattnig S, et al. Basics of MRI technique and MRI image
interpretation [in German]. Orthopade 1994; 23: 300–305.
24. Wessmann A, Chandler K, Garosi L. Ischaemic and haemorrhagic stroke in the dog. Vet
J 2009; 180: 290–303.
25. Garosi L, McConnell JF, Platt SR, et al. Clinical and topographic magnetic resonance
characteristics of suspected brain infarctation in 40 dogs. J Vet Intern Med 2006; 20:
311–321.
26. Tidwell AS, Robertson ID. Magnetic resonance imaging of normal and abnormal brain
perfusion. Vet Radiol Ultrasound 2011; 52(suppl 1): S62–S71.
27. Cherubini GB, Platt SR, Howson S, et al. Comparison of magnetic resonance imaging
sequences in dogs with multi-focal intracranial disease. J Small Anim Pract 2008; 49:
634–640.
28. da Costa RC, Samii VF. Advanced imaging of the spine in small animals. Vet Clin
North Am Small Anim Pract 2010; 40: 765–790.
29. Cherubini GB, Mantis P, Martinez TA, et al. Utility of magnetic resonance imaging for
distinguishing neoplastic from non-neoplastic brain lesions in dogs and cats. Vet Radiol
Ultrasound 2005; 46: 384–387.
30. Koch MW, Sánchez MD, Long S. Multifocal oligodendroglioma in three dogs. J Am
Anim Hosp Assoc 2011; 47: e77–e85.
31. Kuriashkin IV, Losonsky JM. Contrast enhancement in magnetic resonance imaging
using intravenous contrast media: a review. Vet Radiol Ultrasound 2000; 41: 4–7.
32. Joslyn S, Sullivan M, Novellas R, et al. Effect of delayed acquisition times on
gadolinium-enhanced magnetic resonance imaging of the presumably normal canine
brain. Vet Radiol Ultrasound 2011; 52: 611–618.
33. Fike JR, Cann CE, Turowski K, et al. Differentation of neoplastic from non-neoplastic
lesions in dog brain using quantitative CT. Vet Radiol 1986; 27: 121–128.
�88

CHAPTER 3�
34. Gandhi SN, Brown MA, Wong JG, et al. MR contrast agents for liver imaging: what,
when, how. Radiographics 2006; 26: 1621–1636.
35. Lamb CR, Croson PJ, Cappello R, et al. Magnetic resonance imaging findings in 25
dogs with inflammatory cerebrospinal fluid. Vet Radiol Ultrasound 2005; 46: 17–22.
36. Taeymans O, Schwarz T, Duchateau L, et al. Computer tomographic features of the
normal canine thyroid gland. Vet Radiol Ultrasound 2008; 49: 13–19.
37. Mihara F, Hirakata R, Hasuo K, et al. Gd-DTPA administered MR imaging of
intracranial mass lesions: a comparison with CT and precontrast MR. Radiat Med
1989; 7: 227–235.
�89

CHAPTER 3�
�90

CHAPTER 4�
�91
Chapter 4
Low-field MRI and multislice CT for the
detection of cerebellar (foramen
magnum) herniation in Cavalier King
Charles Spaniels
Adapted from: K. Kromhout*, H. van Bree, B.J.G. Broeckx, S. Bhatti, L. Van Ham, I.
Gielen Low-field MRI and multislice CT for the detection of cerebellar (foramen
magnum) herniation in Cavalier King Charles Spaniels. Journal of Veterinary Internal
Medicine 2015; 29:238-241.

CHAPTER 4�
�92

CHAPTER 4�
Summary
Cavalier King Charles Spaniels (CKCS) have a high prevalence of Chiari-like
malformation (CM). Herniation of the cerebellum into the foramen magnum is a key
diagnostic feature for CM. Midsagittal MR images are the preferred technique for
visualizing cerebellar herniation (CH).
The aim of this study was to investigate whether CT can be used to diagnose CH.
CT and MRI images of 15 client-owned CKCS dogs referred for investigation of the brain
and cranial cervical spine on MRI and CT were retrospectively analyzed.
Two reviewers analyzed midsagittal T1WSE and T2WSE MR images and midsagittal pre-
and postcontrast 2D multiplanar reformatted CT images from each dog for the presence of
CH. And, if present, the length (mm, CHL) of the herniation was measured. The results
were analyzed statistically.
There was no significant difference between the different observers and techniques for the
detection of CH and measurement of CHL. Overall, the CHL had a tendency to be longer
(but not significantly so) on the CT images.
Both techniques are useful for detecting CH and measuring CHL. Because CHL does not
have a known direct impact on the clinical presentation of CM, CT can be used as a
diagnostic tool in a routine clinical practice for CM in CKCS when MRI is not available.
We emphasize that MRI is the standard screening technique in CKCS for breeding purposes
to detect the presence of CM and SM and, at the current time, CT cannot replace MRI.
�93

CHAPTER 4�
Introduction
Cavalier King Charles Spaniels (CKCS) have a high prevalence of Chiari-like
malformation (CM). CM is characterized by a disproportion in the volume of the
cerebellum and medulla oblongata compared to that of the caudal fossa.1,2,3,4 These
abnormalities are associated with displacement or caudal herniation of part of the
cerebellum and brainstem into or through the foramen magnum. 5 Other abnormalities
reported in these patients include occipital bone hypoplasia/dysplasia or a shallow caudal
cranial fossa1, kinking of the medulla and malformations of the craniocervical junction1,2,6,
syringomyelia (SM)7 and ventriculomegaly or hydrocephalus.3 Indentation and herniation
of the caudal cerebellar vermis are most commonly cited as the key diagnostic features for
the diagnosis of CM.3,8 Midsagittal magnetic resonance images (MRI) are mentioned in
several articles as the preferred technique for visualizing the caudal fossa and for
identifying morphologic changes associated with CM.1,3,8,9 Diagnostic assessment of the
caudal fossa is sometimes difficult when computed tomography (CT) is used because of
beam-hardening-artifacts associated with this technique. Studies on the comparison of these
imaging modalities for the detection of cerebellar herniation (CH) are absent. The goal of
this study was to prospectively evaluate the degree of agreement between low-field MRI
and multislice CT for the detection of CH and cerebellar herniation length (CHL) in CKCS.
�94

CHAPTER 4�
Materials and Methods
Subjects⎯This study included 15 client-owned CKCS that were evaluated through the
Department of Veterinary Medical Imaging and Small Animal Orthopedics of the Faculty of
Veterinary Medicine, Ghent University, between January 2012 and December 2013.
After medical histories were obtained and a complete clinical evaluation including
neurologic examination was performed, the dogs underwent (in their clinical work-up) both
MRI and CT studies of the brain and cranial cervical spine. Descriptive data were recorded
including age, sex, bodyweight and clinical signs. Owner consent was obtained prior to the
examinations.
MRI protocol⎯Imaging was performed using a 0.2 Tesla MRI unit (Airis Mate, Hitachi,
Japan). The dogs were anesthetized and positioned in dorsal recumbency with their head in
extended position, placed in a multiple array knee coil (paired saddle coil) used in human
medicine. Protocols included precontrast sagittal T1-weighted spin echo (T1WSE) imaging
(repetition time, 400 to 800 milliseconds; echo time, 17 milliseconds) and T2-weighted spin
echo (T2WSE) imaging in sagittal planes (repetition time, 3.000 to 6.000 milliseconds;
echo time, 120 milliseconds). Four-millimeter-thick contiguous slices were chosen (image
matrix, 512 x 512). Mean examination time was 60 minutes per dog.
CT protocol⎯Imaging was performed using a 4-slice helical CT device (Lightspeed Qx/i,
General Electric Medical Systems, Milwaukee, WI). The dogs were anesthetized and
positioned in dorsal recumbency with their head in extended position. Images in 1.25-mm-
thick contiguous slices (120 kVp, 140 mAs, image matrix 512 x 512) were obtained, before
and immediately after administration of 2ml/kg intravenous iodinated contrast medium
(Ultravist 300; N.N. Shering S.A.). The raw data were reconstructed in soft tissue
algorithm. Mean examination time was 10 minutes per dog.
�95

CHAPTER 4�
Imaging analysis⎯Prior to analysis, MR and CT images were loaded into an open source
imaging software (OsiriX Medical Imaging Software). The imaging studies were provided
separate, randomized and the patient information was removed. The images were
independently evaluated by two experienced radiologists (IG and HvB). All CT images
were reviewed in a brain window (window width, 80 HU to 150 HU; window level, 40 HU
to 75 HU). Adjustments of the window width and level were made by the radiologists to
allow better visualization. On midsagittal
T1WSE and T2WSE MR images and midsagittal pre- and postcontrast 2D multiplanar
reformatted CT images, the presence of a cerebellar herniation was noted and the CHL was
measured (mm). The CHL was defined as the position of the tip of the cerebellar vermis
relative to the foramen magnum as previously described (Fig. 1)2,8.
�96

CHAPTER 4�
�97
Fig. 1: Midsagittal T2WSE image (A) and postcontrast CT image (B) (soft tissue
window) of the brain of the same dog. The supraoccipital bone (red asterisk),
basioccipital bone (green asterisk) and occipitoatlantoaxial joint is visible (white
asterisk). The foramen magnum limit is set (black line) from the rostrodorsal aspect
of the supraoccipital bone to the most caudal aspect of the basioccipital bone. The
cerebellar herniation length (mm, white line) is measured caudal from the foramen
magnum.

CHAPTER 4�
Statistical analysis⎯Statistical analyses were performed with an open source software
package R10. Bland-Altman analyses were performed to evaluate the interobserver
agreement. Wilcoxon signed-ranked test was used to analyze differences between the
observers and modalities. In order to investigate the true effects of the imaging modality
instead of the effect of the observer, the mean was used. The Bonferroni correction was
applied for multiple comparisons. Data are presented as mean and P < 0.05 was considered
significant.
�98

CHAPTER 4�
Results
Animals⎯Fifteen CKCS (6 males and 9 females; median age, 66 months [range: 8 to 144
months]) were included in this study. Clinical signs detected or reported by owners at the
initial evaluation varied, the most common of which were neck pain, phantom scratching,
behavioral change (such as sudden fearfulness, unwillingness to play, agression, etc.), head
tilt, ataxia and paresis or paralysis.
Subjective assessment of the presence of CH⎯There was 100% agreement between the
observers concerning the presence of CH on MRI sequences and CT, which determined the
evidence of CH in all dogs in the study.
Interobserver agreement⎯Wilcoxon signed-ranked test showed that there was no
significant difference for measuring CHL on T1WSE (P=0.71) and a significant difference
for measuring CHL on T2WSE MR images (P=0.04) and pre- (P=0.05) and postcontrast
(P=0.01) CT images between the observers. Bland-Altman plots (Fig. 2) showed there was
a large variation between measurements of CHL on CT images, before and after contrast
medium administration, between the observers.
�99

CHAPTER 4�
�100
Fig. 2: Bland Altman plot indicating agreement between the
observers for the CHL on the different techniques. A) T1WSE MR
images, B) T2WSE MR images, C) pre-contrast CT images, D) post-
contrast CT images. The x-axis corresponds to the mean value for
both observers, whereas the y-axis corresponds to the difference
between the 2 observers. The mean of the differences (dashed line)
and 95% limits of agreement (upper and lower lines) are indicated.

CHAPTER 4�
Intermethod agreement⎯Wilcoxon signed-ranked test followed by the Bonferroni
correction for multiple comparisons (Fig. 3) showed there was no significant difference
between the various imaging techniques for measuring CHL: T1WSE and T2WSE MR
images (P=1), CT images before and after contrast medium injection (P=0.29), T1WSE MR
images and pre- (P=1) and postcontrast (P=0.38) CT images and T2WSE MR images and
pre- (P=1) and postcontrast (P=1) CT images.
�101
Fig. 3: Box-and-whisker plot, indicating median (horizontal bar), 25th and 75th
percentiles (box), and range of CHL (mm) in CKCS on both sequences on MR
images and pre- and postcontrast CT images. Overall, the median length and the
range of the length of the CH was higher and longer on the CT images.

CHAPTER 4�
Discussion
Results of this study indicate that low-field MR and multislice CT imaging can provide
comparable information regarding the presence of CH. Computed tomography and MRI are
both imaging modalities to visualize the brain and to detect a variety of intracranial lesions
in humans and animals. Each method has specific advantages and disadvantages to observe
certain brain regions as the patient’s general condition, the availability of the equipment and
economic considerations determine the choice of either method. More specific compared to
MRI studies, CT examinations take less time, hence require shorter anesthesia and therefore
are more suitable for unstable patients. The purchase of computed tomography is less
expensive and devices are more widely available compared to MRI.11
For morphometric studies of the caudal fossa and associated abnormalities related to CM,
T1WSE and T2WSE midsagittal MR images are used in both human and veterinary studies.
1 Sagittal images provide a clear delineation of the boundaries of intracranial structures that
are orientated in a rostrocaudal direction e.g. the corpus callosum, brainstem and cerebellar
vermis.9 Both sequences provide a good contrast between brain parenchyma and
cerebrospinal fluid. T1WSE images reveal better the gross external anatomy and structure
of the cerebellum and bony components, as T2WSE sequences provide a better view of the
internal anatomy of the cerebellum and pathological conditions.12
In our study no significant difference was detected for measuring or detecting CH between
both sequences. Computed tomography scans of the caudal fossa are not routinely
performed to evaluate the cerebellum because of the presence of several artifacts, foremost
partial volume effect and beam hardening, which are reported to influence the evaluation.
These artifacts are most prominent at the caudal fossa because of the thick petrous temporal
bone and are more pronounced in older CT devices. Multislice CT devices use filters to
�102

CHAPTER 4�
perform beam hardening correction to reduce artifacts and provide better temporal and
contrast resolution.13 Also, opting for thin slices, increases the in-plane resolution and
decreases the partial volume effects.14 The use of different reconstruction variables
optimizes the image quality of specific brain regions such as the caudoventral cerebellar
margin.14 The ability to reconstruct thick slices from thin slices reduces skull-base-related
artifacts.15 A bone algorithm was not used in this study to reconstruct CT images and to
measure the CH. Although the use of a bone reconstruction algorithm would enhance the
boundary between the cerebellum and the surrounding bone, it would also increase noise,
making the boundary between the cerebellum and the other soft tissues more difficult to
delineate.
Statistical analysis performed in this study confirmed that there was no significant
difference in MRI and CT for the measurement of the CHL, but overall, the length of the
cerebellar herniation was longer on CT (Fig. 4).
�103
Fig. 4: Midsagittal T2WSE image (A) and postcontrast CT image (B)
(soft tissue window) at the level of the cerebellum of the same dog. The
cerebellar herniation length is longer on the CT image.
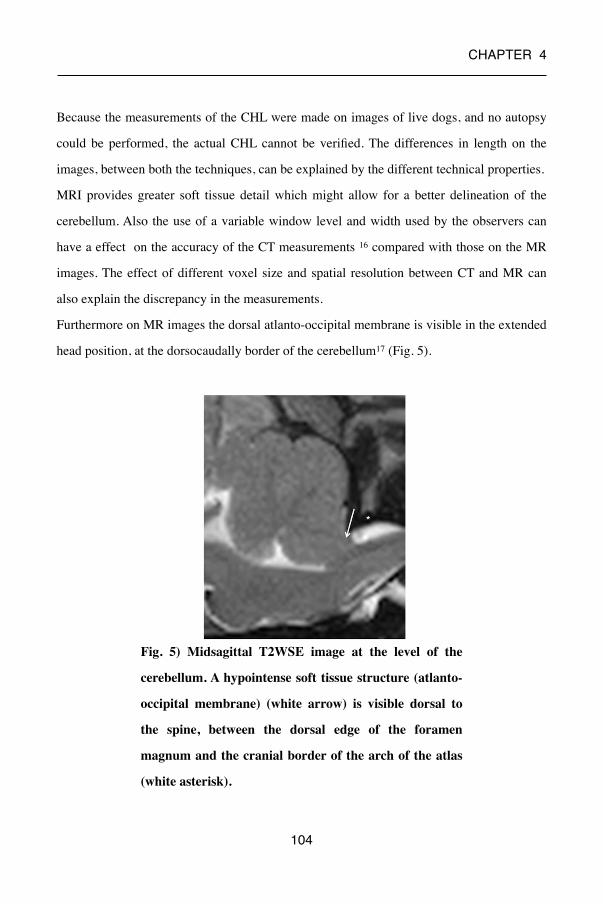
CHAPTER 4�
Because the measurements of the CHL were made on images of live dogs, and no autopsy
could be performed, the actual CHL cannot be verified. The differences in length on the
images, between both the techniques, can be explained by the different technical properties.
MRI provides greater soft tissue detail which might allow for a better delineation of the
cerebellum. Also the use of a variable window level and width used by the observers can
have a effect on the accuracy of the CT measurements 16 compared with those on the MR
images. The effect of different voxel size and spatial resolution between CT and MR can
also explain the discrepancy in the measurements.
Furthermore on MR images the dorsal atlanto-occipital membrane is visible in the extended
head position, at the dorsocaudally border of the cerebellum17 (Fig. 5).
�104
Fig. 5) Midsagittal T2WSE image at the level of the
cerebellum. A hypointense soft tissue structure (atlanto-
occipital membrane) (white arrow) is visible dorsal to
the spine, between the dorsal edge of the foramen
magnum and the cranial border of the arch of the atlas
(white asterisk).
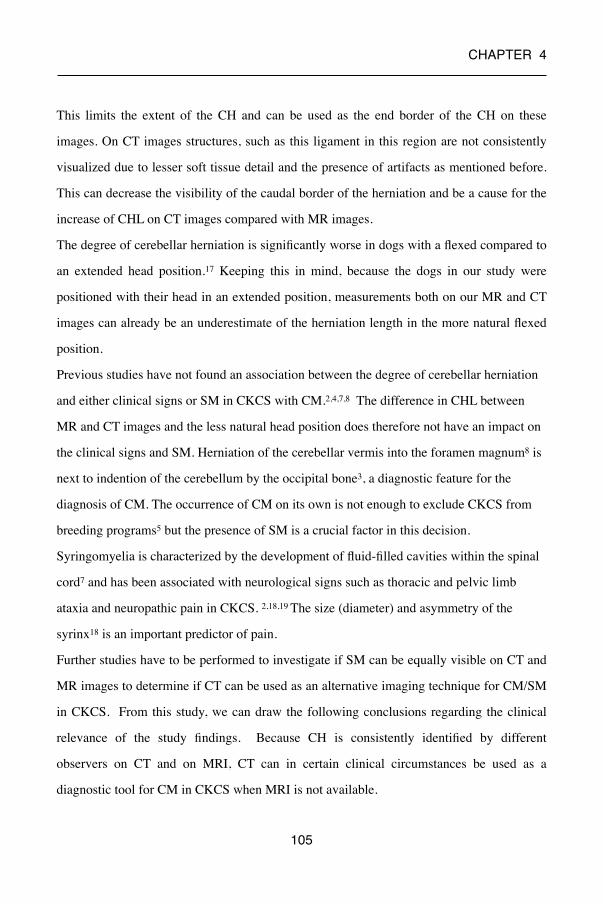
CHAPTER 4�
This limits the extent of the CH and can be used as the end border of the CH on these
images. On CT images structures, such as this ligament in this region are not consistently
visualized due to lesser soft tissue detail and the presence of artifacts as mentioned before.
This can decrease the visibility of the caudal border of the herniation and be a cause for the
increase of CHL on CT images compared with MR images.
The degree of cerebellar herniation is significantly worse in dogs with a flexed compared to
an extended head position.17 Keeping this in mind, because the dogs in our study were
positioned with their head in an extended position, measurements both on our MR and CT
images can already be an underestimate of the herniation length in the more natural flexed
position.
Previous studies have not found an association between the degree of cerebellar herniation
and either clinical signs or SM in CKCS with CM.2,4,7,8 The difference in CHL between
MR and CT images and the less natural head position does therefore not have an impact on
the clinical signs and SM. Herniation of the cerebellar vermis into the foramen magnum8 is
next to indention of the cerebellum by the occipital bone3, a diagnostic feature for the
diagnosis of CM. The occurrence of CM on its own is not enough to exclude CKCS from
breeding programs5 but the presence of SM is a crucial factor in this decision.
Syringomyelia is characterized by the development of fluid-filled cavities within the spinal
cord7 and has been associated with neurological signs such as thoracic and pelvic limb
ataxia and neuropathic pain in CKCS. 2,18,19 The size (diameter) and asymmetry of the
syrinx18 is an important predictor of pain.
Further studies have to be performed to investigate if SM can be equally visible on CT and
MR images to determine if CT can be used as an alternative imaging technique for CM/SM
in CKCS. From this study, we can draw the following conclusions regarding the clinical
relevance of the study findings. Because CH is consistently identified by different
observers on CT and on MRI, CT can in certain clinical circumstances be used as a
diagnostic tool for CM in CKCS when MRI is not available.
�105

CHAPTER 4�
Furthermore the results of this study suggest that CT can be used to confirm or rule out CH
in other situations such as when considering a cisternal puncture for cerebral spinal fluid
collection or cisternal injection for myelography.14 We emphasize that, at the current time,
CT cannot replace MRI as the standard screening technique for CKCS for breeding
purposes for the presence of CM and SM.
�106

CHAPTER 4�
References
1. Carrera I., Dennis R., Mellor DJ. et al. Use of magnetic resonance imaging for
morphometric analysis of the caudal cranial fossa in Cavalier King Charles Spaniels. Am J
Vet Res 2009; 70: 340-345.
2. Cerda-Gonzales S., Olby N.J., Mccullough S. et al. Morphology of the caudal fossa in
Cavalier King Charles Spaniels. Vet Radiol Ultrasound 2009; 50: 37-46.
3. Cross H.R., Cappello R., Rusbridge C. Comparison of cerebral cranium volumes
between Cavalier King Charles Spaniels with Chiari-like malformation, small breed dogs
and Labradors. J Small Anim Pract 2009; 50: 399-405.
4. Driver C.J., Rusbridge C., Cross H. et al. Relationship of brain parenchyma within the
caudal cranial fossa and ventricle size to syringomyelia in Cavalier King Charles Spaniels.
J Small Anim Pract 2010; 51: 382-386.
5. Capello R., Rusbridge C. Report from the Chiari-like malformation and syringomyelia
working group round table. Vet Surg 2007; 36: 509-512.
6. Marino D.J., Loughin C.A. et al. Morphometric features of the craniocervical junction
region in dogs with suspected Chiari-like malformation determined by combined use of
magnetic resonance imaging and computed tomography. Am J Vet Res 2012; 73: 105-111.
7. Rusbridge C., Macsweeney JE., Davies JV. et al. Syringohydromyelia in Cavalier King
Charles Spaniels. J Am Anim Hosp Assoc 2000; 36: 34-41.
8. Lu D., Lamb CR., Pfeiffer DU. Et al. Neurological signs and results of magnetic
resonance imaging in 40 Cavalier King Charles Spaniels with Chiari type 1-like
malformation. Vet Rec 2003; 153: 260-263.
9. Benigni L., Lamb CR. Comparison of fluid-attenuated inversion recovery and T2-
weighted magnetic resonance images in dogs and cats with suspected brain disease. Vet
Radiol Ultrasound 2005; 46: 287–292.
�107
CHAPTER 4�
10. R Core team (2012). R: A language and environment for statistical computing. R
Foundation for Statistical Computing, Vienna, Austria. ISBN 3-900051-07-0, URL http://
www.R-project.org/.
11. Gielen I., Kromhout K., Gavin P. et al. Agreement between low-field MRI and CT for
the detection of suspected intracranial lesions in dogs and cats. J Am Vet Med Assoc 2013;
243: 367-375.
12. Parizel P.M., van den Hauwe L., De Belder F. et al. Magnetic Resonance Imaging of the
brain. In: Reimer P., Parizel P.M., Meaney J.F.M. et al. editors. Clinical MR Imaging. 3rd
ed. Berlin: Springer; 2010. p. 107-195.
13. Schwarz T., Saunders J., editors. Veterinary Computed Tomography. 1st edition, West-
Sussex: John Wiley & Sons Ltd., 2011.
14. Zarelli M., Schwarz T., Puggioni A. et al. An Optimized protocol for multislice
computed tomography of the canine brain. Vet Radiol Ultrasound 2014; 55: 387-392.
15. Porat-Mosenco Y., Schwarz T., Kass P.H. Thick-section reformatting of thinly
collimated computed tomography for reduction of skull-base-related artifacts in dogs and
horses. Vet Radiol Ultrasound 2004; 45: 131-135.
16. Auriemma E., Voorhout G., Barthez P.Y. Determination of optimal window width and
level for measurement of the canine pituitary gland height on computed tomographic
images using a phantom. Vet Radiol Ultrasound 2007; 48: 113-117.
17. Upchurch J.J., McGonnell I.M., Driver C.J. et al. Influence of head positioning on the
assessment of Chiari-like malformation in Cavalier King Charles spaniels. Vet Rec
2011;169: 277-282.
18. Rusbridge C., Carruthers H. Dube M.P. et al. Syringomyelia in Cavalier King Charles
Spaniels: The relationship between syrinx dimensions and pain. J Small Anim Pract 2007;
48: 432-436.
19. Rusbridge C. & Jeffery N.D. Pathophysiology and treatment of neuropathic pain
associated with syringomyelia. Vet J 2008; 175: 164-172.
�108

CHAPTER 5�
�109
Chapter 5
Low-field MRI and multislice CT for
the detection of cervical syringomyelia
in dogs
Adapted from: K. Kromhout *, H. van Bree , B. J. G. Broeckx, S. Bhatti, S. De
Decker, I. Polis, I. Gielen. Low-field MRI and multislice CT for the detection of
cervical syringomyelia in dogs. Journal of Veterinary Internal Medicine
2015;29:1354-1359.

CHAPTER 5�
�110
CHAPTER 5�
Summary
Syringomyelia (SM) is defined as the presence of fluid-containing cavities within the
parenchyma of the spinal cord. Sagittal MR images have been described as the preferred
technique for visualizing SM in dogs and humans.
The aim of this study is to investigate whether CT can be used to diagnose SM.
CT and MR images of 32 client-owned dogs referred for investigation of the cervical spine
on MRI and CT were analyzed retrospectively.
Two reviewers analyzed sagittal and transverse T1WSE MR images and CT images from
each dog for the presence of SM and, if SM was present, the width (mm, SW) was
measured. The results were analyzed statistically.
For the presence of SM there was a moderate interobserver agreement for MR ( 81%, κ=
0.54) and almost perfect agreement for CT (94%, κ= 0.87). There was a moderate
intraobserver intermodality agreement for both observers (observer 1 81%, κ= 0.59;
observer 2 81%, κ= 0.57). For measurement of SW the repeatability was the best on the
midsagittal T1WSE images (95% repeatability coefficient < 0.52mm) and the
reproducibility was the best on midsagittal images in both modalities (95% limits of
agreement -0.55-0.45; p= 0.002)
Both techniques can be used to detect SM. Midsagittal MR and CT images are best used for
measuring SW. CT can be used as a diagnostic tool for SM when MRI is not available, but
CT cannot replace MRI as the standard screening technique for the detection of SM in
Cavalier King Charles Spaniel (CKCS) for breeding purposes.
�111

CHAPTER 5�
Introduction
Syringomyelia (SM) is a condition characterized by the development of fluid-containing
cavities in the spinal cord.1 The fluid in the cavities resembles cerebrospinal fluid but has a
lower protein content.2,3 SM has been considered as a rare disease in veterinary medicine,
but is more and more recognized in animals due to the increased availability of magnetic
resonance imaging (MRI) and the high prevalence in certain breeds such as Cavalier King
Charles spaniels (CKCS)4, Griffon Bruxellois5 and other small or ‘toy’ breeds6. One of the
most common causes in dogs is Chiari-like malformation in CKCS.1,7,8 In this disorder
there is a mismatch between the caudal cranial fossa volume and brain parenchyma which
leads to cerebellar herniation, medullary kinking, obstruction of the dorsal craniocervical
subarachnoid space and alteration of cerebrospinal fluid flow.7 Other causes of SM in dogs
include trauma9,10, caudal fossa masses11 and hydrocephalus.12
MRI is mentioned in several articles in human and veterinary medicine as the preferred
imaging technique for visualizing changes in the spinal cord and to detect SM.1,13,14,15,16
However plain CT and CT after intrathecal injection of non-ionic contrast media have also
been used in human medicine to detect SM.16 Studies on the comparison of these imaging
modalities for the detection of SM are not yet available in veterinary medicine. The goal of
this study was therefore to retrospectively evaluate the agreement within and between
sagittal and transverse low-field MRI and multislice CT for the detection of SM and
measurement of syrinx width (SW) in dogs.
�112

CHAPTER 5�
Materials and Methods
Subjects⎯This retrospective study included client-owned dogs that were evaluated
through the Department of Veterinary Medical Imaging and Small Animal Orthopedics of
the Faculty of Veterinary Medicine, Ghent University, between January 2012 and August
2014. After medical histories were obtained and a complete clinical evaluation including a
general physical and neurologic examination was performed, the dogs underwent (as part of
their clinical work-up) both MRI and CT studies of the cervical region. Thirty two dogs
were included in the study. Dog breeds were CKCS (n=12), French Bulldog (n=7), Maltese
dogs (n=2), Border Collie (n=2), Bordeaux Dog (n=2) and one each of the following: Shi
Tzu, Chihuahua, Yorkshire Terrier, English Springer Spaniel, Jack Russell Terrier,
Rottweiler and Galgo Espanol. Amongst dogs, 17 were female and 15 were male. The mean
age was 63 months (range 6 to 144 months) in the dogs. Clinical signs detected or reported
by owners at the initial evaluation varied, the most common of which were neck pain,
ataxia and tetraparesis.
MRI protocol⎯Imaging was performed using a 0.2 Tesla MRI unit (Airis Mate, Hitachi,
Japan). The animals were anesthetized and positioned in dorsal recumbency, with the area
of interest placed in a human neck/cervical spine coil or a quadrature flexible spine/body
coil used in human medicine. Protocols included precontrast sagittal and transverse T1-
weighted spin echo (T1WSE) imaging and T2-weighted spin echo (T2WSE) imaging in the
same planes. Four-millimeter-thick contiguous slices were chosen (image matrix, 512 x
512).
CT protocol⎯Imaging was performed using a 4-slice helical CT device (Lightspeed Qx/i,
General Electric Medical Systems, Milwaukee, WI). The animals were anesthetized and
positioned in dorsal recumbency. Images in 1.25-mm-thick contiguous slices (120 kVp, 140
�113

CHAPTER 5�
mAs, image matrix 512 x 512) were obtained, before and immediately after administration
of 2 ml/kg (600 mg Iodine/kg body weight) intravenous iodinated contrast medium
(Ultravist 300 (300 mg Iodine/ml); N.N. Shering S.A.). The raw data were reconstructed in
soft tissue algorithm.
Imaging analysis⎯Prior to analysis, MR and CT images were loaded into open source
imaging software (OsiriX Medical Imaging Software). Images were blinded, randomized
and independently evaluated by two experienced observers (KK and IG). All CT images
were reviewed in a brain window. Adjustments of the window width and level were made
by the radiologists individually to allow better visualization. SM was defined by the
presence of an intramedullary fluid filled cavity with uniform signal intensity and density
identical to cerebrospinal fluid (T1WSE: hypointense to spinal cord parenchyma; CT:
hypodense to spinal cord parenchyma) in the ventricular system. The presence of SM on the
MRI and CT images was noted as absent or present.
Morphometric procedure⎯In case SM was present, the maximal dorsoventral SW (Fig.
1) was measured perpendicular to the longitudinal axis of the spinal cord on the midsagittal
images and by measuring the widest dorsoventral diameter of the syrinx on the transverse
images at the same level. Different planes in both modalities were used for the
measurements: midsagittal and transverse T1WSE MR images and postcontrast transverse
and midsagittal 2D multiplanar reformatted CT images.
�114
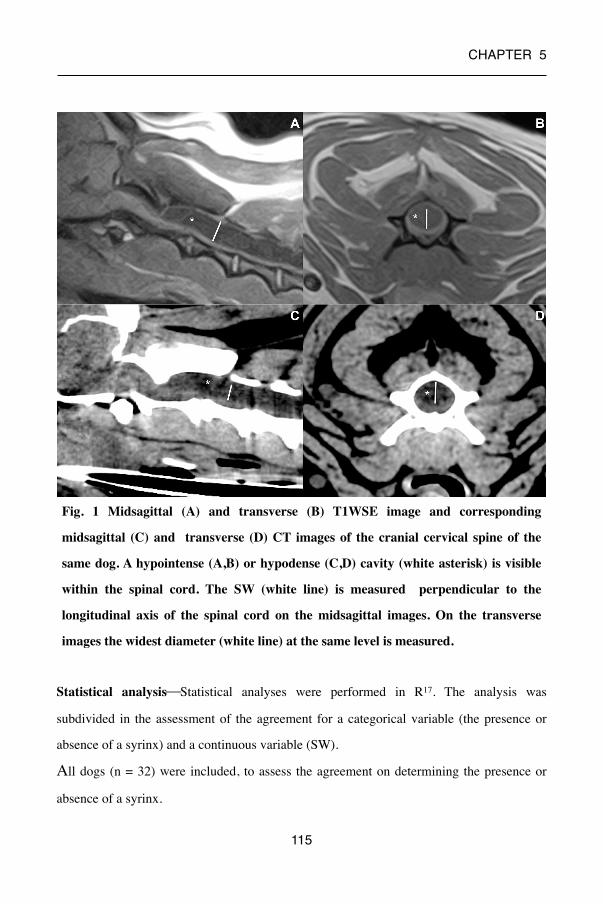
CHAPTER 5�
Statistical analysis⎯Statistical analyses were performed in R17. The analysis was
subdivided in the assessment of the agreement for a categorical variable (the presence or
absence of a syrinx) and a continuous variable (SW).
All dogs (n = 32) were included, to assess the agreement on determining the presence or
absence of a syrinx.
�115
Fig. 1 Midsagittal (A) and transverse (B) T1WSE image and corresponding
midsagittal (C) and transverse (D) CT images of the cranial cervical spine of the
same dog. A hypointense (A,B) or hypodense (C,D) cavity (white asterisk) is visible
within the spinal cord. The SW (white line) is measured perpendicular to the
longitudinal axis of the spinal cord on the midsagittal images. On the transverse
images the widest diameter (white line) at the same level is measured.
CHAPTER 5�
For this diagnosis, each observer had access to both the sagittal and transverse plane from
the same modality (CT or MR). To determine the repeatability, one observer assessed each
patient twice with a two week interval between the assessments, for both CT and MR (=
intraobserver intramodality agreement). To determine the reproducibility within a modality
(CT or MR), the diagnosis from both observers was compared (interobserver intramodality
agreement). To determine the reproducibility between modalities for each individual
observer, the diagnosis from each observer was compared for CT and MR (intraobserver
intermodality agreement). For each analysis, the overall agreement (dogs with agreement
divided by total number of dogs) and a kappa statistic were calculated.18
Only dogs where the agreement on the presence of a syrinx was unanimous for both
imaging modalities, were used to assess the agreement on the measurement of the SW, This
ensures the observed differences are not caused by a different number of dogs or by the in-
or exclusion of specific dogs. Hence, all values can be compared directly. To determine the
repeatability, each dog was measured three times by one observer. Using these results, the
95% repeatability coefficient was calculated as suggested by Bland and Altman19
(intraobserver intramodality intraplanar agreement). To determine the reproducibility, the
mean difference (a measurement for systematic bias) and the 95% limits of agreement were
calculated19. A paired Student’s t test was performed to determine whether the systematic
bias was significantly different from zero. Three different comparisons were made. First,
the reproducibility within one plane and modality (= interobserver intramodality intraplanar
agreement) for two different observers was assessed. Next, the agreement within one
modality between planes for two different observers was assessed (= interobserver
intramodality interplanar agreement). Finally, the agreement for two different observers
between modalities within a plane (= interobserver intermodality intraplanar agreement)
was calculated.
�116

CHAPTER 5�
Results
Categorical variable
repeatability and reproducibility (table 1)⎯There was a perfect intraobserver
intramodality agreement for detection of a syrinx on CT and MR images in consecutive
viewings. There was a moderate interobserver intramodality agreement for MR and almost
perfect agreement for CT on the detecting of a syrinx. There was a moderate intraobserver
intermodality agreement for both observers.
κ, kappa value; levels of agreement: almost perfect (0.8<κ≤1), substantial, (0.6< κ ≤0.8),
moderate (0.4<κ≤0.6), fair (0.2<κ≤0.4), slight (0.2<κ≤0).
κ % of agreement
REPEATABILITYintraobserver intramodality
MRI CT
11
100%100%
REPRODUCIBILITYinterobserver intramodality
MRI CT
0.540.87
81%94%
intraobserver intermodality
observer 1 observer 2
0.590.57
81%81%
�117
Table 1. Agreement between MRI and CT and observers for the detection of a syrinx
(total n examined = 32)

CHAPTER 5�
Continous variable
repeatability⎯ As determined by the 95% repeatability coefficient, 95% of 32 consecutive
readings of SW will be within 0.52 mm for the T1WSE midsagittal images, 0.60 mm for
the midsagittal CT images, 0.61mm for the T1WSE transverse and 0.62 mm for the
transverse CT images.
reproducibility⎯ (table 2)
A) interobserver intramodality intraplanar agreement
A systematic bias significantly different from zero was identified for measuring SW on
T1WSE midsagittal, T1WSE transverse images and midsagittal CT images between the
observers. There was no significant difference present for measuring SW on transverse CT
images between the observers. The reproducibility was highest for midsagittal T1WSE,
followed by transverse T1WSE, transverse CT and midsagittal CT.
B) interobserver intramodality interplanar agreement
A bias significantly different from zero was identified for measuring the SW between
T1WSE midsagittal and transverse images. No significant difference was identified for
measurements between midsagittal and transverse CT images. MR images had the highest
reproducibility.
C) interobserver intermodality intraplanar agreement
The bias was significantly different from zero for the measurement of SW between T1WSE
midsagittal and midsagittal CT images and no significant difference in between T1WSE
transverse and transverse CT images. The midsagittal images over modalities had the
highest reproducibility.
�118
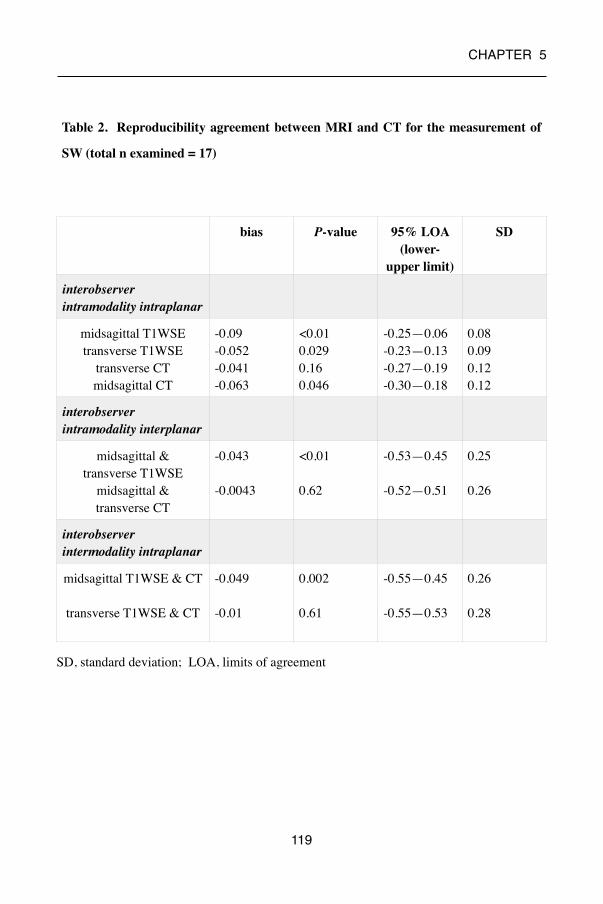
CHAPTER 5�
SD, standard deviation; LOA, limits of agreement
bias P-value 95% LOA (lower-
upper limit)
SD
interobserver intramodality intraplanar agreement
midsagittal T1WSEtransverse T1WSE
transverse CTmidsagittal CT
-0.09-0.052-0.041-0.063
<0.010.0290.160.046
-0.25—0.06-0.23—0.13-0.27—0.19-0.30—0.18
0.080.090.120.12
interobserver intramodality interplanar agreement
midsagittal & transverse T1WSE
midsagittal & transverse CT
-0.043
-0.0043
<0.01
0.62
-0.53—0.45
-0.52—0.51
0.25
0.26
interobserver intermodality intraplanar agreementmidsagittal T1WSE & CT
transverse T1WSE & CT
-0.049
-0.01
0.002
0.61
-0.55—0.45
-0.55—0.53
0.26
0.28
�119
Table 2. Reproducibility agreement between MRI and CT for the measurement of
SW (total n examined = 17)

CHAPTER 5�
Discussion
Results of this study demonstrate that low-field MR and multislice CT imaging provide
comparable information regarding the presence of SM. Analyses of the intraobserver
repeatability resulted in the best repeatability for measurement of SW on the midsagittal
images (T1WSE > CT) and the least on transverse images (T1WSE > CT). An almost
similar result was obtained for the interobserver reproducibility.
Significant bias was identified in some comparisons, This is no issue however as this
indicates the systematic differences between modalities/observers or planes. A systematic
difference can be easily corrected by subtracting or adding this bias to the results from one
technique, to obtain the values for the other technique. A bigger issue is a large standard
deviation (and consequently large limits of agreement) as they indicate a non-systematic
difference and cannot be corrected for.
For the diagnosis and morphometric studies of SM, MR is the imaging modality of choice
both in human and veterinary studies, because of its high contrast resolution and
multiplanar capabilities. This was also reflected in the results of this study. Thin section
images should be obtained to limit partial volume effects and allowing optimal
visualization of small syrinx cavities. In human medicine, most of the investigations
concerning SM have been carried out on T1WSE images.20, 21 Veterinary studies have used
T2WSE images13,22 and T1WSE images8, 14, 23 to evaluate SM. T1WSE images were used
for the measurements in this study. Measurements of the syrinx on T2WSE images may
result in an overestimation of the size because the borders of the syrinx are not well
demarcated23 as they can include the hyperintense signal associated with interstitial
oedema. This interstitial oedema or pre-syrinx state20,24 is an accumulation of fluid in the
parenchyma prior to syrinx formation. In addition, several artifacts interfere more on
T2WSE images compared with T1WSE images. Two such artifacts are the truncation and
susceptibility artifact.
�120
CHAPTER 5�
Truncation artifact is a common source of high signal intramedullary bands on midsagittal
T2WSE images which can be mistaken for a syrinx.25 Susceptibility artifacts due to
metallic foreign bodies, such as ID microchips in veterinary patients, are commonly seen on
MR images of the cervical spine. These are more obvious on T2WSE images and cause a
distortion of the spinal cord on this level which may influence the detection of SM in the
cervical spine.26 CT is not routinely used to investigate intramedullary changes due to the
lesser contrast resolution compared with MRI. Images from plain CT are considered
unreliable due to imaging distortions of the surrounding bone (beam artifact).27 This artifact
is more pronounced in past generation CT scanners. Multislice CT scanners, such as the one
used in this study, can reduce these artifacts and provide better temporal and contrast
resolution. An advantage of CT compared with MRI is the ability to acquire thin slices
without loss of detail on the reformatted images and a high signal to noise ratio in contrast
to MRI where thinner slices result in a decrease in detail and a decreased signal to noise
ratio. In our study a different slice thickness has been used for both modalities (MRI = 4
mm; CT = 1.25 mm) to optimize the visualization of the spinal cord. Optimal CT and MRI
imaging parameters, including slice thickness, for the cervical spine have already been
established in previous articles.28,29 We are aware that the small CT slice thickness used
during our examinations can be different from the thickness that is used standard in other
clinics and can influence the detection of SM in those cases.
Previous articles have stated that CT only allows detection of large intramedullary cavities.
Smaller cavities are only seen if they fill with contrast (= CT myelography).30 CT
myelography is able to show swelling and fixation of the spinal cord and localized
cerebrospinal fluid flow obstruction.27 A syrinx is identified by delayed accumulation of
water-soluble contrast within the spinal cord in less then 4 hours. In human medicine,
10-50% of syrinxes are not detected using CT myelography.31 In addition, this technique is
invasive and is reported to cause adverse effects such as seizures or neurological
deterioration.32
�121

CHAPTER 5�
Consequently and due to the infrequent use of CT myelography in our clinic, this technique
was not used in this study.
When we look at the differences in measurements between the different planes in MR and
CT images and between the modalities there is a significant mean difference between the
transverse and midsagittal planes in MR and the midsagittal planes between MR and CT.
The discrepancy between the SW on midsagittal and transverse MR images can be
attributed to the fact that we choose midsagittal images based on the visualization of the
spinous process to assure that the measurements were made at the maximum diameter of
the spinal canal and cord. This can be off midline (Fig. 2) resulting in a different width
compared with the transverse images. Furthermore the large thickness of the slices on MR
compared to the size of the cervical spinal cord can also produce off midline images. This
might also (partially) explain the differences between the midsagittal MR and CT images.
With CT, we can work with reformatted and smaller thickness images where we can create
images almost exact in the midline.
�122
Fig. 2: Midsagittal (A) and transverse (B) T1WSE image of the cranial cervical
spine of the same dog. A hypointense cavity (white asterisk) is visible within the
spinal cord. A susceptibility artifact (*) is visible due to the present of a microchip.
The corresponding slice (white line) of the sagittal image is off midline compared to
the transverse image.

CHAPTER 5�
The common definition of a syrinx is the presence of a fluid-containing cavity within the
spinal cord parenchyma with a diameter ≥ 2 mm at his widest point.13 This is also the cut-
off value that is used in the breeding recommendations of CKCS.33 The central canal is
normally just appreciable on MR images and not visible in normal circumstances on CT
images. However, any dilatation of the central canal should be considered abnormal. Hence,
the detection of smaller dilatations on both MR and CT is important as progressive central
canal dilatation is a precursor of syrinx formation.1,34 Furthermore results of a previous
study suggest that SW progresses with time in CKCS.34 SW has been shown to be the
strongest predictor of pain in CKCS. A syrinx of > 6.4mm wide causes clinical signs in
95% of CKCS12. In a study conducted in American Brussels Griffon dogs there was no
association found between the size and pain, only between size (>1mm and <2mm) and
Chiari malformation signs.35 Also in human medicine signs of pain are not well correlated
with the size of the syrinx. Damage to the dorsal horn of the spinal cord is a key feature in
the presence of pain.36 Further studies have to be conducted in other breeds to see if the size
of asyrinx has an effect on symptoms in these dogs. This study did not find an association
between the detection of a small dilatation and use of technique (Fig. 3).
�123

CHAPTER 5�
The difference in detection and measurement can be attributed to the experience of the
observer and the presence of several of the artifacts mentioned earlier.
Overall, we conclude that SM is consistently identified by different observers on CT and on
MRI. Additionally, the results of this study suggest that when a syrinx is detected the
highest agreement is present for measuring SW on both midsagittal MR and CT images.
SM and SW have been shown to explain at least some of the clinical signs in dogs. As CT
scanners are more readily available in veterinary practices compared with MRI equipment,
�124
Fig 3. Midsagittal (A) T1WSE and corresponding (B) CT image of the cranial
cervical spine of dog 1 and midsagittal (C) T1WSE and corresponding (D) CT
image of the cranial cervical spine of dog 2. A, B: a small (<1.5mm, white asterisk)
dilatation of the central canal is visible. C, D: a large (>4mm, white asterisk) syrinx
is visible.
CHAPTER 5�
CT can be used as a diagnostic tool for SM when MRI is not available. Cerebellar
herniation is consistently identified by different observers on CT and on MR images of
CKCS.37 Bearing this in mind, we can conclude, that CT can be used as an alternative
imaging technique for Chiari-like malformation/syringomyelia in CKCS when MRI is
not available. We emphasize that, at the current time, CT cannot replace MRI as the
standard screening technique for the detection of SM in CKCS for breeding purposes, more
specific for the detection of the pre-syrinx state.20,24
�125

CHAPTER 5�
References
1. Rusbridge C., Greitz D., Iskandar B.J. Syringomyelia: Current Concepts in Pathogenesis,
Diagnosis, and Treatment. J Vet Intern Med 2006; 20: 469-479.
2. Levine D.N. The pathogenesis of syringomyelia associated with lesions at the foramen
magnum: a critical review of existing theories and proposal of a new hypothesis. J. Neurol
Sci 2004; 220: 3-21.
3. Greitz D. Unraveling the riddle of syringomyelia. Neurosurg Rev 2006; 29: 251-263.
4. Cross HR, Cappello R, Rusbridge C .Comparison of cerebral cranium volumes between
Cavalier King Charles spaniels with Chiari-like malformation, small breed dogs and
Labradors. J Small Anim Pract 2009; 50: 399–405.
5. Rusbridge C., Knowler S.P. et al. Chiari-like malformation in the Griffon Bruxellois. J
Small Anim Pract 2009; 50: 386–393.
6. Dewey C., Berg J. et al. Foramen magnum decompression for treatment of caudal
occipital malformation syndrome in dogs. J Am Vet Med Assoc 2005; 227: 1270-1275.
7. Driver C.J., Volk H.A., Rusbridge C., Van Ham L.M. An update on the pathogenesis of
syringomyelia secondary to Chiari-like malformations in dogs. Vet J 2013; 198: 551-559.
8. Parker J.E., Knowler S.P., Rusbridge C. et al. Prevalence of asymptomatic syringomyelia
in Cavalier King Charles spaniels. Vet Rec 2011; 168: 667.
9. Olby N. The Pathogenesis and Treatment of Acute Spinal Cord Injuries in Dogs. Vet Clin
North Am Small Anim Pract 2010; 40: 791-807.
10. Feliu-Pascual A.L., Garosi L., Dennis R. et al. Iatrogenic brainstem injury during
cerebellomedullary cistern puncture. Vet Rad Ultrasound 2008; 49 :467-471.
11. da Costa R.C., Parent J.M., Poma R. et al. Cervical syringohydromyelia secondary to a
brainstem tumor in a dog. J Am Vet Med Assoc 2004; 225: 1061-1064.
�126

CHAPTER 5�
12. Kitagawa M., Ueno H., Watanabe S. et al. Clinical improvement in two dogs with
hydrocephalus and syringohydromyelia after ventriculoperitoneal shunting. Aus Vet J 2008;
86: 36-42.
13. Rusbridge C., Carruthers H., Dubé M.P. et al. Syringomyelia in Cavalier King Charles
spaniel: the relationship between syrinx dimensions and pain. J Small Anim Pract 2007; 48:
432-436.
14. Couturier J., Rault D., Cauzinille L. Chiari-like malformation and syringomyelia in
normal Cavalier King Charles spaniels: a multiple diagnositic imaging approach. J Small
Anim Practice 2008; 49: 438-443.
15. Kirberger R.M., Jacobson L.S., Davies J.V. et al. Hydromelia in the dog. Vet Radiol
Ultrasound 1997; 39: 30-38.
16. Doyon D., Benoudiba F., Iffenecker C. et al. Imaging of syringomyelia. Neurochirurgie
1999; 45: 105-114.
17. R Core team (2012). R: A language and environment for statistical computing. R
Foundation for Statistical Computing, Vienna, Austria. ISBN 3-900051-07-0, URL http://
www.R-project.org/.
18. Landis J.R., Koch G.G. The measurement of observer agreement for categorical data.
Biometrics 1977; 33: 159–174
19. Bland J.M., Altman D.G. Measuring agreement in method comparison studies. Stat
Methods Med Res 1999; 8: 135-160.
20. Akiyama Y., Koyanagi I., Yoshifuji I. et al. Interstitial spinal-cord oedema in
syringohydromyelia associated with Chiari type 1 malformations. J Neurol Neurosur Ps
2008; 79: 1153-1158.
21. Trigylidas T., Baronia B., Vassilyadi M. et al. Posterior fossa dimension and volume
estimates in pediatric patients with Chiari i malformations. Child Nerv Syst 2008; 24:
329-336.
�127

CHAPTER 5�
22. Carruthers H., Rusbridge C., Dube M.P. et al. Association between cervical and
intracranial dimensions and syringomyelia in the Cavalier King Charles spaniel. J Small
Anim Pract 2009; 50: 394-398.
23. Loderstedt S., Benigni L., Chandler K. et al. Distribution of syringomyelia along the
entire spinal cord in clinacally affected Cavalier King Charles Spaniels. Vet J 2011; 190:
359-363.
24. Fishbein N.J., Dillon W.P., Cobbs C. et al. The “Presyrinx” State: A reversible
Myelopathic Condition That May Precede Syringomyelia. Am J Neuroradiol 1999; 20:
7-20.
25. Bou-Haider P., Peduto A.J., Karunaratne N. Differential diagnosis of T2 hyperintense
spinal cord lesions: Part A. J Med Imaging Radiat Oncol 2009; 52: 535-543.
26. Hecht S., Adams W.H., Narak J. et al. Magnetic Resonance Imaging susceptibility
artifacts due to metallic foreign bodies. Vet Radiol Ultrasound 2011; 52: 409-414.
27. Klekamp J., Samii M. Syringomyelia: Diagnosis and Management, first edn. Springer,
Berlin; 2002:195.
28. Drees R., Dennison S.E. et al. Computed tomographic imaging protocol for the canine
cervical and lumbar spine. Vet Radiol Ultrasound 2009; 50: 74-79.
29. Dennis R. Optimal magnetic resonance imaging of the spine. Vet Radiol Ultrasound
2011; 52 Supp.1: S72-S80.
30. Lee B.C.P., Zimmerman R.D., Manning J.J. et al. MR imaging of syringomylia and
hydromelia. Am J Neuroradiol 1985; 6: 221-228.
31. Brodfelt A.R., Stoodley M.A. Post-traumatic syringomyelia: a review. J Clin Neurosci
2003; 10: 401-408.
32. Barone G, Ziemer L.S, Shofer F.S, et al. Risk factors associated with development of
seizures after use of iohexol for myelography in dogs: 182 cases (1998), J Am Vet Med
Assoc 2002; 220: 1499–1502.
�128
CHAPTER 5�
33. Capello R., Rusbridge C. Report from the Chiari-like malformation and syringomyelia
working group round table. Vet Surg 2007; 36: 509-512.
34. Driver C.J., De Risio L., Hamilton S. et al. Changes over time in craniocerebral
morphology and syringomylia in cavalier King Charles spaniels with Chiari-like
malformation. BMC Vet Res 2012; 8: 215.
35. Freeman A.C., Platt S.R. Kent M. et al. Chiari-Like Malformation and Syringomyelia
in American Brussels Griffon Dogs. J Vet Intern Med 2013; 28: 1551-1559.
36. Todor D.R., Harrison T.M., Millport T.H. Pain and syringomyelia: A review. Neurosurg
Focus 2008; 8: 1-6.
37. Kromhout K.,van Bree H., Broeckx B. J.G. et al. Low-field MRI and multislice CT for
the detection of cerebellar (foramen magnum) herniation in Cavalier King Charles Spaniels.
J Vet Intern Med; Epub 2014 Nov 19.
�129

CHAPTER 5�
�130

CHAPTER 6�
�131
General discussion

CHAPTER 6�
�132

CHAPTER 6�
Imaging modalities − such as MRI and CT − are often used in the diagnostic workup of a
veterinary neurology patient. In both human and veterinary medicine MRI is considered the
imaging modality of choice for detecting lesions of the brain and spinal cord. This is
mainly because of the superior soft tissue contrast of MRI when compared to CT.1 In
addition, pathological changes are better visualized on MRI, because of its analytical
sensitivity for soft tissue alterations.2
However, in small animal medicine, there is a lack of comparative studies between MRI
and CT of the normal or diseased brain and spinal cord. Comparative studies of normal
anatomy are limited to anatomical MRI and CT atlases of dogs 3-4, the normal anatomy of
skull foramina and cranial nerve emergence in dogs and cats 5-6 and a comparison of MRI
and CT for vertebral body and vertebral canal measurements in dogs.7 Moreover, MRI and
CT comparative studies concerning intracranial lesions and spinal cord abnormalities are
also scarce. 8-14
The first part of this thesis documents a comparative study of MRI and CT images of the
brain of 58 patients (51 dogs and 7 cats) for the detection of intracranial lesions. To our
knowledge, no veterinary studies containing a large group of animals and direct comparison
of MRI and CT images have been conducted. In studies where histopathology of lesions
was present and MRI and/or CT was used, CT imaging proved to be less accurate for
detection of an intracranial mass than MRI.15-17 In humans, direct comparative studies have
shown that MRI and CT can be used in a complementary manner − although computed
tomography was considered to be less accurate in the detection of intracranial lesions.18-21
However, these studies are rather dated − they used older generation MRI and CT devices,
which can influence the image quality and interpretation. In our study clinical data was not
given to the radiologist before evaluation of the images. Image blinding was utilized and
dogs without lesions were included in the clinical setup to reduce potential limitations.22 We
found substantial agreement between the two modalities for the initial visualization of the
�133

CHAPTER 6�
lesions. One or more intracranial lesions were detected in 38 of 58 patients either by CT or
MRI, or both. In 30 of these 38 patients the lesions were seen by both modalities. Still, 7
lesions which were detected on MRI were not visualized on CT. The 1 lesion that was
detected on CT but not on MRI is discussed below. This discrepancy may be clinically
relevant and suggests that MRI is more reliable for lesion detection than CT. The non-
detected lesions on CT in our study were classified by the observers on the MR images as
suspected infarctions, oedema or diffuse inflammatory lesions. Because no
histopathological information was present these diagnoses could not be verified.
Various theories can be used to explain the discrepancy in detection between both
modalities. First of all MRI is more sensitive than CT in detecting increasing amounts of
water.23 As most pathologic processes alter the content, distribution, and ambient
environment of hydrogen protons in tissues24, MRI is an appropriate and sensitive modality
for imaging diseases. Also, as mentioned previously, MRI provides excellent soft tissue
contrast. The ability of MRI to produce images that are formed by the use of different
sequences could explain the higher detection rate. Our study included a FLAIR sequence in
addition to T1WSE and T2WSE sequences. FLAIR suppresses the hyperintense signal
associated with free fluid, such as cerebrospinal fluid (CSF). This sequence can therefore
aid in differentiation of hyperintense pathological lesions (such as brain oedema) and
adjacent CSF, which have similar imaging characteristics on the more conventional T2WSE
images.25 When compared to T2WSE, FLAIR also has a higher sensitivity in detecting
subtle abnormalities and lesions with multifocal localizations, such as inflammatory
diseases.26 The advantages of FLAIR sequences in brain lesion detection have been studied
previously, with a variety of results. In one study FLAIR was compared with T2WSE in
dogs and cats with suspected intracranial disease.25 Overall, very good agreement was
found between FLAIR and T2WSE MR images (k= 0.88) for the detection of lesions.
�134

CHAPTER 6�
FLAIR sequences were more effective in identifying periventricular or intraventricular
lesions and in confirming cystic fluid within lesions. Another study found FLAIR to be the
most sensitive sequence for detecting brain lesions and predicting abnormal CSF in dogs
with multifocal inflammatory intracranial disease as compared to T2WSE and both pre- and
postcontrast T1WSE27. Therefore FLAIR should be included in the protocol of imaging of
the brain as suggested by Robertson et al..28 The inclusion of this sequence in our study
could partially explain the higher lesion detection on the MRI images. Looking more into
detail in which types of lesions were not detected on the CT images, suggests a few other
explanations. First of all, detection of infarctions is type- and time-dependent. They can be
classified in haemorrhagic or ischemic. Changes associated with ischaemic infarction can
be detected by CT as early as 3–6 hours after their onset.29,30 CT has also proven to be very
sensitive in detecting acute and subacute haemorrhage. These can be visualized on CT
because of the hyperdense characteristics of haemorrhage compared to normal brain
parenchyma31. The density gradually decreases to become isodense over days and weeks.32
Chronic haemorrhage may be invisible on CT.32 For the detection of ischemic infarcts, MRI
is superior to CT due to its excellent soft tissue contrast and its ability to detect subtle
lesions.33 MRI has been reported to be more sensitive than CT for early diagnosis of
infarction, with changes seen within 1 hour.34,35 However, a recent study shows that CT can
detect infarctions from less than 12 hours and up to 6 days after onset of clinical signs.36
The time lapse between the initial appearance of symptoms and the imaging is important
and this can explain the absence of these types of lesions on our CT images. Diffuse
inflammatory lesions are not well visualized on CT: they can have signal attenuation similar
to surrounding tissue and little or no contrast uptake, and so they can be missed on CT.
Hence, in these cases, MRI is the modality of choice.
�135

CHAPTER 6�
In our study one lesion was detected with CT but not with MRI. This was a contrast-
enhanced multifocal lesion that was categorized as encephalitis after cerebrospinal fluid
analysis. The exact reason why this lesion was undetectable on both pre- and postcontrast
MRI images is unclear. The interval between contrast medium injection and image
acquisition (immediately after intravenous injection of contrast) on MRI in our study may
have been too short. MRI contrast media function indirectly by altering the local magnetic
environment.37,38 Contrast enhancement of intracranial lesions is a dynamic process. The
detection of enhancement is influenced by the time between contrast administration and
sequence acquisition.39,40 In the absence of an intact blood-brain barrier, contrast medium
diffuses first into well vascularized lesions and from there into areas of gliosis, necrosis and
oedema.41 Studies in human medicine have concluded that in most instances, lesion
detection does not change between initial and delayed MRI images.42 In our study, only
postcontrast transverse T1WSE sequences were acquired. When postcontrast images are
acquired in different planes, immediate and delayed contrast images are produced which
could have an influence on the detection of lesions.
Once a lesion is detected, further characterization aids in determining the differential
diagnosis. Veterinary studies have been conducted to see if it is possible to differentiate
neoplastic, inflammatory and vascular brain lesions in dogs primarily on the basis of
specific characteristics.43 These studies tend to show that MRI findings are often non-
specific and are shared between major disease categories.44-47 In our study following
variables were evaluated: lesion pattern (solitary or multiple), mass effect, lesion
localization, aspect of margins, pre- and postcontrast size of the lesions, and presence and
pattern of contrast enhancement. The results of our study indicated various levels of
agreement between MRI and CT for these parameters.
�136

CHAPTER 6�
° Computed tomography and MRI had a perfect agreement for the presence of a mass
effect. Mass effect is present when there is a shift of the brain parenchyma or when a
compression of the ventricular system is observed.15 Detecting a mass effect is important,
because it indicates that healthy brain structures are being displaced (with potential
functional consequences) and this is associated with elevated intracranial pressure.48
Mass effect can sometimes help to differentiate lesions.15,45
° There was almost perfect agreement between both modalities for contrast enhancement
of the lesions on the images in our study. Results of an MRI study indicated that the
administration of contrast medium is not necessary for lesion detection.49 When a lesion
is not detected on precontrast T1WSE, T2WSE or FLAIR images, it is unlikely (1,9%) we
would detect a lesion on postcontrast images. The findings of that study are similar to a CT
study of the brain in equine patients.50 However, contrast should be administered in patients
with persistent neurological deficits, where an inflammatory or infectious disease is
suspected27,51 and to identify certain intracranial neoplasms (cranial nerves or small lesions
with no mass effect).49 The basic principle of contrast medium uptake by tissues is the same
for iodinated and gadolinium-based contrast, which might explain the almost perfect
agreement between CT and MRI in detecting the presence of contrast medium
enhancement.
° The pattern of enhancement differed to a greater extent between the two imaging
modalities in our study. This is important, because the degree or pattern of contrast
enhancement can assist in the characterization of lesions. It can be used to evaluate tumour
type52,53 and to differentiate neoplastic from non-neoplastic lesions such as inflammation
and cerebrovascular disease.43,44 However, contrast enhancement patterns do not
consistently reflect the histologic features of an intracranial lesion.54
�137

CHAPTER 6�
° Important characteristics which had lesser agreement in our study were localization and
dimensions. Lesions in the temporal and piriform lobes and brainstem were not consistently
detected on the CT images. The presence of artefacts in this region can mask the presence
of a lesion. The most important ones are beam hardening and partial volume effect55. They
are most prominent at the level of the caudal fossa, between the thick dens petrous parts of
the temporal bone. These artefacts manifest as a broad hypodense streak bordered by a less
distinct area of elevated CT numbers.56 The partial volume artefact can be seen when
tissues of different signal intensity become part of the same voxel.57,58 In canine patients
these artefacts can influence the diagnostic assessment of the caudal fossa.59,60
° The lesion dimensions did not agree well. Overall, the lesion dimensions were larger on
CT images than on MRI images. As mentioned before, the presence of artefacts might have
influenced this. Partial volume averaging and blooming artefacts can cause blurring and
misinterpretation of the lesion margins.61 Also the better soft tissue detail of MR compared
to CT allows better delineation of the lesions. Lesion size can be important when used tot
evaluate treatment response in cancer.62 The more recent multislice (multidetector) CT
scanners enable submillimetre thickness image data sets to be acquired for a patient. These
very high-resolution image data sets can also be used with advanced three-dimensional
(3D) techniques to visualize and quantify anatomy and pathology with unprecedented detail
and accuracy.62. Contrast medium is routinely used to improve the delineation of lesions
and their margins.63 Our findings suggested that the use of contrast did not lead to improved
agreement between CT and MRI images for lesion dimension.
Our study had a few limitations.
First of all we used a low-field (LF) MRI device. Limitations are mainly a result of the
low signal-to-noise ratio (SNR). Signal-to-noise ratio is the key factor for image quality,
being the ratio of useful signal to unwanted (noise) signal in the image.64 Because SNR,
�138

CHAPTER 6�
contrast and resolution all increase almost linearly with the field strength, LF MRI is
generally associated with decreased spatial resolution, leading to less sharp, but still
diagnostic images.65 In human medicine66-68 there is no significant difference between HF
MRI and LF MRI diagnostic capabilities for certain diseases of the brain. Only iron
deposits, minimal vascular deformities and minimal inflammatory or neoplastic changes
appear to be to harder to identify with a LF system.67
Also, slices are usually thicker in LF devices. The decrease in slice thickness allows better
spatial resolution and more SNR.69,70 Thus, thick-slice images are blurry but contain little
noise, whereas thin-slice images are sharp but noisy. Thicker slices both in MRI and CT
studies can produce artefacts that can reduce image interpretation. Partial volume artefact
and beam hardening are the most important (see above). This limitation also applies to our
following studies in which a LF device was also used.
Second, because we used a LF MRI with thick slices (4mm) we choose CT slices with
equal thickness. This could have contributed to the lower detection of lesions on our images
due to the lesser in-plane resolution and the above mentioned artefacts. This is also a
disadvantage when creating multiplanar reconstructions (MPR). The quality of the MPR
depends on the slice thickness.71 Slice thickness of 1 mm results in high-quality MPRs,
whereas MPRs from 2-mm-thick slices are of poor quality.72 Creating MPR images with
thicker slices and non overlapping sections can cause stair-step artefacts58 on the sagittal
and coronal reconstructed images and limit detection. Stair-step artefacts are virtually
eliminated in multiplanar and three-dimensional reformatted images from thin slices and
overlap obtained with multislice scanners.58 All recent LF systems allow high-resolution 3D
T1-weighted imaging. With this sequence acquisition of isotropic 1 mm slices is possible.
These images have a high resolution, therefor small and/or subtle contrast uptake can be
detected.65 This could have an impact on the detection of smaller lesions in our study.
�139

CHAPTER 6�
In human studies - when applying these sequences - the detection rate increases for small
lesions in cortical and subcortical areas of the brain 73 and the pituitary gland.74
Third a limited number of study subjects (particular cats) were used. This could have an
impact on the statistics. In selected analyses (lesion anatomic location and enhancement
pattern), sample sizes were also low. In these cases κ values should be interpreted with
caution.
Fourth and finally, this was a descriptive study of the agreement between imaging
modalities, and because it did not take the final diagnosis into account, no conclusions
could be made as to the accuracy of either technique.
The use of cats as study objects, with a different skull conformation and brain volume
compared to dogs, should not have an impact on the detection of the lesions. This is
because there were also dogs included with a different skull conformation (brachy-, meso-
and dolichocephalic types) and accordingly different brain volumes. The results for the
detection of an intracranial lesion are similar compared to those observed in humans.18,19,75
Given the aforementioned limitations, we can draw the following conclusions. Although
there was a substantial degree of agreement for the detection of lesions between both
modalities the degree of disagreement is clinically relevant. Once a lesion is detected,
however, CT and MRI are concordant for the most diagnostically important imaging
characteristics (i.e. mass effect and contrast enhancement). The use of advanced imaging
techniques in intracranial lesions is becoming more and more commonplace in veterinary
medicine: they play a role in treatment planning and the assessment of therapeutic response,
and they will be used more frequently in biopsy-based diagnosis. So, it is essential that the
right technique be used in these cases.
�140

CHAPTER 6�
CT can be used as an alternative to MRI when not available, but CT should not be used as
the diagnostic imaging modality of choice for intracranial lesions when MRI is available.
The exception is traumatic events, as stated in other articles, where CT is generally the
imaging modality of choice for initial evaluation, because it can be performed rapidly and it
accurately detects skull fractures and intracranial hemorrhage.76
The second part of this thesis examines the agreement between low-field MRI and
multislice CT for the detection of specific brain and cervical spine abnormalities.
The first study in this part focused on the agreement between both modalities for the
detection of cerebellar herniations. For this study, we choose Cavalier King Charles
Spaniels (CKCS) because they have a high prevalence77,78 of Chiari-like malformation
(CM). Cerebellar herniation, indention and impaction are considered diagnostic
characteristics for CM.79,80 However, a recent article suggested that indention and
impaction are unsuitable as a definition for CM because of the high prevalence in normal
dogs (asymptomatic, non-CKCS).81 MRI is cited in several articles as the preferred
technique for visualizing the caudal fossa and for identifying morphologic changes
associated with CM.77-80 CT is less favourable because of the presence of artefacts (see
above). In human medicine, CT is used complementary to MRI in assessing craniocervical
junction abnormalities to determine what structures are causing the compression on the
neural tissues.82,83 CT is also used in morphometric studies to determine total brain volume,
total cranial volume and cranial and caudal fossa volumes to explain the origin and
neurological signs in dogs with CM.78,84-86
In our study, we used sagittal images in both modalities to evaluate the caudal fossa.
Intracranial structures (e.g. corpus callosum, brainstem and cerebellar vermis) that are
orientated in rostrocaudal direction are best visualized on sagittal images.
�141

CHAPTER 6�
Midsagittal MRI images are mentioned in several veterinary articles28,48,77,87 as the
preferred imaging plane for visualization of cerebellar herniations. Sagittal MPR CT
images can provide valuable information concerning anatomic locations, such as the
tentorium and craniovertebral junction which are subjected to beam hardening artefacts
from osseous structures88. MPRs are easily performed and should be used routinely in the
evaluation of the brain and spine.89,90
In our study there was a perfect agreement regarding the presence of CH on midsagittal
MRI and midsagittal 2D MPR CT images. This suggests that CT can be used to detect CH
and this not only in dogs with CM but also to rule out CH in other situations. Cerebellar or
foramen magnum herniation in which caudal parts of the cerebellum are displaced into and
through the foramen magnum91 can be a result of the presence of a large dorsal
rostrotentorial mass that is localized very caudally.92 Also CH is widely thought to be
associated with elevated intracranial pressure in dogs and cats.93,94 In humans, the extent of
hind brain herniation is correlated with the severity of elevated intracranial pressure95, but
this did not appear to be the case in a recent study in dogs.49 When considering a cisternal
puncture for cerebrospinal fluid collection or cisternal injection for a myelography, CT can
be used as a screening tool. This can avoid potentially fatal complications such as direct
brainstem trauma, cerebral and/or cerebellar herniation and central nervous system
haemorrhage96 which can occur in cisternal puncture. The incidence of brain herniation
following a CSF collection has been found to be slightly higher in cats than in dogs.97 CT
can then potentially be used as an alternative to other imaging methods, such as
ultrasound98,99 to quickly evaluate the craniovertebral junction. This can be especially
valuable when a CT myelography99,100 is requested.
Statistical analysis performed in our study confirmed that there was no significant
difference between MRI and CT for the measurement of the CHL, but overall, the length of
CH was considered to be longer on CT.
�142

CHAPTER 6�
This was also described in an article in which vertebral body length was overestimated on
CT compared to MRI.7 In addition to the better soft tissue detail on MRI images, this can
also be explained by the variable use of window level and window width used by the
observers.101 Another study showed that the most accurate measurement of an object on CT
images is obtained by setting the window level at half of the difference of Hounsfield units
(HU) between the object and the background.102
A higher level will underestimate the size, whereas a lower level will overestimate it. The
histopathology, of the lesions was not available in any of our studies, and so exact
measurement of lesion sizes was not possible. Fixed windows were not used in
our studies. Adjustment of the window width and level were made by the individual
radiologist to allow better evaluation. The differences can be therefore explained due to the
differences in observers. This limitation is always present in studies that compare various
imaging modalities.103,104 Observers can have different backgrounds, training and
experience. However, this situation is routinely encountered in normal clinical settings in
the decision making process of cases that undergo advanced diagnostic imaging.
Another possible explanation can be the difference in spatial resolution between CT and
MRI. Lower spatial resolution is present in most CT scanners when we use reconstructed
images in the sagittal plane, because of the partial volume effect.98
When assessing cerebellar herniation length, the position of the patient and the timing of
the scan can be important. A previous study105 revealed that the degree of cerebellar
herniation was significantly worse in CKCS with a flexed as opposed to an extended head
position. The flexed position, mimics the normal posture of a dog106. The cerebellum
appears to have more space caudally in dogs with a flexed head position. Furthermore in
dogs diagnosed with CM, 30% have atlanto-occipital overlap (AOO) as cause of
compression of the caudal aspect of the cerebellum 106. AOO seems to increase with neck
extension107.
�143

CHAPTER 6�
Therefore some authors suggest that when imaging of the craniocervical region is requested
both imaging in extension and flexion should be acquired to obtain maximal diagnostic
information108,109 . Also during the cardiac cycle the CHL can vary.110 Previously in, human
medicine, the diagnosis of clinically significant CM was based on the size of cerebellar
herniation, with greater than 3-5mm being significant111. However, a study showed that size
of herniation was not related to clinical signs but to a combination of other factors
including decreased cerebellomedullary cistern volume and decreased cerebrospinal fluid
around the cerebellar tonsils112. Previous veterinary studies have not found an association
between the degree of CH/CHL and either clinical signs and SM in CKCS with CM.
78-80,112-114 The difference in CHL between MR and CT images and the less natural head
position used in our study should therefore have no impact on the clinical signs in CKCS
and syringomyelia (SM). In one study78 a positive correlation was found between foramen
magnum size and cerebellar herniation length. Occipital hypoplasia/ dysplasia and
cerebellar herniation can play a role in the development of syringomyelia in CKCS with
CM among other factors such as differences in parenchyma115,116, changes in cerebrospinal
fluid flow characteristics105,116 cerebellar pulsation92 and abnormal jugular foramina size
leading to venous congestion.117
We can draw the following conclusions regarding the clinical relevance of our study’s
findings. Because CH is consistently identified by different observers on CT and MRI, CT
can be used as an alternative for MRI in certain clinical circumstances. The clinical impact
of the difference in CHL between both modalities must be investigated.
The second study of this second part of this thesis, was a comparative study conducted to
see if there was an agreement between both modalities in detecting syringomyelia, not only
in CKCS but also in other breeds of dogs as well. MRI is again mentioned in several
articles as the preferred modality to visualize changes in the spinal cord and detect SM.
118-122 Human medicine studies that included CT and MRI imaging have shown that MRI is
�144

CHAPTER 6�
more effective for the detection of SM.123,124 In a comparative study between MRI and CT
myelography (CTM) by Deeb et al.125, CTM gave false negative results in 29% of the
patients, whereas MRI was positive in 100% of the cases. CT is not used routinely to
investigate intramedullary changes due to the lesser contrast resolution compared to MRI.
Furthermore, CT images can be distorted due to the surrounding bone (beam hardening
artefact) of the spinal canal.126 The difference between CT and MRI for the detection of SM
was confirmed in our study and reflected in the moderate intramodality agreement.
With regard to the observers themselves, there was a moderate agreement for MRI and
perfect agreement for CT. This can be explained by the difference in experience of the
observers as mentioned previously. For example, truncation artefacts can be mistaken for a
syrinx.127 Truncation artefact, also known as Gibb’s or spectral leakage artefact occurs
when time and frequency domains of data are undersampled at locations of sharp tissue
interfaces, such as the subarachnoidal space and the spinal cord. The data will then become
truncated along the data columns.128 Alternating lines of hyperintensity and hypointensity
on sagittal T2-weighted images may create a longitudinally oriented hyperintense spinal
cord signal. This type of artefact, which is especially common in the cervical spine129, is
ignored when it is seen on only one plane and cannot be confirmed in an orthogonal view.
In our study we used T1WSE and T2WSE images to detect SM. The difference between
T1WSE and T2WSE sequences for the detection of SM was not included in our study.
These sequences are part of a normal imaging protocol of the spine.130 SM is normally
imaged as hypointense compared to CSF on T1WSE and isointense compared to CSF on
T2WSE images.131 Intensity can vary due to the presence of flow.106 Signal void can appear
on T2WSE due to the pulsation of CSF. These occur in spin echo imaging when flowing
protons move so quickly through the selected slice that they are not exposed to both the 90°
excitation radiofrequency (RF) pulse and the 180° refocusing RF pulse. The protons do not
produce a signal, which then appears as a signal void.127 This can be the case in imaging of
SM, which appears as a hypointense signal on the T2WSE images. Furthermore, the fluid
�145

CHAPTER 6�
in the cavities of a syrinx closely resembles cerebrospinal fluid but has a significant lower
protein content. This can cause differences in intensity on the images.105,128
In our study, we used T1WSE images to measure the SW. Measurement of the syrinx on
T2WSE images may result in an overestimation of the size because the borders of the
syrinx are not well demarcated as they can include the hyperintense signal associated with
interstitial oedema.132
In our study, there was a significant mean difference for SW between the transverse and
midsagittal planes in MRI. This difference can be explained by the fact that we chose
midsagittal images based on visualization of the spinous process to assure that the
measurements were made at the maximum diameter of the spinal canal and spinal cord133.
This can be off midline resulting in a different width compared with the transverse images.
Using large slice thickness (4mm) on MRI compared to the spinal cord could also be a
cause of this discrepancy.
There was also a significant mean difference in the midsagittal images between the 2
modalities used in our study. The difference in slice thickness between MRI (= 4 mm) and
CT (= 1.25 mm) can partially explain the difference. When using a small slice thickness on
CT, high quality midsagittal MPR images can be created (see above) that are almost
exactly in the midline.
Overall the repeatability of measurements of SW was the best on the midsagittal T1WSE
images and the reproducibility was the best on midsagittal images of both modalities. When
looking at the 95% repeatability coefficient for the midsagittal images, 95% of consecutive
readings of SW will be within 0.52mm (T1WSE) and 0.60mm (CT). This suggests that the
SW is considered to be wider on CT than on MRI images. The width of a syrinx is
considered as a predictor of pain in symptomatic CKCS.
�146

CHAPTER 6�
Especially large SW and asymmetric distribution of the syrinx affecting the dorsal horn can
be the cause of pain.134,135 A syrinx of > 6.4 mm wide causes clinical signs in 95% of
CKCS.136 In American Brussels Griffon dogs and humans, signs of pain are not well
correlated with the size of the syrinx.137,138 Another study suggests that CKCS can have
clinical signs without the presence of a SM.132
Dogs with CM without SM can experience discomfort and pain possibly due to
a direct compression of the medulla oblongata.139, 140 Keeping this in mind, the difference in
size between both modalities does not influence the diagnosis. This can only have an effect
when considering using CT for screening of CKCS for breeding purposes. A syrinx of 2mm
is considered as a cut-off value for identifying a dilatation of the central canal as a syrinx or
not.141
When combining our last two studies we can conclude, because CH and SM are
consistently identified by different observers on CT and MRI, CT can be used as an
alternative to MRI for CM/SM in CKCS when MRI is not available. Nevertheless CT
cannot replace MRI as the standard screening technique for detecting SM in CKCS for
breeding purposes. In these cases not only the presence of a visible SM is important but
also the detection of a pre-syrinx state should be considered.142,143 Pre-syrinx or interstitial
oedema is the presence of oedema in the spinal cord parenchyma and is considered a
reversible myelopathy that may precede syringomyelia.141 The detection of small dilatations
is also important, as progressive central canal dilatation is a precursor of syrinx formation.
119,144 Our study did not find an association between the detection of small
dilatations and use of technique. To our knowledge no articles have been published where
the detection limit of SM on CT was mentioned.
�147
CHAPTER 6�
The main conclusion of this research work is that when using a CT scanner intracranial
lesions and SM can be identified in most cases on the images. Whereas the detection of CH
is 100%. Therefore, CT can be used as an valuable alternative to MRI if this modality is not
available. This is of great value, because in recent times more and more smaller clinics have
a CT machine but not an MRI available. Nevertheless, these results, should be interpreted
with caution, because not all lesions are seen on CT, and this is of clinical importance.
Further studies must be conducted to see if the differences in CHL and SW between MRI
and CT have a clinical impact. Also other comparison studies between MRI and CT for
identification of other abnormalities associated with CM such as medullary kinking and
ventriculomegaly/hydrocephalus can be of importance.
�148

CHAPTER 6�
References
1. d’Anjou M-A. Principles of computed tomography and magnetic resonance imaging. In:
Thrall DE (ed.). Textbook of veterinary diagnostic radiology, 6th ed. St. Louis (MO):
Saunders, Elsevier; 2013. p. 50–73.
2. Berquist TH, Ehman RL, King BF, et al. Value of MR imaging in differentiating benign
from malignant soft-tissue masses: study of 95 lesions. Am J Roentgenol 1990; 155: 1251–
1255.
3. Couturier L., Degueurce C., Ruel Y. et al. Anatomical study of cranial nerve emergence
and skull foramina in the dog using magnetic resonance imaging and computed
tomography.Vet Radiol Ultrasound 2005; 46: 375-383.
4. Gomes E., Degueurce C., Ruel Y. et al. Anatomic study of cranial nerve emergence and
associated skull foramina in cats using CT and MRI. Vet Radiol Ultrasound 2009; 50:
398-40
5. Mihaljevik M., Kramer M. & Gomercic H. 2009, CT und MRT atlas:
Transversalanatomie des Hundes, Parey, Singhofen, Germany.
6. Assheuer J. & Sager M., 1997, MRI and CT atlas of the dog, Blackwell Wissenshaft,
Berlin, Germany.
7. De Decker S., Gielen I.M., Duchateau L. et al. Agreement and repeatability of linear
vertebral body and canal measurements using computed tomography (CT) and low field
magnetic resonance imaging (MRI). Vet Surg 2010; 39: 28-34.
8. Morozumi M., Miyahara K., Sato M. et al. Computed tomography and magnetic
resonance findings in two dogs and a cat with intracranial lesions. J Vet Med Sci 1997; 59:
807-810.
9. Gonzalo-Orden J.M., Altónaga J.R., Orden M.A. et al. Magnetic resonance, computed
tomographic and radiologic findings in a dog with discospondylitis. Vet Radiol Ultrasound
2000; 41: 142-144.
�149

CHAPTER 6�
10. Auriemma E., Barthez P.Y., van der Vlugt-Meijer R.H. et al. Computed tomography and
low-field magnetic resonance imaging of the pituitary gland in dogs with pituitary-
dependent hyperadrenocorticism: 11 cases (2001-2003). J Am Vet Med Assoc 2009; 235:
409-414.
11. Okada M., Kitagawa M., Nagasawa A. et al. Magnetic resonance imaging and computed
tomography findings of vertebral osteosarcoma in a cat. J Vet Med Sci 2009; 71: 513-517.
12. De Decker S., Gielen I.M., Duchateau L. et al. Intraobserver, interobserver, and
intermethod agreement for results of myelography, computed tomography-myelography,
and low-field magnetic resonance imaging in dogs with disk-associated wobbler syndrome.
J Am Vet Med Assoc 2011; 238: 1601-1608.
13. Cooper J.J., Young B.D., Griffin J.F. 4th et al. Comparison between noncontrast
computed tomography and magnetic resonance imaging for detection and characterization
of thoracolumbar myelopathy caused by intervertebral disk herniation in dogs. Vet Radiol
Ultrasound 2014; 55: 182-189.
14. Martin-Vaquero P., da Costa R.C., Drost W.T. Comparison of noncontrast computed
tomography and high-field magnetic resonance imaging in the evaluation of Great Danes
with cervical spondylomyelopathy. Vet Radiol Ultrasound 2014; 55: 496-505.
15. Thomas WB, Wheeler JS, Kramer R, et al. Magnetic resonance imaging features of
primary brain tumors in dogs. Vet Radiol Ultrasound 1996; 37: 20–27.
16. Gavin PR, Fike JR, Hoopes PJ. Central nervous system tumors. Semin Vet Med Surg
(Small Anim) 1995; 10: 180– 189.
17. Snyder J.M., Shofer F.S., Van Winkle T.J. et al. Canine intracranial primary neoplasia:
173 Cases (1986–2003). J Vet Int Med 2006; 20/ 669–675.
18. Brant-Zawadzki M, Badami JP, Mills CM, et al. Primary intracranial tumor imaging: a
comparison of magnetic resonance and CT. Radiology 1984;150: 435–440.
19. Bradley WG, Waluch V, Yadley RA, et al. Comparison of CT and MR in 400 patients
with suspected disease of the brain and cervical spinal cord. Radiology 1984;152: 695–702.
�150
CHAPTER 6�
20. Deck M. D., Henschke C., Lee B.C et al. Computed tomography versus magnetic
resonance imaging of the brain. A collaborative interinstitutional study. Clin Imaging 1989;
13:2-15.
21. Chang KH, Han MC, Kim CW. Magnetic resonance imaging in neurological diseases—
comparison with computed tomography. J Korean Med Sci 1987;2 :53–63.
22. Whiting P., Rutjes A.W, Dinnes J. et al. Development and validation of methods for
assessing the quality of diagnostic accuracy studies. Health Technol Assess 2004; 8: 1-234.
23. Imhof H, Rand T, Trattnig S, Kramer J. Basics of MRI technique and MRI
image interpretation. Orthopade 1994;23:300-305
24. Hecht S., Adams W.H. MRI of brain disease in veterinary patients part 1: Basic
Principles and Congenital Brain disorders.Vet Clin North Am Small Anim Pract 2010;
40: 21-38.
25. Benigni L., Lamb C.R. Comparison of fluid-attenuated inversion recovery and T2-
weighted magnetic resonance images in dogs and cats with suspected brain disease. Vet
Radiol Ultrasound 2005; 46: 287-292.
26. Cherubini G.B., Platt S.R., Anderson T.J. et al. Characteristics of magnetic resonance
images of granulomatous meningoencephalomyelitis in 11 dogs. Vet Rec 2006; 159:110–
115.
27. Cherubini G.B., Platt S.R., Howson S. et al. Comparison of magnetic resonance
imaging sequences in dogs with multi-focal intracranial disease. J Small Anim Pract 2008;
49: 634-640.
28. Robertson I. Optimal magnetic resonance imaging of the brain.Vet Radiol Ultrasound
2011; 52(1 Suppl 1):S15-22.
29. Wall S.D., Brant-Zawadski M,. Jeffrey R.B. et al. High-frequency CT findings within
24 hours after cerebral infarction. Am J Roentgenol 1982; 138: 307-311.
30. McConnell J.F., Garosi L., Platt S.R. Magnetic resonance imaging findings of presumed
cerebellar cerebrovascular accident in twelve dogs. Vet Radiol Ultrasound 2005; 46: 1-10.
�151
CHAPTER 6�
31. Beauchamp N.J. Jr, Barker P.B., Wang P.Y. et al. Imaging of acute cerebral ischaemia.
Radiology 1999, 212: 307-324.
32. Hoggard N., Wilkinson I.D., Paley M.N. et al. Imaging of haemorrhagic stroke. Clin
Radiol 2002; 57, 957–968.
33. Heiland S. Diffusion- and perfusion-weighted MR imaging in acute stroke: principles,
methods, and applications. Imaging Decisions MRI 2003; 7, 4–12.
34. Brant-Zawadzki M, Periera B, Weinstein P. MR Imaging of acute experimental
ischaemia in cats. Am J Neuroradiol 1986; 7: 7-11.
35. Mayer T.E., Schulte-Altedorneburg G., Droste D.W. Serial CT and MRI of ischaemic
cerebral infarcts: frequency and clinical impact of haemorrhagic transformation.
Neuroradiology 2000; 42: 233-239.
36. Paul A.E.H, Lenard Z., Mansfield C.S. Computed tomography diagnosis of eight dogs
with brain infarction. Aust Vet J 2010: 88; 374-380.
37. Kuriashkin IV, Losonsky JM. Contrast enhancement in magnetic resonance
imaging using inravenous contrast media; a review. Vet Radiol Ultrasound
2000;41:4-7.
38. Joslyn S, Sullivan M, Novellas R et al. Effect of delayed acquisition times on
gadolinium-enhanced magnetic resonance imaging of the presumably normal
canine brain. Vet Radiol Ultrasound 2011; 52:611-618.
39. Merhof K., Lang J., Dürr S. et al. Use of contrast-enhanced fluid-attenuated inversion
recovery sequence to detect brain lesions in dogs and cats. J Vet Intern Med 2014;
28:1263-1267.
40. Schorner W., Laniado M., Niendorf H.P. et al. Time-dependent changes in image-
contrast in brain-tumors after Gadolinium-DTPA. Am J Neuroradiol 1986; 7:1013-1020.
41. Pronin I.N., McManus K.A., Holodny A.I. et al. Quantification of dispersion of Gd-
DTPA from the initial area of enhancement into the peritumoral zone of edema in brain
tumors. J Neurooncol 2009; 94: 399-408.
�152

CHAPTER 6�
42. Mathews V.P., Caldemeyer K.S., Ulmer J.L. et al. Effects of contrast dose, delayed
imaging, and magnetization transfer saturation on gadolinium-enhanced MR imaging of
brain lesions. J Magn Reson Imaging, 1997; 7:14-22.
43. Wolff C.A., Holmes S.P., Young B.D. et al. Magnetic resonance imaging for the
differentiation of neoplastic, inflammatory, and cerebrovascular brain disease in dogs. J Vet
Intern Med 2012; 26:589-597.
44. Cherubini G.B., Mantis P,. Martinez T.A. Utility of magnetic resonance imaging for
distinguishing neoplastic from non-neoplastic brain lesions in dogs and cats. Vet Radiol
Ultrasound 2005; 46: 384-387.
45. Cervera V., Mai W., Vite C.H. Comparative magnetic resonance imaging findings
between gliomas and presumed cerebrovascular accidents in dogs. Vet Radiol Ultrasound
2011; 52: 33-40.
46. Vite C.H., Cross J.R. Correlating magnetic resonance findings with neuropathology and
clinical signs in dogs and cats. Vet Radiol Ultrasound 2011;52(1 Suppl 1):S23–S31.
47. Young B.D., Fosgate G.T., Holmes S.P. et al. Evaluation of standard magnetic
resonance characteristics used to differentiate neoplastic, inflammatory, and vascular brain
lesions in dogs. Vet Radiol Ultrasound 2014; 55: 399-406.
48. Bittermann S., Lang J., Henke D. et al. Magnetic resonance imaging signs of presumed
elevated intracranial pressure in dogs. Vet J 2014; 201: 101-108.
49. Ives E.J, Rousset N., Heliczer N. et al.
Exclusion of a brain lesion: is intravenous contrast administration required after normal
precontrast magnetic resonance imaging? J Vet Intern Med 2014;28:522-528.
50. Lacombe V.A., Sogaro-Robinson C., Reed S.M. Diagnostic utility of computed
tomography imaging in equine intracranial conditions. Equine Vet J 2010; 42: 393-399.
51. Lamb C.R., Croson P.J., Cappello R. et al. Magnetic resonance imaging findings in 25
dogs with inflammatory cerebrospinal fluid. Vet Radiol Ultrasound 2005; 46: 17-22
�153
CHAPTER 6�
52. Rodenas S., Pumarola M., Gaitero L. Magnetic resonance imaging findings in 40 dogs
with histologically confirmed intracranial tumours. Vet J 2011; 187: 85-91.
53. Kraft SL, Gavin PR, DeHaan C. Retrospective review of 50 canine intracranial tumours
evaluated by magnetic resonance imaging. J Vet Intern Med 1997; 11: 218-225.
54. Singh J.B., Oevermann A., Lang J. Contrast media enhancement of intracranial lesions
in magnetic resonance imaging does not reflect histopathologic findings consistently.
Vet Radiol Ultrasound 2011; 52: 619-626.
55. Möstrum U., Ytterbergh C. Artifacts in computed tomography of the posterior fossa: a
comparative phantom study. J Comput Assist Tomogr 1986; 10: 560-566.
56. Rozeik C,. Kotterer O., Preiss J. Cranial CT artifacts and gantry angulation.
J Comput Assist Tomogr 1991; 15: 381-386.
57. Bellon EM, Haacke EM, Coleman PE, Sacco DC, Steiger DA, Gangarosa RE. MR
artifacts: a review. Am J Roentgenol 1986;147: 1271– 1281.
58. Barrett J.F., Keat N. Artifacts in CT: Recognition and Avoidance. Radiographics 2004;
24:1679-1691.
59. Hathcock J.T., Stickle R.L. Principles and concepts of computed tomography
Vet Clin North Am Small Anim Pract 1993; 23: 399-415.
60. Morozumi M., Miyahara K., Sato M. Computed tomography and magnetic resonance
findings in two dogs and a cat with intracranial lesions. J Vet Med Sci 1997: 59; 807-810.
61. Taeymans O, Schwarz T, Duchateau L, et al. Computer tomographic features of the
normal canine thyroid gland. Vet Radiol Ultrasound 2008;49:13–19.
62. McNitt-Gray M.F., Kim G.H., Zhao B. et al. Determining the Variability of Lesion Size
Measurements from CT Patient Data Sets Acquired under “No Change” Conditions
Transl Oncol 2015; 8: 55–64.
63. Mihara F, Hirakata R, Hasuo K, et al. Gd-DTPA administered MR imaging of
intracranial mass lesions: a comparison with CT and precontrast MR. Radiat Med
1989;7:227–235.
�154
CHAPTER 6�
64. Chavhan G.B. MRI Made Easy (for beginners). 2nd ed 2013. Jaycee Brothers Medical
Publishers Ltd., New Delhi, India.
65. Konar M., Lang J. Pros and cons of low-field magnetic resonance imaging in veterinary
practice. Vet Radiol Ultrasound 2011; 1: S1-S14.
66. Orrison W.W. , Stimac G.K. , Stevens E.A. et al. Comparison of CT, low-field-strength
MR imaging, and high-field-strength MR imaging. Radiology 1991; 181: 121–127.
67. Merl T., Scholz M. ,Gerhardt O. et al. Results of a prospective multicenter study for
evaluation of the diagnostic quality of an open whole-body low-field MRI unit. A
comparison with high-field MRI measured by the applicable gold standard. Eur J Radiol
1999; 30: 43–53.
68. Blasiak B., Volotovskyy V. , Deng C. et al. A comparison of MR imaging of a mouse
model of glioma at 0.2 T and 9.4 T. J Neurosci Met 2012; 204: 118-123.
69. Joseph PM. Principles of image formation. In: Atlas SW, ed. Magnetic resonance
imaging of the brain and spine, 2nd ed. Philadelphia: Lippincott- Raven, 1996:46–63
70. Hendrick RE. Image contrast and noise. In: Stark DD, Bradley WG, eds. Magnetic
resonance imaging, 3rd ed. St. Louis: Mosby, 1999:43–67
71. Kalender WA. Thin section three-dimensional spiral CT: is isotropic imaging possible?
Radiology 1995; 197: 578–580.
72. van der Vlugt-Meijer R.H. , Meij B.P., Voorhout G. Thin-slice three-dimensional
gradient-echo magnetic resonance imaging of the pituitary gland in healthy dogs Am J Vet
Res 2006; 67: 1865-1872.
73. Filippi M, Yousry T, Horsfield M, et al. A high-Resolution three- dimensional T1-
weighted gradient echo sequence improves the detection of disease activity in multiple
sclerosis. Ann Neurol 1996; 40:901–907
74. Stadnik T, Stevenaert A, Beckers A, et al. Pituitary microadenomas: diagnosis with two-
and three-dimensional MR imaging at 1.5 T before and after injection of gadolinium.
Radiology 1990; 176:419–428.
�155
CHAPTER 6�
75. Taghipour Z., Rezaei S., Dehghani F. Evaluation of diagnostic value of CT scan and
MRI in brain tumors and comparison with biopsy. Iran J Ped Hematol Oncol 2011;
1:121-125.
76. Le T.H., Gean A.D. Neuroimaging of traumatic brain injury. Mt Sinai J Med 2009; 76:
145-162. J Vet Intern Med 2014; 28:1165-85.
77. Carrera I., Dennis R., Mellor DJ. et al. Use of magnetic resonance imaging for
morphometric analysis of the caudal cranial fossa in Cavalier King Charles Spaniels. Am J
Vet Res 2009; 70: 340-345.
78. Cerda-Gonzales S., Olby N.J., Mccullough S. et al. Morphology of the caudal fossa in
Cavalier King Charles Spaniels. Vet Radiol Ultrasound 2009; 50: 37-46.
79. Lu D., Lamb CR., Pfeiffer DU. Et al. Neurological signs and results of magnetic
resonance imaging in 40 Cavalier King Charles Spaniels with Chiari type 1-like
malformation. Vet Rec 2003; 153: 260-263.
80. Cross H.R., Cappello R., Rusbridge C. Comparison of cerebral cranium volumes
between Cavalier King Charles Spaniels with Chiari-like malformation, small breed dogs
and Labradors. J Small Anim Pract 2009; 50: 399-405.
81. Harcourt-Brown T.R., Campbell J., Warren-Smith C. et al. Prevalence of Chiari-like
malformations in clinically unaffected dogs. J Vet Intern Med 2015; 29: 231-237.
82. Goel A, Bhatjiwale M, Desai K. Basilar invagination: a study based on 190 surgically
treated patients. J Neurosurg 1998; 88: 962-8.
83. Botelho R.V., Neto E.B., Patriota G.C. et al. Basilar invagination: craniocervical
instability treated with cervical traction and occipitocervical fixation. Case report. J
Neurosurg Spine 2007; 7: 444-449.
84. García-Real I., Kass P.H., Sturges B.K. et al. Morphometric analysis of the cranial
cavity and caudal cranial fossa in the dog: a computerized tomographic study. Vet Radiol
Ultrasound 2004; 45: 38-45.
�156
CHAPTER 6�
85. Schmidt M.J., Biel M., Klumpp S. et al. Evaluation of the volumes of cranial cavities in
Cavalier King Charles Spaniels with Chiari-like malformation and other brachycephalic
dogs as measured via computed tomography. Am J Vet Res 2009; 70: 508-512.
86. Marino D.J., Loughin C.A., Dewey C.W. et al. Morphometric features of the
craniocervical junction region in dogs with suspected Chiari-like malformation determined
by combined use of magnetic resonance imaging and computed tomography. Am J Vet Res
2012; 73:105-111.
87. Walmsley G.L., Herrtage M.E., Dennis R. et al. The relationship between clinical signs
and brain herniation associated with rostrotentorial mass lesions in the dog. Vet J 2006;
172: 258-64.
88. Zacharia T.T., Nguyen D.T.D. Subtle pathology detection with multidetector row
coronal and sagittal CT reformations in acute head trauma. Emery Radiol 2010; 17: 97-102.
89. Drees R., Dennison S.E., Keuler N.S. et al. Computed tomographic imaging protocol
for the canine cervical and lumbar spine. Vet Radiol Ultrasound 2009; 50: 74-79.
90. Zarelli M., Schwarz T., Puggioni A. et al.An optimized protocol for multislice computed
tomography of the canine brain. Vet Radiol Ultrasound 2014; 55: 387-392.
91. Kornegay J.N., Oliver J.E. Jr., Gorgacz E.J. et al. Clinicopathologic features of brain
herniation in animals. J Am Vet Med Assoc 1983; 182: 1111–1116.
92. Walmsley G.L., Herrtage M.E., Dennis R. et al. The relationship between clinical signs
and brain herniation associated with rostrotentorial mass lesions in the dog. Vet J
2006;172:258-264.
93. R.S. Bagley Pathophysiologic sequelae of intracranial disease. Vet Clin North Am Small
Anim Pract 1996; 26: 711–733.
94. Okada M., Kitagawa M., Ito D. et al. MRI of secondary cervical syringomyelia in
four cats. J Vet Med Sci 2009; 71: 1069–1073.
�157

CHAPTER 6�
95. Thompson D.N., Harkness W., Jones B.M. et al. Aetiology of herniation of the
hindbrain in craniosynostosis. An investigation incorporating intracranial pressure
monitoring and magnetic resonance imaging. Pediatr Neurosurg 1997; 26: 288–295.
96. Wamsley, H. & Alleman A.R. Chapter 3: Clinical pathology. In: BSAVA Manual of
Canine and Feline Neurology, 3rd ed. (S. R. Platt and N. J. Olby, eds). Gloucester: British
Small Animal Veterinary Association. 2004 p. 35–53.
97. Etienne A.L., Audigié F., Peeters D. et al. Ultrasonographic percutaneous anatomy of
the atlanto-occipital region and indirect ultrasound-guided cisternal puncture in the dog and
the cat. Anat Histol Embryol 2015; 44: 92-98.
98. Schmidt M.J., Wigger A., Jawinski S. et al. Ultrasonographic appearance of the
craniocervical junction in normal brachycephalic dogs and dogs with caudal occipital
(Chiari-like) malformation. Vet Radiol Ultrasound 2008; 49: 472-476.
99. da Costa R.C., Echandi R.L., Beauchamp D. Computed tomography myelographic
findings in dogs with cervical spondylomyelopathy. Vet Radiol Ultrasound 2012; 53:
64-70.
100. Dennison S.E., Drees R., Rylander H. et al. Evaluation of different computed
tomography techniques and myelography for the diagnosis of acute canine myelopathy. Vet
Radiol Ultrasound 2010; 51: 254-8.
101. Auriemma E., Voorhout G., Barthez P.Y. Determination of optimal window width and
level for measurement of the canine pituitary gland height on computed tomographic
images using a phantom. Vet Radiol Ultrasound 2007; 48:113-117.
102. Baxter B.S., Sorenson J.A. Factors affecting the measurement of size and CT number
in computed tomography. Invest Radiol 1981; 16: 337-341.
103. Martin-Vaquero P., da Costa R.C., Drost W.T. Comparison of noncontrast computed
tomography and high-field magnetic resonance imaging in the evaluation of Great Danes
with cervical spondylomyelopathy. Vet Radiol Ultrasound 2014; 55: 496-505.
�158

CHAPTER 6�
104. Leclerc M.K., d'Anjou M.A., Blond L. Interobserver agreement and diagnostic
accuracy of brain magnetic resonance imaging in dogs. J Am Vet Med Assoc 2013; 242:
1688-1695.
105. Upchurch J.J. , McGonnell I.M. , Driver C.J. et al. Influence of head positioning on
the assessment of Chiari-like malformation in Cavalier King Charles spaniels Vet Rec 2011;
169: 277.
106. Cerda-Gonzalez S. Olby N.J., Broadstone R. et al. Characteristics of cerebrospinal
fluid flow in Cavalier King Charles Spaniels analyzed using phase velocity cine magnetic
resonance imaging. Vet Radiol Ultrasound 2009; 50: 467-476.
107. Loughin C.A., Marino D.J. Atlantooccipital Overlap and Other Craniocervical
Junction Abnormalities in Dogs. Vet Clin North Am Small Anim Pract 2015 Nov 26 [Epub
ahead of print]
108. Cerda-Gonzalez S., Dewey C.W. Scrivani P.V. et al. Imaging features of atlanto-
occipital overlapping in dogs. Vet Radiol Ultrasound 2009; 50: 264-268.
109. Cerda-Gonzalez S., .J., Griffith E.H. Dorsal compressive atlantoaxial bands and the
craniocervical junction syndrome: association with clinical signs and syringomyelia in
mature cavalier King Charles spaniels. J Vet Intern Med 2015; 29: 887-892.
110. Driver C.J., Watts V., Bunck A.C. et al. Assessment of cerebellar pulsation in dogs
with and
without Chiari-like malformation and syringomyelia using cardiac-gated cine magnetic
resonance imaging. Vet J 2013; 198: 88-91.
111. Milhorat T.H., Chou M.W., Trinidad E.M. etaL. Chiari I malformation redefined:
clinical and radiographic findings for 364 symptomatic patients. Neurosurgery.
1999;44:1005-1017.
112. Levine D.N. The pathogenesis of syringomyelia associated with lesions at the foramen
magnum: a critical review of existing theories and proposal of a new hypothesis. J Neurol
Sci 2004;220:3-21.
�159

CHAPTER 6�
113. Driver C.J., Volk H.A., Rusbridge C., Van Ham L.M. An update on the pathogenesis of
syringomyelia secondary to Chiari-like malformations in dogs. Vet J 2013;198:551-559.
114. Parker J.E., Knowler S.P., Rusbridge C. et al. Prevalence of asymptomatic
syringomyelia in Cavalier King Charles spaniels. Vet Rec 2011;168:667.
115. Shaw T.A., McGonnell I.M., Driver C.J.Caudal cranial fossa partitioning in Cavalier
King Charles spaniels. Vet Rec 2013; 172:341?
116. Driver C.J., Rusbridge C., Cross H.R. Relationship of brain parenchyma within the
caudal cranial fossa and ventricle size to syringomyelia in cavalier King Charles spaniels. J
Small Anim Pract 2010; 51: 382-386.
117. March P.A., Abramson C.J., Smith M. CSF flow abnormalities in caudal occipital
malformation syndrome. J Vet Intern Med 2005; 19:414.
118. Schmidt M.J., Ondreka N., Sauerbrey M. Volume reduction of the jugular foramina in
Cavalier King Charles Spaniels with syringomyelia. BMC Vet Res 2012; 8:158.
119. Rusbridge C., Greitz D., Iskandar B.J. Syringomyelia: Current Concepts in
Pathogenesis, Diagnosis, and Treatment. J Vet Intern Med 2006;20:469-479.
120. Rusbridge C., Carruthers H., Dubé M.P. et al. Syringomyelia in Cavalier King Charles
spaniel: the relationship between syrinx dimensions and pain. J Small Anim Pract
2007;48:432-436.
121. Couturier J., Rault D., Cauzinille L. Chiari-like malformation and syringomyelia in
normal Cavalier King Charles spaniels: a multiple diagnositic imaging approach. J Small
Anim Practice 2008; 49:438-443.
122. Kirberger R.M., Jacobson L.S., Davies J.V. et al. Hydromelia in the dog. Vet Radiol
Ultrasound 1997;39:30-38.
123. González G.I., Escudero M.J.C., Blanco A.M. et al. Syringomyelia: diagnostic value
of magnetic resonance and computed tomography in 5 cases. Rev Clin Esp
1991;188:138-141.
�160

CHAPTER 6�
124. Tashiro K., Fukazawa T., Moriwaka F. et al. Syringomyelic syndrome: clinical
features in 31 cases confirmed by CT myelography or magnetic resonance imaging. J
Neurol 1987;235:26-30.
125. Deeb Z.L., Daffner R.H., Rothfus W.E. et al. Syringomyelia: myelography, computed
tomography, and magnetic resonance imaging. J Comput Tomogr 1988;12:1-8.
126. Klekamp J., Samii M. Syringomyelia: Diagnosis and Management, firts edn. Springer,
Berlin; 2002: 195.
127. Bou-Haider P., Peduto A.J., Karunaratne N. Differential diagnosis of T2
hyperintense spinal cord lesions: Part A. J Med Imaging Radiat Oncol 2009;52:535-543.
128. Aibinu A.M., Salami M.J., Shafie A.A. et al. MRI reconstruction using discrete Fourier
trans- form: a tutorial. Int J Comp Sci 2008; 42:179–185
129. Hakky M., Pandey S., Kwak E. et al.
Application of basic physics principles to clinical neuroradiology: differentiating artifacts
from true pathology on MRI. AJR Am J Roentgenol. 2013;201:369-77.
130. Dennis R. Optimal magnetic resonance imaging of the spine. Vet Radiol Ultrasound
2011; 52(1 Suppl 1):S72-80.
131. Enzmann DR (1991) Imaging of syringomyelia. In: Batzdorf U (ed) Syringomyelia.
Williams and Wilkins, Baltimore.
132. Loderstedt S., Benigni L., Chandler K. Distribution of syringomyelia along the entire
spinal cord in clinically affected Cavalier King Charles Spaniels. Vet J 2011;190:359-363.
133. Hecht S., Huerta M.M. , Reedand B.R. et al. Magnetic Resonance Imaging (MRI)
Spinal Cord and Canal Measurements in Normal Dogs Anat Histol Embryol 2014; 43: 36–
41.
134. Rusbridge C., Carruthers H., Dubé M.P. et al. Syringomyelia in Cavalier King Charles
spaniel: the relationship between syrinx dimensions and pain. J Small Anim Pract
2007;48:432-436.
�161
CHAPTER 6�
135. Hu H.Z, Rusbridge C., Constantino-Casas F et al. Histopathological investigation of
syringomyelia in the Cavalier King Charles spaniel. J Comp Pathol 2012;146: 192-201.
136. Kitagawa M., Ueno H., Watanabe S. et al. Clinical improvement in two dogs with
hydrocephalus and syringohydromyelia after ventriculoperitoneal shunting. Aus Vet J
2008;86:36-42.
137. Freeman A.C., Platt S.R. Kent M. et al. Chiari-Like Malformation and Syringomyelia
in American Brussels Griffon Dogs. J Vet Intern Med 2014;28:1551-1559.
138. Todor D.R., Harrison T.M., Millport T.H. Pain and syringomyelia: A review.
Neurosurg Focus 2008;8:1-6.
139. C. Rusbridge, N.D. Jeffery Pathophysiology and treatment of neuropathic pain
associated with syringomyelia Vet J 2006; 175: 164–172.
140. F.R. Taylor, M.V. Larkins Headache and Chiari i malformation: clinical presentation,
diagnosis, and controversies in management. Current Pain and Headache Reports 2002;
6:331–337.
141. Capello R., Rusbridge C. Report from the Chiari-like malformation and
syringomyelia working group round table. Vet Surg 2007;36:509-512.
142. Fishbein N.J., Dillon W.P., Cobbs C. et al. The “Presyrinx” State: A reversible
Myelopathic Condition That May Precede Syringomyelia. Am J Neuroradiol 1999;20:7-20.
143. Akiyama Y., Koyanagi I., Yoshifuji I. et al. Interstitial spinal-cord oedema in
syringohydromyelia associated with Chiari type 1 malformations. J Neurol Neurosur Ps
2008;79:1153-1158.
144. Driver C.J., De Risio L., Hamilton S. et al. Changes over time in craniocerebral
morphology and syringomylia in cavalier King Charles spaniels with Chiari-like
malformation. BMC Vet Res 2012;8:215.
�162

SUMMARY�
�163
Summary

SUMMARY�
�164
SUMMARY�
Magnetic resonance imaging (MRI) and computed tomography (CT) are both advanced
cross- sectional imaging techniques that can be used in the diagnostic workup of a
veterinary neurology patient. MRI is generally considered as the imaging modality of
choice in imaging of the brain and the spinal cord because of the better soft tissue contrast
than CT. MRI provides both anatomical and physiological information in multiple planes.
CT is mostly used to visualize bone lesions and is used complimentary to MRI in a lot of
cases. It is important to be aware of the possibilities and limitations of both techniques. The
general aim of this thesis is to evaluate if CT can be used as an alternative to MRI in
visualizing lesions of the brain and cervical spinal cord.
The first chapter provides an insight in the key differences between MRI and CT. Also an
overview of the published literature regarding the use of both modalities in imaging of
lesions of the brain and the spinal cord is given.
The scientific aims of this work are presented in the second chapter. The first aim of this
research project was to see if there was an agreement between low-field MRI and CT in the
detection of suspected intracranial lesions in dogs and cats. The second aim was to
determine if there was an agreement between low-field MRI and multislice CT for the
detection of specific brain and cervical spine abnormalities. Can CT be used as an
alternative to MRI for the detection of cerebellar (foramen magnum) herniation in Cavalier
King Charles Spaniels and cervical syringomyelia in dogs?
In the third chapter CT and MRI images of 51 dogs and 7 cats were reviewed by 2
experienced radiologists. During this prospective study, dogs and cats with a suspected
intracranial lesion, who underwent MRI of the brain as part of their diagnostic workup,
were also subjected to a CT exam. A low-field MRI and single-slice CT scanner were used.
This was conducted during a predetermined interval in a 2-year-period.
�165

SUMMARY�
The MRI and CT studies were blinded and the presence or absence of an intracranial lesion
was noted. When present, the pattern, localization, aspect of the margins, pre- and
postcontrast size and the presence and pattern of enhancement were evaluated. Agreement
between both modalities for the detection of intracranial lesions and their characteristics
were calculated statistically. There was a substantial agreement (79%, k = 0.72) between
both modalities for the presence of a intracranial lesion. In 30 out of 38 patients,
intracranial lesions were detected both on CT and MRI images. Lesions that were
undetectable on CT were defined as suspected infarctions, oedema or diffuse inflammatory
lesions. This discrepancy may be clinically relevant and suggest that MRI is more reliable
for detecting lesions than CT. Once a lesion is detected, CT and MRI may be considered
concordant for the most diagnostically important imaging characteristics (perfect agreement
(k = 1) for the presence of mass effect and contrast medium enhancement). Analysis of
lesion dimensions indicated that CT and MRI findings did not agree well. Overall lesion
dimensions were larger on CT than on MRI images. The limits of agreement for all
measurements revealed that the range of the differences between CT and MRI images was
close to or larger than 2 cm. The lesion dimensions may direct treatment, and the poor
agreement between CT and MRI may thus be clinically relevant. Poor agreement was also
present for the lesion margins (k = 0.37) and pattern of contrast enhancement. Substantial to
almost perfect agreement was found for lesion localization, except for lesions located in the
temporal lobe (k = 0.53) and the brainstem (k = 0.38). All lesions seen in the pyriform lobe
on MRI were not identified on CT. This highly variable agreement between both modalities
for the localization of lesions could again influence diagnosis. In view of the clinical
importance of intracranial disease, the degree of disagreement between CT and MRI for
detection of intracranial lesions should be regarded as clinically relevant, even though k
values indicated substantial agreement. Once a lesion is detected on CT, MRI may be
considered concordant for the most diagnostically important imaging characteristics (i.e.
mass effect and contrast agent enhancement).
�166

SUMMARY�
Overall we can conclude that MRI remains the modality of choice for intracranial lesions
but CT can be used as a valuable alternative when MRI is not available.
In the fourth chapter the objective was to investigate whether there was an agreement
between low-field MRI and multislice CT for the detection of cerebellar (foramen magnum)
herniation in Cavalier King Charles Spaniels (CKCS). For this retrospective study, CKCS
were chosen because of their high prevalence of Chiari-like malformation. Indention and
herniation of the cerebellum are key diagnostic features for the diagnosis of Chiari-like
malformation. Included in the study were 15 CKCS, who underwent both MRI and CT
studies of the brain and cranial cervical spine in their diagnostic workup. A low-field MRI
and multislice CT scanner were used for the imaging. The MRI and CT studies were
blinded. On midsagittal TW1SE and TW2SE images and midsagittal pre- and postcontrast
2D multiplanar reformatted CT images the presence of cerebellar herniation (CH) was
noted. If present, cerebellar herniation length (CHL, mm) was measured. Agreement
between both modalities for the detection of CH and the interobserver and intermethod
agreement for CHL were calculated statistically. There was perfect agreement between both
observers for the presence of CH. There was no significant difference in MRI and CT for
the measurement of CHL. Overall the length of CH was greater on CT. We can conclude
that, because no known association has been found in other studies between CHL and
clinical signs in CKCS, CT can be used as an alternative to MRI when not available. Also
CT can be used to confirm or rule out CH in other situations such as when considering a
cisternal puncture for cerebral spinal fluid collection or cisternal injection for
myelography. But when considering CT for the screening of CKCS for breeding purposes,
MRI is still the standard technique because of the ability to evaluate the spinal cord itself.
�167
SUMMARY�
The objective of the fifth chapter was to investigate whether there was an agreement
between low-field MRI and multislice CT for the detection of cervical syringomyelia in
dogs. This retrospective study included 32 dogs who underwent (as part of their diagnostic
workup) both MRI and CT studies of the cervical region. A low-field MRI and multislice
CT scanner were used for the imaging. Images were blinded and two experienced
radiologists noted the presence of syringomyelia (SM) during evaluation of the images.
When present, the maximal dorsoventral syrinx width (SW) was measured on transverse
and midsagittal T1WSE MR images and pre- and postcontrast CT images. Statistical
analyses were divided in two parts: the agreement for a presence or absence of SM and
agreement on the SW between both observers and modalities. For the presence of SM there
was a moderate interobserver agreement for MR (81%, k = 0.54) and an almost perfect
agreement for CT (94%, k = 0.87). There was a moderate intraobserver intermodality
agreement for both observers (observer 1: 81% k = 0.59; observer 2: 81% k = 0.57). The
images of patients who had SM on both modalities (17 out of 35) were included in the
second part of the study. For measurement of SW repeatability was the best on the
midsagittal T1WSE images and reproducibility was the best on midsagittal images in both
modalities. Overall we can conclude that SM can be consistenly identified by different
observers on CT and on MRI. When a syrinx is identified the SW is best measured on
midsagittal images. CT can be used as an diagnostic tool and alternative to MRI when this
technique is not readily available.
The sixth and last chapter includes the general discussion and conclusions. When using
CT, intracranial lesions and SM can be identified on the images in most cases. Whereas the
detection of CH is 100% on the images. Although MRI remains the modality of choice in
visualizing lesions of the brain and the cervical spine, CT can be used as an alternative to
MRI. This is of great value because in recent times, more and more smaller clinics have a
CT machine and not a MRI available.
�168

SUMMARY�
These results, however, should be interpreted with caution because not all lesions are seen
on CT and this is of clinical importance. Further studies have to be conducted to see if the
difference in CHL and SW between MRI and CT have a clinical impact. Also other
comparison studies between MRI and CT for identification of other abnormalities
associated with CM such as medullary kinking and ventriculomegaly/hydrocephalus can be
of importance.
-
�169

SUMMARY�
�170

SAMENVATTING�
�171
Samenvatting

SAMENVATTING�
�172

SAMENVATTING�
Magnetische resonantie (MR) en computer tomografie (CT) zijn beeldvormingstechnieken
die beide kunnen gebruikt worden in de diagnostiek van dieren met neurologische klachten.
Omwille van het betere weke delen contrast wordt MR (in tegenstelling tot CT) algemeen
aanzien als de techniek bij uitstek om hersenen en ruggenmerg in beeld te brengen. Met
MR kan men informatie verkrijgen over de anatomie en fysiologie van een letsel en dit in
verschillende anatomische vlakken (transversaal, dorsaal en sagittaal). CT wordt vooral
gebruikt om botstructuren in beeld te brengen. In de meeste gevallen is deze techniek een
aanvulling op MR. Het is belangrijk om op de hoogte te zijn van de mogelijkheden en
beperkingen van beide beeldvormingstechnieken. Doelstelling van dit doctoraat is nagaan
of CT een volwaardig alternatief is voor MR voor het visualiseren van letsels in de
hersenen en het cervicaal ruggenmerg.
Het eerste hoofdstuk geeft een overzicht van de belangrijkste verschillen tussen MR en
CT. Er wordt tevens een overzicht gegeven van de bestaande literatuur over het gebruik van
beide technieken om letsels van hersenen en ruggenmerg in beeld te brengen.
De wetenschappelijke doelstellingen van dit doctoraat worden geformuleerd in het tweede
hoofdstuk. De eerste doelstelling was nagaan of er een overeenkomst was tussen laagveld
MR en single-slice CT voor het detecteren van intracraniële letsels bij honden en katten. De
tweede doelstelling was onderzoeken of er een overeenkomst was tussen laagveld MR en
multislice CT voor het opsporen van specifieke afwijkingen t.h.v. de hersenen en het
cervicaal ruggenmerg; meer bepaald: kan CT gebruikt worden als alternatief voor het
diagnosticeren van een cerebellaire (foramen magnum) hernia bij Cavalier King Charles
Spaniels en cervicale syringomyelie bij honden.
�173

SAMENVATTING�
Het derde hoofdstuk licht een prospectieve studie toe die naging of er een overeenkomst
was tussen laagveld MR en single-slice CT voor het detecteren van intracraniële letsels bij
honden en katten. Eenenvijftig honden en 7 katten die verdacht werden van een
intracraniaal letsel en hiervoor een MR onderzoek ondergingen, werden ook onder de CT-
scanner gelegd. Hiervoor werd een laagveld MR-toestel en single-slice CT-toestel gebruikt.
Deze onderzoeken werden gepland in een vooraf bepaalde periode over een tijdsspanne van
2 jaar. De MR- en CT-studies werden geanonimiseerd en de aanwezigheid van een
intracraniaal letsel werd onderzocht. Bij de aanwezigheid van een letsel werden tevens
verschillende karakteristieken beoordeeld: massa-effect, patroon (enkelvoudig of
meervoudig), lokalisatie (lobus of regio), aspect van de randen van het letsel (gedefinieerd
of niet), pre- en postcontrast afmetingen, contrastcaptatie en het patroon van
contrastopname (homogeen, heterogeen, rand). De overeenkomst tussen beide technieken
werd statistisch bekeken. Er was een voldoende tot goede overeenkomst (79%, k = 0.72)
tussen MR en CT voor het detecteren van een intracraniaal letsel. Bij 30 van de 58
patiënten werd het letsel zowel op de MR als op de CT-beelden geïdentificeerd. Letsels die
niet gezien waren op CT-beelden maar wel op MR-beelden werden door de radiologen
beschreven als een infarct, oedeem of een diffuus inflammatoir letsel. Het niet detecteren
van deze letsels op CT is relevant en hieruit kan men besluiten dat MR beter is voor het
detecteren van hersenletsels. Wanneer een letsel aanwezig is, is er een goede overeenkomst
tussen CT en MR voor de meeste kenmerken (perfecte overeenkomst (k = 1) voor
aanwezigheid massa-effect en contrastcaptatie). Wat betreft de afmetingen van een letsel is
er geen goede overeenkomst tussen beide technieken. De dimensies van de letsels waren bij
de meeste gevallen groter op de CT-beelden. Wanneer men keek naar de grenzen van
overeenkomst van alle metingen (95% betrouwbaarheidsinterval), was het verschil in
dimensies dicht bij of groter dan 2 cm tussen beide technieken. Het verschil tussen beide
technieken voor metingen heeft een invloed op de uiteindelijke behandeling van een patiënt
en is dus klinisch relevant.
�174

SAMENVATTING�
De overeenkomst was matig (k = 0.37) wat betreft de randen van het letsel en de mate van
contrastcaptatie. De overeenkomst wat de lokalisatie van het letsel betreft, was voldoende
tot bijna perfect, met uitzondering van letsels in de lobus temporalis (k = 0.53) en
hersenstam (k = 0.38). Letsels in de lobus piriformis werden niet gedetecteerd op de CT-
beelden. De hoge variabele overeenkomst tussen MR en CT voor de lokalisatie van een
letsel heeft invloed op de diagnose. Na deze grondige studie kunnen we concluderen dat
MR de techniek bij uitstek is om intracraniële letsels te diagnosticeren. CT is een waardevol
alternatief voor MR als deze niet beschikbaar is.
In het vierde hoofdstuk staat een analyse van de overeenkomst tussen laagveld MR en
multislice CT voor het diagnosticeren van een cerebellaire hernia in Cavalier King Charles
Spaniels (CKCS) centraal. Voor deze retrospectieve studie werd gekozen voor CKCS
omdat deze honden een hoge prevalentie hebben voor Chiari-like malformatie. Indentatie
en herniatie van het cerebellum zijn belangrijke diagnostische kenmerken van Chiari-like
malformatie. Vijftien CKCS, die een MR- en CT-onderzoek van de hersenen en cervicaal
ruggenmerg ondergingen tijdens hun diagnostische work-up, werden geïncludeerd in de
studie. Hiervoor werd een laagveld MR en multislice CT-toestel gebruikt. De MR- en CT-
studies werden geanonimiseerd en geëvalueerd door 2 ervaren veterinaire radiologen. Op
de midsagittale T1WSE en T2WSE MR-beelden en pre- en postcontrast 2D multiplanaire
gereformatteerde CT-beelden werd de aanwezigheid van een cerebellaire hernia (CH)
genoteerd. Wanneer een CH aanwezig was, werd de lengte gemeten (CHL, mm). De
overeenkomst tussen beide technieken voor het detecteren van een CH werd statistisch
berekend. Er was een perfecte overeenkomst tussen MR en CT voor het diagnosticeren van
een CH. Er was geen significant verschil tussen MR en CT voor de lengte van de CH. In het
algemeen was de lengte van de hernia op CT groter. Uit deze studie kunnen we concluderen
dat, aangezien er geen eerdere associatie werd gevonden tussen CHL en klinische klachten
bij CKCS, CT gebruikt kan worden als een alternatief voor MR.
�175
SAMENVATTING�
Ook kan CT gebruikt worden om een CH uit te sluiten in andere situaties, bv. voorafgaand
aan een cervicale punctie van cerebrospinaal vocht of een cisternale injectie van contrast bij
een myelografie. Bij een screening van CKCS voor fokdoeleinden blijft MR echter de
diagnostische techniek bij uitstek aangezien een beoordeling van het ruggenmerg dan
eveneens mogelijk is.
Het vijfde hoofdstuk maakt duidelijk of er een overeenkomst was tussen laagveld MR en
CT voor het diagnosticeren van een cervicale syrinx. Deze retrospectieve studie includeerde
32 honden die als onderdeel van hun diagnostische work-up een MR- en CT-onderzoek van
het cervicaal ruggenmerg ondergingen. De MR- en CT-studies werden geanonimiseerd en
geëvalueerd op de aanwezigheid van syringomyelie (SM) door 2 ervaren veterinaire
radiologen. Bij aanwezigheid van SM werd de maximale dorsoventrale diameter (syrinx
width, SW) gemeten op de transversale en midsagittale T1WSE MR-beelden en pre- en
postcontrast CT-beelden. De statistische analyse werd in 2 delen opgesplitst: 1) de
overeenkomst voor het detecteren van SM en 2) de overeenkomst tussen de SW tussen
beide beoordelaars en tussen beide technieken. Er was een redelijke overeenkomst (81%, k
= 0.54) tussen de beoordelaars voor het opsporen van een SM op de MR beelden en een
bijna perfecte overeenkomst (94%, k = 0.87) voor de CT beelden. Tussen beide
technieken is er een redelijke overeenkomst (observer 1: 81% k = 0.59; observer 2: 81% k =
0.57) bij de verschillende radiologen. Zeventien van de 32 honden waarbij een SM werd
gediagnosticeerd op zowel de MR- als de CT-beelden werden opgenomen in het tweede
deel. Voor de metingen van de SW was de herhaalbaarheid het best op de midsagittale
T1WSE beelden. Bij beide technieken was de reproduceerbaarheid het best op de
midsagittale beelden. Uit deze studie kunnen we concluderen dat SM consequent door de 2
beoordelaars werd geïdentificeerd op de MR- en de CT- beelden.
�176

SAMENVATTING�
Wanneer een syrinx aanwezig is, kan de dorsoventrale diameter het best gemeten worden
op de midsagittale beelden. Ook voor het beoordelen van een syrinx is CT een alternatief
voor MR wanneer deze niet beschikbaar is.
De algemene discussie en conclusies van dit doctoraat zijn vervat in het zesde en tevens
laatste hoofdstuk. In de meeste gevallen zijn intracraniële letsels, een cerebellaire hernia
en syringomyelie d.m.v. CT opspoorbaar. MR blijft de techniek bij uitstek om letsels op te
sporen in de hersenen en het ruggenmerg, maar CT kan gebruikt worden als alternatief. Dit
is van groot belang omdat kleinere dierenklinieken vandaag de dag veelal enkel een CT- en
geen MR-toestel in hun bezit hebben. Om na te gaan of verschillen tussen MR en CT wat
betreft de lengte van een CH en breedte van de syrinx een klinische impact kunnen hebben,
zijn bijkomende studies een conditio sine qua non.
�177

SAMENVATTING�
�178

CURRICULUM VITAE�
�179
Curriculum vitae

CURRICULUM VITAE�
�180

CURRICULUM VITAE�
Kaatje Kromhout werd geboren op 6 februari 1974 te Reet.
Na het behalen van het diploma van gegradueerde in de verpleegkunde besloot ze
om in de voetsporen te treden van haar papa, dokter-verloskundige. Toch bleek de
liefde voor dieren groter waardoor ze haar studies geneeskunde inruilde voor
diergeneeskunde. In 2008 studeerde ze als dierenarts af aan de Universiteit Gent.
Aansluitend volgde een jaar internship medische beeldvorming (CT-MRI) aan de
vakgroep Medische Beeldvorming van de Huisdieren en Orthopedie van de Kleine
Huisdieren. Tot op heden is zij als wetenschappelijk medewerker aan deze
vakgroep verbonden. Hier staat zij in voor de dagelijkse onderzoeken en
protocollering. Daarnaast werkte zij aan haar doctoraatstudie.
Kaatje Kromhout is auteur of mede-auteur van 16 wetenschappelijke publicaties in
nationale en internationale tijdschriften. Zij nam eveneens actief deel aan meerdere
nationale en internationale congressen.
�181

CURRICULUM VITAE�
�182

BIBLIOGRAPHY�
�183
Bibliography

BIBLIOGRAPHY�
�184

BIBLIOGRAPHY�
Publications
Kromhout K. , van Bree H., Broeckx B.J., Bhatti S., De Decker S., Polis I., Gielen I. Low-
field MRI and multislice CT for the detection of cervical syringomyelia in dogs. Journal of
Veterinary Internal Medicine 2015;29:1354-1359.
De Rycke L.M., Gielen I.M., Dingemanse W., Kromhout K., van Bree H. Computed
Tomographic and Low-Field Magnetic Resonance Arthrography: A Comparison of
Techniques For Observing Intra-articular Structures of the Normal Canine Shoulder.
Veterinary Surgery 2015;44:704-712.
Kromhout K., van Bree H., Broeckx B.J., Bhatti S., Van Ham L., Polis I., Gielen I. Low-
field MRI and multislice CT for the detection of cerebellar (foramen magnum) herniation in
Cavalier King Charles Spaniels. Journal of Veterinary Internal Medicine 2015;29:238-241.
Doom M., de Rooster H., van Bergen T., Gielen I., Kromhout K., Simoens P., Cornillie P.
Morphology of the Canine Omentum Part 1: The Omental Bursa and its Compartments
Materialized and Explored by a Novel Technique. Anatomica Histologica Embryologia
Epub 2014.
Doom M., de Rooster H., van Bergen T., Gielen I., Kromhout K., Simoens P., Cornillie P.
Morphology of the Canine Omentum Part 2: The Omental Bursa and its Compartments
Materialized and Explored by a Novel Technique. Anatomia Histologica Embryologia
Epub 2014.
�185
BIBLIOGRAPHY�
Hauspie S., Vanderperren K., Gielen I., Pardon B., Kromhout K., Martens M., Saunders J.
Magnetic Resonance Imaging of the dorsal proximal synovial plica of the equine
metacarpo-/metatarsophalangeal joint. Anatomica Histologica Embryologia. Epub 2014.
De Rycke* L.M., Kromhout* K., van Bree H.J., Bosmans T., Gielen I.M. Computed
Tomography Atlas of the Normal Cranial Canine Abdominal Vasculature Enhanced by
Dial-phase Angiography. Anatatomia Histologia Embryologia 2014;43:413-422.
Cornelis I., Bosmans T., Doom M., Binst D., Van der Vekens E., Kromhout K., Cornillie P.,
Van Ham L. Unilateral shunt formation with thoracic aortic dissection in a Whippet.
Journal of Small Animal Practice 2014; 55:337-339.
de Bakker E., Gielen I., Kromhout K., van Bree H., Van Ryssen B. Magnetic resonance
imaging of primary and concomitant flexor enthesopathy in the canine elbow. Veterinary
Radiology and Ultrasound 2013;55:337-339.
Kromhout* K., Gielen*I., Gavin P., Van Ham L., Polis I., van Bree H. Agreement of low-
field MRI and CT for the detection of suspected intracranial lesions in dogs and cats.
Journal of the American Veterinary Medical Association 2013;243:367-375.
Cornelis I., De Decker S., Gielen I., Gadeyne C., Chiers K., Vandenabeele S., Kromhout K.,
Van Ham L. Idiopathic sterile inflammation of epidural fat and epaxial muscles causing
paraplegia in a mixed-breed dog. Journal of the American Veterinary Medical Association
2013;242:1405-1409.
�186

BIBLIOGRAPHY�
Kromhout K., Wouters A., Gielen I. Computertomografie voor de detectie van longnodulen
bij de hond. Vlaams Diergeneeskundig Tijdschrift 2013;82:91-96.
Kromhout K., Gielen I., De Cock H.E.V., Van Dyck K., van Bree H. Magnetic resonance
and computed tomography imaging of a carotid body tumor in a dog.
Acta Veterinaria Scandinavica 2012;54:24.
De Decker S., Gielen I., Duchateau L., Corzo N., van Bree H., Kromhout K., Bosmans T.,
Van Ham L. Intraobserver, interobserver and intermethod agreement of myelography,
postmyelographic computed tomography, and low-field magnetic resonance imaging in
dogs with disk associated wobbler syndrome (cervical spondylomyelopathy). Journal of the
American Veterinary Medical Association 2011 238;12:1601-1608.
Kromhout K.,Van der Heyden S., Cornelis I., Bosmans T., van Bree H., Gielen I. Canine
nasal adenocarcinoma with atypical intracranial extension : computed tomography and
magnetic resonance findings. European Journal of Companion Animal Practice 2011 21;
2:151-154.
Kromhout K., Gielen I., Van Caelenberg A., Van Ham L., van Bree H.
The use of magnetic resonance imaging in the detection of intracranial lesions in three cats.
Magnetische resonantie bij de detectie van intracraniale letsels bij drie katten.
Vlaams Diergeneeskundig Tijdschrift 2009 78, 2:121-128.
�187
BIBLIOGRAPHY�
Scientific presentation
Kromhout K., Gielen I. CT vs. MRI in brain lesions, when is CT the modality of choice.
Proceedings of the 3rd International CT-Users Meeting, 30th november - 1st december
2013 Ghent, Belgium, 68-70.
Gielen I., Kromhout K. CT in small animal brain diseases.
Proceedings of the 3rd International CT-Users Meeting, 30th november - 1st december
2013 Ghent, Belgium, 54-55.
Kromhout K., Bhatti S., Van Ham L., Van Bree H., Gielen I. Comparison of MRI and CT
for the detection of cerebellar (foramen magnum) herniation in Cavalier King Charles
Spaniels. Proceedings of the 3rd International CT-Users Meeting, 30th november - 1st
december 2013 Ghent, Belgium, 20. (Poster presentation/first prize winner)
Kromhout K.,Van Soens I., Bosseler I., Bhatti S., Gielen I.Computed tomography
characteristics of a spinal epidural hemangiosarcoma in a young dog. Proceedings of the
3rd International CT-Users Meeting, 30th november - 1st december 2013 Ghent, Belgium,
14. (Poster presentation)
Cornelis I., Van Ham L., Kromhout K., Goethals K., Gielen I., Bhatti S.
Sole prednisolone therapy in canine meningoencephalitis of unknown origin: 45 cases
(2006-2012)
Proceedings of the 26th Symposium of European Society of Veterinary Neurology and
European college of Veterinary Neurology: Neuro-emergency and critical care, 26th-28th
september 2013 Paris, France, 91.
�188

BIBLIOGRAPHY�
Mauler D., De Rooster H., Kromhout K., Guzman A.R., Gielen I.
Horner's syndrome associated with a frontal sinusitis in a dog.
Proceedings of the 26th Symposium of European Society of Veterinary Neurology and
European college of Veterinary Neurology: Neuro-emergency and critical care, 26th-28th
september 2013 Paris, France, 97.
Gielen I., Kromhout K., Dingemanse W., Van Bree H.Update on diagnostic imaging in
elbow disease. Proceedings of the 27th annual meeting of the International Elbow Working
Group, 11th april 2012, Birmingham, United Kingdom, 13-14.
De Rycke L., Gielen I., Dingemanse W., Kromhout K., Van Bree H. Magnetic resonance
arthrography (MRA) and CT arthrography (CTA) of the normal canine shoulder;
Proceedings of the 6th European Veterinary MRI User Meeting, 11th-12th may 2012,
Merelbeke, Belgium, 86-88.
Doom M., De Rooster H., Gielen I., Kromhout K., Simoens P., Cornillie P.Exploring an
enigmatic organ: surgery-oriented anatomy of the canine omentum majus. Proceedings
XXIXth Congress of European Association of Veterinary Anatomists, 25th-28th july 2012,
Stara Zagreb, Bulgaria (poster presentation).
Gielen I., Kromhout K., van Bree H. Lumbosacral disease (LS): an update on diagnostic
imaging techniques. Proceedings of the 20th Annual Scientific Meeting of the European
College of Veterinary Surgery, 7th-9th july 2011, Ghent University, Belgium, 137-139.
�189

BIBLIOGRAPHY�
Kromhout K., Gielen I., Van Ham L., van Bree H. CT and MRI findings of cervical stenosis
caused by malformation of the articular facets and meningeal fibrosis of C2-C3 in two
young large breed dogs. Proceedings of the 16th European Veterinary Diagnostic Imaging
Annual Conference, 1st-3rd september 2010, London, United Kingdom, 83. (poster
presentation)
De Decker S., Gielen I., Duchateau L., Corzo N., van Bree H., Kromhout K., Bosmans T.,
Van Ham L. Agreement of myelography, postmyelographic computed tomography (CTM)
and low-field magnetic resonance imaging (MRI) in dogs with disk associated cervical
spondylomyelopathy: a randomized, blinded study. Proceedings of the 23rd Annual
Symposium of the European Society of Veterinary Neurology and European college of
Veterinary Neurology, 16th-18th september 2010, Cambridge, United Kingdom, 53.
K. Kromhout, P. Gavin, L.Van Ham, H. van Bree, I. Gielen. A comparison of CT and MRI
for the detection of intracranial lesions in dogs and cats. Proceedings of the 15th
Conference of the International Veterinary Radiology Association, 26th-31th july 2009,
Buzios, Brazil, 198.
�190

DANKWOORD�
�191
Dankwoord

DANKWOORD�
�192

DANKWOORD�
Mijn lieve mama en papa waren mensen die enorm veel belang hechtten aan waarden en
normen. Ten tijde van ‘Cheers’ dacht ik altijd dat ze het over waard Sam Malone en
tooghanger Norm Peterson hadden. In het meervoud dan. Mijn fout.
Waarden en normen. Zoals dankbaarheid. Niet alleen dankbaar zijn, maar dankbaarheid
tonen. Sommige realisaties zijn zoveel groter dan datgene wat ik ooit voor ogen had. Net
dankzij de steun van mensen rondom mij. Dichtbij en veraf.
Tijdens mijn studies zweerde ik dat het effectief realiseren van een doctoraat pure magie
was, maar jullie maakten van mij de goochelaar die ik nu ben. Niet letterlijk uiteraard en al
maar goed ook of mijn patiënten zouden geen Cavalier King Charles Spaniels, maar
konijnen en duiven geweest zijn, op medische beeldvorming uit mijn hoed getoverd of
mouw geschud.
Aan mijn promotor, Dr. Ingrid Gielen, dank u. U haalde mij aan boord van de CT-MRI-unit
waardoor ik heel veel fijne mensen heb leren kennen.
Professor Dr. Luc Van Ham, Dr. Sofie Bhatti, jullie steun en expertise maakten van mij een
nog betere veterinaire radioloog. Eentje met een grote liefde voor neurologie. Een
vanzelfsprekendheid daar ik wel eens last durf te hebben van zenuwen. Ook graag nog een
woord van oprechte dank aan jullie beiden voor het nalezen wanneer de deadline met rasse
schreden naderde. Als wereldreiziger kreeg last minute plots een heel andere betekenis.
Dank aan mijn examencommissie, vooreerst Professor Dr. Kurt Houf, voorzitter. Sta mij toe
te zeggen dat er naar mijn mening een deel in uw familienaam ontbreekt: “ijzer”. Niet
omdat u een man van staal zou zijn, maar omwille van het geluk dat u brengt. Uw talent om
alles in goede banen te leiden, maken mee dat ik bovendien trots kan en mag zijn op het
resultaat.
�193

DANKWOORD�
Professor Dr. Henri van Bree, u bezorgde mij mee de kans deel uit te maken van een team
gemotiveerde dierenartsen. Daar ben ik u zeer dankbaar voor. Tevens bezorgde u mij zeer
vaak een glimlach. Kennis is macht, maar humor des te meer. Bij deze: ik weet dat u niet
van Bree, maar van Wetteren bent. You don’t fool me.
Professor Dr. Jimmy Saunders, woorden schieten te kort en met een krop in de keel (en
inktprop in de pen) een blijk van enorme appreciatie om niet alleen zoals Professor Dr.
Houf alles in goede banen te leiden, maar mij ook warm te maken om mijn professioneel
terrein te verruimen en te motiveren het beste uit mezelf te halen. Er bestaat geen twijfel dat
u een uitstekende nieuwe vakgroepvoorzitter zal zijn. Succes!
Dr. Steven De Decker, mahalo. Bezorgde ik je bij het lezen van mijn artikelen fronsende
wenkbrauwen? Ik wist dat je kritische blik vanuit het Verenigd Koninkrijk nooit veraf was
wat mij sterkte in mijn overtuiging om er meer dan helemaal voor te gaan. Wanneer ik me
(terecht) op de vingers getikt voelde, dacht ik aan diezelfde vingers die mijn mails naar jou
over Kaua’i, O’ahu en Big Island typten.
Dr. Bart Broeckx, dé enige echte statisticus. Al kan hier sprake zijn van bias. Bart, jouw
genetisch onderzoek naar heupdysplasie fascineert me en… stelt me tevens gerust voor
wanneer het moment daar is dat ook ik een nieuwe heup nodig heb. Dank ook voor het
uitbreiden van mijn woordenschat. Onze gesprekken in het Aantwaarps zen een hiel pak
raiker na we’t oek kunne hemme over Bland Altman (bruur van de Robert) en boxplots
(plots oep een boeksmatch), t-testen (ge wet wol, Earl Grey van Lipton). Ik klink dankze aa
gelek nen eachte Aantwaarpse statisticus.
Ook hartelijk dank aan Dr. Frank De Waele.
Dr. Massimo Baroni, grazie.
�194

DANKWOORD�
Collegae van medische beeldvorming, wat zou ik zijn zonder jullie?
Walter, Annemie, Casper en Billie, bedankt.
Aquilino Villamonte Chevalier, ik waardeer je enorm als medegrondlegger van het
Flemlish. Weet dat schoonheid niet alleen in jouw naam schuilt, maar vooral in jou als
persoon. Weet ook dat Panama niet ver weg is. Met de Aeromodeller van de Belgische
beeldhouwer Henri Van Herwegen ben ik er ongetwijfeld zo. Kan niet anders. Zijn
pseudoniem – Panamarenko – is onlosmakelijk verbonden met je land van herkomst. Maar
stel je voor dat ik kom aankloppen en Sofie zegt dat je verhuisd bent naar de Death Star. Ik
acht het niet onmogelijk. May the force be with you!
Eva, hoe zou ik jou ooit kunnen vergeten te bedanken. Altijd druk bezig op scintigrafie. Je
loopt zo vaak heen en weer dat ik je stiekem Scinty Lauper noem. Girls just want to have
fun! En je lijkt perfect op je plek te zitten daar. Je houdt je o.a. bezig met
joodbehandelingen bij katten met schildklierproblemen. Ik ga dus niet alleen voor die
nieuwe heup terechtkunnen bij Bart, maar ook bij jou wanneer er iets misloopt in het
atoomcentrum in Mol en ik zonder joodpillen zit. Je weet, ik verhuis naar Turnhout, het hart
van de Kempen.
With the uttermost respect, many thanks to four incredible veterinarian ladies who burst
with talent. Not in the least because they fluently speak one of the most difficult languages
on planet earth: French.
Laure, how I love your hustle and your raucous laughter. I can hear your exuberance and
energy when I’m at home while you’re staying in France for a weekend or holiday. Remind
me – safety first – I will provide you with some ear plugs for those cute little monkeys in
Africa.
�195

DANKWOORD�
Caroline Fina and Woody. What a duo! Time and again you both amaze me when you board
an airplane and travel to Cannes together. I’ve always thought you were heir to the oil
company of the same name. Let me tell you a secret: I sincerely hope that when oil prices
go through the roof, you will be there for me like you were now in the clinic.
Olivia (I’m tempted to say I can hear your footsteps that mark the way you walk, but they
are overshadowed by Laure’s exuberance) and Blandine (why does the CT always overheat
in your presence?), thank you to the both of you for helping me.
Met minder woorden een even grote portie dank aan Els, Katrien, Elke, Emmelie & Fritske,
Inez, Stijn H. en Kim. Kim, ik bewonder hoe je al die hengsten de baas kunt, zowel die op
het werk als die ene bij je thuis. Spijtig dat ik geen deel meer uitmaak van je 15 minuten
powernap. Nog dit: dankzij jou zal Zalando nooit failliet gaan.
Verder wil ik ook de collega’s van orthopedie mijn dank betuigen.
Prof. Dr. Bernadette Van Ryssen (soms zo verstrooid als het zout op mijn frieten), Yves,
Stijn , Eva, Melania en oud-collega’s Lynn, Astrid, Hannah, Seppe en Kathelijn.
Evelien, ook al is de fysieke gelijkenis volgens mij afwezig, je bent voor mij zoals een
praatpaal langs de snelweg. Een ingebouwde veiligheid voor automobilisten die panikeren
bij een sputterende motor, een zekerheid bij een platte band, de stem aan de andere kant van
de lijn die zegt dat alles in orde komt. Je bent de Max. Alleen heb je Godzijdank niet zo’n
grijze snuit, blaf je niet zo hard en heb je niet evenveel last van flatulentie. Bedankt voor de
wandelingen in jullie aangenaam gezelschap.
Geert, jij in het bijzonder bedankt om ons Fonske niet alleen terug alle kracht te geven,
gevolgd door een goed herstel, maar tevens voor zijn internationale carrière. Hij is er zich
welbewust van, maar van sterallures geen sprake. Netjes met de pootjes op de grond.
�196

DANKWOORD�
Dit doctoraat heeft me meer dan eens slapeloze nachten bezorgd. Ik heb vaak op het punt
gestaan één van mijn dierbare collega’s anesthesie te bellen om 3 uur ’s ochtends. Eén keer
heb ik het gedaan, maar ik kreeg die zangeres aan de lijn, Anastasia.
Bossie, je bent niet alleen een gedienstige, sportieve anesthesist, maar meer nog – na je
uren – een Amerikaans rockzanger, gitarist en liedsjesschrijver, ‘cause tramps like us, baby
we were born to run. Oh, dat is the boss zeker… Tim, eeuwige dank voor je hulp en je kent
de weg naar mijn luisterend oor.
Virginie, de kilometers die je aflegt op je loopband zijn een inspiratie geweest voor mij. De
lange afstand (met verwachte en onverwachte hindernissen) gaf me een gevoel dat we
hetzelfde pad bewandelden – of beter liepen – richting eindmeet. Ik kan me inbeelden dat
jouw conditie erop vooruit gegaan is, maar ik merk weinig tot geen verschil. Naast mijn
dank heb je mijn steun bij het verdere verloop van je doctoraat. You go girl!
Alix, ook jij bedankt, want ik weet dat achter elke man een sterke vrouw staat. Lang dacht
ik dat dat bij Kenny Barbie was. Niet dus.
Diego, mijn Spaanse God, gracias!
Ilaria, thanks for being there for me and Fonske. I will keep on calling you Hilaria when
you crack me up while having crazy conversations. Come to think of it… Just imagine your
last name would be ‘Clinton’. You might be the first woman to become president of the
United States of America. God Bless!
Andere anesthesisten die nog aanwezig of afwezig zijn: Anna B. (be careful with those
piercings near the MRI), Annika (succes met je residency chirurgie), Caroline, Inge en Tim
W. out of sight but not out of mind.
�197

DANKWOORD�
Ook het team van neurologie stond altijd voor me klaar met de nodige prikkels.
Kenny Privé wil ik bedanken voor bijstand in moeilijke PhD- en Facebookmomenten. Je
vindt zelfs mijn meest waardeloze posts leuk. Ik dacht “Hopelijk meende hij het wanneer
hij zei dat hij zeer enthousiast was over mijn doctoraat.” Maar die twijfel was snel weg
want ach “Die uitspraak niet menen? Dat Kenny niet maken”.
Ine, wanneer jij op me afkomt, weet ik dat er een spervuur van vragen zal volgen. Dan
waren mondelinge examens een lachertje. Je houdt me scherp en wakkert bij mij de wens
aan om steeds bij te leren en kennis te delen. Ik kijk naar je op, gewoon al door je
imposante lengte. Dank voor alle hulp en steun. Ik kijk uit naar wat de toekomst voor ons
brengt qua samenwerking.
Emilie jij moet de neuroloog zijn met de grootste fanbasis onder de eigenaars van de
patiënten. Daaruit begrijp ik dat mijn lang dankwoord aan jou meer op zijn plaats is op je
Facebookprofiel. Igorke, het is altijd uitkijken wanneer je door de gangen scheurt.
Oppassen voor die Gentse ‘superflitspaal’!.
Valentine dankzij jou heb ik veel extra dubbelstudies kunnen doen, ook al waren ze niet
echt nodig.
Kimberley, bij het bedanken meteen ook een vraag: waar heb jij toch dat voorkruipen met
je patiënten geleerd? Aan de kassa van Proxy Delhaize in Lasne-Chapelle-Saint-Lambert?
Ik denk dat niemand beter doet. Klasse!
�198

DANKWOORD�
Marnix, bedankt voor je technische hulp, het babbelen over renoveren en vooral het
oneindig herstellen van de positioneringskussentjes van CT en MRI. Misschien toch eens
tijd voor nieuwe.
Marleen, Claudine en Sandra. Jullie verrichten heel wat werk achter de schermen. Bedankt
daarvoor.
Thanks aan alle andere collega-dierenartsen kleine huisdieren, residents, interns en
studenten. Teveel om op te noemen. De sfeer en de werking van de klinieken zouden niet zo
aangenaam zijn zonder jullie hulp.
Johan en Iris, wat zijn we een geolied team. ’s Avonds werd heel wat van mijn tijd
opgeslorpt door patiënten van Orion, vaak tot diep in de nacht. Soms dacht ik dat het
allemaal wat teveel werd maar dan keek ik naar de sterrenhemel en wist ik dat altijd alles
goed komt. Nu de rust terug is mag je het aantal patienten per dag gerust verdubbelen.
Bedankt dat ik mijn steentje aan jullie geweldige kliniek mag bijdragen.
Familie, vrienden en vriendinnen die ik hier niet allemaal bij naam gaan noemen, jullie
weten zelf wel wie ik bedoel. Bedankt om er voor mij te zijn, in goede en slechte tijden.
Elise toch een speciale dank voor jou. Samen ergens begonnen aan de studie
diergeneeskunde, samen dezelfde hindernissen overwonnen, samen afgestudeerd. Ik ging
ooit eens op babybezoek komen… ondertussen is die schattige baby al bijna 4. Shame on
me!
John Silberstein, thank you very much for being the native speaker I was looking for. I hope
to meet you, Pam en Speck in person very soon. We are saving up for a plane ticket to
Philly!
�199

DANKWOORD�
Denise, Bettina en Flor, een paar jaar geleden waren jullie daar plots. Om niet meer uit mijn
en ons leven te verdwijnen. Het is telkens gezellig bij jullie wekelijks bezoek, al is het niet
zo goed voor onze gezondheid. Door de drukte van het doctoraat heb ik heel wat afspraken
gemist. En mijn berekeningen leren mij dat ik 38 ‘pateekes’ achter sta. Die schade moet
dringend ingehaald worden, maar misschien niet in 1 keer.
Marie-Louiske, mama van Ann en toch ook van mij. Al die jaren heb je jouw thuis mijn
thuis gemaakt. Ik kan er altijd terecht. Bedankt om mijn woordenschat te verruimen met
Turnawts: mastentoppen, meurig, zeksmojer,…
Moemoe en vava van Ann. Wat mis ik jullie en jullie lekker eten.
S. Tante Mit, S. nonkel Hubert en S. tante Yvonne, ook jullie zijn na al die jaren mijn
familie. Bedankt voor de regelmatige updates over beleggingen, rentevoeten en interesten.
De lotto hoef ik niet meer te winnen want jullie zijn voor mij de jackpot.
Aan alle poezen in mijn leven, Wortel, Molly, Jefke en last but not least, Fons. Wat zou ik
zijn zonder jullie. Buiten het krabben, vechten, blazen en grommen, hou ik van jullie en
jullie geluidjes. Het spinnen kalmeert mij. Fonske sponske ik ben blij dat je er nog bent!
Ann, ik ben zo blij dat jij in mijn leven bent gekomen. Jouw liefde, zelfde humor als ik,
geduld en ongeduld zijn voor mij onmisbaar. Bedankt dat je er altijd voor mij bent. Ik kijk
uit naar iedere dag met jou! Ik kijk uit naar ons huis, dat al bloed, zweet en tranen heeft
gekost, maar fantastisch zal zijn als het af is. Al weet ik niet of het groot genoeg is om al
onze rommel in kwijt te kunnen, …
Ann, we stick together like a sticker and glue.
�200

DANKWOORD�
Mama, papa, jullie zijn er beiden niet meer maar ik weet dat jullie trots zijn. Bedankt voor
de jaren, al waren ze veel te kort, die we samen hebben doorgebracht. Papa, je moest je
geen zorgen maken, ik ben echt wel goed terechtgekomen. En mama, ja je mag nu eindelijk
zeggen dat je dochter doctor is.
Kaatje
"Dream as if you'll live forever. Live as if you'll die today." James Dean
�201


“Life is about balance. The good and the bad. The highs and the lows. The pina and the colada.”
Ellen Degeneres