crossm - UGent Biblio
28
American Gut: an Open Platform for Citizen Science Microbiome Research Daniel McDonald, a Embriette Hyde, a Justine W. Debelius, a James T. Morton, a Antonio Gonzalez, a Gail Ackermann, a Alexander A. Aksenov, b,c Bahar Behsaz, d Caitriona Brennan, a Yingfeng Chen, e Lindsay DeRight Goldasich, a Pieter C. Dorrestein, b,c Robert R. Dunn, f Ashkaan K. Fahimipour, g James Gaffney, a Jack A. Gilbert, h,i,j,k Grant Gogul, a Jessica L. Green, g Philip Hugenholtz, l Greg Humphrey, a Curtis Huttenhower, m,n Matthew A. Jackson, o Stefan Janssen, a Dilip V. Jeste, p,q Lingjing Jiang, a Scott T. Kelley, e Dan Knights, r,s Tomasz Kosciolek, a Joshua Ladau, t Jeff Leach, u Clarisse Marotz, a Dmitry Meleshko, v Alexey V. Melnik, b,c Jessica L. Metcalf, w Hosein Mohimani, x Emmanuel Montassier, r,y Jose Navas-Molina, a Tanya T. Nguyen, p,q Shyamal Peddada, z Pavel Pevzner, b,d,aa Katherine S. Pollard, t Gholamali Rahnavard, m,n Adam Robbins-Pianka, bb Naseer Sangwan, j Joshua Shorenstein, a Larry Smarr, d,aa,cc Se Jin Song, a Timothy Spector, o Austin D. Swafford, aa Varykina G. Thackray, dd Luke R. Thompson, ee,ff Anupriya Tripathi, a Yoshiki Vázquez-Baeza, a Alison Vrbanac, a Paul Wischmeyer, gg,hh Elaine Wolfe, a Qiyun Zhu, a The American Gut Consortium, Rob Knight a,d,aa a Department of Pediatrics, University of California San Diego, La Jolla, California, USA b Collaborative Mass Spectrometry Innovation Center, University of California, San Diego, La Jolla, California, USA c Skaggs School of Pharmacy and Pharmaceutical Sciences, University of California, San Diego, La Jolla, California, USA d Department of Computer Science and Engineering, University of California, San Diego, La Jolla, California, USA e Department of Biology, San Diego State University, San Diego, California, USA f Department of Applied Ecology, North Carolina State University, Raleigh, North Carolina, USA g Biology and the Built Environment Center, University of Oregon, Eugene, Oregon, USA h Department of Surgery, University of Chicago, Chicago, Illinois, USA i Institute for Genomic and Systems Biology, University of Chicago, Chicago, Illinois, USA j Department of Biosciences, Argonne National Laboratory, Chicago, Illinois, USA k Marine Biology Laboratory, University of Chicago, Chicago, Illinois, USA l Australian Centre for Ecogenomics, School of Chemistry and Molecular Biosciences, the University of Queensland, Brisbane, QLD, Australia m Harvard T. H. Chan School of Public Health, Boston, Massachusetts, USA n The Broad Institute of MIT and Harvard, Cambridge, Massachusetts, USA o Department of Twin Research and Genetic Epidemiology, King’s College London, London, United Kingdom p Departments of Psychiatry and Neurosciences, University of California San Diego, La Jolla, California, USA q Sam and Rose Stein Institute for Research on Aging and Center for Healthy Aging, University of California San Diego, La Jolla, California, USA r Department of Computer Science and Engineering, University of Minnesota, Minneapolis, Minnesota, USA s Biotechnology Institute, University of Minnesota, Minneapolis, Minnesota, USA t The Gladstone Institutes, University of California, San Francisco, California, USA u Human Food Project, Terlingua, Texas, USA v St. Petersburg State University, Center for Algorithmic Biotechnology, Saint Petersburg, Russia w Department of Animal Science, Colorado State University, Fort Collins, Colorado, USA x Department of Computational Biology, Carnegie Mellon University, Pittsburgh, Pennsylvania, USA y Université de Nantes, Microbiotas Hosts Antibiotics and Bacterial Resistances (MiHAR), Nantes, France z Department of Biostatistics, University of Pittsburgh, Pittsburgh, Pennsylvania, USA aa Center for Microbiome Innovation, University of California, San Diego, La Jolla, California, USA bb Department of Computer Science, University of Colorado Boulder, Boulder, Colorado, USA cc California Institute for Telecommunications and Information Technology (Calit2), University of California San Diego, La Jolla, California, USA Received 8 March 2018 Accepted 16 April 2018 Published 15 May 2018 Citation McDonald D, Hyde E, Debelius JW, Morton JT, Gonzalez A, Ackermann G, Aksenov AA, Behsaz B, Brennan C, Chen Y, DeRight Goldasich L, Dorrestein PC, Dunn RR, Fahimipour AK, Gaffney J, Gilbert JA, Gogul G, Green JL, Hugenholtz P, Humphrey G, Huttenhower C, Jackson MA, Janssen S, Jeste DV, Jiang L, Kelley ST, Knights D, Kosciolek T, Ladau J, Leach J, Marotz C, Meleshko D, Melnik AV, Metcalf JL, Mohimani H, Montassier E, Navas-Molina J, Nguyen TT, Peddada S, Pevzner P, Pollard KS, Rahnavard G, Robbins-Pianka A, Sangwan N, Shorenstein J, Smarr L, Song SJ, Spector T, Swafford AD, Thackray VG, Thompson LR, Tripathi A, Vázquez-Baeza Y, Vrbanac A, Wischmeyer P, Wolfe E, Zhu Q, The American Gut Consortium, Knight R. 2018. American Gut: an open platform for citizen science microbiome research. mSystems 3: e00031-18. https://doi.org/10.1128/mSystems .00031-18. Editor Casey S. Greene, University of Pennsylvania Copyright © 2018 McDonald et al. This is an open-access article distributed under the terms of the Creative Commons Attribution 4.0 International license. Address correspondence to Rob Knight, [email protected]. D. McDonald and E. Hyde contributed equally to this work. For a commentary on this article, see https:// doi.org/10.1128/mSystems.00060-18. American Gut: an Open Platform for Microbiome Research RESEARCH ARTICLE Host-Microbe Biology crossm May/June 2018 Volume 3 Issue 3 e00031-18 msystems.asm.org 1 on July 3, 2019 by guest http://msystems.asm.org/ Downloaded from
-
Upload
khangminh22 -
Category
Documents
-
view
2 -
download
0
Transcript of crossm - UGent Biblio

American Gut: an Open Platform for Citizen ScienceMicrobiome Research
Daniel McDonald,a Embriette Hyde,a Justine W. Debelius,a James T. Morton,a Antonio Gonzalez,a Gail Ackermann,a
Alexander A. Aksenov,b,c Bahar Behsaz,d Caitriona Brennan,a Yingfeng Chen,e Lindsay DeRight Goldasich,a
Pieter C. Dorrestein,b,c Robert R. Dunn,f Ashkaan K. Fahimipour,g James Gaffney,a Jack A. Gilbert,h,i,j,k Grant Gogul,a
Jessica L. Green,g Philip Hugenholtz,l Greg Humphrey,a Curtis Huttenhower,m,n Matthew A. Jackson,o Stefan Janssen,a
Dilip V. Jeste,p,q Lingjing Jiang,a Scott T. Kelley,e Dan Knights,r,s Tomasz Kosciolek,a Joshua Ladau,t Jeff Leach,u
Clarisse Marotz,a Dmitry Meleshko,v Alexey V. Melnik,b,c Jessica L. Metcalf,w Hosein Mohimani,x Emmanuel Montassier,r,y
Jose Navas-Molina,a Tanya T. Nguyen,p,q Shyamal Peddada,z Pavel Pevzner,b,d,aa Katherine S. Pollard,t
Gholamali Rahnavard,m,n Adam Robbins-Pianka,bb Naseer Sangwan,j Joshua Shorenstein,a Larry Smarr,d,aa,cc
Se Jin Song,a Timothy Spector,o Austin D. Swafford,aa Varykina G. Thackray,dd Luke R. Thompson,ee,ff Anupriya Tripathi,a
Yoshiki Vázquez-Baeza,a Alison Vrbanac,a Paul Wischmeyer,gg,hh Elaine Wolfe,a Qiyun Zhu,a The American Gut Consortium,Rob Knighta,d,aa
aDepartment of Pediatrics, University of California San Diego, La Jolla, California, USAbCollaborative Mass Spectrometry Innovation Center, University of California, San Diego, La Jolla, California,USA
cSkaggs School of Pharmacy and Pharmaceutical Sciences, University of California, San Diego, La Jolla,California, USA
dDepartment of Computer Science and Engineering, University of California, San Diego, La Jolla, California,USA
eDepartment of Biology, San Diego State University, San Diego, California, USAfDepartment of Applied Ecology, North Carolina State University, Raleigh, North Carolina, USAgBiology and the Built Environment Center, University of Oregon, Eugene, Oregon, USAhDepartment of Surgery, University of Chicago, Chicago, Illinois, USAiInstitute for Genomic and Systems Biology, University of Chicago, Chicago, Illinois, USAjDepartment of Biosciences, Argonne National Laboratory, Chicago, Illinois, USAkMarine Biology Laboratory, University of Chicago, Chicago, Illinois, USAlAustralian Centre for Ecogenomics, School of Chemistry and Molecular Biosciences, the University ofQueensland, Brisbane, QLD, AustraliamHarvard T. H. Chan School of Public Health, Boston, Massachusetts, USAnThe Broad Institute of MIT and Harvard, Cambridge, Massachusetts, USAoDepartment of Twin Research and Genetic Epidemiology, King’s College London, London,United Kingdom
pDepartments of Psychiatry and Neurosciences, University of California San Diego, La Jolla, California, USAqSam and Rose Stein Institute for Research on Aging and Center for Healthy Aging, University of California SanDiego, La Jolla, California, USA
rDepartment of Computer Science and Engineering, University of Minnesota, Minneapolis, Minnesota, USAsBiotechnology Institute, University of Minnesota, Minneapolis, Minnesota, USAtThe Gladstone Institutes, University of California, San Francisco, California, USAuHuman Food Project, Terlingua, Texas, USAvSt. Petersburg State University, Center for Algorithmic Biotechnology, Saint Petersburg, RussiawDepartment of Animal Science, Colorado State University, Fort Collins, Colorado, USAxDepartment of Computational Biology, Carnegie Mellon University, Pittsburgh, Pennsylvania, USAyUniversité de Nantes, Microbiotas Hosts Antibiotics and Bacterial Resistances (MiHAR), Nantes, FrancezDepartment of Biostatistics, University of Pittsburgh, Pittsburgh, Pennsylvania, USAaaCenter for Microbiome Innovation, University of California, San Diego, La Jolla, California, USAbbDepartment of Computer Science, University of Colorado Boulder, Boulder, Colorado, USAccCalifornia Institute for Telecommunications and Information Technology (Calit2), University of California San
Diego, La Jolla, California, USA
Received 8 March 2018 Accepted 16 April2018 Published 15 May 2018
Citation McDonald D, Hyde E, Debelius JW,Morton JT, Gonzalez A, Ackermann G, AksenovAA, Behsaz B, Brennan C, Chen Y, DeRightGoldasich L, Dorrestein PC, Dunn RR,Fahimipour AK, Gaffney J, Gilbert JA, Gogul G,Green JL, Hugenholtz P, Humphrey G,Huttenhower C, Jackson MA, Janssen S, JesteDV, Jiang L, Kelley ST, Knights D, Kosciolek T,Ladau J, Leach J, Marotz C, Meleshko D, MelnikAV, Metcalf JL, Mohimani H, Montassier E,Navas-Molina J, Nguyen TT, Peddada S, PevznerP, Pollard KS, Rahnavard G, Robbins-Pianka A,Sangwan N, Shorenstein J, Smarr L, Song SJ,Spector T, Swafford AD, Thackray VG,Thompson LR, Tripathi A, Vázquez-Baeza Y,Vrbanac A, Wischmeyer P, Wolfe E, Zhu Q, TheAmerican Gut Consortium, Knight R. 2018.American Gut: an open platform for citizenscience microbiome research. mSystems 3:e00031-18. https://doi.org/10.1128/mSystems.00031-18.
Editor Casey S. Greene, University ofPennsylvania
Copyright © 2018 McDonald et al. This is anopen-access article distributed under the termsof the Creative Commons Attribution 4.0International license.
Address correspondence to Rob Knight,[email protected].
D. McDonald and E. Hyde contributed equallyto this work.
For a commentary on this article, see https://doi.org/10.1128/mSystems.00060-18.
American Gut: an Open Platform forMicrobiome Research
RESEARCH ARTICLEHost-Microbe Biology
crossm
May/June 2018 Volume 3 Issue 3 e00031-18 msystems.asm.org 1
on July 3, 2019 by guesthttp://m
systems.asm
.org/D
ownloaded from

ddDepartment of Obstetrics, Gynecology and Reproductive Sciences, University of California San Diego, LaJolla, California, USA
eeOcean Chemistry and Ecosystems Division, Atlantic Oceanographic and Meteorological Laboratory, NationalOceanic and Atmospheric Administration, stationed at Southwest Fisheries Science Center, La Jolla,California, USA
ffDepartment of Biological Sciences and Northern Gulf Institute, University of Southern Mississippi,Hattiesburg, Mississippi, USA
ggDepartment of Anesthesiology and Surgery, Duke University School of Medicine, Durham, North Carolina,USA
hhDuke Clinical Research Institute, Duke University School of Medicine, Durham, North Carolina, USA
ABSTRACT Although much work has linked the human microbiome to specificphenotypes and lifestyle variables, data from different projects have been challeng-ing to integrate and the extent of microbial and molecular diversity in human stoolremains unknown. Using standardized protocols from the Earth Microbiome Projectand sample contributions from over 10,000 citizen-scientists, together with an openresearch network, we compare human microbiome specimens primarily from theUnited States, United Kingdom, and Australia to one another and to environmentalsamples. Our results show an unexpected range of beta-diversity in human stool mi-crobiomes compared to environmental samples; demonstrate the utility of proce-dures for removing the effects of overgrowth during room-temperature shipping forrevealing phenotype correlations; uncover new molecules and kinds of molecularcommunities in the human stool metabolome; and examine emergent associationsamong the microbiome, metabolome, and the diversity of plants that are consumed(rather than relying on reductive categorical variables such as veganism, which havelittle or no explanatory power). We also demonstrate the utility of the living data re-source and cross-cohort comparison to confirm existing associations between themicrobiome and psychiatric illness and to reveal the extent of microbiome changewithin one individual during surgery, providing a paradigm for open microbiome re-search and education.
IMPORTANCE We show that a citizen science, self-selected cohort shipping samplesthrough the mail at room temperature recaptures many known microbiome resultsfrom clinically collected cohorts and reveals new ones. Of particular interest is inte-grating n � 1 study data with the population data, showing that the extent of mi-crobiome change after events such as surgery can exceed differences between dis-tinct environmental biomes, and the effect of diverse plants in the diet, which weconfirm with untargeted metabolomics on hundreds of samples.
KEYWORDS citizen science, microbiome
The human microbiome plays a fundamental role in human health and disease.While many studies link microbiome composition to phenotypes, we lack under-
standing of the boundaries of bacterial diversity within the human population andthe relative importance of lifestyle, health conditions, and diet to underpin preci-sion medicine or to educate the broader community about this key aspect of humanhealth.
We launched the American Gut Project (AGP; http://americangut.org) in November2012 as a collaboration between the Earth Microbiome Project (EMP) (1) and theHuman Food Project (HFP; http://humanfoodproject.com/) to discover the kinds ofmicrobes and microbiomes “in the wild” via a self-selected citizen-scientist cohort. TheEMP characterizes global microbial taxonomic and functional diversity, and the HFPfocuses on understanding microbial diversity across human populations. As of May2017, the AGP included microbial sequence data from 15,096 samples from 11,336human participants, totaling over 467 million (48,599 unique) 16S rRNA V4 genefragments (abbreviated 16S). Our project informs citizen-scientist participants abouttheir own microbiomes by providing a standard report (Fig. 1A) and deposits alldeidentified data into the public domain on an ongoing basis without access restric-
McDonald et al.
May/June 2018 Volume 3 Issue 3 e00031-18 msystems.asm.org 2
on July 3, 2019 by guesthttp://m
systems.asm
.org/D
ownloaded from

tions (see Table S1 in the supplemental material). This reference database characterizesthe diversity of the industrialized human gut microbiome on an unprecedented scale;reveals novel relationships with health, lifestyle, and dietary factors; and establishes theAGP resource and infrastructure as a living platform for discovery.
RESULTSCohort characteristics. AGP participants primarily reside in the United States (n �
7,860). However, interest in the AGP rapidly expanded beyond the United States to theUnited Kingdom (n � 2,518) and Australia (n � 321), with 42 other countries or territoriesalso represented (Fig. 1A; see also Table S1 in the supplemental material). Participants in theUnited States inhabit urban (n � 7,317), rural (n � 29), and mixed (n � 98) communities(2010 U.S. Census data based on participant ZIP codes) and span greater ranges of age,race, and ethnicity than other large-scale microbiome projects (2–6).
Using a survey modified from references 7 and 8, participants reported generalhealth status, disease history, and lifestyle data (Table S2 and Text S1). In accordancewith our institutional review board (IRB), all survey questions were optional (medianper-question response, 70.9% [Table S2]). Additionally, 14.8% of participants completed
FIG 1 Population characteristics. (A) Participants across the world have sent in samples to American Gut, although the primary geographic regions ofparticipation are in North America and the United Kingdom; the report that a participant receives is depicted. (B) The primary sample breakdown for subsequentanalyses. Red denotes the reasons that samples were removed. (C) Between the two largest populations, the United States (n � 6,634) and the United Kingdom(n � 2,071), we observe a significant difference in alpha-diversity. (D) In a meta-analysis, the largely industrialized population that makes up American Gutexhibits significant differential abundances compared to nonindustrialized populations.
American Gut: an Open Platform for Microbiome Research
May/June 2018 Volume 3 Issue 3 e00031-18 msystems.asm.org 3
on July 3, 2019 by guesthttp://m
systems.asm
.org/D
ownloaded from

a validated picture-based food frequency questionnaire (FFQ) (VioScreen; http://www.viocare.com/vioscreen.html), and responses correlated well with primary survey dietresponses (Table S2).
We focused our primary investigative efforts on a “healthy adult” subset (n � 3,942)of individuals aged 20 to 69 years with body mass indexes (BMIs) ranging between 18.5and 30 kg/m2; no self-reported history of inflammatory bowel disease (IBD), diabetes,or antibiotic use in the past year; and at least 1,250 16S sequences/sample (Fig. 1Band S1B).
The two largest populations in the data set (United States and United Kingdom)differed significantly in alpha-diversity, with Faith’s phylogenetic diversity (PD) higher inU.K. samples (9) (Mann-Whitney test P � 1 � 10�15) (Fig. 1C). One balance (10) (alog-ratio compositional transform) explained most of the taxonomic separation be-tween U.S. and U.K. samples (area under the curve [AUC] � 77.7%; analysis of variance[ANOVA] P � 1.01 � 10�78, F � 386.85) (Fig. S1C and Table S3). To understand howthese two populations differed from others, we compared adult AGP samples (pre-dominantly from industrialized regions) to samples from adults living traditional life-styles (6, 11, 12) (e.g., hunter-gatherer and remote agrarian populations). As previouslyobserved (6), samples from industrial and traditional populations separated in principal-coordinate analysis (PCoA) space of unweighted UniFrac distances (13) (Fig. S1D).UniFrac is a formal distance metric (14) which computes a dissimilarity based on theamount of unique phylogenetic branch length between two samples. These distancesshow a greater variation within industrial populations than within traditional popula-tions (2) and facile separation based on microbial taxonomy (industrial versus nonin-dustrial agrarian, AUC � 98.9%; ANOVA P � 1.52 � 10�260, F � 1,265.8; industrialversus hunter-gatherer, AUC � 99.5%; ANOVA P � 4.48 � 10�227, F � 1,092.35) (Fig. 1Dand Table S3).
Removal of bacterial blooms. An important practical question is whether self-collected microbiome samples can match those from better-controlled studies. MostAGP samples are stools collected on dry swabs and shipped without preservativeto minimize costs and avoid exposure to toxic preservatives. Escherichia coli and afew other taxa grow in transit, so based on data from controlled-storage studies aspreviously described (15), we removed sub-operational taxonomic units (sOTUs) (16)(median of 7.9% of sequences removed per sample) shown to bloom.
We further characterized the impact of these organisms through culturing, high-performance liquid chromatography mass spectrometry (HPLC-MS) analysis of culturedisolates, and shotgun metagenomics of the primary samples and storage controls (15,17). Culturing primary specimens stored at �80°C (United States, n � 116; UnitedKingdom, n � 73; other, n � 25) showed a strong correlation between the fraction ofsequences reported as blooms in 16S sequencing and positive microbial growthfollowing overnight incubation under aerobic conditions (Fig. 2A). Culture supernatantswere characterized using HPLC-MS; most metabolites in these supernatants wereabsent from the primary specimens (Fig. 2B; see method details in Text S1). Wesequenced draft genomes of 169 isolates; of these, 65 contained the exact E. coli 16Ssequence in the published bloom filter (15). To characterize the impact of the 16S filterfor blooms used exactly as described in reference 15, we computed effect sizes over theparticipant covariates and technical parameters for 9,511 individual participant sam-ples, including and excluding blooms (complete list in Table S2), and observed tightcorrelations for both unweighted (Fig. 2C) (Pearson r � 0.91, P � 3.76 � 10�57;Spearman r � 0.90, P � 9.45 � 10�55) and weighted (Fig. 2D) (Pearson r � 0.42, P �
1.71 � 10�6; Spearman r � 0.58, P � 1.03 � 10�9) UniFrac values, suggesting that thepresence of the blooms does not substantially alter effect sizes of the study variables.An outlier on the quantitative metric (weighted UniFrac) is present and corresponds toa variable representing the fraction of bloom reads in a sample. In Text S1, we furthercompare the ranking of these effect sizes to reference 17. The filter for 16S blooms actsby removing exact sOTUs from the data set prior to rarefaction. This filter is applied to
McDonald et al.
May/June 2018 Volume 3 Issue 3 e00031-18 msystems.asm.org 4
on July 3, 2019 by guesthttp://m
systems.asm
.org/D
ownloaded from

all samples in the data set, including samples from other studies when performingmeta-analyses.
Novel taxa and microbiome configurations. To better understand human micro-biome diversity, we placed AGP samples in the context of the EMP (1). Building on
FIG 2 Blooms and effect sizes. (A) The fraction of 16S reads that recruit to bloom reads defined by Amir et al. (15) is strongly associated with the likelihood formicrobial growth under aerobic culture conditions on rich medium. (B) Overlap of mass spectral features (consensus MS/MS cluster nodes; see Materials andMethods, “Molecular networking”) between AGP samples and blooms. (C) Unweighted UniFrac effect sizes. The inset shows the correlation of effect sizes whenincluding or excluding the bloom 16S reads (Pearson r � 0.91, P � 3.76 � 10�57). (D) Weighted UniFrac effect sizes. The inset shows the correlation of the effectsizes when including or excluding bloom 16S reads (Pearson r � 0.42, P � 1.71 � 10�6); the outlier is the 16S bloom fraction of the sample.
American Gut: an Open Platform for Microbiome Research
May/June 2018 Volume 3 Issue 3 e00031-18 msystems.asm.org 5
on July 3, 2019 by guesthttp://m
systems.asm
.org/D
ownloaded from

earlier work that revealed a striking difference between host-associated and environ-mental microbiomes (18), we found that the distances between pairs of human gutmicrobiomes (just one body site in one vertebrate) are often comparable to thedistances between completely different types of environments and that even the firsttwo dimensions of a PCoA plot capture this intuition visually (Fig. 3A). This intuition isconfirmed by PERMDISP (homogeneity of dispersion) analysis: on average, a randomlychosen AGP fecal sample was more likely to be close to the centroid of the AGP fecaldistribution (distances in the range of 0.1 to 0.2) than a randomly chosen EMP sampleand was less distant on average from the centroid overall (P � 0.001, PERMDISP).However, the maximum distance from the centroid was greater for AGP than EMP (0.65versus 0.58; no statistical analysis possible because this is a single value), matching theintuition from the PCoA plot that the dispersion of the AGP samples is large comparedto individual environments and that the extremes of the spread are comparable to thatof the EMP. Because the maximum distance from the centroid increases with thenumber of samples, this distance would have been expected to be greater for the EMP,which is a larger data set.
Inserting the sOTU fragments of AGP and EMP samples into a Greengenes (19)reference phylogenetic tree using SATé-enabled Phylogenetic Placement (SEPP) (20)(Fig. 3B) showed that the AGP population harbored much broader microbial diversity,as measured by phylogenetic diversity, than the Human Microbiome Project (HMP) (5).
FIG 3 OTU and beta-diversity novelty. (A) The AGP data placed into the context of extant microbial diversity at a global scale. (B) A phylogenetic tree showingthe diversity spanned by the AGP and the HMP in the context of Greengenes and the EMP. (C and D) sOTU novelty over increasing numbers of samples in theAGP (C); the AGP appears to have begun to reach saturation and is contrasted with the data from the work of Yatsunenko et al. (6) (D), which, unlike the AGP,had extremely deep sequencing per sample. (E) The minimum observed UniFrac distance between samples over increasing numbers of samples for the AGPand the HMP; the inset is from 0 to 500 samples. (F) An AGP “trading card” of an sOTU of interest (shown in full in Fig. S2).
McDonald et al.
May/June 2018 Volume 3 Issue 3 e00031-18 msystems.asm.org 6
on July 3, 2019 by guesthttp://m
systems.asm
.org/D
ownloaded from

While the AGP vastly exceeds the phylogenetic diversity observed in the HMP (Faith’sPD, 1,579.6 versus 338.2), both data sets are dwarfed by the breadth of bacterial andarchaeal phylogenetic diversity in environmental samples (Faith’s PD, 17,740.6). Thisresult is expected based on the relative size of the data sets (HMP � AGP � EMP), asFaith’s PD increases with sampling effort until the diversity of a habitat is saturated,which has not yet been achieved for any of these types of samples. We confirmed thatthese differences were statistically significant (P � 0.001) by bootstrap resamplingsamples from each study, measuring the distances again, and examining the fraction ofthe time that the rank order of the PD of the studies differed from that reported (0 of1,000 replicates). Examining sOTUs over increasing numbers of samples, we observeda reduction in the discovery rate of novel sOTUs starting around 3,000 samples,emphasizing the need for focused sampling efforts outside the present AGP population(Fig. 3C). The importance of sample size for detecting novel microbes and microbiomesis apparent when contrasted with the work of Yatsunenko et al. (6), which containedhundreds of samples from three distinct human populations at ~1 million sequences/sample (Fig. 3D). This effect is magnified in beta-diversity analysis, where the AGP hassaturated the configuration space, and new samples are not “distant” from existingsamples (Fig. 3E). To encourage broad scientific engagement with sOTUs found in theAGP, we adapted the EMP “trading cards” for sOTUs (Fig. 3F and S2).
Temporal and spatial analyses. Longitudinal samples are required for understand-ing human microbiome dynamics (21). We examined 565 individuals who contributedmultiple samples and observed an increasing trend of intrapersonal divergence withtime. Still, over time individuals resemble themselves more than others, even after1 year (Fig. 4A).
Recent reports suggest that the microbes of human bodies (8), like those of homes(22), are influenced mostly by local phenomena rather than regional biogeography (23),and accordingly, we observed only weak geographic associations with sOTUs (Fig. 4B),no significant distance-decay relationships (Fig. 4C), and, with Bray-Curtis distance, onlya weak effect at neighborhood sizes of ca. 100 km (Mantel r � 0.036, Benjamini-Hochberg adjusted P � 0.03) to 1,000 km (Mantel r � 0.016, Benjamini-Hochbergadjusted P � 0.03) (Fig. 4D).
We tested whether patterns in individual longitudinal sample sets could be betterexplained when placed in the context of the AGP by integrating samples collected from(i) a time series of 58 time points from one subject (designated LS), prior to andfollowing a large bowel resection; (ii) two time points from 121 patients in an intensivecare unit (ICU) (24); (iii) samples from the “extreme” diet study from the work of Davidet al. (25); and (iv) samples from the Hadza hunter-gatherers for additional context (22).Through the longitudinal sampling of LS, dramatic pre- and postmicrobial configurationchanges that exceeded the span of microbial diversity associated with the AGP pop-ulation were observed (Fig. 4E; animated in reference 26). Immediately after surgery,the subject’s samples more closely resembled those of ICU patients (Kruskal-Wallis H �
79.774, P � 4.197 � 10�19) (Fig. S2A to C) and showed a persistent state change uponreturn to the AGP fecal space. Remarkably, the UniFrac distance between the samplesimmediately prior to and following the surgery was almost identical to the distancebetween a marine sediment sample and a plant rhizosphere sample (unweightedUniFrac distance of 0.78). Furthermore, the observed state change in LS is not system-atically observed in the extreme diet study (Fig. S2D) (PERMANOVA [permutationalmultivariate analysis of variance] not significant [NS] when controlling for individual).Despite extensive dietary shifts, these subjects do not deviate from the backgroundAGP context.
Dietary plant diversity. The self-reported dietary data suggested, unexpectedly,that the number of unique plant species that a subject consumes is associated withmicrobial diversity, rather than self-reported categories such as “vegan” or “omnivore”(Fig. 2C and D). Principal-component analysis (PCA) of FFQ responses (Fig. 5A) revealedclusters associated with diet types such as “vegan.” However, these dietary clusters did
American Gut: an Open Platform for Microbiome Research
May/June 2018 Volume 3 Issue 3 e00031-18 msystems.asm.org 7
on July 3, 2019 by guesthttp://m
systems.asm
.org/D
ownloaded from

FIG 4 Temporal and spatial patterns. (A) Five hundred sixty-five individuals had multiple samples. Distances betweensamples within an individual shown at 1 month, 2 months, etc., out to over 1 year; between-subject distances are
(Continued on next page)
McDonald et al.
May/June 2018 Volume 3 Issue 3 e00031-18 msystems.asm.org 8
on July 3, 2019 by guesthttp://m
systems.asm
.org/D
ownloaded from

not significantly relate to microbiome configurations (Fig. 5B) (Procrustes [Fig. 5A] M2 �
0.988). We therefore characterized the impact of dietary plant diversity, as measuredusing food frequency questionnaires and mass spectrometry (Fig. 5C and D), on themicrobial community.
Using a partial least-squares (PLS) approach (10), we identified several putativeshort-chain fatty acid (SCFA) fermenters associated with eating more than 30 types ofplants, including sOTUs putatively of the species Faecalibacterium prausnitzii and of thegenus Oscillospira (27) (AUC � 68.5%; ANOVA P � 8.9 � 10�39, F � 177.2) (Fig. 5E andTable S3). These data suggest community-level changes associated with microbialfermentation of undigested plant components. Because bacteria differ in their carbo-hydrate binding modules and enzymes that hydrolyze diverse substrates in the gut (28),a diet containing various types of dietary fibers and resistant starches likely supports amore diverse microbial community (29, 30). Studies suggest that these types ofresponses in the gut microbiome to a high-plant diet may be common across verte-brates. For example, core fecal taxa of herbivorous mammals (both hindgut fermentersand ruminants) have been identified to include both Prevotella and Ruminococcaceae(31, 32). Oscillospira in particular has been found to increase in omnivorous lizards feda plant-rich diet (33).
Plant consumption was also associated with a reduction in certain antibiotic resis-tance genes. Individuals who consume more than 30 types of plants per week com-pared to those who consume 10 or fewer plants per week had significantly reducedabundance of antibiotic resistance genes for aminoglycosides, chloramphenicol, andmajor facilitator superfamily (MFS) transporters (antibiotic efflux pumps).
To test these effects in the stool metabolome, we performed HPLC-MS annotationand molecular networking (34, 35) on a subset of fecal samples (n � 219), preferentiallyselecting individuals at the extremes of plant type consumption, i.e., eating �10 or �30different types of plants per week. Several fecal metabolites differed between the twogroups, with one key discriminating feature annotated as octadecadienoic acid (anno-tation level 2 according to the 2007 metabolomics initiative [36]). Further investigationusing authentic standards revealed that the detected feature was comprised of multipleisomers, including linoleic acid (LA) and conjugated linoleic acid (CLA). CLA abundancedid not correlate with dietary CLA consumption as determined by the FFQ (dietary[Fig. 5C]; Spearman r � 0.16; P � 0.15) but was significantly higher in individualsconsuming �30 types of plants and those consuming more fruits and vegetablesgenerally (Fig. 5D) (one-sided t test; P � 10�5). CLA is a known end product of LAconversion by lactic acid bacteria in the gut, such as Lactobacillus plantarum (37) andBifidobacterium spp. (38). FFQ-based dietary levels of LA and MS-detected LA did notdiffer significantly between groups (Fig. S3), suggesting that their different micro-biomes may differentially convert LA to CLA. Several other putative octadecadienoicacid isomers were also detected (Fig. 5F), some strongly correlated with plant con-sumption. Determining these compounds’ identities as well as their origin and functionmay uncover new links between the diet, microbiome, and health.
FIG 4 Legend (Continued)shown as BSD. Even at 1 year, the median distance between a participant’s samples is less than the medianbetween-participant distance. (B) Within the United States, spatial processes of sOTUs appear driven by stochasticprocesses, as few sOTUs exhibit spatial autocorrelation (Moran’s I) on the full data set or partitions (e.g., participantsolder than 20 years). (C) Distance-decay relationship for Bray-Curtis dissimilarities between subject pairs that arewithin a 100-km (great-circle distance) neighborhood radius of one another (Mantel test r � 0.036, adjusted P � 0.03).To avoid the overplotting associated with visualization of the more than 3.4 � 105 pairwise comparisons, wevisualized this relationship using two-dimensional frequency bins; darker colors indicate higher-frequency bins. Solidlines represent fits from linear models to raw data. The inset shows the largest radius (i.e., the contiguous UnitedStates). Axes are the same as in the large panel. (D) Mantel correlogram of estimated Mantel r correlations, significanceof distance-decay relationships, and neighborhood size (x axis). Filled points represent neighborhood sizes for whichdistance-decay relationships were significant (adjusted P values � 0.05). (E) Characterizing a large bowel resectionusing the AGP, the EMP, a hunter-gatherer population, and ICU patients in an unweighted UniFrac principal-coordinate plot. A state change was observed in the resulting microbial community. The change in the microbialcommunity immediately following surgery is the same as the distance between a marine sediment sample and a plantrhizosphere sample.
American Gut: an Open Platform for Microbiome Research
May/June 2018 Volume 3 Issue 3 e00031-18 msystems.asm.org 9
on July 3, 2019 by guesthttp://m
systems.asm
.org/D
ownloaded from

Molecular novelty in the human gut metabolome. Our untargeted HPLC-MSapproach allowed us to search for novel molecules in the human stool metabolome,parallel to our search for novelty in microbes and microbiome configurations describedabove. Bacterial N-acyl amides were recently shown to regulate host metabolism byinteracting with G-protein-coupled receptors (GPCRs) in the murine gastrointestinal
FIG 5 Diversity of plants in a diet. (A) Procrustes analysis of fecal samples from n � 1,596 individuals using principal components of theVioScreen FFQ responses and principal coordinates of the unweighted UniFrac distances (M2 � 0.988) colored by diet; Procrustes teststhe fit of one ordination space to another. PCA shows grouping by diets such as vegan, suggesting that self-reported diet type isconsistent with differences in micronutrients and macronutrients as recorded by the FFQ; however, these dietary differences do notexplain relationships between the samples in 16S space. (B) The full AGP data set, including skin and oral samples, through unweightedUniFrac and principal-coordinate analysis, highlighting a lack of apparent clustering by diet type. (C and D) Dietary conjugated linoleicacid levels as reported by the FFQ between the extremes of plant diversity consumption (C) and the levels of CLA observed by HPLC-MS(D). (E) Differential abundances of sOTUs (showing the most specific taxon name per sOTU) between those who eat fewer than 10 plantsper week and those who eat over 30 per week. (F) The molecules linoleic acid (LA) and conjugated linoleic acid (CLA) (only trans-,trans-isomers are shown) were found to comprise the octadecadienoic acid found to be the key feature in this difference in number ofplants consumed.
McDonald et al.
May/June 2018 Volume 3 Issue 3 e00031-18 msystems.asm.org 10
on July 3, 2019 by guesthttp://m
systems.asm
.org/D
ownloaded from

tract, mimicking host-derived signaling molecules (39). These agonistic moleculesregulate metabolic hormones and glucose homeostasis as efficiently as host ligands.Manipulating microbial genes that encode enzymes that produce specific metaboliteseliciting host cellular responses could enable new drugs or treatment strategies formany major diseases, including diabetes, obesity, and Alzheimer’s disease: roughly 34%of all marketed drugs target GPCRs (40). We observed N-acyl amide molecules previ-ously hypothesized but unproven to be present in the gut (39) (Fig. 6 and Fig. S4), aswell as new N-acyl amides (Fig. 6).
FIG 6 (A) Compound occurrence frequency plot. Examples of compounds originating from food (piperine, black pepper alkaloid), host (stercobilin, hemecatabolism product), and bacterial activity (lithocholic acid, microbially modified bile acid) or exogenous compounds such as antibiotics (rifaximin) or otherdrugs (lisinopril, high blood pressure medication) are shown. (B to E) Alpha- and beta-diversity assessments of antibiotic (B and C) and plant (D and E) cohorts;insets depict minimum observed beta-diversity over increasing samples.
American Gut: an Open Platform for Microbiome Research
May/June 2018 Volume 3 Issue 3 e00031-18 msystems.asm.org 11
on July 3, 2019 by guesthttp://m
systems.asm
.org/D
ownloaded from

Levels of two N-acyl amides, annotated as commendamide (m/z 330.2635 [Fig. S4B])and N-3-OH-palmitoyl ornithine (m/z 387.3220 [Fig. S4C]), positively correlated with aself-reported medical diagnosis of thyroid disease (Kruskal-Wallis false discovery rate[FDR] P � 0.032, P � 2.48 � 10�3, �2 � 11.99; N-3-OH-palmitoyl ornithine, Kruskal-Wallis FDR P � 0.048, P � 5.63 � 10�3, �2 � 10.35). Conversely, glycodeoxycholic acid(m/z 450.3187) was significantly higher in individuals not reporting thyroid diseasediagnosis (Kruskal-Wallis FDR P � 1.28 � 10�4, P � 4.41 � 10�7, �2 � 29.27). This cholicacid is produced through microbial dehydroxylation, again linking gut microbiota toendocrine function (41, 42).
Finally, we compared metabolome diversity to 16S rRNA amplicon diversity in thesamples selected for dietary plant diversity and a second set of samples selected toexplore antibiotic effects (n � 256 individuals who self-reported not having takenantibiotics in the past year [n � 117] or self-reported having taken antibiotics in thepast month [n � 139]; participants were matched for age, BMI, and country). Bycomputing a collector’s curve of observed molecular features in both cohorts (Fig. 6Band D), we observe that, paradoxically, individuals who had taken antibiotics in the pastmonth (n � 139) had significantly greater molecular diversity (Kruskal-Wallis H �
255.240, P � 1.87 � 10�57) than those who had not taken antibiotics in the past year(n � 117) and differed in molecular beta-diversity (Fig. 6B, inset), suggesting thatantibiotics promote unique metabolomes that result from differing chemical andmicrobial environments in the gut. Notably, the diversity relationships of this set are notreflected in 16S diversity (Fig. 6C and E), where antibiotic use shows decreased diversity(Kruskal-Wallis H � 3,983.839, P � 0.0). Within the dietary plant diversity cohort, weobserved a significant increase (Kruskal-Wallis H � 897.106, P � 4.17 � 10�197) inmolecular alpha-diversity associated with a high diversity of plant consumption (n �
42) compared to low plant diversity (n � 43), a relationship also observed in 16Sdiversity, where high dietary plant diversity increased 16S alpha-diversity (Kruskal-Wallis H � 65.817, P � 4.947 � 10�16). Recent antibiotic use (within the last 30 days)was, counterintuitively, associated with a decrease in quinolone resistance genes (seeMaterials and Methods), although not with a change in other families of antimicrobialresistance (AMR) genes. However, these results are difficult to interpret given the widerange of antibiotics taken by subjects, the many confounding variables, and theself-reported nature of the data. Studies in more carefully controlled clinical environ-ments would be needed to make more meaningful statements about the role of theuse of specific antibiotics in modifying the overall antimicrobial resistance profile of thehuman gut microbiome.
Citizen science aspects of the project. The AGP engages citizen scientists boththrough providing an individualized report (Fig. 1A) and through auxiliary resources tosupport human microbiome research, including an online course (Gut Check: ExploringYour Microbiome, https://www.coursera.org/learn/microbiome). Because the AGP iscrowdsourced and self-selected, and subjects generally support the cost of sampleprocessing, the population is unrepresentative in several important respects, includinghaving a lower prevalence of smoking and obesity and having higher education andincome (Fig. S1A) and underrepresentation of Hispanic and African American commu-nities (Table S1); generalization of the results should therefore be treated with caution.Targeted and population-based studies will be crucial for filling these cohort gaps(Text S1). Because of the citizen science nature of the project, we sought tominimize errors and misclassifications well known to occur in self-reported data (43).Survey responses relied on controlled vocabularies. For analyses, we trimmed numericentries at extremes (e.g., weight over 200 kg or below 2.5 kg) and excluded obviouslyincorrect answers (e.g., infants drinking alcohol) and samples for which necessary datawere not supplied (e.g., missing ZIP code data for spatial analyses); see the supple-mental material for details.
To promote public data engagement, we aimed to broaden the citizen scienceexperience obtained by participating in AGP by “gamifying” the data and separately by
McDonald et al.
May/June 2018 Volume 3 Issue 3 e00031-18 msystems.asm.org 12
on July 3, 2019 by guesthttp://m
systems.asm
.org/D
ownloaded from

developing an online forum for microbiome data discussion and discovery. The gami-fication introduces concepts of beta-diversity and challenges users to identify clustersof data in principal-coordinate space (http://csb.cs.mcgill.ca/colonyb/). The forum,called Gut Instinct (http://gutinstinct.ucsd.edu), enables participants to share lifestyle-based insights with one another. Participants also have the option to share their AGPsample barcodes, which will help us uncover novel contextual knowledge. Gut Instinctnow has over 1,050 participants who have collectively created over 250 questions.Participants will soon design and run their own investigations using controlled exper-iments to further understand their own lifestyle and the AGP data.
A living data set. The AGP is dynamic, with samples arriving from around the worlddaily. This allows a living analysis, similar to continuous molecular identification andannotation revision in the Global Natural Products Molecular Networking (GNPS)database (34). Although the analysis presented here represents a single snapshot,samples continued to arrive during preparation of the manuscript. For example, afterwe defined the core “healthy” sample set, an exploratory analysis using matchedcontrols was performed by collaborators to test for correlations between mental illnessand microbiome composition (as reported in references 44 and 45). By analyzingmental illness status (depression, schizophrenia, posttraumatic stress disorder [PTSD],and bipolar disorder—four of the most disabling illnesses per the World HealthOrganization [46]) reported by AGP participants (n � 125) against matched 1:1 healthycontrols (n � 125), we observed a significant partitioning using PERMANOVA inweighted UniFrac (P � 0.05, pseudo-F � 2.36). These findings were reproducible withinU.S. residents (n � 122, P � 0.05, pseudo-F � 2.58), U.K. residents (n � 112, P � 0.05,pseudo-F � 2.16), women (n � 152, P � 0.04, pseudo-F � 2.35), and people 45 yearsof age or younger (n � 122, P � 0.05, pseudo-F � 2.45). We also reproduced somepreviously reported differentially abundant taxa in Chinese populations using our U.K.subset (44, 47) (Table S3). This shows that multicohort replication is possible within theAGP (additional detail in Text S1).
DISCUSSION
The AGP provides an example of a successful crowdfunded citizen science projectthat facilitates human microbiome hypothesis generation and testing on an unprece-dented scale, provides a free data resource derived from over 10,000 human-associatedmicrobial samples, and both recaptures known microbiome results and yields newones. Ongoing living data efforts, such as the AGP, will allow researchers to documentand potentially mitigate the effects of a slow but steady global homogenization drivenby increased travel, life spans, and access to similar diets and therapies, includingantibiotics. Because the AGP is a subproject of the EMP (1), all samples were processedusing the publicly available and widely used EMP protocols to facilitate meta-analyses,as highlighted above. Further examples of applications include assessing the stability ofAGP runs over time and comparing the AGP population to fecal samples collected froma fecal transplant study (48) and an infant microbiome time series (49), the latter usingdifferent DNA sequencing technology, to highlight how this context can provideinsight (50).
A unique aspect of the AGP is the open community process of assembling theResearch Network and analyzing these data, which are released immediately on datageneration. Analysis details are shared through a public forum (GitHub, https://github.com/knightlab-analyses/american-gut-analyses). Scientific contributions to the projectwere made through a geographically diverse Research Network represented here as theAmerican Gut Consortium, established prior to project launch and which has grownover time. This model allows a “living analysis” approach, embracing new research-ers and analytical tools on an ongoing basis (e.g., Qiita [http://qiita.microbio.me] andGNPS [34]). Examples of users of the AGP as a research platform include educators atseveral universities, UC San Diego Athletics, and the American GastroenterologicalAssociation (AGA). Details on projects using the AGP infrastructure can be found in thesupplemental material.
American Gut: an Open Platform for Microbiome Research
May/June 2018 Volume 3 Issue 3 e00031-18 msystems.asm.org 13
on July 3, 2019 by guesthttp://m
systems.asm
.org/D
ownloaded from

The AGP therefore represents a unique citizen science data set and resource,providing a rich characterization of microbiome and metabolome diversity at thepopulation level. We believe that the community process for involving participantsfrom sample collection through data analysis and deposition will be adopted by manyprojects harnessing the power of citizen science to understand the world around andwithin our own bodies.
MATERIALS AND METHODSParticipant recruitment and sample processing. Participants signed up for the project through
Indiegogo (https://www.indiegogo.com) and later FundRazr (http://fundrazr.com/). A contribution to theproject was made to help offset the cost of sample processing and sequencing (typically $99 per sample;no requirement to contribute if another party was covering the contribution). All participants’ consentwas obtained under an approved Institutional Review Board human research subject protocol, eitherfrom the University of Colorado Boulder (protocol no. 12-0582; December 2012 to March 2015) or fromthe University of California, San Diego (protocol no. 141853; February 2015 to present). The IRB-approvedprotocol specifically allows for public deposition of all data that are not personally identifying and forreturn of results to participants (Fig. 1A). This research was performed in accordance with the Universityof Colorado Boulder’s Institutional Review Board protocol number 12-0582 and the University ofCalifornia San Diego’s Human Research Protection Program protocol number 141853.
Self-reported metadata were collected through a web portal (http://www.microbio.me/americangut).Samples were collected using BBL culture swabs (Becton, Dickinson and Company, Sparks, MD) andreturned by mail. Samples collected in Australia and the United Kingdom were shipped using domesticpost within each country to an aggregation site and stored at �80°C at the aggregation site untilshipment to the United States. Shipment to the United States was done on dry ice using a certifiedshipping service. All samples were handled and processed in kind with other American Gut samples. Formore information, please find an extensive benchmark of shipping conditions in reference 17. Allsamples were processed using the EMP protocols. Briefly, the V4 region of the 16S rRNA gene wasamplified with barcoded primers and sequenced as previously described (51). Sequencing prior toAugust 2014 was done using the 515f/806r primer pair with the barcode on the reverse primer (52);subsequent rounds were sequenced with the updated 515f/806rB primer pair with the barcode on theforward read (52). Sequencing batches 1 to 19 and 23 to 49 were sequenced using an Illumina MiSeq;sequencing for batches 20 and 21 was performed with an Illumina HiSeq Rapid Run, and round 22 wassequenced with an Illumina HiSeq High-Output.
16S data processing. The 16S sequence data were processed using a sequence variant method,Deblur v1.0.2 (16), trimming to 125 nucleotides (nt) (otherwise default parameters), to maximize thespecificity of 16S data; a trim of 125 nt was used because one sequencing round in the American Gutused 125 cycles while the rest used 150. Following processing by Deblur, previously recognized bloomsequences were removed (15). The Deblur sOTUs were inserted into the Greengenes 13_8 (19) 99%reference tree using SEPP (20). SEPP uses the simultaneous alignment and tree estimation strategydescribed in reference 53 to identify reasonable placements for sequence fragments within an existingphylogeny and alignment. Taxonomy was assigned using an implementation of the RDP classifier (54) asimplemented in QIIME2 (55). Multiple rarefactions were computed, with the minimum being 1,250sequences per sample with the analyses using the 1,250-sequence set except where noted explicitly.Rarefaction was used to mitigate uneven sequencing depth in accordance with the benchmarking inreference 56. Diversity calculations were computed using scikit-bio 0.5.1 with the exception of UniFrac(13), which was computed using an unpublished algorithmic variant, Striped UniFrac (https://github.com/biocore/unifrac), which scales to larger data sets and produces results identical to previouslypublished UniFrac algorithms. In brief, unweighted UniFrac computes a dissimilarity between twosamples by summing up the amount of branch length that is unique to each sample and divides this bythe sum of the branch length that is common to the two samples.
Metadata curation. To address the self-reported nature of the AGP data and the ongoing nature ofthe project, basic filtering was performed on the age, height, weight, and body mass index (BMI). Heightand weight were gated to consider heights only between 48 cm and 210 cm and weight between 2.5 kgand 200 kg. BMI calculations using values outside this range were not considered. We assumed that agewas misreported by any individual who reported a birthdate after the sample was collected. We alsoassumed that age was misreported for participants who reported an age of less than 4 years but heightover 105 cm, weight over 20 kg, or any alcohol consumption. Values assumed to be incorrect weredropped from analyses (see Fig. S1B in the supplemental material).
Sample selection. Analyses in this paper were performed on a subset of the total AGP samples. Asingle fecal sample was selected for each participant with at least one fecal sample that amplified to1,250 sequences per sample unless otherwise noted. Priority was given to samples that were associatedwith VioScreen (http://www.viocare.com/vioscreen.html) metadata.
The samples used for analysis and subsets used in various analyses are described in Table S2. Briefly,we defined the healthy subset (n � 3,942) as adults aged 20 to 69 years with a BMI between 18.5 and30 kg/m2 who reported no history of inflammatory bowel disease (IBD) or diabetes and no antibiotic usein the last year. There were 1,762 participants who provided results for the VioScreen food frequencyquestionnaire (FFQ; http://www.viocare.com/vioscreen.html). The meta-analysis with non-Western sam-ples (n � 4,643) included children over the age of 3 years and adults with a BMI of between 18.5 and
McDonald et al.
May/June 2018 Volume 3 Issue 3 e00031-18 msystems.asm.org 14
on July 3, 2019 by guesthttp://m
systems.asm
.org/D
ownloaded from

30 kg/m2 and no reported history of inflammatory bowel disease, diabetes, or antibiotic use in the lastyear.
Population-level comparisons. Population-level comparisons were calculated for all American Gutparticipants living in the United States. BMI categorization was considered only for adults over the ageof 20 years, since the description of BMI in children is based on their age and sex. Education level wasconsidered for adults over the age of 25 years. This threshold was used to match the available data fromthe U.S. Census Bureau (57). The percentage of the American Gut participants was calculated as thefraction of individuals who reported results for that variable. U.S. population data are from the 2010census (58); U.S. Census Bureau reports (57); Centers for Disease Control reports on obesity (59), diabetes(60), inflammatory bowel disease (IBD) (61), and smoking (62); and a report from the Williams Institute(63) (Table S2).
Alpha- and beta-diversity analyses within American Gut. OTU tables generated in the primaryprocessing step were rarefied to 1,250 sequences per sample. Shannon, observed OTU, and PD whole-tree diversity metrics were calculated as the mean of 10 rarefactions using QIIME (9, 55). Alpha-diversityfor single metadata categories was compared with a Kruskal-Wallis test. Unweighted UniFrac distancebetween samples was tested with PERMANOVA (64) and permuted t tests in QIIME.
Balances. The goal of this analysis was to design two-way classifiers to classify samples and sOTUs.This will allow us to identify sOTUs that are strongly associated with a given environment. To do thiswhile accounting for issues due to compositionality, we used balances (10) constructed from partialleast-squares (65).
First, the sOTU table was centered log ratio (CLR) transformed with a pseudocount of 1. Partialleast-squares discriminant analysis (PLS-DA) was then performed on this sOTU table using a single PLScomponent, using a binary categorical variable as the response and the CLR-transformed sOTU table asthe predictor. This PLS component represented an axis, which assigns scores to each OTU according tohow strongly associated it is with each class. An sOTU with a strong negative score indicates anassociation for the one category, which we will designate the negative category. An sOTU with a strongpositive score indicates that sOTU is strongly associated with the other category, which we will designatethe positive category.
We assumed that PLS scores associated with each OTU were normally distributed. Specifically
score�xpos�i�� � N��pos, �pos
2 �score�xneg
�i�� � N��neg, �neg2 �
score�xnull�i� � � N��null, �null
2 �where �null � 0, �neg � 0, and �pos � 0. To obtain estimates of these normal distributions, Gaussianmixture models with three Gaussians were fitted from the PLS scores. Thresholds were determined fromthe intersection of Gaussians. The OTUs with PLS scores less than the intersection N��null, �null
2 � and N��neg, �neg
2 � are classified as associated with the negative category. The OTUs with PLS scores greater thanthe intersection N��null, �null
2 � and N��pos, �pos2 � are classified as associated with the positive category.
The balance was constructed as follows
b � � |xpos||xneg||xpos| � |xneg|
log�g�xpos�g�xneg��
From this balance, we calculated receiver operator characteristic (ROC) curves and AUC to assess theclassification accuracy and ran ANOVA to assess the statistical significance. The dimensionality wasshrunk through some initial filtering (an sOTU must have at least 50 reads, must exist in at least 20samples except where noted, and must have a variance over 10 to remove sOTUs that do not appear tochange), so that the number of samples is greater than the number of sOTUs to reduce the likelihoodof overfitting. This technique was used to investigate differences due to plant consumption, country ofresidence, and Western versus non-Western samples and was consistently applied with the exceptionthat a filter of 5 samples was used for the Western–versus–non-Western analysis due to group samplesizes.
Balances on plant consumption were constructed using partial least-squares. Only samples frompeople who consumed fewer than 10 types of plants a week or more than 30 types of plants a week wereconsidered.
Meta-analysis of samples from the American Gut and from individuals living agrarian andhunter-gatherer lifestyles. A meta-analysis compared fecal samples collected from healthy individualswho were 3 years of age or older and included in the AGP data set to a previously published 16S rRNAV4 region data set that included healthy people living an industrialized, remote agrarian, or hunter-gatherer lifestyle (6, 11, 12). The AGP subset of healthy individuals was determined by filtering by themetadata columns “subset_antibiotic,” “subset_ibd,” and “subset_diabetes” and, for individuals over theage of 16 years, “subset_bmi.” All data sets were processed using the Deblur pipeline as noted above,with the exception that all reads in the meta-analysis, including AGP data, were trimmed to 100 nt toaccommodate the read length in the work of Yatsunenko et al. (6). Bloom reads as described above wereremoved from all samples. We used Striped UniFrac as noted above to estimate beta-diversity (un-weighted UniFrac) and EMPeror software (66) version 0.9 to visualize principal coordinates. We used anonparametric PERMANOVA with 999 permutations to test for significant differences in fecal micro-biomes associated with industrialized, remote agrarian, and hunter-gatherer lifestyles. All AGP sampleswere considered to be from people living an industrialized lifestyle. Balances were constructed from
American Gut: an Open Platform for Microbiome Research
May/June 2018 Volume 3 Issue 3 e00031-18 msystems.asm.org 15
on July 3, 2019 by guesthttp://m
systems.asm
.org/D
ownloaded from

partial least-squares to assess the differences between the hunter-gatherer and industrialized popula-tions and between the remote farmers and industrialized populations.
Spatial autocorrelation. We sought to investigate distance-decay patterns—the relationship be-tween microbial community similarity and spatial proximity—among American Gut participants, todetermine the extent to which geographical distances could explain variation in microbial communitytaxonomic compositions between participant pairs. The correlation between community-level Bray-Curtis (67) distances and participants’ spatial proximities (i.e., great-circle distances, kilometers) wasassessed using a Mantel test (68) with 1,000 matrix permutations. Analyses were conducted using thesubset of participants located in the continental United States who had not received antibiotics in thelast year. Different neighborhood sizes were investigated in order to detect the relevant spatial scale onwhich significant distance-decay patterns in microbial community compositions emerged. To accomplishthis, we computed distance-decay relationships for a series of model adjacencies corresponding toneighborhood radii of 100, 500, 1,000, 2,500, and 4,500 km among participants and adjusted P valuesfor multiple comparisons using the Benjamini-Hochberg procedure (69). We also studied spatialcorrelations in phylogenetic community dissimilarities, calculated as weighted normalized UniFracdistances, using the procedure described above. Analyses were conducted in the R statisticalprogramming environment.
The spatial autocorrelation of each individual taxon was assessed using Moran’s I statistic (70). Taxapresent in fewer than 10 samples were filtered, since these would not be sufficiently powered. Analyseswere conducted using binary spatial weight matrices, with neighborhoods of 0 to 50 km, 50 to 100 km,and 100 to 250 km. The different neighborhoods were useful for detecting spatial autocorrelation atdifferent scales. All spatial weight matrices were row standardized. We checked for spatial autocorrela-tion at three taxonomic ranks: class, genus, and OTU. We also considered whether there was autocor-relation within subsets of individuals who were under 20 years old and between 20 and 70 years old;those having IBD, no IBD, diabetes, and no diabetes; and those who had taken antibiotics within the pastweek or year or not within the past year. The results presented above did not qualitatively depend onthe subset of individuals considered. Statistical significance was assessed using permutation tests, whichwere implemented using a Markov chain Monte Carlo algorithm. To assess each P value, 100 chains wererun each starting from a different random permutation. Each chain had 1,000 iterations. We usedBonferroni corrections to correct for multiple comparisons, with an overall significance level set to 0.05.Analyses were run using custom Java code, optimized for running many spatial autocorrelation analyseson large data sets (71).
Metadata cross-correlation. To account for covariance among metadata for effect size and variationanalyses, we examined the correlation between individual metadata variables, including technicalparameters. Groups in ordinal variables were combined if there was insufficient sample size (e.g., peoplewho reported sleeping less than 5 h were combined with those who reported sleeping 5 to 6 h into avariable described as “less than 6”). The same transformations were used for effect size analysis. Anygroup with fewer than 25 total observations was ignored during analysis; if this resulted in a metadatacolumn having no groups, the column was removed from analysis. The relationship between continuousand ordinal covariates was calculated using Pearson’s correlation. Ordinal and categorical covariates werecompared using a modified Cramér V statistic (72). Continuous and categorical covariates were comparedwith a Welch t test (72). We used 1 � R as a distance between the covariates. Traversing the resultingbinary, weighted cluster tree starting at tip level into the direction of the root, i.e., bottom up, wegrouped tips together that are members of the same subtree after covering a distance of approximately0.5 (branch length 0.29). A representative variable from each cluster was selected for analysis (Table S2).
Effect size calculations. Effect size was calculated on 179 covariates (including technical parame-ters), selected from the cross correlation (Table S2). Ordinal groups with small sample sizes at the extremewere collapsed as noted above. Individuals who reported self-diagnosis or diagnosis by an alternativepractitioner for medical conditions were excluded from the analysis. Any metadata variable with fewerthan 50 observations per group or that made up less than 3% of the total number of respondents wasalso excluded from the effect size analysis. Continuous covariates were categorized into quartiles. Foreach one of the 179 variables, we applied the mixed directional FDR (mdFDR) (73) methodology to testfor the significance of each pairwise comparison among the groups. For each significant pairwisecomparison, we computed the effect size using Cohen’s d (74) or the absolute difference between themean of each group divided by the pooled standard deviation. For analysis of diversity, we used Faith’sphylogenetic diversity (alpha-diversity) and weighted and unweighted UniFrac distances (beta-diversity).
Variation analysis. Using the methodology reported in the supplemental material of reference 4, wecomputed Adonis (75) using 1,000 permutations, over the sample sets used in the effect size calculationsas noted above, and applied Benjamini-Hochberg correction (FDR � 0.1) to assess drivers of variation inbeta-diversity.
Meta-analysis movie. American Gut samples from all body sites were combined with data from aninfant time series (ITS) (49), a fecal transplant study (44), and recent work characterizing the microbiomeof patients in the intensive care unit (24). The combination of the data sets in the figshare supplementarymovie S2 in reference 50 required that all sequences were trimmed to an even length of 125 nucleotides.All projects except for the infant time series were sequenced using an Illumina instrument. In order tocombine the data, we expressed the Illumina and non-Illumina data through a common referencedatabase. Specifically, the Deblur sOTUs from the Illumina data were mapped against the Greengenes(19) database (13_8 release) using 99% similarity; the associations between the input sOTUs, and theircluster memberships, were used to construct an OTU table based on the original sOTU-per-samplesequence counts (i.e., summing the counts for all sOTUs in a common OTU). The infant time series data
McDonald et al.
May/June 2018 Volume 3 Issue 3 e00031-18 msystems.asm.org 16
on July 3, 2019 by guesthttp://m
systems.asm
.org/D
ownloaded from

were picked using a closed reference OTU picking approach against the same reference at the samesimilarity. The infant time series data set followed a closed reference OTU picking approach using 99%similarity. The resulting two tables (from Illumina-generated data and the ITS data set) were merged andanalyzed using the Greengenes 99% tree. The table was rarefied to 1,250 sequences per sample.Principal-coordinate projections were calculated based on unweighted UniFrac distance (13). Theprincipal-coordinate analysis was visualized and animated in EMPeror 1.0.0-beta8-dev (66, 76). The moviewas captured in QuickTime (Apple, Cupertino, CA) and edited with Premiere Pro (Adobe, San Jose, CA).
Integration with the Earth Microbiome Project. A precomputed 100-nt Deblur BIOM table repre-senting the data in reference 1 was obtained from ftp://ftp.microbio.me/emp/release1/otu_tables/deblur/. One-hundred-nucleotide (100-nt) Deblur tables were also obtained from Qiita for Hadza fecalsamples (Qiita study identifier [ID] 11358 [22]), ICU microbiome samples (Qiita study ID 2136 [24]), anda longitudinal series which includes samples immediately prior to and following a large bowel resection(Qiita study ID 10283, EBI accession no. ERP105968, unpublished); all samples were processed using theEMP Illumina 16S V4 protocol. The EMP data set used a minimum sOTU count of 25; the samethreshold was applied to the other data sets included prior to merge. Blooms as identified by themethod in reference 15 were removed from all samples. This collection of BIOM tables was thenmerged, yielding an OTU table representing 40,600 samples. sOTUs were restricted to those alreadypresent in the EMP 100-nt fragment insertion tree, which represents 329,712 sOTUs. The table wasthen rarefied to 1,000 sequences per sample, and unweighted UniFrac was computed using 768processors with the aforementioned Striped algorithm. Visualizations and animations were per-formed using EMPeror v1.0.0b12.dev0.
Extreme diet study state assessment. The sequence data from reference 25 were processed byDeblur to assess 16S sOTUs in common with the AGP processing above. In order to assess a statedifference with PERMANOVA, we needed to control for sample independence within the longitudinalsampling. To do so, we randomly selected one sample from each individual per diet, computedPERMANOVA, and repeated the process 100 times. None of the trials produced a P value below 0.05.
VioScreen PCA and diet type Procrustes analysis. Before performing principal-component analysis(PCA) on the informal diet questions, VioScreen variables that were categorical or received less than a90% response among the 1,762 participants were excluded, leaving 1,596 participants. PCA was thenperformed using the VioScreen information from these participants’ responses over 207 VioScreenquestions and then colored by their types of diet as answered in the AGP informal food survey. Thecoordinates from the PCA were extracted. For the same samples, PCoA of unweighted UniFrac distanceswas computed on the 16S data subset from the primary processing set. The coordinates from the PCAand the PCoA were assayed for a measure of fitness using Procrustes as implemented in QIIME v1.9.1.
Beta-diversity added. To assess added beta-diversity, we applied the technique used in reference5 (Fig. 3). Specifically, we randomly sampled n samples from the distance matrix 10 times, over anincreasing value of n. For each set of sampled distances, we computed the minimum observed distance.
sOTU novelty. To assess sOTU novelty, we randomly sampled n samples from an sOTU table 10times, over an increasing value of n. At each sampling, we computed the number of sOTUs observed withread counts within minimum thresholds. In other words, a minimum threshold of 1 is the number ofsingletons observed in the sampled set, a minimum threshold of 2 is the number of singletons anddoubletons, etc.
Within-individual beta-diversity. Many of the individuals in the American Gut Project contributedmultiple samples but at uneven time intervals. In order to explore intrapersonal variation, we replicatedthe analysis in the work of Lloyd-Price et al. (77) (Fig. 3). Specifically, we determined all time deltasbetween a subject’s samples and gathered the distributions of beta-diversity between any two samplesbinned by month. An individual is represented only a single time in a given month but may berepresented in multiple months if the individual had, for instance, contributed samples over the courseof a year.
HPLC-MS analysis. A total of 498 samples were selected for analysis via mass spectrometry.Specifically, two groups were chosen. First, given the large body of primary literature describing thenegative impact of antibiotics on the gut microbiome, and the general interest in this topic from manyAmerican Gut participants, we chose 279 samples from individuals (age, BMI, and country matched) whoself-reported not having taken antibiotics in the past year or reported having taken antibiotics in the pastmonth or week. We chose a second group of 219 samples collected from individuals who answered thequestion “In an average week, how many different plants do you eat? (e.g., if you consume a can of soupthat contains carrots, potatoes, and onion, you can count this as 3 different plants; if you consumemultigrain bread, each different grain counts as a plant. Include all fruits in the total)” on the mainAmerican Gut Project main survey and who had also completed the VioScreen food frequency ques-tionnaire. When American Gut participants collect samples, they do so on a double-headed swab;therefore, all samples chosen for this analysis had one remaining swab head (the first had been used forDNA extraction and microbiome sequencing).
Cell culture sample preparation for metabolomics analysis. The supernatants collected from cellcultures (see “Expanded bloom assessment” below) were processed to make them compatible withHPLC-MS analysis. The solid-phase extraction (SPE) with wash was carried out to reduce the impact of cellculture medium, which is highly detrimental for the electrospray ionization (ESI). The 30-mg sorbentOasis HLB (Waters, Waltham, MA) SPE cartridges were used to achieve broad metabolite coverage. Thecell samples were stored at �80°C and thawed at room temperature immediately prior to extraction. Thethawed samples were then centrifuged for 10 min at 1,200 rpm and extracted. For the SPE, the Oasis HLBSPE cartridge was conditioned with 700 �l of 100% HPLC-grade methanol and equilibrated with 700 �l
American Gut: an Open Platform for Microbiome Research
May/June 2018 Volume 3 Issue 3 e00031-18 msystems.asm.org 17
on July 3, 2019 by guesthttp://m
systems.asm
.org/D
ownloaded from

of HPLC-grade deionized (DI) water. The cell supernatant (~350 to 400 �l) was loaded into the cartridgeand allowed to slowly elute. The loaded SPE wells were then washed with 800 �l of 5% methanol inwater, and the absorbed material was slowly eluted with 200 �l of 100% methanol. Vacuum up to~20 lb/in2 was applied for the wells that did not elute within an hour. The collected eluent was storedat �20°C until the HPLC-MS analysis.
Fecal sample preparation for metabolomics analysis. The swab tubes scheduled for analysis wereremoved from the �80°C freezer and placed on dry ice for the duration of sample processing. Each tubewith a swab was logged by reading the barcode with a barcode scanner, and the swab was removedfrom the tube and placed onto a Thermo Fisher Scientific (Waltham, MA) 2-ml deep-well 96-well plateset on top of dry ice coolant. The top part of each swab’s stick was snapped off and discarded.Immediately after all of the wells were filled with swabs, 200 �l of HPLC-grade 90% (vol/vol) ethanol-water solvent was added to each well using a multichannel pipette. Four blanks of unused swabs andextraction solvent were included onto each plate. Each plate was then sealed with a 96-well plate lid,sonicated for 10 min, and placed into the refrigerator at 2°C to extract samples overnight. Afterextraction, the swabs were removed from wells and discarded, the plates were placed into a lyophilizer,and the entire sample was dried down and then resuspended in 200 �l 90% (vol/vol) ethanol-water. Theplates were resealed and centrifuged at 2,000 rpm for 10 min. The 100-�l aliquots of sample were thentransferred onto a Falcon 96-well MS plate using a multichannel pipette, and each plate was immediatelysealed with sealing film. The MS plates were centrifuged at 2,000 rpm for 10 min and stored at 2°C untilanalysis.
HPLC-MS analysis. The metabolomics analysis of samples was conducted using reverse-phase (RP)high-performance liquid chromatography mass spectrometry (HPLC-MS). The HPLC-MS analysis wasperformed on a Dionex UltiMate 3000 Thermo Fisher Scientific high-performance liquid chromatographysystem (Thermo Fisher Scientific, Waltham, MA) coupled to a Bruker Impact HD quadrupole time of flight(qTOF) mass spectrometer. The chromatographic separation was carried out on a Kinetex C18 1.7-�m,100-Å ultrahigh-performance liquid chromatography (UHPLC) column (50 mm by 2.1 mm) (Phenomenex,Torrance, CA), held at 40°C during analysis. A total of 5 �l of each sample was injected. Mobile phase Awas water, and mobile phase B was acetonitrile, both with added 0.1% (vol/vol) formic acid. The solventgradient table was set as follows: initial mobile phase composition was 5% B for 1 min, increased to 40%B over 1 min and then to 100% B over 6 min, held at 100% B for 1 min, and decreased back to 5% B in0.1 min, followed by a washout cycle and equilibration for a total analysis time of 13 min. The scannedm/z range was 80 to 2,000, the capillary voltage was 4,500 V, the nebulizer gas pressure was 2 � 105 Pa,the drying gas flow rate was 9 liters/min, and the temperature was 200°C. Each full MS scan was followedby tandem MS (MS/MS) using collision-induced dissociation (CID) fragmentation of the seven mostabundant ions in the spectrum. For MS/MS, the collision cell collision energy was set at 3 eV and thecollision energy was stepped 50%, 75%, 150%, and 200% to obtain optimal fragmentation for differen-tially sized ions. The scan rate was 3 Hz. An HP-921 lock mass compound was infused during the analysisto carry out postprocessing mass correction.
MS data analysis. The collected HPLC-MS raw data files were first converted from Bruker’s d tomzXML format and then processed with the open-source OpenMS 2.0 software (78) in order todeconvolve and align each peak across different chromatograms (feature detection). The alignmentwindow was set at 0.5 min, the noise threshold was set at 1,000 counts, the chromatographic peak fullwidth at half-maximum (FWHM) value was set at 20, and the mass error was set at 30 ppm. All of thepeaks that were present in any of the blanks with a signal-to-noise ratio (S/N) below 10:1 were removedfrom the final feature table. The number of features with corresponding MS/MS was as follows: VioScreenstudy sample cohort, 5,144 total MS2 features; antibiotic study sample cohort, 8,288 total MS2 features.The number of MS1 features is difficult to estimate exactly as it depends on feature detection settingsand the number of samples, but it is typically about 4- to 5-fold greater depending on the sample. Forall of the MS1 features detected across all samples, only ~1 to 5% are (35) present in an individual sample.
Molecular networking. Raw mass spectrometry data files were converted to the .mzXML formatusing Bruker Data Analysis software and uploaded to the GNPS (https://gnps.ucsd.edu/) MassIVE massspectrometry database (https://massive.ucsd.edu/). Molecular networking (35) was performed to identifyspectra shared between different sample types and to identify known molecules in the data set. Allannotations are at level 2/3 according to the proposed minimum standards in metabolomics (36). Thedata were filtered by removing all MS/MS peaks within �17 Da of the precursor m/z. MS/MS spectra werewindow filtered by choosing only the top 6 peaks in the �50-Da window throughout the spectrum. TheMS spectra were then clustered with the MS-Cluster algorithm with a parent mass tolerance of 0.02 Daand an MS/MS fragment ion tolerance of 0.02 Da to create consensus spectra (34, 75). Further, consensusspectra that contained fewer than 4 spectra were discarded. A network was then created where edgeswere filtered to have a cosine score above 0.65 and more than 5 matched peaks. The edges between twonodes were kept in the network if and only if each of the nodes appeared in each other’s respective top10 most similar nodes. The spectra in the network were then searched against GNPS spectral libraries(34). The library spectra were filtered in the same manner as the input data. All library matches wererequired to have a score above 0.7 and at least 6 matched peaks. Molecular networks were visualized andmined using Cytoscape software (79).
Chemical annotations were carried out by automatic matching of fragmentation spectra to multipledatabases using Global Natural Product Social Molecular Networking (GNPS) (34) and then examining thedata at the MS/MS level by molecular networking (35). The goal is to retrieve spectra with identical andsimilar fragmentation patterns and combine them into consensus nodes and clusters, respectively. Theconsensus node spectra are then compared against public MS/MS libraries to provide molecular annotations
McDonald et al.
May/June 2018 Volume 3 Issue 3 e00031-18 msystems.asm.org 18
on July 3, 2019 by guesthttp://m
systems.asm
.org/D
ownloaded from

(80). Further annotations could be suggested by examining the molecular network (35) (enabling thepropagation of annotations). The links to the job for the molecular networks used for this study can be foundat http://gnps.ucsd.edu/ProteoSAFe/status.jsp?task�9bd16822c8d448f59a03e6cc8f017f43 (antibiotic sub-set) and http://gnps.ucsd.edu/ProteoSAFe/status.jsp?task�d26ae082b1154f73ac050796fcaa6bda (typeof plant subset).
Molecular networking-based propagation of annotations. Library matching was done with theGNPS reference library; however, many nodes that have no annotations are matched to a neighboringnode that did have a match. Consequently, manual annotation of compounds was carried out in twosteps. The exact mass of compounds and their MS/MS fragmentation spectra were matched to thereference spectra found in supplementary information in reference 39 (Fig. S4A). In addition, commen-damide and its analog were identified by matching the exact mass of the corresponding ion and by insilico prediction of the MS/MS fragmentation spectra with CSI:FingerID (81) (Fig. S4B). For novelmolecules that were found within the cluster of compounds of interest but were not described in theliterature previously, the structure was postulated using annotation propagation from adjacent anno-tated nodes in the cluster as described in reference 34 by assessing differences in parent mass andfragmentation patterns. Annotations obtained with precursor and MS/MS matching are considered level2 or 3 annotations according to the 2007 metabolomics standards initiative (36). All molecular network-ing analyses and annotations are available here: antibiotic use subset (82), type of plant subset (83), cellcultures of isolates (84), and fecal samples conetworked with the cell cultures (85). The raw data containa significant number of abundant features originating from swab polymers. Therefore, selective back-ground peak removal was carried out specifically for the polymer compounds originating from swabsthat were used for the sample collection. The m/z shifts that correspond to the polymer repeating units(44.0262, 88.0524, 132.0786, and 176.1049) were identified with the GNPS m/z difference frequency plot.The network clusters that contained nodes with the corresponding mass differences were deemed tobelong to polymers, and all member nodes of the network clusters were removed from the feature table(a total of 1,632 features/nodes). Principal-coordinate analysis (PCoA) using a Hellinger distance (86)matrix was used to confirm that the batch effect corresponding to the batches of swabs was mitigatedprior to further analysis. To confirm putative annotations, authentic standards were purchased for linoleicacid (LA; Spectrum Laboratory Products, Inc., USA), conjugated linoleic acid (CLA; mixture of 4 isomers:9,11 and 10,12 isomers, E and Z) (Sigma-Aldrich, USA), and selected antibiotics—tetracycline, oxytetra-cycline, and doxycycline (Abcam Inc., USA). For level 1 identifications, each authentic compound wasanalyzed under identical experimental conditions and retention times (RTs) and MS/MS spectra werecompared with putatively annotated compounds.
Molecular networking-based propagation of annotations for the N-acyl ligands. The annotationof GPCR agonist compounds was not possible via direct library matching, as their spectra are not presentin any MS libraries, but direct comparison with fragmentation patterns presented in reference 36 allowedus to establish these compounds’ identity with level 3 identification. Consequently, manual annotationof compounds was carried out in two steps. The exact mass of compounds and their MS/MS fragmen-tation spectra were matched to the reference spectra found in the supplemental material (Fig. S4A).Compound m/z 611.5357 was identified in this fashion. In addition, commendamide (330.2640) and itsanalog (m/z 344.2799) were identified by matching the exact mass of the corresponding ion and by insilico prediction of the MS/MS fragmentation spectra with CSI:FingerID (81) (Fig. S4B). For novelmolecules that were found within clusters of compounds of interest but were not described in theliterature previously, the structure was postulated using annotation propagation from adjacent anno-tated nodes in the cluster as described in reference 34 by assessing differences in parent mass andfragmentation patterns. The key structure, m/z 387.322, has been annotated as N-3-OH-palmitoylornithine based on the exact mass and previous annotation (39) as well as analysis of fragmentationpatterns to confirm structural moieties of fragments (Fig. S4C). The rest of the structural assignmentshave been propagated from that structure. The ornithine moiety has been determined to be present ineach structure (due to the presence of the signature ion with m/z 115.09), and acylation of the hydroxylis not possible due to insufficient mass of the structures; thus, the changing mass was postulated tocorrespond to different lengths of the alkyl substituent (Fig. 6).
Selective feature detection. Selective feature extraction was performed with open-source MZmineb2software (87). To separate closely eluting LA and CLA isomers as well as separate various N-acyl amides,crop filtering with a retention time (RT) range of 5.4 to 6.0 min and an m/z range of 281.246 to 281.248was applied to all chromatograms. Mass detection was performed with a signal threshold of 1.0E2 andan 0.6-s minimum peak width. The mass tolerance was set to 20 ppm, and the maximum allowedretention time deviation was set to 5 s. For chromatographic deconvolution, the baseline cutoffalgorithm with a 5.0E1 signal threshold was used. The maximum peak width was set to 0.5 min. Similarly,the MS feature for the reference compound stercobilin was extracted with a crop filter RT range of 2.0to 4.0 min and an m/z range of 595.345 to 595.355. The stercobilin reference compound was used toassess the variability of chromatographic retention times to ensure that the retention times of com-pounds of interest (LA and CLA in particular) were correctly identified. After isotope peak removal, thepeak lists of all samples were aligned within the corresponding retention time and mass tolerances. Gapfilling was performed on the aligned peak list using the peak finder module with 1% intensity, 10-ppmm/z tolerance, and 0.05-min RT tolerance, respectively. After the creation and export of a feature matrixcontaining the feature retention times, exact mass, and peak areas of the corresponding extracted ionchromatograms, we added sample metadata to the feature matrix metadata of the samples.
American Gut: an Open Platform for Microbiome Research
May/June 2018 Volume 3 Issue 3 e00031-18 msystems.asm.org 19
on July 3, 2019 by guesthttp://m
systems.asm
.org/D
ownloaded from
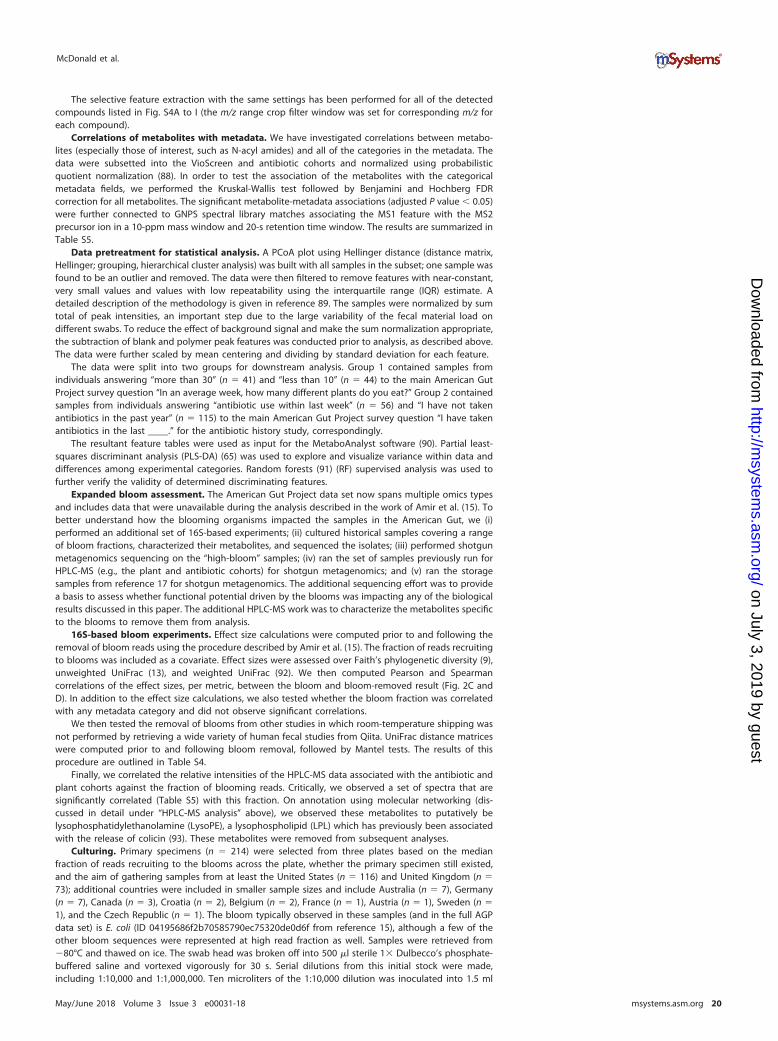
The selective feature extraction with the same settings has been performed for all of the detectedcompounds listed in Fig. S4A to I (the m/z range crop filter window was set for corresponding m/z foreach compound).
Correlations of metabolites with metadata. We have investigated correlations between metabo-lites (especially those of interest, such as N-acyl amides) and all of the categories in the metadata. Thedata were subsetted into the VioScreen and antibiotic cohorts and normalized using probabilisticquotient normalization (88). In order to test the association of the metabolites with the categoricalmetadata fields, we performed the Kruskal-Wallis test followed by Benjamini and Hochberg FDRcorrection for all metabolites. The significant metabolite-metadata associations (adjusted P value � 0.05)were further connected to GNPS spectral library matches associating the MS1 feature with the MS2precursor ion in a 10-ppm mass window and 20-s retention time window. The results are summarized inTable S5.
Data pretreatment for statistical analysis. A PCoA plot using Hellinger distance (distance matrix,Hellinger; grouping, hierarchical cluster analysis) was built with all samples in the subset; one sample wasfound to be an outlier and removed. The data were then filtered to remove features with near-constant,very small values and values with low repeatability using the interquartile range (IQR) estimate. Adetailed description of the methodology is given in reference 89. The samples were normalized by sumtotal of peak intensities, an important step due to the large variability of the fecal material load ondifferent swabs. To reduce the effect of background signal and make the sum normalization appropriate,the subtraction of blank and polymer peak features was conducted prior to analysis, as described above.The data were further scaled by mean centering and dividing by standard deviation for each feature.
The data were split into two groups for downstream analysis. Group 1 contained samples fromindividuals answering “more than 30” (n � 41) and “less than 10” (n � 44) to the main American GutProject survey question “In an average week, how many different plants do you eat?” Group 2 containedsamples from individuals answering “antibiotic use within last week” (n � 56) and “I have not takenantibiotics in the past year” (n � 115) to the main American Gut Project survey question “I have takenantibiotics in the last ____.” for the antibiotic history study, correspondingly.
The resultant feature tables were used as input for the MetaboAnalyst software (90). Partial least-squares discriminant analysis (PLS-DA) (65) was used to explore and visualize variance within data anddifferences among experimental categories. Random forests (91) (RF) supervised analysis was used tofurther verify the validity of determined discriminating features.
Expanded bloom assessment. The American Gut Project data set now spans multiple omics typesand includes data that were unavailable during the analysis described in the work of Amir et al. (15). Tobetter understand how the blooming organisms impacted the samples in the American Gut, we (i)performed an additional set of 16S-based experiments; (ii) cultured historical samples covering a rangeof bloom fractions, characterized their metabolites, and sequenced the isolates; (iii) performed shotgunmetagenomics sequencing on the “high-bloom” samples; (iv) ran the set of samples previously run forHPLC-MS (e.g., the plant and antibiotic cohorts) for shotgun metagenomics; and (v) ran the storagesamples from reference 17 for shotgun metagenomics. The additional sequencing effort was to providea basis to assess whether functional potential driven by the blooms was impacting any of the biologicalresults discussed in this paper. The additional HPLC-MS work was to characterize the metabolites specificto the blooms to remove them from analysis.
16S-based bloom experiments. Effect size calculations were computed prior to and following theremoval of bloom reads using the procedure described by Amir et al. (15). The fraction of reads recruitingto blooms was included as a covariate. Effect sizes were assessed over Faith’s phylogenetic diversity (9),unweighted UniFrac (13), and weighted UniFrac (92). We then computed Pearson and Spearmancorrelations of the effect sizes, per metric, between the bloom and bloom-removed result (Fig. 2C andD). In addition to the effect size calculations, we also tested whether the bloom fraction was correlatedwith any metadata category and did not observe significant correlations.
We then tested the removal of blooms from other studies in which room-temperature shipping wasnot performed by retrieving a wide variety of human fecal studies from Qiita. UniFrac distance matriceswere computed prior to and following bloom removal, followed by Mantel tests. The results of thisprocedure are outlined in Table S4.
Finally, we correlated the relative intensities of the HPLC-MS data associated with the antibiotic andplant cohorts against the fraction of blooming reads. Critically, we observed a set of spectra that aresignificantly correlated (Table S5) with this fraction. On annotation using molecular networking (dis-cussed in detail under “HPLC-MS analysis” above), we observed these metabolites to putatively belysophosphatidylethanolamine (LysoPE), a lysophospholipid (LPL) which has previously been associatedwith the release of colicin (93). These metabolites were removed from subsequent analyses.
Culturing. Primary specimens (n � 214) were selected from three plates based on the medianfraction of reads recruiting to the blooms across the plate, whether the primary specimen still existed,and the aim of gathering samples from at least the United States (n � 116) and United Kingdom (n �73); additional countries were included in smaller sample sizes and include Australia (n � 7), Germany(n � 7), Canada (n � 3), Croatia (n � 2), Belgium (n � 2), France (n � 1), Austria (n � 1), Sweden (n �1), and the Czech Republic (n � 1). The bloom typically observed in these samples (and in the full AGPdata set) is E. coli (ID 04195686f2b70585790ec75320de0d6f from reference 15), although a few of theother bloom sequences were represented at high read fraction as well. Samples were retrieved from�80°C and thawed on ice. The swab head was broken off into 500 �l sterile 1� Dulbecco’s phosphate-buffered saline and vortexed vigorously for 30 s. Serial dilutions from this initial stock were made,including 1:10,000 and 1:1,000,000. Ten microliters of the 1:10,000 dilution was inoculated into 1.5 ml
McDonald et al.
May/June 2018 Volume 3 Issue 3 e00031-18 msystems.asm.org 20
on July 3, 2019 by guesthttp://m
systems.asm
.org/D
ownloaded from

sterile tryptic soy broth (TSB; BD catalog no. 2253534) in sterile 96-deep-well plates (community cultures[CC]) and incubated overnight at 37°C on an orbital shaker at 500 rpm. Values of optical density at 600nm (OD600) above 0.1 (TSB controls measured ~0.08) were counted as positive growth. Samples with ahigh bloom fraction tended to grow overnight under ambient conditions, and samples with a low bloomfraction tended to not grow under these conditions (Fig. 2A). Additionally, 100 �l of each dilution wasplated onto tryptic soy agar using sterile glass beads and incubated overnight at 37°C. The followingmorning, a picture of the best dilution was captured and the most representative colony was selectedfrom each plate and inoculated into 1.5 ml sterile TSB for overnight incubation as described above(isolates [IS]). The following morning, OD600 measurements were taken and the cultures were pelleted at3,000 � g for 5 min. The supernatant and cell pellets were stored at �20°C for metabolomic analysis andDNA extraction, respectively.
Shotgun sequencing of cultured specimens. Shotgun sequencing was performed on all isolatesand community cultures using a 1:10 miniaturized Nextera library preparation with 1 ng genomic DNA(gDNA) input or up to 1 �l and a 15-cycle PCR amplification. Libraries were quantified with the PicoGreendouble-stranded DNA (dsDNA) assay kit, and 50 ng of each library (or a 4-�l maximum) was pooled. Thelibrary was size selected for 200 to 700 bp using the Sage Bioscience Pippin Prep and sequenced as apaired-end 150-cycle run on an Illumina HiSeq 2500 v2 sequencer in Rapid Run mode at the UCSD IGMGenomics Center. Sequence processing, including assembly performed as described for metagenomicprocessing below, with the exception that “--meta” was not used with SPAdes (94), and read binningagainst the resulting contigs was not performed. For each isolate, contigs with abnormally high or lowcoverage as defined by the 1.5� interquartile range (IQR) rule were dropped. The characterization of themetabolites from the supernatant using HPLC-MS is discussed under “HPLC-MS analysis” above.
Following assembly of the draft genomes, taxonomic assessment by Kraken (95) revealed that of the119 successfully sequenced colony isolate cultures, 95 matched the bloom organisms identified by Amiret al. (15). Compellingly, 70 of these isolate genomes contained exact 16S sequence matches to a bloomorganism identified by reference 15, including 65 which matched the dominant E. coli bloom in theAmerican Gut (Table S4).
Biosynthetic gene cluster analysis of isolates. The read data for the isolates were then assessed forpredicted biosynthetic gene clusters (BGCs). We used biosyntheticSPAdes (D. Meleshko, H. Mohimani, I.Hajirasouliha, M. H. Medema, A. Korobeynikov, and P. Pevzner, submitted for publication) to analyze BGCsin the assembly graph of individual genomes. Below, we focus on the longest BGCs that are particularlydifficult to reconstruct based on ad hoc analysis of contigs and reveal their variations (which likelytranslate into variations of their natural products). Some of the reconstructed long BGCs are ubiquitous(shared by many isolates, albeit with some variations), while others are unique, e.g., present in a singleor a small number of isolates. We identified BGCs, representing in the alphabet of their domains(Table S4), and uncovered variations in their sequence across multiple isolates. Specifically, we found aubiquitous BGC similar to the elusive peptide-polyketide genotoxin colibactin and a unique surfactin-likeBGC. Colibactin triggers DNA double-strand breaks in eukaryotic cells (96, 97) and induces cellularsenescence and metabolic reprogramming in affected mammalian cells (98). Of the 11 samples contain-ing the longest colibactin-like BGC, 10 of them contained the exact E. coli bloom 16S sequence describedabove; the 11th isolate was actually a canine fecal sample plated alongside human samples (as the AGPallows participants to submit pet samples).
Although colibactin is frequently harbored by various E. coli strains, the variations of colibactin BGCsacross various isolates have not been studied before. Genomic analysis revealed wide variations incolibactin-like BGCs, suggesting that various strains produce related but not identical variants of naturalproducts (99). These variations may give rise to the suite of LysoPE-associated spectra identified betweenthe 16S and HPLC-MS data sets.
Shotgun sequencing of the high-bloom and storage samples. Previously extracted DNA from thehigh-bloom samples used for culturing was obtained, as was previously extracted DNA from the work ofSong et al. (17). Shotgun sequencing libraries from a total of 5 ng (or 3.5 �l maximum) gDNA were usedin a 1:10 miniaturized Kapa HyperPlus protocol with a 15-cycle PCR amplification. Libraries werequantified with the PicoGreen dsDNA assay kit, and 50 ng (or 1 �l maximum) of each library was pooled.The pool was size selected for 300 to 700 bp and sequenced as a paired-end 150-cycle run on an IlluminaHiSeq 2500 v2 sequencer in Rapid Run mode at the UCSD IGM Genomics Center. Sequence processing,including assembly, was performed as described for metagenomic processing below.
Functional assessment of conjugated and nonconjugated linoleic acid. To investigate themetabolic potential of the gut microbiome for producing conjugated linoleic acid from linoleic acid, weestimated the abundance of linoleic acid isomerase (LAI) in the fecal metagenome. We focused thisinvestigation on the “plant” cohort, which were samples selected to maximize the difference betweenthe number of types of plant metadata category as discussed above. First, we translated the assembledmetagenomes to metaproteomes using Prodigal gene prediction software. To map LAI to these meta-proteomes, we used a representative LAI protein sequence (UniProt D2BQ64), which was matchedagainst UniProtKB (via https://www.ebi.ac.uk/Tools/hmmer/) for multiple sequence alignment (MSA). Theresulting MSA file in Clustal format was then used to generate a hidden Markov model (HMM) profile forLAI using hmmbuild in HMMER software (100). Subsequently, we mapped the resulting HMM profile tosample metaproteomes using hmmsearch with an E value threshold of 10E�5. We calculated abun-dances of LAI per sample based on abundance (coverage � length) of LAI containing contigs in eachsample, normalized to total sample biomass, and performed linear regression between LAI abundancesand bloom fraction. We did not note any correlation between metabolic potential of gut metagenometo produce LAI and the fraction of blooming bacteria (samples with no LAI hits were removed from this
American Gut: an Open Platform for Microbiome Research
May/June 2018 Volume 3 Issue 3 e00031-18 msystems.asm.org 21
on July 3, 2019 by guesthttp://m
systems.asm
.org/D
ownloaded from

analysis). Similarly, there was no correlation between CLA abundances and bloom fraction in the samples.These results suggest that our report on the differential abundance of CLA in subjects with differentdietary practices (with respect to the number of different types of plants consumed) is unlikely to beconfounded by the presence of blooming bacteria.
Storage sample assessment. Metagenomic reads from the storage samples were mapped to the169 isolate assemblies. We then ran model comparison tests on each to determine which mappings weresignificantly different between frozen samples and samples left out at ambient temperatures for variousperiods of time. Using the ‘lme’ package (101) in R (v3.3.3, R Core Team, 2017), linear mixed-effectsmodels were applied to the abundances, with individual treated as the random effect. Mappings wereconsidered to be significantly associated with temperature if the model was significantly improved(ANOVA P 0.05) by incorporating a fixed effect of temperature. Seven mappings to isolates were foundto be significantly increased in samples stored at ambient temperatures compared to frozen samples inboth storage studies, of which 3 contained the 16S of the dominant E. coli bloom in the AGP samples and2 contained the 16S from other blooms recognized by the work in reference 15.
Shotgun sequence processing. Raw Fastq files were processed using Atropos v1.1.5 (102) to removeadapters and low-quality regions. Putative human genome contaminations were identified and removedby using Bowtie 2 v2.3.0 (103) with the “--very-sensitive” option against the human reference genomeGRCh37/hg19.
Sequences were assigned taxonomy using Kraken v1.0.0 (95) against the “standard” database builtaccording to the Kraken manual, which contains all complete bacterial, archeal, and viral genomesavailable from NCBI RefSeq as of 3 August 2017. Results were processed using Bracken v1.0.0 (104) toestimate the relative abundance of species-level taxa.
Metagenome sequencing data were assembled using SPAdes v3.11.1 (94) with the “--meta” flagenabled (105). Contigs of 1 kb in length were retained and fed to the prokaryotic genome annotationpipeline Prokka v1.12 (106). Putatively individual genomes were inferred using MaxBin2 v2.2.4 (107).
In parallel, contigs were sheared into 200-bp fragments and taxonomy was assigned using Kraken(see above). For each contig, the most assigned taxon at each taxonomic rank and the proportion ofsequences assigned to it were inferred.
A total of 3,725 genome bins were identified from 677 out of 780 AGP metagenomes, with 5.50 �4.05 bins per sample and a maximum bin number of 30. Bins with completeness of �50% were dropped,leaving 1,029 bins from 464 samples (2.22 � 1.97 bins per sample, maximum bins � 19).
Antimicrobial resistance gene assessment. There are 780 metagenome shotgun samples in total,of which 713 have at least 100,000 reads and have corresponding metadata. Of these, 240 belong to theantibiotic (“Abx”) cohort, and 203 belong to the “plant” cohort.
We ran FragGeneScan (v1.30 “run_FragGeneScan.pl -complete�0 -train�illumina_10 -genome��input.fa� -out��out.file�”) (108) on quality-controlled reads to infer partial protein sequences andthen ran HMMER (v3.1b2 “hmmsearch --cut_tc --cpu 4 --tblout �out.file� �resfam.db� �input.file�”)(109) against the ResFam database, version 1.2.2 (110, 111), to identify putative antibiotic resistancegenes.
The ResFam database contains entries for 170 antimicrobial resistance (AMR) gene families. Of these,122 belong to at least 1 of 16 antibiotic classes, all 170 belong to at least 1 of 21 mechanism classes, and42 belong to 5 beta-lactamase classes in the Ambler classification.
We normalized the counts against the total number of reads per sample. The results were convertedto BIOM tables, filtered to retain valid samples only (see above), and collapsed from family to the threetypes of classes (see above). The relative abundance table containing antibiotic classes was used fordownstream analysis.
For each metadata category, the upper and lower extrema were selected for comparison. TheKruskal-Wallis H test (using the SciPy command Kruskal) was performed to assess the differentialabundance between upper and lower extrema for each of the nine antibiotic classes. The H statistic andP value were reported for each antibiotic class.
Specifically, for the cohort “Abx,” the metadata column “antibiotic_history” was tested. Categories“Week” and “Month” were merged into “within 1 month”; “I have not taken antibiotics in the past year.”was abbreviated as “beyond 1 year.” Other categories were omitted.
For the cohort “plant,” metadata column “types_of_plants” was tested. Categories “less than 5” and“6 to 10” were merged into “10 or less”; “More than 30” was retained; others were omitted.
Filtering bacterial blooms for metabolomics analysis. To assess and account for the impact of themetabolites contributed by these organisms, we have performed HPLC-MS analysis of cultures ofblooming organisms to establish possible contributions, as described above. It was found that there isa negligible overlap of the bloom-associated metabolites with the compounds detected in AGP samples(Fig. 2B). Furthermore, we have verified that none of the compounds discussed in this work (LA, CLA, andcompounds in Fig. S4A to I) are present in these bloom cultures. The main organism implicated in bloomwas determined to be E. coli, as described earlier, and MS data corroborate these findings (network notshown).
Considering that the metabolites resulting from microbial activity in cultures can differ significantlyfrom those in vivo (e.g., many of the metabolites could originate not from de novo synthesis but ratherfrom microbial modifications of external compounds that are not present in medium, e.g., from the host),we also explored associations of metabolites in AGP metabolomics samples and blooms. Spearman rankcorrelation analysis of the fraction of 16S reads in a sample reporting as bloom to metabolites observedin the same samples revealed several features that correlate significantly (Table S5). There exists asignificant overlap between the antibiotic and VioScreen study subsets, indicating a potential common
McDonald et al.
May/June 2018 Volume 3 Issue 3 e00031-18 msystems.asm.org 22
on July 3, 2019 by guesthttp://m
systems.asm
.org/D
ownloaded from

origin of these features. The strongest correlation was found for the feature m/z 480.3106 with multiplebloom organisms (�^2 � 0.25 for E. coli at P � 1e�40). This feature was found to also significantlycorrelate with the principal coordinates of the PCoA, with and without blooms in the UniFrac matricesfor both subsets. The tentative annotation of this feature is LysoPE, a lysophospholipid (LPL). Theproduction of LPLs in vivo is a result of phospholipase A enzymatic activity associated with Gram-negative bacteria. It is known that LysoPE is essential for release of colicin (93). Colicin (by itself notdetectable with the MS methodology in this study due to very high molecular mass) is a bacteriocinrelated to microbial warfare and is known to be produced by E. coli, the major bloomer in AGP. It canbe suggested that the blooming of an organism is related to attempting to kill competitors to maximizenutrient availability. Importantly, removal of all of the features associated with bloom does not alter themetabolomics results at all, which indicates that all of the observed biological trends reported here arenot related to blooms.
Mental health in the American Gut Project. From the AGP cohort, we selected subjects whoendorsed a mental health disorder (depression, schizophrenia, PTSD, and/or bipolar disorder). Thisresulted in 1,140 subjects. Six hundred thirty-six subjects endorsed at least one of the exclusion criteria(antibiotic use in the last year, IBD, Clostridium difficile infection, pregnancy, Alzheimer’s disease, anorexiaor bulimia, history of substance use disorder, epilepsy or seizure disorder, kidney disease, and phenyl-ketonuria). Out of the remaining 504 subjects, 319 did not provide information regarding country ofresidence, hence forming a case cohort of 185 subjects. The remaining samples were further filtereddown to 125 samples to include only high-quality fecal microbiome data (at least 1,250 sequences/sample) at a single time point per subject. For those cases, we created a 1:1 matched sample of patientsand nonpsychiatric comparison (NC) participants based on age (�5 years), BMI, history of diabetes,smoking frequency, country of residence, census region (if in the United States), and sequencing plate.For each of the cohorts, we calculated beta-diversity distance matrices using Bray-Curtis dissimilarity andweighted UniFrac. On the resulting matrices, we ran pairwise PERMANOVA with 999 permutationsbetween “cases” (people who reported mental illness) and NCs (outmatched control data set). Differentialabundance testing was performed using the permuted mean difference test at 10,000 permutations, withdiscrete FDR (112) correction at alpha � 0.1.
Data availability. All sequence data and deidentified participant responses can be found in EBIunder project PRJEB11419 and Qiita study ID 10317. Per-sample EBI accession numbers and downloadlinks partitioned by the sequencing run are described in Table S1. The sOTU table following bloom removalcontaining the 9,511 samples used in the manuscript can be accessed from figshare in both read count (113)and relative abundance (114), as well as the corresponding phylogeny (115), sample metadata (116), collatedalpha-diversities (117), and unweighted (118) and weighted (119) UniFrac distance matrices. For the massspectrometry, data are accessed through https://gnps.ucsd.edu: MSV000080187 (antibiotic study cohort),MSV000080186 (plant consumption frequency study cohort), and MSV000081777 (cell cultures ofblooms). For the novel annotated structures of N-acyl amides, the reference MS/MS spectra at GNPSare CCMSLIB00004679232, CCMSLIB00004679233, CCMSLIB00004679234, CCMSLIB00004679235,CCMSLIB00004679236, CCMSLIB00004679237, CCMSLIB00004679238, CCMSLIB00004679239, andCCMSLIB00004679240. All of the raw data are publicly available at the UCSD Center for ComputationalMass Spectrometry (36) (data set ID MassIVE MSV000080179). The additional sequence data generatedfrom the American Gut samples were deposited in EBI under the American Gut accession (ERP012803),and the storage sample data were deposited under their accession (ERP015155). The deidentifiedparticipant and sequence data for the American Gut are available from the European BioinformaticsInstitute under accession number ERP012803. Per-sample accession numbers are included in thesupplemental material (Table S1). The EBI accession includes more samples than presented here, asconsent for some samples was obtained after the analysis was completed.
SUPPLEMENTAL MATERIALSupplemental material for this article may be found at https://doi.org/10.1128/
mSystems.00031-18.TEXT S1, DOCX file, 0.03 MB.FIG S1, JPG file, 1.9 MB.FIG S2, JPG file, 1.5 MB.FIG S3, PDF file, 0.8 MB.FIG S4, PDF file, 1.3 MB.TABLE S1, XLSX file, 0.6 MB.TABLE S2, XLSX file, 0.1 MB.TABLE S3, XLSX file, 0.2 MB.TABLE S4, XLSX file, 0.01 MB.TABLE S5, XLSX file, 0.1 MB.
ACKNOWLEDGMENTSWe thank first all the citizen science volunteers around the world. We also thank
Katherine Amato, Margaret K. Butler, Gabriela Surdulescu, Luke Ursell, Jeff DeReus,Evguenia Kopylova, John Graham, Victoria Vazquez, Jai Ram Rideout, Merete Eggesbo,
American Gut: an Open Platform for Microbiome Research
May/June 2018 Volume 3 Issue 3 e00031-18 msystems.asm.org 23
on July 3, 2019 by guesthttp://m
systems.asm
.org/D
ownloaded from

Steve Green, Kathy Holt, Jim Huntley, Zehra Esra Ilhan, Daniel Mayer, Catherine Nich-olas, Laura Parfrey, Juanma Peralta, Dorota Porazinska, Jennifer Smilowitz, Matt Gebert,Se Jin Song, Kumar Thurimella, Sam Way, Tony Walters, Sophie Weiss, Ulla Westermann,Shawnelle White, Doug Woodhams, Jerry Kennedy, Scott Handley, Chandni Desai,Carolina Carpenter, Gabriella Fanelli, Deborah L. Bright, and Xochitl C. Morgan for theircontributions to the American Gut Project. Some sequencing was conducted byMahdieh Khosroheidari and Clifford L. Green at the IGM Genomics Center, University ofCalifornia, San Diego, La Jolla, CA. We thank the BioFrontiers Institute for their admin-istrative support for the project while it was based at the University of ColoradoBoulder.
Crowdfunding support was provided through Indiegogo and FundRazr. Someconsortium members were supported by NSF IGERT award 1144807, the SloanFoundation Microbiology of the Built Environment Program, the Wyss Institute, theHoward Hughes Medical Institute, the U.S. Department of Energy under contractDE-AC02-06CH11357.NS, the ERC Starting Grant 2013 (European Research Council,starting grant 336452-ENIGMO), WELBIO WELBIO-CR-2012S-02R, and the Robert Tour-nut award (Société Nationale Française de Gastro-Entérologie). The British Gut collec-tion was carried out by the Department of Twin Research at KCL funded by theWellcome Trust, MRC, a JPI Dynamic grant, and the National Institute for HealthResearch (NIHR) Clinical Research Facility at Guy’s & St Thomas’ NHS Foundation Trustand NIHR Biomedical Research Centre based at Guy’s and St. Thomas’ NHS FoundationTrust and King’s College London. Tim Spector is an NIHR Senior Investigator. DmitryMeleshko was supported by Russian Science Foundation (grant number 14-50-00069).Parts of the computations were performed using the San Diego Supercomputer Center(SDSC) through XSEDE allocations, which are supported by the NSF grant ACI-1053575.
All authors are members of the American Gut Consortium. The American GutConsortium also includes the following persons: Allison E. Mann, Amnon Amir, AngelFrazier, Cameron Martino, Carlito Lebrilla, Catherine Lozupone, Cecil M. Lewis, Jr.,Charles Raison, Chi Zhang, Christian L. Lauber, Christina Warinner, Christopher A. Lowry,Chris Callewaert, Cinnamon Bloss, Dana Willner, Daniela Domingos Galzerani, David J.Gonzalez, David A. Mills, Deepak Chopra, Dirk Gevers, Donna Berg-Lyons, Dorothy D.Sears, Doug Wendel, Elijah Lovelace, Emily Pierce, Emily TerAvest, Evan Bolyen, FredericD. Bushman, Gary D. Wu, George M. Church, Gordon Saxe, Hannah D. Holscher, IvoUgrina, J. Bruce German, J. Gregory Caporaso, Jacob M. Wozniak, Jacqueline Kerr,Jacques Ravel, James D. Lewis, Jan S. Suchodolski, Janet K. Jansson, Jarrad T. Hampton-Marcell, Jason Bobe, Jeroen Raes, John H. Chase, Jonathan A. Eisen, Jonathan Monk,Jose C. Clemente, Joseph Petrosino, Julia Goodrich, Julia Gauglitz, Julian Jacobs, KarstenZengler, Kelly S. Swanson, Kim Lewis, Kris Mayer, Kyle Bittinger, Lindsay Dillon, Livia S.Zaramela, Lynn M. Schriml, Maria G. Dominguez-Bello, Marta M. Jankowska, MartinBlaser, Meg Pirrung, Michael Minson, Mike Kurisu, Nadim Ajami, Neil R. Gottel, NicholasChia, Noah Fierer, Owen White, Patrice D. Cani, Pawel Gajer, Philip Strandwitz, PurnaKashyap, Rachel Dutton, Rachel S. Park, Ramnik J. Xavier, Robert H. Mills, RosaKrajmalnik-Brown, Ruth Ley, Sarah M. Owens, Scott Klemmer, Sébastien Matamoros,Siavash Mirarab, Stephanie Moorman, Susan Holmes, Tara Schwartz, Tifani W. Eshoo-Anton, Tim Vigers, Vineet Pandey, Will Van Treuren, Xin Fang, Zhenjiang Zech Xu, AlanJarmusch, Justin Geier, Nicolai Reeve, Ricardo Silva, Evguenia Kopylova, DominicNguyen, Karenina Sanders, Rodolfo Antonio Salido Benitez, Arthur Cole Heale, MaxAbramson, Jérôme Waldispühl, Alexander Butyaev, Chris Drogaris, Elena Nazarova,Madeleine Ball, and Beau Gunderson.
REFERENCES1. Thompson LR, Sanders JG, McDonald D, Amir A, Ladau J, Locey KJ, Prill
RJ, Tripathi A, Gibbons SM, Ackermann G, Navas-Molina JA, Janssen S,Kopylova E, Vázquez-Baeza Y, González A, Morton JT, Mirarab S, ZechXu Z, Jiang L, Haroon MF, Kanbar J, Zhu Q, Jin Song S, Kosciolek T,Bokulich NA, Lefler J, Brislawn CJ, Humphrey G, Owens SM, Hampton-
Marcell J, Berg-Lyons D, McKenzie V, Fierer N, Fuhrman JA, Clauset A,Stevens RL, Shade A, Pollard KS, Goodwin KD, Jansson JK, Gilbert JA,Knight R, Earth Microbiome Project. 2017. A communal cataloguereveals Earth’s multiscale microbial diversity. Nature 551:457– 463.https://doi.org/10.1038/nature24621.
McDonald et al.
May/June 2018 Volume 3 Issue 3 e00031-18 msystems.asm.org 24
on July 3, 2019 by guesthttp://m
systems.asm
.org/D
ownloaded from

2. Falony G, Joossens M, Vieira-Silva S, Wang J, Darzi Y, Faust K, KurilshikovA, Bonder MJ, Valles-Colomer M, Vandeputte D, Tito RY, Chaffron S,Rymenans L, Verspecht C, De Sutter L, Lima-Mendez G, D’hoe K, Jon-ckheere K, Homola D, Garcia R, Tigchelaar EF, Eeckhaudt L, Fu J,Henckaerts L, Zhernakova A, Wijmenga C, Raes J. 2016. Population-levelanalysis of gut microbiome variation. Science 352:560 –564. https://doi.org/10.1126/science.aad3503.
3. Qin J, Li R, Raes J, Arumugam M, Burgdorf KS, Manichanh C, Nielsen T,Pons N, Levenez F, Yamada T, Mende DR, Li J, Xu J, Li S, Li D, Cao J,Wang B, Liang H, Zheng H, Xie Y, Tap J, Lepage P, Bertalan M, Batto JM,Hansen T, Le Paslier D, Linneberg A, Nielsen HB, Pelletier E, Renault P,Sicheritz-Ponten T, Turner K, Zhu H, Yu C, Li S, Jian M, Zhou Y, Li Y,Zhang X, Li S, Qin N, Yang H, Wang J, Brunak S, Doré J, Guarner F,Kristiansen K, Pedersen O, Parkhill J, Weissenbach J, MetaHIT Consor-tium, Bork P, Ehrlich SD, Wang J, Wang J. 2010. A human gut microbialgene catalogue established by metagenomic sequencing. Nature 464:59 – 65. https://doi.org/10.1038/nature08821.
4. Zhernakova A, Kurilshikov A, Bonder MJ, Tigchelaar EF, Schirmer M,Vatanen T, Mujagic Z, Vila AV, Falony G, Vieira-Silva S, Wang J, ImhannF, Brandsma E, Jankipersadsing SA, Joossens M, Cenit MC, Deelen P,Swertz MA, LifeLines Cohort Study, Weersma RK, Feskens EJM, Netea MG,Gevers D, Jonkers D, Franke L, Aulchenko YS, Huttenhower C, Raes J,Hofker MH, Xavier RJ, Wijmenga C, Fu J. 2016. Population-based metag-enomics analysis reveals markers for gut microbiome composition anddiversity. Science 352:565–569. https://doi.org/10.1126/science.aad3369.
5. Human Microbiome Project Consortium. 2012. Structure, function anddiversity of the healthy human microbiome. Nature 486:207–214. https://doi.org/10.1038/nature11234.
6. Yatsunenko T, Rey FE, Manary MJ, Trehan I, Dominguez-Bello MG,Contreras M, Magris M, Hidalgo G, Baldassano RN, Anokhin AP, HeathAC, Warner B, Reeder J, Kuczynski J, Caporaso JG, Lozupone CA, LauberC, Clemente JC, Knights D, Knight R, Gordon JI. 2012. Human gutmicrobiome viewed across age and geography. Nature 486:222–227.https://doi.org/10.1038/nature11053.
7. Flores GE, Caporaso JG, Henley JB, Rideout JR, Domogala D, Chase J,Leff JW, Vázquez-Baeza Y, Gonzalez A, Knight R, Dunn RR, Fierer N.2014. Temporal variability is a personalized feature of the humanmicrobiome. Genome Biol 15:531. https://doi.org/10.1186/s13059-014-0531-y.
8. Song SJ, Lauber C, Costello EK, Lozupone CA, Humphrey G, Berg-LyonsD, Caporaso JG, Knights D, Clemente JC, Nakielny S, Gordon JI, Fierer N,Knight R. 2013. Cohabiting family members share microbiota with oneanother and with their dogs. Elife 2:e00458. https://doi.org/10.7554/eLife.00458.
9. Faith DP. 1992. Conservation evaluation and phylogenetic diversity.Biol Conserv 61:1–10. https://doi.org/10.1016/0006-3207(92)91201-3.
10. Morton JT, Sanders J, Quinn RA, McDonald D, Gonzalez A, Vázquez-Baeza Y, Navas-Molina JA, Song SJ, Metcalf JL, Hyde ER, Lladser M,Dorrestein PC, Knight R. 2017. Balance trees reveal microbial nichedifferentiation. mSystems 2:e00162-16. https://doi.org/10.1128/mSystems.00162-16.
11. Clemente JC, Pehrsson EC, Blaser MJ, Sandhu K, Gao Z, Wang B, MagrisM, Hidalgo G, Contreras M, Noya-Alarcón Ó, Lander O, McDonald J, CoxM, Walter J, Oh PL, Ruiz JF, Rodriguez S, Shen N, Song SJ, Metcalf J,Knight R, Dantas G, Dominguez-Bello MG. 2015. The microbiome ofuncontacted Amerindians. Sci Adv 1:e1500183. https://doi.org/10.1126/sciadv.1500183.
12. Obregon-Tito AJ, Tito RY, Metcalf J, Sankaranarayanan K, Clemente JC,Ursell LK, Zech Xu Z, Van Treuren W, Knight R, Gaffney PM, Spicer P,Lawson P, Marin-Reyes L, Trujillo-Villarroel O, Foster M, Guija-Poma E,Troncoso-Corzo L, Warinner C, Ozga AT, Lewis CM. 2015. Subsistencestrategies in traditional societies distinguish gut microbiomes. NatCommun 6:6505. https://doi.org/10.1038/ncomms7505.
13. Lozupone C, Knight R. 2005. UniFrac: a new phylogenetic method forcomparing microbial communities. Appl Environ Microbiol 71:8228 – 8235. https://doi.org/10.1128/AEM.71.12.8228-8235.2005.
14. Lozupone C, Lladser ME, Knights D, Stombaugh J, Knight R. 2011.UniFrac: an effective distance metric for microbial community compar-ison. ISME J 5:169 –172. https://doi.org/10.1038/ismej.2010.133.
15. Amir A, McDonald D, Navas-Molina JA, Debelius J, Morton JT, Hyde E,Robbins-Pianka A, Knight R. 2017. Correcting for microbial blooms in fecalsamples during room-temperature shipping. mSystems 2:e00199-16.https://doi.org/10.1128/mSystems.00199-16.
16. Amir A, McDonald D, Navas-Molina JA, Kopylova E, Morton JT, Zech
Xu Z, Kightley EP, Thompson LR, Hyde ER, Gonzalez A, Knight R.2017. Deblur rapidly resolves single-nucleotide community sequencepatterns. mSystems 2:e00191-16. https://doi.org/10.1128/mSystems.00191-16.
17. Song SJ, Amir A, Metcalf JL, Amato KR, Xu ZZ, Humphrey G, Knight R.2016. Preservation methods differ in fecal microbiome stability, affect-ing suitability for field studies. mSystems 1:e00021-16. https://doi.org/10.1128/mSystems.00021-16.
18. Ley RE, Lozupone CA, Hamady M, Knight R, Gordon JI. 2008. Worldswithin worlds: evolution of the vertebrate gut microbiota. Nat RevMicrobiol 6:776 –788. https://doi.org/10.1038/nrmicro1978.
19. McDonald D, Price MN, Goodrich J, Nawrocki EP, DeSantis TZ, Probst A,Andersen GL, Knight R, Hugenholtz P. 2012. An improved Greengenestaxonomy with explicit ranks for ecological and evolutionary analysesof bacteria and archaea. ISME J 6:610 – 618. https://doi.org/10.1038/ismej.2011.139.
20. Mirarab S, Nguyen N, Warnow T. 2012. SEPP: SATé-enabled phyloge-netic placement. Pac Symp Biocomput 2012:247–258.
21. Halfvarson J, Brislawn CJ, Lamendella R, Vázquez-Baeza Y, Walters WA,Bramer LM, D’Amato M, Bonfiglio F, McDonald D, Gonzalez A, McClureEE, Dunklebarger MF, Knight R, Jansson JK. 2017. Dynamics of thehuman gut microbiome in inflammatory bowel disease. Nat Microbiol2:17004. https://doi.org/10.1038/nmicrobiol.2017.4.
22. Smits SA, Leach J, Sonnenburg ED, Gonzalez CG, Lichtman JS, Reid G,Knight R, Manjurano A, Changalucha J, Elias JE, Dominguez-Bello MG,Sonnenburg JL. 2017. Seasonal cycling in the gut microbiome of theHadza hunter-gatherers of Tanzania. Science 357:802– 806. https://doi.org/10.1126/science.aan4834.
23. Ladau J, Sharpton TJ, Finucane MM, Jospin G, Kembel SW, O’Dwyer J,Koeppel AF, Green JL, Pollard KS. 2013. Global marine bacterial diversitypeaks at high latitudes in winter. ISME J 7:1669 –1677. https://doi.org/10.1038/ismej.2013.37.
24. McDonald D, Ackermann G, Khailova L, Baird C, Heyland D, Kozar R,Lemieux M, Derenski K, King J, Vis-Kampen C, Knight R, Wischmeyer PE.2016. Extreme dysbiosis of the microbiome in critical illness. mSphere1:e00199-16. https://doi.org/10.1128/mSphere.00199-16.
25. David LA, Maurice CF, Carmody RN, Gootenberg DB, Button JE,Wolfe BE, Ling AV, Devlin AS, Varma Y, Fischbach MA, Biddinger SB,Dutton RJ, Turnbaugh PJ. 2014. Diet rapidly and reproducibly altersthe human gut microbiome. Nature 505:559 –563. https://doi.org/10.1038/nature12820.
26. McDonald D, Robbins-Pianka A, Mann AE, Vrbanac A, Amir A, Frazier A,Gonzalez A, Tripathi A, Fahimipour AK, Brennen C, Martino C, Lebrilla C,Lozupone C, Lewis CM, Raison C, Zhang C, Lauber CL, Warinner C,Lowry CA, Callewaert C, Bloss C, Huttenhower C, Knights D, Willner D,Galzerani DD, Gonzalez DJ, Mills DA, Chopra D, Gevers D, Berg-Lyons D,Sears DD, Wendel D, Wolfe E, Lovelace E, Hyde ER, Pierce E, TerAvest E,Montassier E, Bolyen E, Bushman FD, Ackermann G, Wu GD, Church GM,Rahnavard G, Saxe G, Gogul G, Humphrey G, Holscher HD, Ugrina I,German JB, Caporaso JG, Gilbert J, Wozniak JM, Kerr J, Ravel J, GaffneyJ, Lewis JD, Morton JT, Suchodolski JS, Jansson JK, Hampton-Marcell JT,Bobe J, Leach J, Raes J, Green JL, Metcalf JL, Chase JH, Eisen JA, MonkJ, Navas-Molina JA, Clemente JC, et al. 2018. movie_s1.mp4. figsharehttps://doi.org/10.6084/m9.figshare.5936479.
27. Gophna U, Konikoff T, Nielsen HB. 2017. Oscillospira and related bac-teria—from metagenomic species to metabolic features. Environ Mi-crobiol 19:835– 841. https://doi.org/10.1111/1462-2920.13658.
28. Lombard V, Golaconda Ramulu H, Drula E, Coutinho PM, Henrissat B.2014. The carbohydrate-active enzymes database (CAZy) in 2013. Nu-cleic Acids Res 42:D490 –D495. https://doi.org/10.1093/nar/gkt1178.
29. El Kaoutari A, Armougom F, Gordon JI, Raoult D, Henrissat B. 2013. Theabundance and variety of carbohydrate-active enzymes in the humangut microbiota. Nat Rev Microbiol 11:497–504. https://doi.org/10.1038/nrmicro3050.
30. Cummings JH, Macfarlane GT. 1991. The control and consequencesof bacterial fermentation in the human colon. J Appl Bacteriol 70:443– 459. https://doi.org/10.1111/j.1365-2672.1991.tb02739.x.
31. Henderson G, Cox F, Ganesh S, Jonker A, Young W, Global RumenCensus Collaborators, Janssen PH. 2015. Rumen microbial communitycomposition varies with diet and host, but a core microbiome is foundacross a wide geographical range. Sci Rep 5:14567. https://doi.org/10.1038/srep14567.
32. O’Donnell MM, Harris HMB, Ross RP, O’Toole PW. 2017. Core fecalmicrobiota of domesticated herbivorous ruminant, hindgut fermenters,
American Gut: an Open Platform for Microbiome Research
May/June 2018 Volume 3 Issue 3 e00031-18 msystems.asm.org 25
on July 3, 2019 by guesthttp://m
systems.asm
.org/D
ownloaded from

and monogastric animals. Microbiologyopen 6. https://doi.org/10.1002/mbo3.509.
33. Kohl KD, Brun A, Magallanes M, Brinkerhoff J, Laspiur A, Acosta JC,Bordenstein SR, Caviedes-Vidal E. 2016. Physiological and microbialadjustments to diet quality permit facultative herbivory in an omniv-orous lizard. J Exp Biol 219:1903–1912. https://doi.org/10.1242/jeb.138370.
34. Wang M, Carver JJ, Phelan VV, Sanchez LM, Garg N, Peng Y, Nguyen DD,Watrous J, Kapono CA, Luzzatto-Knaan T, Porto C, Bouslimani A, MelnikAV, Meehan MJ, Liu W-T, Crüsemann M, Boudreau PD, Esquenazi E,Sandoval-Calderón M, Kersten RD, Pace LA, Quinn RA, Duncan KR, HsuC-C, Floros DJ, Gavilan RG, Kleigrewe K, Northen T, Dutton RJ, Parrot D,Carlson EE, Aigle B, Michelsen CF, Jelsbak L, Sohlenkamp C, Pevzner P,Edlund A, McLean J, Piel J, Murphy BT, Gerwick L, Liaw C-C, Yang Y-L,Humpf H-U, Maansson M, Keyzers RA, Sims AC, Johnson AR, Sidebot-tom AM, Sedio BE, Klitgaard A, Larson CB, Boya P CA, Torres-MendozaD, Gonzalez DJ, Silva DB, Marques LM, Demarque DP, Pociute E, O’NeillEC, Briand E, Helfrich EJN, Granatosky EA, Glukhov E, Ryffel F, HousonH, Mohimani H, Kharbush JJ, Zeng Y, Vorholt JA, et al. 2016. Sharingand community curation of mass spectrometry data with Global Nat-ural Products Social Molecular Networking. Nat Biotechnol 34:828 – 837.https://doi.org/10.1038/nbt.3597.
35. Watrous J, Roach P, Alexandrov T, Heath BS, Yang JY, Kersten RD, vander Voort M, Pogliano K, Gross H, Raaijmakers JM, Moore BS, Laskin J,Bandeira N, Dorrestein PC. 2012. Mass spectral molecular networking ofliving microbial colonies. Proc Natl Acad Sci U S A 109:E1743–E1752.https://doi.org/10.1073/pnas.1203689109.
36. Sumner LW, Amberg A, Barrett D, Beale MH, Beger R, Daykin CA, FanTW-M, Fiehn O, Goodacre R, Griffin JL, Hankemeier T, Hardy N, HarnlyJ, Higashi R, Kopka J, Lane AN, Lindon JC, Marriott P, Nicholls AW, ReilyMD, Thaden JJ, Viant MR. 2007. Proposed minimum reporting stan-dards for chemical analysis. Chemical Analysis Working Group (CAWG)Metabolomics Standards Initiative (MSI). Metabolomics 3:211–221.https://doi.org/10.1007/s11306-007-0082-2.
37. Kishino S, Takeuchi M, Park SB, Hirata A, Kitamura N, Kunisawa J, KiyonoH, Iwamoto R, Isobe Y, Arita M, Arai H, Ueda K, Shima J, Takahashi S,Yokozeki K, Shimizu S, Ogawa J. 2013. Polyunsaturated fatty acidsaturation by gut lactic acid bacteria affecting host lipid composition.Proc Natl Acad Sci U S A 110:17808 –17813. https://doi.org/10.1073/pnas.1312937110.
38. Coakley M, Ross RP, Nordgren M, Fitzgerald G, Devery R, Stanton C.2003. Conjugated linoleic acid biosynthesis by human-derived Bifido-bacterium species. J Appl Microbiol 94:138 –145. https://doi.org/10.1046/j.1365-2672.2003.01814.x.
39. Cohen LJ, Esterhazy D, Kim SH, Lemetre C, Aguilar RR, Gordon EA,Pickard AJ, Cross JR, Emiliano AB, Han SM, Chu J, Vila-Farres X, KaplittJ, Rogoz A, Calle PY, Hunter C, Bitok JK, Brady SF. 2017. Commensalbacteria make GPCR ligands that mimic human signalling molecules.Nature 549:48 –53. https://doi.org/10.1038/nature23874.
40. Hauser AS, Attwood MM, Rask-Andersen M, Schiöth HB, Gloriam DE.2017. Trends in GPCR drug discovery: new agents, targets and indica-tions. Nat Rev Drug Discov 16:829 – 842. https://doi.org/10.1038/nrd.2017.178.
41. Clarke G, Stilling RM, Kennedy PJ, Stanton C, Cryan JF, Dinan TG. 2014.Minireview: gut microbiota: the neglected endocrine organ. Mol Endo-crinol 28:1221–1238. https://doi.org/10.1210/me.2014-1108.
42. Cani PD, Knauf C. 2016. How gut microbes talk to organs: the role ofendocrine and nervous routes. Mol Metab 5:743–752. https://doi.org/10.1016/j.molmet.2016.05.011.
43. Smith B, Chu LK, Smith TC, Amoroso PJ, Boyko EJ, Hooper TI, Gackstet-ter GD, Ryan MAK, Millennium Cohort Study Team. 2008. Challenges ofself-reported medical conditions and electronic medical records amongmembers of a large military cohort. BMC Med Res Methodol 8:37.https://doi.org/10.1186/1471-2288-8-37.
44. Jiang H, Ling Z, Zhang Y, Mao H, Ma Z, Yin Y, Wang W, Tang W, Tan Z,Shi J, Li L, Ruan B. 2015. Altered fecal microbiota composition inpatients with major depressive disorder. Brain Behav Immun 48:186 –194. https://doi.org/10.1016/j.bbi.2015.03.016.
45. Lin P, Ding B, Feng C, Yin S, Zhang T, Qi X, Lv H, Guo X, Dong K, ZhuY, Li Q. 2017. Prevotella and Klebsiella proportions in fecal microbialcommunities are potential characteristic parameters for patients withmajor depressive disorder. J Affect Disord 207:300 –304. https://doi.org/10.1016/j.jad.2016.09.051.
46. Saraceno B. 2002. The WHO World Health Report 2001 on mental
health. Epidemiol Psichiatr Soc 11:83– 87. https://doi.org/10.1017/S1121189X00005546.
47. Zheng P, Zeng B, Zhou C, Liu M, Fang Z, Xu X, Zeng L, Chen J, Fan S,Du X, Zhang X, Yang D, Yang Y, Meng H, Li W, Melgiri ND, Licinio J, WeiH, Xie P. 2016. Gut microbiome remodeling induces depressive-likebehaviors through a pathway mediated by the host’s metabolism. MolPsychiatry 21:786 –796. https://doi.org/10.1038/mp.2016.44.
48. Weingarden A, González A, Vázquez-Baeza Y, Weiss S, Humphry G,Berg-Lyons D, Knights D, Unno T, Bobr A, Kang J, Khoruts A, Knight R,Sadowsky MJ. 2015. Dynamic changes in short- and long-term bacterialcomposition following fecal microbiota transplantation for recurrentClostridium difficile infection. Microbiome 3:10. https://doi.org/10.1186/s40168-015-0070-0.
49. Koenig JE, Spor A, Scalfone N, Fricker AD, Stombaugh J, Knight R,Angenent LT, Ley RE. 2011. Succession of microbial consortia in thedeveloping infant gut microbiome. Proc Natl Acad Sci U S A 108(Suppl1):4578 – 4585. https://doi.org/10.1073/pnas.1000081107.
50. McDonald D, Robbins-Pianka A, Mann AE, Vrbanac A, Amir A, Frazier A,Gonzalez A, Tripathi A, Fahimipour AK, Brennen C, Martino C, Lebrilla C,Lozupone C, Lewis CM, Raison C, Zhang C, Lauber CL, Warinner C,Lowry CA, Callewaert C, Bloss C, Huttenhower C, Knights D, Willner D,Galzerani DD, Gonzalez DJ, Mills DA, Chopra D, Gevers D, Berg-Lyons D,Sears DD, Wendel D, Wolfe E, Lovelace E, Hyde ER, Pierce E, TerAvest E,Montassier E, Bolyen E, Bushman FD, Ackermann G, Wu GD, Church GM,Rahnavard G, Saxe G, Gogul G, Humphrey G, Holscher HD, Ugrina I,German JB, Caporaso JG, Gilbert J, Wozniak JM, Kerr J, Ravel J, GaffneyJ, Lewis JD, Morton JT, Suchodolski JS, Jansson JK, Hampton-Marcell JT,Bobe J, Leach J, Raes J, Green JL, Metcalf JL, Chase JH, Eisen JA, MonkJ, Navas-Molina JA, Clemente JC, et al. 2018. movie_s2.mp4. figsharehttps://doi.org/10.6084/m9.figshare.5936482.
51. Caporaso JG, Lauber CL, Walters WA, Berg-Lyons D, Huntley J, Fierer N,Owens SM, Betley J, Fraser L, Bauer M, Gormley N, Gilbert JA, Smith G,Knight R. 2012. Ultra-high-throughput microbial community analysison the Illumina HiSeq and MiSeq platforms. ISME J 6:1621–1624.https://doi.org/10.1038/ismej.2012.8.
52. Apprill A, McNally S, Parsons R, Weber L. 2015. Minor revision to V4region SSU rRNA 806R gene primer greatly increases detection ofSAR11 bacterioplankton. Aquat Microb Ecol 75:129 –137. https://doi.org/10.3354/ame01753.
53. Liu K, Raghavan S, Nelesen S, Linder CR, Warnow T. 2009. Rapid andaccurate large-scale coestimation of sequence alignments and phylo-genetic trees. Science 324:1561–1564. https://doi.org/10.1126/science.1171243.
54. Wang Q, Garrity GM, Tiedje JM, Cole JR. 2007. Naive Bayesian classifierfor rapid assignment of rRNA sequences into the new bacterial taxon-omy. Appl Environ Microbiol 73:5261–5267. https://doi.org/10.1128/AEM.00062-07.
55. Caporaso JG, Kuczynski J, Stombaugh J, Bittinger K, Bushman FD,Costello EK, Fierer N, Peña AG, Goodrich JK, Gordon JI, Huttley GA,Kelley ST, Knights D, Koenig JE, Ley RE, Lozupone CA, McDonald D,Muegge BD, Pirrung M, Reeder J, Sevinsky JR, Turnbaugh PJ, WaltersWA, Widmann J, Yatsunenko T, Zaneveld J, Knight R. 2010. QIIME allowsanalysis of high-throughput community sequencing data. Nat Methods7:335–336. https://doi.org/10.1038/nmeth.f.303.
56. Weiss S, Xu ZZ, Peddada S, Amir A, Bittinger K, Gonzalez A, LozuponeC, Zaneveld JR, Vázquez-Baeza Y, Birmingham A, Hyde ER, Knight R.2017. Normalization and microbial differential abundance strategiesdepend upon data characteristics. Microbiome 5:27. https://doi.org/10.1186/s40168-017-0237-y.
57. Ryan CL, Bauman K. 2016. Educational attainment in the United States:2015. Population characteristics. Current population reports. UnitedStates Census Bureau, Washington, DC. https://www.census.gov/content/dam/Census/library/publications/2016/demo/p20-578.pdf.
58. Howden LM, Meyer JA. 2011. Age and sex composition: 2010. 2010census briefs. United States Census Bureau, Washington, DC. https://www.census.gov/prod/cen2010/briefs/c2010br-03.pdf.
59. National Center for Health Statistics. 2016. Table 58. In Health, UnitedStates, 2015: with special feature on racial and ethnic health disparities.National Center for Health Statistics, Hyattsville, MD. https://www.cdc.gov/nchs/data/hus/2015/058.pdf.
60. Gao HX, Regier EE, Close KL. 2016. Prevalence of and trends in diabetesamong adults in the United States, 1988 –2012. J Diabetes 8:8 –9.
61. Centers for Disease Control and Prevention. 2015. Inflammatory boweldisease. Epidemiology of the IBD. Centers for Disease Control and
McDonald et al.
May/June 2018 Volume 3 Issue 3 e00031-18 msystems.asm.org 26
on July 3, 2019 by guesthttp://m
systems.asm
.org/D
ownloaded from

Prevention, Atlanta, GA. https://www.cdc.gov/ibd/ibd-epidemiology.htm.
62. Centers for Disease Control and Prevention. 2018. Current cigarette smok-ing among adults in the United States. Centers for Disease Control andPrevention, Atlanta, GA. https://www.cdc.gov/tobacco/data_statistics/fact_sheets/adult_data/cig_smoking/index.htm.
63. Flores AR, Herman JL, Gates GJ, Brown TNT. 2016. How many adultsidentify as transgender in the United States? The Williams Institute, LosAngeles, CA. http://williamsinstitute.law.ucla.edu/wp-content/uploads/How-Many-Adults-Identify-as-Transgender-in-the-United-States.pdf.
64. Anderson MJ. 2001. A new method for non-parametric multivariateanalysis of variance. Austral Ecol 26:32– 46. https://doi.org/10.1111/j.1442-9993.2001.01070.pp.x .
65. Wold S, Sjöström M, Eriksson L. 2001. PLS-regression: a basic tool ofchemometrics. Chemometrics Intell Lab Syst 58:109 –130. https://doi.org/10.1016/S0169-7439(01)00155-1.
66. Vázquez-Baeza Y, Pirrung M, Gonzalez A, Knight R. 2013. EMPeror: atool for visualizing high-throughput microbial community data. Giga-science 2:16. https://doi.org/10.1186/2047-217X-2-16.
67. Bray JR, Curtis JT. 1957. An ordination of the upland forest communitiesof southern Wisconsin. Ecol Monogr 27:325–349. https://doi.org/10.2307/1942268.
68. Mantel N. 1967. The detection of disease clustering and a generalizedregression approach. Cancer Res 27:209 –220.
69. Benjamini Y, Hochberg Y. 1995. Controlling the false discovery rate: apractical and powerful approach to multiple testing. J R Stat Soc57:289 –300.
70. Moran PAP. 1950. Notes on continuous stochastic phenomena.Biometrika 37:17–23. https://doi.org/10.1093/biomet/37.1-2.17.
71. Maurice CF, Knowles SCL, Ladau J, Pollard KS, Fenton A, Pedersen AB,Turnbaugh PJ. 2015. Marked seasonal variation in the wild mouse gutmicrobiota. ISME J 9:2423–2434. https://doi.org/10.1038/ismej.2015.53.
72. Cramér H. 1946. Mathematical methods of statistics (PMS-9). PrincetonUniversity Press, Princeton, NJ.
73. Guo W, Sarkar SK, Peddada SD. 2010. Controlling false discoveries inmultidimensional directional decisions, with applications to gene ex-pression data on ordered categories. Biometrics 66:485– 492. https://doi.org/10.1111/j.1541-0420.2009.01292.x.
74. Cohen J. 1992. A power primer. Psychol Bull 112:155–159. https://doi.org/10.1037/0033-2909.112.1.155.
75. Yang JY, Sanchez LM, Rath CM, Liu X, Boudreau PD, Bruns N, GlukhovE, Wodtke A, de Felicio R, Fenner A, Wong WR, Linington RG, Zhang L,Debonsi HM, Gerwick WH, Dorrestein PC. 2013. Molecular networkingas a dereplication strategy. J Nat Prod 76:1686 –1699. https://doi.org/10.1021/np400413s.
76. Vázquez-Baeza Y, Gonzalez A, Smarr L, McDonald D, Morton JT, Navas-Molina JA, Knight R. 2017. Bringing the dynamic microbiome to lifewith animations. Cell Host Microbe 21:7–10. https://doi.org/10.1016/j.chom.2016.12.009.
77. Lloyd-Price J, Mahurkar A, Rahnavard G, Crabtree J, Orvis J, Hall AB,Brady A, Creasy HH, McCracken C, Giglio MG, McDonald D, Franzosa EA,Knight R, White O, Huttenhower C. 2017. Strains, functions and dynam-ics in the expanded Human Microbiome Project. Nature 550:61– 66.https://doi.org/10.1038/nature23889.
78. Röst HL, Sachsenberg T, Aiche S, Bielow C, Weisser H, Aicheler F,Andreotti S, Ehrlich HC, Gutenbrunner P, Kenar E, Liang X, Nahnsen S,Nilse L, Pfeuffer J, Rosenberger G, Rurik M, Schmitt U, Veit J, Walzer M,Wojnar D, Wolski WE, Schilling O, Choudhary JS, Malmström L, Aeber-sold R, Reinert K, Kohlbacher O. 2016. OpenMS: a flexible open-sourcesoftware platform for mass spectrometry data analysis. Nat Methods13:741–748. https://doi.org/10.1038/nmeth.3959.
79. Shannon P, Markiel A, Ozier O, Baliga NS, Wang JT, Ramage D, Amin N,Schwikowski B, Ideker T. 2003. Cytoscape: a software environment forintegrated models of biomolecular interaction networks. Genome Res13:2498 –2504. https://doi.org/10.1101/gr.1239303.
80. Nguyen DD, Melnik AV, Koyama N, Lu X, Schorn M, Fang J, AguinaldoK, Lincecum TL, Jr, Ghequire MGK, Carrion VJ, Cheng TL, Duggan BM,Malone JG, Mauchline TH, Sanchez LM, Kilpatrick AM, Raaijmakers JM,De Mot RD, Moore BS, Medema MH, Dorrestein PC. 2016. Indexing thePseudomonas specialized metabolome enabled the discovery of poae-amide B and the bananamides. Nat Microbiol 2:16197. https://doi.org/10.1038/nmicrobiol.2016.197.
81. Dührkop K, Shen H, Meusel M, Rousu J, Böcker S. 2015. Searchingmolecular structure databases with tandem mass spectra using CSI:
FingerID. Proc Natl Acad Sci U S A 112:12580 –12585. https://doi.org/10.1073/pnas.1509788112.
82. GNPS. 27 September 2016. GNPS antibiotic use subset. http://gnps.ucsd.edu/ProteoSAFe/status.jsp?task�9bd16822c8d448f59a03e6cc8f017f43.
83. GNPS. 27 September 2016. GNPS plants subset. http://gnps.ucsd.edu/ProteoSAFe/status.jsp?task�d26ae082b1154f73ac050796fcaa6bda.
84. GNPS. 5 December 2017. GNPS isolate supernatant. https://gnps.ucsd.edu/ProteoSAFe/status.jsp?task�23f0f5e5c70f4163b445de71d086d186.
85. GNPS. 5 December 2017. GNPS fecal samples co-networked. https://gnps.ucsd.edu/ProteoSAFe/status.jsp?task�adcfbba9b4ca448f8b2133559b16d954.
86. Hellinger E. 1909. Neue Begründung der Theorie quadratischerFormen von unendlichvielen Veränderlichen. J Reine Angew Math136:210 –271.
87. Pluskal T, Castillo S, Villar-Briones A, Oresic M. 2010. MZmine 2: modularframework for processing, visualizing, and analyzing mass spectrometry-based molecular profile data. BMC Bioinformatics 11:395. https://doi.org/10.1186/1471-2105-11-395.
88. Ejigu BA, Valkenborg D, Baggerman G, Vanaerschot M, Witters E, Du-jardin JC, Burzykowski T, Berg M. 2013. Evaluation of normalizationmethods to pave the way towards large-scale LC-MS-based metabolo-mics profiling experiments. OMICS 17:473–485. https://doi.org/10.1089/omi.2013.0010.
89. Hackstadt AJ, Hess AM. 2009. Filtering for increased power for microar-ray data analysis. BMC Bioinformatics 10:11. https://doi.org/10.1186/1471-2105-10-11.
90. Xia J, Wishart DS. 2016. Using MetaboAnalyst 3.0 for comprehensivemetabolomics data analysis. Curr Protoc Bioinformatics 55:14.10.1–14.10.91. https://doi.org/10.1002/cpbi.11.
91. Breiman L. 2001. Random forests. Mach Learn 45:5–32. https://doi.org/10.1023/A:1010933404324.
92. Lozupone CA, Hamady M, Kelley ST, Knight R. 2007. Quantitative andqualitative beta diversity measures lead to different insights into fac-tors that structure microbial communities. Appl Environ Microbiol 73:1576 –1585. https://doi.org/10.1128/AEM.01996-06.
93. Pugsley AP, Goldzahl N, Barker RM. 1985. Colicin E2 production andrelease by Escherichia coli K12 and other Enterobacteriaceae. J GenMicrobiol 131:2673–2686. https://doi.org/10.1099/00221287-131-10-2673.
94. Bankevich A, Nurk S, Antipov D, Gurevich AA, Dvorkin M, Kulikov AS,Lesin VM, Nikolenko SI, Pham S, Prjibelski AD, Pyshkin AV, Sirotkin AV,Vyahhi N, Tesler G, Alekseyev MA, Pevzner PA. 2012. SPAdes: a newgenome assembly algorithm and its applications to single-cellsequencing. J Comput Biol 19:455– 477. https://doi.org/10.1089/cmb.2012.0021.
95. Wood DE, Salzberg SL. 2014. Kraken: ultrafast metagenomic sequenceclassification using exact alignments. Genome Biol 15:R46. https://doi.org/10.1186/gb-2014-15-3-r46.
96. Nougayrède JP, Homburg S, Taieb F, Boury M, Brzuszkiewicz E, GottschalkG, Buchrieser C, Hacker J, Dobrindt U, Oswald E. 2006. Escherichia coliinduces DNA double-strand breaks in eukaryotic cells. Science 313:848 – 851. https://doi.org/10.1126/science.1127059.
97. Putze J, Hennequin C, Nougayrède JP, Zhang W, Homburg S, Karch H,Bringer MA, Fayolle C, Carniel E, Rabsch W, Oelschlaeger TA, Oswald E,Forestier C, Hacker J, Dobrindt U. 2009. Genetic structure and distribu-tion of the colibactin genomic island among members of the familyEnterobacteriaceae. Infect Immun 77:4696 – 4703. https://doi.org/10.1128/IAI.00522-09.
98. Secher T, Samba-Louaka A, Oswald E, Nougayrède JP. 2013. Escherichiacoli producing colibactin triggers premature and transmissible senes-cence in mammalian cells. PLoS One 8:e77157. https://doi.org/10.1371/journal.pone.0077157.
99. Gurevich A, Mikheenko A, Shlemov A, Korobeynikov A, Mohimani H,Pevzner PA. 2018. Increased diversity of peptidic natural productsrevealed by modification-tolerant database search of mass spectra. NatMicrobiol 3:319 –327. https://doi.org/10.1038/s41564-017-0094-2.
100. Finn RD, Clements J, Eddy SR. 2011. HMMER web server: interactivesequence similarity searching. Nucleic Acids Res 39:W29 –W37. https://doi.org/10.1093/nar/gkr367.
101. Bates D, Mächler M, Bolker B, Walker S. 2015. Fitting linear mixed-effects models using lme4. J Stat Softw 67:1– 48. https://doi.org/10.18637/jss.v067.i01.
American Gut: an Open Platform for Microbiome Research
May/June 2018 Volume 3 Issue 3 e00031-18 msystems.asm.org 27
on July 3, 2019 by guesthttp://m
systems.asm
.org/D
ownloaded from

102. Didion JP, Martin M, Collins FS. 2017. Atropos: specific, sensitive, andspeedy trimming of sequencing reads. PeerJ 5:e3720. https://doi.org/10.7717/peerj.3720.
103. Langmead B, Salzberg SL. 2012. Fast gapped-read alignment withBowtie 2. Nat Methods 9:357–359. https://doi.org/10.1038/nmeth.1923.
104. Lu J, Breitwieser FP, Thielen P, Salzberg SL. 2017. Bracken: estimatingspecies abundance in metagenomics data. PeerJ Comput Sci 3:e104.https://doi.org/10.7717/peerj-cs.104.
105. Nurk S, Meleshko D, Korobeynikov A, Pevzner PA. 2017. metaSPAdes: anew versatile metagenomic assembler. Genome Res 27:824 – 834.https://doi.org/10.1101/gr.213959.116.
106. Seemann T. 2014. Prokka: rapid prokaryotic genome annotation. Bioin-formatics 30:2068–2069. https://doi.org/10.1093/bioinformatics/btu153.
107. Wu YW, Simmons BA, Singer SW. 2016. MaxBin 2.0: an automated binningalgorithm to recover genomes from multiple metagenomic datasets.Bioinformatics 32:605–607. https://doi.org/10.1093/bioinformatics/btv638.
108. Rho M, Tang H, Ye Y. 2010. FragGeneScan: predicting genes in shortand error-prone reads. Nucleic Acids Res 38:e191. https://doi.org/10.1093/nar/gkq747.
109. Eddy SR. 2011. Accelerated profile HMM searches. PLoS Comput Biol7:e1002195. https://doi.org/10.1371/journal.pcbi.1002195.
110. Gibson MK, Forsberg KJ, Dantas G. 2015. Improved annotation ofantibiotic resistance determinants reveals microbial resistomes clusterby ecology. ISME J 9:207–216. https://doi.org/10.1038/ismej.2014.106.
111. Boolchandani M, Patel S, Dantas G. 2017. Functional metagenomics tostudy antibiotic resistance. Methods Mol Biol 1520:307–329. https://doi.org/10.1007/978-1-4939-6634-9_19.
112. Jiang L, Amir A, Morton JT, Heller R, Arias-Castro E, Knight R. 2017.Discrete false-discovery rate improves identification of differentiallyabundant microbes. mSystems 2:e00092-17. https://doi.org/10.1128/mSystems.00092-17.
113. McDonald D, Robbins-Pianka A, Mann AE, Vrbanac A, Amir A, Frazier A,Gonzalez A, Tripathi A, Fahimipour AK, Brennen C, Martino C, Lebrilla C,Lozupone C, Lewis CM, Raison C, Zhang C, Lauber CL, Warinner C,Lowry CA, Callewaert C, Bloss C, Huttenhower C, Knights D, Willner D,Galzerani DD, Gonzalez DJ, Mills DA, Chopra D, Gevers D, Berg-Lyons D,Sears DD, Wendel D, Wolfe E, Lovelace E, Hyde ER, Pierce E, TerAvest E,Montassier E, Bolyen E, Bushman FD, Ackermann G, Wu GD, Church GM,Rahnavard G, Saxe G, Gogul G, Humphrey G, Holscher HD, Ugrina I,German JB, Gregory Caporaso JG, Gilbert J, Wozniak JM, Kerr J, RavelJ, Gaffney J, Lewis JD, Morton JT, Suchodolski JS, Jansson JK,Hampton-Marcell JT, Bobe J, Leach J, Raes J, Green JL, Metcalf JL,Chase JH, Eisen JA, Monk J, Navas-Molina JA, et al. 2018. AmericanGut Project fecal sOTU counts table. figshare https://doi.org/10.6084/m9.figshare.6137192.
114. McDonald D, Robbins-Pianka A, Mann AE, Vrbanac A, Amir A, Frazier A,Gonzalez A, Tripathi A, Fahimipour AK, Brennen C, Martino C, Lebrilla C,Lozupone C, Lewis CM, Raison C, Zhang C, Lauber CL, Warinner C,Lowry CA, Callewaert C, Bloss C, Huttenhower C, Knights D, Willner D,Galzerani DD, Gonzalez DJ, Mills DA, Chopra D, Gevers D, Berg-Lyons D,Sears DD, Wendel D, Wolfe E, Lovelace E, Hyde ER, Pierce E, TerAvest E,Montassier E, Bolyen E, Bushman FD, Ackermann G, Wu GD, Church GM,Rahnavard G, Saxe G, Gogul G, Humphrey G, Holscher HD, Ugrina I,German JB, Caporaso JG, Gilbert J, Wozniak JM, Kerr J, Ravel J, GaffneyJ, Lewis JD, Morton JT, Suchodolski JS, Jansson JK, Hampton-Marcell JT,Bobe J, Leach J, Raes J, Green JL, Metcalf JL, Chase JH, Eisen JA, Monk J,Navas-Molina JA, et al. 2018. American Gut Project fecal sOTU relativeabundance table. figshare https://doi.org/10.6084/m9.figshare.6137198.
115. McDonald D, Robbins-Pianka A, Mann AE, Vrbanac A, Amir A, Frazier A,Gonzalez A, Tripathi A, Fahimipour AK, Brennen C, Martino C, Lebrilla C,Lozupone C, Lewis CM, Raison C, Zhang C, Lauber CL, Warinner C,Lowry CA, Callewaert C, Bloss C, Huttenhower C, Knights D, Willner D,Galzerani DD, Gonzalez DJ, Mills DA, Chopra D, Gevers D, Berg-Lyons D,Sears DD, Wendel D, Wolfe E, Lovelace E, Hyde ER, Pierce E, TerAvest E,
Montassier E, Bolyen E, Bushman FD, Ackermann G, Wu GD, Church GM,Rahnavard G, Saxe G, Gogul G, Humphrey G, Holscher HD, Ugrina I,German JB, Caporaso JG, Gilbert J, Wozniak JM, Kerr J, Ravel J, GaffneyJ, Lewis JD, Morton JT, Suchodolski JS, Jansson JK, Hampton-Marcell JT,Bobe J, Leach J, Raes J, Green JL, Metcalf JL, Chase JH, Eisen JA, MonkJ, Navas-Molina JA, et al. 2018. ag_tree.tre. figshare https://doi.org/10.6084/m9.figshare.6137270.
116. McDonald D, Robbins-Pianka A, Mann AE, Vrbanac A, Amir A, Frazier A,Gonzalez A, Tripathi A, Fahimipour AK, Brennen C, Martino C, Lebrilla C,Lozupone C, Lewis CM, Raison C, Zhang C, Lauber CL, Warinner C,Lowry CA, Callewaert C, Bloss C, Huttenhower C, Knights D, Willner D,Galzerani DD, Gonzalez DJ, Mills DA, Chopra D, Gevers D, Berg-Lyons D,Sears DD, Wendel D, Wolfe E, Lovelace E, Hyde ER, Pierce E, TerAvest E,Montassier E, Bolyen E, Bushman FD, Ackermann G, Wu GD, Church GM,Rahnavard G, Saxe G, Gogul G, Humphrey G, Holscher HD, Ugrina I,German JB, Caporaso JG, Gilbert J, Wozniak JM, Kerr J, Ravel J, GaffneyJ, Lewis JD, Morton JT, Suchodolski JS, Jansson JK, Hampton-Marcell JT,Bobe J, Leach J, Raes J, Green JL, Metcalf JL, Chase JH, Eisen JA, MonkJ, Navas-Molina JA, et al. 2018. Full American Gut Project mapping file.figshare https://doi.org/10.6084/m9.figshare.6137315.
117. McDonald D, Robbins-Pianka A, Mann AE, Vrbanac A, Amir A, Frazier A,Gonzalez A, Tripathi A, Fahimipour AK, Brennen C, Martino C, Lebrilla C,Lozupone C, Lewis CM, Raison C, Zhang C, Lauber CL, Warinner C,Lowry CA, Callewaert C, Bloss C, Huttenhower C, Knights D, Willner D,Galzerani DD, Gonzalez DJ, Mills DA, Chopra D, Gevers D, Berg-Lyons D,Sears DD, Wendel D, Wolfe E, Lovelace E, Hyde ER, Pierce E, TerAvest E,Montassier E, Bolyen E, Bushman FD, Ackermann G, Wu GD, Church GM,Rahnavard G, Saxe G, Gogul G, Humphrey G, Holscher HD, Ugrina I,German JB, Caporaso JG, Gilbert J, Wozniak JM, Kerr J, Ravel J, GaffneyJ, Lewis JD, Morton JT, Suchodolski JS, Jansson JK, Hampton-Marcell JT,Bobe J, Leach J, Raes J, Green JL, Metcalf JL, Chase JH, Eisen JA, MonkJ, Navas-Molina JA, et al. 2018. American Gut collated alpha diversities.figshare https://doi.org/10.6084/m9.figshare.6137312.
118. McDonald D, Robbins-Pianka A, Mann AE, Vrbanac A, Amir A, Frazier A,Gonzalez A, Tripathi A, Fahimipour AK, Brennen C, Martino C, Lebrilla C,Lozupone C, Lewis CM, Raison C, Zhang C, Lauber CL, Warinner C,Lowry CA, Callewaert C, Bloss C, Huttenhower C, Knights D, Willner D,Galzerani DD, Gonzalez DJ, Mills DA, Chopra D, Gevers D, Berg-Lyons D,Sears DD, Wendel D, Wolfe E, Lovelace E, Hyde ER, Pierce E, TerAvest E,Montassier E, Bolyen E, Bushman FD, Ackermann G, Wu GD, Church GM,Rahnavard G, Saxe G, Gogul G, Humphrey G, Holscher HD, Ugrina I,German JB, Caporaso JG, Gilbert J, Wozniak JM, Kerr J, Ravel J, GaffneyJ, Lewis JD, Morton JT, Suchodolski JS, Jansson JK, Hampton-Marcell JT,Bobe J, Leach J, Raes J, Green JL, Metcalf JL, Chase JH, Eisen JA, MonkJ, Navas-Molina JA, et al. 2018. Unweighted UniFrac distances. figsharehttps://doi.org/10.6084/m9.figshare.6131024.
119. McDonald D, Robbins-Pianka A, Mann AE, Vrbanac A, Amir A, Frazier A,Gonzalez A, Tripathi A, Fahimipour AK, Brennen C, Martino C, Lebrilla C,Lozupone C, Lewis CM, Raison C, Zhang C, Lauber CL, Warinner C,Lowry CA, Callewaert C, Bloss C, Huttenhower C, Knights D, Willner D,Galzerani DD, Gonzalez DJ, Mills DA, Chopra D, Gevers D, Berg-Lyons D,Sears DD, Wendel D, Wolfe E, Lovelace E, Hyde ER, Pierce E, TerAvest E,Montassier E, Bolyen E, Bushman FD, Ackermann G, Wu GD, Church GM,Rahnavard G, Saxe G, Gogul G, Humphrey G, Holscher HD, Ugrina I,German JB, Caporaso JG, Gilbert J, Wozniak JM, Kerr J, Ravel J, GaffneyJ, Lewis JD, Morton JT, Suchodolski JS, Jansson JK, Hampton-Marcell JT,Bobe J, Leach J, Raes J, Green JL, Metcalf JL, Chase JH, Eisen JA, MonkJ, Navas-Molina JA, et al. 2018. Weighted normalized UniFrac distances.figshare https://doi.org/10.6084/m9.figshare.6133121.
120. Cohen LJ, Kang HS, Chu J, Huang YH, Gordon EA, Reddy BVB, TerneiMA, Craig JW, Brady SF. 2015. Functional metagenomic discovery ofbacterial effectors in the human microbiome and isolation of com-mendamide, a GPCR G2A/132 agonist. Proc Natl Acad Sci U S A112:E4825–E4834. https://doi.org/10.1073/pnas.1508737112.
McDonald et al.
May/June 2018 Volume 3 Issue 3 e00031-18 msystems.asm.org 28
on July 3, 2019 by guesthttp://m
systems.asm
.org/D
ownloaded from