Untitled - UGent Biblio
192
-
Upload
khangminh22 -
Category
Documents
-
view
0 -
download
0
Transcript of Untitled - UGent Biblio


Ontwikkeling en toepassing van (gefunctionaliseerde) nanovezelmembranen voor waterbehandeling
Development and Application of (Functionalised) Nanofibre Membranes for Water Treatment
Nele Daels
Promotoren: prof. dr. ir. K. De Clerck, prof. dr. ir. S. Van Hulle Proefschrift ingediend tot het behalen van de graad van Doctor in de Ingenieurswetenschappen Vakgroep Textielkunde Voorzitter: prof. dr. P. Kiekens Faculteit Ingenieurswetenschappen en Architectuur Academiejaar 2014 - 2015

ISBN 978-90-8578-772-3 NUR 971, 973 Wettelijk depot: D/2015/10.500/16


Voorwoord Gaan ontbijten in een brasserie op een festival, dat was een bizar (en eenmalig) voorval, ooit op folkfestival Dranouter. Maar het bracht me bij Wim en nadien bij Stijn, Howest, UGent, Karen en de nanovezels. Of ik niet bang was van vuil water, vroegen ze me toen ik met nette kledij op het sollicitatiegesprek verscheen. Een maand later zat ik in de riool van een ziekenhuis te Ronse voor staalnames. Erger dan dat werd het (gelukkig) niet en het multidisciplinaire karakter van dit onderzoek maakte het net erg boeiend. Dit boek is het eindresultaat van de vele denkpistes die we afliepen met nanovezels. Er is veel onderzocht geweest en zonder steun van Stijn en Karen was dit helemaal niet zo evident verlopen (en niet zo mooi opgeschreven). Stijn, Karen, bedankt voor jullie enthousiasme en voor de steun. Het was ook heel leerrijk om met jullie te vergaderen. Niet alleen heb ik veel bijgeleerd over het verwoorden van resultaten en observaties, maar intussen weet ik ook alles (?) over leven en reizen met drie kinderen.. en over het mooie Italië. Bedankt voor jullie interessante en positieve inbreng in dit werk! Terwijl ik voor de collega’s in Kortrijk naar “de (electro)spinning” ging in Zwijnaarde en voor de collega’s in Zwijnaarde wat ging experimenteren in het waterlabo te Kortrijk, leerde ik beide vakgroepen kennen met enthousiaste collega’s. Annelies, merci voor de boeiende gesprekken die we hadden. Iline, Sam en Jozefien, bedankt voor de plezante momenten samen. Met jullie heb ik mogelijks het boeiendste congres ooit gedaan op een cruiseschip in een zeestorm en met presentaties in een discotheek. Met Iline en Bert at ik op een gigantisch idyllische plek op een klif de pikantste gerechten, om nadien te blussen met flauw Koreaans bier en leuke verhalen, merci voor die leuke herinneringen! En beide ook erg bedankt voor de praktische hulp in het labo en de vele tips in de wondere wereld van de nanovezels. Lien, merci voor de goeie raad. Sander, met uw optimisme had dit werk een goeie start! De vele avondjes in Kortrijk met streekbieren en leuke collega’s: bedankt Joël, Yannick, Ellen, Sam, Michel, Han, Sofie, Helge, Kevin, Justine, Kristof, Katleen, Imca, Ann V, Ann D, Caroline, Dries, Pascal, Diederik, Stijn DW, Bjorge, Hannele, Junling, Violet en Corrado, maar ook aan de VLAKWA-babes Veerle en Charlotte. Merci ook aan Michael en Evelyne om het iedere dag heel plezant te maken om naar Kortrijk te komen en om leuke ideeën/muziek/recepten uit te wisselen. En Michael, ook merci voor de IT/logistieke hulp. Wim, bedankt voor uw ongelofelijk en aanstekelijk enthousiasme! Graag bedank ik ook al mijn thesisstudenten: Kevin, Kjell, Stephanie, Hanne, Lies, Pieter, Lledo en Wim: dankjewel en gracias voor de hulp! Ik wil ook mijn ouders en zus bedanken voor al hun aanmoedigingen: merci! Beste schoonfamilie, bedankt voor jullie steun. Ook mijn vrienden zou ik graag bedanken voor de interesse en natuurlijk de plezante momenten tussendoor.

Tenslotte wil ik Steven bedanken voor de lichtpuntjes in de dalmomenten, de onvoorwaardelijke steun en de vele aanmoedigingen. Het laatste jaar was om veel redenen een heftig jaar, je verdient een medaille om mij zo kundig naar de finish te begeleiden… en naar de start van iets nieuws deze zomer. Gent, februari 2015 Nele Daels

Table of contents
Samenvatting ...................................................................................................... vii
Summary ............................................................................................................ xiii
1 Introduction, objectives and outline ............................................................... 1
1.1 Introduction..................................................................................................... 2
1.2 Objectives ........................................................................................................ 4
1.3 Outline ............................................................................................................. 5
2 Literature review ........................................................................................... 7
2.1 Introduction..................................................................................................... 8
2.2 Membrane filtration ........................................................................................ 8
2.2.1 Membrane properties .............................................................................. 9
2.2.2 Membrane filtration modules and configurations ................................ 10
2.2.3 Applications for microfiltration membranes ......................................... 13
2.2.4 Membrane fouling and concentration polarization .............................. 17
2.3 Electrospun nanofibre membranes .............................................................. 22
2.3.1 Introduction in nanofibres ..................................................................... 22
2.3.2 Nanofibres for water filtration .............................................................. 23
2.3.3 Electrospinning of nanofibres ................................................................ 23
2.3.4 Production parameters influencing the morphology of the fibres ....... 25
2.3.5 Characteristics of electrospun nanofibre membranes .......................... 27
2.3.6 Functionalisation of nanofibres ............................................................. 27
2.4 Possible applications for functionalised membranes ................................... 28
2.4.1 Microbial removal and anti-bio-fouling ................................................. 28
2.4.2 Removal of organic components ........................................................... 34
2.4.3 Toxic metal adsorption .......................................................................... 35
2.4.4 Long term effects of membrane functionalisation ................................ 36
2.5 Conclusions.................................................................................................... 36

ii
3 Material and methods ................................................................................... 37
3.1 Electrospinning of nanofibre membranes .................................................... 38
3.1.1 Polymer and solvents ............................................................................. 38
3.1.2 Single nozzle set-up ............................................................................... 38
3.1.3 Multi-nozzle set-up ................................................................................ 38
3.1.4 Functionalisation of electrospun nanofibre membranes ...................... 40
3.1.5 Characterization techniques .................................................................. 41
3.2 Filtration experiments ................................................................................... 41
3.2.1 Lab-scale filtration set-up ...................................................................... 41
3.2.2 Submerged semi-dead-end MBR ........................................................... 42
3.2.3 Side-stream cross-flow MBR .................................................................. 44
3.3 Disinfection experiments .............................................................................. 45
3.3.1 Bacteria .................................................................................................. 45
3.3.2 Experiments ........................................................................................... 45
3.3.3 Enumeration of bacteria ........................................................................ 46
3.4 Photocatalytic set-up .................................................................................... 46
3.5 Summary ....................................................................................................... 48
4 Performance assessment of electrospun nanofibres for filter applications ..... 49
4.1 Introduction................................................................................................... 50
4.2 Materials ....................................................................................................... 51
4.3 Methods ........................................................................................................ 51
4.3.1 Determination of some membrane characteristics ............................... 51
4.3.2 Assessment for bacterial removal ......................................................... 51
4.3.3 Nanofibre membrane assessment in a semi-dead-end AS-MBR ........... 52
4.3.4 Cleaning of the membrane .................................................................... 52
4.3.5 Nanofibre membrane in a stand-alone application .............................. 52
4.4 Evaluation of the membrane characteristics ................................................ 53
4.4.1 Clean Water Permeability (CWP) ........................................................... 53
4.4.2 Tensile strength ..................................................................................... 54
4.5 Bacterial removal by filtration ...................................................................... 55
4.5.1 Non-functionalised PA-6 membranes .................................................... 55

iii
4.5.2 Membranes post-functionalised with silver nanoparticles. .................. 57
4.6 Nanofibre membrane used in a submerged semi-dead-end MBR ............... 58
4.7 Cleaning of the membrane............................................................................ 61
4.8 Stand-alone application ................................................................................ 62
4.9 Conclusions.................................................................................................... 63
5 The use of electrospun flat sheet nanofibre membranes in MBR applications 65
5.1 Introduction................................................................................................... 66
5.2 Materials ....................................................................................................... 66
5.3 Methods ........................................................................................................ 67
5.3.1 Semi-dead-end MBR .............................................................................. 67
5.3.2 Cross-flow MBR ...................................................................................... 68
5.4 Nanofibre membrane used in a semi-dead-end MBR .................................. 68
5.4.1 Behaviour of the membrane at constant flux operation ....................... 68
5.4.2 Removal efficiency ................................................................................. 69
5.5 Membrane flux in the cross-flow MBR compared to the semi-dead-end MBR
71
5.5.1 Activated sludge MBR in a semi-dead-end configuration ..................... 71
5.5.2 Trickling filter MBR in a semi-dead-end and cross-flow configuration . 71
5.6 Conclusions.................................................................................................... 73
6 Potential of a functionalised nanofibre microfiltration membrane as an
antibacterial filter ................................................................................................ 75
6.1 Introduction................................................................................................... 76
6.2 Material and methods ................................................................................... 77
6.2.1 Membrane production........................................................................... 77
6.2.2 Disinfection experiments ....................................................................... 77
6.2.3 Leaching experiment .............................................................................. 78
6.3 Primary (short-term) tests on disinfection by filtration of hospital
wastewater ............................................................................................................... 78
6.4 Short, mid- and long-term experiments on WSCP inline functionalised
membranes .............................................................................................................. 80
6.4.1 Measurements on leaching of WSCP ..................................................... 80

iv
6.4.2 Short-term experiments with S. aureus ................................................. 81
6.4.3 Long-term filtration experiments .......................................................... 83
6.5 Conclusions.................................................................................................... 84
7 Functionalisation of electrospun polymer nanofibre membranes with TiO2
nanoparticles in view of dissolved organic matter photodegradation ................... 87
7.1 Introduction................................................................................................... 88
7.2 Material and Methods .................................................................................. 90
7.2.1 Production of the functionalised nanofibres ......................................... 90
7.2.2 Experiments on membrane properties.................................................. 91
7.2.3 Photodegradation experiments ............................................................. 91
7.3 Physical characterization ............................................................................... 92
7.4 Methylene blue removal with membranes produced on a single nozzle set-
up 94
7.4.1 Inline functionalised membranes .......................................................... 94
7.4.2 Post-functionalised membranes ............................................................ 96
7.5 Effect of membrane density on removal of methylene blue ........................ 97
7.6 Methylene blue removal with membranes produced on a multi-nozzle set-
up: post- and inline functionalisation ...................................................................... 98
7.7 Comparison with literature ........................................................................... 99
7.8 Conclusions.................................................................................................... 99
8 Electrospun nanofibre membranes functionalised with TiO2 nanoparticles:
evaluation of humic acid and bacterial removal.................................................. 103
8.1 Introduction................................................................................................. 104
8.2 Material and Methods ................................................................................ 105
8.2.1 Filtration and degradation tests .......................................................... 105
8.2.2 Measurement techniques .................................................................... 106
8.2.3 Tested solutions and samples .............................................................. 106
8.3 Results ......................................................................................................... 107
8.3.1 Photodegradation contact tests .......................................................... 107
8.3.2 WWTP effluent filtration...................................................................... 112
8.4 Conclusions.................................................................................................. 113

v
9 Structure changes and water filtration properties of polyamide nanofibre
membranes ....................................................................................................... 115
9.1 Introduction................................................................................................. 116
9.2 Material and methods ................................................................................. 117
9.2.1 Influence of membrane grammage on CWP ....................................... 117
9.2.2 Heat-treatment and description of different storage conditions ....... 117
9.2.3 Analysis ................................................................................................ 118
9.3 Influence of grammage on clean water permeability ................................. 119
9.4 Influence of storage under different environmental conditions on fibre
morphology ............................................................................................................ 120
9.4.1 Evaluation of SEM images .................................................................... 120
9.4.2 Fibre diameter...................................................................................... 122
9.4.3 Dimensional changes ........................................................................... 122
9.5 Influence of storage under different environmental conditions on
membrane properties ............................................................................................ 124
9.5.1 Tensile strength ................................................................................... 124
9.5.2 Clean water permeability ..................................................................... 125
9.5.3 Bacterial removal by filtration ............................................................. 125
9.6 Conclusions.................................................................................................. 127
10 Concluding remarks and perspectives .......................................................... 129
10.1 Introduction................................................................................................. 130
10.2 Microfiltration ............................................................................................. 130
10.3 Functionalisation ......................................................................................... 131
10.3.1 Bacterial removal ................................................................................. 131
10.3.2 Organic matter removal ....................................................................... 132
10.4 Storage and handling .................................................................................. 133
10.5 Future perspectives ..................................................................................... 133
11 References .................................................................................................. 135

vi

vii
Samenvatting Door toenemend gebruik van water en de vermindering van drinkwaterbronnen door vervuiling en klimaatverandering, ontstaat een te kort aan water. Hierdoor moet aandacht worden besteed aan onderzoek naar het ontwikkelen van technieken om een schoner milieu te bereiken. Membraanfiltratie is een van de mogelijke oplossingen om de waterkwaliteit te verhogen en kan gebruikt worden voor het behandelen van alternatieve waterbronnen zoals zeewater, regenwater en afvalwaterzuiveringseffluent. Nanovezelmembranen hebben een aantal heel interessante eigenschappen voor waterfiltratie. Vanwege hun hoge porositeit bezitten ze een hogere waterdoorlaatbaarheid dan conventioneel beschikbare membranen, waardoor ze minder energie verbruiken bij het filtreren aan eenzelfde debiet. In dit werk worden nanovezelmembranen met microfiltratie-poriën gebruikt voor experimenten in waterfiltratie. Ook bieden nanovezels de mogelijkheid om functionaliteit toe te voegen aan het membraanoppervlak en dus aan de filtratie. De nano-afmetingen van de nanovezels leiden tot zeer hoge specifieke oppervlakken waardoor vezeleigenschappen aanzienlijk beïnvloed worden bij toevoeging van functionele stoffen. Het productieproces (electrospinning) maakt het toevoegen van dergelijke functionaliteiten ook mogelijk. De combinatie van uitstekende structurele eigenschappen zoals hoge porositeit, hoog specifiek oppervlak en de mogelijkheid om functionaliteit aan de vezels toe te voegen, doet vermoeden dat de nanovezelmembranen zeer efficiënt kunnen zijn in waterbehandeling. Als zodanig gaat dit proefschrift over de toepassing van nanovezelmembranen voor waterbehandeling. Het overzicht van dit onderzoek wordt weergegeven in figuur 0.1. Een eerste reeks experimenten (hoofdstuk 4) onderzoekt het mogelijke gebruik van de nanovezelmembranen in waterfiltratie waarbij drie verschillende toepassingen werden bestudeerd. Niet-gefunctionaliseerde nanovezelmembranen en nanovezelmembranen die na hun productie werden gefunctionaliseerd met zilveren nanodeeltjes, werden getest op bacteriële verwijdering en toonden goede resultaten. Ten tweede werd het nanovezelmembraan toegepast in een labo-schaal membraanbioreactor (MBR). Als laatste experiment in dit verkennende hoofdstuk, werd het nanovezelmembraan toegepast als stand-alone-filter voor waterbehandeling. De resultaten waren veelbelovend, maar de nanovezelmembranen toonden enkele problemen met scheuren die ontstonden bij het gebruik in een MBR. Het elektrospinproces werd hierna geoptimaliseerd en de nanovezelmembranen werden in een volgend hoofdstuk toegepast in verschillende MBR set-ups, waaronder een biofilm-uitvoering in een semi-dead-end en cross-flow MBR (hoofdstuk 5).

viii
Figuur 0.1: Overzicht van de hoofdstukken en hun belangrijkste conclusies.
De waterdoorlaatbaarheid van de nanovezelmembranen was erg hoog. De gevonden waarden zijn meer dan 10 keer hoger in vergelijking met commercieel beschikbare microfiltratiemembranen, namelijk 27x103 l/m2.u.bar.
(10) Conclusies en perspectieven: Dit werk toonde het grote potentieel
van nanovezelmembranen in waterbehandeling met focus op laaggeconcentreerde stromen
(9) Bewaren van structuur en filtratie-eigenschappen: Om de unieke eigenschappen van het
nanovezelmembraan te bewaren wordt aangeraden om de membranen vochtig te houden eens het in contact
kwam met water.
(7&8) Nanovezels gefunctionaliseerd met nTiO2, getest
voor verwijdering van organische materie: Humuszuren en bacteriën kunnen worden geoxideerd
door nTiO2
gefunctionaliseerde membranen, na 2-4 uur
UV-belichting
(6) Nanovezels gefunctionaliseerd met biocides, getest voor desinfectie:
Functionalisatie met WSCP geeft 3 log10
extra bacteriële verwijdering. Lange termijntesten tonen
reproduceerbare resultaten.
(1&2) Achtergrond & Literatuurstudie (3) Materialen en methodes
(4) Haalbaarheidsstudie over de toepassing van nanovezelmembranen in waterfiltratie:
De eerste resultaten zijn veelbelovend: hoge water doorlaatbaarheid, goede filtratieresultaten en een verbeterde
disinfectie door toevoeging van functionele stoffen. De productietechniek kan echter nog worden geoptimaliseerd.
(5) Nanovezelmembranen toegepast in MBR:
Nanovezelmembranen kunnen worden toegepast in biofilm
MBR set-ups.

ix
De haalbaarheidsstudie toonde aan dat een steunlaag onder het nanovezelmembraan vereist is. Zonder deze steunlaag aan de permeaatzijde, kunnen de poriën in het membraan zich makkelijk verbreden door de hoge filtratiedruk, wat er voor zorgt dat bijvoorbeeld bacteriën doorheen het membraan kunnen filtreren. Een steunlaag is eveneens aan te raden om de vervuiling van het membraan te verminderen die ontstaat door het bewegen van het membraan. In de vervolgens uitgevoerde experimenten over het gebruik van de nanovezels in een MBR (hoofdstuk 5), werden enkele aanpassingen aangebracht aan de membraanmodule, onder andere werd een steunlaag gebruikt. Ook werden enkele wijzigingen aangebracht om de vervuiling van het membraan te minimaliseren door de slibbelasting van de reactor te verminderen. Dit werd bereikt door het gebruik van een vlokmiddel en het toepassen van een biofilm met lavasteen als substraat. Naast de semi-dead-end werd ook een cross-flow MBR getest. De toepassing in een actief slib MBR toonde een te snelle fluxdaling door irreversibele membraanvervuiling waardoor het toepassen van een nanovezelmembraan in een actief slib MBR niet concurrentieel is met de huidige technologie. De experimenten toonden wel een belangrijke verbetering wanneer gebruik werd gemaakt van een biofilm met lavasteen als substraat als voorfiltratie. Dit zorgde voor een lager geconcentreerde slibstroom over het membraan. In vergelijking met conventionele vezels hebben nanovezels een veel groter specifiek oppervlak waardoor nanovezels veel reactiever en efficiënter zijn wanneer hun oppervlak wordt gefunctionaliseerd. Alle experimenten met gefunctionaliseerde nanovezels tonen het toegevoegde effect van deze functionalisatie bovenop hun uitstekende filtratie-eigenschappen. Verschillende types functionalisatie werden toegepast en getest voor disinfectie en verwijderen van organische materiaal. Zowel filtratie-experimenten als contacttesten werden uitgevoerd op verschillende stalen die werden gefunctionaliseerd tijdens of na hun productieproces. Een eerste hoofdstuk over functionalisatie van nanovezels, bestudeerde de toegevoegde waarde van biocides voor het verwijderen van bacteriën tijdens waterfiltratie (hoofdstuk 6). Verschillende biocides (bronopol, WSCP, DBNPA,..) werden getest in disinfectie-experimenten op afvalwater van een ziekenhuis en bacteriële oplossingen (S. aureus en E.coli). De (micro)filtratietesten tonen dat een 5.2 log10/100ml verwijdering mogelijk was bij filtratie met WSCP gefunctionaliseerde membranen (initiële concentratie 108 CFU/100 ml), wat een 3 log10 per 100ml extra verwijdering betekent ten opzichte van een niet gefunctionaliseerd nanovezelmembraan. Bacteriële verwijdering na een half uur contact met het WSCP gefunctionaliseerd membraan, was 2 log10/100ml enkel door de biocide werking van WSCP. Deze experimenten tonen dat de toevoeging van biocides aan het nanovezelmembraan resulteert in een antibacterieel effect. Met de productie van nanovezelmembranen op de geoptimaliseerde electrospinning set-up in het laatste hoofdstuk, werd het mogelijk om zelfs met niet-gefunctionaliseerde nanovezelmembranen alle aanwezige S. aureus (initiële

x
concentratie 108 CFU/100 ml) uit de oplossing te filtreren. Door functionaliseren met biocides zoals in voorgaande test met WSCP, wordt wellicht een nog hogere verwijdering verkregen. Titanium dioxide (TiO2) nanodeeltjes kunnen organisch materiaal degraderen en bacteriële cellen deactiveren wanneer ze belicht worden met UV-A. Tijdens deze belichting produceert TiO2, reactieve zuurstofdeeltjes zoals peroxide, hydroxylradicalen en hydroperoxyl radicalen door reductieve en oxidatieve reacties. Dit maakt deze TiO2 nanodeeltjes interessant om te gebruiken op membraanoppervlakken voor het degraderen van organisch materiaal of voor anti-fouling toepassingen. Hoofdstukken 7 en 8 gaan over de verschillende methodes om deze TiO2 nanodeeltjes toe te voegen aan de nanovezelmembranen en kijken daarbij naar het effect op membraanmorfologie, optimalisatie van de TiO2 concentratie en de mogelijkheid om met TiO2 gefunctionaliseerde nanovezels organisch materiaal te degraderen onder invloed van UV-A. De fotokatalytische werking van de nTiO2 gefunctionaliseerde nanovezelmembranen werd aangetoond voor verschillende types water. In een eerste stap werd de kleurstof methyleenblauw gebruikt als modelcomponent voor organisch materiaal (hoofdstuk 7). De TiO2 gefunctionaliseerde nanovezelmembranen werden geproduceerd door het toevoegen van twee types nTiO2 deeltjes (21 nm commercieel Degussa P25 TiO2 nanodeeltjes en 6 nm TiO2 nanodeeltjes) in verschillende concentraties, voor en na het nanovezelproductieproces. Beide methodes en beide deeltjes veroorzaakten een afbraak van methyleenblauw bij UV belichting. De experimenten op de verwijdering van methyleenblauw met nTiO2 gefunctionaliseerde membranen, gaven goede resultaten waardoor verder werd getest op het verwijderen van organisch materiaal (hoofdstuk 8). Humuszuren aanwezig in het effluent van een waterzuivering en commercieel beschikbare hoger geconcentreerde humuszuren werden getest. Humuszuren werden voor 83% verwijderd uit het effluent na 2 uur belichting met UV-A bij gebruik van een membraan dat was gefunctionaliseerd met commercieel P25 nTiO2 (functionalisatie na productie). Verder werd verwijdering van 67% humuszuren bereikt na 4 uur belichting van een hoger geconcentreerde humuszuuroplossing (60mg/l). Ook het antibacterieel effect van nTiO2 gefunctionaliseerde nanovezel-membranen werd geëvalueerd. Een 4.5 log10 verwijdering van S. aureus werd bereikt na 6 uur contact met de nTiO2 gefunctionaliseerde nanovezelmembranen onder UV-A-licht. Tijdens dit werk werd de electrospinning set-up steeds verder geoptimaliseerd, afhankelijk van de bevindingen tijdens de experimenten voor waterbehandeling. Dit werd vertaald in de productie van nanovezels met steeds verder geoptimaliseerde eigenschappen voor waterfiltratie. Om de unieke eigenschappen van dit erg poreuze membraan te behouden, moeten enkele maatregelen in acht worden genomen tijdens het bewaren en het gebruik er van (hoofdstuk 9). Eens het membraan in contact is geweest met water, is het belangrijk om het membraan vochtig te houden om de unieke eigenschappen te bewaren. Hittebehandeling verbetert de stabiliteit

xi
van de nanovezelstructuren. Hierbij wordt een hogere treksterkte verkregen en blijven de structuur en eigenschappen beter bewaard wanneer het membraan toch droog komt te staan. Deze hittebehandeling is aangeraden meteen na de productie van de vezels. Tot slot kan geconcludeerd worden dat dit werk het grote potentieel voor nanovezelmebranen aantoont in verschillende types van waterbehandeling, met een focus op laaggeconcentreerde stromen. De nanovezelmembranen kunnen een erg hoog debiet aan water verwerken en zijn dus geschikt voor het behandelen van grote volumes water. Bijvoorbeeld als voorbehandeling voor proces of koelwater, als bescherming voor RO membranen of voor filtratie van bacteriën. Daarnaast tonen de mogelijkheden tot functionalisatie hun potentieel voor verbeterde disinfectie, een mogelijkheid om te dienen als anti-fouling membranen en om organische stoffen te verwijderen. Deze functionalisatie van nanovezelmembranen opent nieuwe onderzoeksmogelijkheden naar behandeling van water vervuild met organische componenten zoals micropolluenten of adsorptie van metalen.

xii

xiii
Summary Water scarcity originates from growing use of water and reduction of drinking water resources due to contamination and climate change. Considering the shortage of usable water, attention must be paid towards global research in developing knowledge to obtain a cleaner environment. Membrane filtration technology is one of such potential solutions to increase the water quality and can be used for treating alternative sources of water, such as seawater, rainwater and wastewater effluent. Nanofibre membranes have some interesting properties for water filtration purposes. Due to their high porosity and interconnected porous structures, nanofibre membranes are much more water permeable than conventional available techniques, hence consume lower energy when filtering at the same flow rate. In this work nanofibre membranes with microfiltration pores are used for experiments in water treatment. Also, nanofibres have the possibility to add functionality to membrane filtration with a greater impact than conventional fibres due to their higher surface area while their production technique (electrospinning) makes it possible to actually add functionalities to the fibres. This combination of excellent structural properties such as high porosity, high surface area and the possibility to add functionality to the fibres, are assumed to make the electrospun nanofibre membrane highly efficient for water filtration. As such, this PhD thesis deals with the implementation of electrospun nanofibre membranes for water filtration. The outline of this research is given in Figure 0.1. A first series of experiments (chapter 4) explores the possible use of nanofibre microfiltration membranes in water filtration. Three different applications were studied. Non-functionalised nanofibre membranes and nanofibres that were post-functionalised with silver nanoparticles, were tested for bacterial removal. Secondly the nanofibre membrane was applied in a lab-scale submerged membrane bioreactor (MBR). At last, the nanofibre membrane was applied as stand-alone filter for water treatment. The results were promising but the nanofibres showed some problems with membrane rupture when first used in an MBR. The electrospinning process was hereafter optimised and the nanofibre membranes were applied in different MBR set-ups, including trickling filter and in semi-dead-end and cross-flow MBR configuration (chapter 5).

xiv
Figure 0.1: Schematic representation of the main conclusions in this dissertation.
The clean water flux for the nanofibre membranes was found to be very high. The values were more than 10 times higher for the nanofibre membranes compared to their commercial counterparts: 27x103 l/m2.h.bar.
(10) Conclusions & perspectives: this work demonstrated the major
potential for nanofibre membranes in various types of water treatment with a
focus on low loaded streams
(9) Structure changes and filtration properties: To maintain the unique properties of the nanofibre
membrane, it is recommended to keep the membrane in wet conditions once it has been in contact with water.
(7&8) Nanofibres functionalised with nTiO2 tested for
organic matter removal: Humic acids and bacteria can be oxidised by nTiO
2
functionalised membranes after 2-4 hours of illumination with UV-A.
(6) Nanofibres functionalised with biocides, tested for disinfection:
Functionalisation with WSCP gave 3 log
10 extra bacterial removal.
Long term tests showed reproducable results.
(1&2) Background & Literature review (3) Material and methods
(4) Feasibility study on application of nanofibre membranes in water filtration:
The first results are promising: high water permeability, good filtration performance and enhanced disinfection due to added
functionalities. Still the production technique needs some optimisation.
(5) Nanofibre membranes used in MBR:
Nanofibre membranes can be applied in a trickling filter MBR.

xv
The feasibility study pointed out that a membrane support was required. Without membrane support on the permeate side of the membrane, pores tend to widen due to high pressure on the membrane, allowing bacteria to pass. Also, a supportive layer on the permeate side of the membrane is recommended to decrease the movement of the membrane and thus reducing the layered fouling. In follow-up experiments on the use of nanofibres for MBR (chapter 5), some adaptations were made on the membrane module to support the thin nanofibre membrane and some experiments were done to minimise the fouling on the membrane by decreasing the sludge load in the reactor. This was obtained by making use of a membrane performance enhancer and a trickling filter in the semi-dead-end MBR. Also the use of the nanofibre membrane in a cross-flow MBR pilot was investigated and compared to the other MBR configurations. The application in the activated sludge MBR showed a too fast flux decay due to irreversible fouling. As such the nanofibre membrane applied in an MBR is not competitive with currently applied commercial membranes. The experiments however revealed an important improvement when a trickling filter was introduced that served as a pre-filter thus causing a lower sludge loaded stream as influent for the nanofibre membrane. Compared to conventional fibres, nanofibres have a very large specific surface area. Therefore, nanofibres are much more reactive and efficient when their surface is functionalised. All functionalisation experiments revealed a successful functionalisation of nanofibre membranes and exposed an additional effect of this functionalisation on top of the high-flux filtration possibilities. Different functionalised nanofibre membranes were tested for their disinfection and organic matter removing abilities. Filtration experiments and contact tests were performed on different samples that were inline or post-functionalised with different functional agents. A first chapter on functionalisation of nanofibres, focused on the added value of incorporating biocides to nanofibre microfiltration membranes in view of bacterial removal during water filtration (chapter 6). Different functional biocidal agents (bronopol, WSCP, DBNPA,...) were evaluated in disinfection experiments performed on hospital wastewater and inoculated bacterial solutions (S. aureus en E.coli). The experiments demonstrated that a 5.2 log10/100ml bacterial removal was possible for filtration with WSCP functionalised membranes ( initial concentration of 108 CFU/100 ml), which is 3 log10/100ml extra removal on a non-functionalised nanofibre membrane. Bacterial removal after 0,5 hours contact with the WSCP functionalised membrane was 2 log10/100ml due to the biocidal effect of WSCP. These experiments showed the successful incorporation of biocides on the electrospun membranes, providing an anti-microbial effect. With an optimised electrospinning set-up in the last chapter, it was even possible by filtration with non-functionalised nanofibre membranes to remove all S. aureus (initial concentration 108 CFU/100 ml). When functionalised with WSCP, an extra removal may even further enhance these disinfection results.

xvi
Titanium dioxide (TiO2) nanoparticles have the ability to degrade natural organic matters and destruct bacterial cells when illuminated with UV-A. During illumination, TiO2 nanoparticles produce reactive oxygen species (ROS) such as peroxide, hydroxyl radicals and hydroperoxyl radicals through reductive or oxidative reactions which makes its interesting for use in membranes in view of organic matter degradation and anti-fouling perspectives. Chapters 7 and 8 focussed on different methods for incorporation TiO2 nanoparticles in the nanofibre membranes thereby looking at the effects on physical characteristics, optimisation of TiO2 nanoparticle concentration and the ability of nanofibres functionalised with TiO2 nanoparticles to photodegrade dissolved organic matter. Photocatalytic activity of nanofibre membranes functionalised with TiO2 was demonstrated with different types of water. In a first stage, methylene blue was used as a model compound for dissolved organic matter (chapter 7). The TiO2 functionalised nanofibre membranes were prepared by adding two types of TiO2 nanoparticles (21 nm commercial Degussa P25 TiO2 nanoparticles and colloidal 6 nm TiO2 nanoparticles) at different concentrations to the spinning solution prior to the spinning solution or by post-functionalising the electrospun membranes after their production. Both methods improved the degradation of methylene blue under UV irradiation. Since experiments on methylene blue degradation with nTiO2 functionalised nanofibres gave positive results, it was further focusses on the removal of dissolved organic matter (chapter 8). Humic acids appearing in WWTP effluent as well as commercially available higher concentrated humic acids were tested. Also the bactericidal effect of the nTiO2 functionalised nanofibre membranes was examined. Humic acid removal of 83% of the WWTP effluent was obtained after 2 hours of illumination using a post-functionalised commercial TiO2 membrane, which was the best performing membrane. Further, 67% degradation after 4 hours of illumination was observed with a higher loaded commercial 60 mg/l humic acid solution. Also, nanofibre membranes functionalised with TiO2 give a 4.5 log10 removal of S. aureus after 6 hours of contact with the functionalised membranes under UV illumination. During this work, the electrospinning set-up was updated gradually thereby responding to the findings in the water treatment experiments. This was translated in the production of nanofibres with increasingly enhanced properties for water treatment applications due to their porous structure. To maintain these characteristics, some care has to be taken into account during storage and handling in water filtration (chapter 9). Once in contact with water, it is important to keep the membrane in wet conditions to maintain its unique properties. Heat-treatment enhances the stability of the nanofibrous structures. When heat-treated, the membrane has a higher tensile strength and keeps its structure and characteristics better during storage in dry and mixed conditions but heat-treatment does not prevent the membrane of losing some of its properties after being in a wet/dry cycle. As such it is recommended to do a heat-treatment on the nanofibre membrane immediately after production.

xvii
In conclusion, this work demonstrated the major potential for electrospun nanofibre membranes in various types of water filtration with a focus on low loaded streams. The nanofibre membranes have very high fluxes that are useful to treat large volumes of water for example as pre-treatment for process and cooling water, as protection for RO membranes or for bacterial filtration. In addition, the functionalisation properties of the nanofibres showed their potential application for improved disinfection, a possibility to act as anti-fouling membranes and opens new research opportunities towards treatment of water polluted with organic components such as for example micropollutants.

xviii

xix
List of publications
A1 Publications Nele Daels, Marija Radoicic, Maja Radetic, Stijn Van Hulle, and Karen De Clerck. 2014. “Functionalisation of Electrospun Polymer Nanofibre Membranes with TiO2 Nanoparticles in View of Dissolved Organic Matter Photodegradation.” Separation and Purification Technology 133: 282–290. Patrick Vanraes, Gert Willems, Nele Daels, Stijn W.H. Van Hulle, Karen De Clerck, Pieter Surmont, Frederic Lynen, Jeroen Vandamme, Jim Van Durme, Anton Nikiforov, Christophe Leys, 2014. “Decomposition of atrazine traces in water by combination of non-thermal electrical discharge and adsorption on nanofiber membrane.” Water Research De Vrieze, Sander, Nele Daels, Karel Lambert, Bjorge Decostere, Zeger Hens, Stijn Van Hulle, and Karen De Clerck. 2012. “Filtration Performance of Electrospun Polyamide Nanofibres Loaded with Bactericides.” Textile Research Journal 82 (1): 37–44. Impact factor: 1.135, category: MATERIALS SCIENCE, TEXTILES, rank: 4/22. Nele Daels, Sander De Vrieze, Imca Sampers, Bjorge Decostere, Philippe Westbroek, Ann Dumoulin, Pascal Dejans, Karen De Clerck, and Stijn Van Hulle. 2011. “Potential of a Functionalised Nanofibre Microfiltration Membrane as an Antibacterial Water Filter.” Desalination 275 (1-3): 285–290. Impact factor: 2.59, category: WATER RESOURCES, rank: 5/78. Nele Daels, Sander De Vrieze, Bjorge Decostere, Pascal Dejans, Ann Dumoulin, Karen De Clerck, Philippe Westbroek, and Stijn Van Hulle. 2010. “The Use of Electrospun Flat Sheet Nanofibre Membranes in MBR Applications.” Desalination 257 (1-3): 170–176. Impact factor: 1.851, category: WATER RESOURCES, rank: 14/75. Decostere, Bjorge, Nele Daels, Sander De Vrieze, Pascal Dejans, Tamara Van Camp, Wim Audenaert, Philippe Westbroek, Karen De Clerck, Charlotte Boeckaert, and Stijn Van Hulle. 2010. “Initial Testing of Electrospun Nanofibre Filters in Water Filtration Applications.” Water Sa 36 (1): 151–155. Impact factor: 0.663, category: WATER RESOURCES, rank: 57/75. Decostere, Bjorge, Nele Daels, Sander De Vrieze, Pascal Dejans, Tamara Van Camp, Wim Audenaert, Joël Hogie, Philippe Westbroek, Karen De Clerck, and Stijn Van Hulle. 2009. “Performance Assessment of Electrospun Nanofibres for Filter Applications.” Desalination 249 (3): 942–948. Impact factor: 2.034, category: WATER RESOURCES, rank: 6/64.

xx
A2 Publication Decostere, Bjorge, Nele Daels, Sander De Vrieze, Pascal Dejans, Tamara Van Camp, Wim Audenaert, Joël Hogie, Philippe Westbroek, Karen De Clerck, and Stijn Van
Hulle. 2008.“Waterfiltratie Met Elektrogesponnen Nanovezels.”
Afvalwaterwetenschap 7 (4): 17–28.
Publications in conference proceedings
Vanraes, Patrick, G Willems, Anton Nikiforov, Nele Daels, Karen De Clerck, Pieter
Surmont, Frederic Lynen, and Christophe Leys. 2014. “The Use of Pulsed DBD Discharge Above Water in Combination with Nano-fiber Filtration for Control of
Micro-pollutants in Water.” In XXII Europhysics Conference on Atomic and
Molecular Physics of Ionized Gases, Abstracts, 344–345.
Nele Daels, Annelies Goethals, Stijn Van Hulle, and Karen De Clerck. 2013. “Functionalisation of Electrospun Nanofibre Membranes with Titaniumdioxide
Nanoparticles.”In Colleció e-Treballs d’Informàtica i Tecnologia, ed. José M
Lagarón, Luis Cabedo, Amparo López, and María J Fabra, 17:180–181. Castelló de la Plana, Spain: Universitat Jaume. Servei de Communicació i Publicacions.
Nele Daels, Annelies Goethals, Karen De Clerck, and Stijn Van Hulle. 2013. “Functionalisation of Electrospun Nanofibre Membranes with Titaniumdioxide
Nanoparticles.” In Water and Waste Water Technologies, 10th IWA Leading Edge
Conference, Abstracts. International Water Association (IWA).
Nele Daels, Annelies Goethals, Karen De Clerck, and Stijn Van Hulle. 2013. “Functionalisation of Electrospun Nanofibre Membranes with Titaniumdioxide
Nanoparticles for Water Treatment.” In IWA BeNeLux Regional Young Water Professionals Conference, 3rd, Abstracts. International Water Association (IWA).
Nele Daels, Annelies Goethals, Karen De Clerck, and Stijn Van Hulle. 2012. “Performance Assessment of Functionalized Electrospun Nanofibres for Removal of
Pathogens.” In 2th International Conference on Electrospinning, Abstracts, 38–38. Jeju, Korea: Korea Advanced Institute of Science and Technology. Goethals, Annelies, Nele Daels, Imca Sampers, Karen De Clerck, and Stijn Van Hulle.
2011. “Functionalised Nanofibre Membranes for Water Filtration.” In Conference Book : 6th IWA Specialist Conference on Membrane Technology for Water &
Wastewater Treatment, 173–174. International Water Association (IWA). Goethals, Annelies, Nele Daels, Imca Sampers, Karen De Clerck, and Stijn Van Hulle.
2011. “Electrospun Nanofiber Membranes Functionalized with Antibacterial
Particles.” In EUROMAT 2011, Abstracts. Société Française de Métallurgie et de Matériaux ; Associazione Italiana di Metallurgia.

xxi
Nele Daels, Sander De Vrieze, Imca Sampers, Bjorge Decostere, Philippe Westbroek,
Ann Dumoulin, Pascal Dejans, Karen De Clerck, and Stijn Van Hulle. 2010. “Performance Assessment of Functionalized Electrospun Nanofibres for Removal of
Pathogens.” In IWA World Water Congress, 7th, Proceedings. International Water Association (IWA). Daels, Nele, Sander De Vrieze, Imca Sampers, Bjorge Decostere, Philippe Westbroek,
Ann Dumoulin, Pascal Dejans, Karen De Clerck, and Stijn Van Hulle. 2010. “Performance Assessment of Functionalized Electrospun Nanofibres for Removal of
Pathogens.” In Membranes in Drinking and Industrial Water Treatment, Proceedings. International Water Association (IWA). Nele Daels, Sander De Vrieze, Imca Sampers, Bjorge Decostere, Philippe Westbroek,
Ann Dumoulin, Pascal Dejans, Karen De Clerck, and Stijn Van Hulle. 2010. “
Performance Assessment of Functionalized Electrospun Nanofibres for Removal of
Pathogens.” In European Meeting on Chemical Industry and Environment, 6th, Proceedings. Daels, Nele, Bjorge Decosteren, Sander De Vrieze, Tamara Van Camp, Wim
Audenaert, Philippe Westbroek, Karen De Clerck, and Stijn Van Hulle. 2010. “
Functionalised Electrospun Nanofibres for Removal of Pathogens.” In Flemish Youth Conference of Chemistry, 10th, Abstracts. Koninklijke Vlaamse Chemische Vereniging. Jongerensectie. Nele Daels, Bjorge Decostere, Sander De Vrieze, Pascal Dejans, T Van Camp, Wim Audenaert, Joël Hogie, Philippe Westbroek, Karen De Clerck, and Stijn Van Hulle.
2009. “Performance Assessment of Functionalized Electrospun Nanofibres for
Removal of Pathogens.” In IWA BeNeLux Regional Young Water Professionals Conference, 1st, Abstracts.

xxii

xxiii
List of abbreviations (C10H24Cl2N2O)n WSCP •OH hydroxyl radical Ag silver AS-MBR activated sludge membrane bioreactor Au gold BOD biological oxygen demand C2H2O4 oxalic acid C3H2Br2N2O DBNPA C3H6BrNO4 bronopol C6H8O7 citric acid C9H6N2S3 TCMTB CA cellulose acetate CaCO3 calcium carbonate CaPO4 calcium phosphate CaSO4 calcium sulphate CB conduction band CIL cleaning in line CIP cleaning in place COD chemical oxygen demand CuO copper(II) oxide CWP clean water permeability DBP disinfection by-product DO dissolved oxygen e- electron EPS extracellular polymeric substances
FE SEM field emission scanning electron microscope
H2O2 hydrogen peroxide HRT hydraulic residence time MBR membrane bioreactor MF microfiltration MLSS Mixed liquor suspended solids MPE membrane performance enhancers nAg silver nanoparticles NaOCl sodium hypochlorite NF nanofiltration NOM natural organic matter nTiO2 titaniumdioxide nanoparticles O2- superoxide anion O2
•− superoxide radical anions OH· hydroxyl radical

xxiv
P phosphorus PA-6 polyamide-6 PC polycarboate PEO polyethylene oxide PES polyethersulfone PLA polylactic acid PSU polysulfone PU polyurethane PVA polyvinyl alcohol PVDF polyvinylidenefluoride PVP poly(vinylpyrrolidone) QAC quaternary ammonium compounds RO reverse osmosis ROS reactive oxygen species SEM scanning electron microscope SMP soluble microbial products TF-MBR trickling filter membrane bioreactor TiO2 titaniumdioxide TMP transmembrane pressure TSS total suspended solids UF ultrafiltration UV ultraviolet VB valence band wt% weight percent γ-AlO(OH) boehmite ZnO zincoxide

1
1 Introduction, objectives and outline
This chapter is about the general need of water treatment and introduces
electrospun nanofibre membranes as an interesting technique for water filtration.

2
1.1 Introduction
Water scarcity originates from the growing use of water and reduction of drinking water resources due to contamination and climate change (UNDP 2006). Because of the growing world population, a bigger demand for clean water arises for agricultural, industrial and domestic uses. This makes the reuse of water increasingly crucial. Considering the shortage of usable water, attention must be paid towards global research in developing knowledge and equipment to obtain clean water sources such as membrane filtration. For instance using alternative sources of water, such as seawater, rainwater or wastewater effluent and removal of contaminants through a (membrane) filtration process, is a potential solution to increase the water quality. Membrane filtration is a separation technique using a semi-permeable membrane over which pressure, temperature, concentration or an electric potential difference is present. Certain molecules are allowed to pass, while others are stopped. Membranes are divided in four classes depending on their pore size (Mulder 1996) (Figure 1.1).
Figure 1.1: Application ranges of the different membrane classes (Crittenden et al. 2012b).
The interest of this study goes to microfiltration with nanofibres. Microfiltration membranes are typically used for the removal of suspended solids, protozoa such as Cryptosporidium and Giardia Lamblia and reduction of turbidity (Chang et al. 2001, Chiemchaisri et al. 1993, Hsu and Yeh 2003). They are also used as a post-treatment for granular media filtration or as a pre-treatment prior to desalination with nanofiltration and reverse osmosis. Nanofibres are among the most important nanostructured materials studied for various applications such as healthcare, energy, tissue engineering, electronics, protective clothing and environmental applications (Figure 1.2) (Huang et al. 2003). Various techniques could be used to produce nanofibres, such as electrospinning

3
(Doshi and Reneker 1995), phase separation (Peng et al. 2013), self-assembly (Luo et al. 2011), solvent evaporation (Yongquan et al. 2012) and drawing-processing method (Chen et al. 2004). Among the different techniques, electrospinning is seen as the most simple method to produce one-dimensional nanofibres (Nasreen et al. 2013).
Figure 1.2: Potential applications of polymer nanofibres (Huang et al. 2003).
Nanofibre membranes have some interesting properties for water filtration purposes. Due to their high porosity and interconnected porous structures, nanofibre membranes are much more water permeable than conventional available techniques, hence consume lower energy. Nanofibres have adjustable pore sizes (Bilad et al. 2011b, Nasreen et al. 2013). In the present work nanofibre membranes with microfiltration pores are therefore used for experiments in water treatment. Electrospun nanofibres may further be optimised through functionalisation of the fibres by spinning blends of specific polymers, adding functional agents to the spinning solution, coaxial spinning of two polymer solutions or coating of the fibres (Botes and Cloete 2010). Nanofibres have the possibility to add functionality with a greater impact than conventional fibres due to their higher surface area. The small dimensions of the nanofibres lead to very high specific surface areas. Because of this, the fibre properties may be greatly influenced by surface properties. For these reasons it is interesting to assess nanofibre membranes for water filtration and compare the enhanced functionalities to available filtration techniques.
4
1.2 Objectives
This PhD thesis deals with the implementation of electrospun nanofibre membranes in water filtration. A combination of excellent structural properties such as high porosity, high surface area and the possibility to add functionality to the fibres, are assumed to make the electrospun nanofibre membrane highly efficient for water filtration. During the electrospinning process it is crucial to work under steady state conditions to guarantee reproducible nanofibre membranes. As such this thesis bridges between developments in electrospinning technique for the production of non-woven nanofibre membranes and the application of these membranes in water filtration. The main objectives of this thesis are to:
(i) produce homogenous and reproducible membranes that keep their performance as a strong, high porosity water filter after functionalisation treatments or after a period of storage or use.
(ii) apply polyamide nanofibres in water filtration experiments which will give important feedback in order to optimise their production as water filtration membranes.
(iii) transfer of the knowledge build up in these first application tests to custom made membrane filtration set-ups.
(iv) perform studies on the possibilities towards functionalisation of the fibres
in water treatment circumstances. To optimise the functionalities of the nanofibres, different functionalisation methods were tested.

5
1.3 Outline
The outline of this thesis and the relation between the different chapters is presented in Figure 1.3 and is discussed below.
Figure 1.3: Outline of this thesis.
Chapter 2 reviews literature on functionalised nanofibre membranes including a brief description regarding membrane bioreactors and fouling, electrospinning of nanofibres and diverse applications of functionalised membranes. The experimental part of this work including the preparation of samples, filtration and disinfection experiments, the photocatalytic set-up and main characterisation tests is described in chapter 3. First a feasibility study is done towards the applicability of nanofibres in water filtration in chapter 4 including MBR, disinfection and stand-alone applications. The results were promising but revealed some operational issues with membrane rupture and fouling, when first used in an MBR. The electrospinning process was
Conclusions & perspectives (chapter 10)
Structure changes and filtration properties
(chapter 9)
Nanofibres functionalised with (n)TiO2 tested for organic matter removal
(chapters 7 and 8)
Nanofibres functionalised with biocides, tested for disinfection
(chapter 6)
Background & Literature review (chapters 1 and 2)
Material and methods (chapter 3)
Feasibility study on application of nanofibre membranes in water filtration
(chapter 4)
Nanofibre membranes used in different MBR set-ups
(chapter 5)

6
hereafter optimised and the application of nanofibre membranes in MBR was more deeply investigated in chapter 5. Nanofibre membranes were applied in different MBR set-ups, including both the semi-dead-end MBR and cross-flow MBR. Functionalisation of the fibres turned out to be possible and effective so functionalisation of nanofibres was used to further improve their already excellent properties in the chapters 6, 7 and 8. Functionalisation could be done towards better disinfection or added surface functionality. Chapter 6 compares the use of different functionalised nanofibre membranes for their disinfection abilities. Filtration experiments and contact tests were performed on different samples that were inline or post-functionalised with different biocides and silver (Ag) nanoparticles. Since membrane fouling occurred in chapter 4 and 5 and disinfection experiments in chapter 6 revealed the possibility to functionalise the nanofibre membranes, further tests were conducted on functionalisation with TiO2 nanoparticles which could act as an oxidising agent, thereby providing anti-fouling abilities. In the time-frame of this PhD research it was not possible to test the anti-fouling in real filtration cases, but preliminary tests were done in chapter 7 on removal of methylene blue with TiO2 nanoparticles (nTiO2) functionalised nanofibre membranes. Methylene blue was used as indicator for degradation of organic matter. The experiments were further deepened on removal of humic acids and bacteria in chapter 8. The results of these chapters showed the ability of the nTiO2 functionalised membranes for organic matter removal which could be interesting property as anti-fouling membrane or for use in water treatment techniques (for example removal of micropollutants by nTiO2 functionalised nanofibres). During the different experiments, some problems on the membrane stability were detected after which a study was performed on the behaviour of nanofibre membranes in different environmental conditions in chapter 9. Also a heat-treatment was tested to optimise the use of nanofibre membranes for water treatment.

2 Literature review
This chapter will introduce membrane filtration, present nanofibres and focus on their production with added functionality. Typical functional agents could be biocides or metal nanoparticles that act against bacteria or break down organic contaminants due to oxidative reactions.
8
2.1 Introduction
Membrane filtration can be used for a wide range of applications. It is competitive to conventional techniques such as adsorption, ion exchangers and sand filters due to their relatively high efficiency and low energy consumption (Lenntech 2014). Nanofibre membranes possess high surface area to volume ratio, high interconnected porosity (Agarwal et al. 2013, Bilad et al. 2011b) and tuneable pore sizes. Electrospun nanofibres are easy to produce at a low cost (Fatarella et al. 2009). Electrospinning also enables modification of membrane surface functionality through polymer chemistry (Agarwal et al. 2013) and as such became a widespread research topic last decades (Ahn et al. 2006, Aliabadi et al. 2013, Bhardwaj and Kundu 2010, Botes and Cloete 2010, Kriegel et al. 2008, Wang et al. 2013). This literature review aims to summarise this research.
2.2 Membrane filtration
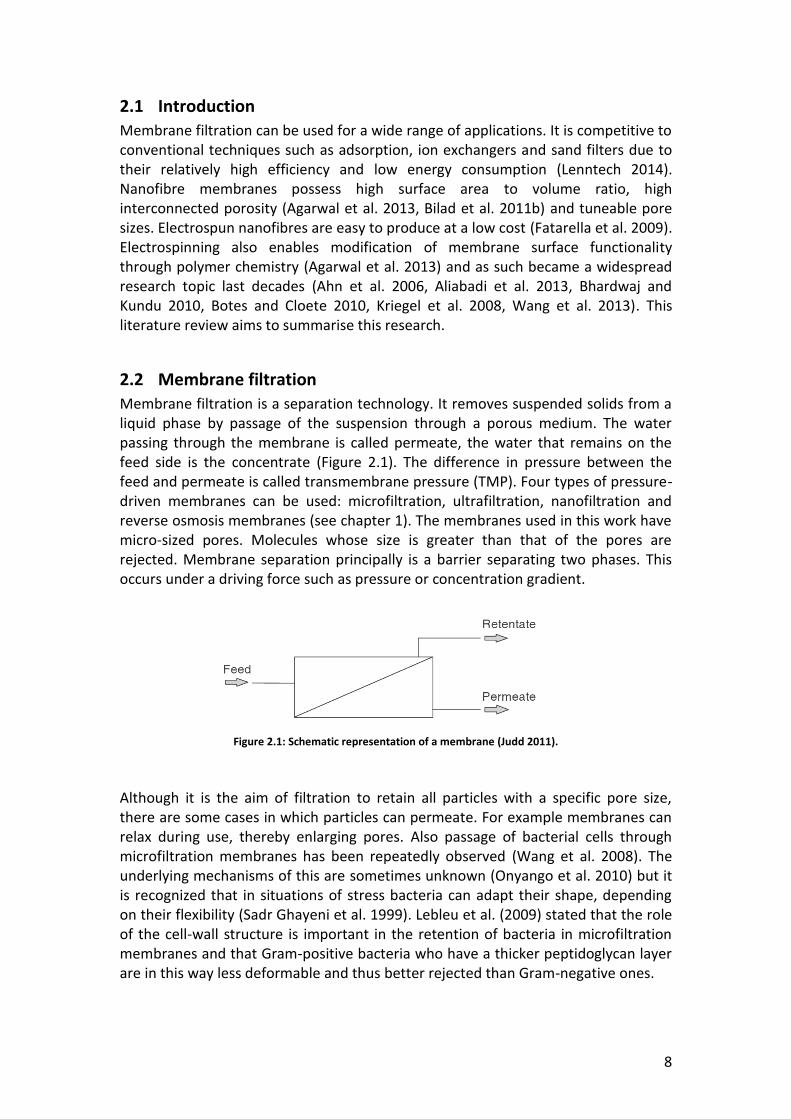
Membrane filtration is a separation technology. It removes suspended solids from a liquid phase by passage of the suspension through a porous medium. The water passing through the membrane is called permeate, the water that remains on the feed side is the concentrate (Figure 2.1). The difference in pressure between the feed and permeate is called transmembrane pressure (TMP). Four types of pressure-driven membranes can be used: microfiltration, ultrafiltration, nanofiltration and reverse osmosis membranes (see chapter 1). The membranes used in this work have micro-sized pores. Molecules whose size is greater than that of the pores are rejected. Membrane separation principally is a barrier separating two phases. This occurs under a driving force such as pressure or concentration gradient.
Figure 2.1: Schematic representation of a membrane (Judd 2011).
Although it is the aim of filtration to retain all particles with a specific pore size, there are some cases in which particles can permeate. For example membranes can relax during use, thereby enlarging pores. Also passage of bacterial cells through microfiltration membranes has been repeatedly observed (Wang et al. 2008). The underlying mechanisms of this are sometimes unknown (Onyango et al. 2010) but it is recognized that in situations of stress bacteria can adapt their shape, depending on their flexibility (Sadr Ghayeni et al. 1999). Lebleu et al. (2009) stated that the role of the cell-wall structure is important in the retention of bacteria in microfiltration membranes and that Gram-positive bacteria who have a thicker peptidoglycan layer are in this way less deformable and thus better rejected than Gram-negative ones.

9
2.2.1 Membrane properties
Important characteristics for membranes are their pore size, tensile strength, clean water flux, membrane surface and morphology. Pore size defines the selection of substances that will be transported through the membrane thereby determining the membrane’s possible applications and was already described in chapter 1. Flux (l/(m².h)) is the amount of solvent per square meter and per unit of time that passes through the membrane. This is among other things dependent of the transmembrane pressure. The clean water permeability (CWP, l/(m².h.bar)) represents the maximum achievable flux per pressure, through the membrane and is determined by measuring the flux of demineralised water at different TMP (Mulder 1996). A hydrophilic membrane exhibits an affinity for water and has a high surface tension value. Hydrophilic membranes are characterised by the presence of active groups that have the ability to form "hydrogen-bonds" with water. Hydrophobic membranes have affinity for other components in addition to water molecules, with an increased risk of fouling as a result (Madaeni et al. 1999). Hydrophilicity is measured by the contact angle that originates when a droplet of water is placed against a membrane surface. The angle between the surface and the water is measured. Hydrophobic surfaces have a high contact angle, whereas hydrophilic surfaces have a low contact angle. This is displayed in Figure 2.2. If the water contact angle is smaller than 90°, the surface is called hydrophilic. For a contact angle larger than 90°, the surface is considered hydrophobic.
Figure 2.2: Difference between hydrophilic (a) and hydrophobic (b) surfaces (Mallevialle et al. 1996).
The morphology of a membrane determines the separation mechanism. Isotropic (also termed symmetric) membranes have one single layer with a thickness of 10 – 200 µm and are presented in Figure 2.3. Anisotropic (also termed asymmetric) membranes consist of different layers with different structure and permeability. A typical anisotropic membrane has an extremely thin yet dense surface layer on a thicker and very porous support. The thin surface layer determines its separation characteristics. The porous structure functions as mechanical support. As a result there is the high selectivity of the dense membrane in combination with the high permeability of a porous membrane (Baker 2012, Mulder 1996). Typical anisotropic membranes are schematically demonstrated in Figure 2.3. They can be formed in one single operation or separately. When the layers are made of different materials, it is termed a composite membrane. Intersections of symmetric and anisotropic hollow fibre membranes are pictured in Figure 2.3.

10
Figure 2.3: Schematic representation of different membrane morphologies: isotropic (a), anisotropic (b) and a
composite anisotropic membrane (c) (Baker 2012).
2.2.2 Membrane filtration modules and configurations
Different types of equipment used in membrane filtration will be discussed as well as different filtration configurations. The same basic membrane modules can be used for all filtration processes although specific types of module tend to be preferred for different types of filtration.
2.2.2.1 Filtration configurations
Two main flow configurations of membrane processes are frequently used in industry (Mota et al. 2002): cross-flow and dead-end filtration (Figure 2.4). In a membrane cell with dead-end filtration, the feed is perpendicularly filtered through the membrane. The cake thickness gradually increases to a certain level determined by drop in pressure or flow velocity. In cross-flow filtration, the main stream of the suspension is parallel to the filter medium. Turbulence generated during cross-flow filtration causes a thinner deposit layer. Cake layer resistance, which affects the filtration performance (Mendret et al. 2009) is different between cross-flow and dead-end filtration cells when filtering identical particles (Chellam and Wiesner 1997, Mota et al. 2002). Among cake layers thickness, difference in cake resistance is further influenced by the shape of the filtered particles, their size and cake compressibility (Mota et al. 2002).
Figure 2.4: Dead-end filtration (left) and cross-flow filtration (right) (Crittenden et al. 2012b).
In membrane bioreactor (MBR) configurations, the solute of the mixed liquor can flow either inside-out (cross-flow configuration) or outside-in (dead-end submerged configuration). These two concepts are displayed schematically in Figure 2.5. The differential pressure over the membrane forces the permeate through the membrane (inside-out). In the outside-in configuration, a slight vacuum is applied by a permeate pump which induces a liquid flow through the membrane wall.
A B C

11
Figure 2.5: Membrane configurations: inside-out (left), outside-in (right) (van Haandel and Van Der Lubbe 2007).
2.2.2.2 Membrane modules
Commercially available membrane modules include spiral wound, hollow fibre, tubular and flat-sheet modules. Hollow fibre modules are used commonly due to their high membrane area to volume ratio (Schwinge et al. 2004). Mitsubishi Rayon, Origin Water, Memstar, GE, Siemens, Litree and Origin water, deliver MBR systems using hollow fibre modules, while Kubota, SINAP and Toray uses flat sheet modules (Yang et al. 2006). A hollow fibre membrane module consists of numerous long porous filaments packed inside a cartridge. Each filament is very narrow in diameter and very flexible. Two such filaments are displayed in Figure 2.6. Broken hollow fibres however, cannot be replaced. Most commercially available hollow fibre membranes run at outside-in mode (Mulder 1996) and their design allows for backflushing (Seneviratne 2006). Because of its large active area combined with a small footprint (600-1200 m²/m³) (Seneviratne 2006), hollow fibre modules have great potential in commercial applications (Camacho et al. 2013).
Figure 2.6 Hollow fibre membrane. On the left there is a symmetric membrane, on the right is an asymmetric
membrane (Seneviratne 2006).
In a spiral wound module, membrane sheets with spacers in between are glued together, which is displayed in Figure 2.7. The feed spacers enhance mass transfer near the membrane. The membrane layers, feed spacer and permeate collector are rolled around a hollow, perforated centre tube that collects the permeate water. Feed solutions enter one end of the element, flowing under pressure through the membrane into permeate channels, spiral to the central core, and exit as permeate. Usually three or more modules are connected in series in a spiral wound module

12
(Schwinge et al. 2004). This membrane configuration offers high membrane-packing area (300-1000 m²/m³) (Seneviratne 2006). Spiral wound modules are not commonly used in MBR set-ups (Judd 2011) but have their application in reverse osmosis (RO) and nanofiltration (NF) systems. Spiral wound membranes are sensitive to fouling and therefore sufficient pre-treatment is a prerequisite.
Figure 2.7: Spiral wound module (Seneviratne 2006).
A tubular module consists of 2 to 18 tubes ranging from 0.5 to 5 cm in diameter. The outer part of the tubes is a membrane. The feed stream goes across the length of the membrane tube and is filtered out through the porous tubes. The concentrate is collected at the opposite end of the membrane tube. The particles in the feed can be 10% of the tubular diameter (Figure 2.8). A tubular module can operate at higher pressures, is less susceptible to fouling and is more robust than spiral wound. The main drawback of this system is the small membrane area to volume ratio (>100 m²/m³) (Seneviratne 2006) and the high energy consumption due to higher pressure differences caused by the large inner diameter (Munir 1998).
Figure 2.8: Top and side view of a tubular membrane module (Foley 2013).
A typical flat sheet membrane is displayed in Figure 2.9. Feed spacers provide the channel for the feed flow and are typically 0.3-1 mm in height (Foley 2013). Multiple layers of flat sheet membranes can be used to increase the effective area (100-600 m²/m³) (Seneviratne 2006). The individual membrane modules can be removed individually to replace damaged membranes as shown in Figure 2.9. Flat sheet systems however are more profound to fouling compared to flat sheet systems (Munir 1998). Nanofibre membranes are non-woven structures and always collected

13
on a flat surface. This means that they could be used in a flat-sheet system or in a spiral wound module. In this work they are used in flat sheet modules.
Figure 2.9: Flat sheet membrane. Left: schematic diagram (Foley 2013), right: picture of multiple flat sheet
membranes (Gallucci et al. 2011)
2.2.3 Applications for microfiltration membranes
Membrane filtration can be applied in different areas. The market trend of membrane-based water treatment in 2011-2016 is shown in Table 2.1. Since this research is on microfiltration membranes, only this type of application will be discussed in more detail. The water market for microfiltration has many applications such as RO pre-treatment, membrane bioreactors, drinking water and wastewater reuse (Pearce 2007a).
Table 2.1: Forecast on membrane market for 2011-2016 (Zhang et al. 2012) (in billions US dollar).
Market sectors using membranes 2011 2016
RO pre-treatment 0.05 0.13 Membrane bioreactors 0.53 0.90 Drinking water 0.17 0.33 Tertiary wastewater treatment 0.16 0.39 Industrial applications 0.16 0.30
Subtotal MF/UF membranes 1.06 2.05 RO/NF industrial applications 0.33 0.51 RO/NF desalination 0.42 0.67
Subtotal NF/RO membranes 0.75 1.18
TOTAL MF/UF/NF/RO membranes 1.81 3.25

14
2.2.3.1 Bacterial removal by microfiltration
The microfiltration market for drinking water originated from the removal of the protozoa Cryptosporidium and Giardia lamblia (Pires 2013). Both Cryptosporidium and Giardia Lamblia are very contagious and should not appear in water after treatment. Protozoa are the largest in water living micro-organisms (3-6 µm) (Ray et al. 2003) and could be removed by microfiltration. Cryptosporidium and Giardia Lamblia have an average concentration of 1-10 per 100 ml in surface waters (Ray et al. 2003). Drinking water should not contain more than 1 coliform bacteria per 100 ml. These bacteria can be removed by microfiltration (Henze et al. 2008). The concentration of coliform bacteria is approximately 300 per 100 ml in surface waters (Ray et al. 2003). The average size of bacterial cells is 0.5-1.0 µm diameter and typically around 2.0-5.0 µm in length (Metcalf and Eddy 2003, Srivastava 2003), while viruses are much smaller. Entero viruses for example have dimensions of 0.032 µm (Parija 2009). For virus removal, microfiltration is not appropriate and ultra-filtration is recommended. Ultrafiltration is therefore likely to become an increasingly important application to reduce disinfection by chlorine.
2.2.3.2 Microfiltration as RO pre-treatment
Appropriate pre-treatment is the most critical factor for successful performance of RO systems since it is greatly affected by membrane fouling (Brehant et al. 2002). Treatment with microfiltration reduces COD (chemical oxygen demand) and BOD (biological oxygen demand) thereby producing good quality water suitable as feed for RO systems (Ebrahim et al. 1997, Teng et al. 2003). Microfiltration can be required as RO pre-treatment to avoid excessive (bio-)fouling of RO membranes (Ebrahim et al. 1997). Some bacteria may adhere to surfaces within the water system, excrete a matrix of polysaccharides and proteins, and form a biofilm on surfaces of industrial water systems which can be a source for corrosion and are a source for bio-fouling on membrane surfaces (Markowska-Szczupak et al. 2011). Pearce (2007b) revealed that the additional cost of microfiltration is paid by the savings on chemicals and RO-membranes.
2.2.3.3 Microfiltration membranes in membrane bioreactors
Another application is the use of membranes in a MBR (Figure 2.10) to separate the activated sludge from the treated water. Activated sludge reactors treat wastewaters (municipal and industrial) by use of aerated bacterial flocs. An activated sludge process includes primary treatment (primary sedimentation), secondary treatment (aeration and secondary clarification) and tertiary treatment. During the secondary treatment, microorganisms use wastewater as a substrate for growth and remove dissolved organic matter. The principle is based on the microbiological degradation of organic compounds and removal of nitrogen: ammonium is converted to nitrate during the aeration phase (nitrification) and the formed nitrate is reduced to nitrogen gas (denitrification) at anoxic phase (Henze et al. 2008). This is followed by sedimentation, in which the biological flocs are separated from the clarified secondary effluent. The treatment processes can be either suspended

15
bacterial flocs (activated sludge) or attached growth (trickling filters). The most commonly used process for biological treatment of municipal and industrial wastewaters is the activated sludge process. Table 2.2 summarizes a comparison of the MBR systems manufacturers.
Table 2.2: Comparison of different MBR systems (adapted to Yang et al. 2006).
Zenon Kubota Mitsubishi-Rayon
Membrane type Hollow fibre Flat sheet Hollow fibre
Configuration Vertical immersion Vertical immersion Horizontal immersion
Pore size (µm) 0.04 0.4 0.1/0.4
Material Proprietary Polyethylene Polyethylene
Module size (m2) 31.6 0.8 105
Cleaning Backpulse and relax Relax Relax
Cleaning freq. (min/min) 0.5/15 1.0/60 2.0/12
Recovery method Chemical soak Chlorine Backwash Chlorine Backwash
Recovery frequency > 3 Months > 6 Months > 3 Months
Recovery location Drained cell or in situ In situ In situ
In this work, MBR systems with nanofibre membranes will be tested chapters 4 and 5. A membrane bioreactor is based on biological degradation and subsequent membrane separation of the biological sludge by microfiltration (Crittenden et al. 2012b). This membrane separation replaces the clarifiers used in conventional activated sludge systems that reach particle separation by gravity (see Figure 2.10). Separation via membrane filtration provides a lower needed surface area, process control and disinfection of the influent without the need of chemicals. In MBR systems, microfiltration is used for this biomass retention. It also enables operation at higher sludge concentrations (up to 15 g/l instead of 6 g/l with conventional systems) (Judd 2011). However MBR technology is usually related to a higher total cost due to the high energy and investment cost. In addition, there are fouling problems. A lot of work on fouling control and membrane development has already been done and is still going on. The membrane module can be either placed in an external side-stream circuit or submerged into the bioreactor as shown in Figure 2.11. The energy demand for a submerged system is twice as high as for the side-stream system (Judd 2011). In this work, both submerged and side-stream modules will be tested in chapter 5.

16
Figure 2.10: Conventional activated sludge process (above) versus MBR technology (below) (van Haandel and
Van Der Lubbe 2007).
Figure 2.11: Side-stream (left) versus submerged (right) (Judd 2011).

17
2.2.4 Membrane fouling and concentration polarization
During membrane filtration two main problems occur: concentration polarization and membrane fouling, which both have a negative effect on the flux.
2.2.4.1 Concentration polarisation
Concentration polarisation originates from the accumulation of components that are rejected by the membrane. The convective flow of these components to the membrane surface is larger than the flow to the bulk solution. This results in an accumulation of the rejected component at the membrane surface (Lee et al. 1984, Matthiasson and Sivik 1980) which increases resistance to filtration flow and thus reduces the permeate flux (Figure 2.12). Concentration polarisation ends spontaneously after the operation. It is a reversible process by low forces between the macromolecules in the gel (Matthiasson and Sivik 1980). The effect of concentration polarisation is severe in microfiltration and ultrafiltration because of the high fluxes and the low diffusion coefficients of small particles, colloids and emulsions (Noble and Stern 1995). Increased flow rates of the solutions and spacers are used to reduce concentration polarisation by promoting turbulence. This causes better mixing of the solution and reduces the thickness of the diffusion boundary layer (Baker 2012).
Figure 2.12 Concentration polarization (Judd 2011)
2.2.4.2 Membrane fouling
Fouling is defined as the result of interactions between particles in the influent and the membrane or previously adsorbed particles (Munir 1998) and is illustrated in Figure 2.13. Fouling changes the effective pore size distribution and thus flux. The result is a typical variation of the flux with time. This is initiated by a rapid decrease and followed by a steady flux decline. External fouling is formed by a cake layer that originates by the accumulation of solids on the membrane or a gel layer that can be formed due to the precipitation of colloids and inorganic salts (Le-Clech et al. 2006b). Internal fouling is caused by the adsorption and deposition of solutes and fine particles by complete pore blocking of the pores or particle deposition within pores.

18
Figure 2.13: Schematic representation of internal (left) and external (right) fouling
There are different types of fouling that can occur in a membrane filtration system: fouling due to colloids, scaling, natural organic matter (NOM) and bio-fouling (Zhang et al. 2012). Scaling is mainly due to inorganic salts that are present in feed and process water. Fouling by salts and metal compounds generally occurs by precipitation within the porous structure of the membrane. Some examples are calcium sulphate (CaSO4), calcium carbonate (CaCO3) and calcium phosphate (CaPO4) and metal oxides. Scaling is a major concern for RO and NF since these membranes reject inorganic species. For MF inorganic fouling is much less profound but can exist due to interactions between ions and other fouling materials via chemical bonding. Some pre-treatment processes such as coagulation may introduce metal hydroxides. Or for example backwash at high pH with water initially containing Ca2+ and HCO3
- can result in CaCO3 precipitation on the permeate side of the membrane during the cleaning (Li et al. 2011). There is a wide range of natural organic matter (NOM) that can cause significant fouling of membranes. Humic and fulvic acids are naturally occurring organic compounds originating from plant and animal materials in surface waters. They are highly surface active, a property which facilitates their fouling characteristics due to adsorption. The majority of dissolved NOM pass through the microfiltration membrane because of their small sizes. However, several studies suggest that NOM have a significant impact on fouling of MF membranes (Carroll et al. 2000, Fan et al. 2001, Yamamura et al. 2007). The main mechanisms for NOM fouling in microfiltration, are the interactions between NOM and the membrane surface. Therefore, the molecules smaller than the pore sizes of the membrane, could lead to membrane fouling due to adsorption within the pores. Fouling also involves living organisms (bio-fouling) causing biofilm formation and bacterial adhesion on the membrane surface. Once bound to the membrane surface, the bacteria can grow and multiply using the nutrients present in the process stream. Part of the organic material are biopolymers originating from either attachment on microorganisms (extracellular polymeric substances, EPS) or are present in the mixed liquor (soluble microbial products, SMP). EPS and SMP comprise among other things polysaccharides and proteins (Le-Clech et al. 2006b). Initially mainly passive adsorption, EPS and pore blockage cause an increase in fouling. Colloids and organic material precipitate on the membrane while EPS adsorb on the membrane surface and is responsible for pore blocking. The intensity of fouling depends on pore distribution and the surface structure (hydrophobic/ hydrophilic character of the membrane). These mechanisms are all self-accelerating

19
(Le-Clech et al. 2006b) and it is probably that these mechanisms act simultaneously. For example due to limited oxygen transfer to the bacteria in the biofilm these bacteria die freeing extra EPS that makes the biofilm stronger and causes better adhesion to the membrane.
2.2.4.3 Fouling control
A lot of research has already been done on methods to reduce fouling (Chen et al. 2007, Le-Clech et al. 2006a, Wu et al. 2008a, b) suggesting adaptations in membrane material, feed or biomass modifications, operating conditions (hydrodynamic changes) and membrane cleaning (Howell et al. 2004). In this work only a few of these fouling control strategies were tested on the nanofibre membranes and will be discussed in chapters 4 and 5. Field et al. (1995) suggested a constant flux at a constant TMP. They defined this critical flux as the flux below which the decline of flux or the increase of TMP does not occur while above this critical flux, fouling is observed. Le-Clech et al. (2006b) wrote that critical flux determination is interesting to assess fouling affinity for given operating condition, but that it cannot be used for long-term estimates. Also in process-operation of MBR’s the addition of coagulant material was suggested (Hwang et al. 2007, Yoon et al. 2005). Coagulation with so-called “membrane performance enhancers” (MPE) reduces membrane fouling significantly (Wozniak 2010) by adding modified biopolymers with a net cationic charge that react with the biomass. Polysaccharides and proteins secreted by bacteria (extracellular polymeric substance or EPS) are major causes of membrane fouling. By the addition of a coagulant, a significant decrease is observed in concentration of EPS because the EPS is caught in microbial clusters that are formed by coagulation due to the membrane performance enhancer. Larger flocs provide a more porous cake fouling (Hwang et al. 2007). Nevertheless this solution needs dosage of a chemical and thus increases process complexity while addition of chemicals in water treatment should be avoided. Commonly used coagulants include ferric chloride and aluminum sulfate. In this work use was made of MPE50, a cationic polymer produced by Nalco (Belgium), as mentioned in chapter 5. The surface of the membrane is known to determine the possibility of deposition and attachment of foulants. Surface modification could minimize membrane fouling (Le-Clech et al. 2006b). In this study some research was done on the addition of nTiO2 (see chapter 7 and 8) which shows anti-fouling effects (Bae and Tak 2005, Kim et al. 2003). Since electrospun nanofibres have the potential to easily add some functionality to the membrane, it is interesting to explore this opportunity in view of anti-fouling membranes.
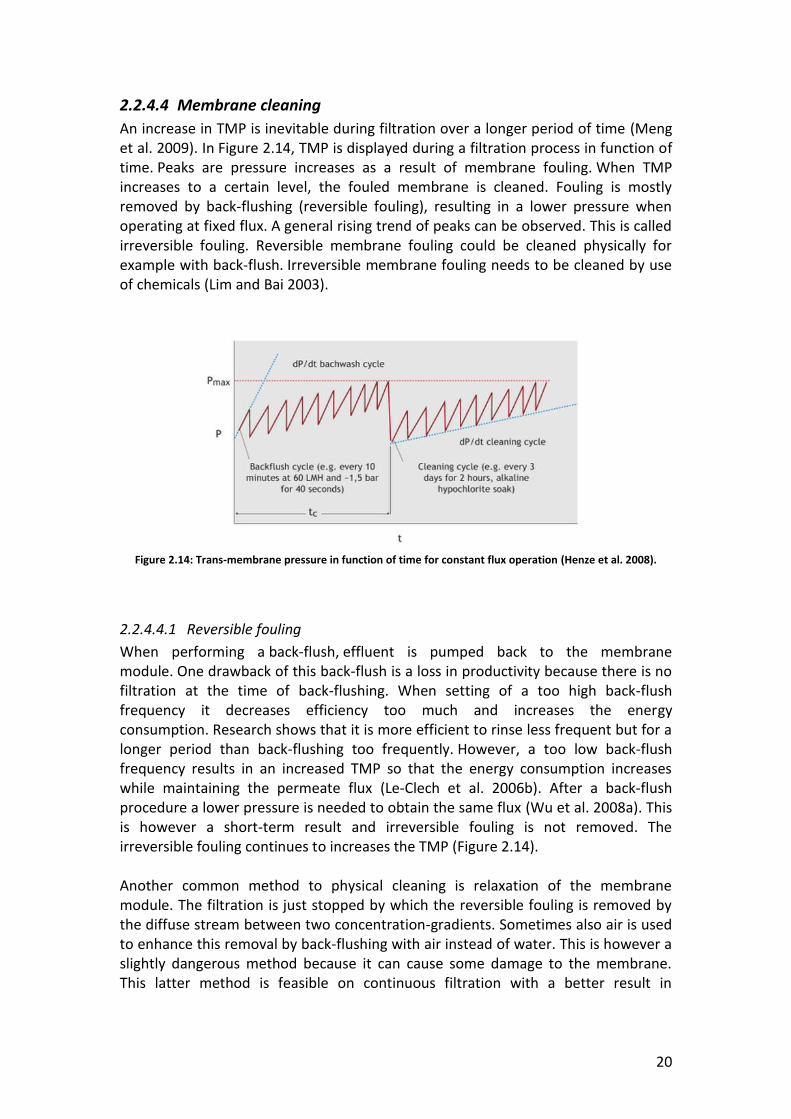
20
2.2.4.4 Membrane cleaning
An increase in TMP is inevitable during filtration over a longer period of time (Meng et al. 2009). In Figure 2.14, TMP is displayed during a filtration process in function of time. Peaks are pressure increases as a result of membrane fouling. When TMP increases to a certain level, the fouled membrane is cleaned. Fouling is mostly removed by back-flushing (reversible fouling), resulting in a lower pressure when operating at fixed flux. A general rising trend of peaks can be observed. This is called irreversible fouling. Reversible membrane fouling could be cleaned physically for example with back-flush. Irreversible membrane fouling needs to be cleaned by use of chemicals (Lim and Bai 2003).
Figure 2.14: Trans-membrane pressure in function of time for constant flux operation (Henze et al. 2008).
2.2.4.4.1 Reversible fouling
When performing a back-flush, effluent is pumped back to the membrane module. One drawback of this back-flush is a loss in productivity because there is no filtration at the time of back-flushing. When setting of a too high back-flush frequency it decreases efficiency too much and increases the energy consumption. Research shows that it is more efficient to rinse less frequent but for a longer period than back-flushing too frequently. However, a too low back-flush frequency results in an increased TMP so that the energy consumption increases while maintaining the permeate flux (Le-Clech et al. 2006b). After a back-flush procedure a lower pressure is needed to obtain the same flux (Wu et al. 2008a). This is however a short-term result and irreversible fouling is not removed. The irreversible fouling continues to increases the TMP (Figure 2.14). Another common method to physical cleaning is relaxation of the membrane module. The filtration is just stopped by which the reversible fouling is removed by the diffuse stream between two concentration-gradients. Sometimes also air is used to enhance this removal by back-flushing with air instead of water. This is however a slightly dangerous method because it can cause some damage to the membrane. This latter method is feasible on continuous filtration with a better result in

21
filtration-time in between chemical cleanings, but does not seem economical for large MBR plants (Smith et al. 2005). Conventional submerged membrane bioreactors (MBRs) often make use of coarse bubble aeration. This technique has a multiple role: it gives extra oxygen while the biomass stays in suspension and it also produces a turbulent flow (estimated around 0.2–0.4 m/s) on the membrane surface, limiting fouling deposition (Le-Clech et al. 2006b). It is usually applied for submerged flat-sheet MBRs and is positioned at the bottom of the membrane module. Unfortunately, it is a very energy consuming method, and still often resulting in a rapid decrease of membrane permeability (Bilad et al. 2012). It was reported that ultra-sonication during membrane filtration is very effective in removing foulants from the membrane. Ultrasonic cleaning is effective in reducing concentration polarization and removing cake layers on the membrane (Kobayashi et al. 2003) but it is not efficient in removing gel layer and pore blocking. This needs to be combined with other cleaning techniques for example back-flush (Ng et al. 2012) and chemical cleaning (Lim and Bai 2003). Further studies are needed in order to ensure the membranes free of damage during the long-term operation in MBRs. Reports show that sonication during 10 minutes gave better results than longer or shorter sonication periods. A drawback however is that due to breaking of the cake layer in smaller pieces, pores could get blocked by these pieces (Lim and Bai 2003).
2.2.4.4.2 Irreversible fouling
Physical cleaning methods will be less efficient when the membrane is in operation for a longer time. Certain intervals for a chemical cleaning of the membrane is necessary. Al-Amoudi and Lovitt (2007) mention that the success of a chemical cleaning is dependent on the type of pollution, chemicals, temperature, pH, concentration of the chemicals, contact time, and type of membrane. Chemical cleaning can be applied by a back-flush with chemicals (daily for external modules), maintaining the membrane by chemical cleaning with higher concentrations (weekly) and intensive cleaning (once or twice a year). Diverse membrane suppliers each have their own cleaning methods (see Table 2.3). Sodium hypochlorite (NaOCl), citric acid (C6H8O7) or oxalic acid (C2H2O4) are the most commonly used detergents for organic and inorganic fouling. Prolonged exposure to hypochlorite cleaners has been revealed to be the primary cause of chemical degradation in membrane polymers. The degradation rate depends on total chlorine dosage (concentration × time) and pH. The membrane damages are due to reactions between the cleaners and some specific functional groups, causing breakdown of membrane polymers (such as PVDF and PS) and attachment of new end groups (Shi et al. 2014). Irrecoverable or long-term irreversible fouling is fouling that cannot be removed by any physical or chemical cleaning. This type of fouling builds up over a number of years and determines the lifetime of a membrane (Henze et al. 2008).

22
Table 2.3: Cleaning protocol used by different suppliers of MBR (Le-Clech et al. 2006b). CIL = Cleaning in line: chemicals flow through the membrane under gravity. CIP = Cleaning in place: module is removed and soaked in
solution
Supplier Type Chemicals Concentration (%) Protocol
Mitsubishi CIL NaOCl 0.3 Back-flush (2 h) + soaking (2 h) Citric acid 0.2 Zenon CIP NaOCl 0.2 Back-flush and recirculation Citric acid 0.2 – 0.3
Tyco CIP NaOCl 0.01 Recirculation and in-tank air manifolds
Citric acid 0.2 Kubota CIL NaOCl 0.5 Back-flush and soaking (2 h) Oxalic acid 1
2.3 Electrospun nanofibre membranes
Within textiles, the development of nanofibres through electrospinning is an important breakthrough with many possible applications. Nanofibres have, by definition, a diameter which is less than 500 nm. Research and development of nanofibres has gained much interest in recent years due to the heightened awareness of its potential in medical and engineering applications (see chapter 1). One of the potential applications of the nanofibres is water filtration.
2.3.1 Introduction in nanofibres
Depending on the dimensions of the fibre diameter, fibres are classified in conventional textile fibres (10 - 50 μm), microfibres (3 - 10 μm) and nanofibres (< 500 nm), as schematically presented in Figure 2.15. By reducing the diameter to nano-scale, several specific and unique characteristics appear. Their unique properties concerning water filtration will be discussed in next section.
Figure 2.15: Classification of textile fibres based on the fibre diameter.
Nanofibre: < 500 nm Microfibre: 3-10 µm Conventional fibre: 10-50 µm

23
2.3.2 Nanofibres for water filtration
Nanofibres have a very large specific surface to volume ratio compared to other non-woven membrane. For example for a fibre with diameter of 50 nm, the specific surface area is up to 100 m2/g (De Vrieze et al. 2007, Huang et al. 2003). And they have a very high porosity up to 90% (Bazargan et al. 2011, Fang et al. 2008). The membranes have a low density and an interconnected open pore structure, making this non-woven membrane appropriate for a wide variety of filtration applications (Barhate et al. 2006, Gopal et al. 2006, Huang et al. 2003). Filtration efficiency, which is closely associated with the fibre diameter, is one of the most important concerns for the filter performance. Due to the very small fibre diameter for the nanofibres in comparison to microfibres, the efficiency of the filter increases (as schematically represented in Figure 2.16) in a same surface with identical pore sizes. This is a huge advance for the use of this novel nanofibres to the commercial microfibre counterparts since conventional microfiltration membranes also have lower water fluxes (Judd 2011). This also means that nanofibre membranes are useful to treat large volumes of water. As such a nanofibre membrane could be very well used for example as pre-treatment for process and cooling water or as protection for RO membranes (Bonnélye et al. 2008). Also the possibility of combining a variety of polymers and functional agents through electrospinning leads to development of nanocomposite/hybrid nanofibre membranes with a more optimum filtration efficiency and a broader domain of applications than conventional membranes. Due to the easy functionalisation possibilities, surface modification in view of anti-fouling abilities or adsorption of toxic metals seems very interesting. All these advantages make the nanofibre membranes very attractive for water filtration.
Figure 2.16: The efficiency of a filter increases with a decrease in fibre diameter (Thavasi et al. 2008).
2.3.3 Electrospinning of nanofibres
Recent research tried to prepare polymer nanofibres by a number of processing techniques such as drawing, template synthesis, phase separation, self-assembly, etc. Among the most successful methods for producing nanofibres is the electrospinning process. Various polymers have been successfully electrospun into

24
ultrafine fibres through solvent solution or melts. Electrospinning is a production process for continuous nanofibres in a non-woven form and is a simple, rapid and inexpensive method (De Vrieze et al. 2009, Liang et al. 2007), which is in the beginning phase of industrial scale production (Barhate and Ramakrishna 2007, Botes and Cloete 2010, Zhou et al. 2009). The electrospinning process spins fibres with diameters ranging from 80 to several hundred nanometres. Figure 2.17 shows a schematic electrospinning set-up with one needle. Electrospinning relies on electrostatic forces obtained by applying an electric field between the tip of a nozzle, through which the polymer solution is flowing, and the collector plate by a DC voltage source. This electric field causes the distortion of the polymer solution from a spherical pendent drop to a conical shape, known as the Taylor cone. Once the electrostatic forces overcome the surface tension of the polymer solution at the nozzle, a jet stream is drawn from the tip of the nozzle. On its way to the collector plate, the jet becomes unstable due to interaction of the charges with the external electric field and solvent evaporation, which causes bending of the jet. This causes elongation of the jet and the so produced nanofibres are randomly deposited on the collector plate as a non-woven structure.
Figure 2.17: A single nozzle set-up for electrospinning of nanofibres (Bhardwaj and Kundu 2010).
A scanning electron microscope (SEM) image of a nanofibrous structure is shown in Figure 2.18. A variety of polymers can be spun, each from a specific solution. Polyamide-6 is used in this study, offering high fibre forming ability, good mechanical strength and strong chemical and thermal stabilities at low cost (Pant et al. 2011). Polyamide is suitable for electrospinning under steady state conditions (Figure 2.18) (De Vrieze et al. 2009). Steady state electrospinning is reported as a solution for obtaining a high stability and reproducibility. Electrospinning is in steady state when the amount of polymer that is transported through the needle per time unit equals the amount of polymer that is deposited as nanofibres on the collector per unit time (De Vrieze et al. 2011). When electrospinning is in steady state, frequent electrospinning set-up problems (clogging, droplets and beads as pictured in Figure

25
2.18) are avoided. This allows a long term stability of the electrospinning, as is needed for industrial scaled up processes. Also uniform membranes at large scale are needed for use in water filtration.
Figure 2.18: A typical example of electrospun PA-6 nanofibres (left) and a nanofibre membrane produced in
non-steady state conditions results in beads and drops (circled) (right).
2.3.4 Production parameters influencing the morphology of the fibres
The result of the electrospinning process is influenced by solution, process and ambient parameters.
2.3.4.1 Solution parameters
There is an optimum range for the polymer concentration in which electrospun fibres may be formed (De Vrieze et al. 2007). When a solution has a too low polymer concentration, the polymer breaks into droplets before this fibre is formed on the collector, while a too concentrated solution is not successful due to the too high viscosity which makes it difficult to control its flow rate through the needle (Bhardwaj and Kundu 2010). Electrospinning of polymer solutions with too low conductivity is not possible since there is no charge on the surface of the liquid droplet. In solutions with a very high conductivity there is an electric field along the surface of the liquid droplet whereby the formation of the Taylor cone is stalled. In general, thinner nanofibres are obtained with a higher conductivity (Bhardwaj and Kundu 2010, Pelipenko et al. 2013). Electrospinning in steady state electrospinning conditions is only possible if the right solvent mixture is used for the selected polymer (De Vrieze et al. 2010). Table 2.4 shows a selection of polymers with a possible solvent used to form nanofibres via electrospinning. A more detailed list of possible polymers and their solvent can be found in the review paper of Huang et al. (2003). In this work, there was made use of PA-6. Reproducible electrospining on a multi-nozzle system is possible with PA-6 and it allows varying in membrane thickness.

26
Also, there is no need of highly toxic solvents. Depending on the aimed application, it is possible to enhance some properties of electrospun nanofibre membranes. PVDF and PESU can also be electrospun and possess higher chemical stability. They however need very toxic solvents. To evaluate the possible use of nanofibres in water treatment, it was chosen to work with PA-6. Table 2.4: Polymers and solvents applied for electrospun nanofibres (Botes and Cloete 2010, Westbroek et al.
2008).
Polymer Solvent Concentration
Polyurethane (PU) Dimethyl formamide 10 wt% Polycarboate (PC) Dichloro-methane 15 wt% Polycarboate (PC) Dimethylformamide:tetrahydrofuran (1:1) 20 wt% Polylactic acid (PLA) Dichloromethane 5 wt% Polyethylene oxide (PEO) Isopropyle alcohol and water 10 wt% Polyvinylcarbazole Dichlormethane 7.5 wt% Polystyrene Tetrahydrofuran 15 wt% Polyamide-6 (PA-6) Acetic acid, formic acid (1:1) 16 wt% Cellulose acetate (CA) Acetone, acetic acid 17 wt%
2.3.4.2 Process and ambient parameters
The applied voltage, the flow rate and the distance between the needle point and the collector are the main process parameters (Sill & von Recum 2008). The applied voltage has an influence on the shape of the initial droplet (Kundu & Bhardwaj 2010), which is demonstrated in Figure 2.19. As the applied voltage increases, the volume of the drop decreases until the Taylor cone is formed within the capillary. This results in the jet being formed from within the capillary, which is associated with beads and drops (examples are displayed in Figure 2.18). Megelski et al. (2002) demonstrated that increasing flow rate led to defects in the fibres. The distance between the needle and collector, varies for different polymers. For example this distance can be 10 cm for production of PA-6 nanofibres (De Vrieze et al. 2011) to 25 cm for electrospinning of PES nanofibres (Homaeigohar et al. 2010). Both temperature and relative humidity are influencing the electrospinning process (Fashandi and Karimi 2012). De Vrieze et al. (2009) demonstrated that with increasing temperature the solvent evaporation rate increased and the viscosity of the polymer solution decreased. The average fibre diameter was higher at 19.9°C than at 9.9 and 29.9°C. As the humidity increases, the fibre diameter of CA nanofibres increased, whereas for poly(vinylpyrrolidone) (PVP) it decreased(De Vrieze et al. 2009)(De Vrieze et al. 2009). The evaporation rate of the solvent and the viscosity of the solution are two opposing mechanisms caused by a change in temperature, that have an effect on the mean fibre diameter (De Vrieze et al. 2009).

27
Figure 2.19 Influence of the increased voltage (Sill and von Recum 2008)
2.3.5 Characteristics of electrospun nanofibre membranes
The porosity and pore size of nanofibre membranes are important for applications in filtration. Pore size measurement on nanofibre membranes have been done by a capillary flow porometer (Li et al. 2002) and via bubble point test. Since pore size of nanofibre membranes is determined by the rigidness of the fibres and the tortuous path that the particles need to accomplish it is difficult to be determined visually although it has been done in literature (Prince et al. 2012, Xie and Wang 2006). Eichhorn and Sampson (2005) made a theoretical model and demonstrated that for a given areal density and porosity, the mean pore radius increased with increasing fibre width. Gopal et al. (2006) did some experiments on the nanofibre membrane by separation of 1, 5 and 10 μm polystyrene particles which revealed that they have similar properties to that of conventional microfiltration membranes. The electrospun membranes were successful in rejecting more than 90% of the micro-particles from solution. Also other studies revealed pore sizes in nanofibres generally ranging from sub-micron to several micrometres (Li et al. 2002, Schreuder-Gibson et al. 2002).
2.3.6 Functionalisation of nanofibres
Combining nano-sized materials for the production of functionalized membranes enhances the performance of several properties of a polymer matrix (Viswanathan et al. 2006, Zodrow et al. 2009) or adds immobilized functionality to a filtration process (Huang et al. 2003). In this study, the functionalities will occur within the matrix of the nanofibre material in case the functional agent is added to the spinning solution prior to the electrospin process (Figure 2.20, left). Post-functionalisation will result in the presence of the functional agents on the surface of the nanofibre (Figure 2.20, right). Other examples on fibre functionalisation techniques are: plasma treatment (Saxena et al. 2009), deposition via magnetron sputtering (Wei et al. 2006), coating via sol-gel (Caruso et al. 2001), by spinning blends of specific polymers and coaxial spinning of polymer (Kriegel et al. 2008). Barhate and Ramakrishna (2007) formulated three challenges on surface modification: uniformity, coating without affecting the pore sizes and the possibility for industrial production. Examples of nanofibre functionalisation and the applications, are described in next section.
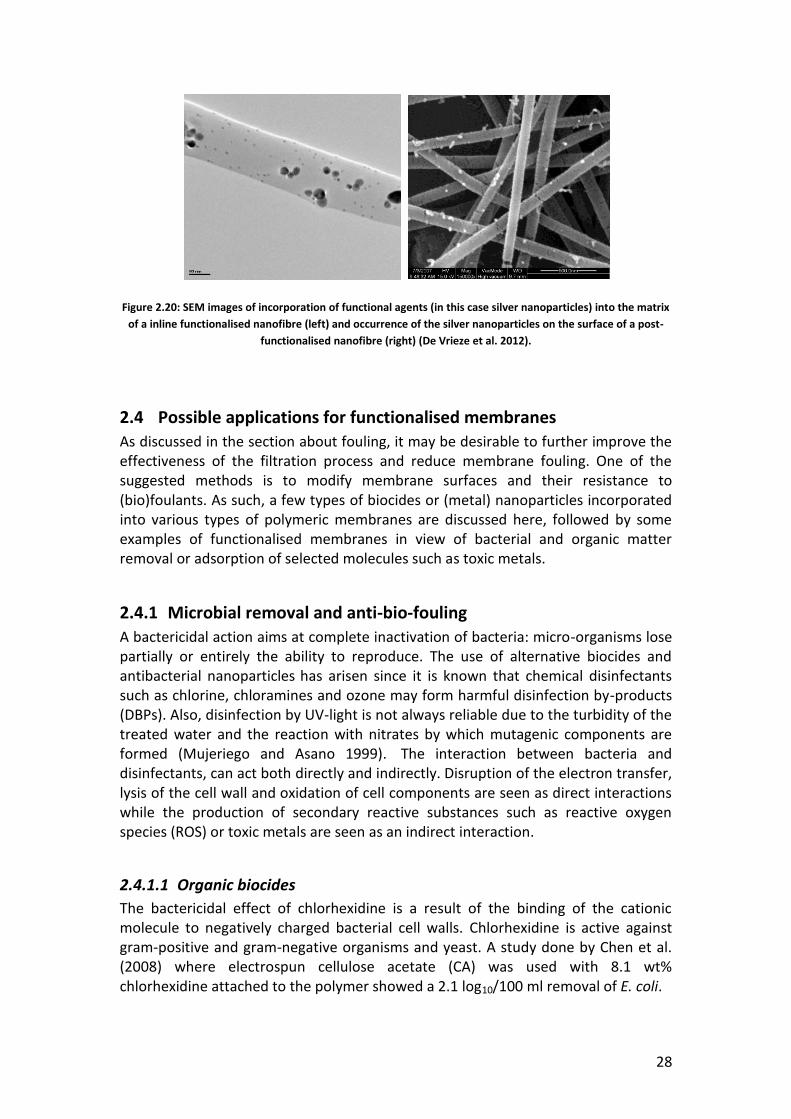
28
Figure 2.20: SEM images of incorporation of functional agents (in this case silver nanoparticles) into the matrix
of a inline functionalised nanofibre (left) and occurrence of the silver nanoparticles on the surface of a post-
functionalised nanofibre (right) (De Vrieze et al. 2012).
2.4 Possible applications for functionalised membranes
As discussed in the section about fouling, it may be desirable to further improve the effectiveness of the filtration process and reduce membrane fouling. One of the suggested methods is to modify membrane surfaces and their resistance to (bio)foulants. As such, a few types of biocides or (metal) nanoparticles incorporated into various types of polymeric membranes are discussed here, followed by some examples of functionalised membranes in view of bacterial and organic matter removal or adsorption of selected molecules such as toxic metals.
2.4.1 Microbial removal and anti-bio-fouling
A bactericidal action aims at complete inactivation of bacteria: micro-organisms lose partially or entirely the ability to reproduce. The use of alternative biocides and antibacterial nanoparticles has arisen since it is known that chemical disinfectants such as chlorine, chloramines and ozone may form harmful disinfection by-products (DBPs). Also, disinfection by UV-light is not always reliable due to the turbidity of the treated water and the reaction with nitrates by which mutagenic components are formed (Mujeriego and Asano 1999). The interaction between bacteria and disinfectants, can act both directly and indirectly. Disruption of the electron transfer, lysis of the cell wall and oxidation of cell components are seen as direct interactions while the production of secondary reactive substances such as reactive oxygen species (ROS) or toxic metals are seen as an indirect interaction.
2.4.1.1 Organic biocides
The bactericidal effect of chlorhexidine is a result of the binding of the cationic molecule to negatively charged bacterial cell walls. Chlorhexidine is active against gram-positive and gram-negative organisms and yeast. A study done by Chen et al. (2008) where electrospun cellulose acetate (CA) was used with 8.1 wt% chlorhexidine attached to the polymer showed a 2.1 log10/100 ml removal of E. coli.

29
The biocides used in this work are displayed in Figure 2.21. Quaternary ammonium compounds (QAC) are organic compounds containing four functional groups which are covalently bound to a central nitrogen atom. QACs are well known membrane-active biocides (Chapman 2003, Feng et al. 2000). Due to the presence of the cationic charge QACs can quickly and strongly react with negatively charged particles (Ferk et al. 2007). WSCP (C10H24Cl2N2O)n is a QAC (Voets et al. 1976) and while it has poor anti-fungal properties, it is effective against both Gram-positive and Gram-negative bacteria (Chen et al. 2008). Bronopol is a diol (C3H6BrNO4) and just like WSCP, bronopol works against both Gram-positive and Gram-negative bacteria. It is a bactericide and fungicide. TCMTB (C9H6N2S3) is mainly a fungicide, but can also be used as a bactericide. DBNPA (C3H2Br2N2O) is a non-oxidizing substance, in particular an amide. It is effective against bacteria, fungi and yeasts and acts rapidly. In addition to biocides, nanomaterials can also be used as anti-bacterial agents. They are excellent adsorbents, catalysts and sensors due to their high reactivity and large reaction surface (Li et al. 2008). There is a large variety of nanomaterials: biological nanoparticles such as chitosan, carbon-based nanoparticles such as fullerenes and metal-based nanoparticles such as silver or titaniumdioxide.
A
B
C
D
Figure 2.21: Molecular structure of WSCP (A), DBNPA (B), TCMTB (C) and bronopol (D)
When a biocidal or nano-material is surface-active, the cell wall or the cell membrane can be destabilised with the result that it may split by which the major cell content can flow out and the cell is inactivated. This phenomenon is referred to as cell lysis. An example of this is the formation of nano-channels due to natural peptides, which makes the osmotic cell collapse, or the reduction of membrane permeability by the positively charged chitosan. Li et al. (2010) studied films of chitosan on PVP and PEO. After 6 hours of contact a reduction of E coli with 3.3 log10/100ml was found for pure chitosan, 2.5 log10/100ml for chitosan on a PVP film and 3.4 log10/100ml for chitosan on a PEO film. Due to interaction of the PVP film with the antibacterial action of chitosan, a lower bacterial
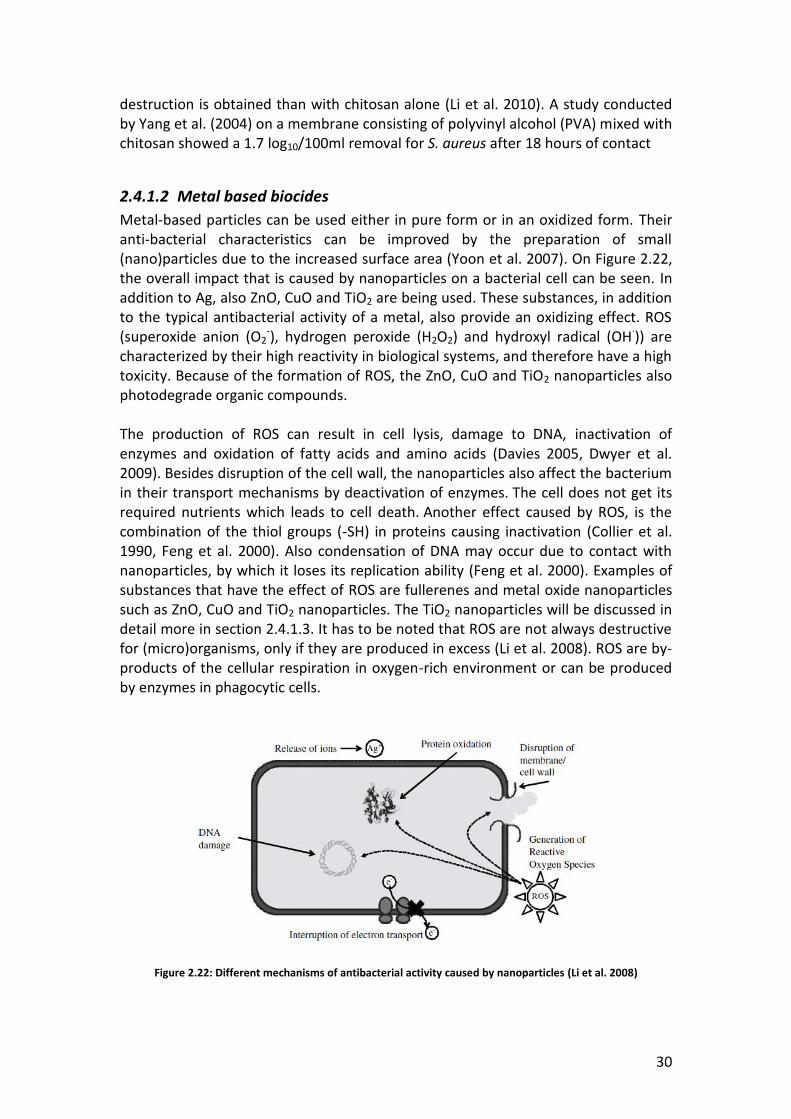
30
destruction is obtained than with chitosan alone (Li et al. 2010). A study conducted by Yang et al. (2004) on a membrane consisting of polyvinyl alcohol (PVA) mixed with chitosan showed a 1.7 log10/100ml removal for S. aureus after 18 hours of contact
2.4.1.2 Metal based biocides
Metal-based particles can be used either in pure form or in an oxidized form. Their anti-bacterial characteristics can be improved by the preparation of small (nano)particles due to the increased surface area (Yoon et al. 2007). On Figure 2.22, the overall impact that is caused by nanoparticles on a bacterial cell can be seen. In addition to Ag, also ZnO, CuO and TiO2 are being used. These substances, in addition to the typical antibacterial activity of a metal, also provide an oxidizing effect. ROS (superoxide anion (O2
-), hydrogen peroxide (H2O2) and hydroxyl radical (OH·)) are characterized by their high reactivity in biological systems, and therefore have a high toxicity. Because of the formation of ROS, the ZnO, CuO and TiO2 nanoparticles also photodegrade organic compounds. The production of ROS can result in cell lysis, damage to DNA, inactivation of enzymes and oxidation of fatty acids and amino acids (Davies 2005, Dwyer et al. 2009). Besides disruption of the cell wall, the nanoparticles also affect the bacterium in their transport mechanisms by deactivation of enzymes. The cell does not get its required nutrients which leads to cell death. Another effect caused by ROS, is the combination of the thiol groups (-SH) in proteins causing inactivation (Collier et al. 1990, Feng et al. 2000). Also condensation of DNA may occur due to contact with nanoparticles, by which it loses its replication ability (Feng et al. 2000). Examples of substances that have the effect of ROS are fullerenes and metal oxide nanoparticles such as ZnO, CuO and TiO2 nanoparticles. The TiO2 nanoparticles will be discussed in detail more in section 2.4.1.3. It has to be noted that ROS are not always destructive for (micro)organisms, only if they are produced in excess (Li et al. 2008). ROS are by-products of the cellular respiration in oxygen-rich environment or can be produced by enzymes in phagocytic cells.
Figure 2.22: Different mechanisms of antibacterial activity caused by nanoparticles (Li et al. 2008)

31
The metal nanoparticles can be incorporated in most of the polymeric materials for the production of membranes with specific characteristics (Ng et al. 2013). ZnO nanoparticles have an anti-bacterial effect against E. coli (Liu et al. 2009, Wang et al. 2012) and S. aureus (Huang et al. 2008) due to damage of the cell membrane by production of hydrogen peroxide. Caution is needed since in too low concentrations, bacterial growth can be enhanced: if the concentration of ZnO is too low to damage the permeability of the cell wall, bacteria can use the ZnO ion as a trace element for growth (Brayner et al. 2006). A chitosan/polyvinylalcohol film with ZnO nanoparticles was developed by Vicentini et al. (2010). Beside a better thermal stability, the functionalised film also had a better bacterial removal against S. aureus with a 4.8 log10/100ml extra removal after 3 hours of contact. Nataraj et al. (2008) functionalised polyacrylonitrile (PAN) nanofibres with 3 wt% ZnO through inline functionalisation and found an improved specific surface. Wei et. al. (2009) used reactive sputter-coating as technique to functionalise nanofibres. Silver nanoparticles (nAg) have a size of 1-100 nm and are commonly used in antibacterial applications. The inherent anti-bacterial activity of silver ions reacts at multiple sites on the surface of the bacterial cell wall. However, the biocidal effect is larger for Gram-negative bacteria, which means that Gram-positive bacteria remain unaffected and can be transported through the membrane (Sondi and Salopek-Sondi 2004). Ag nanoparticles have a large surface-to-volume ratio. Serving as a sustained local supply for Ag+ ions they provide a prolonged prevention of bacterial adhesion (Cao et al. 2010). The mode of action of Ag nanoparticles include the direct interaction on the target and the release of silver ions (Ag+) (Bao et al. 2011). The anti-bacterial activity of Ag+ ions is larger for Gram-negative bacteria because of their peptidoglycan layer. This layer is thicker for Gram-positive bacteria which slows down the effectiveness of Ag+ ions (Rai et al. 2009). Antibacterial Ag/polyacrylonitrile (Ag/PAN) nanofibres were prepared by atmospheric plasma treatment and electrospinning. After 24h incubation (37°C) of 109 CFU/100ml Escherichia coli an almost complete reduction was found for the 0,5 wt% and 1,25 wt% AgNO3/PAN, while pure PAN nanofibres did not reduce the bacteria (Shi et al. 2011). A polyethersulfone (PES) hollow fibre membrane was incorporated with silver nanoparticles (Sawada et al. 2012) and in contact tests and more than 99.99% of E. coli cells were killed after 8 hours of incubation. Zodrow et al. (2009) found a 2 log10/100ml reduction for E. coli after filtration with a polysulfone (PSU) membrane (not a nanofibre membrane) that was impregnated with nAg by use of the "wet phase inversion process". A study conducted by Bielefeldt et al. (2009) in which a point-of-use ceramic water filter (microfiltration, but no nanofibre membrane) was used that consisted of clay and was coated with a colloidal silver solution (3.2% Ag), found a 3.5-4.5 log10/100ml removal for E. coli. Koseoglu-Imer et al. (2013) found that the Ag nanoparticles PSU membranes decreased the growth of bacterial colonies and decreased pore fouling. They also found that the change of roughness due to the nAg was directly proportional to the adsorptive fouling of membranes. Liang et al. (2012) added functionality to a polyvinylidenefluoride (PVDF) membrane with 6.7 wt% ZnO nanoparticles. Liang et

32
al. (2012) found that the modified membranes reached almost 100% water flux recovery and were able to maintain constant initial fluxes in multicycle filtration, whereas the non-functionalised membrane recovered 78% and suffered continuous decline. ZnO decreases the membranes hydrophobicity which is assumed to decrease the attachment of particles resulting in a higher anti-fouling activity.
2.4.1.3 Titanium dioxide
Titanium dioxide (TiO2) has been the focus of numerous studies in recent years since they have the ability of degrading natural organic matters, producing more hydrophilic structures, and decomposing bacterial cells, and thus are interesting for use in membranes surface and structure modifications (Mills and Le Hunte 1997). When illuminated with UV, TiO2 nanoparticles produce reactive oxygen species such as peroxide, hydroxyl radicals and hydroperoxyl radicals through reductive or oxidative reactions. The photocatalytic activity of TiO2 originates by the absorption of ultraviolet (UV) light corresponding to the band gap (Fujishima and Honda 1972, Fujishima et al. 2000, Kobayakawa et al. 1998) which generates a pair of conduction band electron (e-) and valence band hole (h+). The photogenerated holes in the valence band diffuse to the TiO2 surface and react with adsorbed water molecules, forming hydroxyl radicals (•OH) (Fujishima et al. 2008) which can promote oxidation of organic molecules on the TiO2 surface. Meanwhile, electrons in the conduction band participate in reduction processes, which react with molecular oxygen to produce superoxide radical anions (O2
•−). This photocatalytic process is schematically presented in Figure 2.23.
Figure 2.23: Schematic representation of the photochemical activation of a semiconductor after absorption of
UV light corresponding to the band gap and formation of the hydroxyl radical, VB: valence band; CB: conduction band; A: electron acceptor; D: electron donor (Devipriya and Yesodharan 2005).
Furthermore, surfaces covered with TiO2 become superhydrophilic under UV-light irradiation (Cao et al. 2006, Wang et al. 1997). The superhydrophilicity, with a contact angle of less than 5°, originates from chemical conformation changes of a surface due to the TiO2 nanoparticles (Ikeda et al. 1997). As mentioned before, an increase in hydrophilicity enhances membranes anti-fouling properties (Madaeni et al. 1999).

33
Titanium dioxide occurs in nature as minerals rutile, anatase and brookite and is a photocatalyst under UV-light. Brookite is the least studied form of TiO2 due to difficulties encountered when producing it as a pure phase (Kandiel et al. 2013). The anatase phase usually has better photocatalytic activity than rutile (Carp et al. 2004, Markowska-Szczupak et al. 2011). The different behaviour of anatase and rutile has been attributed to the different position of the conduction band (more positive for rutile), to the higher recombination velocity of electron–hole pairs in rutile and to the higher capacity of anatase to adsorb oxygen, due to higher density of superficial hydroxyl groups (Sclafani and Herrmann 1996). However there are also reports that the rutile form has a greater or comparable photocatalytic activity to anatase (Mills and Le Hunte 1997, Rincón and Pulgarin 2003). Finally, some experiments demonstrated that a mixture of anatase and rutile with an approximate composition of 70–75% anatase and 30–25% rutile is more active than a pure phase (Ohno et al. 2001, Prasad et al. 2009). This is the composition that is produced by Degussa for their P25 TiO2 (distributed by Sigma Aldrich). The inconsistency of data originates from experiments in literature that have been carried out in different conditions (diverse types of TiO2, pH, temperature, light source/power (He et al. 2009, Lakshmi et al. 1995, Pant et al. 2013, Rincón and Pulgarin 2003, Uddin et al. 2007)). Additionally due to the many photocatalyst properties (for example crystal size, surface area, crystal defects, pore size distribution, oxygen adsorption capacity, size and mobility of electrons, degree of hydroxylation and by the presence of indirect or direct band gaps (Markowska-Szczupak et al. 2011) a comparison between results in literature is very difficult. Most of the work carried out focused on the use of TiO2 powders suspended in the water as a catalyst followed by a filtration step to separate the particles from the purified solution. Immobilisation of TiO2 omits the need for photocatalyst separation in a subsequent process (Kobayakawa et al. 1998). When exposed to near-UV light, TiO2 exhibits a strong bactericidal activity (Markowska-Szczupak et al. 2011). Kinetic data showed that cell wall damage took place in less than 20 min, followed by a progressive damage of cytoplasmic membrane and intracellular components (Desai and Kowshik 2009) (Figure 2.24). Free TiO2 particles may also gain access into membrane-damaged cells, and subsequently attack directly on the intracellular components which can accelerate cell death. It has been found that smaller TiO2 particles cause quicker intracellular damage (Huang et al. 2000). Evidence has been obtained that TiO2 photocatalytic reaction results in continued bactericidal activity after the UV illumination terminates (Huang et al. 2000). Bacteria exposed to the photocatalytically activated TiO2 nanoparticles are incapable of self-repair so TiO2 could be used as an effective nanomaterial in water treatment systems (Rahimpour et al. 2012, Rahimpour et al. 2011, Soroko and Livingston 2009, Zhou et al. 2011). A cellulose acetate membrane functionalised with ZnO and TiO2 was produced by Bai et. al. (2012) providing better anti-bacterial effects against E. coli and a higher removal rate on humic acids and methylene blue, as indicators for the anti-fouling ability of the membrane.

34
Figure 2.24: Field emission SEM (FE-SEM) image of E. coli before (A) and after (B) being damaged by TiO2 under
UV-irradiation (Desai and Kowshik 2009).
Kim et al. (2003) composed a hybrid thin-film-composite membrane functionalised with TiO2 nanoparticles which showed a pronounced photobactericidal effect on E. coli under UV illumination. The systems was illuminated with a UV lamp for 4 hours per day. Application of the membrane to RO field test after exposure to microbial cells verified a substantial prevention against the microbial fouling by showing less loss of RO permeability, offering a strong potential for possible use as a type of anti-fouling membrane (Figure 2.25).
Figure 2.25: Water flux of the non-functionalised (neat) and the functionalised (hybrid) membranes with and
without UV light after exposure to microbial cells (Kim et al. 2003).
2.4.2 Removal of organic components
A TiO2 functionalised nanowire membrane (pore size: 0.05 μm) was successfully fabricated using hydrothermal synthesis filtration method (Zhang et al. 2008b). Fouling did not occur when operating below the critical flux (Zhang et al. 2008b). The experiments also showed that TiO2 nanowire membrane fouling caused by humic acid accumulation was improved by the concurrent photocatalytic degradation. The

35
high potential for TiO2 as functional agent in anti-fouling membranes was also found by other researchers (Bergamasco et al. 2011, Hamid et al. 2011, Ma et al. 2010). A Ag-TiO2/hydroxiapiate supported composite membrane was tested by Ma et al. (2010) and compared with 42.1% removal by filtration alone, 88.3% of humic acids were removed by filtration combined with photocatalysis in cross-flow operation mode during 1 hour. Based on the anti-fouling performance experiments, Hamid et al. (2011) found that polysulfone electrospun hollow fibre membranes inline functionalised with 2 wt% TiO2 were excellent in modifying fouling behaviour particularly in reducing the fouling resistances due to concentration polarization, cake layer formation and absorption. More studies on TiO2 functionalised nanofibres can be found in the discussion section of chapter 7.
2.4.3 Toxic metal adsorption
The removal of toxic metals from wastewater is important since they may cause toxic effects (Aliabadi et al. 2013, Tian et al. 2011). Also, the recovery of some metals from aqueous solutions creates an economic advantage (Li et al. 2013). Several methods exist for the removal of toxic metals from aqueous solutions (eg. chemical precipitation, RO, biological treatment) but these techniques suffer from some disadvantages such as high costs and high energy consumption (Aliabadi et al. 2013, Tian et al. 2011). Among these methods, adsorption is favoured due to its high efficiency, ease of process, reversibility and the possible low cost (depending on the availability of different adsorbents) (Tian et al. 2011). Because nanofibre membranes possess unique properties (such as a high specific surface area), they seem interesting for the adsorption of metal ions from aqueous solutions (Aliabadi et al. 2013, Hota et al. 2008, Kampalanonwat and Supaphol 2010, Li et al. 2013, Neghlani et al. 2011) and can be applied for reuse of noble metals such as gold, silver, platinum, nickel, cadmium, copper and lead ions from aqueous solution. The introduction of specific functional groups onto the electrospun nanofibres was reported for the removal/adsorption of specific materials from waste/aqueous solutions (Aliabadi et al. 2013, Hota et al. 2008, Tian et al. 2011). For example chitosan is widely used for adsorption of toxic metal ions due to the presence of hydroxyl and amine groups (Wan Ngah et al. 2002). Results from Neghlani et al. (2011) found that the adsorption process in nanofibres is three times faster in comparison with microfibres. The researchers also found that the saturation adsorption capacity of nanofibres is five times more than the value found for microfibres. The regeneration possibility of the adsorbent is an important factor since it reduces the cost. Research from Kampalanonwat and Supaphol (2010), Tian et al. (2011) and Aliabadi et al. (2013) concluded that the nanofibre membranes functionalised for adsorption, only had a small decrease in the adsorption capacity and could frequently be reused.

36
2.4.4 Long term effects of membrane functionalisation
Nevertheless, not many long-term tests on the effect of membrane modification are available in literature. After the short-term, static tests, the long term evaluation of these techniques should become a focus for the research groups dealing with membrane modification. Polydopamine- and polydopamine-g-poly(ethylene glycol)-modified polysulfone membranes showed significantly decreased adhesion of bovine serum albumin and P. aeruginosa during 1-h static adhesion tests. However, when the membranes were used continuously (4 days) in membrane fouling simulators (Vrouwenvelder et al. 2006), the surface modifications did not inhibit biofouling (Miller et al. 2012). The authors state that short-term batch adhesion experiments using model proteins or bacteria under static conditions are not indicative of biofouling. This however does not want to say that long-term results with modified membranes are always unsuccessful. Kim et al. (2003) did a filtration test (3 days) on thin-film-composite RO membranes functionalised with nTiO2 after exposure to microbial cells. The prevention against the microbial fouling was verified by showing less loss of permeability. Louie et al. (2006) performed a physical coating of a commercial polyamide reverse osmosis membrane. In a test with a duration of 106 days in an oil/surfactant emulsion, the coated membrane showed slower rates of flux decline. In another study, Belfer et al. (2001) found an improvement in fouling resistance for a reverse osmosis membrane modified with sulfopropyl methacrylate, which could be explained by the increased hydrophilicity and decreased roughness of the modified membrane. In a field test at a seawater desalination plant, modified membrane retained 77% of its flux, as compared to 69% for the unmodified membrane.
2.5 Conclusions
Microfiltration is useful in water treatment technologies. It can be used in disinfection purposes, as RO pre-treatment and in MBR applications. Nanofibre membranes are a promising material to optimise water filtration due to their high porosity and thus high water flux. Nanofibres are produced via electrospinning which is an easy process with tuneable options. Nanofibre diameters can be adapted and its production technique offers the opportunity to functionalise the nanofibres. These functionalities involve different possibilities in view of disinfection, organic matter removal, anti-fouling abilities and removal of heavy metals via adsorption. This work will deal with the implementation of nanofibres in different water filtration techniques. Use will be made of (i) non-functionalised nanofibre membranes for use in MBR configurations and disinfection by microfiltration and (ii) nanofibre membranes functionalised with different biocides and TiO2 nanoparticles for enhanced disinfection purposes and degradation of dissolved organic matter.

37
3 Material and methods
This chapter provides an overview of the generic materials and methods used for the research in this work. Materials and methods used in one specific chapter only, are mentioned there.

38
3.1 Electrospinning of nanofibre membranes
3.1.1 Polymer and solvents
Polyamide 6 (MW 10000 g/mol) was obtained from Sigma-Aldrich and was used as received. Solvents were 98 wt% formic acid and 99.8 wt% acetic acid (both obtained from Sigma-Aldrich). The solutions for electrospinning of non-functionalised PA-6 nanofibres, were prepared by dissolving 16 wt% PA-6 in a 50:50 v% formic acid/acetic acid solvent mixture
3.1.2 Single nozzle set-up
The standard set-up for electrospinning is shown in Figure 3.1 and consists of a syringe (20 ml Norm-jet of Henke SassWolf) with a 15.24 cm long metallic needle, a syringe pump (KD Scientific Syringe Pump Series 100), a grounded collector and a laboratory jack to adjust the tip-to-collector distance. The needle is connected on a high voltage source (Glassman High Voltage Series EH) which can deliver an output voltage over the range from 0 to 30 kV. The nanofibrous nonwoven is collected on aluminium foil, which was placed on the grounded collector plate. The tip to collecter distance and flow rate are set at 10 cm and 1 ml/h, respectively. Furthermore, the voltage was adjusted between 20 and 25 kV, in order to obtain steady state conditions.
Figure 3.1: Single nozzle set-up.
3.1.3 Multi-nozzle set-up
For use of the membranes in lab-scale filtration systems, larger membrane surfaces are needed thus a system with multiple needles is developed. This multi-nozzle set-up (Figure 3.2) makes it possible to obtain a complete uniform surface and a controllable thickness. Next to this an increase in the production rate of electrospinning is obtained. The multi-nozzle method mainly diverges from the single nozzle by the number of nozzles, with the general methodology remaining the same. The multi-nozzle set-up was used with 18 nozzles, each fed by a syringe. The nozzles are fixed in alternating rows and are moving in the width direction. Meanwhile, a

39
collector is moving in the production (or length) direction. This multi-nozzle set-up delivered nanofibrous nonwovens sufficiently large and reproducible to allow further testing. The tip to collector distance and flow rate are set at 10 cm and 1 ml/h, respectively. Furthermore, the voltage was adjusted between 25 and 30 kV, in order to obtain steady state conditions.
Figure 3.2: Picture of the multi-nozzle set-up.
The multi-nozzle electrospinning set-up was adapted during this research (Table 3.1). Therefore it became possible to make thinner and more uniform nanofibre membranes. Results in chapter 4 indicated that nanofibres could be used in water filtration but some improvements were needed to obtain more homogenous membranes and to avoid membrane rupture. Some parameters were found to influence the electrospinning process (De Vrieze et al. 2009, De Vrieze et al. 2011) such as temperature and humidity. The multi-nozzle set-up therefore was moved to a acclimatised room. The experiments were conducted at room temperature (21 ± 2°C) and humidity 45 ± 5 %RH. Also the position of needles was further optimised providing more homogenous samples in chapters 7, 8 and 9. The first tests in this work were done on thicker membranes (grammage 25 g/m2). Nanofibre membranes in the beginning phase of this work were sensitive to delamination. As such, a certain thickness was required to avoid membrane rupture during the water filtration experiments. Since chapter 5 however indicated a severe problem of fouling it was found that thinner membranes could alter this problem gradually by decreasing the so-called layered fouling. When the homogenous production of nanofibres on the multi-nozzle set-up was enhanced, the production of thinner membranes was possible without membrane rupture during experiments. These thinner membranes were tested in chapter 7, 8 and 9. As such, the applied grammage in different chapters is diverse and is always mentioned at the material and methods section of each chapter. Grammage influences for example the structure of the fibres and thus this results in different

40
clean water permeability and filtration properties for the non-functionalised PA-6 membranes during this research. In each chapter the optimal nanofibre membranes, as possible at that moment, were used. Also when membranes were functionalised and compared to non-functionalised membranes, the functionalised and non-functionalised membranes were produced with the same production technique and at the same moment.
Table 3.1: Development of the multi-nozzle electrospinning set-up.
Chapter Development of the
electrospinning set-up Change in membrane morphology
Filtration characteristics
4 Original set-up 5,6 Use of an acclimatised room +
more needles Increased homogeneity Less delamination
7,8,9 Higher possible speed of the
rotating collector Better positioned needles
Thinner membranes Higher CWP Higher bacterial removal
3.1.4 Functionalisation of electrospun nanofibre membranes
Two ways of functionalisation were being used in this work: post-functionalisation and inline functionalisation (Figure 3.3). The membranes were inline functionalised by adding the functional agents to the polymer solution prior to the electrospinning process. In this way the functionalising agent is incorporated into the fibres. For this functionalisation technique the amount of functionalising agent is typically expressed as wt%. The wt% is calculated as the ratio of the total mass of functionalising agent per total mass fibre (mass functionalising agent + mass PA-6). Functional agents that were used for inline functionalisation in this study are: WSCP, DBNPA, TCMTB, nAg, bronopol and nTiO2. A more detailed description of these can be found in chapter 2. The production and properties of the used TiO2 nanoparticles can be found in chapter 7 and 8. Post-functionalisation is done after PA-6 nanofibres are produced. In chapter 4, 6, 7 and 8 the membranes were post-functionalised with nAg or nTiO2. The method of functionalisation is described in the material and methods section of these chapters.
Figure 3.3: schematic representation of the result from different functionalisation techniques: post-
functionalisation (left) and inline functionalisation (right).
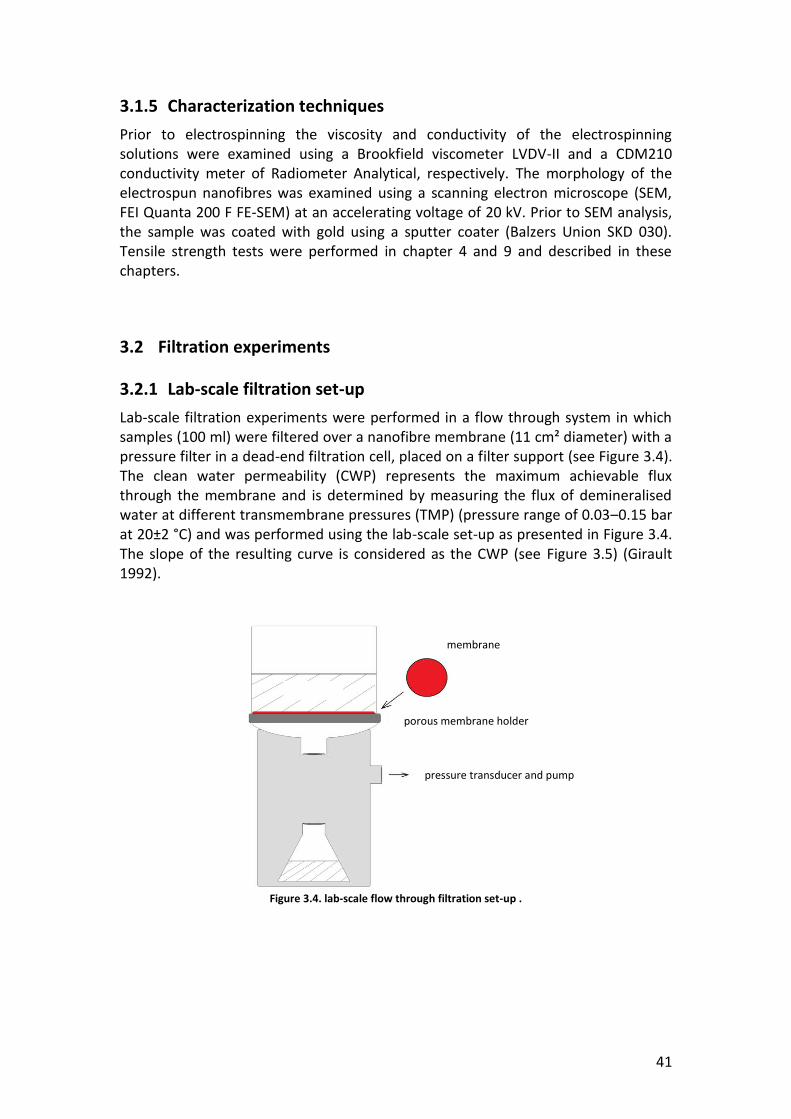
41
3.1.5 Characterization techniques
Prior to electrospinning the viscosity and conductivity of the electrospinning solutions were examined using a Brookfield viscometer LVDV-II and a CDM210 conductivity meter of Radiometer Analytical, respectively. The morphology of the electrospun nanofibres was examined using a scanning electron microscope (SEM, FEI Quanta 200 F FE-SEM) at an accelerating voltage of 20 kV. Prior to SEM analysis, the sample was coated with gold using a sputter coater (Balzers Union SKD 030). Tensile strength tests were performed in chapter 4 and 9 and described in these chapters.
3.2 Filtration experiments
3.2.1 Lab-scale filtration set-up
Lab-scale filtration experiments were performed in a flow through system in which samples (100 ml) were filtered over a nanofibre membrane (11 cm² diameter) with a pressure filter in a dead-end filtration cell, placed on a filter support (see Figure 3.4). The clean water permeability (CWP) represents the maximum achievable flux through the membrane and is determined by measuring the flux of demineralised water at different transmembrane pressures (TMP) (pressure range of 0.03–0.15 bar at 20±2 °C) and was performed using the lab-scale set-up as presented in Figure 3.4. The slope of the resulting curve is considered as the CWP (see Figure 3.5) (Girault 1992).
Figure 3.4. lab-scale flow through filtration set-up .
pressure transducer and pump
porous membrane holder
membrane

42
Figure 3.5: Example of a clean water flux measurement (CWP= 21x10
3 l/m².h.bar).
3.2.2 Submerged semi-dead-end MBR
A fully automated submerged MBR with a semi-dead-end membrane module firstly was operated in activated sludge configuration (AS-MBR) (see picture and scheme in Figure 3.6). The reactor was inoculated with activated sludge from a municipal wastewater treatment plant treating the wastewater of 10,000 IE (www.aquafin.be). Furthermore, at the first compartment of the MBR set-up, lava rock was added as support material for biomass. This configuration is called a trickling filter MBR (TF-MBR). The lava rocks used in the TF-MBR had a diameter between 16 and 32 mm (Figure 3.7).
Figure 3.6: submerged semi-dead-end AS-MBR. Left: picture, right: schematic representation.
y = 27386x R² = 0,8944
0
500
1000
1500
2000
2500
3000
0 0,02 0,04 0,06 0,08 0,1 0,12
Flu
x (l
/(m
²;h
) )
Pressure (bar)

43
Figure 3.7: Trickling filter semi-dead-end TF-MBR. Left: picture, right: schematic representation.
The membrane module consisted of a central part and two side parts produced in PVC and is pictured in Figure 3.8. The nanofibre membrane was pressed between the central and the side part. A support layer was used as spacer on both sides of the membrane in chapter 5 and is described there.
Figure 3.8: semi-dead-end membrane module used in this chapter 4 (and with support in chapter 5).
The design parameters of the MBR are represented in Table 3.2. Due to the hydrostatic pressure in the reactor and the developed pressure difference at the effluent side the cleaned water is pumped through the membrane. The process was monitored and controlled with a Phoenix contact programmable logic controller (www.phoenixcon.com). Membrane flux and trans-membrane pressure were continuous logged, allowing the evaluation of the fouling and condition of the membrane. Registration of dissolved oxygen (DO) with a dissolved oxygen probe (WTW oxi 340-A/SET), gave an idea of the microbiological activity of the sludge. Spectrophotometric methods were used for chemical oxygen demand (COD) (ISO 15705), ammonium NH4
+ (LCK 304) and total nitrogen measurements (American Waterworks Association 1971). The reactor was operated at constant flux (40 l/m².h).

44
Table 3.2: Design parameters.
Design parameter (unit) Value
Total reactor volume (l) 50
Hydraulic residence time (d) 0.5
Recycle ratio (return/feed) 3/1
Ratio aerobic/anoxic (volume/volume) 2/1
Filtering surface (m²) 0.073
The reactor was constructed according to a pre-denitrification configuration (Tchobanoglous et al. 2003) and was divided in two zones. The first zone was an anoxic zone, the second an aerobic zone. The forced aeration in the aerobic zone was realised by compressed air at 7 bar through a diffuser. A level sensor was placed to avoid overflow or depletion of the reactor. The reactor was fed with synthetic waste water of which the components is presented in Table 3.3. This feed was led through a dividing wall in the aerobic zone of the reactor. The DO in this zone was controlled between 3.9 and 4.1 mg O2/l using forced on/off aeration. In the aerobic zone two mechanisms took place: COD removal and nitrification.
Table 3.3: Compounds of the synthetic feed prepared with tap water.
Component (unit) AS-MBR TF-MBR
Glucose (mg O2/l) 200 400
(NH4)2SO4 (mg N/l) 30 30
KH2PO4 (mg P/l) 6 6
NaHCO3 (mg CaCO3/l) 200 200
3.2.3 Side-stream cross-flow MBR
The cross-flow reactor is presented in Figure 3.9. A trickling filter with same lava rocks as described above, was also embedded in the cross-flow pilot (not displayed in the picture). The feed water is pumped around (Sandpiper PB ¼ - A type 3) in a recirculation loop containing the membrane module where the permeate is discharged and the concentrate is returned to the bioreactor. The filtration surface of the membrane is 0.04 m2, the reactor volume is 50 l. Pressure (Cole Parmer 68900 -68) and flow (Mac Millan 101) are logged (with phoenix contact programmable logic controller) before and after the membrane in the internal circuit. Also the permeate flow was measured. If the permeate flow is too low, the solenoid valve (Cole Parmer) is adapted in order to obtain more pressure in the circuit.

45
The cross-flow configuration was operated in anaerobic conditions. Anaerobic granular sludge from a local water treatment plant, was used to inoculate the reactor. The synthetic feed water used had a COD of 600 mg O2/l, 30 mg N/l and 6 mg P/l with pH 7.6 (Ghaniyari-Benis et al. 2009). For the cross-flow MBR (Figure 3.9) the mixed liquor suspended solids (MLSS) had to be as low as 2 g/l in order to avoid membrane failure. TMP was varied between 0 and 0.6 bar, the flux was 10 l/(m².h).
Figure 3.9: Side-stream cross-flow MBR. Left: picture, right: schematic representation.
3.3 Disinfection experiments
3.3.1 Bacteria
S. aureus strain LMG 8224 (Gram-positive) and E. coli strain LMG 2093 (Gram-negative) were used for the inoculation of physiologic water (Figure 3.10). The cultures were grown in nutrient broth (CM0001, Oxoid, UK) at 37°C to stationary phase (Bielefeldt et al., 2009).
Figure 3.10: S. aureus (A) and E. coli (B) (Zhang et al. 2014).
3.3.2 Experiments
Disinfection experiments were performed in two ways: by filtration and by contact of bacteria with the antibacterially functionalised nanofibres. For filtration experiments, the lab-scale set-up was used as depicted in Figure 3.4. The applied
Level sensor
heating circuit
mixer
pump
flow meter
pressure transducer pressure transducer
flow meter
flow meter
variable valve
membrane module
activated sludge
B
A
2 µm 2 µm

46
pressure difference was 1 bar. Prior to disinfection experiments the filtration cell was autoclaved at 121°C for 15 min. Water samples were collected and diluted as needed for enumeration of bacteria. In chapters 6 and 8 disinfection was measured by contact tests with the membranes. These experiments are described in the material and methods section of the chapters.
3.3.3 Enumeration of bacteria
The culturable micro–organisms were enumerated by inoculation in a nutrient agar culture medium (CM0003, Oxoid, UK) at 22°C en 37°C (EN_ISO:6222 1999) (Figure 3.11). In some chapters coliform bacteria were detected and enumerated (EN_ISO:9308-1 2000). Log10/100ml reduction values are calculated by: log10 (bacterial count per 100ml before disinfection / bacterial count per 100ml after disinfection). The log10/100ml reduction values are related to the percentage of microorganisms that are removed or inactivated. A 4 log10/100ml reduction for example equals 99.99% removal.
Figure 3.11 enumeration of bacteria.
3.4 Photocatalytic set-up
Photocatalytic activity of the functionalised nanofibre was assessed by photodegradation under UV irradiation. In this work tests were done on methylene blue, humic acids and S. aureus. Different membranes (3 cm x 3 cm) were immersed in the tested solution (ratio of membrane mass (mg): liquor volume (ml) was 1:800) and illuminated from a 40 cm distance by a 300 W Osram Ultra-Vitalux lamp, emitting radiation similar to the sunlight with an intensity of about 5 mW/cm2. The spectra were measured in house (Ocean Optics QE65000) and are shown in Figure 3.12. The portion of UV light emitted is responsible for the TiO2 photocatalysis (as discussed in chapter 2). The lamp was switched on 1 hour before the beginning of the photocatalytic test to stabilize the power of its emission spectrum. Non-functionalised electrospun nanofibre membranes were considered as a reference. One test was done for comparison between membranes with a different density. For these membranes their specific weight was kept the same. All tests were done in three-fold.

47
Figure 3.12: The light emission profile of the Osram Ultra-vitalux.
Figure 3.13: schematic diagram of the batch photocatalytic set-up.
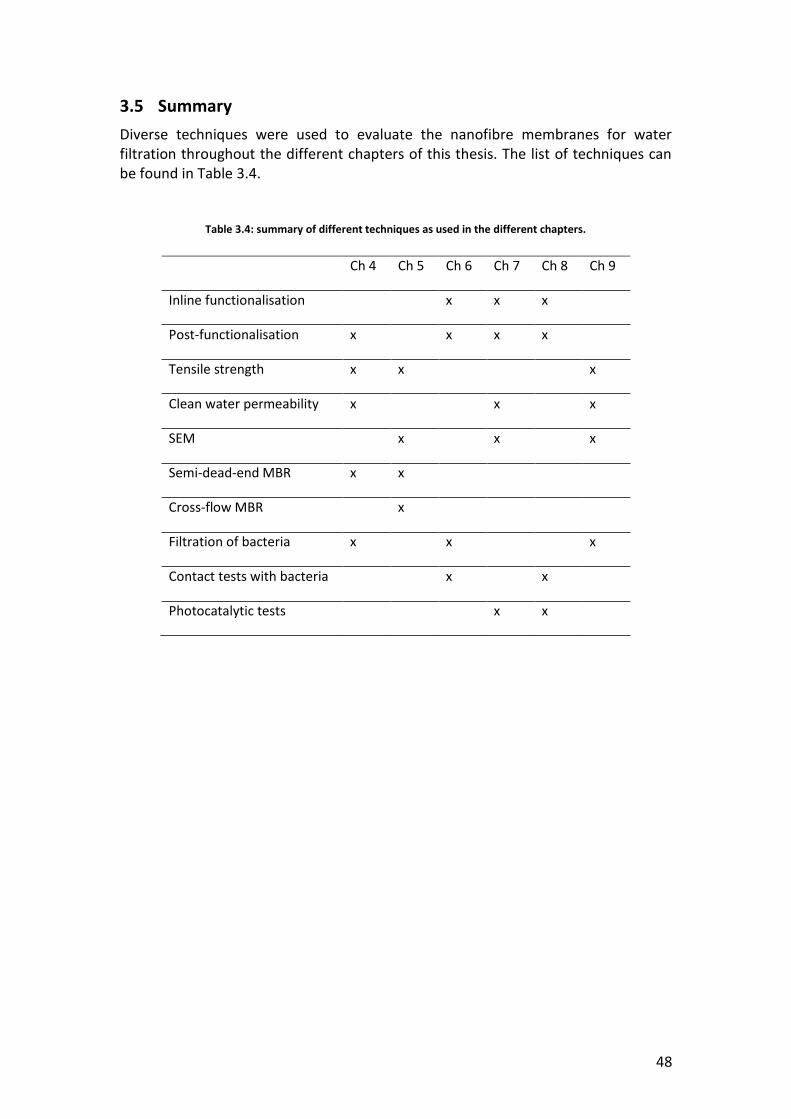
48
3.5 Summary
Diverse techniques were used to evaluate the nanofibre membranes for water filtration throughout the different chapters of this thesis. The list of techniques can be found in Table 3.4.
Table 3.4: summary of different techniques as used in the different chapters.
Ch 4 Ch 5 Ch 6 Ch 7 Ch 8 Ch 9
Inline functionalisation x x x
Post-functionalisation x x x x
Tensile strength x x x
Clean water permeability x x x
SEM x x x
Semi-dead-end MBR x x
Cross-flow MBR x
Filtration of bacteria x x x
Contact tests with bacteria x x
Photocatalytic tests x x
4 Performance assessment of electrospun
nanofibres for filter applications This first series of experiments explores the possible use of PA-6 nanofibre microfiltration membranes in water filtration. At the start of the present research project, the use of nanofibres in water filtration was a very new and attractive topic yet with very little knowledge towards the actual possibilities and applications of the nanofibres for water filtration. Three different applications were studied. Non-functionalised PA-6 nanofibre membranes and nanofibres post-functionalised with silver nanoparticles were tested for bacterial removal. Secondly the nanofibre membrane was applied in a lab-scale submerged membrane bioreactor (MBR). At last the nanofibre membrane was applied as stand-alone filter for water treatment. Results of this chapter are published in: Decostere, B., Daels, N., De Vrieze, S., Dejans, P., Van Camp, T., Audenaert, W., Hogie, J., Westbroek, P., De Clerck, K. and Van Hulle, S.W.H. (2009) Performance assessment of electrospun nanofibers for filter applications. Desalination 249(3), 942-948. Decostere, B., Daels, N., De Vrieze, S., Dejans, P., Van Camp, T., Audenaert, W., Westbroek, P., De Clerck, K., Boeckaert, C. and van Hulle, S.W.H. (2010) Initial testing of electrospun nanofibre filters in water filtration applications. Water SA 36, 151-156.

50
4.1 Introduction
Nanofibres have a wide range of applications due to their large surface area to volume ratio and the unique nanometre scale structure (see chapter 1). Also the high porosity and interconnected pore structures offer a high permeability (Thavasi et al. 2008) and thus seem interesting in filtration applications. This chapter explores their use in microfiltration applications. Microfiltration membranes have a pore size between 0.1 and 10 µm and typically a trans-membrane pressure (TMP) between 0.01 and 0.20 bar is used when applied for water filtration. With these membranes it is possible to retain suspended solids and depending on the pore size also micro-organisms such as bacteria, yeast and fungi (see chapter 2). Earlier studies indicated that in case of a 0.45 µm pore size, a 4 log10 – 6 log10/100ml bacterial reduction could be obtained (Elwell and Barbano 2006, Gómez et al. 2006). As a nanofibre membrane has pore sizes ranging from sub-micron to several micrometres (Gopal et al. 2006) (see chapter 2) it seems interesting to evaluate its bacterial removal capacity. Further, the added value of silver functionalised membranes towards disinfection was studied. The inhibitory effect of silver nanoparticles (nAg) on microbial growth is frequently investigated (Bao et al. 2011, De Windt et al. 2008, Rai et al. 2009). In general it is known that the free silver ion is highly toxic to a wide variety of organisms including bacteria due to its sorption to the negatively charged bacterial cell wall which deactivates cellular enzymes, disrupts membrane permeability and ultimately leads to lysis of the cell (Bao et al. 2011, Choi et al. 2008). Although there are already several membrane types used in an MBR as was discussed in literature review (chapter 2), it is useful to investigate whether this nanofibre membrane is a competitive membrane because commercial membranes have lower fluxes and are rather expensive. The production cost of a nanofibre membrane was estimated at 5 €/m2 (Bilad et al. 2011b), whereas for a commercial available membrane a production cost of 14–50 €/m2 is estimated (Fatarella et al. 2009). Also traditional membranes often use a high transmembrane pressure (TMP) which increases the major energy cost of the installation. Since nanofibre membranes have a high porosity it is expected that a lower TMP is needed. Nanofibre membranes have some very interesting properties (interconnected open pore structure, high permeability and a large surface area per unit volume) for water filtration although their concrete use in water filtration systems should still further be explored. This chapter assesses the use of the nanofibre membrane in water filtration by:
(i) Determination of some important membrane characteristics (clean water
permeability and tensile strength).
(ii) Filtration of bacteria, to be applied as part of a (process) water producing
facility.
(iii) Testing their use in MBR set-up as a flat sheet nanofibre membranes to be
used as alternative for traditionally used flat sheet membranes (e.g. Kubota
membranes).
(iv) Application in a stand-alone microfiltration unit to remove suspended solids.
51
The samples used in this study are the very early stage developed nanofibre membranes. The ultimate goal of this study from a material engineering point of view is to develop and adapt the electrospinning set-up to make the fibres operational for water treatment systems.
4.2 Materials
The nanofibre membranes used in this chapter had a grammage of 25 g/m². Silver nitrate (5 % in water, Sigma Aldrich 00667) and sodium borohydride (99.99 %, Sigma Aldrich 480886) are purchased and used as received. Different water samples were taken for the bacterial assessment: wastewater from a hospital (AZ Glorieux, Ronse, Belgium), water from a local pond and collected rainwater.
4.3 Methods
4.3.1 Determination of some membrane characteristics
First the clean water permeability was determined as described in chapter 3. A tension testing instrument (Chatillon TCD 200) was used to examine the tensile strength of the nanofibre membrane. A specific tie rod (5 cm) was stretched at a pulling speed of 50 mm/min until rupture. The test was executed on different places and directions and in wet and dry condition of the membrane. Also the difference between the nanofibre and a commercial PA membrane (pore size 0.45 μm) and a commercial teflon membrane (pore size 0.2 μm) was evaluated. The tensile strength test was performed at 20°C.
4.3.2 Assessment for bacterial removal
Nanofibre membranes were post-functionalised by impregnation with Ag nanoparticles by reduction of silver nitrate (AgNO3). The silver nitrate was reduced by sodium borohydrite (NaBH4) in aqueous solution according to following reaction: 4 Ag + O2 + 2 H2O 4 Ag+ + 4OH-
The membrane samples were first immersed in a silver nitrate solution (0.001 – 0.01 M) and then in a sodium borohydrite solution (0.002 – 0.02 M) at 0°C which caused formation of Ag-cores at the nanofibre surface. These cores made a further growth to silver nanoparticles possible. Finally, the samples were dried at 40 °C. This process resulted in nanoparticles between 5 and 100 nm. The samples for bacterial assessment were filtered with a pressure filter (described in chapter 3). Leaching of nAg concentration was controlled by measurements with atomic emission spectroscopy (AES-ICP, Varian Vista).

52
4.3.3 Nanofibre membrane assessment in a semi-dead-end AS-MBR
Another application that was examined is the use of the nanofibre membrane in a submerged semi-dead-end AS-MBR. Therefore a fully automated lab scale MBR was built as described in chapter 3. The flux is controlled at 30 l/m2.h.bar. At a set point of 0.4 bar, back-washing with a flux of 27 l/m2h was performed. The hydraulic residence time (HRT) was 24 hours. Assessment on the overall MBR process was done by determining the removal of turbidity, COD and NH4
+ as described in chapter 3. Total suspended solids (TSS) were measured by weight of the sample after filtration over a membrane with pore sizes of 0.45 µm. TSS is expressed as mg/l (Standard Methods 2540D).
4.3.4 Cleaning of the membrane
Two cleaning techniques were performed on the nanofibre membrane. The first technique was a short cleaning, with the membrane soaked into the chemical reagent for 15 minutes. The sequence of this cleaning was an alkali treatment of the membrane, followed by a brief rinse with de-ionized water, and then acid treatment of the membrane. The alkali used is NaOCl (0.5%) the acid is HCl (0.2%) as found by Kimura et al. (2004). The second technique, proposed by Lim et al. (2003) and Kimura et al. (2004) is a chemical cleaning of the membrane by soaking the membrane into each cleaning agent for 12h. A tensile strength test (Chatillon TCD 200) was performed to control if the chemical reagents used for cleaning were not harmful for the membrane strength.
4.3.5 Nanofibre membrane in a stand-alone application
The nanofibre membrane was tested in a stand-alone application (Figure 4.1) treating wastewater originating from a music festival (Dranouter, 2007). The challenge with this wastewater treatment was that the festival only lasted 3 days and in that time the waste water treatment system should be operational (Van Hulle et al. 2008). The feed water originated from shower and wash water. The membrane surface was 0.1 m² and was used in a dead-end configuration without back-flush possibility. COD and total N were measured as described in chapter 3. Total suspended solids (TSS) was measured as explained above. Total phosphorus (P) was measured using spectrophotometric methods (EN ISO 6878).

53
Figure 4.1: nanofibre membranes used in a stand-alone application. Left: schematic set-up of the showers,
buffertank and nanofibre membrane. Right: picture of the membrane module with the nanofibre membrane.
4.4 Evaluation of the membrane characteristics
In the first experiments, some basic properties of a membrane (clean water flux and tensile strength), were tested to value its possible use in water filtration.
4.4.1 Clean Water Permeability (CWP)
The CWP was determined by measuring the flux at different TMP. The slope of the curve equals the CWP, which is 6.6x10³ l/m2h.bar for the nanofibre membrane used in this chapter. In Table 4.1 the comparison of the CWP values from commercial membranes used for microfiltration is illustrated as found in literature (Choi and Ng 2008). The values showed a very high CWP for the tested nanofibre membranes when comparing to CWP values of commercial counterparts. This high CWP indicates that nanofibre membranes could be energy saving by giving higher water fluxes at a same pressure in comparison to the commercial membranes (Thavasi et al. 2008). Results from these tests on early-stage developed nanofibre samples, were very positive and it seemed interesting to do more experiments on their use in water treatment. This chapter further explores their application in different water filtration systems.
Table 4.1: CWP–values obtained from nanofibres in this work, in comparison with commercial microfiltration
membranes from literature (Choi and Ng 2008).
Membrane type CWP (x 103 l/m2.h.bar)
polyester (PETE) 2.0
polycarbonate (PCTE) 2.6
polytetrafluoroethylene (PTFE) 2.9
nanofibre membrane (PA) 6.6

54
4.4.2 Tensile strength
A comparison in tensile strength between the nanofibre membrane, a commercial PA membrane and a commercial polytetrafluorethyleen (PTFE or Teflon) membrane was evaluated (Table 4.2). Also the tensile strength of the nanofibre membranes was measured on different places and in different directions, in wet and dry condition of the membrane (Table 4.3). Figure 4.2 shows a schematic representation of production of the nanofibres on the multi-nozzle set-up. Since the nanofibres are formed through different needles in a parallel system on a moving collector, experiments were done to look at a possible effect of this production line on tensile strength. One direction is called “lengthwise” and is the line in which the membrane is being formed (basically the direction of the arrows on Figure 4.2), the other direction is called “traverse” and is perpendicular to this production line.
Figure 4.2: Schematic representation of the multi-nozzle electrospinning set-up. The arrows indicate the
movement of the collector plate and thus show the direction in which the nanofibres are formed.
The comparison in tensile strength between the nanofibre and commercial membranes is given in Table 4.2. The results show that the strength of the nanofibre is comparable with a commercial teflon (PTFE) membrane that is used for water filter applications and that the tensile strength is better than the result found for the commercial PA membrane. Out of these results it can be concluded that the strength of the nanofibre is competitive with commercial membranes and satisfying for further water filter applications.
Table 4.2: Tensile strength of PTFE, commercial PA and nanofibre membranes (dry conditions).
Membrane Tensile strength (MPa) Stdev
PTFE 14.9 3.8
Commercial PA 2.5 0.3
PA-6 nanofibre 14.2 6.1
HV
HV

55
The results of the strength tests on different conditions and different directions of the membrane are illustrated in Table 4.3. The results showed that the strength of the membrane is independent of the direction in dry condition. When the membrane is wet, it seems to be stronger in lengthwise direction, but all the found results in different directions and different conditions are competitive in tensile strength with the tested commercial membranes. More experiments on the influence of water on tensile strength of the nanofibre membrane, were performed in chapter 9. Table 4.3: Results of the tensile strength tests on wet and dry membranes in lengthwise or traverse directions.
Condition, direction Tensile strength (MPa) Stdev
Dry, lengthwise 14.3 2.0
Dry, traverse 14.0 6.3
Wet, lengthwise 20.3 8.6
Wet, traverse 10.1 2.0
In the last chapter of this PhD-work (chapter 9), the nanofibre membranes were also tested for their tensile strength. The electrospinning set-up was continuously adapted to improve the production process, which led to a stronger membrane. For the sample in the last chapter (grammage 17 g/m²) stress at failure was found to be 28.5 MPa, whereas the initial samples as produced in this chapter (grammage 25 g/m²) had stress at failure of 14.2 MPa. These results show the important improvements of the electrospinning set-up throughout this work.
4.5 Bacterial removal by filtration
The use of the nanofibre membranes as an anti-bacterial filter was tested. In order to assess the extra removal due to the anti-bacterial functionalisation with nAg, first tests were done on filtration with non-functionalised PA-6 membranes. Different types of wastewater were used.
4.5.1 Non-functionalised PA-6 membranes
Filtration of hospital wastewater, rain water and surface water on the small filtration set-up was done with non-functionalised PA-6 membranes. The enumeration of culturable micro-organisms (37°C, 22°C) and coliform bacteria are presented in Table 4.4 and are represented as log10/100ml removal values (this is explained in chapter 3). The results from these first experiments showed that the removal of pathogens was not sufficient neither for culturable micro-organisms (1.3-1.7 log10/100ml) nor for coliform bacteria (1.4-1.6 log10/100ml) in order to be competitive with commercial microfiltration membranes. Non-functionalised commercial

56
microfiltration membranes give a 4 – 6 log10 /100ml removal (Elwell and Barbano 2006, Gómez et al. 2006).
Table 4.4: Enumeration of culturable micro-organisms and coliform bacteria without support layer. EO:
enumeration of culturable organisms EC : enumeration of coliform bacteria.
Sample Parameter Before filtration
(*108/100ml)
Bacterial removal
(log10/100ml)
Collected rain water EO 37 °C 2.0 1.6
EO 22 °C 1.0 1.3
EC 0.3 1.6
Hospital waste water EO 37 °C 3.2 1.6
EO 22 °C 2.0 1.7
EC 0.5 1.7
Pond EO 37 °C 10.0 1.4
EO 22°C 6.3 1.3
EC 0.6 1.6
These findings could be explained by the fact that the support plate of the pressurised filter module had very large pores. Because this is a non-woven membrane and in combination with the high filtration pressure this caused micro-cracks in the membrane. Therefore the experiment was repeated with a (non-selective) support layer under the non-woven nanofibre membrane. The layer has sufficiently large pores not to influence the bacterial filtration. The results of these experiments are represented in Table 4.5. The results with the support layer under the nanofibre membrane show that in presence of this support layer, a better removal could be achieved. But the removal is still not as good as found for other microfiltration studies. Three assumptions could be made for this lower removal capacity. First, it is the possibility of the presence of a small number of pores with an abnormally large size as compared to the average pore size (Gómez et al. 2006). Secondly, it could be assumed that the TMP causes a deformation of the nanofibres so that the pore size increases and bacteria leak trough the membrane. A third assumption focuses on the microorganisms’ physiological behaviour during filtration (see chapter 2). Some studies indicate that microorganisms are deformable under mechanical stress which leads to their internal volume reduction. It can be assumed that similar modifications occur during filtration due to the TMP applied on the filtration cell (Gómez et al. 2006).

57
Table 4.5: Enumeration of culturable organisms and coliform bacteria in presence of support layer. EO: enumeration of culturable organisms EC : enumeration of coliform bacteria.
Sample Parameter Before filtration
(*108/100ml)
Bacterial removal
(log10/100ml)
Collected rain water EO 37 °C 2.5 2.2
EO 22 °C 2.0 2.2
EC 0.3 3.2
Hospital waste water EO 37 °C 6.3 2.3
EO 22 °C 4.0 2.1
EC 0.5 2.1
Pond EO 37 °C 8.0 2.5
EO 22°C 6.3 2.3
EC 0.6 2.8
4.5.2 Membranes post-functionalised with silver nanoparticles.
A first test on functionalisation of nanofibres was done with silver nanoparticle (nAg) via post-functionalisation. Since nAg are anti-bacterial (as explained in chapter 2), it is expected that an enhanced bacterial removal is obtained compared to filtration with non-functionalised fibres. The bacteria are likely to get either removed by the microfiltration membrane or being destruct by contact with silver nanoparticles on the membrane. Leaching of nAg was measured in the filtrate: 7.1 µg/l silver was detected which corresponds with 2 ‰ of the original concentration implemented on the membrane. Thus it can be concluded that the nAg had a good retention on the membrane, indicating the successful application of the nAg on the nanofibre membrane. The stability of the nanofibre functionalisation was also seen for the functionalisation with WSCP in chapter 6 and TiO2 nanoparticles in chapter 7 and 8. Previous disinfection experiment was repeated with rain water and hospital wastewater on a membrane that was post-functionalised with nAg. In Figure 4.3 the comparison between a non–functionalised and nAg functionalised membrane is depicted. It shows that with filtration with the nAg functionalisation the results become competitive to non-functionalised microfiltration membranes. The bacterial removal with membranes functionalised with nAg have a much higher efficiency (3.9-4.0 log10/100ml) in comparison to the non-functionalised nanofibre membranes.

58
Figure 4.3: Removal of culturable organisms at 37°C with non-functionalised (with and without support) and
functionalised membranes with support layer.
4.6 Nanofibre membrane used in a submerged semi-dead-end MBR
Another possible application for nanofibre microfiltration membranes is their use in membrane bioreactors as a separator to filter the treated and cleaned water from the biological sludge. As such, the nanofibre membrane was applied in a MBR. The biology in the MBR was performing very well. Online registration of the dissolved oxygen showed a good bacterial activity throughout the process. Bacteria that metabolise normally, consume dissolved oxygen in the process. The mixed liquor suspended solids (MLSS) increased from 1.0 g/l to 3.9 g/l and the mixed liquor volatile suspended solids (MLVSS) enlarged from 0.6 g/l to 3.2 g/l during the 59 days operation. MBR’s are typically operated at MLSS concentrations of between 7 and 15 g/l. In this study, there was made use of MLSS of 1-4 g/l to avoid membrane rupture which was originated by delamination of the membrane. Other important parameters on the biological activity that were monitored in this study, are the removal of NH4
+, COD, TSS, NO3- and turbidity. The results are
illustrated in Table 4.6 and showed a very good removal of turbidity (99.3%), TSS (99.7%), COD (94.8%) and NH4
+(94.0%). Only total nitrogen removal (NH4+ and NO3
-) was not satisfying due to an insufficient denitrification. Several measures were taken to improve the denitrification. At first the recycle ratio of the reactor was increased which resulted in a minor enhancement. Lowering the DO in the reactor (2 - 3 mg/l) seemed not to have any influence at all.

59
Table 4.6: Removal of turbidity, TSS, COD, NH4+ and total nitrogen
Parameter Removal (%)
Turbidity 99.3
COD 94.8
NH4+ 94.0
TSS 99.7
Total nitrogen 59.8
Initial tests showed that the membrane was not strong enough to resist the pressure during filtration when TMP increased due to the fouling on the membrane. At first only a 5 day working period could be guaranteed without membrane rupture. Changes were made to increase the tensile strength of the membrane. The membrane was found to be less affected by pressure when it was thicker (the relation between membrane density and flux can be found in chapter 9). After this increase in thickness of the membrane a working period of at least 59 days was possible (until the operation was stopped) and the effluent had a good quality (Table 4.1). During this 59 days there was no membrane rupture but there were some fouling problems. The online registration of TMP and flux gave an idea of the fouling on the membrane. In Figure 4.5 this registration is illustrated during the first days of membrane operation with 3 back-wash cycles, removing the reversible fouling. After these first few days, irreversible fouling increased very fast, with a rapid decline in flux as result (see Figure 4.4).
Figure 4.4: Decay of the flux (day 1 to 7 and day 7 to 12) and cleaning phase at day 7.

60
Figure 4.5 shows the increase in TMP until the set point (0.4 bar) and the activation of the back-flush (27 l/m².h) until the TMP drops to 0 bar. The flux is controlled at 30 l/m2.h.bar. In case of membrane rupture there was no increase of the TMP. Therefore the TMP curve was a good indicator for the condition of the membrane. An earlier study showed that in case of a flat sheet membrane (Kubota) the backwashing frequency was 1/60 min (Yang et al. 2006). In the case of the nanofibre membrane presented here this frequency was 2/60 min due to the high fouling on the membrane (Figure 4.5).
Figure 4.5: Registration of TMP(bar) and flux(l/m
2.h) with regular back-flush at the set point (0.4 bar)
Although this back-flush with permeate removed the reversible fouling, a persistent yellow layer could not be removed. This irreversible fouling caused a swift decay of the membrane flux after only 7 days (Figure 4.4) and was clearly visible in the SEM pictures taken after 14 days of operation. This “layered” fouling (Figure 4.6) of electrospun nanofibres was also observed by Aussawasathien et al. (2008). Pressure-changes on the nanofibre membrane causes deformation of the pores. This was already seen in the section in this chapter on the bacterial filtration: with supportive membrane a higher bacterial removal was obtained due to the pores that were less deformed. Consequentially opening and closing of the pores can cause “layered” clogging of electrospun nanofibres (Aussawasathien et al. 2008). Minimization of this fouling requires further research on operational conditions and membrane optimization. This will be done in chapter 5.

61
Figure 4.6: Origin of layered fouling. A: original nanofibre membrane. B: nanofibre membrane when the pores could open under filtration pressure if no supportive layer is used on the permeate side of the membrane.
Fouling particles can enter easily and are trapped inside the nanofibrous structure if the pores close (adapted to Bilad et al. (2011b)).
4.7 Cleaning of the membrane
As explained in chapter 2, cleaning the membrane with demineralised water is not sufficient to restore the flux at original level since this only removes the reversible part of fouling. Irreversible membrane fouling needs to be cleaned by use of chemicals (Kimura et al. 2004, Lim and Bai 2003). In Figure 4.7 the effect of different cleaning strategies on the removal of fouling is demonstrated by SEM pictures. Two cleaning methods were used: 30 min 0.5% NaOCl and 30 min 0,2% HCl and secondly 12 hours 0.5% NaOCl and 12 hours 0.2% HCl. In chapter 2 there is described how manufacturers use 2 hours of soaking in chemicals. Even with the chemical cleaning procedure, the original flux could not be restored and after the cleaning phase the same decay of the flux could be observed (Figure 4.4). Further membrane development and additional measures such as membrane performance enhancement products (www.nalco.com) urge to be used and will be tested and discussed in next chapter 5. It can be seen that even for long term cleaning only the fouling on the surface of the membrane can be removed. The fouling that is caused by depth filtration remains in the membrane. This is the so-called “layered” fouling. The foulants are trapped in the nanofibrous structure by opening and closing of the pores by pressure changes during backwash of the membrane. To make sure that the chemical reagents used for the cleaning of the membrane, were not harmful for the membrane, a novel tensile strength test was done in this study after the cleaning procedure. The original tensile strength was 13 MPa, after cleaning it was 11 MPa. The results of the strength test on the membrane showed that the strength of the membrane is only slightly effected by the used chemicals.
A
B

62
Figure 4.7 Influence of the cleaning procedure on irreversible fouling. a: before cleaning; b: after cleaning with
30 min 0.5% NaOCl and 30 min 0,2% HCl; c: after cleaning with 12 hours 0.5% NaOCl and 12 hours 0.2% HCl
4.8 Stand-alone application
The nanofibre membrane was tested in a stand-alone application. A visual result of the cleaning can be found in Figure 4.8. It can be concluded that the use of these nanofibre filter materials was satisfactory when looking at the results found in Table 4.7. The discharge limits were met by applying the nanofibre membrane. Although at the end of the operation (after 2 days), fouling occurred since back-flush in this membrane module was not possible. Comparing the obtained results with Xu et al. (2008) with polysulfone nanofibres, reveals that with the nanofibre membrane a higher suspended solids removal (100% vs. 87%) although a lower COD removal (50% vs. 71%) is obtained. Table 4.7: Resulting effluent concentrations when a nanofibre membrane was used as stand-alone application
Parameter Influent (mg/l) Effluent (mg/l) Discharge limit (mg/l)
TSS 84 0 35
COD 202 102 125
Total P 1.3 1.4 2.0
Total N 9.0 5.5 15.0
Figure 4.8: Picture of the shower wastewater before (left) and after filtration (right).
A B C
63
4.9 Conclusions
In this chapter a feasibility study was done towards the applicability of nanofibres in water filtration including their use in an MBR set-up, disinfection and a stand-alone application. At the start of the present research project, the use of nanofibres in water filtration was a very new and attractive topic yet with very little knowledge towards the actual possibilities and applications of the nanofibres for water filtration. The results from this study were promising for further testing but revealed however some operating challenges. The results are very informative for possible adaptations to the electrospinning process in next chapters in order to obtain the best suited nanofibre structures for use in water treatment. The clean water flux for the nanofibre membranes was exceptionally high compared to commercial microfiltration membranes. The values were more than 3 times higher for the nanofibre membranes. Future tests (chapter 9) on further improved nanofibres will show values that are about 10 times higher. Tensile strength tests showed the nanofibre membranes to be competitive to their commercial counterparts. Removal of bacteria by filtration was not satisfactory in case of non-functionalised membranes. This could be explained by the fact that the TMP causes changes in the non-woven membrane structure which leads to the enlargement of the pores and allows bacteria to pass the membrane. The electrospin process will be enhanced for production of more homogenous membrane samples since the occurrence of large pores (not visible to the eye) could be an explanation for the leakage of bacteria. This is discussed in chapter 3 and throughout this work. Filtration after functionalisation with nAg gave a 4 log10/100ml removal, which is a 2 log10/100ml extra removal compared to filtration with non-functionalised membranes. This result shows the added effect of the functionalisation. Leakage of the silver nanoparticles did not occur. Both results showed a successful functionalisation possibility of the nanofibre membranes. The anti-bacterial activity of Ag+ ions is larger for Gram-negative bacteria (such as E. coli) than for Gram-positive bacteria (such as S. aureus), which implies that the use of other anti-bacterial agents which affect both bacterial species, could give enhanced bacterial removal compared to the functionalisation with nAg. This will be done in chapter 5 (with biocides, including WSCP) and in chapter 8 (nTiO2). The use of the nanofibre membrane in a submerged MBR showed that irreversible fouling causes a rapid decay of the flux. Chemical cleaning on the nanofibre membrane was possible but did not restore the flux to the original value. The membrane fouling was found to be “layered” in the membrane. Further research on operational conditions and membrane optimization should be a focus in next experiments. Also the use of membrane performance enhancers are tested in next chapter 5. The application of nanofibre membranes in the MBR gave some problems with membrane rupture. The electrospinning process was hereafter optimised and

64
the application of nanofibre membranes in MBR was further investigated and discussed in next chapter. Overall the results were promising to further investigate the use of nanofibre membranes as high flux water filters.

5
The use of electrospun flat sheet nanofibre
membranes in MBR applications In previous chapter a feasibility study was done for the use of nanofibres in water filtration in general. The follow-up experiments in this chapter have a deeper focus on their use in MBR systems. Membrane rupture was found to be a working point as well as the layered fouling. As such some adaptations were made on the membrane module to support the thin nanofibre membrane and some experiments were done to minimize the fouling on the membrane by decreasing the sludge load in the reactor. This was obtained by making use of a membrane performance enhancer and a trickling filter in the semi-dead-end MBR pilot which was already used in previous chapter. Also the use of the nanofibre membrane in a cross-flow MBR pilot was investigated and compared to the other MBR configurations and literature. Results of this chapter are published in: Daels, N., De Vrieze, S., Decostere, B., Dejans, P., Dumoulin, A., De Clerck, K., Westbroek, P. and Van Hulle, S.W.H. (2010) The use of electrospun flat sheet nanofibre membranes in MBR applications. Desalination 257(1–3), 170-176.

66
5.1 Introduction
The membrane bioreactor is considered as one of the most promising processes for water treatment and re-use with many advantages over the conventional systems. Membrane bioreactors produce effluent of high quality that could be discharged and have a smaller footprint than conventional systems (Crittenden et al. 2012b). However, membrane fouling is the main limitation for the widespread application. Many studies focusing on the methods for fouling control have been performed (Le-Clech et al. 2006b), as fouling reduces the filtration performance and thus increasing operating costs. Some studies try to adjust physical parameters (e.g. air scouring) or operational parameters (e.g. periodical backwashing, sub-critical flux operation, lower HRT). As an alternative strategy to avoid SMP and EPS to foul the membrane, membrane performance enhancers could be used (Iversen et al. 2008). When a cationic polymer is added to a solution, it adsorbs onto microbial flocs causing the surface charge change from dominantly negative to neutral. Due to attraction by charge neutralization, larger flocs are formed (Lee et al. 2007). An optimal dosage amount is important as deflocculation can occur when the cationic polymer is added in excess of the optimum concentration due to the surface charge that could be reversed to positive, by an electrostatic repulsion mechanism and some substances may be re-released to the bulk solution (Meng et al. 2009). Koseoglu et al. (2008) obtained a fouling reduction of 96% by usage of MPE50 (a membrane performance enhancer from Nalco Company, Illinois), allowing for an increase of 46% in the critical flux. When testing the long-term effects of MPE50, Yoon et al. (2005) found that the filtration time increased from 22 to more than 30 days with a 50% higher average flux. This study aims at assessing the possible use for nanofibrous nonwovens in two different membrane bioreactors (a semi-dead-end and a cross-flow MBR) in different set-ups (by use of a membrane performance enhancer and a trickling filter). First the application of a flat sheet nanofibre membrane in the semi-dead-end MBR described in chapter 4 was tested in a “classic” membrane bioreactor with activated sludge (AS-MBR), the effect of dosing polymer (MPE50) was studied and a trickling filter MBR (TF-MBR) was used. This TF-MBR is a configuration that can be seen as an alternative strategy to reduce membrane fouling under low loading rates (Leiknes and Ødegaard 2007). Secondly the use of the nanofibre membrane in a cross-flow MBR pilot was tested.
5.2 Materials
The membranes used in this study, had a grammage of 25 g/m². MPE50 was kindly delivered by Nalco (www.nalco.com). The lava rocks used in the TF-MBR had a diameter between 16 and 32 mm. The synthetic influent was described in chapter 3.

67
5.3 Methods
5.3.1 Semi-dead-end MBR
The schematic representation and picture of this set-up can be found in chapter 3.
5.3.1.1 Adaptations on the semi-dead-end membrane module since previous
chapter
Previous chapter indicated some problems with membrane rupture thus a novel membrane module was developed. At first, a steel grid with mesh size 1x1 cm² (Figure 5.1) was used in the AS-MBR (with and without MPE50). When using the TF-MBR this membrane module was adapted. The steel grid as used with the AS-MBR is believed to avoid membrane rupture, but was not supportive enough to avoid the layered fouling. Layered fouling originates due to entrapping foulants in the pores due to pressure changes causing movement of the membrane. Consequentially opening and closing of the pores can cause this “layered” clogging. By giving a good support to the nanofibre membrane, the movement of the membrane will reduce, avoiding pores to open and close and thus decreasing the layered fouling. The influence of membrane movement on the nanofibre pores was also described in previous chapter in the bacterial filtration experiment. When no supportive membrane was used, the bacteria leaked through the membrane pores probably due to the high pressure which caused deformation of the membrane and thus affected pore sizes. This leakage decreased and filtration efficiency improved by using a membrane support, resulting in a better bacterial removal. The grid was replaced and the nanofibre membrane was sandwiched between two non-woven polymer pre-filters with smaller pores than previous supportive layer, but with a bigger pore size (1x1mm) than the nanofibre membranes.
Figure 5.1: Nanofibre membrane between two supportive grids.

68
5.3.1.2 Different semi-dead-end configurations
At first, the membrane was operated in a conventional semi-dead-end AS-MBR. This was done at a constant flux of 27 l/(m².h), which is comparable to the flux of 30 l/(m².h) in previous chapter 4. The HRT was 12 hours. A maximum TMP decrease of 0.3 - 0.4 bar was allowed, after which the membrane was backwashed for 10 minutes at a flux of 40 l/(m².h). The nanofibre membrane was tested in the AS-MBR set-up for 59 days. Secondly, since still too much fouling occurred, experiments were done with addition of a membrane performance enhancer in previously described AS-MBR configuration. As such MPE50 was added in the anoxic zone of the reactor. The optimum dosage of MPE50 was found to be 500 mg/l by Iversen et al. (2008) and was applied as such for 22 days. Thirdly, at the first compartment of the MBR set-up, lava rock was added as support material for biomass. This configuration is called a trickling filter MBR (TF-MBR). The study with this TF-MBR configuration was continued for 86 days. The effluent flux was determined on a daily basis by measuring the flow rate through the membrane for all configurations.
5.3.2 Cross-flow MBR
A second lab-scale MBR was developed in a cross-flow configuration (as described in chapter 3). The nanofibre membrane was tested in this cross-flow module. Unfortunately, delamination of the nanofibre membrane occurred by the tangential water flow across the surface of the filter, the typical characteristic of a cross-flow filtration. This delamination caused membrane rupture. As to give the membrane extra support, it was enforced by a supportive layer on top of the membrane. This feed spacer caused too much fouling issues, a thick cake layer was formed between the nanofibre and the feed spacer, making it impossible to use the nanofibre membrane in this activated sludge cross-flow MBR configuration. At last, a trickling filter was embedded in the cross-flow pilot. The cross-flow TF-MBR set-up was continued for 20 days. On a daily basis the effluent flux was determined by measuring the flow rate through the membrane.
5.4 Nanofibre membrane used in a semi-dead-end MBR
At first, the new membrane module with supportive layers was tested in the activated sludge MBR (AS-MBR). This enhanced the use of the membrane without frequent membrane rupture as appeared in previous chapter. Since still too much fouling occurred, the effect of dosing polymer (MPE50) was studied and a trickling filter membrane bioreactor (TF-MBR) was tested.
5.4.1 Behaviour of the membrane at constant flux operation
When the nanofibre membrane was used as a semi-dead-end flat sheet filter in an AS-MBR, the membrane rapidly fouled. The curve in Figure 5.2 shows the increase in TMP until the set point (0.3 - 0.4 bar) and the activation of the back flushing

69
mechanism. The flux was controlled at 27 l/m2.h.bar by increasing the pump flow rate at increasing TMP. An earlier study on MBR systems by Bonnélye et al. (2008) showed that in case of a flat sheet membrane (Kubota) the backwash frequency was 1/60 min. In this AS-MBR with the nanofibre membrane, the backwash frequency was 2/60 min due to the high fouling on the membrane. When using a nanofibre membrane in a TF-MBR set-up, the backwash frequency was decreasing to 1/60 min, which is a comparable frequency to literature , due to less turbidity after the trickling filter.
Figure 5.2: change in TMP, comparing the AS-MBR and TF-MBR in the semi-dead-end configuration
5.4.2 Removal efficiency
The removal of contaminants from the synthetic influent by the MBR is compared between the different semi-dead-end configurations. No measurements on removal efficiency were done in the cross-flow configuration. The ability for removal of contaminants is a measure for the effectiveness of the bacterial sludge by monitoring the effluent quality on COD, NH4
+ and total nitrogen removal. By measuring effluent turbidity, the membrane effectiveness could be tested. The MBR configuration which had the best overall removal efficiency is the AS-MBR. The results (given in Figure 5.3) showed a very good removal of turbidity (99%), TSS (99%), COD (94%) and NH4
+(93%), compared to literature (Chang et al. 2001, Chiemchaisri et al. 1993, Henze et al. 2008, Hoinkis et al. 2012, Wen et al. 2004). Only the removal of total nitrogen (NH4
+ and NO3-) was not satisfying due to an
incomplete denitrification. As such the total nitrogen removal in the MBR was lower than the results found in literature (Yang et al. 2006). In the TF-MBR, a better removal of total nitrogen (67%) was obtained and removal of turbidity (95%) and COD (92%) were comparable. However, NH4+ removal was

70
significantly lower (76%) probably due to the unsatisfactory diffusion of air through the trickling filter. As for the AS-MBR with MPE50, the overall results on treating the synthetic influent, were lower than obtained with the other two semi-dead-end configurations and literature, probably because MPE50 inhibited bacterial activity. This is in contrast to what was found by Yoon et al. (2005) who demonstrated that there is no biotoxic effect for MPE50 by measuring the oxygen uptake rate of the sludge, even for concentrations as high as 5000 mg MPE50/l. A possible explanation could be that the MLSS used in this study (3 – 4 g/l) is 3 times lower than the sludge used in the study of Yoon et al. (2005) (MLSS of 12 g/l). A toxic effect could have occurred because of this higher concentration per volume of biomass.
Figure 5.3: Removal efficiency comparing the different semi-dead-end MBR set-ups with minimum and
maximum values as found in literature (Chang et al. 2001, Chiemchaisri et al. 1993, Henze et al. 2008, Hoinkis et al. 2012, Wen et al. 2004).
Measurements on turbidity removal in between the different parts of the TF-MBR was done by sampling before the trickling filter (the original synthetic influent), between the trickling filter and the membrane and a third sampling was done after the membrane in the effluent. Figure 5.4 shows that 21.7% of the turbidity is removed by the trickling filter, while 78.3% is removed by the nanofibre membrane.
Figure 5.4: Removal of turbidity by the trickling filter and nanofibre membrane in the semi-dead-end TF-MBR.

71
5.5 Membrane flux in the cross-flow MBR compared to the semi-
dead-end MBR
Next to the continuous operation and monitoring, the effluent flux was determined on a daily basis by operating the membrane for 60 min without backwashing and measuring the flow rate through the membrane manually. In Figure 5.5 this membrane flux is presented. As explained in the “methods” section of this chapter, also a cross-flow pilot membrane reactor was developed and used in a trickling-filter set-up. The flux was compared between the semi-dead-end configurations as described in previous section (semi-dead-end AS-MBR and semi-dead-end TF-MBR) and this novel configuration: cross-flow TF-MBR.
5.5.1 Activated sludge MBR in a semi-dead-end configuration
The AS-MBR was least performing for the flux measurements: the flux dropped from its initial value 21 l/m².h to 3 l/m².h in 7 days. As described before, back-flush was done 2 times in 60 min but this only removes reversible fouling. In order to remove irreversible fouling a sequential chemical cleaning (Aussawasathien et al. 2008) but the original flux could not be restored (see Figure 5.5). When adding MPE50, the initial flux increased almost 31% to 29 l/m².h compared to the AS-MBR without MPE50. This effect however was short-term since the flux decreased very fast to 9 l/m².h in 7 days. This flux after 7 days is 66% higher than the flux in the AS-MBR after the same period but still not good enough to be competitive. Both previously described AS-MBR configurations used the nanofibre membrane in a module with a steel grid as supportive layer with very large pores was placed behind the membrane to avoid membrane rupture. Because the pores of the membrane open when back-washing the membrane, fouling particles are captured as the pores closed again, and as such these particles get entrapped in the membrane pores. Two main things were adapted: the membrane was sandwiched between two very porous layers and the activated sludge was replaced by a trickling filter (which served as a pre-filter).
5.5.2 Trickling filter MBR in a semi-dead-end and cross-flow
configuration
Both the semi-dead-end TF-MBR and cross-flow TF-MBR are discussed below. For the semi-dead-end MBRs the most stable and highest flux was obtained in the TF-MBR, keeping the flux at 40 l/m².h for at least 22 days. This configuration is a good option for the nanofibre membrane, which works best under low loading rates. For the use in both the semi-dead-end TF-MBR and the cross-flow TF-MBR, a supportive layer was placed before and after the nanofibre membrane (as described

72
in the “methods”-section in this chapter). As such the membrane pores could not open and less fouling could occur in the membrane. This was an important improvement for the membrane module configuration which causes the nanofibre membrane to work in the semi-dead-end TF-MBR for more than 80 days to work without flux decline. As expected the flux increased when a trickling filter was used. The trickling filter removed more than 75% of the turbidity and acted therefore as a pre-filter. As such the flux stabilized at 40 l/m².h during the experiment (Figure 5.5). The cross-flow TF-MBR was expected to act better than the semi-dead-end configuration because the high sheer rates in cross-flow module could slow down the membrane fouling process. However due to the delamination of the membrane (and thus membrane rupture) it was not possible to operate at high sheer rates thus membrane fouling occurred. Also the necessary supportive feed-spacer above the nanofibre membrane (to avoid excessive membrane delamination), caused extra fouling problems since the fouling particles got stuck between this feed spacer and the nanofibre membrane, while the tangential flow of the cross-flow module could not remove these particles. There was no backflush opportunity in the cross-flow module used in this study. As such, this fouling could not be removed.
Figure 5.5: Fluxes obtained for the different MBR configurations.
Since membrane fouling was found in the porous structure of the membrane, it is seems recommended to make use of nanofibre membranes as thin as possible by applying them on a supportive material. For this study, membranes with a high grammage (25 g/m²) (and thus “thicker” membranes) were used since this was

73
necessary to give them enough strength to avoid membrane rupture. At the beginning of this PhD-work, there was few knowledge about electrospinning on supportive material. Most of the experiments were still in small lab-scale environments where delamination could not occur. As such research effort should be conducted towards such supported nanofibres. It is also important to work with membranes as thin as possible for microfiltration. Thinner membranes will get more easily cleaned by backflushing while entrapment of the foulants in the porous layers of the filter, will decrease. It is necessary to make some improvements on the electrospinning set-up that allow thin membranes to be free of rupture.
5.6 Conclusions
The use of a nanofibre membrane in an MBR was investigated. The membrane was tested in a semi-dead-end and a cross-flow MBR, in an activated sludge and trickling filter set-up. The application in an activated sludge MBR showed that irreversible fouling caused a too fast flux decay to be competitive with the currently applied membranes. The experiments however revealed an important improvement when a trickling filter was introduced instead of the activated sludge. The trickling filter served as a pre-filter and causing lower sludge load as influent for the nanofibre membrane. When using the membrane in the trickling-filter semi-dead-end configuration, it needed backwashing as frequent as found in literature (1/60 min), which is a good result and the flux remained stable for 80 days while being higher than previous configurations (40 l/m².h). Also the removal efficiency was acceptable. The operation of this trickling filter in the cross-flow MBR did not give the expected results since high flux operation was not possible due to delamination and membrane rupture. This membrane delamination was solved by adding a feed spacer on top of the membrane, but this feed spacer increased membrane fouling. Out of the experiments done in this chapter, it can be concluded that for nanofibre membranes, semi-dead-end modules are more suited than cross-flow modules to avoid delamination problems. The membranes however were adapted as described in chapter 3. By making them more homogenous it is expected that delamination will occur less frequent although this was not further tested in this work. This chapter also sets out that membrane support is necessary for optimal filtration performance. Further optimization of the nanofibre production process such as electrospinning on a supportive layer, is necessary but was not further investigated in this PhD work, because other applications such as bacterial and organic matter removal appeared to be more promising. A supportive layer is necessary since this reduces the layered fouling which originates from the opening and closing of pores, causing the foulants to get trapped in the nanofibre non-woven structure.

74
This chapter showed that nanofibre flat sheet membranes can be applied for filtration of low loaded streams. Applications with high sludge concentrations are not the target for this material. Nanofibre membranes have very high fluxes which are useful to treat large volumes of water for example as pre-treatment for process and cooling water, as protection for RO membranes (Bonnélye et al. 2008) or bacterial filtration are possible applications. Since fouling occurs in all filtration systems, it is still important to look at materials to enhance the anti-fouling properties of the membrane for example by surface modification with functionalised membranes. This will be done in chapter 7 and 8 with nTiO2 functionalised membranes. In next chapter, experiments are done on the enhanced effect of biocidal functional agents in the nanofibres for bacterial filtration and disinfection.

6
Potential of a functionalised nanofibre
microfiltration membrane as an
antibacterial filter This chapter focuses on the added value of incorporating biocides to nanofibre microfiltration membranes in view of bacterial removal during process water filtration. Different functional biocidal agents (bronopol, WSCP, DBNPA,...) were evaluated in disinfection experiments performed on hospital wastewater and inoculated bacterial solutions. Results of this chapter are published in: Daels, N., De Vrieze, S., Sampers, I., Decostere, B., Westbroek, P., Dumoulin, A., Dejans, P., De Clerck, K. and Van Hulle, S.W.H. (2011) Potential of a functionalised nanofibre microfiltration membrane as an antibacterial water filter. Desalination 275(1–3), 285-290.
76
6.1 Introduction
A widely used method to inactivate pathogenic micro-organisms in water and wastewater and for preventing waterborne infectious diseases throughout the world is the use of oxidative biocides such as chlorine (Crittenden et al. 2012a). However, some studies reported that the effectiveness of the process is reduced by turbidity, suspended solids and the presence of nitrogen compounds such as ammonia and nitrite (Lazarova et al. 1999). The use of chlorine in water treatment gives rise to undesirable by-products suspected to pose a hazard to humans and the environment (e.g. trihalomethanes and haloacetic acids) (Li et al. 2008). Alternatives for chlorine could be for example dosing of biocides in the water, but their harmful residuals then could also occur in the effluent. Immobilisation of biocides omits their presence in the effluent or the need for separation in a subsequent process (Kobayakawa et al. 1998). Nanofibre membranes functionalised with a biocide electrospun into the fibres, could be used as a cost-effective alternative for chlorine. Also the functionalised membranes could find a use as anti-biofouling membranes (Bai et al. 2012, Ma et al. 2010). Zodrow et al. (2009) found that polysulfone ultrafiltration membranes impregnated with silver nanoparticles were not only antimicrobial, but also prevented bacteria to attach to the membrane surface whereby biofilm formation was consequentially reduced. The applied biocides (WSCP, DBNPA, TCMTB, nAg and bronopol) act with different mechanisms for disinfection. According to Shrivastava et al. (2007), the antibacterial property of silver nanoparticles result from bacterial cell lysis. Silver is an electrophylic agent, similar to bronopol. Silver nanoparticles are currently implemented in a wide variety of consumer products for antimicrobial control (Choi et al. 2008). DBNPA is an oxidation agent, and works directly via radical-mediated reactions to oxidize organic compounds (Chapman 2003). Quaternary ammonium compounds, such as WSCP are most effective against algae and bacteria in alkaline pH ranges because of their cationic surface activity and was described more in detail in chapter 2. Their cationic charge forms an electrostatic bond with the negatively charged sites on a bacterial cell wall. This causes stress, leading to cell lysis and death. The quaternary ammonium salts also cause denaturation of proteins, by deforming the permeability of the cell wall and reducing the normal flow of critical nutrients into the cell which leads to cell death (Melo et al. 1988). Quaternary ammonium compounds such as WSCP are the primary non-oxidising biocides (Crittenden et al. 2012a) and are mostly applied directly into the water. WSCP has an effect on both Gram-positive and Gram-negative bacteria, in contrast to silver nanoparticles that have only effect on Gram-negative bacteria (Chen et al. 2008, Sondi and Salopek-Sondi 2004). Hydrophilicity of the membrane surface is known to affect the antimicrobial properties. In this study, the nanofibre membranes are hydrophylic due to the used polyamide polymer (PA-6) (contact angle <118°). Hydrophilic surfaces provide intimate contact with the aqueous bacteria suspension thus providing more killing power (Sun and Sun 2002).

77
In this chapter, electrospinning of nanofibres was performed with several functionalising agents that are soluble in the spinning solution. As such the main goal of this study was to assess the short term and long term disinfection performance of functionalised nanofibre membranes.
6.2 Material and methods
6.2.1 Membrane production
Nanofibre membranes were produced and inline functionalised as described in chapter 3. The membranes were inline functionalised with Ag nanoparticles (nAg), WSCP, DBNPA, TCMTB and bronopol. The nAg solution in isopropanol (HAG78) was kindly provided by Umicore. TCMTB, DBNPA, Bronopol and WSCP were provided by Buckman. Silver nanoparticles were inserted in the polymeric solution in ratios of 1 and 3 wt% and stirred for four hours. WSCP, DBNPA, TCMTB and bronopol were inserted in the spinning solution at concentrations of 1, 3 or 5 wt% and stirred for four hours. The nanofibres had a grammage of 25 g/m².
6.2.2 Disinfection experiments
Primarily filtration tests were performed on the different functionalised membranes with hospital wastewater (AZ Glorieux, Belgium) with an initial concentration of 108 CFU/100 ml. Non-functionalised, WSCP, DBNPA and 1 wt% nAg were tested in triplicate. Other samples were tested once. The best performing biocide was chosen for further testing on larger filtration volumes (0.350 and 0.650 l) with a S. aureus inoculated bacterial solution. Antibacterial properties by contact with the functionalised nanofibre membranes was studied using a modified version of AATCC (2004) in a sandwich method. The S. aureus working culture was diluted to obtain an inoculum of approximately 108 CFU/100 ml after which 1 ml bacterial suspension was put onto the functionalised nanofibre membrane. The surface was then carefully covered with another identical membrane in a sterilised glass jar. To ensure sufficient contact, a sterilized flat bottom bottle was put on top of the membrane surface. After 0.5, 1 and 2 hours of contact time, 0.02 N sodium thiosulfate was added in excess to quench the biological interaction. The mixture solution was then vortexed for 2 minutes. The test was done in triplicate. Bacteria count was performed as described in chapter 3. In order to circumvent pore blocking caused by the nutrient broth in which the bacteria were grown, the membrane was rinsed with demineralised water (instead of the nutrient broth bacterial solution) for this long-term experiment. After rinsing, 100 ml of inoculated bacterial solution was filtered. The test was performed with E. coli and with S.aureus as examples of Gram-negative and Gram-positive bacteria respectively.
78
6.2.3 Leaching experiment
Leaching of WSCP from the nanofibre membrane by filtering demineralised water, was determined by measuring conductivity (Consort C830), and by measuring the concentration of quaternary ammonium compounds (QAC). QAC were measured spectrophotometrically by aid of QAC-tests (Method 8336) supplied by Hach Lange (www.hach-lange.com). Ten batches of 100 ml and one batch of 2 l demineralised water were consecutively filtered by a functionalised nanofibre membrane. Each batch was analysed for conductivity and WSCP. The test was repeated 4 times. The resulting concentration of these tests was expressed as cetyl-trimethyl-ammonium-bromide (CTAB). The conversion factor for CTAB to WSCP is 2.8:1, meaning that a concentration of 2.8 mg CTAB/l equals a concentration of 1 mg WSCP/l.
6.3 Primary (short-term) tests on disinfection by filtration of hospital
wastewater
The first step was a filtration experiment on the different functionalised membranes with hospital wastewater. As such, the best performing biocide could be chosen for further testing on larger filtration volumes. As a reference, the hospital wastewater (108 CFU/100 ml) was filtered on non-functionalised PA-6 membranes. The results of the enumeration of culturable micro-organisms (37°C) are demonstrated in Figure 6.1, a 2.2 log10/100ml or a 99.37% removal was found after filtration with a non-functionalised PA-6, which is comparable to the results in chapter 4, where a 2.3 log10/100ml removal was found for the hospital wastewater. Both tests were performed with identical membranes but on a different sampling date. This filtration test on non-functionalised PA-6 was repeated with a S. aureus inoculated bacterial solution, resulting in a 1.6 log10/100ml removal (results not shown) which is still a lower result than expected. Cultivable organisms are not likely to pass with the nanofibre membrane with a mean pore size of 0.20-0.45 µm yet no complete removal was obtained. These results are in accordance with literature on bacterial filtration with microfiltration membranes. According to Kobayashi et al. (1998) and Leblue et al. (2009), bacteria larger than the nominal pore size of the filter can leak through the membrane. A possible explanation could be the appearance of abnormal larger pores in the membranes surface. But also the role of the cell properties such as their membrane surface or the mechanical stiffness of the cell has been questioned by several authors. This passing of bacteria through a microfiltration membrane with significantly smaller pores is also illustrated by Suchecka et al. (2003) but the mechanism needs more research. Important factors are the osmotic pressure, cell membrane/polymeric membrane interaction and cell membrane characteristics. Leblue et al. (2009) found that an increase of trans-membrane pressure had a negative effect on the removal of bacteria resulting in an
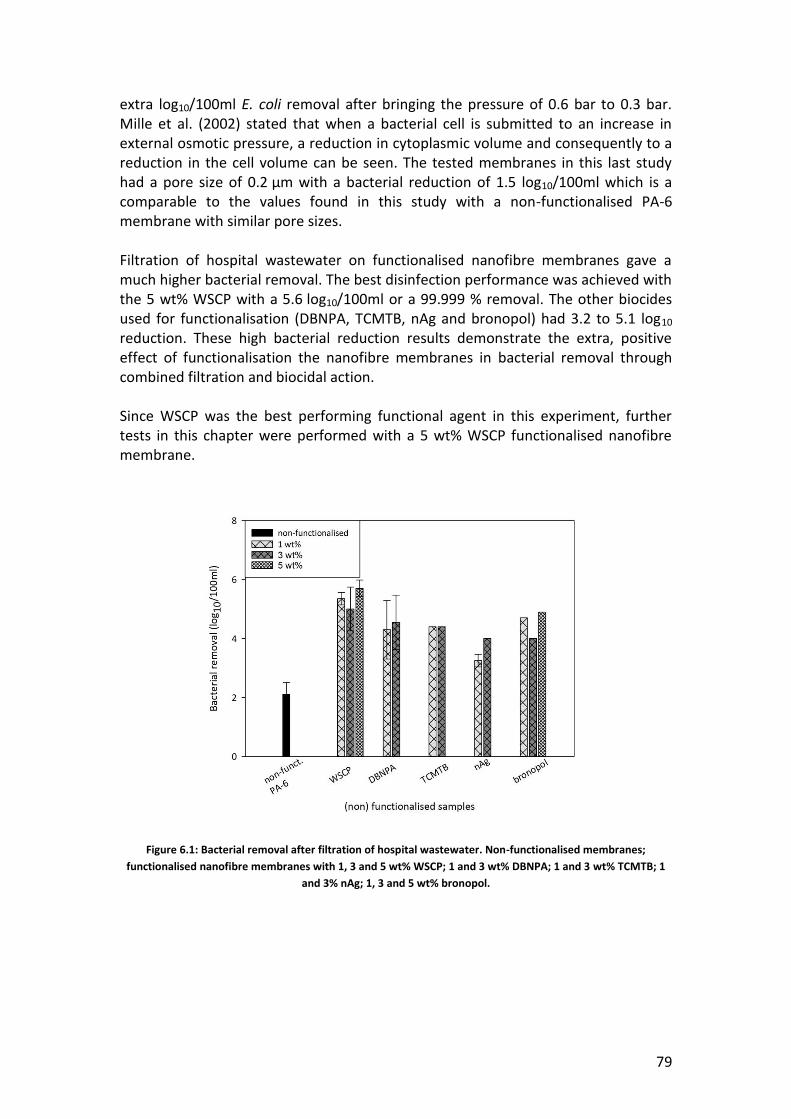
79
extra log10/100ml E. coli removal after bringing the pressure of 0.6 bar to 0.3 bar. Mille et al. (2002) stated that when a bacterial cell is submitted to an increase in external osmotic pressure, a reduction in cytoplasmic volume and consequently to a reduction in the cell volume can be seen. The tested membranes in this last study had a pore size of 0.2 µm with a bacterial reduction of 1.5 log10/100ml which is a comparable to the values found in this study with a non-functionalised PA-6 membrane with similar pore sizes. Filtration of hospital wastewater on functionalised nanofibre membranes gave a much higher bacterial removal. The best disinfection performance was achieved with the 5 wt% WSCP with a 5.6 log10/100ml or a 99.999 % removal. The other biocides used for functionalisation (DBNPA, TCMTB, nAg and bronopol) had 3.2 to 5.1 log10 reduction. These high bacterial reduction results demonstrate the extra, positive effect of functionalisation the nanofibre membranes in bacterial removal through combined filtration and biocidal action. Since WSCP was the best performing functional agent in this experiment, further tests in this chapter were performed with a 5 wt% WSCP functionalised nanofibre membrane.
Figure 6.1: Bacterial removal after filtration of hospital wastewater. Non-functionalised membranes;
functionalised nanofibre membranes with 1, 3 and 5 wt% WSCP; 1 and 3 wt% DBNPA; 1 and 3 wt% TCMTB; 1
and 3% nAg; 1, 3 and 5 wt% bronopol.

80
6.4 Short, mid- and long-term experiments on WSCP inline
functionalised membranes
Out of previous tests, WSCP was chosen as best performing functionalising agent. A 5 wt% functionalisation was applied for further testing. First the leaching of the WSCP was measured in order to examine its stability. To have more feeling with which bacteria are removed from the solution, filtration tests with S. aureus and E. coli inoculated medium were executed. First S.aureus was removed in short-term and contact experiments with 5 wt% WSCP functionalised membranes. Afterwards long-term performance of the 5 wt% WSCP functionalised membranes was evaluated with filtration of S. aureus and E. coli.
6.4.1 Measurements on leaching of WSCP
Leaching of WSCP from the nanofibre membrane was tested by filtration of demineralised water. The results of this test are expressed as CTAB and then converted to the concentration of WSCP. Figure 6.2 shows a peak in the first 100 ml of filtered water with a maximum of 5.4 mg/l CTAB but decreases after further filtration. After filtration of 2 l, the leached concentration is below 0.02 mg/l CTAB which is the detection limit. The area under the curve in Figure 6.2 gives the total amount of WSCP leached out of the membrane. The membrane contained 5 wt% WSCP and had a mass of 114.9 mg. This equals 114.9 x 0.05 = 5.8 mg WSCP present on the membrane. During the first 2 l, 0.3 mg WSCP leached or 5.1% leached during the first 2 l of filtration which means that more than 90% of the WSCP is retained on the membrane. Chapter 3 examined post-functionalisation of the nanofibres with silver nanoparticles. The leaching of this functionalisation was found to be 0.2 %. The leaching found is this study is initially higher, but as next sections will show, it does not alter the long-term stability of the bacterial disinfection results.

81
Figure 6.2: Leaching of WSCP after filtration of 2 l demineralised water.
6.4.2 Short-term experiments with S. aureus
In a first short-term experiment, small volumes (< 1 l) of the inoculated solution were filtered. Also contact experiments were done to distinguish between the removal by biocidal contact and by filtration.
6.4.2.1 Filtration with WSCP inline functionalised membranes
In the short-term filtration experiments, 0.350 and 0.650 l of S. aureus inoculated solution was filtered. These volumes were chosen in accordance with previous experiment showing the maximum leaching occurring before 0.200 l. Because of the high viscosity of the nutrient broth medium this filtration was going rather slow, reducing the volume of nutrient broth that could be filtered. As a reference to assess the performance of a WSCP functionalised membrane, the filtration with S. aureus was also performed on a non-functionalised PA-6 membrane. This filtration of S. aureus with the non-functionalised PA-6 membrane resulted in a 2.1-3.1 log10/100ml removal (Figure 6.3) which is comparable to the results obtained on disinfection of hospital wastewater. Figure 6.3 demonstrates that the 5 wt% WSCP functionalised membrane gives only a very small reduction of 6.2 to 6.3 log10/100ml. Despite the 10% leaching of WSCP during the filtration of the first filtered volumes (with a peak of leached WSCP between 0 and 0.200 l filtered, Figure 6.2), the bacterial removal after filtration of 0.650 l inoculated water (S aureus) remains stable, illustrating that enough WSCP is

82
left in the membrane to have disinfection results after this first 0.200l. These results give a statistically significant (p<0,05) higher removal than the non-functionalised samples. In order to be sure this bacterial reduction is stable, long term experiments were conducted in a next filtration experiment.
Figure 6.3: Bacterial removal after filtration of inoculated solution (S. aureus) with a non-functionalised PA-6
and a 5 wt% WSCP functionalised nanofibre membrane.
6.4.2.2 Disinfection by contact with WSCP inline functionalised membranes
Disinfection by contact was tested on S. aureus by having one ml of the bacterial solution sandwiched between two 5 wt% WSCP inline functionalised nanofibre membranes. No significant differences were found in Figure 6.4 between the diverse contact times. A bacterial removal of 2 log10/100ml was observed for all contact times. These results are in contradiction with other studies (Liu and Sun 2008, Tan and Obendorf 2007) where an increasing bacterial removal with increasing contact time was observed. Research done on a functionalised electrospun polycarbonate membrane functionalised with quaternary ammonium compounds by Kim et al. (2007), gave a 1.1 log10/100ml after one hour of contact time with S. aureus and 3.0 log10/100ml for E. coli. Considering that at first the bacterial removal with a non-functionalised membrane was 2 log10/100ml due to filtration efficiency and secondly the bacterial removal by contact with a functionalised membrane 2 log10/100ml due to the biocidal effect of WSCP, this results in a total bacterial removal of 4 to 5 log10/100ml by combination of filtration and contact with a WSCP functionalised membrane as was observed in these experiments.

83
Figure 6.4: Removal of S. aureus by contact with a 5 wt% WSCP inline functionalised membrane.
6.4.3 Long-term filtration experiments
In order to assess the filtration efficiency of the functionalised membranes for longer use of the filter, the nanofibre membranes were pre-rinsed with demineralised water (0.500 and 25 l), preventing the membrane getting fouled by the nutrient broth which has a rather high viscosity. After this rinsing, 0.100 l inoculated nutrient broth (S. aureus and E. coli in separate experiments) was filtered. In Figure 6.5, S. aureus shows a higher bacterial removal (5.8 log10/100ml ) then E. coli (4.0 log10/100ml). In the study from Lebleu et al. (2009), S. aureus also had a 2 log10/100ml removal better removal than E. coli. In our study a similar difference in both bacterial removal is seen. Lebleu et al. (2009) stated that the role of the cell-wall structure is important in the retention of bacteria in microfiltration membranes. Gram-positive bacteria have a thicker peptidoglycan layer and are in this way less deformable and so better rejected than Gram-negative ones, while Onyango et al. (2010) found that also the both shape of the bacterium was a contributing factor to the observed filterability. E. coli is a rod-shaped bacteria while S. aureus is a spherical shaped, suggesting it to be more suitable in penetrating through small pores. These results show the stability of the enhanced effect of the functionalisation. The stability of the bacterial removal after 25 l filtered was also illustrated by the small percentage leaching that was found in the leaching experiments during the first two litres.

84
Figure 6.5: results of long term tests after rinsing a 5 wt% WSCP functionalised nanofibre membrane with 0.5 l
and 25 l demineralised water before the inoculated volume (0.5 l) was filtered.
6.5 Conclusions
Different biocidal agents were tested for functionalisation of the nanofibre membrane in view of bacterial filtration. Short term experiments conducted on filtration with hospital wastewater (initial concentration 108 CFU/100 ml) showed that 5 wt% WSCP functionalisation was best performing and that a 5.2 log10/100ml or a 99.99% bacterial removal is possible. As a reference the filtration experiment was performed on a non-functionalised PA-6 nanofibre membrane which had a 2.2 log10/100ml or a 99.37% bacterial removal which shows the enhanced anti-bacterial effect that is possible with the WSCP functionalised filter. Without filtration, the bacterial removal (only) due to contact with a biocidal functionalised membrane resulted in a 2 log10/100ml due to the biocidal effect of WSCP. Leaching experiments showed a 10% leaching of WSCP during the first 2 litres filtered. This leaching however did not alter the long-term stability of the membrane. The bacterial removal is maintained after rinsing with 25 l of demineralised water, showing a 5.8 log10/100ml and a 4.0 log10/100ml removal after filtration with S. aureus and E. coli respectively with a WSCP functionalised membrane. These long term filtration tests showed the stability of the functionalised nanofibre membranes. This chapter demonstrated the potential of electrospun nanofibre membranes for water filtration and disinfection with WSCP as case study. In general, this shows the ability for nanofibre membranes to get extra functionality on top of the high-flux filtration possibilities. This opens new research opportunities towards additional functionalities of filtration with nanofibre membranes. Research

85
can be done on other functional agents than the antibacterial ones tested in order to obtain better filtration properties (such as anti-fouling activity) or immobilisation techniques for dedicated streams (such as removal of pollutants or adsorption of heavy metals). Next chapters will focus on nanofibre functionalisation with TiO2 nanoparticles in view of organic matter degradation and bacterial destruction.


87
7 Functionalisation of electrospun polymer
nanofibre membranes with TiO2 nanoparticles in view of dissolved organic
matter photodegradation Previous chapters showed the successful incorporation of biocides on the electrospun membranes, providing an anti-microbial effect. Titanium dioxide (TiO2) has been the focus of numerous studies in recent years since they have the ability of degrading natural organic matters and destruction of bacterial cells. When illuminated with UV, TiO2 nanoparticles produce reactive oxygen species (ROS) such as peroxide, hydroxyl radicals and hydroperoxyl radicals through reductive or oxidative reactions which makes it interesting for use in membranes in view of organic matter degradation and anti-fouling perspectives. This chapter focuses on different methods for the incorporation of TiO2 nanoparticles in the nanofibre membranes thereby looking at the effects on physical characteristics, optimisation of TiO2 nanoparticle concentration and the photodegrading efficiency. The ability of nanofibres functionalised with TiO2 nanoparticles to photodegrade dissolved organic matter was assessed with methylene blue as a test compound. Results of this chapter are published in: Daels, N., Radoicic, M., Radetic, M., Van Hulle, S.W.H. and De Clerck, K. (2014) Functionalisation of electrospun polymer nanofibre membranes with TiO2 nanoparticles in view of dissolved organic matter photodegradation. Separation and Purification Technology 133, 282-290.

88
7.1 Introduction
The TiO2 nanoparticles are known for their great availability, non-toxicity, stability, low cost and efficiency (Linsebigler et al. 1995) as was already described in chapter 2. The exposure of TiO2 nanoparticles to UV light with an energy that matches or exceeds their band gap energy leads to an excitation of electrons from the valence band to the conduction band, leaving holes in the valence band. The electrons react with molecular oxygen molecules in acidic medium producing superoxide radical anions while the holes react with water to produce hydroxyl radicals. These two reactive species can decompose organic materials (Fujishima and Honda 1972, Tachikawa and Majima 2009). Different studies found the improved functionality of simultaneous photocatalytic degradation and filtration when high reactive photocatalysts such as TiO2 are immobilised on the membranes (Albu et al. 2007, Ma et al. 2010, Zhang et al. 2008b, Zhang et al. 2009). Immobilisation of TiO2 in a photoreactor also omits the need for photocatalyst separation in a subsequent process (Kobayakawa et al. 1998). The electrospinning technique enables the incorporation of inorganic nanoparticles into a polymer matrix (Barakat et al. 2010). The longer the TiO2-particles are illuminated with UV light, the more organic material can be decomposed (Fujishima et al. 2000). In literature an illumination time of 30 minutes to 6 hours is commonly used (He et al. 2009, Kasanen et al. 2011, Mihailović et al. 2011, Mihailović et al. 2010, Pant et al. 2013). Generally, nano-sized TiO2 unveils greater photocatalytic bactericidal properties than bulk material (Rincón and Pulgarin 2003). It was reported that TiO2 nanoparticles with an average diameter of 20 nm will attach to the surface of the cell wall and destroy the cell membrane, whereas smaller particles (<20 nm) can penetrate the interior of bacterial cells (Desai and Kowshik 2009, Prasad et al. 2009), giving a complete bacterial destruction. Also, smaller particles have more specific surface area for binding with the nanofibres for immobilization of the particles and have a greater potential for reaction with the pollutants. Results of Lin et al. (2006) showed that the smaller the particle size (29 nm – 3.8 nm), the faster the degradation rate. This can be attributed in part to the large specific surface area of smaller particles. Also Rajh et al. (2002 ) and Zhang et al. (1998) found that nanocrystalline TiO2 with particle sizes smaller than 11 nm exposed higher reactivity than those with 21 nm sized TiO2 in photocatalytic decomposition. In this chapter colloidal TiO2 nanoparticles with an average dimension of 6 nm prepared by Mihailovic et al. (2010) were immobilized on nanofibre membranes. Mihailovic et al. (2010) tested such 6 nm colloidal TiO2 particles that were immobilized on conventional polyester fabrics (PES) with thicker fibres (30 µm). They revealed the possibility of methylene blue removal for PES fabrics functionalized with the 6 nm TiO2 nanoparticles, however illumination with UV for times as long as 24h were needed to achieve complete dye removal. Nanofibres have a smaller fibre diameter and a higher specific surface area and are therefore expected to provide a higher efficiency when immobilizing TiO2 nanoparticles than what is possible on

89
conventional fibres and hence will be tested in this chapter on their methylene blue removal after functionalization with 6 nm TiO2. Also via the electrospinning process it is possible to add inline functionalization, which was not possible on the PES fibres in the study of Mihailovic et al. (2010). Since experiments found in literature have been carried out under different conditions and parameter settings (different types of TiO2 (Rincón and Pulgarin 2003), pH, temperature (Lakshmi et al. 1995), light source/power (He et al. 2009, Pant et al. 2013, Uddin et al. 2007)), a comparison with data obtained in literature is difficult for the colloidal TiO2 nanoparticles. For this reason it is chosen to simultaneously look at the performance of the commercial available Degussa P25 TiO2 nanoparticles which are commonly used as a reference (Markowska-Szczupak et al. 2011). Most studies found in literature (Kasanen et al. 2011, Mihailović et al. 2010, Uddin et al. 2007) do not make a comparison and make conclusions based on their own results in specific research conditions and by using only one type of TiO2. However since crystalline structure and size of the nanoparticles as well as the functionalisation method play an important role in available surface for the reaction of the TiO2 oxidation process (He et al. 2009), it is important to perform tests under the same conditions allowing a good comparison. Therefore in this chapter two techniques of functionalisation with two types of TiO2 nanoparticles have been tested simultaneously and under the same conditions, allowing to assess the performance of the manufactured colloidal TiO2 and comparing their performance to the commercially available 21 nm Degussa P25 for their use in nanofibre functionalisation. The photocatalytic performance of the functionalised nanofibre membranes was evaluated by degrading methylene blue under UV irradiation. In the ISO certified method for the determination of photocatalytic activity of surfaces in an aqueous medium (ISO:10678 2010), methylene blue is suggested as test chemical. Since methylene blue has been used in different researches as a model compound for removing organic contaminants and dyes (He et al. 2009, Kasanen et al. 2011, Lučić et al. 2014, Mihailović et al. 2010, Pant et al. 2011, Pant et al. 2013, Uddin et al. 2007) it has become a reference for photocatalytic activity in water treatment. The degradation pathway of methylene blue in aqueous solutions include intermediate products, in general aromatic components, for which sequential hydroxylations resulted in the opening of the aromatic ring. A detailed reaction mechanism could be found in Houas et al. (2001). Hence the ultimate aim of this chapter is to demonstrate the ability of nanofibres functionalised with TiO2 nanoparticles to photodegrade dissolved organic matter, with methylene blue as a test compound.

90
7.2 Material and Methods
7.2.1 Production of the functionalised nanofibres
Two methods of functionalisation are being used in this chapter. The TiO2 nanoparticles will occur throughout the matrix of the nanofibre material when the TiO2 is added to the spinning solution. Functionalisation after the spinning process, such as dip-coating, will result in the presence of TiO2 on the surface of the nanofibres. Functionalisation with nTiO2 was carried out using two different types of TiO2: a colloidal suspension that was used as received by the University of Belgrade, and commercially available Degussa P25. The colloid solution supplied by the University of Belgrade consisting of TiO2 nanoparticles was prepared by acidic hydrolysis of TiCl4 in a manner analogous to the one proposed by Rajh at al. (1996). The solution of TiCl4 cooled down to -20 °C was added drop-wise to cooled water (at 4 °C) under vigorous stirring and then kept at this temperature for 30 min. The pH of the solution was between 0 and 1, depending on TiCl4 concentration. Slow growth of the particles was achieved by dialysis against water at 4°C until the pH of the solution reached 3.5. The concentration of colloid was determined from the concentration of the peroxide complex obtained after dissolving the particles in concentrated sulphuric acid (Thompson 1984). In order to enhance the crystallinity and overall efficiency of generated TiO2 nanoparticles the colloid was thermally treated in reflux at 60 °C for 16 h. The synthesized colloid comprises of faceted, single crystalline, anatase TiO2 nanoparticles with an average size of 6 nm (Mihailović et al. 2010) and are further denoted as “colloidal TiO2 nanoparticles”. Degussa P25 (Aldrich Co., USA), a standard material in the field of photocatalytic reactions, is a TiO2 nanopowder containing anatase and rutile phases in a ratio of about 3:1 (Ohno et al. 2001) with a molecular weight of 79.87 g/mol, specific surface area 35-65 m2/g and average particle size of 21 nm. Degussa P25 was used as a commercial available reference system (Markowska-Szczupak et al. 2011). Moreover its application allowed preparation of suspensions with higher concentration of TiO2 nanoparticles then possible with our 0.12 M colloidal TiO2 nanoparticles. In this study Degussa P25 TiO2 nanoparticles were used in an aqueous suspension of 0.12 M and 0.50 M. These nanoparticles are further denoted as “commercial TiO2 nanoparticles”. Inline functionalised nanofibres were obtained by adding a colloid/suspension of TiO2 nanoparticles to the PA-6 solution prior to the electrospinning process. Five different colloid/suspension volumes were added in the electrospun solution as to find the optimal dose for the two types of TiO2 nanoparticles (6 nm colloidal and 21 nm commercial TiO2). For the commercial TiO2 nanoparticles it was possible to use both 0.12 and 0.50 M stock-solution, the colloidal TiO2 nanoparticles allowed only for a 0.12 M colloid stock-solution since higher concentrations during synthesis are not yet possible. The colloids/suspensions were gently stirred with a magnetic stirrer for 10 minutes at room temperature after which the electrospinning process was immediately started.

91
Post-functionalisation was accomplished by dipping the electrospun nanofibre membranes in the 0.12 M colloidal TiO2 nanoparticles suspension or the 0.50 M commercial TiO2 nanoparticles suspension (ratio of membrane mass (mg) to liquor volume (ml) was 1:400) for 5 min. Subsequently the membranes were dried at room temperature (24h). After 30 min of curing at 100°C, the samples were rinsed twice (5 min) with deionized water and again dried at room temperature (24h).
7.2.2 Experiments on membrane properties
First membranes produced via single nozzle electrospinning were used for screening to determine the optimum concentration of TiO2 nanoparticles. After this screening, the tests were repeated on the multi-nozzle set-up with the selected concentrations on membranes with a density of 10 g/m². Prior to electrospinning the viscosity and conductivity of the electrospinning solutions were examined. The morphology of the electrospun nanofibres was examined using a scanning electron microscope. The CWP was measured on the functionalized membranes and compared to the non-functionalized membrane. Previous work was done on non-functionalised membranes. This CWP test was performed to have an idea on a possible change in CWP due to a potential modification in morphology or pore structure as a result of the functionalisation techniques. The CWP was thus measured on the functionalised membranes and compared to the non-functionalised membrane. The membranes used in this chapter, were further developed since previous chapters allowing for production of thinner membranes, which resulted in higher CWP values than earlier described.
7.2.3 Photodegradation experiments
Photocatalytic activity of the functionalised nanofibres was assessed by photodegradation of methylene blue under UV irradiation by measuring the absorbance at 663 nm wavelength on a UV–vis spectrophotometer (UV-Vis spectrophotometer Shimadzu UV-1601). The experiment is described more in detail in chapter 3. Identical colloidal nTiO2 particles were previously tested by Mihailovic et al. (2010) on functionalised PES fibres. To obtain a correct comparison between the functionalised PES fibres (diameter 30 µm) and nanofibres (diameter 160 nm) used in this study, exactly the same method for evaluation of the photocatalytic activity of the TiO2 functionalised fibres, was used. Stability of the fibres was evaluated by immerging the non-functionalised and TiO2 nanoparticles functionalised multi-nozzle membranes in distilled water during 20 days. After this period, photocatalytic activity was tested on these membranes and the results on removal of methylene blue were compared to the results obtained with new membranes to see whether leaching of TiO2 nanoparticles had occurred indicating the performance of the membrane after a longer period of tests.

92
7.3 Physical characterization
SEM images of non-functionalised membranes are shown in Figure 7.1, nanofibre membranes inline functionalised with TiO2 nanoparticles are shown in Figure 7.2, demonstrating that steady state electrospinning of inline functionalisation with TiO2 nanoparticles is possible and results in the formation of uniform nanofibre membranes with a fibre diameter of 158 ± 18 nm and 162 ± 36 nm for 0.07 wt% colloidal TiO2 nanoparticles and 0.30 wt% commercial TiO2 nanoparticles respectively. These values are within the standard deviation of the diameters of a non-functionalised PA-6 membrane (166 ± 23 nm).
Figure 7.1: SEM image non- functionalised membranes (a), (b) enlarged image
Figure 7.2: SEM images of inline functionalised membranes with (a) 0.07 wt% colloidal TiO2 nanoparticles, (b)
enlarged image, (c) 0.30 wt% commercial TiO2 nanoparticles, (d) enlarged image

93
Non-functionalised PA-6 membranes (grammage 10 g/m2) obtained a clean water flux of 24x103 l/m2.h.bar (Table 7.1). Inline functionalised membranes show a minor decrease in flux to 21x103 l/m².h.bar proving that inline functionalisation does not alter the membrane morphology significantly. Note that these fluxes are significantly higher than the fluxes measured in chapter 4 which were 6.6x10³ l/m2.h.bar (grammage 25 g/m2). The production of the nanofibre membranes used in this chapter were adapted since previous chapters (the modification of the electrospinning set-up is described in chapter 2: material and methods), allowing for thinner membranes, which lead to higher CWP values. This illustrates the large improvements that can be obtained through optimization of this novel process and results in a positive characteristic towards use in water filtration. In contrast to this, the post-functionalisation process reduces the CWP of the membrane. This is most explicit for the commercial TiO2 particles resulting in a reduction of CWP to 50% of the original value obtained for non-functionalised PA-6 nanofibre membranes. This is attributed to an agglomeration of the nanoparticles and obstruction of the pores, which can be seen in Figure 7.3 and Table 7.1. Figure 7.3 shows no pore blocking when colloidal TiO2 nanoparticles are used for post-functionalisation resulting in a considerable high flux of 15x103 l/m².h.bar. Although this is also a post-functionalised membrane the decrease in CWP when comparing them to non-functionalised PA-6, is smaller than when it is functionalised with commercial TiO2 particles. A visual comparison between the membranes in Figure 7.3 learns that this decrease in flux most likely does not originate from pore blocking and is possibly due to the variation in pore structure owed to the treatment needed for dipcoating as consecutive wetting and drying of nanofibres seemed to alter the physical properties (this will be discussed later in chapter 9).
Figure 7.3: SEM images of post-functionalised membranes with (a) 0.12 M colloidal TiO2 nanoparticles, (b)
enlarged image, (c) 0.50 M commercial TiO2 nanoparticles, (d) enlarged image

94
Table 7.1: Clean water permeability of different functionalised membranes produced on the multi-nozzle set-up (density 10 g/m²).
Membrane CWP (x103 l/m2.h.bar)
Non-functionalised PA-6 24 ± 1,1
Inline functionalised with 0.07 wt% colloidal TiO2 nanoparticles 21 ± 1,3
Inline functionalised with 0.30 wt% commercial TiO2 nanoparticles 21 ± 1,4
Post-functionalised with colloidal 0.12 M TiO2 nanoparticles 15 ± 1,9
Post-functionalised with commercial 0.50 M TiO2 nanoparticles 10 ± 1,6
7.4 Methylene blue removal with membranes produced on a single
nozzle set-up
The photocatalytic ability of nanofibres functionalised with TiO2 nanoparticles was investigated through photocatalytic degradation of a methylene blue solution under UV irradiation. First the two functionalisation techniques were carried out on electrospun nanofibre membranes produced on a single nozzle set-up. The best performing membranes were then produced on a larger scale with a multi-nozzle set-up.
7.4.1 Inline functionalised membranes
Increased concentrations of TiO2 nanoparticles, inline functionalised on the single nozzle electrospin set-up, were determined for their phtocatalytic ability. The addition of 0.12 M colloidal TiO2 nanoparticles, 0.12 M commercial TiO2 nanoparticles and 0.50 M commercial TiO2 nanoparticles in different volumes to the electrospin solution prior to the electrospin process is looked at, resulting in different wt% TiO2
nanoparticles in the spinning solution as indicated in Figure 7.4.
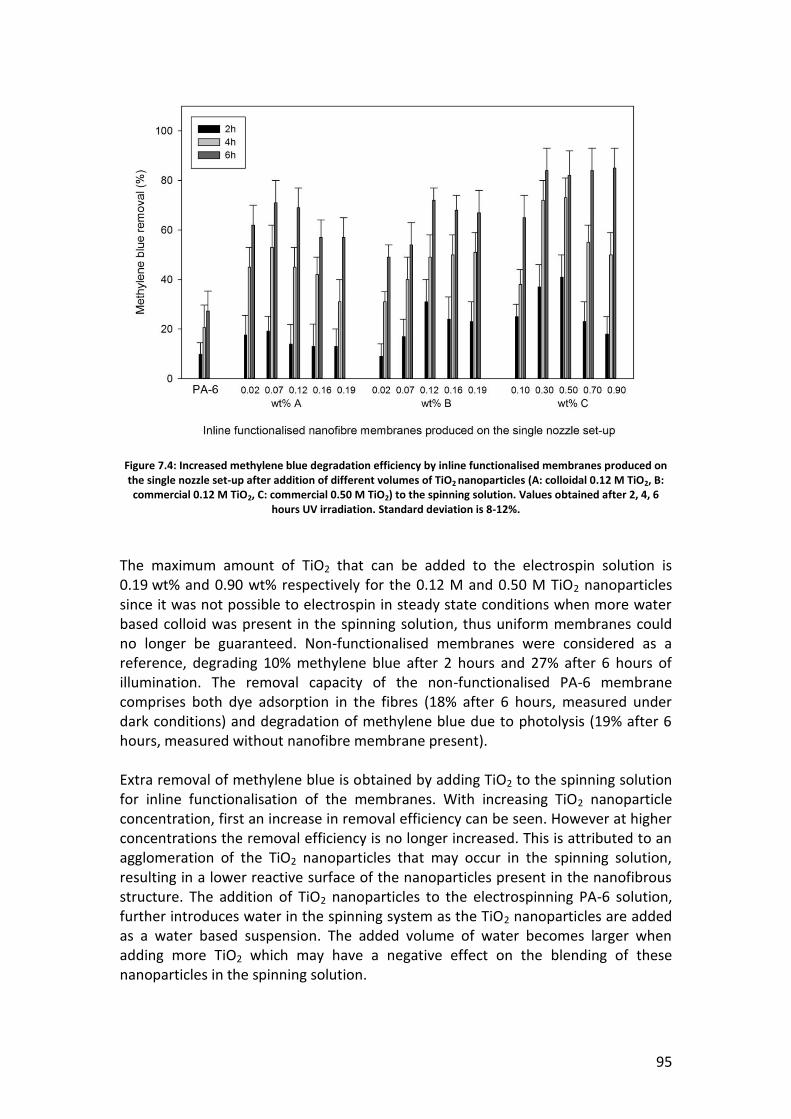
95
Figure 7.4: Increased methylene blue degradation efficiency by inline functionalised membranes produced on the single nozzle set-up after addition of different volumes of TiO2 nanoparticles (A: colloidal 0.12 M TiO2, B: commercial 0.12 M TiO2, C: commercial 0.50 M TiO2) to the spinning solution. Values obtained after 2, 4, 6
hours UV irradiation. Standard deviation is 8-12%.
The maximum amount of TiO2 that can be added to the electrospin solution is 0.19 wt% and 0.90 wt% respectively for the 0.12 M and 0.50 M TiO2 nanoparticles since it was not possible to electrospin in steady state conditions when more water based colloid was present in the spinning solution, thus uniform membranes could no longer be guaranteed. Non-functionalised membranes were considered as a reference, degrading 10% methylene blue after 2 hours and 27% after 6 hours of illumination. The removal capacity of the non-functionalised PA-6 membrane comprises both dye adsorption in the fibres (18% after 6 hours, measured under dark conditions) and degradation of methylene blue due to photolysis (19% after 6 hours, measured without nanofibre membrane present). Extra removal of methylene blue is obtained by adding TiO2 to the spinning solution for inline functionalisation of the membranes. With increasing TiO2 nanoparticle concentration, first an increase in removal efficiency can be seen. However at higher concentrations the removal efficiency is no longer increased. This is attributed to an agglomeration of the TiO2 nanoparticles that may occur in the spinning solution, resulting in a lower reactive surface of the nanoparticles present in the nanofibrous structure. The addition of TiO2 nanoparticles to the electrospinning PA-6 solution, further introduces water in the spinning system as the TiO2 nanoparticles are added as a water based suspension. The added volume of water becomes larger when adding more TiO2 which may have a negative effect on the blending of these nanoparticles in the spinning solution.

96
Comparing colloidal and commercial TiO2 nanoparticles using them in the same concentration (0.12 M) it can be observed that an overall better activity is obtained when using the smaller, 6 nm colloidal TiO2 nanoparticles when used with a lower concentration TiO2. A 0.07 wt% colloidal TiO2 is degrading 19% of methylene blue after 2 hours and 71% after 6 hours of illumination. This is faster and higher than what is obtained with the commercial TiO2 nanoparticles, both used in the same concentration of 0.12 M. The greatest degradation of methylene blue is found when using a 0.30 wt% of the commercial TiO2 in the highest possible concentration for this suspension (0.50 M). This 0.30 wt% commercial TiO2 membrane removes 37% after 2 hours of UV illumination and 84% after 6 hours of illumination. As such, a 0.07 wt% of colloidal 0.12 M TiO2 and a 0.30 wt% of a commercial 0.50 M TiO2 suspension were selected as the optimal concentrations for the inline functionalisation method. These concentrations will be applied to the multi-nozzle set-up as discussed below.
7.4.2 Post-functionalised membranes
In Figure 7.5 the removal of methylene blue with post-functionalised nanofibres is presented. Again the non-functionalised PA-6 membrane was considered as a reference membrane for which the results are described in 7.4.2. Both post-functionalised membranes degrade almost 100% methylene blue after 6 hours of illumination. Post-functionalised membranes with colloidal 0.12 M TiO2 nanoparticles are degrading the methylene blue faster than membranes with commercial 0.50 M TiO2. Respectively a 82% and 56% removal is obtained after 2 hours of illumination. Despite their lower concentration, the smaller 6 nm colloidal TiO2 nanoparticles have a higher performance.
Figure 7.5: Increased methylene blue degradation efficiency by post-functionalised membranes produced on
the single nozzle set-up with two types of TiO2 nanoparticles. Values obtained after 2, 4 and 6 hours UV illumination.

97
7.5 Effect of membrane density on removal of methylene blue
A characteristic of membranes produced on the single nozzle set-up is the variation in thickness as a thicker center and a thinner outer part are obtained. The multi-nozzle set-up allows for a more even thickness and a thickness modification. Therefore it permits for a study of membrane density on the removal of methylene blue. This is illustrated in Figure 7.6 for non-functionalised membranes. The thinner the membrane, the more removal is observed. The fibres in thin membranes are more accessible to the methylene blue solution possibly causing a higher dye adsorption on the fibres resulting in already a higher dye removal for the non-functionalised membranes. Since membranes in water filtration are preferred to be as thin as possible, the membrane with a density of 10 g/m² is chosen as a reference membrane for the results on methylene blue removal for further tests with membranes produced on the multi-nozzle set-up.
Figure 7.6: influence of membrane density on methylene blue removal on non-functionalised PA-6 membranes
after 2, 4 and 6 hours of UV irradiation.

98
7.6 Methylene blue removal with membranes produced on a multi-
nozzle set-up: post- and inline functionalisation
In Figure 7.7 the removal of methylene blue with post-functionalised nanofibres is presented. Non-functionalised membranes were considered as a reference, degrading 21% methylene blue after 2 hours and 78% after 6 hours of UV irradiation. The removal capacity of the non-functionalised PA-6 membrane comprises both dye adsorption in the fibres (34% after 6 hours, measured under dark conditions) and degradation of methylene blue due to the solar light simulating source (19% after 6 hours, measured without nanofibre membrane present).
Figure 7.7: Increased methylene blue degradation efficiency by inline and post-functionalised membranes produced on the multi-nozzle set-up with two types of TiO2 nanoparticles. Values obtained after 2, 4 and 6
hours of UV irradiation.
All functionalised membranes performed better than the non-functionalised membrane with a removal of methylene blue higher than 90%. To distinguish between the different types of functionalisation, focus will be given on the removal after 2 hours. Overall post-functionalised membranes with colloidal TiO2
nanoparticles had the best performance with 84% removal of methylene blue after 2 hours. Post-functionalised membranes have a faster methylene blue removal than inline functionalised membranes which is in line with literature (Pant et al. 2011). Post-functionalisation of the membranes results in a higher specific surface area available for photocatalytic activity. Removal efficiency for inline functionalised membranes is highest for the 0.30 wt% commercial TiO2 particles (61% after 2 hours of irradiation). It is possible to add commercial TiO2 nanoparticles in higher concentrations to the spinning solution prior to the electrospin process, resulting in higher removal efficiencies than for the 0.07 wt% colloidal TiO2.

99
When using the TiO2 nanoparticles as post-functionalising agents the colloidal finer particles are degrading the methylene blue faster than commercial coarser ones which can be attributed to the larger available specific surface area of the particles. This is in line with literature suggesting a higher efficiency can be obtained with smaller particles (Comparelli et al. 2005, Curri et al. 2003, Mascolo et al. 2007). As mentioned before it is an important characteristic of these smaller colloidal TiO2 nanoparticles that they do not cause any pore blocking when adding it as a post-functional agent and thus resulting in high water fluxes making them favorable as best-performing post-functionalising agents. Finally the stability of the photocatalytic behavior was tested by submerging the membranes in distilled water for 20 days. The overall activity loss measured after 6 hours of illumination was smaller than the standard deviation. Leaching tests were performed, but the TiO2 nanoparticle concentrations were lower than the detection limit indicating a stable functionalisation of the TiO2 nanoparticles. In previous chapters, leaching of nAg (0.2%) and WSCP (10%) was done. The experiment on WSCP showed that leaching occurred during filtration of the first 0.2l and did not alter the long-term stability of this functionalisation.
7.7 Comparison with literature
In this research it is possible to compare the effect of different functionalisation methods and sizes of TiO2 nanoparticles on methylene blue removal. In this way conclusions can be made on the effectiveness of the membrane functionalisation methods. In Table 7.2 these results are compared with literature although comparison is not always straightforward as not all studies were performed under the same conditions. Keeping this in mind it is possible to say that the results obtained for the post-functionalisation with the colloid nanoparticles in this research are in line with the research of He et al. (2009) and better in degradation efficiency than other researches on immobilizing TiO2 nanoparticles. Identical conditions and the same colloidal particles are used as in the study of Mihailovic et al. (2010), making a comparison between conventional and nanofibres possible. Nanofibres offer a much larger specific surface area then conventional fibres, adding more functionality to the same surface resulting in a faster degradation of methylene blue.

100
Table 7.2: Comparative study on methylene blue removal found in literature for membranes inline or post- functionalised with TiO2 after 2 hours irradiation with UV.
Fibres UV lamp source power Functionalisation method Size and type of TiO2 Degradation of methylene blue (%) Reference
/
18 mg/l TiO2 powder 21 nm P25 48 He et al. (2009)
HDPE disk with PU layer 100 W no / 28 Kasanen et al. (2011) post-functionalisation 21 nm P25 48 Conventional fibres 15 W no / 12 Mihailovic et al. (2010)
post-functionalisation 6 nm anatase 22
Conventional fibres 50 mW/cm² no / 3 Uddin et al. (2007) post-functionalisation 3-5 nm 42 Nanofibres 2x15 W no / 23 He et al. (2009)
post-functionalisation 10 nm anatase 88
Nanofibres 15 W no / 6 Pant et al. (2013)
post-functionalisation 21 nm P25 49
inline functionalisation 21 nm P25 32
Nanofibres 15W no / 26 This present study post-functionalisation 6 nm anatase 84 inline functionalisation 21 nm P25 61

7.8 Conclusions
The TiO2 functionalised nanofibre membranes were prepared via electrospinning on a single nozzle electrospin set-up by adding two types of TiO2 nanoparticles (21 nm commercial Degussa P25 TiO2 nanoparticles and colloidal 6 nm TiO2 nanoparticles synthesised by acidic hydrolysis of TiCl4) at different concentrations to the PA-6 prior to the spinning solution or by post-functionalising the electrospun membranes with TiO2 nanoparticles. Both methods improved the degradation of methylene blue under UV irradiation although the post-functionalisation with colloidal TiO2 nanoparticles showed the best photocatalytic activity. Up scaling from the single nozzle electrospin set-up to a multi-nozzle allows larger uniform membrane surfaces with controllable thickness and clean water fluxes ranging from 15x103 l/m2.h.bar for membranes post-functionalised with 6 nm colloidal TiO2 nanoparticles to 21x103 l/m2.h.bar for inline functionalised membranes. This is 5 - 7 times higher than conventional microfiltration systems. This chapter shows a clear influence of membrane density on methylene blue dye adsorption and thus the interpretation of methylene blue removal and it’s comparison with literature. The degradation results of methylene blue show that TiO2 nanofibres have good photocatalytic degradation abilities, degrading up to 84% of methylene blue after 2 hours of illumination with UV irradiation for the post-functionalised membranes with colloidal TiO2. The performed tests with methylene blue as a model compound revealed that dissolved organic matter photodegradation is possible. The membranes can now be tested in more lifelike conditions such as waste water treatment plant effluent (in view of water discharge and re-use) in next chapter.

102

103
8 Electrospun nanofibre membranes
functionalised with TiO2 nanoparticles: evaluation of humic acid and bacterial removal
Since experiments in previous chapter on methylene blue degradation with nTiO2 functionalised nanofibres gave positive results, this chapter further focuses on the removal of dissolved organic matter: humic acids were tested as appearing in WWTP effluent as well as commercially available humic acids. Also the bactericidal effect of the nTiO2 functionalised nanofibre membranes was examined. Both contaminants can be indicators for the anti-fouling ability of the membranes and give information on their efficiency to remove dissolved organic matter in general. Also the possibility of using (functionalised) nanofibre membranes for effluent filtration in view of water reuse, was examined. Daels, N., Radoicic, M., Radetic, M., Van Hulle, S.W.H. and De Clerck, K. Electrospun nanofibre membranes functionalised with TiO2 nanoparticles: evaluation of humic acid and bacterial removal. In preparation.

104
8.1 Introduction
Secondary effluent of a wastewater treatment plant (WWTP) is often discharged into surface waters, while there is an increased interest in water reuse. As these effluents cannot be reused without further treatment, numerous studies on advanced treatment of secondary effluent are initiated. Humic acids represent a major fraction of natural organic matter in WWTP effluent and consist of a complex mixture of macromolecular organic matter which is derived from the decomposition of plant and animal materials (Stevenson 1994). These recalcitrant moieties cannot be removed by biological treatment and introduce problems in further water treatment methods such as membrane filtration and disinfection processes. Humic acids are not hazardous for humans but reactions with halogen-based disinfecting agents (e.g. sodium hypochlorite) can form disinfection by-products (Cho and Choi 2002) which are mutagenic and carcinogenic (Richardson 1998). Humic acids are also a major contributor to the fouling of (micro)filtration processes (Cho et al. 1999, Fan et al. 2001). As highlighted in chapter 2, it is also necessary to remove bacteria from water to enhance effluent quality and to avoid bacterial growth on membrane surfaces. Some bacteria may adhere to surfaces within the water system, excrete a matrix of polysaccharides and proteins (peptidoglycan), and form a biofilm on surfaces of industrial water systems and can be a source for increased corrosion rates or can cause bio-fouling on membrane surfaces (Markowska-Szczupak et al. 2011). Turbidity is an expression of the optical property of water that causes light to be scattered and is caused by the presence of suspended matter such as clay, (in)organic matter and microscopic organisms in water (LeChevallier et al. 1981). Suspended solids play an important role in defining the overall quality of (secondary waste) water, acting as a pollutant or by transporting other pollutants (Blondeel et al. 2014, Lacour et al. 2009). Increase in suspended solids corresponds with a number of negative effects on freshwater ecosystems, including the variation of water quality and direct impact on planktonic and fish population (Tananaev and Debolskiy 2014). Turbidity can be an indication for transport of nutrients which support microbial growth in the distribution system (Geldreich et al. 1972). Also contaminants like viruses or bacteria can become attached to the suspended solids (Faust et al. 1975, LeChevallier et al. 1981). In addition coliform survival at high turbidity levels is possible if coliforms are embedded in suspended particles and chlorine is not able to come into contact with bacteria. In presence of UV-light, TiO2 nanoparticles have both photocatalytic and antimicrobial properties. They can destruct bacteria and oxidise organic matter such as humic acids. The anti-fouling ability of TiO2 is related to photocatalytic degradation of foulants by UV irradiation (Ma et al. 2010). By incorporating TiO2 into membranes, extra functionality can be obtained which ensures the above mentioned photocatalytic and antimicrobial properties, as well as removal of turbid material by filtration. Kim et al. (2003) for example demonstrated the bactericidal action of TiO2 with UV limiting bio-fouling on a membrane functionalised with TiO2 nanoparticles by using a reactor set-up that was illuminated with UV for 4 hour per day.

105
As seen in chapter 7, the best performing membranes in this study is a nanofibre membranes post-functionalised with colloidal TiO2. Also, nanofibres, due to their excellent functionalisation properties and very high active surface, could act as an immobilization technique for example for adsorption purposes. In previous chapter the preparation of nano-sized TiO2 functionalised nanofibres was described and the photocatalytic activity on methylene blue was demonstrated. This methylene blue has been used in different researches as a model compound for removal of organic contaminants and dyes (He et al. 2009, Pant et al. 2011, Pant et al. 2013). As such, the objective of this chapter was to investigate the photocatalytic efficiency of the TiO2 functionalised nanofiber membranes in more life-like circumstances using wastewater treatment plant (WWTP) effluent. Contact and filtration experiments were performed on WWTP effluent and a 60 mg/l commercial humic acid solution (as a model solution to simulate higher concentrated natural organic matter such as landfill leachate treatment plant effluent). Contact tests were performed on a cell solution of S. aureus. As such, the photocatalytic activity of the nTiO2 functionalised nanofibres was assessed by:
(i) Contact experiments on photodegradation of humic acids (WWTP effluent and
commercial humic acids) with TiO2 functionalised nanofibre membranes.
(ii) Contact experiments on phododegradation of S. aureus with nTiO2 functionalised
membranes.
(iii) Filtration of WWTP effluent with (functionalised) nanofibre membranes under UV
illumination.
8.2 Material and Methods
The (functionalised) membranes used in this study are produced on the multi-nozzle set-up with a density of 10 g/m². The selected functionalisation concentrations on membranes were chosen by the best-performing membranes in previous chapter: 0.07 wt% colloidal TiO2 inline functionalised, 0.30 wt% commercial TiO2 inline functionalised, 0.12 M colloidal TiO2 post-functionalised, 0.50 M commercial TiO2 post-functionalised membranes.
8.2.1 Filtration and degradation tests
Photodegradation contact tests were first performed to assess removal of humic acids in WWTP effluent by contact with TiO2 functionalised membranes. The contact degradation experiment was repeated with commercial humic acids at a concentration of 60 mg/l, simulating higher concentrated wastewaters with a darker, less transparent colour such as landfill leachate treatment plant effluent (Chys et al. 2014). The tests were carried out by immersing different membranes (3 x 3 cm) in a WWTP effluent and a 60 mg/l commercial humic acid solution (ratio of membrane mass (mg): liquor volume (ml) was 1:800) according to the test done in chapter 7 and fully described in chapter 3. The nanofibre samples with

106
humic acid solutions were kept in the dark for 16 hours to ensure the adsorption equilibrium had been reached (Bai et al. 2012, Bekbolet et al. 2002, D'Oliveira et al. 1990). After 16 hours in dark conditions and after 0.5, 1, 2 and 4 hours of UV illumination, samples were taken for analysis. Different membranes (3 x 3 cm) were immersed in the bacterial solution containing 8 x 10⁹ S. aureus per 100 ml (ratio of membrane mass (mg): liquor volume (ml) was 1:800). Sampling was done after 0.5, 1, 2 and 4 hours of UV illumination. The filtration experiments were performed in a dead-end cell with a filtration speed of 11 m3/(m2.h) and was performed in the presence of a UV lamp on a 40 cm distance of the membrane. The equipment was also used in chapter 4 and 6 and is described in chapter 3.
8.2.2 Measurement techniques
Photodegradation of humic acids was assessed by measuring the absorbance at 436 nm wavelength on a UV–Vis spectrophotometer (UV-Vis spectrophotometer Shimadzu UV-1601). Absorbance at a wavelength of 436 nm represents the colour forming moieties in humic acids (Uyguner and Bekbolet 2005) and is a typical parameter in wastewater to quantify the humic acids (Nöthe et al. 2009, Zhang et al. 2008a). Absorbance was measured with a quartz cuvette of 1 cm and indicated as A436. The percentage of photodegradation on the effluent and commercial humic acids, were calculated as follows: (C0-Cx)/C0 where C0 presents concentration of humic acids before the experiment and Cx presents concentrations of humic acid at a certain time. Absorbance at 436 nm wavelength was measured both after the filtration experiments and the photodegradation contact experiments on humic acids. Control experiments on humic acids under UV illumination without any membrane were also performed since it can occur that humic acids degrade by the energy of the UV-light. Tests were done in threefold. Surviving cells of S. aureus were measured by use of the method described in the chapter 3. After effluent filtration, turbidity (HI98703; Hanna Instruments) was measured (expressed in NTU). Also biological activity expressed as total adenosine tri-phosphate (total ATP) was determined (3M Clean-trace Uni-lite NG Luminometer, Biognost). The amount of light is proportional to the concentration of ATP in the sample that is in turn related to the number of organisms (Ford and Leach 1998). The results of the luminometer are expressed as relative light units (RLU).
8.2.3 Tested solutions and samples
Effluent samples were collected from the secondary clarifier of a municipal WWTP in Harelbeke, Belgium operated by Aquafin (www.aquafin.be). The wastewater is treated by a conventional activated sludge process (21 days average sludge residence time) with screen filtration, sand and oil trap, primary settling, nitrification and denitrification and secondary clarification (Audenaert et al. 2013). Samples were filtered through a rapid sand filter (granular size: 0,4 – 0,8 mm; flow: 5 m/h) to remove suspended solids before the

107
photodegradation and filtration experiments. The characteristics of the sand filtered effluent are given in Table 8.1. The sand filtered effluent was used in contact experiments and in filtration experiments.
Table 8.1: Summary of water quality variables of the used sand filtered effluent
Variable (unit) Value
Turbidity (NTU) 1.38 Total ATP (RLU) 787 A436 0.04 pH 7.53 Conductivity (µS/cm) 970 COD (mg O2/l) 16.5
For a second series of contact experiments, humic acid sodium salt (Aldrich, H16752 technical grade, molecular weight range of 2 x 10³ – 500 x 103) was used, allowing the composition to be controlled. Humic acid solution of 60 mg/l was prepared. Bench scale experiments were performed under neutral pH conditions (pH 7.4). The initial value of A436 was 0.37. S. aureus strain LMG 8224 was used for the inoculation of this influent water. Detailed description on the bacteria could be found in chapter 3. The bacteria were washed in sterile phosphate buffered saline solution (Gracia et al. 1999) to avoid interference of the nutrient broth in the photocatalytic reaction. Also, since the cell solution was washed it was used without nutrients to reduce the multiplication of cells during the experiment. This resulted in a cell solution containing 8 x 10⁹ S. aureus per 100 ml. This bacterial solution was used as such in the contact tests. Tests were done in two-fold.
8.3 Results
First the photodegradation contact experiments are discussed after which the filtration experiment on WWTP effluent is described.
8.3.1 Photodegradation contact tests
Contact tests on photodegradation with nTiO2 functionalised membranes were performed on (i) WWTP effluent, (ii) commercial humic acids with a concentration of 60 mg/l and (iii) S. aureus (initial concentration 8 x 10⁹ CFU/100ml).

108
8.3.1.1 WWTP effluent
Nanofibre membranes were immersed in effluent and irradiated with UV light for 0.5, 1, 2 and 4 hours after 16 hours in dark conditions. Control experiments on effluent under UV illumination without any membrane showed that a small percentage of degradation of humic acids occurred, which could also be found in literature (Wiszniowski et al. 2002). Adsorption of present components in the effluent on the nanofibres was measured after 16 hours in dark conditions and varied from 9% for the colloidal inline functionalised membrane to 28% for the commercial post-functionalised membrane. In general, the ISO certified method for the determination of photocatalytic activity of surfaces in an aqueous medium (ISO:10678 2010) suggests methylene blue as test chemical. However, a different removal behaviour is observed when measuring humic acids compared to methylene blue. This may probably be attributed to adsorption on the nanofibre membranes. Non-functionalised PA-6 membranes obtain a 33% degradation of humic acids after 4 hours of UV illumination (Figure 8.1). Since no oxidation is expected from a non-functionalised PA-6 sample, this could be attributed to enhanced photolysis under UV illumination. The adsorption on non-functionalised PA-6 membranes is already a positive result as the immobilisation of humic acids triggers the degradation with UV. The adsorption of contaminants in the surrounding area of the photocatalytic sites enhances photodegradation of these contaminants. This is a result of the reactants physisorption on the fibre followed by surface diffusion to the interface between the adsorptive and photocatalytic sites (Carp et al. 2004). Also, the adsorption of humic acids on TiO2 is a requirement for an efficient electron injection and subsequent oxidation of humic acids (Cho and Choi 2002). To distinguish between the mechanism of adsorption and photolysis when illuminating the humic acid solution in presence of a nanofibre membrane, further research is needed. HPLC analysis could be used to measure the formation and disappearance of by-products (Wiszniowski et al. 2002), enabling to see whether it is a photolysis (and thus formation or disappearance of smaller molecules) or an adsorption phenomena. This would be interesting for future research. Although the results are not fully in line with expected results based on methylene blue degradation in chapter 6, the best performing sample, that was post-functionalised with commercial TiO2, shows 72% degradation after 1 hour, which is higher than found in literature. Zhang et al. (2008b) produced TiO2 nanowire membranes and compared its degradation efficiency to P25 TiO2 nanoparticles deposited on a glass filter. Removal of low concentration humic acids (15 mg/l), comparable to the WWTP effluent in this study, gave a 35% removal after 1 hour of illumination for both samples. The degradation efficiency with the TiO2 functionalised nanofibres in this chapter, is found to be faster. Again, this may possibly be attributed to the positive effect of the nanofibrous structure acting as a high adsorbing material. Comparing with literature is difficult since use of other types of membranes, TiO2 particles and experimental conditions influent the results. The best performing membrane in this study is the membrane post-functionalised with commercial TiO2 demonstrating the faster response in removing humic acids. Already 55%, 73% and 83% of the humic acids after 0.5, 1 and 2 hours of illumination respectively are

109
degraded. Figure 8.1 shows a stabilisation for photodegradation of humic acids. This has also been described in literature by Liu et al. (2014) who studied the photocatalytic removal of humic acids using a TiO2 slurry and found a fraction of dissolved organic carbon that cannot be entirely removed, indicating recalcitrant complexes present in the effluent or formed during the photocatalytic process. The other TiO2 functionalised membranes have a degradation of 61-73% of the humic acids after 4 hour of UV illumination, while the best performing membrane has a 84% removal of the humic acids. There can be concluded that the nanofibres post-functionalised with commercial TiO2 have a faster degradation of WWTP effluent, due to immobilisation and TiO2 induced photodegradation.
Figure 8.1: Increased humic acid degradation efficiency of effluent by contact with inline and post-functionalised
membranes with two types of TiO2 nanoparticles. Values obtained after 16 hours in dark conditions, 0.5, 1, 2 and 4 hours of UV irradiation.
8.3.1.2 Commercial humic acids in a higher concentration
The contact degradation experiment was repeated with commercial humic acids with a higher loaded concentration of 60 mg/l. Control experiments with UV illumination without membranes showed that a small percentage of degradation of humic acids occurred. The adsorption on the fibres after 16 hours in dark conditions is comparable with previous contact experiment performed on WWTP effluent, immobilising and thus removing humic acids from the sample.

110
Non-functionalised PA-6 membranes obtain a 33% degradation of humic acids after 4 hours of UV illumination (Figure 8.1). No oxidation is expected from a non-functionalised PA-6 sample, which is explained in previous section. Again nanofibres post-functionalised with commercial TiO2 nanoparticles demonstrate the fastest degradation under UV illumination. After 2 hours 60% humic acid removal is obtained. Despite the oxidation reaction is going slower in comparison to photodegradation of effluent as described above, it is still possible to obtain high removal results on humic acids even in a higher concentrated humic acid and thus less transparent solution. A reduction of 67% of the humic acids is observed with membranes post-functionalised with commercial TiO2 after 4 hours while degradation of 30-39% was found for the other TiO2 functionalised membranes. The membranes post-functionalised with commercial TiO2 are fastest in degrading 60 mg/l humic acids.
Figure 8.2: Increased humic acid degradation efficiency of 60 mg/l commercial humic acids by contact with inline and
post-functionalised membranes with two types of TiO2 nanoparticles. Values obtained after 16 hours in dark conditions, 0.5, 1, 2 and 4 hours of UV irradiation.

111
8.3.1.3 Bacterial removal by contact with TiO2 functionalised membranes
The nanofibre membranes were immersed in a cell solution containing 8 x 10⁹/100ml S. aureus and illuminated with UV for 2, 4 and 6 hours prior to sampling. Figure 8.3 compares the removal of S. aureus on both TiO2 functionalised and non-functionalised PA-6 nanofibre membranes. UV light causes sterilisation and 1.1 log10/100ml of cells are deactivated after 6 hours of illumination in absence of any membrane. As seen in Figure 8.3, inactivation of S. aureus with TiO2-functionalised nanofibres plus UV light is significantly higher than with UV photodegradation alone. In contrast with previous sections on humic acid removal, a difference can be seen in removal when comparing non-functionalised and all TiO2 functionalised nanofibre membranes. This could be attributed to the fact that adsorption plays a less important role when working with bacteria. This causes the effect of TiO2 photolysis to be clearly visible. There still is some effect of immobilisation due to adsorption since an extra removal can be found for the non-functionalised PA-6 nanofibre. The results present in Figure 8.3 show that the functionalised membranes under UV can eliminate extra bacteria by the photocatalytic bactericidal effects of TiO2. The best performing nanofibre obtains a 2.4 log10/100ml S. aureus after 2 hours. When looking at some results described in previous chapters, the disinfection results obtained by contact are comparable. Results in chapter 6, on bacterial removal after 2 hours contact with a WSCP functionalised membrane revealed a 2 log10/100ml S. aureus. This is similar to the results obtained after 2 hours of contact with TiO2 functionalised membranes in UV light (2.4 log10/100ml). Taken into account the small removal initiated by sterilisation after 2 hours, these results are comparable. All functionalised nanofibres in this study, obtain 4 – 4.5 log10/100ml or an almost complete removal (99.99%) of S. aureus after 6 hours under UV light. When looking at literature on contact disinfection experiments with TiO2 coated surfaces, diverse disinfection results can be found. Chawengkijwanich et al. (2008) found similar results on a TiO2-coated polypropylene film obtaining a 1.9 log10/100ml removal after 2 hours of UV illumination. Shiraishi et al. (2009) synthesized TiO2 films on stainless steel and obtained a complete removal after 1 hour illumination (inoculation with 107 CFU/100 ml). Kim et al. (2003) tested for a polyamide TiO2 thin-film-composite membrane and obtained a 0.4 log10/100ml after 2 hours UV illumination. Despite this being a lower disinfection effect than found in this study, they demonstrated in their study an anti-fouling effect with TiO2 functionalised membranes. This suggests the possible use of the TiO2 functionalised nanofibre membranes as developed in this study, with faster bacterial removal than Kim et al. (2003) and high humic acids removal, as a high-flux anti-fouling membranes.

112
Figure 8.3: Bacterial removal of S. aureus by contact with nTiO2 functionalised and non-functionalised membranes under
UV illumination.
8.3.2 WWTP effluent filtration
Effluent from a wastewater treatment plant was filtered (flow rate 11 m3/(m2.h)) over nanofibre membranes in the presence of UV-light. The results on the effluent filtration with non-functionalised PA-6 and TiO2 functionalised nanofibre membranes were analysed by measuring turbidity, biological activity (total ATP) and interpretation of UV-VIS spectra (A436) for detection of humic acids. Figure 8.4 presents turbidity, decrease in biological activity and A436 removal and, indicating a reduction on all parameters. Filtration with nanofibre membranes has a positive effect on the effluent quality. After filtration with non-functionalised PA-6 membranes, turbidity was 69% lower and biological activity decreased to 76% of the original effluent values. Also the effect of filtration on humic acids is shown in Figure 8.4 . Non-functionalised PA-6 membranes remove 44% of the humic acids. When comparing with the results of Ma et al. (2010) on filtration of surface water (pore size 0.80 µm), the results are comparable with filtration performed in this study on non-functionalised PA-6 membranes. Ma et al. (2010) obtained 42% humic acid removal by filtration alone which is comparable to the 44% humic acid removal obtained in this study. Since nanofibres have a very high clean water flux (see chapter 4) a lower trans-membrane pressure is needed to obtain the same water flux, giving benefit to the novel nanofibre membranes developed in this study, with similar humic acid removal.

113
To obtain photodegradation effect, higher contact times and as such lower fluxes are needed. This was also demonstrated in the contact tests done in this chapter where 4 hours of illumination were needed to obtain a 84% degradation of WWTP effluent and 67% degradation of higher loaded 60 mg/l humic acids. In studies performed by Zhang et al. (2008b), Ma et al. (2010) and (Bai et al. 2012) fluxes between 450 and 1000 l/(m².h) in cross-flow set-with TiO2 loaded membranes were used compared to 11000 l/(m².h) during this test. From the results obtained in this chapter on filtration with non-functionalised PA-6 membranes, it can be concluded that nanofibre membranes can be used as a high-flux effluent filtration technique for example for recuperation of water. The functionalisation with TiO2 could give an extra positive aspect for a possible use in a cleaning phase if appropriate contact times are applied. However, this still needs to be tested.
Figure 8.4: Removal of turbidity, biological activity (expressed as ATP) and humic acid removal A436 after effluent
filtration by nanofibre membranes. All samples were pre-treated with sand filtration. Results express removal compared to the original effluent values.
8.4 Conclusions
In this study the photocatalytic activity and filtration performance of nanofibre membranes functionalised with TiO2 was demonstrated with different types of wastewater. WWTP effluent filtration with nanofibre membranes improved water quality as reduction in turbidity (69%), humic acids (44%) and bacterial activity (76%) was observed. Contact experiments showed extra removal on humic acids and S. aureus. Humic acid removal of 83% of the WWTP effluent was obtained after 2 hours of illumination using a post-functionalised commercial TiO2 membrane which was the best performing membrane.

114
Further, 60% degradation after 2 hours of illumination was observed with a higher loaded commercial 60 mg/l humic acid solution. The inactivation of S. aureus with TiO2-functionalised nanofibres plus UV light is higher than with UV photodegradation alone. Nanofibre membranes functionalised with TiO2 give a 4 – 4.5 log10/100ml or a 99.99% removal of S. aureus after 6 hours of UV illumination. The oxidation of humic acids and bacteria suggest the potential of a TiO2 functionalised nanofibres membrane as a high-flux anti-fouling membrane. However, this still needs to be tested. In a normal filtration set-up, contact time is too low to see an effect of functionalisation on the membranes, but functionalisation proves its utility when the nanofibres are under UV-illumination for 4 hours, reducing bacteria and humic acids and thus contributing to anti-fouling abilities. Also, filtration with non-functionalised PA-6 nanofibre membranes can be used as a high-flux effluent filtration technique.

9 Structure changes and water filtration
properties of polyamide nanofibre membranes During this work it was noticed that sometimes results for clean water permeability were not reproducible, especially when nanofibre membranes were produced, stored and tested on different occasions. The storage of nanofibres seemed to alter membranes properties. Care was taken during all previous experiments to avoid different storage conditions. This however shows the need to study this effect in more detail as to offer a solution for long term behaviour and stability. In this chapter the nanofibre membranes were treated under different circumstances, simulating the diverse conditions in which a membrane could be stored and to simulate their use in water filtration systems. Under all these different conditions, experiments were done on the fibre morphology (SEM pictures, dimensional changes) and the membrane properties (tensile strength, clean water flux, bacterial removal). Also the benefit of a heat-treatment was demonstrated. Daels, N., Van Hulle, S.W.H. and De Clerck, K. Structure changes and water filtration properties of polyamide nanofibre membranes. In preparation.

116
9.1 Introduction
Nanofibre membranes have a unique and porous structure resulting in a very high water flux. The nanofibres are randomly organised, because the jet of the polymer is bending during the electrospinning production process. The overall fibre configuration has a large influence on the membrane pore structure as was shown in different studies focusing on modelling of fibre orientation (Pradhan et al. 2013, Soltani et al. 2014). Previous chapters showed its excellent properties and potential use in water treatment technologies. For the long-term use of the nanofibres, it is essential to know how to keep their excellent properties in different environmental conditions. Water filtration systems sometimes need to be taken offline, due to some mechanical failure or because there is a temporary reduced need for water treatment. During this offline period, membrane elements can either be stored in or out of the system but today it is generally recommended to keep the membranes in wet conditions (CSMfilter 2014, DOW 2014, GEwater 2014). For these novel nanofibre membranes, it is essential to test possible variations in morphology of the nanofibre membrane due to the storage as this may affect its filtration performance. The structure of a material is immediately related to its properties (Page 2000). The nanofibre membranes as used in this work, are made of a polyamide, PA-6. In general, polyamides are hydrophilic. PA-6 absorbs water, which acts as a plasticizer by lowering the glass transition temperature (Utracki and Jamieson 2011). Above the glass transition temperature of the polymer, the polymer chains are more mobile (Callister and Rethwisch 2011) which could affect the membranes structure and thus its filtration properties. Also, water is known to affect the tensile strength in polyamides (Utracki and Jamieson 2011). This will influence the behaviour of the PA-6 nanofibre membranes during their use in water treatment. A possible action is a heat-treatment, causing the glass transition temperature of PA-6 to rise which lowers the effect of water as a plasticizer. A heat-treatment already showed some advantages in the prevention of “layered fouling” (Bilad et al. 2011b). It could be used to produce self-supporting membranes without the need for a non-woven support (Gopal et al. 2006) and is commonly used to reinforce membranes (Bilad et al. 2011a, Bilad et al. 2011b, Liu et al. 2011, Tsai et al. 2005). In a heat-treatment, membranes are exposed to a temperature just below their melting point. The heat-treatment will increase dimensional stability during further use as long as the temperature is below the heat-treatment temperature. In order to obtain a stable water filter the nanofibre membrane needs to keep its properties and thus its structure. To investigate possible changes in the structure of the nanofibre membranes, several conditions were simulated in which the nanofibre membranes could possibly end up when using the membranes in water treatment systems. As such the aim of this chapter is to study structure and filtration properties (tensile strength, clean water permeability, pathogen removal efficiency) of electrospun PA-6 nanofibre membranes during storage (one month) in wet, dry and mixed environments. Initially nanofibres are spun onto a substrate. Storage of the nanofibre membranes on this substrate was compared to storage of membranes that were used as stand-alone membranes. Since a heat-treatment is expected to improve the stability of the nanofibre structure this was tested in this chapter simultaneously with non-heat-treated membranes. Also the influence of grammage on the filtration properties was investigated.

117
9.2 Material and methods
9.2.1 Influence of membrane grammage on CWP
The electrospinning set-up was continuously optimised during this PhD thesis (as described in the material and method section in chapter 3). Therefore it is now possible to make thinner and more uniform nanofibres comparing to the start of this PhD. In order to test the influence of grammage on clean water permeability, diverse nanofibre membranes were produced on the multi-nozzle set-up with a grammage of 7, 9, 14, 17 and 25 g/m². The tests were performed in triplicate within one week after production.
9.2.2 Heat-treatment and description of different storage conditions
9.2.2.1 Description of the different storage conditions
After their production, the membranes were subjected to different conditions of storage: dry storage and wet storage and the storage under multiple wet/dry cycles. These different conditions are described in Table 9.1. The samples were produced and given different treatments immediately after their production (day 0). Subsequently to their production and treatment, the membranes were stored (and dried) in a acclimatized lab (296 K, relative humidity of 50%). After 4 weeks, some samples received an extra treatment. Experiments were done on the membrane properties of all different samples on day 2 and day 30, one day after their treatment, allowing the samples to dry before the experiments. The samples were conditioned as follows (see Table 9.1). One nanofibre sample was stored still attached to the substrate (aluminium foil) (sample A) simulating the use of the nanofibre membrane on a substrate. All other samples were removed from the substrate and used as stand-alone filter, therefore free shrinkage is allowed. Of the samples that were removed from the substrate, one sample was kept completely dry during the 4 weeks (sample B). Another sample was submerged in water for 4 minutes after which it was kept dry for 4 weeks. This treatment is further noted as the treatment with “one wet/dry cycle” (sample C). Additionally a sample had a wet/dry cycle immediately after its production, kept dry for 4 weeks and then had a second wet/dry cycle. This is further noted as the treatment with “two wet/dry cycles” (sample D). The last sample was stored in water for 4 weeks after which it was removed from the water (sample E).

118
Table 9.1: Five different treatments were performed on the nanofibre samples. Each sample was done in triplicate and had non-heat-treated and heat-treated samples, except for sample A, which only had non-heat-treated samples.
Sample Immediately after production After 4 weeks
Stored on a
substrate
Stored as stand-alone
structure
Dry Wetted and
dried
Stored in water
(still) dry
(again) wetted
and dried
dried
A X X X B X X X C X X X D X X X E X X X
9.2.2.2 Description of the heat-treatment
The effect of a heat-treatment was studied by simultaneously testing heat-treated (HT) and non-heat-treated samples for all different storage conditions. This was done except for sample A that was stored on alumina foil and therefore could not be heat-treated. The heated alumina foil caused membrane damage during heat-treatment. A Dofix press was used for heat-setting of the membranes immediately after production. Heat-treatment was performed immediately after production of the nanofibres and before simulation of different wet/dry conditions on the different samples. The heat-treatment was performed by placing the membranes between two layers of aluminium and heating at 180°C for 60 seconds. For samples B, C, D and E, a set of three samples was heat-treated and a set of three samples was non-heat-treated.
9.2.3 Analysis
Immediately after production, samples were cut in dimensions of 20x20 cm. Analysis on membrane morphology and filtration properties were done on day 2 and at day 30. The two days production and specific treatment allowed for the wetted membranes to become in a dry condition. After four weeks the second treatment was conducted as described in Table 9.1. On day 30 all membranes were in a dry condition when analysed. Evaluation of the membranes was done visually via SEM (description in chapter 3), including fibre diameter measurements. Dimensional changes were monitored by measuring the length and width of the membranes every few days, in duplicate (measuring error 0.5 mm). The values are expressed as changes relative to the original value (20x20cm). A negative value corresponds to shrinkage of the membrane as then the dimensions got smaller than the original dimensions. Tensile properties were evaluated on a Statimat M (Textechno). The gauge length, width and test speed were 100 mm, 40 mm and 25 mm/min, respectively. Measurements on different

119
parameters were performed on day 1 and day 30, allowing the membranes that were wetted on day 1 and day 28, to become in a dry state before accomplishing the tests. Tests were done in quadruplicate. Filtration properties were examined to make conclusions on membrane pore sizes due to changes in membrane morphology. Clean water permeability (CWP) was measured as described in chapter 3. Bacterial removal capacity was measured by filtration of inoculated solution with S. aureus as described in chapter 3 and is expressed as a log10/100ml value. The initial concentration was 8.6x10⁸ CFU/100 ml. Filtration of bacteria was done with two samples, each in two-fold dilution series.
9.3 Influence of grammage on clean water permeability
The multi-nozzle set-up is able to electrospin large nanofiber samples by a conveyor belt that shifts an aluminium foil horizontally on which the nanofiber is deposited. The speed of the conveyor belt can be varied to electrospin nanofibre membranes with different grammages. It can be expected that the more layers of nanofibres are deposited on the same surface, the smaller porosity will be. This hypothesis was evaluated by testing the clean water permeability on samples with different grammages. Figure 9.1 verifies the relation between grammage and clean water permeability: the thinner the membrane, the higher the water flux due to a higher porosity. In this chapter membranes with a grammage of 17 g/m² were further used. Such a grammage allows the use of the membrane for evaluation of filtration properties without the need of any support layer while maintaining a high flux.
Figure 9.1: Relation between nanofibre grammage and clean water permeability

120
9.4 Influence of storage under different environmental conditions on fibre
morphology
PA-6 is hydrophilic and absorbs water which act as a plasticizer. In this first section the influence of water on membranes structure is evaluated by SEM analysis, measurement of fibre diameter and the dimensional changes of the membrane.
9.4.1 Evaluation of SEM images
A SEM analysis already revealed some effects of the different wet/dry conditions on the nanofibrous structures. Sample A is seen as a reference membrane since this is the original state of the membrane after production via electrospinning: the sample stayed on the aluminium foil during four weeks without further treatments. Figure 9.2 indicates that the fibre morphology does not change during the four weeks of storage. Since the membrane is attached on the alumina foil, no free shrinkage could occur. For membranes that were taken off the aluminium foil, only the SEM pictures on day 30 (non-heat-treated and heat-treated) are displayed in Figure 9.3. All other samples than sample A had the possibility of free shrinkage. On the SEM picture sample B does not show a large difference with sample A. Samples that had one or two wet/dry cycles (Sample C and D) show more dense structured fibres. Also the fibres are more adhered and less aligned. When the fibres come in a wet condition they expand, relax and lose their specific porous form and structure that originates from the electrospin process. PA-6 may be plasticized with water, which lowers the glass transition temperature (Utracki and Jamieson 2011). Above the glass transition temperature of the polymer, the polymer chains are more mobile (Callister and Rethwisch 2011). As such, under wet conditions, the nanofibres can relax. Overall the heat-treated samples in the SEM pictures show a more stable structure with less dense or adhered structures. Due to the heat-treatment, the glass transition temperature of PA-6 rises, lowering the effect of water as a plasticizer.
Figure 9.2: sample A: day 2 (left) and day 30 (right)
A2 A30

121
Figure 9.3: sample B, C, D and E on day 30. The samples on the left are the non-heat-treated samples, samples on the
right received a heat-treatment.
B30
C30
D30
B30 heat-treated
C30 heat-treated
D30 heat-treated
E30 E30 heat-treated
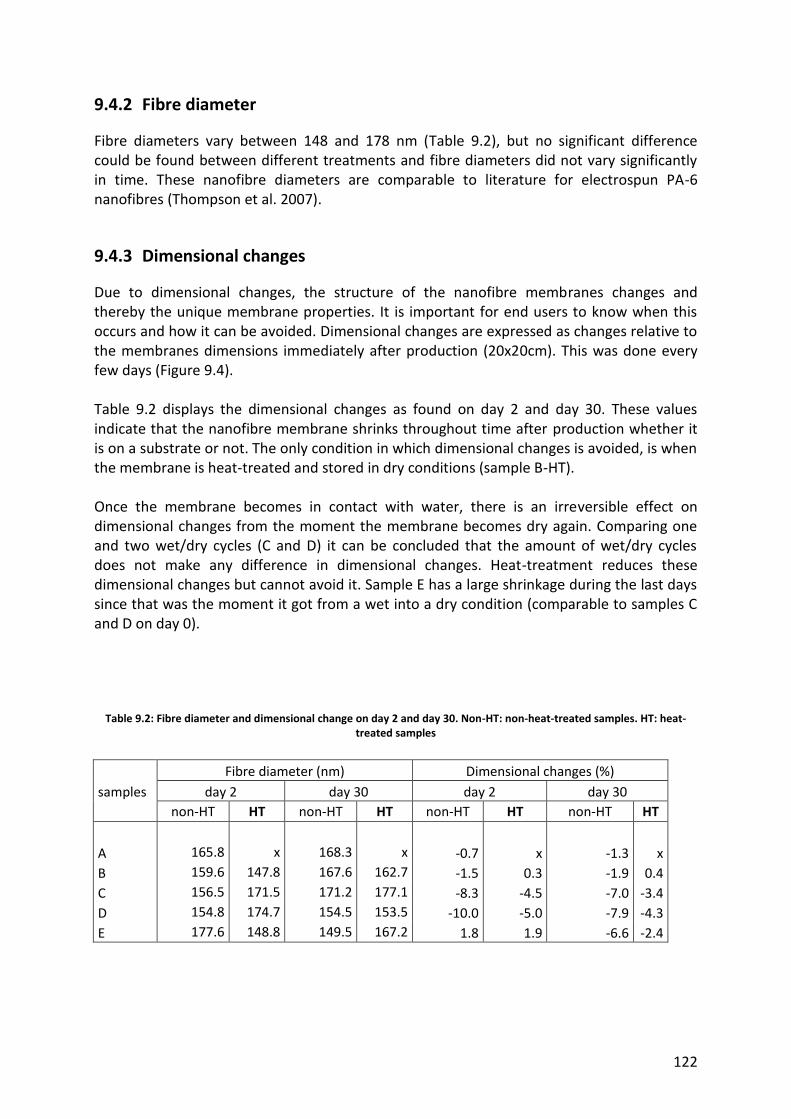
122
9.4.2 Fibre diameter
Fibre diameters vary between 148 and 178 nm (Table 9.2), but no significant difference could be found between different treatments and fibre diameters did not vary significantly in time. These nanofibre diameters are comparable to literature for electrospun PA-6 nanofibres (Thompson et al. 2007).
9.4.3 Dimensional changes
Due to dimensional changes, the structure of the nanofibre membranes changes and thereby the unique membrane properties. It is important for end users to know when this occurs and how it can be avoided. Dimensional changes are expressed as changes relative to the membranes dimensions immediately after production (20x20cm). This was done every few days (Figure 9.4). Table 9.2 displays the dimensional changes as found on day 2 and day 30. These values indicate that the nanofibre membrane shrinks throughout time after production whether it is on a substrate or not. The only condition in which dimensional changes is avoided, is when the membrane is heat-treated and stored in dry conditions (sample B-HT). Once the membrane becomes in contact with water, there is an irreversible effect on dimensional changes from the moment the membrane becomes dry again. Comparing one and two wet/dry cycles (C and D) it can be concluded that the amount of wet/dry cycles does not make any difference in dimensional changes. Heat-treatment reduces these dimensional changes but cannot avoid it. Sample E has a large shrinkage during the last days since that was the moment it got from a wet into a dry condition (comparable to samples C and D on day 0).
Table 9.2: Fibre diameter and dimensional change on day 2 and day 30. Non-HT: non-heat-treated samples. HT: heat-treated samples
Fibre diameter (nm) Dimensional changes (%)
samples day 2 day 30 day 2 day 30
non-HT HT non-HT HT non-HT HT non-HT HT
A 165.8 x 168.3 x -0.7 x -1.3 x
B 159.6 147.8 167.6 162.7 -1.5 0.3 -1.9 0.4
C 156.5 171.5 171.2 177.1 -8.3 -4.5 -7.0 -3.4
D 154.8 174.7 154.5 153.5 -10.0 -5.0 -7.9 -4.3
E 177.6 148.8 149.5 167.2 1.8 1.9 -6.6 -2.4
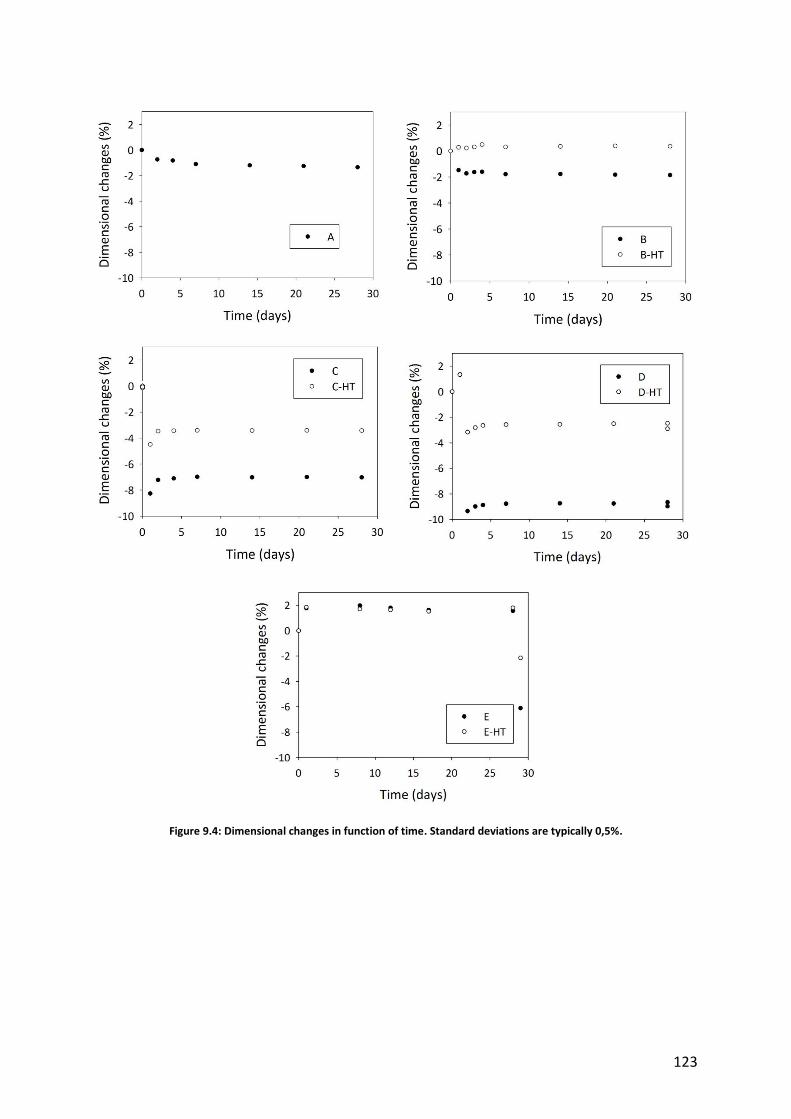
123
Figure 9.4: Dimensional changes in function of time. Standard deviations are typically 0,5%.

124
9.5 Influence of storage under different environmental conditions on
membrane properties
As a consequence of previously described changes in fibre alignment when the membrane is wetted and dried, unwanted changes in membrane properties can occur. Water acts as a plasticizer and causes relaxation. These changes are visible in the SEM pictures and in the dimensional changes of the membrane. It will probably affect the membrane porosity. As such, next section describes the membrane properties after different treatments and compares them to their dimensional changes.
9.5.1 Tensile strength
Tensile strength of the samples was measured on the 2nd and 30th day after simulation of different environmental conditions as described in Table 9.1. The influence of the different conditions on tensile strength is shown in Figure 9.5. Figure 9.6 A, presents the relation between the tensile strength and dimensional changes. It has to be mentioned that the tensile strength tests were conducted, not on the bulk polymer material, but on the non-woven nanofibrous structure. As such, the given Young’s modulus is obtained from the nanofibrous structure itself. After being in contact with water, the nanofibres show a more dense structure as described after SEM analysis (Figure 9.3). Increased stress first causes fibre alignment before the fibres are loaded. This gives a reduction in Youngs modulus (Figure 9.5). Heat-treatment on the membranes initially gives stronger membranes but could not stop the decrease of tensile strength. Figure 9.6 A further shows that dimensional changes with a shrinkage bigger than 1.8%, result in a lower Young’s Modulus.
Figure 9.5: Tensile strength of the membrane samples stored in different conditions.

125
In order to make a comparison between the initial membrane samples and the membranes produced in this chapter after production improvements, Sample A was analysed for its stress at failure, immediately after production and without any treatment which means it is comparable to the samples tested in chapter 4 although they had a different grammage. For sample A (grammage 17 g/m²) stress at failure was found to be 28.5 MPa, whereas the initial samples as produced in chapter 4 (grammage 25 g/m²) had stress at failure of 14.2 MPa. These results show the important improvements of the electrospinning set-up throughout this work.
9.5.2 Clean water permeability
Clean water permeability (CWP) is a measure for the porosity of the membranes. This flux was determined on day 2 and day 30 after simulation of different environmental conditions as described in Table 9.1. As found in Table 9.3, heat-treatment of the membrane does not affect CWP when samples are stored in dry conditions. As soon as the membrane is in a wet/dry cycle, the CWP decreases. A relation between fibre orientation and mean pore size was found by Li et al. (2014) and could be a possible explanation of the decrease in CWP after a wet/dry cycle since a reorientation of the nanofibres was seen in SEM pictures. Heat-treatment of the membranes limits this strong decrease in CWP but is not able to stop this reduction. Dimensional changes affect the structure of the membrane, resulting in a more dense, less porous structure. Since CWP is a good parameter to value porosity, CWP and dimensional changes are compared in Figure 9.6. This figure indicates that samples with a shrinkage bigger than 3 %, have a much lower CWP value. To maintain a good porosity of the nanofibre membrane it is important to keep dimensional changes as low as possible.
9.5.3 Bacterial removal by filtration
Bacterial removal capacity was measured by filtration of inoculated solution with S. aureus. The bacteria were completely removed after filtration with the samples that were stored in dry conditions: sample A and sample B with and without heat-treatment. From the moment the samples have a wet/dry cycle their removal capacity becomes uncertain: sometimes they have complete removal, other times they let bacteria pass the membrane. If the membranes have been in a wet/dry cycle, the porosity increases (as described above for CWP), but the pores might be damaged. Figure 9.6 C, further shows the relation between the bacterial removal and dimensional change, indicating the importance that the membrane keeps its structure to maintain bacterial removal and thus pore size structure. Dimensional changes with a shrinkage bigger than 2% give a uncertain bacterial removal. When the changes vary between -2% and 2%, a complete bacterial removal can be obtained.

126
Table 9.3: Clean water flux and bacterial removal of the different sample samples. The initial bacterial concentration was 8.6x10
8 CFU/100 ml.
CWP (*10³ l/m².h.bar) Bacterial removal (log10/100ml). TR= total reduction
samples day 2 day 30 day 2 day 30
non-HT HT non-HT HT non-HT HT non-HT HT
mean stdev mean stdev mean stdev mean stdev
A 21.0 x 17.9 x TR 0 x x TR x x x
B 20.4 20.1 23.3 23.1 TR 0 TR 0 TR 0 TR 0
C 10.2 13.9 16.3 20.0 6.1 3.4 TR 0 3.3 0.5 TR 0
D 12.7 20.1 12.3 15.0 3.0 3.2 3.3 0 7.3 1.8 6.9 2.3
E 21.8 23.1 20.4 x TR 0 TR 0 4.6 0.4 7.1 2.1
Filtration of S.aureus with PA-6 nanofibre membranes that are stored in dry conditions (sample A), could be compared to the PA-6 nanofibre membranes that were tested in chapter 6. The membranes in chapter 6 however, were tested with hospital wastewater (initial concentration 8.6x10⁸ CFU/100 ml), resulting in a 2.2 log10 removal. The better removal obtained in this chapter, could be attributed to the more homogenous samples produced by the enhanced multi-nozzle set-up.

127
Figure 9.6: Relation between dimensional changes and A: Tensile strength, B: CWP, C: Bacterial removal. White dots are heat-treated.
9.6 Conclusions
In this chapter the nanofibre membranes were treated under different conditions, simulating the diverse conditions in which a membrane could be stored and simulating their use in water filtration systems. Also the influence of grammage on CWP was measured: the thinner the membrane, the higher the water flux. Therefore it is important to select the appropriate grammage for the aimed application, taking in mind that this influences the water flux. A clean water flux of 27x103 l/m2.h.bar was possible for a membrane with grammage 7 g/m² and 20x103 l/m2.h.bar was found for a membrane with grammage 17 g/m2, again demonstrating the very high flux of these nanofibre membranes. It is recommended to use thin nanofibre membranes ensuring the highest possible flux, eventually spun on a supportive layer.
B A
C

128
Since the multi-nozzle set-up has been adapted during this thesis and more homogenous samples were produced, it was found that non-functionalised membranes could obtain a complete removal of S. aureus (initial concentration was 8.6x10⁸ CFU/100 ml). Nanofibre membranes have some excellent properties due to their unique and porous structure. To maintain these characteristics, some care has to be taken into account. This chapter reveals the necessity of the structure staying intact. When the nanofibre membrane comes in contact with water and afterwards gets into a dry condition again, the structure of the fibres becomes more dense thus destructing the porous structure formed during the electrospinning process. The fibres reorient every time they get dry after being in a wet condition. This reorientation is visible in SEM pictures but can also be found in an unwanted change of the membrane properties: dimensional changes, a lower tensile strength, a decrease in clean water permeability and uncertain bacterial removal. Heat-treatment does enhance the stability of the nanofibrous structures. When heat-treated the results in this chapter show that the membrane has a higher tensile strength and keeps its structure and characteristics better during storage in dry and mixed conditions. Heat-treatment however does not prevent the membrane of losing some of its properties after being in a wet/dry cycle although the decline of the membrane properties for heat-treated membranes is going slower than when not heat-treated and thus recommended prior to use. As long as the membrane is stored in dry condition, it keeps all of its characteristics after being heat-treated. As a final conclusion it is recommended to do a heat-treatment on the nanofibre membrane immediately after production. Once in contact with water, it is very important to keep the membrane in wet conditions to store its unique properties.

129
10 Concluding remarks and perspectives
This chapter summarizes the main conclusions of this PhD dissertation and highlights the future perspectives.

130
10.1 Introduction
First a feasibility study was done towards the applicability of electrospun nanofibres in water filtration applications. The results from this study were promising and provided ideas for further testing but also revealed some operational problems. As such, during this work, the multi-nozzle electrospinning set-up was updated gradually (as described in the “material and methods” section) thereby responding to the findings in the lab experiments. This was translated in the production of nanofibres with increasingly enhanced qualities for water treatment applications. After the feasibility study the nanofibres were further tested including their use in different MBR set-ups, disinfection techniques (by filtration or contact) and dissolved organic matter removal. In the last chapter, tests on membrane handling were done to gather knowledge on maintaining the nanofibrous structure during storage and use.
10.2 Microfiltration
In the first feasibility tests, the clean water flux for the nanofibre membranes was found to be very high. The values were more than 3 times higher for the nanofibre membranes compared to their commercial counterparts. Future tests on nanofibre membranes via the improved electrospinning set-up, showed clean water permeability that are 10 times higher than commercial membranes: 27x103 l/(m2.h.bar). The clean water permeability is dependent on membranes thickness (expressed as grammage): the thinner the membrane, the higher the water flux. Therefore it is important to select the appropriate grammage for the aimed application, taking in mind that this influences the water flux. The first tests in this research were done on nanofibre membranes with a high grammage (25 g/m2). When the production of nanofibre membranes on the multi-nozzle set-up improved, production of thinner membranes was possible. These membranes did not exhibit membrane rupture. When these thinner membranes were tested for their clean water permeability in chapter 7 and chapter 9, an even higher clean water permeability was measured: 20x103 l/(m2.h.bar) (membrane grammage 17 g/m2) to 27x103 l/(m2.h.bar) (membrane grammage 6.8 g/m²). As such it is recommended to use thin nanofibre membranes ensuring the highest possible flux, eventually spun on a supportive layer. Tensile strength tests showed the nanofibre membranes to be competitive to their commercial counterparts. Further the tensile strength was not influenced by the chemical cleaning of the membrane after use in an MBR (12 hours soaked in 0.5% NaOCl and 0,2% HCl). The feasibility study pointed out that a membrane support was required. Without membrane support on the permeate side of the membrane, pores tend to widen due to high pressure on the membrane and allow bacteria to pass the membrane. This could be avoided when the membrane is supported thoroughly at the permeate side and was proven successful at first in filtration experiments of bacteria by an extra log10/100 ml removal of bacteria obtained when the filter was used on a supportive layer (chapter 4). Secondly, this same enlargement of the pores due to pressure caused a specific type of fouling. This “layered” fouling was found in the porous membrane structure. A supportive layer on the

131
permeate side of the membrane is recommended to decrease the movement of the membrane when applying a back-flush. It can be concluded that a membrane support on the permeate-side of the membrane is necessary for optimal filtration performance. Further optimization of the nanofibre production process such as electrospinning on a supportive layer, is necessary. The use of nanofibre membranes in an MBR-system was investigated in a semi-dead-end and a cross-flow MBR. An suspended activated sludge as well as a trickling filter configuration was evaluated. The application of nanofibre membranes in the activated sludge MBR showed a too fast flux decay due to irreversible fouling, compared to currently applied commercial membranes. The experiments however revealed an important improvement when a trickling filter was introduced instead of the activated sludge. This trickling filter served as a pre-filter thus causing a lower sludge loaded stream as influent for the nanofibre membrane. Also, filtration with non-functionalised PA-6 nanofibre membranes can be used as a high flux effluent filtration technique. Nanofibre membranes can therefore be applied for filtration of low loaded streams such as pre-filtered waste water (Bonnélye et al. 2008). In this work, effluent from a wastewater treatment plant was filtered with nanofibre membranes. It improved water quality as reduction in turbidity (69%), UV436 (44%) and bacterial activity (76%) was observed. Also bacterial filtration was assessed. With an optimised electrospinning set-up it is possible to remove all S. aureus (initial concentration 108 CFU/100 ml) by filtration with non-functionalised nanofibre membranes.
10.3 Functionalisation
10.3.1 Bacterial removal
Compared with conventional fibres, nanofibres have a much larger specific surface area. Therefore, nanofibres are much more reactive and efficient when their surface is functionalised. All functionalisation experiments revealed a successful functionalisation of nanofibre membranes and exposed an additional effect of this functionalisation, showing the ability for nanofibre membranes to get extra functionality on top of the high-flux filtration possibilities. These positive results open research opportunities towards additional functionalities of filtration with nanofibre membranes. Experiments were done towards functionalisation in order to obtain better filtration properties (such as disinfection or anti-fouling activity) or better removal (dissolved organic matter removal by contact with the functionalised membrane). Leaching of the functionalising agent occurred in small amount but did not alter the long-term operation of the membrane.

132
Short term filtration experiments demonstrated that a 5.2 log10/100 ml bacterial removal was possible for filtration with WSCP functionalised membranes of hospital wastewater with an initial concentration of 108 CFU/100 ml. These results show the enhanced functionality, with a 3 log10/100 ml extra removal obtained with a non-functionalised PA-6 membrane. Both the functionalised and non-functionalised membranes were produced in identical conditions of the multi-nozzle electrospinning set-up (chapter 4). With an optimised electrospinning set-up in more recently conducted research of this study, it was possible to remove all S. aureus (initial concentration 8.6x10⁸ CFU/100 ml) by filtration with non-functionalised nanofibre membranes (as found in chapter 9). This test was not performed on WSCP functionalised membranes, however a higher disinfection rate could be expected. Bacterial removal during 0,5 hours contact tests with the WSCP functionalised membrane was 2 log10/100 ml due to the biocidal effect of WSCP. As such it could be hypothesized that an even higher removal could be obtained with the nanofibre membranes produced with the current set-up, functionalised with WSCP.
10.3.2 Organic matter removal
Photocatalytic activity of nanofibre membranes functionalised with TiO2 was demonstrated with different types of water. In a first stage, methylene blue was used as a model compound for dissolved organic matter. The TiO2 functionalised nanofibre membranes were prepared via electrospinning by adding two types of TiO2 nanoparticles (21 nm commercial Degussa P25 TiO2 nanoparticles and colloidal 6 nm TiO2 nanoparticles) at different concentrations to the spinning solution prior to the actual spinning (inline functionalisation) or by post-functionalising the electrospun membranes after their production. Both methods improved the degradation of methylene blue under UV irradiation. Humic acid removal of 83% of the WWTP effluent was obtained after 2 hours of illumination using a post-functionalised commercial TiO2 membrane, which was the best performing membrane. Further, 67% degradation after 4 hours of illumination was observed with a higher concentrated (darker) commercial 60 mg/l humic acid solution. Also, nanofibre membranes functionalised with TiO2 give a 4.5 log10/100 ml removal of S. aureus after 6 hours of contact with the functionalised membranes under UV illumination. As such a clear difference between TiO2 functionalised membranes and the non-functionalised membrane when testing them against bacteria in a contact-test was demonstrated. As seen in chapter 7, nanofibre membranes post-functionalised with commercial TiO2 lost a part of their nanofibrous structure since the commercial TiO2 nanoparticles clogged the pores in a post-functionalisation process. Although this is not a pure nanofibrous structure anymore, its clean water flux is still very high (10x103 l/m2.h.bar) compared to its commercial counterparts (2.5x10³l/(m2.h.bar) ). The oxidation of humic acids and deactivation of bacteria suggest the potential of a TiO2 functionalised nanofibres membrane as a high-flux anti-fouling membrane. In a normal filtration set-up, contact time is too low to see an effect of functionalisation on the membranes, but functionalisation proves its utility when the nanofibres are under UV-illumination for 4 hours, reducing bacteria and humic acids and thus contributing to anti-fouling abilities (Kim et al. 2003).

133
10.4 Storage and handling
Nanofibre membranes have some excellent properties due to their unique and porous structure. To maintain these characteristics, some care has to be taken into account during storage and handling in water filtration. The nanofibres reorient every time they become dry after being in a wet condition, causing dimensional changes that result in unwanted changes of the membrane properties: a lower tensile strength, a decrease in clean water flux and uncertain bacterial removal time the nanofibre membranes becomes dry after being in wet conditions. Heat-treatment does enhance the stability of the nanofibrous structures. When heat-treated, the membrane has a higher tensile strength and keeps its structure and characteristics better during storage in dry and mixed conditions but heat-treatment does not prevent the membrane of losing some of its properties after being in a wet/dry cycle. As a final conclusion on storage and handling, it is recommended to do a heat-treatment on the nanofibre membrane immediately after production. Once in contact with water, it is very important to keep the membrane in wet conditions to maintain its unique properties.
10.5 Future perspectives
This work delivered some practical knowledge on the use of nanofibre membranes in different water treatment technologies. Especially low loaded streams are the target for these novel membranes. Continuous-flow experiments should be conducted to evaluate long-term activity of the functionalised nanofibres. Long-term use of functionalised nanofibres has not been tested in literature, where the focus is still on possible functionalisation techniques of the nanofibres. Evaluation in short-term filtration or contact experiments are no guarantee for successful long term use, but are however needed to make a start. As this start is made, new experiments should be carried out to evaluate the long-term use. TiO2 functionalised membranes could be tested for example in a photocatalytic set-up (Figure 10.1) where also the hydraulic retention time could be high enough to allow the contaminants to be sufficiently removed by the photocatalytic treatment. For example when using TiO2 functionalised nanofibres as tested in chapter 8, an UV-irradiation time of 2 hours is required to obtain a 83% removal of the humic acids as present in WWTP effluent or 4 hours to obtain an 67% removal of 60 mg/l humic acids.

134
Figure 10.1: A possible set-up for continuous flow experiments.
Electrospun nanofibres, due to their excellent functionalisation properties and their very high active surface, could act as a very efficient immobilization technique for example for adsorption purposes. As already indicated in chapter 2, the adsorption process in nanofibres is found to be three times faster in comparison with microfibres (Neghlani et al. 2011). In chapter 2 some examples on the use of functionalised nanofibre membranes for toxic metal adsorption were already mentioned. Photocatalytic treatment of pharmaceutical micropollutants with nTiO2 functionalised nanofibres is another interesting option. Most experimental studies have been conducted with suspensions of TiO2 nanoparticles (Doll and Frimmel 2004, Rizzo et al. 2009) but also immobilisation of TiO2 on glass (Carbonaro et al. 2013) was tested. Experiments were found to halve the concentration of the pharmaceuticals in 90-120 minutes of UV-irradiation. The results are promising, but could almost certainly be enhanced by using the high specific surface area of the TiO2 functionalised nanofibre membranes.

135
11 References
AATCC-100 (2004) Antibacterial finishes on textile materials: assessment of, p. 3, AATCC technical manual.
Agarwal, S., Greiner, A. and Wendorff, J.H. (2013) Functional materials by electrospinning of polymers. Progress in Polymer Science 38(6), 963-991.
Ahn, Y.C., Park, S.K., Kim, G.T., Hwang, Y.J., Lee, C.G., Shin, H.S. and Lee, J.K. (2006) Development of high efficiency nanofilters made of nanofibers. Current Applied Physics 6(6), 1030-1035.
Al-Amoudi, A. and W. Lovitt, R. (2007) Fouling strategies and the cleaning system of NF membranes and factors affecting cleaning efficiency. Journal of Membrane Science 303(1-2), 4-28.
Albu, S.P., Ghicov, A., Macak, J.M., Hahn, R. and Schmuki, P. (2007) Self-organized, free-standing TiO2 nanotube membrane for flow-through photocatalytic applications. Nano Lett 7(5), 1286-1289.
Aliabadi, M., Irani, M., Ismaeili, J., Piri, H. and Parnian, M.J. (2013) Electrospun nanofiber membrane of PEO/Chitosan for the adsorption of nickel, cadmium, lead and copper ions from aqueous solution. Chemical Engineering Journal 220(0), 237-243.
American Waterworks Association, a.W.P.C.F. (1971) Standard methods for the examination of water and wastewater, American Public Health Association (APHA), Washington, D.C.
Audenaert, W.T.M., Vandierendonck, D., Van Hulle, S.W.H. and Nopens, I. (2013) Comparison of ozone and HO induced conversion of effluent organic matter (EfOM) using ozonation and UV/H2O2 treatment. Water Research 47(7), 2387-2398.
Aussawasathien, D., Teerawattananon, C. and Vongachariya, A. (2008) Separation of micron to sub-micron particles from water: Electrospun nylon-6 nanofibrous membranes as pre-filters. Journal of Membrane Science 315(1–2), 11-19.
Bae, T.-H. and Tak, T.-M. (2005) Effect of TiO2 nanoparticles on fouling mitigation of ultrafiltration membranes for activated sludge filtration. Journal of Membrane Science 249(1–2), 1-8.

136
Bai, H., Liu, Z. and Sun, D.D. (2012) A hierarchically structured and multifunctional membrane for water treatment. Applied Catalysis B: Environmental 111–112(0), 571-577.
Baker, R.W. (2012) Membrane Technology and Applications, Wiley.
Bao, Q., Zhang, D. and Qi, P. (2011) Synthesis and characterization of silver nanoparticle and graphene oxide nanosheet composites as a bactericidal agent for water disinfection. J Colloid Interface Sci 360(2), 463-470.
Barakat, N.A.M., Abadir, M.F., Sheikh, F.A., Kanjwal, M.A., Park, S.J. and Kim, H.Y. (2010) Polymeric nanofibers containing solid nanoparticles prepared by electrospinning and their applications. Chemical Engineering Journal 156(2), 487-495.
Barhate, R.S., Loong, C.K. and Ramakrishna, S. (2006) Preparation and characterization of nanofibrous filtering media. Journal of Membrane Science 283(1–2), 209-218.
Barhate, R.S. and Ramakrishna, S. (2007) Nanofibrous filtering media: Filtration problems and solutions from tiny materials. Journal of Membrane Science 296(1–2), 1-8.
Bazargan, A.M., Keyanpour-rad, M., Hesari, F.A. and Ganji, M.E. (2011) A study on the microfiltration behavior of self-supporting electrospun nanofibrous membrane in water using an optical particle counter. Desalination 265(1–3), 148-152.
Bekbolet, M., Suphandag, A.S. and Uyguner, C.S. (2002) An investigation of the photocatalytic efficiencies of TiO2 powders on the decolourisation of humic acids. Journal of Photochemistry and Photobiology A: Chemistry 148(1–3), 121-128.
Belfer, S., Gilron, J., Purinson, Y., Fainshtain, R., Daltrophe, N., Priel, M., Tenzer, B. and Toma, A. (2001) Effect of surface modification in preventing fouling of commercial SWRO membranes at the Eilat seawater desalination pilot plant. Desalination 139(1–3), 169-176.
Bergamasco, R., da Silva, F.V., Arakawa, F.S., Yamaguchi, N.U., Reis, M.H.M., Tavares, C.J., de Amorim, M.T.P.S. and Tavares, C.R.G. (2011) Drinking water treatment in a gravimetric flow system with TiO2 coated membranes. Chemical Engineering Journal 174(1), 102-109.
Bhardwaj, N. and Kundu, S.C. (2010) Electrospinning: A fascinating fiber fabrication technique. Biotechnology Advances 28(3), 325-347.
Bielefeldt, A.R., Kowalski, K. and Summers, R.S. (2009) Bacterial treatment effectiveness of point-of-use ceramic water filters. Water Research 43(14), 3559-3565.
Bilad, M.R., Declerck, P., Piasecka, A., Vanysacker, L., Yan, X. and Vankelecom, I.F.J. (2011a) Development and validation of a high-throughput membrane bioreactor (HT-MBR). Journal of Membrane Science 379(1–2), 146-153.
137
Bilad, M.R., Mezohegyi, G., Declerck, P. and Vankelecom, I.F.J. (2012) Novel magnetically induced membrane vibration (MMV) for fouling control in membrane bioreactors. Water Research 46(1), 63-72.
Bilad, M.R., Westbroek, P. and Vankelecom, I.F.J. (2011b) Assessment and optimization of electrospun nanofiber-membranes in a membrane bioreactor (MBR). Journal of Membrane Science 380(1–2), 181-191.
Blondeel, E., Chys, M., Depuydt, V., Folens, K., Du Laing, G., Verliefde, A. and Van Hulle, S.W. (2014) Leaching behaviour of different scrap materials at recovery and recycling companies: Full-, pilot- and lab-scale investigation. Waste Manag 34(12), 2674-2686.
Bonnélye, V., Guey, L. and Del Castillo, J. (2008) UF/MF as RO pre-treatment: the real benefit. Desalination 222(1–3), 59-65.
Botes, M. and Cloete, T.E. (2010) The potential of nanofibers and nanobiocides in water purification. Crit Rev Microbiol 36(1), 68-81.
Brayner, R., Ferrari-Iliou, R., Brivois, N., Djediat, S., Benedetti, M.F. and Fievet, F. (2006) Toxicological impact studies based on Escherichia coli bacteria in ultrafine ZnO nanoparticles colloidal medium. Nano Letters 6(4), 866-870.
Brehant, A., Bonnelye, V. and Perez, M. (2002) Comparison of MF/UF pretreatment with conventional filtration prior to RO membranes for surface seawater desalination. Desalination 144(1–3), 353-360.
Callister, W.D. and Rethwisch, D.G. (2011) Fundamentals of materials science and engineering: an integrated approach, p. 910, John Wiley & Sons.
Camacho, L.M., Dumée, L., Zhang, J., Li, J.-D., Duke, M., Gomez, J. and Gray, S. (2013) Advances in Membrane Distillation for Water Desalination and Purification Applications. Water 5, 103.
Cao, X., Ma, J., Shi, X. and Ren, Z. (2006) Effect of TiO2 nanoparticle size on the performance of PVDF membrane. Applied Surface Science 253(4), 2003-2010.
Cao, X., Tang, M., Liu, F., Nie, Y. and Zhao, C. (2010) Immobilization of silver nanoparticles onto sulfonated polyethersulfone membranes as antibacterial materials. Colloids and Surfaces B: Biointerfaces 81(2), 555-562.
Carbonaro, S., Sugihara, M.N. and Strathmann, T.J. (2013) Continuous-flow photocatalytic treatment of pharmaceutical micropollutants: Activity, inhibition, and deactivation of TiO2 photocatalysts in wastewater effluent. Applied Catalysis B: Environmental 129(0), 1-12.

138
Carp, O., Huisman, C.L. and Reller, A. (2004) Photoinduced reactivity of titanium dioxide. Progress in Solid State Chemistry 32(1–2), 33-177.
Carroll, T., King, S., Gray, S.R., Bolto, B.A. and Booker, N.A. (2000) The fouling of microfiltration membranes by NOM after coagulation treatment. Water Research 34(11), 2861-2868.
Caruso, R.A., Schattka, J.H. and Greiner, A. (2001) Titanium Dioxide Tubes from Sol–Gel Coating of Electrospun Polymer Fibers. Advanced Materials 13(20), 1577-1579.
Chang, I.S., Gander, M., Jefferson, B. and Judd, S.J. (2001) Low-Cost Membranes for Use in a Submerged MBR. Process Safety and Environmental Protection 79(3), 183-188.
Chapman, J.S. (2003) Biocide resistance mechanisms. International Biodeterioration & Biodegradation 51(2), 133-138.
Chawengkijwanich, C. and Hayata, Y. (2008) Development of TiO2 powder-coated food packaging film and its ability to inactivate Escherichia coli in vitro and in actual tests. International Journal of Food Microbiology 123(3), 288-292.
Chellam, S. and Wiesner, M.R. (1997) Particle Back-Transport and Permeate Flux Behavior in Crossflow Membrane Filters. Environmental Science & Technology 31(3), 819-824.
Chen, L., Bromberg, L., Hatton, T.A. and Rutledge, G.C. (2008) Electrospun cellulose acetate fibers containing chlorhexidine as a bactericide. Polymer 49(5), 1266-1275.
Chen, Y., Donga, B.Z., Gaoa, N.Y. and Fana, J.C. (2007) Effect of coagulation pretreatment on fouling of an ultrafiltration membrane. Desalination 204(1-3), 181-188.
Chen, Y., Worley, S.D., Huang, T.S., Weese, J., Kim, J., Wei, C.I. and Williams, J.F. (2004) Biocidal polystyrene beads. III. Comparison of N-halamine and quat functional groups. Journal of Applied Polymer Science 92(1), 363-367.
Chiemchaisri, C., Wong, Y.K., Urase, T. and Yamamoto, K. (1993) Organic stabilisation and nitrogen removal in a membrane separation bioreactor for domestic wastewater treatment. Filtration & Separation 30(3), 247-240.
Cho, J., Amy, G. and Pellegrino, J. (1999) Membrane filtration of natural organic matter: initial comparison of rejection and flux decline characteristics with ultrafiltration and nanofiltration membranes. Water Research 33(11), 2517-2526.
Cho, Y. and Choi, W. (2002) Visible light-induced reactions of humic acids on TiO2. Journal of Photochemistry and Photobiology A: Chemistry 148(1–3), 129-135.

139
Choi, J.-H. and Ng, H.Y. (2008) Effect of membrane type and material on performance of a submerged membrane bioreactor. Chemosphere 71(5), 853-859.
Choi, O., Deng, K.K., Kim, N.-J., Ross Jr, L., Surampalli, R.Y. and Hu, Z. (2008) The inhibitory effects of silver nanoparticles, silver ions, and silver chloride colloids on microbial growth. Water Research 42(12), 3066-3074.
Chys, M., Declerck, W., Audenaert, W.T.M. and Van Hulle, S.W.H. (2014) UV/H2O2, O3 and (photo-) Fenton as treatment prior to granular activated carbon filtration of biologically stabilized landfill leachate. Journal of Chemical Technology & Biotechnology, n/a-n/a.
Collier, P.J., Ramsey, A.J., Austin, P. and Gilbert, P. (1990) Growth inhibitory and biocidal activity of some isothiazolone biocides. Journal of Applied Bacteriology 69(4), 569-577.
Comparelli, R., Fanizza, E., Curri, M.L., Cozzoli, P.D., Mascolo, G., Passino, R. and Agostiano, A. (2005) Photocatalytic degradation of azo dyes by organic-capped anatase TiO2 nanocrystals immobilized onto substrates. Applied Catalysis B: Environmental 55(2), 81-91.
Crittenden, J.C., Trussell, R.R., Hand, D.W., Howe, K.J. and Tchobanoglous, G. (2012a) MWH's Water Treatment: Principles and Design, Third Edition, pp. 903-1032, John Wiley & Sons, Inc.
Crittenden, J.C., Trussell, R.R., Hand, D.W., Howe, K.J. and Tchobanoglous, G. (2012b) MWH's Water Treatment: Principles and Design, Third Edition, pp. 819-902, John Wiley & Sons, Inc.
CSMfilter (2014), http://www.csmfilter.com/csm/upload/Storage/Storage%20Care%20Guidelines.pdf.
Curri, M.L., Comparelli, R., Cozzoli, P.D., Mascolo, G. and Agostiano, A. (2003) Colloidal oxide nanoparticles for the photocatalytic degradation of organic dye. Materials Science and Engineering: C 23(1–2), 285-289.
D'Oliveira, J.C., Al-Sayyed, G. and Pichat, P. (1990) Photodegradation of 2- and 3-chlorophenol in titanium dioxide aqueous suspensions. Environmental Science & Technology 24(7), 990-996.
Davies, M.J. (2005) The oxidative environment and protein damage. Biochim Biophys Acta 1703(2), 93-109.
De Vrieze, S., Camp, T., Nelvig, A., Hagström, B., Westbroek, P. and Clerck, K. (2009) The effect of temperature and humidity on electrospinning. Journal of Materials Science 44(5), 1357-1362.
De Vrieze, S., Daels, N., Lambert, K., Decostere, B., Hens, Z., Van Hulle, S. and De Clerck, K. (2012) Filtration performance of electrospun polyamide nanofibres loaded with bactericides. Textile Research Journal 82(1), 37-44.

140
De Vrieze, S., De Schoenmaker, B., Ceylan, Ö., Depuydt, J., Van Landuyt, L., Rahier, H., Van Assche, G. and De Clerck, K. (2011) Morphologic study of steady state electrospun polyamide 6 nanofibres. Journal of Applied Polymer Science 119(5), 2984-2990.
De Vrieze, S., Westbroek, P., Van Camp, T. and De Clerck, K. (2010) Solvent system for steady state electrospinning of polyamide 6.6. Journal of Applied Polymer Science 115(2), 837-842.
De Vrieze, S., Westbroek, P., Van Camp, T. and Van Langenhove, L. (2007) Electrospinning of chitosan nanofibrous structures: feasibility study. Journal of Materials Science 42(19), 8029-8034.
De Windt, W., Vercauteren, T. and Verstraete, W. (2008) US8455226 B2 Method for producing metal nanoparticles, Janssen Pharmaceutica NV.
Desai, V.S. and Kowshik, M. (2009) Antimicrobial Activity of Titanium Dioxide Nanoparticles Synthesized by Sol-Gel Technique. Research Journal of Microbiology 4(3), 97-103.
Doll, T.E. and Frimmel, F.H. (2004) Kinetic study of photocatalytic degradation of carbamazepine, clofibric acid, iomeprol and iopromide assisted by different TiO2 materials--determination of intermediates and reaction pathways. Water Res 38(4), 955-964.
Doshi, J. and Reneker, D.H. (1995) Electrospinning process and applications of electrospun fibers. Journal of Electrostatics 35(2–3), 151-160.
DOW (2014), http://msdssearch.dow.com/PublishedLiteratureDOWCOM/dh_07d0/0901b803807d04d1.pdf?filepath=liquidseps/pdfs/noreg/609-02103.pdf&fromPage=GetDoc.
Dwyer, D.J., Kohanski, M.A. and Collins, J.J. (2009) Role of reactive oxygen species in antibiotic action and resistance. Current Opinion in Microbiology 12(5), 482-489.
Ebrahim, S., Bou-Hamed, S., Abdel-Jawad, M. and Burney, N. (1997) Microfiltration system as a pretreatment for RO units: Technical and economic assessment. Desalination 109(2), 165-175.
Eichhorn, S.J. and Sampson, W.W. (2005) Statistical geometry of pores and statistics of porous nanofibrous assemblies. Journal of The Royal Society Interface 2(4), 309-318.
Elwell, M.W. and Barbano, D.M. (2006) Use of Microfiltration to Improve Fluid Milk Quality. Journal of Dairy Science 89, Supplement(0), E20-E30.
EN_ISO:6222 (1999) Water quality – enumeration of culturable micro-organisms – colony count by inoculation in a nutrient agar culture medium.

141
EN_ISO:9308-1 (2000) Water quality – Detection and enumeration of Escherichia coli and coliform bacteria – Part1 :Membrane filtration method.
Fan, L., Harris, J.L., Roddick, F.A. and Booker, N.A. (2001) Influence of the characteristics of natural organic matter on the fouling of microfiltration membranes. Water Research 35(18), 4455-4463.
Fang, J., Niu, H., Lin, T. and Wang, X. (2008) Applications of electrospun nanofibers. Chinese Science Bulletin 53(15), 2265-2286.
Fashandi, H. and Karimi, M. (2012) Pore formation in polystyrene fiber by superimposing temperature and relative humidity of electrospinning atmosphere. Polymer 53(25), 5832-5849.
Fatarella, E., Iversen, V., Grinwis, S. and Paulussen , S. (2009) Textile material for membrane filtration AMADEUS Final Report.
Faust, M.A., Aotaky, A.E. and Hargadon, M.T. (1975) Effect of physical parameters on the in situ survival of Escherichia coli MC-6 in an estuarine environment. Appl Microbiol 30(5), 800-806.
Feng, Q.L., Wu, J., Chen, G.Q., Cui, F.Z., Kim, T.N. and Kim, J.O. (2000) A mechanistic study of the antibacterial effect of silver ions on Escherichia coli and Staphylococcus aureus. J Biomed Mater Res 52(4), 662-668.
Ferk, F., Misik, M., Hoelzl, C., Uhl, M., Fuerhacker, M., Grillitsch, B., Parzefall, W., Nersesyan, A., Micieta, K., Grummt, T., Ehrlich, V. and Knasmuller, S. (2007) Benzalkonium chloride (BAC) and dimethyldioctadecyl-ammonium bromide (DDAB), two common quaternary ammonium compounds, cause genotoxic effects in mammalian and plant cells at environmentally relevant concentrations. Mutagenesis 22(6), 363-370.
Field, R.W., Wu, D., Howell, J.A. and Gupta, B.B. (1995) Critical flux concept for microfiltration fouling. Journal of Membrane Science 100(3), 259-272.
Foley, G. (2013) Membrane Filtration: A Problem Solving Approach with MATLAB®, Cambridge University Press.
Ford, S.R. and Leach, F.R. (1998) Bioluminescence Methods and Protocols. LaRossa, R.A. (ed), pp. 3-20, Humana Press.
Fujishima, A. and Honda, K. (1972) Electrochemical photolysis of water at a semiconductor electrode. Nature 238(5358), 37-38.
Fujishima, A., Rao, T.N. and Tryk, D.A. (2000) Titanium dioxide photocatalysis. Journal of Photochemistry and Photobiology C-photochemistry Reviews 1(1), 1-21.
142
Fujishima, A., Zhang, X. and Tryk, D.A. (2008) TiO2 photocatalysis and related surface phenomena. Surface Science Reports 63(12), 515-582.
Gallucci, F., Basile, A. and Hai, F.I. (2011) Membranes for Membrane Reactors, pp. 1-61, John Wiley & Sons, Ltd.
Geldreich, E.E., Nash, H.D., Reasoner, D.J. and Taylor, R.H. (1972) The Necessity of Controlling Bacterial Populations in Potable Waters: Community Water Supply. American Water Works Association 64(9), 7.
GEwater (2014) Storage and care, guidelines, http://50.244.15.10/techlib/General%20Electric%20(GE)/GE_Preservation_&_storage_membrane_elements.pdf.
Ghaniyari-Benis, S., Borja, R., Monemian, S.A. and Goodarzi, V. (2009) Anaerobic treatment of synthetic medium-strength wastewater using a multistage biofilm reactor. Bioresource Technology 100(5), 1740-1745.
Girault, H.H. (1992) Basic principles of membrane technology : M. Mulder. Kluwer, Dordrecht, 1991, xii + 363 pp., Dfl. 200.00, US$ 129.00, £69.00. Journal of Electroanalytical Chemistry 322(1–2), 412-413.
Gopal, R., Kaur, S., Ma, Z., Chan, C., Ramakrishna, S. and Matsuura, T. (2006) Electrospun nanofibrous filtration membrane. Journal of Membrane Science 281(1–2), 581-586.
Gracia, E., Fernández, A., Conchello, P., Alabart, J.L., Pérez, M. and Amorena, B. (1999) In vitro development of Staphylococcus aureus biofilms using slime-producing variants and ATP-bioluminescence for automated bacterial quantification. Luminescence 14(1), 23-31.
Gómez, M., de la Rua, A., Garralón, G., Plaza, F., Hontoria, E. and Gómez, M.A. (2006) Urban wastewater disinfection by filtration technologies. Desalination 190(1–3), 16-28.
Hamid, N.A.A., Ismail, A.F., Matsuura, T., Zularisam, A.W., Lau, W.J., Yuliwati, E. and Abdullah, M.S. (2011) Morphological and separation performance study of polysulfone/titanium dioxide (PSF/TiO2) ultrafiltration membranes for humic acid removal. Desalination 273(1), 85-92.
He, T., Zhou, Z., Xu, W., Ren, F., Ma, H. and Wang, J. (2009) Preparation and photocatalysis of TiO2–fluoropolymer electrospun fiber nanocomposites. Polymer 50(13), 3031-3036.
Henze, M., van Loosdrecht, M.C.M., Ekama, G.A. and Brdjanovic, D. (2008) Biological wastewater treatment: principles, modeling and design. , IWA Publishing, London, UK.
143
Hoinkis, J., Deowan, S.A., Panten, V., Figoli, A., Huang, R.R. and Drioli, E. (2012) Membrane Bioreactor (MBR) Technology – a Promising Approach for Industrial Water Reuse. Procedia Engineering 33(0), 234-241.
Homaeigohar, S.S., Buhr, K. and Ebert, K. (2010) Polyethersulfone electrospun nanofibrous composite membrane for liquid filtration. Journal of Membrane Science 365, 68-77.
Hota, G., Kumar, B.R., Ng, W.J. and Ramakrishna, S. (2008) Fabrication and characterization of a boehmite nanoparticle impregnated electrospun fiber membrane for removal of metal ions. Journal of Materials Science 43(1), 212-217.
Houas, A., Lachheb, H., Ksibi, M., Elaloui, E., Guillard, C. and Herrmann, J.-M. (2001) Photocatalytic degradation pathway of methylene blue in water. Applied Catalysis B: Environmental 31(2), 145-157.
Howell, J.A., Chua, H.C. and Arnot, T.C. (2004) In situ manipulation of critical flux in a submerged membrane bioreactor using variable aeration rates, and effects of membrane history. Journal of Membrane Science 242(1–2), 13-19.
Hsu, B.-M. and Yeh, H.-H. (2003) Removal of Giardia and Cryptosporidium in drinking water treatment: a pilot-scale study. Water Research 37(5), 1111-1117.
Huang, Z., Maness, P.-C., Blake, D.M., Wolfrum, E.J., Smolinski, S.L. and Jacoby, W.A. (2000) Bactericidal mode of titanium dioxide photocatalysis. Journal of Photochemistry and Photobiology A: Chemistry 130(2–3), 163-170.
Huang, Z.-M., Zhang, Y.Z., Kotaki, M. and Ramakrishna, S. (2003) A review on polymer nanofibers by electrospinning and their applications in nanocomposites. Composites Science and Technology 63(15), 2223-2253.
Huang, Z.B., Zheng, X., Yan, D.H., Yin, G.F., Liao, X.M., Kang, Y.Q., Yao, Y.D., Huang, D. and Hao, B.Q. (2008) Toxicological effect of ZnO nanoparticles based on bacteria. Langmuir 24(8), 4140-4144.
Hwang, B.-K., Lee, W.-N., Park, P.-K., Lee, C.-H. and Chang, I.-S. (2007) Effect of membrane fouling reducer on cake structure and membrane permeability in membrane bioreactor. Journal of Membrane Science 288(1–2), 149-156.
Ikeda, K., Sakai, H., Baba, R., Hashimoto, K. and Fujishima, A. (1997) Photocatalytic Reactions Involving Radical Chain Reactions Using Microelectrodes†. The Journal of Physical Chemistry B 101(14), 2617-2620.
ISO:10678 (2010) Determination of photocatalytic activity of surfaces in an aqueous medium by degradation of methylene blue.

144
Iversen, V., Mohaupt, J., Drews, A., Lesjean, B. and Kraume, M. (2008) Side effects of flux enhancing chemicals in membrane bioreactors (MBRs): study on their biological toxicity and their residual fouling propensity. Water Sci Technol 57(1), 117-123.
Judd, S. (2011) The MBR Book (Second Edition). Judd, S. and Judd, C. (eds), pp. 55-207, Butterworth-Heinemann, Oxford.
Kampalanonwat, P. and Supaphol, P. (2010) Preparation and adsorption behavior of aminated electrospun polyacrylonitrile nanofiber mats for heavy metal ion removal. ACS Appl Mater Interfaces 2(12), 3619-3627.
Kandiel, T.A., Robben, L., Alkaim, A. and Bahnemann, D. (2013) Brookite versus anatase TiO2 photocatalysts: phase transformations and photocatalytic activities. Photochemical & Photobiological Sciences 12(4), 602-609.
Kasanen, J., Salstela, J., Suvanto, M. and Pakkanen, T.T. (2011) Photocatalytic degradation of methylene blue in water solution by multilayer TiO2 coating on HDPE. Applied Surface Science 258(5), 1738-1743.
Kim, S.H., Kwak, S.-Y., Sohn, B.-H. and Park, T.H. (2003) Design of TiO2 nanoparticle self-assembled aromatic polyamide thin-film-composite (TFC) membrane as an approach to solve biofouling problem. Journal of Membrane Science 211(1), 157-165.
Kim, S.J., Nam, Y.S., Rhee, D.M., Park, H.-S. and Park, W.H. (2007) Preparation and characterization of antimicrobial polycarbonate nanofibrous membrane. European Polymer Journal 43(8), 3146-3152.
Kimura, K., Hane, Y., Watanabe, Y., Amy, G. and Ohkuma, N. (2004) Irreversible membrane fouling during ultrafiltration of surface water. Water Research 38(14–15), 3431-3441.
Kobayakawa, K., Sato, C., Sato, Y. and Fujishima, A. (1998) Continuous-flow photoreactor packed with titanium dioxide immobilized on large silica gel beads to decompose oxalic acid in excess water. Journal of Photochemistry and Photobiology A: Chemistry 118(1), 65-69.
Kobayashi, T., Kobayashi, T., Hosaka, Y. and Fujii, N. (2003) Ultrasound-enhanced membrane-cleaning processes applied water treatments: influence of sonic frequency on filtration treatments. Ultrasonics 41(3), 185-190.
Kobayashi, T., Ono, M., Shibata, M. and Fujii, N. (1998) Cutoff performance of Escherichia coli by charged and noncharged polyacrylonitrile ultrafiltration membranes. Journal of Membrane Science 140(1), 1-11.
Koseoglu, H., Yigit, N.O., Iversen, V., Drews, A., Kitis, M., Lesjean, B. and Kraume, M. (2008) Effects of several different flux enhancing chemicals on filterability and fouling reduction of membrane bioreactor (MBR) mixed liquors. Journal of Membrane Science 320(1–2), 57-64.

145
Koseoglu-Imer, D.Y., Kose, B., Altinbas, M. and Koyuncu, I. (2013) The production of polysulfone (PS) membrane with silver nanoparticles (AgNP): Physical properties, filtration performances, and biofouling resistances of membranes. Journal of Membrane Science 428(0), 620-628.
Kriegel, C., Arecchi, A., Kit, K., McClements, D.J. and Weiss, J. (2008) Fabrication, functionalization, and application of electrospun biopolymer nanofibers. Crit Rev Food Sci Nutr 48(8), 775-797.
Lacour, C., Joannis, C., Gromaire, M.C. and Chebbo, G. (2009) Potential of turbidity monitoring for real time control of pollutant discharge in sewers during rainfall events. Water Sci Technol 59(8), 1471-1478.
Lakshmi, S., Renganathan, R. and Fujita, S. (1995) Study on TiO2-mediated photocatalytic degradation of methylene blue. Journal of Photochemistry and Photobiology A: Chemistry 88(2–3), 163-167.
Lazarova, V., Savoye, P., Janex, M.L., Blatchley Iii, E.R. and Pommepuy, M. (1999) Advanced wastewater disinfection technologies: State of the art and perspectives. Water Science and Technology 40(4–5), 203-213.
Le-Clech, P., Chen, V. and A.G. Fane, T. (2006a) Fouling in membrane bioreactors used in wastewater treatment. Journal of Membrane Science 284(1-2), 17-53.
Le-Clech, P., Chen, V. and Fane, T.A.G. (2006b) Fouling in membrane bioreactors used in wastewater treatment. Journal of Membrane Science 284(1–2), 17-53.
Lebleu, N., Roques, C., Aimar, P. and Causserand, C. (2009) Role of the cell-wall structure in the retention of bacteria by microfiltration membranes. Journal of Membrane Science 326(1), 178-185.
LeChevallier, M.W., Evans, T.M. and Seidler, R.J. (1981) Effect of turbidity on chlorination efficiency and bacterial persistence in drinking water. Appl Environ Microbiol 42(1), 159-167.
Lee, S., Aurelle, Y. and Roques, H. (1984) Concentration polarization, membrane fouling and cleaning in ultrafiltration of soluble oil. Journal of Membrane Science 19(1), 23-38.
Lee, W.-N., Chang, I.-S., Hwang, B.-K., Park, P.-K., Lee, C.-H. and Huang, X. (2007) Changes in biofilm architecture with addition of membrane fouling reducer in a membrane bioreactor. Process Biochemistry 42(4), 655-661.
Leiknes, T. and Ødegaard, H. (2007) The development of a biofilm membrane bioreactor. Desalination 202(1–3), 135-143.

146
Lenntech (2014) Membrane technology, http://www.lenntech.com/membrane-technology.htm.
Li, J., Zivanovic, S., Davidson, P.M. and Kit, K. (2010) Characterization and comparison of chitosan/PVP and chitosan/PEO blend films. Carbohydrate Polymers 79(3), 786-791.
Li, N.N., Fane, A.G., Ho, W.S.W. and Matsuura, T. (2011) Advanced Membrane Technology and Applications, Wiley.
Li, Q., Mahendra, S., Lyon, D.Y., Brunet, L., Liga, M.V., Li, D. and Alvarez, P.J.J. (2008) Antimicrobial nanomaterials for water disinfection and microbial control: Potential applications and implications. Water Research 42(18), 4591-4602.
Li, W.-J., Laurencin, C.T., Caterson, E.J., Tuan, R.S. and Ko, F.K. (2002) Electrospun nanofibrous structure: A novel scaffold for tissue engineering. Journal of Biomedical Materials Research 60(4), 613-621.
Li, X., Zhang, C., Zhao, R., Lu, X., Xu, X., Jia, X., Wang, C. and Li, L. (2013) Efficient adsorption of gold ions from aqueous systems with thioamide-group chelating nanofiber membranes. Chemical Engineering Journal 229(0), 420-428.
Li, X., Zhang, Y., Li, H., Chen, H., Ding, Y. and Yang, W. (2014) Effect of oriented fiber membrane fabricated via needleless melt electrospinning on water filtration efficiency. Desalination 344(0), 266-273.
Liang, D., Hsiao, B.S. and Chu, B. (2007) Functional electrospun nanofibrous scaffolds for biomedical applications. Advanced Drug Delivery Reviews 59(14), 1392-1412.
Liang, S., Xiao, K., Mo, Y. and Huang, X. (2012) A novel ZnO nanoparticle blended polyvinylidene fluoride membrane for anti-irreversible fouling. Journal of Membrane Science 394–395(0), 184-192.
Lim, A.L. and Bai, R. (2003) Membrane fouling and cleaning in microfiltration of activated sludge wastewater. Journal of Membrane Science 216(1–2), 279-290.
Lin, H., Huang, C.P., Li, W., Ni, C., Shah, S.I. and Tseng, Y.-H. (2006) Size dependency of nanocrystalline TiO2 on its optical property and photocatalytic reactivity exemplified by 2-chlorophenol. Applied Catalysis B: Environmental 68(1–2), 1-11.
Linsebigler, A.L., Lu, G. and Yates, J.T. (1995) Photocatalysis on TiO2 Surfaces: Principles, Mechanisms, and Selected Results. Chemical Reviews 95(3), 735-758.
Liu, M., Xiao, C. and Hu, X. (2011) Optimization of polyurethane-based hollow fiber membranes morphology and performance by post-treatment methods. Desalination 275(1–3), 133-140.

147
Liu, S., Lim, M. and Amal, R. (2014) TiO2-coated natural zeolite: Rapid humic acid adsorption and effective photocatalytic regeneration. Chemical Engineering Science 105(0), 46-52.
Liu, S. and Sun, G. (2008) Functional modification of poly(ethylene terephthalate) with an allyl monomer: Chemistry and structure characterization. Polymer 49(24), 5225-5232.
Liu, Y., He, L., Mustapha, A., Li, H., Hu, Z.Q. and Lin, M. (2009) Antibacterial activities of zinc oxide nanoparticles against Escherichia coli O157:H7. Journal of Applied Microbiology 107(4), 1193-1201.
Louie, J.S., Pinnau, I., Ciobanu, I., Ishida, K.P., Ng, A. and Reinhard, M. (2006) Effects of polyether–polyamide block copolymer coating on performance and fouling of reverse osmosis membranes. Journal of Membrane Science 280(1–2), 762-770.
Luo, Z., Wang, S. and Zhang, S. (2011) Fabrication of self-assembling d-form peptide nanofiber scaffold d-EAK16 for rapid hemostasis. Biomaterials 32(8), 2013-2020.
Lučić, M., Milosavljević, N., Radetić, M., Šaponjić, Z., Radoičić, M. and Kalagasidis Krušić, M. (2014) The potential application of TiO2/hydrogel nanocomposite for removal of various textile azo dyes. Separation and Purification Technology 122(0), 206-216.
Ma, N., Zhang, Y., Quan, X., Fan, X. and Zhao, H. (2010) Performing a microfiltration integrated with photocatalysis using an Ag-TiO2/HAP/Al2O3 composite membrane for water treatment: Evaluating effectiveness for humic acid removal and anti-fouling properties. Water Research 44(20), 6104-6114.
Madaeni, S.S., Fane, A.G. and Wiley, D.E. (1999) Factors influencing critical flux in membrane filtration of activated sludge. Journal of Chemical Technology & Biotechnology 74(6), 539-543.
Mallevialle, J., Odendaal, P.E., Foundation, A.R., Wiesner, M.R., Lyonnaise des, e.-D. and South Africa. Water Research, C. (1996) Water Treatment Membrane Processes, McGraw-Hill.
Markowska-Szczupak, A., Ulfig, K. and Morawski, A.W. (2011) The application of titanium dioxide for deactivation of bioparticulates: An overview. Catalysis Today 169(1), 249-257.
Mascolo, G., Comparelli, R., Curri, M.L., Lovecchio, G., Lopez, A. and Agostiano, A. (2007) Photocatalytic degradation of methyl red by TiO2: Comparison of the efficiency of immobilized nanoparticles versus conventional suspended catalyst. Journal of Hazardous Materials 142(1–2), 130-137.
Matthiasson, E. and Sivik, B. (1980) Concentration polarization and fouling. Desalination 35(0), 59-103.

148
Melo, L.F., Bott, T.R. and Bernardo, C.A. (1988) Fouling science and technology, Kluwer Academic Publishers, Dordrecht ; Boston.
Mendret, J., Guigui, C., Schmitz, P. and Cabassud, C. (2009) In situ dynamic characterisation of fouling under different pressure conditions during dead-end filtration: Compressibility properties of particle cakes. Journal of Membrane Science 333(1–2), 20-29.
Meng, F., Chae, S.-R., Drews, A., Kraume, M., Shin, H.-S. and Yang, F. (2009) Recent advances in membrane bioreactors (MBRs): Membranen fouling and previous termmembrane material. Water Research 43(6), 1-24.
Metcalf and Eddy (2003) Wastewater Engineering: Treatment and Reuse, McGraw-Hill Education.
Mihailović, D., Šaponjić, Z., Molina, R., Radoičić, M., Esquena, J., Jovančić, P., Nedeljković, J. and Radetić, M. (2011) Multifunctional properties of polyester fabrics modified by corona discharge/air RF plasma and colloidal TiO2 nanoparticles. Polymer Composites 32(3), 390-397.
Mihailović, D., Šaponjić, Z., Radoičić, M., Radetić, T., Jovančić, P., Nedeljković, J. and Radetić, M. (2010) Functionalization of polyester fabrics with alginates and TiO2 nanoparticles. Carbohydrate Polymers 79(3), 526-532.
Mille, Y., Beney, L. and Gervais, P. (2002) Viability of Escherichia coli after combined osmotic and thermal treatment: a plasma membrane implication. Biochimica et Biophysica Acta (BBA) - Biomembranes 1567(0), 41-48.
Miller, D.J., Araújo, P.A., Correia, P.B., Ramsey, M.M., Kruithof, J.C., van Loosdrecht, M.C.M., Freeman, B.D., Paul, D.R., Whiteley, M. and Vrouwenvelder, J.S. (2012) Short-term adhesion and long-term biofouling testing of polydopamine and poly(ethylene glycol) surface modifications of membranes and feed spacers for biofouling control. Water Research 46(12), 3737-3753.
Mills, A. and Le Hunte, S. (1997) An overview of semiconductor photocatalysis. Journal of Photochemistry and Photobiology A: Chemistry 108(1), 1-35.
Mota, M., Teixeira, J.A. and Yelshin, A. (2002) Influence of cell-shape on the cake resistance in dead-end and cross-flow filtrations. Separation and Purification Technology 27(2), 137-144.
Mujeriego, R. and Asano, T. (1999) The role of advanced treatment in wastewater reclamation and reuse. Water Science and Technology 40(4–5), 1-9.
Mulder, M. (1996) Basic principles of membrane technology, Kluwer academic publishers.

149
Munir, C. (1998) Ultrafiltration and Microfiltration Handbook, Technomic Publishing Company, Lancaster.
Nasreen, S.A., Sundarrajan, S., Nizar, S.A., Balamurugan, R. and Ramakrishna, S. (2013) Advancement in electrospun nanofibrous membranes modification and their application in water treatment. Membranes (Basel) 3(4), 266-284.
Nataraj, S.K., Kim, B.H., Yun, J.H., Lee, D.H., Aminabhavi, T.M. and Yang, K.S. (2008) Electrospun Nanocomposite Fiber Mats of Zinc-Oxide Loaded Polyacrylonitrile. Carbon Letters 9(2), 108-114.
Neghlani, P.K., Rafizadeh, M. and Taromi, F.A. (2011) Preparation of aminated-polyacrylonitrile nanofiber membranes for the adsorption of metal ions: comparison with microfibers. J Hazard Mater 186(1), 182-189.
Ng, K.-K., Wu, C.-J., Yang, H.-L., Panchangam, S.C., Lin, Y.-C., Hong, P.-K.A., Wu, C.-H. and Lin, C.-F. (2012) Effect of Ultrasound on Membrane Filtration and Cleaning Operations. Separation Science and Technology 48(2), 215-222.
Ng, L.Y., Mohammad, A.W., Leo, C.P. and Hilal, N. (2013) Polymeric membranes incorporated with metal/metal oxide nanoparticles: A comprehensive review. Desalination 308(0), 15-33.
Noble, R.D. and Stern, S.A. (1995) Membrane Separations Technology: Principles and Applications, Elsevier Science.
Nöthe, T., Fahlenkamp, H. and Sonntag, C.v. (2009) Ozonation of Wastewater: Rate of Ozone Consumption and Hydroxyl Radical Yield. Environmental Science & Technology 43(15), 5990-5995.
Ohno, T., Sarukawa, K., Tokieda, K. and Matsumura, M. (2001) Morphology of a TiO2 Photocatalyst (Degussa, P-25) Consisting of Anatase and Rutile Crystalline Phases. Journal of Catalysis 203(1), 82-86.
Onyango, L.A., Dunstan, R.H. and Roberts, T.K. (2010) Filterability of staphylococcal species through membrane filters following application of stressors. BMC Res Notes 3, 152.
Page, I.B. (2000) Polyamides as Engineering Thermoplastic Materials, Rapra Technology Limited.
Pant, H.R., Bajgai, M.P., Nam, K.T., Seo, Y.A., Pandeya, D.R., Hong, S.T. and Kim, H.Y. (2011) Electrospun nylon-6 spider-net like nanofiber mat containing TiO2 nanoparticles: A multifunctional nanocomposite textile material. Journal of Hazardous Materials 185(1), 124-130.

150
Pant, H.R., Pant, B., Pokharel, P., Kim, H.J., Tijing, L.D., Park, C.H., Lee, D.S., Kim, H.Y. and Kim, C.S. (2013) Photocatalytic TiO2–RGO/nylon-6 spider-wave-like nano-nets via electrospinning and hydrothermal treatment. Journal of Membrane Science 429(0), 225-234.
Parija (2009) Textbook of Microbiology & Immunology, Elsevier India Pvt. Limited.
Pearce, G. (2007a) Introduction to membranes: Manufacturers' comparison: part 1. Filtration & Separation 44(8), 36-38.
Pearce, G.K. (2007b) The case for UF/MF pretreatment to RO in seawater applications. Desalination 203(1–3), 286-295.
Pelipenko, J., Kristl, J., Janković, B., Baumgartner, S. and Kocbek, P. (2013) The impact of relative humidity during electrospinning on the morphology and mechanical properties of nanofibers. International Journal of Pharmaceutics 456(1), 125-134.
Peng, Y., Dong, Y., Fan, H., Chen, P., Li, Z. and Jiang, Q. (2013) Preparation of polysulfone membranes via vapor-induced phase separation and simulation of direct-contact membrane distillation by measuring hydrophobic layer thickness. Desalination 316(0), 53-66.
Pires, N.M. (2013) Recovery of Cryptosporidium and Giardia organisms from surface water by counter-flow refining microfiltration. Environ Technol 34(17-20), 2541-2551.
Pradhan, A.K., Das, D., Chattopadhyay, R. and Singh, S.N. (2013) Effect of 3D fiber orientation distribution on particle capture efficiency of anisotropic fiber networks. Powder Technology 249(0), 205-207.
Prasad, G.K., Agarwal, G.S., Singh, B., Rai, G.P. and Vijayaraghavan, R. (2009) Photocatalytic inactivation of Bacillus anthracis by titania nanomaterials. Journal of Hazardous Materials 165(1–3), 506-510.
Prince, J.A., Singh, G., Rana, D., Matsuura, T., Anbharasi, V. and Shanmugasundaram, T.S. (2012) Preparation and characterization of highly hydrophobic poly(vinylidene fluoride) – Clay nanocomposite nanofiber membranes (PVDF–clay NNMs) for desalination using direct contact membrane distillation. Journal of Membrane Science 397–398(0), 80-86.
Rahimpour, A., Jahanshahi, M., Mollahosseini, A. and Rajaeian, B. (2012) Structural and performance properties of UV-assisted TiO2 deposited nano-composite PVDF/SPES membranes. Desalination 285(0), 31-38.
Rahimpour, A., Jahanshahi, M., Rajaeian, B. and Rahimnejad, M. (2011) TiO2 entrapped nano-composite PVDF/SPES membranes: Preparation, characterization, antifouling and antibacterial properties. Desalination 278(1–3), 343-353.

151
Rai, M., Yadav, A. and Gade, A. (2009) Silver nanoparticles as a new generation of antimicrobials. Biotechnology Advances 27(1), 76-83.
Rajh, T., Chen, L.X., Lukas, K., Liu, T., Thurnauer, M.C. and Tiede, D.M. (2002) Surface Restructuring of Nanoparticles: An Efficient Route for Ligand−Metal Oxide Crosstalk. The Journal of Physical Chemistry B 106(41), 10543-10552.
Rajh, T., Ostafin, A.E., Micic, O.I., Tiede, D.M. and Thurnauer, M.C. (1996) Surface Modification of Small Particle TiO2 Colloids with Cysteine for Enhanced Photochemical Reduction: An EPR Study†. The Journal of Physical Chemistry 100(11), 4538-4545.
Ray, C., Melin, G. and Linsky, R.B. (2003) Riverbank Filtration: Improving Source-Water Quality, Springer.
Richardson, S.D. (1998) Drinking water disinfection by-products. In: Encyclopaedia of Environmental Analysis and Remediation, pp. 1398–1421, Wiley, New York.
Rincón, A.G. and Pulgarin, C. (2003) Photocatalytical inactivation of E. coli: effect of (continuous–intermittent) light intensity and of (suspended–fixed) TiO2 concentration. Applied Catalysis B: Environmental 44(3), 263-284.
Rizzo, L., Meric, S., Guida, M., Kassinos, D. and Belgiorno, V. (2009) Heterogenous photocatalytic degradation kinetics and detoxification of an urban wastewater treatment plant effluent contaminated with pharmaceuticals. Water Research 43(16), 4070-4078.
Sadr Ghayeni, S.B., Beatson, P.J., Fane, A.J. and Schneider, R.P. (1999) Bacterial passage through microfiltration membranes in wastewater applications. Journal of Membrane Science 153(1), 71-82.
Sawada, I., Fachrul, R., Ito, T., Ohmukai, Y., Maruyama, T. and Matsuyama, H. (2012) Development of a hydrophilic polymer membrane containing silver nanoparticles with both organic antifouling and antibacterial properties. Journal of Membrane Science 387–388(0), 1-6.
Saxena, N., Prabhavathy, C., De, S. and DasGupta, S. (2009) Flux enhancement by argon–oxygen plasma treatment of polyethersulfone membranes. Separation and Purification Technology 70(2), 160-165.
Schreuder-Gibson, H., Gibson, P., Senecal, K., Sennett, M., Walker, J., Yeomans, W., Ziegler, D. and Tsai Peter, P. (2002) Protective textile materials based on electrospun nanofibers. Journal of advanced materials 34(3), 44-55.
Schwinge, J., Neal, P.R., Wiley, D.E., Fletcher, D.F. and Fane, A.G. (2004) Spiral wound modules and spacers: Review and analysis. Journal of Membrane Science 242(1–2), 129-153.

152
Sclafani, A. and Herrmann, J.M. (1996) Comparison of the Photoelectronic and Photocatalytic Activities of Various Anatase and Rutile Forms of Titania in Pure Liquid Organic Phases and in Aqueous Solutions. The Journal of Physical Chemistry 100(32), 13655-13661.
Seneviratne, M. (2006) A Practical Approach to Water Conservation for Commercial and Industrial Facilities. Seneviratne, M. (ed), pp. 157-220, Elsevier, Oxford.
Shi, Q., Vitchuli, N., Nowak, J., Caldwell, J.M., Breidt, F., Bourham, M., Zhang, X. and McCord, M. (2011) Durable antibacterial Ag/polyacrylonitrile (Ag/PAN) hybrid nanofibers prepared by atmospheric plasma treatment and electrospinning. European Polymer Journal 47(7), 1402-1409.
Shi, X., Tal, G., Hankins, N.P. and Gitis, V. (2014) Fouling and cleaning of ultrafiltration membranes: A review. Journal of Water Process Engineering 1(0), 121-138.
Shiraishi, K., Koseki, H., Tsurumoto, T., Baba, K., Naito, M., Nakayama, K. and Shindo, H. (2009) Antibacterial metal implant with a TiO2-conferred photocatalytic bactericidal effect against Staphylococcus aureus. Surface and Interface Analysis 41(1), 17-22.
Shrivastava, S., Bera, T., Royl, A., Singh, G., Ramachandrarao, P. and Dash, D. (2007) Characterization of enhanced antibacterial effects of novel silver nanoparticles. , p. 8, Nanotechnology
Sill, T.J. and von Recum, H.A. (2008) Electrospinning: Applications in drug delivery and tissue engineering. Biomaterials 29(13), 1989-2006.
Smith, P.J., Vigneswaran, S., Hao Ngo, H., Ben-Aim, R. and Nguyen, H. (2005) A new approach to backwash initiation in membrane systems. Journal of Membrane Science 278(1-2), 381-389.
Soltani, P., Johari, M.S. and Zarrebini, M. (2014) Effect of 3D fiber orientation on permeability of realistic fibrous porous networks. Powder Technology 254(0), 44-56.
Sondi, I. and Salopek-Sondi, B. (2004) Silver nanoparticles as antimicrobial agent: a case study on E. coli as a model for Gram-negative bacteria. Journal of Colloid and Interface Science 275(1), 177-182.
Soroko, I. and Livingston, A. (2009) Impact of TiO2 nanoparticles on morphology and performance of crosslinked polyimide organic solvent nanofiltration (OSN) membranes. Journal of Membrane Science 343(1–2), 189-198.
Srivastava, S. (2003) Understanding Bacteria, Springer.

153
Stevenson, F.J. (1994) Humus Chemistry: Genesis, Composition, Reactions, 2nd Edition, Wiley, New York.
Suchecka, T., Biernacka, E. and Piatkiewicz, W. (2003) Microorganism Retention on Microfiltration Membranes. Filtration & Separation 40(8), 50-55.
Sun, Y. and Sun, G. (2002) Durable and regenerable antimicrobial textile materials prepared by a continuous grafting process. Journal of Applied Polymer Science 84(8), 1592-1599.
Tachikawa, T. and Majima, T. (2009) Single-molecule fluorescence imaging of TiO(2) photocatalytic reactions. Langmuir 25(14), 7791-7802.
Tan, K. and Obendorf, S.K. (2007) Fabrication and evaluation of electrospun nanofibrous antimicrobial nylon 6 membranes. Journal of Membrane Science 305(1–2), 287-298.
Tananaev, N.I. and Debolskiy, M.V. (2014) Turbidity observations in sediment flux studies: Examples from Russian rivers in cold environments. Geomorphology 218(0), 63-71.
Tchobanoglous, G., Burton, F.L., Stensel, H.D., Metcalf and Eddy (2003) Wastewater Engineering: Treatment and Reuse, McGraw-Hill Education.
Teng, C.K., Hawlader, M.N.A. and Malek, A. (2003) An experiment with different pretreatment methods. Desalination 156(1–3), 51-58.
Thavasi, V., Singh, G. and Ramakrishna, S. (2008) Electrospun nanofibers in energy and environmental applications. Energy & Environmental Science 1(2), 205-221.
Thompson, C.J., Chase, G.G., Yarin, A.L. and Reneker, D.H. (2007) Effects of parameters on nanofiber diameter determined from electrospinning model. Polymer 48(23), 6913-6922.
Thompson, R.C. (1984) Oxidation of peroxotitanium(IV) by chlorine and cerium(IV) in acidic perchlorate solution. Inorganic Chemistry 23(13), 1794-1798.
Tian, Y., Wu, M., Liu, R., Li, Y., Wang, D., Tan, J., Wu, R. and Huang, Y. (2011) Electrospun membrane of cellulose acetate for heavy metal ion adsorption in water treatment. Carbohydrate Polymers 83(2), 743-748.
Tsai, H.A., Ciou, Y.S., Hu, C.C., Lee, K.R., Yu, D.G. and Lai, J.Y. (2005) Heat-treatment effect on the morphology and pervaporation performances of asymmetric PAN hollow fiber membranes. Journal of Membrane Science 255(1–2), 33-47.
Uddin, M.J., Cesano, F., Bonino, F., Bordiga, S., Spoto, G., Scarano, D. and Zecchina, A. (2007) Photoactive TiO2 films on cellulose fibres: synthesis and characterization. Journal of Photochemistry and Photobiology A: Chemistry 189(2–3), 286-294.

154
UNDP (2006) Human Development Report 2006: coping with water scarcity. Challenge of the twenty-first century, UN-water, FAO.
Utracki, L.A. and Jamieson, A.M. (2011) Polymer physics: from suspensions to nanocomposites and beyond, John Wiley & Sons.
Uyguner, C.S. and Bekbolet, M. (2005) Evaluation of humic acid photocatalytic degradation by UV–vis and fluorescence spectroscopy. Catalysis Today 101(3–4), 267-274.
van Haandel, A. and Van Der Lubbe, J. (2007) Handbook Biological Waste Water Treatment-Design and Optimisation of Activated Sludge Systems, Webshop Wastewater Handbook.
Van Hulle, S.W., Audenaert, W., Decostere, B., Hogie, J. and Dejans, P. (2008) De Folk Festival Dranouter Case: Duurzame waterbehandeling van tijdelijke evenementen, p. 10, Afvalwaterwetenschap.
Vicentini, D.S., Smania Jr, A. and Laranjeira, M.C.M. (2010) Chitosan/poly (vinyl alcohol) films containing ZnO nanoparticles and plasticizers. Materials Science and Engineering: C 30(4), 503-508.
Viswanathan, V., Laha, T., Balani, K., Agarwal, A. and Seal, S. (2006) Challenges and advances in nanocomposite processing techniques. Materials Science and Engineering: R: Reports 54(5–6), 121-285.
Voets, J.P., Pipyn, P., Van Lancker, P. and Verstraete, W. (1976) Degradation of Microbicides under Different Environmental Conditions. Journal of Applied Bacteriology 40(1), 67-72.
Vrouwenvelder, J.S., van Paassen, J.A.M., Wessels, L.P., van Dam, A.F. and Bakker, S.M. (2006) The Membrane Fouling Simulator: A practical tool for fouling prediction and control. Journal of Membrane Science 281(1–2), 316-324.
Wan Ngah, W.S., Endud, C.S. and Mayanar, R. (2002) Removal of copper(II) ions from aqueous solution onto chitosan and cross-linked chitosan beads. Reactive and Functional Polymers 50(2), 181-190.
Wang, C., Liu, L.-L., Zhang, A.-T., Xie, P., Lu, J.-j. and Zou, X.-T. (2012) Antibacterial effects of zinc oxide nanoparticles on Escherichia coli K88. African Journal of Biotechnology 11, 10248-10254.
Wang, R., Guan, S., Sato, A., Wang, X., Wang, Z., Yang, R., Hsiao, B.S. and Chu, B. (2013) Nanofibrous microfiltration membranes capable of removing bacteria, viruses and heavy metal ions. Journal of Membrane Science 446(0), 376-382.
Wang, R., Hashimoto, K., Fujishima, A., Chikuni, M., Kojima, E., Kitamura, A., Shimohigoshi, M. and Watanabe, T. (1997) Light-induced amphiphilic surfaces. Nature 388(6641), 431-432.

155
Wang, Y., Hammes, F., Düggelin, M. and Egli, T. (2008) Influence of Size, Shape, and Flexibility on Bacterial Passage through Micropore Membrane Filters. Environmental Science & Technology 42(17), 6749-6754.
Wei, Q., Xu, Q., Cai, Y., Gao, W. and Bo, C. (2009) Characterization of polymer nanofibers coated by reactive sputtering of zinc. Journal of Materials Processing Technology 209(4), 2028-2032.
Wei, Q.F., Huang, F.L., Hou, D.Y. and Wang, Y.Y. (2006) Surface functionalisation of polymer nanofibres by sputter coating of titanium dioxide. Applied Surface Science 252(22), 7874-7877.
Wen, X., Ding, H., Huang, X. and Liu, R. (2004) Treatment of hospital wastewater using a submerged membrane bioreactor. Process Biochemistry 39(11), 1427-1431.
Westbroek, P., Van Camp, T., De Vrieze, S. and De Clerck, K. (2008) Production and use of laminated nanofibrous structures. PCT/EP2008/056050.
Wiszniowski, J., Robert, D., Surmacz-Gorska, J., Miksch, K. and Weber, J.-V. (2002) Photocatalytic decomposition of humic acids on TiO2: Part I: Discussion of adsorption and mechanism. Journal of Photochemistry and Photobiology A: Chemistry 152(1–3), 267-273.
Wozniak, T. (2010) MBR design and operation using MPE-technology (Membrane Performance Enhancer). Desalination 250(2), 723-728.
Wu, J., Le-Clech, P., M. Stuetz, R., G. Fane, A. and Chen, V. (2008a) Effects of relaxation and backwashing conditions on fouling in membrane bioreactor. Journal of Membrane Science 324(1-2), 26-32.
Wu, J., Le-Clech, P., M. Stuetz, R., G. Fane, A. and Chen, V. (2008b) Novel filtration mode for fouling limitation in membrane bioreactors. Water Research 42(1-4), 3677-3684.
Xie, J. and Wang, C.H. (2006) Electrospun micro- and nanofibers for sustained delivery of paclitaxel to treat C6 glioma in vitro. Pharm Res 23(8), 1817-1826.
Xu, Z., Gu, Q., Hu, H. and Li, F. (2008) A novel electrospun polysulfone fiber membrane:f application to advanced treatment of secondary bio-treatment sewage. Environmental Technology 29(1), 13-21.
Yamamura, H., Kimura, K. and Watanabe, Y. (2007) Mechanism Involved in the Evolution of Physically Irreversible Fouling in Microfiltration and Ultrafiltration Membranes Used for Drinking Water Treatment. Environmental Science & Technology 41(19), 6789-6794.
Yang, J.M., Su, W.Y., Leu, T.L. and Yang, M.C. (2004) Evaluation of chitosan/PVA blended hydrogel membranes. Journal of Membrane Science 236(1–2), 39-51.

156
Yang, W., Cicek, N. and Ilg, J. (2006) State-of-the-art of membrane bioreactors: Worldwide research and commercial applications in North America. Journal of Membrane Science 270(1–2), 201-211.
Yongquan, D., Ming, W., Lin, C. and Mingjun, L. (2012) Preparation, characterization of P(VDF-HFP)/[bmim]BF4 ionic liquids hybrid membranes and their pervaporation performance for ethyl acetate recovery from water. Desalination 295(0), 53-60.
Yoon, K.Y., Hoon Byeon, J., Park, J.H. and Hwang, J. (2007) Susceptibility constants of Escherichia coli and Bacillus subtilis to silver and copper nanoparticles. Sci Total Environ 373(2-3), 572-575.
Yoon, S., Collins, J., Musale, D., Sundararajan, S., Tsai, S., Hallsby, G., Kong, J., Koppes, J. and Cachia, P. (2005) Effects of flux enhancing polymer on the characteristics of sludge in membrane bioreactor process., p. 8, Water science and technology.
Zhang, T.C., Surampalli, R.Y., Vigneswaran, S., Tyagi, R.D., Ong, S.L. and Kao, C.M. (2012) Membrane Technology and Environmental Applications, American Society of Civil Engineers.
Zhang, X., Du, A.J., Lee, P., Sun, D.D. and Leckie, J.O. (2008a) Grafted multifunctional titanium dioxide nanotube membrane: Separation and photodegradation of aquatic pollutant. Applied Catalysis B: Environmental 84(1–2), 262-267.
Zhang, X., Du, A.J., Lee, P., Sun, D.D. and Leckie, J.O. (2008b) TiO2 nanowire membrane for concurrent filtration and photocatalytic oxidation of humic acid in water. Journal of Membrane Science 313(1–2), 44-51.
Zhang, X., Zhang, T., Ng, J. and Sun, D.D. (2009) High-Performance Multifunctional TiO2 Nanowire Ultrafiltration Membrane with a Hierarchical Layer Structure for Water Treatment. Advanced Functional Materials 19(23), 3731-3736.
Zhang, Z., Qu, Y., Li, X., Zhang, S., Wei, Q., Shi, Y. and Chen, L. (2014) Electrophoretic deposition of tetracycline modified silk fibroin coatings for functionalization of titanium surfaces. Applied Surface Science 303(0), 255-262.
Zhang, Z., Wang, C.-C., Zakaria, R. and Ying, J.Y. (1998) Role of Particle Size in Nanocrystalline TiO2-Based Photocatalysts. The Journal of Physical Chemistry B 102(52), 10871-10878.
Zhou, F.-L., Gong, R.-H. and Porat, I. (2009) Mass production of nanofibre assemblies by electrostatic spinning. Polymer International 58(4), 331-342.
Zhou, J., Cheng, Y. and Yu, J. (2011) Preparation and characterization of visible-light-driven plasmonic photocatalyst Ag/AgCl/TiO2 nanocomposite thin films. Journal of Photochemistry and Photobiology A: Chemistry 223(2–3), 82-87.

157
Zodrow, K., Brunet, L., Mahendra, S., Li, D., Zhang, A., Li, Q. and Alvarez, P.J.J. (2009) Polysulfone ultrafiltration membranes impregnated with silver nanoparticles show improved biofouling resistance and virus removal. Water Research 43(3), 715-723.