For Peer Review - Biblio UGent
52
For Peer Review Seasonal variations in the functional performance of industrial low-moisture part-skim Mozzarella over a 1.5 year period Journal: Journal of Dairy Science Manuscript ID JDS.2020-19047.R1 Article Type: Research Date Submitted by the Author: n/a Complete List of Authors: To, Chak Ming; Ghent University, Green Chemistry and Technology Vermeir, Lien; Ghent University, Green Chemistry and Technology Kerkaert, Barbara; Milcobel CV, Dairy Products and Ingredients Van Gaver, Dirk; Milcobel CV, Dairy Products and Ingredients Van der Meeren, Paul; Gent University, Particle and Interfacial Technology Group Guinee, Tim; Teagasc, Food Chemistry and Technology, Moorepark Key Words: low-moisture part-skim Mozzarella, cheese characteristics, principal component analysis, process variability ScholarOne support: (434) 964 4100 Journal of Dairy Science
-
Upload
khangminh22 -
Category
Documents
-
view
0 -
download
0
Transcript of For Peer Review - Biblio UGent

For Peer ReviewSeasonal variations in the functional performance of
industrial low-moisture part-skim Mozzarella over a 1.5 year period
Journal: Journal of Dairy Science
Manuscript ID JDS.2020-19047.R1
Article Type: Research
Date Submitted by the Author: n/a
Complete List of Authors: To, Chak Ming; Ghent University, Green Chemistry and TechnologyVermeir, Lien; Ghent University, Green Chemistry and TechnologyKerkaert, Barbara; Milcobel CV, Dairy Products and IngredientsVan Gaver, Dirk; Milcobel CV, Dairy Products and IngredientsVan der Meeren, Paul; Gent University, Particle and Interfacial Technology GroupGuinee, Tim; Teagasc, Food Chemistry and Technology, Moorepark
Key Words: low-moisture part-skim Mozzarella, cheese characteristics, principal component analysis, process variability
ScholarOne support: (434) 964 4100
Journal of Dairy Science

For Peer Review
1
INTERPRETIVE SUMMARY 1
First author’s last name: To 2
Title: Seasonal Variations in the Functional Performance of Industrial Low-Moisture 3
Part-Skim Mozzarella over a 1.5 year Period 4
Low-moisture part-skim Mozzarella is used in the pizza-industry as a cheese topping because of 5
its desirable melt and stretch properties upon cooking. The current study investigated the 6
relationships between the physicochemical and functional properties of low-moisture part-skim 7
Mozzarella, which was manufactured according to a standardized procedure on industrial scale. In 8
addition, specific attention was paid to the variability in the functional performance of the cheese 9
during storage. Our study identified variation in calcium content of the cheese as the major factor 10
responsible for vat-to-vat variation in cheese quality. We recommend a tight control of the calcium 11
level to obtain a more consistent quality. 12
Page 1 of 51
ScholarOne support: (434) 964 4100
Journal of Dairy Science

For Peer Review
2
VARIATIONS IN QUALITY OF INDUSTRIAL MOZZARELLA 13
14
Seasonal variations in the functional performance of industrial low-moisture part-15
skim Mozzarella over a 1.5 year period 16
C. M. To*†‡, L. Vermeir†, B. Kerkaert*, D. Van Gaver*, P. Van der Meeren† and T. P. Guinee‡ 17
*Milcobel CV, DPI: Dairy Products and Ingredients, Kallo, Belgium 18
†Particle and Interfacial Technology Group, Department of Green Chemistry and Technology, 19
Faculty of Bioscience Engineering, Ghent University, Ghent, Belgium 20
‡Department of Food Chemistry and Technology, Teagasc Food Research Centre Moorepark, 21
Fermoy, Co. Cork, Ireland 22
23
Corresponding author: Chak Ming To 24
Mailing address: Particle and Interfacial Technology Group, Department of Green Chemistry and 25
Technology, Faculty of Bioscience Engineering, Ghent University, Coupure Links 653, Building 26
B3, Ghent 9000, Belgium 27
E-mail: [email protected] 28
Phone: +32 9 260 99 43 29
Page 2 of 51
ScholarOne support: (434) 964 4100
Journal of Dairy Science

For Peer Review
3
ABSTRACT 30
Seventy-five blocks of low-moisture part-skim (LMPS) Mozzarella cheese were procured from an 31
industrial cheese plant, and the relationships between the physicochemical and functional 32
properties were evaluated during refrigerated storage. In total, cheeses were obtained from 1 cheese 33
vat on 7 different production dates, at two- to four monthly intervals, over a 1.5 year period; all 34
cheeses were made using a standard recipe. The cheeses were held at 4°C for 0, 1, 2, 4, 8, 16 or 32 35
d and assayed for composition, primary proteolysis, serum distribution, texture profile analysis, 36
heat-induced changes in viscoelastic behavior, cheese extensibility and melt characteristics. The 37
results demonstrated a substantial increase in serum uptake by the calcium-phosphate para-casein 38
matrix between 1 and 16 d of storage with a concomitant improvement in the functional 39
performance of the cheese. Extending the storage time to 32 d resulted in further changes in the 40
functional quality, concurrent with ongoing increases in protein hydration and primary proteolysis. 41
Differences in the measured characteristics between the cheeses obtained on different sampling 42
occasions were evident. Principal component analysis separated the cheeses based on their variance 43
in functional performance, which was found to be correlated mainly with the calcium content of 44
the cheese. The results indicate that the manufacturing process should be tightly controlled to 45
minimize variation in calcium content, and enhance the quality consistency of the cheese. 46
47
Key Words: low-moisture part-skim Mozzarella, cheese characteristics, principal component 48
analysis, process variability 49
Page 3 of 51
ScholarOne support: (434) 964 4100
Journal of Dairy Science

For Peer Review
4
INTRODUCTION 50
Low-moisture part-skim Mozzarella (LMPS) is a plasticized cheese, with a structure typically 51
described as a fibrous calcium-phosphate para-casein network with occluded pools of serum and 52
fat (Oberg et al., 1993). Plasticization is typically achieved by displacing the contiguous planes of 53
the fat-filled calcium-phosphate para-casein matrix of the fermented curd (pH ~5.1 to 5.3) by 54
heating (~58 to 62°C), kneading and stretching the curd in hot water or dilute brine (Fox et al., 55
2017). The supplied thermomechanical energy alters the interactions between proteins and bestows 56
the cheese with the ability to form extendable strands and undergo limited oiling-off when 57
subsequently baked on a pizza (McMahon and Oberg, 2017; Sharma et al., 2016). 58
According to several researchers, understanding the development of the curd structure during 59
manufacturing and the overall interactions between the para-casein fibers could help in optimizing 60
the functional quality of the cheese (Oberg et al., 1993; Feeney et al., 2001; Lucey et al., 2003). 61
These linkages between facing casein polymers include calcium phosphate bridges between 62
colloidal calcium phosphate and phosphoserine residues, calcium bridges between calcium ions 63
and dissociated amino acid residues, and hydrophobic attractions between hydrophobic protein 64
domains (McMahon et al., 1999; Lucey et al., 2003; Fox et al., 2017). The overall balance of 65
interactions is likely to be affected by many factors including cheese composition (e.g., pH, content 66
of protein, moisture, fat and calcium), degree of proteolysis, shear work input during curd 67
stretching and curd temperature during manufacturing, storage and cheese application. Smith et al. 68
(2017) investigated the effects of refrigerated storage on the microstructure of a 10 kg industrial 69
Mozzarella cheese block, and demonstrated how changes in hydrophobic interactions and 70
proteolytic breakdown were significant drivers in the alteration of the calcium-phosphate para-71
casein matrix. In particular, free moisture, as measured by 1H-NMR relaxometry, was gradually 72
taken up by the para-casein matrix within 20 days after manufacturing of the cheese, with a 73
Page 4 of 51
ScholarOne support: (434) 964 4100
Journal of Dairy Science
Administrator
Markering
Administrator
Markering

For Peer Review
5
concomitant weakening of the hydrophobic interactions. These results were in agreement with 74
those of Kuo and Gunasekaran (2009) and McMahon et al. (1999) who investigated the 75
microstructure of LMPS Mozzarella cheeses during 14 or 21 d storage at 4°C using scanning 76
electron microscopy, and described how the uptake of moisture resulted in swelling of the calcium-77
phosphate para-casein matrix, and the formation of a reticular network of distinctly defined flat 78
globules occluded by the para-casein matrix. Similarly, Gianferri et al. (2007) reported substantial 79
displacement of ‘serum water’, described as the accumulated water in protein fiber channels, to 80
‘junction zone water’, described as the water that could be seen as an integral part of the protein 81
structure, in retail Mozzarella di Bufala Campana cheese (moisture content of 55 to 60%, wt/wt) 82
during storage at 8°C for 7 d. 83
Other studies focused on the biochemical and thermophysical (functional, baking) properties of 84
LMPS Mozzarella during refrigerated storage. Increasing storage temperature of LMPS Mozzarella 85
from 0 to 15°C over a 70 d period resulted in more rapid depletion of expressible serum during the 86
first 20 d, higher primary proteolysis and flow over 70 d, and higher extensibility after 5 to 20 d 87
(Feeney et al., 2001; Guinee et al., 2001). Similar effects of storage time on the functional 88
performance have been reported for LMPS Mozzarella cheeses, manufactured on pilot-scale 89
(Guinee et al., 2002; Dave et al., 2003; Imm et al., 2003; Banville et al., 2013). 90
Previous studies (Smith et al., 2017; Vermeir et al., 2019) evaluated storage-related changes in 91
industrial LMPS Mozzarella using 1H-NMR relaxometry, but did not relate these changes to the 92
concurrent changes in other physicochemical or functional characteristics. The objectives of the 93
current study were firstly to establish the relationships between the biochemical, water-distribution, 94
and functional characteristics in industrial LMPS Mozzarella cheeses during storage at 4°, and 95
secondly to monitor inter-vat variability in these characteristics between the cheeses sampled on 7 96
different production dates over a 1.5 year period. Identifying the source of this variability could 97
Page 5 of 51
ScholarOne support: (434) 964 4100
Journal of Dairy Science

For Peer Review
6
afford manufacturers with a clearer view of the factors that impact quality, and thereby assist the 98
production of cheese with a more consistent quality. 99
100
MATERIALS AND METHODS 101
Manufacturing of LMPS Mozzarella 102
LMPS Mozzarella was manufactured at Milcobel CV (Langemark, Belgium) following a 103
standardized procedure. Milk was standardized to a fat content of 2.8% (wt/wt), pasteurized, cooled 104
to 35°C, pumped to the cheese vat, and inoculated with a freeze-dried culture (Streptococcus 105
thermophilus). CaCl2 (33%, wt/wt) was added to a final concentration of 0.42 mM Ca. A 106
commercial liquid microbial coagulant EC 3.4.23.23 (endopeptidase derived from Rhizumucor 107
miehei) was dosed at a level of 23.83 IMCU.L-1 milk. The milk was allowed to stand for 108
approximately 30 min during which time it gelled. The gel was cut into curd grains, and the curd-109
whey mixture was stirred for ~20 min, and cooked at 39°C for ~20 min. After curd cooking, the 110
whey was drained and the curd grains were collected on a transport belt and held at 35°C to promote 111
curd dehydration and acidification, which resulted in fusing of the curd grains into a consolidated 112
curd mass. When the curd attained a pH of 5.05 to 5.25, it was milled, diced, heated to 62°C using 113
a water-steam mixture, and kneaded and stretched mechanically into hot uniform molten mass. The 114
stretched curd was extruded into a mat, sprinkled with salt (0.9%, wt/wt), moulded into blocks 115
(2.5kg; 28 cm x 10 cm x 8 cm) and held in a brining bath at 4°C until the core of the cheeses was 116
cooled down to 4°C. After brining, the cheese blocks were rinsed with water, packaged and stored 117
at 4°C. 118
Experimental Analysis 119
Production. Every two to four months over a period of 16 months (November 2017 - February 120
2019), a cheese vat (coded A, B, C, D, E, F and G, resp.) was sampled to determine the effects of 121
Page 6 of 51
ScholarOne support: (434) 964 4100
Journal of Dairy Science
Administrator
Markering
Administrator
Markering

For Peer Review
7
variability in milk composition, cheese pH at different stages of manufacture, and cheese 122
composition on the functional characteristics of the cheese. Every production was done with the 123
same thermophilic starter culture and commercial rennet, and the process was operated under 124
standardized conditions (time, temperature and amount of water-steam mixture injected during 125
curd plasticization). 126
Sampling. For each production date, the milk was stirred and sampled before rennet was added. 127
A sample of the curd-whey mixture was collected during whey drainage, such that the sample 128
corresponded to the middle of the cheese vat. A portion of the fermented curd was sampled from 129
the transport belt before milling, such that the sample corresponded to the middle of the cheese vat. 130
The milk, curd-whey and curd samples were analyzed for pH (Knick, 765 Laboratory pH meter, 131
SE 503 pH sensor, Berlin, Germany) directly after sampling; the results were denoted as pHrenneting, 132
pHdrainage and pHmilling, respectively. The milk samples were stored at 4°C for less than 8 h and 133
analyzed for fat and protein (Milcoscan FT2, Foss, Hilleroed, Denmark). 134
Consecutive cheese blocks were removed at the end of the production line, such that the sampled 135
blocks corresponded to the middle of the cheese vat. This was chosen to minimize the inter-block 136
variability between cheeses taken from the same vat. After sampling, the cheeses were sealed in 137
plastic vacuum bags, and stored at 4°C for up to 32 d. A total of 75 industrial cheese blocks were 138
sampled. An overview of the sampling pattern of the blocks per production date and per storage 139
time is given in Table 1. The serum distribution was evaluated in separate cheese blocks due to the 140
difference in location between the analytical instruments. 141
Cheese Composition. Grated LMPS Mozzarella was analyzed for moisture, fat, total N, salt, Ca 142
and pH, as described previously (To, et al., 2020). Moisture, fat and pH were measured in duplicate 143
on each cheese block. Total N, salt and Ca were measured in duplicate on each cheese block from 144
vat A during storage. For the subsequent cheese vats (vats B, C, D, E, F and G), the contents of 145
Page 7 of 51
ScholarOne support: (434) 964 4100
Journal of Dairy Science

For Peer Review
8
total N, salt and Ca were analyzed in duplicate on at least four cheese blocks after 2 or 4 d of 146
storage. 147
Soluble Ca and pH 4.6 Soluble N. The levels of soluble Ca and pH 4.6 Soluble N (pH4.6SN) 148
were determined on a water-soluble extract of the cheese, as described previously by To et al. 149
(2020). Serum-soluble Ca was expressed as a percentage of the total cheese Ca content and 150
pH4.6SN was expressed as a percentage of total cheese N. Measurements were performed in 151
duplicate per cheese block. 152
Time Domain 1H NMR Relaxometry. The T2 relaxation time distribution of LMPS Mozzarella 153
was evaluated by low-field NMR on a benchtop Maran Ultra spectrometer (Oxford instruments, 154
Abingdon, UK), operating at 0.55T (23.4 MHz for 1H). The method was described by Vermeir et 155
al. (2019) who distinguished three serum fractions comprising liquid oil protons and water protons 156
in LMPS Mozzarella with different T2 relaxation times. The serum fraction characterized by a T2 > 157
60 ms was ascribed to weakly interacting serum protons and could be interpreted as ‘more-mobile-158
serum’, whereas the other serum fractions, characterized by T2 < 3 ms or T2 ≈ 10 ms, were 159
interpreted as ‘less-mobile-serum’. In this study, the integrated signal intensity of the less-mobile-160
serum fractions, A3ms and A10ms, and the more-mobile-serum fraction, A60ms, were reported. A3ms 161
and A10ms were indicative of serum that interacted with the calcium-phosphate para-casein network 162
of the cheese, whereby shorter T2 times indicated stronger interactions. Triplicate measurements 163
were performed at two separate locations in one Mozzarella block after 0, 1, 2, 4, 8, 16 or 32 d 164
storage at 4°C, sampled from vats A, B or G (Table 1). The data were used to monitor the behavior 165
of cheese serum during refrigerated storage and its relation to the functional performance of the 166
cheese. 167
Page 8 of 51
ScholarOne support: (434) 964 4100
Journal of Dairy Science

For Peer Review
9
Functional Properties. The methods for assaying the functional performance of the cheese have 168
been described previously in detail (To et al., 2020), and are summarized below. 169
Texture Profile Analysis. Cheese cubes (25 mm x 25 mm x 25 mm) were loaded individually 170
on a TAHdi texture analyzer fitted with a 100 kg load cell (Stable Micro Systems, Goldalming, 171
UK), and compressed in two consecutive bites at a speed of 1 mm.s-1 to 60% of its original height. 172
The following characteristics were reported: maximum compression force recorded during bite 1 173
(firmness), the ratio of height to which the cube was compressed at the start of bite 2 relative to the 174
sample’s original height (springiness), the ratio of work required to compress the cube in bite 2 175
relative to that of bite 1 (cohesiveness) and the product of firmness x springiness x cohesiveness 176
(chewiness). Measurements were performed in sextuplicate per cheese block. 177
Extensibility of the Heated Cheese. Shredded cheese was heated to 95°C and the molten curd 178
(85-95°C) was loaded on a TAHDi texture analyzer (Stable Micro Systems, Goldalming, UK) and 179
uniaxially extended at a rate of 10 mm.s-1 to a height of 380 mm. Extension work (EW) was defined 180
as the cumulative work required to extend the hot molten cheese, directly after heating (EW0) and 181
after allowing the cheese to cool down for 5 minutes at room temperature (EW5). EW0 and EW5 182
were measured in triplicate and in duplicate per cheese block, respectively. EW5 was used to 183
simulate the impact of cooling-induced stiffening of molten cheese on a pizza during consumption 184
and was assessed for cheeses sampled from vats C, D, E, F and G. 185
Heat-induced Changes in Viscoelastic Behavior. Cheese discs (50 mm diameter; 2 mm 186
thickness) were placed between parallel cross-hatched plates (PP50/P2-SN27902; INSET I-187
PP50/SS/P2) on a strain-controlled rheometer (MCR501, Anton Paar GmbH, Graz, Austria), 188
subjected to a low amplitude shear strain (γ = 0.0063) at an angular frequency of 1 Hz and heated 189
from 25°C to 90°C. The cross-over temperature (COT), corresponding to the point at which the 190
Page 9 of 51
ScholarOne support: (434) 964 4100
Journal of Dairy Science

For Peer Review
10
cheese transitioned from the solid phase into the liquid phase, and the maximum value of the loss 191
tangent (LTmax), an index for the fluidity of the cheese during heating, were reported. 192
Measurements were performed in duplicate per cheese block. 193
Flow. Cheese discs (45 mm diameter; 4 mm thickness) were heated at 280°C for 4 minutes in a 194
convection oven (Binder FD 35, Binder GmbH, Tuttlingen, Germany). Flow was defined as the 195
percentage increase in mean diameter during heating. Measurements were performed in 196
quadruplicate per cheese block. 197
198
Statistical Analysis 199
LMPS Mozzarella was manufactured on seven different production dates according to a 200
standardized procedure. The cheeses from the different production dates were analyzed for changes 201
in physicochemical and functional characteristics during storage, and the data were analyzed using 202
a randomized incomplete block design incorporating storage time as the treatment and 7 blocks 203
(replicate trials). JMP 14 statistical software package was used to determine significant differences 204
between mean compositional values of cheeses obtained from different vats by One-way ANOVA 205
and Tukey’s HSD post-hoc test. 206
The relationships between the physicochemical (A3ms, pH, serum-soluble Ca and pH4.6SN) and 207
functional (firmness, COT, LTmax, EW0 and flow) characteristics of the cheeses during storage at 208
4°C were evaluated using simple linear regression analysis, and the significance was determined 209
by application of an F-test with n – 2 df. 210
The variability in the characteristics of the cheeses during storage at 4°C was evaluated using 211
principal component analysis (PCA), which identifies linear combinations of correlated variables, 212
i.e., principal components, while retaining the highest amount of variability among the studied 213
Page 10 of 51
ScholarOne support: (434) 964 4100
Journal of Dairy Science

For Peer Review
11
variables. First, the Kaiser-Meyer-Olkin (KMO) test and Bartlett's test of sphericity were used to 214
test the sampling adequacy and the degree of correlation between variables, respectively. The KMO 215
test measures the proportion of variance that could be attributed to underlying principle 216
components whereas the Bartlett's test of sphericity tests the correlation matrix against the identity 217
matrix. PCA was performed when the KMO value was larger than 0.6 and when the Bartlett’s test 218
of sphericity returned significant at P < 0.05, and the minimal number of principal components was 219
derived based on Eigenvalues larger than 1, Skree plot analysis and the cumulative percentage of 220
variance explained. Varimax rotation was used to obtain principal components that were not 221
correlated, and to reduce the amount of variables. 222
Two-way ANOVA was then used to determine the effects of variations in the composition, storage 223
time at 4°C and their interactions on the functional performance-related components, separately. 224
The level of significance was determined at α = 0.05 throughout. For each functional performance-225
related component, the ‘fit model’ function of JMP 14 was used to fit a linear model to the variables 226
that were found to have a significant effect. 227
Page 11 of 51
ScholarOne support: (434) 964 4100
Journal of Dairy Science

For Peer Review
12
RESULTS AND DISCUSSION 228
In-line Process Analysis 229
The mean fat and protein content of the milk used for cheese-making was 2.83% and 3.67%, 230
respectively. The variability in the contents of fat and protein at the seven different production 231
dates over the 1.5 year period is indicated by the difference between the maximum and minimum 232
value of the measured data, divided by the average (Table 2), and reflects the width of the 233
distribution for a given average on the condition that the data is normally distributed and no 234
significant outliers are present. The milk protein content showed a variability of 8.4% in the current 235
study, which was consistent with the data reported by Eurostat (2020), which reported a variability 236
of 7.6% in the protein content (in non-fat dry matter) of Belgian raw milk for the year 2019, and 237
reflects the natural variation associated with differences in breed, feed type, season or stage of 238
lactation. Walstra et al. (2006) reported that the fat content in raw milk showed the highest 239
variability among all milk constituents. As legal “Standards of Identity” impose FDM 240
specifications on many cheese varieties, this highlights the importance of fat standardization for 241
cheese-making (Fox et al., 2017). 242
The curd becomes suitable for plasticization when sufficient Ca is released from the calcium-243
phosphate para-casein network, and is governed by the values for pHrenneting, pHdrainage and pHmilling 244
which upon decrease promote solubilization of colloidal Ca by displacement with acidic protons 245
(Fox et al., 2017; McMahon and Oberg, 2017). The former two values are critical for mediating 246
the total calcium content of the curd, and hence the pH of the curd at which sufficient Ca is released 247
(Kindstedt et al., 2004; McMahon and Oberg, 2017). Typical pHdrainage and pHmilling values of 6.20 248
to 6.00 and 5.15 to 5.30 are reported, in respective order, for the production of LMPS Mozzarella 249
(Fox et al., 2017; McMahon and Oberg, 2017). The mean values for pHrenneting, pHdrainage and 250
pHmilling over the seven cheese-making days in the present study were 6.54, 6.37 and 5.15 for this 251
Page 12 of 51
ScholarOne support: (434) 964 4100
Journal of Dairy Science
Administrator
Markering

For Peer Review
13
particular long shelf life recipe, respectively. The average pHdrainage applied by the plant in this 252
study was relatively high, and a pHmilling near the lower limit was required in order to plasticize the 253
curd. The mean Ca content of the resulting cheeses in this study (29.9 mg Ca.g-1 protein) was 254
relatively high when compared to those reported by Guinee et al. (2000), who evaluated the 255
composition of 8 commercial low-moisture Mozzarella cheeses (22.6 to 31.1 mg Ca.g-1 protein), 256
and thus reflects the wide range of pHrenneting, pHdrainage and pHmilling applied in commercial practices. 257
All cheeses conformed to the specifications of dry matter (DM) and fat-in-dry matter (FDM) for 258
low-moisture part-skim Mozzarella, as defined by the Code of federal regulation (48%, w/w < DM 259
< 55%, w/w; 30%, w/w < FDM < 45%, w/w) (FDA, 2020). The mean values for the contents of 260
DM, FDM, moisture-non-fat-substances (MNFS), salt-in-moisture (S/M) and Ca differed between 261
production dates at P < 0.05, with S/M and Ca showing the highest variability. Variability likely 262
reflects differences in milk composition (levels of protein, fat, lactose and Ca; pH) and 263
manufacturing process (ratio of added rennet and starter culture to milk casein content, starter 264
culture activity, pH at different stages of manufacture) across the cheesemaking season (Chen et 265
al., 2014; Lin et al., 2017; Gulati et al., 2018, 2019). Such factors predetermine the composition 266
and, ultimately, the biochemical and functional properties of the cheese (Fox et al., 2017). The 267
relatively high variability between different production dates for Ca and S/M is consistent with that 268
previously reported for industrial Mozzarella and Cheddar cheeses (Guinee et al., 2000), which 269
may be associated with differences in rate of acid development and curd pH profile at different 270
stages of manufacture. Acid development, which is influenced by the interactive effects of many 271
compositional and cheesemaking variables, is a key determinant for calcium release from, and salt 272
uptake by, curd on transit through the manufacturing process (Fox et al., 2017). 273
274
Overall Changes during Storage at 4°C 275
Page 13 of 51
ScholarOne support: (434) 964 4100
Journal of Dairy Science
Administrator
Markering
Administrator
Markering

For Peer Review
14
The storage-related changes in physicochemical and functional characteristics of cheese across the 276
seven different production dates are shown in Figure 1. The data for the individual vats at different 277
storage times are available in Supplementary Table A. 278
Physicochemical Changes. Increasing storage time resulted in a reduction in more-mobile-279
serum (A60ms) (P < 0.001) and increases in less-mobile-serum (A3ms and A10ms) (P < 0.001), 280
pH4.6SN (P < 0.001) and pH (P < 0.05). The trends concur with those of previous studies (Guo 281
and Kindstedt, 1995; Guinee et al., 2002; Smith et al, 2017). Smith et al. (2017) suggested that the 282
reduction in A60ms was related to the increase in soluble Ca content during early storage (e.g., 20 d; 283
Guo and Kindstedt, 1995; O’Mahony et al., 2006), concomitant with the solubilization of colloidal 284
calcium phosphate (CCP), and hypothesized that the CCP solubilization would expose the highly 285
polar phosphoserine groups of the casein and thereby promote water immobilization through 286
hydrogen bonding. Additionally, salt in the cheese contributes to salting-in and hydration of the 287
casein during early storage (Guo et al.,1997) due to exchange of casein-bound Ca with Na. The 288
increase in pH is of comparable magnitude to that reported previously for LMPS Mozzarella (Guo 289
et al., 1997; Guinee et al., 1998), and has been attributed to a storage-related increase in the 290
solubilization of CCP and the pH-upward buffering effect associated with the protonation of the 291
released phosphate groups (HPO42-) in the serum phase (Upreti et al., 2006; Smith et al., 2017). 292
Storage time did not affect the proportion of serum-soluble Ca at P > 0.05, which varied from 28% 293
to 43% of total Ca (Fig. 1). This trend contrasts with that of Guo and co-workers (Guo and 294
Kindstedt, 1995; Guo et al., 1997) who found a significant increase in the concentration of Ca in 295
serum expressed from LMPS Mozzarella cheese on centrifugation at 12,500 g over the first 8 d of 296
storage; simultaneously, the volume of expressible serum decreased. However, the current results 297
agree with those of Metzger et al. (2001) who showed that the soluble Ca content (as % of total Ca 298
in cheese) of a water-soluble extract of LMPS Mozzarella, prepared by filtration of a cheese-water 299
Page 14 of 51
ScholarOne support: (434) 964 4100
Journal of Dairy Science
Administrator
Markering

For Peer Review
15
homogenate, changed little from 40 to 45% over the course of a 90 d storage period at 4°C. The 300
discrepancy between these findings may be attributed to variations in curd temperature at stretching. 301
Metzger et al. (2001) applied a similar temperature at curd stretching (62.3°C) to that in the current 302
study (~62°C), whereas Guo and Kindstedt (1995) and Guo et al. (1997) stretched the curd at a 303
lower temperature (54°C). These stretching temperatures were in accordance with the values 304
reported for commercial practices (50 to 65°C) (Renda et al., 1997), and may differ depending on 305
the intended markets. For example, higher stretch temperatures may be applied to render the cheese 306
more firm during storage through greater inactivation of the starter culture and residual coagulant 307
activity (Feeney et al., 2001). Kindstedt et al. (1995) increased the plasticization temperature from 308
62 to 66°C by varying the screw speed and found that higher plasticization temperatures resulted 309
in cheeses with lower amounts of serum-soluble Ca and increased firmness during storage at 4°C, 310
thereby indicating that a slight increase in curd temperature during stretching may already induce 311
a shift in Ca distribution to the casein-bound state, and thus promote the aggregation of the calcium-312
phosphate para-casein network (Kindstedt et al., 2004). The discrepancy between results may also 313
be attributed to differences in curd stretching time. Sharma et al. (2016) investigated the effects of 314
shear work input during curd stretching on the viscoelastic properties of three model Mozzarella 315
cheeses at fixed screw speeds. Longer stretching times at fixed screws speed resulted in cheeses 316
with increased stiffness and reduced flow upon heating. The authors proposed that the cheese 317
structure transitioned from an entangled polymer network to a highly aggregated network of casein 318
particles with enhanced calcium bridging. It is likely that the extraction method, conditions of 319
extraction, and in particular pH of the cheese after manufacture and changes in pH during storage 320
further affected the proportion of serum-soluble Ca in LMPS Mozzarella (Guinee et al., 2000; 321
Metzger et al., 2001; Hassan et al., 2004). 322
323
Page 15 of 51
ScholarOne support: (434) 964 4100
Journal of Dairy Science
Administrator
Markering

For Peer Review
16
Functional Properties. The springiness or cohesiveness of the unheated cheese decreased (P < 324
0.001) during storage at 4°C (graphs not shown) whereas firmness remained unchanged at P > 0.05 325
(Fig. 1). These results were in contrast with those of Yun et al. (1993b), who found no effects of 326
storage for up to 50 d at 4°C on the cohesiveness of unheated LMPS Mozzarella whereas hardness 327
and springiness decreased significantly. The lack of storage-related effects on hardness may reflect 328
the inter-vat variation in composition or the relatively low levels of pH4.6SN (Yun et al, 1993a). 329
The mean values for COT, EW0 and EW5 decreased during storage at 4°C (P < 0.001) whereas 330
those for LTmax and flow increased (P < 0.001). These trends were consistent with the increases in 331
A3ms and pH4.6SN. We found the largest changes in serum distribution (A3ms and A60ms) and 332
functional performance (COT, LTmax, EW0 and flow) during the first 16 d of storage after which 333
the rate of change decreased markedly. In contrast, the pH4.6SN increased linearly over the 32 d 334
storage. Similar trends were reported by Guinee et al. (2001) and Imm et al. (2003). Increases in 335
protein hydration and proteolysis have been considered as factors that facilitate the displacement 336
of the calcium-phosphate para-casein network when the cheese is subjected to heating and 337
extension and shear stresses during baking and consumption, with consequent increases in LTmax 338
and flow, and decreases in COT, EW0 and EW5 during storage at 4°C (McMahon et al., 1999; 339
Guinee et al., 2001; McMahon and Oberg, 2017). 340
341
Relationships between Physicochemical and Functional Properties 342
The relationships between physicochemical and functional characteristics of the cheeses are 343
illustrated in Figure 2. Despite the scatter associated with the different production dates and storage 344
time, linear regression analysis indicated significant relationships between characteristics of the 345
heated cheese (COT, LTmax, EW0 and flow) and protein hydration (A3ms), or pH4.6SN (Table 3). 346
Additionally, protein hydration and pH4.6SN affected the springiness and cohesiveness of the 347
Page 16 of 51
ScholarOne support: (434) 964 4100
Journal of Dairy Science

For Peer Review
17
unheated cheese but did not affect the firmness at P < 0.05. Cheese pH varied from 5.3 to 5.6 and 348
affected COT and LTmax, whereas the proportion of soluble Ca (28 to 42%) affected cheese 349
firmness only. The analysis confirms the importance of para-casein hydration (A3ms) and hydrolysis 350
(pH4.6SN) as modulating factors on the functionality of heated LMPS Mozzarella. Typically, the 351
increases in A3ms and pH4.6SN in LPMS Mozzarella during the first 16 d of refrigerated storage 352
are critical in transforming its melting behavior and bestowing it with acceptable functionality 353
when baked (e.g., smooth, fluid, extensible and flowable cheese). The continued storage to 32 d 354
promotes further changes in these factors, especially protein hydrolysis, and thereby further alters 355
the functionality. 356
357
Overall Variability in Industrial LMPS Mozzarella 358
The mean values and standard deviation for the different compositional constituents are shown in 359
Table 2, and those of the physicochemical and functional characteristics after different storage 360
times in Figure 1. Evaluation of this variability and identifying the causative factors potentially 361
provide cheesemakers with clearer insight into the production of cheese of more consistent 362
functional quality. 363
Principal Component Analysis. PCA was used to resolve relationships between 364
physicochemical and functional characteristics of the cheeses, and to establish a quantifiable factor 365
to describe the overall functional performance of the cheese, which was then used to separate the 366
cheeses on the basis of storage time and production date. First, we simplified the current 367
multivariable study by reducing the number of functional-performance-related and cheese-make-368
related variables, separately (Supplementary Table B). Cheese-serum-related variables were not 369
included in the PCA, as these were measured for 3 different production dates only (Supplementary 370
Page 17 of 51
ScholarOne support: (434) 964 4100
Journal of Dairy Science

For Peer Review
18
Table A) and sampling times did not correspond to those at which the remaining physicochemical 371
and functional properties were evaluated. 372
Variation in Physicochemical and Functional Characteristics. PCA combined three 373
physicochemical (pH, serum-soluble Ca, pH4.6SN) and eight functional (firmness, springiness, 374
cohesiveness, chewiness, COT, LTmax, EW0, flow) variables into two principal components, PC1 375
and PC2, which accounted for 58.7% and 15.8% of the total variance in the measured data, 376
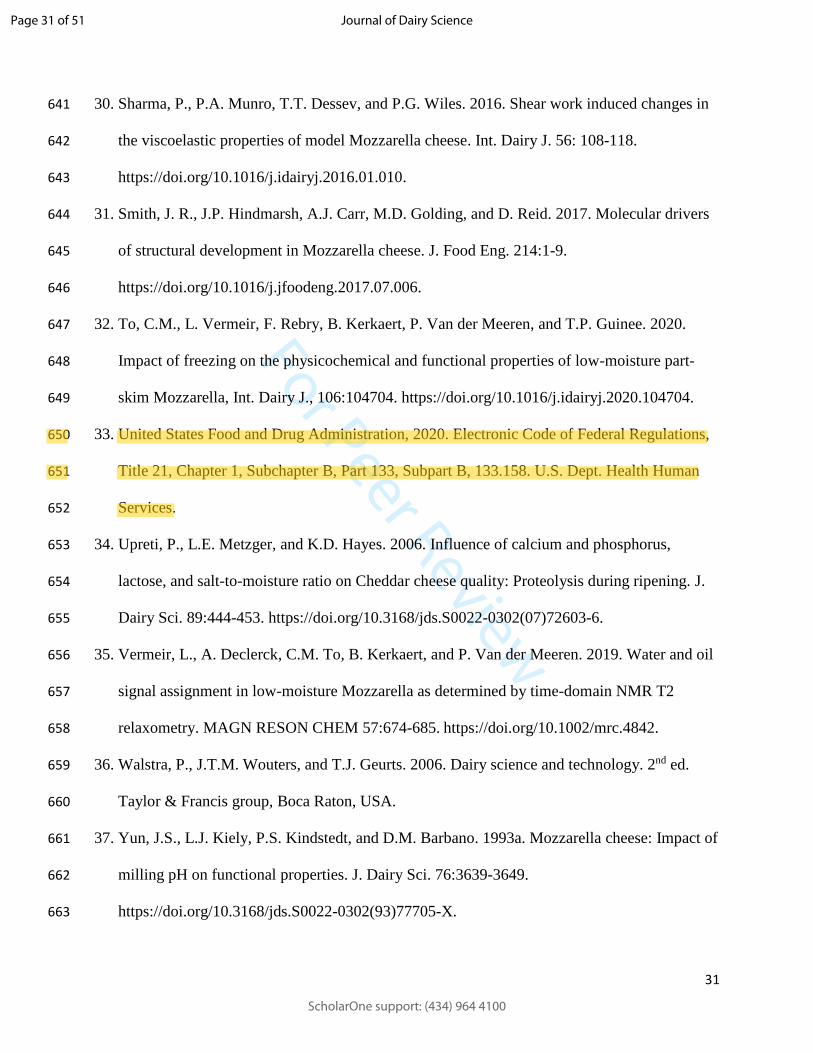
respectively. The loadings plot (Fig. 3A) illustrates how the variance in the original eleven response 377
variables is explained by PC1 (x-axis) and PC2 (y-axis). The main variables contributing to a 378
positive scoring on PC1 are cohesiveness, springiness, EW0 and COT whereas those contributing 379
to a negative scoring are pH4.6SN, LTmax and flow. This indicated that pH4.6SN correlated 380
positively with flow and LTmax, but negatively with EW0, COT, cohesiveness and springiness. The 381
relation between these variables was also evident from Figure 2, and is in agreement with other 382
authors (Guinee et al., 2001, 2002; Sharma et al., 2016). The main variables contributing to a 383
positive scoring on PC2 were pH, firmness and chewiness, whereas soluble Ca content contributed 384
to a negative scoring. PC1 and PC2 thus explain the variance in the physicochemical and functional 385
properties of the cheese, and could be used to separate the cheeses on the basis of storage time and 386
production date. We illustrate this in the score plot (Fig. 3B), where we group the Mozzarella blocks 387
assayed in this study according to their scorings on PC1 and PC2, such that the plot was divided 388
into four quadrants: I, II, III and IV. Cheeses in quadrant I scored positively for both PC1 and PC2, 389
and thus had the highest values for pH, firmness, springiness, cohesiveness, chewiness, EW0 and 390
COT; such conditions would contribute to poor cheese functionality. In contrast, cheeses in 391
quadrant III scored negatively on PC1 and PC2, and had the highest values for soluble Ca, pH4.6SN, 392
flow and LTmax, which would favor an overall more desirable functionality. In conjunction with 393
the loadings plot (Fig. 3A), Figure 3B demonstrates the effects of storage time at 4°C on the 394
Page 18 of 51
ScholarOne support: (434) 964 4100
Journal of Dairy Science
Administrator
Markering

For Peer Review
19
functional performance of the cheese. Cheeses stored for 2 to 4 d at 4°C were situated mainly in 395
quadrants I and IV, which corresponded to poor cheese functionality (positive scoring of PC1). 396
With further storage time (8 to 32 d), cheeses shifted gradually towards quadrants II and III and 397
acquired a more desirable functionality as indicated by the negative scoring of PC1, which 398
corresponded to higher values of pH4.6SN, LTmax and flow, and lower values for COT and EW0. 399
Figure 3B thus illustrates how the functionality of the cheese improved with more negative scorings 400
on PC1 or PC2, and we therefore considered the scorings on PC1 and PC2 as a measure for the 401
overall functional performance of the cheese. Storage time mainly affected the cheese 402
characteristics contributing to PC1 (pH4.6SN, cohesiveness, springiness, EW0, LTmax, COT and 403
flow) (Fig. 1) as compared to those contributing to PC2 (pH, soluble Ca, firmness and chewiness). 404
For this reason, we denoted PC1 as the ‘major storage time-related’ component and PC2 as the 405
‘minor storage time-related’ component. 406
Figure 3B provides further insights in the variability between the cheeses sampled at the seven 407
production dates; quadrants I and II mainly contained cheeses from production dates A, B and F, 408
which overall had the highest scorings on PC1 and PC2 at each storage time. In contrast, quadrants 409
III and IV mostly contained cheeses from production dates C, D, E or G, which had the lowest 410
scorings on PC1 and PC2, and had better functional performance. We could thus trace the observed 411
variability in functional performance of industrial LMPS Mozzarella during storage, as shown by 412
the standard deviation in Figure 1, to these production dates (A, B and F vs. C, D, E and G) in 413
particular, whereby the degree of variability is reflected by the distance between the different 414
production dates in Figure 3B. 415
Variation in Cheesemaking Variables. PCA of the cheese-making variables, characterized by 416
a variability greater than 1% (contents of milk fat and protein, and pHrenneting and pHmilling) resulted 417
in two principal components (PC1, PC2), which explained 94% of the cumulative variance (Fig. 418
Page 19 of 51
ScholarOne support: (434) 964 4100
Journal of Dairy Science

For Peer Review
20
3C). The variables milk protein, pHrenneting and pHmilling contributed mainly to a positive scoring on 419
PC1, and milk fat to a positive scoring on PC2. The former indicated a positive correlation between 420
the variables milk protein content and the pHrenneting and pHmilling under standardized cheese-make 421
procedures; this reflects the importance of milk protein concentration in affecting buffering 422
capacity and, therefore, the pH at different stages of cheese manufacture (Fox et al., 2017). We 423
therefore accepted the linear combination of milk protein, pHrenneting and pHmilling into PC1 and 424
denoted this as the ‘milk protein-related’ component, and PC2 as the ‘milk fat-related’ component. 425
Figure 3D shows the resolution of the seven production dates based on the ‘milk protein-related’ 426
component (PC1) and the ‘milk fat-related’ component (PC2). Overall, cheese at production dates 427
E, F and G was produced with milk with lower fat content, relative to production dates A, B, D and 428
C (Table 2). Cheeses from production dates B, D and E had a lower scoring for the ‘milk-protein-429
related’ component as compared to cheeses from production dates A, C, F and G. Even though the 430
protein content of the milk in production date C was numerically lower than that at production date 431
B (Table 2), cheeses from production date C scored relatively higher on the ‘milk protein-related’ 432
component, indicating that the negative contribution of the lower milk protein content to PC1 was 433
partially offset by the corresponding high value for pHrenneting. 434
We did not subject cheese-composition-related variables (contents of DM, FDM, MNFS, S/M and 435
Ca-to-protein) to PCA as no strong correlations could be demonstrated, with the exception of DM 436
and MNFS. 437
Variability in Functional Performance of Industrial LMPS Mozzarella. The variability in 438
‘major storage time-related’ and ‘minor-storage time-related’ components in 59 LMPS Mozzarella 439
blocks from seven cheese production dates after each storage time is presented in Figure 4. Overall, 440
the variation of the ‘minor storage time-related’ component was higher than that of the ‘major 441
Page 20 of 51
ScholarOne support: (434) 964 4100
Journal of Dairy Science

For Peer Review
21
storage time-related’ component, which was indicative of a relatively large variation in pH, serum-442
soluble Ca, firmness or chewiness of the unheated cheese. 443
PCA showed that the cheeses from production dates A, B and F could be separated from those of 444
production dates C, D, E and G based on their physicochemical and functional characteristics (Fig. 445
3B). The variation in functional performance between cheeses produced at different dates may be 446
related to the variation in ‘milk fat-related’ component, ‘milk protein-related’ component or 447
contents of FDM, MNFS, S/M and Ca. We applied Two-way ANOVA to assess the effects of these 448
independent variables, storage time, and their interaction on the response components, separately. 449
Variables found to have a significant effect were further analyzed using a linear model to identify 450
which variable(s) contributed mostly to the observed variance in physicochemical and functional 451
characteristics between the cheeses from the different production dates. 452
Effects of Manufacturing Variables and Cheese Composition on Cheese Functionality. The 453
output of the two-way ANOVA is presented in Supplementary Table C. We found no interaction-454
effects (P > 0.05) between the different variables and storage time on the ‘major storage time-455
related’ or ‘minor storage time-related’ components. The effects of storage time on the ‘major 456
storage time-related’ (P < 0.001) and ‘minor storage time-related’ (P > 0.05) components were 457
discussed above. 458
Two-way ANOVA revealed no effects (P > 0.05) of the ‘milk fat-related’ component, FDM or 459
MNFS on the ‘major storage-time related’ or ‘minor storage time-related’ components. This is 460
consistent with the small difference in fat content between the cheeses (Table 2). 461
The ‘milk protein-related’ component (P < 0.05), S/M (P < 0.01) and Ca-to-protein (P < 0.001) 462
affected the ‘major storage time-related’ or ‘minor storage time-related’ components; this is 463
consistent with the data in Table 2 which showed relatively high variability for milk protein content, 464
and for S/M content and Ca-to-protein ratio of the cheese. 465
Page 21 of 51
ScholarOne support: (434) 964 4100
Journal of Dairy Science

For Peer Review
22
We constructed a linear model to evaluate the combined effects of the ‘milk protein-related’ 466
component, S/M, Ca-to-protein content and storage time at 4°C. The ‘milk protein-related’ 467
component, i.e. the factor which showed the least significant effect (Supplementary Table C), 468
returned as non-significant in the combined model and was thus removed. The resulting model 469
revealed that Ca-to-protein content (P < 0.01) and storage time (P < 0.001) were the only factors 470
contributing to the variability in the ‘major storage time-related’ component (Supplementary Table 471
D). We therefore concluded that the variations in Ca-to-protein content of the cheese on the ‘major 472
storage time-related’ component outweighed the corresponding contributions of variations in ‘milk 473
protein-related’ component or S/M. The response curves (Fig. 5) show that the score on the ‘major 474
storage time-related’ component of the cheese, which represents a linear combination of correlated 475
physicochemical and functional variables (pH4.6SN, cohesiveness, springiness, EW0, LTmax, COT 476
and flow), is a function of storage time at 4°C and calcium content. PCA (Fig. 3) showed that more 477
negative scores coincide with more desirable functional characteristics (higher LTmax and flow, 478
lower COT). Hence, the storage time required to attain a desired level of functionality (i.e., a 479
particular negative score on the ‘major storage time-related’ component) depends on calcium 480
content, with cheeses having a relatively low content in need of a shorter time and vice versa. 481
Furthermore, Ca-to-protein was found to be the only factor (P < 0.001) affecting the variability in 482
the ‘minor storage time-related’ component (Supplementary Table D). 483
The effects of the Ca content on the overall functional performance of cheese after different storage 484
times is shown in Figure 6, and demonstrates how the level of Ca content consistently influenced 485
the scorings on the ‘major storage time-related’ and ‘minor storage time-related’ components after 486
2, 8, 16 or 32 d of storage at 4°C, and therefore the functional performance of the cheese. Higher 487
Ca content resulted in firmer cheeses, and lower Ca content in better functional performance of the 488
heated cheese, as demonstrated by higher negative score on the ‘major storage time-related’ 489
Page 22 of 51
ScholarOne support: (434) 964 4100
Journal of Dairy Science

For Peer Review
23
component. Hence, the Ca content is a critical factor modulating functionality and should be tightly 490
controlled to produce cheese with consistent functional performance. The importance of Ca on the 491
functionality of LMPS Mozzarella confirms the findings of previous studies (Guinee et al., 2002; 492
Joshi et al., 2004; Banville et al., 2013). 493
Page 23 of 51
ScholarOne support: (434) 964 4100
Journal of Dairy Science

For Peer Review
24
CONCLUSIONS 494
LMPS Mozzarella cheese was produced on industrial-scale following a standardized procedure. A 495
total of 7 cheese vats and 75 blocks of cheese were sampled over a 1.5 year period, and 496
characterized for their physicochemical and functional properties after 0, 1, 2, 4, 8, 16 or 32 d of 497
storage at 4°C. The functional performance of the heated cheese developed markedly during the 498
first 16 d, concomitant with a substantial increase in protein hydration, as measured by 1H-NMR 499
relaxometry, and a gradual increase in primary proteolysis (pH4.6SN). Prolonging the storage time 500
to 32 d, resulted in a less significant change in cheese functionality. The level of serum-soluble Ca, 501
expressed as a percentage of total calcium content, mainly affected the firmness of the unheated 502
cheese. 503
Despite the use of a defined manufacturing procedure, a significant variation in the functional 504
performance of the heated cheese obtained at different production dates was observed. 505
Principal component analysis (PCA) identified two components, which we denoted as the ‘major 506
storage time-related’ and ‘minor storage time-related’ components. These components represent 507
linear combinations of correlated physiochemical and functional variables, corresponding in the 508
former component to pH4.6SN, cohesiveness, springiness, EW0, LTmax, COT and flow, and in the 509
latter component to pH, soluble Ca, firmness and chewiness. The components, which were a 510
measure for the overall functional performance of the cheese, separated the cheeses on the basis of 511
storage time and production date, and provided insights in the source and degree of the variation 512
between cheeses from different production dates. 513
A linear model describing the effects of milk composition (protein and fat), pH during 514
manufacturing, and cheese composition (fat-in-dry matter, moisture-non-fat-substances, salt-in-515
moisture and calcium) on the ‘major storage time-related’ and ‘minor storage time-related’ 516
components identified the variation in calcium content (27.3 to 32.6 mg.g-1 protein) as the main 517
Page 24 of 51
ScholarOne support: (434) 964 4100
Journal of Dairy Science

For Peer Review
25
source of the variability in the functionality of the unheated- and heated cheese after different 518
storage times. 519
Consequently, we recommend tight control of the calcium content of LMPS Mozzarella as a means 520
of ensuring more consistent functionality. High-calcium cheeses (32.6 mg.g-1 protein) were firmer 521
and more resistant against heat-induced flow. The effects of a high calcium content on the 522
functional performance of the cheese could, however, be mitigated by prolonging the storage time 523
at 4°C. This finding is of relevance to manufacturers interested in the development of LMPS 524
Mozzarella variants with points of differentiation (e.g., in shreddability, flow or shelf life) for 525
different markets. The methods applied in this study have been insightful both in characterizing the 526
quality of LMPS Mozzarella, and identifying the sources of variability in quality over the 527
cheesemaking season. The cheeses in this study were produced applying a subset of manufacturing 528
conditions that are found in commercial production of Mozzarella (e.g. relatively high pH at whey 529
drainage, high stretching temperature), and were characterized by a relatively high Ca content and 530
low proteolysis. Hence, their application to LPMS Mozzarella in general has to be considered with 531
due consideration of the particular production conditions and composition of the cheese. 532
533
ACKNOWLEDGEMENTS 534
The authors would like to express their gratitude to Dr. John Tobin (Teagasc Food Research Centre 535
Moorepark) for the provision of materials, equipment and scientific support. 536
537
FUNDING 538
This work was supported by the Flemish Agency for Innovation & Entrepreneurship (grant number 539
HBC.2017.0297, VLAIO, Belgium). The Fund for Scientific Research - Flanders (FWO-540
Page 25 of 51
ScholarOne support: (434) 964 4100
Journal of Dairy Science
Administrator
Markering

For Peer Review
26
Vlaanderen) is gratefully acknowledged for its financial support for obtaining the time-domain 541
NMR equipment. 542
543
CONFLICTS OF INTEREST 544
There are no conflicts of interest. 545
Page 26 of 51
ScholarOne support: (434) 964 4100
Journal of Dairy Science

For Peer Review
27
REFERENCES 546
1. Banville, V., P. Morin, Y. Pouliot, and M. Britten. 2013. Physical properties of pizza 547
Mozzarella cheese manufactured under different cheese-making conditions. J. Dairy Sci. 548
96:4804-4815. https://doi.org/10.3168/jds.2012-6314. 549
2. Chen, B., M.J. Lewis, and A.S. Grandison. 2014. Effect of seasonal variation on the 550
composition and properties of raw milk destined for processing in the UK. Food Chem. 551
158:216-223. https://doi.org/10.1016/j.foodchem.2014.02.118. 552
3. Dave, R., P. Sharma, and D. McMahon. 2003. Melt and rheological properties of Mozzarella 553
cheese as affected by starter culture and coagulating enzymes. Lait 83:61-77. 554
https://doi.org/10.1051/lait:2002050. 555
4. Eurostat. 2020. Cows' milk collection and products obtained - monthly data [Data file]. 556
Available from https://ec.europa.eu/eurostat/web/main 557
5. Feeney, E. P., P.F. Fox, and T.P. Guinee. 2001. Effect of ripening temperature on the quality 558
of low moisture Mozzarella cheese: 1. Composition and proteolysis. Lait 81:463-474. 559
https://doi.org/10.1051/lait:2001145. 560
6. Fox, E.P., T.P. Guinee, T.M. Cogan, and P.L. McSweeney. 2017. Fundamentals of cheese 561
science. 2nd ed. Springer, New York, USA. 562
7. Gianferri, R., V. D’Aiuto, R. Curini, M. Delfini, and E. Brosio. 2007. Proton NMR transverse 563
relaxation measurements to study water dynamic states and age-related changes in Mozzarella 564
di Bufala Campana cheese. Food Chem. 105:720-726. 565
https://doi.org/10.1016/j.foodchem.2007.01.005. 566
8. Guinee, T. P., E.P. Feeney, and P.F. Fox. 2001. Effect of ripening temperature on low 567
moisture Mozzarella cheese: 2. Texture and functionality. Lait 81:475-485. 568
https://doi.org/10.1051/lait:2001146. 569
Page 27 of 51
ScholarOne support: (434) 964 4100
Journal of Dairy Science

For Peer Review
28
9. Guinee, T. P., E.P. Feeney, M.A. Auty, and P.F. Fox. 2002. Effect of pH and calcium 570
concentration on some textural and functional properties of Mozzarella cheese. J. Dairy Sci. 571
85:1655-1669. https://doi.org/10.3168/jds.S0022-0302(02)74238-0. 572
10. Guinee, T. P., D. Harrington, M.O. O Corcoran, E. Mulholland, and C. Mullins. 2000. The 573
compositional and functional properties of commercial Mozzarella, cheddar and analogue 574
pizza cheeses. Int. J. Dairy Technol. 53:51-56. https://doi.org/10.1111/j.1471-575
0307.2000.tb02658.x. 576
11. Guinee, T. P., E.O. Mulholland, C. Mullins, M.O. Corcoran, J.F. Connolly, T. Beresford, R. 577
Mehra, B.J. O’Brien, J.J. Murphy, G. Stakelum, and D. Harrington. 1998. Effect of altering 578
the daily herbage allowance to cows in mid lactation on the composition, ripening and 579
functionality of low-moisture, part-skim Mozzarella cheese. J. Dairy Res. 65:23–30. 580
https://doi.org/10.1017/S0022029997002665. 581
12. Gulati, A., N. Galvin, D. Hennessy, S. McAuliffe, M. O’Donovan, J.J. McManus, M. 582
Fenelon, and T.P. Guinee. 2018. Grazing of dairy cows on pasture versus indoor feeding on 583
total mixed ration: Effects on low-moisture part-skim Mozzarella cheese yield and quality 584
characteristics in mid and late lactation. J. Dairy Sci. 101:8737-8756. 585
https://doi.org/10.3168/jds.2018-14566. 586
13. Gulati, A., D. Hennessy, M. O’Donovan, J.J. McManus, M. Fenelon, and T.P. Guinee. 2019. 587
Dairy cow feeding system alters the characteristics of low-heat skim milk powder and 588
processability of reconstituted skim milk. J. Dairy Sci. 102:8630-8647. 589
https://doi.org/10.3168/jds.2018-15884. 590
14. Guo, M.R., and P.S. Kindstedt. 1995. Age-related changes in the water phase of Mozzarella 591
cheese. J. Dairy Sci. 78:2099-2107. https://doi.org/10.3168/jds.S0022-0302(95)76836-9. 592
Page 28 of 51
ScholarOne support: (434) 964 4100
Journal of Dairy Science
Administrator
Markering

For Peer Review
29
15. Guo, M.R., J.A. Gilmore, and P.S. Kindstedt. 1997. Effect of sodium chloride on the serum 593
phase of Mozzarella cheese. J. Dairy Sci. 80:3092-3098. https://doi.org/10.3168/jds.S0022-594
0302(97)76279-9. 595
16. Hassan, A., M.E. Johnson, and J.A. Lucey. 2004. Changes in the proportions of soluble and 596
insoluble calcium during the ripening of Cheddar cheese. J. Dairy Sci. 87:854-862. 597
https://doi.org/10.3168/jds.S0022-0302(04)73229-4. 598
17. Imm, J. Y., E.J. Oh, K.S. Han, S. Oh, Y.W. Park, and S.H. Kim. 2003. Functionality and 599
physico-chemical characteristics of bovine and caprine Mozzarella cheeses during 600
refrigerated storage. J. Dairy Sci. 86:2790-2798. https://doi.org/10.3168/jds.S0022-601
0302(03)73876-4. 602
18. Joshi, N.S., K. Muthukumarappan, and R.I. Dave. 2004. Effect of calcium on microstructure 603
and meltability of part skim Mozzarella cheese. J. Dairy Sci. 87:1975-1985. 604
https://doi.org/10.3168/jds.S0022-0302(04)70014-4. 605
19. Kindstedt, P.S., M.R. Guo, W.H. Viotto, J.J. Yun, and D.M. Barbano. 1995. Effect of screw 606
speed and residence time at high stretching temperature on composition, proteolysis, 607
functional properties and the water phase of Mozzarella cheese. Pages 56–72 in Proceedings 608
of the 32nd Annual Marschall Italian and Specialty Cheese Seminar, Rhone Poulenc Dairy 609
Ingredients, Madison, Wisconsin. 610
20. Kindstedt, P. S., M. Caric, and S. Milanovic, 2004. Pasta-filata cheeses. Pages 251-276 in: 611
Cheese Chemistry, Physics and Microbiology, Vol. 2, Major Cheese Groups. 3rd ed. P.F. Fox, 612
P.L.H. McSweeney, T.M. Cogan, and T.P. Guinee, ed. Elsevier Academic Press, London, 613
UK. 614
21. Kuo, M. I., and S. Gunasekaran. 2009. Effect of freezing and frozen storage on microstructure 615
of Mozzarella and pizza cheeses. LWT 42:9-16. https://doi.org/10.1016/j.lwt.2008.07.003. 616
Page 29 of 51
ScholarOne support: (434) 964 4100
Journal of Dairy Science
Administrator
Markering
Administrator
Markering

For Peer Review
30
22. Lin, Y., A.L. Kelly, J.A. O’Mahony, and T.P. Guinee. 2017. Addition of sodium caseinate to 617
skim milk increases nonsedimentable casein and causes significant changes in rennet-induced 618
gelation, heat stability, and ethanol stability. J. Dairy Sci. 100:908-918. 619
https://doi.org/10.3168/jds.2016-11704. 620
23. Lucey, J.A., M.E. Johnson, and D.S. Horne. 2003. Invited review: perspectives on the basis of 621
the rheology and texture properties of cheese. J. Dairy Sci. 86:2725-2743. 622
https://doi.org/10.3168/jds.S0022-0302(03)73869-7. 623
24. McMahon, D. J., R.M. Fife, and C.J. Oberg. 1999. Water partitioning in Mozzarella cheese 624
and its relationship to cheese meltability. J. Dairy Sci. 82:1361-1369. 625
https://doi.org/10.3168/jds.S0022-0302(99)75361-0. 626
25. McMahon, D.J., and C.J. Oberg. 2017. Pasta-filata cheeses. Pages 1041-1068 in Cheese: 627
Chemistry, physics and microbiology. 4th ed. P.L.H. McSweeney, P.F. Fox, P. D. Cotter, and 628
D. W. Everett, ed. Academic Press, Cambridge, USA. 629
26. Metzger, L.E., D.M. Barbano, and P.S. Kindstedt. 2001. Effect of milk preacidification on 630
low fat Mozzarella cheese: III. Post-melt chewiness and whiteness. J. Dairy Sci. 84, 1357-631
1366. https://doi.org/10.3168/jds.S0022-0302(01)70166-X. 632
27. Oberg, C. J., W.R. McManus, and D.J. McMahon. 1993. Microstructure of Mozzarella cheese 633
during manufacture. Food Struct. 12:251-258. 634
28. O’Mahony, J.A., P.L.H. McSweeney, and J.A. Lucey. 2006. A model system for studying the 635
effects of colloidal calcium phosphate concentration on the rheological properties of Cheddar 636
cheese. J. Dairy Sci. 89:892-904. https://doi.org/10.3168/jds.S0022-0302(06)72154-3. 637
29. Renda, A., D.M. Barbano, J.J. Yun, P.S. Kindstedt, and S.J. Mulvaney. 1997. Influence of 638
screw speeds of the mixer at low temperature on characteristics of Mozzarella cheese. J. 639
Dairy Sci. 80:1901-1907. https://doi.org/10.3168/jds.S0022-0302(97)76130-7. 640
Page 30 of 51
ScholarOne support: (434) 964 4100
Journal of Dairy Science
Administrator
Markering
For Peer Review
31
30. Sharma, P., P.A. Munro, T.T. Dessev, and P.G. Wiles. 2016. Shear work induced changes in 641
the viscoelastic properties of model Mozzarella cheese. Int. Dairy J. 56: 108-118. 642
https://doi.org/10.1016/j.idairyj.2016.01.010. 643
31. Smith, J. R., J.P. Hindmarsh, A.J. Carr, M.D. Golding, and D. Reid. 2017. Molecular drivers 644
of structural development in Mozzarella cheese. J. Food Eng. 214:1-9. 645
https://doi.org/10.1016/j.jfoodeng.2017.07.006. 646
32. To, C.M., L. Vermeir, F. Rebry, B. Kerkaert, P. Van der Meeren, and T.P. Guinee. 2020. 647
Impact of freezing on the physicochemical and functional properties of low-moisture part-648
skim Mozzarella, Int. Dairy J., 106:104704. https://doi.org/10.1016/j.idairyj.2020.104704. 649
33. United States Food and Drug Administration, 2020. Electronic Code of Federal Regulations, 650
Title 21, Chapter 1, Subchapter B, Part 133, Subpart B, 133.158. U.S. Dept. Health Human 651
Services. 652
34. Upreti, P., L.E. Metzger, and K.D. Hayes. 2006. Influence of calcium and phosphorus, 653
lactose, and salt-to-moisture ratio on Cheddar cheese quality: Proteolysis during ripening. J. 654
Dairy Sci. 89:444-453. https://doi.org/10.3168/jds.S0022-0302(07)72603-6. 655
35. Vermeir, L., A. Declerck, C.M. To, B. Kerkaert, and P. Van der Meeren. 2019. Water and oil 656
signal assignment in low-moisture Mozzarella as determined by time-domain NMR T2 657
relaxometry. MAGN RESON CHEM 57:674-685. https://doi.org/10.1002/mrc.4842. 658
36. Walstra, P., J.T.M. Wouters, and T.J. Geurts. 2006. Dairy science and technology. 2nd ed. 659
Taylor & Francis group, Boca Raton, USA. 660
37. Yun, J.S., L.J. Kiely, P.S. Kindstedt, and D.M. Barbano. 1993a. Mozzarella cheese: Impact of 661
milling pH on functional properties. J. Dairy Sci. 76:3639-3649. 662
https://doi.org/10.3168/jds.S0022-0302(93)77705-X. 663
Page 31 of 51
ScholarOne support: (434) 964 4100
Journal of Dairy Science
Administrator
Markering

For Peer Review
32
38. Yun, J.S., L.J. Kiely, D.M. Barbano, and P.S. Kindstedt. 1993b. Mozzarella cheese: Impact of 664
cooking temperature on chemical composition, proteolysis and functional properties. J. Dairy 665
Sci. 76:3664-3673. https://doi.org/10.3168/jds.S0022-0302(93)77708-5. 666
Page 32 of 51
ScholarOne support: (434) 964 4100
Journal of Dairy Science

For Peer Review
33
Table 1. Sampling pattern of blocks per production date and per storage time at 4°C 667
Storage time at 4°C (d)1 Sampled number of blocks per production date Total number of blocks
per storage time at 4°C
5/11/2017 8/01/2018 12/03/2018 19/03/2018 18/06/2018 5/11/2018 20/01/2019
Serum distribution Vat A Vat B Vat C Vat D Vat E Vat F Vat G
0 1 1 - - - - - 2
1 1 1 - - - - - 2
2 1 1 - - - - 1 3
4 1 1 - - - - 1 3
8 1 1 - - - - 1 3
16 1 1 - - - - - 2
32 1 - - - - - - 1
Other physicochemical2
and functional properties3 Vat A Vat B Vat C Vat D Vat E Vat F Vat G
2 3 2 2 2 2 2 - 13
4 3 - - - 2 - 2 7
8 3 2 2 2 2 - - 11
16 3 2 2 2 2 2 2 15
32 3 2 - 2 2 2 2 13 1The physicochemical and functional properties of industrial low-moisture part-skim Mozzarella cheeses were evaluated during storage at 4°C. 668 2Other physicochemical properties: pH, serum-soluble Ca and pH 4.6 soluble N. 669 3Functional properties: firmness, springiness, cohesiveness and chewiness of the unheated cheese, and cross-over temperature, maximum value of the loss tangent, 670 extension work at 0 or 5 min after melting and flow of the heated cheese.671
Page 33 of 51
ScholarOne support: (434) 964 4100
Journal of Dairy Science

For Peer Review
34
Table 2. Details of the cheese-making process and the composition of the resultant cheeses obtained at different production dates1 672
Vat A Vat B Vat C Vat D Vat E Vat F Vat G
Variability
(%)
Production date 5/11/2017 8/01/2018 12/03/2018 19/03/2018 18/06/2018 5/11/2018 20/01/2019
Milk composition
Fat (%, wt/wt) 2.84 2.87 2.86 2.86 2.82 2.77 2.76 3.9
Protein (%, wt/wt) 3.73 3.68 3.66 3.64 3.47 3.75 3.78 8.4
Cheese manufacture2
pHrenneting 6.55 6.54 6.57 6.54 6.49 6.56 6.55 1.2
pHdrainage 6.36 6.39 6.41 6.35 6.36 6.38 6.37 0.9
pHmilling 5.19 5.15 5.15 5.11 5.06 5.16 5.17 2.5
Cheese composition2
Dry matter (%, wt/wt) 51.6 ± 0.5c 52.1 ± 0.4bc 52.0 ± 0.3bc 52.1 ± 0.4b 52.1 ± 0.2b 52.9 ± 0.3a 52.0 ± 0.2bc 2.5
FDM (%) 41.8 ± 0.5bc 42.3 ± 0.5ab 41.8 ± 0.5bc 42.7 ± 0.5a 41.4 ± 0.4c 41.4 ± 0.6bc 41.9 ± 0.4bc 3.1
MNFS (%) 61.7 ± 0.6a 61 .5 ± 0.3abc 61.3 ± 0.5ab 61.6 ± 0.6ab 61.1 ± 0.3bc 60.3 ± 0.5c 61.4 ± 0.4ab 2.3
S/M (%) 2.7 ± 0.1a 2.7 ± 0.1a 2.5 ± 0.1b 2.3 ± 0.1b 2.4 ± 0.0b 2.4 ± 0.1ab 2.0 ± 0.3c 28.8
Ca (mg.g-1 protein) 32.6 ± 1.4a 31.1 ± 0.6ab 27.3 ± 0.7c 28.5 ± 0.7bc 28.2 ± 1.0bc 30.9 ± 2.9ab 30.4 ± 1.0ab 17.6
1Presented data for milk composition or cheese manufacture represent one measured value per vat, whereas data for cheese composition represent mean values with 673 standard deviation measured on at least four different cheeses per vat. 674 2Abbreviations: pH at rennet addition, pHrenneting; pH at vat drainage, pHdrainage; pH at curd milling, pHmilling; fat-in-dry matter, FDM; moisture-non-fat-substances, 675 MNFS; salt-in-moisture, S/M. 676 a,b,cValues in rows with different superscript letters denote a difference at P < 0.05.677
Page 34 of 51
ScholarOne support: (434) 964 4100
Journal of Dairy Science

For Peer Review
35
Table 3. Relationships between physicochemical and functional characteristics of the unheated or 678 the heated cheese1 679
A3ms dfmodel dferror Fratio P pH dfmodel dferror Fratio P
Firmness 1 22 1.61 - Firmness 1 57 2.03 -
Springiness 1 22 2.95 - Springiness 1 57 1.49 -
Cohesiveness 1 22 5.72 * Cohesiveness 1 57 2.54 -
Chewiness 1 22 0.27 - Chewiness 1 57 0.15 -
COT 1 22 47.12 *** COT 1 57 10.79 **
LTmax 1 22 34.44 *** LTmax 1 57 6.83 *
EW0 1 22 6.61 ** EW0 1 57 2.98 -
Flow 1 22 23.89 *** Flow 1 57 3.60 -
SCa dfmodel dferror Fratio P pH4.6SN dfmodel dferror Fratio P
Firmness 1 57 9.34 ** Firmness 1 57 3.48 -
Springiness 1 57 0.03 - Springiness 1 57 36.90 ***
Cohesiveness 1 57 1.39 - Cohesiveness 1 57 55.62 ***
Chewiness 1 57 7.79 ** Chewiness 1 57 28.66 ***
COT 1 57 1.19 - COT 1 57 184.22 ***
LTmax 1 57 3.28 - LTmax 1 57 168.34 ***
EW0 1 57 1.43 - EW0 1 57 137.22 ***
Flow 1 57 0.91 - Flow 1 57 31.97 ***
1Abbreviations: less-mobile-serum, A3ms; serum-soluble calcium content, SCa; primary proteolysis, pH4.6SN; cross-680 over temperature, COT; maximum value of the loss tangent, LTmax; extension work at 0 min after melting, EW0. 681 Simple regression analysis between physicochemical (A3ms, pH, SCa or pH4.6SN) and functional characteristics of the 682 unheated (firmness, springiness, cohesiveness or chewiness) or the heated cheese (COT, LTmax, EW0 or flow) was 683 performed using data obtained on 75 industrial LMPS Mozzarella cheeses. The cheeses were sampled at 7 different 684 production dates, and measured after 0, 1, 2, 4, 8, 16 or 32 d storage at 4°C. The statistical significance (P) is given 685 where P > 0.05, P < 0.05, P < 0.01 and P < 0.001 are denoted by -, *, ** and ***, respectively. 686
Page 35 of 51
ScholarOne support: (434) 964 4100
Journal of Dairy Science

For Peer Review
36
LIST OF CAPTIONS 687
Fig. 1 Overall changes during storage at 4°C in serum distribution (A3ms, A10ms, A60ms), cheese pH, serum-688
soluble Ca (SCa), primary proteolysis (as measured by the level of pH4.6SN), firmness, cross-over 689
temperature (COT), maximum value of the loss tangent (LTmax), extension work at 0 or 5 min after melting 690
(EW0 or EW5), and flow of commercial LMPS Mozzarella cheeses. The data presented are mean values of 691
seven different production dates, except for those for serum distribution properties, which were measured 692
for three different production dates only (Table 1). Error bars represent the standard deviation. 693
694
Fig. 2 Relationships between physicochemical characteristics (less-mobile-serum, A3ms; pH; serum-soluble 695
calcium content, SCa; primary proteolysis, pH4.6SN) and functional characteristics of the unheated 696
(firmness, springiness, cohesiveness) and heated (cross-over temperature, COT; maximum value of the loss 697
tangent, LTmax; extension work at 0 min after melting, EW0; flow) cheeses. The data were obtained from 75 698
industrial LMPS Mozzarella cheese blocks sampled from seven different production dates, and measured 699
after 0, 1, 2, 4, 8, 16 or 32 d storage at 4°C. Regression lines with 95% confidence limits are shown for 700
significant relationships (P < 0.05). 701
702
Fig. 3 Loading (A, C) and scores (B, D) plots for LMPS Mozzarella obtained by principle component 703
analysis. Plot A shows the variance in the physicochemical (pH; serum-soluble Ca; pH4.6SN) and functional 704
variables (firmness; springiness; cohesiveness; chewiness; cross-over temperature, COT; maximum value 705
of the loss tangent, LTmax; extension work at 0 min after melting, EW0; and flow) explained by two principal 706
components (PC1 and PC2). Plot C shows the variance in cheese-making related variables (milk fat, milk 707
protein, pH at rennet addition and pH at curd milling) explained by PC1 and PC2. Score plots B and D 708
illustrate the separation of cheeses sampled at different production dates (A, B, C, D, E, F or G) based on 709
their scorings on PC1 and PC2 during storage at 4°C, such that the plots were divided into four quadrants 710
(I, II, III and IV). In plot B, the numbers (0, 2, 4, 8, 16 or 32) correspond to the storage time at 4°C, and the 711
letters (A, B, C, D, E, F or G) to the production date (Table 1). 712
Page 36 of 51
ScholarOne support: (434) 964 4100
Journal of Dairy Science

For Peer Review
37
713
Fig. 4 Changes during storage at 4°C in the scores on the ‘major storage time-related’ and ‘minor storage 714
time-related’ components, which represent linear combinations of the physicochemical and functional 715
variables of industrial low-moisture part-skim Mozzarella, and are a measure for the overall functional 716
performance of the cheese. The main variables included in the major (pH4.6SN, cohesiveness, springiness, 717
EW0, LTmax, COT and flow) and minor (pH, soluble Ca, firmness and chewiness) time-dependent 718
components were derived using principal component analysis (Fig. 3). Presented data are mean values of 719
cheeses produced on 7 different production dates; error bars represent the standard deviation. 720
721
Fig. 5 Contour plot for industrial LMPS Mozzarella showing the dependence of storage time at 4°C on 722
calcium content of cheese in attaining a score of -5 to 2 units on the ‘major storage time-related’ component 723
(linear combination of cheese physicochemical and functional properties: pH4.6SN, cohesiveness, 724
springiness, EW0, LTmax, COT and flow). Each curve or score signifies an overall degree in functional 725
performance of the cheese, as derived from principal component analysis (Fig. 3). Curves with a more 726
negative scoring for the ‘major storage time-related component’ correspond to cheese with higher values of 727
loss tangent (LTmax) and flow of the heated cheese, and lower values for cross-over temperature during 728
heating (COT) and extension work at 0 min after melting (EW0), and thus are indicative of a more desirable 729
cheese functionality. 730
731
Fig. 6 Scores on the ‘major storage time-related’ and ‘minor storage time-related’ components as a function 732
of the variation in calcium content in industrial low-moisture part-skim Mozzarella during 32 days of storage 733
at 4°C. The ‘major storage time-related’ and ‘minor storage time-related’ components correspond to linear 734
combinations of functional-performance related variables as derived from principal component analysis, 735
and are a measure for the overall functional performance of industrial low-moisture part-skim Mozzarella 736
cheese. Data illustrated are mean values of cheeses sampled on 7 different production dates. Error bars 737
represent the standard deviation.738
Page 37 of 51
ScholarOne support: (434) 964 4100
Journal of Dairy Science

For Peer Review
38
To. Fig. 1 739
740 741
742 743
744 745 746
747
748
749 750 751
752 753
754 755 756
757
758 759
760 761 762 763
764
765 766
767 768 769 770
JDS.2020-19047 Fig. 1 771 772
Flo
w (
%)
A6
0m
s (a
.u.)
A1
0m
s (a
.u.)
A3m
s (a
.u.)
SC
a (
% t
ota
l C
a)
Page 38 of 51
ScholarOne support: (434) 964 4100
Journal of Dairy Science

For Peer Review
39
To. Fig. 2 773
774
775 776 777 778 779 780
781 782
JDS.2020-19047 Fig. 2 783
784
Page 39 of 51
ScholarOne support: (434) 964 4100
Journal of Dairy Science
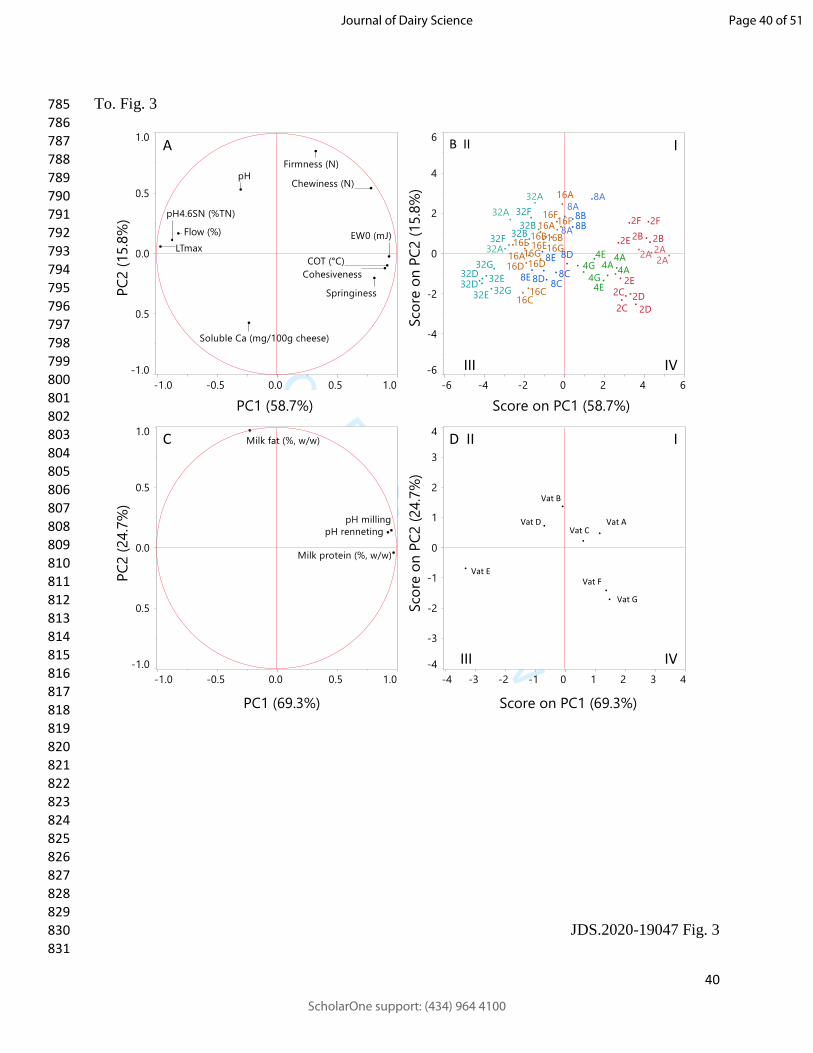
For Peer Review
40
To. Fig. 3 785
786 787 788 789 790
791 792 793 794 795
796 797
798
799 800 801 802
803 804
805 806 807
808 809
810
811
812 813
814 815 816
817 818 819
820 821 822
823 824 825 826
827 828 829
JDS.2020-19047 Fig. 3 830 831
Vat F Vat G
Vat A Vat C
Vat D
Vat B
Vat E
A B II I
IV III
D II I
IV III
C
PC
2 (
15.8
%)
PC
2 (
24.7
%)
Sco
re o
n P
C2 (
15.8
%)
Sco
re o
n P
C2 (
24.7
%)
PC1 (58.7%)
PC1 (69.3%)
Score on PC1 (58.7%)
Score on PC1 (69.3%)
Flow (%)
Page 40 of 51
ScholarOne support: (434) 964 4100
Journal of Dairy Science

For Peer Review
41
To. Fig. 4 832
833 834
835 836
837 838 839
840
841
842 843 844
845 846
847 848 849
850
851 852
853 854 855 856
857
858 859
860 861 862 863
JDS.2020-19047 Fig. 4 864 865
-2
0
-4
2
4
-2
-1
0
2
1
‘Maj
or
sto
rage
tim
e-r
elat
ed’ c
om
po
nen
t sc
ore
‘Min
or
sto
rage
tim
e-re
late
d’ c
om
po
nen
t sc
ore
Storage time (days)
0 5 15 30 20 25 10 35
Storage time (days)
0 5 15 30 20 25 10 35
Page 41 of 51
ScholarOne support: (434) 964 4100
Journal of Dairy Science
For Peer Review
42
To. Fig. 5 866
867 868
869 870
871 872 873
874
875
876 877 878
879 880
881 882 883
884
885 886
887 888 889 890
891
892 893
894 895 896 897
JDS.2020-19047 Fig. 5 898 899
-2
-1
-4 -5
0
-3
1
‘Major storage time-related’
component score
5
10
15
20
25
30
.
2
27.0 28.5 30.0 31.5 33.0
Sto
rag
e t
ime (
days)
Calcium content of the cheese (mg/g protein)
Page 42 of 51
ScholarOne support: (434) 964 4100
Journal of Dairy Science

For Peer Review
43
To. Fig. 6 900
901 902
903 904
905
906 907
908 909
910 911 912
913 914
915 916 917
918
919 920 921 922
923
924 925 926
927 928 929
930 JDS.2020-19047 Fig. 6 931
932
D2
D2
D8
D8
D16
D16
D32
D32
Ca (mg/g protein)
-4
-2
0
2
4
-2
-1
0
1
2
-3
‘Min
or
sto
rage
tim
e-
dep
end
ent
com
po
nen
t’ s
core
‘Maj
or
sto
rage
tim
e-
dep
end
ent
com
po
nen
t’ s
core
27.0 28.5 30.0 31.5 27.0 28.5 30.0 31.5 27.0 28.5 30.0 31.5 27.0 28.5 30.0 31.5
D2
D2
D8
D8
D16
D16
D32
D32
Page 43 of 51
ScholarOne support: (434) 964 4100
Journal of Dairy Science
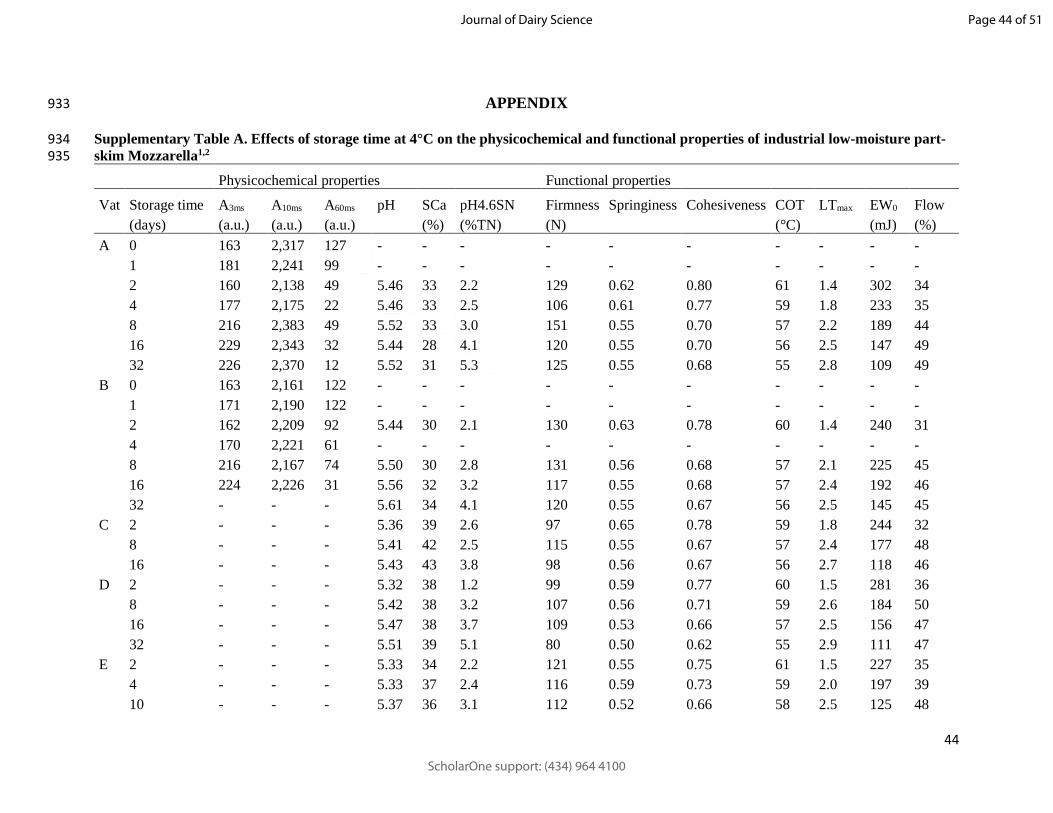
For Peer Review
44
APPENDIX 933
Supplementary Table A. Effects of storage time at 4°C on the physicochemical and functional properties of industrial low-moisture part-934 skim Mozzarella1,2 935
Physicochemical properties Functional properties
Vat Storage time A3ms A10ms A60ms pH SCa pH4.6SN Firmness Springiness Cohesiveness COT LTmax EW0 Flow
(days) (a.u.) (a.u.) (a.u.) (%) (%TN) (N) (°C) (mJ) (%)
A 0 163 2,317 127 - - - - - - - - - -
1 181 2,241 99 - - - - - - - - - -
2 160 2,138 49 5.46 33 2.2 129 0.62 0.80 61 1.4 302 34
4 177 2,175 22 5.46 33 2.5 106 0.61 0.77 59 1.8 233 35
8 216 2,383 49 5.52 33 3.0 151 0.55 0.70 57 2.2 189 44
16 229 2,343 32 5.44 28 4.1 120 0.55 0.70 56 2.5 147 49
32 226 2,370 12 5.52 31 5.3 125 0.55 0.68 55 2.8 109 49
B 0 163 2,161 122 - - - - - - - - - -
1 171 2,190 122 - - - - - - - - - -
2 162 2,209 92 5.44 30 2.1 130 0.63 0.78 60 1.4 240 31
4 170 2,221 61 - - - - - - - - - -
8 216 2,167 74 5.50 30 2.8 131 0.56 0.68 57 2.1 225 45
16 224 2,226 31 5.56 32 3.2 117 0.55 0.68 57 2.4 192 46
32 - - - 5.61 34 4.1 120 0.55 0.67 56 2.5 145 45
C 2 - - - 5.36 39 2.6 97 0.65 0.78 59 1.8 244 32
8 - - - 5.41 42 2.5 115 0.55 0.67 57 2.4 177 48
16 - - - 5.43 43 3.8 98 0.56 0.67 56 2.7 118 46
D 2 - - - 5.32 38 1.2 99 0.59 0.77 60 1.5 281 36
8 - - - 5.42 38 3.2 107 0.56 0.71 59 2.6 184 50
16 - - - 5.47 38 3.7 109 0.53 0.66 57 2.5 156 47
32 - - - 5.51 39 5.1 80 0.50 0.62 55 2.9 111 47
E 2 - - - 5.33 34 2.2 121 0.55 0.75 61 1.5 227 35
4 - - - 5.33 37 2.4 116 0.59 0.73 59 2.0 197 39
10 - - - 5.37 36 3.1 112 0.52 0.66 58 2.5 125 48
Page 44 of 51
ScholarOne support: (434) 964 4100
Journal of Dairy Science

For Peer Review
45
16 - - - 5.38 38 3.7 133 0.51 0.64 57 2.7 113 52
32 - - - 5.41 40 5.2 92 0.52 0.66 54 3.0 75 53
F 2 - - - 5.34 30 2.2 158 0.56 0.74 61 1.5 275 36
16 - - - 5.49 31 2.5 135 0.55 0.68 57 2.4 147 45
32 - - - 5.47 33 5.0 135 0.52 0.64 55 2.8 111 39
G 2 183 2336 100 - - - - - - - - - -
4 189 2384 50 5.35 33 2.6 115 0.55 0.67 58 1.8 221 39
8 189 2183 20 - - - - - - - - - -
16 - - - 5.40 35 3.8 111 0.55 0.63 56 2.6 164 47
32 - - - 5.39 33 5.4 88 0.53 0.63 54 2.8 81 43 1Abbreviations are: less-mobile-serum fractions, A3ms, A10ms; more-mobile-serum fraction, A60ms; serum-soluble Ca, SCa; cross-over temperature, COT; maximum 936 value of the loss tangent, LTmax; extension work at 0 min after melting, EW0. Data are mean values measured on at least two different cheese blocks per storage 937 time at 4°C except for A3ms, A10ms and A60ms, which were measured on two different locations in one cheese block per storage time. 938 2A cheese vat (coded A, B, C, D, E, F and G) was sampled every two to four months over a period of 16 months (November 2017 - February 2019).939
Page 45 of 51
ScholarOne support: (434) 964 4100
Journal of Dairy Science
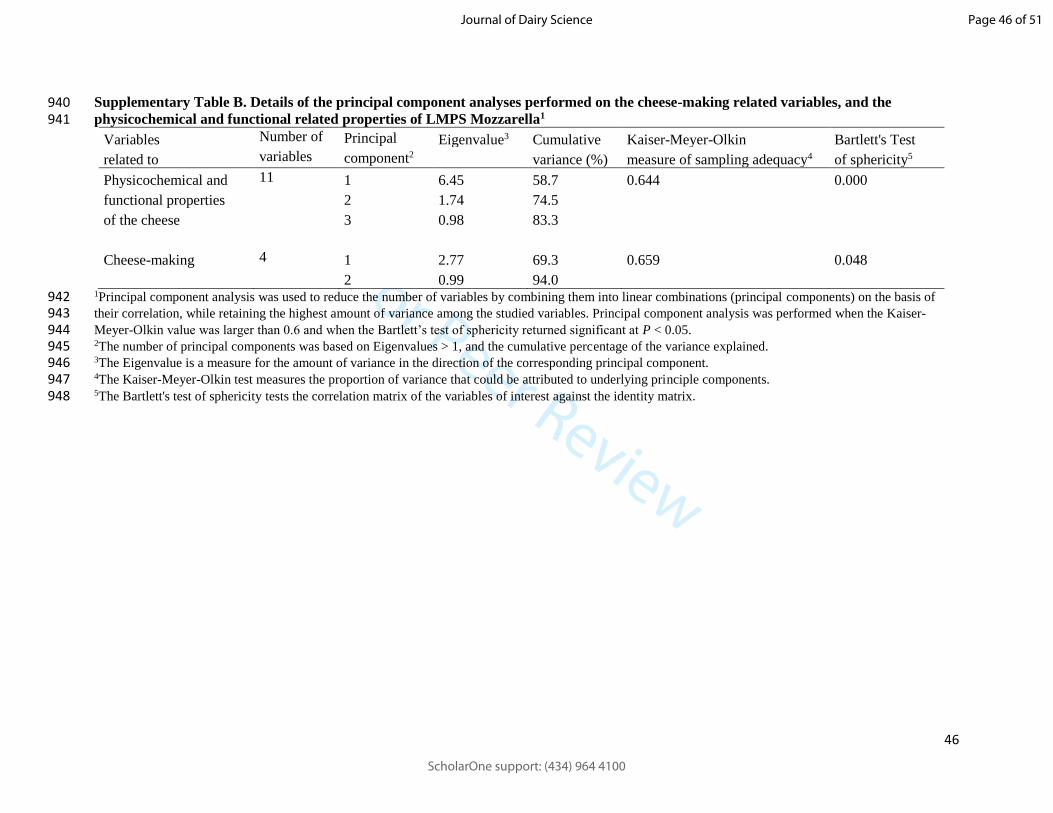
For Peer Review
46
Supplementary Table B. Details of the principal component analyses performed on the cheese-making related variables, and the 940 physicochemical and functional related properties of LMPS Mozzarella1 941
Variables Number of Principal Eigenvalue3 Cumulative Kaiser-Meyer-Olkin Bartlett's Test
related to variables component2 variance (%) measure of sampling adequacy4 of sphericity5
Physicochemical and 11 1 6.45 58.7 0.644 0.000
functional properties 2 1.74 74.5
of the cheese 3 0.98 83.3
Cheese-making 4 1 2.77 69.3 0.659 0.048
2 0.99 94.0 1Principal component analysis was used to reduce the number of variables by combining them into linear combinations (principal components) on the basis of 942 their correlation, while retaining the highest amount of variance among the studied variables. Principal component analysis was performed when the Kaiser-943 Meyer-Olkin value was larger than 0.6 and when the Bartlett’s test of sphericity returned significant at P < 0.05. 944 2The number of principal components was based on Eigenvalues > 1, and the cumulative percentage of the variance explained. 945 3The Eigenvalue is a measure for the amount of variance in the direction of the corresponding principal component. 946 4The Kaiser-Meyer-Olkin test measures the proportion of variance that could be attributed to underlying principle components. 947 5The Bartlett's test of sphericity tests the correlation matrix of the variables of interest against the identity matrix.948
Page 46 of 51
ScholarOne support: (434) 964 4100
Journal of Dairy Science

For Peer Review
47
Supplementary Table C. Effects of compositional variation, storage time at 4°C and their interactions on the ‘major storage time-related’ 949 and ‘minor storage time-related’ components1 950
1Abbreviations: FDM, fat-in-dry matter; MNFS, moisture-non-fat-substance, S/M, salt-in-moisture. 951 2The factors ‘milk protein-related’ and ‘milk fat-related’ components correspond to linear combinations of milk contents of protein and fat, and pH during 952 manufacturing as derived from principal component analysis, whereas the response variables ‘major storage time-related’ and ‘minor storage time-related’ 953 components correspond to linear combinations of the physicochemical and functional properties of low-moisture part-skim Mozzarella, and are a measure for the 954 overall functional quality of the cheese. The statistical significance (P) for treatment effects on the ‘major storage time-related’ or ‘minor storage time-related’ 955 component is given where P > 0.05, P < 0.05, P < 0.01 and P < 0.001 are denoted by -, *, ** and ***, respectively.956
‘Major storage time-related’ ‘Minor storage time-related’
component component
Effects of2 df SS Fratio P df SS Fratio
P
‘Milk protein-related’ component (‘MP’) 1 277 165 * 1 7 4 *
Storage time (ST) 1 9.51 5.68 *** 1 1.56 0.95 -
Interaction (‘MP’ x ST) 1 0.36 0.21 - 1 1.41 0.86 -
‘Milk fat-related’ component (‘MF’) 1 266 148 - 1 0 0 -
Storage time (ST) 1 2.81 1.56 *** 1 2.19 1.23 -
Interaction (‘MF’ x ST) 1 0.42 0.23 - 1 1.10 0.62 -
FDM (%) (FDM) 1 273 148 - 1 2 1 -
Storage time (ST) 1 0.21 0.12 *** 1 2.14 1.21 -
Interaction (FDM x ST) 1 0.12 0.06 - 1 0.02 0.01 -
MNFS (%) (MNFS) 1 272 148 - 1 2 1 -
Storage time (ST) 1 0.11 0.06 *** 1 1.89 1.08 -
Interaction (MNFS x ST) 1 0.35 0.19 - 1 0.87 0.50 -
S/M (%) (S/M) 1 260 163 ** 1 19 14 **
Storage time (ST) 1 14.37 9.04 *** 1 3.41 2.46 -
Interaction (S/M x ST) 1 0.20 0.13 - 1 1.19 0.86 -
Ca (mg.g-1 protein) (Ca) 1 283 197 *** 1 44 44 ***
Storage time (ST) 1 22.43 15.61 *** 1 0.66 0.66 -
Interaction (Ca x ST) 1 2.05 1.43 - 1 2.25 2.26 -
Page 47 of 51
ScholarOne support: (434) 964 4100
Journal of Dairy Science
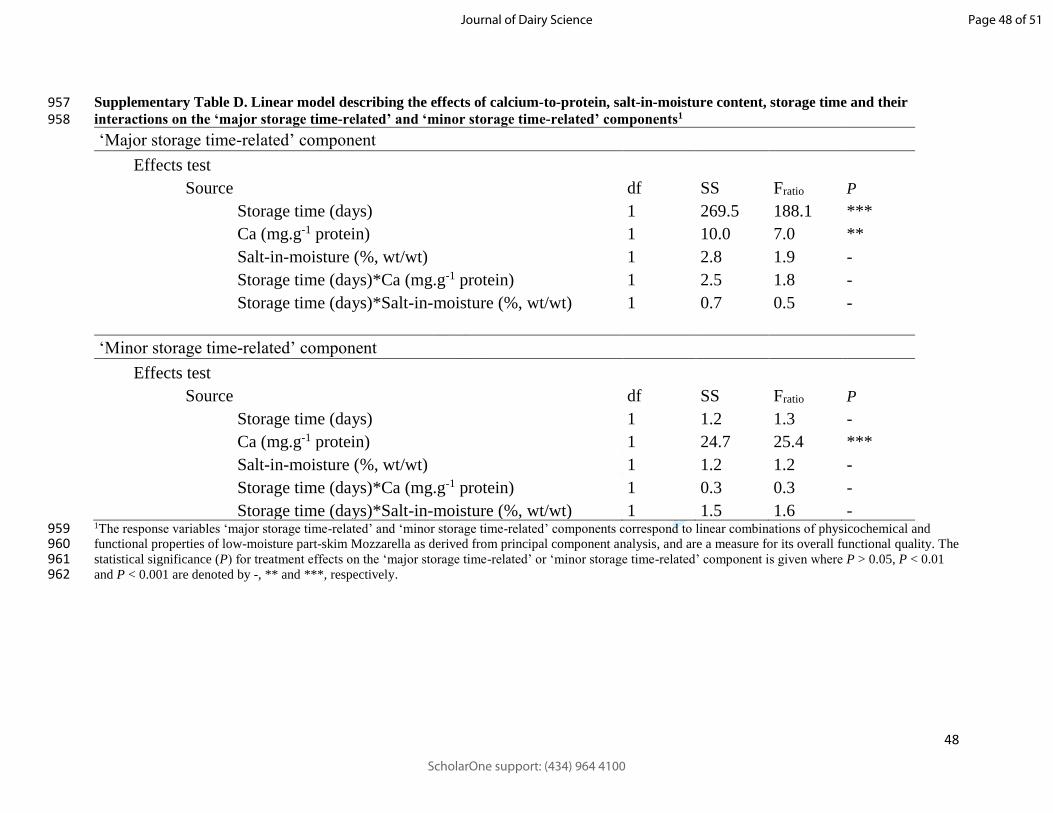
For Peer Review
48
Supplementary Table D. Linear model describing the effects of calcium-to-protein, salt-in-moisture content, storage time and their 957 interactions on the ‘major storage time-related’ and ‘minor storage time-related’ components1 958
‘Major storage time-related’ component
Effects test
Source df SS Fratio P
Storage time (days) 1 269.5 188.1 ***
Ca (mg.g-1 protein) 1 10.0 7.0 **
Salt-in-moisture (%, wt/wt) 1 2.8 1.9 -
Storage time (days)*Ca (mg.g-1 protein) 1 2.5 1.8 -
Storage time (days)*Salt-in-moisture (%, wt/wt) 1 0.7 0.5 -
‘Minor storage time-related’ component
Effects test
Source df SS Fratio P
Storage time (days) 1 1.2 1.3 -
Ca (mg.g-1 protein) 1 24.7 25.4 ***
Salt-in-moisture (%, wt/wt) 1 1.2 1.2 -
Storage time (days)*Ca (mg.g-1 protein) 1 0.3 0.3 -
Storage time (days)*Salt-in-moisture (%, wt/wt) 1 1.5 1.6 - 1The response variables ‘major storage time-related’ and ‘minor storage time-related’ components correspond to linear combinations of physicochemical and 959 functional properties of low-moisture part-skim Mozzarella as derived from principal component analysis, and are a measure for its overall functional quality. The 960 statistical significance (P) for treatment effects on the ‘major storage time-related’ or ‘minor storage time-related’ component is given where P > 0.05, P < 0.01 961 and P < 0.001 are denoted by -, ** and ***, respectively. 962
Page 48 of 51
ScholarOne support: (434) 964 4100
Journal of Dairy Science

For Peer Review
Reporting checklist for JDS for primary research that does not involve animals. Adapted from the REFLECT and STROBE-Vet statements. For intervention trials or observational studies in humans, consider using CONSORT or STROBE.
Indicate where in the paper these items are reported
Paper section
and topic
Item Descriptor of statement item Reported on Page #
Title & Abstract 1 Describe how experimental units were allocated to treatments (e.g., "random allocation," "randomized," or "randomly assigned"), or whether the study was observational, or an assessment of a method. Clearly state whether the outcome was the result of natural exposure or was the result of a controlled experiment. For observational studies, include a common study design term.
Introduction
Background
2 Provide scientific background and explanation of rationale.
Methods
Participants
3 If relevant, describe the eligibility criteria for human participants (e.g., in sensory evaluation or in surveys) and the settings and locations where the data were collected.
Interventions 4 Describe precise details of the interventions (treatments) for each group, the level (e.g., farm, animal, batch, or product) at which the intervention was allocated, and how and when interventions were administered.
Objectives 5 State specific objectives and hypotheses. Clearly state primary (i.e., the one that determined the sample size) and secondary objectives (if applicable).
Outcomes 6 Clearly define primary and secondary outcome measures and the levels at which they were measured, and, when applicable, any methods used to enhance the quality of measurements (e.g., multiple observations, training of assessors).
Sample size 7 Explain how sample size was determined and, when applicable, explain any interim analyses Where relevant, include sample size determinations at each level of the organizational structure and how any non-independence among groups or samples within a group were accounted for.
Randomization --
Sequence
generation
8 Describe the method used to generate the random allocation scheme, including details of any restrictions (e.g., blocking, stratification)
Randomization --
Allocation
concealment
9 Describe the method used to implement random allocation, including how treatment assignment was concealed (e.g., treatments may be randomly assigned, but if study units or samples are labelled with letters or colors, differentiation between groups is not concealed).
Download PDF to use as fillable formPage 49 of 51
ScholarOne support: (434) 964 4100
Journal of Dairy Science

For Peer Review
Randomization --
Implementation
10 Describe who generated the allocation sequence, who enrolled study units, and who assigned study units to their groups at the relevant level of the organizational structure.
Blinding (masking) 11 State whether or not those administering the interventions and those assessing the outcomes were blinded to group assignment; if done, how the success of blinding was evaluated. Provide justification for not using blinding if it was not used.
Analytical methods 12 Describe the analytic methods in sufficient detail for replication. Provide data or references to validate the accuracy of the methods under the conditions of this study. Include measures of the precision (repeatability) of assays and the limits of quantification. In sensory evaluations of foods, report the individual traits assessed, not only aggregated scores. For identification, or description of the properties of biological compounds, report the composition of compounds and the techniques by which they were determined. Describe and support how the techniques were validated.
Statistical methods 13 Specify the statistical methods used to compare groups for all outcomes. Clearly state the level of the data on which statistical analysis were performed i.e., show that the correct degrees of freedom were employed for the structure of the data. Clearly state if repeated measures of the outcome were made and how this was accounted for in the statistical analyses. Clearly state all covariates tested.
Results
Study flow
14 Account for the flow of study units through each stage of the study and analysis (a diagram is recommended). Specifically, for each group, report the numbers of study units randomly assigned or enrolled, receiving intended treatment, completing the study protocol, and analyzed or excluded. Describe any deviations from the study protocol as planned, and the reasons for these changes.
Contextual data 15 Where human evaluators (e.g., sensory analysis) or subjects are involved, describe the demographic and other relevant characteristics of participants.
Numbers analyzed 16 Specify the number of study units (denominator) in each group included in each analysis and whether the analysis was by "intention-to-treat” or whether units were excluded if they did not comply with the intended treatment. State the results in absolute numbers when feasible (e.g., 10/20, not 50%).
Outcomes 17 For each primary and secondary outcome, provide a summary of results for each group, accounting where relevant for each relevant level of the organizational structure, and the estimated effect size and its precision (e.g., 95% confidence interval). Where relative measures of effect are reported, also provide absolute values.
Ancillary analyses 18 Address multiplicity by reporting any other analyses performed, including subgroup analyses and adjusted analyses, indicating which were pre-specified and which were exploratory.
Reported on page #Page 50 of 51
ScholarOne support: (434) 964 4100
Journal of Dairy Science

For Peer Review
Discussion
Interpretation
19 Provide interpretation of the results, taking into account the study hypotheses, and sources of potential bias or imprecision, including explicit discussion of multiplicity of analyses and outcomes. Explicitly discuss the strengths and limitations of the study. Discuss both direction and magnitude of any potential bias. Place the results in the context of relevant literature and state whether or how the findings should change practice.
Generalizability 20 Discuss generalizability (external validity) of the study findings.
Transparency 21 List the sources of funding for the work and acknowledge any potential conflicts of interest that the authors have.
Reported on page #Page 51 of 51
ScholarOne support: (434) 964 4100
Journal of Dairy Science