assessments of physical function in older adults - UGent Biblio
234
Stefanie De Buyser Assessments of physical function in older adults as predictors of mortality and adverse health outcomes
-
Upload
khangminh22 -
Category
Documents
-
view
2 -
download
0
Transcript of assessments of physical function in older adults - UGent Biblio

Stefanie De Buyser
Assessments of physical function in older adults
as predictors of mortality and
adverse health outcomes

ASSESSMENTS OF PHYSICAL FUNCTION IN OLDER ADULTS AS PREDICTORS OF MORTALITY AND ADVERSE HEALTH
OUTCOMES
Stefanie De Buyser

© 2016 Stefanie De Buyser
2016 Nevelland Graphics
Cover illustration by Veerle Gevaert
The picture of a frail older man on this cover is
inspired by Edvard Munch’s ‘Self Portrait Between
Clock and Bed’
ISBN 9789073626232
All rights reserved. No parts of this book may be reproduced or transmitted in any form or by any
means, electronic, mechanical, photocopying, recording, or otherwise, without the prior written
permission of the author.

MMXVI
ASSESSMENTS OF PHYSICAL FUNCTION IN OLDER ADULTS AS PREDICTORS OF MORTALITY AND ADVERSE HEALTH
OUTCOMES
Stefanie De Buyser
Thesis submitted in fulfillment of the requirements for the degree of
DOCTOR IN MEDICAL SCIENCES
Supervisor: Prof. dr. Mirko Petrovic
Co-supervisor: Prof. dr. Youri Taes
Faculty of Medicine and Health Sciences

SUPERVISOR
Prof. dr. Mirko Petrovic Ghent University, Faculty of Medicine and Health Sciences, Department of Internal Medicine, Section of Geriatrics
CO-SUPERVISOR
Prof. dr. Youri Taes Ghent University, Faculty of Medicine and Health Sciences, Department of Internal Medicine, Section of Endocrinology and Unit for Osteoporosis and Metabolic Bone Diseases
OTHER MEMBERS OF THE STEERING COMMITTEE
Prof. dr. Jean-Marc Kaufman Ghent University, Faculty of Medicine and Health Sciences, Department of Internal Medicine, Section of Endocrinology and Unit for Osteoporosis and Metabolic Bone Diseases
Prof. dr. Nele Van Den Noortgate Ghent University, Faculty of Medicine and Health Sciences, Department of Internal Medicine, Section of Geriatrics
MEMBERS OF THE EXAM COMMITTEE
Prof. dr. Kristiane Van Lierde (Chairwoman) Ghent University, Faculty of Medicine and Health Sciences, Department of Speech, Language and Hearing sciences
Prof. dr. Guy T’Sjoen Ghent University, Faculty of Medicine and Health Sciences, Department of Internal Medicine, Section of Endocrinology and Unit for Osteoporosis and Metabolic Bone Diseases
Prof. dr. Ruth Piers Ghent University, Faculty of Medicine and Health Sciences, Department of Internal Medicine, Section of Geriatrics
Prof. dr. Patrick Calders Ghent University, Faculty of Medicine and Health Sciences, Department of Physical therapy and motor rehabilitation
Prof. dr. Ivan Bautmans Free University of Brussels, Faculty of Medicine and Pharmacy, Department of Gerontology
Prof. dr. Maurits Vandewoude University of Antwerp, Faculty of Medicine and Health Sciences, Department of Primary and Interdisciplinary Care Antwerp, Research Unit of Geriatrics
Prof. dr. Evelien Gielen Catholic University of Leuven, Faculty of Medicine, Department of Clinical and Experimental Medicine, Section of Gerontology and Geriatrics

Voor mijn ouders


TABLE OF CONTENTS
LIST OF ABBREVIATIONS 1
CHAPTER 1: BACKGROUND 3
1.1 THE AGEING AND AGED POPULATION 5
1.1.1 (Healthy) life expectancy 5
1.1.2 Health risks in the aged population 10
1.2 PHYSICAL FRAILTY, SARCOPENIA, AND LOW LEVELS OF PHYSICAL
FUNCTION 12
1.2.1 Conceptual and operational definitions 12
1.2.2 Underpinning mechanisms 21
1.2.3 Purposes 24
1.2.4 Epidemiology 26
1.3 RESEARCH OBJECTIVES 28
1.3.1 General aims 28
1.3.2 Specific aims in community-dwelling older men 28
1.3.3 Specific aims in older in-patients 29
1.4 STUDY POPULATIONS 31
1.4.1 Community-dwelling older men 31
1.4.2 Older in-patients 32
1.5 METHODOLOGY 33
1.5.1 Physical function (related) assessments 33
1.5.2 Adverse health outcomes 39
1.5.3 Statistical methodology 40

CHAPTER 2: MORTALITY RISK ASSESSMENT IN COMMUNITY-DWELLING
OLDER MEN THROUGH MEASUREMENTS OF PHYSICAL FUNCTION 41
2.1 VALIDATION OF THE FNIH SARCOPENIA CRITERIA AND SOF
FRAILTY INDEX AS PREDICTORS OF LONG-TERM MORTALITY IN
AMBULATORY OLDER MEN 43
2.2 PHYSICAL FUNCTION MEASUREMENTS PREDICT MORTALITY IN
AMBULATORY OLDER MEN 61
2.3 THREE YEAR FUNCTIONAL CHANGES AND LONG-TERM
MORTALITY HAZARD IN COMMUNITY-DWELLING OLDER MEN 81
CHAPTER 3: HEALTH RISK ASSESSMENT IN OLDER IN-PATIENTS
THROUGH MEASUREMENTS OF PHYSICAL FUNCTION 99
3.1 A MULTICOMPONENT APPROACH TO IDENTIFY PREDICTORS OF
HOSPITAL OUTCOMES IN OLDER IN-PATIENTS: A MULTICENTRE,
OBSERVATIONAL STUDY 101
3.2 FUNCTIONAL CHANGES DURING HOSPITAL STAY IN OLDER
PATIENTS ADMITTED TO AN ACUTE CARE WARD: A
MULTICENTRE OBSERVATIONAL STUDY 121

CHAPTER 4: GENERAL DISCUSSION 135
4.1 MAIN FINDINGS & CONTRIBUTIONS IN COMMUNITY-DWELLING
OLDER MEN 137
4.1.1 SOF frailty & mortality 137
4.1.2 FNIH sarcopenia & mortality 139
4.1.3 Physical function & mortality 141
4.1.4 Changes in physical function & mortality 146
4.2 MAIN FINDINGS & CONTRIBUTIONS IN OLDER IN-PATIENTS 149
4.2.1 Physical function & hospital outcomes 149
4.2.2 Functional changes during hospital stay 155
4.3 IMPLICATIONS & PERSPECTIVES 159
4.3.1 Physical function & its purpose 159
4.3.2 Physical function & its numerous operational definitions 161
4.3.3 Physical function & its interventions 162
4.3.4 Physical function & the older individual 165
4.3.5 Physical function & its future 166
4.4 METHODOLOGICAL CONSIDERATIONS 166
4.4.1 Merelbeke study 167
4.4.2 CRIME study 171
CHAPTER 5: REFERENCES 173
SUMMARY 203
SAMENVATTING 207
ABOUT THE AUTHOR 211
DANKWOORD 219


LIST OF ABBREVIATIONS
ACE Acute Care for the Elderly
ADL Activities of daily living
ALM Appendicular lean mass
ALMBMI Appendicular lean mass to Body mass index - ratio
ANCOVA Analysis of covariance
AUC Area under the curve
BIA Bioelectrical impedance analysis
BMI Body mass index
CI95 95% confidence interval
CHS Cardiovascular Health Study
COPD Chronic obstructive pulmonary disease
CRIME CRIteria to assess appropriate Medication use among Elderly complex patients
DXA Dual-energy X-ray absorptiometry
ESPEN SIG European Society for Clinical Nutrition and Metabolism Special Interest Group
EWGSOP European Working Group on Sarcopenia in Older People
FNIH Foundation for the National Institutes of Health
GDS Geriatric Depression Scale
HR Hazard ratio
IADL Instrumental activities of daily living
ICC Intra-class correlation coefficient
INRCA Italian National Institute of Health and Science on Aging
IQR Interquartile range
IWGS International Working Group on Sarcopenia
LoS Length of hospital stay
MMSE Mini-Mental State Examination
OLS Ordinary least-squares
OR Odds ratio
RDRS-2 Rapid Disability Rating Scale-2
SCWD Society of Sarcopenia, Cachexia and Wasting Disorders
SD Standard deviation
SF-36 Short Form-36
SOF Study of Osteoporotic Fractures
SPPB Short Physical Performance Battery

1 CHAPTER 1: BACKGROUND
1.1 THE AGEING AND AGED POPULATION 5
1.1.1 (Healthy) life expectancy 5
1.1.2 Health risks in the aged population 10
1.2 PHYSICAL FRAILTY, SARCOPENIA, AND LOW LEVELS OF PHYSICAL
FUNCTION 12
1.2.1 Conceptual and operational definitions 12
1.2.2 Underpinning mechanisms 21
1.2.3 Purposes 24
1.2.4 Epidemiology 26
1.3 RESEARCH OBJECTIVES 28
1.3.1 General aims 28
1.3.2 Specific aims in community-dwelling older men 28
1.3.3 Specific aims in older in-patients 29
1.4 STUDY POPULATIONS 31
1.4.1 Community-dwelling older men 31
1.4.2 Older in-patients 32
1.5 METHODOLOGY 33
1.5.1 Physical function (related) assessments 33
1.5.2 Adverse health outcomes 39
1.5.3 Statistical methodology 40

4
Outline
This doctoral thesis evaluates physical function (related) assessments in older adults and their
predictive value for health risks and mortality. In addition, it reports on changes in physical
function occurring over time.
This first chapter starts with several facts and figures on the ageing and aged population.
Thereafter, physical function assessments are introduced. This introduction includes conceptual
and operational definitions of physical frailty, sarcopenia, and low levels of physical function. It
also consists of the latter’s underpinning mechanisms, purposes, and epidemiology. Thereafter, the
research objectives are expressed and motivated. This is followed by a summary of the two cohort
studies in which these questions were investigated. Finally, the chapter ends with a description of
the used methodology.

THE AGEING AND AGED POPULATION
1.1
5
1.1 THE AGEING AND AGED POPULATION
1.1.1 (HEALTHY) LIFE EXPECTANCY
Increasing life expectancy
Globally, the average life expectancy at birth has increased from approximately 28.5 years in 1800
to approximately 70 years now (1,2) (Figure 1). The continuous increase in life expectancy at birth
across Europe during the last century is driven by reductions in infant mortality, rising living
standards, improved lifestyles and better education, as well as advances in healthcare and medicine
(2–4).
Figure 1. Life expectancy from birth by world region over time.
While the earliest health transitions already began in the 1770s in Europe, a steep increase in life expectancy
estimates occurred from about 1920 to about 1973 (after World War I and the global influenza pandemic).
Afterwards the pace of advancing life expectancy slowed down again (1).
Visualization adapted from Roser (2); data up to 2001 are from Riley (1); data for 2000, 2012, and 2013 are from the
World Health Organization (5); data for Asia in 2009 are from the Organization for Economic Co-operation and
Development (6).
In 1800, the region of Belgium had the highest life expectancy at birth of all regions with just 40
years (2). In 2013, Belgium’s average life expectancy at birth was 80.4 years (7), just below the 28-
membered European Union’s average of 80.6 years in 2013 (4). Over the past 20 years annual
progress in life expectancy in Belgium was a mean 0.2 years (72 days). However, there has been a

6
significant increase of 0.6 years (218 days) in life expectancy in 2014, with average life expectancy at
birth for women being 83.5 years and for men 78.6 years (8). Based on mortality data between 1991
and 2012, it has been hypothesized that life expectancy at birth in 2060 will be 88.4 years for
women and 86.1 years for men (9). These further gains are expected to be achieved mostly from the
reduction in mortality at older age. Figure 2 displays the increasing life expectancy at age 65. In
1996, life expectancy at age 70 was 11.7 years for men and 15.3 years for women. This has
increased to 14.6 years and 17.4 years respectively in 2014 (7).
Figure 2. Life expectancy and healthy life years from age 65 since 1995.
Results on healthy life years should be interpreted with caution, because sample sizes vary remarkably and because
the underlying health measure was not always truly comparable to make valid comparisons.
Health expectancy until 2001 was based on the disability question of the ‘European Community Household Panel’
survey, which paid less attention to the translation aspect for true harmonisation across countries.
Health expectancy from 2004 onwards was based on the ‘Statistics on Income and Living Conditions’ question on
long-term health related disability (Global Activity Limitation Indicator). The wording of the question slightly
changed in 2005 for Belgium to better reflect the European Union standard. In addition, the wording of the question
has been revised in 2008 for most countries including Belgium and in 2007 for Italy.
Data for 1996 – 2001 are from EurOhex – the European Community Household Panel (10); data for 2004 – 2013 are
from EurOhex – Statistics on Income and Living Conditions (11).

THE AGEING AND AGED POPULATION
1.1
7
Ageing of the population
The increasing life expectancy together with the reduction in fertility are the main reasons for the
ageing of the European population (4,8). In 2015 in Belgium, 1 152 835 women and 857 424 men
were aged 65 years or more, they represent 20% and 16% of female and male population (12)
(Figure 3).
Figure 3. Structure of the Belgian population in 2015 according to age and gender.
Data are from Statistics Belgium (12).

8
Healthy life expectancy
Unfortunately, the mean number of years expected to live does not fully represent the mean
number of years expected to live in good health, which has a less favorable evolution. Life
expectancy can be divided into life spent in different states of health. The most common health
expectancies are those based on activity limitation or chronic morbidity. Figure 4 depicts the
increasing prevalence of activity limitation and chronic morbidity with age in Belgium (based on
cross-sectional data from 2013). Across age categories, women were more frequently than men
experiencing morbidity (51% vs. 41% at 70 years of age) and activity limitation (54% vs. 44% at 70
years of age).
Hereafter, life expectancy without long-term activity limitation is referred to as healthy life years (13).
Figure 2 shows that in 2012 the number of healthy life years at age 65 has increased to 11.1 years
and 10.7 years for women and men respectively (not taking into account the institutional
population)(13). This means that women and men at age 65 can expect to spend 52% and 60%
respectively of their life without self-reported long-term activity limitations. While life expectancy
in 2012 in Belgium was below the European average, the healthy life years surpassed the European
average. Prevalence rates of activity limitation were lower compared to the mean trajectory in the
European Union after the age of 45 years for women and 50 years for men (13).
In general, life expectancy has always been longer for women. However, the difference between
genders keeps on decreasing. In addition, the difference in healthy life years is much smaller, which
leads to women spending a larger proportion of their life in poor health (13) (Figure 2).

THE AGEING AND AGED POPULATION
1.1
9
Figure 4. Prevalence of activity limitation and chronic morbidity in Belgium according to
gender and age group (2013).
Data are from EurOhex – Statistics on Income and Living Conditions (11).
Data were collected through personal interview (proxy as an exception) or registers.
These results should be interpreted cautiously given the sample size comprised 6025 women and 5686 men excluding
the institutional population, such as people living in nursing homes (14).
The question on chronic morbidity was implemented as “Do you have any longstanding illness or health problem?
By longstanding I mean illnesses or health problems which have lasted, or are expected to last, for 6 months or
more”. Prevalence of chronic morbidity ranges from 24% to 45% in men, and 29% to 56% in women. The relatively
high prevalence in younger persons may partially be explained by the fact that interviewers were instructed to be as
inclusive as possible. This means problems that are seasonal or intermittent, problems not seem by the respondent as
very serious (hay fever), problems that have not been diagnosed by a doctor, etc. are also included.
The question on activity limitations was implemented as “For at least the past 6 months, to what extent have you
been limited because of a health problem in activities people usually do?” Response categories made a distinction in
three levels of severity (yes strongly limited, yes limited, no not limited at all). Prevalence of activity limitations
(regardless of severity) range from 18% to 62% in men, and 23% to 70% in women.

10
1.1.2 HEALTH RISKS IN THE AGED POPULATION
In addition to the above mentioned age-associated increases in activity limitation and morbidity, the
aged population (65 years or more) is also more exposed to various health risks compared to other
age categories (Figure 5). Mortality events in 2012 occurred in over 90 000 older Belgian citizens
aged 65 years or more. The most common causes of death in these older persons were
cardiovascular diseases (32%), cancer (24%), and respiratory diseases (12%) (15). Hospital
admissions with an overnight stay happened in more than 715 000 patients aged 65 years or more.
Of all in-patients who stayed in hospital up to 90 days, older persons had the longest mean length
of hospital stay (LoS) with 10.3 days. Stays in day hospital happened in more than 826 000 older
persons (data for 2012 (16)). In-hospital death occurred in over 44 000 older persons in 2012, which
corresponded to 6% of all older inpatient stays of type H or L (these include the standard
hospitalizations with overnight stay and the prolonged stays of over six months with discharge
during the first semester of the registration period, respectively) (17). Long-term care in Belgian
institutions was received by over 124 000 persons aged 65 years or more. These older long-term
care recipients represented 1% of the total population and 7% of the population aged 65 years or
more (data for 2010 (18)).

THE AGEING AND AGED POPULATION
1.1
11
Figure 5. Health risks in the aged population.
Data for all-cause mortality (2012) are from the FOD Volksgezondheid veiligheid van de voedselketen en leefmilieu
(15), data for hospital stays ≤ or > 90 days (2012) are from the FOD Volksgezondheid veiligheid van de voedselketen
en leefmilieu (16), data for hospital stays type H or L and in-hospital mortality (2012) are from the FOD
Volksgezondheid veiligheid van de voedselketen en leefmilieu (17), data for long-term care in institution (2010) are
from the Organization for Economic Co-operation and Development (18).
Dotted lines represent the percentage of women (20%) and men (16%) aged 65 years or more in the female and male
Belgian population, respectively (2015) (12).
* within persons with hospital stay type H or L.

12
1.2 PHYSICAL FRAILTY, SARCOPENIA, AND LOW LEVELS OF PHYSICAL FUNCTION
1.2.1 CONCEPTUAL AND OPERATIONAL DEFINITIONS
Physical frailty: Towards a conceptual definition, yet still in search of a consented
operational definition
The age-related loss of physiologic reserve and hence loss of resistance to stressors is characteristic
for the condition called frailty, in which minimal stress can lead to functional impairment.
Following a minor stressful event (for example a urinary tract infection), robust older persons
experience a relatively small decline in function and afterwards return to homeostasis. Whereas frail
older persons, who already have lower function, experience a larger decline, making them
dependent. They require more time to recover and do not return to baseline homeostasis (Figure
6) (19).
Figure 6. Resilience to stressors.
A frail older person has an increased vulnerability to stressors, with reduced ability to maintain or regain homeostasis
after a destabilizing event (20). Adapted from Clegg et al. (19).

PHYSICAL FRAILTY, SARCOPENIA, AND LOW LEVELS OF PHYSICAL FUNCTION
1.2
13
There are many different conceptual definitions of frailty, some of them are reported in Table 1.
Those before 2008 are reviewed by Gobbens et al. (21,22). The unsuccessful attempts to arrive at a
consensus around frailty, may be due to the unresolved distinctions between broad definitions of
frailty and more specific subsets. Therefore, a frailty consensus group (consisting of participants
from six major international, European and US societies) recognized and separated physical frailty
from the broader definition of frailty, with the former being a more specific medical syndrome and
the latter being a general state or condition of an individual (23). Another frailty consensus group
(the Frailty Operative Definition-Consensus Conference Group) failed to arrive at a consensus
definition, however > 80% agreement was reached on several statements regarding the concept and
framework of frailty (24). One of these strongly agreed statements concerns that frailty is a dynamic
nonlinear process, different from multimorbidity and disability.
Table 1. Some conceptual definitions of frailty.
Rockwood et al. 1999 (25) Frailty is a combination of aging, disease, and other factors that make some
people vulnerable
Fried et al. 2001 (26) Frailty is a biologic syndrome of decreased reserve and resistance to stressors,
resulting from cumulative declines across multiple physiologic systems, and
causing vulnerability to adverse outcomes
Gobbens et al. 2010 (22)
(On behalf of an expert
group)
Frailty is a dynamic state affecting an individual who experiences losses in
one or more domains of human functioning (physical, psychological, social)
which is caused by the influence of a range of variables and which increases
the risk of adverse outcomes
Morley et al. 2013 (23)
(On behalf of a frailty
consensus group)
Physical frailty is a medical syndrome with multiple causes and contributors
that is characterized by diminished strength, endurance, and reduced
physiologic function that increases an individual’s vulnerability for developing
increased dependency and/or death
Boers et al. 2015 (27) Frailty is the weakening of the resilience or capacity to cope, and to maintain
and restore one’s integrity, equilibrium, and sense of wellbeing in three
domains: physical, mental, and social

14
Indeed, frailty should be distinguished from multimorbidity (which refers to the concurrent
presence of multiple chronic diseases or conditions) and from disability (which can refer to the
presence of one or more difficulties or dependencies in basic activities of daily living (ADL)(22,28), or
to mobility limitations as indicated by physical domains of health-related quality of life
questionnaires). These are three distinct yet partially overlapping entities (28). Multimorbidity is more
prevalent in older adults than frailty (23), Fried et al. reported that 68% of frail subjects also have
multimorbidity, while only 10% of subjects with multimorbidity simultaneously have frailty.
Prevalence of ADL disability and frailty was similar, with about 27% overlap (26). Some authors
have postulated that frailty can be considered as a form of pre-disability (29). Indeed, frailty is a risk
factor for disability (26), but disability can exist without previous frailty. Therefore, disability should
not be included in a definition of frailty (21,24).
Two widely accepted frameworks, where most operational definitions of physical frailty rely upon,
are the phenotype model and the cumulative deficit model.
The phenotype model was developed by Fried et al., who consider frailty as a clinical syndrome. It
includes characteristics of shrinking (weight loss, sarcopenia), weakness, exhaustion (poor
endurance), slowness, and low activity (26). Their physical phenotype, consisting of unintentional
weight loss, weak Grip strength, self-reported exhaustion, slow Gait speed, and low energy
expenditure, was validated in the Cardiovascular Health Study (CHS). Many others have developed
a slightly altered or simplified frailty phenotype. Ensrud et al. validated the parsimonious Study of
Osteoporotic Fractures (SOF) index (which consists only of weight loss, weakness, and poor
endurance) for prediction of adverse outcomes and found no difference in validity with the original
Fried frailty phenotype (30,31).
The cumulative deficit model underpins the Frailty index score, which was developed by Rockwood et
al. and validated in the Canadian Study of Health and Aging (32). A higher frailty index score, which
reflects the proportion of potential deficits (symptoms, signs, disease states, disabilities, and
abnormal laboratory values) present, indicates a higher likelihood that frailty is present. Subsequent
studies have demonstrated that the checklist with deficits can be reduced without loss of predictive
validity (33).
A third approach, where some operational definitions of frailty are based upon, relies on clinical
judgment. For example with the Clinical Frailty Scale, also developed by Rockwood et al. (34) and
validated in the Canadian Study of Health and Aging, the physician assigns the patient a score of 1

PHYSICAL FRAILTY, SARCOPENIA, AND LOW LEVELS OF PHYSICAL FUNCTION
1.2
15
(being very fit) to 7 (being severely frail). The Clinical Global Impression of Change in Physical
Frailty (35) has the clinician determine change in intrinsic and global frailty compared to notes from
a prior baseline assessment, which considered 13 domains. Amount of change is scored from 1
(marked worsening) to 7 (marked improvement). Also the Gérontopôle Frailty Screening Tool (36)
contains a part in which the view of the general practitioner about the frailty status of an individual
is expressed.
Finally, a fourth model, on which operational definitions are increasingly being built, is the
multidimensional one. As there is consensus that global frailty is multidimensional and may involve
psychological, social, emotional, and spiritual aspects in addition to physical components (24). There
are several instruments which try to capture this multidimensional nature. The Tilburg Frailty
Indicator (37) considers ten determinants of frailty (including gender and age) and eight physical,
four psychological, and three social components of frailty (cutoff point ≥ 5 components). The
Groningen Frailty Indicator (38) considers nine physical, one cognitive, three social, and two
psychological domains (cutoff point ≥ 4). The Edmonton Frail Scale (39) samples ten domains
among which cognition, health attitudes, quality of life, social support, and mood.
Both Rockwood et al. (40) and Gobbens et al. (22) have proposed criteria that should be reflected in a
successful definition of frailty. They believe that this frailty definition should be multidimensional,
make clear its dynamic state, and predict adverse outcomes. Many definitions apply cutoff points to
classify subjects as robust, pre-frail, or frail. However, this approach impedes looking at the
dynamic nature of frailty. While Rockwood et al. propose including frailty’s relation to disability and
comorbidity, Gobbens et al., reinforced by consensus groups mentioned above, advocate the
exclusion of disease, comorbidity and disability from any frailty definition. Unfortunately, to date
no operational definition of frailty meets all these criteria.

16
Sarcopenia: Similar story
The term sarcopenia was derived from the Greek ‘sarx’ for flesh and ‘penia’ for loss or poverty. It
was introduced by Rosenberg in 1989. He wanted to bring more attention to the age-related decline
in muscle mass by giving it a name, as it is “the most functionally significant decline with age” (41).
While originally sarcopenia was considered to be the age-related loss of muscle mass, currently its
definitions also incorporate elements such as strength or function. However, there is still no widely
accepted operational definition for sarcopenia at the moment.
In 1998, Baumgartner et al. (42) were first to assess sarcopenia, which back then was defined solely
by muscle mass. They obtained an index of relative skeletal muscle mass via estimating
appendicular skeletal muscle mass through an anthropometric prediction equation and dividing it
by height squared. Since 2009 several meetings were convened to arrive at a consensus definition of
sarcopenia. Table 2 displays the consensus diagnostic criteria for sarcopenia according to the
European Working Group on Sarcopenia in Older People (EWGSOP), the European Society for
Clinical Nutrition and Metabolism Special Interest Group (ESPEN SIG), the International
Working Group on Sarcopenia (IWGS), the Society of Sarcopenia, Cachexia and Wasting
Disorders (SCWD), and the Foundation for the National Institutes of Health Sarcopenia Project
(FNIH) Biomarkers Consortium. Both EWGSOP, ESPEN SIG, as well as SCWD defined their
cutoff point for low muscle mass based on the distribution of values for healthy young adults. In
contrast, the FNIH cutoff points for Grip strength and muscle mass were derived from a large,
diverse sample of older adults to best identify mobility impairment and weakness, respectively.
Other indices of low muscle mass are summarized nicely by Fielding et al (43).
Sarcopenia is primarily age-related, however its development can also accompany conditions that
are not exclusively seen in older persons, like malnutrition and cachexia. Similar to frailty,
sarcopenia needs to be distinguished from overlapping entities, in particular cachexia, which may
be defined as a “multifactorial syndrome characterized by severe body weight, fat and muscle loss
and increased protein catabolism due to underlying disease(s)” (44).
While muscle mass is lost with ageing, visceral abdominal fat mass may be preserved or even
increased. The term ‘sarcopenic obesity’ is used to describe the combination of excess weight and
reduced muscle mass or strength (45).

17
1.2
Table 2. Diagnostic criteria for sarcopenia according to several consensus definitions.
PARAMETERS VARIABLES MEASUREMENT TOOLS CUTOFF POINTS
EWGSOP 2010 (46) Low muscle mass
AND EITHER Low muscle strength
OR
Low physical performance
* ALM/height² Skeletal muscle mass/height²
or absolute muscle mass/height² * Grip strength
SPPB * Usual Gait speed Timed Up and Go
DXA BIA
> 2 SD below young healthy mean Gender (and BMI) adjusted, based on statistical analyses or quartiles of study group
≤ 8/12 ≤ 0.8 m/s
ESPEN SIG 2010 (44) Low muscle mass
AND
Low muscle strength
Undefined
Gait speed (4 m)
≥ 2 SD below young mean (gender and ethnicity adjusted) < 0.8 m/s
IWGS 2011 (43) Low muscle mass AND
Poor functional capacity
* ALM/height²
Bedridden or Non-ambulatory or
Cannot rise from a chair or Gait speed
DXA
♂ ≤ 7.23 kg/m² ♀ ≤ 5.67 kg/m²
Sex-specific lowest 20% of the distribution in well-functioning older persons (47)
< 1 m/s
SCWD 2011 (48) Low muscle mass AND
Limited mobility
ALM/height²
Gait speed (4 – 6 m) 6-minute walk
≥ 2 SD below young mean (gender and ethnicity adjusted) < 1 m/s < 400 m
FNIH 2014 (49–53) Low lean mass
Weakness
ALM * ALMBMI
* Grip strength Grip strength / BMI
DXA
Jamar® dynamometry
♂ < 19.75 kg ♂ < 0.789 ♂ < 26 kg ♂ < 1.00
♀ < 15.02 kg ♀ < 0.512 ♀ < 16 kg ♀ < 0.56
Most groups allow for parameters to be measured by a variety of variables, however their most favored assessment is indicated with an asterisk *. EWGSOP =
European Working Group on Sarcopenia in Older People, ESPEN SIG = European Society for Clinical Nutrition and Metabolism Special Interest Group, IWGS
= International Working Group on Sarcopenia, SCWD = Society of Sarcopenia, Cachexia and Wasting Disorders, FNIH = Foundation for the National Institutes
of Health, ALM = Appendicular lean mass, SPPB = Short Physical Performance Battery, ALMBMI = Appendicular lean mass to Body mass index - ratio, BMI =
Body mass index, DXA = Dual-energy X-ray absorptiometry, BIA = Bioelectrical impedance analysis, SD = Standard deviation.

18
Physical function: The core feature of physical frailty and sarcopenia
Frailty and sarcopenia are closely related and have therefore been called ‘twin’ conditions (54).
Cooper et al. (55) even suggested the term ‘sarcopenic frailty’ referring to “the inability of active,
autonomous, community-dwelling older people without current disabilities (but with low muscle
mass) to cope with stressors, leading to increased risk of adverse outcomes”. However, there is
some controversy about the causal relation between frailty and sarcopenia. On the one hand,
sarcopenia might be considered the pathophysiological pathway through which the negative health-
related outcomes of physical frailty arise (a clinical manifestation). On the other, however,
sarcopenia might precede frailty and act as a biological substrate for its development (54,56).
Although sarcopenia might be a component of frailty, there is agreement that frailty is more
multifaceted than sarcopenia alone (23) (Figure 7).
Cesari et al. (54) advocate diverting the focus towards the shared feature of physical frailty and
sarcopenia, instead of determining the causality of their relationship. Indeed, their unique core
feature is low physical function, which is usually measured by objective tests of Gait speed and
muscle strength (Figure 8). This shift in focus has also been picked up by others. For instance,
physical performance measurements have been tested as simple instruments for identifying physical
frailty (phenotype) in community-dwelling older people. While Gait speed (< 0.8 m/s) and Timed
Up and Go (> 10.0 seconds) both had high sensitivity (> 90%), their specificity was only moderate
indicating that around 40% of cases would be falsely classified as frail (57). In addition, the FNIH
Biomarkers Consortium avoids using the term sarcopenia, but consistently discriminates the
contributions of muscle mass and function (49).

PHYSICAL FRAILTY, SARCOPENIA, AND LOW LEVELS OF PHYSICAL FUNCTION
19
1.2 Indeed, by focusing on this shared feature of low physical function, the opportunity arises to define
a novel target for interventions against disability (54). Currently the treatment of frailty and
sarcopenia overlaps (58) and there is agreement that interventions against sarcopenia could be
clinically beneficial in cases of frailty (23). Possible interventions are described in Chapter 4.3.3.
When an intervention is capable of positively influencing both conditions at the same time, the
direction of the relationship between frailty and sarcopenia will no longer be clinically relevant (54).
Figure 7. The conceptual idea that sarcopenia is a key component of frailty. Adapted from
Rizzoli et al. (59).
Figure 8. The relationship between sarcopenia, frailty, and low levels of physical function.
Adapted from Cesari et al. (54).

20
Physical function: Levels and assessments
Low levels of physical function include impairments, functional limitations, and disabilities.
According to the classification of Liu et al. (60), which was used in their Cochrane review and based
upon the Nagi model of health states, impairments may be detected through measurements of
muscle strength (amongst others). Functional limitations may be assessed through simple physical
activities, such as Balance, Gait speed, Timed Up and Go, Chair rising, etc. Finally, assessment of
physical disabilities may include evaluations of reported measures of ADL and of physical domains
of health-related quality of life.
In this doctoral thesis ‘physical function’ encompasses both muscle strength, physical performance,
as well as functional status. With regard to the above mentioned levels of physical function, ‘muscle
strength’ can relate to Grip strength; ‘physical performance’ can relate to functional limitations and
thereby includes performance-based tests of Balance, Gait speed, Timed Up and Go, and Chair
rising; ‘functional status’ can relate to physical disabilities and comprises reported measures of both
ADL and mobility limitations. More details concerning the physical function measurements
assessed in this thesis and their psychometric properties are provided in Chapter 1.5.1. A common
performance-based test, which was not assessed in this thesis, is the Short Physical Performance
Battery (SPPB). It includes an assessment of Standing balance (holding three positions for ten
seconds each), a timed Gait at normal pace, and a Five Times Sit To Stand test. Subtest scores all
range between 0 – 4 points and the total summary score ranges between 0 – 12 points, with higher
scores indicating higher performance (61).
Physical function assessments most often apply continuous scoring systems and hence physical
function may be easier to approach as a dynamic process compared to frailty and sarcopenia,
whose operational definitions often apply ordinal scoring systems. Change in physical function can
be estimated in different ways. Two approaches are most found in literature. The first is to take the
absolute difference between two measuring points (follow-up - baseline) and classify persons
according to cutoff points for meaningful change, which can be established by a consensus panel
(62,63) or can be based on distribution (64). When more than two measuring points are available,
change from baseline can further be considered as intermittent or persistent (62,63). The second is to
calculate the rate or slope of change from linear models using two or more measuring points. This
latter approach also takes into account the time between measurements (64–66).
In this thesis ‘physical function (related) assessments’ is used to refer to instruments of physical
frailty and sarcopenia, and assessments of physical function.

PHYSICAL FRAILTY, SARCOPENIA, AND LOW LEVELS OF PHYSICAL FUNCTION
21
1.2 1.2.2 UNDERPINNING MECHANISMS
Multisystem physiological changes underlie the development of frailty and sarcopenia, including
dysregulations in the interrelated neuromuscular, endocrine and immune systems.
Neuromuscular changes
The loss of skeletal muscle mass is an integral component in the development of both sarcopenia
and frailty. However, loss of muscle strength can only be partially explained by loss in skeletal
muscle mass. Other age-induced neuromuscular alterations may also be implicated, including motor
cortex and spinal reflex lower excitability, decline in number of alpha motor neurons, decline in
number and size of type II fibers, loss in tendon stiffness, increased myocellular lipid content, and
maladaptations in excitation-contraction coupling (67,68).
Inflammation & coagulation
With sarcopenia and frailty, both inflammatory and coagulation pathways are increasingly active (69).
Serum levels of interleukin-6 and C-reactive protein, as well as numbers of white blood cells and
monocytes have shown to be elevated in frail older adults (70–74), suggesting a chronic low-grade
inflammatory status. Likewise, higher levels of coagulation markers, such as D-dimer, factor VIII
and tissue plasminogen activator, have been associated with prevalent and incident frailty (71,73,75).
Although the inflammatory and coagulation pathways interact with each other, their increased
activity might predominantly be explained by the relative increase in adiposity with ageing and
frailty (76), since adipose tissue highly expresses both pro-thrombotic factors and pro-inflammatory
cytokines.
Hormonal dysregulation
Endocrine factors influence synthesis and degradation of skeletal muscle proteins. Declines in
levels of testosterone, dehydroepiandrosterone-sulfate and insulin-like growth factor-1, insulin
resistance, alterations in levels of sex-hormone binding globulin and estrogens, increases in cortisol
levels, and vitamin D deficiency might play a role in the development of sarcopenia and frailty.
Most (but not all (77)) cross-sectional studies found a linear inverse relation between testosterone
levels and prevalent frailty in men (78,79) and one study found a U-shaped relation in women (78).
Prospective studies in men found change in testosterone to be associated with frailty progression
(80), but also found baseline testosterone not to be independently significantly associated with
incident physical frailty (79). Testosterone levels have been associated with concurrent Grip strength

22
(77,81), although this might have been mediated through appendicular lean mass (ALM) (81). The
association of baseline testosterone levels with decrease in muscle mass has been inconsistent (82,83).
Increasing levels of estradiol have been associated with prevalent frailty in older women (84) and
with greater decrease in ALM in older men (83). However, the association between increasing levels
of estradiol and frailty is controversial, as another study in men did not find an association between
(bioavailable) estradiol and prevalent and incident physical frailty (79).
Lower serum levels of the adrenal androgen dehydroepiandrosterone-sulfate have been associated
with prevalent physical frailty (85), concurrent number of frailty deficits (86), and incident frailty in
both older women and men (87).
Insulin-like growth factor-1 promotes protein synthesis in skeletal muscle by activating anabolic
and anti-catabolic pathways (68). Indeed, low levels of insulin-like growth factor-1 have been
associated with poor lower limb muscle strength, slow Gait speed, and sometimes (88) frailty in
cross-sectional studies (85,89) and with higher decrease in Gait speed and greater decrease in ALM in
a longitudinal study including older Belgian men (83).
Insulin is an important anabolic hormone and insulin resistance has been associated with lower
Grip strength (90), lower skeletal muscle mass index (91), and incident frailty (73). Likewise, diabetes
has been associated with lower muscle strength (92) and with greater declines in muscle mass and
strength (82,93). The multifactorial elements in the development of sarcopenia and frailty are
interlinked with those of diabetes, and hence it remains unclear which condition precedes the other
(94).
Associations with sex-hormone binding globulin have been inconsistent. While higher levels were
observed in physically frail older persons (77,86) and were predictive of decreasing ALM and incident
IWGS sarcopenia (in unadjusted models) (83), non-significant associations have also been found
with prevalent and incident physical frailty (79,80), incident EWGSOP sarcopenia and decreasing
Gait speed and Grip strength (83). Increased evening cortisol levels have been observed in older
women with physical frailty (95). In addition, high cortisol to dehydroepiandrosterone-sulfate - ratio
could predict the risk of developing frailty (87).
Lastly, vitamin D also has an effect on muscle metabolism. Although inconsistent associations have
been found of low serum 25(OH)-vitamin D levels with concurrent (96,97) and prospective (83,96)
physical performance (96–98), prevalent (99) and incident (83,100) sarcopenia, and prevalent (88,99,101–103)
and incident (88,101,103) frailty.

PHYSICAL FRAILTY, SARCOPENIA, AND LOW LEVELS OF PHYSICAL FUNCTION
23
1.2 Biological & genetic underpinnings
Several age-associated molecular mechanisms and genetic variations may underlie these multisystem
physiological dysregulations and hence have potential relevance to the development of sarcopenia
and frailty. However, these remain largely unexplored in human frailty research (20,58).
Mitochondrial dysfunction with increased production of reactive oxygen species might play a role
in the development of frailty. In fact, markers of increased oxidative stress such as elevated levels
of 8-epi-FGFα isoprostanes and lipoprotein phospholipase A2 mass, have been associated with
increased odds of prevalent physical frailty and slower Gait speed (104). Telomere attrition has also
been proposed as a biomarker of ageing. While shorter telomeres in peripheral blood mononuclear
cells have been observed in sarcopenic older persons (105), most studies found no association with
prevalent and incident physical frailty (105,106). With ageing, there is also a decreased clearance of
senescent and apoptotic cells. In this respect, CD8+CD28−CD27+, which is a specific T-cell subset
and marker of immuno-senescence, has been associated with physical frailty (107).
Finally, polymorphisms across genes related to apoptotic and transcription regulation pathways
might also be involved in the development of frailty (108).

24
1.2.3 PURPOSES
Physical function (related) assessments can be used for different purposes. Frailty instruments have
been used *to predict adverse health outcomes, *to find risk factors for frailty and understand its
etiology, *to compare with other instruments and evaluate clinimetric properties, *to find
biomarkers of frailty, *to screen subjects for inclusion/exclusion into a study, *to estimate the
prevalence of frailty, *to guide clinical decision making, and *to evaluate the impact of an
intervention (109,110).
The most common purpose (31%) of frailty instruments (for which the CHS phenotype has most
often been used) is to predict adverse health outcomes. In community-dwelling older persons,
operational definitions of physical frailty, especially the CHS phenotype, have been associated with
incident disability (26,31) and mortality (31,111). Likewise, operational definitions of sarcopenia,
especially EWGSOP sarcopenia, have been associated with incident disability (112) and mortality
(113,114). Nevertheless, inconsistent results were found for the association of FNIH sarcopenia with
mortality, while this is the only well-established instrument with data-driven criteria (52,115,116).
Finally, objective physical function measurements have also been associated with incident disability
(61,117–119) and mortality (120) in community-dwelling older persons. However, follow-up in mortality
studies has usually been less than ten years (except for Grip strength) (120), while meta-regression
analyses of Grip strength studies with various follow-up have indicated a weaker association with
mortality in studies with longer follow-up (120). In hospitalized older patients, operational definitions
of frailty (121,122) and sarcopenia (114,123) have also been associated with hospital outcomes. Albeit
reported measurements of physical function are most often used in this setting. Disability
instruments related to ADL have consistently been associated with mortality and
institutionalization, but less consistently with LoS (more details are provided in Chapter 4.2.1).
To date, much less commonly reported is the clinical use of frailty instruments (only 2% of all
purposes) (109), for example to manage a particular disease differently in frail vs. robust older
persons or to evaluate an older person’s capability to undergo a surgical procedure (109,124). An
international survey among clinicians belonging to professional societies (with 12% respondents
from Belgium) on the use of certain tools in clinical practice found around 60% of geriatricians,
endocrinologists and rheumatologists assess muscle mass in their daily practice. Muscle strength
was assessed in 53% to 61% of all medical specialties. Assessment of physical performance
depended on the field of interest of respondents: most geriatricians (84%) assessed physical

PHYSICAL FRAILTY, SARCOPENIA, AND LOW LEVELS OF PHYSICAL FUNCTION
1.2
25
performance in their clinical practice whilst 53% to 54% of endocrinologists and rheumatologists
assessed it (125).
There is likewise a paucity on the interventional use of frailty instruments as outcome measure (also
only 2% of all purposes) (109). In a systematic review on interventions targeting frailty, only 11
studies (published before November 2011) were found which used the entire construct of frailty as
an outcome (126).
26
1.2.4 EPIDEMIOLOGY
Frailty
The prevalence of frailty depends to a great extent on its operational definition and the setting in
which it is used.
In community-based studies, frailty has been detected in 23 to 59% of older adults according to
more broad, multidimensional definitions such as the Groningen Frailty Indicator, Tilburg Frailty
Indicator, and Sherbrooke Postal Questionnaire (127,128). However, only 4 to 17% of community-
dwelling older adults have been identified as frail according to definitions of physical frailty (127).
Within the concept of physical frailty, prevalence varies less along with its operationalization. For
instance, the Fried phenotype (CHS) identifies 4 to 17% as frail (127), and 38 to 53% as pre-frail,
whilst the SOF index identifies 4 to 17% as frail, and 19 to 50% as pre-frail (30,31,129–131).
Nevertheless there is only moderate agreement between the indexes, in other words the various
physical frailty phenotypes lead to different selections of patients, albeit of similar size (30,31,129,131).
Agreement between the CHS phenotype and global frailty instruments was poor in the Survey of
Health, Ageing, and Retirement in Europe (128). Prevalence of frailty in the community is higher in
women (127), older age (127), and certain ethnic origins. In the US, African American persons are
more likely to have physical frailty compared with white persons (132–134). Across Europe, frailty is
more prevalent in southern countries such as Spain and Italy, although the difference with northern
countries is attenuated when education is accounted for (135).
In acute care, frailty has been detected in 49 to 91% of hospitalized older patients according to
more broad, multidimensional definitions such as the Clinical Frailty Scale (136), the Edmonton Frail
Scale (137), and the Groningen Frailty Indicator (138), and in 27 to 66% of older in-patients according
to definitions of physical frailty (139–142). Frailty, as defined by SOF, was present in 33% of Belgian
(142) and in 27% of Italian (140) patients admitted to a geriatric ward. In hospitalized older patients,
prevalence of frailty varies across clinical wards, with the highest prevalence rates found in the
geriatric ward (up to 91% according to the Groningen Frailty Indicator) (138).
In long-term care, frailty has been detected in 64 to 85% of residents (143), although the actual
prevalence might even be higher since non-ambulatory and cognitively impaired subjects were not
taken into account.

PHYSICAL FRAILTY, SARCOPENIA, AND LOW LEVELS OF PHYSICAL FUNCTION
1.2
27
Frailty, however, has a dynamic nature. Transitions from a robust state to a more frail state have
been reported in 27 – 36% of robust older community-dwelling adults, while transitions to a lesser
frail state have been observed in 13 – 30% of (pre-)frail older adults, according to physical frailty
phenotypes (133,144,145).
Sarcopenia
Likewise, the prevalence of sarcopenia depends on its diagnostic parameters, resultant variables and
measurements tools, and the setting in which it is used.
In community, sarcopenia has been detected in 9 to 40% of older persons when it is defined solely
by low ALM measured with dual-energy X-ray absorptiometry (DXA) (43,83,115,133,146), in 0.9 to 29%
when defined by the EWGSOP (83,115,146–148), in 0.0 to 3% when defined by the IWGS (83), and in 0.6
to 8% when defined by the FNIH (52,115,116,146,149).
In acute care, EWGSOP sarcopenia has been detected in 10% of hospitalized older patients.
In older long-term care residents prevalence reports vary from 14 to 33% (147).
Prevalence of sarcopenia increases with age. Between genders, there is inconsistency as to which
sex has the highest prevalence, although higher rates are mostly found in women (147). Reported
prevalence rates of low ALM measured with DXA vary more widely in women than men (43),
furthermore prevalence of EWGSOP sarcopenia varies greatly in women according to the cutoff
points applied (148).
The Health, Aging, and Body Composition study has followed older persons over nine years and
found few (1%) participants with normal ALM, Grip strength and Gait speed at baseline to
develop low muscle mass (without low physical function) and no participants to become
sarcopenic. Of participants with low ALM at baseline, 7% transitioned to sarcopenia, while 4%
transitioned to more normal states. Of sarcopenic participants only 1 – 2% transitioned to more
normal states and 8 – 12% died (150).

28
1.3 RESEARCH OBJECTIVES
1.3.1 GENERAL AIMS
The aged population is more exposed to various health risks compared to other age categories.
Identifying which older subjects are at increased risk of adverse health events is of pivotal
importance for prevention and targeted interventions. The general aim of this doctoral thesis is
twofold. First, we aim to evaluate the predictive value of assessments of frailty, sarcopenia and
physical function for health risks in older adults. Second, we want to assess changes in physical
function occurring over time and during hospital stay.
1.3.2 SPECIFIC AIMS IN COMMUNITY-DWELLING OLDER MEN
Chapter 2 focuses on apparently healthy community-dwelling older Belgian men. The population-
based European cohort with long-term follow-up of this chapter enables contributions to the
validation of physical function (related) assessments. First, the association of physical frailty,
sarcopenia, and physical function with long-term all-cause mortality is explored. Second, change in
physical function over 3-year time and its effect on mortality hazard are examined.
SOF Frailty & mortality
In Chapter 2.1 we aim to evaluate the SOF frailty index for prediction of mortality. The 3-item
SOF index has been found just as accurate for discriminating death as the 5-item CHS index in US
studies. Moreover, the SOF index is considered to be more practical in the clinical setting, because
of its limited number of items and its non-distribution based cutoff points. However, with
inconsistent results found in hospitalized and non-US populations, we found it necessary to
investigate the validity of the SOF index towards mortality, which has to date not been explored in
a population-based European community-dwelling sample.
FNIH sarcopenia & mortality
In Chapter 2.1 we also aim to evaluate the FNIH cutoff points for weakness and low muscle mass
for prediction of mortality. The FNIH criteria are data-driven and based on discriminative and
predictive ability towards mobility impairment and weakness. This is unlike criteria from other
sarcopenia consensus groups that are founded on medical literature and their distribution in
reference populations. While previous related studies have been performed outside of Europe and

RESEARCH OBJECTIVES
1.3
29
showed inconsistent results, we are able investigate the validity of the FNIH criteria towards
mortality in European community-dwelling men.
Physical function & mortality
In Chapter 2.2 we aim to evaluate six physical function measurements assessed at a single time
point for prediction of all-cause mortality. While most previous studies have had relatively short
follow-up, we are able to investigate associations with subsequent 15-year mortality. By expressing
hazard ratios (HRs) per increase of 1 standard deviation (SD), we also compare the predictive value
of Rapid Disability Rating Scale-2 (RDRS-2) ADL, Short Form-36 (SF-36) Physical Function
Index, Grip strength, Standing balance, Chair rising, and Timed Up and Go.
Changes in physical function & mortality
In Chapter 2.3 we aim to evaluate the association between (rate of) change in physical function
and all-cause mortality (independent from baseline physical function). Most studies have examined
physical function at a single time point. We investigate whether assessing physical function
repeatedly over time adds prognostic information independent from that available with single
assessment.
1.3.3 SPECIFIC AIMS IN OLDER IN-PATIENTS
Chapter 3 focuses on hospitalized older Italian men and women admitted to acute care. The
assessment of Grip strength and Gait speed in these in-patients may contribute to the applicability
of objective measurements of physical function in hospital setting, where reported measurements
of physical function are most common. Firstly, the association of physical function with adverse
hospital outcomes is explored. Secondly, change in physical function during hospital stay and its
predictors are examined.
Physical function & hospital outcomes
In Chapter 3.1 we aim to identify which factors on admission can predict hospital outcomes, i.e.
LoS, in-hospital mortality, and institutionalization. We analyze prospectively collected data,
including both socio-demographic factors and multifaceted aspects of ageing e.g. nutritional status,
functional status, and physical performance measurements. We investigate whether physical
function measurements add prognostic information independently from that available with
routinely collected parameters.
30
Functional changes during hospital stay
In Chapter 3.2 we aim to examine functional changes during hospital stay through measurements
of both functional status and objective physical function. In addition we investigate which
characteristics of older in-patients are associated with meaningful in-hospital improvement in
physical performance.

STUDY POPULATIONS
1.4
31
1.4 STUDY POPULATIONS
1.4.1 COMMUNITY-DWELLING OLDER MEN
All analyses presented in Chapter 2 were performed on a sample of community-dwelling older
men participating in the Merelbeke study. This observational community-based cohort study was
designed to investigate the process of aging, mainly focusing on hormonal changes and bone
metabolism. Previous findings have been the subject of several publications (151–169). Participants
were recruited from the population register of Merelbeke, a semi-rural community of 22 000
inhabitants near Ghent University Hospital (Belgium). Age between 70 and 85 years and
willingness to participate were the only selection criteria at recruitment. All participants gave
written informed consent for participation in this study, which the ethics committee of Ghent
University Hospital has approved (Project 96/22). As displayed in Figure 9, the study started in
1996 with follow-up visits annually until 2000, one visit in 2003, and thereafter annual follow-up by
postal questionnaires and telephone contacts (still ongoing).
Figure 9. Overview of the Merelbeke study.

32
1.4.2 OLDER IN-PATIENTS
All analyses presented in Chapter 3 were performed on a sample of hospitalized older patients
participating in the CRIteria to assess appropriate Medication use among Elderly complex patients
(CRIME) study. This multicentre, observational study was designed to assess prescribing patterns
in older adults hospitalized in Italy and to produce recommendations for pharmacological
prescribing in older complex patients. Previous findings have been the subject of several
publications (123,170–178). Participants were recruited from the internal and geriatric medicine acute
care wards of three academic hospitals in Italy (Università Cattolica in Rome, University of Perugia,
and University of Ferrara) and four centres of the Italian National Institute of Health and Science
on Aging (INRCA)(situated in Ancona, Cosenza, Fermo, and Rome). Age of at least 65 years and
willingness to participate were the only selection criteria at inclusion. All participants gave written
informed consent for participation in this study, which the ethics committees of all participating
centres have approved. The study recruited patients between June 2010 and May 2011. Participants
were assessed within 24 hours of hospital admission and followed until the day of discharge,
transfer to another ward, or in-hospital death (Figure 10).
Figure 10. Overview of the CRIteria to assess appropriate Medication use among Elderly
complex patients study.

METHODOLOGY
1.5
33
1.5 METHODOLOGY
1.5.1 PHYSICAL FUNCTION (RELATED) ASSESSMENTS
Frailty
The SOF index (30,31) was used to define (pre-)frailty in Chapter 2.1. It was the only validated frailty
instrument that could be applied retrospectively to the Merelbeke study without any modifications.
According to the SOF index, frailty is defined as the presence of at least two of the following
components, pre-frailty as the presence of only one component, and robustness as the absence of
all components.
1) Weight loss (irrespective of intent to lose weight) of 5% or more between the second and
fifth visit (mean time between visits 3.0 ± 0.1 years). For subjects with missing data on
weight at the second visit (N = 11), weight at the first visit was used.
2) Inability to rise from a chair five consecutive times without using the arms.
3) Poor energy as identified by a negative answer to the question "do you feel full of
energy?" on the 30-item Geriatric Depression Scale (GDS) (179).
Sarcopenia
The FNIH criteria (49–53) were used to define sarcopenia in Chapter 2.1. Due to the lack of data on
Gait speed in the Merelbeke study, other operational definitions, such as those suggested by
ESPEN SIG and SCWD, could not be applied retrospectively without any modifications.
According to the FNIH criteria, weakness and low muscle mass in men are defined respectively as:
1) Maximum Grip strength < 26 kg or Grip strength to Body mass index (BMI) - ratio
< 1.00.
2) ALM < 19.75 kg or ALM to BMI - ratio (ALMBMI) < 0.789.
ALM was assessed using DXA, a bone density measurement technology that can also be used to
estimate total body composition. While computed tomography and magnetic resonance imaging are
gold standards to measure muscle mass, DXA is the preferred alternative method due to its
relatively higher accessibility, low cost, rapid scan time, and low ionizing radiation dose (< 5 µSv)
(46).
DXA-calculated ALM closely approximates limb skeletal muscle mass as it includes mainly skeletal
muscle and only a small amount of skin and connective tissue.

34
DXA cannot differentiate between water and bone-free lean tissue. It relies on the constant 0.73
ratio of total body water/fat-free mass for estimation of fat-free mass. Extracellular fluid
accumulation in older persons may cause fluctuation in fat-free mass hydration and overestimation
of lean body mass (180,181).
Functional status
SF-36 Physical Function Index
The SF-36 (182) is a health-related quality-of-life questionnaire, developed for persons aged 14 years
and more. It assesses eight health domains: vitality, physical function, bodily pain, general health
perceptions, role limitations due to physical health problems, role limitations due to emotional
problems, limitations in social activities because of physical or emotional problems, and mental
health. The Physical Function Index consists of ten items asking about mobility limitations at the
present time. Responses are self-reported on a three-point scale (yes, limited a lot / yes, limited a
little / no, not limited at all). All points are summed and transformed to total scores ranging
between 0 and 100 with higher values indicating better health status.
In older community-dwelling subjects, the Physical Function Index has shown to be feasible with
item completion rates exceeding 90% (183,184). Floor effects increase from 4% in subjects aged 70 –
74 years to 20% in subjects aged 85 years or more, while ceiling effects decrease from 4 to 0.5%,
respectively (183). Previous studies in older adults all report good to excellent internal consistency
(Cronbach’s alpha > 0.80) (183–188), and good inter-rater and intra-rater reliability (intra-class
correlation coefficient (ICC) > 0.75) (185,187,189).
In the Merelbeke study, the SF-36 questionnaire was administered at each visit. During all of these
visits, hardly 1% of participants scored the minimum value. Ceiling effects were highest at the
second visit in 1997 with 11% of men scoring the maximum value. Internal consistency was always
excellent with Cronbach’s alpha ranging between 0.90 and 0.92.
RDRS-2 ADL
The RDRS-2 (190) is a disability questionnaire, developed specifically for older patients. It consists of
two parts. The first part assesses assistance required in eight activities, mostly ADL (feeding,
transferring, mobility, bathing, dressing, toilet use, grooming, and practical tasks). The second part
assesses the level of disability in ten activities. Responses are reported by a proxy, who knows the
subject and has observed him in ADL. Ratings are on four-point scales and should be based on
actual status, not on ability. The total sum of points ranges between 8 and 32 for the first part, with
higher values indicating more assistance needed. The original study reports good inter-rater

METHODOLOGY
1.5
35
reliability of the eight items with ICCs between two raters ranging between 0.73 and 0.98 (190). Total
scores on the full RDRS-2 range from 18 to 72 points.
In the Merelbeke study, the RDRS-2 was administered to a proxy at each visit. Very high ceiling
effects could be detected for the first part of the RDRS-2, with 74 to 87% of subjects scoring the
best (lowest) possible value.
Katz index ADL
The Katz index of ADL (191) was developed for older and chronically ill persons as a measure of
biological and psychosocial function. It assesses six functions: bathing, dressing, toilet use,
transferring, continence, and feeding. Dependence in any of these functions is reported by an
observer, with evaluations being based on actual status and not on ability. According to its
developers, ADL adequacy is expressed as an over-all ADL grade, which reflects the hierarchy of
loss of functional skills. Grade A is the most independent and grade G is the most dependent
grade. However, in practice, responses are often on a four-point scale with total scores ranging
between 4 and 24 and higher values indicating greater dependency. To evaluate older persons’
eligibility for reimbursement of institutionalization, the six Katz ADL items are often
complemented with two criteria on orientation in time and place, which leads to five categories of
care dependency (O, A, B, C, and C dementia).
In older persons admitted to an internal medicine ward, a ceiling effect was present in 44% (grade
A), while a floor effect could be observed in 15% of in-patients (grade G) (192). Previous studies in
older adults report good to excellent internal consistency (Cronbach’s alpha > 0.80) (193–195), and
good inter-rater and intra-rater reliability (195).
In the CRIME study, ADL dependencies were reported at admission and at discharge. In Chapter
3.1, ADL total dependency corresponds to a Katz grade G. At admission, when ADL score reflects
patient’s functional status in the two weeks preceding hospitalization, 36% had no dependency in
any ADL, while 22% was totally dependent.
Timed physical performance
Gait speed
Gait speed is a performance-based test of mobility. Walking tests can vary according to pace (usual
or maximum speed), distance to walk (ranging from 4 to 500 m), starting protocol (static or
moving), walking aid (permitted or not), etc. The test is timed, but Gait speed results can also be
converted to meters per second.

36
Previous studies in older patients admitted to acute care report 19 to 36% of in-patients being
unable to perform Gait speed (196,197). The test has shown good intra-rater and inter-rater reliability
(> 0.90) in older persons living in the community (198), from primary care (ambulatory) clinic sites
(189), and admitted to acute care (197).
In the CRIME study, Gait speed was assessed at admission and at discharge. The patient was timed
while he walked four meters at his usual speed. At admission, the test could not be executed in
54% of patients.
Timed Up and Go
Timed Up and Go is a performance-based test, developed for frail community-dwelling older
persons, as a measure of basic functional mobility (199). The patient is observed and timed while he
stands up from a standard arm chair, walks to a line on the floor three meters away at a
comfortable and safe pace, turns, walks back, and sits down again (199). The patient can use his
customary walking aid (199). The test is timed with shorter time taken indicating better physical
mobility and balance ability.
The Timed Up and Go test is appropriate for older persons who are frailer or who use walking aids
(200), however the test seems less feasible in cognitive impaired older persons (non-participation up
to 36%) (200,201). The test does not suffer from ceiling or floor effects in healthy older adults (202).
Most studies in community-dwelling older persons report good inter-rater and intra-rater reliability
(ICC > 0.90) (199,200,203,204). In cognitively impaired older persons intra-rater reliability was only
moderate (ICC = 0.50) (201).
In the Merelbeke study, the Timed Up and Go test was assessed once annually from 1996 until
1999, and twice in 2000. During all of these visits, 1 to 2% of subjects did not perform the test, due
to various reasons. Intra-rater reliability was good (ICC = 0.88, CI95 = 0.81 – 0.92) in 204 subjects
who were assessed in 2000. For Chapter 2.3, subjects who inconsistently used walking aids over
the years, were excluded.
Chair rising
Chair rising is a performance-based test, developed for healthy persons aged 20 to 85 years, as a
measure of lower extremity muscle strength (205). Variations in the test exist, with the Five Times Sit
To Stand test the patient is instructed to stand up from a seated position and sit down again five
times as quickly as possible (205). Simultaneous use of the upper extremities is not permitted, in fact
subjects are asked to keep their upper limbs folded across the chest. The test is timed, with shorter

METHODOLOGY
1.5
37
time taken indicating greater lower limb strength. Variations on the Chair rising test include timing
a different number of repetitions or counting the number of repetitions completed in a given
period of time.
Previous large-scale studies in older community-dwelling adults report 6 to 18% of men being
unable to perform Chair rising (206,207). The test has shown moderate inter-rater and intra-rater
reliability in older persons (207).
In the Merelbeke study, Chair rising was assessed twice at each visit until 2000. During all of these
visits, 1 to 2% of subjects did not perform the test, due to various reasons. Each time, intra-rater
reliability was good (ICC 0.81 – 0.94).
Gait speed, Timed Up and Go, and Chair rising require lower limb strength and power, balance
and mobility (208,209). Performance on these tests is influenced by musculoskeletal, neurological,
sensory, cardiovascular and respiratory factors (210).
Balance
Standing balance
Standing balance is a performance based test to measure static balance. It requires lower limb
strength and good vestibular function (210), and is influenced by musculoskeletal, neurological, and
sensory factors. In general, subjects’ ability to maintain balance is assessed when their base of
support is reduced. Different protocols exist to assess and score Standing balance. According to the
‘Frailty and Injuries: Cooperative Studies of Intervention Techniques-3’ scale, which was developed
for community-dwelling people and nursing home residents, Standing balance is assessed by asking
the patient to stand in three positions of increasing difficulty first with the eyes open and then
closed for ten seconds (parallel stand = Romberg position, semi-tandem stand, and tandem stand =
Sharpened Romberg position). Each stand is scored on a four-point scale based on degree of
steadiness and amount of time the stand was held. The SPPB test uses the same positions to assess
Standing balance, but the patients do not need to close their eyes and the scoring system differs
(206).
The test positions have good feasibility, with only 8% of community-dwelling older men being
unable to perform any of the positions (206). However, there are substantial ceiling effects in
community samples (211).

38
In the Merelbeke study, Standing balance was assessed at each visit in a way similar to the ‘Frailty
and Injuries: Cooperative Studies of Intervention Techniques-3’ scale, except each stand was
scored on a binary scale based on whether subjects’ could hold the stand for ten seconds (yes / no).
Total score ranged from zero to six stands held. Across study waves, 0 to 4% of subjects did not
perform the Standing balance test. A ceiling effect could be detected with up to 33% of subjects
scoring 6/6.
Muscle strength
Handheld dynamometer
Grip strength measured with a handheld dynamometer is a valid and reliable measurement of
isometric muscle strength (198). Performance is influenced by both musculoskeletal and neurological
factors (210,212). Measurements diverse regarding device and test protocol used. Devices can be
categorized into hydraulic, pneumatic, mechanical, and strain hand dynamometers. Test protocols
may include body position, handle position, hand dominance, training of assessors, number of
assessments, interpretation of results, etc. (213). Grip strength has shown good feasibility in older
patients admitted to acute care (197). Both Jamar® and Smedley dynamometers are accurate
instruments (214) with excellent test-retest reliability (215).
In the Merelbeke study, Grip strength was measured at all visits. Between 1996 and 2000, a
Smedley-type hand dynamometer (Smith & Nephew Rolyan, Inc., Germantown, WI) was used
(Chapter 2.2 and Chapter 2.3). Additionally in 1999 and 2000 a Jamar® hand dynamometer (MSD
Europe bvba, Londerzeel Belgium) was also used. Results with the Jamar® hand dynamometer
were used in Chapter 2.1, because the FNIH criteria were developed using this type of device.
With both dynamometers, the same protocol was applied. Subjects were in a standing position with
the elbow in full extension, moving the shoulder from 180° to 0° flexion while squeezing as hard as
possible. Assessors were trained study nurses who gave encouragement during the assessment. Two
consecutive trials (with unstandardized interval) of the dominant hand were performed and
expressed to the nearest kilogram. Both methods had good intra-rater reliability (ICC = 0.90 – 0.94
for Smedley and 0.90 – 0.95 for Jamar®).
In the CRIME study (Chapter 3), Grip strength was measured using a North Coast Medical
hydraulic hand dynamometer. Patients were seated with the wrist in a neutral position and the
elbow flexed 90°. In case a subject was unable to sit, Grip strength was assessed lying at 30° in bed
with the elbows supported. The score was the best result of two consecutive measurements,
expressed to the nearest kilogram.

METHODOLOGY
1.5
39
1.5.2 ADVERSE HEALTH OUTCOMES
Mortality
In the Merelbeke study, data on all-cause mortality were obtained through yearly postal
questionnaires and, in case of no response, telephone contacts with proxies and treating general
practitioners. For Chapter 2.2, all deaths before December 31st 2011 were coded as events in the
survival analyses. For Chapter 2.1 and Chapter 2.3, mortality data were updated with responses
from postal questionnaires received before January 1st 2015 and telephone calls performed before
July 8th 2015. Subjects who were lost-to follow-up were coded as alive on the last date of contact.
In the CRIME study, data on in-hospital all-cause mortality were obtained through daily review of
patients’ clinical records during hospitalization. After discharge, participants’ status was assessed at
three, six, and twelve months through ambulatory visits and telephone contacts.
Length of hospital stay
LoS of older in-patients in the CRIME study was defined as the number of days from admission to
discharge or death.
Institutionalization
In the CRIME study, institutionalization comprised subjects who were living at home before
hospital admission and were transferred to a residence for older people or to a nursing home at
discharge.

40
1.5.3 STATISTICAL METHODOLOGY
A description of the applied statistical methods can be found in each subsection of Chapter 2 and
Chapter 3. The statistical methodology used to examine associations with all-cause mortality in
Chapter 2 is Cox (proportional hazards) regression, which is the basis of survival analyses in the
medical world (216). It might be seen as an extension of multiple logistic regression except the time
to when an event occurs (rate), rather than simply whether an event occurs (proportion) is taken
into account. In addition, Cox regression allows variable periods of follow-up for each individual
and censoring of some survival times (217). Survival times are said to be (right) censored if the event
of interest (which is death in our case) has not occurred before the time of last contact (218,219).
The final model of a proportional hazards analysis will yield an equation in which the natural
logarithm of the HR (the hazard function h(t) divided by the baseline hazard h0(t)) is expressed as a
linear combination of k coefficients (β) and predictor variables (x).
lnℎ(𝑡)
ℎ0(𝑡) = 𝛽1𝑥1 + ⋯ + 𝛽𝑘𝑥𝑘 (217,220,221)
Coefficients of a proportional hazards model can be interpreted in a similar manner to those of a
multiple logistic regression model. The HR (𝑒𝛽𝑖∆)) can be interpreted as “the instantaneous relative
risk of an event per unit time for an individual with risk-factor level 𝑥𝑖 + ∆ compared with an
individual with the risk-factor level 𝑥𝑖 , given that both individuals have survived to time t, and are
the same on all other covariates” (217).
An important assumption with proportional hazards regression involves the hazard to be
proportional, meaning the coefficient does not change over time (β(t) = c). When this assumption
is violated, the models can be extended with time-dependent coefficients (220,221), as was done in
Chapter 2.3.

2 CHAPTER 2: MORTALITY RISK ASSESSMENT
IN COMMUNITY-DWELLING OLDER MEN
THROUGH MEASUREMENTS OF PHYSICAL
FUNCTION
2.1 VALIDATION OF THE FNIH SARCOPENIA CRITERIA AND SOF
FRAILTY INDEX AS PREDICTORS OF LONG-TERM MORTALITY IN
AMBULATORY OLDER MEN 43
2.2 PHYSICAL FUNCTION MEASUREMENTS PREDICT MORTALITY IN
AMBULATORY OLDER MEN 61
2.3 THREE YEAR FUNCTIONAL CHANGES AND LONG-TERM
MORTALITY HAZARD IN COMMUNITY-DWELLING OLDER MEN 81


2.1 VALIDATION OF THE FNIH SARCOPENIA CRITERIA AND SOF FRAILTY INDEX
AS PREDICTORS OF LONG-TERM MORTALITY IN AMBULATORY OLDER MEN
De Buyser SL, Petrovic M, Taes YE, Toye KRC, Kaufman J-M, Lapauw B, Goemaere S
Age Ageing (2016) pii: afw071.

44
ABSTRACT
Objective
We aimed to evaluate the FNIH criteria for weakness and low muscle mass and the SOF frailty
index for prediction of long-term all-cause mortality.
Design
Community-based cohort study.
Setting
Semi-rural community of Merelbeke (Belgium).
Subjects
Ambulatory men aged 74 and more (N = 191).
Methods
Weakness was defined on previously established criteria as low Grip strength (< 26 kg) or low Grip
strength to BMI - ratio (< 1.00). Low muscle mass (DXA) was categorized as low ALM
(predefined < 19.75 kg) or low ALMBMI (predefined < 0.789). Frailty status was assessed using the
components of weight loss, inability to rise from a chair, and poor energy (SOF index). Survival
time was calculated as the number of months from assessment in 2000 until death or up to 15 years
of follow-up.
Results
Mean age of the participants was 78.4 ± 3.5 years. Combined weakness and low muscle mass was
present in 3 to 8% of men, depending on the criteria applied. Pre-frailty and frailty was present in
30 and 7% of men, respectively. After 15 years of follow-up, 165 men (86%) died. Both the
presence of combined weakness and low ALMBMI (age-adjusted HR = 2.50, CI95 = 1.30 – 4.79),
and the presence of SOF frailty (age-adjusted HR = 2.64, CI95 = 1.44 – 4.86) was associated with
mortality.
Conclusions
Our findings confirm the predictive value for mortality of the non-distribution based FNIH criteria
and SOF index in older community-dwelling Belgian men.
Keywords
Ambulatory older men; Mortality; FNIH sarcopenia; SOF frailty

SOF AND FNIH & MORTALITY
2.1
45
INTRODUCTION
Sarcopenia and frailty are geriatric syndromes that have received particular attention in the last
decade, especially because of their association with negative health-related outcomes (54). However,
no consensus exists so far on operational definitions for both syndromes. Definitions using criteria
that do not rely on distribution-based cutoff points seem appealing for clinical practice, since the
establishment of a reference population is not required.
Sarcopenia is characterized by the age-related loss of muscle mass and muscle function (43,46).
Several expert groups have proposed an operational definition for sarcopenia, using the medical
literature and founding their criterion for low muscle mass on its distribution in healthy young (44,46)
or well-functioning older (43) reference populations. Recently, the FNIH Biomarkers Consortium
developed new criteria for diagnosis of weakness and low muscle mass in older adults (49), using a
data-driven approach and founding their criteria on discriminative and predictive ability. They used
Classification and Regression Tree analyses in pooled cross-sectional data from several cohort
studies and included several candidate predictors of mobility impairment and weakness, amongst
which also body-size adjusted measurements of Grip strength and ALM, respectively. Cutoff
points for both Grip strength as well as Grip strength to BMI - ratio were retained from models to
predict slow Gait speed, because the effect of BMI adjustment was only noticeable in women (50).
For consistency, the same type of indicators was proposed in both men and women. Likewise,
cutoff points for both ALM and ALMBMI were retained to discriminate the presence or absence of
weakness (51). Although ALM was the best predictor of weakness overall, sensitivity analyses with
ALMBMI identified one clear cutoff point in women, whilst they found two when ALM was
unadjusted. Finally, the association of these criteria for weakness and low muscle mass with
increased likelihood for incident mobility impairment and mortality was investigated (52). The
combination of Grip strength and ALMBMI was the only one for which there was no heterogeneity
of association with incident mobility impairment across different study samples in women.
Nevertheless, mortality risk patterns were inconsistent and further validation of their cutoff points
for weakness and low muscle mass in other populations is needed (52).
Frailty is characterized by a physiologic decrease of reserve capacity and resistance to stressors (26).
Several operational definitions have been proposed; the most extensively studied one is the physical
frailty phenotype developed by Fried et al. (26) in the CHS, including weight loss, weakness,
exhaustion, slowness, and low activity. In 2008, the SOF Research Group developed a more

46
straightforward index to identify frailty which includes only three components (weight loss, inability
to rise from a chair five times without using the arms, and self-reported poor energy) and is more
practical to assess in the clinical setting (30). No difference between the parsimonious SOF index
and the more complicated CHS index was found in predictive accuracy for discriminating falls,
disability, and death in both the female SOF and male MrOS Sleep studies (30,31). Nevertheless,
inconsistent associations of the SOF index with mortality have been found depending on ethnicity
and setting of the population examined (130,131,140,142).
We aimed to evaluate the FNIH cutoff points for weakness and low muscle mass and the SOF
frailty index for prediction of all-cause mortality in a well-described sample of apparently healthy
community-dwelling older men in Belgium with long-term follow-up.

SOF AND FNIH & MORTALITY
2.1
47
METHODS
Study Population
Men aged 70 – 85 years were recruited from the population register of a community of ± 20 000
inhabitants (Merelbeke, Belgium). The recruitment has been described previously (222) and is briefly
summarized in Figure 11. This cohort study started in 1996 with follow-up visits annually until
2000, one visit in 2003, and thereafter annual follow-up by postal questionnaires and telephone
contacts. Sarcopenia and frailty could be identified retrospectively based on data acquired at the
fifth visit in 2000. All participants gave written informed consent. This study was conducted
according to the Declaration of Helsinki and approved by the ethics committee of Ghent
University Hospital.

48
Figure 11. Study Design.

SOF AND FNIH & MORTALITY
2.1
49
Measurements
Weight and height were measured in indoor clothing without shoes. BMI was calculated as weight
in kilograms divided by the square of height in metres. The SF-36 was completed to evaluate self-
reported health (range 0 – 100) (223). Subjects were asked about their educational degree, residence,
recreational physical activity, any falls in the previous year, medication use (range 0 – 8+), and
smoking status. The GDS (range 0 – 30) was used to evaluate depressive symptoms (179). The first
part of the RDRS-2 was used to rate the amount of assistance required in eight ADL (range 8 – 32)
(190). Physical performance was assessed using the Timed Up and Go test (199) (fastest time of two
consecutive measurements). Furthermore, participants had to complete five full stands from seated
position as quickly as possible (224). Grip strength of the dominant hand was measured twice
consecutively using Jamar® dynamometry (maximum value achieved). ALM was calculated as the
sum of lean mass from both arms and legs, acquired from total body scans using DXA (Hologic
QDR– 4500A, Hologic Inc., Bedford, MA, USA, software V8.26a).
FNIH sarcopenia criteria
Weakness and low muscle mass at the fifth visit were defined according to the FNIH criteria (49):
Weakness as identified by maximum Grip strength < 26 kg or Grip strength to BMI - ratio
< 1.00.
Low muscle mass as identified by ALM < 19.75 kg or ALMBMI < 0.789.
SOF frailty index
Frailty status at the fifth visit was defined according to the SOF index (30,31). Subjects are considered
to be frail if two or all of the following components are present, pre-frail if only one component is
present, and robust if none of the components is present:
Weight loss (irrespective of intent to lose weight) of 5% or more between the second and
fifth visit (mean time between visits 3.0 ± 0.05 years). For subjects with missing data on
weight at the second visit (N = 15), weight at the first visit was used.
Inability to rise from a chair five consecutive times without using the arms.
Poor energy as identified by a negative answer to the question "do you feel full of energy?"
on the 30-item GDS (179).

50
Mortality
Data on all-cause mortality were obtained through yearly postal questionnaires and by contacting
proxies and the treating general practitioners via telephone. Survival time was calculated as the
number of months from assessment in 2000 until death or up to 15 years of follow-up (until
January 1st 2015 if there was a response to the postal questionnaire (N = 16), until July 8th 2015 if
the proxy or treating general practitioner was contacted by telephone (N = 9), until last date of
contact if the subject was lost to follow-up in 2015 (N = 1)).
Statistical analysis
Descriptive data are presented as mean ± SD, median and interquartile range (IQR), or total
number and percentage. Differences between subjects were compared using Independent samples
T tests, Mann-Whitney U tests, or Chi-square tests, depending on the type and distribution of the
characteristic.
Age-adjusted Cox proportional hazards models were used to analyse the associations of sarcopenia
and frailty with all-cause mortality. The HRs with CI95 were estimated using as a reference men
who are not weak and have normal lean mass or robust men, respectively. No violations of the
proportional hazards assumption were detected. Moreover, multivariate analyses with forward
selection of BMI category*, low education, living alone, smoking status, number of medications,
and total score on the GDS were performed. *Analyses regarding the FNIH criteria were not
adjusted for BMI category. Age-adjusted logistic regression models were computed to calculate area
under the curve (AUC) and explained variability. All analyses were performed using SPSS software,
version 20.0 (SPSS Inc., Chicago, IL). Statistical significance was indicated by a P value < 0.05; all P
values were two-tailed.

SOF AND FNIH & MORTALITY
2.1
51
RESULTS
In total, 208 men attended the fifth visit (Figure 11); assessment of both sarcopenia and frailty was
complete for 191 of them. Table 3 shows their characteristics. Mean age was 78 (± 4) years.
Combined weakness and low muscle mass was present in 3 to 8% of men, depending on the
criteria applied (Figure 12). Pre-frailty and frailty was present in 30 and 7%, respectively (Figure
12). Weakness was more likely in men with frailty compared to robust (P < 0.001) or pre-frail men
(P = 0.001). Similarly, inability to rise from a chair was more likely in men with weakness compared
to men without weakness (P = 0.005).
After 15 years of follow-up, 165 men (86%) died (Figure 11 and Table 3). Median survival time
was 8.3 (IQR 4.3 – 12.4) years.
Of 191 men, 61% had normal Grip strength and normal ALMBMI (42% was robust, 17% was pre-
frail and 2% was frail) and 63% was robust (5% had weakness alone, 15% had low ALMBMI alone,
and 2% had both). The combination of frailty, weakness and low ALMBMI was present in 1.6% of
men.

Table 3. Characteristics of Men According To Their Sarcopenic and Frailty Status at Visit 5 (N = 191).
CHARACTERISTIC NOT WEAK AND
NORMAL ALMBMI
(N = 117)
NOT WEAK, BUT
LOW ALMBMI
(N = 47)
WEAK, BUT
NORMAL ALMBMI
(N = 15)
WEAK AND LOW
ALMBMI
(N = 12)
ROBUST
(N = 121)
PRE-FRAIL
(N = 57)
FRAIL
(N = 13)
Age (y), mean ± SD 78 ± 3 79 ± 4 * 79 ± 3 82 ± 5 * 78 ± 4 78 ± 3 81 ± 4 * ††
BMI (kg/m²) ** ††† ‡‡‡ ** ‡
< 25, N (%) 42 (36) 10 (21) 2 (13) 3 (25) 40 (33) 18 (32) 10 (77)
25 to < 30, N (%) 60 (51) 26 (55) 2 (13) 6 (50) 60 (50) 32 (56) 2 (15)
≥ 30, N (%) 15 (13) 11 (23) 0 (0) 3 (25) 21 (17) 7 (12) 1 (8)
Self-reported health [0 – 100],
median (IQR)
65 (55 – 80) 60 (45 – 70) * 65 (45 – 75) 50 (35 – 60) ** 65 (55 – 80) 55 (45 – 70) *** 35 (23 – 53) *** ††
Low education (elementary or less), N (%)
56 (48) 26 (55) 9 (60) 9 (75) 56 (46) 35 (61) 9 (75)
Living alone, N (%) 25 (21) 11 (23) 6 (40) 6 (50) * 24 (20) 20 (35) * 4 (31)
Recreational physical activity <
2h/week₸, N (%)
332 (29) 20 (44) 3 (25) 7 (64) * 36 (31) 22 (40) 4 (40)
Any fall in previous year, N (%) 14 (12) 6 (13) 4 (27) 5 (42) ** † 13 (11) 10 (18) 6 (46) ** †
N° of medications, median (IQR) 3 (1 – 5) 4 (1 – 5) 2 (0 – 3) † 4 (3 – 5) ‡‡ 2 (1 – 4) 4 (2 – 6) *** 5 (3 – 6) **
Current smoker, N (%) 14 (12) 6 (13) 1 (7) 2 (17) 12 (10) 11 (20) 0 (0)
GDS score [0 – 30], median (IQR) 4 (2 – 7) 6 (3 – 11) 5 (4 – 9) 7 (4 – 11) 4 (2 – 6) 7 (4 – 12) *** 15 (8 – 20) *** ††
RDRS-2 [8 – 32], median (IQR) 8 (8 – 8) 8 (8 – 8) 8 (8 – 11) 9 (8 – 14) ** † 8 (8 – 8) 8 (8 – 8) 9 (8 – 11.5) *** ††
Timed Up and Go (s), median (IQR)
9.6 (8.3 – 11.0) 10.2 (9.2 – 12.2) 10.4 (9.5 – 14.3) 12.3 (9.9 – 14.9) **
9.6 (8.2 – 10.7) 10.6 (9.4 – 12.8) **
15.8 (12.1 – 18.9) *** †††

53 53
2.1
Table 3. Characteristics of Men According To Their Sarcopenic and Frailty Status at Visit 5 (N = 191). [Continued]
CHARACTERISTIC
NOT WEAK AND
NORMAL ALMBMI
(N = 117)
NOT WEAK, BUT
LOW ALMBMI
(N = 47)
WEAK, BUT
NORMAL ALMBMI
(N = 15)
WEAK AND LOW
ALMBMI
(N = 12)
ROBUST
(N = 121)
PRE-FRAIL
(N = 57)
FRAIL
(N = 13)
Grip strength (kg), mean ± SD 37.4 ± 6.3 33.7 ± 4.8 *** 22.8 ± 2.6 *** †††
22.7 ± 3.3 *** †††
35.5 ± 7.3 33.7 ± 6.7 27.2 ± 8.3 *** ††
Grip strength / BMI (m²), mean ± SD
1.43 ± 0.24 1.22 ± 0.20 *** 1.03 ± 0.15 *** ††
0.82 ± 0.16 *** ††† ‡‡
1.34 ± 0.26 1.29 ± 0.30 1.13 ± 0.36
ALM (kg), mean ± SD 23.08 ± 2.77 20.77 ± 2.55 *** 20.42 ± 2.84 ** 19.79 ± 3.22 *** 22.33 ± 2.98 22.00 ± 3.04 20.37 ± 2.76 *
ALMBMI (m²), mean ± SD 0.88 ± 0.08 0.74 ± 0.03 *** 0.92 ± 0.09 ††† 0.70 ± 0.06 *** ‡‡‡
0.84 ± 0.09 0.83 ± 0.10 0.85 ± 0.14
Weak, N (%) 0 (0) 0 (0) 15 (100) *** ††† 12 (100) *** ††† 13 (11) 7 (12) 7 (54) *** ††
WeakBMI, N (%) 2 (2) 5 (11) * 4 (27) *** 11 (92) *** ††† ‡‡ 8 (7) 9 (16) 5 (39) ***
Low ALM, N (%) 12 (10) 16 (34) *** 9 (60) *** 5 (42) ** 24 (20) 13 (23) 5 (39)
Low ALMBMI, N (%) 0 (0) 47 (100) *** 0 (0) ††† 12 (100) *** ‡‡‡ 32 (26) 22 (39) 5 (39)
Weight loss, N (%) 12 (10) 5 (11) 3 (20) 3 (25) 0 (0) 14 (25) *** 9 (69) *** ††
Inability to rise from a chair, N (%) 3 (3) 4 (9) 3 (20) ** 2 (17) * 0 (0) 5 (9) ** 7 (54) *** †††
Poor energy, N (%) 26 (22) 13 (28) 4 (27) 6 (50) * 0 (0) 38 (67) *** 11 (85) ***
Deaths after 15y follow-up, N (%) 97 (83) 43 (92) 13 (87) 12 (100) 98 (81) 54 (95) * 13 (100)
Follow-up time (months), median (IQR)
120 (69 – 157) 87 (36 – 125) ** 97 (30 – 170) 48 (18 – 81) *** † 116 (63 – 165) 86 (41 – 137) * 66 (22 – 88) ** †
P values correspond to Independent samples T tests, Mann-Whitney U tests, and Chi-square tests, depending on the type and distribution of the characteristic.
* P < 0.05 ** P < 0.010 *** P < 0.001 comparison with men who are not weak and have normal ALMBMI / who are robust.
† P < 0.05 †† P < 0.010 ††† P < 0.001 comparison with men who are not weak, but have low ALMBMI / who are pre-frail.
‡ P < 0.05 ‡‡ P < 0.010 ‡‡‡ P < 0.001 comparison with men who are weak, but have normal ALMBMI.
₸ 11 men had missing data on recreational physical activity.
ALMBMI = Appendicular lean mass to Body mass index - ratio, SD = Standard deviation, BMI = Body mass index, IQR = Interquartile range, GDS = Geriatric
Depression Scale, RDRS-2 = Rapid Disability Rating Scale-2, ALM = Appendicular lean mass.

54
FNIH sarcopenia criteria
Low ALMBMI (age-adjusted HR = 1.47, CI95 = 1.05 – 2.07) was associated with all-cause mortality,
but low Grip strength (age-adjusted HR = 1.31, CI95 = 0.85 – 2.02), low Grip strength to BMI -
ratio (age-adjusted HR = 1.45, CI95 = 0.90 – 2.34), and low ALM (age-adjusted HR = 1.08, CI95 =
0.75 – 1.55) were not. Figure 12 shows age-adjusted Cox proportional hazards models each time
including one of the four different combinations of weakness and low lean mass criteria. The
presence of both weakness and low lean mass defined by ALMBMI was associated with a twofold
higher hazard of mortality (age-adjusted HR = 2.50, CI95 = 1.30 – 4.79). Multivariate forward
regression, retaining number of medications in the analysis (HR = 1.16, CI95 = 1.07 – 1.24), did not
alter significance of this finding (age and medication number-adjusted HR = 2.30, CI95 = 1.20 –
4.43).
After three years, the proportion of deceased men who had presented with weakness and low
ALMBMI was 42% (positive predictive value), while the proportion of survivors who were not weak
and had normal ALMBMI was 90% (negative predictive value). The age-adjusted AUC was 0.700
and explained variability was 12.1%. After nine years, positive predictive value increased to 83%,
but negative predictive value decreased to 54%. The age-adjusted AUC was 0.671 and explained
variability was 13.1%.
Analyses in men without weakness (N = 164) did not reveal a significant association of low
ALMBMI with mortality (P = 0.121). Compared to men without weakness, only men with combined
weakness and low muscle mass had an increased mortality hazard (P = 0.015).
SOF frailty index
Weight loss (age-adjusted HR = 1.99, CI95 = 1.27 – 3.11) and poor energy (age-adjusted HR =
1.78, CI95 = 1.26 – 2.51) were associated with all-cause mortality, but not inability to rise from a
chair (age-adjusted HR = 1.23, CI95 = 0.67 – 2.27). Both pre-frail and frail status was associated
with higher mortality rates, independently from age (Figure 12). Multivariate forward regression,
which retained number of medications in the analysis (HR = 1.11, CI95 = 1.03 – 1.21), did not alter
significance of the association between frailty and mortality (age and medication number-adjusted
HR = 1.95, CI95 = 1.01 – 3.77).
After three years, the proportion of deceased men who had presented with frailty was 39% while
the proportion of survivors who were robust was 87% (age-adjusted AUC was 0.675, explained

SOF AND FNIH & MORTALITY
55
2.1 variability 8.4%). After nine years, positive predictive value increased to 92%, but negative
predictive value decreased to 53% (age-adjusted AUC was 0.674, explained variability 15.6%).
Figure 12. Association of sarcopenia and frailty states with all-cause mortality after 15-year
follow-up of community-dwelling older Belgian men (N = 191). Age-adjusted hazard ratios
with 95% confidence interval from Cox regression models.
When the CI95 encompasses the value one, the association is not significant at the 95% significance level (P < 0.05).
Ref = reference, HR = Hazard ratio, CI95 = 95% confidence interval, ALMBMI = Appendicular lean mass to Body
mass index - ratio, BMI = Body mass index.

56
The age-adjusted survival curves show the association of the FNIH sarcopenia criteria and SOF
frailty index with mortality rates (Figure 13).
Figure 13. Survival Curves for Sarcopenia and Frailty States in Community-Dwelling Older
Belgian Men (N = 191), predicted from age-adjusted Cox regression models.
ALMBMI = Appendicular lean mass to Body mass index - ratio.

SOF AND FNIH & MORTALITY
57
2.1 Both indices were independently associated with mortality when they were entered into the same
Cox regression model (adjusted HR for combined weakness and low ALMBMI = 2.02, CI95 = 1.04 –
3.90, adjusted HR for pre-frail state = 1.65, CI95 = 1.17 – 2.33, adjusted HR for frail state = 2.41,
CI95 = 1.29 – 4.51).

58
DISCUSSION
We evaluated the FNIH cutoff points for weakness and low muscle mass and the SOF frailty index
for prediction of all-cause mortality in a sample of community-dwelling older Belgian men. The
presence of combined weakness and low ALMBMI, as well as the presence of SOF frailty, was
associated with twofold higher hazard of mortality, independently from age and medication
number. Low ALM (without adjustment for BMI) was not associated with mortality hazard, both
in age-adjusted and in age- and weakness-adjusted models.
Currently, very few studies have evaluated the FNIH criteria for prediction of all-cause mortality
(52,116,149). The FNIH Biomarkers Consortium (52) found no consistent association with mortality,
however weakness appeared to be the predominant predictor over lean mass. We however found
subjects with low ALMBMI having the highest mortality hazard regardless of their weakness status
(Grip strength or Grip strength to BMI - ratio). But, when ALM was not adjusted for BMI, lean
mass did not have any predictive value. Similarly, Woo et al. (116) found men with low Grip strength
and low ALMBMI to have higher odds for mortality after 10 years compared with men without
sarcopenia in a Chinese community-dwelling sample. Lastly, Hirani et al.(149) found low ALM and
low Grip strength to be associated with mortality in Australian community-dwelling men, but their
criteria were not adjusted for BMI. Their age-adjusted AUC for predicting 9-year mortality was
0.68, which corresponds with our 0.67.
In addition to being data-driven, the FNIH Biomarkers Consortium approach distinguishes itself
from other expert group strategies, by consistently discriminating the contributions of muscle mass
and function. This is in contrast with for example the IWGS approach (43), which combines its
parameters into a single classification of sarcopenia. Regarding these independent contributions of
muscle mass and function, our findings support the clinical paradigm in which first low Grip
strength is established, before the presence or absence of low lean mass is assessed. In this final
selection of older persons, low lean mass might be a possible cause of their weakness (49).
The SOF index has been evaluated in different settings and populations for prediction of all-cause
mortality. The index was associated with mortality in community-dwelling older Caucasians in the
US (30,31) and Italy (225). Our findings confirm this association in Caucasian community-dwellers.
Albeit our age-adjusted AUC for predicting 3-year mortality (0.68) was slightly lower than the 0.71
found in the MrOS Sleep study (31). The index has been inconsistent in hospitalized patients (140,142)

SOF AND FNIH & MORTALITY
59
2.1 and non-significant in community-dwelling older persons of Asian or African-American ethnicity
(130,131).
Our findings have some implications both for research and clinical practice. In research, reporting
the sarcopenic and/or frailty status of older study participants can help characterizing their overall
health, which might facilitate comparison across studies.
For clinical practice, this interpretation is more complex, because both the FNIH criteria and the
SOF index have demonstrated low positive predictive value (< 54%) and high negative predictive
value (> 80%) for short-term mortality (3 years), and contrariwise for long-term mortality (9 years).
This suggests that men without weakness and low muscle mass as well as robust men are likely to
be in good health and function within the next three years; while men with weakness and low
muscle mass and frail men are likely to be in poor health and function within the next nine years.
Moreover, the FNIH criteria and the SOF index may help identifying older people in need of an
intervention, both in research and clinical practice. Although the FNIH criteria and SOF index did
not identify the same men (there was only 1.6% overlap between weakness, low ALMBMI and
frailty), both might be used to target subjects for similar interventions such as exercise
interventions, optimizing protein intake, and correcting vitamin D insufficiency.
Several factors additionally promote the implementation of the FNIH criteria and SOF index in
clinical practice. All measurements can be performed quickly and easily, with minimal professional
training needed and with relatively low costs. The criteria do not rely on distribution-based cutoff
points and thus no knowledge of the underlying distribution in a given population is required.
However, several proposals for further research can be formulated. A first proposal is to examine
the generalizability of these criteria to other ethnicities and settings, because the clinical relevance
of both criteria might be limited to the population and setting in which they were developed. The
FNIH criteria were derived from nine studies performed mostly in the US and some in Europe.
Around 90% of all subjects were Caucasian. Similarly, the SOF index was developed using data
from Caucasian women in the US. Applicability of both criteria to other ethnic groups is hence
uncertain and might explain some of the divergent findings mentioned earlier. Moreover, both
criteria were developed in ambulatory older persons and previous studies pointed out the
inconsistent validity of the SOF index in hospital setting.

60
A second proposal relates to the range of existing operational definitions for both sarcopenia and
frailty. Studies comparing the predictive accuracy of the FNIH criteria and SOF index with other
instruments of sarcopenia and frailty, respectively, might help researchers and clinicians with the
challenge of deciding which consensus definition to use.
A third proposal might focus on the meaning of change / transitions in these syndromes. Both
sarcopenia and frailty are used as outcome measures for interventions (126,147), since they are driving
the disability cascade but are (unlike disability) still potentially reversible. Therefore, it is important
to understand the effect on mortality risk of transitions from and to non-sarcopenic and robust
states over time. Moreover, evidence is needed for a link between improvement in sarcopenia or
frailty state and clinical outcomes in order to justify the use of these syndromes as outcome
measurements in interventions (55). Our study has some limitations. First, our cohort study had a
baseline participation rate of 47%, which is in accordance with other population-based studies (226).
Unfortunately, no clinical data are available for the men who declined to participate and it is likely
that these non-participating men had higher mortality rates than our participants (227). Second,
analyses were restricted to all-cause mortality, because cause of death could not be validated based
on death certificates, but relied on communication with the treating general practitioner.
A major strength of this study is its long follow-up period of 15 years, which is the longest follow-
up for any mortality study implementing the FNIH criteria (previously max. 10 years (52,116)) or SOF
index (previously max. 9 years (30,130)). This long follow-up contributes to the exceptionally high
mortality rate of 86% in our study. Mortality rates in previous studies evaluating the FNIH or SOF
criteria in men range from 8 to 32% and from 7 to 27%, respectively. The small survival rate in our
study entails that few observations are censored in the analyses; this reduces the risk of bias in
estimates and standard errors.
Furthermore our study population seems to be a representative sample. This is indicated by the
correspondence of our prevalences with those reported in other population-based studies
implementing the FNIH criteria (prevalence varied between 1 and 8% (52,116,149)) or SOF index
(prevalence of pre-frailty and frailty ranged from 19 to 50% and from 4 to 17%, respectively
(30,31,129–131)).

SOF AND FNIH & MORTALITY
61
2.1 KEY POINTS
This community-based, cohort study in ambulatory older Belgian men applied the FNIH
criteria and the SOF index.
Combined weakness and low muscle mass was found in 3 to 8%. Pre-frailty and frailty was
present in 30 and 7%, respectively.
The FNIH criteria for weakness and low muscle mass and the SOF index for frailty
predicted 15-year all-cause mortality.
The non-distributional characteristics of these criteria facilitate their application in clinical
setting.
AUTHOR CONTRIBUTIONS
De Buyser SL created the concept, performed the statistical analyses and wrote the manuscript.
Petrovic M and Taes YE contributed to conception of the manuscript and revised the article.
Lapauw B provided statistical support and critical revisions of the manuscript. Toye KRC
contributed substantially to acquisition of data and revised the article. Kaufman J-M and Goemaere
S designed the study, supported data collection and provided critical revisions of the manuscript.
SUPPLEMENTARY DATA
Supplementary data mentioned in the text are available to subscribers in Age and Ageing online.
CONFLICTS OF INTEREST
None.
DECLARATION OF SOURCES OF FUNDING
This work was supported by ‘Fonds voor Wetenschappelijk Onderzoek – Vlaanderen (FWO;
Research Foundation – Flanders)’ [grant numbers G0662.07, G0867.11]. The financial sponsors
had no role in the design and execution of the study, analysis and interpretation of data, or writing
of the manuscript.
ACKNOWLEDGEMENTS
None.


2.2 PHYSICAL FUNCTION MEASUREMENTS PREDICT MORTALITY IN AMBULATORY
OLDER MEN
De Buyser SL, Petrovic M, Taes YE, Toye KRC, Kaufman J-M, Goemaere S
Eur J Clin Invest (2013) 43:379 – 386.

64
ABSTRACT
Background
To assess and compare the predictive value of physical function measurements for all-cause
mortality in older men, and to evaluate the Timed Up and Go test as a predictor in subjects with
underlying comorbidity.
Design
Observational study of a population-based sample of 352 ambulatory older men aged 71 to 86 at
study baseline. The RDRS-2, SF-36, Grip strength, Chair rising, Standing balance, and Timed Up
and Go test were determined at baseline. Associations with all-cause mortality were assessed using
Cox proportional hazards analyses. Age, BMI, smoking status, education, physical activity, and
cognitive status were included as confounders. Follow-up exceeded 15 years. Comorbidity status
was categorized into cardiovascular disease, chronic obstructive pulmonary disease (COPD), and
diabetes mellitus.
Results
All examined physical function measurements were associated with all-cause mortality. The Timed
Up and Go test was the best predictor (adjusted HR per SD increase = 1.58, CI95 = 1.40 – 1.79, P
< 0.001) for global mortality and continued to be predictive in subjects with cardiovascular disease
(adjusted HR per SD increase = 1.80, CI95 = 1.40 – 2.33, P < 0.001).
Conclusions
The assessment of physical function is important in the evaluation of older persons. We encourage
the use of the Timed Up and Go test as a reliable, quick and feasible screening tool in clinical
settings.

PHYSICAL FUNCTION & MORTALITY
2.2
65
INTRODUCTION
In the care of older patients, it is important to assess physical function (228,229). Physical function
measurements may identify problems not observable in a routine physical examination (230), and
moreover physical function measurements are able to predict health-related outcomes, such as
hospitalization and mortality (120,189). Generally, physical function is assessed through functional
status measurements (228). Well-introduced instruments are the ADL scale (191) and the instrumental
ADL (IADL) scale (231). Other instruments include the RDRS-2 (190) and the Physical Function
Index of the SF-36 (184,223). Besides, there has been a growing interest in objective measurements of
physical function, such as muscle strength measurements and physical performance measurements.
Compared to questionnaires, these objective measurements have clear face validity for the task
being performed, better reproducibility and greater sensitivity to change in function (228).
Furthermore, they are considered to be better predictors of health risks (189). Commonly used in
clinical and research settings are Grip strength, Standing balance, and the Chair rising test, the latter
two as part of the SPPB test (206). Few have compared the relative strength of physical function
measurements in predicting global mortality. Yet, knowing which physical function measurement
has the strongest predictive value for health-related risks, such as mortality risk, would support its
use in clinical practice.
The Timed Up and Go test includes both standing and walking, two physical ADL, therefore its
concept (199) seems very appealing to implement. The Timed Up and Go test is quick and easy to
conduct; it requires little equipment and no special training. Previous publications regarding the
association of Timed Up and Go with mortality are limited. Moreover these studies all had short (≤
5 years) or intermediate (9 years) follow-up. Research concerning the predictive value of Timed Up
and Go for all-cause mortality during a prolonged follow-up (> 15 years), has not been done. Also
it is not known whether underlying comorbidity, such as cardiovascular disease, COPD or diabetes
mellitus type 2, affects Timed Up and Go’s predictive ability.
Taking into consideration the above mentioned aspects, we aimed to evaluate the association of six
physical function measurements with all-cause mortality. The primary goal was to compare the
predictive value for global mortality of RDRS-2 ADL, SF-36 Physical Function Index, Grip
strength, Standing balance, Chair rising, and Timed Up and Go. A secondary goal was to assess the
potential role of chronic diseases in the association of Timed Up and Go with mortality.

66
METHODS
Study Population
This longitudinal study was initiated in 1996 to investigate the process of aging, mainly focusing on
hormonal changes and bone metabolism. The participants were men, recruited from the population
register of a semi-rural community of 20 000 inhabitants (Merelbeke) near Ghent University
Hospital (Belgium). Age between 70 and 85 years and willingness to participate were the only
selection criteria at recruitment. From the 748 men in the age group investigated, 407 (54%) gave
written informed consent, as approved by the ethics committee of the Ghent University Hospital;
352 men (47%) took part in all key examinations. This participation rate is in accordance with other
population-based studies (226). Reasons for non-participation comprised of lack of interest in 255
subjects (34%), 36 felt unable to participate because of interfering diseases (5%), 20 died before
start of the study (3%), 12 considered themselves too old to participate (2%), 8 moved to another
area (1%), and there were various other reasons in 64 subjects (9%). For the present study there
were no exclusion criteria. We report on data obtained by interviews and physical examinations at
the start of the study. Reporting of the study conforms to the STROBE statement (232,233). Follow-
up is still on-going with the latest update finalized in December, 2011. Of the 352 subjects included
at baseline, 77 men were still alive and 2 men were lost to follow-up in 2011. Baseline data on
unrelated issues have previously been reported (153,155).
Functional status measurements
The first part of the RDRS-2 was used to rate the amount of assistance required in 8 activities (190)
on four-point response scales. The summary score ranges between 8 and 32 and was used for all
primary analyses. The full RDRS-2 (range 18 – 72) also contains a second part to assess the level of
disability in ten activities. The SF-36 was likewise completed (223) and includes a Physical Function
Index, composed of ten items covering a range of difficulties (184).
Muscle Strength Measurements
Grip strength
Measurement of Grip strength was performed using a Smedley-type hand dynamometer (Smith &
Nephew Rolyan, Inc., Germantown, WI) (214,234). Subjects held the dynamometer in the dominant
hand with the arm hanging by the side. The score was the best result of two consecutive
measurements, expressed to the nearest kilogram. Test-retest reliability for all participants was
excellent (ICC = 0.92).

PHYSICAL FUNCTION & MORTALITY
2.2
67
Physical Performance Measurements
Standing balance
Standing balance was adapted from the method applied in the SPPB test (206). Subjects were asked
to stand in three positions for up to ten seconds each: parallel stand with the feet together side-by-
side, semi-tandem stand with the heel of one foot touching the big toe of the other foot, and
tandem stand with the heel of one foot aligned to the toes of the other foot. Each position was
scored from 0 to 2, based on degree of steadiness and amount of time the stand was held.
Chair rising
Subjects were instructed to complete five full stands from seated position as quickly as possible
(205,224). The seat height for the chair was 45 cm. The minimum time to the nearest tenth of a
second of two assessments was used as final score. Test-retest reliability for all participants was
excellent (ICC = 0.92). Eight subjects were unable to perform the Chair rising test, mainly due to
osteoarthritis symptoms or because they considered the test too difficult.
Timed Up and Go
The Timed Up and Go test was performed according to the method described by Podsiadlo &
Richardson (199). Subjects were instructed to stand up from an armchair (seat height of 45 cm), walk
at a comfortable and secure pace to a line on the floor three meters away, turn, return to the chair
and sit down again. Test-retest reliability was tested in a subset of patients. ICC was 0.90,
suggesting very good reliability. Four participants did not perform the Timed Up and Go test due
to foot pain or other non-specified reasons.
Total Mortality
Data on all-cause mortality were obtained by contacting proxies and the treating general
practitioners by telephone. The most recent update was completed on December 31st, 2011.
Covariates
All participants completed questionnaires to gain information on chronic diseases, medication use,
educational degree, and current life style, including smoking habits and physical activity. Subjects’
weight and height were measured in light indoor clothing without shoes. BMI was calculated as
weight in kilograms divided by the square of height in meters. Underlying comorbidity was
abstracted from the self-reported diseases and use of medication. For evaluation of cognitive status,
subjects had to remember five pictures of objects and were questioned three times after delay and
without receiving cues (range 0 – 15) (235). Higher scores indicate better cognitive status.

68
Statistical analysis
Descriptive data are presented as mean ± SD, median (first to third quartile) or percentage.
Univariate associations between physical function measurements were studied by calculating
Spearman’s correlation coefficients. Test-retest reliability of Grip strength, Chair rising and Timed
Up and Go was examined using ICCs.
Associations between physical function measurements and all-cause mortality were assessed by Cox
proportional hazards models. The proportional hazards assumption was first verified by including
time-dependent covariates into the Cox model. For subjects who were lost to follow-up in 2011,
survival time until the last date of contact was entered. Cox regression analyses were also
performed using the z-scores of the physical function measurements, to calculate the risk for
mortality associated with 1 SD increase in physical function. Three sequential Cox models were
built: in which there were no adjustments made, in which age was adjusted for, and in which age,
BMI, smoking status, education, physical activity, and cognitive status were covariates, respectively.
To further assess the association, survival curves adjusted for age were plotted according to tertiles
of physical function. Three unequal groups had to be made for survival curves of RDRS-2 ADL
(score = 8 for 270 men; 9 – 10 in 47 men; > 10 in 32 men).
Independent samples T test or one-way analysis of covariance (ANCOVA) was performed where
appropriate, to compare physical function and survival time between healthy subjects and subjects
with comorbidity. Bar charts were used to present median survival time of subjects dichotomized
by performance on Timed Up and Go; associated significances were calculated with the Mann-
Whitney U test.
All analyses were performed using SPSS software, version 20.0 (SPSS Inc., Chicago, IL). Statistical
significance was indicated by a P value < 0.05; all P values were two-tailed.

PHYSICAL FUNCTION & MORTALITY
2.2
69
RESULTS
Average follow-up duration was 184 ± 2 months. Seventy-eight percent (273) of the 352 men died
during follow-up, with a median survival time of 110 months. Characteristics of the study
population at baseline are described in Table 4. At inclusion, the age of the subjects ranged
between 71 and 86 years. Fourteen men out of 352 (4%) were underweight (BMI < 20 kg/m²); 61
(17%) reported the use of at least five medications; 72 (21%) were currently smoking, which is in
accordance with the proportion of smoking, older men in Belgium at that time (236). Mean number
of pack years was 34 ± 31. Three hundred twenty two men (92%) finished primary school, 154
(44%) also completed lower secondary education and 71 men (20%) completed upper secondary
education. With scores on the full RDRS-2 that can range from 18 to 72, a mean score of 22
indicated that there was little disability in the study population. Merely 71 men (20%) reported to
only occasionally perform some type of physical exercise, while 165 (47%) reported to exercise at
least 1 h/week. All physical function measurements correlated significantly with each other (P <
0.001). The Timed Up and Go time score had the best correlation with the Chair rising time score
(Spearman’s correlation coefficient r = 0.60) and was inversely associated with Grip strength (r =
-0.29) and Standing balance (r = -0.31). Correlation of Timed Up and Go with RDRS-2 ADL (r =
0.42) and SF-36 Physical Function Index (r = -0.50) was also low.
The predictive value of the physical function measurements for all-cause mortality was examined
by Cox regression analyses. Since all time-dependent covariates were statistically non-significant in
the Cox model, the proportional hazards assumption was met. Preceding univariate Cox regression
analyses examined the effect of age, BMI, smoking status, education, physical activity, and cognitive
status. Age was significantly associated with mortality (HR = 1.12, 95% confidence interval (CI95) =
1.09 – 1.15, P < 0.001). The same was true for education, physical activity, and cognitive status (HR
= 0.96, CI95 = 0.93 – 1.00, P = 0.043; HR = 0.86, CI95 = 0.77 – 0.96, P = 0.008; HR = 0.84, CI95 =
0.78 – 0.89, P < 0.001; respectively). BMI and smoking status were not significantly associated (HR
= 0.97, CI95 = 0.93 – 1.00, P = 0.054 and HR = 0.98, CI95 = 0.73 – 1.31, P = 0.878, respectively).
Subsequently, models were built unadjusted, adjusted for age and additionally adjusted for BMI,
smoking status, education, physical activity, and cognitive status.

70
Table 4. Characteristics of the study population at baseline.
VARIABLE VALUE
Age (y), mean ± SD 76 ± 4
Weight (kg), mean ± SD 74.1 ± 11.9
Body mass index (kg/m²), mean ± SD 26.3 ± 3.7
Smoking status, N (%)
Never 12 (3)
Former 268 (76)
Current 72 (21)
Cognitive status, mean ± SD 13.3 ± 1.7
RDRS-2 ADL, mean ± SD 8.7 ± 1.9
SF-36 Physical Function Index, mean ± SD 73 ± 24
Grip strength (kg), mean ± SD 24.3 ± 7.9
Standing balance, mean ± SD 5.0 ± 1.0
Chair rising (s), mean ± SD 13.8 ± 4.7
Timed Up and Go (s), mean ± SD 12.2 ± 4.7
Number of medications, median (IQR) 2 (1 – 4)
Self-reported chronic diseases, N (%)
Cardiovascular disease 111 (32)
Chronic obstructive pulmonary disease 28 (8)
Diabetes mellitus 25 (7)
RDRS-2 = Rapid Disability Rating Scale-2, ADL = Activities of daily living, SF-36 = Short Form-36, IQR =
Interquartile range.

PHYSICAL FUNCTION & MORTALITY
2.2
71
As summary score on the eight ADL questions of the RDRS-2 indicated higher assistance levels,
mortality risk increased (age-adjusted HR = 1.18, CI95 = 1.12 – 1.24, P < 0.001). Correspondingly,
when less limitations were reported on the SF-36 Physical Function Index, mortality risk decreased
(age-adjusted HR = 0.99, CI95 = 0.98 – 0.99, P < 0.001). Mortality risk also decreased as absolute
levels of Grip strength and Standing balance increased (age-adjusted HR per 1 kg = 0.97, CI95 =
0.96 – 0.99, P = 0.001; HR = 0.87, CI95 = 0.78 – 0.98, P = 0.020, respectively). As more time was
needed to complete the Chair rising and Timed Up and Go test, mortality risk increased (age-
adjusted HR per 1 second increase for Chair rising = 1.08, CI95 = 1.06 – 1.11, P < 0.001; HR for
Timed Up and Go = 1.10, CI95 = 1.07 – 1.12, P < 0.001). Mortality risk doubled for every eight
seconds increase in time needed to perform the Timed Up and Go test (age-adjusted HR per eight
seconds increase for Timed Up and Go = 2.08, CI95 = 1.70 – 2.54, P < 0.001). Table 5 shows the
HRs associated with 1 SD increase in physical function. This allows direct comparison of the
predictive ability between physical function measurements. In each model, Timed Up and Go
performance exhibited the strongest HR. Every time, the results were attenuated when adjusting
for covariates, as can be seen in Table 5. The age-adjusted survival curves in Figure 14 likewise
show that the worst physical functioning participants had lower survival probability. The higher
mortality rates existed not only after 15 years but during the full follow-up period. The HR
comparing the lowest with the highest tertile for performance on Timed Up and Go was 2.09 (CI95
= 1.53 – 2.85, P < 0.001) with adjustment for age.
As can be seen in Table 6, subjects with cardiovascular disease or COPD performed poorer on the
physical function measurements in comparison with healthy subjects. ANCOVA further revealed
shorter survival time for subjects with cardiovascular disease (P = 0.001), COPD (P = 0.006), and
diabetes (P = 0.006). This can also be observed in Figure 15. In subjects with COPD or diabetes,
performance on Timed Up and Go had little influence on survival time (P = 0.281 and P = 0.309,
respectively). In patients with cardiovascular disease however, Timed Up and Go remained to have
a significant association with mortality (HR in the model adjusted for age, BMI, and smoking status
per SD = 1.80, CI95 = 1.40 – 2.33, P < 0.001).

Table 5. Hazard ratios for total mortality of physical performance measurements (per standard deviation increase).
MODEL 1A MODEL 2B MODEL 3C
CHARACTERISTIC HR (CI95) P CHI² HR (CI95) P CHI² HR (CI95) P CHI²
RDRS-2 ADL 1.44 (1.30 – 1.58) < 0.001 62 1.37 (1.24 – 1.52) < 0.001 105 1.19 (1.03 – 1.37) 0.016 77
SF-36 Physical Function Index 0.66 (0.59 –0.74) < 0.001 56 0.71 (0.63 –0.79) < 0.001 97 0.83 (0.71 –0.97) 0.020 73
Grip strength 0.72 (0.63 –0.81) < 0.001 27 0.80 (0.70 –0.91) 0.001 70 0.85 (0.74 –0.99) 0.031 74
Standing balance 0.77 (0.70 –0.86) < 0.001 23 0.87 (0.78 –0.98) 0.020 67 0.90 (0.78 – 1.05) 0.186 71
Chair rising 1.59 (1.41 – 1.80) < 0.001 54 1.46 (1.28 – 1.65) < 0.001 99 1.30 (1.10 – 1.52) 0.002 79
Timed Up and Go 1.70 (1.53 – 1.90) < 0.001 94 1.54 (1.37 – 1.74) < 0.001 123 1.40 (1.19 – 1.66) < 0.001 98
a Unadjusted.
b Adjusted for age.
c Additionally adjusted for body mass index, smoking status, education, physical activity and cognitive status.
HR = Hazard ratio, CI95= 95% confidence interval, RDRS-2 = Rapid Disability Rating Scale-2, ADL = Activities of daily living, SF-36 = Short Form-36.

PHYSICAL FUNCTION & MORTALITY
73
2.2
Figure 14. Adjusteda survival curves according to tertilesb of physical function.
P values indicate significant differences in survival probability between best and worst functioning subjects. Survival
curves diverge further with follow-up.
a Adjusted for age.
b For the Rapid Disability Rating Scale-2 questions on activities of daily living, three unequal groups had to be made.
ADL = Activities of daily living.

74
74
Figure 15. Median survival time for subjects, dichotomized by performance on the Timed
Up and Go test.
Error bars represent the 95% confidence interval. In subjects with cardiovascular disease, performance on the Timed
Up and Go test has an important influence on survival; this influence is not observed in subjects with chronic
obstructive pulmonary disease or diabetes mellitus type 2.
COPD = Chronic obstructive pulmonary disease.

75
2.2
Table 6. Physical performance of healthy subjects and subjects with comorbidities.
HEALTHY SUBJECTS
(N = 200)
SUBJECTS WITH CV DISEASE
(N = 111)
SUBJECTS WITH COPD
(N = 28)
SUBJECTS WITH DIABETES
(N = 25)
CHARACTERISTIC MEAN ± SD MEAN ± SD P MEAN ± SD P MEAN ± SD P
RDRS-2 ADL 8.5 ± 1.7 8.9 ± 2.1 0.082a 9.3 ± 2.8 0.152a 9.8 ± 3.4 0.067a
SF-36 Physical Function Index 78.8 ± 20.7 65.1 ± 26.1 < 0.001a 54.8 ± 29.9 < 0.001a 55.4 ± 29.3 0.001a
Grip strength (kg) 25.4 ± 7.8 22.7 ± 7.2 0.033b 22.1 ± 9.6 0.041b 22.7 ± 8.6 0.464b
Standing balance 5.1 ± 0.9 4.8 ± 1.2 0.008a 4.6 ± 1.0 0.003b 4.2 ± 1.3 0.003a
Chair rising (seconds) 13.1 ± 3.8 15.2 ± 5.8 0.002a 15.7 ± 4.9 0.002b 14.3 ± 4.8 0.186a
Timed Up and Go (seconds) 11.2 ± 2.9 14.0 ± 6.7 < 0.001a 13.6 ± 5.3 0.032a 14.8 ± 8.0 0.038a
a Independent samples T test testing the null hypothesis that there is no difference in mean physical performance between healthy subjects and subjects with
comorbidity.
b ANCOVA testing the null hypothesis that there is no difference in mean physical performance between healthy subjects and subjects with comorbidity, taking the
variability of age into account.
CV = Cardiovascular, COPD = Chronic obstructive pulmonary disease, SD = Standard deviation; RDRS-2 = Rapid Disability Rating Scale-2, ADL = Activities of
daily living, SF-36 = Short Form-36.

76
DISCUSSION
In this study we assessed the predictive value of RDRS-2 ADL, SF-36 Physical Function Index,
Grip strength, Standing balance, Chair rising, and Timed Up and Go, for all-cause mortality in
older men. All physical function measurements showed an association with global mortality during
the full follow-up period. Interestingly, the proportional hazards models including Timed Up and
Go had the best fit and Timed Up and Go exhibited the strongest HR of all physical function
measurements. These findings suggest that Timed Up and Go is the best predictor of global
mortality. Timed Up and Go remained to be a significant predictor after presence of cardiovascular
disease was taken into account.
Our results confirm the previously reported association between physical function measurements
and mortality among older persons. A former study likewise described an association between the
SF-20 Physical Function Index and mortality (237). When comparing subjects with a SF-20 Physical
Function Index score ≥ 81 with those with a score ≤ 39, an age-adjusted HR of 0.4 (CI95 = 0.4 –
0.5) was found. Cesari et al. (238) analysed the association of ADL and IADL score with mortality,
the unadjusted HRs per SD increase were 0.54 (CI95 = 0.45 – 0.65) and 0.48 (CI95 = 0.38 – 0.61),
respectively (238). Their results indicate a stronger association of functional status measurements
with mortality than our findings. Most studies regarding Grip strength found an independent
association with mortality risk (239–242). In the study of Cesari et al. (238), 1 SD decrease in Grip
strength was associated with a higher risk for mortality (unadjusted HR = 0.55, CI95 = 0.43 – 0.71),
than in our study (unadjusted HR per SD = 0.72, CI95 = 0.63 – 0.81). Perhaps this could be
explained by the difference in follow-up duration since there is evidence for a weaker association
between Grip strength and mortality in studies with longer follow-up (120). Moreover, the shorter
follow-up in the study of Cesari et al. (238) might explain their stronger HR corresponding with 1 SD
increase in Standing balance-score (unadjusted HR = 0.55, CI95 = 0.44 – 0.68) (238), compared to
ours (HR = 0.77, CI95 = 0.70 – 0.86). In the comparative study between the SPPB tasks and Grip
strength of Cesari et al., Chair rising had the strongest association with mortality (238). Similarly,
Chair rising was a better predictor than Grip strength and Standing balance in our study as well.
Conversely, one study found Chair rising and Standing balance to be equally prognostic (118).
Although the Timed Up and Go test has been examined mostly for evaluating balance, as a
predictor of falls (203,243), there is some evidence for an association with mortality. Tice et al. found a
strong association in postmenopausal women (237) and Hoshide et al. reported a correlation between

PHYSICAL FUNCTION & MORTALITY
2.2
77
Timed Up and Go and cardiovascular mortality in the very old subjects at least 80 years of age (244).
Lastly, according to Davis et al., Timed Up and Go was independently of sex and age associated
with an increased risk of death (245). Our results can confirm the association of Timed Up and Go
with global mortality in older men after 15-year follow-up.
The Timed Up and Go test and Chair rising test, both being objective, timed physical performance
measurements, confirm to be more predictive for mortality than the RDRS-2 ADL and SF-36
Physical Function Index, both subjective reports of functional status. Other studies have stated that
performance measurements were more able to predict outcomes, such as mortality than self-
reports of functional status (189), we only found this to be true for timed physical performance
measurements. Among all six physical function measurements, Timed Up and Go appeared to have
strongest predictive value for all-cause mortality. However, in case a subject is unable to stand or
walk, alternative physical function measurements can be used and are valid; functional status
measurements and Grip strength can be used to provide a good estimate of survival.
In our study, most of the subjects with comorbidity had significantly poorer physical function than
healthy subjects. This is in concordance with the known association of chronic diseases such as
stroke, coronary heart disease, COPD, and diabetes, with steep strength decrease (246). The Timed
Up and Go test continued to be a significant predictor of mortality in subjects with cardiovascular
disease. The lack of predictive value of Timed Up and Go in subjects with COPD or diabetes in
our study is most probably due to the small sample size. Previous studies did show functional
capacity is a strong predictor of all-cause mortality in patients with cardiovascular disease (247),
COPD (248), and type 2 diabetes mellitus (249).
Some limitations of our study should be noted. Our study population is composed solely of men,
of which only 47% took part in all key examinations. Although this participation rate seems in line
with other population-based studies (226), non-participants revealed to have higher mortality than
participants in the population-based HUNT study (227). Therefore, the 47% participation rate may
result in selection bias. As mentioned above, the limited size of groups with comorbidity may have
also influenced some or our results. An important physical performance measurement that was not
addressed in our study is Gait speed. This timed measurement has frequently been associated with
mortality in older patients. According to a pooled analyses by Studenski et al. the age-adjusted
mortality risk per 0.1 m/s higher Gait speed ranges from 0.83 to 0.94 (250). When comparing Gait
speed and Timed Up and Go, no differences were found in their predictive ability for decline in
global health, new ADL difficulty, and falls (243). In the comparative study of Cesari et al. (238), four-

78
meter Gait speed, categorized into four groups by increasing speed, had an unadjusted HR for
mortality of 0.49 (CI95 = 0.38 – 0.63) per SD increase. Adjusted, its predictive ability (HR – CI95)
was of the same magnitude as that of Grip strength and the SPPB Balance test.
Strength of this study is the long follow-up. With an average of 184 months, our study has much
longer follow-up than other related studies. This could have an important influence on our
findings. As already mentioned, a weaker association between muscle strength and mortality has
been found in studies with longer follow-up (120). As a result of this long follow-up period, there is
also little censoring, which reduces bias.
Although our study population consisted of independently functioning ambulatory older men, we
believe that the Timed Up and Go test can be useful in signalling of functional decline. Moreover,
after a low performance on the Timed Up and Go test, comprehensive geriatric assessment should
take place in order to detect specific underlying problems. To perform the Timed Up and Go test,
only an arm chair, a measuring tape in order to indicate the three-meter distance and a watch with a
second-hand are required. Since the instructions are straight-forward, professional expertise or
training is not required (199). The time score is objective and easy to record (199). In addition, the
Timed Up and Go test has shown good reliability between observers and over time (199,203).
Potential use of the Timed Up and Go test in clinical practice could be enhanced with the
implementation of a clear cutoff point. Further research regarding physical function measurements
in general should also focus on prediction of mortality following invasive procedures (e.g.
chemotherapy), as this would enable targeted interventions.
In this study we have presented the evaluation of six physical function measurements with regard
to their predictive value for all-cause mortality. Our findings indicate that the Timed Up and Go
test, a timed measurement of observed performance, is the best predictor of global mortality. We
consequently encourage the use of Timed Up and Go as a reliable, quick and feasible screening tool
in clinical settings.

PHYSICAL FUNCTION & MORTALITY
2.2
79
ACKNOWLEDGEMENTS
Conflict of interest
The authors declare no conflicts of interest.
Author contributions
De Buyser SL analysed and interpreted the data, and wrote the manuscript. Petrovic M and Taes
YE contributed to conception of the manuscript, provided statistical support, and provided critical
revisions of the manuscript. Toye KRC contributed substantially to acquisition of data and
reviewed the manuscript. Kaufman J-M and Goemaere S designed the study, supported data
collection, and provided critical revisions of the manuscript.
Sponsor’s role
This work was supported by grants G0662.07 and G0867.11 from 'Fonds voor Wetenschappelijk
Onderzoek – Vlaanderen (FWO; Research Foundation – Flanders)' and by an unrestricted grant of
Novartis Belgium. YT is a Postdoctoral Fellow with the FWO.


2.3 THREE YEAR FUNCTIONAL CHANGES AND LONG-TERM MORTALITY HAZARD IN
COMMUNITY-DWELLING OLDER MEN
De Buyser SL, Petrovic M, Taes YE, Toye KRC, Kaufman J-M, Goemaere S, Lapauw B
Accepted in Eur J Intern Med.

82
ABSTRACT
Background
Low levels of physical function have been associated with higher mortality hazard in older persons.
However, few studies have investigated the association between functional changes and subsequent
mortality. This study aimed to examine whether 3-year functional changes independently predict
subsequent all-cause mortality.
Methods
This population-based cohort study included 171 community-dwelling men aged ≥ 71 years at
wave 2 (baseline of the present analysis), living in the semi-rural community of Merelbeke
(Belgium). Physical function assessments included the SF-36 Physical Function Index, Grip
strength, Chair rising, and Timed Up and Go. Changes over 3-year time were calculated using data
obtained at four annual visits.
Results
After 15 years of follow-up, 149 men (87%) died. Median survival time was 8.2 (4.2 – 12.4) years.
Physical function assessed at a single time point (at wave 2 or wave 5) was significantly associated
with subsequent mortality hazard, independently from future or preceding 3-year changes. Greater
functional declines during the 3-year follow-up were associated with higher mortality hazards.
These associations were 1) more pronounced within the first seven years, 2) independent from
baseline age, polypharmacy, depression, disability, and physical function, 3) no longer significant
when closure physical function was taken into account.
Conclusion
Physical function assessed at a single time point is a robust predictor of all-cause long-term
mortality in community-dwelling older men. Yet, repeated assessments of physical function can
provide prognostic information beyond that available from single initial assessment. However, with
repeated assessments, most prognostic information can be found in the final assessment of physical
function.

CHANGES IN PHYSICAL FUNCTION & MORTALITY
2.3
83
INTRODUCTION
Low levels of physical function have been associated with higher mortality hazard in older persons
(222,251,252). These low levels of physical function include impairments (which may be detected
through measurements of muscle strength), functional limitations (which can be assessed with
physical performance measurements), as well as disabilities (which include reported measurements
of ADL and physical domains of health-related quality of life).
The majority of previous research used measurements of physical function at a single point in time
to predict mortality. Nevertheless, physical function is dynamic and changes with time (62,63). On
average physical function declines with age (253–256). According to the European Male Ageing Study,
annual decline in Gait Speed and Grip strength in community-dwelling men turns significant from
the age of 70 years (83). Functional decline in community-dwelling older persons has been associated
with incident disability (257), but few studies have investigated its association with subsequent
mortality and they have yielded inconsistent results. At present evidence is still lacking that
functional changes would affect mortality hazard (55,120,251).
A better understanding of the clinical effects and consequences of functional changes would help
to justify physical function as a relevant outcome in clinical trials and to adapt and tailor care in the
clinical setting accordingly. Identifying persons at risk of death may allow interventions to be more
targeted and efficient.
In this study, we aimed to examine whether 3-year functional changes - not caused by any active
intervention - in four assessments of physical function (SF-36 Physical Function Index, Grip
strength, Chair rising, and Timed Up and Go) independently predict subsequent 15-year all-cause
mortality in community-dwelling older men.

84
METHODS
Study Population
The study population consisted of participants who attended both the second and fifth wave of a
cohort study, which was initiated to investigate the process of aging, mainly focusing on hormonal
changes and bone metabolism. This population-based observational study started in 1996 with
follow-up visits annually until 2000, one visit in 2003, and subsequent annual follow-up by postal
questionnaires and telephone contacts (still ongoing) (Figure 16). Ambulatory, non-
institutionalized men aged 70 to 85 years were recruited from the population register of Merelbeke,
a semi-rural community of ± 20 000 inhabitants in East Flanders, Belgium. Details concerning
recruitment have been described previously (162,168,222). We used the second wave in 1997 as this
analysis’ baseline since the serial testing of physical performance by the same group of four study
nurses began at this point. During each wave, all participants were assessed within 3.5 months. The
study was performed according to the Declaration of Helsinki. All participants gave their written
informed consent for participation in this study, which the ethics committee of Ghent University
Hospital approved (project 96/22).

CHANGES IN PHYSICAL FUNCTION & MORTALITY
2.3
85
Figure 16. Study design.
Measurements
Participants’ weight (nearest 0.1 kg) and height (nearest 0.1 cm) were measured in light clothing
without shoes. BMI was calculated as weight in kilograms divided by squared height in metres.
Participants were asked about their educational level, marital and residential status (living with
spouse, with family or alone), recreational physical activity (how much time during the week they

86
were exercising in the past years), concomitant medication use (range 0 – 8+; polypharmacy was
defined as ≥ 5 medications), and history of falls in the previous year. Standing balance was
evaluated by instructing participants to stand in three positions (parallel, semi-tandem, and tandem
stand) first with the eyes open and then closed for up to ten seconds each (range 0 – 6). Cognition
was evaluated through a 5-item recall performed three times (range 0 – 15). Higher scores indicate
better cognitive status. The 30-item GDS was used to evaluate depressive symptoms (range 0 – 30,
a score ≥ 11 is a possible indicator of depression) (179), the first part of the RDRS-2 to rate the
amount of assistance required in eight ADL (range 8 – 32, higher scores indicate more assistance
needed, a score > 8 is considered an indicator of disability) (190) and the SF-36 to evaluate self-
reported health and physical function (range 0 – 100) (223).
Educational level was recorded at the first visit, whereas the other correlates were assessed by four
dedicated study nurses at the second visit, which is our analysis’ baseline.
Assessments of physical function
Assessments of physical function were performed at each wave by the same group of study nurses.
Self-reported physical function was assessed using the ‘Physical Function Index’ of the SF-36
questionnaire (184), which consists of ten items asking about mobility limitations at the present time.
The total sum of the three-point scale responses is transformed to a total score ranging between 0
and 100 with higher values indicating better physical function.
Performance-based physical function was assessed using the Grip strength, Chair rising, and Timed
Up and Go tests. Grip strength was measured with a Smedley type hand dynamometer (Smith &
Nephew Rolyan Inc., Germantown, WI, USA). Participants were in a standing position with the
elbow in full extension, moving the shoulder from 180° to 0° flexion while squeezing as hard as
possible. Assessors were trained study nurses who gave encouragement during the assessment. The
used score was the second result of two trials (with unstandardized interval) of the dominant hand,
expressed to the nearest kilogram (214,234). Performance on the Chair Stand test was assessed twice in
a row, using a standard chair with seat height of 45 cm. Participants were instructed to complete
five full stands from seated position as quickly as possible (fastest time expressed to the nearest
hundredth of a second) (205,224). The Timed Up and Go test was assessed according to the method
described by Podsiadlo & Richardson (199). Participants were instructed to stand up from an
armchair (seat height of 45 cm), walk at a comfortable and secure pace to a line on the floor three
meters away, turn, return to the chair and sit down again (time expressed to the nearest hundredth
of a second).

CHANGES IN PHYSICAL FUNCTION & MORTALITY
2.3
87
Functional change
Functional change over four assessment points within three years was estimated for each
participant separately using the formula for the slope of an ordinary least-squares (OLS) regression
line.
𝑇ℎ𝑟𝑒𝑒 − 𝑦𝑒𝑎𝑟 𝑐ℎ𝑎𝑛𝑔𝑒 =3 ∗ 365 ∗ ∑ (𝑃𝐹𝑖 − 𝑃𝐹̅̅ ̅̅ )(𝑑𝑎𝑦𝑠𝑖 − 𝑑𝑎𝑦𝑠̅̅ ̅̅ ̅̅ ̅)𝑛
𝑖=1
∑ (𝑑𝑎𝑦𝑠𝑖 − 𝑑𝑎𝑦𝑠̅̅ ̅̅ ̅̅ ̅)²𝑛𝑖=1
PF = physical function
n = number of assessment points in time
days = number of days since baseline assessment at wave 2
Assessments were completed at all four waves in 158 men, at three waves in 12 men and at two
waves in 1 man. Missing data for in-between assessments were not replaced; instead the slope of
change was estimated without these data.
Mortality
We obtained data on all-cause mortality through yearly postal questionnaires and by contacting
proxies and the treating general practitioners via telephone. Survival time was calculated as the
number of months from assessment in 2000 until death or up to 15 years of follow-up (until
January 1st 2015 if there was a response to the postal questionnaire (N = 15), until July 8th 2015 if
the proxy or treating general practitioner was contacted by telephone (N = 7), until last date of
contact if the participant was lost to follow-up in 2015 (N = 1)).
Statistical analysis
Normally distributed data are presented as mean ± SD, and differences between groups were
compared using Independent samples T tests. Non-normally distributed data are presented as
median (IQR), and differences between groups were compared using Mann-Whitney U tests.
Countable variables are presented as total number and percentage of the sample. Differences
between groups were compared using Chi-square tests.
Cox proportional hazards models were used to analyse associations with all-cause mortality. Date
of participants’ fifth visit was considered as zero time for subsequent survival. For participants who
did not attend the fifth wave (and were included in the sensitivity analyses), July 1st 2000 was
considered as zero time. Interaction terms between baseline physical function and functional
change were not significant. The proportional hazards assumption which requires coefficients not
to change over time was assessed by plotting estimates of β(t) and by using the cox.zph function in

88
RStudio. Because the effect of decline in SF-36 Physical Function Index, Grip strength, and Chair
rising was not constant over time, a time-dependent covariate was constructed using the time-
transform functionality of coxph in RStudio and additional analyses were performed examining the
associations with shorter-term (7-year) mortality (221). HRs for continuous measures are computed
in such way to correspond with a unit of worse function / functional decline. Wald statistics were
provided to indicate the models’ fit.
All analyses were performed using RStudio, Version 0.99.484 – © 2009-2015 RStudio, Inc.
Statistical significance was indicated by a P value < 0.05.

CHANGES IN PHYSICAL FUNCTION & MORTALITY
2.3
89
RESULTS
A total of 198 men attended both the second and the fifth visit of this longitudinal study. However,
assessment of functional changes was incomplete due to protocol deviations for 27 men (Figure
16). Participants’ characteristics at baseline are shown in Table 7. Participants included in our
analysis (N = 171) differed from excluded men who had missing data (N = 57) or who died before
the fifth wave (N = 35) in terms of younger age, higher likelihood to perform at least two hours of
recreational physical activity per week, lesser likelihood to have fallen in the previous year and to
have balance problems, higher self-reported Physical Function Index, and faster Timed Up and Go
time. In addition, compared with the men who died before the fifth wave, included men had lower
scores on the GDS, lesser likelihood for depression and disability, and higher self-reported general
health.
Median (IQR) survival time after the second wave was 11.3 (7.3 – 15.4) years for included
participants, 2.1 (1.5 – 2.5) years for men who died before 2000 (P < 0.001) and 9.5 (6 – 12.4) years
for men with missing data (P = 0.035).
Median (IQR) 3-year change in SF-36 Physical Function Index was -4.71 (-18.58 – +0.11) points, in
Grip strength +0.25 (-4.02 – +2.23) kg, in Chair rising -0.85 (-2.14 – +0.15) seconds, and in Timed
Up and Go -0.02 (-1.18 – +1.22) seconds.

90
Table 7. Characteristics of men at the second wave of this cohort study (N = 263).
BASELINE CHARACTERISTIC PARTICIPANTS IN WAVE 2
INCLUDED IN THIS ANALYSIS
NOT INCLUDED IN THIS ANALYSIS A
DECEASED BEFORE WAVE 5
N 171 (65%) 57 (22%) 35 (13%)
Age (y), mean ± SD 75 ± 3 78 ± 4 *** 78 ± 5 **
BMI (kg/m²), mean ± SD 26.5 ± 3.3 26.3 ± 4.0 25.6 ± 3.7
Low education (elementary or less),
N (%)
81 (47) 37 (65) 18 (51)
Living alone, N (%) 31 (18) 8 (14) 8 (23)
Recreational physical activity
< 2h/week, N (%)
33 (19) 21 (4) * 12 (34) *
N° of medications, median (IQR) 2 (1 – 4) 2 (1 – 3) 3 (1 – 5)
Polypharmacy, N (%) 24 (14) 6 (11) 10 (29)
Any fall in previous year, N (%) 20 (12) 12 (21) * 9 (26) *
Balance < 5/6 points, N (%) 18 (11) 18 (32) *** 13 (37) ***
Cognitive recall [0 – 15], median (IQR) 13 (12 – 14) 13 (11 – 14) 13 (12 – 14)
Cognitive recall < 13/15, N (%) 61 (36) 23 (40) 15 (43)
GDS score [0 – 30], median (IQR) 4 (2 – 7) 6 (3 – 7) 6 (4 – 11) **
Depression, N (%) 21 (12) 6 (11) 10 (29) *
Disability, N (%) 18 (11) 5 (9) 11 (31) **
Self-reported health [0 – 100], median
(IQR)
65 (55 – 80) 65 (55 – 75) 60 (45 – 70) *
Physical Function Index [0 – 100],
median (IQR)
85 (75 – 95) 75 (60 – 93) ** 70 (51 – 85) ***
Grip strength (kg), mean ± SD 31.0 ± 7.5 29.4 ± 7.7 29.1 ± 7.8
Chair rising (s), median (IQR) 10.8 (9.5 – 12.4) 11.5 (10.0 – 13.8) 12.7 (11.1 – 17.2) ***
Timed Up and Go (s), median (IQR) 10.4 (8.9 – 12.2) 11.9 (10.0 – 14.5) ** 12.9 (10.6 – 16.9) ***
*** P < 0.001 ** P < 0.01 * P < 0.05 compared with the men who were included in this analysis.
A this group consists of men with incomplete physical function data at the second and/or fifth wave.
SD = Standard deviation, BMI = Body mass index, IQR = Interquartile range, GDS = Geriatric Depression Scale.

CHANGES IN PHYSICAL FUNCTION & MORTALITY
2.3
91
After 15 years of follow-up, 149 out of 171 participants (87%) died. Median survival time after the
fifth wave was 8.3 (4.3 – 12.4) years.
Cox proportional hazards models including a time-dependent object found 3-year functional
decline in SF-36 Physical Function Index (β = 0.06, HR = 1.06 (1.02 – 1.10)), Grip strength (β =
0.20, HR = 1.22 (1.06 – 1.41)), Chair rising (β = 0.41, HR = 1.50 (1.12 – 2.02)), and Timed Up and
Go (β = 0.26, HR = 1.30 (1.05 – 1.61)) to be associated with mortality hazard at zero time,
independent from age and baseline physical function. However, a significant time-attenuated effect
for decline in SF-36 Physical Function Index (β = -0.01, HR = 0.99 (0.98 – 0.998)), Grip strength
(β = -0.04, HR = 0.96 (0.93 – 0.998)), and Chair rising (β = -0.08, HR = 0.92 (0.85 – 0.995), but
not Timed Up and Go (β = -0.04, HR = 0.96 (0.91 – 1.02)) was detected. For example, a greater 3-
year decline in Chair rising with 1 second/3 year was associated with 50% higher mortality hazard
at zero time, but with only 26% higher mortality hazard at 15 years (= exp(0.41-0.08*log(180
months)). This time-attenuated effect turned significant after seven year for changes in SF-36
Physical Function, Grip strength, and Chair rising, but not for changes in Timed Up and Go.
Cox proportional hazards models with fixed covariates found both physical function at a single
time point assessment (either baseline (M1 in Table 8) or closure at wave 5 (M3 and M5 in Table
8) and 3-year functional decline estimated from repeated assessments (M1 in Table 8) to be
associated with higher subsequent 7-year mortality hazard, independent from age. For example,
men of similar age with a similar 3-year decline had on average a 16% higher mortality hazard for
every 1 second increase in baseline Chair rising performance. Men of similar age with a similar
baseline Chair rising performance had on average 20% higher mortality hazard for every 1
second/3 year greater decline in 3-year Chair rising change.
Figure 17 shows age- and baseline function-adjusted survival curves stratified by tertile of 3-year
functional changes (SF-36 Physical Function Index [33rd percentile = -11.93; 66th percentile = -
0.26], Grip strength [-2.65; 1.49 kg], Chair rising [-1.62; -0.27 seconds], Timed Up and Go [-0.79;
0.81 seconds]).
Associations between functional decline and 7-year mortality were still significant in supplementary
analyses adjusted for baseline polypharmacy, disability, and depression in addition to age and
physical function at baseline (M2* in Table 8), but were no longer significant when closure
physical function at wave 5 was taken into account (M3 and M4* in Table 8).

92
Sensitivity analyses were performed including participants who attended wave 2 and had at least
two measurements without protocol deviations (attendance of wave 5 was not specifically
required). Similar results were obtained by these analyses, which included up to 30 extra
participants (results not shown).

CHANGES IN PHYSICAL FUNCTION & MORTALITY
2.3
93
Table 8. Seven-year all-cause mortality hazard predicted by physical function at single time
point assessment (baseline or closure) and 3-year functional estimated from repeated
assessments in community-dwelling older men (N = 171, deaths = 73).
FUNCTION AT WAVE 2 3-YEAR FUNCTIONAL
DECLINE
FUNCTION AT WAVE 5 WALD
MODEL HR (CI95) P HR (CI95) P HR (CI95) P
Physical Function Index (0 – 100)
M1 1.02 (1.003 - 1.03) 0.011 1.02 (1.01 - 1.03) 0.002 - - 29
M2* 1.01 (0.998 - 1.03) 0.086 1.02 (1.01 - 1.03) 0.003 - - 33
M3 - - 1.00 (0.98 - 1.02) 0.535 1.01 (1.003 - 1.03) 0.011 29
M4* - - 1.01 (0.99 - 1.03) 0.354 1.01 (0.998 - 1.03) 0.087 33
M5 1.00 (0.98 - 1.01) 0.622 - - 1.02 (1.01 - 1.03) 0.003 29
M6* 0.99 (0.98 - 1.01) 0.433 - - 1.02 (1.01 - 1.03) 0.003 32
Grip Strength (kg)
M1 1.04 (1.01 - 1.08) 0.014 1.09 (1.04 - 1.14) < 0.001 - - 33
M2* 1.04 (1.001 - 1.08) 0.043 1.10 (1.05 - 1.15) < 0.001 - - 39
M3 - - 1.05 (0.99 - 1.11) 0.101 1.04 (1.001 - 1.07) 0.042 29
M4* - - 1.05 (0.995 - 1.12) 0.071 1.03 (0.995 - 1.07) 0.087 35
M5 0.97 (0.93 - 1.02) 0.272 - - 1.07 (1.02 - 1.12) 0.004 27
M6* 0.96 (0.91 - 1.02) 0.17 - - 1.08 (1.03 - 1.13) 0.003 33
Chair Rising (s)
M1 1.16 (1.08 - 1.25) < 0.001 1.20 (1.09 - 1.32) < 0.001 - - 35
M2* 1.17 (1.08 - 1.27) < 0.001 1.23 (1.10 - 1.36) < 0.001 - - 43
M3 - - 1.04 (0.93 - 1.15) 0.504 1.15 (1.06 - 1.23) < 0.001 33
M4* - - 1.04 (0.94 - 1.14) 0.463 1.17 (1.08 - 1.27) < 0.001 43
M5 0.99 (0.90 - 1.09) 0.799 - - 1.17 (1.06 - 1.28) 0.001 33
M6* 0.99 (0.90 - 1.07) 0.622 - - 1.20 (1.09 - 1.32) < 0.001 42
Timed Up and Go (s)
M1 1.15 (1.05 - 1.26) 0.003 1.16 (1.08 -1.25) < 0.001 - - 37
M2* 1.16 (1.04 - 1.29) 0.008 1.18 (1.08 - 1.28) < 0.001 - - 41
M3 - - 1.02 (0.92 - 1.14) 0.659 1.14 (1.04 - 1.25) 0.01 34
M4* - - 1.03 (0.93 - 1.15) 0.568 1.14 (1.02 - 1.27) 0.017 40
M5 1.00 (0.90 - 1.11) 0.954 - - 1.15 (1.07 - 1.25) < 0.001 34
M6* 0.99 (0.89 - 1.11) 0.908 - - 1.17 (1.07 - 1.28) < 0.001 38
HR = Hazard ratio, CI95 = 95% confidence interval.
M1, M3, M5: adjusted models included age at wave 2.
M2*, M4*, M6*: fully adjusted models included age, polypharmacy, depression, and disability at wave 2.

94
Figure 17. Age- and baseline physical function-adjusted survival curves stratified by tertile
of 3-year functional change.
Yellow lines correspond with tertiles of highest functional decline, red lines with mid tertiles of functional change,
and blue lines with tertiles of least functional decline / improvement.
HR = Hazard ratio, 95% confidence intervals are reported between brackets.

CHANGES IN PHYSICAL FUNCTION & MORTALITY
2.3
95
DISCUSSION
In this study, the association of 3-year functional changes - not caused by any active intervention -
with subsequent long-term all-cause mortality was evaluated in a sample of apparently healthy
community-dwelling older men.
Physical function assessed at a single time point (either baseline or closure at wave 5) was
significantly associated with subsequent mortality hazard, independently from future or preceding
3-year functional changes. Greater functional declines during the 3-year follow-up were associated
with higher mortality hazards. These associations were 1) more pronounced within the first seven
years, 2) independent from age, polypharmacy, depression, disability, and physical function at
baseline, 3) no longer significant when physical function at wave 5 was taken into account.
Few studies so far have examined the association between functional and subsequent mortality in
healthy community-dwelling older persons and they have yielded inconsistent results (62–64,66,258–260).
In addition, there are many discrepancies regarding how functional change was evaluated, the time
span over which change was assessed, and the duration of mortality follow-up. Different studies
who included a self-reported measure of physical function derived from the SF-36 questionnaire
found change (258) or at least decline (259) in the physical component summary score predicted 4-year
mortality, but neither decline nor improvement on the Physical Function Index within one year was
associated with 5- or 8-year mortality (62,63). Studies including a performance-based measure of
physical function most often used Gait speed. Patterns of change (62,63,260), but not always slopes of
Gait speed (64,66) were associated with subsequent mortality risk. When the SPPB was used, patterns
of decline but not of improvement within one year were associated with subsequent mortality rate
(62,63). In the CHS the highest quintile of Grip strength decline, but not of Chair rising decline was
associated with higher subsequent 7-year mortality risk (66). These inconsistent associations with
mortality indicate the importance of which physical function assessment is considered and how its
change over time is evaluated (number of assessments over time, patterns vs. slope of change).
Our findings have two important implications. First, physical function assessments at a single time
point - baseline or closure - were significantly associated with mortality independently from future
or preceding functional changes (Table 7) which supports their robustness and their use in clinical
practice. Second, in addition to age and single baseline function, ensuing 3-year functional changes
added significant value to the prediction of mortality. This indicates assessing physical function
repeatedly over time can provide prognostic information beyond that available from initial
assessment (261). In addition to closure physical function (at wave 5) preceding 3-year functional

96
changes did no longer contribute to the prediction of mortality. This indicates that when physical
function is repeatedly assessed over time, most prognostic information can be found in the final
assessment. Our results are in line with the findings of Sabia et al. (64).
Further research questions emerging from our findings relate to the longitudinal use of the SF-36
Physical Function Index, Grip strength, Chair rising, and Timed Up and Go test as markers of
(altered) mortality risk in older community-dwelling persons. Notably in this study, the observed
functional changes were not caused by any active intervention. As such, it remains to be
demonstrated whether functional changes, caused by active intervention, have similar predictive
capacity and could therefore be used as surrogate end points of mortality hazard in clinical trials. It
might also be further examined whether undergoing meaningful change in physical function or
reaching a threshold for closure physical function is best associated with mortality.
Our study has several innovative aspects. It is to our knowledge the first European study in
community-dwelling older men to report on the association between objectively measured
performance change and subsequent mortality risk and is the first to assess rate of change in Timed
Up and Go performance in that sense. Moreover, four assessment points over 3-year time,
performed by the same group of four dedicated and experienced study nurses, allow an accurate
estimate of rate of functional change. The subsequent 15-year follow-up, which is the longest for
any related mortality study, contributes to the high mortality rate of 86% in our analysis. The small
number of survivors, who are censored in the analysis, reduces the risk of bias in estimates and
standard errors.
Our study, however, has also some limitations. First, results might be influenced due to selection
bias, because only men who participated in both the second and fifth wave of this longitudinal
study could be included in the analyses (Table 7). Sensitivity analyses, including participants who
attended wave 2 and had at least two measurements without protocol deviations led to similar
results. Second, mortality was not confirmed by death registry data, but relied on communication
with the treating general practitioner and/or proxy. Third, this study was performed in apparently
healthy community-dwelling men, so our findings might not be generalizable to a more health-
deprived population. Fourth, the study sample is relatively small. By adjusting only for age,
polypharmacy, depression, disability, and physical function at baseline in the survival analyses, we
might have omitted important confounders. Related to the time-attenuated effect we observed,
Sabia et al. (64) similarly reported that the association of change in fast walking speed with mortality
was more pronounced in the first four year compared to the full 8-year follow-up. Nevertheless, it

CHANGES IN PHYSICAL FUNCTION & MORTALITY
2.3
97
possible that our observed attenuated effect results from the decreasing sample of men who are still
alive after certain follow-up.
In conclusion, physical function assessed at a single time point is a robust predictor of all-cause
long-term mortality in community-dwelling older men. Yet, repeated assessments of physical
function can provide prognostic information beyond that available from single initial assessment
for subsequent mortality hazard. However, with repeated assessments, most prognostic
information lays in the final assessment of physical function.

98
LEARNING POINTS
Physical function assessments at a single time point are robust predictors of all-cause long-
term mortality in community-dwelling older men.
Nevertheless, older community-dwelling men can experience functional changes over 3-year
time, not caused by any active intervention.
In this respect, repeated assessments of physical function can provide prognostic
information beyond that available from single initial assessment for subsequent mortality
hazard. However, with repeated assessments, most prognostic information lays in the final
assessment of physical function.
ACKNOWLEDGEMENTS
This work was supported by ‘Fonds voor Wetenschappelijk Onderzoek – Vlaanderen (FWO; Research
Foundation – Flanders)’ [grant numbers G0662.07, G0867.11].
Role of the sponsor in study design, in the collection, analysis and interpretation of data, in the
writing of the report, and in the decision to submit the article for publication: none.

3 CHAPTER 3: HEALTH RISK ASSESSMENT IN
OLDER IN-PATIENTS THROUGH
MEASUREMENTS OF PHYSICAL FUNCTION
3.1 A MULTICOMPONENT APPROACH TO IDENTIFY PREDICTORS OF
HOSPITAL OUTCOMES IN OLDER IN-PATIENTS: A MULTICENTRE,
OBSERVATIONAL STUDY 101
3.2 FUNCTIONAL CHANGES DURING HOSPITAL STAY IN OLDER
PATIENTS ADMITTED TO AN ACUTE CARE WARD: A
MULTICENTRE OBSERVATIONAL STUDY 121


3.1 A MULTICOMPONENT APPROACH TO IDENTIFY PREDICTORS OF HOSPITAL
OUTCOMES IN OLDER IN-PATIENTS: A MULTICENTRE, OBSERVATIONAL STUDY
De Buyser SL, Petrovic M, Taes YE, Vetrano DL, Onder G
PLoS One (2014) 9:e115413.

102
ABSTRACT
Background
The identification of older patients at risk of poor hospital outcomes (e.g. longer hospital stay, in-
hospital mortality, and institutionalization) is important to provide an effective healthcare service.
Objective
To identify factors related to older patients’ clinical, nutritional, functional, and socio-demographic
profiles at admission to an acute care ward that can predict poor hospital outcomes.
Design and setting
The CRIME project was a multicentre, observational study performed in geriatric and internal
medicine acute care wards of seven Italian hospitals.
Subjects
One thousand one hundred twenty-three consecutively admitted patients aged 65 years or older.
Methods
Hospital outcomes were LoS, in-hospital mortality, and institutionalization.
Results
Mean age of participants was 81 years, 56% were women. Median LoS was 10 (7 – 14) days, 41
patients died during hospital stay and 37 were newly institutionalized. Number of drugs before
admission, metastasized cancer, renal failure or dialysis, infection, falls at home during the last year,
pain, and Gait speed were independent predictors of LoS. Total dependency in ADL and inability
to perform Grip strength test were independent predictors of in-hospital mortality. Malnutrition
and total dependency in ADL were independent predictors of institutionalization.
Conclusions
Our results confirm that not only diseases, but also multifaceted aspects of ageing such as physical
function and malnutrition are strong predictors of hospital outcomes and suggest that these
variables should be systematically recorded.

PHYSICAL FUNCTION & HOSPITAL OUTCOMES
103
3.1
103
103
INTRODUCTION
The identification of geriatric patients at risk of poor hospital outcomes (e.g. longer hospital stay,
in-hospital mortality, institutionalization) is important to provide an effective health care service
(262). Predicting hospital outcomes at admission may facilitate the healthcare organization, as it
allows staff to optimally manage healthcare resources. Additionally, providing information
regarding prognosis may help the individual patient in terms of planning care (262–265).
Most studies rely on routinely collected data such as age, gender, and clinical diagnosis when
looking at outcomes of hospitalized older adults. However, a systematic literature review by
Campbell et al. (266) underlined the need to take into account multifaceted aspects such as nutritional
and functional status. Indeed, these aspects are rarely considered in clinical research. For example,
very few studies performed in the acute care setting have included physical performance measures.
Nevertheless these measures cover multiple facets and have been shown to predict hospital
outcomes (196,263,267).
The aim of the present study was to identify which factors on admission can predict hospital
outcomes in older patients admitted to an acute care ward. In pursuit of this objective, we used a
multi-component approach. First, we addressed multiple hospital outcomes, i.e. LoS, in-hospital
mortality, and institutionalization. Second, we analyzed prospectively collected data, including both
socio-demographic factors and multifaceted aspects of ageing e.g. nutritional status, functional status, and
physical performance measurements.

104
METHODS
Ethics statement
The study complies with the ethical rules for human experimentation that are stated in the
Declaration of Helsinki. All participating hospitals had obtained approval for the study from their
ethical committee. Written informed consent was obtained from either the patient or the surrogate
legal representative.
Study population
The CRIME study was a multicentre, observational study, aimed to assess prescribing patterns in
older adults hospitalized in Italy and to produce recommendations for pharmacological prescribing
in older complex patients. Details about these results of the CRIME project are reported elsewhere
(123,171,172,174,268). Researchers of three academic hospitals in Italy (Università Cattolica in Rome,
University of Perugia, and University of Ferrara) and researchers of four centres of the INRCA
(situated in Ancona, Cosenza, Fermo, and Rome) recruited patients, who were consecutively
admitted to geriatric and internal medicine acute care wards. Age of at least 65 years and willingness
to participate were the only inclusion criteria. Between June 2010 and May 2011, 1123 hospitalized
older in-patients were enrolled in the study.
Data collection
A questionnaire was designed to assess the participants at admission and at daily intervals until
discharge. Study researchers had received a two-day training course in which they were well-
instructed about how to correctly collect and report questionnaire data. The researchers were
ordinary clinical staff, external research staff, or a combination of both. They used a variety of
information sources, including direct observation, clinical records, and interviews with the patients,
family, friends or formal service providers.
Patient-related data included socio-demographic factors and medical history. Type of admission
was classified into admission through the emergency room and elective admission (if previously
planned). Comorbidity score was the count of a set of 50 medical diagnoses comprising
cardiovascular, endocrine, genitourinary, musculoskeletal, neurological, and malignant diseases at
admission or hospital-acquired. Additionally, presence of clinical conditions (falls at home during
the last year, pain, pressure ulcers, and incontinence) was reported. Furthermore, nutritional status

PHYSICAL FUNCTION & HOSPITAL OUTCOMES
105
3.1
105
105
(BMI), cognitive status (30-item Mini-Mental State Examination (MMSE) (269)), and affective status
(15-item GDS (270)) were evaluated.
Dependency in six ADL (191) (transferring, bathing, dressing, eating, bowel and bladder continence,
and personal hygiene) was reported to assess functional status. Gait speed was assessed by having
the participant walk at his/her usual pace over a four-meter course. This test has shown a high test-
retest reliability (189). Grip strength was measured using a North Coast Medical hand dynamometer.
Patients were seated with the wrist in a neutral position and the elbow flexed 90°. In case a subject
was unable to sit, Grip strength was assessed lying at 30° in bed with the elbows supported. Data
on Grip strength was missing for 21 patients.
Analytical approach
LoS was defined as the number of days from admission to discharge (or death). For the analyses
regarding LoS, continuous ADL score was used. Gait speed performance was categorized into
unable to perform the test, < 0.8 m/s, and ≥ 0.8 m/s (271). Grip strength categories were: unable to
perform the test at admission, < 21 kg in women or < 37 kg in men, and ≥ 21 kg in women or ≥
37 kg in men (272). New institutionalization comprised subjects who lived at home before admission
and were transferred to a residence for older people or to a nursing home at discharge. For the
analyses regarding mortality and institutionalization, ADL total dependency (6/6 dependencies)
was used and only two categories of Gait speed performance and Grip strength were considered
(able vs. unable to perform the test), due to the limited number of deaths and institutionalizations.
Participants were considered ‘unable’ to perform a test, if they could not follow instructions to
complete the test, if they could not complete the test because of their health condition (i.e.
drowsiness or severe cognitive impairment), or in the case of Gait speed, if the researchers
considered it unsafe to perform the test.

106
Statistical analyses
Descriptive data are presented as mean ± SD, median (IQR) or percentage, where appropriate.
Multiple linear regression was used to predict LoS. Models were adjusted for centre, gender, age,
and type of admission. Model validity was tested for the linearity of the regression function, the
constancy of variance, and the independence and normality of error terms. LoS was natural log-
transformed, because the untransformed variable was highly skewed. The approximate
interpretation of β is: LoS changes by 100 * β percent for a one unit increase in the independent
variable. Change in average LoS was calculated as follows: β * (mean LoS) = β * 11.17 days.
Subsequent analyses included all significant predictors of LoS in a multivariate regression model
with forward selection procedure and forced retention of centre, gender, age, and type of
admission.
Multiple logistic regression was used to predict in-hospital mortality and institutionalization.
Models were adjusted for centre and age. Subsequent analyses included all significant predictors of
in-hospital mortality or institutionalization in a multivariate regression model with forward
selection procedure and forced retention of centre and age. The Nagelkerke R² statistic (273) was
used to assess the amount of variation in in-hospital mortality and institutionalization, ‘explained’
by the variables.
Subjects who died in-hospital were excluded from the analyses of institutionalization. Of patients
who were hospitalized more than once during the enrolment period, only data concerning the first
hospitalization was considered.
All analyses were performed using SPSS software, version 19.0 (SPSS Inc., Chicago, IL). Statistical
significance was indicated by a P value < 0.05; all P values were two-tailed.

PHYSICAL FUNCTION & HOSPITAL OUTCOMES
107
3.1
107
107
RESULTS
Study population
In total, 1123 participants were enrolled in the CRIME study. Age ranged between 65 and 102
years (mean 82 ± 7 years). Slightly more than half of the participants (56%, N = 629) were female.
Subjects had a mean BMI of 26 ± 5 kg/m², 4% (N = 41) were underweight (BMI < 18.5 kg/m²).
Functional status fluctuated between both ends of the spectrum, with 36% (N = 404) having no
ADL impairments and 22% (N = 252) being totally dependent in ADL. Mean Gait speed
performance was 0.65 ± 0.25 m/s. Grip strength performers had a mean of 20 ± 9 kg. Further
characteristics of the study population are described in Table 9.

108
Table 9. Characteristics of the study population (N = 1123).
VARIABLE VALUE
SOCIO-DEMOGRAPHIC FACTORS
Age (y), mean ± SD 82 ± 7
Gender (female), N (%) 629 (56)
Elective admission, N (%) 551 (49)
Living alone, N (%) 279 (25)
MEDICAL HISTORY
No of drugs before admission, mean ± SD 6 ± 3
≥ 2 hospital admissions during the last year, N (%) 216 (19)
MEDICAL DIAGNOSES
Comorbidity score, median (IQR) 5 (3 – 6)
Ischemic heart disease, N (%) 356 (32)
Heart failure, N (%) 307 (27)
Cerebrovascular accident, N (%) 236 (21)
Parkinson's disease, N (%) 68 (6)
Dementia (Alzheimer or other), N (%) 230 (21)
Diabetes mellitus, N (%) 333 (30)
Metastasized cancer, N (%) 47 (4)
Renal failure or dialysis, N (%) 286 (26)
Infection, N (%) 119 (11)

PHYSICAL FUNCTION & HOSPITAL OUTCOMES
109
3.1
109
109
Table 9. Characteristics of the study population (N = 1123).[Continued]
VARIABLE VALUE
CLINICAL CONDITIONS
Falls at home during the last year, N (%)) 278 (25)
Pain, N (%) 589 (52)
Pressure ulcers, N (%) 57 (5)
Urinary incontinence or catheter, N (%) 468 (42)
Faecal incontinence, N (%) 157 (14)
Malnutrition (BMI < 18.5 kg/m²), N (%) 41 (4)
COGNITIVE AND AFFECTIVE STATUS
30-item Mini-Mental State Examination category, N (%)
Unable 186 (17)
< 24 460 (41)
≥ 24 415 (37)
15-item Geriatric Depression Scale, median (IQR) 4 (2 – 7)
FUNCTIONAL STATUS AND PHYSICAL PERFORMANCE
ADL score ( /6), median (IQR) 1 (0 – 5)
ADL total dependency, N (%) 252 (22)
Gait speed category, N (%)
Unable 603 (54)
< 0.8 m/s 381 (34)
≥ 0.8 m/s 139 (12)
Grip strength category,% (N)
Unable 306 (27)
< 21 kg ♀, < 37 kg ♂ 700 (62)
≥ 21 kg ♀, ≥ 37 kg ♂ 96 (9)
SD = Standard deviation, BMI = Body mass index, IQR = Interquartile range, ADL = Activities of daily living.
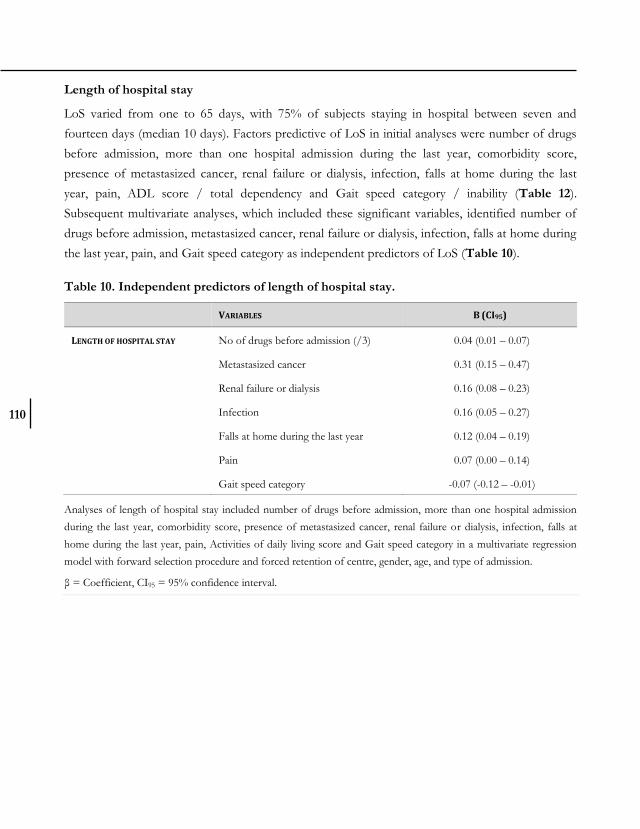
110
Length of hospital stay
LoS varied from one to 65 days, with 75% of subjects staying in hospital between seven and
fourteen days (median 10 days). Factors predictive of LoS in initial analyses were number of drugs
before admission, more than one hospital admission during the last year, comorbidity score,
presence of metastasized cancer, renal failure or dialysis, infection, falls at home during the last
year, pain, ADL score / total dependency and Gait speed category / inability (Table 12).
Subsequent multivariate analyses, which included these significant variables, identified number of
drugs before admission, metastasized cancer, renal failure or dialysis, infection, falls at home during
the last year, pain, and Gait speed category as independent predictors of LoS (Table 10).
Table 10. Independent predictors of length of hospital stay.
VARIABLES B (CI95)
LENGTH OF HOSPITAL STAY No of drugs before admission (/3) 0.04 (0.01 – 0.07)
Metastasized cancer 0.31 (0.15 – 0.47)
Renal failure or dialysis 0.16 (0.08 – 0.23)
Infection 0.16 (0.05 – 0.27)
Falls at home during the last year 0.12 (0.04 – 0.19)
Pain 0.07 (0.00 – 0.14)
Gait speed category -0.07 (-0.12 – -0.01)
Analyses of length of hospital stay included number of drugs before admission, more than one hospital admission
during the last year, comorbidity score, presence of metastasized cancer, renal failure or dialysis, infection, falls at
home during the last year, pain, Activities of daily living score and Gait speed category in a multivariate regression
model with forward selection procedure and forced retention of centre, gender, age, and type of admission.
β = Coefficient, CI95 = 95% confidence interval.

PHYSICAL FUNCTION & HOSPITAL OUTCOMES
111
3.1
111
111
In-hospital mortality
Forty one (4%) patients died in hospital. Factors predictive of in-hospital mortality in initial
analyses were age, infection, falls at home during the last year, pressure ulcers, urinary or faecal
incontinence, MMSE category, ADL score / total dependency, Gait speed inability, and Grip
strength inability (Table 13). Subsequent multivariate analyses, which included these significant
variables, identified ADL total dependency and Grip strength inability as independent predictors of
in-hospital mortality (Table 11). This multivariate model explained 28.5% of the variability in in-
hospital mortality.
Institutionalization
Thirty seven patients (3%) were newly institutionalized after discharge. Factors predictive of
institutionalization in initial analyses were age, cerebrovascular accident, dementia, metastasized
cancer, pain, urinary incontinence, malnutrition, MMSE category, ADL score / total dependency,
Gait speed inability, and Grip strength inability (Table 14). Subsequent multivariate analyses, which
included these significant variables, identified malnutrition and ADL total dependency as
independent predictors of institutionalization (Table 11). This model explained 32.9% of the
variability in institutionalization.
Table 11. Independent predictors of in-hospital mortality and institutionalization.
VARIABLES OR (CI95)
IN-HOSPITAL MORTALITY ADL total dependency 3.8 (1.5 – 9.8)
Grip strength inability 5.6 (2.0 – 16)
INSTITUTIONALIZATION Malnutrition (BMI < 18.5 kg/m²) 7.6 (2.0 – 29)
ADL total dependency 8.0 (2.8 – 23)
Analyses of in-hospital mortality included infection, falls at home during the last year, pressure ulcers, urinary or
faecal incontinence, MMSE category, ADL total dependency, Gait speed inability, and Grip strength inability with
forward selection procedure and forced retention of centre and age.
Analyses of institutionalization included cerebrovascular accident, dementia, metastasized cancer, pain, urinary
incontinence, malnutrition, MMSE category, ADL total dependency, Gait speed inability, and Grip strength inability
with forward selection procedure and forced retention of centre and age. Subjects who died in-hospital were
excluded from the analyses.
OR = Odds ratio, CI95 = 95% confidence interval; ADL = Activities of daily living, BMI = Body mass index.

112
DISCUSSION
In this multicentre study, we aimed to identify factors related to older patients’ clinical, nutritional,
functional, and socio-demographic profiles at admission to an acute care ward that can predict LoS,
in-hospital mortality, and institutionalization.
The observed median LoS of ten days in this study is in line with previous reports of multicentre
Italian and European studies (274,275). The number of drugs before admission was predictive of
longer LoS. This corresponds with the reported association between polypharmacy and poor
hospital outcomes (265,266). Along with other studies, we found the occurrence of infection (276),
having a history of falls at home (262,277), and slower Gait speed (196,267,277–279) were associated with
longer LoS. The predictive value of falls may not only be explained by poor walking mobility, as the
association between falls and LoS persists after adjustment for Gait speed in the multivariate
analyses. The presence of pain has not been reported as a predictor of LoS in the acute care setting
previously, but this finding is consistent with a reported association between pain perception and
LoS in older patients with hip fracture (280).
The observed percentage of in-hospital mortality (4%) and new institutionalization (3%) in this
study are in line with previous reports of multicentre Italian and European studies (274,275,281). The
presence of malnutrition and ADL total dependency both led to an eight-fold increase in
institutionalization rate. Previous studies likewise found malnutrition to be independently predictive
of institutionalization (263,282,283). This may be explained in part by the fact that malnutrition in older
hospitalized patients is a result of several medical and social conditions that chronically affect them,
rather than an indicator of an acute illness (282). In agreement with other studies, we found that
ADL total dependency was independently predictive of in-hospital mortality (265,275,282) and
institutionalization (263,275). Inability to perform the Grip strength test led to a five-fold increase in
mortality hazard. Grip strength is both a marker of functional and nutritional status (263).
The added value of physical performance measurements over self-reported measurements has been
questioned (196,267,284,285). In our study, Gait speed was a better predictor of LoS than ADL score.
Likewise, other studies found the association between functional status and LoS less discriminating
compared with Gait speed (196,267). Self-reported functional status measures, such as ADL score, are
not designed to capture the entire range of function in older adults (196) and may display ceiling
effects (284). Therefore, in older persons with few ADL dependencies, physical performance
measures might be more valuable (284). On the other hand, ADL total dependency as a measure of

PHYSICAL FUNCTION & HOSPITAL OUTCOMES
113
3.1
113
113
functional status was more discriminating for in-hospital mortality and institutionalization than
Gait speed performance. First, the Gait speed test displayed a floor effect in the weakest patients.
Only few subjects who died in-hospital or who were newly institutionalized could perform the Gait
speed test (N = 1 and 4, respectively) at admission. Second, functional status encompasses physical
function, cognitive status, and incontinence; these all have predictive value for institutionalization.
This study has both strengths and limitations. Overall, 1541 eligible patients were screened and
1123 (73%) agreed to participate in the study (171). These non-participants might have had poorer
hospital outcomes than participants and hence might bias our results. Despite the multicentre
design of our study, findings may not be representative for all older patients admitted to an acute
care ward, because the centres involved were exclusively Italian facilities and they were not
randomly chosen. Outcomes studied (in-hospital mortality, new institutionalization, and especially
LoS) can be highly influenced by the characteristics of the hospital and their staff. However, the
aim of the present study was to assess factors related to older patients’ profiles rather than
organizational characteristics. In addition, analyses were adjusted for ‘centre’ in order to take into
account the effect of centres' characteristics on study outcomes. One strength of this study is that
data was prospectively collected on multifaceted variables, which are otherwise unavailable in
administrative datasets and in many chart-based studies. It is interesting to note that routinely
available socio-demographic factors were not predictive of any hospital outcome. Similar findings
have been reported by other studies (262,265,277). We believe that such a multi-dimensional approach
to identify predictors of hospital outcomes in older in-patients might add value to the organization
of healthcare in comparison with single-component assessments.
The ageing ratio in Italy has been increasing over the past decades, with 146.5 persons aged 65 and
over compared to 100 persons aged 0 – 14 in 2010 (286). Mean life expectancy at the age of 65 has
reached 22.1 years for women (with 10 healthy life years) and 18.3 years for men (with 10.2 healthy
life years) (287). In 2010, over 10 million persons were admitted to acute care in Italy, of which 40%
were aged 65 and older (288). There were 287 acute care beds in hospitals per 100 000 inhabitants
(289). This number has decreased over the last years, which may be explained by the shift in
resources from the hospital to the community through the realization of integrated home care and
residential health care facilities. The number of facilities is increasing over the years with 6153
residential health care facilities in 2010 (290), of which 3749 provided health care for older persons
(291). However, Italy still has a low number of residential beds for older persons compared to other
Western countries. This may be due to the Italian family structure, which traditionally considers

114
care of older people as a responsibility of the family (292) and it may explain the low rate of
institutionalization observed in our study sample.
One of Italy’s challenges to satisfy the needs of frail older people is the presence of Geriatric
Evaluation Units in Health agencies to perform comprehensive geriatric assessments (292). If older
patients at risk of poor hospital outcomes could be identified at admission, than appropriate
resources could be made available during hospitalization, enabling a more effective healthcare
service (262). This can be achieved by implementing a comprehensive geriatric assessment at
admission to evaluate physical performance, functional dependency, nutritional status,
polypharmacy, and falls. Our results may therefore have not only important implications for the
organization and quality of clinical practice but also for its economic aspects.
Based on our results, in addition to nutrition optimization, we encourage exercise and physical
therapy interventions, which may help to prevent falls and to improve physical performance. We
endorse that patients’ drug use is carefully reviewed in order to discontinue potentially
inappropriate medication (274), particularly by withdrawing drugs of little added value and limiting
those related to falling.
Our results confirm that not only diseases, but also multifaceted aspects of ageing such as physical
function and malnutrition are strong predictors of hospital outcomes and suggest that these
variables should be systematically recorded (275,293).

PHYSICAL FUNCTION & HOSPITAL OUTCOMES
115
3.1
115
115
SUPPORTING INFORMATION
Table 12. Predictors of length of hospital stay. Data reported are from different linear
regression models predicting length of hospital stay (natural log-transformed). Each model
included centre, age, gender, and type of admission as covariates.
VARIABLE Β (CI95) P CHANGE IN AVERAGE LOS
(DAYS)
SOCIO-DEMOGRAPHIC FACTORS
Age (years) 0.00 (-0.00 – 0.01) 0.10 0.04
Gender (female) 0.01 (-0.05 – 0.08) 0.69 0.15
Elective admission -0.06 (-0.15 – 0.02) 0.15 -0.70
Living alone 0.03 (-0.05 – 0.10) 0.49 0.30
MEDICAL HISTORY
No of drugs before admission
(/3)***
0.07 (0.04 – 0.10) < 0.001 0.74
≥ 2 hospital admissions during the
last year***
0.09 (0.01 – 0.18) 0.04 1.01
MEDICAL DIAGNOSES
Comorbidity score*** 0.03 (0.01 – 0.05) < 0.001 0.34
Ischemic heart disease 0.04 (-0.03 – 0.11) 0.28 0.42
Heart failure 0.07 (-0.01 – 0.14) 0.09 0.75
Cerebrovascular accident 0.06 (-0.14 – 0.02) 0.16 0.65
Parkinson's disease -0.02 (-0.15 – 0.11) 0.77 -0.22
Dementia (Alzheimer or other) -0.01 (-0.10 – 0.08) 0.80 -0.12
Diabetes mellitus 0.05 (-0.02 – 0.12) 0.17 0.55
Metastasized cancer*** 0.31 (0.15 – 0.47) < 0.001 3.48
Renal failure or dialysis*** 0.18 (0.11 – 0.26) < 0.001 2.02
Infection*** 0.18 (0.07 – 0.29) 0.002 2.00

116
Table 12. Predictors of length of hospital stay. Data reported are from different linear
regression models predicting length of hospital stay (natural log-transformed). Each model
included centre, age, gender, and type of admission as covariates. [Continued]
VARIABLE Β (CI95) P CHANGE IN AVERAGE LOS
(DAYS)
CLINICAL CONDITIONS
Falls at home during the last year*** 0.12 (0.05 – 0.20) 0.002 1.35
Pain*** 0.11 (0.04 – 0.18) 0.002 1.21
Pressure ulcers 0.03 (-0.12 – 0.18) 0.68 0.35
Urinary incontinence or catheter 0.07 (-0.00 – 0.14) 0.06 0.77
Faecal incontinence 0.10 (0.00 – 0.20) 0.05 1.12
Malnutrition (BMI < 18.5 kg/m²) -0.11 (-0.28 – 0.06) 0.20 -1.25
COGNITIVE AND AFFECTIVE STATUS
30-item MMSE category -0.04 (-0.10 – 0.01) 0.09 -0.49
15-item Geriatric Depression Scale 0.01 (-0.01 – 0.02) 0.43 0.06
FUNCTIONAL STATUS AND PHYSICAL PERFORMANCE
ADL score*** 0.02 (0.00 – 0.04) 0.02 0.23
ADL total dependency 0.09 (0.00 – 0.18) 0.05 1.01
Gait speed category*** -0.10 (-0.15 – -0.04) < 0.001 -1.06
Gait speed inability*** 0.12 (0.05 – 0.20) 0.001 1.34
Grip strength category -0.02 (-0.09 – 0.04) 0.53 -0.23
Grip strength inability -0.04 (-0.12 – 0.04) 0.32 -0.45
The approximate interpretation of β is: Length of hospital stay changes by 100 * β percent for a one unit increase in
the independent variable.
Change in average length of hospital stay was calculated as follows: β * (mean length of hospital stay) = β * 11.17
days.
β = Coefficient LN (length of hospital stay), CI95 = 95% confidence interval, LoS = length of hospital stay, BMI =
Body mass index, MMSE = Mini-Mental State Examination, ADL = Activities of daily living.
*** Statistical significance was indicated by a P value < 0.05.

PHYSICAL FUNCTION & HOSPITAL OUTCOMES
117
3.1
117
117
Table 13. Predictors of in-hospital mortality. Data reported are from different logistic
regression models predicting in-hospital mortality. Each model included centre and age as
covariates.
VARIABLE OR (CI95) P
SOCIO-DEMOGRAPHIC FACTORS
Age (years)*** 1.10 (1.05 – 1.17) < 0.001
Gender (female) 0.72 (0.37 – 1.39) 0.33
Elective admission 0.54 (0.21 – 1.38) 0.20
Living alone 1.09 (0.50 – 2.35) 0.83
MEDICAL HISTORY
No of drugs before admission (/3) 1.09 (0.80 – 1.48) 0.60
≥ 2 hospital admissions during the last year 0.70 (0.31 – 1.56) 0.38
MEDICAL DIAGNOSES
Comorbidity score 1.03 (0.89 – 1.19) 0.71
Ischemic heart disease 1.14 (0.58 – 2.23) 0.70
Heart failure 1.34 (0.66 – 2.75) 0.42
Cerebrovascular accident 0.83 (0.40 – 1.72) 0.62
Parkinson's disease 0.59 (0.14 – 2.58) 0.48
Dementia (Alzheimer or other) 1.17 (0.59 – 2.33) 0.65
Diabetes mellitus 0.89 (0.42 – 1.90) 0.77
Metastasized cancer 0.00 (0.00 – .) 1.00
Renal failure or dialysis 1.79 (0.91 – 3.50) 0.09
Infection*** 2.69 (1.21 – 5.99) 0.02

118
Table 13. Predictors of in-hospital mortality. Data reported are from different logistic
regression models predicting in-hospital mortality. Each model included centre and age as
covariates. [Continued]
VARIABLE OR (CI95) P
CLINICAL CONDITIONS
Falls at home during the last year*** 0.39 (0.16 – 0.97) 0.04
Pain 1.17 (0.55 – 2.55) 0.69
Pressure ulcers*** 4.93 (1.89 – 12.9) 0.001
Urinary incontinence or catheter*** 4.12 (1.64 – 10.3) 0.003
Faecal incontinence*** 2.92 (1.45 – 5.90) 0.003
Malnutrition (BMI < 18.5 kg/m²) 2.26 (0.77 – 6.65) 0.14
COGNITIVE AND AFFECTIVE STATUS
30-item MMSE category*** 0.42 (0.24 – 0.75) 0.003
15-item Geriatric Depression Scale 1.09 (0.83 – 1.44) 0.53
FUNCTIONAL STATUS AND PHYSICAL PERFORMANCE
ADL score*** 1.08 (1.02 – 1.14) 0.005
ADL total dependency*** 5.60 (2.45 – 12.8) < 0.001
Gait speed inability*** 14.8 (1.91 – 114) 0.010
Grip strength inability*** 8.03 (3.17 – 20.3) < 0.001
*** Statistical significance was indicated by a P value < 0.05.
OR = Odds ratio, CI95 = 95% confidence interval, BMI = Body mass index, MMSE = Mini-Mental State
Examination, ADL = Activities of daily living.

PHYSICAL FUNCTION & HOSPITAL OUTCOMES
119
3.1
119
119
Table 14. Predictors of institutionalization. Data reported are from different logistic
regression models predicting new institutionalization. Each model included centre and age
as covariates. Subjects who died in-hospital were excluded from the analyses.
VARIABLE OR (CI95) P
SOCIO-DEMOGRAPHIC FACTORS
Age (years)*** 1.10 (1.04 – 1.16) 0.001
Gender (female) 1.25 (0.61 – 2.57) 0.54
Elective admission 1.61 (0.60 – 4.32) 0.34
Living alone 0.96 (0.43 – 2.14) 0.93
MEDICAL HISTORY
No of drugs before admission (/3) 1.03 (0.73 – 1.43) 0.88
≥ 2 hospital admissions during the last year 1.69 (0.79 – 3.60) 0.18
MEDICAL DIAGNOSES
Comorbidity score 1.05 (0.91 – 1.22) 0.53
Ischemic heart disease 0.72 (0.34 – 1.52) 0.39
Heart failure 1.09 (0.50 – 2.37) 0.82
Cerebrovascular accident*** 2.10 (1.03 – 4.29) 0.04
Parkinson's disease 1.83 (0.59 – 5.74) 0.30
Dementia (Alzheimer or other)*** 3.47 (1.64 – 7.74) 0.001
Diabetes mellitus 1.08 (0.51 – 2.28) 0.85
Metastasized cancer*** 3.10 (1.14 – 8.48) 0.03
Renal failure or dialysis 1.13 (0.54 – 2.36) 0.75
Infection 1.90 (0.84 – 4.29) 0.13

120
Table 14. Predictors of institutionalization. Data reported are from different logistic
regression models predicting new institutionalization. Each model included centre and age
as covariates. Subjects who died in-hospital were excluded from the analyses. [Continued]
VARIABLE OR (CI95) P
CLINICAL CONDITIONS 0.33
Falls at home during the last year 1.43 (0.70 – 2.93) 0.33
Pain*** 2.47 (1.04 – 5.86) 0.04
Pressure ulcers 2.74 (0.54 – 13.9) 0.22
Urinary incontinence or catheter*** 2.47 (1.12 – 5.45) 0.03
Faecal incontinence 2.28 (0.98 – 5.28) 0.06
Malnutrition (BMI < 18.5 kg/m²)*** 4.51 (1.42 – 14.34) 0.01
COGNITIVE AND AFFECTIVE STATUS
30-item MMSE category*** 0.33 (0.18 – 0.59) < 0.001
15-item Geriatric Depression Scale 1.10 (0.95 – 1.28) 0.21
FUNCTIONAL STATUS AND PHYSICAL PERFORMANCE
ADL score*** 1.60 (1.27 – 2.01) < 0.001
ADL total dependency*** 5.65 (2.44 – 13.1) < 0.001
Gait speed inability*** 5.34 (1.69 – 16.9) 0.004
Grip strength inability*** 3.22 (1.35 – 7.70) 0.01
*** Statistical significance was indicated by a P value < 0.05.
OR = Odds ratio, CI95 = 95% confidence interval, BMI = Body mass index, MMSE = Mini-Mental State
Examination, ADL = Activities of daily living.
ACKNOWLEDGEMENTS
The authors are grateful to Perehudoff K for her linguistic review and editing of the manuscript.

3.2 FUNCTIONAL CHANGES DURING HOSPITAL STAY IN OLDER PATIENTS
ADMITTED TO AN ACUTE CARE WARD: A MULTICENTRE OBSERVATIONAL
STUDY
De Buyser SL, Petrovic M, Taes YE, Vetrano DL, Corsonello A, Volpato S, Onder G
PLoS One (2014) 9:e96398.

122
ABSTRACT
Objectives
Changes in physical performance during hospital stay have rarely been evaluated. In this study, we
examined functional changes during hospital stay by assessing both physical performance and
ADL. Additionally, we investigated characteristics of older patients associated with meaningful in-
hospital improvement in physical performance.
Methods
The CRIME project recruited 1123 patients aged ≥ 65 years, consecutively admitted to geriatric or
internal medicine acute care wards of seven Italian hospitals. We analyzed data from 639
participating participants with a MMSE score ≥ 18/30. Physical performance was assessed by Gait
speed and Grip strength, and functional status by ADL at hospital admission and at discharge.
Meaningful improvement was defined as a measured change of at least 1 SD. Multivariable logistic
regression models predicting meaningful improvement, included age, gender, type of admission
(through emergency room or elective), and physical performance at admission.
Results
Mean age of the study participants was 79 years (range 65 – 98), 52% were female. Overall, mean
Gait speed and Grip strength performance improved during hospital stay (Gait speed
improvement: 0.04 ± 0.20 m/s, P < 0.001; Grip strength improvement: 0.43 ± 5.66 kg, P = 0.001),
no significant change was observed in ADL. Patients with poor physical performance at admission
had higher odds for in-hospital improvement.
Conclusion
Overall, physical performance measurements show an improvement during hospital stay. The
margin for meaningful functional improvement is larger in patients with poor physical function at
admission. Nevertheless, most of these patients continue to have poor performance at discharge.
FUNCTIONAL CHANGES DURING HOSPITAL STAY
3.2
123
INTRODUCTION
Functional changes in older persons with an acute illness can be expected during hospital stay
(294,295). However, changes in physical performance during hospital stay have scarcely been
evaluated. In the existing literature, in-hospital functional changes have been almost exclusively
reported by changes in functional status (296–299), e.g. using the Barthel index (300) and Katz ADL
index (191). Functional status measurements are self-reported and their accuracy can be affected by
the complex circumstances of hospital stay. Sager et al. (301) found discrepancies between patient’
assessments and performance-based measurements of the ability to do ADL in a substantial
proportion of hospitalized older persons. Bathing and dressing were the two activities in which
agreement rates were the lowest. For example, patients who need help dressing because they are
tethered to an intravenous pole, may have a clouded judgment about the ability to perform this
ADL independently (298).
Alternatively, physical performance measurements can be used to assess physical function in older
adults. Physical performance measurements can even identify more limitations in physical function
than self-reported subjective measurements (61). Furthermore, physical performance measurements
are more sensitive to change and might be more useful for longitudinal evaluations (267). Finally,
physical performance measurements are more able to predict outcomes than self-reported
measurements (189). Results of functional change during hospital stay might be different for physical
performance measurements compared with ADL index (298,301).
Past studies have mainly focused on functional decline of acutely ill older patients during hospital
stay (302–304). Functional decline is strongly associated with nursing home admission (305) and 3-
month mortality (299). Nevertheless, functional improvement after hospital admission has also been
reported (297–299).
This study had two objectives. The first objective was to examine functional changes during
hospital stay in older patients admitted to geriatric or internal medicine acute care wards by
assessing both physical performance and functional status. The second objective was to investigate
which characteristics of older patients are associated with meaningful in-hospital improvement in
physical performance.

124
METHODS
Ethics statement
The study complies with the ethical rules for human experimentation that are stated in the
Declaration of Helsinki. All participating hospitals (Gemelli Hospital, Università Cattolica del Sacro
Cuore in Rome / University of Perugia / University of Ferrara / INRCA in Ancona / INRCA in
Cosenza / INRCA in Fermo / INRCA in Rome) had obtained approval for the study from their
ethical committee. Written informed consent was obtained from all participants.
Data source & study population
Data from the CRIME project were used. The CRIME project was initiated to assess prescribing
patterns in older adults hospitalized across Italy and to produce recommendations for appropriate
pharmacological prescribing in older complex patients. Details about the methodology of the
CRIME project are reported elsewhere (170–172).
CRIME participants were patients aged 65 years or more, consecutively admitted to geriatric or
internal medicine acute care wards of the seven above mentioned hospitals. Between June 2010 and
May 2011, a total number of 1123 hospitalized older in-patients were enrolled in the CRIME
project.
Data collection
A questionnaire was designed to assess the participants within 24 hours of admission and at daily
intervals until discharge. Study researchers had received a two-day training course in which they
were well-trained about how to correctly collect and report questionnaire data. The study
researchers used a variety of information sources, including direct observation, clinical records, and
interviews with the patients, family, friends or formal service providers. The questionnaire included
demographics, type of admission (through emergency room or elective if planned previously),
anthropometrics, socio-economics, cognitive status (30-item MMSE (269)), psychological status (15-
item GDS), drug use, medical diagnoses, and geriatric conditions (pain, falls, delirium, and pressure
sores). Data on drug use, medical diagnoses, and geriatric conditions were updated daily.

FUNCTIONAL CHANGES DURING HOSPITAL STAY
3.2
125
Physical function measurements
Physical function was assessed within the first 24 hours after hospital admission and the day of
discharge by the study researchers. Gait speed was assessed by having the participant walk at
his/her usual pace over a four-meter distance. This test has shown a high test-retest reliability (189).
For the present study the fastest walk of two measurements was used in the analyses. Not all
patients were ambulatory at admission. For this reason Gait speed assessment was not performed
in 228 patients.
Measurement of Grip strength was performed using a North Coast Medical hand dynamometer.
Patients were seated with the wrist in a neutral position and the elbow flexed 90°. In case a subject
was unable to sit, Grip strength was assessed lying at 30° in bed with the elbows supported. The
highest value of two consecutive measurements obtained with the dominant hand was used in the
analyses. A distinction was made between subjects unable to perform Grip strength and subjects
who did not execute the test despite being capable.
Dependency in ADL (transferring, bathing, dressing, eating, bowel and bladder continence, and
personal hygiene) was reported to assess functional status just before admission. Scores ranged
from no to six dependencies.
Analytical approach
In order to exclude patients not able to complete the physical performance measurements because
of cognitive problems or inability to understand instructions, analyses were limited to patients with
an MMSE score ≥ 18/30. This is in line with other projects focusing on physical performance in
older persons (254). Further, patients who died during hospital stay (N = 25) were excluded from the
analyses. This left an analytical sample of 639 subjects. Various sub-analyses have been performed,
for example, by excluding subjects unable to perform Gait speed or Grip strength at admission or
by excluding subjects with high performance at admission (Gait speed ≥ 0.80 m/s or Grip strength
≥ 20.0 kg / 30.0 kg for women / men).
Functional change was computed in the way that positive values indicate a functional
improvement. In order to capture functional change in subjects unable to perform a test at
admission or discharge, the value corresponding to the first percentile of admission performance of
participants was assigned to these subjects and to those with a performance below the first
percentile (Gait speed 0.23 m/s, Grip strength 5.0 kg). Subjects who did not perform Grip strength
despite being capable, were treated as missing variables (N = 4). Meaningful improvement in

126
physical performance was defined as a measured change of at least 1 SD, this equals a 0.20 m/s
increase in Gait speed and 5.0 or 7.0 kg increase in Grip strength for women or men, respectively.
For functional status, change in the ability to do at least 1 ADL was considered meaningful.
To visualise the functional change according to admission performance, subjects were categorised
into three groups according to physical performance at admission. Gait speed categories were:
unable to perform the test, less than 0.8 m/s, and at least 0.8 m/s (271). Grip strength categories
were: unable to perform the test, less than 20.0 kg in women or 30.0 kg in men, and at least 20.0 kg
in women or 30.0 kg in men (271).
Statistical methodology
Continuous variables were expressed as mean ± SD or median (first to third quartile), where
appropriate. Countable variables were presented as absolute number and percentage of the study
population. In-hospital change in physical function was examined with paired samples T tests or
related samples Wilcoxon signed rank tests, where appropriate. Multivariable logistic regression was
used to predict meaningful improvement in Gait speed and Grip strength. Regression models
included age, gender, type of admission, and physical performance at admission (continuous
variable). Additional analyses also included LoS (days), MMSE score, comorbidity (sum), or
number of drugs during stay. Hosmer-Lemeshow goodness-of-fit tests indicated no signs of a bad
model fit. All analyses were performed using SPSS software, version 19.0 (SPSS Inc., Chicago, IL).
Differences according to type of admission in ability to perform physical performance
measurements and in physical performance of participants were examined with Chi-square tests
and Independent samples T tests, respectively. The relationship between comorbidity and physical
performance at admission was assessed using linear regression analyses. Statistical significance was
indicated by a P value < 0.05; all P values were two-tailed.

FUNCTIONAL CHANGES DURING HOSPITAL STAY
3.2
127
RESULTS
Patient Characteristics
Age ranged between 65 and 98 years. Men and women were nearly equally represented (48% men).
Slightly more than half of the patients were electively admitted (55%). Detailed characteristics of
our sample are reported in Table 15. Most prevalent diseases were hypertension (N = 523; 82%),
ischemic heart disease (N = 206; 32%), heart failure (N = 156; 25%), diabetes mellitus (N = 195;
31%), osteoarthritis (N = 239; 37%), COPD (N = 237; 37%), and renal failure (N = 147; 23%).
Table 15. Characteristics of the study population (N=639).
VALUE
Age (y), mean ± SD 79 ± 7
Gender (female), N (%) 331 (52)
Elective admission, N (%) 349 (55)
Gait speed category at admission, N (%)
Unable to perform the test 228 (36)
< 0.8 m/s 291 (46)
≥ 0.8 m/s 120 (19)
Grip strength category at admission, N (%)
Unable to perform the test 78 (12)
< 20 kg ♀ / < 30 kg ♂ 368 (58)
≥ 20 kg ♀ / ≥ 30 kg ♂ 189 (30)
ADL dependencies, median (IQR) 1 (0 – 2)
Length of hospital stay (days), median (IQR) 9 (6 – 14)
MMSE, median (IQR) 25 (22 – 28)
Geriatric Depression Scale (15-item), median (IQR)* 4 (2 – 7)
Comorbidity sum, median (IQR) 4 (3 – 6)
N° drugs during stay, median (IQR) 9 (7 – 13)
*Geriatric Depression Scale data were missing for 48 subjects. SD = Standard deviation, ADL = Activities of daily
living, IQR = Interquartile range, MMSE = Mini-Mental State Examination.

128
Within patients admitted from the emergency room, 49% (N = 141) and 22% (N = 53) was unable
to perform Gait speed or Grip strength, respectively. These proportions are substantially higher (P
< 0.001) than those in patients admitted electively (N = 87; 33% and N = 25; 8%). In patients able
to perform, mean Grip strength and Gait speed performance did not significantly differ according
to type of admission.
Changes during Hospital Stay in Physical Performance and Functional Status
Overall, mean Gait speed and Grip strength performance improved significantly during hospital
stay (Table 16), but most patients had no meaningful change in Gait speed (N = 552; 86%) or
Grip strength (N = 558; 88%). Thirty-six percent of subjects (N = 228) were unable to perform
Gait speed at admission, of these 23% (N = 52) regained their ability with a mean Gait speed of
0.69 ± 0.28 m/s at discharge. Twelve percent was unable to perform Grip strength at admission, of
these 41% (N = 78) had regained function at discharge (mean Grip strength = 17.48 ± 10.61 kg).
The mean and SD of Grip strength change was larger in men than in women (1.02 ± 6.65 kg vs. -
0.12 ± 4.50 kg). Table 16 provides more details concerning the changes in physical performance
during hospital stay. Sub-analyses excluding subjects unable to perform Gait speed or Grip strength
at admission led to similar mean changes.
Table 16. In-hospital change in physical performance.
ADMISSION
SCORES IN-HOSPITAL CHANGE
N MEAN SD MEAN SD
% CHANGE VS. ADMISSION SDa
P MEANINGFUL
IMPROVEMENT
% (N)b
Gait speed (m/s) 639 0.52 0.3 0.04 0.20 13.79 < 0.001 10 (62)
Grip strength (kg) 635 19.16 10.4 0.43 5.66 4.15 0.001 7 (45)
a Percent change vs. SD of the mean was calculated with the following formula: 100 * mean change / SD of mean at
admission.
b Meaningful improvement was defined as ≥ 0.20 m/s Gait speed and ≥ 5.0 kg ♀ / ≥ 7.0 kg ♂ Grip strength
SD = Standard deviation.
Globally, functional status, expressed by ADL score, did not significantly change during hospital
stay, only 38 subjects improved in ADL (P = 0.058). The great majority of the subjects (N = 581;
91%) obtained the same score of admission at discharge (median admission score = 1 (0 – 2)
dependencies).

FUNCTIONAL CHANGES DURING HOSPITAL STAY
3.2
129
Characteristics Associated with Meaningful Changes during Hospital Stay
As illustrated in Figure 18, in-hospital change in physical function varied according to admission
performance. Subjects who were unable to perform Gait speed at admission or with slow Gait
speed (< 0.8 m/s) improved in mean Gait speed performance during stay, but remained to have
poor function at discharge. Similarly, subjects who were unable to perform Grip strength or with
weak Grip strength at admission improved in mean Grip strength performance during stay, but still
performed poorly at discharge. Subjects with high Grip strength performance at admission had a
significant decline during hospital stay.
Figure 18. Change in physical performance measurements according to admission
performance. Error bars represent 95% confidence intervals.

130
Table 17 shows the results from multivariable logistic regression analyses predicting meaningful
improvement in Gait speed or Grip strength during hospital stay. These models illustrate an
association of admission performance with functional improvement during hospital stay. The odds
for in-hospital improvement decreased when patients were electively admitted and when they had
higher performance at admission. Additionally, the odds for Gait speed improvement during stay
decreased with older age. Sub-analyses excluding subjects with high performance at admission led
to similar results. Additional analyses including one extra covariate found LoS (days), MMSE score,
and number of drugs during stay not to be predictive of functional improvement. Higher
comorbidity was associated with higher odds for meaningful improvement in Grip strength (Odds
ratio (OR) = 1.02, CI95 = 1.04 – 1.33, P = 0.009). Comorbidity sum was also significantly
associated with Grip strength performance at admission (β = -0.51, CI95 = -0.84 – -0.19, P =
0.002).
Table 17. Associations with meaningful improvement in physical performance during
hospital stay.
GAIT SPEED IMPROVEMENT GRIP STRENGTH IMPROVEMENT
OR CI95 P OR CI95 P
Age (years) 0.95 0.92 – 0.99 0.022 0.98 0.93 – 1.02 0.320
Gender (male) 1.48 0.87 – 2.55 0.148 1.70 0.89 – 3.26 0.110
Elective admission 0.42 0.24 – 0.74 0.003 0.46 0.23 – 0.93 0.030
Admission performance (m/s or kg) 0.19 0.06 – 0.57 0.003 0.86 0.82 – 0.91 <0.001
Data reported are from multivariable logistic regression models predicting improvement of ≥ 0.20 m/s in Gait speed
and improvement of ≥ 5.0 kg ♀ / ≥ 7.0 kg ♂ in Grip strength.
OR = Odds ratio, CI95 = 95% confidence interval.

FUNCTIONAL CHANGES DURING HOSPITAL STAY
3.2
131
DISCUSSION
The first objective of this study was to examine functional changes during hospital stay in older
patients admitted to acute care. Because functional change has scarcely been evaluated by physical
performance measurements, we have assessed both Gait speed and Grip strength performance at
admission and at discharge.
Physical performance measurements have mostly been used in community-dwelling older persons,
where a Gait speed of 0.8 m/s has been accepted to define low Gait speed (271). Ostir et al. (196)
assessed Gait speed in acutely ill older patients admitted to acute care. They found 64% of patients
could complete the Gait speed test, with a mean performance of 0.5 ± 0.3 m/s (196). Their results
are in perfect agreement with ours. Common gender-specific thresholds for Grip strength to
identify mobility limitations are 20 kg / 30 kg (271) and 21 kg / 37 kg (272) for women / men.
Due to older in-patients’ acute illness, high catabolism, bed rest, sleep deprivation, and
polypharmacy, hospital stay is a risk factor for functional decline (294,295). Nevertheless, we found an
overall mean improvement in physical performance during hospital stay, while median functional
status (ADL score) did not change significantly.
The detected improvement in physical performance might be part of a functional recovery
trajectory, where functional improvement is preceded by functional decline before hospital
admission as a consequence of the acute medical illness (297,298). Stabilization of the acute medical
condition may outweigh the negative consequences of hospital stay on physical function (306).
The overall improvement in physical performance, observed in our study, is in line with the results
of Volpato et al. (267) who reported in-hospital change in performance on the SPPB (206) of 92
patients; 63% had better performance at hospital discharge. Similarly, Bodilsen et al. (306) reported an
improvement during hospital stay in mean physical performance of 33 patients, quantified by the
Timed Up and Go test. Furthermore, Purser et al. (279) reported a mean improvement in Gait speed
during stay of 0.03 m/s in frail older veterans.
Unlike two others studies (306,307), we could validate a significant improvement in mean Grip
strength performance during hospital stay. These other studies either excluded subjects unable to
perform physical performance measurements (306) or assessed changes after only one week of

132
hospital stay (307). In our study, subjects unable to perform had the greatest functional change and
65% of subjects stayed in hospital longer than seven days.
The second objective of this study was to investigate which patient characteristics are associated with
meaningful in-hospital improvement. In our study, improvement in physical performance was
related to admission performance, with poor performers experiencing meaningful improvements
more frequently than good performers. These poor performers might have had a functional
recovery trajectory with greater functional decline before admission. Since, in the study of Palleschi
et al. (297), greater functional decline before hospital stay was a significant predictor of in-hospital
functional improvement. In addition, a floor effect may clarify the observed improvement in poor
performers, given that subjects unable to perform at admission could not further decline. When
interpreting these results, one must consider that regression toward the mean might be responsible
for improvement in poor performers and decline in good performers.
Older subjects had lower odds for Gait speed improvement. Similarly, in the study of Covinsky et
al. (298), older patients were more likely to fail to recover in ADL function during hospital stay.
Subjects who were electively admitted had lower odds to improve performance. Patients admitted
from the emergency room often present with severe acute conditions, which may have led to a
steep decline in physical performance before hospital admission. During hospital stay they can
recover from the acute conditions and consequently improve their level of physical performance
during stay. Patients admitted electively are less likely to present severe acute conditions. Therefore,
they are less likely to improve during stay. Similarly, subjects with higher comorbidity might have a
larger margin to recover from an acute condition than those with few diseases.
Performance-based versus patient-reported physical function
As reported in other studies, performance-based and patient-reported measurements of physical
function appear to assess distinct and only partially overlapping domains of physical function
(308,309). Diehr et al. (310) found Gait speed to be the most sensitive indicator of age-related decline in
older adults. In our study, changes in Gait speed and Grip strength could be detected over the
short period of time in hospital. On the contrary, the 6-item ADL scale did not seem suitable to
assess in-hospital changes. Our results suggest that physical performance measurements might be
more sensitive to demonstrate functional changes during hospital stay, than self-reported functional
status. Use of physical performance measurements in the acute care setting should be encouraged,
as physical performance measurements may provide important clinical information in acutely ill

FUNCTIONAL CHANGES DURING HOSPITAL STAY
3.2
133
older subjects. Multifaceted aspects of aging are integrated in physical functions measurements,
including disease processes, nutritional status, and fitness (189). In addition, low physical
performance may reflect a state of frailty.
Limitations & Strengths
Our results have implications for the feasibility of physical performance measurements in the acute
care setting. We assigned a continuous value equivalent to the worst percentile of performance, to
those patients who were unable to perform Gait speed and Grip strength. Just like Purser et al. (279),
we found this to be a feasible way of tracking continuous improvement over time. Although this
recoding may have introduced bias, we found that excluding those unable to perform led to similar
mean changes. Unfortunately, the reason why subjects were unable to perform was not recorded.
However, the exclusion of subjects with an MMSE below 18 removed patients not able to
complete the test because of cognitive problems or inability to understand instructions. Therefore
physical problems were the main reason why subjects were unable to perform physical
performance measurements.
An important variable not recorded is main reason of admission. The severity of the disease that
led to hospital admission might very well be a confounding factor. However, we believe this factor
is partially captured in the type of admission. Patients admitted from the emergency room often
present with severe acute conditions, while patients admitted electively are less likely to present
severe acute conditions. The high proportion of subjects unable to perform within patients
admitted from the emergency room endorses this theory. Unfortunately, we do not have the data
to fully explore these findings.
The percentage of subjects with meaningful change was relatively low. Our definitions of
meaningful change (0.20 m/s Gait speed and 5.0 or 7.0 kg Grip strength women / men) seem
roughly in line with those reported elsewhere (311–313). Substantial meaningful change in four-meter
Gait speed observed in community-dwelling older adults was estimated at 0.10 m/s (311), while
substantial meaningful improvement in Gait speed observed during recovery from hip fracture was
estimated between 0.17 to 0.26 m/s (312). Estimates of meaningful change in Gait speed may differ
based on the direction of change or between patient populations (312). Regarding Grip strength, a
change of more than 6.0 kg was suggested as necessary to detect a genuine change in Grip strength
95% of the time (313). It is conceivable that patients with relatively high performance on admission
could not be able to demonstrate such meaningful improvement during hospital stay due to ceiling
effects in physical performance measurements. Sub-analyses have confirmed that predictive factors

134
for functional change did not alter when subjects with high performance at admission were
excluded.
Our study was restricted to functional changes from admission until discharge. Given the
possibility that patients are admitted in the night, a 24-hour window was allowed to perform the
first assessment. Medical therapy could have taken place between admission and assessment that
could affect patients’ physical performance. After hospital discharge, functional changes might still
occur as part of the functional recovery trajectory. Volpato et al. (314) reported an improvement in
50% of patients in performance on the SPPB (206) during the first month after discharge.
A strength of this study is the availability of comprehensive data. We present objective data in the
clinical setting where physical performance measurements have received little attention (314). Our
data demonstrate the feasibility of physical performance measurements in acute care setting.
Furthermore, we provide a better understanding of the dynamic nature of physical performance in
older people with an acute illness during hospital stay. The multicentre design of the study
improves generalisability of our results to acute care settings across Italy and Europe.
Further research
Both in community-dwelling and hospitalized older subjects, physical function measurements have
shown their predictive value in terms of various adverse health-related outcomes, such as mortality,
institutionalization, and healthcare costs (222,293,315). Our results suggest that the interpretation of
physical performance at a single time point is not straightforward. More research is needed to
determine how functional changes can add value to the prediction of hospital outcomes. Functional
trajectories might even be more prognostic than single and static measurements of physical
function (299).
Conclusions
This study was one of the few that observed in-hospital change in physical performance of older
subjects. Overall, physical performance measurements show an improvement during hospital stay.
The margin for meaningful functional improvement is larger in patients with poor physical
performance at admission. Nevertheless most of these patients continue to have poor performance
at discharge.
ACKNOWLEDGEMENTS
The authors are grateful to Perehudoff K for linguistic editing of the manuscript.

4 CHAPTER 4: GENERAL DISCUSSION
4.1 MAIN FINDINGS & CONTRIBUTIONS IN COMMUNITY-DWELLING
OLDER MEN 137
4.1.1 SOF frailty & mortality 137
4.1.2 FNIH sarcopenia & mortality 139
4.1.3 Physical function & mortality 141
4.1.4 Changes in physical function & mortality 146
4.2 MAIN FINDINGS & CONTRIBUTIONS IN OLDER IN-PATIENTS 149
4.2.1 Physical function & hospital outcomes 149
4.2.2 Functional changes during hospital stay 155
4.3 IMPLICATIONS & PERSPECTIVES 159
4.3.1 Physical function & its purpose 159
4.3.2 Physical function & its numerous operational definitions 161
4.3.3 Physical function & its interventions 162
4.3.4 Physical function & the older individual 165
4.3.5 Physical function & its future 166
4.4 METHODOLOGICAL CONSIDERATIONS 166
4.4.1 Merelbeke study 167
4.4.2 CRIME study 171


MAIN FINDINGS & CONTRIBUTIONS IN COMMUNITY-DWELLING OLDER MEN
4.1
137
4.1 MAIN FINDINGS & CONTRIBUTIONS IN COMMUNITY-DWELLING OLDER MEN
4.1.1 SOF FRAILTY & MORTALITY
In Chapter 2.1 we evaluated the simple SOF frailty index for prediction of subsequent 15-year all-
cause mortality in a well-described sample of apparently healthy community-dwelling older men in
Belgium. As this frailty index has a non-distribution based character, its clinical relevance might
have been limited to the population and setting in which it was developed, being community-
dwelling older women in the US. This theory was supported by the non-significant association with
mortality found in Asian and African American community-dwellers (130,131). Furthermore the
initially significant association with mortality found in Belgian in-patients admitted to an acute
geriatric ward, turned non-significant when the model was adjusted for multiple risk factors (142).
In the Merelbeke study population, pre-frailty and frailty as defined by the SOF index was present
in 30 and 7% of men, respectively. Of the individual SOF components, ≥ 5% weight loss (age-
adjusted HR = 1.99, CI95 = 1.27 – 3.11) and poor energy (age-adjusted HR = 1.78, CI95 = 1.26 –
2.51) were significantly associated with all-cause mortality, but not inability to rise from a chair five
times without using the arms (age-adjusted HR = 1.23, CI95 = 0.67 – 2.27). Other studies
oppositely have found higher mortality odds or hazards in those unable to do Chair rising (120,316),
albeit they were compared to older persons in the fastest quarter of performance instead of to all
older persons able to perform the test. In comparison with robust men of the same age, pre-frail
older men had on average 1.72 times higher mortality hazard (age-adjusted HR = 1.72, CI95 = 1.23
– 2.42) and frail older men had on average 2.64 times higher mortality hazard (age-adjusted HR =
2.64, CI95 = 1.44 – 4.86).
Our population-based study was the first in community-dwelling European men, as can be
deducted from Table 18, which summarizes all studies to date examining the SOF frailty index as
predictor of all-cause mortality. Furthermore, the Merelbeke study has had the longest mortality
follow-up and hence the highest mortality rate by far. Prevalence of pre-frailty and frailty was in
line with rates reported in other studies in community-dwelling older adults.
A consideration regarding the concept of this study is that no comparisons of predictive accuracy
were made with other frailty indices. Due to the retrospective nature of our research questions, the
SOF frailty index was the only validated frailty instrument that could be applied retrospectively to
the Merelbeke database without any modifications.

Table 18. Studies examining the association of the SOF frailty index with mortality.
FIRST
AUTHOR, YEAR
COUNTRY N WOMEN AGE RANGE
(MEAN ± SD), YEARS
RECRUITMENT [STUDY] FOLLOW-UP MAX,
YEARS
MORTA-LITY RATE
SOF
INDEX PREVA-LENCE
ASSOCIA-TION WITH
MORTALITY
Ensrud, 2008 (30)
US 6701 100% ≥ 69
(77 ± 5)
Community-dwellers listed in four areas (no African Americans) [SOF]
9 41% Pre-frail Frail
36% 17%
S
Ensrud, 2009 (31)
US 3132 0% ≥ 67
(76 ± 6)
Community-dwellers residing in six communities (community-based mailings and advertising) [MrOS Sleep]
3 (mean) 7% Pre-frail Frail
43% 13%
S
Bilotta, 2012 (225)
Italy 265 71% ≥ 65
(82 ± 7)
Outpatients consecutively referred to a geriatric clinic by the general practitioner
1 9% Pre-frail Frail
35% 37%
S
Pilotto, 2012 (140)
Italy 2033 57% ≥ 65
(80 ± 8)
In-patients admitted to 20 Italian geriatric units, due to acute disease or relapse of a chronic disease
1 month 1
9% 25%
Pre-frail Frail
40% 27%
S
Joosten, 2014 (142)
Belgium 189 57% ≥ 70
(84)
In-patients consecutively admitted to the acute geriatric ward of a tertiary care hospital
6 months 13% Pre-frail Frail
52% 33%
S / NS
Jung,
2014 (131)
Korea 663 51% ≥ 65
(76 ± 9)
Community-dwellers residing in one city (random sample + volunteers) [Korean Longitudinal Study in Health and Aging]
6 14% Pre-frail Frail
50% 9%
NS
Malmstrom, 2014 (130)
US 779 58% 49 – 65
(57)
Community-dwelling African Americans from two areas [African American Health]
9 15% Pre-frail Frail
32% 9%
NS
De Buyser, 2016 (317)
Belgium 198 0% 74 – 89
(79 ± 4)
Community-dwellers registered in one municipality (population register)
15 86% Pre-frail Frail
30% 7%
S
SD = Standard deviation, SOF = Study of Osteoporotic Fractures, S = Significant, NS = Not significant.

MAIN FINDINGS & CONTRIBUTIONS IN COMMUNITY-DWELLING OLDER MEN
4.1
139
4.1.2 FNIH SARCOPENIA & MORTALITY
In Chapter 2.1 we also evaluated the data-driven FNIH cutoff points for weakness and low muscle
mass for prediction of subsequent 15-year all-cause mortality in a well-described sample of
apparently healthy community-dwelling older men in Belgium. These non-distribution based
criteria were only recently (2014) developed in community-dwelling older adults, predominantly
living in the US. However, their association with mortality was inconsistent and further validation,
including studies in European older adults, was still needed, since clinical relevance of the criteria
might have been limited to the original population and setting.
In the Merelbeke study population, the combination of weakness and low muscle mass, as defined
by the FNIH criteria, was present in 3 to 8% of men. Of the individual criteria, only low ALMBMI
(age-adjusted HR = 1.47, CI95 = 1.05 – 2.07) was associated with all-cause mortality. However, in
the absence of weakness the association of low ALMBMI with mortality disappeared. This supports
the clinical paradigm in which first low Grip strength is established, before ALMBMI is assessed. In
comparison with men of the same age who have normal muscle mass and strength, men with both
weakness and low lean mass had on average 2.5 times higher mortality hazard (age-adjusted HR =
2.50, CI95 = 1.30 – 4.79).
Our study was the first in community-dwelling European men, as can be deducted from Table 19,
which summarizes all studies to date in men examining the FNIH criteria as predictors of all-cause
mortality. Furthermore, the Merelbeke study has had the longest mortality follow-up and hence the
highest mortality rate by far. Prevalence of combined weakness and low muscle mass was in line
with rates reported by Woo et al. (116) and Hirani et al. (149).
A consideration regarding the concept of this study is that no comparisons of predictive accuracy
were made with other sarcopenia definitions. Due to the lack of data on Gait speed, most well-
recognized operational definitions could not be applied retrospectively to the Merelbeke database
without modifications.

Table 19. Studies examining the association of the FNIH criteria with mortality in men.
FIRST
AUTHOR, YEAR
COUNTRY N AGE RANGE
(MEAN ± SD), YEARS
RECRUITMENT [STUDY] FOLLOW-UP
MAX, YEARS MORTALITY
RATE FNIH CRITERIA PREVALENCE ASSOCIATION WITH
MORTALITY + AGE-ADJUSTED HR (CI95)
McLean,
2014 (52)
US 3006 ≥ 65
(73 ± 6)
Community-dwellers residing in six communities (community-based mailings and advertising) [Osteoporotic Fractures in Men study]
10 22% GS + ALM GS + ALMBMI GSBMI+ ALM
GSBMI+ ALMBMI
1% 1%
< 1% 2%
0.74 (0.24 – 2.32) 1.27 (0.65 – 2.46) 1.07 (0.34 – 3.33) 1.8 (1.21 – 2.68)
McLean,
2014 (52)
US 894 ≥ 76
(78 ± 3)
Community-dwellers residing in two towns (random sample of Medicare-eligible older adults) [Health, Aging, and Body Composition Study]
10 11% GS + ALM GS + ALMBMI GSBMI+ ALM
GSBMI+ ALMBMI
3% 3% 3% 6%
2.88 (1.33 – 6.22) 1.51 (0.61 – 3.71) 2.27 (0.99 – 5.22) 0.93 (0.43 – 2.01)
Woo,
2015 (116)
China 2000 ≥ 65
(72)
Community-dwellers recruited from notices in community centres for older adults and housing estates [MrOS (Hong Kong)]
10 25% GS + ALMBMI 8% *1.78 (1.23 – 2.59)
Hirani,
2015 (149)
Australia 1659 ≥ 70
(77)
Community-dwellers registered in one defined urban geographical region (Electoral Roll) [Concord Health and Ageing in Men Project]
7 – 9 31% GS + ALM 5% 1.54 (1.17 – 2.03)
De Buyser, 2016 (317)
Belgium 200 74 – 89
(79 ± 4)
Community-dwellers registered in one municipality (population register)
15 86% GS + ALM GS + ALMBMI GSBMI+ ALM
GSBMI+ ALMBMI
7% 6% 3% 7%
1.09 (0.61 – 1.94) 2.50 (1.30 – 4.79) 1.72 (0.75 – 3.97) 1.87 (1.07 – 3.26)
SD = Standard deviation, FNIH = Foundation for the National Institutes of Health, HR = Hazard ratio, CI95= 95% confidence interval, GS = Grip strength,
ALM = Appendicular lean mass, ALMBMI = Appendicular lean mass to Body mass index - ratio, BMI = Body mass index, S = Significant, NS = Not significant.

MAIN FINDINGS & CONTRIBUTIONS IN COMMUNITY-DWELLING OLDER MEN
4.1
141
4.1.3 PHYSICAL FUNCTION & MORTALITY
In Chapter 2.2, we evaluated and compared the RDRS-2 ADL, SF-36 Physical Function Index,
Grip strength, Standing balance, Chair rising, and Timed Up and Go for prediction of subsequent
15-year all-cause mortality in a well-described sample of apparently healthy community-dwelling
older men in Belgium. There was already evidence of associations between physical function and
all-cause mortality. However, with the exception of those for SF-36 Physical Function Index and
Grip strength, most studies had relatively short follow-up. Whether similar associations would be
found after participants were followed for longer than 10 years was unclear (120).
In the Merelbeke study population at baseline, over 75% of men obtained the best minimum value
on the first part of the RDRS-2, indicating no assistance was needed for ADL. Mean score on the
SF-36 Physical Function Index was 73 ± 24, which is quite high given subjects’ older age. Mean
Grip strength was 24.3 ± 7.9 kg, which is fairly low as it would indicate that weakness (< 26 kg
according to FNIH (50)) was present in about half of men (given the Gaussian distribution).
Although we must keep in mind that these results were obtained with a Smedley type dynamometer
as opposed to a Jamar® dynamometer. The majority of men were able to stand in three positions of
increasing difficulty, albeit the tandem stand could not always be held for 10.0 seconds with the
eyes closed. Mean performance at baseline on the Chair rising and Timed Up and Go tests was 13.8
± 4.7 and 12.2 ± 4.7 seconds, respectively.
All six physical function measurements were significantly associated with subsequent 15-year
mortality. With every improvement of 1 SD, mortality hazard decreased with 37% for ADL, 29%
for SF-36 Physical Function Index, 20% for Grip strength, 13% for Standing balance, 46% for
Chair rising, and 54% for Timed Up and Go (age-adjusted HRs). Models including the Timed Up
and Go test had the best fit and the highest decrease of mortality hazard with increasing
standardized physical function. Men who took over 12.5 seconds to complete the Timed Up and
Go test had over two times higher mortality hazard compared with similar aged men who
completed the test in under 10.0 seconds (age-adjusted HR = 2.09, CI95 = 1.53 – 2.85, P < 0.001).

Table 20. Studies examining the association of Rapid Disability Rating Scale-2 score (on activities of daily living) with
mortality.
FIRST AUTHOR, YEAR
COUNTRY N WOMEN AGE RANGE (MEAN ±
SD), YEARS RECRUITMENT FOLLOW-
UP MAX, YEARS
MORTALI
TY RATE ASSOCIATI
ON WITH
MORTALITY
Linn,
1982 (190)
US 845 0%
(68)
Patients transferred from a general medical
hospital to community nursing homes
0.5 33% S
Valizadeh,
2012 (318)
Iran 102 ≥ 50 In-patients consecutively admitted with low
trauma hip fracture
1 16% S
De Buyser,
2013 (222)
Belgium 352 0% 71 – 86
(76 ± 4)
Community-dwellers registered in one
municipality (population register)
15 78% S
Vilalte-Franch,
2013 (319)
Spain 491 71%
(75 ± 7)
Outpatients with probable Alzheimer’s disease
referred from public primary care to a memory
unit at a hospital
2.5 12% S
SD = Standard deviation, S = Significant.

MAIN FINDINGS & CONTRIBUTIONS IN COMMUNITY-DWELLING OLDER MEN
4.1
143
When examining the literature, we found to be the only population-based study in community-
dwelling older adults to have evaluated the first part of the RDRS-2 for prediction of mortality
(Table 20). Both in research and in clinical practice, the 6-item Katz ADL index is most commonly
used to assess functional status by observing difficulties in bathing, dressing, toilet use, transferring,
continence, and feeding. The first part of the RDRS-2 misses the item on continence, but contains
three additional activities, namely mobility, grooming, and practical tasks (such as managing money
and telephoning, which are considered to be more IADL). We believe an extended scale to asses
functional status with rating of perceived level of difficulty, might be more appropriate in healthy
community-dwelling older adults, who present high ceiling effects on basic ADL questionnaires
with limited response scale. In congruence, a study in community-dwelling older adults found that
extending the Katz index with items on IADL increases predictive validity towards hospitalization,
institutionalization, and death within one year (320).
The significant association of the SF-36 Physical Function Index with long-term mortality in our
study population contributes to the limited literature available in community-dwelling older
subjects not selected on the basis of a specific disease. Like our study, studies in population-based
samples of community-dwelling older persons found a significant association with 3-year mortality
(321,322).
Grip strength has been examined many times as predictor of mortality and it can be said that Grip
strength predicts future all-cause mortality across a range of populations (323). In community-
dwelling populations, a meta-analysis performed by Cooper et al. (120) found an unadjusted summary
HR per 1 kg increase of 0.97 (CI95 = 0.97 – 0.98) (14 studies), which is in line with our age-adjusted
HR of 0.97 (CI95 = 0.96 – 0.99). The large PURE study with median follow-up of four years found
a 37% increase in all-cause mortality hazard per SD reduction in Grip strength (251), which is higher
than our 20% increase. Our weaker association might be due to our longer follow-up (120).
Other studies on Standing balance, although not always measured in a comparable way, found
some evidence that poorer performance was associated (albeit not always significantly) with higher
mortality rates in community-dwelling older adults (120).
Studies examining the association of Chair rising time with all-cause mortality in community-
dwelling subjects aged 70 and over (5 studies, N = 28 036) found a significant difference in
mortality hazard between the lowest and highest quarter of performance (summary HR = 1.96, CI95
= 1.56 – 2.46) (120).

144
Other studies in community-dwelling subjects also found a significant association between Timed
Up and Go performance and mortality. Table 21 summarizes all studies to date examining Timed
Up and Go performance as predictor of all-cause mortality. Our study was first to be conducted in
Europe and to have long follow-up (and high mortality rate). After publication of our results, a
Scandinavian study with comparable follow-up time (14 years) and mortality rate (71%) reported a
very similar unadjusted HR of 1.10 per second increase (CI95 = 1.06 – 1.14) in community-dwelling
older women (324) (our age-adjusted HR for Timed Up and Go was 1.10, CI95 = 1.07 – 1.12).
While many studies have examined the association of physical function with mortality, few have
directly compared measurements. Cesari et al. (238) were first to compare several physical
performance measurements for prediction of subsequent 2-year mortality in community-dwellers
aged 80 years and over. Similarly, they found all tested physical function variables were able to
predict mortality. The Chair rising test was a stronger predictor over Grip strength and Standing
balance, Timed Up and Go was not assessed. Similarly, Arnau et al. (325) found the Chair rising test
in itself to be just as useful as the complete SPPB test to predict mortality in persons aged 70 years
and over without severe dependence. In contrast, Goldman et al. (326) found a stronger association
for Grip strength than Chair rising in community-dwelling older persons. However, their analyses
were adjusted for ADL which reflected lower extremity function; without adjustment the advantage
of Grip strength weakened. The stronger associations for Chair rising and Timed up and Go over
Grip strength and Standing balance, may perhaps be partially explained by the fact that these
former timed physical performance measurements require both lower limb strength and balance
(208,209).
Previous studies have questioned the extra value of physical performance tests in addition to self-
reported ADL or mobility limitations. In older persons with high self-reported function (no
disability), physical performance tests still detect wide variation in performance and can further
discriminate mortality hazard (206,284,326). The added value of physical performance measurements
among persons with ADL dependency is more controversial (284,326). From a reversed perspective,
Markides et al. (327) found adding ADL assessment to the SPPB test, did not have extra value for
prediction of 2-year mortality in community-dwelling older Mexican Americans.
A consideration regarding the concept of this study is that no comparisons could be made with
Gait speed. Indeed, as timed measurements of physical performance appeared to be most
predictive, it would have been interesting to have data on Gait speed at our disposal.

145
4.1
Table 21. Studies examining the association of Timed Up and Go performance with mortality.
FIRST
AUTHOR, YEAR
COUNTRY N WOMEN AGE RANGE
(MEAN ± SD), YEARS
RECRUITMENT [STUDY] FOLLOW-UP
MAX, YEARS MORTALITY
RATE ASSOCIA-
TION
Beloosesky, 2004 (328)
171 ≥ 60 Outpatients admitted to a geriatric rehabilitation day unit after inpatient rehabilitation of hip fracture
4 14% NS
Tice,
2006 (329)
US 17748 100%
≥ 55
(68 ± 6)
Community-dwellers living in 11 metropolitan areas (advertisements + population-based listings) [Breast and Bone Follow-up Study of the Fracture Intervention Trial]
9 11% S
Wong,
2008 (330)
Vancouver 147 53% ≥ 75
(84 ± 6)
Outpatients admitted to two acute care for elders-units at a teaching hospital
0.5 (post-discharge)
13% S
Hoshide,
2008 (244)
Japan 489 64%
≥ 80
(84 ± 5)
Outpatients from 25 institutions 6 15% S
Davis,
2011 (245)
Canada 1295 57%
70 – 105
(85 ± 7)
Community-dwellers from 36 study centres (community-sample via records of provincial health insurance plans or the Enumerated Composite record) [Canadian Study of Health and Aging (second wave)]
5 44% S *
De Buyser, 2013 (222)
Belgium 352 0% 71 – 86
(76 ± 4)
Community-dwellers registered in one municipality (population register)
15 78% S
Idland,
2013 (324)
Norway 300 100% ≥ 75
(81)
Community-dwellers from one community (random sample via census files)
14 71% S
Robinson,
2013 (331)
US 272 2% ≥ 65
(74 ± 6)
In-patients undergoing elective colorectal and cardiac operations
1 – 6 7% S
Roshanravan, 2013 (332)
US 362 16%
≥ 18
(61 ± 13)
Outpatients with chronic kidney disease not on dialysis
3 12% S
Ferrat,
2015 (333)
France 985 49% ≥ 70
(80 ± 6)
Out- and in-patients with newly diagnosed solid or hematologic malignancies, referred to two geriatric oncology clinics in teaching hospitals by specialists [ELPACA06]
1 41% S
SD = Standard deviation, S = Significant, NS = Not significant.
* Significant in analyses adjusted for age and sex, but not for frailty.

146
4.1.4 CHANGES IN PHYSICAL FUNCTION & MORTALITY
In Chapter 2.3, we evaluated 3-year changes in SF-36 Physical Function Index, Grip strength,
Chair rising, and Timed Up and Go for prediction of subsequent 15-year all-cause mortality in a
well-described sample of apparently healthy community-dwelling older men in Belgium. While
physical function is increasingly being used as outcome measure in clinical trials, evidence is needed
that changes in physical function will lead to relevant changes in clinical outcomes.
In a subsample of the Merelbeke study population, which only included men with reliable physical
function data at the second and fifth wave, median 3-year change (IQR) in SF-36 Physical Function
Index was -4.71 (-18.58 – +0.11) points, in Grip strength +0.25 (-4.02 – +2.23) kg, in Chair rising -
0.9 (-2.14 – +0.15) seconds, and in Timed Up and Go -0.02 (-1.18 – +1.22) seconds. A decline in
all physical function measurements was significantly associated with higher subsequent mortality
hazard. With every unit of greater 3-year decline, subsequent 7-year mortality hazard increased on
average with 2% for SF-36 Physical Function Index, 4% for Grip strength, 16% for Chair rising,
and 15% for Timed Up and Go (age- and baseline function-adjusted HRs). After seven years, a
time-attenuated effect became significant for change in SF-36 Physical Function Index, Grip
strength, and Chair rising, but not for change in Timed Up and Go. Interestingly, both baseline
function and closure function (at the fifth wave) remained significantly associated with mortality
when they were entered (separately) into a model including 3-year change in physical function,
indicating the robustness of single time-point physical function measurements.
Our study was one of the first in community-dwelling European older men, as can be deducted
from Table 22, which summarizes studies examining change in physical function as predictor of
all-cause mortality. Moreover, we were first to assess the impact of change in Timed Up and Go on
mortality. Furthermore, the Merelbeke study has had the longest mortality follow-up and highest
mortality rate by far.
A consideration regarding the concept of this study is that the observed changes in physical
function were not linked to any active intervention. In order to demonstrate that physical function
assessments can be used as surrogate end points of mortality hazard in clinical trials, interventional
trials with long follow-up are needed.

147 14
7
4.1
Table 22. Studies examining the association of change in physical function with mortality.
FIRST
AUTHOR, YEAR
COUNTRY N WOMEN AGE RANGE
(MEAN ±
SD), YEARS
RECRUITMENT [STUDY] PHYSICAL
FUNCTION
MEASUREMENT
ASSESSMENT OF
CHANGE FOLLOW-UP MAX,
YEARS
MORTALITY
RATE ASSOCIATION
Perera,
2005 (62)
US 439 44% ≥ 65 (73 ± 6)
Community-dwellers recruited from a veteran’s affairs hospital-based ambulatory care site and a Medicare health management organization serving a common geographic area; with MMSE > 16 and Gait speed between 0.2 and 1.3 m/s
Gait speed, SPPB, SF-36 Physical Function Index, ADL
Meaningful decline from baseline assessed quarterly within 1 year
5 20% S only for decline in Gait speed
Buchman,
2007 (65)
US 837 75% (81 ± 7)
Community-dwellers with one or more follow-up evaluations and without dementia [Rush Memory and Aging Project]
Composite measure of motor performance
Change estimated with 5 measuring points over 4 years, using OLS regression
2 (mean) 10% S
Hardy,
2007 (63)
US 439 44% ≥ 65 (74 ± 6)
Community-dwellers recruited from a veteran’s affairs hospital–based ambulatory care site and a Medicare health management organization serving a common geographic area; with MMSE > 16 and Gait speed between 0.2 and 1.3 m/s
Gait speed, SPPB, SF-36 Physical Function Index, ADL
Pattern of meaningful improvement from baseline assessed quarterly within 1 year (persistent, transient, or never)
8 43% S only for persistent improvement in Gait speed
Kroenke,
2008 (258)
US 40 337 100% 46 – 71 Nurses without serious illnesses or medical procedures [Nurses' Health Study]
SF-36 physical component summary score
Categories of 4-year delta change
4 2% S across categories of change
Otero-Rodriguez,
2010 (259)
Spain 2373 58% ≥ 60 Non-institutionalized older persons (population-based sample)
SF-36 physical component summary score
Categories of 2-year delta change
4 9% S for categories of decline

Table 22. Studies examining the association of change in physical function with mortality. [Continued]
FIRST
AUTHOR, YEAR
COUNTRY N WOMEN AGE RANGE
(MEAN ±
SD), YEARS
RECRUITMENT [STUDY] PHYSICAL
FUNCTION
MEASUREMENT
ASSESSMENT OF
CHANGE FOLLOW-UP MAX,
YEARS
MORTALITY
RATE ASSOCIATION
Hirsch,
2012 (66)
US 4182 52% ≥ 65
(79)
Older persons recruited from four communities (population-based sample) [Cardiovascular Health Study]
Gait speed, Chair rising, Grip strength
Quintiles of annual change estimated with 7 measuring points over 6 years, using linear mixed-effects models
7 46% S only for highest quintile of change (decline) in Grip strength
White,
2013 (260)
US 2158 52% 70 – 79
(74 ± 3)
Caucasian Medicare beneficiaries and black community-dwellers residing in and around two cities without mobility difficulty or terminal cancer (Random sample) [Health ABC study]
Gait speed Trajectory pattern of decline estimated with 3 measuring points over 2 years, using multinomial models (slow, moderate, and fast decline)
10 25% S only for fast decline
Sabia,
2014 (64)
France 2094 62% 65 – 85 (73 ± 5)
Community-dwellers sample registered in one city (electoral rolls) [3C Study]
Gait speed Annual change estimated with 2 measuring points over 4 years, using OLS regression
8 15% S for continuous change and for categories of substantial decline
De Buyser,
2016
Belgium 171 0% 71 – 86 (75 ± 3)
Community-dwellers registered in one municipality (population register)
SF-36 Physical Function Index, Grip strength Chair rising Timed Up and Go
Change estimated with 4 measuring points over 3 years, using OLS regression
15 87% S
SD = Standard deviation, MMSE = Mini-Mental State Examination, SPPB = Short Physical Performance Battery, SF-36 = Short Form-36, ADL = Activities of
daily living, ABC = Aging and Body Composition, OLS = Ordinary least-squares, S = Significant.

MAIN FINDINGS & CONTRIBUTIONS IN OLDER IN-PATIENTS
4.2
149
4.2 MAIN FINDINGS & CONTRIBUTIONS IN OLDER IN-PATIENTS
4.2.1 PHYSICAL FUNCTION & HOSPITAL OUTCOMES
In Chapter 3.1 we identified factors related to older patients’ clinical, nutritional, functional and
socio-demographic profiles, which can predict LoS, in-hospital mortality, and institutionalization in
a sample of in-patients admitted to acute care. Most studies on hospital outcomes of older patients
so far have relied on routinely collected data such as age, gender, and clinical diagnosis. However
multifaceted aspects such as functional status and physical performance, which are rarely
considered in clinical research, need to be taken into account as well (266).
In the CRIME study population, 22% of patients were dependent in six ADL, 54% were unable to
perform Gait speed, and 27% were unable to perform Grip strength at admission. Both Gait speed
and ADL provided prognostic information on LoS according to initial analyses. When both were
simultaneously entered into a forward selection multivariate regression model, only Gait speed
category (unable, < 0.8 m/s, or ≥ 0.8 m/s) was kept into the model as one of the independent
predictors. Regarding factors predictive of in-hospital mortality, all three physical function
measurements were significantly associated in initial analyses, albeit Gait speed and Grip strength
had to be dichotomized into able / unable because very few subjects who died in-hospital, could
perform these tests at admission. Subsequent forward selection multivariate regression retained
ADL total dependency and Grip strength inability as independent predictors. Likewise, all three
physical function measurements were significantly associated with new institutionalization in initial
analyses; but only ADL total dependency was retained in the final adjusted model.
Some studies reporting on the association of physical function with hospital outcome in older in-
patients admitted to acute care are described in Table 23. Table 24 helps envisage the frequency
and consistency of associations between either reported or performance-based physical function
measures and LoS, mortality, and institutionalization, which have been reported previously.
Regarding predictors of LoS, both reported and performance-based physical function measures
have been investigated. While performance-based measures of physical function were consistently
associated with LoS, associations of reported measures of physical function were less persistent.
Regarding predictors of mortality and institutionalization, almost exclusively reported measures of
ADL or IADL have been investigated.

150
In the CRIME study population, in-hospital mortality and institutionalization seemed to occur
almost entirely in subjects at the lowest end of the physical performance spectrum, namely in those
unable to perform the tests. In these patients, ADL score could further distinguish a gradient risk
for in-hospital mortality and institutionalization.
A consideration regarding the concept of this study might relate to the available data on mortality
after discharge, which were not taken into account in the analysis. These data were used for related
research on EWGSOP sarcopenia, which was associated with both in-hospital mortality and
mortality in the year after discharge in the CRIME study (123).

151
4.2
Table 23. Some studies on the association of physical function with hospital outcome in older in-patients admitted to acute
care.
FIRST
AUTHOR, YEAR
COUNTRY N WOMEN AGE RANGE
(MEAN ± SD), YEARS
RECRUITMENT [STUDY] PHYSICAL FUNCTION
MEASUREMENT HOSPITAL OUTCOME
(% OR MEDIAN OR MEAN ± SD)
Covinsky,
1997 (315)
US 823 68% ≥ 70
(81)
Medical in-patients at a general medical service of a teaching hospital
6 ADL items: dependent in all 6 ADL (24%) vs. dependent in 0 ADL (26%) at admission
Mortality in-hospital (7%) Mortality within 1 year (32%) Institutionalization to a nursing home within 90 days (17%)
Inouye,
1998 (293)
US 207 59% ≥ 70
(79 ± 6)
In-patients consecutively admitted to six general medicine (non-intensive care) floors of a university teaching hospital
7 ADL items referent to two weeks prior to admission: any impairment (39%) 7 IADL items referent to two weeks prior to admission: any impairment (65%)
Mortality within 90 days (14%) Mortality within 2 years (39%)
Alarcón,
1999 (265)
Spain 353 66%
(82 ± 7)
In-patients admitted to an acute geriatric ward
Barthel index at admission Red Cross Hospital Functional Disability Scale at admission
LoS prolonged > 28 days (9%) Mortality in-hospital (11%) Institutionalization (3%)
Di Iorio,
1999 (334)
Italy 402 54% ≥ 65
(81)
In-patients consecutively admitted to four acute geriatric care units for at least four days
Katz index at admission
(2.2 ± 2.9 – 3.1 ± 3.3) Lawton scale at admission
(3.2 ± 2.2 – 4.0 ± 2.1) Ability to perform six performance tests prior to discharge
(4.2 ± 1.3 – 4.9 ± 1.4)
LoS (9.4 ± 3.3 days – 14.1 ± 7.2 days)
Campbell,
2005 (275)
Europe 1626 58% ≥ 65
(74)
Non-elective medical in-patients from eight centres in six European countries
Barthel index at day 3: score 0 – 9 (23%) vs. score 16 – 20 (50%)
LoS (12 days) Mortality in-hospital (9%) Institutionalization (6%)
Purser,
2005 (279)
US 1388 2% ≥ 65
(74 ± 6)
Medical or surgical in-patients from eleven Veteran Affairs Medical Centres
Gait speed at admission (0.5 ± 0.2 m/s) (only 26% completed the test in 90seconds or less)
LoS (10.1 days)

Table 23. Some studies on the association of physical function with hospital outcome in older in-patients admitted to acute
care. [Continued]
FIRST
AUTHOR, YEAR
COUNTRY N WOMEN AGE RANGE
(MEAN ± SD), YEARS
RECRUITMENT [STUDY] PHYSICAL FUNCTION
MEASUREMENT HOSPITAL OUTCOME
(% OR MEDIAN OR MEAN ± SD)
Gan,
2006 (278)
Australia 2463 61%
(82 ± 8)
In-patients consecutively admitted to a multidisciplinary acute care unit for frail older people
Timed Up and Go time at admission (28 s) Timed Up and Go ability at admission (38%)
LoS (8 – 11 days)
Kerr,
2006 (263)
US 110 57% 75 – 101
(84)
In-patients admitted to a Medical Admissions Unit (clinical setting not surgical) at Southampton University Hospitals NHS Trust
Grip strength at admission (median 29 kg for men, 16 kg for women): < 25 kg in men and < 15 kg in women vs. > 31 kg in men and > 18 kg in women Barthel index at admission
LoS from admission until discharge to usual residence (9 days)
Lang,
2006 (277)
France 908 64% ≥ 75
(84 ± 6)
In-patients hospitalized through an emergency department in any medical ward except an Acute Care for elders unit at nine hospitals
5 ADL items referent to 2 weeks before admission (32% with at least 3 impairments) 5 ADL items referent to inclusion between the 4th and 7th day (69% with at least 3 impairments) Timed Get Up and Go: walking difficulty between the 4th and 7th day (82%) One-leg-balance: risk of fall between the 4th and 7th day (52%)
LoS prolonged > 30 days (15%) Los prolonged > f-DRG adjusted limit (5%)
Carpenter,
2007 (335)
England 1942 55%
(74)
In-patients consecutively admitted from the emergency department with one or more of the following conditions: stroke, fracture neck of femur, myocardial infarction, acute respiratory infection, COPD, and falls
ADL Hierarchy Scale based on four ADL items: not dependent (12%) vs. dependent in 1 – 3 ADL (22%) and dependent in 4 – 6 ADL (66%) at admission
LoS (observed minus predicted)

153
4.2
Table 23. Some studies on the association of physical function with hospital outcome in older in-patients admitted to acute
care. [Continued]
FIRST
AUTHOR, YEAR
COUNTRY N WOMEN AGE RANGE
(MEAN ± SD), YEARS
RECRUITMENT [STUDY] PHYSICAL FUNCTION
MEASUREMENT HOSPITAL OUTCOME
(% OR MEDIAN OR MEAN ± SD)
Volpato,
2008 (267)
Italy 92 49% 65 – 94
(78)
In-patients who were able to walk and had an MMSE ≥ 18, admitted to the section of internal medicine and geriatrics at one university hospital with a clinical diagnosis of congestive heart failure, COPD, pneumonia, and minor stroke.
SPPB at admission (6.0 ± 2.7): score 0 – 4 vs. score 8 – 12 Katz index referent to admission: any difficulty (53%)
LoS (9.8 ± 4.8 days)
Matzen,
2012 (336)
Denmark 4527 64% ≥ 65
(82 ± 7)
In-patients admitted to an acute geriatric unit at a university hospital
Barthel index at admission: score 80 – 100 vs. score 0 – 24, score 25 – 49 and score 50 – 79
Mortality in-hospital (8%) Mortality within 12 months (55%)
Ostir,
2012 (196)
US 322 64% ≥ 65
(76 ± 7)
In-patients admitted to an ACE hospital unit at a university teaching hospital
Gait speed at admission: ≥ 0.6 m/s (22%) vs. < 0.40 m/s (21%) and unable to complete (64%)
7 ADL items at admission: no disability vs. 1 – 2 disabilities, 3 – 4 disabilities, and ≥ 5 disabilities
LoS (4.1 ± 3.8 days)
Home discharge (83%)
De Buyser,
2014 (337)
Italy 1123 56% ≥ 65
(81 ± 7)
In-patients consecutively admitted to geriatric and internal medicine acute care wards of seven hospitals
Gait speed at admission: ≥ 0.8 m/s (12%) vs. < 0.8 m/s (34%) and unable (54%) Grip strength admission: able vs. unable (27%) 6 ADL items referent to preceding 2 weeks: total dependency (22%)
LoS (10 days) Mortality in-hospital (4%) Institutionalization at discharge (3%)
SD = Standard deviation, ADL = Activities of daily living, IADL = Instrumental activities of daily living, LoS = Length of hospital stay, DRG = Diagnosis-related group, COPD = Chronic obstructive pulmonary disease, MMSE = Mini-Mental State Examination, ACE = Acute care for elderly, SPPB = Short Physical Performance Battery.

Table 24. Association of physical function with hospital outcome in older in-patients admitted to acute care.
OUTCOME → LENGTH OF HOSPITAL STAY MORTALITY DISCHARGE DESTINATION
ASSOCIATION → SIGNIFICANT NS SIGNIFICANT NS SIGNIFICANT NS
PREDICTOR ↓
REPORTED MEASURES
ADL – prior to admission (277) (337) (337) (293) (337)
ADL (265) (263) (335) (196) (277) (267) (334) (265) (315) (336) (196) (315)
ADL – at day 3 (275) (275) (275)
IADL – prior to admission (293)
IADL (334)
Functional Disability scale (265) (265) (265)
PERFORMANCE-BASED MEASURES
Gait speed score (196) (279) (337) (196)
Timed Up and Go score (278)
Timed Up and Go difficulty – between day 4 and 7 (277)
One-Leg-balance score – between day 4 and 7 (277)
SPPB score (267)
Gait speed ability (196) (337) (337) (196) (337)
Timed Up and Go ability (278)
Ability to perform 6 tests – prior to discharge (334)
Grip strength ability (263) (337) (337) (337)
All measurement are referent to admission, unless otherwise stated. Significance of the association with most adjustments was used.
ADL = Activities of daily living, IADL = Instrumental activities of daily living, NS = Not significant.

MAIN FINDINGS & CONTRIBUTIONS IN OLDER IN-PATIENTS
155
4.2 4.2.2 FUNCTIONAL CHANGES DURING HOSPITAL STAY
In Chapter 3.2 we examined functional changes during hospital stay in older patients admitted to
geriatric or internal medicine acute care wards. While previous studies almost exclusively assessed
functional changes via ADL questionnaires, our study also examined changes in Gait speed and
Grip strength. Additionally, we investigated characteristics of older patients that were associated
with meaningful in-hospital improvement in physical performance.
In a subsample of the CRIME study population, which only included patients with an MMSE ≥ 18,
we found that at least half of in-patients were dependent in one or more ADL two weeks before
admission. On average, functional status did not change, since at discharge 91% of patients
obtained the same score as pre-admission. On admission, 36% of patients were unable to perform
Gait speed and 12% could not execute Grip strength. Mean physical performance improved
significantly in-hospital, however this improvement was only meaningful (≥ 1 SD) in 10% and 7%
of patients for Gait speed and Grip strength, respectively. Meaningful improvement in
performance was most common in subjects who were unable to perform the particular test at
admission, nevertheless discharge performance was still very low compared with patients who were
able to perform the respective test at admission. In addition, patients admitted from the emergency
room were more likely to improve their performance than electively admitted patients. This
perhaps could be attributed to the pre-hospital decline (297,338) and subsequent functional recovery
trajectory of some ER patients, while electively admitted patients are less likely to have declined
before admission. Finally, the odds of improvement also decreased with older age (298).
Some studies reporting functional changes of older in-patients are described in Table 25. In-
hospital functional improvement was nearly always more prevalent than decline. In fact, functional
decline is reported most commonly in the weeks prior to admission, probably due to patients’ acute
illness. The functional recovery trajectory continues after discharge, although not all patients
eventually regain the same level of function as reported two weeks before admission. Studies with
follow-up after discharge still found declined ADL from preadmission in 41 – 49% of patients after
one month (339,340) and in 12% after three months (341). Follow-up studies on physical performance
could detect further improvement from hospital discharge after one year (279), but not after merely
one month (306). Although practically more challenging than ADL follow-up by telephone, it would
be interesting to further explore this recovery of physical performance after discharge.
Nevertheless, the functional changes occurring in hospital only have shown to have predictive

156
value towards adverse health risks. The lack of function regain during hospitalization was found to
be associated with greater risk for nursing home admission within one month after discharge (305)
and higher mortality rate at three months (299).
A consideration regarding the concept of this study is that these in-hospital changes have not been
linked to adverse outcomes at hospital discharge. Very few mortality and institutionalization events
occurred in this subsample of the CRIME study population.

157
4.2
Table 25. Functional changes of older in-patients.
FIRST
AUTHOR,
YEAR
COUNTRY N WOMEN AGE RANGE
(MEAN ± SD),
YEARS
RECRUITMENT PHYSICAL
FUNCTION
MEASUREMENT
FUNCTIONAL DECLINE FUNCTIONAL
IMPROVEMENT
PRE-HOSPITAL
IN-HOSPITAL IN-HOSPITAL
Fortinsky,
1999 (305)
US 551 66% ≥ 70
(80)
General medical in-patients admitted to a teaching hospital
5 ADL items 39% 15 – 28% 26 – 71%
Blè,
2003 (302)
Italy 65 48% ≥ 65
(75 ± 5)
In-patients admitted to the internal medicine department of a university hospital; who were not mobility disable
Barthel index items on mobility
34%
Covinsky,
2003 (298)
US 2293 64% ≥ 70
(79.5)
Medical in-patients nonelectively admitted to the general medical services of two hospitals; who were not totally dependent pre-admission
5 ADL items 43% 17% 20 – 65%
Brown,
2004 (304)
US 474 56% ≥ 70
(79 ± 6)
In-patients consecutively admitted to the medicine service at a teaching hospital; who were not totally dependent at admission
5 non-mobility ADL
29%
Bautmans,
2005 (307)
Belgium 63 67%
(84 ± 6)
In-patients consecutively admitted at the geriatric ward of an academic hospital
Grip strength NS
Purser,
2005 (279)
US 1388 2% ≥ 65
(74 ± 6)
Medical or surgical In-patients in a Department of Veterans Affairs, who were designated as frail
Gait speed S
Volpato,
2008 (267)
Italy 92 49% 65 – 94
(78)
In-patients admitted to the section of internal medicine and geriatrics at one university hospital; who were able to walk and had an MMSE ≥ 18, presenting with a clinical diagnosis of congestive heart failure, chronic obstructive pulmonary disease, pneumonia, or minor stroke.
SPPB 20% 63%

Table 25. Functional changes of older in-patients. [Continued]
FIRST
AUTHOR,
YEAR
COUNTRY N WOMEN AGE RANGE
(MEAN ± SD),
YEARS
RECRUITMENT PHYSICAL
FUNCTION
MEASUREMENT
FUNCTIONAL DECLINE FUNCTIONAL
IMPROVEMENT
PRE-HOSPITAL
IN-HOSPITAL IN-HOSPITAL
Corsonello,
2009 (303)
Italy 506 54% ≥ 65
(80 ± 6)
In-patients consecutively admitted to 11 acute care medical wards
7 ADL items 11% 10%
Sleiman,
2009 (299)
Italy 1119 60%
(81 ± 8)
In-patients admitted to the high dependency area of an acute geriatric ward, who presented functional changes during hospitalization
Barthel index ≥ 61% 66%
Palleschi,
2011 (297)
Italy 1048 55% ≥ 65
(80 ± 8)
In-patients consecutively admitted to acute care geriatric and general medicine units of five hospitals
Barthel index 44% 1% ≥ 26%
29%
Zisberg,
2011 (339)
Israel 525 50% ≥ 70
(79 ± 6)
In-patients non-electively admitted to one of five general medical units of a tertiary care teaching hospital, who were not disable
Modified Barthel Index
50% ≥ 4%
46%
Merino Martín,
2012 (341)
Spain 186 41% 65 – 100
(76 ± 7)
Medical and surgical in-patients admitted (electively or through the ER) to a public teaching hospital
Katz index Lawton's scale
17% 25%
Bodilsen,
2013 (306)
Denmark 33 46% ≥ 65
(83 ± 8)
Inpatient admitted to a university hospital for an acute medical illness, able to walk (random sample)
Grip strength Timed Up and Go
NS S
De Buyser,
2014 (268)
Italy 639 52% 65 – 98
(79 ± 7)
In-patients consecutively admitted to geriatric and internal medicine acute care wards of seven hospitals, who had an MMSE ≥ 18
ADL
Grip strength Gait speed
3%
S 7%
S 10%
Palleschi,
2014 (338)
Italy 1281 54% ≥ 65
(85 ± 8)
In-patients consecutively admitted to acute care geriatric and general medicine units of five hospitals
Barthel index 42%
SD = Standard deviation, ADL = Activities of daily living, SPPB = Short Physical Performance Battery, MMSE = Mini-Mental State Examination.

IMPLICATIONS & PERSPECTIVES
4.3
159
4.3 IMPLICATIONS & PERSPECTIVES
4.3.1 PHYSICAL FUNCTION & ITS PURPOSE
As predictor of mortality and adverse health outcomes
Our findings from Chapter 2 indicate that the SOF index for frailty, the FNIH criteria for
weakness and low muscle mass, and assessments of physical function (RDRS-2 ADL, SF-36
Physical Function Index, Grip strength, Standing balance, Chair rising, and Timed Up and Go) can
be used as predictors of mortality and adverse health outcomes in a Caucasian male older
community-dwelling population. Equally, physical function assessments (Gait speed, Grip strength,
and ADL) can also predict hospital risks of an older population admitted to acute care (Chapter
3.1). In this respect, physical function (related) assessments can be used to characterize older adults
in primary care or older participants in research manuscripts. Further research might focus on
health risks other than mortality and hospital outcome. Associations with disability (342) and health-
related quality of life (59,343) have already been established.
While the above mentioned associations with mortality relate to assessments at a single point in
time, our findings from Chapter 2.3 and Chapter 3.2 indicate that physical function has a dynamic
nature, hence reassessment of physical function over time might be warranted and informative. In
healthy community-dwelling older men, reassessment every few years can help predict mortality
risk more accurately than single baseline assessment (Chapter 2.3). In hospitalized older patients,
reassessment at discharge can already show meaningful improvement from admission (Chapter
3.2). Evidence that improvement in physical function during hospital stay can predict hospital outcome
is currently limited to improvement in ADL. Functional improvement during hospital stay according to
the Barthel index has been associated with shorter LoS (297), functional recovery (regaining the same
levels of functioning as those reported two weeks prior to hospital admission)(340), and lower 1-year
mortality (344). Correspondingly, lack of function regain during hospitalization has been associated
with greater risk for nursing home admission within 30 days following discharge (305) and higher
mortality rate at 1, 3, 6, and 12 months (299,345). A related implication is that further research aiming
to investigate independent associations with mortality in community-dwelling older men should
control for frailty or sarcopenic status, or physical function. Likewise, studies examining
independent associations with hospital outcome of acutely ill older adults should take into account
physical function at admission or pre-admission. Future research might revise our found
associations in samples of populations with very specific diseases, although geriatric research and

160
clinical practice tends not to focus on single diseases but rather on reflections of overall health
status.
As estimate for frailty and sarcopenia prevalence
Findings from Chapter 2.1 indicate that sarcopenia (3 – 8%) and frailty (7%) are quite prevalent in
apparently healthy older community-dwelling men. These estimates may even be underestimated, as
non-participants are likely to have worse physical function.
As target definer for interventions
Chapter 2 illustrates how the SOF frailty index, FNIH criteria, and physical function assessments
can be used as screening tools to identify community-dwelling older men at higher risk of mortality
and therefore in need of intervention. Previously the SPPB test (0 – 12) has been used to target
subjects for the Lifestyle Interventions and Independence for Elders study by excluding those with
scores above nine (346). Recent studies have indicated physical function assessments can also help
select subjects who would most likely benefit from intervention. However, this needs further
research. While mobile subjects with poorer function at baseline (SPPB score < 8) have shown
greater beneficial effects of exercise training (346), this has also been found for subjects with
moderate frailty as opposed to severe frailty and/or disability (347). The contrast might indicate there
is a window for level of physical function in which interventions are most beneficial.
Similar as in ambulatory setting, assessment of physical function in acutely ill older in-patients at
hospital admission can help target populations in need of hospital models of care (Chapter 3.1).
Several methods have been established to help prevent functional decline of older hospitalized
patients and to improve their hospital outcome. Most approaches start with assessment of older
patients’ function and risks for functional loss to determine if they are eligible for the program.
Gait speed and Grip strength can be used to evaluate a patient’s physical function during hospital
stay and to identify those patients who are in need of comprehensive geriatric assessment or
exercise training (more details on hospital models of care can be found in Chapter 4.3.3).
As outcome measure in interventions
Results from Chapter 2.3 support the use of physical function assessments to evaluate the
effectiveness of geriatric interventions, as they demonstrate how decline in physical function has an
impact on mortality. Given the observed time-dependent effect, future large randomized controlled
trials with long follow-up of both physical function and mortality outcome are needed to further

IMPLICATIONS & PERSPECTIVES
4.3
161
validate physical function as outcome measure in interventions. Further research should examine
how counteracting decline in physical function has an impact on health risks in older persons.
4.3.2 PHYSICAL FUNCTION & ITS NUMEROUS OPERATIONAL DEFINITIONS
On the one hand, there is a need for one standard assessment of physical function to be
implemented across studies, to allow more accurate comparison of study populations. On the other
hand, there is no single assessment that will be feasible in all settings, nor will it suit all purposes.
When deciding how to assess physical function, consideration should be given to the intended
purpose, clinimetric properties, and practical issues (109,110,124).
The intended purpose will largely determine which assessment tools are appropriate to use. When
the main goal is to classify persons at risk of adverse health outcomes, assessment tools with an
ordinal or even dichotomous scoring system can be used (110). Likewise, classifying older persons as
frail vs. non-frail or sarcopenic vs. non-sarcopenic is useful to estimate the prevalence of frailty and
sarcopenia, respectively (110). However, purposes such as guiding clinical decision making or
evaluating the impact of an intervention will benefit from assessments that address physical
function, frailty and sarcopenia as a dynamic process (110). These latter assessments should enable
early detection of small declines and hence foster prevention rather than treatment. When
screening patients for inclusion/exclusion into a study, assessments that can identify a window
within the functional spectrum might help target populations in which interventions are most
beneficial. Finally, when the purpose is to understand the etiology behind frailty, it is important the
instrument does not include disability or comorbidity (109).
Clinimetric properties should also be taken into account when selecting a physical function
assessment. Obviously predictive validity will be important when the primary purpose is to identify
older persons at risk. Likewise responsiveness will be pivotal when the assessment is used to
evaluate the impact of an intervention. Further attention needs to be paid to the feasibility of
assessments and their floor- and ceiling effects, because assessments may not cover the whole
functional spectrum within older persons.
Finally, practical issues also need to be taken into consideration when selecting an assessment.
Feasibility may be considered as one of these issues, as well as restraints related to time, costs,
resources, and space.

162
All physical function (related) assessments examined in the Merelbeke study have supported their
use as predictors of mortality. Their clinimetric properties have been described in Chapter 1.5.1.
Nevertheless, they also come with some practical considerations. Both the SOF frailty index and
the FNIH criteria come with the advantage that they do not further require the establishment of a
reference population. This is not the case for some other well-recognised frailty and sarcopenia
instruments, such as the Fried and EWGSOP criteria. Optimal cutoff points for most of our
examined measures of physical function still need to be established. In our study population, 12.5
seconds has shown to be a successful cutoff point to identify limited Timed Up and Go
performance associated with mortality. Nevertheless, future research might truly focus on
identifying cutoff points of physical function that can distinguish low levels of function associated
with mortality and other adverse health risks, such as mobility limitation. Reported and timed
physical function measurements and also the SOF frailty index do not require any special
equipment, whilst inter-instrument variability can influence Grip strength and the FNIH criteria.
On the other hand, environmental differences may influence reported physical function
measurements including the SOF question on low energy-level. The FNIH criterion for low muscle
mass is more expensive to assess, since DXA is not refunded for sarcopenia indications.
In light of the reflections above the SPPB test, which was regretfully not assessed in the Merelbeke
study, might be a suitable assessment tool in community-dwelling older persons for several
purposes (risk prediction, evaluation of interventions, target selection), as it has predictive validity
with regards to mortality (348), is responsive to change (348), and can identify subpopulations in
whom interventions are most beneficial (346). Floor effects have been reported in 0 – 7% and ceiling
effects in 2 – 16% (348). However, it was found that in older adults with impaired mobility and at
least 1 ADL dependency (who already have increased mortality risk), SPPB cannot further
distinguish mortality risk (284).
4.3.3 PHYSICAL FUNCTION & ITS INTERVENTIONS
Interventions in older adults
Therapeutic approaches have been proposed to slow down or even inverse the loss of physical
function in older adults. These targeted interventions are mainly focused on exercise, nutrition, and
pharmacological agents.
Exercise is believed to be the most effective intervention to improve physical function of older
adults. In non-hospitalized older adults, most evidence has been gathered for progressive resistance

IMPLICATIONS & PERSPECTIVES
4.3
163
training by a Cochrane review of 121 randomized controlled trials (60). Progressive resistance
training has a small but significant effect on improving physical (dis)ability, a small to moderate
effect on decreasing some functional limitations, and a large effect on increasing strength.
Regarding outcomes related to our research, progressive resistance training leads to a significant
improvement of Timed Up and Go and Chair rising time, but not to any difference in disability
according to the SF-36 Physical Function Index. A meta-analysis on supervised whole-body
resistance training (for at least eight weeks) has found a robust association with increased lean body
mass in adults ≥ 50 years, with volume of training (defined as number of sets per session) and age
as important predictors of effectiveness. Higher volume interventions are associated with greater
increases in muscle mass, while older persons experience less gain (349). In frail older adults,
according to reviews, exercise interventions improve muscle strength and physical performance,
but not always muscle mass (147,347). Systematic reviews of randomized controlled trials find
multicomponent exercise interventions to be most effective for improvement of mobility, balance,
and strength (350,351). Superior outcomes are obtained with multicomponent training interventions of
long duration (≥ 5 months), performed three times per week, for 30 – 45 minutes per session (350).
Limited evidence is currently available for nutritional interventions. A Cochrane review found no
evidence of functional benefit with oral protein and energy supplementation in older people (352).
Although some positive effects are reported in malnourished older patients (353). Moderate evidence
was found for vitamin D supplements in older persons, which have a positive effect on lower limb
muscle strength; especially in persons with 25(OH)-vitamin D levels below 30 nmol/L (354). Both in
frail and in sarcopenic older persons, current recommendations include correcting vitamin D
insufficiency and optimizing protein intake (355,356). Recommended daily intake of vitamin D for
older adults is at least 800 to 1000 IU. Recommended average daily protein intake for healthy older
people lies in the range of 1.0 to 1.2 g protein per kilogram of body weight to help maintain and
regain lean body mass and function. Higher protein intake is advised for older persons who are
exercising and otherwise active, and for those with acute or chronic diseases (except with severe
kidney disease and no dialysis) (353). Further research still needs to establish recommendations
regarding protein quality and timing of ingestion (353,357). Novel nutrition strategies, which are under
development, include β-hydroxy β-methylbutyrate, omega-3 fatty acids, and ursolic acid (357,358).
At the moment, there is no consistent evidence to combine exercise training with dietary
supplementation (359). However, some trials have shown enhanced benefits, hence there might be
potential for future interventions (359,360). Creatine for instance, has a positive effect on muscle mass
and strength when combined with exercise training (357,359).

164
To date insufficient evidence has been found for recommending pharmacological treatment (355,361),
perhaps with the exception of testosterone treatment. Testosterone replacement therapy in older
men produces a moderate increase in muscle strength (362), but might also be associated with
increased prostate and cardiovascular events (363–365). Testosterone supplements may be considered
in men with repeated low serum testosterone and consistent signs and symptoms of androgen
deficiency (366,367). Growth hormone administration, which is associated with adverse events related
to fluid retention, arthralgia, carpal tunnel syndrome, and gynaecomastia, cannot be recommended
in older people, except in conditions with growth hormone deficiency (361,368). Growth hormone
secretagogues may increase absolute lean body mass and potentially improve physical function in
frail older persons. However, only short-term studies have been performed and these reported
frequent side effects such as increased appetite, insomnia, mild lower extremity oedema and muscle
pain (369,370). A promising treatment may be with angiotensin-converting enzyme inhibitors, which
are currently used in cardiovascular prevention, but also have some evidence for improved physical
function (361,371). Compounds currently under development are myostatin antagonists such as
bimagrumab, and nonsteroidal selective androgen receptor modulators (372,373).
Hospital models of careRegarding the several programs developed for improving hospitalized care
for older adults, the strongest evidence for reducing decline has been found for Acute Care for the
Elderly (ACE) units (374). This model of care typically includes a specifically designed environment
that is friendlier to older adults, patient-centred care, early discharge planning with follow-up, and
review of medical care. ACE units use geriatric assessment and multidisciplinary teams to deliver
acute medical care while targeting interventions to maintain function (374). A meta-analysis found
older people admitted to acute geriatric units to have lower risk of functional decline at discharge
and higher likelihood to live at home after discharge compared with older people admitted to
conventional care units (344). In-patient comprehensive geriatric assessment can be delivered in such
ACE unit or in a general ward setting by a mobile team. However, a meta-analysis revealed positive
effects of comprehensive geriatric assessment on survival and living at home after twelve months,
only when delivered in a designated ward and not by a mobile team (375). However, when
comprehensive geriatric assessment performed by a mobile team was followed by transfer to
geriatric wards or case-management, LoS has shown to decrease (pre vs. post) (376). Other
approaches have focused on geriatric resource nurse models (374) (where primary nurses and unit-
based resource nurses are trained to become geriatric resource nurses), volunteer programs (377)
(where trained volunteers carry out therapeutic activities, nutritional assistance, or physical activities
with patients), transitional care models (378,379) (with comprehensive discharge planning,

IMPLICATIONS & PERSPECTIVES
4.3
165
coordination of services and agencies, and education of patients), and exercise programs. Exercise
programs can improve physical function, with no increase of adverse events during acute
hospitalization (380,381). Albeit hospitalized frail older adults do not seem to benefit from exercise to
the same extent as do community-dwelling older adults (350). Multidisciplinary programs including
an exercise component may also improve hospital outcomes, such as LoS and home discharge
(380,381).
4.3.4 PHYSICAL FUNCTION & THE OLDER INDIVIDUAL
In this doctoral thesis, most effect measures were presented as HRs, ORs, and regression
coefficients, which reflect relative risk. To assess the probability that an older individual at an initial
age a will experience a certain health risk or death in the subsequent interval [a, t] (382) absolute risk
models, however, are needed. A variety of metrics can be used to evaluate models of absolute risk.
Widely used classes of criteria are calibration, discrimination, accuracy, and proportion of variation
explained. Although we have not reported measures of calibration (or goodness-of-fit of the
models), we have occasionally described the other criteria.
For instance in Chapter 2.1, we have measured discrimination with the concordance statistic and
accuracy with positive and negative predictive values. While our HRs indicate an association of
frailty and sarcopenia with mortality, this does not necessarily imply that frailty and sarcopenia can
discriminate between older persons likely to die within three or nine years and those who do not.
Therefore, concordance statistics were computed to measure the discriminatory power of age and
frailty or sarcopenia (AUCs > 0.67). The reported positive and negative predictive values reflect
how accurately frailty and sarcopenia classify death within three and nine years. While men without
weakness and low muscle mass as well as robust men are likely (> 85%) to stay a live within the
next three years; men with weakness and low muscle mass as do frail men are likely to die within
the next nine years (> 80%).
In Chapter 3.1, our multivariate models could explain 28.5% and 32.9% of the variability of in-
hospital mortality and institutionalization risk, respectively.

166
4.3.5 PHYSICAL FUNCTION & ITS FUTURE
Increasing popularity of the SPPB test may be anticipated, as it is currently being used as an
outcome measure in several large-scale projects on interventions in frailty (383) and sarcopenia (384).
Furthermore, there has been a growing interest in muscle quality. With age, fat in the muscle
increases and influences the muscle’s metabolic and contractile function (myosteatosis). It could be
expected that future definitions of sarcopenia will include fat-adjusted estimates of ALM.

METHODOLOGICAL CONSIDERATIONS
4.4
167
4.4 METHODOLOGICAL CONSIDERATIONS
4.4.1 MERELBEKE STUDY
Representativeness & external validity
The entire older male population of Merelbeke was considered for longitudinal assessment in the
Merelbeke study. This population-based cohort study design added to the representativeness of the
sample studied and external validity of the associations found. Representativeness was further
supported by the wide eligibility criteria for inclusion (which were age between 70 and 85 years old
and willingness to participate) and the stability of the cohort on follow-up. Follow-up on survival
status until 2015 was 99% complete, only three subjects could last be contacted in 2010. Follow-up
rates were 75% at the second visit and 59% at the fifth visit (76% when excluding the 68 subjects
who deceased). Therefore, results from Chapter 2.3 might be influenced by selection bias, since
only subjects who participated in both the second and fifth visit could be included in the analyses.
Representativeness might be influenced by our initial participation rate of 47%. Although this rate
is in accordance with other population-based studies (226), it is unfortunate that no clinical data are
available for the men who declined to participate. It is not unlikely that these non-participating men
had higher mortality rates than our participants (227), thereby introducing some selection bias.
Having a representative study sample allowed for estimation of prevalence rates in older,
community-dwelling Belgian men. In this respect our prevalence of SOF frailty and FNIH
sarcopenia corresponded with those reported in other population-based studies in community-
dwelling older persons. Even more important, our mortality rate corresponded with that of Belgian
older men (Figure 19). In 2014, cumulative mortality of Belgian men aged 71 – 86 years in 1997
was 89.7%, which matches the 89.6% mortality rate of Merelbeke study participants.

168
Figure 19. (Cumulative) mortality rates between 1997 and 2014 of men aged 71 – 86 years in
1997 in the Belgian population (7) and Merelbeke study population.
Comparisons to other studies would have been facilitated if certain characteristics of our study
population were known (e.g. Gait speed, SPPB score, and presence of CHS physical frailty).
Accuracy & reliability
Several factors contributed to the accuracy and reliability of our results. First, all assessments were
performed by a fixed group of four dedicated study nurses from the second visit on. Second, rate
of change in physical function (Chapter 2.3) was estimated from four measurements over a 3-year
period. Third, few observations were censored in the Cox proportional hazards analyses, due to the
small survival rate.
Unfortunately, the study sample was relatively small and lack of power may have attributed to some
of the unexpected non-significant findings.
Internal validity
Cohort studies, like the Merelbeke study, allow analyzing predictors. However, confounding
variables are the main problem when analyzing cohort studies. Due to our relatively small sample,
we could not adjust our analyses for many variables, thereby potentially omitting confounders.

METHODOLOGICAL CONSIDERATIONS
4.4
169
An important confounder which was taken into account, albeit unintentionally, was gender. As the
Merelbeke study population was composed solely of men. In Chapter 1.1, we discussed the
difference between genders when it comes to life expectancy and mortality events, whilst in
Chapter 1.2.4, we noticed a difference between genders in prevalence of frailty. Results might have
been different if our study population comprised older women. Given the gender-neutral
components of the SOF frailty index, not much difference is expected for related results from
Chapter 2.1. Indeed, similar classification performance of the SOF index has been found in men
and women (age-adjusted AUC for 9-year mortality was 0.72 in women of the SOF study (30), age-
adjusted AUC for 3-year mortality was 0.71 in men of the MrOS study (31)). In contrast, during
development of the FNIH criteria different components and cutoff points were found to best
predict mobility impairment and weakness in men and women. Whilst our analyses in men
identified the combination of low Grip strength and low ALMBMI to best predict mortality, in
women the combination of low Grip strength to BMI - ratio and low unadjusted ALM might work
better (50,51). In addition, prevalence of low ALM varies more in women than men when different
cutoff points are applied (148), which might influence the consistency of observed associations. The
association of physical function measurements with long-term mortality (Chapter 2.2) has likewise
been found in older women. A cohort study in older women with follow-up and mortality rate
close to those of the Merelbeke study population found Timed Up and Go to be independently
associated with mortality hazard. Their unadjusted HR per second increase of 1.10 (CI95 = 1.06 –
1.14) is comparable with our age-adjusted HR per second increase of 1.10 (CI95 = 1.07 – 1.12) (324).
Meta-analysis of associations of Grip strength with all-cause mortality found similar HR’s in men
and women per 1 kg increase, however when the lowest quarter was compared with the best
quarter, the overall HR was higher in men (HR = 1.75 (CI95 = 1.41 – 2.16) than women (HR =
1.46 (CI95 = 1.29 – 1.66)) (120). Given that strength declines more rapidly in older men than in older
women (over three years men lose almost twice as much absolute strength as women (385)), 3-year
functional changes in women might be too confined to observe any association with mortality,
independent from baseline function (Chapter 2.3).
Our analyses were restricted to all-cause mortality, because cause of death could not be validated
based on death certificates, but relied on communication with the treating general practitioner
and/or proxy. Associations might strengthen or weaken if only subsamples with certain mortality
cause are investigated. Different trajectories of functional decline have been observed in persons
with sudden death, cancer death, death from organ failure (congestive heart failure or chronic lung
disease), and death from frailty (defined as reporting a nursing home stay). People deceased with

170
frailty were more likely to have ADL disability throughout their final year with a substantial decline
in function during the last 3 months of life (386).
Regretfully, no comorbidity index was used to assess morbidity burden in the Merelbeke study
population. Number of medications was counted from a list of medications provided by the
participants. Only seven diseases were specified in the questionnaire used in the first wave and
cancer was not one of them, while it and its treatment are major stressors which influence physical
function. Whereas the Charlson index, a commonly used measure of morbidity (which assigns
more weight to diagnoses such as malignant tumors), has strong evidence in relation to predictive
validity for mortality, some suggest simple counts of diseases or medications (which was available
to us) perform almost as well as complex measures in predicting most outcomes (387). Another
measure of morbidity, which was developed to predict physical function (according to the SF-36
Physical Function Index), namely the Functional Comorbidity Index, includes 18 items amongst
which COPD, diabetes, and several cardiovascular diseases (388) (these latter were also available to
us). In Chapter 2.1 associations of sarcopenia and frailty with mortality remained significant after
adjustment for number of medications. In Chapter 2.2 the association of Timed Up and Go with
mortality remained significant in a subsample of men with cardiovascular disease. The lack of
significance in men with COPD or diabetes was most likely due to the small sample sizes (N = 28
and N = 25, respectively). In Chapter 2.3 associations of baseline physical function with mortality
mostly remained significant after adjustment for polypharmacy and other covariates.

METHODOLOGICAL CONSIDERATIONS
4.4
171
4.4.2 CRIME STUDY
Representativeness & external validity
The CRIME study was a multicentre, observational study in which all older patients consecutively
admitted to geriatric and internal medicine acute care wards were approached for participation.
Representativeness was supported by the wide eligibility criteria for inclusion (which were age of at
least 65 years and willingness to participate), the initial participation rate of 73%, and the stability of
the cohort on follow-up (only 4% could not be followed until discharge due to transfer to another
ward). Despite the multicentre design of our study, findings may not be generalizable towards all
older patients admitted to an acute care ward, because the centres involved were exclusively Italian
facilities and they were not randomly chosen.
Accuracy
Accuracy of our results was supported by using objective physical function data.
In Chapter 3.2, bias may have been introduced by assigning a continuous value (equivalent to the
worst percentile of performance) to those patients who were unable to perform Gait speed and
Grip strength. Nevertheless, excluding those subjects who were unable to perform the tests led to
similar mean changes. Although the reason why subjects were unable to perform physical
performance measurements was not recorded, the main cause must be physical problems, since
subjects with cognitive problems or inability to understand instructions were excluded.
Internal validity
A potential confounding factor, that was not recorded, was the main disease that led to hospital
admission. Severity of admission reason is, however, partially captured in type of admission,
because patients admitted from the emergency room often present with severe acute conditions,
while patients admitted electively are less likely to present severe acute conditions.
First assessment of physical performance was performed within 24 hours of admission, therefore
some medical therapy still could have taken place before assessment, which could have affected
patients’ physical performance.


5 CHAPTER 5: REFERENCES

174
1 Riley J (2005). Estimates of regional and global life expectancy, 1800 – 2001. Popul Dev
Rev. 31: 537–543.
2 Roser M (2015). Life expectancy [Internet]. OurWorldInData.org. Available from:
http://ourworldindata.org/data/population-growth-vital-statistics/life-expectancy
3 Oeppen J, Vaupel J (2012). Broken limits to life expectancy. Science. 296: 1029–1031.
4 Eurostat (2015). Mortality and life expectancy statistics [Internet]. Stat Explain. Available
from: http://ec.europa.eu/eurostat/statistics-
explained/index.php/Mortality_and_life_expectancy_statistics
5 World Health Organization (2013). Life expectancy data by WHO region [Internet].
Glob Heal Obs Data Repos. Available from:
http://apps.who.int/gho/data/view.main.690?lang=en
6 Organization for Economic Co-operation and Development (2012). Life expectancy
at birth [Internet]. Heal a Glance Asia/Pacific. Available from: http://www.oecd-
ilibrary.org/sites/9789264183902-
en/01/01/index.html?itemId=/content/chapter/9789264183902-4-en
7 Statistics Belgium (2014). Sterftetafels en levensverwachting [Internet]. Stat Anal.
Available from:
http://statbel.fgov.be/nl/statistieken/cijfers/bevolking/sterfte_leven/tafels
8 FOD Economie (2014). Opmerkelijke vooruitgang in de levensverwachting in 2014
[Internet]. Persberichten. Available from:
http://statbel.fgov.be/nl/modules/pressrelease/statistieken/bevolking/progres_remarqua
ble_de_l_esperance_de_vie_en_2014.jsp
9 Planbureau F (2014). Demografische vooruitzichten 2013-2060 - Bevolking, huishoudens
en prospectieve sterftequotiënten [Internet]. Publicaties. Available from:
http://www.plan.be/publications/publication-1322-nl-
demografische+vooruitzichten+2013+2060+bevolking+huishoudens+en+prospectieve+s
terftequotienten
10 EurOhex. The European Community Household Panel (1995-2001) [Internet]. Heal Life
tables. Available from:
http://www.eurohex.eu/IS/index.php?controller=healthExpectancies/NationalHealths&a
ction=displayDataForAL
11 EurOhex. Statistics on Income and Living Conditions (2004-2011) [Internet]. Heal Life
tables. Available from:
http://www.eurohex.eu/IS/index.php?controller=lifeExpectancies/NationalLifeExpectan
cies&action=displayData
12 Statistics Belgium (2015). Structuur van de bevolking volgens leeftijd en geslacht: België
[Internet]. Stat Anal. Available from:
http://economie.fgov.be/nl/statistieken/cijfers/bevolking/structuur/leeftijdgeslacht/belg
ie
13 EurOhex (2012). Belgium Issue 8 [Internet]. Ctry Reports. Available from:
http://www.eurohex.eu/index.php?option=countryreports
14 EurOhex (2015). Belgium Issue 9 [Internet]. Ctry Reports. Available from:
http://www.eurohex.eu/index.php?option=countryreports

REFERENCES
175
15 Statistics Belgium (2012). Doodsoorzaken [Internet]. Stat Anal. Available from:
http://statbel.fgov.be/nl/statistieken/cijfers/bevolking/sterfte_leven/oorzaken
16 FOD Volksgezondheid veiligheid van de voedselketen en leefmilieu (2012). Maxi
feedback (Alle ziekenhuizen) [Internet]. Minimale Ziekenhuisgegevens. Available from:
http://www.health.belgium.be/eportal/Healthcare/Healthcarefacilities/Registrationsystem
s/MHD%28MinimumHospitalData%29/Publications/Maxifeedback/index.htm?fodnlang
=nl#.Vi9E8W4gzPs
17 FOD Volksgezondheid veiligheid van de voedselketen en leefmilieu (2012).
Overlijdens in het ziekenhuis [Internet]. Minimale Ziekenhuisgegevens. Available from:
http://www.health.belgium.be/eportal/Healthcare/Healthcarefacilities/Registrationsystem
s/MHD%28MinimumHospitalData%29/Publications/DeceasesInHospital/index.htm#.V
i89yG4gzPs
18 Organization for Economic Co-operation and Development (2015). Long-term care
resources and utilisation: Long-term care recipients [Internet]. Available from:
http://stats.oecd.org/index.aspx?DataSetCode=HEALTH_STAT#
19 Clegg A, Young J, Iliffe S, Olde Rikkert MGM, Rockwood K (2013). Frailty in older
people summary. Lancet. 381: 752–762.
20 Walston J, Hadley EC, Ferrucci L, Guralnik JM, Newman AB, Studenski SA,
Ershler WB, Harris T, Fried LP (2006). Research agenda for frailty in older adults:
toward a better understanding of physiology and etiology: Summary from the American
Geriatrics Society/National Institute on Aging Research Conference on Frailty in Older
Adults. J Am Geriatr Soc. 54: 991–1001.
21 Gobbens R, Luijkx KG, Wijnen-Sponselee MT, Schols J (2010). In search of an
integral conceptual definition of frailty: Opinions of experts. J Am Med Dir Assoc. 11:
338–343.
22 Gobbens R, Luijkx KG, Wijnen-Sponselee MT, Schols J (2010). Toward a conceptual
definition of frail community dwelling older people. Nurs Outlook. 58: 76–86.
23 Morley JE, Vellas B, Abellan van Kan G, Anker SD, Bauer JM, Bernabei R, Cesari
M, Chumlea WC, Doehner W, Evans J, Fried LP, Guralnik JM, Katz PR,
Malmstrom TK, McCarter RJ, Gutierrez Robledo LM, Rockwood K, von Haehling
S, Vandewoude MF, Walston J (2013). Frailty consensus: A call to action. J Am Med Dir
Assoc. 14: 392–397.
24 Rodríguez-Mañas L, Féart C, Mann G, Viña J, Chatterji S, Chodzko-Zajko W,
Gonzalez-Colaço Harmand M, Bergman H, Carcaillon L, Nicholson C, Scuteri A,
Sinclair A, Pelaez M, Van Der Cammen T, Beland F, Bickenbach J, Delamarche P,
Ferrucci L, Fried LP, Gutiérrez-Robledo LM, Rockwood K, Rodríguez Artalejo F,
Serviddio G, Vega E (2013). Searching for an operational definition of frailty: A delphi
method based consensus statement. The Frailty Operative Definition-Consensus
Conference Project. J Gerontol A Biol Sci Med Sci. 68: 62–67.
25 Rockwood K, Stadnyk K, MacKnight C, McDowell I, Hébert R, Hogan DB (1999).
A brief clinical instrument to classify frailty in elderly people. Lancet. 353: 205–206.
176
26 Fried LP, Tangen CM, Walston J, Newman AB, Hirsch C, Gottdiener J, Seeman T,
Tracy R, Kop WJ, Burke G, McBurnie MA (2001). Frailty in older adults: Evidence for
a phenotype. J Gerontol A Biol Sci Med Sci. 56: M146–156.
27 Boers M, Cruz Jentoft AJ (2015). A new concept of health can improve the definition of
frailty. Calcif Tissue Int. 97: 429–431.
28 Fried LP, Ferrucci L, Darer J, Williamson JD, Anderson G (2004). Untangling the
concepts of disability, frailty, and comorbidity: Implications for improved targeting and
care. J Gerontol A Biol Sci Med Sci. 59: 255–263.
29 Abellan van Kan G, Rolland YM, Morley JE, Vellas B (2008). Frailty: Toward a clinical
definition. J Am Med Dir Assoc. 9: 71–72.
30 Ensrud KE, Ewing SK, Taylor BC, Fink HA, Cawthon PM, Stone KL, Hillier TA,
Cauley JA, Hochberg MC, Rodondi N, Tracy JK, Cummings SR (2008). Comparison
of 2 frailty indexes for prediction of falls, disability, fractures, and death in older women.
Arch Intern Med. 168: 382–389.
31 Ensrud KE, Ewing SK, Cawthon PM, Fink HA, Taylor BC, Cauley JA, Dam T-TL,
Marshall LM, Orwoll ES, Cummings SR (2009). A comparison of frailty indexes for the
prediction of falls, disability, fractures, and mortality in older men. J Am Geriatr Soc. 57:
492–498.
32 Rockwood K, Mitnitski A (2007). Frailty in relation to the accumulation of deficits. J
Gerontol A Biol Sci Med Sci. 62: 722–727.
33 Searle SD, Mitnitski A, Gahbauer EA, Gill TM, Rockwood K (2008). A standard
procedure for creating a frailty index. BMC Geriatr. 8: 24.
34 Rockwood K, Song X, Macknight C, Bergman H, Hogan DB, Mcdowell I,
Mitnitski A (2005). A global clinical measure of fitness and frailty in elderly people.
CMAJ. 173: 489–495.
35 Studenski SA, Hayes RP, Leibowitz RQ, Bode R, Lavery L, Walston J, Duncan P,
Perera S (2004). Clinical global impression of change in physical frailty: Development of a
measure based on clinical judgment. J Am Geriatr Soc. 52: 1560–1566.
36 Vellas B, Balardy L, Gillette-Guyonnet S, Abellan Van Kan G, Ghisolfi-Marque A,
Subra J, Bismuth S, Oustric S, Cesari M (2013). Looking for frailty in community-
dwelling older persons: the Gérontopôle Frailty Screening Tool (GFST). J Nutr Heal
Aging. 17: 629–31.
37 Gobbens R, van Assen M, Luijkx KG, Wijnen-Sponselee MT, Schols J (2010). The
Tilburg Frailty Indicator: Psychometric properties. J Am Med Dir Assoc. 11: 344–355.
38 Peters LL, Boter H, Buskens E, Slaets JPJ (2012). Measurement properties of the
Groningen Frailty Indicator in home-dwelling and institutionalized elderly people. J Am
Med Dir Assoc. 13: 546–551.
39 Rolfson D, Majumdar S, Tsuyuki R, Tahir A, Rockwood K (2006). Validity and
reliability of the Edmonton Frail Scale. Age Ageing. 35: 526–529.
40 Rockwood K (2005). What would make a definition of frailty successful? Age Ageing. 34:
432–434.
41 Rosenberg IH (1989). Summary comments. Am J Clin Nutr. 50: 1231–1233.

REFERENCES
177
42 Baumgartner RN, Koehler KM, Gallagher D, Romero L, Heymsfield SB, Ross RR,
Garry PJ, Lindeman RD (1998). Epidemiology of sarcopenia among the elderly in New
Mexico. Am J Epidemiol. 147: 755–763.
43 Fielding RA, Vellas B, Evans WJ, Bhasin S, Morley JE, Newman AB, Abellan van
Kan G, Andrieu S, Bauer J, Breuille D, Cederholm T, Chandler J, De Meynard C,
Donini L, Harris T, Kannt A, Keime Guibert F, Onder G, Papanicolaou D, Rolland
Y, Rooks D, Sieber C, Souhami E, Verlaan S, Zamboni M (2011). Sarcopenia: An
undiagnosed condition in older adults. Current consensus definition: Prevalence, etiology,
and consequences. International Working Group on Sarcopenia. J Am Med Dir Assoc. 12:
249–256.
44 Muscaritoli M, Anker SD, Argilés J, Aversa Z, Bauer JM, Biolo G, Boirie Y, Bosaeus
I, Cederholm T, Costelli P, Fearon KC, Laviano A, Maggio M, Fanelli FR,
Schneider SM, Schols A, Sieber CC (2010). Consensus definition of sarcopenia, cachexia
and pre-cachexia: Joint document elaborated by Special Interest Groups (SIG) “cachexia-
anorexia in chronic wasting diseases” and “nutrition in geriatrics.” Clin Nutr. 29: 154–159.
45 Zamboni M, Mazzali G, Fantin F, Rossi A, Di Francesco V (2008). Sarcopenic
obesity: A new category of obesity in the elderly. Nutr Metab Cardiovasc Dis. 18: 388–395.
46 Cruz-Jentoft AJ, Baeyens JP, Bauer JM, Boirie Y, Cederholm T, Landi F, Martin
FC, Michel J-P, Rolland Y, Schneider SM, Topinková E, Vandewoude M, Zamboni
M (2010). Sarcopenia: European consensus on definition and diagnosis: Report of the
European Working Group on Sarcopenia in Older People. Age Ageing. 39: 412–423.
47 Newman AB, Kupelian ÃV, Visser ÃM, Simonsick E, Goodpaster B, Nevitt ÃM,
Kritchevsky SB, Tylavsky FA, Rubin SM (2003). Sarcopenia: Alternative definitions and
associations with lower extremity function. J Am Geriatr Soc. 51: 1602–1609.
48 Morley JE, Abbatecola AM, Argiles JM, Baracos V, Bauer J, Bhasin S, Cederholm
T, Stewart Coats AJ, Cummings SR, Evans WJ, Fearon K, Ferrucci L, Fielding RA,
Guralnik JM, Harris TB, Inui A, Kalantar-Zadeh K, Kirwan BA, Mantovani G,
Muscaritoli M, Newman AB, Rossi-Fanelli F, Rosano GMC, Roubenoff R,
Schambelan M, Sokol GH, Storer TW, Vellas B, von Haehling S, Yeh SS, Anker SD
(2011). Sarcopenia with limited mobility: An international consensus. J Am Med Dir Assoc.
12: 403–409.
49 Studenski SA, Peters KW, Alley DE, Cawthon PM, McLean RR, Harris TB,
Ferrucci L, Guralnik JM, Fragala MS, Kenny AM, Kiel DP, Kritchevsky SB, Shardell
MD, Dam T-TL, Vassileva MT (2014). The FNIH sarcopenia project: Rationale, study
description, conference recommendations, and final estimates. J Gerontol A Biol Sci Med
Sci. 69: 547–558.
50 Alley DE, Shardell MD, Peters KW, McLean RR, Dam T-TL, Kenny AM, Fragala
MS, Harris TB, Kiel DP, Guralnik JM, Ferrucci L, Kritchevsky SB, Studenski SA,
Vassileva MT, Cawthon PM (2014). Grip strength cutpoints for the identification of
clinically relevant weakness. J Gerontol A Biol Sci Med Sci. 69: 559–566.

178
51 Cawthon PM, Peters KW, Shardell MD, McLean RR, Dam T-TL, Kenny AM,
Fragala MS, Harris TB, Kiel DP, Guralnik JM, Ferrucci L, Kritchevsky SB,
Vassileva MT, Studenski SA, Alley DE (2014). Cutpoints for low appendicular lean
mass that identify older adults with clinically significant weakness. J Gerontol A Biol Sci
Med Sci. 69: 567–575.
52 McLean RR, Shardell MD, Alley DE, Cawthon PM, Fragala MS, Harris TB, Kenny
AM, Peters KW, Ferrucci L, Guralnik JM, Kritchevsky SB, Kiel DP, Vassileva MT,
Xue QL, Perera S, Studenski SA, Dam T-TL (2014). Criteria for clinically relevant
weakness and low lean mass and their longitudinal association with incident mobility
impairment and mortality: The Foundation for the National Institutes of Health (FNIH)
Sarcopenia Project. J Gerontol A Biol Sci Med Sci. 69: 576–583.
53 Dam T-TL, Peters KW, Fragala MS, Cawthon PM, Harris TB, McLean R, Shardell
M, Alley DE, Kenny AM, Ferrucci L, Guralnik JM, Kiel DP, Kritchevsky SB,
Vassileva MT, Studenski SA (2014). An evidence-based comparison of operational
criteria for the presence of sarcopenia. J Gerontol A Biol Sci Med Sci. 69: 584–590.
54 Cesari M, Landi F, Vellas B, Bernabei R, Marzetti E (2014). Sarcopenia and physical
frailty: Two sides of the same coin. Front Aging Neurosci. 6: 192.
55 Cooper C, Dere W, Evans W, Kanis JA, Rizzoli R, Sayer A, Sieber CC, Kaufman J-
M, Abellan van Kan G, Boonen S, Adachi J, Mitlak B, Tsouderos Y, Rolland Y,
Reginster J-Y (2012). Frailty and sarcopenia: Definitions and outcome parameters.
Osteoporos Int. 23: 1839–1848.
56 Landi F, Calvani R, Cesari M, Tosato M, Martone AM, Bernabei R, Onder G,
Marzetti E (2015). Sarcopenia as the biological substrate of physical frailty. Clin Geriatr
Med. 31: 367–374.
57 Clegg A, Rogers L, Young J (2015). Diagnostic test accuracy of simple instruments for
identifying frailty in community-dwelling older people: A systematic review. Age Ageing.
44: 148–152.
58 Cederholm T (2015). Overlaps between frailty and sarcopenia definitions. Nestlé Nutr
Inst Work Ser. 83: 65–69.
59 Rizzoli R, Reginster J-Y, Arnal J, Bautmans I (2013). Quality of life in sarcopenia and
frailty. Calcif Tissue Int. 93: 101–120.
60 Liu C, Latham NK (2009). Progressive resistance strength training for improving physical
function in older adults. Cochrane Database Syst Rev. Jul 8: CD002759.
61 Guralnik J, Ferrucci L, Simonsick E, Salive M, Wallace R (1995). Lower-extremity
function in persons over the age of 70 years as a predictor of subsequent disability. N Engl
J Med. 332: 556–561.
62 Perera S, Studenski SA, Chandler JM, Guralnik JM (2005). Magnitude and patterns of
decline in health and function in 1 year affect subsequent 5-year survival. J Gerontol A Biol
Sci Med Sci. 60: 894–900.
63 Hardy SE, Perera S, Roumani YF, Chandler JM, Studenski SA (2007). Improvement
in usual Gait speed predicts better survival in older adults. J Am Geriatr Soc. 55: 1727–
1734.

REFERENCES
179
64 Sabia S, Dumurgier J, Tavernier B, Head J, Tzourio C, Elbaz A (2014). Change in fast
Walking speed preceding death: Results from a prospective longitudinal cohort study. J
Gerontol A Biol Sci Med Sci. 69: 354–362.
65 Buchman AS, Wilson RS, Boyle PA, Bienias JL, Bennett DA (2007). Change in motor
function and risk of mortality in older persons. J Am Geriatr Soc. 55: 11–19.
66 Hirsch CH, Bůžková P, Robbins JA, Patel K, Newman AB (2012). Predicting late-life
disability and death by the rate of decline in physical performance measures. Age Ageing.
41: 155–161.
67 Clark BC, Manini TM (2008). Sarcopenia ≠ dynapenia. J Gerontol. 63: 829–834.
68 Lang T, Streeper T, Cawthon P, Baldwin K, Taaffe DR, Harris TB (2010).
Sarcopenia: Etiology, clinical consequences, intervention, and assessment. Osteoporos Int.
21: 543–559.
69 Kanapuru B, Ershler WB (2009). Inflammation, coagulation, and the pathway to frailty.
Am J Med. 122: 605–613.
70 Leng SX, Xue QL, Tian J, Walston JD, Fried LP (2007). Inflammation and frailty in
older women. J Am Geriatr Soc. 55: 864–871.
71 Walston J, McBurnie MA, Newman A, Tracy RP, Kop WJ, Hirsch CH, Gottdiener
J, Fried LP (2002). Frailty and activation of the inflammation and coagulation systems
with and without clinical comorbidities: Results from the Cardiovascular Health Study.
Arch Intern Med. 162: 2333–2341.
72 Cesari M, Kritchevsky SB, Baumgartner RN, Atkinson HH, Penninx BWHJ,
Lenchik L, Palla SL, Ambrosius WT, Tracy RP, Pahor M (2005). Sarcopenia, obesity,
and inflammation - Results from the Trial of Angiotensin Converting Enzyme Inhibition
and Novel Cardiovascular Risk Factors Study. Am J Clin Nutr. 82: 428–434.
73 Barzilay JI, Blaum C, Moore T, Xue QL, Hirsch CH, Walston JD, Fried LP (2007).
Insulin resistance and inflammation as precursors of frailty: The Cardiovascular Health
Study. Arch Intern Med. 167: 635–641.
74 Visser M, Pahor M, Taaffe DR, Goodpaster BH, Simonsick EM, Newman AB,
Nevitt M, Harris TB (2002). Relationship of interleukin-6 and tumor necrosis factor-
alpha with muscle mass and muscle strength in elderly men and women: The Health ABC
Study. J Gerontol A Biol Sci Med Sci. 57A: M326–M332.
75 Reiner AP, Aragaki AK, Gray SL, Wactawski-Wende J, Cauley JA, Cochrane BB,
Kooperberg CL, Woods NF, LaCroix AZ (2009). Inflammation and thrombosis
biomarkers and incident frailty in postmenopausal women. Am J Med. 122: 947–954.
76 Rodríguez-Mañas L (2015). Determinants of frailty and longevity: Are they the same
ones? Nestlé Nutr Inst Work Ser. 83: 29–39.
77 Mohr BA, Bhasin S, Kupelian V, Araujo AB, O’Donnell AB, McKinlay JB (2007).
Testosterone, sex hormone-binding globulin, and frailty in older men. J Am Geriatr Soc.
55: 548–555.
78 Carcaillon L, Blanco C, Alonso-Bouzón C, Alfaro-Acha A, Garcia-García FJ,
Rodriguez-Mañas L (2012). Sex differences in the association between serum levels of
testosterone and frailty in an elderly population: The Toledo Study for Healthy Aging.
PLoS One. 7: e32401.
180
79 Cawthon PM, Ensrud KE, Laughlin GA, Cauley JA, Dam T-TL, Barrett-Connor E,
Fink HA, Hoffman AR, Lau E, Lane NE, Stefanick ML, Cummings SR, Orwoll ES
(2009). Sex hormones and frailty in older men: The Osteoporotic Fractures in Men (MrOS)
Study. J Clin Endocrinol Metab. 94: 3806–3815.
80 Travison TG, Nguyen AH, Naganathan V, Stanaway FF, Blyth FM, Cumming RG,
Le Couteur DG, Sambrook PN, Handelsman DJ (2011). Changes in reproductive
hormone concentrations predict the prevalence and progression of the frailty syndrome in
older men: The Concord Health and Ageing in Men Project. J Clin Endocrinol Metab. 96:
2464–2474.
81 Araujo AB, Travison TG, Bhasin S, Esche GR, Williams RE, Clark R, McKinlay JB
(2008). Association between testosterone and estradiol and age-related decline in physical
function in a diverse sample of men. J Am Geriatr Soc. 56: 2000–2008.
82 Renoud A, Ecochard R, Marchand F, Chapurlat R, Szulc P (2014). Predictive
parameters of accelerated muscle loss in Men - MINOS study. Am J Med. 127: 554–561.
83 Gielen E, O’Neill TW, Pye SR, Adams JE, Wu FC, Laurent MR, Claessens F, Ward
KA, Boonen S, Bouillon R, Vanderschueren D, Verschueren S (2015). Endocrine
determinants of incident sarcopenia in middle-aged and elderly European men. J Cachexia
Sarcopenia Muscle. 6: 242–252.
84 Carcaillon L, García-García FJ, Tresguerres JAF, Gutiérrez Avila G, Kireev R,
Rodríguez-Mãnas L (2012). Higher levels of endogenous estradiol are associated with
frailty in postmenopausal women from the Toledo Study for Healthy Aging. J Clin
Endocrinol Metab. 97: 2898–2906.
85 Leng S, Cappola A, Andersen R, Blackman M, Koenig K, Blair M, Walston J (2004).
Serum levels of insulin-like growth factor-I (IGF-I) and dehydroepiandrosterone sulfate
(DHEA-S), and their relationships with serum interleukin-6, in the geriatric syndrome of
frailty. Aging Clin Exp Res. 16: 153–157.
86 Tajar A, O’Connell MDL, Mitnitski AB, O’Neill TW, Searle SD, Huhtaniemi IT,
Finn JD, Bartfai G, Boonen S, Casanueva FF, Forti G, Giwercman A, Han TS, Kula
K, Labrie F, Lean MEJ, Pendleton N, Punab M, Silman AJ, Vanderschueren D,
Rockwood K, Wu FCW (2011). Frailty in relation to variations in hormone levels of the
hypothalamic-pituitary-testicular axis in older men: Results from the European Male Aging
Study. J Am Geriatr Soc. 59: 814–821.
87 Baylis D, Bartlett DB, Syddall HE, Ntani G, Gale CR, Cooper C, Lord JM, Sayer
AA (2013). Immune-endocrine biomarkers as predictors of frailty and mortality: A 10-year
longitudinal study in community-dwelling older people. Age (Omaha). 35: 963–971.
88 Puts MTE, Visser M, Twisk JWR, Deeg DJH, Lips P (2005). Endocrine and
inflammatory markers as predictors of frailty. Clin Endocrinol. 63: 403–411.
89 Cappola AR, Bandeen-Roche K, Wand GS, Volpato S, Fried LP (2001). Association
of IGF-I levels with muscle strength and mobility in older women. J Clin Endocrinol
Metab. 86: 4139–4146.
90 Sayer AA, Syddall HE, Dennison EM, Martin HJ, Phillips DIW, Cooper C (2007).
The relationship between Grip strength and features of the metabolic syndrome: Findings
from the Hertfordshire Cohort Study. QJM. 100: 707–713.

REFERENCES
181
91 Kim TN, Park MS, Lim K Il, Choi HY, Yang SJ, Yoo HJ, Kang HJ, Song W, Choi
H, Baik SH, Choi DS, Choi KM (2013). Relationships between sarcopenic obesity and
insulin resistance, inflammation, and vitamin D status: The Korean Sarcopenic Obesity
Study. Clin Endocrinol. 78: 525–532.
92 Park S, Goodpaster BH, Strotmeyer ES, De Rekeneire N, Harris TB, Schwartz A V,
Tylavsky FA, Newman AB (2006). Decreased muscle strength and quality in older adults
with type 2 diabetes: The Health, Aging, and Body Composition Study. Diabetes. 55:
1813–1818.
93 Park SW, Goodpaster BH, Strotmeyer ES, Kuller LH, Broudeau R, Kammerer C,
De Rekeneire N, Harris TB, Schwartz A V, Tylavsky FA, Cho YW, Newman AB
(2007). Accelerated loss of skeletal muscle strength in older adults with type 2 diabetes.
The Health, Aging, and Body Composition Study. Diabetes Care. 30: 1507–1512.
94 Perkisas S, Vandewoude M (2016). Where frailty meets diabetes. Diabetes Metab Res
Rev. 32: 261–267.
95 Varadhan R, Walston J, Cappola AR, Carlson MC, Wand GS, Fried LP (2008).
Higher levels and blunted diurnal variation of cortisol in frail older women. J Gerontol A
Biol Sci Med Sci. 63: 190–195.
96 Dam T-TL, Mühlen D von, Barrett-Connor E (2009). Sex-specific association of serum
vitamin D levels with physical function in older adults. Osteoporos Int. 20: 751–760.
97 Houston DK, Cesari M, Ferrucci L, Cherubini A, Maggio D, Bartali B, Johnson
MA, Schwartz GG, Kritchevsky SB (2007). Association between vitamin D status and
physical performance: The InCHIANTI Study. J Gerontol A Biol Sci Med Sci. 62: 440–
446.
98 Ceglia L, Chiu G, Harris S, Araujo A (2011). Serum 25-hydroxyvitamin D concentration
and physical function in adult men. Clin Endocrinol. 74: 370–376.
99 Tajar A, Lee DM, Pye SR, O’Connell MDL, Ravindrarajah R, Gielen E, Boonen S,
Vanderschueren D, Pendleton N, Finn JD, Bartfai G, Casanueva FF, Forti G,
Giwercman A, Han TS, Huhtaniemi IT, Kula K, Lean MEJ, Punab M, Wu FCW,
O’Neill TW (2013). The association of frailty with serum 25-hydroxyvitamin D and
parathyroid hormone levels in older European men. Age Ageing. 42: 352–359.
100 Visser M, Deeg DJH, Lips P (2003). Low vitamin D and high parathyroid hormone
levels as determinants of loss of muscle strength and muscle mass (sarcopenia): The
Longitudinal Aging Study Amsterdam. J Clin Endocrinol Metab. 88: 5766–5772.
101 Ensrud KE, Blackwell TL, Cauley JA, Cummings SR, Barrett-Connor E, Dam T-
TL, Hoffman AR, Shikany JM, Lane NE, Stefanick ML, Orwoll ES, Cawthon PM
(2011). Circulating 25-hydroxyvitamin D levels and frailty in older men: The Osteoporotic
Fractures in Men Study. J Am Geriatr Soc. 59: 101–106.
102 Shardell M, Hicks GE, Miller RR, Kritchevsky S, Andersen D, Bandinelli S,
Cherubini A, Ferrucci L (2009). Association of low vitamin D levels with the frailty
syndrome in men and women. J Gerontol A Biol Sci Med Sci. 64: 69–75.
103 Wong YYE, McCaul KA, Yeap BB, Hankey GJ, Flicker L (2013). Low vitamin D
status is an independent predictor of increased frailty and all-cause mortality in older men:
The Health in Men Study. J Clin Endocrinol Metab. 98: 3821–3828.

182
104 Liu CK, Lyass A, Larson MG, Massaro JM, Wang N, D’Agostino RB, Benjamin EJ,
Murabito JM (2016). Biomarkers of oxidative stress are associated with frailty: The
Framingham Offspring Study. Age (Omaha). 38: 1.
105 Marzetti E, Lorenzi M, Antocicco M, Bonassi S, Celi M, Mastropaolo S, Settanni S,
Valdiglesias V, Landi F, Bernabei R, Onder G (2014). Shorter telomeres in peripheral
blood mononuclear cells from older persons with sarcopenia: Results from an exploratory
study. Front Aging Neurosci. 6: 233.
106 Yu R, Tang N, Leung J, Woo J (2015). Telomere length is not associated with frailty in
older Chinese elderly: Cross-sectional and longitudinal analysis. Mech Ageing Dev. 152:
74–79.
107 Ng TP, Camous X, Nyunt MSZ, Vasudev A, Tan CTY, Feng L, Fulop T, Yap KB,
Larbi A (2015). Markers of T-cell senescence and physical frailty: Insights from Singapore
Longitudinal Ageing Studies. npj Aging Mech Dis. 1: 15005.
108 Ho YY, Matteini AM, Beamer B, Fried L, Xue QL, Arking DE, Chakravarti A,
Fallin MMD, Walston J (2011). Exploring biologically relevant pathways in frailty. J
Gerontol A Biol Sci Med Sci. 66A: 975–979.
109 Buta BJ, Walston JD, Godino JG, Park M, Kalyani RR, Xue QL, Bandeen-Roche K,
Varadhan R (2016). Frailty assessment instruments: Systematic characterization of the
uses and contexts of highly-cited instruments. Ageing Res Rev. 26: 53–61.
110 Rockwood K, Theou O, Mitnitski A (2015). What are frailty instruments for? Age
Ageing. 44: 545–547.
111 Chang S-F, Lin P-L (2015). Frail phenotype and mortality prediction: A systematic review
and meta-analysis of prospective cohort studies. Int J Nurs Stud. 52: 1362–1374.
112 Bianchi L, Ferrucci L, Cherubini A, Maggio M, Bandinelli S, Savino E, Brombo G,
Zuliani G, Guralnik JM, Landi F, Volpato S (2016). The predictive value of the
EWGSOP definition of sarcopenia: Results from the InCHIANTI Study. J Gerontol A
Biol Sci Med Sci. 71: 259–64.
113 Chang S, Lin RNP (2016). Systematic literature review and meta-analysis of the
association of sarcopenia with mortality. Worldviews Evidence-Based Nurs. Feb 4.
114 Cerri AP, Bellelli G, Mazzone A, Pittella F, Landi F, Zambon A, Annoni G (2015).
Sarcopenia and malnutrition in acutely ill hospitalized elderly: Prevalence and outcomes.
Clin Nutr. 34: 745–751.
115 Bischoff-Ferrari HA, Orav JE, Kanis JA, Rizzoli R, Schlögl M, Staehelin HB, Willett
WC, Dawson-Hughes B (2015). Comparative performance of current definitions of
sarcopenia against the prospective incidence of falls among community-dwelling seniors
age 65 and older. Osteoporos Int. 26: 2793–2802.
116 Woo J, Leung J, Morley JE (2015). Defining sarcopenia in terms of incident adverse
outcomes. J Am Med Dir Assoc. 16: 247–252.
117 Guralnik J, Ferrucci L, Pieper C, Leveille S, Markides K, Ostir G, Studenski S,
Berkman L, Wallace R (2000). Lower extremity function and subsequent disability:
Consistency across studies, predictive models, and value of Gait speed alone compared
with the short physical performance battery. J Gerontol A Biol Sci Med Sci. 55: M221–231.

REFERENCES
183
118 Cesari M, Kritchevsky SB, Newman AB, Simonsick EM, Harris TB, Penninx BW,
Brach JS, Tylavsky FA, Satterfield S, Bauer DC, Rubin SM, Visser M, Pahor M
(2009). Added value of physical performance measures in predicting adverse health-related
events: Results from the Health, Aging And Body Composition Study. J Am Geriatr Soc.
57: 251–259.
119 Kempen GI, Ormel J (1998). The impact of physical performance and cognitive status on
subsequent ADL disability in low-functioning older adults. Int J Geriatr Psychiatry. 13:
480–483.
120 Cooper R, Kuh D, Hardy R (2010). Objectively measured physical capability levels and
mortality: Systematic review and meta-analysis. BMJ. 341: c4467.
121 Evans SJ, Sayers M, Mitnitski A, Rockwood K (2014). The risk of adverse outcomes in
hospitalized older patients in relation to a frailty index based on a comprehensive geriatric
assessment. Age Ageing. 43: 127–132.
122 Forti P, Maioli F, Zagni E, Lucassenn T, Montanari L, Maltoni B, Luca Pirazzoli
G, Bianchi G, Zoli M (2014). The physical phenotype of frailty for risk stratification of
older medical inpatients. J Nutr Heal Aging. 18: 912–918.
123 Vetrano DL, Landi F, Volpato S, Corsonello A, Meloni E, Bernabei R, Onder G
(2014). Association of sarcopenia with short- and long-term mortality in older adults
admitted to acute care wards: Results from the CRIME Study. J Gerontol A Biol Sci Med
Sci. 69: 1154–1161.
124 Sternberg S, Schwartz A, Karunananthan S, Bergman H, Clarfield M (2011). The
identification of frailty: a systematic literature review. J Am Geriatr Soc. 59: 2129–2138.
125 Bruyère O, Beaudart C, Reginster J-Y, Buckinx F, Schoene D, Hirani V, Cooper C,
Kanis J, Rizzoli R, McCloskey E, Cederholm T, Cruz-Jentoft A, Freiberger E (2016).
Assessment of muscle mass, muscle strength and physical performance in clinical practice:
An international survey. Eur Geriatr Med.
126 Lee P-H, Lee Y-S, Chan D-C (2012). Interventions targeting geriatric frailty: A systemic
review. J Clin Gerontol Geriatr. 3: 47–52.
127 Collard RM, Boter H, Schoevers RA, Oude Voshaar RC (2012). Prevalence of frailty in
community-dwelling older persons: A systematic review. J Am Geriatr Soc. 60: 1487–1492.
128 Theou O, Brothers TD, Mitnitski A, Rockwood K (2013). Operationalization of frailty
using eight commonly used scales and comparison of their ability to predict all-cause
mortality. J Am Geriatr Soc. 61: 1537–1551.
129 Kiely D, Cupples L, Lipsitz L (2009). Validation and comparison of two frailty indexes:
The MOBILIZE Boston Study. J Am Geriatr Soc. 57: 1532–1539.
130 Malmstrom TK, Miller DK, Morley JE (2014). A comparison of four frailty models. J
Am Geriatr Soc. 62: 721–726.
131 Jung HW, Kim SW, Ahn S, Lim JY, Han JW, Kim TH, Kim KW, Kim K Il, Kim CH
(2014). Prevalence and outcomes of frailty in Korean elderly population: Comparisons of a
multidimensional frailty index with two phenotype models. PLoS One. 9: e87958.

184
132 Woods NF, LaCroix AZ, Gray SL, Aragaki A, Cochrane BB, Brunner RL, Masaki K,
Murray A, Newman AB (2005). Frailty: Emergence and consequences in women aged 65
and older in the Women’s Health Initiative Observational Study. J Am Geriatr Soc. 53:
1321–1330.
133 Cawthon PM, Marshall LM, Michael Y, Dam T-TL, Ensrud KE, Barrett-Connor E,
Orwoll ES (2007). Frailty in older men: Prevalence, progression, and relationship with
mortality. J Am Geriatr Soc. 55: 1216–1223.
134 Hirsch C, Anderson ML, Newman A, Kop W, Jackson S, Gottdiener J, Tracy R,
Fried LP (2006). The association of race with frailty: The Cardiovascular Health Study.
Ann Epidemiol. 16: 545–553.
135 Santos-Eggimann B, Cuénoud P, Spagnoli J, Junod J (2009). Prevalence of frailty in
middle-aged and older community-dwelling Europeans living in 10 countries. J Gerontol A
Biol Sci Med Sci. 64: 675–681.
136 Ekerstad N, Swahn E, Janzon M (2011). Frailty is independently associated with short-
term outcomes for elderly patients with non – ST-segment. Circulation. 124: 2397–2404.
137 Hilmer SN, Perera V, Mitchell S, Murnion BP, Dent J, Bajorek B, Matthews S,
Rolfson DB (2009). The assessment of frailty in older people in acute care. Australas J
Ageing. 28: 182–188.
138 Andela RM, Dijkstra A, Slaets JPJ, Sanderman R (2010). Prevalence of frailty on
clinical wards: Description and implications. Int J Nurs Pract. 16: 14–19.
139 Purser JL, Kuchibhatla MN, Fillenbaum GG, Harding T, Peterson ED, Alexander
KP (2006). Identifying frailty in hospitalized older adults with significant coronary artery
disease. J Am Geriatr Soc. 54: 1674–1681.
140 Pilotto A, Rengo F, Marchionni N, Sancarlo D, Fontana A, Panza F, Ferrucci L
(2012). Comparing the prognostic accuracy for all-cause mortality of frailty instruments: A
multicentre 1-year follow-up in hospitalized older patients. PLoS One. 7: e29090.
141 Wou F, Gladman JRF, Bradshaw L, Franklin M, Edmans J, Conroy SP (2013). The
predictive properties of frailty-rating scales in the acute medical unit. Age Ageing. 42: 776–
781.
142 Joosten E, Demuynck M, Detroyer E, Milisen K (2014). Prevalence of frailty and its
ability to predict in hospital delirium, falls, and 6-month mortality in hospitalized older
patients. BMC Geriatr. 14: 1.
143 Kanwar A, Singh M, Lennon R, Ghanta K, McNallan S, Roger VL (2013). Frailty and
health-related quality of life among residents of long-term care facilities. J Aging Heal. 25:
792–802.
144 Espinoza SE, Jung I, Hazuda H (2012). Frailty transitions in the San Antonio
Longitudinal Study of Aging. J Am Geriatr Soc. 60: 652–660.
145 Lee JSW, Auyeung T-W, Leung J, Kwok T, Woo J (2014). Transitions in frailty states
among community-living older adults and their associated factors. J Am Med Dir Assoc.
15: 281–286.

REFERENCES
185
146 Reijnierse E, Trappenburg MC, Leter MJ, Blauw GJ, Sipilä S, Sillanpää E, Narici
M, Hogrel J-Y, Butler-Browne G, McPhee JS, Gapeyeva H, Pääsuke M, de van der
Schueren MA, Meskers CGM, Maier AB (2015). The impact of different diagnostic
criteria on the prevalence of sarcopenia in healthy elderly participants and geriatric
outpatients. Gerontology. 61: 491–496.
147 Cruz-Jentoft AJ, Landi F, Schneider SM, Zuniga C, Arai H, Boirie Y, Chen L-K,
Fielding RA, Martin FC, Michel J-P, Sieber C, Stout JR, Studenski SA, Vellas B,
Woo J, Zamboni M, Cederholm T (2014). Prevalence of and interventions for
sarcopenia in ageing adults: A systematic review. Report of the International Sarcopenia
Initiative (EWGSOP and IWGS). Age Ageing. 43: 749–759.
148 Beaudart C, Reginster J, Slomian J, Buckinx F, Locquet M, Bruyère O (2014).
Prevalence of sarcopenia: The impact of different diagnostic cutoff limits. J Musculoskelet
Neuronal Interact. 14: 425–431.
149 Hirani V, Blyth F, Naganathan V, Le Couteur DG, Seibel MJ, Waite LM,
Handelsman DJ, Cumming RG (2015). Sarcopenia is associated with incident disability,
institutionalization, and mortality in community-dwelling older men: The Concord Health
and Ageing in Men Project. J Am Med Dir Assoc. 16: 607–613.
150 Murphy RA, Ip EH, Zhang Q, Boudreau RM, Cawthon PM, Newman AB,
Tylavsky FA, Visser M, Goodpaster BH, Harris TB (2014). Transition to sarcopenia
and determinants of transitions in older adults: A population-based study. J Gerontol A
Biol Sci Med Sci. 69: 751–758.
151 Van Den Saffele JK, Goemaere S, De Bacquer D, Kaufman J-M (1999). Serum leptin
levels in healthy ageing men: Are decreased serum testosterone and increased adiposity in
elderly men the consequence of leptin deficiency? Clin Endocrinol. 51: 81–88.
152 Mahmoud AM, Goemaere S, De Bacquer D, Comhaire FH, Kaufman J-M (2000).
Serum inhibin B levels in community-dwelling elderly men. Clin Endocrinol. 53: 141–147.
153 Goemaere S, Van Pottelbergh I, Zmierczak H, Toye K, Daems M, Demuynck R,
Myny H, De Bacquer D, Kaufman J-M (2001). Inverse association between bone
turnover rate and bone mineral density in community-dwelling men >70 years of age: No
major role of sex steroid status. Bone. 29: 286–291.
154 Van Pottelbergh I, Lumbroso S, Goemaere S, Sultan C, Kaufman J-M (2001). Lack of
influence of the androgen receptor gene CAG-repeat polymorphism on sex steroid status
and bone metabolism in elderly men. Clin Endocrinol. 55: 659–666.
155 Van Pottelbergh I, Goemaere S, Nuytinck L, De Paepe A, Kaufman J-M (2001).
Association of the type I collagen alpha1 Sp1 polymorphism, bone density and upper limb
muscle strength in community-dwelling elderly men. Osteoporos Int. 12: 895–901.
156 Van Pottelbergh I, Goemaere S, De Bacquer D, De Paepe A, Kaufman J-M (2002).
Vitamin D receptor gene allelic variants, bone density, and bone turnover in community-
dwelling men. Bone. 31: 631–637.
157 Goemaere S, Zmierczak H, Van Pottelbergh I, Kaufman J-M (2002). Ability of
peripheral bone assessments to predict areal bone mineral density at hip in community-
dwelling elderly men. J Clin Densitom. 5: 219–228.

186
158 Van Pottelbergh I, Goemaere S, Kaufman J-M (2003). Bioavailable estradiol and an
aromatase gene polymorphism are determinants of bone mineral density changes in men
over 70 years of age. J Clin Endocrinol Metab. 88: 3075–3081.
159 Mahmoud AM, Goemaere S, El-Garem Y, Van Pottelbergh I, Comhaire FH,
Kaufman J-M (2003). Testicular volume in relation to hormonal indices of gonadal
function in community-dwelling elderly men. J Clin Endocrinol Metab. 88: 179–184.
160 T’Sjoen G, Goemaere S, De Meyere M, Kaufman J-M (2004). Perception of males’
aging symptoms, health and well-being in elderly community-dwelling men is not related to
circulating androgen levels. Psychoneuroendocrinology. 29: 201–214.
161 Goemaere S, Van Pottelbergh I, Kaufman J-M (2004). Hormonal and genetic
determinants of bone loss in community-dwelling elderly men: A longitudinal population
study. Verh K Acad Geneeskd Belg. 66: 81–95.
162 T’Sjoen GGT, De Vos S, Goemaere S, Van Pottelbergh I, Dierick M, Van
Heeringen C, Kaufman J-M (2005). Sex steroid level, androgen recepter polymorphism,
and depressive symptoms in healthy elderly men. J Am Geriatr Soc. 53: 636–642.
163 Bekaert S, Van Pottelbergh I, De Meyer T, Zmierczak H, Kaufman J-M, Van
Oostveldt P, Goemaere S (2005). Telomere length versus hormonal and bone mineral
status in healthy elderly men. Mech Ageing Dev. 126: 1115–1122.
164 Taes YE, Goemaere S, Huang G, Van Pottelbergh I, De Bacquer D, Verhasselt B,
Van den Broeke C, Delanghe JR, Kaufman J-M (2006). Vitamin D binding protein,
bone status and body composition in community-dwelling elderly men. Bone. 38: 701–707.
165 Crabbe P, Goemaere S, Zmierczak H, Van Pottelbergh I, De Bacquer D, Kaufman
J-M (2006). Are serum leptin and the Gln223Arg polymorphism of the leptin receptor
determinants of bone homeostasis in elderly men? Eur J Endocrinol. 154: 707–714.
166 Lapauw B, Goemaere S, Crabbe P, Kaufman J-M, Ruige JB (2007). Is the effect of
testosterone on body composition modulated by the androgen receptor gene CAG repeat
polymorphism in elderly men? Eur J Endocrinol. 156: 395–401.
167 Bogaert V, Taes YE, Konings P, Van Steen K, De Bacquer D, Goemaere S,
Zmierczak H, Crabbe P, Kaufman J-M (2008). Heritability of blood concentrations of
sex-steroids in relation to body composition in young adult male siblings. Clin Endocrinol.
69: 129–135.
168 Lapauw B, Goemaere S, Zmierczak H, Van Pottelbergh I, Mahmoud A, Taes YE,
De Bacquer D, Vansteelandt S, Kaufman J-M (2008). The decline of serum
testosterone levels in community-dwelling men over 70 years of age: Descriptive data and
predictors of longitudinal changes. Eur J Endocrinol. 159: 459–468.
169 Vanbillemont G, Bogaert V, De Bacquer D, Lapauw B, Goemaere S, Toye K, Van
Steen K, Taes Y, Kaufman J-M (2009). Polymorphisms of the SHBG gene contribute to
the interindividual variation of sex steroid hormone blood levels in young, middle-aged and
elderly men. Clin Endocrinol. 70: 303–310.
170 Fusco D, Lattanzio F, Tosato M, Corsonello A, Cherubini A, Volpato S, Maraldi C,
Ruggiero C, Onder G (2009). Development of CRIteria to assess appropriate Medication
use among Elderly complex patients (CRIME) Project: Rationale and methodology. Drugs
Aging. 26: 3–13.

REFERENCES
187
171 Tosato M, Settanni S, Antocicco M, Battaglia M, Corsonello A, Ruggiero C,
Volpato S, Fabbietti P, Lattanzio F, Bernabei R, Onder G (2013). Pattern of
medication use among older inpatients in seven hospitals in Italy: Results from the
CRIteria to assess appropriate Medication use among Elderly complex patients (CRIME)
Project. Curr Drug Saf. 8: 98–103.
172 Vetrano DL, Landi F, De Buyser SL, Carfì A, Zuccalà G, Petrovic M, Volpato S,
Cherubini A, Corsonello A, Bernabei R, Onder G (2014). Predictors of length of
hospital stay among older adults admitted to acute care wards: A multicentre observational
study. Eur J Intern Med. 25: 56–62.
173 Onder G, Vetrano DL, Cherubini A, Fini M, Mannucci PM, Marengoni A, Monaco
A, Nobili A, Pecorelli S, Russo P, Vitale C, Bernabei R (2014). Prescription drug use
among older adults in Italy: A country-wide perspective. J Am Med Dir Assoc. 15:
531.e11–531.e15.
174 Onder G, Landi F, Fusco D, Corsonello A, Tosato M, Battaglia M, Mastropaolo S,
Settanni S, Antocicco M, Lattanzio F (2014). Recommendations to prescribe in
complex older adults: Results of the CRIteria to assess appropriate Medication use among
Elderly complex patients (CRIME) Project. Drugs Aging. 31: 33–45.
175 Sganga F, Vetrano DL, Volpato S, Lattanzio F (2014). Physical performance measures
and polypharmacy among hospitalized older adults: Results from the CRIME Study. J Nutr
Heal Aging. 18: 616–21.
176 Tosato M, Landi F, Martone AM, Cherubini A, Corsonello A, Volpato S, Bernabei
R, Onder G (2014). Potentially inappropriate drug use among hospitalised older adults:
Results from the CRIME Study. Age Ageing. 43: 767–773.
177 Sganga F, Landi F, Ruggiero C, Corsonello A, Vetrano DL, Lattanzio F, Cherubini
A, Bernabei R, Onder G (2015). Polypharmacy and health outcomes among older adults
discharged from hospital: Results from the CRIME Study. Geriatr Gerontol Int. 15: 141–
146.
178 Sganga F, Landi F, Vetrano DL, Corsonello A, Lattanzio F, Bernabei R, Onder G
(2015). Impact of hospitalization on modification of drug regimens: Results of the CRIteria
to assess appropriate Medication use among Elderly complex patients Study. Geriatr
Gerontol Int. May 28.
179 Yesavage JA, Brink TL, Rose TL, Lum O, Huang V, Adey M, Leirer VO (1983).
Development and validation of a Geriatric Depression Screening Scale: A preliminary
report. J Psychiatr Res. 17: 37–49.
180 Lustgarden MS, Fielding RA (2011). Assessment of analytical methods used to measure
changes in body composition in the elderly and recommendations for their use in phase II
clinical trials. J Nutr Heal Aging. 15: 368–375.
181 Prado CMM, Heymsfield SB (2014). Lean tissue imaging: A new era for nutritional
assessment and intervention. J Parenter Enter Nutr. 38: 940–953.
182 Ware JEJ, Sherbourne CD (1992). The MOS 36-item Short-Form Health Survey (SF-36):
I. Conceptual framework and item selection. Med Care. 30: 473–483.
183 Walters SJ, Munro JF, Brazier JE (2001). Using the SF-36 with older adults: A cross-
sectional community-based survey. Age Ageing. 30: 337–343.

188
184 Bohannon RW, DePasquale L (2010). Physical Functioning Scale of the Short-Form
(SF) 36: Internal consistency and validity with older adults. J Geriatr Phys Ther. 33: 16–18.
185 Stadnyk K, Calder J, Rockwood K (1998). Testing the measurement properties of the
Short Form-36 Health Survey in a frail elderly population. J Clin Epidemiol. 51: 827–835.
186 Wolinsky FD, Wan GJ, Tierney WM (1998). Changes in the SF-36 in 12 months in a
clinical sample of disadvantaged older adults. Med Care. 36: 1589–1598.
187 Steffen T, Seney M (2008). Test-retest reliability and minimal detectable change on
balance and ambulation tests, the 36-item Short-Form Health Survey, and the Unified
Parkinson Disease Rating Scale in people with parkinsonism. Phys Ther. 88: 733–746.
188 Syddall HE, Martin HJ, Harwood RH, Cooper C, Sayer A (2009). The SF-36: A
simple, effective measure of mobility-disability for epidemiological studies. J Nutr Heal
Aging. 13: 57–62.
189 Studenski SA, Perera S, Wallace D, Chandler JM, Duncan PW, Rooney E, Fox M,
Guralnik JM (2003). Physical performance measures in the clinical setting. J Am Geriatr
Soc. 51: 314–322.
190 Linn MW, Linn BS (1982). The Rapid Disability Rating Scale-2. J Am Geriatr Soc. 30:
378–382.
191 Katz S, Ford AB, Moskowitz RW, Jackson BA, Jaffe MW (1963). Studies of illnes in
the aged. The index of ADL: A standardized measure of biological and psychosocial
function. J Am Med Dir Assoc. 185: 914–919.
192 Brorsson B, Asberg KH (1984). Katz index of independence in ADL. Reliability and
validity in short-term care. Scand J Rehabil Med. 16: 125–132.
193 Reijneveld SA, Spijker J, Dijkshoorn H (2007). Katz’ ADL index assessed functional
performance of Turkish, Moroccan, and Dutch elderly. J Clin Epidemiol. 60: 382–388.
194 Cabañero-Martínez MJ, Cabrero-García J, Richart-Martínez M, Muñoz-Mendoza
CL (2009). The Spanish versions of the Barthel index (BI) and the Katz index (KI) of
activities of daily living (ADL): A structured review. Arch Gerontol Geriatr. 49: e77–84.
195 Arik G, Varan HD, Yavuz BB, Karabulut E, Kara O, Kilic MK, Kizilarslanoglu MC,
Sumer F, Kuyumcu ME, Yesil Y, Halil M, Cankurtaran M (2015). Validation of Katz
index of independence in activities of daily living in Turkish older adults. Arch Gerontol
Geriatr. 61: 344–350.
196 Ostir G, Berges I, Kuo Y-F, Goodwin JS, Ottenbacher KJ, Guralnik JM (2012).
Assessing Gait speed in acutely ill older patients admitted to an acute care for elders
hospital unit. Arch Intern Med. 172: 353–358.
197 Bodilsen AC, Juul-Larsen HG, Petersen J, Beyer N, Andersen O, Bandholm T
(2015). Feasibility and inter-rater reliability of physical performance measures in acutely
admitted older medical patients. PLoS One. 10: e0118248.
198 Mijnarends DM, Meijers JMM, Halfens RJG, ter Borg S, Luiking YC, Verlaan S,
Schoberer D, Cruz Jentoft AJ, van Loon LJC, Schols J (2013). Validity and reliability of
tools to measure muscle mass, strength, and physical performance in community-dwelling
older people: A systematic review. J Am Med Dir Assoc. 14: 170–178.
199 Podsiadlo D, Richardson S (1991). The Timed “Up & Go”: A test of basic functional
mobility for frail elderly persons. J Am Geriatr Soc. 39: 142–148.
REFERENCES
189
200 Lin MR, Hwang HF, Hu MH, Wu HD, Wang YW, Huang FC (2004). Psychometric
comparisons of the Timed Up and Go, One-leg stand, Functional reach, and Tinetti
balance measures in community-dwelling older people. J Am Geriatr Soc. 52: 1343–1348.
201 Rockwood K, Awalt E, Carver D, MacKnight C (2000). Feasibility and measurement
properties of the Functional reach and the Timed Up and Go tests in the Canadian Study
of Health and Aging. J Gerontol A Biol Sci Med Sci. 55: M70–M73.
202 Herman T, Giladi N, Hausdorff JM (2011). Properties of the “Timed Up and Go” test:
More than meets the eye. Gerontology. 57: 203–210.
203 Shumway-Cook A, Brauer S, Woollacott M (2000). Predicting the probability for falls in
community-dwelling older adults using the Timed Up & Go test. Phys Ther. 80: 896–903.
204 Steffen TM, Hacker TA, Mollinger L (2002). Age- and gender-related test performance
in community-dwelling elderly people: Six-Minute Walk test, Berg Balance Scale, Timed Up
& Go test, and Gait speeds. Phys Ther. 82: 128–137.
205 Csuka M, McCarty DJ (1985). Simple method for measurement of lower extremity
muscle strength. Am J Med. 78: 77–81.
206 Guralnik JM, Simonsick EM, Ferrucci L, Glynn RJ, Berkman LF, Blazer DG,
Scherr PA, Wallace RB (1994). A Short Physical Performance Battery assessing lower
extremity function: Association with self-reported disability and prediction of mortality and
nursing home admission. J Gerontol. 49: 85–94.
207 Ostchega Y, Harris TB, Hirsch R, Parsons VL, Kington R, Katzoff M (2000).
Reliability and prevalence of physical performance examination assessing mobility and
balance in older persons in the US: Data from the Third National Health and Nutrition
Examination Survey. J Am Geriatr Soc. 48: 1136–1141.
208 Benavent-Caballer V, Sendín-Magdalena A, Lisón JF, Rosado-Calatayud P, Amer-
Cuenca JJ, Salvador-Coloma P, Segura-Ortí E (2015). Physical factors underlying the
Timed “Up and Go” test in older adults. Geriatr Nurs (Minneap). 37: 122–127.
209 Lord SR, Murray SM, Chapman K, Munro B, Tiedemann A (2002). Sit-to-stand
performance depends on sensation, speed, balance, and psychological status in addition to
strength in older people. J Gerontol A Biol Sci Med Sci. 57: M539–M543.
210 Cooper R, Rebecca H, Sayer A, Kuh D (2014). A life course approach to physical
capability. In: A life course approach to healthy ageing. Oxford University Press. p. 16–31.
211 Rossiter-Fornoff J, Wolf S, Wolfson L, Buchner D (1995). A cross-sectional validation
study of the FICSIT common data base static balance measures. Frailty and Injuries:
Cooperative Studies of Intervention Techniques. J Gerontol A Biol Sci Med Sci. 50:
M291–297.
212 Manini TM, Clark BC (2012). Dynapenia and aging: An update. J Gerontol A Biol Sci
Med Sci. 67 A: 28–40.
213 Roberts HC, Denison HJ, Martin HJ, Patel HP, Syddall H, Cooper C, Sayer AA
(2011). A review of the measurement of Grip strength in clinical and epidemiological
studies: Towards a standardised approach. Age Ageing. 40: 423–429.
214 Innes E (1999). Handgrip strength testing: A review of the literature. Aust Occup Ther J.
46: 120–140.

190
215 Stratford PW, Norman GR, McIntosh JM (1989). Generalizability of Grip strength
measurements in patients with tennis elbow. Phys Ther. 69: 276–281.
216 Lumley T (2004). The survival package. R news. 4: 26–28.
217 Rosner B (2000). The proportional-hazards model. Fundamentals of biostatistics.
218 Crawley M (2014). Statistics: An introduction using R.
219 Walters SJ (2009). What is a Cox model? [Internet]. Available from:
http://www.whatisseries.co.uk
220 Van Maele G, Deschepper E, Buysse H, Coorevits P (2011). Statistische
gegevensverwerking met behulp van IBM SPSS STATISTICS 19. University Press.
221 Therneau T, Crowson C (2015). Using time dependent covariates and time dependent
coefficients in the Cox model [Internet]. Available from: https://cran.r-
project.org/web/packages/survival/vignettes/timedep.pdf
222 De Buyser SL, Petrovic M, Taes YE, Toye KRC, Kaufman J-M, Goemaere S (2013).
Physical function measurements predict mortality in ambulatory older men. Eur J Clin
Invest. 43: 379–86.
223 Hays RD, Sherbourne CD, Mazel RM (1993). The RAND 36-Item Health Survey 1.0.
Heal Econ. 2: 217–227.
224 Bohannon RW (1995). Sit-to-stand test for measuring performance of lower extremity
muscles. Percept Mot Ski. 80: 163–166.
225 Bilotta C, Nicolini P, Casè A, Pina G, Rossi S, Vergani C (2012). Frailty syndrome
diagnosed according to the Study of Osteoporotic Fractures (SOF) criteria and adverse
health outcomes among community-dwelling older outpatients in Italy. A one-year
prospective cohort study. Arch Gerontol Geriatr. 54: e23–28.
226 Koopmans B, Nielen MM, Schellevis FG, Korevaar JC (2012). Non-participation in
population-based disease prevention programs in general practice. BMC Public Health. 12:
856.
227 Langhammer A, Krokstad S, Romundstad P, Heggland J, Holmen J (2012). The
HUNT Study: Participation is associated with survival and depends on socioeconomic
status, diseases and symptoms. BMC Med Res Methodol. 12: 143.
228 Guralnik JM, Branch LG, Cummings SR, Curb JD (1989). Physical performance
measures in aging research. J Gerontol A Biol Sci Med Sci. 44: M141–146.
229 Applegate WB, Blass JP, Williams TF (1990). Instruments for the functional assessment
of older patients. N Engl J Med. 322: 1207–1214.
230 Tinetti ME, Ginter SF (1988). Identifying mobility dysfunctions in elderly patients.
Standard neuromuscular examination or direct assessment? J Am Med Dir Assoc. 259:
1190–1193.
231 Lawton MP, Brody EM (1969). Assessment of older people: Self-maintaining and
instrumental activities of daily living. Gerontologist. 9: 179–186.
232 von Elm E, Altman DG, Egger M, Pocock SJ, Gotzsche PC, Vandenbroucke JP
(2007). The Strengthening the Reporting of Observational Studies in Epidemiology
(STROBE) statement: Guidelines for reporting observational studies. Lancet. 370: 1453–
1457.

REFERENCES
191
233 Simera I, Moher D, Hoey J, Schulz KF, Altman DG (2010). A catalogue of reporting
guidelines for health research. Eur J Clin Invest. 40: 35–53.
234 Bechtol CO (1954). Grip test: The use of a dynamometer with adjustable handle spacings.
J Bone Jt Surg Am. 36-A: 820–824.
235 Cahn L, Diesfeldt H (1973). Psychologisch onderzoek van psychisch gestoorde bejaarden
met behulp van diapositieven. Ned T Geront. 4: 256 – 263.
236 Demarest S, Leurquin P, Tafforeau J, Tellier V, Van der Heyden J, Van Oyen H
(1998). De gezondheid van de bevolking in België. Gezondheidsenquête door middel van
interview, België, 1997 [Internet]. Wet Inst Volksgezond. Available from:
https://www.wiv-isp.be/epidemio/epinl/crospnl/hisnl/table97.htm
237 Tice JA, Kanaya A, Hue T, Rubin S, Buist DS, Lacroix A, Lacey JVJ, Cauley JA,
Litwack S, Brinton LA, Bauer DC (2006). Risk factors for mortality in middle-aged
women. Arch Intern Med. 166: 2469–2477.
238 Cesari M, Onder G, Zamboni V, Manini T, Shorr RI, Russo A, Bernabei R, Pahor
M, Landi F (2008). Physical function and self-rated health status as predictors of
mortality: Results from longitudinal analysis in the ilSIRENTE Study. BMC Geriatr. 8: 34.
239 Rantanen T (2003). Muscle strength, disability and mortality. Scand J Med Sci Sports. 13:
3–8.
240 Rolland Y, Lauwers-Cances V, Cesari M, Vellas B, Pahor M, Grandjean H (2006).
Physical performance measures as predictors of mortality in a cohort of community-
dwelling older French women. Eur J Epidemiol. 21: 113–122.
241 Takata Y, Ansai T, Soh I, Awano S, Yoshitake Y, Kimura Y, Nakamichi I, Goto K,
Fujisawa R, Sonoki K, Yoshida A, Toyoshima K, Nishihara T (2012). Physical fitness
and 6.5-year mortality in an 85-year-old community-dwelling population. Arch Gerontol
Geriatr. 54: 28–33.
242 Gale CR, Martyn CN, Cooper C, Sayer AA (2007). Grip strength, body composition,
and mortality. Int J Epidemiol. 36: 228–235.
243 Viccaro LJ, Perera S, Studenski SA (2011). Is Timed Up and Go better than Gait speed
in predicting health, function, and falls in older adults? J Am Geriatr Soc. 59: 887–892.
244 Hoshide S, Ishikawa J, Eguchi K, Oowada T, Shimada K, Kario K (2008). Cognitive
dysfunction and physical disability are associated with mortality in extremely elderly
patients. Hypertens Res. 31: 1331–1338.
245 Davis DH, Rockwood MR, Mitnitski AB, Rockwood K (2011). Impairments in
mobility and balance in relation to frailty. Arch Gerontol Geriatr. 53: 79–83.
246 Rantanen T, Masaki K, Foley D, Izmirlian G, White L, Guralnik JM (1998). Grip
strength changes over 27 yr in Japanese-American men pulmonary disease. J Appl Physiol.
85: 2047–2053.
247 Mandic S, Myers J, Oliveira RB, Abella J, Froelicher VF (2010). Characterizing
differences in mortality at the low end of the fitness spectrum in individuals with
cardiovascular disease. Eur J Cardiovasc Prev Rehabil. 17: 289–295.
248 Pinto-Plata VM, Cote C, Cabral H, Taylor J, Celli BR (2004). The 6-min walk distance:
change over time and value as a predictor of survival in severe COPD. Eur Respir J. 23:
28–33.

192
249 Kokkinos P, Myers J, Nylen E, Panagiotakos DB, Manolis A, Pittaras A, Blackman
MR, Jacob-Issac R, Faselis C, Abella J, Singh S, Okkinos PEK, Anagiotakos DEBP,
Ingh STS (2009). Exercise capacity and all-cause mortality in African American and
Caucasian men with type 2 diabetes. Diabetes Care. 32: 623–628.
250 Studenski SA, Perera S, Patel K, Rosano C, Faulkner K, Inzitari M, Brach J,
Chandler J, Cawthon P, Connor EB, Nevitt M, Visser M, Kritchevsky S, Badinelli S,
Harris T, Newman AB, Cauley J, Ferrucci L, Guralnik J (2011). Gait speed and
survival in older adults. J Am Med Dir Assoc. 305: 50–58.
251 Leong DP, Teo KK, Rangarajan S, Lopez-jaramillo P, Avezum Jr A, Orlandini A,
Seron P, Ahmed SH, Fraser S (2015). Prognostic value of Grip strength: Findings from
the Prospective Urban Rural Epidemiology (PURE) Study. Lancet. 386: 266–273.
252 Legrand D, Vaes B, Matheï C, Adriaensen W, Van Pottelbergh G, Degryse J (2014).
Muscle strength and physical performance as predictors of mortality, hospitalization, and
disability in the oldest old. J Am Geriatr Soc. 62: 1030–1038.
253 Furuna T, Nagasaki H, Nishizawa S, Sugiura M, Okuzumu H, Ito H, Kinugasa T,
Hashizume K, Maruyama H (1998). Longitudinal change in the physical performance of
older adults in the community. J Jpn Phy Ther Assoc. 1: 1–5.
254 Onder G, Penninx BWJH, Lapuerta P, Fried LP, Ostir G, Guralnik JM, Pahor M
(2002). Change in physical performance over time in older women: The Women’s Health
and Aging Study. J Gerontol A Biol Sci Med Sci. 57: M289–293.
255 Visser M, Pluijm SMF, Stel VS, Bosscher RJ, Deeg DJH (2002). Physical activity as a
determinant of change in mobility performance: The Longitudinal Aging Study
Amsterdam. J Am Geriatr Soc. 50: 1774–1781.
256 Dodds RM, Syddall HE, Cooper R, Benzeval M, Deary IJ, Dennison EM, Der G,
Gale CR, Inskip HM, Jagger C, Kirkwood TB, Lawlor DA, Robinson SM, Starr JM,
Steptoe A, Tilling K, Kuh D, Cooper C, Sayer AA (2014). Grip Strength across the life
course: Normative data from twelve British studies. PLoS One. 9: e113637.
257 Artaud F, Singh-Manoux A, Dugravot A, Tzourio C, Elbaz A (2015). Decline in fast
Gait speed as a predictor of disability in older adults. J Am Geriatr Soc. 63: 1129–1136.
258 Kroenke CH, Kubzansky LD, Adler N, Kawachi I (2008). Prospective change in
health-related quality of life and subsequent mortality among middle-aged and older
women. Am J Public Health. 98: 2085–2091.
259 Otero-Rodriguez A, Leon-Munoz LM, Balboa-Castillo T, Banegas JR, Rodriguez-
Artalejo F, Guallar-Castillon P (2010). Change in health-related quality of life as a
predictor of mortality in the older adults. Qual Life Res. 19: 15–23.
260 White DK, Neogi T, Nevitt MC, Peloquin CE, Zhu Y, Boudreau RM, Cauley JA,
Ferrucci L, Harris TB, Satterfield SM, Simonsick EM, Strotmeyer ES, Zhang Y
(2013). Trajectories of Gait speed predict mortality in well-functioning older adults: The
Health, Aging and Body Composition Study. J Gerontol A Biol Sci Med Sci. 68: 546–564.
261 Gill TM, Williams CS, Mendes de Leon CF, Tinetti ME (1997). The role of change in
physical performance in determining risk for dependence in activities of daily living among
nondisabled community- living elderly persons. J Clin Epidemiol. 50: 765–772.

REFERENCES
193
262 Maguire PA, Taylor IANC, Stout RW (1986). Elderly patients in acute medical wards:
Factors predicting length of stay in hospital. Br Med J (Clin Res Ed). 292: 1251–1253.
263 Kerr A, Syddall HE, Cooper C, Turner GF, Briggs RS, Sayer AA (2006). Does
admission Grip strength predict length of stay in hospitalised older patients? Age Ageing.
35: 82–84.
264 Roberts HC, Syddall HE, Cooper C, Aihie Sayer A (2012). Is Grip strength associated
with length of stay in hospitalised older patients admitted for rehabilitation? Findings from
the Southampton Grip Strength Study. Age Ageing. 41: 641–646.
265 Alarcón T, Bárcena A, González-Montalvo JI, Penãlosa C, Salgado A (1999). Factors
predictive of outcome on admission to an acute geriatric ward. Age Ageing. 28: 429–432.
266 Campbell SE, Seymour DG, Primrose WR (2004). A systematic literature review of
factors affecting outcome in older medical patients admitted to hospital. Age Ageing. 33:
110–115.
267 Volpato S, Cavalieri M, Guerra G, Sioulis F, Ranzini M, Maraldi C, Fellin R,
Guralnik JM (2008). Performance-based functional assessment in older hospitalized
patients: Feasibility and clinical correlates. J Gerontol A Biol Sci Med Sci. 63: 1393–1398.
268 De Buyser SL, Petrovic M, Taes YE, Vetrano DL, Corsonello A, Volpato S, Onder
G (2014). Functional changes during hospital stay in older patients admitted to an acute
care ward: A multicenter observational study. PLoS One. 9: e96398.
269 Folstein M, Robins L, Helzer J (1983). The Mini-Mental State Examination. Arch Gen
Psychiatry. 40: 812.
270 Parmelee PA, Lawton MP, Katz IR (1989). Psychometric properties of the Geriatric
Depression Scale among the institutionalized aged. Psychol Assess A J Consult Clin
Psychol. 1: 331–338.
271 Lauretani F, Russo CR, Bandinelli S, Bartali B, Cavazzini C, Di Iorio A, Corsi AM,
Rantanen T, Guralnik JM, Ferrucci L (2003). Age-associated changes in skeletal
muscles and their effect on mobility: An operational diagnosis of sarcopenia. J Appl
Physiol. 95: 1851–1860.
272 Sallinen J, Stenholm S, Rantanen T, Heliövaara M, Sainio P, Koskinen S (2010).
Hand-Grip strength cut points to screen older persons at risk for mobility limitation. J Am
Geriatr Soc. 58: 1721–1726.
273 Nagelkerke N (1991). A note on a general definition of the coefficient of determination.
Biometrika. 78: 691–692.
274 Nobili A, Licata G, Salerno F, Pasina L, Tettamanti M, Franchi C, De Vittorio L,
Marengoni A, Corrao S, Iorio A, Marcucci M, Mannucci PM (2011). Polypharmacy,
length of hospital stay, and in-hospital mortality among elderly patients in internal medicine
wards. The REPOSI Study. Eur J Clin Pharmacol. 67: 507–519.
275 Campbell SE, Seymour DG, Primrose WR, Lynch JE, Dunstan E, Espallargues M,
Lamura G, Lawson P, Philp I, Mestheneos E, Politynska B, Raiha I (2005). A multi-
centre European study of factors affecting the discharge destination of older people
admitted to hospital: Analysis of in-hospital data from the ACMEplus Project. Age Ageing.
34: 467–475.

194
276 Graves N, Birrell F, Whitby M (2005). Effect of pressure ulcers on length of hospital
stay. Infect Control Hosp Epidemiol. 26: 293–297.
277 Lang P-O, Heitz D, Hédelin G, Dramé M, Jovenin N, Ankri J, Somme D, Novella
J-L, Gauvain JB, Couturier P, Voisin T, De Wazière B, Gonthier R, Jeandel C, Jolly
D, Saint-Jean O, Blanchard F (2006). Early markers of prolonged hospital stays in older
people: A prospective, multicenter study of 908 inpatients in French acute hospitals. J Am
Geriatr Soc. 54: 1031–1039.
278 Gan N, Large J, Basic D, Jennings N (2006). The Timed Up and Go Test does not
predict length of stay on an acute geriatric ward. Aust J Physiother. 52: 141–144.
279 Purser JL, Weinberger M, Cohen HJ, Pieper CF, Morey MC, Li T, Williams GR,
Lapuerta P (2005). Walking speed predicts health status and hospital costs for frail elderly
male veterans. J Rehabil Res Dev. 42: 535–546.
280 Espallargues M, Philp I, Seymour DG, Campbell SE, Primrose W, Arino S,
Dunstan E, Lamura G, Lawson P, Mestheneos E, Politynska B, Raiha I (2008).
Measuring case-mix and outcome for older people in acute hospital care across Europe:
The development and potential of the ACMEplus Instrument. QJM. 101: 99–109.
281 Onder G, Landi F, Liperoti R, Fialova D, Gambassi G, Bernabei R (2005). Impact of
inappropriate drug use among hospitalized older adults. Eur J Clin Pharmacol. 61: 453–
459.
282 Incalzi RA, Capparella O, Gemma A, Landi F, Bruno E, Di Meo F, Carbonin P
(1997). The interaction between age and comorbidity contributes to predicting the
mortality of geriatric patients in the acute-care hospital. J Intern Med. 242: 291–298.
283 Van Nes MC, Herrmann FR, Gold G, Michel JP, Rizzoli R (2001). Does the Mini
Nutritional Assessment predict hospitalization outcomes in older people? Age Ageing. 30:
221–226.
284 Reuben DB, Seeman TE, Keeler E, Hayes RP, Bowman L, Sewall A, Hirsch SH,
Wallace RB, Guralnik JM (2004). Refining the categorization of physical functional
status: The added value of combining self-reported and performance-based measures. J
Gerontol A Biol Sci Med Sci. 59: 1056–1061.
285 Studenski SA (2012). Gait speed in hospitalized older people. Arch Intern Med. 172: 358–
359.
286 Italian National Institute of Statistics (2004). Italy in figures [Internet]. Available from:
www.istat.it/en/files/2011/06/italyinfigures2004.pdf
287 Eurostat. European health statistics: Health status [Internet]. Available from:
http://epp.eurostat.ec.europa.eu/portal/page/portal/health/health_status_determinants/
data/main_tables
288 Italian National Institute of Statistics. Hospitalizations for acute care by nationality
with reference to the place of hospitalization [Internet]. Available from:
http://dati.istat.it/Index.aspx?DataSetCode=DCIS_OSPSTRA&Lang=
289 Eurostat. European health statistics: Curative care beds in hospitals [Internet]. Available
from:
http://epp.eurostat.ec.europa.eu/tgm/refreshTableAction.do?tab=table&plugin=1&pcode
=tps00168&language=en
REFERENCES
195
290 Italian National Institute of Statistics. Outpatient and residential facilities [Internet].
Available from:
http://dati.istat.it/Index.aspx?DataSetCode=DCIS_STRSANDISTR&Lang
291 Italian National Institute of Statistics. Outpatient and residential facilities: Activities of
outpatient and residential facilities [Internet]. Available from:
http://dati.istat.it/Index.aspx?lang=en&SubSessionId=53f8b576-c9b4-4145-b63e-
c44457649d8f&themetreeid=36
292 Bernabei R, Landi F, Zuccalà G (2002). Health care for older persons in Italy. Aging
Clin Exp Res. 14: 247–251.
293 Inouye SK, Peduzzi PN, Robison JT, Hughes JS, Horwitz RI, Concato J (1998).
Importance of functional measures in predicting mortality among older hospitalized
patients. J Am Med Dir Assoc. 279: 1187–1193.
294 Hoenig H, Rubenstein L (1991). Hospital-associated deconditioning and dysfunction. J
Am Geriatr Soc. 39: 220–222.
295 Creditor MC (1993). Hazards of hospitalization of the elderly. Ann Intern Med. 118: 219–
223.
296 Landefeld C, Palmer R (1995). A randomized trial of care in a hospital medical unit
especially designed to improve the functional outcomes of acutely ill older patients. N Engl
J Med. 332: 1338–1344.
297 Palleschi L, De Alfieri W, Salani B, Fimognari FL, Marsilii A, Pierantozzi A, Di
Cioccio L, Zuccaro SM (2011). Functional recovery of elderly patients hospitalized in
geriatric and general medicine units. The progetto dimissioni in geriatria study. J Am
Geriatr Soc. 59: 193–199.
298 Covinsky KE, Palmer RM, Fortinsky RH, Counsell SR, Stewart AL, Kresevic D,
Burant CJ, Landefeld CS (2003). Loss of independence in activities of daily living in
older adults hospitalized with medical illnesses: Increased vulnerability with age. J Am
Geriatr Soc. 51: 451–458.
299 Sleiman I, Rozzini R, Barbisoni P, Morandi A, Ricci A, Giordano A, Trabucchi M
(2009). Functional trajectories during hospitalization: A prognostic sign for elderly patients.
J Gerontol A Biol Sci Med Sci. 64: 659–663.
300 Mahoney F, Barthel D (1965). Functional evaluation: The Barthel index. Maryl State Med
J. 14: 61–65.
301 Sager M, Dunham N, Schwantes A, Mecum L, Halverson K, Harlowe D (1992).
Measurement of activities of daily living in hospitalized elderly: A comparison of self-
report and performance-based methods. J Am Geriatr Soc. 40: 457–462.
302 Blè A, Volpato S, Pacetti M, Zuliani G (2003). Emotional vitality and change in lower
extremity function after acute medical illness and hospitalization. J Am Geriatr Soc. 51:
1814–1824.
303 Corsonello A, Pedone C, Lattanzio F, Lucchetti M, Garasto S, Di Muzio M, Giunta
S, Onder G, Di Iorio A, Volpato S, Corica F, Mussi C, Antonelli Incalzi R (2009).
Potentially inappropriate medications and functional decline in elderly hospitalized
patients. J Am Geriatr Soc. 57: 1007–1014.

196
304 Brown CJ, Friedkin RJ, Inouye SK (2004). Prevalence and outcomes of low mobility in
hospitalized older patients. J Am Geriatr Soc. 52: 1263–1270.
305 Fortinsky R, Covinsky KE, Palmer RM, Landefeld CS (1999). Effects of functional
status changes before and during hospitalization on nursing home admission of older
adults. J Gerontol A Biol Sci Med Sci. 54: 521–526.
306 Bodilsen AC, Pedersen MM, Petersen J, Beyer N, Andersen O, Smith LL, Kehlet H,
Bandholm T (2013). Acute hospitalization of the older patient: Changes in muscle
strength and functional performance during hospitalization and 30 days after discharge.
Am J Phys Med Rehabil. 92: 789–796.
307 Bautmans I, Njemini R, Lambert M, Demanet C, Mets T (2005). Circulating acute
phase mediators and skeletal muscle performance in hospitalized geriatric patients. J
Gerontol A Biol Sci Med Sci. 60: 361–367.
308 Bean JF, Olveczky DD, Kiely DK, LaRose SI, Jette AM (2011). Performance-based
versus patient-reported physical function: What are the underlying predictors? Phys Ther.
91: 1804–1811.
309 Wittink H, Rogers W, Sukiennik A, Carr DB (2003). Physical functioning: Self-report
and performance measures are related but distinct. Spine (Phila Pa 1976). 28: 2407–2413.
310 Diehr PH, Thielke SM, Newman AB, Hirsch C, Tracy R (2013). Decline in health for
older adults: Five-year change in 13 key measures of standardized health. J Gerontol A Biol
Sci Med Sci. 68: 1059–1067.
311 Perera S, Mody SH, Woodman RC, Studenski SA (2006). Meaningful change and
responsiveness in common physical performance measures in older adults. J Am Geriatr
Soc. 54: 743–749.
312 Alley D, Hicks G, Shardell M, Hawkes W, Miller R, Craik RL, Mangione K, Orwig
D, Hochberg M, Resnick B, Magaziner J (2011). Meaningful improvement in Gait
speed in hip fracture recovery. J Am Geriatr Soc. 59: 1650–1657.
313 Nitschke J, McMeeken J, Burry H, Matyas T (1999). When is a change a genuine
change? A clinically meaningful interpretation of Grip strength measurements in healthy
and disabled women. J Hand Ther. 12: 25–30.
314 Volpato S, Cavalieri M, Sioulis F, Guerra G, Maraldi C, Zuliani G, Fellin R,
Guralnik JM (2011). Predictive value of the Short Physical Performance Battery following
hospitalization in older patients. J Gerontol A Biol Sci Med Sci. 66: 89–96.
315 Covinsky K, Justice A, Rosenthal GE, Palmer RM, Landefeld CS (1997). Measuring
prognosis and case mix in hospitalized elders. J Gen Intern Med. 12: 203–208.
316 Panas LJ, Siordia C, Angel RJ, Eschbach K, Markides KS (2013). Physical
performance and short-term mortality in very old Mexican Americans. Exp Aging Res. 39:
481–492.
317 De Buyser SL, Petrovic M, Taes YE, Toye KRC, Kaufman J-M, Lapauw B,
Goemaere S (2016). Validation of the FNIH sarcopenia criteria and SOF frailty index as
predictors of long-term mortality in ambulatory older men. Age Ageing. afw071.
318 Valizadeh M, Mazloomzadeh S, Golmohammadi S, Larijani B (2012). Mortality after
low trauma hip fracture: A prospective cohort study. BMC Musculoskelet Disord. 13: 143.

REFERENCES
197
319 Vilalta-Franch J, López-Pousa S, Calvó-Perxas L, Garre-Olmo J (2013). Psychosis of
Alzheimer’s disease: Prevalence, incidence, persistence, risk factors, and mortality. Am J
Geriatr Psychiatry. 21: 1135–1143.
320 Laan W, Zuithoff NPA, Drubbel I, Bleijenberg N, Numans ME, De Wit NJ,
Schuurmans MJ (2015). Validity and reliability of the Katz-15 Scale to measure
unfavorable health outcomes in community-dwelling older people. J Nutr Heal Aging. 18:
848–854.
321 Tsai S-Y, Chi L-Y, Lee C-H, Chou P (2007). Health-related quality of life as a predictor
of mortality among community-dwelling older persons. Eur J Epidemiol. 22: 19–26.
322 Masel M, Ostir G, Ottenbacher K (2010). Frailty, mortality, and health-related quality of
life in older Mexican Americans. J Am Geriatr Soc. 58: 2149–2153.
323 Sayer AA, Kirkwood TBL (2015). Grip strength and mortality: A biomarker of ageing?
Lancet. 386: 226–227.
324 Idland G, Engedal K, Bergland A (2013). Physical performance and 13.5-year mortality
in elderly women. Scand J Public Health. 41: 102–108.
325 Arnau A, Espaulella J, Mendez T, Serrarols M, Canudas J, Formiga F, Ferrer M
(2016). Lower limb function and 10-year survival in population aged 75 years and older.
Fam Pract. 33: 10–16.
326 Goldman N, Glei DA, Rosero-Bixby L, Chiou S-T, Weinstein M (2014).
Performance-based measures of physical function as mortality predictors: Incremental
value beyond self-reports. Demogr Res. 30: 227–252.
327 Markides KS, Black SA, Ostir G, Angel RJ, Guralnik JM, Lichtenstein M (2001).
Lower body function and mortality in Mexican American elderly people. J Gerontol A Biol
Sci Med Sci. 56: M243–M247.
328 Beloosesky Y, Weiss A, Grinblat J, Brill S, Hershkovitz A (2004). Can functional
status, after rehabilitation, independently predict long-term mortality of hip-fractured
elderly patients? Aging Clin Exp Res. 16: 44–48.
329 Tice JA, Kanaya A, Hue T, Rubin S, Buist DSM, Lacroix A, Lacey J, Cauley JA,
Litwack S, Brinton LA, Bauer DC (2006). Risk factors for mortality in middle-aged
women. Arch Intern Med. 166: 2469–2477.
330 Wong RY, Miller WC (2008). Adverse outcomes following hospitalization in acutely ill
older patients. BMC Geriatr. 8: 10.
331 Robinson T, Wu D, Sauaia A, Dunn C, Stevens-Lapsley J, Moss M, Stiegmann G,
Gajdos C, Cleveland J, Inouye SK (2013). Slower Walking speed forecasts increased
postoperative morbidity and one-year mortality across surgical specialties. Ann Surg. 258:
582–590.
332 Roshanravan B, Robinson-Cohen C, Patel K, Ayers E, Littman AJ, de Boer IH,
Ikizler TA, Himmelfarb J, Katzel LI, Kestenbaum B, Seliger S (2013). Association
between physical performance and all-cause mortality in CKD. J Am Soc Nephrol. 24:
822–830.

198
333 Ferrat E, Paillaud E, Laurent M, Le Thuaut A, Caillet P, Tournigand C, Lagrange
J-L, Canouï-Poitrine F, Bastuji-Garin S (2015). Predictors of 1-year mortality in a
prospective cohort of elderly patients with cancer. J Gerontol A Biol Sci Med Sci. 70:
1148–1155.
334 Di Iorio A, Longo A, Mitidieri Costanza A, Palmerio T, Benvenuti E (1999). Factors
related to the length of in-hospital stay of geriatric patients. Aging Clin Exp Res. 11: 150–
154.
335 Carpenter I, Bobby J, Kulinskaya E, Seymour G (2007). People admitted to hospital
with physical disability have increased length of stay: Implications for diagnosis related
group re-imbursement in England. Age Ageing. 36: 73–78.
336 Matzen LE, Jepsen DB, Ryg J, Masud T (2012). Functional level at admission is a
predictor of survival in older patients admitted to an acute geriatric unit. BMC Geriatr. 12:
32.
337 De Buyser SL, Petrovic M, Taes YE, Vetrano DL, Onder G (2014). A
multicomponent approach to identify predictors of hospital outcomes in older in-patients:
A multicentre observational study. PLoS One. 9: e115413.
338 Palleschi L, Fimognari FL, Pierantozzi A, Salani B, Marsilii A, Zuccaro SM, Di
Cioccio L, De Alfieri W (2014). Acute functional decline before hospitalization in older
patients. Geriatr Gerontol Int. 14: 769–777.
339 Zisberg A, Shadmi E, Sinoff G, Gur-Yaish N, Srulovici E, Admi H (2011). Low
mobility during hospitalization and functional decline in older adults. J Am Geriatr Soc. 59:
266–273.
340 Zaslavsky O, Zisberg A, Shadmi E (2015). Impact of functional change before and
during hospitalization on functional recovery 1 month following hospitalization. J
Gerontol A Biol Sci Med Sci. 70: 379–384.
341 Merino Martín S, Cruz-Jentoft A (2012). Impact of hospital admission on functional and
cognitive measures in older subjects. Eur Geriatr Med. 3: 208–212.
342 Cesari M, Rolland Y, Abellan Van Kan G, Bandinelli S, Vellas B, Ferrucci L (2014).
Sarcopenia-related parameters and incident disability in older persons: Results from the
“Invecchiare in Chianti” Study. J Gerontol A Biol Sci Med Sci. 70: 457–463.
343 Sayer AA, Syddall HE, Martin HJ, Dennison EM, Roberts HC, Cooper C (2006). Is
Grip strength associated with health-related quality of life? Findings from the
Hertfordshire Cohort Study. Age Ageing. 35: 409–415.
344 Baztan JJ, Suarez-Garcia FM, Lopez-Arrieta J, Rodriguez-Manas L, Rodriguez-
Artalejo F (2009). Effectiveness of acute geriatric units on functional decline, living at
home, and case fatality among older patients admitted to hospital for acute medical
disorders: Meta-analysis. BMJ. 338: b50.
345 Boyd CM, Landefeld CS, Counsell SR, Robert M, Fortinsky RH, Kresevic D (2008).
Recovery in activities of dialy living among older adults following hospitalization for acute
medical illness. J Am Geriatr Soc. 56: 2171–2179.

REFERENCES
199
346 Pahor M, Guralnik JM, Ambrosius WT, Blair S, Bonds DE, Church TS, Espeland
MA, Fielding RA, Gill TM, Groessl EJ, King AC, Kritchevsky SB, Manini TM,
McDermott MM, Miller ME, Newman AB, Rejeski WJ, Sink KM, Williamson JD,
for the LIFE Study investigators (2014). Effect of structured physical activity on
prevention of major mobility disability in older adults: The LIFE Study randomized clinical
trial. J Am Med Dir Assoc. 311: 2387–2396.
347 Bibas L, Levi M, Bendayan M, Mullie L, Formand DE, Afilalo J (2014). Therapeutic
interventions for frail elderly patients: Part I. Published randomized trials. Prog Cardiovasc
Dis. 57: 134–143.
348 Freiberger E, De vreede P, Schoene D, Rydwik E, Mueller V, Fr??ndin K, Hopman-
Rock M (2012). Performance-based physical function in older community-dwelling
persons: A systematic review of instruments. Age Ageing. 41: 712–721.
349 Peterson MD, Sen A, Gordon PM (2011). Influence of resistance exercise on lean body
mass in aging adults: A meta-analysis. Med Sci Sport Exerc. 43: 249–258.
350 Theou O, Stathokostas L, Roland KP, Jakobi JM, Patterson C, Vandervoort AA,
Jones GR (2011). The effectiveness of exercise interventions for the management of
frailty: A systematic review. J Aging Res. 2011: 569194.
351 Cadore EL, Rodríguez-Mañas L, Sinclair A, Izquierdo M (2013). Effects of different
exercise interventions on risk of falls, gait ability, and balance in physically frail older adults:
A systematic review. Rejuvenation Res. 16: 105–114.
352 Milne A, Potter J, Avenell A (2009). Protein and energy supplementation in elderly
people at risk from malnutrition. Cochrane Database Syst Rev. April 15: CD003288.
353 Bauer J, Biolo G, Cederholm T, Cesari M, Cruz-Jentoft AJ, Morley JE, Phillips S,
Sieber C, Stehle P, Teta D, Visvanathan R, Volpi E, Boirie Y (2013). Evidence-based
recommendations for optimal dietary protein intake in older people: A position paper from
the PROT-AGE Study Group. J Am Med Dir Assoc. 14: 542–559.
354 Beaudart C, Buckinx F, Rabenda V, Gillain S, Cavalier E, Slomian J, Petermans J,
Reginster J-Y, Bruyère O (2014). The effects of vitamin D on skeletal muscle strength,
muscle mass and muscle power: A systematic review and meta-analysis of randomized
controlled trials. J Clin Endocrinol Metab. 99: jc20141742.
355 British Geriatrics Society (2014). Fit for frailty. British Geriatrics Society.
356 Morley JE, Argiles JM, Evans WJ, Bhasin S, Cella D, Deutz NEP, Doehner W,
Fearon KCH, Ferrucci L, Hellerstein MK, Kalantar-Zadeh K, Lochs H, MacDonald
N, Mulligan K, Muscaritoli M, Ponikowski P, Posthauer ME, Fanelli FR,
Schambelan M, Schols AMWJ, Schuster MW, Anker SD (2010). Nutritional
recommendations for the management of sarcopenia. J Am Med Dir Assoc. 11: 391–396.
357 Calvani R, Miccheli A, Landi F, Bossola M, Cesari M, Leeuwenburgh C, Sieber CC,
Bernabei R, Marzetti E (2013). Current nutritional recommendations and novel dietary
strategies to manage sarcopenia. J Frailty Aging. 2: 38–53.
358 Bendayan M, Bibas L, Levi M, Mullie L, Forman DE, Afilalo J (2014). Therapeutic
interventions for frail elderly patients: Part II. Ongoing and unpublished randomized trials.
Prog Cardiovasc Dis. 57: 144–151.

200
359 Denison HJ, Cooper C, Sayer AA, Robinson SM (2015). Prevention and optimal
management of sarcopenia: A review of combined exercise and nutrition interventions to
improve muscle outcomes in older people. Clin Interv Aging. 10: 859–869.
360 Cermak NM, Res PT, de Groot LC, Saris WHM, van Loon LJC (2012). Protein
supplementation augments the adaptive response of skeletal muscle to resistance-type
exercise training: A meta-analysis. Am J Clin Nutr. 96: 1454–1464.
361 Laosa O, Alonso C, Castro M, Rodriguez-Manas L (2014). Pharmaceutical
interventions for frailty and sarcopenia. Curr Pharm Des. 20: 3068–3082.
362 Ottenbacher KJ, Ottenbacher ME, Ottenbacher AJ, Alfaro Acha A, Ostir G (2006).
Androgen treatment and muscle strength in elderly males: A meta-analysis. J Am Geriatr
Soc. 54: 1666–1673.
363 Calof OM, Singh AB, Lee ML, Kenny AM, Urban RJ, Tenover JL, Bhasin S (2005).
Adverse events associated with testosterone replacement in middle-aged and older men: A
meta-analysis of randomized, placebo-controlled trials. J Gerontol A Biol Sci Med Sci. 60A:
1451–1457.
364 Fernández-Balsells MM, Murad MH, Lane M, Lampropulos JF, Albuquerque F,
Mullan RJ, Agrwal N, Elamin MB, Gallegos-Orozco JF, Wang AT, Erwin PJ,
Bhasin S, Montori VM (2010). Adverse effects of testosterone therapy in adult men: A
systematic review and meta-analysis. J Clin Endocrinol Metab. 95: 2560–2575.
365 Basaria S, Coviello AD, Travison TG, Storer TW, Farwell WR, Jette AM, Eder R,
Tennstedt S, Ulloor J, Zhang A, Choon K, Bhasin S (2010). Adverse events associated
with testosterone administration. N Engl J Med. 363: 109–122.
366 Kanis JA, Bilezikian JP, Kaufman J-M, Khosla S, Orwoll E, Seeman E (2011).
Towards a diagnostic and therapeutic consensus in male osteoporosis. Osteoporos Int. 22:
2789–2798.
367 Gielen E, Verschueren S, O’Neill TW, Pye SR, O’Connell MDL, Lee DM,
Ravindrarajah R, Claessens F, Laurent M, Milisen K, Tournoy J, Dejaeger M, Wu
FC, Vanderschueren D, Boonen S (2012). Musculoskeletal frailty: A geriatric syndrome
at the core of fracture occurrence in older age. Calcif Tissue Int. 91: 161–177.
368 Liu H, Bravata DM, Olkin I, Nayak S, Roberts B, Garber AM, Hoffman AR (2007).
Systematic review: The safety and efficacy of growth hormone in the healthy elderly. Ann
Interanl Med. 146: 104–115.
369 Nass R, Pezzoli SS, Clancy Oliveri M, Patrie JT, Harrel FE, Clasey JL, Heymsfield
SB, Bach MA, Lee Vance M, Thorner MO (2008). Effects of an oral ghrelin mimetic on
body composition and clinical outcomes in healthy older adults: A randomized, controlled
trial. Ann Intern Med. 149: 601–611.
370 White HK, Petrie CD, Landschulz W, MacLean D, Taylor A, Lyles K, Wei JY,
Hoffman AR, Salvatori R, Ettinger MP, Morey MC, Blackman MR, Merriam GR
(2009). Effects of an oral growth hormone secretagogue in older adults. J Clin Endocrinol
Metab. 94: 1198–1206.
371 Sayer AA, Robinson SM, Patel HP, Shavlakadze T, Cooper C, Grounds MD (2013).
New horizons in the pathogenesis, diagnosis and management of sarcopenia. Age Ageing.
42: 145–150.

REFERENCES
201
372 Morley JE, Malmstrom TK (2014). Can sarcopenia be diagnosed without measurements?
Eur Geriatr Med. 5: 291–293.
373 Cesari M, Fielding RA, Bénichou O, Bernabei R, Bhasin S, Guralnik JM, Jette AM,
Landi F, Pahor M, Rodriguez-Mañas L, Rolland Y, Roubenoff R, Sinclair AJ,
Studenski SA, Travison TG, Vellas B (2015). Pharmacological interventions in frailty
and sarcopenia: Report by the International Conference on Frailty and Sarcopenia
Research Task Force. J Frailty Aging. 4: 114–120.
374 Sullivan GM, Pomidor AK (2015). Exercise for aging adults for practitioners. Springer
International Publishing AG.
375 Ellis G, Whitehead MA, Robinson D, O’Neill D, Langhorne P (2011).
Comprehensive geriatric assessment for older adults admitted to hospital: Meta-analysis of
randomised controlled trials. BMJ. 343: d6553.
376 Harari D, Martin FC, Buttery A, O’Neill S, Hopper A (2007). The Older Persons’
Assessment and Liaison team “OPAL”: Evaluation of comprehensive geriatric assessment
in acute medical inpatients. Age Ageing. 36: 670–675.
377 Bakker FC, Persoon A, Schoon Y, Olde Rikkert MG (2013). Hospital elder life
program integrated in Dutch hospital care: A pilot. J Am Geriatr Soc. 61: 641–642.
378 Palmisano-Mills C (2007). Common problems in hospitalized older adults. J Gerontol
Nurs. 33: 48–54.
379 Bryant-Lukosius D, Carter N, Reid K, Donald F, Martin-Misener R, Kilpatrick K,
Harbman P, Kaasalainen S, Marshall D, Charbonneau-Smith R, DiCenso A (2015).
The clinical effectiveness and cost-effectiveness of clinical nurse specialist-led hospital to
home transitional care: A systematic review. J Eval Clin Pract. 21: 763–781.
380 de Morton NA, Keating JL, Jeffs K (2007). Exercise for acutely hospitalised older
medical patients. Cochrane Database Syst Rev. Jan 24: CD005955.
381 Kosse NM, Dutmer AL, Dasenbrock L, Bauer JM, Lamoth CJ (2013). Effectiveness
and feasibility of early physical rehabilitation programs for geriatric hospitalized patients: A
systematic review. BMC Geriatr. 13: 107.
382 Gail MH, Pfeiffer RM (2005). On criteria for evaluating models of absolute risk.
Biostatistics. 6: 227–239.
383 Rodriguez-Manas L, Bayer AJ, Kelly M, Zeyfang A, Izquierdo M, Laosa O,
Hardman TC, Sinclair AJ (2014). An evaluation of the effectiveness of a multi-modal
intervention in frail and pre-frail older people with type 2 diabetes - the MID-Frail study:
Study protocol for a randomised controlled trial. Trials. 15: 1–9.
384 Marzetti E, Calvani R, Landi F, Hoogendijk E, Fougère B, Velles B, Pahor M,
Bernabei R, Cesari M, SPRINTT Consortium (2015). Innovative medicines initiative:
The SPRINTT project. J Frailty Aging. 1: 207–208.
385 Goodpaster B, Park S, Harris T, Kritchevsky S, Nevitt M, Schwartz A, Simonsick E,
Tylavsky F, Visser M, Newman A (2006). The loss of skeletal muscle strength, mass,
and quality in older adults: The Health, Aging and Body Composition Study. J Gerontol A
Biol Sci Med Sci. 61: 1059–1064.

202
386 Lunney JR, Lynn J, Foley DJ, Lipson S (2003). Patterns of functional decline at the end
of life. J Am Med Dir Assoc. 289: 2387–2392.
387 Huntley AL, Johnson R, Purdy S, Valderas JM, Salisbury C (2012). Measures of
multimorbidity and morbidity burden for use in primary care and community settings : A
systematic review and guide. Ann Fam Med. 10: 134–141.
388 Groll DL, To T, Bombardier C, Wright JG (2005). The development of a comorbidity
index with physical function as the outcome. J Clin Epidemiol. 58: 595–602.

SUMMARY
203
SUMMARY
The increasing life expectancy contributes to the ageing of the population, making Belgium an
‘aged society’. With advancing age important physiological changes occur. The age-related loss of
physiologic reserve and hence loss of resistance to stressors is characteristic for the condition called
frailty, in which minimal stress can lead to function impairment. Sarcopenia, the age-related loss of
muscle mass and function, is considered a key component in the development of physical frailty.
While these ‘twin’ conditions are close to reaching consensus on their conceptual framework, the
search towards a consensus operational definition for each is still ongoing. Lately, there has been a
shift in focus towards the shared feature of physical frailty and sarcopenia, namely low physical
function. Low levels of physical function include impairments (which can be measured with e.g. Grip
strength), functional limitations according to physical performance measurements (e.g. Balance, Chair
Rising, and Timed up and Go), and disabilities related to physical domains of health-related quality
of life (e.g. SF-36 Physical Function Index) and ADL (e.g. RDRS-2 ADL).
The general aim of this thesis is twofold. Firstly, we aim to evaluate the predictive value of physical
function (related) assessments towards health risks in older adults; secondly we want to assess
changes in physical function occurring over time. For both objectives we have used data from two
studies: the first being a population-based cohort study in apparently healthy community-dwelling
older Belgian men (Merelbeke study), the second a multicentre cohort study in acutely ill
hospitalized older Italian patients (CRIME study).
In Chapter 1 we present a general background starting with the ageing and aged population. This
leads us to conceptual and operational definitions of physical frailty and sarcopenia and their shared
feature of low levels of physical function. We subsequently report their epidemiology and some
underpinning pathophysiological mechanisms, which include neuromuscular changes, low-grade
inflammation, coagulation, and hormonal dysregulation. Furthermore we describe our above-
mentioned research objectives and study populations more in depth. This chapter ends with a
description of our used methodology.

204
In Chapter 2 we report all our findings in community-dwelling older men. All three subchapters
focus on predictive value towards long-term all-cause mortality, since the Merelbeke study has had
an exceptionally long survival follow-up. While the first two subchapters involve physical function
(related) assessments at a single time-point, the last subchapter includes changes in physical
function over 3-year time not caused by any active intervention.
In Chapter 2.1 we explore the association of the simple SOF index for physical frailty and the
data-driven FNIH criteria for weakness and low muscle mass with subsequent 15-year mortality.
Since both instruments do not rely on their parameters’ distribution in reference populations, their
validation in populations, other than those in which they were developed, is important. Presence of
physical frailty and sarcopenia could be identified in respectively 7 and 6% of 191 men who
attended the study’s fifth wave. Remarkably, with only 1.6% overlap, the instruments have not
selected the same men. Both physical frailty and weakness combined with low muscle mass have
shown to be significantly associated with higher mortality hazard compared to robustness or
normal Grip strength with normal muscle mass respectively, independently from age and number
of medications.
In Chapter 2.2 we evaluate and compare the association of four objective physical function
measurements (Grip strength, Standing balance, Chair rising, and Timed Up and Go) and two
disability instruments (RDRS-2 ADL and SF-36 Physical Function Index) with subsequent 15-year
mortality. With the exception of Grip strength and SF-36 Physical Function Index, these
measurements have not been validated before towards mortality hazard in studies with more than
10-year follow-up. All six physical function measurements, assessed at baseline in 352 men, have
shown to be significantly associated with mortality hazard. The highest standardized HRs have
been observed with timed physical performance measurements, especially Timed Up and Go.
In Chapter 2.3 we investigate the association of physical function changes with subsequent 15-year
mortality. Functional changes have rarely been related to changes in clinical outcomes before. We
have examined decline in physical function (SF-36 Physical Function Index, Grip strength, Chair
rising, and Timed Up and Go) over four time-points within three years in 171 men who
participated in both the second and fifth wave of the Merelbeke study. While decline in all physical
function measurements could be significantly associated with higher mortality hazard, a significant
time-attenuated effect for SF-36 Physical Function Index, Grip strength, and Chair rising has been
observed after seven years. Interestingly, physical function at a single-time point also has remained

SUMMARY
205
to be significantly associated in these multivariate models, indicating the robustness of single time-
point physical function measurements.
In Chapter 3 we report all our findings in older Italian in-patients admitted to acute care. While the
first subchapter focuses on the prediction of hospital outcomes, the second subchapter addresses
changes in physical function from admission until discharge. In Chapter 3.1 we identify predictors
of LoS, in-hospital mortality, and institutionalization in 1123 older in-patients. Contrary to most
previous studies that relied on routinely collected data, we have data on patients’ functional status
and physical performance. Indeed, our multivariate analyses have identified these multifaceted
aspects as independent predictors of hospital outcome. Gait speed category could be significantly
associated with LoS, Grip strength inability with in-hospital mortality, and ADL total dependency
with both in-hospital mortality and institutionalization. In Chapter 3.2, we look into functional
changes during hospital stay assessed through Grip strength and Gait speed in addition to ADL,
whereas in-hospital changes have previously been established almost exclusively via ADL
measurements. In 639 patients with an MMSE score of at least 18, we could not find a significant
in-hospital change in ADL on average, while we have found an overall improvement in Grip
strength and Gait speed, especially in patients with poor baseline performance, admission from the
emergency room, and older age.
Finally in Chapter 4, our main findings together with contributions to the existing literature are
summarized and discussed. The apparently healthy European male population and long-term
survival follow-up of our studies in Chapter 2 have added new contributions to the validation of
physical function (related) assessments. The assessment of Grip strength and Gait speed in our
studies of Chapter 3 has contributed to the feasibility of objective physical function measurements
in hospital setting. Further along this chapter, we discuss the implications of our findings and some
perspectives for future research related to physical function and its health risk indications, dynamic
nature, numerous operational definitions, and use in interventions to define the target population
and to evaluate effectiveness. Finally, we mention some methodological considerations related to
the overall representativeness and external validity, accuracy and reliability, and internal validity of
our findings.
With this doctoral thesis, we contribute to the research on physical frailty and sarcopenia, more
specifically the prognostic value and dynamic nature of physical function (related) assessments.
Consensus on operational instruments should push research forward towards finding effective
interventions to counteract low levels of physical function.


SAMENVATTING
207
SAMENVATTING
De toenemende levensverwachting draagt bij tot de vergrijzing van de bevolking, waardoor België
een ‘oude samenleving’ kent. Met het verouderen treden belangrijke fysiologische veranderingen
op: het leeftijdsgebonden verlies aan fysiologische reserve en het daarmee gepaard gaande verlies
aan weerstand tegen stressfactoren is kenmerkend voor kwetsbaarheid, een aandoening waarbij reeds
minimale stress kan leiden tot een functiebeperking. Sarcopenie, het leeftijdsgebonden verlies van
spiermassa en -functie, wordt beschouwd als een belangrijk element betrokken bij de ontwikkeling
van deze fysieke kwetsbaarheid. Hoewel het conceptuele kader van deze ‘tweeling’ condities
nagenoeg vastligt, is de zoektocht naar een consensus operationele definitie voor elk nog gaande.
Recentelijk wordt er meer aandacht geschonken aan het gemeenschappelijke kenmerk van fysieke
kwetsbaarheid en sarcopenie, namelijk lage fysieke functie. Lage fysieke functie omvat verzwakkingen
(onder meer gemeten met bijv. Handgrijpkracht), functionele beperkingen aantoonbaar op basis van
fysieke prestatie metingen (bijv. Evenwicht, Chair rising en Timed Up and Go) en onbekwaamheden
samenhangend met ofwel fysieke aspecten van gezondheidsgerelateerde levenskwaliteit (bijv. SF-
36 Fysieke Functie Index) ofwel activiteiten van het dagelijks leven (bijv. RDRS-2 ADL).
Het algemene doel van dit proefschrift is tweeledig. In de eerste plaats willen we van bovenstaande
fysieke functie (gerelateerde) metingen de voorspellende waarde met betrekking tot
gezondheidsrisico's bij ouderen evalueren. Ten tweede willen we veranderingen in fysieke functie
na verloop van tijd evalueren. Voor beide doelstellingen hebben we gebruik gemaakt van gegevens
uit twee studies: de eerste is een bevolkingsgebaseerde, cohort studie bij ogenschijnlijk gezonde,
thuiswonende, oudere, Belgische mannen (de Merelbeke studie) en de tweede een multicentrische,
cohort studie bij acuut zieke, gehospitaliseerde, oudere, Italiaanse patiënten (de CRIME studie).
In Hoofdstuk 1 presenteren we een algemene achtergrond beginnend bij de vergrijsde en oudere
bevolking. Dit leidt ons tot conceptuele en operationele definities van fysieke kwetsbaarheid en
sarcopenie en hun gemeenschappelijk kenmerk namelijk lage fysieke functie. We rapporteren
aansluitend hun epidemiologie en enkele onderbouwende pathofysiologische mechanismen,
waaronder neuromusculaire veranderingen, laaggradige ontsteking, coagulatie, en hormonale
ontregelingen. Verder beschrijven we onze bovengenoemde doelstellingen en studiepopulaties
meer in de diepte. Dit hoofdstuk eindigt met een beschrijving van onze gebruikte methodologie.

208
In Hoofdstuk 2 rapporteren we al onze bevindingen bij thuiswonende, oudere mannen. Alle
subhoofdstukken richten zich op de voorspellende waarde van fysieke functie (gerelateerde)
metingen met betrekking tot lange termijn-sterfte van alle oorzaken, omdat de Merelbeke studie
een uitzonderlijk lange overlevingsopvolging heeft gekend. Terwijl de eerste twee subhoofdstukken
betrekking hebben tot fysieke functie (gerelateerde) metingen op één enkel tijdspunt, omvat het
laatste subhoofdstuk veranderingen in fysieke functie over drie jaar tijd, die niet veroorzaakt
werden door een actieve interventie.
In Hoofdstuk 2.1 onderzoeken we de associatie van de eenvoudige SOF-index voor fysieke
kwetsbaarheid en de door data aangedreven FNIH criteria voor zwakte en lage spiermassa met
daaropvolgende 15-jaars mortaliteit. Omdat beide instrumenten hun parameters niet afhankelijk
zijn van de verdeling in referentiepopulaties, is hun validatie in andere populaties dan die waarin ze
werden ontwikkeld, belangrijk. Fysieke kwetsbaarheid en sarcopenie konden worden
teruggevonden in respectievelijk 7 en 6% van 191 mannen die aanwezig waren op de vijfde visite
van de studie. Opvallend is dat, met slechts 1.6% overlapping, de instrumenten niet dezelfde
mannen hebben geselecteerd. Zowel fysieke kwetsbaarheid als zwakte in combinatie met lage
spiermassa bleek significant geassocieerd te zijn met een hogere mortaliteitshazard in vergelijking
met robuustheid of normale Handgrijpkracht en spiermassa, respectievelijk, onafhankelijk van de
leeftijd en het aantal in te nemen geneesmiddelen.
In Hoofdstuk 2.2 evalueren en vergelijken we de voorspellende waarde van vier objectieve fysieke
functie metingen (Handgrijpkracht, Staand evenwicht, Chair rising en Timed Up and Go) en twee
onbekwaamheidsinstrumenten (RDRS-2 ADL en SF-36 Fysieke Functie Index) voor
daaropvolgende 15-jaars mortaliteit. Met uitzondering van Handgrijpkracht en SF-36 Fysieke
Functie Index, zijn deze metingen nooit eerder gevalideerd met betrekking tot mortaliteit in studies
met meer dan tien jaar opvolging. Alle zes fysieke functie metingen, beschouwd in het begin van de
studie bij 352 mannen, hebben aangetoond significant geassocieerd te zijn met mortaliteitshazard.
De hoogste gestandaardiseerde hazardratio's zijn waargenomen met tijdsgemeten fysieke prestaties
metingen, in het bijzonder Timed Up and Go.

SAMENVATTING
209
In Hoofdstuk 2.3 onderzoeken we de associatie van veranderingen in fysieke functie met
daaropvolgende 15-jaars mortaliteit. Functionele veranderingen zijn voordien zelden gelinkt
geweest aan veranderingen in klinische eindpunten. We hebben de achteruitgang in fysieke functie
(gemeten aan de hand van SF-36 Fysieke Functie Index, Handgrijpkracht, Chair rising en Timed
Up and Go) over vier tijdspunten binnen drie jaar onderzocht in 171 mannen, die hebben
deelgenomen aan zowel de tweede als de vijfde visite van de Merelbeke studie. Terwijl
achteruitgang in alle fysieke functie metingen significant kon worden geassocieerd met een hogere
mortaliteitshazard, is er een significant afzwakkend effect met de tijd waargenomen voor de SF-36
Fysieke Functie Index, Handgrijpkracht en Chair rising na zeven jaar. Interessant is dat fysieke
functie gemeten op een enkel tijdspunt steeds significant geassocieerd is gebleven met mortaliteit in
deze multivariate modellen met verandering in fysieke functie, wat duidt op de robuustheid van
fysieke functie metingen op een enkel tijdspunt.
In Hoofdstuk 3 rapporteren we onze bevindingen bij oudere, Italiaanse, gehospitaliseerde
patiënten opgenomen op acute zorg. Terwijl het eerste subhoofdstuk zich richt op de voorspelling
van ziekenhuisuitkomsten, behandelt het tweede subhoofdstuk veranderingen in fysieke functie
gedurende de ziekenhuisopname, van opname tot ontslag. In Hoofdstuk 3.1 identificeren we
voorspellende factoren voor de duur van ziekenhuisverblijf, sterfte in het ziekenhuis, en
institutionalisering bij ontslag in 1123 oudere patiënten. In tegenstelling tot de meeste voorgaande
studies die vertrouwden op routinematig verzamelde data, beschikken wij ook over gegevens zoals
functionele status en fysieke prestatie. Onze multivariate analyses hebben bovendien deze
veelzijdige aspecten als onafhankelijk voorspellende factoren van ziekenhuisuitkomst
geïdentificeerd. Wandelsnelheid categorie kon worden geassocieerd met de duur van
ziekenhuisverblijf, onvermogen om Handgrijpkracht uit te voeren met mortaliteit en ADL totale
afhankelijkheid met zowel mortaliteit als institutionalisering bij ontslag. In Hoofdstuk 3.2 kijken
we naar functionele veranderingen tijdens verblijf in het ziekenhuis, beoordeeld via
Handgrijpkracht, Wandelsnelheid en ADL, terwijl voorheen deze functionele veranderingen vrijwel
uitsluitend bestudeerd zijn geweest via ADL metingen. Bij 639 patiënten met een MMSE score van
ten minste 18, hebben we geen significante verandering in gemiddelde ADL waargenomen, terwijl
we wel een algemene verbetering van Handgrijpkracht en Wandelsnelheid hebben gedetecteerd,
vooral bij patiënten met een lage fysieke functie bij opname, een opname via de spoeddienst en een
oudere leeftijd.

210
Ten slotte, in Hoofdstuk 4 geven we een bespreking en samenvatting van onze belangrijkste
bevindingen samen met onze bijdrage aan de bestaande literatuur. De ogenschijnlijk gezonde,
Europese, mannelijke bevolking en de lange-termijn overlevingsopvolging van onze studies in
Hoofdstuk 2 hebben nieuwe bijdragen aan de validering van fysieke functie (gerelateerde) metingen
toegevoegd. De beoordeling van Handgrijpkracht en Wandelsnelheid in onze studies van
Hoofdstuk 3 heeft bijgedragen aan de uitvoerbaarheid van objectieve fysieke functie metingen in
ziekenhuiskader. Verderop in dit hoofdstuk bespreken we de implicaties van onze bevindingen en
een aantal perspectieven voor toekomstig onderzoek die verband houden met fysieke functie en
haar indicaties voor gezondheidsrisico’s, dynamische karakter, tal van operationele definities en
gebruik in interventies om doelpopulaties af te bakenen en de doeltreffendheid te evalueren. Tot
slot vermelden we een aantal methodologische overwegingen met betrekking tot de algemene
representativiteit en externe validiteit, nauwkeurigheid en betrouwbaarheid, en interne validiteit van
onze bevindingen.
Met dit proefschrift hebben we een bijdrage geleverd aan het onderzoek naar fysieke kwetsbaarheid
en sarcopenie, meer in het bijzonder de prognostische waarde en het dynamische karakter van
fysieke functie (gerelateerde) metingen. Eensgezindheid over een operationeel instrument zou het
onderzoek kunnen doen voortbewegen richting het zoeken naar effectieve interventies om lage
fysieke functie tegen te gaan.

ABOUT THE AUTHOR
211
ABOUT THE AUTHOR
Stefanie De Buyser was born on the 21st of March, 1988 in Bruges, Belgium. After her high-school
education at the Koninklijk Atheneum 1 in Bruges center, she started her Pharmacy studies in 2006
at Ghent University, and obtained her Master degree in Drug Development in 2011 (magna cum
laude). In the spring of 2012 she started as a PhD student at the Department of Geriatrics at Ghent
University Hospital. Concurrently she worked as primary researcher on the MID-Frail project.
Under the supervision of Prof. dr. Mirko Petrovic, she performed research on physical function
(related) assessments in older persons.
Stefanie De Buyser is currently (co-)author of nine international publications. She won the Junior
investigator’s Award of the Belgian association for Gerontology & Geriatrics in February 2013 for
best oral presentation.
Publications in international journals with peer review
2013 De Buyser SL, Petrovic M, Taes YE, Toye KRC, Kaufman J-M, Goemaere S
(April 2013). Physical function measurements predict mortality in ambulatory older
men. Eur J Clin Invest. 43: 379–86.
(A1 – JRC impact factor in 2013 = 2.834 – rank 27 of 155 in 2013 = Q1 Medicine,
general & internal)
2014 Vetrano DL, Landi F, De Buyser SL, Carfì A, Zuccalà G, Petrovic M,
Volpato S, Cherubini A, Corsonello A, Bernabei R, Onder G (Jan 2014).
Predictors of length of hospital stay among older adults admitted to acute care
wards: A multicentre observational study. Eur J Intern Med. 25: 56–62.
(A1 – JRC impact factor in 2014 = 2.891 – rank 26 of 154 in 2014 = Q1 Medicine,
general & internal)
De Buyser SL, Petrovic M, Taes YE, Vetrano DL, Corsonello A, Volpato S,
Onder G (May 2014). Functional changes during hospital stay in older patients
admitted to an acute care ward: A multicenter observational study. PLoS One. 9:
e96398.
(A1 – JRC impact factor in 2014 = 3.234 – rank 9 of 57 in 2014 = Q1
Multidisciplinary sciences)

212
Velghe A, Noens L, Demuynck R, De Buyser SL, Petrovic M (August 2014).
Evaluation of the nutritional status in older patients with aggressive haematological
malignancies using the MNA-SF. Eur Geriatr Med. 5: 258–260.
(A1 – JRC impact factor in 2014 = 0.773 – rank 46 of 50 in 2014 = Q4 Geriatrics
& gerontology)
Velghe A, Petrovic M, De Buyser SL, Demuynck R, Noens L (Dec 2014).
Validation of the G8 screening tool in older patients with aggressive haematological
malignancies. Eur J Oncol Nurs. 18: 645–648.
(A1 – JRC impact factor in 2014 = 1.426 – rank 23 of 110 in 2014 = Q1 Nursing)
De Buyser SL, Petrovic M, Taes YE, Vetrano DL, Onder G (Dec 2014). A
multicomponent approach to identify predictors of hospital outcomes in older in-
patients: A multicentre observational study. PLoS One. 9: e115413.
(A1 – JRC impact factor in 2014 = 3.234 – rank 9 of 57 in 2014 = Q1
Multidisciplinary sciences)
2016 Velghe A, De Buyser SL, Noens L, Demuynck R, Petrovic M (April 2016).
Hand grip strength as a screening tool for frailty in older patients with
haematological malignancies. Acta Clin Belg. 27: 1–4.
(A1 – JRC impact factor in 2014 = 0.518 – rank 125 of 154 in 2014 = Q4
Medicine, general & internal)
De Buyser SL, Petrovic M, Taes YE, Toye KRC, Kaufman J-M, Lapauw B,
Goemaere S (April 2016). Validation of the FNIH sarcopenia criteria and SOF
frailty index as predictors of long-term mortality in ambulatory older men. Age
Ageing. 10.1093/ageing/afw071.
(A1 – JRC impact factor in 2014 = 3.642 – rank 9 of 50 in 2014 = Q1 Geriatrics &
gerontology)
De Buyser SL, Petrovic M, Taes YE, Toye KRC, Kaufman J-M, Goemaere S,
Lapauw B (Accepted June 2016). Three year functional changes and long-term
mortality hazard in community-dwelling older men. Eur J Intern Med.
(A1 – JRC impact factor in 2014 = 2.891 – rank 26 of 154 in 2014 = Q1 Medicine,
general & internal)

ABOUT THE AUTHOR
213
Oral presentations
2013 Winter meeting Belgian association for Gerontology & Geriatrics (Oostend,
Belgium)
De Buyser SL, Petrovic M, Taes YE, Toye KRC, Kaufman J-M and
Goemaere S. Physical function measurements predict mortality in ambulatory
older men. Tijdschr Gerontol Geriatr 44(1): 32.
Research Day (Ghent, Belgium)
De Buyser SL, Petrovic M, Taes YE, Toye KRC, Kaufman J-M and
Goemaere S. Physical function measurements predict mortality in ambulatory
older men.
9th Congress of the European Union Geriatric Medicine Society (Venice Lido,
Italy)
De Buyser SL, Petrovic M, Taes YE, Vetrano DL and Onder G. Identifying
predictors for hospital outcomes of older patients admitted to an acute care ward:
a multi-component approach: Results from the CRIME study. Eur Geriatr Med
4(suppl. 1): S14–15.
2014 International Conference on Frailty and Sarcopenia Research (Barcelona, Spain)
De Buyser SL, Petrovic M, Taes YE, Vetrano DL and Onder G. Physical
function measurements to predict hospital outcome in older in-patients: Results
from the CRIME study. J Frailty Aging 3(1): 32.
2015 Winter meeting Belgian association for Gerontology & Geriatrics (Oostend,
Belgium)
De Buyser SL, Petrovic M, Taes YE, Lapauw B, Toye KRC, Kaufman J-M
and Goemaere S. Longitudinal performance assessment for predicting adverse
outcomes: The added value to single time point Timed Up and Go assessment.
Tijdschr Gerontol Geriatr 46(1): 47.
Research Day (Ghent, Belgium)
De Buyser SL, Petrovic M, Taes YE, Lapauw B, Toye KRC, Kaufman J-M
and Goemaere S. Frailty and Health-Related Quality of Life in Ambulatory
Older Men.
11th Congress of the European Union Geriatric Medicine Society (Oslo,
Norway)
De Buyser SL, Petrovic M, Taes YE, Lapauw B, Toye KRC, Kaufman J-M
and Goemaere S. Persistent decline over 3 years in physical function predicts
15-year mortality in ambulatory older men. Eur Geriatr Med. 6(suppl. 1): S8.

214
2016 Research Day (Ghent, Belgium)
De Buyser SL, Petrovic M, Taes YE, Toye KRC, Kaufman J-M, Goemaere
S and Lapauw B. Validation of the FNIH sarcopenia criteria as predictors of
long-term mortality in ambulatory older men.

ABOUT THE AUTHOR
215
Poster presentations
2013 9th Congress of the European Union Geriatric Medicine Society (Venice Lido,
Italy)
De Buyser SL, Petrovic M, Taes YE, Vetrano DL, Volpato S and Onder G.
Functional changes during hospitalization in older patients admitted to an acute
care ward: Results from the CRIME Study. Eur Geriatr Med 4(suppl. 1): S92–92.
9th Congress of the European Union Geriatric Medicine Society (Venice Lido,
Italy)
De Buyser SL, Petrovic M, Taes YE, Toye KRC, Kaufman J-M and
Goemaere S. Physical function measurements predict mortality in ambulatory
older men. Eur Geriatr Med 4(suppl. 1): S94–S94.
2014 Winter meeting Belgian association for Gerontology & Geriatrics (Oostend,
Belgium)
De Buyser SL, Petrovic M, Taes YE, Vetrano DL, Corsonello A, Volpato S
and Onder G. Functional changes during hospital stay in older patients admitted
to an acute care ward. Tijdschr Gerontol Geriatr 45(1): 34–65.
Winter meeting Belgian association for Gerontology & Geriatrics (Oostend,
Belgium)
De Buyser SL, Petrovic M, Taes YE, Vetrano DL and Onder G.
Independent predictors of hospital outcomes in older patients in acute care: a
multicentre, observational study. Tijdschr Gerontol Geriatr 45(1): 34–65.
International Conference on Frailty and Sarcopenia Research (Barcelona, Spain)
De Buyser SL, Petrovic M, Taes YE, Vetrano DL, Corsonello A, Volpato S
and Onder G. Functional changes during hospitalization in older patients
admitted to an acute care ward: Results from the CRIME study. J Frailty Aging
3(1): 71.
International Conference on Frailty and Sarcopenia Research (Barcelona, Spain)
De Buyser SL, Petrovic M, Taes YE, Kaufman J-M and Goemaere S.
Longitudinal analysis of the relationship between physical function and mortality
in ambulatory older men. J Frailty Aging 3(1): 71.
10th Congress of the European Union Geriatric Medicine Society (Rotterdam,
the Netherlands)
De Buyser SL, Petrovic M, Taes YE, Lapauw B, Toye KRC, Kaufman J-M
and Goemaere S. Frailty and health-related quality of life in ambulatory older
men. Eur Geriatr Med 5(suppl. 1): S128–S128.

216
10th Congress of the European Union Geriatric Medicine Society (Rotterdam,
the Netherlands)
De Buyser SL, Petrovic M, Taes YE, Lapauw B, Toye KRC, Kaufman J-M
and Goemaere S. The association of frailty with serum 25-hydroxy vitamin D in
older men. Eur Geriatr Med 5(suppl. 1): S128–S128.
Perspectives in Endocrinology, fifth edition (Dworp, Belgium)
De Buyser SL, Petrovic M, Taes YE, Lapauw B, Toye KRC, Kaufman J-M
and Goemaere S. The association of frailty with serum 25-hydroxy vitamin D in
older men.
2015 Symposium on Nutrition and Health ‘Let thy food be thy medicine’ (Ghent,
Belgium)
De Buyser SL, Petrovic M, Taes YE, Lapauw B, Toye KRC, Kaufman J-M
and Goemaere S. The association of frailty with serum 25-hydroxy vitamin D in
older men.
Winter meeting Belgian association for Gerontology & Geriatrics (Oostend,
Belgium)
De Buyser SL, Petrovic M, Taes YE, Lapauw B, Sjors Verlaan, Toye KRC,
Kaufman J-M and Goemaere S. Change in Timed Up and Go performance
over time in community-dwelling older men. Tijdschr Gerontol Geriatr 46(1):
47–48.
Winter meeting Belgian association for Gerontology & Geriatrics (Oostend,
Belgium)
De Buyser SL, Petrovic M, Taes YE, Lapauw B, Toye KRC, Kaufman J-M
and Goemaere S. Frailty and Health-Related Quality of Life in Ambulatory
Older Men. Tijdschr Gerontol Geriatr 46(1): 48.
International Conference on Frailty and Sarcopenia Research (Boston, MA, USA)
De Buyser SL, Petrovic M, Taes YE, Lapauw B, Sjors Verlaan, Toye KRC,
Kaufman J-M and Goemaere S. Change in Timed Up and Go performance
over time in community-dwelling older men. J Frailty Aging 4(1): 79.
International Conference on Frailty and Sarcopenia Research (Boston, MA, USA)
De Buyser SL, Petrovic M, Taes YE, Lapauw B, Toye KRC, Kaufman J-M
and Goemaere S. Longitudinal performance assessment for predicting adverse
outcomes: The added value to single time point Timed Up and Go assessment. J
Frailty Aging 4(1): 100 – 101.

ABOUT THE AUTHOR
217
11th Congress of the European Union Geriatric Medicine Society (Oslo,
Norway)
De Buyser SL, Petrovic M, Taes YE, Toye KRC, Kaufman J-M, Lapauw B
and Goemaere S. The FNIH-criteria for sarcopenia predict 15-year mortality in
ambulatory older men. Eur Geriatr Med 6(suppl. 1): S85–86.
2016 Winter meeting Belgian association for Gerontology & Geriatrics (Oostend,
Belgium)
De Buyser SL, Petrovic M, Taes YE, Toye KRC, Kaufman J-M, Goemaere
S and Lapauw B. Validation of the FNIH sarcopenia criteria and SOF frailty
index as predictors for long-term mortality in ambulatory older men. Tijdschr
Gerontol Geriatr 47(1): 26.
Winter meeting Belgian association for Gerontology & Geriatrics (Oostend,
Belgium)
De Buyser SL, Petrovic M, van der Cammen T, Rajkumar C, Tangiisuran
B and Onder G. Comparison of two risk screening tools for adverse drug
reactions in older in-patients. Tijdschr Gerontol Geriatr 47(1): 25.
International Conference on Frailty and Sarcopenia Research (Philadelphia, PA,
USA)
De Buyser SL, Petrovic M, Taes YE, Toye KRC, Kaufman J-M, Goemaere
S and Lapauw B. Validation of the Study of Osteoporotic Fractures (SOF)
frailty index as predictor of long-term mortality in ambulatory older men. J Frailty
Aging 5(1): 51–52.
International Conference on Frailty and Sarcopenia Research (Philadelphia, PA,
USA)
De Buyser SL, Petrovic M, Taes YE, Toye KRC, Kaufman J-M, Goemaere
S and Lapauw B. Association of spontaneous 3-year changes in physical
function with subsequent 15-year mortality in community-dwelling older men. J
Frailty Aging 5(1): 59–60.


DANKWOORD
219
DANKWOORD
Graag wens ik iedereen te bedanken die mij de voorbije vier jaar heeft geholpen bij de realisatie van
dit doctoraatsproefschrift.
Vooreerst wil ik de personen bedanken die mij hebben begeleid en hebben bijgedragen aan de
artikels waarop dit proefschrift is gebaseerd.
Veel eer komt toe aan mijn promotor prof. dr. Mirko Petrovic en co-promotor prof. dr. Youri
Taes.
Prof. Petrovic, ik wil u oprecht bedanken voor het vertrouwen dat u in mij stelde en de
mogelijkheden die u mij gegeven heeft om mij verder te ontplooien. Zo kon ik aan meerdere
congressen en opleidingen deelnemen. Bovendien stond u altijd klaar om te reageren op mijn
mails ongeacht het uur of de dag.
Youri, het was een luxe om steeds op je deur te kunnen kloppen wanneer ik hulp nodig had bij
statistische analyses, de opmaak van figuren, … Ook na je vertrek bleef je ter beschikking
wanneer nodig. Je rustige aanpak en luisterend oor heb ik erg geapprecieerd.
Ook de andere leden van mijn begeleidingscommissie, prof. dr. Jean-Marc Kaufman en prof. dr.
Nele Van Den Noortgate ben ik dank verschuldigd.
Prof. Kaufman, bedankt voor de begeleiding bij mijn doctoraat en alle Merelbeke artikels. In het
bijzonder voor het laatste artikel vond ik het zeer fijn om bij u te kunnen aankloppen.
Prof. Van Den Noortgate, bedankt om mij steeds geholpen te hebben wanneer ik hier om vroeg,
zeker in de laatste fases van mijn doctoraat.
Mijn dank gaat eveneens uit naar de leden van de examencommissie.
Prof. dr. Evelien Gielen, prof. dr. Maurits Vandewoude, prof. dr. Patrick Calders, prof. dr. Ruth Piers, prof.
dr. Guy T’Sjoen, prof. dr. Ivan Bautmans en voorzitster prof. dr. Kristiane Van Lierde, dank u wel om
de tijd te nemen om mijn thesis zo grondig na te lezen. Uw constructieve bijdrages hebben de
kwaliteit van dit proefschrift zeker verbeterd.

220
Daarnaast wens ik alle co-auteurs, waaronder dr. Stefan Goemaere, Kaatje Toye, prof. dr. Bruno
Lapauw, prof. dr. Graziano Onder, dr. Davide Vetrano en dr. Anja Velghe van harte te bedanken.
Stefan, dank u wel dat ik mocht werken op de Merelbeke studie, die u heeft opgestart. Kaatje,
bedankt (onder meer) om 20 jaar geleden data verzameld te hebben voor de Merelbeke studie
en om mij wegwijs te maken in alle Access-variabelen. Bruno, bedankt om mij toch te willen
ondersteunen, hoewel je officieel geen deel uitmaakte van mijn begeleidingscommissie. Ik las
met plezier je wekelijkse agenda-mails. Thank you Graziano for giving me the opportunity to
come to Rome and work on the CRIME data. Davide, thanks for finding me an apartment in
Rome to stay. It was always nice to see you at conferences. Anja, het was aangenaam
samenwerken aan de hemato-artikels, onder meer door je nuchtere kijk op de dingen. Ook
vond ik het fijn om de laatste fases van ons doctoraat samen te beleven.
Als tweede wil ik de personen bedanken die ervoor gezorgd hebben dat ik met plezier naar mijn
werk kwam.
Ik prijs me zeer gelukkig dat ik bij de befaamde meisjes van 6K12 ben terechtgekomen.
Greetje, Katrien, Sara, Hélène, Marlies, Annelies, Ellen, Joke en Eva: jullie waren fantastische
collega’s en ik heb jullie één voor één gemist na jullie vertrek.
Alma mater Greetje, jij wist altijd het gesprek op gang te brengen door interessante vragen te
stellen. Down-to-earth Katrien, jij was steeds optimistisch, ik heb je nooit horen klagen. Lieve
Sara, jij bekommerde je altijd om iedereen rond je. Sportieve Hélène, je enthousiasme werkte
aanstekelijk. Creatieve Marlies, ik vond het zo leuk om bij jou binnen te springen. Onbevreesde
Annelies, ik bewonderde je durf om avonturen aan te gaan. Fashionista Ellen, ik hield van je
rustige en genuanceerde persoonlijkheid. Geestige Joke, jij maakte de boel levendiger, onder
andere op de afterwork parties. Zoetemond Eva, je bereidde overheerlijke kaastaart met
speculaas. Bedankt om met mij een bureau te willen delen.
Charlotte, Frederique, Lore en Eline: gelukkig waren jullie er om alle tradities in stand te houden.
Zo heb ik echt genoten van onze picknicks in al zijn vormen (zomers, winters, in kerstsfeer,
met pizza). Ook ons BBB-uurtje op maandagmiddag zal mij bijblijven, net zoals de andere
sportactiviteiten die we toch minstens éénmaal hebben geprobeerd.
Vrolijke Charlotte, jij was steeds te vinden voor een feestje. Open Frederique, ik heb al vaak
succes gehad met het recept van je overheerlijke brownietaart. Behulpzame Lore, jouw oog
voor detail heeft erg geholpen bij de afwerking van mijn proefschrift. Hartelijke Eline, jij was
altijd zo begripvol.

DANKWOORD
221
Joz en Melanie, jullie komst naar het zesde maakte de sfeer nog beter. Erik, Tanita, Inge en Betty,
bedankt voor jullie gezelschap tijdens de middagpauzes. Inge, ik wens je een goede gezondheid
toe. Tanita, we hadden al veel eerder moeten beginnen met onze wekelijkse lunchafspraak op
donderdag! Ik kijk al uit naar onze strandwandeling te paard. Kathelijne en Ahmed, bedankt voor
de gezellige babbels. Frank en Andrea, ook al zijn jullie al enige tijd weg van het zesde, jullie
blijven me bij. Frank, bedankt om mij vaak te hebben geholpen met computer- en statistiek-
gerelateerde problemen. Ik hoop dat je het goed stelt in Oostende.
Ook de mensen van het secretariaat wens ik te bedanken.
Inge en Stephanie, jullie waren altijd zo vriendelijk.
Naast de mensen van Endocrinologie, ben ik ook heel wat collega’s van Geriatrie dankbaar.
Liesbeth, bedankt voor de leuke lunchpauzes buiten het UZ. Karen en Let, ik heb oprecht
genoten van onze babbels. Katrina, het was heel leuk om jou als collega te hebben en om af en
toe samen een theepauze in te lassen. Maar bovenal ben ik blij voor onze vriendschap buiten
het werk. Mieke, bedankt om altijd zo vrolijk mijn telefoontjes te beantwoorden. Cynthia en
Virgie, medekonijnliefhebbers, jullie blijven me bij. Toch jammer dat er geen UZ konijntjes zijn
gekomen. Tania, jij stal de show op elk feestje. Lieve Leen en Anne, na een afspraak op 1K2 kon
ik het nooit laten om even goeiedag aan jullie te zeggen.
Enkele persoonlijke vrienden wens ik hier ook bij te vermelden.
Heidi, onze wekelijkse lunchafspraakjes op dinsdag deden mij altijd de tijd uit het oog verliezen.
Bovendien was het een opluchting om de stress tijdens de laatste fases van ons
doctoraatstraject te kunnen delen. Marie-Laure en Christophe, bedankt om het pendelen tussen
Brugge en Gent heel wat aangenamer te maken.

222
Als laatste wil ik de personen bedanken die mij het meest dierbaar zijn.
Jeroen, bedankt om mij zo goed te kennen en te weten hoe best te reageren op elk van mijn
buien. Je brengt zoveel rust. Je voortdurende steun bleek de laatste maanden onvoorwaardelijk
te zijn.
Liefste mama en papa, bedankt voor zóveel redenen. Bedankt om mij logistiek te helpen door
de auto uit te lenen wanneer de NMBS weer eens staakte. Bedankt om mij steeds te steunen bij
grote en kleine gebeurtenissen. Maar vooral bedankt om mij altijd zo’n warme welkom te
geven wanneer ik langskom. Ik weet dat een bezoekje aan jullie begint met een ontvangst door
een overenthousiast Boomertje, steevast gevolgd door jullie vraag of ik al heb gegeten en niet
eens moet proeven van mama’s lekkere creatie van de dag. Gewoonlijk wordt het bezoekje ook
nog afgesloten met de vraag of ik geen strijk heb. Bedankt voor al jullie goede zorgen.
Stefanie De Buyser,
Brugge, juni 2016