AN IAM-LC/MLC STUDY - UGent Biblio
46
DETERMINATION OF IN VITRO AND IN SILICO INDEXES FOR THE MODELLING OF 1 BLOOD-BRAIN BARRIER PARTITIONING OF DRUGS VIA MICELLAR AND 2 IMMOBILIZED ARTIFICIAL MEMBRANE LIQUID CHROMATOGRAPHY. 3 4 Giacomo Russo 1,2 , Lucia Grumetto 2 , Roman Szucs 3 , Francesco Barbato 2 , Frederic Lynen 1 *. 5 *corresponding author 6 1. Separation Science Group, Department of Organic and Macromolecular Chemistry, Ghent 7 University, Krijgslaan 281, S4-bis, B-9000 Gent, Belgium 8 2. Dipartimento di Farmacia, Università degli Studi di Napoli Federico II, Via D. Montesano, 49 I- 9 80131 Naples, Italy 10 3. Pfizer Global R&D, Sandwich CT13 9NJ, Kent, United Kingdom 11 12
-
Upload
khangminh22 -
Category
Documents
-
view
0 -
download
0
Transcript of AN IAM-LC/MLC STUDY - UGent Biblio

DETERMINATION OF IN VITRO AND IN SILICO INDEXES FOR THE MODELLING OF 1
BLOOD-BRAIN BARRIER PARTITIONING OF DRUGS VIA MICELLAR AND 2
IMMOBILIZED ARTIFICIAL MEMBRANE LIQUID CHROMATOGRAPHY. 3
4
Giacomo Russo1,2
, Lucia Grumetto2, Roman Szucs
3, Francesco Barbato
2, Frederic Lynen
1*.
5
*corresponding author 6
1. Separation Science Group, Department of Organic and Macromolecular Chemistry, Ghent 7
University, Krijgslaan 281, S4-bis, B-9000 Gent, Belgium 8
2. Dipartimento di Farmacia, Università degli Studi di Napoli Federico II, Via D. Montesano, 49 I-9
80131 Naples, Italy 10
3. Pfizer Global R&D, Sandwich CT13 9NJ, Kent, United Kingdom 11
12

DETERMINATION OF IN VITRO AND IN SILICO INDEXES FOR THE MODELLING OF 13
BLOOD-BRAIN BARRIER PARTITIONING OF DRUGS VIA MICELLAR AND 14
IMMOBILIZED ARTIFICIAL MEMBRANE LIQUID CHROMATOGRAPHY. 15
16
ABSTRACT 17
18
In the present work, 79 structurally unrelated analytes were taken into account and their 19
chromatographic retention coefficients, measured by Immobilized Artificial Membrane Liquid 20
Chromatography (IAM-LC), and by Micellar Liquid Chromatography (MLC) employing sodium 21
dodecyl sulfate (SDS) as surfactant, were determined. Such indexes, along with topological and 22
physico-chemical parameters calculated in silico, were subsequently used for the development of 23
Blood-Brain Barrier passage-predictive statistical models using partial least square (PLS) regression.. 24
Highly significant relationships were observed either using IAM (r2 (n-1) = 0.78) or MLC (r
2 (n-1) = 25
0.83) derived indexes along with in silico descriptors. This hybrid approach proved fast and effective in 26
the development of highly predictive BBB passage oriented models and, therefore, it can be of interest 27
for pharmaceutical industries as a high-throughput BBB penetration oriented screening method. 28
Finally, it shed new light into the molecular mechanism involved in the BBB uptake of therapeutics. 29
30
Keywords: Immobilized Artificial Membrane; Micellar Liquid Chromatography; Blood-Brain Barrier 31
passage; Quantitative structure–activity relationships. 32

1.0 INTRODUCTION 33
34
Pharmaceutical drug development is still a highly inefficient process: over one third of the failures 35
in drug candidate development is estimated to occur due to unsatisfactory pharmacokinetic 36
properties1, mainly regarding absorption, metabolism and toxicity and the attrition rates for Central 37
Nervous System (CNS) active drugs are even higher2. In fact, before reaching the blood circulation, 38
a drug diffuses through the biological barriers separating the circulating blood from the interstitial 39
fluid that surrounds the tissues. For orally administered drugs, this barrier is the intestinal 40
epithelium whereas the passage of drugs designed to act at the CNS level is further regulated by the 41
Blood-Brain Barrier (BBB). The BBB is one of the most complex and extensively studied 42
biological barriers, and its function is to preserve mammalian brain integrity against possible 43
injurious substances. It is made of endothelial cells, narrowly adherent one to the other to form tight 44
junctions, restricting the passage of solutes3,4
. Indeed, drug transport is strongly limited by this 45
peculiar biological structure to pure passive transcellular diffusion. In fact, the paracellular route, 46
i.e. the passage of actives through the gaps between each endothelial cell, is completely hindered. 47
Apart from active transport mechanisms, whose occurrence is difficult to predict on a solely 48
chemical structure basis, drugs can therefore cross the BBB only by the passive transcellular route. 49
Plenty of in vivo, ex vivo, and in vitro methods are available for measuring BBB partitioning of 50
analytes. Historically, one of the most used and reputed method is the determination of log BB 51
values5. Log BB is defined as: 52
53
log BB = log Blood
Brain
C
C 54
55
in which CBrain is the concentration that the analyte realizes in the brain tissues, and CBlood is the 56
concentration that it realizes in the blood. However, this method involves the use of animal models, 57

usually rodents, and does not provide any mechanistic information about the nature of the passage; 58
furthermore, the method is time-consuming and potential source of ethical issues. 59
Methods based on the employment of cultured cell lines can also be effective; however, astrocytes 60
cell cultures are often difficult to grow and recreating an in vitro environment similar to the in vivo 61
BBB can be challenging even for the most experienced scientists. Caco-2 model based methods 62
may also be an alternative; however, apart from the structural dissimilarities with the other cell 63
cultures6, they are difficult to standardize, complicating comparisons of data determined in different 64
laboratories. 65
In silico methods, generally based on the calculation of physico-chemical parameters, yield various 66
advantages. They are much faster to perform, allowing the screening of large libraries of 67
compounds (even solutes not yet synthesized); in addition, they can assist in the elucidation of the 68
molecular mechanisms involved in membrane permeation. However, they also suffer from several 69
limitations including the aspect that they are unable to take into account all phenomena actually 70
occurring in vivo7 . 71
In vitro methods based on the use of biomimetic stationary phases coupled with high performance 72
liquid chromatography (HPLC) have been used to surrogate BBB permeation data8,9
. The main 73
advantages are that they are much more reproducible and easier to perform and, albeit conceptually 74
simple, they can be incidentally able to provide an in-depth understanding of the mechanisms 75
involved in membrane barrier passage. Such biomimetic stationary phases include, for instance, 76
Immobilized Artificial Membranes (IAM). IAM stationary phases are based on analogues of 77
phosphatidylcholine, which is the major component of biological membranes, and chromatographic 78
retention coefficients of the analytes on such stationary phases are assumed as direct measures of 79
their phospholipophilicity10
, i.e. their affinity for phospholipids. Such measures have been proven to 80
be able to mirror various phenomena underlying membrane barrier passage8,11–13
. In addition, other 81
chromatographic indexes, whose drug BBB-penetration predictivity has been demonstrated14–16
, 82
include those achieved by Micellar Liquid Chromatography (MLC) technique. This technique is 83

based on the addition of surfactants to an aqueous mobile phase at concentrations higher than their 84
critical micelle concentrations (CMC)17
resulting in the formation of micelles acting as a partition 85
phase. Both IAM and MLC chromatographic indexes, mainly if combined with in silico calculated 86
descriptors, have demonstrated effectiveness in the prediction of BBB drug penetration16
. However, 87
the methods proposed are still too time-consuming to meet the demands of pharmaceutical 88
companies and their suitability should be confirmed on larger set of analytes. 89
The aim of the present work has been the development of drug BBB penetration oriented statistical 90
models based on analytical indexes, achieved on biomimetic conditions by medium/high-91
throughput methods, along with in silico calculated descriptors. To the best of our knowledge, this 92
is the study based on the highest number of compounds among those employing IAM and MLC 93
data to predict drug pharmacokinetic properties. 94
Therefore, particular attention is set on: 95
i) the setup of medium/high-throughput methods for the achievement of both IAM and MLC 96
indexes; 97
ii) the validation of such parameters by developing statistical models for the prediction of BBB 98
penetration (log BB) by using the chromatographic indexes along with in silico calculated 99
descriptors; 100
iii) the elucidation of the molecular mechanism involved in BBB passive diffusion of drugs; 101
iv) the possibility of taking into account, by molecular docking studies, the occurrence of active 102
efflux mechanisms. 103
In the present work, 79 structurally unrelated analytes have been taken into account and their 104
chromatographic retention coefficients, measured by high-throughput IAM-LC and MLC methods, 105
the latter employing sodium dodecyl sulfate (SDS) as surfactant, were determined. Such indexes 106
have subsequently been used for the development of BBB-passage predictive statistical models 107
using partial least squares (PLS) automatic regression along with physico-chemical parameters, 108
calculated in silico. Such hybrid approach was aimed at combining the speediness in the 109

achievement of computational chemistry derived topological and physico-chemical parameters with 110
the improved predictivity of the in vitro methods. 111
112
2.0 RESULTS AND DISCUSSION 113
The IAM-LC and MLC chromatographic retention coefficients, as well as the pKa, log BB values, 114
UV wavelengths of the experimental determinations and suppliers, are presented in Table 1. In 115
MLC, the highest retained compound (triprolidine) eluted within 33.0 minutes, whereas in IAM-LC 116
the maximum run time was 37.0 minutes (fluphenazine). However, by performing either the MLC 117
or the IAM-LC analytical methods, 85% of the compounds of the dataset eluted within 15.0 minutes 118
and a preliminary estimate, as an order of magnitude, of the retention times expected can be easily 119
performed based on the calculation of log D7.4
values of each compound present in the dataset. Two 120
chromatographic runs for each technique are reported in Figure 1 (MLC) and Figure 2 (IAM-LC). 121
The log BB values span a very large range (from -2.00 to +1.51) as the analytes to be included in 122
the dataset were selected to include both CNS inactive (e.g. norfloxacin, nitrofurantoin) and CNS 123
active (e.g. fluphenazine, desipramine) drugs. The P-gp affinities, expressed in kcal·mol-1
, of the 124
drugs considered are listed in Table 2A and Table 2B. They were incorporated in each of the 125
following steps to model even the BBB passage of analytes undergoing P-gp effux mechanisms. 126
127

128 Figure 1. MLC chromatograms achieved for the analytes A) Imipramine (50 μg mL
-1 in methanol) 129
and B) Ethylbenzene (50 μg mL-1
in methanol) employing a mobile phase consisting of an aqueous 130
solution of 0.05 mol·L−1
sodium dodecyl sulfate. The detailed experimental conditions are reported 131
in paragraph 4.0. 132
133 134 A 135
136 137 B 138
139 140 141

Figure 2. IAM chromatograms achieved for the analytes A) Paroxetine (50 μg mL-1
in methanol) 142
and B) Diclofenac (50 μg mL-1
in methanol). The mobile phase was a solution 70/30 v/v 143
Dulbecco’s phosphate-buffered saline (DPBS) / methanol. The detailed experimental conditions are 144
reported in paragraph 4.0. 145
A 146
147 148 B 149
150
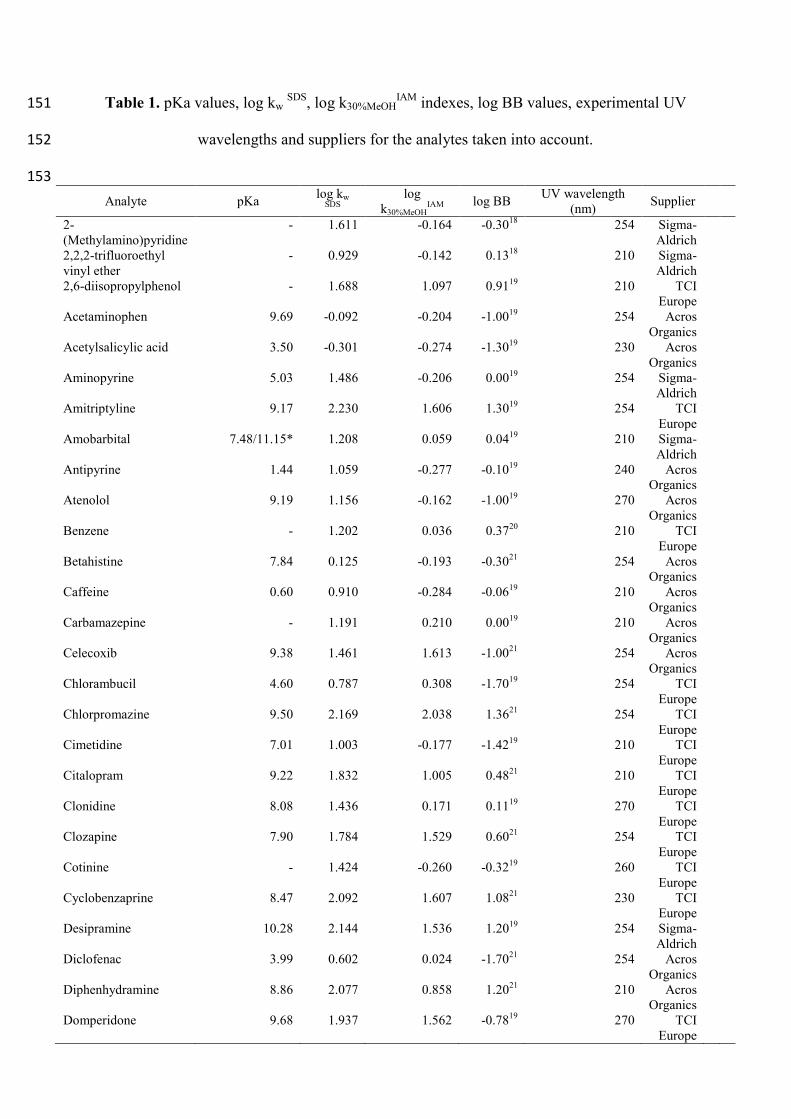
Table 1. pKa values, log kw SDS
, log k30%MeOHIAM
indexes, log BB values, experimental UV 151
wavelengths and suppliers for the analytes taken into account. 152
153
Analyte pKa log kw
SDS
log
k30%MeOHIAM log BB
UV wavelength
(nm) Supplier
2-
(Methylamino)pyridine
- 1.611 -0.164 -0.3018
254 Sigma-
Aldrich
2,2,2-trifluoroethyl
vinyl ether
- 0.929 -0.142 0.1318
210 Sigma-
Aldrich
2,6-diisopropylphenol - 1.688 1.097 0.9119
210 TCI
Europe
Acetaminophen 9.69 -0.092 -0.204 -1.0019
254 Acros
Organics
Acetylsalicylic acid 3.50 -0.301 -0.274 -1.3019
230 Acros
Organics
Aminopyrine 5.03 1.486 -0.206 0.0019
254 Sigma-
Aldrich
Amitriptyline 9.17 2.230 1.606 1.3019
254 TCI
Europe
Amobarbital 7.48/11.15* 1.208 0.059 0.0419
210 Sigma-
Aldrich
Antipyrine 1.44 1.059 -0.277 -0.1019
240 Acros
Organics
Atenolol 9.19 1.156 -0.162 -1.0019
270 Acros
Organics
Benzene - 1.202 0.036 0.3720
210 TCI
Europe
Betahistine 7.84 0.125 -0.193 -0.3021
254 Acros
Organics
Caffeine 0.60 0.910 -0.284 -0.0619
210 Acros
Organics
Carbamazepine - 1.191 0.210 0.0019
210 Acros
Organics
Celecoxib 9.38 1.461 1.613 -1.0021
254 Acros
Organics
Chlorambucil 4.60 0.787 0.308 -1.7019
254 TCI
Europe
Chlorpromazine 9.50 2.169 2.038 1.3621
254 TCI
Europe
Cimetidine 7.01 1.003 -0.177 -1.4219
210 TCI
Europe
Citalopram 9.22 1.832 1.005 0.4821
210 TCI
Europe
Clonidine 8.08 1.436 0.171 0.1119
270 TCI
Europe
Clozapine 7.90 1.784 1.529 0.6021
254 TCI
Europe
Cotinine - 1.424 -0.260 -0.3219
260 TCI
Europe
Cyclobenzaprine 8.47 2.092 1.607 1.0821
230 TCI
Europe
Desipramine 10.28 2.144 1.536 1.2019
254 Sigma-
Aldrich
Diclofenac 3.99 0.602 0.024 -1.7021
254 Acros
Organics
Diphenhydramine 8.86 2.077 0.858 1.2021
210 Acros
Organics
Domperidone 9.68 1.937 1.562 -0.7819
270 TCI
Europe

Donepezil 8.54* 1.968 0.858 0.8922
210 Acros
Organics
Eserine 8.17 1.656 0.030 0.0819
240 TCI
Europe
Ethosuximide 9.27 0.545 -0.228 0.0421
210 Acros
Organics
Ethylbenzene - 1.588 0.600 0.2620
210 Acros
Organics
Fluphenazine 7.84/2.08* 2.207 2.066 1.5119
254 Sigma-
Aldrich
Haloperidol 8.29 2.366 1.483 1.3422
254 TCI
Europe
Halothane - 1.215 0.152 0.3520
210 Sigma-
Aldrich
Hexobarbital 8.20 1.284 -0.008 0.1019
254 Sigma-
Aldrich
Hydroxyzine 7.52/1.58* 2.038 1.337 0.9021
210 Sigma-
Aldrich
Ibuprofen 4.24 0.626 0.090 -0.1819
270 Acros
Organics
Imipramine 9.52 2.190 1.452 1.3019
240 Acros
Organics
Indomethacin 4.13 0.647 -0.257 -1.2619
210 TCI
Europe
Ketorolac 3.84 -0.097 -0.500 -2.0021
300 TCI
Europe
Lamotrigine 5.36 1.316 -0.006 0.4823
220 Acros
Organics
Levofloxacin 6.20/5.45* 1.388 -0.099 -0.7021
290 TCI
Europe
Metanol - 0.000 -0.447 0.0223
210 Sigma-
Aldrich
Metoclopramide 9.71 1.610 0.346 0.0821
210 TCI
Europe
Metoprolol 9.56 1.771 0.198 1.1522
220 TCI
Europe
Mianserin 6.92 2.152 1.456 0.9919
280 TCI
Europe
Naproxen 4.14 0.153 -0.090 -1.7021
254 Acros
Organics
Nicotine 8.11 1.969 -0.139 0.4020
210 Acros
Organics
Nitrofurantoin 7.05 -0.074 -0.447 -2.0021
254 Acros
Organics
Norfloxacin 8.68/5.77* 1.332 -0.062 -1.0021
280 Acros
Organics
Nortriptyline 10.13 2.169 1.639 1.0421
254 TCI
Europe
Olanzapine 7.80 1.825 0.843 0.8021
254 TCI
Europe
Omeprazole 9.29/4.77* 1.591 -0.229 -0.8219
300 TCI
Europe
Oxazepam - 1.420 0.707 0.6119
230 Sigma-
Aldrich
Paroxetine 9.77 2.104 1.796 0.4821
210 TCI
Europe
Pentobarbital 8.18 1.243 0.103 0.1219
210 Sigma-
Aldrich
Phenylbutazone 4.34 0.996 0.273 -0.5219
240 Acros
Organics
Phenytoin 8.28 1.311 0.382 -0.0419
210 Acros
Organics

Pindolol 9.54 0.811 0.312 0.3021
210 Sigma-
Aldrich
Primidone - 0.710 -0.152 -0.0721
210 TCI
Europe
Promazine 9.36 2.030 1.643 1.2320
254 Sigma-
Aldrich
Promethazine 9.00 2.040 1.613 1.3024
254 TCI
Europe
Propranolol 9.16 2.028 0.992 0.8521
290 Acros
Organics
Quinidine 8.56 2.245 0.982 0.3322
230 Acros
Organics
Ranitidine 8.33 1.233 -0.239 -1.2319
230 TCI
Europe
Rifampicin 1.70 1.900 0.990 -1.5221
230 TCI
Europe
Ropinirole 10.17 1.685 0.326 0.2519
254 Sigma-
Aldrich
Salicylic acid 2.82 -0.280 -0.302 -1.1019
300 Acros
Organics
Theobromine - 0.347 -0.284 -0.2819
270 Acros
Organics
Theophylline - 0.447 -0.218 -0.2919
270 Acros
Organics
Toluene - 1.459 0.330 0.3720
210 Acros
Organics
Tramadol 9.41 1.692 0.256 0.7021
210 Sigma-
Aldrich
Trazodone 7.30 2.223 0.780 0.3021
210 Sigma-
Aldrich
Triprolidine 8.64 2.493 0.789 0.7821
230 Sigma-
Aldrich
Valproic acid 4.54 0.001 -0.279 -0.8419
210 Acros
Organics
Venlafaxine 9.67 1.900 0.429 0.4825
230 Acros
Organics
Verapamil 8.68 2.271 1.169 -0.5219
210 Acros
Organics
Zidovudine 9.40 0.271 -0.264 -1.0020
270 Acros
Organics
Zolmitriptan 9.55 0.974 -0.159 -1.4021
220 TCI
Europe
154 * calculated by Marvin Sketch 15.1 software 155 156 157

Table 2A. Minimum and most populated values, expressed in kcal mol-1
, of the cluster affinities of 158
the analytes for the first four (from 1 to 4) discrete binding sites located on the P-gp. 159
160 161
Analyte
P-gp
1 Min
P-gp
1 MP
P-gp
2 Min
P-gp
2 MP
P-gp
3 Min
P-gp
3 MP
P-gp
4 Min
P-gp
4 MP
2-(Methylamino)pyridine -3.03 -3.03 -3.61 -3.61 -3.62 -3.62 -3.63 -3.63
2,2,2-trifluoroethyl vinyl ether -1.72 -1.72 -2.09 -2.09 -1.85 -1.85 -1.98 -1.94
2,6-diisopropylphenol -4.42 -4.42 -5.36 -5.36 -5.55 -5.55 -5.36 -5.36
Acetaminophen -3.30 -3.30 -4.72 -4.72 -4.13 -4.08 -4.85 -4.85
Acetylsalicylic acid -3.57 -3.57 -4.47 -4.36 -4.48 -4.48 -4.22 -3.95
Aminopyrine -4.43 -4.30 -5.66 -5.66 -5.63 -5.63 -5.70 -5.70
Amitriptyline -6.09 -5.02 -7.29 -7.15 -6.39 -6.39 -7.22 -7.22
Amobarbital -4.14 -4.06 -5.30 -5.00 -4.83 -4.83 -5.05 -5.05
Antipyrine -4.33 -4.33 -5.61 -5.61 -5.31 -5.31 -5.61 -5.44
Atenolol -3.81 -3.34 -5.74 -3.99 -3.82 -3.40 -4.83 -4.70
Benzene -2.72 -2.72 -3.31 -3.31 -3.31 -3.31 -3.31 -3.31
Betahistine -3.06 -3.06 -3.68 -3.68 -3.32 -3.14 -3.70 -3.70
Caffeine -3.80 -3.80 -4.60 -4.60 -4.23 -4.23 -4.33 -4.33
Carbamazepine -5.84 -5.82 -7.09 -7.09 -6.12 -6.12 -7.07 -7.07
Celecoxib -4.30 -4.30 -7.01 -6.98 -4.73 -4.12 -7.18 -7.18
Chlorambucil -3.77 -3.77 -5.13 -4.81 -5.19 -5.19 -5.16 -5.16
Chlorpromazine -5.38 -4.84 -7.24 -7.24 -6.57 -6.57 -7.26 -7.26
Cimetidine -3.27 -2.95 -4.74 -4.60 -4.10 -4.02 -4.70 -4.64
Citalopram -4.75 -4.45 -6.41 -6.14 -4.93 -4.93 -7.16 -6.86
Clonidine -4.34 -4.34 -5.41 -5.41 -5.44 -5.44 -5.40 -5.40
Clozapine -5.10 -5.05 -7.01 -7.01 -5.36 -5.36 -7.00 -6.98
Cotinine -3.93 -3.87 -5.14 -4.79 -4.92 -4.92 -4.82 -4.82
Cyclobenzaprine -6.32 -5.14 -7.18 -7.04 -6.94 -6.94 -7.14 -7.14
Desipramine -5.75 -5.43 -6.80 -6.62 -6.26 -6.08 -6.53 -6.53
Diclofenac -5.23 -4.96 -6.34 -6.13 -6.49 -6.19 -6.14 -6.05
Diphenhydramine -4.35 -3.91 -5.63 -5.63 -5.14 -5.14 -5.61 -5.61
Domperidone -5.23 -4.82 -7.12 -6.98 -6.39 -6.39 -7.18 -7.18
Donepezil -6.05 -6.05 -7.70 -7.46 -6.69 -6.67 -7.72 -7.65
Eserine -4.88 -4.88 -6.01 -5.87 -5.45 -5.45 -5.91 -5.91
Ethosuximide -3.62 -3.62 -4.22 -4.22 -4.47 -4.39 -4.42 -4.42
Ethylbenzene -3.34 -3.34 -4.22 -4.22 -4.07 -4.07 -4.07 -4.07
Fluphenazine -4.81 -3.58 -6.75 -6.75 -4.30 -4.12 -6.60 -5.82
Haloperidol -4.35 -4.17 -6.25 -6.25 -5.60 -5.60 -7.23 -6.20
Halothane -2.12 -2.12 -2.76 -2.75 -2.74 -2.72 -2.66 -2.64
Hexobarbital -4.85 -4.79 -6.02 -6.02 -5.13 -4.97 -6.03 -6.03
Hydroxyzine -4.24 -3.67 -6.41 -5.43 -4.05 -3.66 -6.19 -5.84
Ibuprofen -4.37 -4.37 -5.52 -5.43 -5.88 -5.88 -5.43 -5.34
Imipramine -5.34 -5.34 -6.68 -6.68 -5.76 -4.64 -6.68 -6.13
Indomethacin -5.67 -5.53 -7.02 -7.02 -7.28 -7.28 -7.37 -7.37
Ketorolac -5.22 -5.22 -6.61 -6.61 -6.55 -6.41 -6.62 -6.62
Lamotrigine -4.49 -3.92 -5.84 -5.84 -4.88 -4.56 -5.36 -5.36
Levofloxacin -4.45 -4.45 -5.80 -5.54 -5.80 -5.23 -6.07 -5.85
Metanol -1.40 -1.33 -1.43 -1.43 -1.33 -1.33 -1.40 -1.40

Metoclopramide -3.47 -3.47 -5.19 -3.92 -3.71 -3.07 -4.52 -4.13
Metoprolol -3.58 -3.35 -4.63 -4.06 -3.54 -2.87 -4.39 -4.18
Mianserin -5.23 -5.23 -7.06 -7.06 -6.05 -5.98 -7.11 -7.11
Naproxen -4.82 -4.82 -5.99 -5.99 -6.03 -5.91 -6.03 -6.03
Nicotine -4.02 -4.02 -4.70 -4.69 -4.50 -4.50 -4.70 -4.70
Nitrofurantoin -4.10 -4.10 -5.33 -5.33 -5.18 -5.18 -5.32 -5.32
Norfloxacin -3.83 -3.83 -5.59 -5.59 -5.51 -5.51 -5.75 -5.63
Nortriptyline -6.35 -6.35 -7.07 -6.86 -6.44 -6.44 -7.00 -7.00
Olanzapine -4.60 -4.60 -6.71 -6.62 -5.47 -5.29 -6.68 -6.68
Omeprazole -5.26 -5.20 -6.96 -6.76 -6.65 -6.41 -7.16 -6.92
Oxazepam -5.29 -5.29 -6.90 -6.90 -6.16 -6.16 -6.89 -6.89
Paroxetine -4.94 -4.94 -6.95 -6.84 -6.42 -5.67 -6.83 -6.29
Pentobarbital -3.88 -3.88 -4.76 -4.76 -4.41 -4.41 -4.91 -4.91
Phenylbutazone -5.53 -5.53 -7.27 -7.27 -6.02 -5.12 -7.45 -6.69
Phenytoin -5.00 -5.00 -6.56 -6.56 -5.39 -5.00 -6.55 -6.55
Pindolol -4.17 -4.13 -5.43 -4.86 -4.56 -4.26 -5.47 -4.60
Primidone -4.55 -4.55 -5.19 -5.19 -4.88 -4.71 -5.50 -5.50
Promazine -5.58 -5.58 -6.79 -6.50 -6.32 -6.32 -6.50 -5.84
Promethazine -4.99 -4.80 -6.78 -6.49 -6.60 -5.83 -6.51 -6.42
Propranolol -4.60 -4.38 -6.33 -5.54 -4.79 -4.22 -6.10 -5.39
Quinidine -5.72 -5.72 -7.43 -7.43 -5.26 -4.56 -7.77 -7.77
Ranitidine -2.77 -2.65 -4.11 -3.91 -4.42 -2.88 -4.31 -3.48
Rifampicin -7.10 -6.50 -4.48 -4.32 -6.80 -5.95 -7.22 -6.59
Ropinirole -4.02 -4.01 -6.30 -5.55 -4.72 -3.94 -5.94 -5.52
Salicylic acid -3.09 -3.09 -3.69 -3.69 -4.00 -4.00 -3.74 -3.71
Theobromine -3.47 -3.47 -4.54 -4.54 -4.08 -4.08 -4.54 -4.54
Theophylline -3.63 -3.63 -4.43 -4.43 -3.88 -3.87 -4.43 -4.43
Toluene -3.08 -3.08 -3.81 -3.81 -3.77 -3.77 -3.74 -3.74
Tramadol -4.89 -4.89 -5.94 -5.20 -5.15 -3.77 -5.71 -5.30
Trazodone -5.37 -5.00 -7.30 -5.74 -5.79 -6.47 -7.09 -6.06
Triprolidine -5.03 -4.92 -7.19 -7.11 -5.36 -5.36 -6.96 -6.88
Valproic acid -2.78 -2.78 -3.56 -3.56 -3.81 -3.81 -3.43 -3.43
Venlafaxine -4.81 -4.54 -6.07 -5.82 -4.54 -4.09 -6.47 -6.08
Verapamil -3.93 -3.54 -6.56 -6.37 -5.28 -4.48 -6.58 -6.14
Zidovudine -3.45 -3.21 -5.14 -5.14 -3.56 -3.27 -5.20 -5.20
Zolmitriptan -4.48 -4.32 -6.32 -6.01 -5.56 -5.56 -6.38 -5.73
162

Table 2B. Minimum and most populated values, expressed as kcal mol-1
, of the cluster affinities of 163
the analytes for the second four (from 5 to 8) discrete binding sites located on the P-gp. 164
165 Analyte
P-gp
5 Min
P-gp 5
MP
P-gp
6 Min
P-gp
6 MP
P-gp
7 Min
P-gp
7 MP
P-gp
8 Min
P-gp
8 MP
2-(Methylamino)pyridine -3.03 -3.03 -3.40 -3.40 -3.53 -3.53 -3.22 -3.22
2,2,2-trifluoroethyl vinyl ether -1.72 -1.64 -2.05 -2.05 -2.18 -2.18 -1.93 -1.93
2,6-diisopropylphenol -4.42 -4.22 -5.17 -5.17 -5.56 -5.56 -4.67 -4.67
Acetaminophen -3.81 -3.81 -4.20 -4.20 -4.10 -4.10 -3.37 -3.37
Acetylsalicylic acid -3.86 -3.86 -3.91 -3.91 -4.42 -4.42 -3.68 -3.68
Aminopyrine -5.20 -5.18 -5.36 -4.91 -5.60 -5.60 -4.47 -4.47
Amitriptyline -6.00 -5.92 -6.85 -6.85 -7.49 -7.49 -5.63 -5.63
Amobarbital -4.51 -4.51 -4.40 -4.05 -4.99 -4.99 -4.23 -4.23
Antipyrine -4.78 -4.78 -4.77 -4.77 -5.58 -5.58 -4.31 -4.30
Atenolol -4.03 -4.03 -4.82 -4.60 -4.86 -4.86 -3.37 -3.37
Benzene -3.19 -3.19 -3.26 -3.26 -3.31 -3.31 -3.01 -3.01
Betahistine -2.93 -2.93 -3.54 -3.54 -3.52 -3.52 -3.41 -3.41
Caffeine -3.64 -3.64 -3.76 -3.76 -4.56 -4.56 -3.76 -3.76
Carbamazepine -5.87 -5.87 -6.16 -6.16 -6.83 -6.83 -5.31 -5.31
Celecoxib -5.93 -5.31 -5.82 -5.82 -7.97 -7.97 -5.59 -5.04
Chlorambucil -4.30 -4.30 -4.57 -4.56 -5.63 -5.63 -3.93 -3.93
Chlorpromazine -5.66 -5.00 -6.75 -6.57 -7.23 -7.01 -5.16 -5.16
Cimetidine -3.72 -3.45 -4.58 -3.80 -4.76 -3.88 -3.41 -3.20
Citalopram -5.63 -5.59 -5.85 -5.69 -6.44 -6.44 -4.93 -4.86
Clonidine -4.06 -3.98 -4.47 -4.40 -5.34 -5.34 -4.31 -4.31
Clozapine -5.44 -5.18 -6.64 -6.64 -7.05 -7.05 -4.98 -4.95
Cotinine -4.52 -4.52 -4.48 -4.48 -4.86 -4.76 -4.29 -4.29
Cyclobenzaprine -5.70 -5.68 -7.12 -6.86 -7.35 -7.23 -5.36 -5.28
Desipramine -5.74 -5.74 -6.44 -6.44 -6.42 -5.73 -4.78 -4.78
Diclofenac -5.23 -5.23 -5.96 -5.46 -6.32 -6.32 -4.65 -4.37
Diphenhydramine -5.07 -5.07 -5.41 -4.78 -5.42 -5.42 -3.89 -3.54
Domperidone -6.04 -5.71 -5.73 -5.73 -7.69 -7.69 -6.26 -6.13
Donepezil -7.11 -6.10 -7.07 -7.07 -7.83 -7.77 -6.58 -6.58
Eserine -5.52 -5.50 -5.57 -5.57 -5.92 -5.92 -4.57 -4.54
Ethosuximide -3.62 -3.62 -4.16 -4.16 -4.34 -4.34 -3.76 -3.35
Ethylbenzene -3.58 -3.58 -3.96 -3.96 -4.21 -4.21 -3.71 -3.71
Fluphenazine -4.39 -4.39 -5.23 -3.06 -6.46 -5.16 -5.79 -5.79
Haloperidol -5.68 -5.14 -5.35 -4.41 -7.32 -7.31 -5.48 -5.35
Halothane -2.37 -2.37 -2.57 -2.55 -2.86 -2.86 -2.41 -2.35
Hexobarbital -5.21 -4.99 -5.22 -5.22 -5.51 -5.51 -4.56 -4.50
Hydroxyzine -5.26 -4.29 -5.29 -5.29 -6.18 -5.89 -4.57 -4.50
Ibuprofen -4.84 -4.84 -4.91 -4.69 -5.41 -5.41 -4.55 -4.55
Imipramine -5.83 -5.18 -6.69 -6.32 -6.67 -6.67 -4.97 -4.97
Indomethacin -5.92 -5.92 -6.44 -6.44 -7.22 -6.91 -5.26 -5.26
Ketorolac -5.73 -5.68 -5.71 -5.63 -6.36 -6.35 -5.01 -4.74
Lamotrigine -4.13 -4.09 -4.77 -4.77 -5.30 -5.23 -4.32 -3.66
Levofloxacin -5.40 -5.14 -3.46 -3.46 -6.37 -6.37 -4.71 -4.71
Metanol -1.47 -1.47 -1.38 -1.38 -1.37 -1.37 -1.42 -1.42
Metoclopramide -3.63 -3.36 -4.40 -4.02 -4.95 -4.95 -3.55 -2.80
Metoprolol -3.49 -3.46 -4.25 -4.25 -4.60 -4.39 -3.57 -3.42
Mianserin -5.89 -5.89 -6.21 -6.21 -7.07 -7.07 -5.63 -5.63
Naproxen -5.26 -5.26 -5.48 -5.48 -5.80 -5.80 -4.72 -4.71
Nicotine -3.77 -3.77 -4.42 -4.20 -4.67 -4.67 -4.24 -4.13
Nitrofurantoin -4.37 -4.30 -4.62 -4.31 -5.24 -5.24 -3.90 -3.67
Norfloxacin -4.46 -4.44 -3.73 -2.70 -5.85 -5.83 -4.99 -4.99
Nortriptyline -5.98 -5.98 -7.20 -7.20 -7.09 -7.07 -5.30 -5.05
Olanzapine -5.42 -5.42 -6.24 -6.24 -6.48 -6.48 -5.06 -5.06
Omeprazole -5.24 -5.22 -6.47 -6.47 -7.26 -6.79 -5.28 -4.22
Oxazepam -5.96 -5.94 -6.61 -6.61 -6.81 -6.70 -5.02 -5.02
Paroxetine -5.71 -5.03 -6.14 -4.23 -7.49 -6.50 -4.97 -4.97
Pentobarbital -4.29 -4.18 -4.35 -4.22 -4.84 -4.84 -3.75 -3.60
Phenylbutazone -6.29 -6.19 -7.19 -7.19 -7.33 -6.78 -5.57 -5.44
Phenytoin -5.80 -5.80 -5.42 -5.38 -6.25 -6.25 -4.67 -4.64
Pindolol -3.61 -3.58 -5.72 -5.72 -5.29 -5.13 -4.03 -3.81
Primidone -4.43 -4.31 -4.99 -4.99 -5.23 -5.23 -4.26 -4.08
Promazine -5.47 -4.86 -6.22 -5.94 -6.47 -6.05 -4.71 -4.50
Promethazine -5.55 -4.99 -6.07 -5.87 -6.62 -6.40 -4.72 -4.68
Propranolol -4.42 -4.42 -5.99 -5.19 -5.67 -5.62 -4.30 -4.30
Quinidine -5.68 -5.68 -6.74 -5.62 -7.92 -7.78 -5.32 -4.72
Ranitidine -2.99 -2.99 -3.61 -3.34 -3.76 -2.86 -2.12 -1.63
Rifampicin -5.13 -3.28 -6.66 -6.00 -7.44 -7.00 -3.14 -3.14
Ropinirole -4.25 -4.17 -5.98 -5.98 -6.22 -6.22 -4.11 -3.39
Salicylic acid -3.09 -3.09 -3.42 -3.42 -3.85 -3.85 -3.31 -3.31
Theobromine -3.46 -3.46 -3.49 -3.49 -4.29 -4.29 -3.80 -3.80
Theophylline -3.63 -3.63 -3.72 -3.72 -4.45 -4.45 -3.66 -3.66
Toluene -3.42 -3.42 -3.79 -3.79 -3.93 -3.93 -3.39 -3.39
Tramadol -4.46 -4.46 -5.36 -5.36 -5.62 -5.46 -4.26 -4.26
Trazodone -6.06 -6.26 -6.86 -6.86 -7.40 -7.29 -6.06 -5.47
Triprolidine -6.48 -6.48 -6.40 -5.53 -7.28 -7.28 -5.38 -5.26
Valproic acid -3.03 -3.03 -3.10 -3.10 -3.76 -3.76 -2.90 -2.90
Venlafaxine -4.64 -4.33 -5.60 -5.23 -6.48 -6.48 -4.40 -4.40
Verapamil -5.16 -4.84 -4.74 -3.51 -6.80 -6.53 -4.32 -3.72
Zidovudine -3.94 -3.93 -4.49 -4.49 -4.55 -4.55 -3.90 -3.19
Zolmitriptan -4.78 -3.70 -6.13 -6.13 -6.15 -6.15 -4.42 -4.42
166

2.1 MLC INDEXES IN LOG BB PREDICTION 167
MLC indexes were used to develop BBB passage potential predicting models along with either 168
static or conformational properties. At first, all the analytes were assumed as having zero atomic 169
charges, even the ones supporting one or more ionizable functions. The equations along with the 170
statistical validation are reported in Table 3. In the equations thereby reported, r2
is the multiple 171
regression coefficient, q2
is the r2 validated by Leave-One-Out (LOO) optimization, SE is the error 172
standard deviation, F represents the Fischer regression statistical value, PC is the Amemiya 173
predictive criterion and ExRow is the analyte excluded for maximizing the predictive strength of 174
the statistical model. If not differently indicated, every regression was developed by employing four 175
different independent variables (MLC indexes + three other physico-chemical descriptors). 176
Surprisingly, even if over two thirds of the analytes support one or more ionizable functions, fairly 177
good relationships, as the one expressed by equations (1) and (2), are obtained even not taking into 178
account the presence of electric charges. This may be attributed to the fact that, although the 179
molecular mechanisms involved in MLC are multiple and complex, the occurrence of 180
analyte/micelles electrostatic interactions plays a pivotal role in the global retention and it appears 181
reasonable to assume that such interactions are encoded in MLC indexes. It should be also 182
highlighted that, in these specific cases, being VirtualLogP values calculated starting from the 183
analytes assumed in their forms having zero atomic charges, such values can be reasonably assumed 184
as estimates of their log PN values. Subsequently, the analytes supporting extensively ionizable 185
functions (i.e. carboxy groups, for acids primary, secondary and tertiary amines for bases) were 186
assumed as completely charged, regardless of the relative abundance of the charged species at the 187
physiological pH. Considering the ionizable analytes as entirely charged species slightly worsened 188
the relationships (equations (3) and (4)). It should be pointed out that verapamil, the analyte 189
excluded to maximize the predictive strength of the statistical model is a well-known P-gp 190
substrate26
. P-gp is an ATP-dependent efflux pump, with broad substrate specificity which pumps 191
many foreign substances out of cells27
. Although it is widely expressed in the intestinal epithelium, 192

liver cells and proximal tubule of the kidney, P-gp is also localized in the capillary endothelial cells 193
composing the BBB and is responsible, for some classes of actives, of multi-drug resistance. 194
Eventually, a weighted average of the static properties at physiological pH (7.4), according to the 195
pKa of each compound, was performed. For zwitterions, the static properties were calculated for 196
each microspecies possibly present at pH 7.4 and their relative abundances, calculated by the 197
software Marvin Sketch 15.1 for Mac OS X28
, were also used to perform the weighted averages. 198
The relative abundances of the microspecies present at pH 7.4 are reported in the Supporting 199
Information section for the ampholytes levofloxacin (page S-2), norfloxacin (page S-4) and 200
omeprazole (page S-6). This approach was adapted to mirror more closely what actually occurs in 201
vivo. Performing the weighted average of the properties benefited noticeably the relationships as 202
described by equations (5) and (6). It is also interesting to note how, according to the above 203
reported relationships, the BBB penetration of drugs will be enhanced for highly retained 204
compounds in MLC, how it is hindered by the occurrence of drug/membrane polar (Psa)/ 205
electrostatic (Dipole) interactions, and how the transport through the barrier seems favored for 206
bases (Charge). However, by taking into account the analytes assumed as static, the properties are 207
derived considering them in their minimum energy conformations, i.e. after minimization. Indeed, 208
several authors29
reported that such conformations are not always the ones actually involved in 209
membrane barrier passage. Therefore, a conformational analysis in vacuum was carried out for each 210
analyte included in the data set by using the Boltzmann Jump method that generates at random 1000 211
possible conformations by exploring the conformational space of the rotatable dihedral angles. The 212
conformational analysis was first performed on the analytes assumed as having zero atomic 213
charges, then on the analytes assumed as completely charged and finally taking into account a 214
weighted average of the properties at the experimental pH 7.4, according to the pKa of each analyte. 215
In the following models the conformational properties were considered separately to look into the 216
predictive strength of the models. As it is evident from Table 3, the use of conformational 217
properties instead of the static ones slightly worsened the relationships. This aspect is quite 218

interesting as the calculation of conformational properties can be rather time-consuming especially 219
if the compound libraries to screen are wide and the computers employed are not sufficiently 220
powerful. Conversely, the static properties are much faster to calculate. Performing the weighted 221
average of the conformational properties yielded the most predictive models (equations (11) and 222
(12)) and in those relationships, verapamil again behaved as an outlier, suggesting that such models 223
would not be able to mirror the penetration of analytes undergoing some sort of active transport, in 224
this case P-gp mediated efflux. It is interesting to point out how, among the ionized properties 225
employed for the statistical method development (equations (9) and (10)), no one depends 226
noticeably on ionization. Furthermore, the conformational analysis demonstrated how it is the PSA 227
Max, i.e. the maximum value that the PSA assumes by exploring the conformational space in 228
vacuum of each analyte, that best relates with log BB values as those values are incorporated in 229
each model based on conformational properties (equations (7), (8), (9), (10), (11) and (12)). 230
231
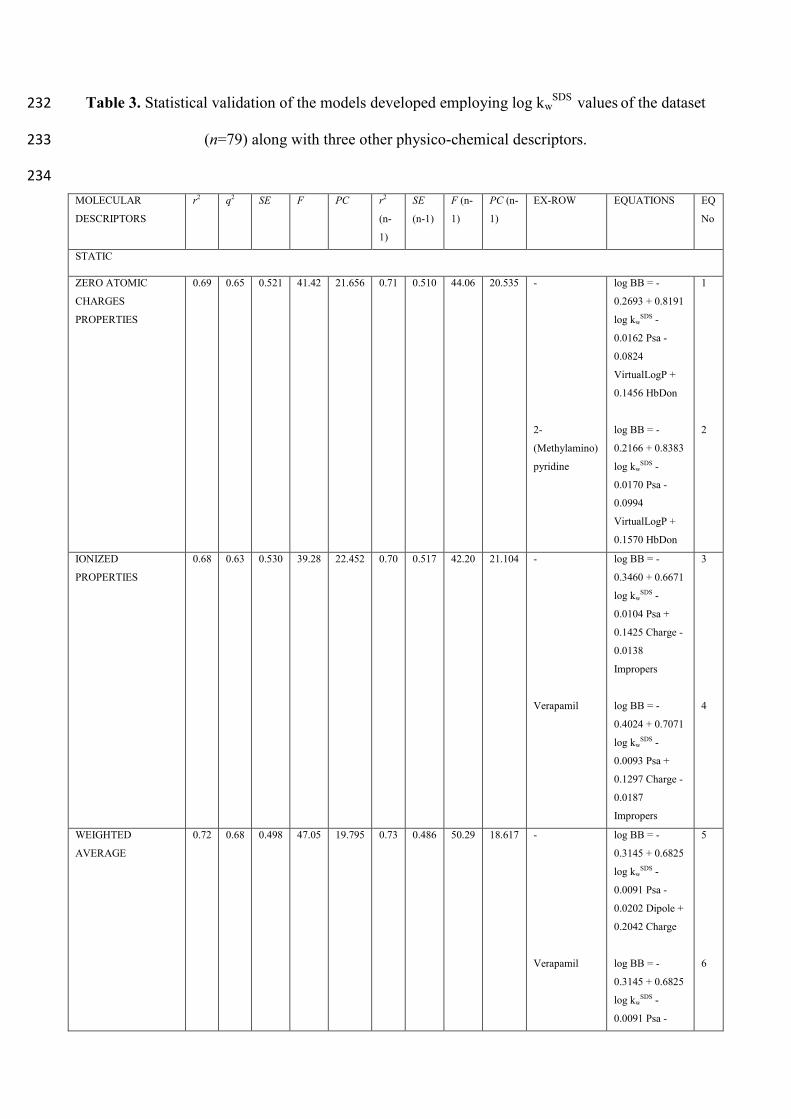
Table 3. Statistical validation of the models developed employing log kwSDS
values of the dataset 232
(n=79) along with three other physico-chemical descriptors. 233
234
MOLECULAR
DESCRIPTORS
r2 q2 SE F PC r2
(n-
1)
SE
(n-1)
F (n-
1)
PC (n-
1)
EX-ROW EQUATIONS EQ
No
STATIC
ZERO ATOMIC
CHARGES
PROPERTIES
0.69 0.65 0.521 41.42 21.656 0.71 0.510 44.06 20.535 -
2-
(Methylamino)
pyridine
log BB = -
0.2693 + 0.8191
log kwSDS -
0.0162 Psa -
0.0824
VirtualLogP +
0.1456 HbDon
log BB = -
0.2166 + 0.8383
log kwSDS -
0.0170 Psa -
0.0994
VirtualLogP +
0.1570 HbDon
1
2
IONIZED
PROPERTIES
0.68 0.63 0.530 39.28 22.452 0.70 0.517 42.20 21.104 -
Verapamil
log BB = -
0.3460 + 0.6671
log kwSDS -
0.0104 Psa +
0.1425 Charge -
0.0138
Impropers
log BB = -
0.4024 + 0.7071
log kwSDS -
0.0093 Psa +
0.1297 Charge -
0.0187
Impropers
3
4
WEIGHTED
AVERAGE
0.72 0.68 0.498 47.05 19.795 0.73 0.486 50.29 18.617 -
Verapamil
log BB = -
0.3145 + 0.6825
log kwSDS -
0.0091 Psa -
0.0202 Dipole +
0.2042 Charge
log BB = -
0.3145 + 0.6825
log kwSDS -
0.0091 Psa -
5
6

0.0202 Dipole +
0.2042 Charge
CONFORMATIONAL
ZERO ATOMIC
CHARGES
PROPERTIES
0.69 0.64 0.526 40.25 22.081 0.71 0.509 44.37 20.426 -
Pindolol
log BB = -
0.4857 + 0.8201
log kwSDS -
0.0044 PSA
Max - 0.0708
MD Max -
0.2671 MD sd
log BB = -
0.4973 + 0.8307
log kwSDS -
0.0048 PSA
Max - 0.0583
MD Max -
0.3274 MD sd
7
8
IONIZED
PROPERTIES
0.65 0.62 0.549 69.77 23.504 0.67 0.538 74.60 22.304 -
Primidone
log BB = -
0.5392 + 0.7898
log kwSDS -
0.0093 PSA
Max
log BB = -
0.5338 + 0.8008
log kwSDS -
0.0099 PSA
Max
9
10
WEIGHTED
AVERAGE
0.68 0.63 0.534 38.57 22.729 0.70 0.520 41.69 21.283 -
Verapamil
log BB = -
0.4329 + 0.7969 log kw
SDS -
0.0072 PSA
Max - 0.0235
MD Min -
0.0485 MLP
Average
log BB = -
0.4911 + 0.8121
log kwSDS -
0.0068 PSA
Max - 0.0233
MD Min - 0.0334 MLP
Average
11
12
2.2 IAM INDEXES IN LOG BB PREDICTION 235
The same approach was extended to the IAM indexes. The equations along with the statistical 236
validation coefficient are reported in Table 4. Indeed, taking into account either the properties of the 237
analytes assumed as having zero atomic charges (equations (13) and (14)) or those of the analytes 238

assumed as completely charged (equations (15) and (16)) resulted in a BBB passage predictive 239
strength inferior to that obtained by using MLC indexes. Such conclusions are supported by the 240
lower correlation coefficients obtained. It is interesting to note how domperidone, the compound 241
excluded in first best optimized model described by equation (14), is a well-known substrate of the 242
P-gp26
, and is pumped out of cells by such efflux system despite its high biomembrane passive 243
diffusion. Analogously to what was observed in the analysis of MLC indexes, performing the 244
weighted average of the static properties resulted the winning strategy also for this set of 245
experimental measures. In fact, a 0.72 r2 (n-1), achieved on a set as large as 79 analytes, employing 246
only four descriptors suggests that the model (equations (17) and (18)) is robust and reliable 247
However, these relationships are roughly comparable to those obtained by using MLC indexes 248
(equations (5) and (6)). This evidence is indeed rather surprising, since the IAM stationary phase 249
consists of analogues of phosphatidylcholine, the most abundant phospholipid expressed in the 250
capillary endothelium acting as a barrier between the blood and the cerebrospinal fluids (CSF), and 251
thus they would represent an ideal biomimetic system. Conversely, this kind of SDS based MLC 252
should have drawbacks arising from the different chemical structure of SDS in comparison with 253
membrane phospholipids. But this evidence would suggest that they are incidentally able to mirror 254
the drug/membrane interactions involved in vivo thanks to the peculiar amphiphilic features of the 255
anionic micelles. In fact, for some reasons, they seem to be able to model the passive BBB 256
penetration of drugs fairly better than IAM indexes. Furthermore, the physico-chemical descriptors 257
reported in equation (18) are the same as the ones in equation (6), supporting again the concept 258
according to which the polar (Psa) /electrostatic (Dipole) interaction component plays a relevant 259
role in hindering the BBB penetration of drugs. Again, bases seem to be favored in BBB entering 260
and this is also consistent with the clinical experience. In fact, polar and extensively protonated at 261
pH 7.4 basic compounds, such as amphetamine and methamphetamine, are known to have an 262
appreciable CNS activity but it is much harder to recall similar cases for polar acids. The 263
conformational analyses of the analytes neither assumed as having zero atomic charges, nor as 264

ionized benefitted the relationships. Moreover, even performing the weighted average was not 265
beneficial at all for the relationships (data not shown). 266
267
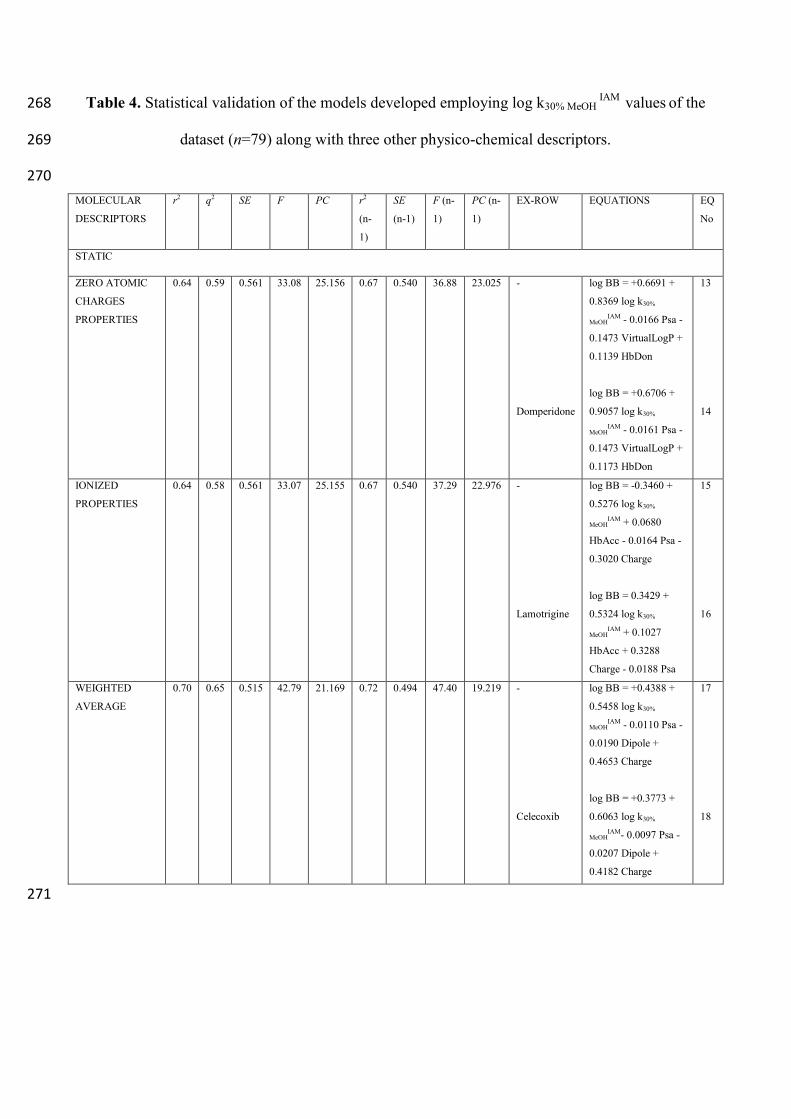
Table 4. Statistical validation of the models developed employing log k30% MeOH IAM
values of the 268
dataset (n=79) along with three other physico-chemical descriptors. 269
270
MOLECULAR
DESCRIPTORS
r2 q2 SE F PC r2
(n-
1)
SE
(n-1)
F (n-
1)
PC (n-
1)
EX-ROW EQUATIONS EQ
No
STATIC
ZERO ATOMIC
CHARGES
PROPERTIES
0.64 0.59 0.561 33.08 25.156 0.67 0.540 36.88 23.025 -
Domperidone
log BB = +0.6691 +
0.8369 log k30%
MeOHIAM - 0.0166 Psa -
0.1473 VirtualLogP +
0.1139 HbDon
log BB = +0.6706 +
0.9057 log k30%
MeOHIAM - 0.0161 Psa -
0.1473 VirtualLogP +
0.1173 HbDon
13
14
IONIZED
PROPERTIES
0.64 0.58 0.561 33.07 25.155 0.67 0.540 37.29 22.976 -
Lamotrigine
log BB = -0.3460 +
0.5276 log k30%
MeOHIAM + 0.0680
HbAcc - 0.0164 Psa -
0.3020 Charge
log BB = 0.3429 +
0.5324 log k30%
MeOHIAM + 0.1027
HbAcc + 0.3288
Charge - 0.0188 Psa
15
16
WEIGHTED
AVERAGE
0.70 0.65 0.515 42.79 21.169 0.72 0.494 47.40 19.219 -
Celecoxib
log BB = +0.4388 +
0.5458 log k30%
MeOHIAM - 0.0110 Psa -
0.0190 Dipole +
0.4653 Charge
log BB = +0.3773 +
0.6063 log k30%
MeOHIAM- 0.0097 Psa -
0.0207 Dipole +
0.4182 Charge
17
18
271

2.3 IAM + MLC INDEXES IN LOG BB PREDICTION 272
In the present study, MLC and IAM indexes were, in a first instance, considered separately. 273
However, the evident differences in the elution order observed depict a rather different selectivity 274
between both techniques. For this reason, the development of the BBB entering potential statistical 275
models was also performed by considering both the chromatographic indexes at the same time, 276
along with three other molecular descriptors (five independent variables in total), starting from the 277
weighted average of the molecular properties. This strategy resulted in a markedly improved 278
predictive strength (equations (19) and (20)) as reported in Table 5. These relationships may 279
suggest that the molecular mechanism involved in IAM-LC and MLC are different but play both a 280
relevant role in BBB diffusion of drugs. 281
2.4 P-GP AFFINITIES IN LOG BB PREDICTION 282
As already mentioned, each analyte present in the dataset was docked into each discrete binding site 283
on the P-gp and the binding affinities were incorporated in the development of BBB passage 284
predictive statistical models. Indeed, recent fuctional studies have identified seven sometimes 285
overlapping binding sites accommodating substrates and inhibitors in the greasy, polyspecific 286
binding cavity of P-gp. These binding sites were demonstrated able to allosterically communicate in 287
a negative heterotropic manner. Moreover, an additional binding site was recognized on the exterior 288
of P-gp bounded by residues from the transmembrane helices 9, 12 and the elbow helix 2. This site 289
faces away from the transporter, lying close to the predicted membrane–water interface and 290
intramembranous substrate-entry portal. 291
On average , highly clustered results were achieved, meaning that the conformational search 292
procedure was exhaustive enough to ensure a coverage of the accessible conformational space. An 293
extensive cluster analysis (RMSD tolerance was set to 2.0 Å) was performed and the binding 294
affinity now reported in Table 2A and Table 2B are the minimum and the most populated binding 295
energies of the clusters. The errors of the estimates of free energies of binding were never higher 296

than ± 1.8 kcal mol-1
. However, from the relationships reported above, P-gp affinities do not seem 297
to have an appreciable role in BBB passage. However, this is not entirely true because the statistical 298
model development was carried out using only four independent variables, thus leading the 299
software to select only the four most relevant descriptors, among which P-gp affinities were not 300
included. Indeed, when five independent variables were set in the statistical method development, 301
the P-gp binding affinities (Table 5A and 5B) were used by the software to build up the models. 302
Equations (21) and (22), generated by IAM indexes and four static properties of the analytes, 303
assumed as having zero atomic charges, is an example as can be seen in Table 5. The AutoDock 304
GPF/DPF files for site 1 and 7, i.e. the ones actually involved in the statistical models (21) and (22), 305
are now provided as supplementary materials. 306
This is not surprising because among the considered analytes, the only ones known from the 307
literature to be substrates of P-gp are cimetidine, domperidone, ranitidine, rifampicin, quinidine and 308
verapamil26
, and they represent less than 5% of the dataset. Indeed, the compounds considered were 309
selected in the attempt to mirror as accurately and completely as possible the marketed drugs, in 310
terms of diverse chemical nature, molecular volume, CNS activity and molecular lipophilicity. 311
Since the active transport comprises only for a minority of drugs, whereby the drug uptake in 312
mainly driven by passive transcellular diffusion, the limited predictivity of the P-gp molecular 313
affinity may be dataset related. This approach suffers from some limitations, the most evident one 314
being the aspect that the receptor flexibility is not taken into account. The main reason behind it is 315
the large number of degrees of freedom that should be considered in this kind of calculations, thus 316
requiring remarkable computational power. However, neglecting the receptor flexibility could lead 317
to poor docking results in terms of binding pose prediction in real-world settings. Therefore, these 318
results must be regarded as a preliminary attempt to gain new insights and model the active efflux 319
of drugs pumped out of cells by P-gp, being neither exhaustive nor complete. Other experiments 320
have to be performed and docking conditions further calibrated in order to validate the proposed 321

model. 322
323

Table 5. Statistical validation of the models developed employing either log kwSDS
or log k30% MeOH 324
IAM values
of the dataset (n=79) along with four (equations (29-32)) or five (equations (25-28)) 325
other physico-chemical descriptors. 326
327 328 STATIC r2 q2 SE F PC r2 (n-
1)
SE (n-
1)
F (n-
1)
PC (n-
1)
EX-ROW EQUATIONS EQ
No
MLC + IAM 0.74 0.69 0.477 42.45 18.409 0.77 0.454 48.09 16.447 -
Domperidone
log BB = -
0.0521 +
0.5338 log
kwSDS +
0.3799 log
k30%MeOHIAM -
0.0093 PSA -
0.0252 Dipole
- 0.1057
VirtualLog P
log BB = -
0.0506 +
0.5134 log
kwSDS +
0.4466 log
k30%MeOHIAM -
0.0086 PSA -
0.0266 Dipole
- 0.1120
VirtualLogP
19
20
P-GP AFFINITIES +
IAM
0.67 0.61 0.544 29.30 23.925 0.69 0.521 32.50 21.653 -
Celecoxib
log BB =
0.8837 +
0.9206 log k
IAM - 0.0131
Psa - 0.2781
P-gp 1 Min -
0.1399
VirtualLogP
+ 0.2742 P-gp
7 MP
log BB =
0.8118 +
0.9239 log
k30%MeOHIAM -
0.0135 Psa -
0.1574
VirtualLogP -
0.2825 P-gp 1
Min + 0.2575
21
22
P-gp 7 MP
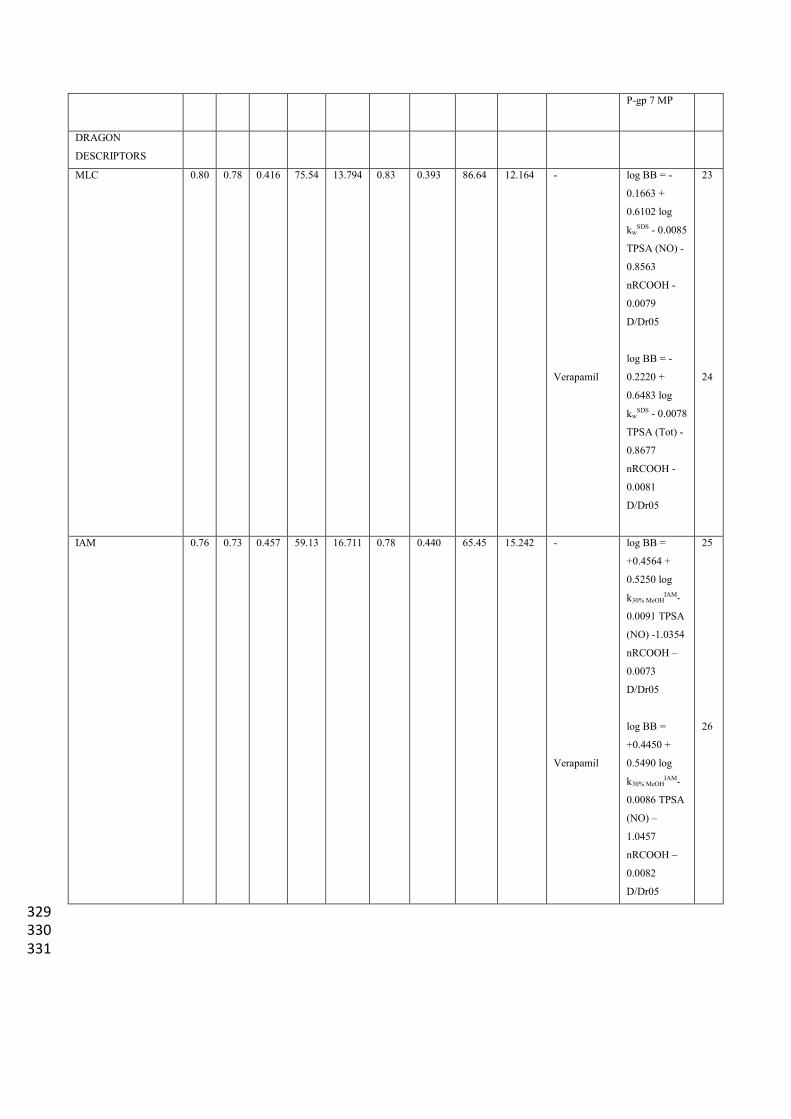
DRAGON
DESCRIPTORS
MLC 0.80 0.78 0.416 75.54 13.794 0.83 0.393 86.64 12.164 -
Verapamil
log BB = -
0.1663 +
0.6102 log
kwSDS - 0.0085
TPSA (NO) -
0.8563
nRCOOH -
0.0079
D/Dr05
log BB = -
0.2220 +
0.6483 log
kwSDS - 0.0078
TPSA (Tot) -
0.8677
nRCOOH -
0.0081
D/Dr05
23
24
IAM 0.76 0.73 0.457 59.13 16.711 0.78 0.440 65.45 15.242 -
Verapamil
log BB =
+0.4564 +
0.5250 log
k30% MeOHIAM-
0.0091 TPSA
(NO) -1.0354
nRCOOH –
0.0073
D/Dr05
log BB =
+0.4450 +
0.5490 log
k30% MeOHIAM-
0.0086 TPSA
(NO) –
1.0457
nRCOOH –
0.0082
D/Dr05
25
26
329 330 331

2.5 E-DRAGON DESCRIPTORS IN MAXIMIZING THE PREDICTIVE STRENGTH OF THE 332
MODELS 333
In an attempt to further maximize the predictive strength of the models, IAM and MLC indexes 334
were used in combination with E-Dragon descriptors30
. The E-Dragon software calculates more 335
than 1,600 descriptors, including not only the simplest atom type, functional group and fragment 336
counts, but also several topological and geometrical descriptors. The results and statistical method 337
validation are reported in Table 5. Remarkably high correlation coefficients were achieved with 338
either IAM (r2 = 0.78, equation (26)) or MLC (r
2= 0.83, equation (24)). As suggested by the 339
similarly high q2 values, those relationships are not affected by any over fitting. The plots of the 340
experimental vs predicted log BB values (as predicted by equation (24)) are reported in Figure 3. 341
Such relationship is based on MLC indexes, TPSA (Tot) i.e. the topological polar surface area using 342
nitrogen, oxygen, sulphur, phosphorus polar contributions which differs from the TPSA (NO), 343
included, for instance in equations (23), (25) and (26) that instead takes into account, in the 344
topological polar surface area computation the nitrogen and oxygen contributions only. nRCOOH 345
and D/Dr 05 are included in all the equations reported in Table 5. While the former is a functional 346
group descriptor referring to the number of aliphatic carboxylic acids, the latter is a topological 347
descriptor, named distance/detour ring index of order 5. It is based on operation over the 348
distance/detour matrix D/∆, a square symmetric matrix that contains the ratios of the lengths of the 349
shortest to the longest path between any pair of vertices. It is calculated by the following equation: 350
351
Although the role that such a parameter could play in the BBB partition is unclear, being its 352
interpretation quite difficult, it cannot be excluded that it might affect the molecular flexibility of 353
the analytes. However, the models obtained starting from E-Dragon descriptors would again 354
support the view according to which the BBB penetration of drugs would be enhanced for highly 355

retained compounds either in IAM or MLC and hindered for compounds having greater PSA and 356
supporting one or even more acidic functions. To further validate the proposed method, the datasets 357
were divided randomly into 16 pairs of training and test sets. For each pair, the multiple linear 358
regression was performed and the equations derived from the training sets were subsequently used 359
to predict the log BB values of the test sets. Such value set was used to evaluate the regression 360
coefficient (r2), the standard error (SE) of the estimates and the Fischer coefficients. The results of 361
this additional validation are shown in Table 6. 362
363
Table 6. Validation of the best model employing four descriptors for log BB prediction. 364
365
Model Validation
Trial Training set Test set
r2 SE F r
2 SE
1 0.87 0.320 57.459 0.75 0.496
2 0.85 0.412 46.645 0.71 0.445
3 0.84 0.411 45.880 0.71 0.498
4 0.84 0.390 45.696 0.74 0.488
5 0.84 0.415 43.969 0.75 0.433
6 0.84 0.394 43.432 0.75 0.450
7 0.83 0.389 41.407 0.77 0.455
8 0.81 0.427 35.093 0.76 0.445
9 0.80 0.444 35.085 0.78 0.411
10 0.80 0.438 34.173 0.77 0.430
11 0.80 0.426 33.984 0.79 0.453
12 0.80 0.482 33.303 0.79 0.372
13 0.80 0.444 33.181 0.78 0.424
14 0.79 0.444 32.284 0.79 0.413
15 0.77 0.462 28.660 0.81 0.404
16 0.75 0.476 25.656 0.82 0.393
366 . 367 368
369

Figure 3. Experimental vs Predicted log BB values plot for the best model obtained in the present 370 study (Eq. (24)). 371
372 373
374 375 376 377
r² = 0.83
-3,50
-2,50
-1,50
-0,50
0,50
1,50
2,50
-2,50 -2,00 -1,50 -1,00 -0,50 0,00 0,50 1,00 1,50 2,00 2,50
Pre
dic
ted
lo
g B
B
Exp log BB

3.0 CONCLUSION 378
379 Highly significant (r
2 (n-1) up to 0.83) statistical methods for the BBB entering potential of drugs 380
were achieved by applying the proposed method, which incidentally shed new light into BBB 381
penetration of drugs. In fact, the BBB passage was found related to the analyte charges, being 382
hindered for compounds supporting one or more acidic functions, and enhanced for bases. 383
Moreover, molecules with higher dipolar momentum and greater PSA seemed less prone to cross 384
the BBB. The relatively high number of analytes taken into account support statistically the 385
suitability of the method as early screening method to evaluate BBB passage, and consolidate the 386
novelty of the present work. In the modeling of drugs’ BBB passage, both IAM and MLC indexes 387
are found advantageously suitable; however, their combination with physico-chemical descriptors is 388
highly beneficial for prediction. From a theoretical point of view, it should be considered that both 389
IAM and MLC indexes relate to BBB passage data despite the different interactions they depict as 390
confirmed by the lack of co-linearity between those two analytical indexes. Again, their 391
simultaneous use in the statistic models, here performed for the first time, improved their prediction 392
strength, thus suggesting that both play a relevant role in BBB passage although mirroring different 393
phenomena. The P-gp efflux has also been investigated, but our results indicate that it would affect 394
the overall BBB drug uptake only negligibly. However, this conclusion should be regarded 395
cautiously due to the aspect that only a fewP-gp substrates were included in the set of analytes 396
considered. Furthermore, the molecular docking simulations suffer from several limitations, the 397
most important being the aspect that the receptor flexibility is not taken into account. This might 398
have played a role in the moderate predictivity of the in silico calculated P-gp binding affinities. 399
Finally, the proposed method is also suitable for pharmaceutical companies in the search for 400
accurate BBB penetration oriented screening methods as the chromatographic conditions were 401
carefully studied to obtain the indexes in a relatively short time such as to meet their demands. 402
Chromatographic indexes (MLC and IAM) were always included in the best statistical models; this 403

implies that the information encoded in such measures is original and cannot be satisfactorily 404
surrogated by other in silico descriptors. The molecular modeling performed was simple, easy-to-405
perform and can be configured to run automatically in case of batch analyses. Furthermore, as the 406
method is rather cheap and relies on basic HPLC equipment, it offers potential for broad scale 407
application 408
4.0 EXPERIMENTAL SECTION 409
410
4.1 CHEMICALS 411
412
The solutes were obtained from Sigma-Aldrich (Machelen, Belgium), TCI-Europe (Zwijndrecht, 413
Belgium) and Thermofisher Acros Organics (Geel, Belgium) as listed in Table 1 and their purity 414
was equal to or higher than 98%. 415
416 4.2 ANALYTICAL COLUMNS 417
MLC and IAM experiments were performed on an Agilent Zorbax SB-C18 Rapid Resolution (3.5 418
μm, 50 mm x 2.1 mm; Santa Clara, CA, USA) and Regis IAM Fast Mini Screening (10 μm, 10 mm 419
× 3.0 mm; Morton Grove, IL, USA) columns, respectively. 420
4.3 APPARATUS 421
422
4.3.1 MLC-HPLC 423
MLC chromatographic analysis was performed on an Alliance, Waters 2690 chromatograph 424
(Milford, MA, USA) with a quaternary pump and an automatic injector. A Waters 2487 dual-425
wavelength absorbance ultraviolet detector was used. The applied detection wavelengths for the 426
various solutes were always in the range between 210 and 300 nm as listed in Table 1. Data 427

acquisition and processing were performed using a PeakSimple Chromatography Data System 428
(model 202) and PeakSimple software (SRI Instruments, Torrance, CA, USA). The temperature of 429
the analysis was controlled by a Polaratherm series 9000 unit (Selerity Technologies, Salt Lake 430
City, USA) and set at 37 °C. The flow rate was 1.0 mL min-1
and the injection volume was 20 L. 431
4.3.2. IAM-HPLC 432
IAM based chromatographic analysis was performed on an Agilent Capillary 1200 system (Santa 433
Clara, CA, USA). The system included a capillary pump, a micro vacuum degasser and an 434
automatic injector. An Agilent 1200 Series variable wavelength detector was used and set at the 435
maximum absorbance wavelength of each analyte. The IAM-HPLC experiments were carried out 436
at room temperature (20 ± 2 °C), the flow rate was 300 L min-1
and the injection volume was 1 L. 437
4.4 MOBILE PHASE AND SAMPLE PREPARATION 438
MLC mobile phases were composed of aqueous solutions of 0.05 mol·L−1
sodium dodecyl sulfate 439
(SDS) (Acros). Water (18.2 MΩ·cm-1
) was purified and deionized in house via a Milli-Q plus 440
instrument from Millipore (Bedford, New Hampshire, USA). pH was adjusted to pH 7.4 by 441
phosphate buffer, prepared with 0.05 mol·L-1
disodium hydrogen phosphate (Sigma–Aldrich) and 442
potassium dihydrogen phosphate (Sigma–Aldrich). To reproduce the osmotic pressure of biological 443
fluids, NaCl (9.20 g·L-1
) (Sigma–Aldrich) was added to the micellar mobile phase. IAM mobile 444
phases consisted of a solution 70/30 v/v Dulbecco’s phosphate-buffered saline (DPBS) / methanol 445
(HPLC-grade; Biosolve, Valkenswaard, The Netherlands). DPBS was composed of 2.7 mmol·L−1
446
KCl, 1.5 mmol·L−1
potassium dihydrogen phosphate, 137.0 mmol·L−1
NaCl, and 8.1 mmol·L−1
447
disodium hydrogen phosphate (Sigma–Aldrich). Such solution had a pH value of 7.40 0.05, and 448
no pH adjustment was performed. All mobile phases were vacuum-filtered through 0.20 μm nylon 449
membranes (Grace, Lokeren, Belgium) before use. Different mobile phases and elution programs 450
were tested starting from 100% aqueous phase; however, in IAM-LC the latter condition did not 451
allow the elution of the most lipophilic bases in a reasonable amount of time. Stock solutions of all 452

drugs were prepared by dissolving 10 mg in 1 mL of methanol except for i) quinidine and 453
theobromine, for which stock concentrations of 1 mg·mL−1
and 200 μg·mL−1
, respectively, were 454
used, ii) caffeine and theophylline, which were dissolved in water (10 mg·mL−1
), iii) domperidone, 455
which was dissolved in dimethyl sulfoxide (10 mg·mL−1
) and iv) chlorpromazine, which was 456
dissolved in acetonitrile. Stock solutions were stored at 4 °C, except for atenolol, zidovudine, 457
chlorambucil and rifampicin, which were stored at −20 °C. Working solutions were freshly 458
prepared at the beginning of each day by dilution, with the mobile phase, of the stock solutions to 459
50 μg·mL−1
for all the analytes, except for valproic acid and halothane that were diluted to 250 460
μg·mL−1
. 461
4.5 DATA SOURCES 462
Log BB values were taken from the literature18–24
. pKa values were obtained from the literature21
463
except for amobarbital, donepezil, fluphenazine, hydroxyzine, ketorolac, paroxetine and ropinirole, 464
whose values were calculated by the software Marvin Sketch 15.1 for Mac OS X28
. 465
4.6 SOFTWARE 466
467
4.6.1 MOLECULAR MODELING 468
Molecular modeling was performed by the software Vega ZZ 3.0.5 for Windows-based PCs31
. The 469
starting three-dimensional structures of the considered molecules were downloaded from PubChem 470
database32
and they were considered in both zero atomic charge and ionized form. The Gasteiger – 471
Marsili33
method, along with CHARMM34,35,36
force field, was applied to calculate the atomic 472
charges required to perform the next molecular mechanics calculations. An extensive 473
conformational analysis was carried out in vacuum by using the Boltzmann Jump method 474
(MonteCarlo procedure) implemented in AMMP software37
which generates 1000 geometries for 475
each compound by randomly rotating the rotors and the obtained lowest energy conformation was 476
further optimized by performing a PM7 semi-empirical calculation with MOPAC 2012 program38
477

(keywords: PM7 PRECISE MMOK). A cluster analysis was performed to select the most populated 478
conformation states. Physico-chemical and topological/geometrical properties (Virtual logP39
, 479
lipole40
, volume, polar surface area, surface accessible to the solvent, gyration radius, ovality, mass, 480
number of atoms, angles, dihedrals, etc) were calculated by VEGA ZZ software and, finally, all 481
molecules were inserted into a Microsoft Access database. 482
The QSPR models were obtained by the automatic stepwise approach implemented in “Automatic 483
linear regression” script of VEGA ZZ software, calculating regression models, including from 1 to 484
5 independent variables. The predictive strength of the best equation was evaluated by leave-one-485
out (LOO) cross validation and the regression coefficients were calculated to evaluate the set in 486
terms of standard deviation of errors, angular coefficient, intercept and r2 of the trend line of the 487
chart of the predicted vs. experimental activities. Descriptors with too low regression coefficient (r2 488
< 0.1) were excluded and collinear descriptors were detected by evaluating the variance inflation 489
factor (VIF) whose threshold value was set to 5. A further validation of the model having the 490
highest predictive strength was performed via model validator script, included in Vega. 491
492
4.6.2 MOLECULAR DOCKING 493
Molecular docking calculations were carried out using AutoDock 4.2 software41
. The 3.4 Å 494
resolution P-glycoprotein (P-gp) crystallographic structure (mouse P-glycoprotein 3, gene: MD1A, 495
PDB code: 4Q9H) was downloaded from Protein Data Bank (PDB) Database. Gasteiger partial 496
charges were calculated on ligand atoms. Polar hydrogens were added to P-gp and Gesteiger33
497
partial charges were calculated using AutoDock Tools42
. Simulation boxes were centered on the 498
ligands in the structures of P-gp-ligand complexes (PDB codes: 4Q9I, 4Q9J, 4Q9K, 4Q9L) as 499
reported in the literature27
. The simulation boxes were adjusted to accommodate the ligand in each 500
complex and the sizes were between 26x26x26 Å and 30x26x30 Å. 100 runs for each simulation 501
were performed and the Lamarckian Genetic Algorithm (number of energy evaluation: 2.5 x 10⁶) 502
for the docking simulations was used. The choice was based on the aspect that this protocol 503

provides the most efficient search for general applications, and is typically effective for systems 504
with about 10 rotatable bonds in the ligand. The acidic compounds having pKa < 7.4 and the basic 505
ones having pKa > 7.4 were considered in their dissociated forms. Gasteiger-Marsili33
electric 506
charges were supplied. Amphoteric drugs were assumed in their prevalent forms as calculated by 507
the software MarvinSketch28
. For the analytes supporting one or more stereocenters, the following 508
arrangements were undertaken. When the drugs were administered as racemic mixture (Atenolol, 509
Citalopram, Donepezil, Eserine, Halothane, Hexobarbital, Hydroxyzine, Ibuprofen, Ketorolac, 510
Mianserin, Nicotine, Omeprazole, Oxazepam, Pindolol, Promethazine, Venlafaxine and 511
Verapamil), each stereoisomer was docked into each site of the P-gp and the binding energies 512
presented are the averages of those of the stereoisomers included in the mixtures. On the contrary, 513
when the log BB values referred to a specific stereoisomer (Rifampicine, Zidovudine, 514
Levofloxacin) as that was the one administered in the log BB determinations, only this was docked. 515
When a new stereocenter was created because of protonation, as for instance occurs for tertiary 516
amines supporting different groups, both configurations were tested. The consistency of the results 517
was analyzed by clustering spatially the docked conformations. This step was necessary because of 518
the stochastic nature of the search methods, that are used to predict optimal docked conformations. 519
4.7 PROCESSING 520
The chromatographic retention coefficients of each analytes were calculated by using the following 521
expression: 522
k = 0
0
t
ttr 523
in which tr is the retention time of the compound of interest and t0 the retention time of a non-524
retained compound (acetone). All reported log k values are the average of at least three 525
measurements; for each log k value the 95% confidence interval associated with each value never 526

exceeded 0.04. 527
Three different sets of properties were generated. At first, all the analytes were considered as 528
uncharged (having full charge equal to 0), subsequently analytes having acidic or basic functions 529
were considered fully ionized and zwitterions were considered with both the acidic and basic 530
functions in their charged forms. Eventually, a weighted average of the static properties at pH 7.4 531
according to the pKa of each analyte was performed; for zwitterions, the relative abundance of each 532
microspecies (zero atomic charges, zwitterion, anion and cation) in solution at the physiological pH 533
(7.4) was calculated by the software Marvin Sketch 15.1 for Mac OS X28
. This approach was also 534
extended to the conformational analysis performed in vacuum, yielding three different sets of 535
conformational properties, i.e. i) conformational properties of the forms of the analytes having zero 536
atomic charges, ii) conformational properties of the ionized forms of the analytes, and iii) average 537
of the conformational properties at pH 7.4 according to the pKa of each analyte and the calculated 538
microspecies distribution for zwitterions. For each of the properties taken into account (Molecular 539
lipophilicity potential (MLP)39
, lipole40
, volume, polar surface area, superficial area, gyration 540
radius, ovality, volume diameter, dipolar moment, etc), minimum and maximum value, average, 541
range and standard deviation for each population of conformers were calculated and incorporated in 542
the statistical models. An additional deal of molecular descriptor were calculated by the software E-543
Dragon30
. 544
Conflict of interest disclosure 545
The authors declare no competing financial interest. 546
547
LIST OF ABBREVIATIONS 548
549
CNS Central Nervous System; D/Dr05 distance/detour ring index of order 5; Impropers Number of 550
improper angles (out of plane); HbDon Number of H-bond donor groups; HbAcc Number of H-551

bond acceptor groups; IAM Immobilized artificial membrane; MD Dipole Moment (Debye); MLC 552
Micellar liquid chromatography; MLP Molecular Lipophilicity Potential; nRCOOH number of 553
carboxylic group (aliphatic); PLS Partial Least Squares; Psa Polar Surface Area (Å2); P-gp P-554
glycoprotein; SDS sodium dodecyl sulphate; TPSA (NO) topological polar surface area using N,O 555
polar contributions; TPSA (Tot) topological polar surface area using N,O,S,P polar contributions. 556
557

Supporting Information 558 559
- Figure 1 Page S-2; 560
- Figure 2 Page S-4; 561
- Figure 3 Page S-6; 562
- raw data in the spreadsheet file “data.xlsx”. 563
- AutoDock GPF file for site 1 564
- AutoDock DPF file for site 1 565
- AutoDock GPF file for site 7 566
- AutoDock DPF file for site 7 567
568
To whom correspondence should be addressed: 569
570
Prof. Dr. Frederic Lynen 571
Separation Science Group 572
Department of Organic and Macromolecular Chemistry 573
Ghent University 574
Krijgslaan 281, S4-bis 575
B-9000 Gent, Belgium 576
Tel. +(32)9 264 96 02 577
Fax +(32)9 264 49 98 578
e-mail: [email protected] 579
- 580
581
582

5.0 REFERENCES 583
(1) Waring, M.J.; Arrowsmith, J.; Leach, A.R.; Leeson, P.D.; Mandrell, S.; Owen, R.M.; 584
Pairaudeau, G.; Pennie, W.D.; Pickett, S.D.; Wang, J.; Wallace, O.; Weir, A. An Analysis of 585
the Attrition of Drug Candidates from Four Major Pharmaceutical Companies. Nat. Rev. 586
Drug Discov. 2015, 14 (7), 475–486. 587
(2) Kola, I.; Landis, J. Can the Pharmaceutical Industry Reduce Attrition Rates? Nat. Rev. Drug 588
Discov. 2004, 3 (August), 1–5. 589
(3) Van Bree, J. B.; De Boer, A. G.; Danhof, M.; Breimer, D. D. Drug Transport across the 590
Blood--Brain Barrier. I. Anatomical and Physiological Aspects. Pharm. Weekbl. Sci. Ed. 591
1992, 14 (5), 305–310. 592
(4) Keaney, J.; Campbell, M. The Dynamic Blood-Brain Barrier. FEBS J. 2015, 282 (21), 4067–593
4079. 594
(5) Bickel, U. How to Measure Drug Transport across the Blood-Brain Barrier. NeuroRx 2005, 2 595
(1), 15–26. 596
(6) Lundquist, S.; Renftel, M.; Brillault, J.; Fenart, L.; Cecchelli, R.; Dehouck, M.-P. Prediction 597
of Drug Transport through the Blood-Brain Barrier in Vivo: A Comparison between Two in 598
Vitro Cell Models. Pharm. Res. 2002, 19 (7), 976–981. 599
(7) Ekins, S.; Mestres, J.; Testa, B. In Silico Pharmacology for Drug Discovery: Applications to 600
Targets and Beyond. Br. J. Pharmacol. 2007, 152 (December 2006), 21–37. 601
(8) Grumetto, L.; Russo, G.; Barbato, F. Indexes of Polar Interactions between Ionizable Drugs 602
and Membrane Phospholipids Measured by IAM-HPLC: Their Relationships with Data of 603
Blood-Brain Barrier Passage. Eur. J. Pharm. Sci. 2014, 65, 139–146. 604
(9) De Vrieze, M.; Verzele, D.; Szucs, R.; Sandra, P.; Lynen, F. Evaluation of Sphingomyelin, 605
Cholester, and Phosphatidylcholine-Based Immobilized Artificial Membrane Liquid 606
Chromatography to Predict Drug Penetration across the Blood-Brain Barrier. Anal. Bioanal. 607

Chem. 2014, 406 (25), 6179–6188. 608
(10) Barbato, F.; Di Martino, G.; Grumetto, L.; La Rotonda, M. I. Prediction of Drug-Membrane 609
Interactions by IAM-HPLC: Effects of Different Phospholipid Stationary Phases on the 610
Partition of Bases. Eur. J. Pharm. Sci. 2004, 22 (4), 261–269. 611
(11) Grumetto, L.; Russo, G.; Barbato, F. Relationships between Human Intestinal Absorption 612
and Polar Interactions Drug/phospholipids Estimated by IAM-HPLC. Int. J. Pharm. 2015, 613
489 (1–2), 186–194. 614
(12) Grumetto, L.; Russo, G.; Barbato, F. Immobilized Artificial Membrane HPLC Derived 615
Parameters vs PAMPA-BBB Data in Estimating in Situ Measured Blood–Brain Barrier 616
Permeation of Drugs. Mol. Pharm. 2016, 13(8), 2808-2816. 617
(13) Grumetto, L.; Russo, G.; Barbato, F. Polar Interactions Drug/phospholipids Estimated by 618
IAM-HPLC vs Cultured Cell Line Passage Data: Their Relationships and Comparison of 619
Their Effectiveness in Predicting Drug Human Intestinal Absorption. Int. J. Pharm. 2016, 620
500 (1–2), 275–290. 621
(14) De Vrieze, M.; Janssens, P.; Szucs, R.; Van der Eycken, J.; Lynen, F. In Vitro Prediction of 622
Human Intestinal Absorption and Blood-Brain Barrier Partitioning: Development of a Lipid 623
Analog for Micellar Liquid Chromatography. Anal. Bioanal. Chem. 2015, 407 (24), 7453–624
7466. 625
(15) Verzele, D.; Lynen, F.; Vrieze, M. D.; Wright, A. G.; Hanna-Brown, M.; Sandra, P. 626
Development of the First Sphingomyelin Biomimetic Stationary Phase for Immobilized 627
Artificial Membrane (IAM) Chromatography. Chem. Commun. 2012, 48 (8), 1162–1164. 628
(16) De Vrieze, M.; Lynen, F.; Chen, K.; Szucs, R.; Sandra, P. Predicting Drug Penetration across 629
the Blood-Brain Barrier: Comparison of Micellar Liquid Chromatography and Immobilized 630
Artificial Membrane Liquid Chromatography. Anal. Bioanal. Chem. 2013, 405, 6029–6041. 631
(17) Berthod, A.; Garcia-Alvarez-Coque, C. Micellar Liquid Chromatography; Marcel Dekker 632
Incorporated, New York, 2000. 633

(18) Abraham, M. H.; Chadha, H. S.; Whiting, G. S.; Mitchell, R. C. Hydrogen Bonding. 32. An 634
Analysis of Water-Octanol and Water-Alkane Partitioning and the Deltalog P Parameter of 635
Seiler. J. Pharm. Sci. 1994, 83 (8), 1085–1100. 636
(19) Katritzky, A. R.; Kuanar, M.; Slavov, S.; Dobchev, D. A.; Fara, D. C.; Karelson, M.; Acree, 637
W. E.; Solov’ev, V. P.; Varnek, A. Correlation of Blood-Brain Penetration Using Structural 638
Descriptors. Bioorganic Med. Chem. 2006, 14 (14), 4888–4917. 639
(20) Platts, J. A.; Abraham, M. H.; Zhao, Y. H.; Hersey, A.; Ijaz, L.; Butina, D. Correlation and 640
Prediction of a Large Blood-Brain Distribution Data Set - An LFER Study. Eur. J. Med. 641
Chem. 2001, 36 (9), 719–730. 642
(21) Avdeef, A. Absorption and Drug Development; John Wiley & Sons, Inc.: Hoboken, NJ, 643
USA, 2012; pp 625–663. 644
(22) Mente, S. R.; Lombardo, F. A Recursive-Partitioning Model for Blood-Brain Barrier 645
Permeation. J. Comput. Aided. Mol. Des. 2005, 19 (7), 465–481. 646
(23) Abraham, M. H.; Ibrahim, A.; Zhao, Y.; Jr, W. E. A.; Al, A. E. T. A Data Base for Partition 647
of Volatile Organic Compounds and Drugs From Blood / Plasma / Serum to Brain , and an 648
LFER Analysis of the Data. J. Pharm. Sci. 2006, 95 (10), 2091–2100. 649
(24) Björkman, S. Prediction of the Volume of Distribution of a Drug: Which Tissue-Plasma 650
Partition Coefficients Are Needed? J. Pharm. Pharmacol. 2002, 54 (9), 1237–1245. 651
(25) Avdeef, A. Absorption and Drug Development; John Wiley & Sons, Inc.: Hoboken, NJ, 652
USA, 2012; p 595–602 and references cited therein. 653
(26) Eyal, S.; Hsiao, P.; Unadkat, J. D. Drug Interactions at the Blood-Brain Barrier: Fact or 654
Fantasy? Pharmacol. Ther. 2009, 123 (1), 80–104. 655
(27) Szewczyk, P.; Tao, H.; McGrath, A. P.; Villaluz, M.; Rees, S. D.; Lee, S. C.; Doshi, R.; 656
Urbatsch, I. L.; Zhang, Q.; Chang, G. Snapshots of Ligand Entry, Malleable Binding and 657
Induced Helical Movement in P-Glycoprotein. Acta Crystallogr. Sect. D Biol. Crystallogr. 658
2015, 71, 732–741. 659

(28) ChemAxon. Marvin Sketch. 660
(29) Vistoli, G.; Pedretti, A.; Testa, B. Partition Coefficient and Molecular Flexibility: The 661
Concept of Lipophilicity Space. Chem. Biodivers. 2009, 6 (8), 1152–1169. 662
(30) Tetko, I. V; Gasteiger, J.; Todeschini, R.; Mauri, A.; Livingstone, D.; Ertl, P.; Palyulin, V. 663
A.; Radchenko, E. V; Zefirov, N. S.; Makarenko, A. S.; Tanchuk, V. Y.; Prokopenko, V. V. 664
Virtual Computational Chemistry Laboratory--Design and Description. J. Comput. Aided. 665
Mol. Des. 2005, 19 (6), 453–463. 666
(31) Pedretti, A.; Villa, L.; Vistoli, G. VEGA - An Open Platform to Develop Chemo-Bio-667
Informatics Applications, Using Plug-in Architecture and Script Programming. J. Comput. 668
Aided. Mol. Des. 2004, 18 (3), 167–173. 669
(32) Kim, S.; Thiessen, P. A.; Bolton, E. E.; Chen, J.; Fu, G.; Gindulyte, A.; Han, L.; He, J.; He, 670
S.; Shoemaker, B. A.; Wang, J.; Yu, B.; Zhang, J.; Bryant, S. H. PubChem Substance and 671
Compound Databases. Nucleic Acids Res. 2016, 44 (D1), D1202-1213. 672
(33) Gasteiger, J.; Marsili, M. Iterative Partial Equalization of Orbital Electronegativity-a Rapid 673
Access to Atomic Charges. Tetrahedron 1980, 36 (22), 3219–3228. 674
(34) Brooks, B. R.; Brooks, C. L., 3rd; Mackerell, A. D., Jr.; Nilsson, L.; Petrella, R. J.; Roux, B.; 675
Won, Y.; Archontis, G.; Bartels, C.; Boresch, S.; Caflisch, A.; Caves, L.; Cui, Q.; Dinner, A. 676
R.; Feig, M.; Fischer, S.; Gao, J.; Hodoscek, M.; Im, W.; Kuczera, K.; Lazaridis, T.; Ma, J.; 677
Ovchinnikov, V.; Paci, E.; Pastor, R. W.; Post, C. B.; Pu, J. Z.; Schaefer, M.; Tidor, B.; 678
Venable, R. M.; Woodcock, H. L.; Wu, X.; Yang, W.; York, D. M.; Karplus, M. CHARMM: 679
the biomolecular simulation program. J. Comput. Chem. 2009, 30, 1545-1614. 680
(35) Brooks, B. R.; Bruccoleri, R. E.; Olafson, B. D.; States, D. J.; Swaminathan, S.; Karplus, M. 681
CHARMM: A program for macromolecular energy, minimization, and dynamics 682
calculations. J. Comput. Chem. 1983, 4, 187-217. 683
(36) MacKerell, A. D.; Brooks, B.; Brooks, C. L.; Nilsson, L.; Roux, B.; Won, Y.; Karplus, M. 684
CHARMM: The Energy Function and Its Parameterization with an Overview of the Program. 685

In Encyclopedia of Computational Chemistry, 1st ed.; Schleyer, P. v. R., Ed.; John Wiley & 686
Sons, Inc.: Chichester, UK, 1998; 271-277. 687
688
(37) Harrison, R. W. Stiffness and Energy-Conservation Molecular-Dynamics - An Improved 689
Integrator. J. Comput. Chem. 1993, 14 (9), 1112–1122. 690
(38) Stewart, J. J. P. MOPAC: A Semiempirical Molecular Orbital Program. J. Comput. Aided. 691
Mol. Des. 1990, 4 (1), 1–103. 692
(39) Gaillard, P.; Carrupt, P. A.; Testa, B.; Boudon, A. Molecular Lipophilicity Potential, a Tool 693
in 3D QSAR: Method and Applications. J. Comput. Aided. Mol. Des. 1994, 8 (2), 83–96. 694
(40) Pedretti, A.; Villa, L.; Vistoli, G. Modeling of Binding Modes and Inhibition Mechanism of 695
Some Natural Ligands of Farnesyl Transferase Using Molecular Docking. J. Med. Chem. 696
2002, 45 (7), 1460–1465. 697
(41) Huey, R.; Morris, G. M.; Olson, A. J.; Goodsell, D. S. Software News and Update. A 698
Semiempirical Free Energy Force Field with Charge-Based Desolvation. J. Comput. Chem. 699
2007, 28, 1145–1152. 700
(42) Morris, G. M.; Ruth, H.; Lindstrom, W.; Sanner, M. F.; Belew, R. K.; Goodsell, D. S.; 701
Olson, A. J. Software News and Updates AutoDock4 and AutoDockTools4: Automated 702
Docking with Selective Receptor Flexibility. J. Comput. Chem. 2009, 30 (16), 2785–2791. 703
704
705
706
707

TABLE OF CONTENTS GRAPHIC 708
709
710