Experimental and Numerical Modeling of Dialysis - UGent Biblio
314
Dissertation submitted to obtain the degree of Doctor in de Toegepaste Wetenschappen Academic Year 2004-2005 Ghent University Faculty of Engineering Civil Engineering Department Hydraulics Laboratory Experimental and Numerical Modeling of Dialysis Experimentele en Numerieke Modellering van Dialyse Sunny Eloot Promoter: Prof. dr. ir. Pascal Verdonck Dissertation submitted to obtain the degree of Doctor in de Toegepaste Wetenschappen Academic Year 2004-2005 Ghent University Faculty of Engineering Civil Engineering Department Hydraulics Laboratory Experimental and Numerical Modeling of Dialysis Experimentele en Numerieke Modellering van Dialyse Sunny Eloot Promoter: Prof. dr. ir. Pascal Verdonck
-
Upload
khangminh22 -
Category
Documents
-
view
1 -
download
0
Transcript of Experimental and Numerical Modeling of Dialysis - UGent Biblio

Dissertation submitted to obtain the degree ofDoctor in de Toegepaste Wetenschappen
Academic Year 2004-2005
Ghent UniversityFaculty of Engineering
Civil Engineering DepartmentHydraulics Laboratory
Experimental and Numerical Modeling of Dialysis Experimentele en Numerieke Modellering van Dialyse
Sunny Eloot
Promoter: Prof. dr. ir. Pascal Verdonck

2004 Parts of this book may only be reproduced if accompanied by clear reference to the source.
Suggested citation: Eloot S. Experimental and Numerical Modeling of Dialysis. PhD dissertation. Gent. Ghent University; 2004.
ISBN 9090186980
Cover drawing by ir. J. Snoep (1943)
Archive J. van Noordwijk / Willem Kolff Stichting
Ir. Snoep was the director of the machine factory ‘De IJsel’ in Kampen, producing parts for the rotating drum that Willem Kolff was working on.
Under the suspicion of being a member of the resistance, ir. Snoep was executed by the Germans in 1944.

Promoter:
Prof. Dr. ir. P. Verdonck
Hydraulics Laboratory
Civil Engineering Department (TW15)
Faculty of Engineering
Ghent University
Sint-Pietersnieuwstraat 41
B - 9000 Gent
Members of the exam committee:
Prof. R. Verhoeven (president, Faculty of Engineering, UGent)
Prof. J. Vierendeels * (secretary, Faculty of Engineering, UGent)
Prof. F. De Bisschop (Faculty of Medicine and Health Sciences, UGent)
Dr. D. De Wachter (Faculty of Engineering, UGent)
Prof. A. Dhondt (Faculty of Medicine and Health Sciences, UGent)
Dr. R. Hombrouckx (Hospital Zusters van Barmhartigheid, Ronse)
Dr. B. Perrone * (Hôpital René Dubos, Pontoise)
Prof. R. Vanholder * (Faculty of Medicine and Health Sciences, UGent)
Prof. P. Verdonck * (promoter, Faculty of Engineering, UGent)
Prof. J. Vienken * (Fresenius Medical Care, Oberursel)
* also member of the reading committee


Preface
Performing a PhD research project is like participating in a North Pole expedition. Because of his enormous enthusiasm, the expedition leader, my promoter Pascal Verdonck, easily convinced me to join the research group at the Hydraulics Laboratory.
As happens with all expeditions, the preparation of years is much more important than those final steps towards the goal. From the moment it was decided that I would follow the trail of ‘hemodialyzers’, it was time to meet the other participants with different backgrounds, like medical doctors and their staff. One of the first persons I ran into was Jean-Yves, who introduced me in the world of dialysis, and helped me with an inexhaustible passion and patience with most of the experiments.
Once a starting knowledge was gathered and the trail was roughly traced out, it was time to look for good technical equipment. From this respect I especially have to thank the technicians Stefaan, Marcel, Martin, Chris, Jurgen, Hichem, and Johan, for their work behind the scenes. Thanks to them I could profit by pulling a well-sliding sledge instead of carrying all heavy stuff in a backpack.
But a successful expedition does not only depend on knowledge and excellent technical materials. Already from the start, a good physical condition is indispensable and helps you through the moral rock bottoms and the long cold nights. I was surely not standing alone with my ever-stating motto ‘a sound mind in a sound body’. Therefore, special thanks go to Kris and Koen for joining me when swimming numerous lengths, and to Annie, Henk, Chris and Christian for the countless kilometers jogging at the riverside. I must honestly say that I also took a lot of courage from the memories on previous ‘expeditions’ on the ice of Svalbard and Greenland, and the moral support and deep friendship from the other participants: thank you Margreet, Ole, and Jakob!
On my long way to go, I was lucky to meet other researchers and medical doctors who gave a critical evaluation of the covered trail with suggestions for the future. Some of them even joined my expedition and enlarged in that way the chance for success. For the various and interesting projects I am most indebted to Dr Hombrouckx, Prof Vanholder, Prof De Bisschop, Prof Dhondt, Rita, Stefaan, Yves, and Pieter.

Preface
ii
In spite of a good preparation, obstacles like ice-holes might always block the initial plans. Luckily I could always count on a number of persons that helped me solving the problems I could not handle alone. Thank you Jan, Kris, Dirk, Guy, and Ilse for all the advices with respect to numerical modeling. I am also grateful to Peter, Veerle, and Prof De Bisschop for solving numerous questions related to chemistry, and to Jean-Yves and Rita for keeping me well informed about the clinical practice.
After each stage during the final months, different colleagues helped me in the evaluation of the performed work. Pascal, Patrick, Dirk, Stijn, Guy, and Tom wrestled with kilos of paperwork. But also people from outside the lab, Jan and Prof Vanholder, never argued when I came along with another version of the text. They all contributed, each in his way, to the final version of my dissertation.
I was also strengthened by the encouragements from the other colleagues in the lab who were not actively joining the expedition. Ronny, Manuella, and the youngsters followed the progressions through different channels with great interest.
Although it looked like if the last months were a lonesome struggle far away from home, having a satellite phone for calling the home front gave me a strong feeling. Especially during the last tracks when I started counting every single progression, and when it felt like I sank deeper in the snow for every further step, I was only able to persist thanks to the moral support of my family and friends. I especially want to thank my parents for having me learned to define goals in my life and to strive for them. Finally, I must honestly say that, although I will be the only person getting the credits, this was not at all a solo expedition. My husband Bruno was like the leader of my dog team, leading me through the wide white landscape straight to the goal.
The day that I will finally plant my flag on the North Pole, I will feel great for having reached another challenge in my life. But as ice is always drifting away from the pole, research must go on while striving for another goal: never stop exploring!
Thanks to all,
Sunny,
August 2004

Table of Contents
Chapter I Introduction to modeling of dialysis ................................................ 3
1. Chapter overview ........................................................................................ 4 2. Introduction to dialysis and artificial kidney .............................................. 5
2.1. Function of the healthy kidneys.................................................................... 5 2.2. The uremic syndrome ................................................................................... 6 2.3. Renal replacement therapies ......................................................................... 7
3. Biophysics of a hemodialyzer ................................................................... 11 3.1. Blood characteristics................................................................................... 11 3.2. Dialysis fluid characteristics....................................................................... 14 3.3. Membrane properties .................................................................................. 15 3.4. Basic transport phenomena......................................................................... 16 3.5. Mass transfer in hemodialyzers .................................................................. 17
4. Milestones in the history of dialysis ......................................................... 21 5. Research techniques.................................................................................. 26
5.1. In vitro testing............................................................................................. 26 5.2. In vivo testing ............................................................................................. 28 5.3. Ex vivo testing ............................................................................................ 28 5.4. Medical Imaging techniques....................................................................... 29 5.5. Kinetic modeling......................................................................................... 31 5.6. Numerical modeling ................................................................................... 33
Chapter II Modeling of flow in a hollow fiber dialyzer................................. 37 1. Chapter overview ...................................................................................... 38 2. The importance of flow modeling............................................................. 39 3. Literature overview................................................................................... 40
3.1. Flow distributions in the original dialyzer concept .................................... 40 3.2. New dialyzer designs optimizing flow distributions .................................. 42
4. Combining SPECT and CFD for analyzing flow distributions in a low flux dialyzer....................................................................................................... 46
4.1. Abstract....................................................................................................... 46 4.2. Background................................................................................................. 47 4.3. Materials and methods ................................................................................ 48 4.4. Results......................................................................................................... 55 4.5. Discussion................................................................................................... 59 4.6. Conclusion .................................................................................................. 61 4.7. Acknowledgements..................................................................................... 61
5. Validation of the CFD model used for analyzing flow distributions........ 62 5.1. Background................................................................................................. 62 5.2. Methods ...................................................................................................... 62 5.3. Results......................................................................................................... 63 5.4. Conclusion .................................................................................................. 64

Table of contents
iv
Chapter III Modeling of flow in a single hemodialyzer fiber....................... 65 1. Chapter overview...................................................................................... 66 2. Introduction............................................................................................... 67
2.1. Assessment of the experimental settings.....................................................67 2.2. Differences between blood flow and particle transport ..............................69 2.3. Conclusion...................................................................................................70
3. Particle transport in a microcapillary........................................................ 71 3.1. Abstract .......................................................................................................71 3.2. Background .................................................................................................71 3.3. Experimental method ..................................................................................75 3.4. Experimental results....................................................................................79 3.5. Discussion ...................................................................................................83 3.6. Conclusion...................................................................................................92 3.7. Acknowledgements .....................................................................................92
4. Flow modeling at the blood-dialysate interface of a hemodialyzer fiber . 93 4.1. Importance of microscopic flow modeling .................................................93 4.2. Literature overview .....................................................................................93 4.3. In vivo evaluation of the dialysate properties .............................................96 4.4. In vitro evaluation of the membrane permeability ....................................101 4.5. Influence of dialyzer membrane type on membrane permeability............111 4.6. Influence of the filtration fluid on membrane permeability......................115 4.7. Numerical model for blood, dialysate and ultrafiltration flow..................117 4.8. Validation of the numerical model............................................................126 4.9. Influence of ultrafiltration on blood-side pressure drop............................137
Chapter IV Mass transport in a hemodialyzer............................................ 139 1. Chapter overview.................................................................................... 140 2. Introduction............................................................................................. 141
2.1. Small versus middle molecule removal ....................................................141 2.2. Solute removal in low flux versus high flux dialyzers..............................142 2.3. Conclusion.................................................................................................144
3. Theoretical analysis of mass transport.................................................... 146 3.1. Influence of flow direction on mass transport...........................................146 3.2. Influence of flow rate on mass transport ...................................................151
4. Experimental analysis of mass transport ................................................ 160 4.1. Diffusive clearance of small molecules in different dialyzer flow configurations ............................................................................................160 4.2. Diffusive clearance of middle molecules in different dialyzer flow configurations ............................................................................................172
5. Numerical analysis of mass transport ..................................................... 186 5.1. Influence of dialyzer geometry on mass transport ....................................186 5.2. Influence of flow distribution on mass transport ......................................198

Table of contents
v
Chapter V Intra-dialytic kinetic behavior of uremic solutes..................... 203 1. Chapter overview .................................................................................... 204 2. Introduction............................................................................................. 205
2.1. Uremic toxins............................................................................................ 205 2.2. The importance of kinetic modeling......................................................... 207
3. Intra-dialytic kinetic behavior of small water-soluble uremic toxins, the case of the guanidino compounds........................................................... 209
3.1. Abstract..................................................................................................... 209 3.2. Introduction............................................................................................... 210 3.3. Patients and methods ................................................................................ 211 3.4. Results....................................................................................................... 216 3.5. Discussion................................................................................................. 221 3.6. Conclusion ................................................................................................ 225 3.7. Acknowledgements................................................................................... 225
4. Intra-dialytic kinetic behavior of protein- bound uremic toxins............. 226 4.1. Introduction............................................................................................... 226 4.2. Patients and Methods ................................................................................ 226 4.3. Results....................................................................................................... 228 4.4. Discussion................................................................................................. 231 4.5. Conclusion ................................................................................................ 232
Chapter VI Analysis of dialysis using a single-pass batch system ............. 235 1. Chapter overview .................................................................................... 236 2. Introduction............................................................................................. 237 3. Theoretical analysis of Genius dialysis................................................... 238
3.1. Abstract..................................................................................................... 238 3.2. Background............................................................................................... 238 3.3. Materials and methods .............................................................................. 240 3.4. Results....................................................................................................... 250 3.5. Discussion................................................................................................. 256 3.6. Conclusion ................................................................................................ 258
4. Experimental analysis of Genius dialysis ............................................... 259 4.1. Introduction............................................................................................... 259 4.2. Materials and methods .............................................................................. 259 4.3. Experimental results ................................................................................. 262 4.4. Discussion................................................................................................. 264 4.5. Conclusion ................................................................................................ 266 4.6. Acknowledgements................................................................................... 266
5. Numerical analysis of Genius dialysis .................................................... 267 5.1. Background............................................................................................... 267 5.2. Materials and Methods.............................................................................. 267 5.3. Results....................................................................................................... 270 5.4. Discussion................................................................................................. 272 5.5. Conclusion ................................................................................................ 273

Table of contents
vi
Chapter VII Conclusion and future work ................................................. 275
1. Conclusion .............................................................................................. 276 1.1. Summary of quantifying dialyzer performance ........................................276 1.2. Summary of quantifying patient clearance................................................277 1.3. Summary of analyzing batch dialysis........................................................278 1.4. Final summary...........................................................................................278
2. Future work............................................................................................. 279 2.1. Suggestions for optimizing the dialyzer model.........................................279 2.2. Suggestions for optimizing the patient model...........................................279
REFERENCES................................................................................................. 281

Nomenclature
Symbols a Particle diameter m A Area m² Af Gross frontal area m² c Particle volume fraction - cp Specific heat capacity J/kg/K C Concentration kg/m³ mol/m³ d Width m D Diameter m Deq Equivalent diameter m D Diffusive dialysance m³/s mL/min DS Solute diffusivity m²/s DDC Dimensionless drag coefficient - E Extraction ratio - F Free energy J FP Plasma water fraction - FRBC Red blood cell fraction - hm Hydraulic permeability m/s/Pa GS Solute generation rate kg/s mol/s h Heat transfer coefficient W/m²/K H Hematocrit % - J Solute flux kg/s mol/s Ju Volumetric flux m³/s mL/min k Porous medium permeability m²/s/Pa k = K/t Kinetic parameter 1/s k= f(h) Thermal transport velocity 1/s K Diffusive clearance m³/s mL/min K’ Total clearance m³/s mL/min Kblood Total blood-side clearance m³/s mL/min Kdialysate Total dialysate-side clearance m³/s mL/min KUF Ultrafiltration coefficient m³/s/Pa mL/h/mmHg K0 Mass transfer coefficient m/s K12 Inter-compartmental clearance m³/s mL/min L Length m m& Mass flow rate kg/s M Mass kg n Lerche parameter - P Pressure Pa mmHg

Nomenclature
viii
PF Summation of perimeters of all fibers m PT Perimeter of the tubing m Pe Péclet number - Q Flow rate m³/s mL/min QUF Ultrafiltration rate m³/s mL/min r Radial distance m R Radius m R Universal gas constant = 8.314 J/kg/K R0 Total resisitance s/m Re Reynolds number - Rep Particle Reynolds number - S Sieving coefficient - St Stokes number - t Time s T Absolute temperature K T Torque N·m TMP Transmembrane pressure Pa mmHg Tr Transmittance coefficient - u Axial velocity m/s V Volume m³ V1 Perfused volume L Vmax Maximum velocity m/s Vmean Mean flow velocity m/s Vtot Total distribut ion volume L
Greek symbols ε Porosity - γ Shear rate 1/s γsl, γpl, γps Solid- liquid, particle- liquid, particle-
substrate interfacial energy J/m²
γd Dispersion force J/m² κ Dean number - µ Dynamic viscosity Pa·s µp Dynamic plasma viscosity Pa·s µapp Apparent blood viscosity Pa·s µw Dynamic water viscosity Pa·s ν Kinematic viscosity m²/s ∆π Oncotic pressure Pa ρ Density kg/m³ τ Shear stress Pa ω Angular velocity rad/s

Nomenclature
ix
Abbreviations ADMA Asymmetric dimethylarginine AN Acrylonitrile AV Arterio-venous BW Body weight CA Cellulose acetate CAPD Continuous ambulatory peritoneal dialysis CC Co-current CCPD Continuous cyclic peritoneal dialysis CDA Cellulose diacetate CFD Computational fluid dynamics Ci Curie CMPF 3-carboxy-4-methyl-5-propyl-2-furanpropionic acid CT (imaging) Computer tomography CT (solute) Creatine CTA Cellulose triacetate CTC Counter current CTN Creatinine DAPD Daytime ambulatory peritoneal dialysis DMSA Dimercaptosuccinic acid FDM Finite difference method FEM Finite element method FVM Finite volume method G Guanidine GAA Guanidinoacetic acid GSA Guanidinosuccinic acid HMW High molecular weight HLA Human leukocyte antigen IAA Indole-3-acetic acid IS In series IP In parallel IPD Intermittent peritoneal dialysis LMW Low molecular weight MAA Macro aggregated albumin MCV Mean cell volume MG methylguanidine MMR Middle molecule reduction ratio MMW Middle molecular weight MRI Magnetic resonance imaging MW Molecular weight NIPD Nightly intermittent peritoneal dialysis PAN Polyacrylonitrile PET Positron emission tomography PMMA Polymethylmethacrylate PSu Polysulphone

Nomenclature
x
PVC Polyvinylchloride RBC Red blood cell RO Reverse osmosis RR Reduction ratio SMC Saponified modified cellulose SPECT Single photon emission computed tomography Tc Technetium URR Urea reduction ratio

Overview and Rationale
Nowadays, a broad range of hollow fiber dialyzers is available on the market, differing from each other in membrane type, surface area and/or filtration characteristics. The rationale of this work was therefore not the design of a new device or the examination of a particular commercially available dialyzer. The primary goal of the research summarized in this dissertation was to develop new tools, which allow quantifying dialysis. From this respect, numerical models were developed to investigate dialyzer performance and patient clearance. By combining those implementations, a better comprehension is obtained of the intervening phenomena during dialysis.
The first chapter is intended to introduce the reader in the medical as well as mathematical background of this dissertation. After a general introductive paragraph about renal failure and the potential renal replacement therapies, the biophysics in a hemodialyzer is discussed by focusing on the characteristics of blood, dialysate and the semi-permeable membrane. This allows better understanding of the transport phenomena that determine the efficiency of a dialyzer. Emphasizing the long period of dialyzer developments in the past, a review of the major milestones in the history of hemodialyzer and associated devices is presented. The chapter is completed with an overview of the research techniques applied within the scope of this dissertation. Distinction is hereby made between experimental and mathematical approaches.
Because blood and dialysate flow distributions are important determinants of the efficiency of mass transport, the dialyzer overall flow was investigated experimentally and numerically, and described in chapter II. The experimental results of the SPECT (single photon emission computed tomography) technique were combined with the numerical results obtained with a macro model of the blood and dialysate compartment.
Because detailed flow information and fluid specific characteristics cannot be derived from the macro model, chapter III highlights the flow in a single fiber. First, a technique is described to investigate particle transport in an impermeable microcapillary. A feasibility study was made for using this technique to investigate blood flow in a dialyzer fiber. However, because of some drawbacks of this experimental technique for blood flow modeling, it was decided to switch

Overview and rationale
2
to computational modeling combined with in vitro, in vivo, and ex vivo experiments. The validated micro model renders detailed information about fluid dynamics and blood behavior over the entire dialyzer length, allowing to perform parameter studies related to geometrical and/or flow variations.
In chapter IV the influence of flows and flow distributions on mass transfer efficiency was investigated using a theoretical, experimental, and numerical approach. Distinction was made between the removal of small (MW<500) and middle molecules (MW>500). Two different in vitro setups were built to investigate the impact of flow, flow direction and dialyzer surface area on the overall clearance. With the numerical analysis, the developed micro model of the dialyzer fiber was further extended to study especially the diffusive mass transfer of small and middle molecules. Finally, the SPECT results were used as input data in order to calculate the overall dialyzer efficiency.
Instead of concentrating on the dialyzer clearance, chapter V considers the patient clearance for small water-soluble compounds as well as protein-bound solutes. Therefore, a two-pool kinetic model was developed and parameters like distribution volumes and inter-compartmental clearance were derived from in vivo concentration measurements during dialysis. The model is especially useful to define the intra-dialytic kinetic behavior of solutes that are distributed according a two-pool configuration, and allows comparison with the kinetic behavior of urea. This is of special interest since the latter is used as marker for dialysis adequacy.
Deviating from a standard dialysis setup, chapter VI discusses some major parameters for adequate dialysis with the single-pass Genius batch system. The system consists of a closed circuit and dialysate container in which fresh, as well as spent dialysate are stored. Since the separation of both fluids is based on density differences, the impact of two influencing parameters, i.e. temperature and concentration, was studied theoretically, with experiments, and by computational fluid dynamics.
Finally, chapter VII summarizes the major conclusions as drawn from the previous chapters, and discusses some drawbacks of the presented modeling techniques. Consequently, suggestions are given to further improve the discussed models in order to have an optimal tool available for overall dialysis quantification.

Chapter I Introduction to modeling of dialysis
Chapter I
4
1. Chapter overview
After a general introduction to the dialysis therapy and the artificial kidney, the biophysics in a hemodialyzer is discussed. Hereby, special attention is drawn to the fluid properties of blood and dialysate, the membrane characteristics, and the different transport phenomena determining dialysis efficiency.
Furthermore, a review is given of the milestones performed in the development and enhancement of dialysis therapy. This includes the design of dialyzers, the dialyzer system, and the vascular access.
Finally, the research techniques as used within the scope of this dissertation are described. Experimental as well as mathematical modeling techniques are explained and the necessity of combining both types of techniques is discussed.

Introduction to modeling of dialysis
5
2. Introduction to dialysis and artificial kidney†
2.1. Function of the healthy kidneys
The urinary system consists of two kidneys that filter blood and deliver the produced urine into the two ureters. From the ureters the urine is passed to the urinary bladder, which is drained via the urethra during urination. The kidneys are bean-shaped organs of about 11cm long, 4 to 5cm wide and 2 to 3cm thick, and lie bilaterally in the retroperitoneum in the abdominal cavity. The smallest functional unit of the kidney is the uriniferous tubule, each containing a nephron and a collecting tubule. There are approximately 1 to 1.3 million nephrons in each kidney. One nephron is composed of a vascular part (glomerulus), a drainage part (Bowman's capsule), a proximal tubule, Henle’s loop and a distal tubule (Fig. I-1). Several nephrons are drained by one collecting tubule, which enlarges downstream until it becomes a duct of Bellini and perforates the renal papilla [1].
The major function of the kidneys is removing toxic by-products of the metabolism and other molecules smaller than 69000Da (i.e. smaller than albumin) by filtration of the blood flowing through the glomerulus. They also regulate body fluid composition and volume. Specifically resorption of salts (Na+, K+, Cl-), glucose, creatine, proteins, and water takes place in the tubular parts. Because of these eliminating and conserving functions, the kidneys also contribute to the regulation of the blood pressure, hemodynamics, and the acid-base balance of the body. Additionally, kidneys have an endocrine function: they produce the hormone renin, erythropoietin and prostaglandines (derivatives of essential fatty acids to maintain homeostasis) and help in converting vitamin D to dihydroxycholecalciferol, a substance which controls calcium transport [1].
† The contents of this section was submitted for publication Modeling of transport phenomena in an artificial kidney
S. Eloot and P. Verdonck

Chapter I
6
Fig. I-1: The urineferous tubule, the smallest functional unit of the kidney
2.2. The uremic syndrome
Renal insufficiency can be subdivided into three categories according to the duration that the kidneys loose their ability to purify the blood: acute (hours to days) [2], subacute (months) and chronic (years) renal failure. In contrast with the subacute and chronic form, acute renal failure is often reversible. The uremic syndrome is the result of the retention of compounds, normally cleared by healthy kidneys, and of a disorder in the hormonal and enzymatic homeostasis [3]. As renal failure progresses, glomerular filtration rate as well as the amount of nephrons decreases. The main causes of end stage renal disease are diabetes and hypertension, while the most important symptoms are found in the cardiovascular [4-6], neurological [7,8], hematological [9,10] and immunological [11-13] status.

Introduction to modeling of dialysis
7
2.3. Renal replacement therapies
The diagnosis of chronic renal failure is based on the indication of a decreased renal function or a disorder in urine sedimentation. In daily practice, creatinine clearance (95±20mL/min for women and 120±25mL/min for men) [14] is used as a measure of the glomerular ultrafiltration rate and quantifies the remaining renal function. In contrast with creatinine, the urea blood level is strongly dependent on the protein intake and the catabolic state of the patient, and furthermore, urea clearance is dependent on the urine flow rate. Nevertheless, the increase of serum ureum is a useful additional marker of chronic renal failure.
As renal replacement therapy, two treatment modalities are available: a natural one (kidney transplantation from cadaver or living donors), and an artificial one (dialysis), which has two sub-modalities: peritoneal dialysis and hemodialysis.
2.3.1. Transplantation
The introduction of the chirurgical ‘end-to-end’ anastomosis technique [15], the revelation of the secrets of the HLA (Human Leukocyte Antigen) [16,17] and the availability of immunosuppressiva [18], opened the way to successful transplantations. The implantation of the donor kidney occurs usually in one of the fossae iliacae (cavity at the intestinal bone). The venous anastomosis consists of a ‘side-to-end’ connection of the vena renalis with the vena iliaca communis/externa. The arteria renalis is anastomosed with the arteria iliaca interna (‘end-to-end’) or with the arteria iliaca communis/externa (‘side-to-end’). Last but not least, the donor ureter must be fixed at the supralateral side of the bladder roof after performing an anti-reflux channel at the bladder wall.
Possible rejections of transplanted organs can be subdivided into two groups: hyperacute rejections, which are serological processes based on preformed antibodies, and the rejections caused by cellular reactions between T-lymphocytes and HLA. The latter can be acute or chronic. In spite of those complications, kidney transplantation can be called the solution for chronic renal failure with immense advantages for the patient: no limitation concerning water intake, less restricted diet, no suffering from anemia, normalization of the bone metabolism and return to a dynamic life with a social and professional reintegration. Only a small percentage of patients are on the waiting list, and only a small percentage of patients on the waiting list are actually transplanted (27% for West Europe – Eurotransplant 2003).

Chapter I
8
2.3.2. Peritoneal dialysis
With peritoneal dialysis [19], a hypertonic, mostly, glucose dialysis fluid [20] is injected in the peritoneal cavity by means of a permanent peritoneal catheter [21-
25]. The peritoneal cavity is an intra abdominal space, which is surrounded by a serous membrane called the peritoneum (1-1.5m²). It is a semi-permeable membrane that contains mesothelial cells on an interstitium that consists of connective tissue with capillaries and lymphatic vessels. In between the mesothelial cells, intercellular gaps (range 50 nm) are responsible for the major solute transport between the dialysis fluid and the blood in the capillaries [14]. Peritoneal dialysis can be performed continuously (CAPD = Continuous Ambulatory Peritoneal Dialysis [26], CCPD = Continuous Cyclic Peritoneal Dialysis [27,28]), or intermittently (DAPD = Daytime Ambulatory Peritoneal Dialysis, IPD = Intermittent Peritoneal Dialysis [29], NIPD = Nightly Intermittent Peritoneal Dialysis).
2.3.3. Hemodialysis
Hemodialysis is a blood purifying therapy in which the blood of a patient is circulated through an artificial kidney, also called hemodialyzer. This is realized in an extracorporeal circuit (Fig. I-2) where one or two needles (or catheters) can be used as the patient’s vascular access. A general hemodialysis therapy lasts about 9-15 hours a week, mostly spread over three sessions. It can take place in the hospital, in a low care unit or at home.
Fig. I-2: The extracorporeal circuit in hemodialysis
Two types of hemodialyzers are in use: plate and hollow fiber dialyzers [30]. In a plate dialyzer, membrane sheets are packed together and blood and dialysate flow in subsequent layers. The priming volume is around 30% larger than in a hollow fiber dialyzer. The latter (Fig. I-3) consists of thousands of small
blood pump
dialyzer
fresh dialysate
waste dialysate
blood pump
dialyzer
fresh dialysate
waste dialysate

Introduction to modeling of dialysis
9
capillaries (inner diameter in the range of 200µm and wall thickness of 8-40µm). Blood flows inside the capillaries whereas dialysate flows counter currently around them. Typical blood flow rates are in the range of 200 up to 350mL/min [31], while dialysate flows are preferably twice the blood flow [32]. Besides the advantage of a small blood volume, these dialyzers suffer from problems like clotting in and clogging of the capillaries. With respect to the membrane characteristics, distinction can be made between low, medium, and high flux dialyzers on one hand (ultrafiltration coefficient lower than 15, between 15 and 40, and higher than 40mL/h/mmHg, respectively), and low and high area dialyzers on the other (membrane surface lower and higher than 1.5m², respectively).
Fig. I-3: The hollow fiber dialyzer
Already from the start of hemodialysis, the challenge for nephrologists was to obtain an adequate vascular access. The Quinton-Scribner shunt [33] with the use of an external access is nowadays, if used, only utilized in patients with acute renal failure and important vascular problems. More often, catheters are used for acute short phase of renal failure. The original subcutaneous internal arterio-venous fistula, described by Brescia and Cimino [34], between the arteria radialis and the vena cephalica is still the most successful angioaccess method [35]. In the latter, arterial flow and pressure dilates the vein, facilitating repetitive puncture. In case vessel conditions are inadequate or fail to dilate (10-30% of the patients), bridge grafts between an artery and a suitable vein are used. Several types of graft material are used, including autologous veins [36-39], allografts [40], and synthetic grafts [41,42]. As more elderly people with peripheral vascular disease are recruited on dialysis, the central venous catheter, which was initially introduced for acute dialysis, is gaining popularity in long-term dialysis treatment [43-45].
blood inflow
blood outflow
dialysate inflow
dialysate outflow
fiber bundle

Chapter I
10
As hemodialysis implies a repeated and compulsory contact of blood with foreign materials, biocompatibility problems are unavoidable. Traditionally, biocompatibility is defined as the absence of functional and/or biochemical reaction during or after the contact of the body, a body fluid or an organ with an artificial device or a foreign material [46,47]. Dialysis related biocompatibility problems are mainly due to the intermittent nature, the application of high blood flows, and the use of dialysis fluid and of semi-permeable membranes. They can be summarized as problems related to clotting phenomena [48-50], complement and leukocyte activation [51,52], susceptibility to bacterial [53] and tuberculosis infection [54], leaching [55], surface alterations [56], allergic reactions [57,58], shear [59], and inverse transfer of electrolytes [60] or endotoxins from the dialysate towards the blood [61].

Introduction to modeling of dialysis
11
3. Biophysics of a hemodialyzer†
In hemodialysis therapy, the dialyzer succeeds in purifying the blood and extracting the excess water due to basic transport phenomena, such as diffusion, ultrafiltration, and osmosis. As transport takes place between the blood and dialysate compartment over a semi-permeable membrane, fluid characteristics and membrane properties should also be considered.
3.1. Blood characteristics
3.1.1. Blood constitution and major functions
An average adult has a total blood volume of about 5L, which is approximately 7% of total body weight. Blood is a dark red, viscous, slightly alkaline suspension (pH 7.4) of cells - erythrocytes (red blood cells), leukocytes (white blood cells) and thrombocytes (platelets) - suspended in a fluid (plasma). The amount of cells (45% for male, 43% for female) is better known as the hematocrit [14].
The main functions of blood include transportation of nutrients from the gastrointestinal system to all cells of the body and subsequently delivering waste products of these cells to organs for elimination. Oxygen (O2) is carried from the lungs to all cells of the organism by the hemoglobin in the erythrocytes, whereas carbon dioxide (CO2) is transported back to the lungs for elimination both by the hemoglobin and the plasma. Besides nutrients, numerous other metabolites, cellular products, and electrolytes are transported by the bloodstream. Additionally, blood has also a function of regulating the body temperature and maintaining the acid-base and osmotic balance of the body fluids.
Plasma consists of water (90%), proteins (9%) and inorganic salts, ions, nitrogens, nutrients and gases (1%) [14]. There are several plasma proteins with different origin and function, e.g. albumin (69000Da), α- and β-globulins (0.08-1·E+6Da), γ-globulins, clotting proteins, complement proteins (C1 to C9) and plasma lipoproteins.
† The contents of this section was submitted for publication Modeling of transport phenomena in an artificial kidney
S. Eloot and P. Verdonck

Chapter I
12
Erythrocytes are non-nucleated, biconcave-shaped disks, 7.5µm in diameter and 1-2µm thick. Their large surface-volume proportion benefits the exchange of gases. Erythrocytes are packed with hemoglobin, a large protein (68000Da) composed of four polypeptide chains, which are covalently bound to an iron containing heme. In regions of high oxygen concentration, the hemoglobin part releases CO2 while the iron binds to O2. Leukocytes use the bloodstream as a means for traveling and only fulfill their function after diapedesis (leaving the blood vessels and entering the surrounding connective tissue). Within the bloodstream, leukocytes are round while they are pleomorphic in connective tissue. Their main function is to defend the human body against foreign substances. They can be classified into two main groups: granulocytes (60-70% neutrophiles, 4% eosinophiles and 1% basophiles) and agranulocytes (20-25% lymphocytes and 3-8% monocytes). Thrombocytes are small (2-4µm in diameter), disk-shaped, non-nucleated cell fragments, containing several tubules and granules. They function in limiting hemorrhage of blood vessel endothelium in case of injury [14].
3.1.2. Bloodrheology
Blood is a non Newtonian fluid characterized by a non-linear relationship between shear stress τ (Pa) and shear rate γ = ∂u/∂y (1/s) [62]:
mm
γµyuµτ ⋅=
∂∂
⋅= Eq. I-1
With µ the dynamic viscosity (Pa·s), u the velocity in axial direction (m/s), y the direction perpendicular to the flow direction (m), and m a coefficient (-) equal to unity for Newtonian fluids, and smaller than 1 for shear thinning fluids like blood.
The shear thinning behavior as well as the dependence of the blood viscosity µ on the hematocrit H (-) and the plasma viscosity µp, is described among others by Quemada [63] (Fig. I-4):
( )2p
Hk211
µµ
⋅−= Eq. I-2
Parameter k is function of the intrinsic viscosities k0(H), characterizing the red blood cell aggregation at zero shear stress, k∝(H), describing the orientation and deformation of red blood cells at important shear stress, and the shear rate γ [64]:

Introduction to modeling of dialysis
13
c
c0
γγ1
γγkk
k+
⋅+=
∞ Eq. I-3
With:
⋅+⋅−⋅+−=
⋅−⋅+⋅−=
⋅−⋅+⋅−=
∞
32c
32
320
H3.697H25.600H27.9236.1508ln γ
H0.6479H2.711H2.8031.3435kln
H6.738H13.800H10.4103.874kln Eq. I-4
For a fixed hematocrit, viscosity decreases with increasing shear rate, whereas for a fixed shear rate, viscosity increases with hematocrit.
Fig. I-4: Dynamic viscosity µ as a function of hematocrit H and shear rate, as described by Quemada
Blood flowing through small capillaries exhibits a redistribution of the red blood cells creating a plasma-skimming layer that can be observed near the wall while red blood cells are concentrated in the centre. Fahraeus and Lindqvist [65] described the effect of this non-uniform cell distribution on the flow by defining an apparent blood viscosity µapp (Pa·s) for use in the Haegen-Poiseuille equation, describing laminar flow in a circular tube [62]:
P128
DπLµ
1Q4
app
∆⋅⋅
⋅⋅
= Eq. I-5
With Q the flow rate (m³/s) through a tube with diameter D (m), and ∆P the pressure drop over the tube length L (m).
µ (mPa.s)
H (-)
0.0 0.2 0.4 0.6 0.8
10
100 0.1 s-1
1000 s-1

Chapter I
14
The radial variation of the hematocrit was deduced by Lerche et al. [66] using a parameter n, which describes the degree of plasma skimming: non-uniformity of cell distribution increases with decreasing n (Fig. I-5):
( ) ( ) ( )
( ) ( )
−⋅−⋅
−−
+−
⋅−
−⋅+⋅−
⋅=
−−
2n1nn2
2nr
1nr2
nr
.2
1n1nnHrH
2n1nn
0
Eq. I-6
With H0 the mean hematocrit (-), r the relative radial position in the capillary (-), and n the dimensionless Lerche parameter.
Fig. I-5: The radial variation of the hematocrit over the fiber radius, described by Lerche
3.2. Dialysis fluid characteristics
The hemodialysis fluid should be considered as a temporary extension of the patient's extracellular fluid because of the bi-directional transport process when blood and dialysate are flowing through the dialyzer. Therefore, the composition of dialysis fluid is critical in achieving the desired blood purification and body fluid and electrolyte homeostasis. It contains reverse osmosis water, dextrose and different electrolytes like calcium-, magnesium-, potassium- and sodium chloride and sodium acetate or -bicarbonate. The latter two fulfill the function of dialysate buffer, responsible for the correction of metabolic acidosis in the uremic patient. Hydrogen ions (H+) are, soon after their production, buffered by plasma bicarbonate, and can only be removed by the diffusive flux of alkaline from the dialysate into the blood replacing the blood buffers [67].
H(r) / H0
radius ratio0 10.5
1
25
7
1575
n = 1000
H(r) / H0
radius ratio0 10.5
1
25
7
1575
n = 1000
relative radial position r
H(r) / H0
radius ratio0 10.5
1
25
7
1575
n = 1000
H(r) / H0
radius ratio0 10.5
1
25
7
1575
n = 1000
relative radial position r

Introduction to modeling of dialysis
15
Besides the chemical composition, also the physical and microbiological characteristics are important. As the use of highly permeable membranes in hemodialysis is responsible for backfiltration and/or backdiffusion (filtration and/or diffusion from the dialysate compartment towards the blood compartment), toxic and pyrogenic substances can move from the dialysate towards the blood resulting in febrile reactions [61].
Nowadays, the composition of dialysis fluid is prescribed for each single patient to individualize the dialysis therapy according to the personal needs [68]. The actual dialysis machines guarantee accurate proportioning of treated water and concentrated salts, continuous monitoring of the final composition and a constant maintenance of the required conductivity values [69].
The hemodialysis system is the end point of a hydraulic circuit where tap water is changed into reverse osmosis water through water supply, water pre-treatment, water purification [70], and dialysis fluid preparation. The pre-treatment consists of flowing tap water through filters, softener, carbon filter and microfilters. The subsequent treatment concerns flow through one or two reverse osmosis membranes [71] and a deionizer [72], closing the purification chain with ultrafiltration and submicrofiltration.
3.3. Membrane properties
Hemodialysis membranes vary in chemical compositional structure, transport properties and biocompatibility. Polymers can be categorized in three major groups [73,74]: regenerated and modified cellulose membranes, and synthetic membranes. Regenerated cellulose membranes replaced collodion, the first polymer to be used as an artificial membrane, and showed a better performance and mechanical stability. Cuprophan, for example, is a polysaccharide with the same chemical but other physical characteristics than the original cellulose because of a chemical modification. These membranes are very hydrophilic and form a hydrogel when absorbing water. Solute diffusion occurs through highly water-swollen amorphous regions.
Examples of synthetically modified cellulose are cellulose (di) (tri) acetate and hemophan. In the first, one, two, respectively, three hydroxyl groups are changed by an acetate group making it more hydrophobic than cellulose. With hemophan, 1% of the hydrogen (H+) in the hydroxyl (OH-) groups is changed by an amino ligand. The majority of cellulose and modified cellulose membranes have a thickness of 5-11µm and a surface of 0.8-2.5m².

Chapter I
16
Polysulphone (PSu), polyamide (PA) and polyacrylonitrile polyvinylchloride copolymer (PAN-PVC) are membranes prepared from synthetic engineered thermoplastics and are hydrophobic, asymmetric and anisotropic with solid structures and open void spaces [74]. These membranes are also characterized by a thin skin layer, determining the hydraulic permeability and solute retention properties, and a bulk spongy region, which provides mechanical strength (Fig. I-6). Synthetic materials are usually less activating complement cascade and are less restrictive to the transport of middle and large molecules. The AN69 (acrylonitrile) is different from the other synthetic membranes due to its symmetric structure. The well-chosen proportion of the hydrophilic sulphonate groups and the hydrophobic nitrile groups makes it a membrane with good permeability and biocompatible characteristics.
Fig. I-6: Synthetic polysulphone membrane
Due to varying polymer compositions, membranes with the same polymer names may differ in their hemocompatibility, flux properties and adsorption characteristics [75,76]. The phenomenon that dialysis membranes differently adsorb proteins like beta2-microglobulin, fibrinogen, and coagulation factors, complement proteins or hormones like parathormone and erythropoietin, contributes to the removal characteristics [77].
3.4. Basic transport phenomena
Diffusion refers to the net transport of matter from one region to another due to random thermal motion. First and foremost, the driving force for the net diffusion of an uncharged solute is a concentration difference. Because the thermal energy, responsible for the random molecular motion, is high enough, diffusion is often called downhill or passive transport. Adolf Fick derived the first law of diffusion of uncharged particles [78]:

Introduction to modeling of dialysis
17
∆x∆CADJ S ⋅⋅−= Eq. I-7
With J the net solute flux (mol/s), DS the solute diffusivity (m²/s) being a unique property of the solute-solvent at a specific temperature, A the area of diffusion (m²) and ∆C/∆x the concentration difference (mol/m³) over the membrane thickness (m).
Ultrafiltration is a mode of convective transport with a pressure difference as driving force. Because the fluid conveys solutes, it can be seen as passive transport of solutes. Darcy’s law gives a general equation for ultrafiltration:
PAhJ mu ∆⋅⋅= Eq. I-8
With Ju the volumetric flux (m³/s), hm the hydraulic permeability (m/s/Pa), A the area of ultrafiltration (m²), and ∆P the pressure difference (Pa).
Osmosis can be described as diffusive transport. The difference with diffusion, however, is that the dissolved particles cannot pass the membrane (e.g. albumin). Thus, water passes the membrane in opposite direction to tend to equalize the concentrations. The osmotic pressure ∆π is given by the expression of Van 't Hoff [79]:
∆CTRσ∆π ⋅⋅⋅= Eq. I-9
With σ the reflection coefficient of the membrane (-), R the universal gas constant (8.314J/mol/K), T the absolute temperature (K) and ∆C the concentration difference (mol/L).
In hemodialysis, diffusion is the major transport phenomenon, while the term hemofiltration is used for the therapy in which solutes are mainly cleared by convection [80,81]. In the latter, the excess water and vital solute removal are counterbalanced by adding a dilution fluid at the dialyzer inlet (pre dilution [82]) or outlet (post dilution technique [83]). In hemodiafiltration therapy, toxic agents are removed by a combination of diffusion and convection resulting in a better clearance of high molecular weight (HMW) solutes (MW>12000Da) while maintaining the performance for low molecular weight (LMW) solutes (MW<300Da) [84].
3.5. Mass transfer in hemodialyzers
The practical application of the diffusion law (Eq. I-7), requires the definition of different coefficients that can help in either dialyzer design or clinical practice.

Chapter I
18
From this point of view the overall mass transfer coefficient K0 (m/s) can be defined transforming Eq. I-7 into:
CAKJ 0 ∆⋅⋅−= Eq. I-10
The reciprocal of K0 can be seen as the resistance to diffusive transport, which is the sum of blood side, membrane and dialysate side resistances [85]. Therefore, dialyzer efficiency can be increased best by reducing the largest resistance. The blood and dialysate side resistances are mainly covered by the diffusion distance from the main fluid stream to and from the membrane. The membrane resistance, however, is depending on membrane thickness as well as diffusivity in the membrane, varying with the chemical composition of it.
The diffusive dialysance D (mL/min) is defined as the change in solute content in the blood inflow per unit of concentration driving force [86]:
( ) ( )
DiBi
DiDoDi
DiBi
BoBiBi
CCCCQ
CCCCQ
−−⋅
=−
−⋅=D Eq. I-11
With QBi the inlet blood flow rate (mL/min) and CBi, CBo, CDi, CDo the blood inlet and outlet concentrations, respectively, dialysate inlet and outlet concentrations. As the dialysate inlet concentration is zero in the case of hemodialysis, Eq. I-11 can be simplified to the definition of the diffusive clearance K (mL/min), a definition that is analogical to the physiological kidney clearance [87]:
( ) ( )
Bi
DiDoDi
Bi
BoBiBi
CCCQ
CCCQ
K−⋅
=−⋅
= Eq. I-12
In case ultrafiltration takes place, the diffusive clearance K is increased by net contribution of ultrafiltration QUF (mL/min) to the flux:
( )
Bi
BoUF
Bi
BoUF
Bi
BoBiBi
CCQK
CCQ
CCCQK' ⋅+=⋅+
−⋅= Eq. I-13
Because these relations hold for aqueous solutions, a correction factor should be added, counting for the heterogeneous nature of blood. The influence of the hematocrit H (%), plasma water and solute protein binding is considered by replacing QBi by QE in the conventional formulas [88]:
( )
⋅⋅−⋅−⋅= φk'FF
100HFQQ RBCPPBiE Eq. I-14
Where FP is the plasma water fraction, FRBC the red blood cell water fraction, k’ the equilibrium distribution coefficient and ϕ the red blood cell water fraction that participates in solute transfer during blood flow through the dialyzer.

Introduction to modeling of dialysis
19
In clinical practice, clearance index, K·t/Vurea, equal to 1.2-1.4 is used as gold standard for adequate dialysis [89]. This indicator is larger for better clearance, K, longer dialysis time, t, and/or for a smaller patient distribution volume, Vurea. In general, an increase of K·t/Vurea by 0.1 is associated with a substantially decreased risk of death from cardiac, cerebrovascular and infectious diseases [90]. K·t/Vurea, however, measures only removal of low molecular weight substances, which occurs predominantly by diffusion, and does not consider clearance of larger molecules. Babb et al. [91] introduced as first the term middle molecular weight solutes (300-12000Da) [84], playing an important role in uremic toxicity, especially in processes related to inflammation, malnutrition, and atherogenesis (start of degeneration of the inner vessel wall). Moreover, he defined their clearance as the product of overall mass transfer coefficient K0 and membrane area A, the proportion factor in Eq. I-10. Both described parameters (i.e. K·t/Vurea and K0A) are linked by the Michaels equation [85] stating that diffusive clearance K is a function of blood and dialysate flow rates and of the dialyzer specific parameter K0·A:
D
BB
B
D
B
B0
Q
Qln
1QQ
QAK
⋅−
−⋅
−=⋅
D
D Eq. I-15
Besides the mass transfer to and from the patient, described by dialysance D or clearance K, there is also a transfer of water towards and/or from the dialysate compartment to control the patient’s distribution volume. In analogy with Darcy’s law (Eq. I-8), the ultrafiltration coefficient KUF (mL/min/mmHg) can be defined as [92]:
TMPQ
πPQK UFUF
UF =∆−∆
= Eq. I-16
With QUF the ultrafiltration flow rate (mL/min) and ∆P the hydraulic pressure difference (mmHg) between blood and dialysate compartment. The latter can be defined as the sum of transmembrane pressure TMP and oncotic pressure ∆π exerted by the proteins present at dialyzer blood side. While low flux dialyzers were originally designed as diffusive exchangers [93], high flux dialyzers have the therapeutic advantage of an increased solute removal by ultrafiltration. Their open pore structure results in high rates of small molecule diffusion [94] and middle molecule diffusion and convection [92,94].
Backfiltration may occur whenever the transmembrane pressure becomes negative [95]. The existence and importance of backfiltration during high flux hemodialysis have been extensively demonstrated performing hydrostatic and

Chapter I
20
oncotic pressure measurements [61,96-99]. The main problem related to backfiltration is the bacterial contamination by liquid bicarbonate concentrate and the passage of endotoxins towards the blood compartment [61]. Ronco et al. [100], however, demonstrated the positive influence of high forward filtration in the proximal and backfiltration in the distal segment of the dialyzer for the removal of large molecules.
After the membrane is exposed to proteins, diffusive transport as well as hydraulic permeability decreases significantly due to protein adsorption [56]. Moreover, these plasma proteins exert an oncotic pressure ∆π of 20-30mmHg opposing the applied hydrostatic pressure [30,101]. Furthermore, the ultrafiltration flow deviates from linearity for high TMP values due to concentration polarization of high molecular weight substances in the blood which are not freely filtrated through the membrane pores [101,102].

Introduction to modeling of dialysis
21
4. Milestones in the history of dialysis
Thomas Graham (1805-1869) can be called the father of modern dialysis [103]. With his hoop dialyzer (a semi-permeable membrane coated with albumin and stretched over a wooden hoop), he demonstrated that solutes are removed by diffusion from fluids containing colloids and crystalloids (1861). Although he predicted that his findings might be applied in medicine, he never proceeded into this field.
In 1913, John Abel (1857-1938) et al. developed a vividiffusion apparatus, which they coined the name artificial kidney. Their original dialyzer, consisting of 8 parallel collodion tubes of 8 mm diameter and 40 cm long, was soon after extended to 32 parallel tubes. The making of those fragile collodion tubes and the non-availability of heparin as an anticoagulant were the hardest difficulties they had to deal with. Nevertheless, they succeeded in preparing a non-toxic hirudin as anticoagulant and in extending the dialyzing capacity with 192 parallel tubes for use in human patients. It would however last even more than 30 years before the use of an artificial kidney saved the first patient with acute renal failure.
Meanwhile, the problems of anticoagulation and a suitable membrane were well investigated by different researchers all over the world. Von Hess and McGuigan (1914) prevented clotting and the formation of stagnant layers by creating a pulsatile blood flow and a turbulent dialysate flow, respectively. Love (Chicago, 1920) started preparing dialysis membranes from chicken intestines while Heinrich Necheles (Hamburg, 1923) used semi-permeable tubes made from goldbeater’s skin (membrane isolated from calf appendix) [104]. In order to keep the blood volume small, these tubes were compressed between metal wire grids.
Georg Haas (1886-1971) performed the first human dialysis in 1924. He constructed a collodion tube (1.2m long) dialyzer with a surface area of 1.5-2.1m². He reported on improvements in a male patient recovering from uremic coma to full consciousness, however deteriorating later again. Moreover, during dialysis extended to 60 minutes, the anticoagulant caused bleeding from the surgical cannulation wounds. During later in vivo experiments in 1928, using heparin as anticoagulant and Ringer solution as dialysis fluid, Haas reported the phenomenon of ultrafiltration from positive pressure.
During the following years (1928-1937), two important advances were made: purified heparin became available for human application and a new type of membrane named cellophane became commercially.

Chapter I
22
A real break-through happened in 1943 when Willem Kolff constructed the rotating drum dialyzer (Fig. I-7), originally made from a wooden core. A 30 to 40m cellophane tube (diameter 2.5cm) was wound around the cylinder and was perfused with the patient's blood by means of a water pump copied from a Ford automobile. The lower half of the drum was immersed in a stationary tank containing 70-100L dialysis fluid. After some life saving intermittent dialysis sessions using one needle for draining and reinfusing the blood, Kolff changed to continuous dialysis using two needles. After making punctures in the main arteries and veins he had to use surgical cut-downs into the vessels, which frequently caused bleeding during heparinization. The problem with achieving repeated access to the bloodstream was the major reason why chronic uremic patients didn't survive for a long time. Focusing on acute renal failure patients, Kolff celebrated his first survivor, a 67 years old female, in 1945.
Fig. I-7: Kolff’s original rotating drum (1943)
Stimulated by the work of Kolff and his first successes, Nils Alwall (Sweden, 1946) constructed the first dialyzer with controllable ultrafiltration by applying negative pressures to the dialysate reservoir. His dialyzer consisted of cellophane tubing wrapped around a stationary vertical metal drum, which was surrounded by a second screen and placed in a glass reservoir filled with dialysate.
Unaware of the work of Kolff and Alwall, Murray et al. (Canada, 1946) constructed a static coil, which they used in human patients, using a pulsatile blood pump. To attach the patient to their apparatus, they passed a catheter through a saphenous vein into the vena cava and another catheter into the opposite femoral vein, a method that is still frequently used in patients with acute renal failure.
Von Garrelts (Sweden, 1947) developed a dialyzer, which was more or less the precursor of the coil type in which cellophane tubing is wrapped together with a

Introduction to modeling of dialysis
23
spacer. The spacer was meant to support the membrane but also to allow the dialyzer to get perfused by the dialysate.
Meanwhile, MacNeill (USA, 1947) built a parallel flow dialyzer made from 28 short flattened cellophane tubes, which were separated by a nylon mesh. This prototype was portable but not disposable and had to be sterilized for each dialysis session. Skeggs and Leonards (USA, 1948) changed the design of this prototype by using two sheets of cellophane and two grooved rubber pads. The blood is flowing between the sheets while dialysate flows in the grooves outside the cellophane sheets. It is also important to mention that they were the first to use counter current flow.
At the first meeting of the American Society for Artificial Internal Organs (ASAIO) in 1955, Kolff presented his twin coil dialyzer (Fig. I-8).
Fig. I-8: Twin coil dialyzer, developed by Kollf (1955)
Two parallel cellophane tubes (10m long) and fibreglass with spacers were wrapped together around a metal core. This type of coil dialyzer was compact and could be sterilized in advance by steam or ethylene oxide. Moreover, it was disposable and could be mass-produced. However, several disadvantages could be remarked: a blood pump was still required, the high pressures in the extracorporeal circuit could damage the membrane, a high priming volume was needed and, in addition, there was a high incidence of bacterial contamination caused by the open tank system. Nevertheless, the survival rate of patients with acute renal failure who were dialyzed with this twin coil was rather high. The hardest bottleneck to overcome was still the problem of vascular access.
The studies of Alwall (Sweden, 1949) formed a new approach to the latter problem. During animal experiments, he created an arterio-venous shunt between the carotid artery and the jugular vein by means of a siliconized heparinized glass tube. But the major break-through was the invention of an exterior Teflon bypass by Quinton, Dillard and Scribner (USA, 1960) (Fig. I-9). Two Teflon cannules, being bent over 180° beneath the skin, were inserted in the radial artery respectively the cephalic vein near the wrist of the patient. This device was a

Chapter I
24
landmark in the history of dialysis because it opened the door for the treatment of chronic renal failure patients.
Fig. I-9: Prototype of the arterio-venous shunt, developed by Quinton et al. in 1960
The Kiil dialyzer, developed by Frederik Kiil (Norway, 1960) formed an answer to the different problems of that time. The two-layer cuprophan dialyzer consisted of a small volume of the blood compartment, which made priming with donor blood unnecessary. In addition, the combination of the low flow resistance in the blood compartment and the use of an arterio-venous cannule system made the use of a blood pump superfluous.
To avoid problems with dialysate contamination, the single pass technique was introduced (1963). This technique was actually the first step in the development of a central dialysate supply system. A second step was the substitution of acetate for bicarbonate in the dialysis fluid. Sodium acetate, in contrast to the precipitating bicarbonate, could be readily mixed with other salts and dextrose in the appropriate concentration. Babb developed a multi-patient dialysate proportioning system in 1964.
As a consequence of all these available facilities, an enormous increase of regular dialysis treatments occurred. As an answer on the problems of the financing and the training of doctors and nurses, Shaldon (UK, 1963) introduced the self-dialysis, which was soon after extended to home dialysis.
Although the predecessor of the current hollow fiber dialyzer was described by Stewart already in 1968, the Achilles heel of chronic patients remained the arterio-venous (A-V) shunt. Therefore, Brescia, Cimino, et al. (USA) created a surgically A-V fistula. Because some patients had recurrent problems, May introduced in 1969 the saphenous vein autograph as a loop or straight bridge between an artery and a vein.
In the 70's further developments were performed on other domains: increasing the dialysis efficiency, shortening the dialysis time, increasing the quality of life and the comfort of the chronic patient, amelioration of the biocompatibility and miniaturization of the equipment.

Introduction to modeling of dialysis
25
The middle molecule hypothesis, reported by Babb in 1971, suggested that inadequate removal of the middle molecules causes complications such as peripheral neuropathy and pericarditis. To provide high diffusive and convective transport of middle and large molecules, high flux devices for use in hemodialysis were developed.
The introduction in 1972 of synthetic membranes (e.g. polyacrylonitrile PAN, polymethylmethacrylate PMMA, polysulphone PSu), which are far more biocompatible than cellulose membranes, prevented activation of the complement cascade.
To control the ultrafiltration flow, a direct control or a control based on a differential flow measurement was used until Schultheis (Germany, 1975) described the volumetric control method relying on balancing chambers that equalize the flow of fresh and spent dialysate [105].
As an alternative for the classical Brescia-Cimino bridged arterio-venous fistula, Baker and Kaplan introduced in 1976 the expanded polytetrafluoroethylene (ePTFE, Gore-tex) self-sealing conduit.
In the 80's, the suspicion arose that acetate, used to prepare the dialysis fluid, could accumulate in the blood and tissues, leading to acetate toxicity with vascular instability and hypotension. For this reason the use of bicarbonate containing dialysate was reborn in 1982.
The modern machines for hemodialysis permit a complete manipulation of the dialysate composition, temperature, flows, and pressures to improve problems of metabolic acidosis and electrolyte imbalances [67]. Although most hollow fiber dialyzers today resemble to those devices over 30 years ago, a number of variations in design have been established in order to optimize dialyzer performance. These performance-enhancing designs will be discussed more in detail in Chapter II.

Chapter I
26
5. Research techniques
For the investigation of transport phenomena and fluid properties, experimental as well as mathematical techniques were applied for the projects reported in this dissertation. While physical properties of fluid and flow were effectively measured with experiments, they were described by equations in a mathematical model.
One can distinguish between in vitro, in vivo, and ex vivo experiments. While in vivo experiments are initially achieved at the patient’s bedside, in vitro and ex vivo experiments can be performed in the laboratory. In vitro and ex vivo experiments allow using the exact same equipment as it is used in the clinical setting (e.g., dialyzer, pressure monitors), and they even permit the use of uncommon measuring approaches, such as medical imaging of dialyzer flows.
The experimental results were further used either as input or as a validation tool for the mathematical model. With the validated model, detailed three-dimensional predictions of transport phenomena and fluid properties were provided. Furthermore, a validated mathematical model offered the opportunity to investigate different design and flow parameters in a non-destructive way with minimal cost.
5.1. In vitro testing
In vitro experiments were useful to investigate specific dialyzer, flow and/or fluid characteristics. For this purpose, basic measuring equipment and water-like fluids, such as reverse osmosis water or dialysis fluid, were used. Using water instead of blood, flow rates were adapted according to dynamic similarity, keeping the Reynolds number in the model equal to that in reality [62]:
ν
DVRe mean ⋅= Eq. I-17
With Vmean the mean flow velocity (m/s), D a characteristic geometry parameter (m) (e.g. diameter), and ν the kinematic viscosity (m²/s).
The in vitro setups used to study dialyzer related aspects, consisted of an upstream reservoir from which the fluid was pumped with a roller pump through the dialyzer under study towards a downstream reservoir. The semi-pulsatile flow pattern was often attenuated by the use of air chambers.

Introduction to modeling of dialysis
27
In order to describe flow properties, flow rate and pressure measurements were performed. Using a downstream reservoir, the flow rate was determined gravimetrically as the mass change (registered by a balance) over a time interval (registered by a chronometer). In order to characterize flow at an intermediate position in the in vitro setup, clamp-on probes were applied to determine the flow rate with ultrasound (Transonic Systems Inc, Ithaca, NY). The probes were however calibrated by gravimetrical flow measurements, as the ultrasound propagation and derived flow rates are dependent on the fluid properties and the tubing material and wall thickness.
Local pressure was measured with fluid filled strain gauge transducers (Ohmeda, Gent, Belgium). The filling and purging of the transducers was achieved using capillary fluid lines, connected perpendicular to the tubing wall. To compare local pressures as measured with several pressure transducers, static pressure differences due to height were taken into account. To measure a pressure difference directly, e.g. pressure drop over a dialyzer, a differential pressure transducer was used (Fuji Electrics FCX, Coulton, UK). With either type of transducer the pressure is translated into a voltage signal that has to be conditioned and amplified, thus requiring calibration of the whole system.
Density and viscosity are important fluid characteristics when performing flow measurements. The density of an aqueous fluid was measured with a density-hydrometer-aerometer (Assistant, Germany). The densimeter, a long sealed capillary, was placed in a glass container filled with the fluid under study. Depending on the fluid density, the densimeter floats on the fluid, characterized by a certain submerged height. The denser the fluid is, the smaller the submerged height.
The viscosity of an aqueous fluid was measured with a capillary Ubbelohde viscometer (Schott, Germany). This glass tube with a partial capillary was fixed in a thermostatic bath and was filled with the fluid under study. Viscosity is derived from the time interval that the fluid needs to pass the capillary. To obtain an absolute value, the instrument was calibrated and characterized by an apparatus constant K (m²/s²):
tKν ⋅= Eq. I-18
With ν the kinematic fluid viscosity (m²/s) and t the passage time of the fluid (s).
For laboratory measurements, dialysis fluid was prepared on the spot by proportional mixing of reverse osmosis water with electrolytes and bicarbonate. The conductivity of the final mixture should be constant at 14mS/cm and was controlled using a conductivity probe (LF340-WTW, Weilheim, Germany).

Chapter I
28
Conductivity is a measure of the ability of the fluid to carry an electric current. Conductivity meters function by measuring the amount of ionized substances in the fluid, such that a change in conductivity occurs when there is a change in the total concentration of ionized solutes.
5.2. In vivo testing
Patient data was in particular cases indispensable for the input and/or validation of mathematical models. While pressure and flow rates were set and read from the hemodialysis machine monitor, blood properties were mainly investigated by blood sampling from the arterial and/or venous blood line. The samples were analyzed in the clinical laboratory to determine specific blood properties, i.e., solute concentrations and hematocrit.
Techniques that require aspiration of a blood sample for hematocrit (H) determination change the sample status and introduce three potentially significant errors: dilution errors (caused by blood anticoagulation), mean cell volume errors (caused by red blood cell shrinkage due to anticoagulation), and technique errors (e.g. contamination or hemolysis of the sample, equipment related errors, or inappropriate sampling time). In general, the overall potential error for human blood samples is as high as +/-5H units.
To counter this problem, hematocrit, together with blood volume and oxygen saturation, were monitored on line during in vivo dialysis using a Critline system (Inline Diagnostics, US). The Critline sensors were placed in the blood line and register the in vivo hematocrit Hiv by optical trans-illumination of blood:
plasmaRBC
RBCiv VV
VH
+= Eq. I-19
With VRBC and Vplasma the red blood cell and plasma volume, respectively. The Critline is calibrated to standard hemodialysis patient’s blood with a mean cell volume (MCV) of 91µm³.
5.3. Ex vivo testing
The term ‘ex vivo’ refers to the simulation of the clinical dialysis setup, however, without a patient – as if the fluid is taken out of the body. Using a standard dialysis machine, a blood substitute flow and dialysate flow were generated in the dialyzer. As blood substitute, bovine blood from the slaughterhouse was used in the blood compartment.

Introduction to modeling of dialysis
29
Flow rate and pressure measurements were performed as described in paragraph 5.1. The viscosity of non-Newtonian blood was evaluated with a plate and cone viscometer (Rheolyst AR 1000-N Rheometer, TA Instruments, UK), where viscosity is registered as a function of shear rate by assessing the torque necessary to spin the cone. For blood measurements, an acrylic cone (176°) with a diameter of 6cm was applied. The distance between cone and plate was set to 56µm and the plate was heated to body temperature 37°C. The dynamic blood viscosity for a given shear rate was derived using:
ωFF
γτµ
rate
stress
⋅⋅
==T Eq. I-20
With τ the shear stress (Pa), γ the shear rate (1/s), T the torque (N·m), and ω the angular velocity (rad/s). The instrument constants Fstress and Frate are equal to 18000m-3 and 28.5, respectively. By increasing the shear rate from 10 to 800s-1 during the experiments, the shear thinning behavior of blood (viscosity decreasing with shear rate) can be adequately visualized.
5.4. Medical Imaging techniques
5.4.1. Overview of available imaging techniques
According to the purpose, different medical imaging techniques are clinically applied: computer tomography (CT), magnetic resonance imaging (MRI), positron emission tomography (PET), and single photon emission computed tomography (SPECT). CT and MRI are morphological imaging techniques resulting in anatomical information with a high resolution (~1mm). PET and SPECT, however, provide information about functional processes and are nuclear techniques with a limited resolution (~5-12mm in patients).
With CT, a thin and efficiently collimated X-ray bundle is passing radially through the patient’s body, while a detector measures the different attenuation values of the cross section. Because the obtained intensity profile is actually a projection, the instrument is rotated over 180° in 1° increments. From all projections, the computer calculates a two-dimensional attenuation distribution corresponding to the scanned object.
MRI is based on the fact that hydrogen atoms act as little magnets in an overall magnetic field. By registering, after external excitation, the movement of these magnets in the patient, cross sectional images of the patient’s body are obtained.

Chapter I
30
The image forming variable with PET is the distribution in the structure under study of a radionuclide, a radioactive indicator of physiological processes. The latter is administered in the form of a pharmaceutical prior to the imaging procedure, and decays by the emission of positrons. The reconstruction is analogous to that used in conventional CT.
The medical imaging technique used in this dissertation was SPECT, and will therefore be explained more in detail in the following paragraph.
5.4.2. SPECT imaging
SPECT, or single photon emission computed tomography, aims to visualize the regional concentration of a radionuclide within a specific organ as a function of time. Such a radionuclide (e.g. 99m-Tc) is normally injected in the patient’s body, where it emits a single gamma ray photon. This photon has 141keV energy and a half-life of about 6h, and is easily detected by gamma cameras. In order to obtain reliable images, collimation of the gamma rays is necessary. A collimator contains thousands of parallel channels, and is connected directly on top of a single crystal (NaI) present in every gamma camera (Fig. I-10). Gamma rays passing unabsorbed through the collimator interact with the crystal and create light. Behind the crystal, a grid of photomultiplier tubes collect the light for processing. By analyzing these light signals, SPECT images are produced.
In order to obtain a three-dimensional activity distribution, the two-dimensional projections, as taken at each view angle by camera rotation, must be reconstructed with a filtered backprojection algorithm [106]. Here, the Fourier transform of a projection is related to the Fourier transform of the object along a single radial according to the Fourier slice theorem [107]. Given the Fourier transform of a projection at enough angles, the projections can be assembled into a complete estimate of the two-dimensional transform.
Filtered backprojection is performed in four steps: first, measuring of the projection; second, finding the Fourier transform of the projection; third, performing a filter operation by multiplying the Fourier transform by a weighing function that is linear in frequency; and fourth, completing a backprojection by summation of the Fourier transforms of the filtered projections over the image plane. This procedure is repeated for the projections taken at each view angle.
There are two advantages to the filtered backprojection algorithm over a frequency domain interpolation scheme. Most importantly, the reconstruction procedure can be started as soon as the first projection was measured. Secondly, interpolation in the space domain is more accurate than in the frequency domain.

Introduction to modeling of dialysis
31
Fig. I-10: The detection system in a SPECT camera
5.5. Kinetic modeling
The human body can be considered as a biological system, consisting of different compartments, which are separated by semi-permeable membranes. Around 58% of the human body consists of water, which is divided over the extracellular compartment (plasma water and interstitial water) and the intracellular compartment. Transport between the different compartments can happen passively by free diffusion of non-loaded particles (e.g. water, oxygen, urea) or loaded particles (ions), and by forced diffusion via carriers or channels. The transport can also occur as an active process where the energy is supplied by the ATP (adenosine triphosphate) hydrolysis ATPase, or as a secondary active transport according to an electrochemical gradient.
In order to investigate the efficiency of hemodialysis, a kinetic model, incorporating fluid mechanics and mass transport, can describe the entire patient-dialyzer system. In general, kinetics describes the variation in time (characterized by a time constant) of a physical entity (e.g. mass, energy) according to a driving force.
Geometrically evaluated, a kinetic model may consist of a single pool, two pools or even more compartments. Each compartment is characterized by an internal solute concentration (C) and a volume (V). Different transport processes can change the solute concentration and volume: input (I) and output (O), and solute generation (GS) and/or elimination (E) (Fig. I-11).

Chapter I
32
Fig. I-11: Single pool model characterized by its solute concentration (C), volume (V), and the different transport processes: input (I), output (O), solute generation (GS), and elimination (E).
Depending on how the mass transfer is related to the solute concentration, we can distinguish between a zero, first, or higher order process. In a zero order process, a constant amount of mass (A) is added or extracted. This transport process, independent on the solute concentration, might however be time dependent, and can be described as follows in a single pool model:
( ) A
dtdCV
dtdVC
dtCVd
=⋅+⋅=⋅
Eq. I-21
In a first order process, the mass input and output is proportional with the concentration itself or, in the case of two compartments, with the concentration difference. The proportionality factor is then often called the clearance (K) and inter-compartmental clearance (K12), respectively. A first order process in a single pool can be formulated as:
( ) CK
dtdCV
dtdVC
dtCVd
⋅=⋅+⋅=⋅
Eq. I-22
In the case the volume change can be neglected, solving Eq. I-22 gives:
( )tkexpCtVKexpCC 00 ⋅−⋅=
⋅−⋅= Eq. I-23
With C0 the solute concentration at t=0, and k a kinetic parameter. The reciprocal of the latter is the time constant of this first order process, indicating the time it takes to decrease concentration by 63% [as C/C0 = exp(-1) = 0.37].
With a higher order process, the mass input and output varies non-linearly with the solute concentration.
A two-pool model is a logical extension of the single pool model. There are two well distinguishable parts, such that the physical entities have different values in both compartments. In analogy with a single pool model, a mass balance is written for each compartment separately, resulting in two differential equations. Furthermore, as mass transport takes place in between the two pools, the differential equations are coupled and must be solved simultaneously.
C, VI O
GS E
C, VI O
GS E

Introduction to modeling of dialysis
33
5.6. Numerical modeling
Besides experimental and theoretical approaches, computational fluid dynamics (CFD) can be seen as a virtual way of investigating complex flow situations. With CFD, the flow situation in a specific structure is analyzed by dividing the geometry in numerous non-overlapping small cells for which the basic flow dynamics can be calculated and related to the neighboring cells. The results are calculated in some discrete points of the cells, also called nodes. Cells can be of different shape (e.g. triangular, quadrilateral), and can be part of a structured or non-structured grid. The meshes used in the scope of this work were created using Gambit (Sheffield, UK). The cornerstones of CFD are the fundamental governing equations of fluid dynamics: continuity, momentum and energy equations. These mathematical statements are based on the fundamental physical principles mass conservation, Newton's second law respectively energy conservation, which can be written in a differential or an integral form.
These equations are replaced by algebraic equations using one of the three known discretizing techniques: Finite Difference Method (FDM), Finite Element Method (FEM), or Finite Volume Method (FVM). The FDM replaces the derivatives in the differential equations by differences, and needs therefore a structured grid. The FEM does not look for a solution of the differential equations itself, but looks for a solution of some integral form of the equations, obtained from a weighted residual formulation. With the FVM the integral form, and not the differential form is discretized.
By replacing the equations with numbers, which are advanced in space and/or time, a final numerical description of the complete flow field of interest was obtained.
5.6.1. Governing equations
The governing equations were calculated using the software package Fluent (Sheffield, UK).
5.6.1.1. Fluid dynamic equations The continuity and momentum equations are also known as the steady Navier-Stokes equations and are expressed as:
τpuuρ
0u
∇=∇+∇•⋅
=•∇ Eq. I-24

Chapter I
34
With u the local mass average fluid velocity vector (m/s), ρ the local density (kg/m³), p the local pressure (Pa), and τ the deviatoric stress tensor (Pa). ∇ is the gradient operator in three-dimensional Cartesian coordinates:
∂∂
∂∂
∂∂
=∇z
,y
,x
Eq. I-25
The stress tensor, σ , consists of two parts, i.e. the pressure p and deviatoric stress tensor τ :
τIpσ +⋅−= Eq. I-26
With I being the unity tensor.
To model the stress tensor, it is necessary to add the constitutive equation, expressing the rheological properties of the fluid:
( ) ( )Tuuuµτ ∇+∇⋅∇= Eq. I-27
µ denotes the dynamic viscosity (Pa·s) and the superscript T is the transpose of the tensor. The choice of ( )uµ ∇ defines the model and is constant for a Newtonian fluid.
5.6.1.2. The convection-diffusion equation The equations of continuity for two chemical species (e.g. A and B) in a binary fluid mixture can be established by making a mass balance over an arbitrary differential fluid volume. The insertion of the expression for the mass flux results in the convection-diffusion equation. The stationary convection-diffusion equation for mass transport of species A in a binary fluid mixture with species A and B, can be described as:
( ) rCuCD AAAB =∇•+∇⋅∇− Eq. I-28
With DAB the diffusion coefficient of species A in B (m²/s), CA the solute concentration of species A (mol/m³), u the macroscopic fluid velocity vector of species B, and r a reaction term (source or sink).
In case the diffusion coefficient DAB is constant, Eq. I-28 can be written as:
rCu∆CD- AAAB =∇•+⋅ Eq. I-29

Introduction to modeling of dialysis
35
With ∆ the Laplace operator in three-dimensional Cartesian coordinates:
2
2
2
2
2
2
zyx∆
∂∂
+∂∂
+∂∂
= Eq. I-30
5.6.2. Boundary conditions
The fluid dynamic equations (Eq. I-24) must be solved using appropriate boundary conditions for the limits of the flow field. Because Eq. I-24 is a system of second order differential equations in space, it is necessary to prescribe boundary conditions for each velocity component and pressure at the complete domain boundary.
At the inlet, a Poiseuille or uniform velocity distribution is assumed. The outlet boundary can be modeled as a pressure outlet or an outflow. The latter can specify, in the case of multiple outlets, how much of the total inlet flow will leave the geometry by this particular outlet.
The domain boundaries are modeled either as a wall where no-slip occurs or as symmetry planes when only a part of a symmetric structure is modeled. There are no velocity components perpendicular (n direction) to the symmetry plane (un = 0), and the tangential stress is zero (σt = 0). At fixed walls, no-slip conditions at the wall are applied ( u =0).
The concentration can be prescribed on some part of the domain boundary, while
at symmetry planes a zero perpendicular variation is prescribed: 0n
CA =∂
∂.


Chapter II Modeling of flow in a hollow fiber dialyzer

Chapter II
38
1. Chapter overview
This chapter starts with focusing on the importance of investigating blood and dialysate flow distributions in hemodialyzers (paragraph 2). A literature overview deals with the different techniques that have been used in the past in order to assess the flow distribution in the blood and/or dialysate compartment. At once, the results of the investigated dialyzers will be discussed as well as some new dialyzer designs to improve any flow mismatch (paragraph 3).
In paragraph 4, our study is presented in which we combined a medical imaging technique (i.e. single photon emission computed tomography: SPECT) and computational fluid dynamics (CFD) for the assessment of flow distributions in a low flux polysulphone hollow fiber dialyzer (Fresenius F6HPS). The SPECT results were further applied to validate the CFD model (paragraph 5). By implementing the local results in a computer model of one single fiber, the influence on mass transfer of different flow distributions can be quantified (Chapter IV).

Modeling of flow in a hollow fiber dialyzer
39
2. The importance of flow modeling
Diffusion is the major transport phenomenon in hemodialysis. Low molecular weight solutes are removed primarily by diffusion, while larger molecules are transported by diffusion as well as with the convective ultrafiltration flow. As a consequence, the efficiency of the diffusion process plays an important role in the removal of small uremic solutes from the patient’s blood. Since it has been proven in the early 70’s that the removal of larger molecules also plays an important role in uremic toxicity [91], optimization of convective transport efficiency gained more attention.
The driving force for diffusive transport is the concentration difference over the membrane between the blood and dialysate. The blood and dialysate flow rates, and the membrane surface area and thickness mainly influence this gradient. Although the surface area and membrane thickness are theoretically constant for a particular dialyzer type, disturbances in flow can influence the effective value of those parameters, and are therefore of special interest.
The driving force for convective transport is the pressure difference over the membrane between the blood and dialysate. This difference is primarily influenced by the blood and dialysate flow rates and the geometrical dimensions. The pressure profile in both compartments also determines the location of forward and backfiltration. Because internal filtration enhances overall mass transfer, the knowledge of pressure and, with it, of flow distributions is significant.
Ideally, the flow distributions in both the blood and dialysate compartment should be uniform over the entire dialyzer geometry to ensure optimal solute removal [108]. Blood should flow uniformly inside the lumen of the fibers, while dialysis fluid should flow uniformly around the fibers. When each fiber is completely bathed in the dialysis fluid, the surface area that effectively contributes to the solute removal is then optimal. It is evident that any mismatch in flow distributions, e.g. caused by dialysate channeling and/or fluid stagnation, plays a negative role in solute clearance efficiency.

Chapter II
40
3. Literature overview
In the early 70's, several dialyzer innovations were achieved increasing dialysis adequacy. The introduction of synthetic membranes was a real breakthrough in favor of a better biocompatibility. The development of high flux devices ameliorated the removal of middle and large molecules, decreasing the risk of long-term effects on mortality and morbidity [109,110]. And furthermore, control systems were developed to adjust ultrafiltration rate, especially important when using high flux dialyzers [105].
Until the 90’s, the concept of hollow fiber dialyzers was not changed and dialyzers only differed from each other regarding the membrane type and the geometrical dimensions on fiber as well as dialyzer level. Since it was proven during the last decennium, however, that flow distributions have an important impact on dialyzer efficiency, different performance-enhancing designs were developed.
3.1. Flow distributions in the original dialyzer concept
Nordon et al. [111] investigated the blood flow distribution in an axi-symmetrical two-dimensional CFD model of hollow fiber systems used for affinity cell separation. In the inlet and outlet header, the Navier-Stokes equations (conservation of mass and momentum) were solved for steady incompressible laminar flow. The hollow fibers were modeled as a porous medium with a radial permeability a factor thousand less than the axial permeability. They found a uniform blood flow, and stated that this is mainly influenced by the radial-to-axial hydraulic permeability ratio. In the inlet header, boundary layer separation occurred at the point of channel divergence causing the formation of a separation bubble. This phenomenon can be avoided ensuring a lower inlet Reynolds number (<200), or changing the inlet header geometry, i.e. decreasing the length within the inlet and the fiber bundle interface, and adapting the shape of the header.
Performing in vitro measurements using whole blood, blood flow distributions were shown to be hematocrit dependent. Ronco et al. [112] found that the peripheral regions (near the dialyzer outer shell) are less perfused for higher hematocrits compared to the central region of a dialyzer. With a pre-dialysis hematocrit of 25%, the central and peripheral velocities were 13% higher and 23% lower than the average calculated flow velocity, respectively. For a start

Modeling of flow in a hollow fiber dialyzer
41
hematocrit of 40%, deviations from the average velocity were even more pronounced, i.e. 42% higher and 53% lower in the central and peripheral regions, respectively. Furthermore, in vivo studies illustrated that diffusion of several solutes is hampered for higher hematocrits [113,114]. Urea transfer is not significantly affected by the hematocrit, because it diffuses freely through the red cell membrane and is almost in equilibrium (99%) at the dialyzer outlet [115,116]. Creatinine, however, only hardly diffuses from the red blood cell to plasma during blood transit through the dialyzer (2%) [115,116]. As a consequence, solute clearances that are confined to plasma water are more influenced by changes in hematocrit.
Osuga et al. [117] determined dialysate pressure isobars in a low flux hollow fiber dialyzer (Toray B2-2.0) by combining the results of magnetic resonance imaging (MRI) and a numerical simulation of a contrast solution injected in the dialysate flow. Comparing the results of both measuring techniques, the fiber compartment was regarded as a porous medium with a radial-to-axial hydraulic permeability ratio in the range 0.114-1.14. Because the pressure isobars only vary in the axial direction, dialysate flow was assumed uniform with no local non-uniformities of the fiber bundle density.
Using computed tomography (CT), Takesawa et al. [118], however, found a non-uniform dialysate flow in dialyzers of different membrane types (i.e. cuprophan, regenerated cellulose, cellulose diacetate, and polymethylmethacrylate) and different manufacturers (i.e. Senko, Asahi Medical and Terumo, Baxter, and Toray Medical, respectively). It was found that the wetting of the cellulose fibers causes breaking and twisting of the fiber bundle resulting in a markedly increase of local dialysate velocity. With the polymethylmethacrylate membranes (PMMA), dialysate flow towards the inner regions of the dialyzer was delayed causing part of the surface area ineffective when it comes to solute removal. The presence of spacing yarns, however, avoids fiber twisting and makes the PMMA membranes more efficient compared to cellulose membranes (see paragraph 3.2.1).
Zhang et al. [119] determined the blood and dialysate flow distributions simultaneously using magnetic resonance Fourier velocity imaging. Equal but counter current blood and dialysate flow rates were applied with cellulose acetate (CA), cellulose triacetate (CTA), and polysulphone (PSu) membranes. The flow distribution within the fibers was relatively uniform in all studied dialyzers. Dialysate flow distribution, however, was strongly non-uniform with regions of high flow either outside the fiber bundle (CA and CTA) or dispersed in a patchy way (PSu).

Chapter II
42
In conclusion, the standard hollow fiber dialyzer design, with thousands of fibers randomly packed and encapsulated inside a dialyzer housing, results in a decreased mass transfer efficiency compared to theoretical assumptions based on the entire membrane surface area. In the search for enhancing mass removal to ameliorate the quality of life and comfort of the chronic renal patient, several new designs were developed in the recent years.
3.2. New dialyzer designs optimizing flow distributions
Different strategies were followed in order to obtain homogeneously distributed dialyzer flows. Some attempts were related to the fiber bundle, while others were focused on the design of the dialyzer housing.
3.2.1. Improvements on the fiber bundle
Using a helical CT scan, Ronco et al. evaluated the use of spacing yarns in a polyacrylonitrile (PAN) membrane (Asahi Medical 65SF) [112,120,121]. Spacing yarns are placed within the fiber bundle to separate the fibers, increasing the effective surface area (Fig. II-1 left and middle panel). They also investigated dialysate flow around hollow fibers with a Moiré structured wave design in a cellulose diacetate (CDA) membrane (Nissho-Nipro FB130) [112,121] (Fig. II-1 right panel). Flow distributions were most homogeneous in the dialyzer with the fibers waved to give Moiré structure, while spacing yarns gave a result intermediate to the Moiré structure and a standard PAN hemodialyzer (Asahi Medical 65DX). Both techniques were found effective in preventing fiber twisting and excessive packing of the fibers in some regions, hereby resulting in an idealized dialysate flow pattern without dialysate channeling.
The positive effect of spacing yarns on dialysate flow distribution was also studied by Poh et al., by using MRI [122].
Fig. II-1: Spacing yarns (left and middle panel) and Moiré structured fibers (right panel) in a dialyzer, adapted from Ronco et al. [121] and Uhlenbusch et al. [123]

Modeling of flow in a hollow fiber dialyzer
43
Gastaldon et al. [124] reported that the use of a special fiber cutting technology contributes to an improved blood flow distribution in the PSu Diacap 15 (Braun). This is because accidental obstructions of the fiber lumen are prevented and a smooth interface at the fiber inlets is created decreasing cell activation [125]. Furthermore, the undulation of the fibers reduces dialysate channeling, comparable to what happens with Moiré structured fibers.
As an alternative to spacing yarns and undulated fibers, a special fiber crossing with a certain angle can be applied (e.g. Gambro polyamide Polyflux) [126]. Furthermore, fin-like structures at the outer surface of each fiber have also been developed to ensure fiber separation [123]. The effectiveness of the latter technique could however not be proven [127].
The dimensions of the fiber itself also affect diffusive and/or convective transport. Because thicker membrane increases the diffusion length, hereby reducing the diffusion driving force (Eq. I-7), a higher urea mass transfer area coefficient (K0·A) was found using a CTA membrane (15µm) compared to a PSu membrane (40µm) [128]. Keeping the total surface area constant, a reduction of the fiber diameter does not affect diffusive transport, while the convective removal of middle [129] and large molecules [130] is enhanced. Furthermore, increasing the fiber length results in a larger pressure drop over the dialyzer, ameliorating filtration and/or internal filtration [131]. As a consequence, larger molecules are transported more efficiently by convection, while the diffusive transport is not altered for equal surface areas.
Finally, it should be remarked that the optimum dialyzer dimensions and related fiber packing density should be determined for each dialyzer individually [132]. The use of different fiber bundles in the same dialyzer housing may lead to low packing densities, resulting in flow channeling, or dense packed fibers, resulting in fluid stagnation, thereby also inducing flow channeling.
3.2.2. Improvements on the dialyzer housing
In order to avoid the non-uniform blood flow distribution as found with higher hematocrits [112], new blood header designs were developed. In the arterial header, blood stagnation should be avoided as well as irregularities. The conic-shape distributor with a very thin space between the inlet and the fiber bundle interface [113] was many years considered as the most efficient flow distributor. This was previously confirmed by the calculations of Nordon et al. [111].
Recently, the manufacturers Fresenius Medical Care and Hospal introduced a new header, in which the blood is entering through a laterally positioned inlet

Chapter II
44
nozzle. For the FX-class of dialyzers (Fresenius), the radial inflow together with the internal helicoidal distributor enhances the radial blood velocity and the homogeneous access to all fibers. With the Arylane and CDA dialyzers (Hospal), blood inlet is tangential rather than radial [123].
Fig. II-2: Flow baffles in a hemodialyzer: semi rounded flow baffle (left panel) and internally finned flow baffle (right panel), adapted from Poh et al. [133]
With respect to the dialysate side, flow distribution was originally enhanced using distribution rings within the dialyzer housing. Related to this, Poh et al. [122,133] investigated with MRI the effect of different designs of flow baffles (pieces of plastics) in the dialysate inlet and outlet header (Fig. II-2). The semi rounded flow baffle (Fig. II-2 left panel) prevents a high velocity impact onto the fiber bundle. Although these flow baffles are commonly used in a hemodialyzer, both designs were found ineffective to guarantee a uniform dialysate flow. Wang et al. [134] reported an increased mass transfer in a double-segmented baffled module compared to conventional modules (Fig. II-3).
Fig. II-3: A double segmental baffled module, adapted from Wang et al. [134]
Recently, a pinnacle structure of the ends of the dialyzer housing (Fig. II-4) was considered as another innovative construction to promote a homogeneous dialysate flow distribution (Helixone, Fresenius) [123,135].

Modeling of flow in a hollow fiber dialyzer
45
Fig. II-4: Pinacle structure in the dialyzer housing, adapted from Uhlenbusch et al. [123]

Chapter II
46
4. Combining SPECT and CFD for analyzing flow distributions in a low flux dialyzer†
4.1. Abstract
For a better insight in dialyzer efficiency with respect to local mass transport in a low flux dialyzer (Fresenius F6HPS), blood and dialysate flow distributions were visualized with computational fluid dynamic (CFD) simulations, which were validated with single photon emission computed tomography (SPECT) imaging.
To visualize blood-side flow while avoiding transport through the fiber membrane, a bolus of 99m-Technetium labeled MAA (Macro Aggregated Albumin) was injected in the flow using an electronic valve. Water was used to simulate blood, but flow rate was adjusted according to laws of dynamic similarity to account for the viscosity difference (factor 2.75). For the visualization of dialysate flow, a bolus of 99m-Technetium labeled DMSA (Dimercaptosuccinic Acid) was injected, while pressurized air in the blood compartment avoided transmembrane flow. For each test series, 3D acquisitions were made on a two respectively three-headed SPECT camera. By evaluating the images at different time steps, dynamic 3D intensity plots were obtained, which were further used to derive local flow velocities. Additionally, three-dimensional CFD models were developed for simulating the overall blood and dialysate flow, respectively. In both models, the whole fiber compartment was defined as a porous medium with overall axial and radial permeability derived theoretically and from in vitro tests.
With the imaging as well as with the computational technique, a homogeneous blood flow distribution was found, while vortices and fluid stagnation were observed in the dialyzer inlet manifold. The non-homogeneous dialysate distribution, as found with SPECT imaging, implies the occurrence of non-efficient sites with respect to mass transfer. The discrepancy between the dialysate results of both techniques indicated that the assumption of a constant fiber bundle permeability in the CFD model was too optimistic.
† The contents of this section was submitted for publication
Combining SPECT medical imaging and computational fluid dynamics for analyzing blood and dialysate flow in hemodialyzers
S. Eloot, Y. D’Asseler, P. De Bondt, and P. Verdonck

Modeling of flow in a hollow fiber dialyzer
47
In conclusion, medical imaging techniques like SPECT are helpful to validate CFD models, which can be further applied for dialyzer design and optimization.
4.2. Background
The flow distribution in both the blood and dialysate compartment of a hollow fiber dialyzer determines the efficiency of the mass transfer. A uniform flow distribution benefits local mass transfer, and any mismatch caused by non-uniform flow in either the blood or dialysate compartment results in an inferior uremic solute removal from the blood [108]. It has been demonstrated that a significant increase in mass transfer area coefficient (K0·A) can be obtained by augmenting the dialysate flow rate from 500 up to 800mL/min [128,136]. This benefit in dialyzer efficiency can be ascribed to an increase in effective membrane surface area [137], as fiber bundle perfusion is enhanced, and preferential flow channeling and fluid stagnation are impeded with the use of higher dialysate flows. Due to the high economical cost of using increased dialysate flow rates, alternative solutions were sought by developing new dialyzer designs, either targeting the fiber bundle (the use of spacing yarns [112,121,122]), the fiber itself (fiber undulations [112,124]), the dialyzer manifolds (radial inflow [135], or the use of flow baffles [133]).
These dialyzer designs were evaluated using experimental medical imaging techniques like helical computed tomography (CT) scanning [112,120,121], magnetic resonance imaging (MRI) [117,119,122,133], and X-ray CT scanning [118]. These techniques have been proven to be adequate for a global description of flow and pressure distributions in hemodialyzers, but their accuracy is however limited due to restricted resolution of the medical images.
Recently, computational fluid dynamics (CFD) has become an important tool in the design process of artificial organs [138,139]. Although CFD can provide a detailed three-dimensional evaluation of flow and mass transport in complex geometries, it should be noted that the numerical results are only as valid as the physical models incorporated in the implemented governing equations and boundary conditions. As a consequence, the simulations should be validated using experimental techniques, such as, for instance, flow visualization by medical imaging.
The main objective of this study was to assess the local flow in hemodialyzers by combining experimental and numerical techniques. The flow distributions in a low flux dialyzer were visualized using single photon emission computed tomography (SPECT) imaging, a different imaging technique then those

Chapter II
48
previously described in literature. A CFD model was developed for the simulation of the transport processes in a hemodialyzer, providing detailed quantitative information about local velocities and fiber bundle permeabilities. The combination of the SPECT images and the CFD simulations are used to assess the transport in hemodialyzers.
4.3. Materials and methods
4.3.1. Experimental SPECT measurements
4.3.1.1. In vitro setup A new in vitro setup (Fig. II-5) was built to visualize blood or dialysate flow through a low flux polysulphone F6HPS hemodialyzer (Fresenius Medical Care, Bad Homburg, Germany) with SPECT imaging. Using an upstream overflow reservoir, a steady state flow was accomplished in the compartment under study either the blood or the dialysate compartment. At the dialyzer outlet, flow rates were measured gravimetrically. A controlled injection system using an electronic valve was used for radioactive bolus injection in the dialyzer supply tubing.
Fig. II-5: In vitro setup for SPECT measurements.
As radioactive tracer we utilized Technetium, which is a radionuclide with a half-life of 6.01hours and an energy of 141keV. The F6HPS dialyzer (ultrafiltration coefficient 8.5mL/h/mmHg, fiber inner diameter 200µm, membrane thickness 40µm, 9200 fibers) was horizontally and centrally positioned inside a SPECT camera (IRIX, Marconi-Phillips, Cleveland Ohio). For blood and dialysate flow visualizations, the SPECT camera contained two respectively three single-crystal NaI low energy high-resolution detectors with parallel hole collimators. Images
Injection System Computer
Overflow ReservoirInjection System Controller
Overflow Reservoir
Dialyzer
γ CameraSPECT Camera
z
x
Injection System Computer
Overflow ReservoirInjection System Controller
Overflow Reservoir
Dialyzer
γ CameraSPECT Camera
z
x

Modeling of flow in a hollow fiber dialyzer
49
of the projection of the bolus activity distribution were taken at different time steps.
4.3.1.2. SPECT blood flow visualization Using water instead of blood in the dialyzer blood compartment, flow rates were adjusted to account for the difference in dynamic viscosity and density. To obey dimensional similarity between in vivo blood and in vitro water flow, Reynolds numbers Re (-) were kept equal in both models:
fAεµ
DQρRe⋅⋅⋅⋅
= Eq. II-1
With ρ fluid density (kg/m³), Q flow rate (m³/s), D fiber diameter (m), µ dynamic viscosity (Pa·s), ε porosity (-), and Af gross frontal area (m²). Human anemic blood at 37°C has a density of 1054kg/m³ and a dynamic viscosity of 2.96mPa·s derived from [140]:
( )H0.0235expµµ p ⋅⋅= Eq. II-2
With plasma viscosity µp=1.3mPa·s and hematocrit H=35%. The experimental water flow rates at room temperature (µw = 1.02mPa·s and ρw = 998kg/m³) had to be lowered by a factor 2.75. As a consequence, to simulate a blood flow of 300mL/min, a water flow rate of 109mL/min was used in the in vitro setup. During investigation of the flow pattern in the blood compartment, the dialysate side was filled with fresh tap water at room temperature and hermetically closed.
Radioactive transport through the semi-permeable membrane (cut-off 69000Da) from the blood towards the dialysate compartment would trouble the images and results, and was avoided by injecting 10mL boluses of 200000Da 99m-Technetium labeled MAA (Macro Aggregated Albumin).
Preliminary viscosity measurements of the macro aggregate suspension were performed using an Ubbelohde capillary (Schott, Germany). The viscosity of a water solution with 0.01% MAA mass fraction showed no significant differences compared to 0.005% solution (P=0.69) and compared to fresh water (P=0.71). As a result, the injected boluses containing only 0.007% MAA mass fraction did not differ the water fluid properties. With respect to radioactivity, the 10mL boluses contained 10mCi each.
With the dialyzer fixed under a two-headed SPECT camera and using a dynamic acquisition mode, 128 planar 2D images of intensity distribution were taken of the bolus passage each 0.7s. The result is a 2D matrix per time interval with prescribed dimensions (128 by 128). Each element of the matrix shows the

Chapter II
50
amount of photon counts along a line perpendicular to the camera (spatial superposition). Owing to the axi-symmetrical housing and nozzle construction of the blood compartment, an axi-symmetric blood flow was assumed a priori. Within this respect, the planar images were considered identical for each view angle. After performing a filtered backprojection reconstruction to calculate a 3D image of the activity distribution [106], and after a replication of the images over 360°, a three-dimensional dynamic image was reconstructed of the bolus passage through the dialyzer fibers.
The in vitro experiments with bolus injection in the blood compartment were repeated four times to investigate reproducibility.
4.3.1.3. Extracting blood velocity from the SPECT measurements
The passage of the bolus through the blood compartment took at least 61 timeframes (total time of 43s). The images were evaluated each 6 timeframes corresponding to a time step of 4.2s. The first assessed timeframe corresponded with a bolus front at the dialyzer axis at 14mm from the blood inlet. Furthermore, according to the radial spatial resolution (2.34mm), each axial section was subdivided in 16 slices (Fig. II-6).

Modeling of flow in a hollow fiber dialyzer
51
Fig. II-6: Calculation procedure of dialyzer velocity.
Due to the a priori made assumption of axi-symmetrical blood-side flow, images will be identical in every axial section. For each slice and for each time step, the intensity profile along the total dialyzer length was assessed. By analyzing the axial bolus intensity shift (∆z) in between two considered timeframes (∆t=4.2s), the local velocity was calculated as ∆z/∆t (Fig. II-6). Three different velocities were examined: vpeak, velocity corresponding with the shift of the intensity peak; vslope, velocity derived from the budge of the bolus intensity slope, characterized by an intensity of one third of maximum bolus intensity; and vfront, velocity of the bolus front (Fig. II-6). From the four performed experiments of blood flow visualization, a mean velocity with standard deviation was obtained for each slice, after normalization of the velocities for the average water flow rate, as measured gravimetrically during each bolus injection.
4.3.1.4. SPECT dialysate flow visualization Because the 99m-Tc-MAA tracer, as used for the blood experiments, was adhered to the dialyzer housing, the intensity images obtained with preliminary measurements were unreliable. Therefore instead, 10mL boluses of 99m-Tc-
..1 23 ..
slices
axial z(mm)
radial y
radial x
0
50
100
200
250
Spatial domainaxial z
∆zpeak
∆zfront
Intensity I
Imax1/3Imax
∆zslope
Time domain
t = t1 t = t2
t = t2
t = t1
..1 23 ..
slices
axial z(mm)
radial y
radial x
0
50
100
200
250
..1 23 ..
slices
axial z(mm)
radial y
radial x
0
50
100
200
250
Spatial domainaxial z
∆zpeak
∆zfront
Intensity I
Imax1/3Imax
∆zslope
Time domain
t = t1 t = t2
t = t2
t = t1
axial z
∆zpeak
∆zfront
Intensity I
Imax1/3Imax
∆zslope
Time domain
t = t1 t = t2
t = t2
t = t1

Chapter II
52
DMSA (Dimercaptosuccinic Acid, MW 281Da) tracer were injected in the 500mL/min dialysate flow, while pressurized air at 6bar was forced simultaneously and counter currently through the blood compartment. The latter technique was useful to avoid water filtration and Technetium diffusion through the dialyzer membrane, and yet no air bubbles were forced through the membrane.
3D acquisitions of flow in the dialysate compartment were made by rotating the three-headed SPECT camera over 120° in 12° increments. Thus the three heads together covered a 360° range in 10 measurements, with each one bolus injection. Consequently, 10 bolus injections were used for the 3D reconstruction of one bolus passage. For each angular position, 2D planar intensity pictures of the bolus passage through the dialysate compartment were taken by each camera head as 128 by 128 images every 0.4s. By evaluating the images of the 10 measurements at different time steps during 128 time frames, and by performing a filtered backprojection [106], a dynamic 3D image was constructed of the bolus propagation in the dialysate compartment.
4.3.1.5. Extracting dialysate velocity from the SPECT measurements
The images taken at every second timeframe (every 0.8s) were studied to derive local dialysate flow velocities. In the first considered timeframe, the bolus front was distributed and observed over the entire dialyzer radial section. Analogous to the blood experiments, velocities of the bolus peak (vpeak), slope (vslope), and front (vfront) were calculated for each axial slice of 2.34mm in width.
4.3.2. CFD modeling
4.3.2.1. CFD blood flow simulation The blood flow inside the fiber lumen was modeled with a three-dimensional finite volume model (Fluent 6, Sheffield, UK). Due to symmetry reasons, only a quarter part of the dialyzer needed to be simulated (Fig. II-7). Blood was modeled as a Newtonian fluid with a dynamic inlet viscosity of 2.96mPa·s and density of 1054kg/m³. As blood thickening due to ultrafiltration occurs along the dialyzer length, blood viscosity was assumed to increase linearly up to 4.10mPa·s, which corresponds to an overall ultrafiltration flow of 2L/h [141].
Conservation of mass and momentum, expressed by the Navier-Stokes equations, was defined in the inlet and outlet nozzles and dialyzer manifolds. Instead of including the geometry of the 9200 fibers individually, the fiber compartment was modeled as one porous entity, characterized by a given resistance to the flow

Modeling of flow in a hollow fiber dialyzer
53
(Darcy’s law) (Fig. II-7). This resistance should be adapted such that pressure drop over the porous medium is comparable to flow inside the fiber lumen. Because the fibers are elongated along the dialyzer length and because the ultrafiltration flow rate can be ignored as compared to the applied blood flow rate, the radial blood-side porous medium permeability kB_radial (reciprocal of the resistance to flow) can be neglected. The axial blood-side porous medium permeability kB_axial, however, was derived from the theoretical flow-pressure drop relation in circular tubes (Poiseuille’s law), and was found equal to 8.1·E-8m²/s/Pa.
A parabolic velocity profile at the inlet nozzle (i.e., matching with an overall blood flow of 300mL/min), and a relative zero outlet pressure at the outlet nozzle were set as boundary conditions. The boundaries of the dialyzer housing, were defined as no-slip walls. The internal planar boundaries were specified as symmetry planes characterized by zero radial velocities (Fig. II-7).
Fig. II-7: CFD model for blood flow (upper left panel), dialysate flow (upper right panel), and in vitro setup in order to determine the dialysate-side radial permeability kD_radial (bottom panel).
4.3.2.2. CFD dialysate flow simulation
Poiseuille velocityinlet profile
Zero outlet pressure
POROUS MEDIUM
kD_axial /kD_radial ≈ 22
INLET MANIFOLD
OUTLET MANIFOLD
No-slip wall
Poiseuille velocityinlet profile
Zero outlet pressure
POROUS MEDIUM
kD_axial /kD_radial ≈ 22
INLET MANIFOLD
OUTLET MANIFOLD
No-slip wall
Poiseuille velocityinlet profile
POROUS MEDIUM
kB_axial (kB_radial≈0)
Zero outlet pressure
No-slip wall Symmetry planes
INLET MANIFOLD
OUTLET MANIFOLD
Poiseuille velocityinlet profile
POROUS MEDIUM
kB_axial (kB_radial≈0)
Zero outlet pressure
No-slip wall Symmetry planes
INLET MANIFOLD
OUTLET MANIFOLD
CFD model for blood flow CFD model for dialysate flow
In vitro set up to determine kD_radial
FIBER BUNDLEWater inflow
Water inflow
Water outflow
Water outflow
Pressure measurements
CAPSULES
FIBER BUNDLEWater inflow
Water inflow
Water outflow
Water outflow
Pressure measurements
CAPSULES
Poiseuille velocityinlet profile
Zero outlet pressure
POROUS MEDIUM
kD_axial /kD_radial ≈ 22
INLET MANIFOLD
OUTLET MANIFOLD
No-slip wall
Poiseuille velocityinlet profile
Zero outlet pressure
POROUS MEDIUM
kD_axial /kD_radial ≈ 22
INLET MANIFOLD
OUTLET MANIFOLD
No-slip wall
Poiseuille velocityinlet profile
POROUS MEDIUM
kB_axial (kB_radial≈0)
Zero outlet pressure
No-slip wall Symmetry planes
INLET MANIFOLD
OUTLET MANIFOLD
Poiseuille velocityinlet profile
POROUS MEDIUM
kB_axial (kB_radial≈0)
Zero outlet pressure
No-slip wall Symmetry planes
INLET MANIFOLD
OUTLET MANIFOLD
CFD model for blood flow CFD model for dialysate flow
In vitro set up to determine kD_radial
FIBER BUNDLEWater inflow
Water inflow
Water outflow
Water outflow
Pressure measurements
CAPSULES
FIBER BUNDLEWater inflow
Water inflow
Water outflow
Water outflow
Pressure measurements
CAPSULES

Chapter II
54
Dialysate flow distribution was investigated using a 3D finite volume model of the entire dialyzer due to the asymmetrically placed inlet and outlet nozzles (Fluent 6, Sheffield, UK) (Fig. II-7). The dialysate properties at 37°C were a dynamic viscosity of 0.687mPa·s and density of 1008kg/m³, as derived in a previous performed clinical study [141]. Moreover, it was previously demonstrated that dialysate properties are not influenced by dialysis over the dialyzer length, and can be assumed constant at least for ultrafiltration flow rates limited to 2L/h [141].
In analogy with the blood-side simulations, the Navier-Stokes equations were calculated in the inlet and outlet nozzles and dialyzer manifolds, each consisting of a distribution ring.
Due to the three-dimensional dialysate flow around the hollow fibers, the porous medium of the fiber compartment was characterized by an axial permeability as well as a non-negligible radial permeability. The latter were obtained from in vitro experiments performing flow and pressure measurements in the dialysate compartment [142]:
f
UF
Ad
∆PQk ⋅= Eq. II-3
With k the porous medium permeability (m²/s/Pa), QUF the filtration flow rate (m³/s), ∆P the pressure drop (Pa) over the width d (m), and Af the considered gross frontal area (m²).
The axial dialysate-side permeability of the fiber bundle was investigated by flowing dialysate at room temperature through the dialysate compartment and by registration of the flow rate (range 300-800mL/min) and inlet and outlet pressures (range 14-27mmHg). With this procedure, an axial dialysate-side porous medium permeability kD_axial of 91.0·E-8m²/s/Pa was found.
For the study of the radial permeability, the dialyzer was extended with two sidelong capsules in opposite position (Fig. II-7, bottom panel). The latter were connected to the fiber compartment by 15 rectangular side holes (2.5mm x 8.0mm) in the dialyzer housing. Dialysate was then squeezed radially through the dialyzer using flows in the range 0-650mL/min. The water flow was measured gravimetrically, while inlet and outlet pressures were measured in both capsules with fluid-filled pressure transducers (Ohmeda, Gent, Belgium). During the dialysate-side permeability tests, the blood compartment was filled with dialysate and closed hermetically. The radial dialysate-side permeability showed a linear relation for flow rates limited to 200mL/min, while further increasing of the flow resulted in a non-linear increase of flow resistance. In the lower radial flow

Modeling of flow in a hollow fiber dialyzer
55
range, a permeability kD_radial of 4.16·E-8m²/s/Pa was found. As a consequence, an axial to radial permeability ratio of 22 was found in the dialysate compartment, which assumes a preferential axial dialyzer flow.
The overall dialysate flow of 500mL/min was defined as a parabolic velocity profile at the inlet nozzle. At the outlet nozzle, pressure was set to zero while all other boundaries of the dialyzer housing were defined as no-slip wall.
4.3.3. Statistical analysis
Data are expressed as mean ± standard deviations. Correlations between parameters were investigated by performing linear regression analysis (Pearson). Statistical analyses were carried out using the Student t-Test for unpaired samples on normally distributed populations, with P<0.05 as the limit of significant difference (Sigmastat, Jandel Scientific Corporation).
4.4. Results
4.4.1. SPECT blood flow visualization
Velocities of the bolus intensity peak, slope, and front were derived from evaluation of intensity plots at different time steps (Fig. II-6). For each axial dialyzer slice, mean velocities with standard deviations, averaged over the dialyzer length, are shown in Fig. II-8 for a mean blood flow rate of 297±5mL/min. The overall mean velocity was 12.1±1.6mm/s for the bolus peak, 21.5±2.8mm/s for the bolus slope, and 28.6±1.2mm/s and 24.8±1.8mm/s for the bolus front at the dialyzer axis and near the dialyzer housing, respectively. While the mean velocity of the bolus peak was significantly smaller than the theoretical mean velocity of 17.3mm/s (P<0.001), the velocity of the bolus slope and front were significantly larger (P<0.001).
Fig. II-9 illustrates the radial distribution of axial velocity in a dialyzer radial section for different positions along the dialyzer length (z-values). The latter were derived from the mean axial position of the bolus intensity peak within two consecutive considered time frames. For z equal to 70, 89, and 107mm (Fig. II-6), no significant differences were found between the local bolus peak velocities and the mean bolus peak velocity of 12.1mm/s. Near the dialyzer inlet and halfway the dialyzer, however, local bolus peak velocities were found significant higher than (P<0.001 for z=47mm), and lower than 12.1mm/s (P<0.001 for z=121mm and z=140mm, and P=0.011 for z=154mm), respectively.

Chapter II
56
Fig. II-8: Mean axial blood velocity of the bolus peak, slope, and front at different radial positions, as obtained with SPECT.
Fig. II-9: Mean radial distribution of axial blood velocity of the bolus peak for 7 different axial z positions compared to average, as obtained with SPECT.
4.4.2. SPECT dialysate flow visualization
The mean bolus peak and slope velocities were derived in the axial section tangential to the dialysate inlet and outlet nozzles (yz-plane) and in the axial section perpendicular to the latter (xz-plane) (Fig. II-6).
For the yz-plane, bolus peak and slope velocities are illustrated in Fig. II-10. Velocities were not homogeneously distributed over the radial section, but showed maximum values near the nozzles-side housing, while a minimum value
0
5
10
15
20
25
30
35
1 2 3 4 5 6 7 8 9 10 11 12 13 14 15 16radial position (slice)
velo
city
(mm
/s)
peakslopefront
1 2 3 4 5 6 7 8 9 10 11 12 13 14 15 160
5
10
15
20
25
radial position (slice)
velo
city
of b
olus
pea
k (m
m/s
)
z = 47mmz = 70mmz = 89mmz = 107mmz = 121mmz = 140mmz = 154mm average
1 2 3 4 5 6 7 8 9 10 11 12 13 14 15 160
5
10
15
20
25
radial position (slice)
velo
city
of b
olus
pea
k (m
m/s
)
z = 47mmz = 70mmz = 89mmz = 107mmz = 121mmz = 140mmz = 154mm average

Modeling of flow in a hollow fiber dialyzer
57
was located down the dialyzer axis (at 23-25mm vertical distance from the inlet nozzle, corresponding with slice 6). An overall mean velocity of 17.9±13.1mm/s and 28.7±10.0mm/s was found for the peak and slope velocities, respectively. There was no significant difference between the mean measured peak velocity and the mean theoretical value of 17.0mm/s (P=0.985), while the mean measured slope velocity was significantly larger (P<0.001). Furthermore, peak and slope velocities were strongly correlated (R=0.95; P<0.001). The maximum velocity of the bolus front was equal to 39.2±2.2mm/s and occurred at 7-9mm vertical distance from the inlet nozzle (slice 13) (Fig. II-10).
Fig. II-10: Mean axial dialysate velocity of the bolus peak, slope, and front at different radial positions in the axial yz-plane, as obtained with SPECT.
In the xz-plane, overall mean bolus peak and slope velocities were 16.8±13.0mm/s and 26.0±11.9mm/s, respectively, and strong correlation between both velocities was observed (R=0.94; P<0.001). The mean bolus peak and slope velocity did not (P=0.985), respectively, did differ significantly (P<0.001) from the mean theoretical velocity 17.0mm/s. Again, a non-homogeneous velocity distribution over the radial section was measured (Fig. II-11), with maximum values near one side of the dialyzer housing, and a minimum velocity at a quarter radial distance between the dialyzer axis and the opposed dialyzer housing (slice 6). In addition, no significant differences were found between the mean bolus peak velocities respectively mean bolus slope velocities as measured in the yz-plane compared to those found in the xz-plane.
4.4.3. CFD blood flow simulation
0
10
20
30
40
50
60
1 2 3 4 5 6 7 8 9 10 11 12 13 14 15 16
radial position (slice)
velo
city
(mm
/s)
peakslopefront

Chapter II
58
A homogeneous blood velocity of 17.5±0.2mm/s was found over the complete dialyzer radial section. Due to boundary layer separation at the point of channel divergence, and due to the impact of the inflowing blood on the fiber compartment inlet surface with a velocity in the order of 300-400mm/s, vortices were developed in the inlet manifold. Moreover, near the outer regions of the inlet and outlet manifolds, stagnant fluid layers were observed.
Fig. II-11: Mean axial dialysate velocity of the bolus peak, slope, and front at different radial positions in the axial xz-plane, as obtained with SPECT.
4.4.4. CFD dialysate simulation
Fig. II-12 shows the axial velocities in the yz-plane for a constant overall porous medium permeability, corresponding with perfectly distributed fibers. In the radial sections near the nozzles (z=42mm and z=184mm), minimum velocities were found near the dialyzer axis and were 19-23% lower than the mean velocity in the radial section. Velocities near the housing were 24-29% higher compared to the mean value. In the radial sections located more centrally (z=89mm and z=137mm), however, minimum axis velocities were only 3% lower and distal maximum velocities were 3-4% higher compared to the radial sectional mean velocity. Furthermore, no significant differences were found with the velocity profile as averaged over the dialyzer length and which is illustrated in Fig. II-12 (average). The axial velocities in the xz-plane show a similar distribution as found in the yz-plane, such that no differences were found in the considered radial sections z=42mm (P=0.956), z=89mm (P=0.543), z=137mm (P=0.635), and z=184mm (P=0.889).
0
10
20
30
40
50
60
1 2 3 4 5 6 7 8 9 10 11 12 13 14 15 16
radial position (slice)
velo
city
(mm
/s)
peakslopefront

Modeling of flow in a hollow fiber dialyzer
59
Fig. II-12: Radial distribution of axial dialysate velocity as computed with CFD for 4 different axial z positions compared to average. The CFD results are also compared to mean bolus peak
velocity (bars) as measured with SPECT.
4.5. Discussion
The present study combines experimental and numerical tools in order to quantify blood and dialysate flow distributions in a low flux polysulphone dialyzer. For this purpose, planar dynamic SPECT images were taken from bolus passages in the blood, respectively, the dialysate compartment. Local fluid velocities were then derived from time-varying bolus intensity plots in the axial section under study. Although this medical imaging technique offered us an overall analysis of velocity distributions in a hemodialyzer, detailed information and flow paths in the nozzles and dialyzer manifolds, could however not be obtained with this technique. Therefore, both fluid flows were further investigated in depth using CFD. The fiber bundle was modeled as a porous medium with permeability characteristics depending on the considered flow direction and fluid.
The most striking results of this study are: first, the SPECT as well as CFD results showed a fully homogeneously distributed blood flow; second, medical images of the dialysate flow indicated preferential flow paths, while the CFD results for a constant porous medium permeability showed a symmetrical dialysate velocity distribution.
Blood velocity calculations from the SPECT images taken at different time steps, resulted in bolus peak velocities, which were lower than theoretically predicted. The bolus slope and front velocities were however significantly larger than the mean velocity. Because this phenomenon implies that axial diffusion and, more
1 2 3 4 5 6 7 8 9 10 11 12 13 14 15 16
radial position (slice)
0
5
10
15
20
25
30
35
velo
city
(mm
/s) z = 42mm
z = 89mmz = 137mmz = 184mmaverage
CFD
SPECT
1 2 3 4 5 6 7 8 9 10 11 12 13 14 15 16
radial position (slice)
0
5
10
15
20
25
30
35
velo
city
(mm
/s) z = 42mm
z = 89mmz = 137mmz = 184mmaverage
1 2 3 4 5 6 7 8 9 10 11 12 13 14 15 16
radial position (slice)
0
5
10
15
20
25
30
35
velo
city
(mm
/s) z = 42mm
z = 89mmz = 137mmz = 184mmaverage
CFD
SPECT

Chapter II
60
important, convective transport of the radioactive bolus are non-negligible, care should be taken drawing the conclusions of the SPECT measurements. However, as the bolus diffuses forward as well as backward in the same degree, our results, revealing a homogeneous blood flow distribution, are reliable. Moreover, correspondence was found with earlier published data concerning blood flow visualizations in a different dialyzer [119].
Due to the radial dialysate inflow, it was expected that the bolus would show an asymmetrical profile while flowing through the dialyzer. A declined bolus front, however, does not necessarily imply a radially distributed dialysate flow. Because of the occurrence of preferential flow channeling due to fiber twisting, however, a non-homogeneous dialysate flow was found. While former experiments [118-120] reported a radially distributed dialysate flow in the axial section tangential to the dialysate inlet and outlet nozzles (yz-plane), we found flow non-homogeneities as well in all other axial sections (e.g. demonstrated for the xz-plane in Fig. II-11).
The mismatch between blood and dialysate flow distribution, as found with the SPECT measurements, has a pernicious effect on mass transfer efficiency of small molecules. This is because diffusion is, for a constant surface area and membrane thickness, mainly dependent on the concentration gradient between blood and dialysate, which is, on its turn, strongly affected by the flows and their distribution.
To obtain more accurate quantitative data of both dialyzer flows, two CFD models were developed for each compartment under study. The outer regions of the inlet and outlet nozzles, where blood flow was stagnating, form a potential risk with respect to blood clotting.
While the fiber bundle permeability at blood-side could be derived easily from Poiseuille’s theory, an alternative method was sought to determine the flow resistance in the dialysate compartment. Osuga et al. [117] combined the results of MRI and CFD by evaluating the dialysate pressure isobars until correspondence between both techniques was found for a given radial-to-axial hydraulic permeability ratio of the fiber bundle. In the present study, however, we preferred to derive the characteristics of the porous medium independently by performing in vitro experiments.
The fact that large discrepancies were found between the SPECT and CFD results for dialysate flow indicated that the hypothesis of a constant fiber bundle permeability is not correct. As a consequence, permeabilities, as defined in the

Modeling of flow in a hollow fiber dialyzer
61
CFD model, should be adapted locally until the velocity profiles obtained with both techniques do match.
In conclusion, medical imaging offers a non-destructive method to gain insight in flow distributions and transport characteristics in hemodialyzers. Moreover, those techniques play a key role in the validation of numerical models. The latter are, on their turn, important to examine regions of interest, which are smaller than the spatial resolution of the imaging techniques, and to further optimize dialyzer design.
4.6. Conclusion
Flow distribution in a low flux dialyzer was visualized using single photon emission computed tomography (SPECT) imaging. The experimental results were compared to computational fluid dynamic (CFD) simulations. With both techniques, a fully homogeneously distributed blood flow was found, while a discrepancy was observed for the dialysate flow in the case a constant fiber bundle permeability was modeled numerically. The SPECT results can be applied for validation of the CFD model with respect to the fiber bundle permeabilities, such that the validated CFD model can be further used for new dialyzer design and optimization.
4.7. Acknowledgements
The authors feel indebted to F. De Vos, O. De Winter, B. Cuvelier, and S. Vandenberghe for their contribution in the SPECT experiments, to P. Segers, S. Vandenberghe and G. Mareels for their review, and to M. Anteunis for the drawings.

Chapter II
62
5. Validation of the CFD model used for analyzing flow distributions
5.1. Background
When using computational fluid dynamics, one should keep in mind that the simulation results are only as valid as the equations, boundary conditions, and fluid and membrane properties that are implemented in the model. As a consequence, validation of the CFD model is necessary. Comparison of the CFD results with the results of the SPECT measurements is hereby a useful tool.
In the previous study (paragraph 4), a discrepancy was found for the axial dialysate velocities in the fiber compartment between CFD and SPECT. This implies that some formulated assumptions in the CFD calculations are not yet suitable.
Because it is not feasible, with the available computer capacity, to model each fiber in the bundle separately, we cannot drop the modeling of the fiber bundle as a porous medium using Darcy’s law (Eq. I-8). In the latter equation, however, the permeability factor is a parameter that was derived and implemented by us. Although a radial and axial component for the permeability was derived from in vitro tests, those proportion factors were assumed constant over the entire fiber compartment. Because many previously performed studies reported the incidence of dialysate channeling [118,119,121], the assumption of a uniform permeability was too optimistic. Furthermore, the phenomenon of dialysate channeling implies the variation of the axial permeability rather than the radial one. Finally, because no radial velocities were obtained from the SPECT measurements, a local radial permeability cannot be implemented in the CFD model by direct comparison of both results.
In this section, the local axial permeabilities are derived for implementation in the CFD model. This will result in analogous flow distributions with SPECT and with CFD, such that the CFD model can be further applied when investigating other parameters, as for instance proportional dialyzer dimensions.
5.2. Methods
Using Darcy’s law (Eq. I-8) and the definition of the permeability of a porous medium (Eq. II-3), the mean axial velocity Vmean (m/s) in the fiber bundle can be written as a function of the pressure drop ∆P (Pa) over the fiber length d (m):

Modeling of flow in a hollow fiber dialyzer
63
∆Pd
k∆PhAQV mean
mF
UF ⋅=⋅==mean Eq. II-4
With kmean the mean porous medium permeability (m²/s/Pa), QUF the filtration flow rate (m³/s), and Af the gross frontal area (m²).
As the pressure drop over the fiber bundle is constant, the local permeability k (m²/s/Pa) can be derived from the mean fiber bundle permeability kmean, and the local and mean axial velocities, v and Vmean, respectively:
meanmean
kV
vk ⋅= Eq. II-5
v represents the local velocities measured with SPECT and shown as peak velocities in Fig. II-10 and Fig. II-11 in the yz-plane and xz-plane, respectively.
5.3. Results
Fig. II-13 shows the axial permeabilities in the yz-plane and the xz-plane, as calculated with Eq. II-5 compared to a constant axial permeability.
Fig. II-13: Radial distribution of axial permeabilities in the yz-plane and xz-plane compared to a constant axial permeability.
The assumption of a constant axial permeability of 91·E-8m²/s/Pa resulted in an overestimation of the permeability with 58% (yz-plane) and 75% (xz-plane) near the dialyzer axis (slice 6). Near the dialyzer outer shell, however, permeability was underestimated with 103% (yz-plane) and 130% (xz-plane) (slice 16).
0,0E+00
5,0E-07
1,0E-06
1,5E-06
2,0E-06
2,5E-06
1 2 3 4 5 6 7 8 9 10 11 12 13 14 15 16
radial position (slice)
perm
eabi
lity
k (m
²/s/P
a)
yz-planexz-plane
mean
0,0E+00
5,0E-07
1,0E-06
1,5E-06
2,0E-06
2,5E-06
1 2 3 4 5 6 7 8 9 10 11 12 13 14 15 16
radial position (slice)
perm
eabi
lity
k (m
²/s/P
a)
yz-planexz-plane
mean

Chapter II
64
5.4. Conclusion
Dialysate flow channeling can be observed easily from the local axial velocities as calculated with SPECT measurements. In order to simulate this phenomenon using CFD, local axial permeabilities were derived from the local SPECT velocities. The calculated permeability distribution can now be implemented in the computer model for further parameter investigation.

Chapter III Modeling of flow in a single hemodialyzer fiber

Chapter III
66
1. Chapter overview
In contrast with investigating the macroscopic flow in the entire dialyzer (Chapter II), we focus now on the flow (Chapter III) and mass transport (Chapter IV) in one single fiber of a dialyzer.
First, a measuring technique is described for quantitative evaluation of cell or particle convective transport in capillary tubes (paragraph 3). The proposed technique was applied to investigate the transport of 10µm spherical particles in non-permeable capillary tubes of various diameters, lengths, and internal coatings. Considering a capillary of 220µm in diameter and 0.3m in length, a link can be drawn with red blood cell transport in a hollow fiber. There are however some important limitations to the measuring technique when it comes to the radial blood cell distribution in a dialyzer fiber. Due to the high reproducibility of the measurements, the technique was found effective for particle transport in microcapillaries, which might be of interest in future artificial organ devices design.
Radial blood cell distribution will be studied intensively in the second part of this chapter. Abstraction is made of the fiber packing in the dialyzer to isolate one fiber with its surrounding membrane and dialysate compartment. In order to implement this blood-dialysate interface in a numerical model, characteristics of the three compartments must be known. Therefore, in vivo tests were done to study the influence of dialysis on the dialysate properties (paragraph 4.3). The membrane permeability was investigated in vitro (paragraph 4.4) for different membrane types (paragraph 4.5) and with different filtration fluids (paragraph 4.6). Furthermore, theoretical formulations were obtained from literature to describe blood behavior in small fibers (paragraph 4.7). With those input data, numerical simulations give information about the ultrafiltration profile and the radial and axial variation of blood properties by flowing through the dialyzer.
The third part of this chapter deals with the validation of the numerical model. With an in vivo study blood properties were examined, while an ex vivo study was set out using bovine blood as patient’s blood substitute. Flow and fluid properties were measured and compared to the results of the numerical simulations.
Finally, the numerical model was optimized in order to remove the remaining drawbacks, and the influence of ultrafiltration on the blood-side pressure drop was calculated and compared to the theoretical Poiseuille law.

Modeling of flow in a single hemodialyzer fiber
67
2. Introduction
In continuation of the macroscopic blood and dialysate flow investigation in a hemodialyzer, some important aspects like radial distribution of blood properties, ultrafiltration, and convection-diffusion are investigated microscopically in a single fiber.
The in vitro measurements investigating particle transport in a microcapillary were a first attempt to learn more about capillary (blood) flow. The technique is based on a bolus injection of particles at the capillary entrance, while the particle outflow is registered using an electronic gate detector. Assuming a capillary Poiseuille flow, a preferential radial position of particle transport can be derived from the particle transit time.
To simulate the blood flow through a dialyzer fiber, the in vitro settings were adapted as much as possible. It should be remarked however that, although this adaptation, a considerable difference remains between particles transported in a convective capillary flow and a high concentrated cell suspension (blood) flow in a hollow fiber.
2.1. Assessment of the experimental settings
To generate in vitro flow conditions (particle transport in a capillary) that are dynamically similar to the ones in vivo (blood cell transport in a hollow fiber), the dimensionless Reynolds number (Eq. I-17) for flow and particles should be similar in vivo and in vitro.
Restricted by the available characteristics of particle and microcapillary dimensions, those settings were a priori decided matching as much as possible the dialyzer and blood cell dimensions. The experiments were done i.e. in a 220µm diameter capillary using spherical particles with a diameter of 10µm. Furthermore, a physiological solution (0.9%NaCl) with an electrical conductivity of 66mS/cm was used as carrier liquid to obtain an adequate signal to noise ratio (-70dB) during particle detection at the gate.
An overview of the in vivo and in vitro characteristics is shown in Table III-1 for a low flux Fresenius F6 or high flux F60 dialyzer with 9200 fibers. For different dialyzer blood flows (QB), the in vivo flow Reynolds numbers are calculated from the kinematic blood viscosity (νblood), fiber diameter (Dfiber) and fluid velocity in a single fiber (vfiber). The in vitro fluid velocity (vcap) can then be derived using the calculated in vivo Reynolds value (Rein vivo), the a priori known

Chapter III
68
diameter of the capillary (Dcap), and the kinematic viscosity of the physiological solution (νphys) (Table III-1).
Table III-1: Dynamic similarity between blood flow in a dialyzer fiber and particle flow in a microcapillary.
In vivo: dialyzer fiber In vitro: microcapillary QB
mL/min vfiber
mm/s Dfiber
µm νblood 37°C
mm²/s Rein vivo
- Dcap
µm νphys
mm²/s vcap
mm/s 150 8.6 200 3.42 0.51 220 0.995 2.3 250 14.4 200 3.42 0.85 220 0.995 3.8 350 20.2 200 3.42 1.18 220 0.995 5.3
Besides the flow Reynolds number, dynamic similarity should also be obtained for the particles and cells. The particle Reynolds number (Rep) is defined as [143]:
Dν
aVRe2
maxp ⋅
⋅= Eq. III-1
With a the particle radius (m), ν the kinematic fluid viscosity (m²/s), D the capillary diameter (m), and Vmax the maximum velocity, as it takes place at the capillary axis (r=0), derived from the Poiseuille velocity profile:
−⋅⋅=
2
mean Rr1V2v Eq. III-2
With v the local velocity (m/s) at radial position r (m) from the axis, Vmean the mean velocity (m/s), and R the capillary radius (m).
The comparison between the in vitro and in vivo particle Reynolds numbers is shown in Table III-2 for a low flux F6 or high flux F60 dialyzer. For the in vivo particle diameter, the maximum diameter of a red blood cell (7µm) is used. The maximum Poiseuille velocity for capillary flow is derived from the mean velocities as calculated with the flow Reynolds number (Vmax = 2·Vmean).
Using in vitro flow rates derived from the flow Reynolds number and counting for the in vitro particle and fluid properties, the particle Reynolds number was found of the same order of magnitude in vitro and in vivo (Table III-2), varying with a factor 1.7.

Modeling of flow in a single hemodialyzer fiber
69
Table III-2: Comparison between the particle Reynolds number for blood flow in a dialyzer fiber and particle flow in a microcapillary.
In vivo: dialyzer fiber In vitro: microcapillary Qblood
mL/min Vmax mm/s
a µm
Dfiber
µm νblood
mm²/sRep in vivo
- Vmax
mm/sa
µm Dcap
µm νphys
mm²/s Rep in vitro
-
150 17.3 3.5 200 3.42 3.1 E-4 4.6 5 220 0.995 5.2 E-4 250 28.8 3.5 200 3.42 5.2 E-4 7.6 5 220 0.995 8.7 E-4 350 40.4 3.5 200 3.42 7.2 E-4 10.7 5 220 0.995 12.2 E-4
The cell concentration in blood (hematocrit) is taken as a criterion to derive the required particle concentration of the bolus in vitro. Table III-3 shows the calculation of the number of particles per bolus injection of 20µL, taking into account the volume of one single sphere (529.6µm³). The total number of particles is of the order 1000-2000 in the hematocrit range 25-50%.
Table III-3: Particle concentration in a bolus injection
Hematocrit %
Cell volume µl
Number of particles -
25 5 955 30 6 1146 35 7 1337 40 8 1528 45 9 1719 50 10 1910
In conclusion, with the available capillaries and particles, both the flow rate and the injected number of particles can be adapted to obtain dynamic similar conditions as in vivo.
2.2. Differences between blood flow and particle transport
With the applied measuring technique, we are, however, not able to adequately simulate blood flow in a hollow fiber by investigating particle transport in microcapillaries, due to different flow phenomena.
It has been shown in several studies that blood behaves as a strongly non-Newtonian fluid. Besides the dependency on hematocrit [144-146], blood viscosity is also affected by the shear rate and the tube diameter. At higher shear rates, red blood cells start to deform and will align in the flow, resulting in a lower apparent viscosity [144]. Blood viscosity will further decrease for blood flowing in

Chapter III
70
tubes between 300-30µm in diameter [65,147]. Microscopic observations showed a central core of red blood cells and a marginal plasma layer. With the proposed measuring technique, however, rigid particles are used.
Furthermore, blood flow is a continuous flow of cells suspended in plasma, characterized by a volume percentage equal to the hematocrit. In the experiments, however, a bolus of 20µL of suspended particles is injected in an aqueous Poiseuille flow at the capillary inlet. Although the bolus concentration can be well chosen such that it matches the corresponding hematocrit, a bolus is always subject to dilution, resulting in a lower concentration at the capillary outlet.
Particle buoyancy is an important aspect when investigating particle transport in microcapillaries. With the present technique, the particles are lagging the fluid with a buoyancy of 0.6%. In blood, however, the buoyancy of cells in plasma is 5.8%.
As blood is flowing through the dialyzer, ultrafiltration causes blood thickening and changes the flow rate along the fiber length. With the non-permeable capillaries, ultrafiltration and related flow phenomena are not taken into account.
2.3. Conclusion
Because of the differences between blood flow in a hollow fiber of a dialyzer and particle transport in a non-permeable microcapillary, the aim of the next paragraph is to present the developed measuring technique rather than to draw a direct relation between blood and particle flow. The proposed technique presents unprecedented possibilities for quantitative evaluation of cell or particle adhesion at solid-liquid interfaces; of interest in future artificial organs design. Moreover, it offers possibilities of cell or particle separation with particle size, density and adherence as the discriminating parameters.

Modeling of flow in a single hemodialyzer fiber
71
3. Particle transport in a microcapillary†
3.1. Abstract
Convective transport of 10µm nearly neutrally buoyant spherical particles (polystyrene vinyl dibenzene) is studied in 220µm and 530µm diameter capillaries using an on-line particle detector of the electronic gate type. The detector, connected to the capillary outlet, monitors the elution and translates the passage of individual particles into pulsed signals. The measuring technique requires the use of an electrically conductive carrier liquid, such as physiological saline (0.9%NaCl). Passage times are registered for discrete capillary lengths varying between 0.25m and 5m. Mean particle and fluid velocities are used to calculate the preferential radius of particle transport.
The equilibrium position of the particles is found to shift towards the capillary wall for higher Reynolds numbers, for longer and smaller capillaries, and for more dilute suspensions. However, the higher the particle to capillary diameter ratio, the more pronounced wall effects are. Moreover, as the Stokes number is small (E-2), adhesion at the capillary walls turns out to be non-negligible and to have an impact on the final quantitative results.
3.2. Background
Spherical particles injected in a convective (Poiseuille) flow are subjected to forces like lift, drag [148,149] and the Archimedes gravity. The combination of these might result in particle migration towards preferential streamlines.
Most studies in this context describe the motion of a single particle in shear flow. The linearized Navier-Stokes equations, describing creeping motion by neglecting acceleration, ignore the existence of radially directed motion [150]. Segré and Silberberg [151], however, experimentally demonstrated the occurrence of radial particle displacements that are attributed to the inertia of the moving fluid. In order to describe this migration theoretically, several investigators considered the contribution of inertial effects for a particle that translates and rotates in an unbounded flow, by defining lift forces due to particle rotation [152] and shear [153]. Although Saffman [153] took into account the wall effect slowing
† The contents of this section was published in Phys Fluids 2004;16:2282-2293. Experimental evaluation of the migration of spherical particles in three-dimensional Poiseuille flow
S. Eloot, F. De Bisschop, and P. Verdonck

Chapter III
72
down a particle due to the extra drag, he did not consider the change of the flow field surrounding any particle near the wall. In summary, none of those viscous theories, accepting lift force to be linear in the carrier velocity and to be viscosity dependent, explains the observations by Segré and Silberberg [151] to a satisfying degree.
3.2.1. Neutrally buoyant particle
Cox and Brenner [154] were the first to consider all influences exerted by a wall, as well as the non-uniformity of shear in three-dimensional Poiseuille flow. Their inertial theory, however, did not allow drawing any conclusions regarding the direction of lateral forces, nor did it explain the occurrence of preferential flow paths and their location. Based on the theory of Cox and Brenner [154] and by reducing the problem to two-dimensional flow between two parallel plates, Ho and Leal [155] were able to evaluate the magnitude and direction of the lateral force on a neutrally buoyant particle in both simple shear and Poiseuille flow. They concluded that lateral migration originates from shear stresses acting on the sphere, rather than from wall-induced lag and/or angular velocities. Moreover, they defined lift as a function of the disturbance flow created by the wall on one hand and of the migration velocity due to an unbounded shear field on the other. In general, for two-dimensional Poiseuille flow, three particle positions are found where lift is vanishing: an unstable one at the centerline and two stable ones at 20 and 80%, respectively, of the channel width [155]. These equilibrium positions agree well with the preferential flow paths in two- and three-dimensional flow experiments performed by Tachibana [156] and Segré and Silberberg [151]. For vertical Poiseuille flow, Vasseur and Cox [157] defined stable equilibrium positions at 19 and 81% of the channel width for freely rotating particles. These equilibrium points shift to 26 and 74%, respectively, whenever particles are prevented from rotating. Despite fair agreements of their findings with the lateral migration theories for spheres in the bulk region, closer to the wall, Ho and Leal [155] overestimated the lateral migration velocity as derived by Vasseur and Cox [157] and Cox and Hsu [158]. The latter focused on the migration of a neutrally buoyant particle in the vicinity of a single plane wall. It should be noticed finally, that particle size plays an important role, as reported by Karnis et al. [159]. In the limit, a particle with a diameter closely matching the channel width travels by definition on the axis, while smaller particles travel further away from the axis.

Modeling of flow in a single hemodialyzer fiber
73
3.2.2. Non-neutrally buoyant particle
A non-neutrally buoyant spherical particle with a velocity greater than the undisturbed local fluid velocity migrates towards the nearest wall. A particle that lags the carrier liquid, on the contrary, experiences larger inertial lift and migrates towards the center plane in a rectangular duct (2D) [160,161] or towards the axis in a circular conduit [151,162,163]. Moreover, the migration rate increases with particle size, carrier liquid flow rate, and/or particle-fluid density difference [157]. Numerical simulations by Feng et al. [143] are in good agreement with the preceding theories, at least for small particle-fluid density differences in a Poiseuille flow. For larger density differences, the equilibrium position shifts towards the centerline, irrespective of whether the particle is more or less dense than the fluid. However, particles never are able to stabilize exactly on the centerline.
3.2.3. Dependence on Reynolds number
One of the main parameters controlling the position of the equilibrium streamlines is the tube or channel Reynolds number (-):
νDVRe mean
tube⋅
= ν
LVRe maxchannel
⋅= Eq. III-3
With Vmean and Vmax the mean and maximum flow velocity (m/s), respectively, D the tube diameter (m), L the channel width (m) and ν the kinematic fluid viscosity (m²/s). The formerly mentioned theories [155,157] were derived for low Rechannel (<<1), and indicated that the equilibrium streamline is the result of two effects. One is caused by the interaction with the wall and the shear there, producing migration towards the axis, while the other is linked to the shear and the curvature of the Poiseuille flow, producing migration towards the wall. Schonberg et al. [164], however, investigated, based on Saffman’s theory, the migration of neutrally buoyant particles in 3D Poiseuille flow for the case convective terms are equal (Rechannel ≈ 1) or more important than the viscous terms (Rechannel > 1). For Rechannel ≤ 15, they found migration profiles in good agreement with those predicted by Vasseur and Cox [157]. However, for higher Rechannel (> 30) and particles not too close to the walls ( channelReL/> ), lateral
migration velocities (scaled by particle diameter a and mean fluid velocity Vmean) decrease and equilibrium positions are closer to the wall [165], as also observed by Segré and Silberberg [151]. Extending Saffman’s theory for shear flow (lower Re), Mc Laughlin [166] found lift forces to be much smaller than predicted [153], at least

Chapter III
74
for unbounded shear flow. On the basis of numerical simulations for a neutrally buoyant particle in a 2D Poiseuille flow and for Rechannel of 40 and higher, Feng et al. [143] found an equilibrium position at 25.2% of the channel width and closer to the wall, respectively. For Rechannel in the range 100 up to 3000, Asmolov [167] described lift on neutrally as well as non neutrally buoyant spheres as a function of Rechannel, distance to the wall, and slip velocity. His results for Rechannel = 100 and non-neutrally buoyant spheres were similar to those obtained by Hogg [168]. These reported results indicate the importance of the tube or channel Reynolds number.
3.2.4. Particle transport near the wall
For effectively bounded domains, Ho and Leal [155] defined a lift force determined by inertia alone, without explicit dependence on viscosity. In more recent studies of a shear flow in systems bounded by one single [169] or two infinite flat planes [170], lift is derived from the superposition of migration velocity due to the unbounded shear field on one hand, and, to the disturbance flow created by the wall on the other. Whereas former theories were derived for distances between the sphere and the wall larger than the particle radius, an extension of such theories was formulated by Cherukat et al. [171] for a wall lying within the inner region of a particle (i.e. the region in which viscous effects dominate). For spherical particles colliding with the wall in a shear flow, Leighton and Acrivos [172] found that lift is directed away from the wall and that its magnitude is proportional with the fourth power of the particle radius and the square of the velocity gradient at both sides of the sphere. Gondret et al. [173] experimentally investigated the bouncing of spherical particles onto a wall and found that no rebound occurs if the Stokes number (St) remains lower than a critical value (Stc) of about 10. The Stokes number is here defined as the ratio of particle inertia to viscous forces:
µVaρ
92St p
⋅⋅⋅= Eq. III-4
ρp represents the particle density (kg/m³), a the particle radius (m), V the impact velocity (m/s), and µ the dynamic fluid viscosity (Pa·s).
In this experimental study, the migration of approximately neutrally buoyant spherical particles is investigated in three-dimensional microcapillary Poiseuille flow. The main parameters investigated are the Reynolds number, the particle to capillary diameter ratio, the internal capillary coating, and the injected particle volume fraction.

Modeling of flow in a single hemodialyzer fiber
75
3.3. Experimental method
3.3.1. In vitro setup
Silica capillary (Achrom) of varying length and of internal diameters of 530µm and 220µm, respectively, is horizontally coiled-up (coil radius is about 100mm) (Fig. III-1). The capillary is coated at its inside with methyl, methyl-phenyl or glycol groups, resulting in different adhesive behavior. A piston pump driven by a stepping motor generates convective transport in the capillary. The step rate of the motor, fixed by a resistance-capacitance RC time constant, is set by means of a potentiometer.
At the capillary inlet, a sampling valve connected to a storage column (530µm diameter and 90.65mm in length) allows a bolus injection of a 20µL suspension of particles of various concentrations. By repeatedly transporting the particle suspension in between the loading syringes, the storage column is loaded by a homogeneous suspension and can be subsequently unloaded when opening the sampling valve (Fig. III-1).
Fig. III-1: Scheme of the in vitro setup with a detail of the gate geometry.
The capillary outlet is connected to an on-line detection apparatus [174] with a gate of 50µm aperture and 50µm in length (see detail in Fig. III-1). In front of the gate, the streamlines of the suspension are made to converge, using a secondary surrounding carrier liquid flow, in order to avoid recirculation of particles and with it, the generation of false counts [175]. As capillary passage times are of the order 8-400s, and particles are only 0.04-0.13s in the transitional phase in front
Particle
Pulsed voltage
Capillary columninternally coated
Capillary columninternally coated
Storage column
Loading Syringe
Piston Pump
Stepping motor
On-line detection apparatus
Cumulative Elution Curve
t
∫ dn/dt
Elution Curve
capillary flow
gate
50µm
50µm
surrounding flow

Chapter III
76
of the gate (i.e. 0.01-1.6%), particle track times are not influenced by it. Transit of particles through the electronic gate is signaled as a variation of the gate’s resistance, in proportion to the particle size [176]. Resistance-to-voltage conversion is then effectuated by operating the gate in a measuring bridge that is actuated by a low-frequency signal of high spectral purity [175]. Further handling of the pulsed gate signal remains a matter of selective amplification and base-line restoration [175].
A 0.9% sodium chloride physiological solution with density of 1024kg/m³ and dynamic viscosity of 1.02mPa·s is used as carrier liquid. For the different potentiometer settings, the flow rates of the carrier are calibrated in advance by gravimetric flow measurements. The suspended particles are polystyrene vinyl dibenzene spheres of 10µm nominal diameter, calibration standards of uniform density (1030kg/m³) (Coulter-PN6602796). The particle size distribution is derived on the basis of pulse-height measurements (sizing resolution better than 0.10µm) and is found being Gaussian with a standard deviation of 0.15µm. Considering particle to carrier densities, the particle is lagging the fluid with a buoyancy of 0.6%.
3.3.2. Elution diagrams
The electronic coaxial gate detector at the capillary outlet translates the passage of individual particles into pulsed signals and monitors the elution rate, i.e. the
number of particles leaving the capillary per unit of time:
t,
dtdn plot (Fig.
III-1). As monitoring starts at the moment of bolus injection at capillary inlet, the onset of detection of elution is a measure for the velocity of the fastest particles (capillary length divided by passage time). Moreover, an elution peak reflects the velocity of the majority of particles, also indicating the occurrence of a preferential pathway of transport (Segré-Silberberg phenomenon). Broadening and tailing of elution peaks reflect particle retardation due to adhesion and/or particle collisions.
From the elution diagram, the cumulative number of particles detected per time
step is derived and normalized for the total particle number:
∫ t,
dtdn plot (Fig.
III-1). Cumulative elution diagrams, less sensitive to statistical variations in the elution rate, allow more reliable comparisons between subsequent tests with the same and different parameters, respectively. Moreover, in a normalized cumulative elution plot, the area below the curve (i.e. the integral) constitutes a

Modeling of flow in a single hemodialyzer fiber
77
measure of occurring retardation: the lower the area, the more important adhesion and collision phenomena are. Whether adhesion is irreversible or not can be investigated by comparing the number of injected and detected particles.
3.3.3. Measuring protocol
Main parameters in this study are capillary diameter, length, and internal coating, carrier liquid flow rate, and number of particles injected (Table III-4). The same methyl coated capillary, either of 530µm or 220µm diameter, was cut to decreasing lengths, stepwise. For each length and flow rate, elution rates were registered 2 up to 4 times, in order to investigate reproducibility. Poor reproducibility indeed may result from effects of irreversible adhesion. During repeated tests with the 220µm diameter methyl coated capillary, already shortened to a length of 0.9m, irreversible adhesion of particles to the capillary wall started disturbing the subsequent test series. Therefore, a fresh 220µm diameter capillary was used so that reliable results were obtained for the shorter capillary lengths (0.5m and 0.25m).
Table III-4: Overview of the test parameters
Parameters 530µm diameter capillary 220µm diameter capillary Capillary length L (m) 5 - 2 - 1.5 - 1 - 0.5 - 0.3 2.7 - 1.7 - 0.9 - 0.5 - 0.3
Internal coating methyl / methyl-phenyl / glycol methyl Flow rate Q (mm³/s) 6.82 - 3.23 0.90 - 0.31
Mean velocity Vmean (mm/s) 31 - 15 24 - 8 Mean sedimentation Vsed (mm/s) 3.2·E-4 3.2·E-4
Sedimentation ratio α (-) 0.006 – 0.200 0.018 – 0.490 Reynolds number Retube (-) 16 - 8 5 - 2 Number of particles n (-) 15000 - 25000 1000 - 10000
Injected volume fraction (-) E-4 E-5 - E-4 Injection time (s) 3 - 6 22 - 64
To investigate the adhesion phenomenon more in detail, the results for 530µm diameter capillaries with different internal coatings, i.e. methyl, methyl-phenyl, and glycol groups, are compared. The adhesiveness of these groups is dissimilar for reasons of molecular polarity. Moreover, for a constant capillary length (5m) and constant number of injected particles, the influence of carrier flow rate on adhesion is studied.
As the tube Re numbers are of the order 1.8-5.2 (D=220µm) and 7.8-16.5 (D=530µm) for flow rates varying from 0.3 up to 0.9mm³/s and from 3.2 up to

Chapter III
78
6.8mm³/s, respectively (Table III-4), the capillary flow is laminar with the characteristic velocity profile as described by Poiseuille’s law:
( )
−⋅⋅=
2
Rr1V2rv mean Eq. III-5
With v(r) the axial velocity (m/s) at a radial position r from the axis (m), Vmean the mean fluid velocity (m/s) and R the capillary radius (m).
The curvature ratio δ of the coiled capillaries (capillary radius R divided by the curvature radius) is very small, i.e. 0.00265 and 0.00110, giving rise to a Dean number κ in the range of 0.06-0.85. The latter is defined [177] as a function of mean velocity Vmean (m/s), capillary radius R (m) and kinematic viscosity ν (m²/s):
δ
νRV2
κ mean ⋅⋅⋅
= Eq. III-6
The Poiseuille velocity profile, in such conditions, remains undisturbed by capillary curvature [177,178].
As for the presented test results particle volume fractions were only of the order E-4, fluid viscosity [179,180] is never affected by the bolus injection. The preferential flow path (r/R) is then derived from Poiseuille’s law:
meanV2v
1Rr particle
⋅−= Eq. III-7
Owing to the finite bolus volume (20µL) and the relative small flow rates, injection times (22-64s for D=220µm and 3-6s for D=530µm) cannot be neglected and should be taken into account while interpreting elution diagrams. As for the 530µm capillary the particle injection produces a short bolus of high particle concentration, and since elution starts with a steep peak, track times effectively correspond to the detected time interval (Fig. III-2 top panel). This however is no longer the case with the 220µm capillary: the fastest particles anyhow leave the storage column as first. For the majority of particles (i.e. for the elution peak), track times are more accurately derived from a start time corresponding with the number of particles as detected at the peak of the elution (shaded area in Fig. III-2 bottom panel).

Modeling of flow in a single hemodialyzer fiber
79
Fig. III-2: A typical bolus injection and elution plot with the 530µm diameter capillary for a flow rate of 6.823mm³/s (top panel) and with the 220µm diameter capillary for a flow rate of
0.779mm³/s (bottom panel).
3.4. Experimental results
The migration of nearly neutrally buoyant spherical particles is investigated experimentally. An overview of the average positions of the preferential flow path r/R (%) for the fastest particles in the 530µm diameter methyl coated capillary is given in Table III-5 and Fig. III-3. The equilibrium position shifts towards the capillary wall at higher flow rates and for longer capillaries. Table III-6 shows the derived r/R values for a 220µm diameter capillary for the fastest particles on one hand (Fig. III-3), and for the majority of particles on the other. For higher flow rates (>0.77mm³/s) and shorter capillaries (<0.5m), the velocity
Injected and detected number of particles
in 530µm capillair
0
2000
4000
6000
8000
10000
-50 0 50 100 150 200 250
time (s)
num
ber o
f par
ticle
s (-)
track time
0
200
400
600
800
50 100 150 200 250
capillary
Injected and detected number of particles in 220µm capillair
0
20
40
60
80
100
120
140
-50 0 50 100 150 200 250
time (s)
num
ber o
f par
ticle
s (-) track time of
fastest particles
track time of majority of particles
capillary

Chapter III
80
of the fastest particles is higher (20-60%) than the mean carrier liquid flow velocity, while it is slightly lower (0-10%) for lower flow rates (<0.41mm²/s) and longer capillaries (>1m).
Table III-5: Mean values of preferential flow path r/R (%) for the fastest particles in the 530µm diameter capillary for the applied flow rates and capillary lengths.
Q(mm³/s) \ L(m) 5.0 2.0 1.5 1.0 0.5 0.3 6.823 46 45 47 42 29 37 5.151 42 43 39 42 28 16 4.190 43 44 42 39 13 19 3.231 40 40 38 34 16 19
Fig. III-3: Illustration of preferential pathways in 3D Poiseuille flow for the 530µm and the 220µm diameter capillary compared with literature results.
The distance traveled by the fastest particles as a function of elution peak time for the different carrier liquid flow rates, is shown in Fig. III-4 (530µm diameter) and Fig. III-5 (220µm diameter). The slope of these curves, derived from a linear regression, is a measure of the speed of Segré-Silberberg transport. Due to transitional phenomena and finite bolus injection times, the regression curves do not pass the origin.
Capillary diameter Channel width
530µm capillaryr/R = 40-47%
27-30% channel width
220µm capillary(fastest particles)
r/R = 40-80%10-30% channel width
Literature r/R = 60% 20% channel width
r
R

Modeling of flow in a single hemodialyzer fiber
81
Table III-6: Mean values of preferential flow path r/R (%) for the fastest particles/majority of particles in the 220µm diameter capillary for the applied flow rates
and capillary lengths.
Q(mm³/s) \ L(m) 2.7 1.7 0.9 0.5 0.25 0.895 48 / 66 55 / 71 77 / 79 66 / 83 49 / 77 0.779 66 / 80 51 / 78 76 / 78 62 / 79 53 / 75 0.407 73 / 80 77 / 84 73 / 74 60 / 72 46 / 77 0.311 68 / 77 77 / 81 73 / 74 44 / 63 40 / 71
Fig. III-4: Distance covered by the particles as a function of the track time at various flow rates of the carrier liquid in the 530µm diameter capillary.
Fig. III-6 shows the normalized cumulative elution obtained with a 220µm diameter capillary of 0.9m long, and at a flow rate of 0.407mm³/s, before and after contamination of the capillary with irreversible adhering particles. For a standard capillary, the preferential flow path is found at r/R = 73±1%, while the radius of transport is closer to the centerline, i.e. r/R = 41±1% when permanent adhesion has occurred.
0,0
0,5
1,0
1,5
2,0
2,5
0 20 40 60 80 100Track time (s)
Cap
illar
y le
ngth
(m)
Q=3,231mm³/s
Q=4,190mm³/s
Q=5,151mm³/s
Q=6,823mm³/s

Chapter III
82
Fig. III-5: Distance covered by the fastest particles as a function of track time at various flow rates of the carrier liquid in the 220µm diameter capillary.
Fig. III-6: Cumulative elution plots before (bold line) and after (thin line) irreversible adhesion in the 220µm diameter and 0.9m long capillary for a carrier liquid flow rate of 0.407mm³/s. The curves are numbered from 1 up to 6 in order of successive performed measurements.
Fig. III-7 shows the normalized cumulative elution plots for 530µm diameter and 5m long capillaries with different internal coatings, i.e. methyl, methyl-phenyl and glycol, and for a flow rate of 4.190mm³/s. Taking the results of the methyl capillary as reference and normalizing the elution curves for the total number of detected particles, the area in between the curves is a measure for the extra adhesion occurring in the methyl-phenyl and glycol capillaries, respectively. The
0,0
0,5
1,0
1,5
2,0
2,5
3,0
0 50 100 150 200 250 300 350
Track time (s)
Cap
illar
y le
ngth
(m)
Q=0.311mm³/s
Q=0.407mm³/s
Q=0.779mm³/s
Q=0.895mm³/s
0
0,2
0,4
0,6
0,8
1
1,2
0 50 100 150 200 250 300 350 400
time (s)
norm
. cum
ul. e
lutio
n (-) 1
3
2
4 5 6

Modeling of flow in a single hemodialyzer fiber
83
ratio of the enclosed area to the total area below the cumulative elution curve of the methyl coated capillary (%) is a measure for the extra appearing adhesion and is given in Table III-7 for the different applied flow rates. Adhesion seems more important in the methyl-phenyl coated capillary and for lower flow rates.
Fig. III-7: Cumulative elution plots in 530µm diameter and 5m long capillaries with different internal coating: methyl, methyl-phenyl, and glycol. The carrier liquid flow rate is 4.190mm³/s.
Table III-7: Extra adhesion (%) in the methyl-phenyl and glycol capillaries, compared with the methyl coated one (530µm diameter and 5m in length), for the different applied
flow rates.
Q(mm³/s) methyl-phenyl glycol 6.823 0.6 0.06 5.151 0.8 0.2 4.190 2.5 0.7 3.231 5.3 4.1
3.5. Discussion
Most former studies investigated either the transport of a single particle theoretically [143,157,164,168,170], or the motion of a continuous dilute suspension of particles experimentally in relatively wide tubes [151,156]. This study, however, aims to quantify particle suspension transport in long microcapillaries by evaluating the elution at the capillary outlet after bolus injection at the inlet. The main distinctions between the different approaches are given in Table III-8. With respect to the carrier liquid fluid, Poiseuille flow conditions are assumed since tube Reynolds numbers are low (<20) and the velocity profile is not influenced by capillary curvature [177,178].
0
50
100
150
200
250
300
350
0 100 200 300 400 500 600 700 800
time (s)
elut
ion
(-)
0
0,2
0,4
0,6
0,8
1
1,2
norm.cum
ul. elution (-)
methyl glycolmethyl-phenyl

Chapter III
84
Table III-8: Parameters and results of the presented study compared with those of an experimental [151] and theoretical [143] study.
Parameters Eloot et al. D = 530µm
Eloot et al. D = 220µm
Segré et al. Experimental
Feng et al. Numerical
Capillary position horizontal horizontal vertical horizontal Capillary length L (m) 0.3 - 5 0.3 - 2.7 0.31 - 1.20 - Capillary diam D (mm) 0.530 0.220 11.2 8·a Particle diam a (mm) 0.010 0.010 0.32 - 1.71 a
Ratio a/D (-) 0.019 0.045 0.029 – 0.153 0.125 (ρp - ρf) / ρf (%) + 0.6 + 0.6 0 -10 - +10
Velocity Vmean (mm/s) 31 - 15 24 - 8 50 - 900 0.625·ν·L/a² Re number Retube (-) 16 - 8 5 - 2 3 - 700 40 - 120
Number of particles (#/cm³) 7·E+5 – 10·E+5 5·E+4 – 50·E+4 0.33 - 4 single particleInjection time (s) 3 - 6 22 - 64 7 - 134 - Flow path r/R (%)
Neutrally buoyancy 16 - 47 40 – 77 40 / 60 60 Strong buoyancy - - - → 0
3.5.1. Particle buoyancy
The buoyancy parameter is only 0.6% and might inspire the reader to make comparisons with the results for neutrally buoyant particles. For the intermediate case between neutrally and non-neutrally buoyant particles, Vasseur and Cox [157] described a theory (originally derived for Retube<<1 but found to be valid [164] for Retube< 15) based on the dimensionless parameter B:
2
mean
particle
R2a
Vv
B
⋅⋅= Eq. III-8
B is equal to zero for neutrally buoyant particles migrating to the equilibrium flow path at r/R=62%. Positive values of B result in preferential flow paths nearer to the wall, while negative values result in particle migration towards the axis [157]. Deviations from the equilibrium streamline only become important for absolute values of B equal to E-1. As we are dealing with B values E-4 (220µm capillary) and E-5 (530µm capillary), buoyancy seems not to be important. However, in long microcapillaries, particle sedimentation plays a non-negligible role. Using Stokes’ law and considering hydrodynamic interactions between particles, Batchelor [181] defined the average sedimentation velocity in a dilute random suspension Vsed (m/s) as:
( )( )2Stsed cOc6.551VV +⋅−⋅= Eq. III-9

Modeling of flow in a single hemodialyzer fiber
85
with c as the particle volume fraction (-) and VSt as the Stokes velocity (m/s):
( )g
µ9ρρa2
V fp2
St ⋅⋅
−⋅⋅= Eq. III-10
The latter is a function of particle radius a (m), dynamic fluid viscosity µ (Pa·s), the particle and fluid density ρp and ρf (kg/m³), respectively, and the gravitational acceleration g (m/s²). As the suspension is rather dilute, sedimentation velocity is found constant and equal to 0.32µm/s (Table III-4). The ratio of sedimentation distance to capillary inner diameter, α (-), a relevant measure for buoyancy, becomes important (α=0.49) for low flow rates (Vmean=8mm/s) in long (L=2.96m) and small (D=220µm) capillaries (Table III-4):
mean
sedsed
VDLV
DtV
α⋅
⋅=
⋅= Eq. III-11
As a consequence, particles tend to migrate to the bottom of longer capillaries, which makes adhesion more likely to occur.
3.5.2. Preferential flow paths
There is a significant difference between the preferential flow paths found with the 530µm (range r/R = 16-47%) and with the 220µm diameter capillary (range r/R = 40-77%), respectively (Fig. III-3). Causes of that might be multiple. First, the particle to capillary diameter ratio, 2·a/2·R, (0.019 in the 530µm versus 0.045 in the 220µm diameter capillary) appears to have an important influence on particle transport. As occurring differences in axial velocities at both sides of the particle are higher in smaller capillaries for a fixed mean velocity, particles will experience stronger negative pressure at the lower velocity side, stimulating migration towards the wall. Secondly, due to dissimilar flow rates applied in both capillaries, we are dealing with different injection times and, hence, with different elution curves. For capillaries of relatively large diameter and for higher flow rates, bolus injection can be considered as instantaneous, such that the elution diagrams are characterized by a steep frontal peak (Fig. III-2). In the smaller capillary, however, and for lower flow rates applied, injection as well as elution spread out (Fig. III-2), resulting in a lower detected volume fraction. Moreover, to avoid contamination resulting in capillary and/or gate blockage, the injected bolus particle volume fraction was reduced by a factor 10 with the 220µm diameter capillary, compared to the tests with the wider capillary. As a consequence, the elution measured with the 220µm diameter capillary is more the result of single particles passing the gate, less influenced by preceding or

Chapter III
86
chasing particles. This might be the reason why preferential flow paths derived from those elution curves are better matching former experimental and theoretical results [143,151].
The equilibrium streamlines in the 530µm capillary shift towards the wall for higher Reynolds numbers (higher flow rates), as was experimentally and numerically pointed out by Segré et al. [151] and Feng et al. [143]. In general, higher Reynolds numbers correspond to higher fluid velocities, larger channel width, or less viscous fluids. For a particle flowing e.g. beneath the axis in a horizontal Poiseuille flow, the velocity curvature, more expressed for higher flow rates, creates a higher velocity of the fluid relative to the particle on the bottom side. This stronger local flow causes low pressure on this side such that the particle is sucked away from the centerline [143]. Moreover, for wider channels, the wake of a particle no longer fills the channel width, in such a way that the inertial interaction with the wall and, with it, wall repulsion decreases. As a consequence, radial migration velocity is related to three dimensionless variables [151,157,165,166]: particle to capillary radius ratio, a/R, radial position to capillary radius ratio, r/R, and the Reynolds number.
As Segré and Silberberg did not consider the lower Re range (i.e. Retube<16.2) in their experiments with long (L=1.2m) wide tubes (r/R=60%), the influence of Reynolds number on particle transport as found with our experiments is compared to their results for a shorter tube (L=0.31m). For a high number of injected particles (7·E+5 - 40·E+5 particles/cm³) in the longest capillary (L=5m), our experimental findings gave an r/R varying from 40 to 46% for tube Reynolds numbers increasing from 7.8 up to 16.5 (Table III-5). These results appear in good agreement with the experimental data as measured by Segré and Silberberg for an injection of 2 particles/cm³ (particle diameter 1.21mm) in a tube with diameter D=11.2mm and length L=0.31m. They found an r/R varying from 40 to 46% for a Reynolds number in the range 3.2-16.2. However, it should be remarked, that both experiments are performed in totally different ranges with respect to particle/tube sizes and particle volume fractions. As a consequence, this comparison is more an evidence of the phenomenon rather than a quantitative verification.
For the longest 530µm diameter capillaries (2m-5m), a stable equilibrium is found at 27-30% of the capillary width (i.e. the capillary diameter) while 20% width is predicted on the basis of single particle tracking [151,155-157] (Fig. III-3). The observed equilibrium streamline for slightly buoyant (0.6%) injected particles is the result of two competing effects: particle sedimentation towards the bottom wall, and migration of the lagging particles towards the centerline

Modeling of flow in a single hemodialyzer fiber
87
[160,161]. With shorter capillaries (<1m) particles are moving with velocities more approaching the maximum fluid velocity. This can be explained by the fact that the shorter the capillary passage time is, the lower the axial particle diffusion and bolus dilution are. And, as a consequence, the higher the bolus volume fraction, the more important the interaction between particles is. Han et al. [182] reported mutual particle collisions for volume fractions of 0.06, resulting in a smooth particle distribution around the equilibrium in between the centre and the wall. Dealing with much smaller volume fractions (e.g. order E-4) does, however, not necessarily imply that indirect particle interactions can be ignored. For the case the distance in between two neighbouring particles is not too close but still small compared to the channel width, the disturbance flow in the inviscid region (far enough from the wall) is influenced by both particles. This results in a lift force on each particle twice as high as found for a single particle [183]. Furthermore, mutual particle collisions between a flowing and an adhered particle are more likely to occur with the more concentrated suspension in the 530µm diameter capillaries. As a consequence, adhered particles are enabled to be released again and to migrate towards regions of higher fluid velocities [184].
For the 220µm capillary, the fastest particles move along streamlines at 10-30% of the capillary width, which is in quite good agreement with previous results [151,155-157] (Fig. III-3). Although good reproducibility for measurements with the same test conditions was found, it is hard drawing clear conclusions with respect to capillary lengths and Reynolds numbers. For the larger capillary lengths (>1.5m), equilibrium streamlines shift towards the wall for lower flow rates (lower Reynolds numbers) as sedimentation becomes more expressed (Eq. III-11). However it should be remarked that a considerable experimental variability (high standard deviation) was found for the transport radii at higher flow rates (>0.779mm³/s) compared with the lower ones (<0.407mm3/s).
Of decisive importance for the applicability of the present measuring technique is the rate of establishment of Segré-Silberberg transport immediately after injection of the bolus. Relevant information in that context was obtained by measuring track times in capillaries cut to decreasing lengths and at various flow rates of the carrier liquid (Fig. III-4 and Fig. III-5). For the 530µm capillaries, the slopes deviate from linearity only for capillary lengths smaller than 0.5m (Fig. III-4). As the negative x-intercept diminishes for higher flow rates, the transition phenomenon is more expressed with lower axial velocities. In general, this entry effect is caused by the fact that fluid from the storage column, entering the mouth of the capillary, will not immediately transform into the laminar Poiseuille profile. Moreover, the initial homogeneous particle distribution will transform to

Chapter III
88
transport along preferential streamlines. Using the shear-induced-diffusion hypothesis of Leighton and Acrivos [185], the timescale for reaching fully steady state flow [186], tss, is function of the mean radial distance the particles must travel, R:
D⋅
≈4Rt
2
ss Eq. III-12
With D the shear-induced diffusivity (m²/s) defined as:
( ) 2aγd ⋅⋅= φD Eq. III-13
γ being the shear rate (1/s), a the particle radius (m), and d(φ) a non-dimensional function of particle volume fraction, φ, obtained from extrapolation of experimental data with high concentrated suspensions [187]:
( ) ( )[ ]φφφ ⋅⋅+⋅⋅= 7exp9.015.0d 2 Eq. III-14
The shear rate is estimated for Poiseuille flow at the radial position corresponding with mean axial velocity: 2.83·Vmean/R. Eq. III-12 can be expressed equivalently as the length required to reach steady state, Lss (m):
( )[ ] 2
3
2ss aR
7exp9.0166.51L ⋅
⋅⋅+⋅⋅=
φφ Eq. III-15
Although this theory was originally derived from experiments using a totally different range for particle and tube sizes, particle volume fractions, and shear rates, Eq. III-15 might still give an indication about transition phenomena. For our dilute suspension and small particle to capillary ratio, a transition length of at least E+6m is found. This implies that no fully developed flow is reached in the considered capillaries. In addition, investigation of transport of dilute particle suspensions in microcapillaries requires the use of extremely long capillaries. However, regarding the relatively short lengths investigated, the presented results are only slightly influenced by the transition phenomenon. As a consequence, cautiously, the results can be considered valuable within the experimental range. Moreover, the good correlation of the linear curves observed in Fig. III-4, clearly indicates that transition effects mainly manifest in the first 0.5m and are rather negligible for capillary lengths between 0.5-2m. With the 220µm capillaries, curves derived for the fastest particles correlate less well (R² = 0.88-0.99) and, even worse, a positive x-intercept is found for the highest flow rate (0.9mm³/s) (Fig. III-5). The latter implies that besides entrance effects, particle transport along the capillary, characterized by wall adhesion and release, also plays an important role.

Modeling of flow in a single hemodialyzer fiber
89
3.5.3. Adhesion
Both adhesion and removal of particles to/from a substrate are influenced by mechanical properties of the materials (Young’s moduli and yield strength), by their chemical nature and texture, and by characteristics of the flow near the surface of the substrate. As the influence of different coatings is investigated in this study at a constant temperature, at preset flow rates (constant shear stress at the surface), and with suspensions of similar concentrations, only differences in chemical constitution have to be considered. Adhesion and disruption are assumed to take place at constant temperature, without any volume change of the materials involved, and in the absence of chemical processes. Thermodynamically speaking, spontaneous and reversible adhesion may occur in such circumstances whenever the system’s free energy F (Joule) is decreasing [188]:
0σZγγγA∆F
plslps <⋅+−−=∆
Eq. III-16
With γps, γsl, and γpl the particle/substrate, substrate/liquid, and particle/liquid interfacial energies (J/m² or N/m), respectively, ∆A the contact surface change (m²), Z the electric potential at the shear surface, and σ the surface charge density (Clb/m²). As the polystyrene vinyl dibenzene spheres are uncharged (σ∼0) and the sodium chloride solution has a high ion concentration (Z∼0), the last term in Eq. III-16 can be ignored.
Interfacial energies of the types γsl and γpl on the ground of Young’s law are related to solid/liquid contact angles:
⋅−=⋅−=
pllvppl
sllvssl
cosθγγγcosθγγγ
Eq. III-17
Where γlv (also referred to in literature as γl) represents the surface tension of the liquid.
Molecular interaction between materials such as polystyrene vinyl dibenzene latex and the adhesive substrates of the present experiments (methyl, methyl-phenyl, and glycol coated) mainly takes place as a consequence of dispersion forces (γd). This allows the interfacial energy, γps, to be formulated as [189]:
( ) 21d
sdpspps γγ2γγγ ⋅−+= Eq. III-18
Substituting Eq. III-17 and Eq. III-18 in Eq. III-16, one obtains:

Chapter III
90
( ) ( ) 0γγ2cosθcosθγ 21d
sdpplsllv <⋅−+⋅ Eq. III-19
The dispersion terms, ds
dp γand γ , can be determined by measuring the contact
angle of a fluid with known surface tension, γl, with the corresponding solid, e.g.:
l
dld
ssl γγ
γ2-1cosθ ⋅⋅+= Eq. III-20
The governing equation (Eq. III-19) regarding occurrence of adhesion, is transformed in:
( ) 0
γγ2
1cosθ.
γγ2
1cosθ2cosθcosθγ
ldl
pl
ldl
slplsllv <
⋅
+
⋅
+⋅−+⋅ Eq. III-21
Because methyl groups have the second lowest free surface energy [190] (≈20mN/m), it is taken in this study as the reference. Free surface energy is increased in alcohols [190] (such as glycol) because of an increased molecular polarity as the oxygen group enlarges the contact angle. For similar reasons actually, progressively higher surface energies are found for aliphatic chains and aromatic rings (such as methyl-phenyl) [190]. So the order of ranking the coatings for increasing free surface energy becomes methyl, glycol, and methyl-phenyl. Because substrate surface free energy γs is related to the contact angle θsl (Eq. III-17), higher energies correspond to lower values for Eq. III-21.
To investigate the degree of adhesion, the load Ps needed to effect a particle/substrate separation is also an interesting tool, and was defined by Johnson, Kendall, and Roberts [191]:
aπw23P As ⋅⋅⋅−= Eq. III-22
With a the particle radius (m) and wA the thermodynamic work of adhesion (J/m²), related to the surface energies, γp and γs, of any particle and substrate and their interfacial energy, γps:
psspA γγγw −+= Eq. III-23
Combining Eq. III-18, Eq. III-22, and Eq. III-23, the separation load can be rewritten as:
( ) aπγγ3P 21d
sdps ⋅⋅⋅−= Eq. III-24
The separation load, Ps, decreases in absolute value for a decreasing dispersion force, d
s γ . This is reached using a substrate material, such as methyl, with a lower

Modeling of flow in a single hemodialyzer fiber
91
free surface energy, γs, and, thus, characterized by a lower contact angle. Our experimental findings, i.e. increasing importance of adhesion in methyl, glycol, and methyl-phenyl coated capillaries, respectively, are in agreement with the here presented theory describing adhesion phenomena.
Particles transported by rolling over the wall in the absence of any adhesion, are characterized by a flow path of r/R=0.95. Higher values, as found for the slowest particles in the 220µm diameter capillary, at least indicate the presence of adhesion with subsequent release of particles. By flushing the capillary at high flow rates (exerting higher shear stresses at the surface) once a measurement at the lowest flow rates was done, around 5% of the total number of particles, adhering to the wall, was released again. As the Stokes number in our experiments with the 220µm capillary (of the order E-2) is much lower than the critical Stokes number [173], rebound appears impossible. As a consequence, a release of adhering particles can be effectuated only by extra acceleration obtained from a moving particle colliding with an adhered one. This phenomenon was also observed in a previous study [183,192] where adhesion in the 530µm capillary was less pronounced for increasing particle concentrations.
After irrevocable deposition of particles on the capillary wall, so as observed in the 0.9m long 220µm diameter capillary, elution starts earlier and lasts even longer (Fig. III-6) in such a way that it is hard to distinguish an isolated elution peak. On one hand we speculate that contamination at the capillary wall causes the approaching particles to migrate towards the centerline, resulting in a higher transport velocity. This wall repulsive phenomenon was described earlier by Feng et al. [143] for particles initially released near the wall. On the other hand, wall contamination might cause particles to be trapped; in such a way that temporarily or even irreversible adhesion occurs.
3.5.4. Experimental limitations
Finally, it should be remarked that although reliable quantitative results are obtained, we have to deal with some limitations. First, the bolus injection times are non-negligible so that interpretation of the elution curves is more difficult. Secondly, as the used microcapillaries are nontransparent, microscopic observations of steady state conditions, particle collisions and adhesion cannot be performed and results should be considered as black box output.

Chapter III
92
3.6. Conclusion
The described measuring technique allows quantitative evaluation of the transport of a particle suspension in microcapillaries. Critical parameters like carrier liquid flow rate, bolus volume fraction, particle-to-liquid density ratio, particle-to-capillary diameter ratio, and capillary length were investigated.
For more concentrated dilute suspensions in wider capillaries, indirect particle interactions cause preferential flow paths to lie closer to the centerline than obtained from experimental and numerical studies concerning a single particle or more dilute suspensions. In small capillaries, however, the idea of particles following a specific flow path parallel to the capillary axis might be too optimistic even for dilute suspensions. It is more realistic to conclude that sedimentation and temporary wall adhesion cause retardation, which, in turn, causes deviations from the ideal flow path.
3.7. Acknowledgements
This research was originally supported by Fresenius Medical Care (Germany). The authors also wish to thank R Lepercq for cooperation during some of the tests, S Bliki for technical support and P Segers for his extended review.

Modeling of flow in a single hemodialyzer fiber
93
4. Flow modeling at the blood-dialysate interface of a hemodialyzer fiber
4.1. Importance of microscopic flow modeling
Pressure values in the blood, as well as in the dialysate compartment determine the ultrafiltration profile in hemodialyzers. This pressure profile can be theoretically calculated, assuming a constant fluid viscosity and a linear pressure drop over the fiber length in blood and dialysate. Due to ultrafiltration, however, flow rates are changing over the fiber length and may cause the pressure drop deviating from linearity. Moreover, blood viscosity is varying along the length of the dialyzer, causing blood thickening. Besides this axial variation, blood viscosity will also vary in radial direction due to the Fahraeus-Lindqvist effect. Blood viscosity will approach plasma viscosity near the dialyzer membrane, while the high concentration of cells near the fiber axis causes a local viscosity increase.
As a consequence, the influence of ultrafiltration on fiber flow and fluid properties must be investigated at the fiber level rather than the dialyzer level. Therefore, a numerical model was developed of the blood-dialysate interface. Fluid characteristics and membrane properties were investigated in advance in order to implement them properly in the numerical model.
After a short literature overview, the following studies are reported: in vivo evaluation of the dialysate properties, in vitro evaluation of the membrane permeability, influence of the dialyzer membrane type, and influence of the filtration fluid.
4.2. Literature overview†
Whereas one can investigate and compute (macroscopically) blood and dialysate flow in a dialyzer assuming flow in a permeable medium, it should be noted that some important aspects like ultrafiltration, concentration polarization, particle accumulation or protein adsorption at the membrane surface and the multiphase blood flow should be investigated with a microscopic model. Computational fluid dynamics (CFD) is a useful tool for flow visualization at both macroscopic
† The contents of this section was published in Artif Organs 2002;26(7):590-599. Computational flow modeling in hollow-fiber dialyzers S. Eloot, D. De Wachter, I. Van Tricht, and P. Verdonck

Chapter III
94
and microscopic level. However, the numerical results should at least be validated with analytical solutions and/or experimental measurements.
4.2.1. Ultrafiltration versus Haegen-Poiseuille
Ultrafiltration, generated by osmotic and hydrostatic pressure drops over a porous membrane, was originally numerically described by Kedem and Katchalsky [193] using thermodynamics of irreversible processes. The membrane properties were described in terms of filtration, reflection and permeability. Rather than using thermodynamics, Kargol [194] redefined those coefficients assuming a membrane with randomly distributed pore sizes. Using a theoretical model validated with experiments, Wupper et al. [195] described the profile of ultrafiltration and concentration along the axis of high flux hollow fiber dialyzers. It was found that the hydrostatic pressure profile could be approximated as linear even in the presence of a non-linear concentration profile for impermeable solutes. As a result, changes in fiber radius and membrane permeability can be studied using the Darcy and Haegen-Poiseuille laws.
Karode [196] derived analytical expressions for the pressure drop in a permeable tube as a function of wall permeability, channel dimensions, axial position and fluid properties by differentiating the Haegen-Poiseuille formula and applying it locally to infinitesimal sections. Moreover, to benchmark the expression for constant wall permeability, a CFD model was developed and verified by comparing the results for constant wall velocity with Berman’s solution [197].
4.2.2. Concentration-polarization
In the presence of ultrafiltration, particles within the main stream are subjected to a drag force and accumulate near the membrane surface, while the accumulated particles tend to migrate to the feeding stream driven by the concentration gradient. The boundary layer concentration modifies the solute and/or solvent properties like viscosity, density and solute molecular diffusivity [198]. Due to particle accumulation, ultrafiltration flow decreases with time and a steady state value, described as a function of the concentration ratio near the membrane and in the main stream and of the mass transfer coefficient, was derived by Michaels [199] using the one-dimensional convection-diffusion equation. Backfiltration, caused by the oncotic effect, induces a shear stress, which was incorporated by Zydney et al. [200] by using the shear-induced hydrodynamic diffusion coefficient analyzed experimentally by Eckstein et al. [201]. Moreover, the shear stress, maximal at the membrane on the fluid-like concentrated layer, causes this layer

Modeling of flow in a single hemodialyzer fiber
95
to get fluidized. This shear-induced hydrodynamic diffusion process was implemented by Romero et al. [202] taking into account the two-dimensional characteristics of ultrafiltration by integrating the axial momentum equation into the one-dimensional convection-diffusion equation.
Lee et al. [203] used the two-dimensional convection-diffusion equation to describe, using an iterative algorithm, the ultrafiltration flow decline caused by concentration polarization. They found that the concentration as well as the thickness of the boundary layer increases with axial distance but decreases for higher diffusion coefficients and axial velocities.
For computational modeling of such a thin boundary layer in which the solute concentration changes intensively, a very dense grid should be used. To enable the use of a large grid, Miranda et al. [198] applied a simple natural logarithmic variable transformation, a procedure described earlier by Zidney et al. [204], in the solute transport equation attenuating the concentration derivatives inside the boundary layer. Other studies [205,206] refer to the use of CFD to model concentration polarization in the fluid phase adjacent to the membrane without taking into account the selective permeation through the membrane fluid phase.
4.2.3. Particle accumulation
As the characteristics of the particle layer on the membrane are directly related to the hydraulic permeability, numerous algorithms (e.g. based on a simple Monte Carlo simulation [207] or a discrete stochastic model [208]) exist for simulating the particle packing. Kawakatsu et al. [209] performed a three-dimensional analysis of boundary layer formation and porosity assuming mono-dispersed particles moving according to Brownian motion. Emphasizing the non-equal sized character of accumulating particles, Yoon et al. [210] developed a three-dimensional simulation for the microfiltration of colloidal particles considering the particle back transport velocity, which was found to be dominantly controlled by particle-surface interactions. The particle transport towards the membrane surface was determined considering the ensemble of forces (lift, drag, van der Waals attraction and charge repulsion) and torques acting on the moving particle. Moreover, the flux is calculated using the concept of a resistance in series model considering pore blocking as well as layer resistance. For non-flocculating particle conditions, the latter is the major flux controlling parameter.

Chapter III
96
4.2.4. Multiphase flow
The unidirectional shear flow of highly concentrated fluid-particle suspensions, showing particle migration from regions of high shear to regions of low shear, has been investigated using a two-dimensional [211] and axi-symmetric [212] numerical model. The suspension, treated as a Newtonian fluid, is modeled using the momentum and continuity equation, whereas the particle motion is governed by a modified transport equation accounting for the effects of shear-induced particle migrations. Although the parameters of rigid neutrally buoyant particles [212] are far from matching those of the deformable red blood cells, the numerical results, in good agreement with analytical predictions of Phillips et al. [213], may contribute to a better understanding of the possible local variations of the hematocrit.
4.3. In vivo evaluation of the dialysate properties†
4.3.1. Objective
The influence of ultrafiltration and solute removal on the dialysate viscosity and density was investigated in vivo. Dialysate samples were taken at the inlet and outlet dialysate line at different time points during the dialysis session.
4.3.2. Patients and methods
4.3.2.1. Patients and dialysis strategies The study was performed in three stable female dialysis patients without native kidney function. Two-needle conventional hemodialysis was performed during 210±30 minutes using low flux dialyzers. The main characteristics of the patients and their dialysis sessions are shown in Table III-9. The composition of the dialysate was: 37mmol/L bicarbonate, 140mmol/L sodium, 107.5mmol/L chloride, 3.0mmol/L acetate, 1.5g/L glucose, 1.25mmol/L calcium, 1.0mmol/L potassium, and 0.5mmol/L magnesium. A constant dialysate flow rate of 500mL/min was applied using a Bellco Multimat dialysis machine. Blood flow of 227±25mL/min and ultrafiltration rates of 0.72±0.13L/h were obtained (Table III-9).
† The contents of this section was adapted from the report published in 2001
Assessment of the impact of bloodviscosity on the flow through a hollow fiber dialyzer S. Eloot, D. De Wachter, and P. Verdonck
This study was financially supported by Fresenius Medical Care - Bad Homburg - Germany.

Modeling of flow in a single hemodialyzer fiber
97
Table III-9: Main characteristics of the dialysis patients.
Patient
Age years
QB
mL/min BW*
kg H* %
UF L
Dialysis min
Dialyzer KUF mL/h/mmHg
1 67 200 53.7 28 3.48 240 Nipro FB 210H 15 2 67 230 35.2 34 2.17 210 Renak MA 18U 8.8 3 77 250 76.0 28 1.98 180 Fresenius F6 HPS 8.5
MEAN 70 227 55.0 30 2,54 210 - 10.8 SD 6 25 20.4 3 0,82 30 - 3.0
*pre-dialysis; blood flow QB; body weight BW; hematocrit H; ultrafiltration UF; standard deviation SD
In the water pre-treatment system of the hospital, well water is subsequently percolated over a rough sediment filter, iron filter, softener, activated carbon filter and two reverse osmosis membranes. The characteristics of the obtained reverse osmosis (RO) water correspond to the demands as described by the European Best Practice Guidelines [214]. After water distribution towards the dialysis unit, a Bellco Multimat dialysis machine prepared the dialysis fluid just before it flows through the hollow fiber dialyzer. The ultra pure water is first mixed with automatic self-made bicarbonate in order to obtain a conductivity of 3mS/cm. Finally it was mixed with industrial made acid concentrate. The mixing is based on a constant conductivity of 14mS/cm and doesn't count with constant volumes of RO water, bicarbonate and acid.
4.3.2.2. Dialysate sampling and analyses In order to investigate viscosity, dialysate was sampled (20mL) for each patient at the inlet and outlet dialysate line at the start, halfway and at the end of the dialysis session. The dialysate viscosity was measured at 37°C with a capillary Ubbelohde viscometer. The measuring technique was described in Chapter I, paragraph 5.1. Each sample was measured three times to check reproducibility.
For the density measurements, 500mL samples were needed. The number of samples was limited owing to the risk of getting the dialysis machine in leak alarm during sampling. Only one sample was taken at the inlet dialysate line, while dialysate outlet samples were taken when the patients were halfway in the dialysis treatment. The density of the dialysate was measured with a density-hydrometer-aerometer (Assistant, Germany). The measuring technique was described more in detail in Chapter I, paragraph 5.1.
4.3.3. Experimental results
The mean inlet and outlet dialysate viscosity (with standard deviation) at the start, halfway, and at the end of the dialysis session, is for the three different

Chapter III
98
patients given in Table III-10. The viscosity variation by flowing through the dialyzer is indicated as % increment.
Table III-10: Results of the viscosity measurements.
Patient Inlet viscosity mPa·s
Outlet viscosity mPa·s
Increment %
Start of dialysis 1 0.665 ± 0.003 0.684 ± 0.006 2.9 2 0.670 ± 0.004 0.680 ± 0.003 1.5 3 0.675 ± 0.006 0.679 ± 0.003 0.5
Halfway dialysis 1 0.676 ± 0.008 0.685 ± 0.006 1.3 2 0.679 ± 0.003 0.686 ± 0.001 1.1 3 0.684 ± 0.001 0.681 ± 0.003 -0.4
End of dialysis 1 0.720 ± 0.010 0.713 ± 0.005 -1.0 2 0.712 ± 0.003 0.699 ± 0.001 -1.8 3 0.695 ± 0.010 0.693 ± 0.002 -0.3
Performing three measurements with each dialysate sample resulted in a small standard deviation on the measured viscosity. By flowing through the dialyzer, dialysate viscosity is increased at the start of dialysis, while it is decreased at the discontinuation of the dialysis session. It must be remarked, however, that the changes are not significant (1-2%). The overall mean viscosity was calculated and was found 0.687±0.200mPa·s.
The evolution over the dialysis session of the inlet and outlet dialysate viscosities is presented in Fig. III-8. A significant rise (range 3.0-6.3%) in the viscosity of fresh dialysate was observed.
The results of the dialysate density measurements are shown in Table III-11. Because the densimeter was calibrated at 25°C, the samples were cooled to room temperature before registration of the density. No significant difference was found between the density of the inlet and outlet samples. Furthermore, the density of the dialysate can be considered equal for the three patients (1008g/L).

Modeling of flow in a single hemodialyzer fiber
99
Fig. III-8: Variation of dialysate viscosity during the dialysis session at the dialyzer inlet (left panel) and dialyzer outlet (right panel) for patient 1 (rhombs), patient 2 (squares), and patient 3
(triangles)
Table III-11: Results of the density measurements.
Dialyzer inlet Dialyzer outlet Density
(g/L) Temperature
(°C) Patient Density
(g/L) Temperature
(°C) 1 1008 29.5 2 1009 26.0 1008 24.5 3 1008 26.5
4.3.4. Discussion
The present study aimed at investigating whether the mass transport in the dialyzer influences the dialysate viscosity and density properties. Therefore, dialysate samples were taken in vivo at the inlet and outlet line, and were examined with a viscometer and densimeter, respectively.
The main conclusions of this study are: first, dialysate viscosity is only slightly influenced (1-2%) by flowing through the dialyzer; second, the viscosity of fresh dialysate increased towards the end of the dialysis session; third, dialysate density is not influenced by dialysis and can be assumed constant (1008g/L).
Hoping to find an explanation for the unexpected rise of fresh dialysate viscosity, dialysate glucose measurements were achieved at different time points during a standard dialysis day. In Fig. III-9, three different mixing procedures are presented: first, RO water mixed with industrial acid and self-made bicarbonate with an overall conductivity of 14.5mS/cm; second, RO water mixed with industrial acid and industrial bicarbonate with a resulting conductivity of 14mS/cm; and third, RO water mixed with industrial acid and industrial bicarbonate with a resulting conductivity of 14.5mS/cm. While both latter
0,66
0,67
0,68
0,69
0,7
0,71
0,72
0,73
start halfway end
time during dialysis
0,66
0,67
0,68
0,69
0,7
0,71
0,72
0,73
start halfway end
time during dialysis
visc
osity
(mP
a.s)
0,66
0,67
0,68
0,69
0,7
0,71
0,72
0,73
start halfway end
time during dialysis
0,66
0,67
0,68
0,69
0,7
0,71
0,72
0,73
start halfway end
time during dialysis
visc
osity
(mP
a.s)

Chapter III
100
mixtures can be considered constant for each conductivity value 14mS/cm (162.7±0.6mg%) and 14.5mS/cm (183.7±2.9mg%), the mixing method as used during our experiments, RO water mixed with self-made bicarbonate and industrial made acid, describes important fluctuations in glucose concentration (161.5±9.5mg%).
Because of variations in the preparation of self-made bicarbonate, the final mixing will contain variable proportions of acid and bicarbonate in order to keep the conductivity at the prescribed rate. Varying proportions of the two solutes results in varying glucose concentrations, which is an important parameter for the viscosity [215]. The increasing difference between glucose concentration in dialysate and blood can lead to higher glucose diffusion towards the blood. This phenomenon explains the decrease of dialysate viscosity (inflow versus outflow) at the end of a dialysis treatment.
Fig. III-9: Variation in time of dialysate glucose concentration (mg%) using different mixtures: industrial acid with self-made bicarbonate to 14.5mS/cm (asterisks), industrial acid with
industrial bicarbonate to 14mS/cm (triangles), and industrial acid with industrial bicarbonate to 14.5mS/cm (squares).
4.3.5. Conclusion
Dialysate viscosity shows no significant variation (1-2%) by passing through the dialyzer and has a mean value of 0.687±0.200mPa·s. Due to a non-constant volume mixing of the RO water with bicarbonate and acid, there is an evolution in the fresh dialysate viscosity during dialysis. From this respect, it is recommended for future tests to combine viscosity and glucose measurements or to use dialysis fluid prepared with industrial made solutes.
With the applied measuring technique, dialysate density was found constant (1008g/L) and not influenced by dialysis.
140
150
160
170
180
190
7:30 9:30 11:30 13:30 15:30 17:30 19:30
time (h:min)
gluc
ose
conc
entra
tion
(mg%
)

Modeling of flow in a single hemodialyzer fiber
101
4.4. In vitro evaluation of the membrane permeability†
4.4.1. Abstract
An in vitro setup has been designed to study the hydraulic permeability of hollow fiber dialyzers. Forward and reverse dialysate filtration were determined using both sterile dialyzers and samples with a protein layer settled on the membrane (Fresenius F6, F8, F60 and F80).
The ultrafiltration coefficient KUF (mL/h/mmHg) was calculated as the ratio of volumetrically flow (QUF) and transmembrane pressure (TMP) measurements. The protein layer on the membrane was induced either by recirculation of human plasma through the dialyzers (in vitro) or by a standard hemodialysis session (in vivo).
KUF is largely independent of TMP up to 600mmHg (low flux) and 60mmHg (high flux) for forward and reverse flow. In sterile dialyzers, backfiltration yields a significantly different KUF except for the F80. An in vitro induced protein layer on the membrane decreases KUF with 15-30% (forward) and 4-12% (backward) in low flux and 45-70% (forward) and 65-73% (backward) in high flux dialyzers.
4.4.2. Introduction
Hollow fiber dialyzers were originally designed as multi-pipe diffusive exchangers using low permeable membranes. They could be safely utilized without serious risks of excessive ultrafiltration [92]. High flux dialyzers, on the other hand, have the therapeutic advantage of an increased solute removal. Their open pore structure results in high rates of small molecule diffusion [93] and middle molecule diffusion and convection [93,94]. Ronco et al. [100] demonstrated the importance of high forward filtration in the proximal and backfiltration in the distal segment of the dialyzer for the removal of large molecules.
The overall water flux QUF (mL/min) [100] in a dialyzer can be written as a function of the difference in hydraulic (∆P) and oncotic pressure (∆π) between the blood and dialysate compartment:
( )∫∫ ∆∆=A
UFUF .dA.K'π-PQ Eq. III-25
† The contents of this section was published in Int J Artif Organs 2002;25(3):210-216
In vitro evaluation of the hydraulic permeability of polysulfone dialysers S. Eloot, D. De Wachter, J. Vienken, R. Pohlmeier, and P. Verdonck

Chapter III
102
Assuming the ultrafiltration coefficient of the membrane K'UF (mL/h/mmHg/m²) to be constant over the surface area A and ∆P to be identical at any point in a cross section of the dialyzer, Eq. III-25 can be simplified to:
( ) .TMPKLdx.π-P.KQ UF
LxUFUF =∆∆= ∫ Eq. III-26
With L the dialyzer length, KUF the ultrafiltration coefficient of the dialyzer (mL/h/mmHg) and TMP the transmembrane pressure (mmHg).
The ultrafiltration flow of pure water through a membrane increases linearly (proportionality factor KUF) with the average transmembrane pressure [92]. After exposure to proteins however, the diffusive transport as well as the hydraulic permeability of the membrane decreases significantly due to protein adsorption [56]. Moreover, these plasma proteins exert an oncotic pressure of 20-30mmHg opposing the applied hydrostatic pressure, but which is not responsible for the permeability decrease [30,101]. Furthermore, the ultrafiltration flow deviates from linearity for high TMP values due to concentration polarization of high molecular weight substances in the blood which are not freely filtrated through the membrane pores [101,102]. Because blood cells are 2000 times larger than pores of a high flux polysulphone membrane, one single blood cell may block several pores, reducing the effective membrane area and ultrafiltration flow. Individual variations in the hematocrit, plasma protein concentration and coagulation may lead to significant variation in the ultrafiltration flow at a given TMP. Furthermore, in vivo ultrafiltration coefficients are 10-25% lower than the values reported by manufacturers because of the used in vitro test setup and differences between the test solution and a patient's blood [92].
Backfiltration may occur whenever the local pressure drop over the membrane ( )xπ-P ∆∆ becomes negative [95]. The existence and importance of backfiltration during high flux hemodialysis have been extensively demonstrated performing hydrostatic and oncotic pressure measurements [61,96-99]. Moreover, several theoretical models have been developed, whether or not relying on extensive knowledge of the properties of blood and the dialysis membrane [216-219].
Forward and backfiltration coefficients are different in vitro and even more different in vivo because of the protein layer in the blood compartment and the structure of the membrane [100]. The main problem related to backfiltration is the bacterial contamination by liquid bicarbonate concentrate. Moreover, endotoxins may pass the dialysis membrane barrier.
In this study, the hydraulic permeability of dialyzers for both forward and reverse ultrafiltration flow is investigated in a newly built in vitro setup. Moreover, the

Modeling of flow in a single hemodialyzer fiber
103
permeability influence of a protein layer on the membrane is studied. These data are a necessary intermediate step (parameter identification) in a numerical model study where the blood, dialysate and ultrafiltration flow through a hollow fiber dialyzer will be computed.
4.4.3. Experimental method
4.4.3.1. In vitro setup To measure the forward ultrafiltration in sterile dialyzers as well as in dialyzers with a deposited protein layer, the inlet and outlet of the blood compartment were used as fluid inlet, while the inlet and outlet of the dialysate compartment were used as fluid outlet (Fig. III-10).
Fig. III-10: In vitro setup; Configuration for forward filtration with dialysis fluid;
Parallel circuit to induce an in vitro protein layer while the filtration circuit is closed.
The fluid was squeezed through the membrane by means of a roller pump (Bellco BL 760\D). A buffer chamber upstream the dialyzer served to damp the pulsatile character of the flow. Downstream the dialyzer the fluid was collected in a reservoir on a balance for mass measurement. For backfiltration measurements, the inlet and outlet connections were reversed.
4.4.3.2. Filtration fluid Reverse osmosis (RO) water from the renal unit was transported easily to the lab without changing its properties. Because of the possible precipitation of bicarbonate, the dialysis fluid was prepared just in time. It consisted of RO water, 1:27 bicarbonate and 1:35 acid (producer: Sterima n.v., distributor: Fresenius
T T
TT
buffer
dialyzer
pressure transducer
balanceplasma reservoir
dialysate reservoir
pump
T T
TT
buffer
dialyzer
pressure transducer
balanceplasma reservoir
dialysate reservoir
pump

Chapter III
104
Medical Care, Belgium). Accuracy of mixing was monitored by measuring the conductivity of the mixture (JENWAY 4200, Spectronic, UK). During the entire measurement session, the conductivity was kept constant at 14mS/cm.
4.4.3.3. Tested dialyzers We tested several types of polysulphone hollow fiber dialyzers (Fresenius F6, F8, F60 and F80). The characteristics of the dialyzers are given in Table III-12, also showing the ultrafiltration coefficients as given by the manufacturer (Fresenius Medical Care, Bad Homburg, Germany) and obtained from in vitro tests imitating the clinical setup and using a counter current flow of dialysate and blood with a specific composition.
Table III-12: Manufacturer's data for the four tested hollow fiber dialyzers.
Membrane Dialyzer Surface
m² Thickness
mm # fibers
- KUF
mL/h/mmHg F6 1.3 0.04 9 200 5.5 F8 1.8 0.04 12 300 7.5
F60 1.3 0.04 9 200 40 F80 1.8 0.04 12 300 55
In our study, both forward and backfiltration coefficients were derived for three sterile samples (identical lot number) of each dialyzer type. An in vitro protein layer was induced in two of the three samples. In addition, two clinically used dialyzers (F6 and F8) were tested to investigate the influence of in vivo induced protein adhesion.
4.4.3.4. In vitro protein layer To induce the build-up of an in vitro protein layer, the blood compartment of the dialyzer was circulated in advance with human plasma using a parallel circuit (Fig. III-10). The deep frozen human plasma was warmed to room temperature in a bain-marie. Looking at intra-dialytic metabolic reactivity of polymorphonuclear cells, a marked suppression in reactivity versus pre-dialysis was observed 15 minutes after the start of the dialysis session [220]. This down regulation of the response to complement factors can be seen especially with cuprophan, and gives an indication of the presence of a protein layer in general. Therefore, it was assumed that a protein layer is formed during the first 15 minutes of a dialysis session and the plasma (800-1000mL) was recirculated in the in vitro setup for 20 minutes at a flow rate of about 250mL/min. The measurements with an in vitro protein layer were started with the blood compartment filled with plasma.

Modeling of flow in a single hemodialyzer fiber
105
4.4.3.5. In vivo protein layer The influence of an in vivo protein layer was tested with dialyzer samples (F6 and F8), which were used during a standard dialysis therapy of about four hours. They were flushed and filled with physiological water after the dialysis session in preparation to the in vitro experiments.
4.4.3.6. Pressure and flow measurements The pressure was measured at both inlet and both outlets with fluid filled pressure transducers (Ohmeda, Gent, Belgium) calibrated prior to each test series. Additionally, a differential pressure transducer (Fuji Electrics FCX, Coulton, UK) was used as an independent measurement for validation. The flow was measured gravimetrically (mass change on the balance per time interval).
4.4.3.7. Test procedure The measurements were done for a cycle of increasing and decreasing ultrafiltration rates. Once a constant ultrafiltration rate was achieved, the four pressures (at blood inlet PBi and outlet PBo and dialysate inlet PDi and outlet PDo) were registered during 120s to obtain a time-averaged transmembrane pressure, while the mass flow rate ∆M/∆t was measured during about 300s with an electronic balance (accuracy 1g) and a chronometer. To calculate the volume, a density value ρ of 1008g/L for dialysate fluid (measured at room temperature with a density-hydrometer-aerometer) was used. The mean transmembrane pressure TMP (mmHg) was derived from the recorded values over an integer number of pump revolutions.
4.4.3.8. Calculation of ultrafiltration and permeability Ultrafiltration flow QUF (mL/min) and hydraulic pressure difference ∆P (mmHg) were calculated by standard formulae:
∆tρ
∆MQUF ⋅= Eq. III-27
πTMP2
PP2
PPP DoDiBoBi ∆+=
+−
+=∆ Eq. III-28
The ultrafiltration coefficient KUF (mL/h/mmHg) and the permeability k (nm²/s/Pa), using the membrane thickness d (mm) and total membrane surface A (m²), were defined as :
TMPQK UF
UF = (device characteristic) Eq. III-29

Chapter III
106
AdKk UF ⋅= (membrane characteristic) Eq. III-30
Plotting the ultrafiltration flow QUF (mL/min) as a function of transmembrane pressure TMP (mmHg), a mean value for the ultrafiltration coefficient KUF (mL/h/mmHg) was derived as the slope of the fitted regression line (Fig. III-11). The permeability k, calculated from the KUF value, is a measure to distinguish between low and high flux membranes and was expected to be equal for dialyzers with a similar membrane type.
Fig. III-11: Forward ultrafiltration flow QUF as a function of TMP for tests without and with an in vitro induced protein layer in a F80 dialyzer; -ο- sterile dialyzer (y=2.73x+0.02; R²=0.999); -×- ∆P-QUF for dialyzer with in vitro protein layer (y=1.04x-29.13; R²=0.948; oncotic pressure
∆π=28mmHg); -+- TMP-QUF for dialyzer with in vitro protein layer (y=1.04x; R²=0.948).
The oncotic pressure ∆π was estimated from the x-intercept of the ∆P-QUF curve (Fig. III-11) in the presence of plasma proteins.
4.4.3.9. Statistical Analysis A general linear model (GLM) multivariate procedure was used for simultaneous assessment of the influence of the hydrostatic and measuring error (intercept) and ultrafiltration coefficient KUF (slope) in the experimental model. The GLM multivariate procedure provides regression analysis and analysis of variance for multiple dependent variables by one or more factor variables. An F-value was calculated to determine the overall significance of the model. Moreover, for each term, the standard error, t-value and significance were estimated.
The data points of different measurement series were combined if no significant difference was found for the ultrafiltration coefficient KUF (slope) as obtained from one series. Moreover, different measurement conditions, as the performance of forward versus backfiltration, were compared considering the KUF value.
0
20
40
60
0 20 40 60 80
∆P or TMP (mmHg)
QU
F (m
l/min
)Q
UF
(mL/
min
)
0
20
40
60
0 20 40 60 80
∆P or TMP (mmHg)
QU
F (m
l/min
)Q
UF
(mL/
min
)

Modeling of flow in a single hemodialyzer fiber
107
4.4.4. Results
Mean values and standard deviations of the forward ultrafiltration coefficient KUF (mL/h/mmHg), the permeability of the sterile membrane k (nm²/s/Pa), the x-intercept (mmHg) and the correlation R² are given in Table III-13 for all samples of the different hollow fiber dialyzers. Backfiltration yields a different (P<0.05) permeability coefficient compared with forward filtration except for the F80. For the F6 and F60, reverse filtration is 6-7% higher, whereas in the F8 and F80, it results in a 3-9% lower ultrafiltration rate (Table III-14).
Table III-13: Ultrafiltration coefficient and membrane permeability in sterile dialyzers using three samples.
Type n -
KUF mL/h/mmHg
k nm²/s/Pa
x-intercept mmHg
R²
F6 18 5.86 ± 0.07 376 ± 4 -0.35 ± 3.65 0.997 F8 19 7.53 ± 0.20 349 ± 9 -1.50 ± 6.55 0.988
F60 23 144 ± 2 9231 ± 128 -1.01 ± 0.15 0.997 F80 17 166 ± 5 7685 ± 231 -0.19 ± 0.31 0.987 number of data points n; ultrafiltration coefficient KUF; membrane permeability k;
correlation R²
An in vitro induced protein layer on the membrane (maximum 2 samples) decreases the permeability by 15-30% (forward) and 3.9-12% (backward) in low flux and 58-60% (forward) and 65-73% (backward) in high flux dialyzers (Table III-15). For the F80, Fig. III-11 shows the reduction in slope of the ∆P-QUF plot of a dialyzer in which an in vitro protein layer was induced. After deriving the oncotic pressure from the x-intercept of this curve, a TMP-QUF plot is drawn.
Table III-14: Forward and backward ultrafiltration coefficient in sterile dialyzers using three samples.
Type Forward filtration Backfiltration Reduction %
Significance P
KUF mL/h/mmHg
n -
KUF mL/h/mmHg
n -
F6 5.86 ± 0.07 18 6.28 ± 0.04 18 -7.2 < 0.001 F8 7.53 ± 0.20 19 6.87 ± 0.19 19 8.8 0.022
F60 144 ± 2 23 153 ± 2 18 -6.3 0.003 F80 166 ± 5 17 160 ± 6 19 3.6 0.464
number of data points n; ultrafiltration coefficient KUF; significance level P
Two dialyzers with in vivo induced proteins on the membrane were 14% (F6) - 24% (F8) more permeable compared with the corresponding test samples in which an in vitro protein layer was performed. Because of the difficulty of

Chapter III
108
reproducing a protein layer in different dialyzer samples, the oncotic pressures were calculated separately for each single test series. These oncotic pressures are much higher in dialyzers with an in vitro induced protein layer (9-45mmHg) than in those with an in vivo protein layer (4 and 12mmHg) for forward filtration (Table III-16).
Table III-15: Forward and backward ultrafiltration coefficient for dialyzers without versus with a protein layer.
Type Forward filtration Backfiltration KUF sterile KUF proteins Reduction KUF sterile KUF proteins Reduction mL/h/mmHg mL/h/mmHg % mL/h/mmHg mL/h/mmHg %
F6 6.05 ± 0.02 5.13 ± 0.02 15 5.69 ± 0.01 5.47 ± 0.11 3.9 F8 8.03 ± 0.15 5.61 ± 0.06 30 7.29 ± 0.03 6.44 ± 0.04 12
F60 144 ± 2 57.0 ± 1.0 60 153 ± 2 53.5 ± 3.2 65 F80 163 ± 2 69.0 ± 12 58 176 ± 3 48.0 ± 7.1 73
For the low flux F6 and F8, one sample was used (5 data points); for the high flux F60 and F80, two samples were used (15-20 data points).
Table III-16: In vitro fitted oncotic pressures (mmHg) for both forward and backfiltration.
Type In vitro oncotic pressures Forward
mmHg Backward
mmHg F6 9 - 36 17 F8 35 - 45 16
F60 17 - 35 2 F80 16 - 28 8
4.4.5. Discussion
In contrast with experiments published in literature in which the hydraulic permeability [221] and the influence of proteins [56] is investigated in an ex vivo setup using the clinical flow directions, we built a new in vitro setup in order to quantify the water permeability of the membrane as its real physical characteristic with greater accuracy.
4.4.5.1. Sterile dialyzers The forward and reverse ultrafiltration coefficient KUF is considered independent of TMP up to 600mmHg for low flux and 60mmHg for high flux polysulphone dialyzers. For the low TMP range in high flux dialyzers, the small deviation from constant is due to the greater influence of the measuring error rather than the existence of hemoconcentration.

Modeling of flow in a single hemodialyzer fiber
109
For the F6, the in vitro KUF exceeds the value given by the manufacturer by 6%, whereas the results for the F8 are comparable with the value given by the manufacturer (discrepancy only 0.4%). The KUF values for F60 and F80 differ significantly from the values given by the manufacturer (66-72%) (Table III-12 and Table III-13). This discrepancy is expected because of differences in setup. Note, however, that our results for the F60 are almost similar (discrepancy 9%) to the results measured in an ex vivo setup [56] in which sodium chloride was used as blood substitute.
Although a similar membrane permeability k is expected for the low respectively the high flux dialyzers, a slight difference can be observed (Table III-13). It seems that other dialyzer characteristics like geometry and manifold also influence the in vitro measured overall ultrafiltration coefficient.
For the F6, F8 and F60 we found a significant difference between forward and reverse ultrafiltration flow presumably due to the asymmetrical structure of polysulphone membranes. In these three dialyzer types backfiltration renders a significant higher filtration except for the F8 (Table III-14).
4.4.5.2. Protein layer The ultrafiltration coefficient of the low flux hollow fiber dialyzers in which an in vitro protein layer has been formed can be considered constant within normally encountered TMP range. The decrease of the forward permeability of the F6 results in KUF value, which is more comparable to the value given by Fresenius (Table III-12 and Table III-15). In the ex vivo study of Ronco et al. [221], in which the influence of a protein layer was rather limited, the measured ultrafiltration exceeds our findings by 5%. For the high flux hollow fiber dialyzers, the ultrafiltration is strongly decreased in presence of an in vitro protein layer both for forward and reverse flow. However, the results for the F60 as well as for the F80 show an ultrafiltration coefficient, which is still significantly higher than the value given by the manufacturer (20-30%). The plasma ultrafiltration coefficient found by Bosch et al. [56] in their ex vivo setup shows a permeability reduction of almost 68% compared with their sodium chloride measurements. This reduction is quite similar to what we measure after inducing an in vitro protein layer on the dialyzer membrane. Comparing forward with backfiltration (Table III-15), higher permeabilities are registered for backfiltration for low flux dialyzers due to the washing out of the proteins from the blood compartment. The influence of in vivo deposited proteins is less significant than the effect of an in vitro formed protein layer. We speculate that this is due to the fact that the clinically used samples were flushed with a

Chapter III
110
physiological solution before testing. A small increase in permeability can also be observed in the ex vivo experiments of Bosch et al. when sodium chloride flows in the blood compartment after the dialyzer had first been exposed to plasma [56]. On the other hand, the oncotic pressure still present in our samples with an in vivo induced protein layer is absent in their ex vivo study.
Although the same procedure was performed to induce the in vitro protein layer, accurate reproduction of such a layer appears extremely difficult due to the recirculation of a mixture of plasma of several non-anemic donors. As a consequence, the forward oncotic pressures (28±21mmHg for low flux and 20±9mmHg for high flux dialyzers) exhibit a large standard deviation.
Overall, a protein layer on the membrane is the main limiting factor with respect to the overall permeability.
4.4.6. Conclusion
The presented in vitro setup allows quantifying the hydraulic permeability of hollow fiber dialyzers with a different and more specific method than in previous ex vivo studies [56]. For sterile as well as dialyzers with an induced protein layer, the ultrafiltration coefficient KUF is constant over a TMP range up to 600mmHg for low flux and up to 60mmHg for high flux dialyzers. In sterile dialyzers, backfiltration deviates from forward filtration up to 9%. In the F6 and F60, the reverse permeability is higher, whereas in the F8, it is lower than the forward permeability. An in vitro protein layer on the membrane induces an important reduction of membrane permeability. The permeability values presented in this study differ from the values provided by the manufacturer due to the fact that they use a setup closer resembling to the actual clinical setting. We used a specific setup, which yields the hydraulic permeability for aqueous solutions. These permeabilities are suitable for a numerical model to simulate forward and backfiltration.
4.4.7. Acknowledgements
The present study was supported by Fresenius Medical Care (Germany). The authors also wish to express their gratefulness to the medical staff of the renal unit of the hospital 'AZ Zusters van Barmhartigheid' (Ronse) for supplying the filtration fluid and the clinically used dialyzer samples, to the Blood Transfusion Centre (Red Cross Belgium) for supplying plasma pockets, as well as to our colleague P Segers for his review.

Modeling of flow in a single hemodialyzer fiber
111
4.5. Influence of dialyzer membrane type on membrane permeability
4.5.1. Objective and methods
The permeability characteristics of different membrane types were investigated with the previous described in vitro setup (paragraph 4.4.3.1) and using bicarbonate dialysate as filtration fluid. The studied membrane types (Table III-17) were modified cellulose membranes (saponified modified cellulose and cellulose triacetate) and synthetic membranes (polysulphone and acrylonitrile). The morphological differences between the different membrane types are illustrated in Fig. III-12.
Table III-17: Manufacturer's data for the different tested hollow fiber dialyzers.
Membrane Dialyzer Type Surface
m² Thickness
mm KUF
mL/h/mmHg Spiraflo NC 2085 G SMC 1.95 0.0085 6.4
Sureflux 210E CTA 2.1 0.015 20 FX60 PSu 1.4 0.030 40 F70 S PSu 1.6 0.040 50
AN 69 Filtral 20 AN 2.05 0.050 62 ultrafiltration coefficient KUF; saponified modified cellulose SMC; cellulose
triacetate CTA; polysulphone PSu; acrylonitrile AN
Fig. III-12: Morphological differences between different membrane types [123].
Cellulose membrane Synthetic membraneCellulose membrane Synthetic membraneCellulose membrane Synthetic membraneCellulose membrane Synthetic membrane

Chapter III
112
4.5.2. Results
Mean values and standard deviations of the forward ultrafiltration coefficient KUF (mL/h/mmHg), the permeability of the sterile membrane k (nm²/s/Pa), the x-intercept (mmHg) and the correlation R² are given in Table III-18 for the dialyzers under study. One sample of each dialyzer was evaluated, except for the FX60 were two samples were tested.
Table III-18: Ultrafiltration coefficient, membrane permeability, and x-inercept in sterile dialyzers.
Dialyzer n -
KUF mL/h/mmHg
k nm²/s/Pa
x-intercept mmHg
R²
Spiraflo NC 2085 G 8 6.36 ± 0.58 57.8 ± 5.3 7.23 ± 5.05 0.944 Sureflux 210E 9 16.2 ± 0.5 241 ± 8 7.60 ± 2.80 0.993
FX60 30 131 ± 3 5852 ± 139 0.77 ± 0.39 0.985 F70 S 10 122 ± 5 6331 ± 251 0.28 ± 0.35 0.988
AN 69 Filtral 20 10 54 ± 3 2728 ± 128 2.86 ± 1.82 0.983 number of data points n; ultrafiltration coefficient KUF; membrane permeability k; correlation R²
The results for the Spiraflo are comparable with the KUF value given by the manufacturer (discrepancy only 0.6%), while the manufacturer’s data exceeds our results for the Sureflux (by 24%) and the AN69 (by 15%). The KUF values for the FX60 and F70S are significantly higher than the values given by the manufacturer (69 and 59%, respectively) (Table III-17 and Table III-18).
Accounting for the membrane thickness and surface area, the membrane permeability k was found not significantly different (P=0.484) for both polysulphone membranes in the FX60 and F70S.
Backfiltration yields a significant larger ultrafiltration coefficient (16%) compared with forward filtration for the FX60 (Table III-19). No significant differences were however found between forward and backfiltration for the Spiraflo (P=0.470), the Sureflux (P=0.306), the F70S (P=0.092), and the AN69 (P=0.326).
An in vitro induced protein layer on the membrane decreases the forward ultrafiltration coefficient by 14% (Spiraflo), 51% (FX60), 22% (F70S), and 41% (AN69) (Table III-20). The protein layer hampers backfiltration, resulting in a decrease of KUF by 6% (Spiraflo), 39% (FX60), 51% (F70S), and 18% (AN69) compared to sterile dialyzers. In the Sureflux, however, no significant decrease in forward (P=0.717) and reverse (P=0.647) ultrafiltration was observed after protein deposition at the membrane.

Modeling of flow in a single hemodialyzer fiber
113
Table III-19: Forward and reverse ultrafiltration coefficient in sterile dialyzers
Type Forward filtration Backfiltration Reduction P KUF
mL/h/mmHg n -
KUF mL/h/mmHg
n -
%
Spiraflo NC 2085 G 6.36 ± 0.58 8 5.82 ± 0.45 10 8.5 0.470Sureflux 210E 16.2 ± 0.5 9 15.3 ± 0.6 9 5.6 0.306
FX60 131 ± 3 30 152 ± 8 20 -16.0 0.006F70 S 122 ± 5 10 112 ± 7 8 5.9 0.092
AN 69 Filtral 20 54 ± 3 10 56 ± 1 10 3.7 0.326number of data points n; ultrafiltration coefficient KUF; significance P
Table III-20: Forward and reverse ultrafiltration coefficient for dialyzers without versus with a protein layer.
Type Forward filtration Backfiltration KUF sterile KUF proteins Red KUF sterile KUF proteins Red mL/h/mmHg mL/h/mmHg % mL/h/mmHg mL/h/mmHg %
Spiraflo NC 6.36 ± 0.58 5.47 ± 0.31 14 5.82 ± 0.45 5.47 ± 0.31 6 Sureflux 16.2 ± 0.5 15.8 ± 0.3 2 15.3 ± 0.6 15.5 ± 0.3 -1
FX60 131 ± 3 64 ± 2 51 152 ± 8 92 ± 3 39 F70 S 122 ± 5 93 ± 6 22 112 ± 7 55 ± 4 51 AN 69 54 ± 3 32 ± 2 41 56 ± 1 46 ± 3 18
ultrafiltration coefficient KUF ; reduction Red
4.5.3. Discussion
The present study was set out to evaluate the permeability differences between several types of dialyzer membranes. Furthermore, the influence of a protein layer on the overall permeability was investigated. Therefore, in vitro permeability measurements were performed in sterile dialyzers and in dialyzers in which a protein layer was induced on the membrane.
The main conclusions can be summarized as follows: first, the forward ultrafiltration coefficients differ from the value reported by the manufacturer, except for the Spiraflo; second, backfiltration increases significantly the ultrafiltration coefficient for the asymmetrical polysulphone membrane of the FX60; third, with the cellulose triacetate membrane (Sureflux), protein deposition on the membrane does not alter permeability; and fourth, the decrease of membrane permeability caused by a protein layer is most expressed with the synthetic membranes (PSu and AN dialyzers).

Chapter III
114
As found previously for low flux dialyzers (paragraph 4.4.4), the backfiltration coefficient for the low flux Spiraflo dialyzer with a protein layer is not much decreased (6%) compared to the sterile dialyzer. Furthermore, the mid flux Sureflux (KUF=20mL/h/mmHg) showed no variation at all for the backfiltration coefficient after deposition of a protein layer. This confirms the phenomenon that plasma proteins are washed out with backfiltration.
It was shown that dialyzers with hydroxyl groups on the membrane surface (e.g. regenerated or unmodified cellulose) are the strongest complement activators due to binding of complement factor (C3b). Partial substitution of these hydroxyl groups by either acetyl groups (CTA Sureflux) or benzyl groups (SMC Spiraflo) results in a considerable reduction of complement activation. Moreover, an even lower increase in concentration of intra-dialytic circulating complement factors is observed consecutively in the AN69 and polysulphone dialyzer membrane types. The deposition of a protein layer on the membrane was found to suppress complement activation. The present study illustrates a low influence of a protein layer on the low flux cellulose membranes, while protein adsorption was found more pronounced in the biocompatible high flux synthetic membranes. This phenomenon is not only due to the pore structure of the membrane (i.e. difference in ultrafiltration coefficient), because the previous investigated low flux polysulphone dialyzers (paragraph 4.4.4), also showed a higher influence on permeability by protein adsorption.
It was not unexpected that differences were found between our results and the ultrafiltration coefficients as measured by the manufacturers. While the latter determined KUF values using anemic blood or blood-like fluids with counter current flows, we determined the water permeability of the membrane as its physical property not influenced by any flow setting.
It should be remarked however, that our results for the tests with a protein layer on the membrane might differ from reality, because inducing in vitro a protein layer on the membrane does not represent the clinical situation. When the patient’s blood is exposed to the membrane, a rapid adsorption of proteins occurs within seconds. The initial protein deposition takes place in a specific sequence (i.e. albumin, immunoglobulin, fibrinogen, fibronectin, factor XII, and high molecular weight kininogen). The protein adsorption is however followed by desorption caused by the subsequent arrival of proteins with higher affinity. Instead of this active process of adsorption and desorption, the in vitro induced protein layer must be considered as a static layer and might result in deviating permeability properties compared to reality.

Modeling of flow in a single hemodialyzer fiber
115
4.5.4. Conclusion
The permeability of different membrane types was investigated in vitro. The obtained ultrafiltration coefficients differ from the values reported by the manufacturers due to the different study objective and experimental setup.
Moreover, protein adsorption on the membrane results in diverging influences on membrane permeability when considering different types of membranes. Permeability decrease was more pronounced in the biocompatible synthetic membranes compared to the modified cellulose membranes.
4.6. Influence of the filtration fluid on membrane permeability†
4.6.1. Objective and methods
A crossover study was performed to investigate the influence of the filtration fluid used in the permeability measurements. The hydraulic permeability of the polysulphone F80 dialyzer (Fresenius Medical Care, Bad Homburg, Germany) was derived using either RO water or bicarbonate dialysis fluid as filtration fluid. The tests were performed for forward (4 tests) and backfiltration (2 tests) in one sterile dialyzer sample. The in vitro setup as described in paragraph 4.4.3.1 was used.
4.6.2. Results
For each test series, mean values and standard deviations of the ultrafiltration coefficient KUF (mL/h/mmHg), the permeability of the sterile membrane k (nm²/s/Pa), the x-intercept (mmHg) and the correlation R² are given in Table III-21 for forward and backfiltration using either RO water or dialysis fluid.
The mean ultrafiltration coefficient with RO water and dialysate is 195±1 and 188±1mL/h/mmHg, respectively, for forward filtration, and 196±1 and 188±2mL/h/mmHg, respectively, for backfiltration.
† The contents of this section was adapted from the report published in 2002
Assessment of flow and particle transport through a hollow fiber dialyzer S. Eloot, D. De Wachter, and P. Verdonck
This study was financially supported by Fresenius Medical Care – Bad Homburg – Germany

Chapter III
116
Table III-21: Permeability characteristics using RO water and dialysate.
Test No.
n -
Fluid Filtration KUF mL/h/mmHg
k nm²/s/Pa
x-intercept mmHg
R²
1 10 RO Forward 194 ± 1 8982 ± 27 0.04 ± 0.03 0.99 2 10 Dialysate Forward 189 ± 1 8750 ± 42 0.08 ± 0.09 0.99 3 8 RO Forward 195 ± 1 9045 ± 42 0.17 ± 0.06 0.99 4 9 Dialysate Forward 187 ± 1 8670 ± 15 0.13 ± 0.02 0.99 5 9 RO Reverse 196 ± 1 9078 ± 22 0.02 ± 0.03 0.99 6 10 Dialysate Reverse 188 ± 2 8688 ± 105 0.18 ± 0.15 0.99
number of data points n; ultrafiltration coefficient KUF; permeability k; correlation R²
A significant difference was found for the forward (<0.001) and reverse (P=0.003) ultrafiltration coefficient derived from measurements using RO water and dialysate. For one type of filtration fluid, no significant differences could be observed between the successive test series with RO water (P=0.341) and with dialysate (P=0.326). This implies that, due to the crossover protocol of the tests, the filtration fluid has no irreversible influence on the membrane characteristics. As a consequence, the permeability difference is owing to the type of filtration fluid.
Finally, no significant difference was found between the forward and reverse ultrafiltration coefficient in the F80 dialyzer with RO water (P=0.198) and dialysate (P=0.771).
4.6.3. Discussion
In the present study, the influence of the filtration fluid on the membrane permeability of a high flux polysulphone dialyzer (F80) was investigated in a crossover study. A significant difference was found for the forward as well as backfiltration coefficient when testing with RO water or dialysate.
A possible explanation for the influence of the filtration fluid on membrane permeability might be the difference in hydration volume of protons. Small protons like hydrogen (H+) induce a higher surrounding electric field such that more water molecules are dragged together with the protons during membrane flow. Large protons like sodium and bicarbonate, as present in dialysis fluid, are characterized by a smaller hydration volume, which results in a lower permeability.
As no difference was found between the forward and reverse ultrafiltration coefficients for the F80, the present results are in good agreement with previous measurements (paragraph 4.4.4). It should be remarked, however, that the

Modeling of flow in a single hemodialyzer fiber
117
absolute values found previously for the ultrafiltration coefficient are significantly smaller than those described here for forward (P=0.037) and backfiltration (P=0.021). One of the possible reasons might be found in a different proportional mixing while preparing the dialysate solution. In our experiments, the final mixing was only controlled for conductivity and not for proportionality. As described earlier (paragraph 4.3), the mixing quantity and quality can result in different characteristics, such as viscosity. A bicarbonate concentration deviating from prescribed, changes the proton concentration and, as a consequence, might be responsible for a different permeability.
4.6.4. Conclusion
The choice of the filtration fluid used in the in vitro permeability tests (either reverse osmosis water or dialysate) affects the membrane permeability results in hollow fiber dialyzers.
Because the composition of the filtration fluid in a clinical dialysis is not a priori known, care should be taken when defining the membrane permeability. For the numerical simulations, the results of the in vitro test with dialysate as filtration fluid were applied. Therefore, the properties of the filtration fluid were defined equal to those of dialysate (i.e. density 1008g/L and viscosity 0.687mPa·s).
4.7. Numerical model for blood, dialysate and ultrafiltration flow†
4.7.1. Abstract
A three-dimensional finite volume model of the blood-dialysate interface over the complete length of the dialyzer is developed. Different equations govern dialyzer flow and pressure distribution (Navier-Stokes) and radial transport (Darcy). Blood is modeled as a non-Newtonian fluid with a viscosity varying in radial and axial direction determined by the local hematocrit, the diameter of the capillaries and the local shear rate. The dialysate flow is assumed as an incompressible, isothermal laminar Newtonian flow with a constant viscosity. The permeability characteristics of the membrane are calculated from laboratory tests for forward and backfiltration. The oncotic pressure induced by the plasma proteins is implemented as well as the reduction of the overall permeability
† The contents of this section was published in Artif Organs 2002;26(7):590-599
Computational flow modeling in hollow-fiber dialyzers S. Eloot, D. De Wachter, I. Van Tricht, and P. Verdonck

Chapter III
118
caused by the adhesion of proteins to the membrane. From the calculated pressure distribution, the impact of flow, hematocrit and capillary dimensions on the presence and localization of backfiltration can be investigated.
4.7.2. Numerical model
A three-dimensional finite volume microscopic model of the blood-dialysate interface over the complete length of a dialyzer is developed (Fluent 5.4 - Sheffield UK). Assuming the fibers spaced in a hexagonal lattice and based on symmetry, a twelfth part of one single fiber can be isolated (Fig. III-13). The parameter settings of the three-dimensional module (Fig. III-14) were assessed for a high flux polysulphone Fresenius F60, characterized by a fiber diameter of 200µm, membrane thickness of 40µm (1µm inner layer and 39µm bulk layer) and dialysate compartment dimensions (maximum radius 230µm) calculated from fiber density. The membrane module has an active length of 230mm while in and outlet tubes (each 12.5mm long) are foreseen in both fluid compartments simulating the header and potting region. For the implementation in the numerical model, properties of the three compartments, blood, dialysate and the semi-permeable membrane in between, are derived from in vitro and in vivo tests.
Fig. III-13: Hexagonal lattice of the hollow fiber dialyzer (cross section).
4.7.2.1. Membrane permeability The permeability characteristics of the membrane are obtained from laboratory tests in which a dialysate flow was forced through the membrane. The ultrafiltration coefficient (m³/s/Pa) is calculated from flow (m³/s) and transmembrane pressure (Pa) measurements. Furthermore, the hydraulic membrane permeability (m²/s/Pa) is derived from the ultrafiltration coefficient, membrane surface and thickness. The tests are done for forward and

Modeling of flow in a single hemodialyzer fiber
119
backfiltration using sterile dialyzers (overall permeability 7950nm²/s/Pa) as well as samples in which a protein layer is induced on the membrane (overall permeability 2400nm²/s/Pa) simulating a clinical session [142]. The permeabilities of a sterile inner layer and bulk layer are implemented as a series of two resistances, whereas the influence of a protein layer on the overall membrane permeability is incorporated as a higher resistive inner layer.
Fig. III-14: 3D visualization of an isolated unit, showing blood, membrane, and dialysate compartment.
4.7.2.2. Dialysate fluid properties From bicarbonate dialysate samples taken in vivo from the supply and the drain of the dialyzer, dynamic viscosity and density were determined using a capillary Ubbelohde viscometer and a density-hydrometer-aerometer, respectively. As it was found that both properties are not influenced by the dialysis session, the dialysate flow is assumed as an incompressible, isothermal laminar Newtonian flow with a constant viscosity (0.687mPa·s) and density (1008kg/m³).
4.7.2.3. Non-Newtonian blood behavior An extended literature review was needed to perform an accurate modeling of the non-Newtonian blood flow. While plasma or another Newtonian fluid is used in the blood compartment for the majority of the models described in literature [222,223], the presented model accounts for the influence on viscosity of the local hematocrit, the small diameter of the capillaries and the local shear rate.
The shear thinning behavior as well as the dependence of the blood viscosity µ on plasma viscosity µp and the local hematocrit H, is described by Quemada [63]:
( )2
p
Hk211
µµ
⋅⋅−= Eq. III-31
Parameter k is function of the intrinsic viscosities k0(H), characterizing the red blood cell aggregation at zero shear stress, k∝(H), describing the orientation and
Qdialysate_out Pdialysate_out Quf >0
Quf <0Qblood_in Pblood_in
Qdialysate_in Pdialysate_in
Qblood_out
Pblood_out
TMP
Blood capillary
Membrane
Dialysate
z = 0.02m z = 0.23m

Chapter III
120
deformation of red blood cells at important shear stress, and the shear rate γ. For a fixed hematocrit, viscosity decreases with increasing shear rate, whereas for a fixed shear rate, viscosity increases with hematocrit.
Blood flowing through small capillaries exhibits a redistribution of the red blood cells in such a way that a plasma-skimming layer can be observed near the wall while red blood cells are concentrated in the centre. Fahraeus and Lindqvist [147] described the effect of this non-uniform cell distribution on the flow by defining an apparent blood viscosity for use in the Haegen-Poiseuille equation. The radial variation of the hematocrit was deduced by Lerche et al. [66] using a parameter n, which describes the degree of plasma skimming: non-uniformity of cell distribution increases with decreasing n. This parameter is determined iteratively as a function of the hematocrit using an axi-symmetrical numerical model such that the obtained viscosity for flow in a small tube matches literature results of the apparent viscosity (Fig. III-15).
Since plasma density (1030kg/m³) differs from the density of platelets and blood cells (1090kg/m³), the density of blood ρblood varies with the local hematocrit H:
H1090H)(11030ρ blood ⋅+−⋅= Eq. III-32
Fig. III-15: The Lerche parameter n as a function of hematocrit
4.7.2.4. Governing equations In the blood and dialysate compartment, conservation of mass and momentum are described by the three-dimensional steady incompressible Navier-Stokes and continuity equations, using the local and constant viscosity and density for blood and dialysate, respectively. The transmembrane water transport, function of the membrane permeability and the local oncotic pressure, is described by the Darcy equation for porous media.
Hematocrit (-)0,20 0,25 0,30 0,35 0,40 0,45 0,50 0,55
para
met
er n
(-)
0
50
100
150
200
250
300
350
400
n=17.3+11.1/(H-0.206)

Modeling of flow in a single hemodialyzer fiber
121
4.7.2.5. Boundary conditions In the blood and dialysate compartment, a constant inlet velocity is given, while outlet conditions can be specified either as outlet pressures or as a flow percentage distribution in both compartments to apply the desired ultrafiltration flow. Oncotic pressure, which is exerted by the plasma proteins and opposes the hydrostatic transmembrane pressure, is implemented as a discontinuous pressure drop at the skin-bulk interface. Moreover, as hemoconcentration takes place in axial direction, the oncotic pressure is varying with hematocrit. Because the smallest blood-membrane-dialysate entity was isolated, all other boundaries are symmetry planes.
4.7.3. Results
Assuming a constant blood and dialysate inlet flow of 250 and 500mL/min, respectively, outlet pressures of 10kPa and 5Pa respectively and initial oncotic pressure of 3.33kPa, the pressure distribution renders an overall ultrafiltration flow of 45mL/min while no backfiltration occurs (Fig. III-16 and Fig. III-18).
Fig. III-16: Radial pressure distribution at blood inlet (x) and outlet (+) section
As blood, with an initial viscosity of 3mPa·s, flows through the dialyzer, the water removal causes hemoconcentration. As a consequence, the hematocrit shows an axial variation from its initial value 0.30 at blood entrance up to 0.42 at the outlet, resulting in a mean viscosity increase from 3mPa·s to 4.5mPa·s. The plug flow of blood cells at the axis (maximum viscosity 7.5-11.8mPa·s) and the
Blood Membrane Dialysate
× z = 0.02m
+ z = 0.23m
1.6 E+04
1.2 E+04
1.4 E+04
8.0 E+03
1.0 E+04
6.0 E+03
4.0 E+03
2.0 E+03
Pres
sure
(Pa)
Radial distance (m)2.0 E-05 1.0 E-046.0 E-05 1.4 E-04 1.8 E-04
Blood Membrane Dialysate
× z = 0.02m
+ z = 0.23m
1.6 E+04
1.2 E+04
1.4 E+04
8.0 E+03
1.0 E+04
6.0 E+03
4.0 E+03
2.0 E+03
Pres
sure
(Pa)
Radial distance (m)2.0 E-05 1.0 E-046.0 E-05 1.4 E-04 1.8 E-04

Chapter III
122
plasma layer near the membrane wall (viscosity 1.3mPa·s) demonstrates the radial variation of the blood viscosity (Fig. III-17).
The oncotic pressure, varying with the local hematocrit, increases from its initial value 3.33kPa up to 4.20kPa. The ultrafiltration flow is decreased with 28% because of the oncotic pressure opposing the hydraulic driving pressure.
The shear stress, zero at blood and dialysate axes, is maximal at the blood-membrane interface decreasing from 0.97Pa at blood inlet to 0.78Pa at the outlet, while it is slightly increasing at the dialysate-membrane interface from 0.23 up to 0.26Pa at dialysate outlet.
Fig. III-17: Radial viscosity distribution at blood inlet (x) and outlet (+) section
Due to ultrafiltration, one may expect a deviation from the linear flow-pressure drop profile described by Haegen-Poiseuille as well as from the parabolic velocity profile. Nevertheless, for an ultrafiltration flow of 45mL/min in a dialyzer module of 230mm, the pressure distribution in the blood compartment deviates only slightly from linearity (maximum 0.28-0.33% at blood inlet and outlet respectively) (Fig. III-18), while the same is true for the parabolic velocity profile (R² = 0.997-0.993 at blood inlet and outlet respectively) (Fig. III-19).
Blood Membrane Dialysate
12.0
8.0
10.0
4.0
6.0
2.0
Vis
cosi
ty(m
Pa.s)
Radial distance (m)2.0 E-05 1.0 E-046.0 E-05 1.4 E-04 1.8 E-04
× z = 0.02m
+ z = 0.23m
Blood Membrane Dialysate
12.0
8.0
10.0
4.0
6.0
2.0
Vis
cosi
ty(m
Pa.s)
Radial distance (m)2.0 E-05 1.0 E-046.0 E-05 1.4 E-04 1.8 E-04
× z = 0.02m
+ z = 0.23m

Modeling of flow in a single hemodialyzer fiber
123
Fig. III-18: Axial pressure distribution in blood (x) and dialysate (+) compartment
Fig. III-19: Spatial velocity profile in blood and dialysate compartment at blood inlet (x) and outlet (+) section
4.7.4. Discussion
The presented 3D microscopic model allows the investigation of the impact of flow, blood viscosity and hematocrit, on the presence and localization of backfiltration for given capillary dimensions. Varying the dimensions of the
0,00E+00
5,00E-03
1,00E-02
1,50E-02
2,00E-02
2,50E-02
0,00E+00 2,00E-05 4,00E-05 6,00E-05 8,00E-05 1,00E-04 1,20E-04 1,40E-04 1,60E-04 1,80E-04 2,00E-04 2,20E-04
× z = 0.02m
+ z = 0.23m
— Parabolic
Blood Membrane Dialysate
2.5 E-02
1.5 E-02
2.0 E-02
5.0 E-03
1.0 E-02
Vel
ocity
mag
nitu
de (m
/s)
Radial distance (m)
2.0 E-05 1.0 E-046.0 E-05 1.4 E-04 1.8 E-04
0,00E+00
2,00E+03
4,00E+03
6,00E+03
8,00E+03
1,00E+04
1,20E+04
1,40E+04
1,60E+04
0,00E+00 5,00E-02 1,00E-01 1,50E-01 2,00E-01 2,50E-01
Pres
sure
(Pa)
Axial distance (m)
1.6 E+04
1.4 E+04
1.2 E+04
1.0 E+04
8.0 E+03
6.0 E+03
4.0 E+03
2.0 E+03
5.0 E-02 1.0 E-01 1.5 E-01 2.0 E-01 2.5 E-01
× CFD : pressure at blood-membrane interface
+ CFD : pressure at membrane-dialysate interface
— Linear regression
Ultrafiltration flow

Chapter III
124
dialysate compartment subsequently, the impact of anisotropic fiber density and/or fiber twisting, as reported in macroscopic models [118,120,224], can be investigated. Moreover, the influence of a non-uniform blood and/or dialysate flow [111,118-120,224,225], resulting in locally different ultrafiltration flows, can be visualized at discrete radial positions.
In the one-dimensional model of Legallais et al. [222], hydraulic and diffusive permeabilities of the membrane are obtained from experimental results found in literature [56,226]. In contrast with experiments where the hydraulic permeability [56,221,226] and the influence of proteins [56] is investigated in an ex vivo setup using the clinical flow directions, a new in vitro setup was built for this study in order to quantify the water permeability of the membrane as its real physical characteristic with greater accuracy. Nevertheless, the plasma ultrafiltration coefficient found by Bosch et al. [56] in their ex vivo setup shows a permeability reduction of 68% compared with their sodium chloride measurements, quite similar to what we measure after inducing an in vitro protein layer on the dialyzer membrane (reduction of 70%).
Legallais et al. [222] assumed the Newtonian fluid plasma to flow in the blood compartment with a viscosity depending on the actual protein concentration [227]. In the presented model, the shear-thinning behavior of blood as well as the hematocrit dependency of its viscosity is incorporated using the Quemada model [63]. The influence of the non-uniform cell distribution is taken into account by using the Fahraeus-Lindqvist model, which was originally derived for impermeable tubes.
Oncotic pressure, induced by the plasma proteins in the blood compartment, is not considered in models using saline solutions. For plasma [222], the oncotic pressure dependence on protein concentration is expressed by Landis et al. [228]. In this study, using blood, the local oncotic pressure is calculated accounting for the local hematocrit. As water is removed from the blood compartment over the length of the dialyzer and hemoconcentration occurs, the local hematocrit increases with the red blood cell concentration and the oncotic pressure increases with protein (albumin) concentration.
Nevertheless the Haegen-Poiseuille equation is derived for flow in impermeable tubes, most one and two-dimensional numerical models [222] assume a linear pressure drop over the length of the dialyzer. Our three-dimensional model gives the opportunity to investigate whether this assumption is valid. It is found (Fig. III-18 and Fig. III-19) that deviation from linearity is negligible (0.3%) for flow in dialyzers with a limited active length (230mm), hereby confirming the

Modeling of flow in a single hemodialyzer fiber
125
theoretical results by Wupper et al. [195]. However, using the analytical expression of Karode [196], a deviation from linearity of 6% is found at blood inlet and outlet for a common active dialyzer length (0.23m).
After validation of the model by an ex vivo study mimicking the clinical setup, a profound parameter study can be performed to investigate the impact of ultrafiltration flow and capillary dimensions on blood viscosity.
Although the presented model is the result of combining several flow, transport and fluid property aspects, some limitations of the model can be remarked. Concentration polarization, which should be considered for flow in permeable tubes, is not considered. Moreover, the accumulation of particles at the membrane is idealized by assuming the presence of a homogeneous monolayer of proteins (100µm) at the inner layer of the membrane. As a result, the axial variation of boundary layer thickness [203] and the shearing effect arising from backfiltration [200,201] as well as the shear stress acting on the boundary layer itself [202], are not considered. Therefore, with respect to the flow of highly concentrated fluids like blood, the consideration of concentration polarization and multiphase flow simulating inertial effects and slip between the particles and the carrier liquid [142] could be a point of further improvement.
4.7.5. Conclusion
Our numerical model incorporates the blood, dialysate and membrane flow in hollow fiber dialyzers allowing an accurate investigation of the fluid properties and the presence and localization of backfiltration can be performed. The hydraulic permeability of the dialyzer is based on a different and more accurate method than in previous ex vivo studies and blood is modeled as a non-Newtonian fluid with properties varying in radial as well as axial direction. The simulation shows that deviation from a linear pressure drop - flow relationship is negligible for flow in dialyzers with a limited active length.
4.7.6. Acknowledgements
This research was financially supported by Fresenius Medical Care (Germany). The authors also wish to thank the medical staff of the renal unit of the hospital 'AZ Zusters van Barmhartigheid' (Ronse) for their assistance during the in vivo measurements, the Blood transfusion Centre (Red Cross Belgium) for supplying plasma pockets used in the laboratory tests and, last but not least, our colleague P Segers for his review.

Chapter III
126
4.7.7. Correction to the manuscript
The Lerche parameter n as described in paragraph 4.7.2.3, was derived with a two-dimensional axi-symmetrical model using the finite element software SEPRAN (Eindhoven, The Netherlands). Calculations with a three-dimensional model using the finite volume software Fluent (Sheffield, UK), resulted however in a different equation for the Lerche parameter n as a function of hematocrit H:
0.206-H
11.0148n += Eq. III-33
The calculations performed with Fluent were checked for grid convergence and for the applicability of Poiseuille’s law for zero hematocrit values.
This new formulated relation is illustrated in Fig. III-20, together with the former reported relation. No significant differences were found for the resulting blood properties between both methods. In what follows, results are given using the adapted equation for the Lerche parameter.
Fig. III-20: The Lerche parameter n as a function of hematocrit H: previous reported relation with a 2D model (thin line) [141] versus corrected relation (bold line) with a 3D model.
4.8. Validation of the numerical model
4.8.1. Objective
The main objective of this study was to investigate whether the numerical model is able to predict ultrafiltration profiles and viscosity increases. From this respect, in vivo and ex vivo experiments were performed measuring flow and fluid properties.
0
1000
2000
3000
0,2 0,25 0,3 0,35 0,4 0,45 0,5
hematocrit H (-)
para
met
er n
(-)
0
100
200
300
400
500
0,25 0,3 0,35 0,4 0,45 0,5
0
1000
2000
3000
0,2 0,25 0,3 0,35 0,4 0,45 0,5
hematocrit H (-)
para
met
er n
(-)
0
100
200
300
400
500
0,25 0,3 0,35 0,4 0,45 0,50
100
200
300
400
500
0,25 0,3 0,35 0,4 0,45 0,5

Modeling of flow in a single hemodialyzer fiber
127
4.8.2. In vivo determination of blood properties
4.8.2.1. Patients and methods The characteristics of blood flowing through a dialyzer were examined by the Critline system (described in Chapter I, paragraph 5.2). The sensors are placed at the inlet and outlet blood line for on line registration of hematocrit, blood volume, and oxygen saturation.
The tests were completed for two stable dialysis patients. They were dialyzed during 4 hours with a low flux F6 and high flux F60 dialyzer, respectively (Fresenius Medical Care, Bad Homburg, Germany). The patients had an arterio-venous fistula as vascular access, and the use of two needles assured a low recirculation rate (limited to 2-5%).
A Bellco Multimat dialysis machine controlled blood and dialysate flows as well as ultrafiltration. The dialysate flow was kept constant at 500mL/min, while blood flow was changed stepwise (150-250-350mL/min) for an ultrafiltration rate of 0.5, 2, and 2.5L/h, respectively.
4.8.2.2. Experimental results The difference between the inlet and outlet hematocrit is for the different blood and ultrafiltration flows given in Table III-22.
Table III-22: Hematocrit increase for different blood and ultrafiltration flows.
Patient 1: low flux F6 Patient 2: high flux F60 QB
mL/min QUF L/h
Hinlet %
Houtlet %
Incr. %
Hinlet %
Houtlet %
Incr. %
150 0.5 30.1 31.6 5.0 30.8 31.2 1.3 250 0.5 30.1 31.1 3.3 30.7 31.1 1.3 350 0.5 30.0 30.9 3.0 30.6 30.9 1.0 150 2 30.3 37.8 25 30.8 37.9 23 250 2 30.6 34.8 14 30.8 34.5 12 350 2 30.7 33.7 9.8 30.8 32.8 6.5 150 2.5 30.7 39.9 30 31.0 40.6 31 250 2.5 30.8 36.6 19 31.1 36.2 16 350 2.5 30.9 35.1 14 31.3 34.5 10
blood flow QB; ultrafiltration flow QUF; hematocrit H; increment Incr
The mean inlet hematocrit was 30.5±0.3% (patient 1: F6) and 30.9±0.2% (patient 2: F60), while outlet hematocrit values were 34.6±3.1% (F6) and 34.4±3.4% (F60). By flowing through the dialyzer, blood thickening resulted in a hematocrit

Chapter III
128
increase of 3-30% (F6) and 1-31% (F60), depending on the blood and ultrafiltration flows.
With a constant dialysate and blood flow, and increasing the ultrafiltration flow from 0.5L/h up to 2.5L/h in the F6 and F60, the outlet hematocrit was increased by 26 and 30% (QB=150mL/min), 18 and 16% (QB=250mL/min), and 14 and 12% (QB=350mL/min), respectively. The outlet hematocrit is an exponential relation of ultrafiltration rate (Fig. III-21), with a mean hematocrit of 29.9±0.1% (F6) and 29.7±0.4% (F60) for a zero ultrafiltration flow. Those values are not significant different from the hematocrit measured at the dialyzer inlet.
Fig. III-21: Outlet hematocrit as a function of ultrafiltration flow, for a blood flow of 150mL/min (thin line), 250mL/min (dashed line), and 350mL/min (bold line), with the F6 (left panel) and the
F60 (right panel).
Keeping the dialysate and ultrafiltration flow constant, and decreasing the blood flow rate from 350 to 150mL/min in the F6 and F60, outlet hematocrit values increased by 2.3 and 1.0% (QUF=0.5L/h), 12 and 16% (QUF=2L/h), and 14 and 18% (QUF=2.5L/h), respectively. The outlet hematocrit varies according a second order relation for decreasing blood flows, and is illustrated in Fig. III-22.
Considering constant flows, hematocrit increase was not significantly different in the high flux (F60) compared to the low flux (F6) dialyzer (P=0.657), except for the lowest applied ultrafiltration rate of 0.5L/h (P=0.014). We think however that this has more to do with the accuracy of the Critline system (not reported by the manufacturer) than with the dialyzer type.
The mean inlet oxygen saturation was 90.2±1.4% (F6) and 92.2±0.4% (F60), while the outlet was varied 1-2% resulting in a mean value of 91.0±1.3% (F6) and 90.8±0.4% (F60).
30
32
34
36
38
40
42
0 0,5 1 1,5 2 2,5 3
QUF (L/h)
outle
t hem
atoc
rit (%
)
30
32
34
36
38
40
42
0 0,5 1 1,5 2 2,5 3
QUF (L/h)
30
32
34
36
38
40
42
0 0,5 1 1,5 2 2,5 3
QUF (L/h)
outle
t hem
atoc
rit (%
)
30
32
34
36
38
40
42
0 0,5 1 1,5 2 2,5 3
QUF (L/h)

Modeling of flow in a single hemodialyzer fiber
129
Fig. III-22: Outlet hematocrit as a function of blood flow, for an ultrafiltration flow of 0.5L/h (thin line), 2L/h (dashed line), and 2.5L/h (bold line), with the F6 (left panel) and the F60 (right
panel).
4.8.2.3. Conclusion The present in vivo study aimed at determining the variation of blood properties, i.e. hematocrit. The influence on hematocrit of different flow settings was investigated using Critline sensors on the inlet and outlet blood line.
The most important conclusion is that for a constant dialysate flow, the hematocrit increase due to dialyzer flow is more pronounced for lower blood flows and higher ultrafiltration rates.
4.8.3. Ex vivo determination of flow and fluid properties
4.8.3.1. Materials and Methods A scheme of the ex vivo setup is shown in Fig. III-23. A Bellco Formula dialysis machine prepared the dialysis fluid and controlled the dialysate, blood and ultrafiltration flow. Blood/dialysate flow combinations of 150/300mL/min, 250/500mL/min, and 350/800mL/min were investigated for an overall ultrafiltration flow rate of 0.5L/h and 2L/h, respectively. Blood and dialysate flow rates were checked by gravimetrical flow measurements at the dialyzer outlet (Fig. III-23). Pressure was assessed at blood inlet and outlet, using fluid filled pressure transducers (Ohmeda, Gent, Belgium).
The tests were performed using a high flux dialyzer F60 (Fresenius Medical Care, Bad Homburg, Germany). The main characteristics of the dialyzer are shown in Table III-12 (paragraph 4.4.3.3).
30
32
34
36
38
40
42
100 150 200 250 300 350 400
QB (mL/min)
outle
t hem
atoc
rit (%
)
30
32
34
36
38
40
42
100 150 200 250 300 350 400
QB (mL/min)
30
32
34
36
38
40
42
100 150 200 250 300 350 400
QB (mL/min)
outle
t hem
atoc
rit (%
)
30
32
34
36
38
40
42
100 150 200 250 300 350 400
QB (mL/min)

Chapter III
130
Fig. III-23: Ex vivo setup for flow and fluid investigation
As patient’s blood substitute, bovine blood from the slaughterhouse was used. The blood was anticoagulated using 15 units of heparin per milliliter blood. Furthermore, it was filtered and maintained at a constant temperature (37°C) using a Bellco Simplex circulating system. The main blood characteristics of human and bovine blood are given in Table III-23.
Table III-23: Blood characteristics of human and bovine blood.
Blood H %
RBC E+6 / µL
DRBC µm
WBC E+3 / µL
Hb g/dL
human 36 - 51 4.8 - 5.4 7 - 8 4 - 11 14 - 16 bovine 24 - 46 5 - 10 4 - 8 4 - 12 8 - 15 hematocrit H; number of red blood cells RBC; red blood cell diameter DRBC;
number of white blood cells WBC; hemoglobin Hb
Blood was sampled at the inlet and outlet blood line. Samples of 10mL were used for viscosity measurements with a plate and cone viscometer (Chapter I, paragraph 5.3). Dynamic viscosity was determined for shear rates of 100, 200, 400, and 500s-1, while reproducibility was checked measuring the whole viscosity range, increasing the shear rate from 10 up to 800s-1. A second series of samples of 2.5mL were taken for hematocrit and mean cell volume (MCV) determination in the medical laboratory, while a third series of samples (2.5mL) were taken to control oxygen saturation and blood acidification (pH).
balance
Bellco Formula
blood reservoir
Bellco Simplex
sampling port
sampling port
dialyzer
dialysate preparation
balance
spent dialysate
RO A B
balance
Bellco Formula
blood reservoir
Bellco Simplex
sampling port
sampling port
dialyzer
dialysate preparation
balance
spent dialysate
RO A BRO A B

Modeling of flow in a single hemodialyzer fiber
131
4.8.3.2. Experimental results With the different flow settings, the mean pH of the inlet blood sample was 7.33±0.01, while outlet pH was 7.27±0.01. As a consequence, no blood acidification took place during the four hours of testing (small standard deviation for the inlet samples), nor when blood was flowing through the dialyzer (outlet pH only 0.7% lower than inlet pH).
The inlet and outlet mean cell volume (MCV) was both found 51µm³. An important difference was found with the normal human MCV values (83-98µm³). Because the Critline system for hematocrit determination is calibrated for an MCV of 91µm³, which is a typical value for a dialysis patient population, Critline monitoring during the ex vivo experiments did not offer reliable results.
With respect to the oxygen saturation, no significant difference was observed between the inlet and outlet samples (P=1.000). Owing to the constant oxygen saturation value during the four hours of testing, blood oxygenation was superfluous.
Table III-24 shows the hematocrit increase for bovine blood flowing through the F60 dialyzer for different flow settings. When decreasing the blood and dialysate flow, the hematocrit increase was found to vary from 1.6 to 3.4% (QUF=0.5L/h), even more pronounced for the higher ultrafiltration rates of 2L/h (i.e. 7.6 to 27%).
Table III-24: Hematocrit increase of bovine blood for different flow settings.
QB mL/min
QD mL/min
QUF L/h
Hinlet %
Houtlet %
Incr %
150 300 0.5 43.7 45.2 3.4 250 500 0.5 43.7 44.6 2.1 350 800 0.5 43.7 44.4 1.6 150 300 2 43.2 55.0 27 250 500 2 43.2 48.9 13 350 800 2 43.2 46.5 7.6
blood flow QB; dialysate flow QD; ultrafiltration flow QUF; hematocrit H; increment Incr
Fig. III-24 illustrates the variation of dynamic viscosity with increasing shear rate for samples taken at the inlet and outlet blood line with a blood and dialysate flow of 150 and 300mL/min and with an ultrafiltration rate of 0.5L/h and 2L/h, respectively. Viscosity can be assumed constant for shear rates in the range 300-600s-1. For higher shear rates, viscosity was slightly increasing again due to the non-appropriate cone dimensions for measurements at high shear rates.

Chapter III
132
Fig. III-24: Dynamic viscosity variation for increasing shear rates with QB/QD =150/300mL/min: inlet sample (squares), outlet sample with QUF=0.5L/h (triangles) and QUF=2L/h (rhombs).
Table III-25 shows the dynamic viscosity at a shear rate of 500s-1 of samples taken at the inlet and outlet blood line for different flow settings. The mean inlet viscosity was 4.73±0.09mPa·s, while viscosity was increased by 5-121% by flowing through the dialyzer. Because this important viscosity increase appeared unrealistic, inlet and outlet blood viscosities were also calculated using the formula derived for bovine blood by Mockros et al. [140] (Table III-25):
( )H0.0235expµµ p ⋅⋅= Eq. III-34
With µp the plasma viscosity (1.3mPa·s) and H the hematocrit (%).
Table III-25: Viscosity increase of bovine blood for different flow settings.
Ex vivo measurements Calculation with Eq. III-34 QB
mL/min QD
mL/min QUF L/h
µinlet
mPa·s µoutlet
mPa·s Incr %
µinlet
mPa·s µoutlet
mPa·s Incr %
150 300 0.5 4.90 5.30 8.1 3.57 3.69 3.5 250 500 0.5 4.74 5.02 5.9 3.57 3.64 2.1 350 800 0.5 4.67 4.91 5.3 3.57 3.63 1.6 150 300 2 4.70 10.4 121 3.53 4.63 31 250 500 2 4.69 6.70 43 3.53 4.02 14 350 800 2 4.68 5.91 26 3.53 3.81 7.9
blood flow QB; dialysate flow QD; ultrafiltration flow QUF; dynamic viscosity µ; increment Incr
Significant differences were found between the viscosity rise obtained from the ex vivo tests and derived theoretically (Table III-25). Furthermore, an exponential relation could be drawn between viscosity (Table III-25) and hematocrit (Table III-24): µ=0.25·exp(0.068·H) and R²=0.996 (Fig. III-25). This equation is
4
8
12
16
20
24
10 100 1000
shear rate (1/s)
visc
osity
(mP
a.s)

Modeling of flow in a single hemodialyzer fiber
133
significantly deviating from the one reported by Mockros et al. [140], and results in an underestimation of the plasma viscosity.
Both phenomena suggest that the outlet blood viscosity was influenced not only by ultrafiltration, but maybe by clotting related factors as well. It was revealed that a protein layer on the membrane of critical thickness (20nm) plays an important role in the activation of the coagulation system [229]. Although the bovine blood was heparinized, it still might induce reactions that are not seen with clinical dialysis. As a consequence, care should be taken when extrapolating the bovine blood viscosity results to patient’s data.
Fig. III-25: Dynamic viscosity as a function of hematocrit (F60)
The pressure drop in the blood compartment can be calculated using the law of Haegen-Poiseuille (Eq. I-5) in a single fiber, counting with a fiber diameter of 200µm, a fiber length of 0.255m (including potting) and a mean viscosity derived from the measured inlet and outlet viscosities (Table III-25). A comparison of the measured pressure drop with theory is, for the different flow settings, given in Table III-26. The measured pressure drop varied from a theoretical underestimation (3-17%) towards an overestimation (4-34%) for consecutive measurements. This phenomenon suggests that fiber clogging progressively occurred, increasing the pressure drop in the blood compartment.
Table III-26: Theoretical and measured pressure drops in the blood compartment
QB mL/min
QD mL/min
QUF L/h
∆Ptheory mmHg
∆Pex vivo mmHg
deviation %
150 300 0.5 68 56 -17 250 500 0.5 108 96 -11 350 800 0.5 148 143 -3 150 300 2 100 104 4 250 500 2 126 148 18 350 800 2 164 219 34
blood flow QB; dialysate flow QD; ultrafiltration flow QUF; pressure drop ∆P
0
2
4
6
8
10
12
40 42 44 46 48 50 52 54 56hematocrit (%)
visc
osity
(mP
a.s)

Chapter III
134
4.8.3.3. Conclusion With the present ex vivo study, fluid (i.e. pressure and flow) and flow properties (i.e. hematocrit, viscosity, oxygen saturation and pH) were investigated in a high flux polysulphone dialyzer.
The most striking conclusion is that the hematocrit and blood viscosity increases were most pronounced for lower blood flows and higher ultrafiltration rates. With respect to absolute values, care must be taken when considering bovine blood viscosity results for evaluation of a clinical session. Furthermore, fiber clogging during the ex vivo tests showed an important influence on pressure measurements.
4.8.4. Comparison between experimental and numerical results
4.8.4.1. Objective and methods The numerical model, as described in paragraph 4.7, was used to simulate selected in vivo and ex vivo experiments. The main input flow parameters were blood and dialysate inlet flow, and the overall ultrafiltration rate (using outflow boundaries - Chapter I, paragraph 5.6.2). The input fluid properties were inlet hematocrit, plasma viscosity (1.3mPa·s), inlet blood density, and inlet dialysate viscosity and density.
For the considered simulations, different output parameters were investigated. The hematocrit and blood viscosity augmentations were calculated from mean inlet and outlet values and compared to the in vivo, ex vivo, and theoretical results. The pressure drop in the blood compartment was compared to the measured pressure difference as well as to the theoretical results using the Haegen-Poiseuille equation.
4.8.4.2. Results Table III-27 and Table III-28 show the results of the numerical simulations for the blood properties (i.e. hematocrit and viscosity increase, respectively), compared to the results obtained with the in vivo, ex vivo, and theoretical method.
No considerable difference was found between the hematocrit increases as found with the numerical simulations, the theoretical calculation, and the ex vivo experiments. With respect to the viscosity variation however, the numerical results are distinctly different from the experimental results, while similarity was found between simulations and theory.
The experimentally measured, and numerically and theoretically derived pressure drops in the blood compartment are given in Table III-29. The simulation results

Modeling of flow in a single hemodialyzer fiber
135
deviate significantly from the ex vivo measured (P=0.028) as well as from the theoretical derived pressure drops (P=0.008).
Table III-27: Hematocrit increase for different flow settings.
QB mL/min
QD mL/min
QUF L/h
∆Hin vivo
% ∆Hex vivo
% ∆Hsimulation
% ∆Htheory
% 250 500 0.5 1.3 2.1 3.6 3.4 150 300 2 27 28 28 250 500 2 12 13 15 15 350 800 2 7.6 11 11
blood flow QB; dialysate flow QD; ultrafiltration flow QUF; hematocrit increase ∆H
Table III-28: Blood viscosity increase for different flow settings.
QB mL/min
QD mL/min
QUF L/h
∆µex vivo
% ∆µsimulation
% ∆µMockros
% 250 500 0.5 5.9 7.2 2.1 150 300 2 121 32 31 250 500 2 43 13 14 350 800 2 26 9.8 7.9 blood flow QB; dialysate flow QD; ultrafiltration flow QUF;
viscosity increase ∆µ
Table III-29: Pressure drops in the blood compartment for different flow settings.
QB mL/min
QD mL/min
QUF L/h
∆Pex vivo mmHg
∆Psimulation mmHg
∆Ptheory mmHg
250 500 0.5 96 76 108 150 300 2 104 28 100 250 500 2 148 49 126 350 800 2 219 68 164
blood flow QB; dialysate flow QD; ultrafiltration flow QUF; pressure drop ∆P
4.8.4.3. Discussion With respect to the blood property variation when flowing through the dialyzer, good similarity was found for the hematocrit increases as obtained with the different experimental and numerical methods. While matching was found between the numerical and theoretical results for blood viscosity, the ex vivo measured viscosities overestimated theoretical reality, probably due to the experimental test method (paragraph 4.8.3.2). As a consequence, accounting for the complex calculation of the varying blood properties, the implemented viscosity model was found appropriate.

Chapter III
136
With the ex vivo measurements, the pressure drop was assessed over the entire dialyzer, including energy losses at the dialyzer inlet and outlet manifold. This can however not explain the important difference with the numerical simulations. Furthermore, the discrepancy between the simulated and theoretical results suggests a non-appropriate calculation of the pressure drop with the CFD model.
Because the blood-membrane interface is not defined as a no-slip wall, velocities at the interface are calculated by interpolation of the velocities of the adjacent cells. Keeping the parabolic Poiseuille velocity profile in mind, it is obvious that the velocity at the interface is more deviating from zero for increasing cell widths. As a consequence, velocities, and with it, flow and pressure drops were calculated inaccurate. Because the available computer capacity restricted the number of cells in the originally developed CFD model (paragraph 4.7), no refinement could be established near the blood-membrane interface (Fig. III-26). Recently, however, the mesh of the fiber model was refined, especially near the important boundaries blood-membrane and membrane-dialysate (Fig. III-26).
Fig. III-26: Radial illustration of the original mesh (left panel) and the improved mesh (right panel) of the blood-dialysate interface
Using the original mesh, simulations with an infinite membrane resistance resulted in a deviation of the blood-side pressure drop of 10% compared to the theoretical Poiseuille calculation. Mesh refinement reduced this error to 4.5%. In order to avoid long lasting simulations, further refinement was not considered. The hereafter reported results were calculated with the new-implemented mesh.
4.8.4.4. Conclusion A number of simulations were performed to evaluate the validity of the microscopic CFD model by comparing the numerical results with experimental and theoretical results. While good similarity was found for the blood property
blood
dialysate
bulk skin + protein layer
blood
dialysate
bulk skin + protein layerskin + protein layer

Modeling of flow in a single hemodialyzer fiber
137
variation over the dialyzer fiber, important discrepancies were found with respect to the pressure drop in the blood compartment. To remedy this calculation inaccuracy, the numerical mesh was refined for further applications.
4.9. Influence of ultrafiltration on blood-side pressure drop
4.9.1. Objective and aim
With the refined mesh of the F60 dialyzer fiber, pressure profiles in the blood compartment were evaluated for increasing dialyzer lengths and an overall ultrafiltration flow of 2L/h. Results were compared to the theoretical calculation using Poiseuille’s law for flow in circular non-permeable tubes.
4.9.2. Results
Fig. III-27 illustrates the blood-side pressure drop for increasing dialyzer lengths. The theoretical (squares) as well as the numerically derived (triangles) results are shown.
Due to forward filtration, blood flow decreases over the dialyzer length resulting in a smaller pressure drop than calculated theoretically. For a standard dialyzer with 230mm active fiber length, a deviation of 9.6% was found, while fiber elongation by a factor 1.5 or 2 results in a pressure drop that is 15% lower than given by Poiseuille’s law.
Finally, it should be remarked that care must be taken when interpreting those percentage deviations, as a deviation of 4.5% was already found with the simulations for a non-permeable assumed membrane.
Fig. III-27: Blood-side pressure drop (mmHg) as calculated theoretically (squares) and numerically (triangles)
0
20
40
60
80
100
120
140
150 200 250 300 350 400 450 500
active fiber length (mm)
pres
sure
dro
p (m
mH
g)

Chapter III
138
4.9.3. Conclusion
Because ultrafiltration causes the blood-side pressure drop to deviate from linearity, an interesting question is to which extent a linear approximation is still suitable. For a standard active fiber length of 230mm it was found with the described numerical model that deviations are below 10%, even for an overall ultrafiltration flow of 2L/h. However, care must be taken when considering longer dialyzer lengths.

Chapter IV Mass transport in a hemodialyzer

Chapter IV
140
1. Chapter overview
This chapter starts with the description of the different transport processes (diffusion, convection and adsorption), and the differences in solute removal of solutes with a different molecular weight in hemodialyzers with different membrane characteristics.
Three different approaches were applied to investigate and describe solute removal, i.e. a theoretical, experimental, and numerical analysis. While each method has its proper drawbacks, by combining those three techniques we tried to provide the complete picture.
The theoretical analysis was set out to investigate the influence on solute removal of dialyzer flow directions, total flow rates, and flow distributions. With respect to the latter, a general description is given and further applied to the low flux F6HPS dialyzer using the results of the SPECT measurements, as described in Chapter II.
In the experiments, mass transport of small and middle molecules was studied in different flow and dialyzer combinations using F6HPS dialyzers. The investigated parameters were dialyzer flow directions, flow rates, and dialyzer positioning (i.e. two dialyzers placed in series or in parallel).
Finally, a numerical model was developed to describe flow and mass transport in a single dialyzer fiber. After model calibration and validation, the impact on solute removal of a variable fiber length and diameter was assessed for small and middle molecules. Further on, the model is used to examine the effect of dialysate flow maldistribution by implementing the experimental SPECT results of chapter II. This allows a comparison between solute transport in a low flux F6, as derived theoretically, and in a high flux F60 dialyzer, as calculated numerically.

Mass transport in a hemodialyzer
141
2. Introduction
Besides the removal of the excess body water from the patient, dialysis therapies also aim at removing the toxic by-products of the metabolism.
In hemodialysis, the major transport phenomenon is diffusion, driven solely by a concentration gradient without any filtration. To restore the fluid balance in the patient, however, a transmembrane pressure must be applied such that convection comes into play. The basics of both transport phenomena were discussed more in detail in Chapter I, paragraphs 3.4 and 3.5.
In the description of mass transfer in hemodialyzers, it is important to make a distinction between small and middle molecule transport. Furthermore, besides the difference in filtration capacity, low and high flux dialyzers also differ with respect to solute clearances.
2.1. Small versus middle molecule removal
Small solutes are generally defined as molecules with a molecular weight (MW) below 300-500Da [84,229]. There is also ambiguity concerning the transition of middle to large solutes. Upper limits for the middle molecules of 12000 and 15000Da are reported throughout the literature. Table IV-1 shows the classification of small, middle, and large molecules as defined by the European Uremic Toxin Work Group (EUTox)
Table IV-1: Categorization of small, middle and large molecules.
Classification of solutes Molecular weight range Small molecules e.g. urea (60), creatinine (113), phosphate (134)
< 500
Middle molecules e.g. vitamin B12 (1355), vancomycin (1448), inulin (5200), endotoxin fragments (1000-15000), β2-microglobulin (11818)
500 – 15000
Large molecules e.g. myoglobin (17000), EPO (34000), albumin (66000)
> 15000
The removal of middle molecules gained more and more attention over the past years due to its important role in uremic toxicity [110,230]. Traditionally, however, dialysis efficiency in the clinical practice is only focused on the removal of urea. The removal rate is then indicated as K·t/V or Urea Reduction Ratio (URR) [231], two dialysis adequacy parameters that are calculated on a regular basis (e.g. weekly, monthly…) [232].

Chapter IV
142
Because the diffusion rate of solutes was found inversely proportional to the square root of the solute molecular weight, only low molecular weight (LMW) molecules are removed by diffusion. Middle molecular weight solutes (MMW) are mainly removed by convection, and the contribution of convection to total solute removal increases with increasing molecular size [93].
When ultrafiltration becomes non-negligible, diffusion and convection interfere continuously with each other. Convection causes an accumulation of large solutes (i.e. larger than the membrane cut-off) at the membrane surface, influencing the diffusion length and the concentration gradient over the membrane. On the other hand, diffusion changes the local solute concentrations, which has an impact on their netto convective transport. As a consequence, it is impossible to specify the exact contribution of convection to the overall dialyzer clearance. It is however certain that the ultrafiltration flow has a larger impact on large solutes, which are not easily diffusing through the membrane [93].
Finally, the larger middle molecules (e.g. β2 microglobulin – MW11818) can also be removed by adsorption at the membrane. This phenomenon is however dependent on the membrane type, and is especially observed with polymethylmethacrylate (PMMA) [233,234] and some polyacrylonitrile (PAN) membranes. With the latter membrane, it is usually noticed that adsorption is overruling in the early stages of the dialysis treatment, while convection becomes dominant in the later stage [73,233]. Furthermore, solute removal by adsorption and convection are both enhanced by the use of high ultrafiltration flows [234,235].
2.2. Solute removal in low flux versus high flux dialyzers
Because of the different driving forces for small and middle molecule transport, i.e. concentration and pressure differences, the membrane properties play a key role in dialyzer efficiency.
2.2.1. Diffusive transport
The reciprocal of the mass transfer coefficient K0 in the equation for diffusive mass transport (Chapter I, Eq. I-10) can be seen as the resistance to diffusion. The latter is the sum of blood-side, membrane, and dialysate-side resistance. Because the membrane is far most the highest resistor, reducing this would result in a better dialysis efficiency. As a consequence, using membranes with smaller thickness and/or higher porosity enhances mass transfer. From this respect, membranes from modified cellulose have a significant lower membrane thickness (5-11µm) compared to synthetic membranes (40-50µm). The latter

Mass transport in a hemodialyzer
143
group, however, can be produced with higher porosity (i.e. larger pores or increased number of pores), resulting in a high ultrafiltration coefficient (KUF>15mL/h/mmHg).
Fig. IV-1 shows the difference in ranges of in vitro diffusive clearances for low flux and high flux membranes. Although Fig. IV-1 is based on data of 13 low flux and 7 high flux dialyzers of comparable surface area, the ranges of urea and creatinine clearances are quite narrow. This indicates that the different dialyzers, produced with different types of membranes, have relatively similar low molecular weight clearances.
Fig. IV-1: Typical in vitro clearances of low and high flux dialyzers of 1.3-1.35m² [123]. All tests were performed without ultrafiltration and with QB and QD equal to 200 and 500mL/min.
2.2.2. Convective transport
The formula for total clearance K’, as reported in Chapter I (Eq. I-13) was drawn for the special case of unhindered solute transport through the membrane. For middle molecules, the convective term should be extended with the sieving coefficient S (-) [101,236,237]:
( )
Bi
BoUF
Bi
BoUF
Bi
BoBiBi
CC
QSKCC
QSC
CCQK' ⋅⋅+=⋅⋅+
−⋅= Eq. IV-1
A sieving coefficient equal to unity corresponds to unhindered transport through the membrane, while S equal to zero implies that the membrane is impermeable for the considered solute, resulting in zero diffusion as well.
It is obvious that the smaller pores in the low flux membranes hamper the transport of middle molecules over the membrane. This results in a sieving coefficient of only 0.7 and 0.1 for vitamin B12 (MW1355) and inulin (MW 5200), respectively, in the low flux Fresenius polysulphone dialyzers (Fig. IV-2). The high flux polysulphone membranes, however, allow free passage of
Urea
Creatinine
Phosphate
Vitamin B12
Low flux High flux Mean value
0 20 40 60 80 100 120 140 160 180 200 Clearance (mL/min)
Urea
Creatinine
Phosphate
Vitamin B12
Low flux High flux Mean value
0 20 40 60 80 100 120 140 160 180 200 Clearance (mL/min)

Chapter IV
144
molecules with a molecular weight less than or equal to inulin. Even β2-microglobulin (MW11818), a molecule of the higher middle molecule range, is removed with a sieving coefficient approaching 0.65 (Fig. IV-2).
Fig. IV-2: Schematic illustration of the sieving coefficient profiles (S) of low and high flux polysulphone dialyzers as a function of molecular weight [123].
In analogy as was earlier reported with respect to the ultrafiltration coefficient (Chapter III, paragraph 4.5.3), in vivo values for the sieving coefficient are different from the in vitro derived values. This is also due to the different composition of the patient’s blood and the different flow conditions. Depending on the membrane type, different combinations of diffusion, convection and adsorption can occur, such that the sieving coefficient may differ significantly in between different dialyzers. Furthermore, as the relative contribution of convection and adsorption to overall solute removal can change during the dialysis session, the sieving coefficient may also decrease, increase or remain constant when blood-membrane contact time increases.
2.3. Conclusion
Small molecules are solely removed by diffusion while middle molecules are mainly dragged by the ultrafiltration flow (convection). Furthermore, each membrane is characterized by different contributions of diffusion and convection to the overall solute removal. As a consequence, some membranes will be found more appropriate for the removal of a specific solute than others. It is the clinician’s challenge to find the optimal dialyzer for each patient individually.
In general, the performance of a dialyzer depends on different aspects, which can be summarized as follows: first, the proficiency to remove urea and other small molecules that are normally eliminated by the native kidneys; second, the
100000
Creatinine(113)
Vitamin B12(1355)
Inulin(5200)
β2-M(11818)
Albumin(66000)
Molecular weight
100 1000 10000
0.8
1
0.6
0.4
0.2
0
Low flux polysulphone High flux polysulphone
100000
Creatinine(113)
Vitamin B12(1355)
Inulin(5200)
β2-M(11818)
Albumin(66000)
Molecular weight
100 1000 10000
0.8
1
0.6
0.4
0.2
0
Low flux polysulphone High flux polysulphone

Mass transport in a hemodialyzer
145
ultrafiltration flux for water removal, determined by the transmembrane pressure and the ultrafiltration coefficient of the membrane; third, the corresponding removal of the middle molecules expelled with the filtration fluid, and fourth, the ability to retain important proteins, such as albumin, and other large molecules.

Chapter IV
146
3. Theoretical analysis of mass transport
3.1. Influence of flow direction on mass transport
In a hemodialyzer, mass is transported over the semi-permeable membrane in between the blood and dialysate compartment. In the following, a mathematical relation is derived to determine the unknown blood and dialysate outlet concentrations as a function of the a priori known inlet concentrations. The spatial variation of mass transport in a dialyzer is described for the case blood and dialysate are flowing respectively in counter current and co-current direction (Fig. IV-3).
Fig. IV-3: Scheme of counter current (left panel) and co-current dialyzer flows (right panel).
3.1.1. Counter current dialyzer flows
For small molecules that are easily transported by diffusion through the dialyzer membrane without any adsorption, the mass balance without considering ultrafiltration is given by:
( ) ( ) dxC-CPKC-CdAK
dCQdCQ
DBF0DB0
DDBB
⋅⋅⋅−=⋅⋅−=⋅−=⋅
Eq. IV-2
QB and QD represent blood and dialysate flow rates (m³/s), dC the solute concentration difference in flow direction (mol/m³) in blood (subscript B) and in dialysate (subscript D), K0 the overall mass transfer coefficient (m/s), A the mass exchange area (m²), PF the summation of the perimeters of all fibers (m), and x the axial direction (m) (Fig. IV-3, left panel).
With α defined as the ratio of blood to dialysate flow, the concentration variation in blood and dialysate can be written in the x-direction:
( ) ( )α1dCdCQQ
dCdCdCCCd BBD
BBDBDB −⋅=⋅−=−=− Eq. IV-3
QB
CBi
QD CDiQD+QUFCDo
QB-QUF
CBo
x
LF
dxQB
CBi
QD CDiQD+QUFCDo
QB-QUF
CBo
x
LF
dx QB
CBi
QD CDi QD+QUFCDo
QB-QUF
CBo
x
LF
dxQB
CBi
QD CDi QD+QUFCDo
QB-QUF
CBo
x
LF
dxQB
CBi
QD CDiQD+QUFCDo
QB-QUF
CBo
x
LF
dxQB
CBi
QD CDiQD+QUFCDo
QB-QUF
CBo
x
LF
dx QB
CBi
QD CDi QD+QUFCDo
QB-QUF
CBo
x
LF
dxQB
CBi
QD CDi QD+QUFCDo
QB-QUF
CBo
x
LF
dx

Mass transport in a hemodialyzer
147
Substitution in Eq. IV-2 gives:
( ) ( ) dxC-CPKα1CCd
Q DBF0DB
B ⋅⋅⋅−=−−
⋅ Eq. IV-4
By integration of Eq. IV-4 from 0 to x, the transmembrane concentration difference at a distance x in the dialyzer, is found:
( ) ( ) ( ) ( ) ( )xβexp0∆CxCxCx∆C DB ⋅−⋅=−= Eq. IV-5
With the parameter β (1/m) defined as a function of α (-):
( )α-1Q
PKβ
B
F0 ⋅⋅
= Eq. IV-6
To eliminate the a priori unknown transmembrane concentration difference at x=0, Eq. IV-5 is substituted in the blood-side and dialysate-side formula of Eq. IV-2, respectively:
( ) ( )( ) ( )
⋅⋅−⋅⋅⋅−=⋅⋅⋅−⋅⋅⋅−=⋅
dxxβexp0∆CPKdCQ-dxxβexp0∆CPKdCQ
F0DD
F0BB Eq. IV-7
Such that integration over the entire fiber length LF gives the following expressions:
( ) ( )[ ]( ) ( )[ ]
⋅−−⋅−
⋅−=−
⋅−−⋅−
=−
FDoDi
FBoBi
Lβexp1α1α0∆CCC
Lβexp1α10∆CCC
Eq. IV-8
Substitution of the concentrations (Eq. IV-8) in the definition of ∆C(0)=CBi-CDo, provides:
( ) ( ) ( )( )F
DiBi
Lβexpα1α1CC
0∆C⋅−⋅−−⋅−
= Eq. IV-9
Finally, by substituting Eq. IV-9 in Eq. IV-8, the concentrations at the dialyzer outlet are described as a function of the known inlet concentrations:
( ) ( )( )
( ) ( )( )
⋅−⋅−⋅−−
⋅⋅−+=
⋅−⋅−⋅−−
⋅−−=
F
FDiBiDiDo
F
FDiBiBiBo
Lβexpα1Lβexp1
αCCCC
Lβexpα1Lβexp1
CCCC Eq. IV-10
In order to obtain the blood and dialysate concentrations at an arbitrary distance x, LF should be substituted by (x) and (LF-x), respectively, in the equation for CBo and CDo (Eq. IV-10).

Chapter IV
148
In the case of non-negligible ultrafiltration, the mass balance is extended:
( ) ( )( ) UFUFDBF0
DDBB
CdQSdxC-CPKCQdCQd
⋅⋅±⋅⋅⋅−=⋅−=⋅
Eq. IV-11
CUF represents the solute concentration in the plasma ultrafiltrate in case of forward filtration (negative sign), or in the dialysate in case of backfiltration (positive sign), and S represents the sieving coefficient (-) [101,236,237].
It should be remarked that blood flow (QB) in Eq. IV-11 is decreasing over the dialyzer length in the x-direction, resulting in a corresponding increase of dialysate flow (QD) in the opposite x-direction. Furthermore, if forward as well as backfiltration occurs, Eq. IV-11 should be used for each part of the dialyzer with the corresponding inlet concentrations. As a consequence, in order to determine the concentration distribution in a dialyzer in which forward and backfiltration take place simultaneously, Eq. IV-11 should be solved iteratively.
Using the concentration variations (Eq. IV-10) as drawn from the mass balance equation (Eq. IV-2), a relation between the diffusive dialysance D (defined in Chapter I, Eq. I-11) and the mass transfer coefficient K0 can be derived:
( )( ) B
F
FB
DiBi
BoBi QLβexpα1
Lβexp1QCCCC
⋅⋅−⋅−
⋅−−=⋅
−−
=D Eq. IV-12
Substituting the expressions for α and β in Eq. IV-12, the mass transfer area product K0·A is found as was reported earlier [85]:
D
BB
B
D
B
B0
Q
Qln
1QQ
QAK
⋅−
−⋅
−=⋅
D
D Eq. IV-13
3.1.2. Co-current dialyzer flows
In analogy with the preceding derivation, the concentration profiles for the case of co-current flows can be derived from the mass balance equation (Eq. IV-2), neglecting ultrafiltration (Fig. IV-3, right panel):
( ) ( )
( ) ( )
−⋅−−
⋅⋅−−=
−⋅−−
⋅−−=
α1Lβexp1
αCCCC
α1Lβexp1
CCCC
FDiBiDiDo
FDiBiBiBo
Eq. IV-14
With the parameter α as defined in Eq. IV-3 and β equal to:

Mass transport in a hemodialyzer
149
( )α1Q
PKβB
F0 +⋅⋅
= Eq. IV-15
The diffusive dialysance is for the co-current situation transformed into:
( )B
FB
DiBi
BoBi Qα1
Lβexp1QCCCC
⋅−
⋅−−=⋅
−−
=D Eq. IV-16
And substitution of α and β in Eq. IV-16, gives the following expression for the mass transfer area product:
⋅
⋅−
+⋅−⋅
=⋅ DDB
DB
DB
DB0 QQ
QQ1ln
QQQQ
AK Eq. IV-17
3.1.3. Diffusive mass transport with counter current and co-current flow directions
3.1.3.1. Objective and methods Concentration variations along the dialyzer length were calculated and visualized using Eq. IV-10 and Eq. IV-14 for counter current and co-current flow directions, respectively. Furthermore, the influence of solute molecular weight was demonstrated theoretically.
The main input parameters were related to flow (blood and dialysate flow rates), solute (diffusive dialysance and inlet concentration), and dialyzer dimensions (active fiber length, fiber diameter, and number of fibers). The considered Fresenius low flux F6 and high flux F60 dialyzers have 9200 fibers with an internal diameter of 200µm and active fiber length of 0.23m. The solute parameters are given in Table IV-2 for a blood flow of 250mL/min and dialysate flow of 500mL/min.
Table IV-2: Diffusive dialysance and inlet concentrations of urea and vitamin B12 for counter current and co-current blood (250mL/min) and dialysate (500mL/min) flows in
F6 / F60 dialyzers.
Counter current flows Co-current flows Solute MW
Da D
mL/min CBi
mmol/L D
mL/min CBi
mmol/L Urea 60 201 / 213 16.7 172 / 182 16.7
Vit B12 1355 61 / 126 0.037 51 / 95 0.037 molecular weight MW; diffusive dialysance D [238,239]; blood inlet concentration CBi [240].

Chapter IV
150
3.1.3.2. Results and discussion The dialyzer concentration profiles of the small molecule urea in the high flux F60 are illustrated in Fig. IV-4 for counter current (left panel) and co-current flows (right panel). Because urea dialysance is only slightly lower in the low flux F6 dialyzer, concentration profiles will be quite similar compared to those found in the F60.
Fig. IV-4: Urea concentration profiles in blood (bold line) and dialysate (thin line) in a high flux F60 dialyzer with counter current (left panel) and co-current flow directions (right panel).
It is obvious from Fig. IV-4 that the driving force for diffusive transport (i.e. the concentration difference between blood and dialysate) is maintained over the entire dialyzer length for counter current flows. With the co-current flow configuration, however, the driving force is decreasing with dialyzer length.
Because the diffusive dialysance of the middle molecule vitamin B12 is significant lower when using a low flux F6 compared to a high flux F60, concentration profiles will be different (Fig. IV-5). The blood concentration decrease and, with it, the dialysate concentration increase, are less pronounced in the low flux F6.
3.1.3.3. Conclusion The mass balance equation in a hemodialyzer was applied to derive the concentration profiles in blood and dialysate. Furthermore, the influence of the mutual flow directions was investigated and the use of counter current flows was found most effective as the driving force for diffusive transport is well maintained over the entire dialyzer length.
0
5
10
15
20
0 0,05 0,1 0,15 0,2 0,25
dialyzer axial x-position (m)
conc
entra
tion
(mm
ol/L
)
0
5
10
15
20
0 0,05 0,1 0,15 0,2 0,25
dialyzer axial x-position (m)
0
5
10
15
20
0 0,05 0,1 0,15 0,2 0,25
dialyzer axial x-position (m)
conc
entra
tion
(mm
ol/L
)
0
5
10
15
20
0 0,05 0,1 0,15 0,2 0,25
dialyzer axial x-position (m)

Mass transport in a hemodialyzer
151
Fig. IV-5: Vit B12 concentration profiles in blood (bold line) and dialysate (thin line) in a high flux F60 (full lines) and low flux F6 (dotted lines) with counter current (left panel) and co-
current flow directions (right panel).
3.2. Influence of flow rate on mass transport
When investigating the impact of flow on solute removal, one can consider the total dialyzer flow as controlled by the dialysis machine. It was however confirmed in Chapter II, that dialysate channeling (e.g. in the F6HPS dialyzer) causes maldistribution of flow. From this respect, the influence of total flows as well as flow distribution will be explained in this section and further applied on the F6HPS dialyzer.
3.2.1. Influence of total flow rates on solute removal
3.2.1.1. General description From the relation between the diffusive dialysance (D) and the mass transfer area coefficient (K0·A) (Eq. IV-12), the extraction ratio E (-) can be derived [108]. The larger the extraction ratio, the more efficient mass transfer is for a constant blood flow:
( )( )
( )[ ]( )[ ]α1ηexp
α1ηexp1Lβexpα1
Lβexp1Q
EB −⋅−
−⋅−=
⋅−⋅−⋅−−
==α
D Eq. IV-18
With α and η two parameters describing flow and mass transfer, respectively:
⋅=
−⋅
=
=
B
0
D
B
QAK
α1Lβη
α Eq. IV-19
0
10
20
30
40
0 0,05 0,1 0,15 0,2 0,25
dialyzer axial x-position (m)
conc
entra
tion
(µm
ol/L
)
0
10
20
30
40
0 0,05 0,1 0,15 0,2 0,25
dialyzer axial x-position (m)
0
10
20
30
40
0 0,05 0,1 0,15 0,2 0,25
dialyzer axial x-position (m)
conc
entra
tion
(µm
ol/L
)
0
10
20
30
40
0 0,05 0,1 0,15 0,2 0,25
dialyzer axial x-position (m)

Chapter IV
152
The variation of the extraction ratio E with the flow parameter α (0.3-1) and the mass transfer parameter η (0.3-3) is illustrated in Fig. IV-6. For a constant dialysate flow of 500mL/min, dialysis seems more efficient for smaller α and larger η. This implies the use of lower blood and/or higher dialysate flows, and dialyzers with a larger K0·A value. It should be remarked, however, that for economical reasons, a dialysate flow of 2-2.5 times the blood flow is currently clinically applied (α=0.4-0.5).
Fig. IV-6: Variation of the extraction ratio E as a function of the flow parameter α (left panel) and the mass transfer parameter η (right panel). Left panel: η=0.5 (thin dotted line), η=1 (thin line), η=2 (bold dotted line), and η=3 (bold line). Right panel: α=0.3 (thin dotted line), α=0.6
(thin line), α=0.9 (bold line).
Considering flow and mass transport of urea and vitamin B12 in a low flux F6 and high flux F60 dialyzer, typical values for the parameters α, η and E are given in Table IV-3.
Table IV-3: Parameters describing flow and mass transfer in F6/F60 dialyzers.
Solute QB mL/min
QD mL/min
α (-)
D mL/min
K0·A mL/min
η (-)
E (-)
Urea 200 500 0.4 180 / 185 619 / 709 3.09 / 3.55 0.90 / 0.93 250 500 0.5 201 / 213 558 / 684 2.23 / 2.74 0.80 / 0.85 300 500 0.6 222 / 242 570 / 736 1.90 / 2.45 0.74 / 0.81 350 500 0.7 243 / 270 606 / 821 1.73 / 2.35 0.69 / 0.77
Vit B12 200 500 0.4 60 / 118 76 / 207 0.38 / 1.04 0.30 / 0.59 250 500 0.5 61 / 126 75 / 205 0.30 / 0.82 0.24 / 0.50 300 500 0.6 62 / 134 74 / 210 0.25 / 0.70 0.21 / 0.45 350 500 0.7 63 / 142 74 / 217 0.21 / 0.62 0.18 / 0.41
blood flow QB; dialysate flow QD; flow parameter α; diffusive dialysance D; mass transfer area coefficient K0·A; mass transfer parameter η; extraction ratio E.
0
0,2
0,4
0,6
0,8
1
0 1 2 3parameter η (-)
0
0,2
0,4
0,6
0,8
1
0,2 0,4 0,6 0,8 1parameter α (-)
Ext
ract
ion
ratio
(-)
0
0,2
0,4
0,6
0,8
1
0 1 2 3parameter η (-)
0
0,2
0,4
0,6
0,8
1
0,2 0,4 0,6 0,8 1parameter α (-)
Ext
ract
ion
ratio
(-)

Mass transport in a hemodialyzer
153
3.2.1.2. Application for the F6HPS dialyzer For overall blood and dialysate flows of 300 and 500mL/min, Table IV-4 gives the flow and mass transport parameters in the F6HPS dialyzer. An extraction ratio E of 0.79 and 0.31 was found for the small molecule urea and the middle molecule vitamin B12, respectively. Those values are however maximum values, and are only obtained in the case both flows are homogeneously distributed over the dialyzer cross section. The influence of the non-homogeneous flow distribution as found with the SPECT measurements is studied more in detail in the following paragraph.
Table IV-4: Parameters describing flow and mass transfer in the F6HPS dialyzer.
Solute QB mL/min
QD mL/min
α (-)
D mL/min
K0·A mL/min
η (-)
E (-)
Urea 300 500 0.6 237 689 2.30 0.79 VitB12 300 500 0.6 92 122 0.41 0.31 blood flow QB; dialysate flow QD; flow parameter α; diffusive dialysance D; mass
transfer coefficient K0·A; mass transfer parameter η; extraction ratio E.
3.2.2. Influence of dialyzer flow distribution on solute removal
3.2.2.1. General description When flow is not homogeneously distributed in a hemodialyzer, Eq. IV-18 cannot be directly applied. Many flow maldistributions however occur due to flow channeling or preferential supply by the manifolds, and can be regarded as parallel maldistributions. Considering the dialyzer to be composed of a number of rectangular bars, the local extraction ratio e(ξ) can be derived from Eq. IV-18 and Eq. IV-19 [108]:
( )
( )( )
( )( )
( )( )
( )( )
( )( )
−⋅
⋅−
−⋅
⋅−
=
ξqξq1
ξqξakexp
ξqξq
ξqξq1
ξqξakexp1
ξe
D
B
B
0
D
B
D
B
B
0
Eq. IV-20
With qB(ξ) and qD(ξ) the local blood and dialysate flow, k0·a(ξ) the local mass transfer area coefficient K0·A, and ξ a spatial variable (0 ≤ ξ ≤ 1).
The overall dialyzer extraction ratio is then defined as a function of total mass transport J (mol/s):
B
iiBi
BB Q
eq
QCJE
∑ ⋅=
⋅= Eq. IV-21

Chapter IV
154
In a cylindrical dialyzer, local parameters will depend on the cylindrical coordinates r and θ (Fig. IV-7). In what follows, two different cases are discussed. First, a general formulation of the extraction ratio is given for a non-homogeneous but axi-symmetrical flow distribution. And second, the extraction ratio is derived for the flow distribution as found in the F6HPS dialyzer (described in Chapter II).
Fig. IV-7: Cylindrical skin (width dr) in a cross section of the dialyzer.
3.2.2.2. Axi-symmetrical non-homogeneous flow distribution To illustrate the impact of the non-homogeneous flow on the extraction ratio E, the local blood and dialysate flows qB(r) and qD(r) are described as a function of two parameters A and B [-5, 5], indicating the degree of inhomogeneity:
⋅−⋅−⋅⋅⋅
−
⋅⋅⋅−⋅=
⋅−⋅−⋅⋅⋅
−
⋅⋅⋅−⋅=
π
Q2π)5(QB52
21
πrBπ)5(Q
52(r)q
π
Q2π)5(QA52
21
πrAπ)5(Q
52(r)q
DD2D
D
BB2B
B
Eq. IV-22
Eq. IV-22 was obtained accounting for different conditions: first, the first derivative of those functions must be zero for r=0; second, the sum of all local flow rates has to match the overall flow; and third, qB(r) and qD(r) may not become equal to zero.
The local dialysate flow profile is for a different inhomogeneity parameter B and overall dialysate flow of 500mL/min illustrated in Fig. IV-8. The local blood flow has a similar profile.
θr θθr

Mass transport in a hemodialyzer
155
Fig. IV-8: Local flow qD(r) as function of radial distance r and inhomogeneity parameter B. Overall dialysate flow is 500mL/min
In each cylindrical skin (width dr), a first order approximation of blood and dialysate flow is 2·π·r·qB(r)·dr and 2·π·r·qD(r)·dr, respectively (Fig. IV-7). The membrane in between both flows has an area of 2·π·r·a0·dr, where a0 (-) represents a constant equal to Afiber·ρfiber (Afiber is the mass transfer area of a sinlge fiber and ρfiber is the fiber packing).
Total mass transport J (mol/s) can be written as:
( ) ( )
( )( )
( )( )
( )( ) ( )
( )( )
dr
rqrq
1rqak
exprqrq
rqrq1
rqak
exp1rqrπ2C
drrerqrπ2CJ
1
0
D
B
B
00
D
B
D
B
B
00
BBi
1
0BBi
⋅
−⋅
⋅−
−⋅
⋅−
⋅⋅⋅⋅⋅=
⋅⋅⋅⋅⋅⋅=
∫
∫
Eq. IV-23
Such that the extraction ratio E becomes:
( )( )
( )( )
( )( ) ( )
( )( )
( )∫
∫
⋅⋅
⋅
−⋅
⋅−
−⋅
⋅−
⋅⋅
=⋅
= 1
0B
1
0
D
B
B
00
D
B
D
B
B
00
B
BBi drrqr
dr
rqrq1
rqak
exprqrq
rqrq1
rqak
exp1rqr
QCJE
Eq. IV-24
To study the extraction ratio for a given solute, the parameter k0·a0 is first calculated based on the solute clearance for a particular homogeneously distributed blood and dialysate flow. For a QB/QD of 300/500mL/min, urea and vitamin B12 clearances (D = E/QB = J/CBi) of 237 and 92mL/min, respectively,
0
50
100
150
200
250
300
350
0 0,2 0,4 0,6 0,8 1
normalized radial distance r (-)
qD(r) (ml/min/m²)

Chapter IV
156
were reported by the manufacturer. Using Eq. IV-23 results in a k0·a0 value of 202 and 38 for urea and vitamin B12.
The extraction ratio E (Eq. IV-24) can now be determined for any given overall blood and dialysate flow, and for inhomogeneity parameters A and B in the range –5 to 5. Fig. IV-9 en Fig. IV-10 show the extraction ratio E(A,B) for urea and vitamin B12, respectively, normalized by the extraction ratio for a homogeneously distributed flow E(0,0), with an overall blood and dialysate flow of 300 and 500mL/min.
Fig. IV-9: Contour curves for the extraction ratio E(A,B) for urea, normalized for the extraction ratio with homogeneous flow distribution E(0,0).
For an axi-symmetrical non-homogeneous flow distribution, the influence of inhomogeneities on solute clearance and extraction ratio is rather limited. The worst case is obtained in the situation where high blood (dialysate) flows counter low dialysate (blood) flows. While the optimum efficiency is obviously obtained for (A,B) equal to (0,0), the optimum is shifting from (0,0) if one of both parameters is deviating from zero (Fig. IV-9).
Comparing the results for urea and vitamin B12, it can be remarked that for a smaller k0·a0 value, as found with vitamin B12 (Fig. IV-10), contour curves are more symmetrical with respect to the axis A and B. As a consequence, if one of the parameters is deviating from zero, the optimum is reached for values of the other parameter more approaching zero.
-5 -4 -3 -2 -1 0 1 2 3 4 5-5
-4
-3
-2
-1
0
1
2
3
4
5
0.986130.972270.944530.91680.87519
0.83359
A
B
-5 -4 -3 -2 -1 0 1 2 3 4 5-5
-4
-3
-2
-1
0
1
2
3
4
5
0.986130.972270.944530.91680.87519
0.83359
A
B

Mass transport in a hemodialyzer
157
Fig. IV-10: Contour curves for the extraction ratio E(A,B) for vitamin B12, normalized for the extraction ratio with homogeneous flow distribution E(0,0).
Finally, in reality the value of k0 is not constant because of the differences in boundary layer resistances near the membrane for different flow rates. As a consequence, it would be more accurate when substituting an appropriate relation k0(qB,qD) in Eq. IV-23 and Eq. IV-24.
3.2.2.3. In vitro measured non-homogeneous flow distribution With the experimental SPECT measurements, as reported in Chapter II, local blood and dialysate flow velocities were calculated in two perpendicular axial sections of the dialyzer, yz and xz-plane, divided in 16 slices of each 2.33mm in width (Fig. IV-11). Blood velocities were found to be uniform, while dialysate velocities were depending on the radial position.
Fig. IV-11: Schematic illustration of the dialyzer with the axial sections yz and xz.
The local extraction ratio was calculated using Eq. IV-20, where local blood and dialysate flows were drawn from the local velocities that were averaged over the different considered axial positions. The mass transfer area coefficient was
-5 -4 -3 -2 -1 0 1 2 3 4 5-5
-4
-3
-2
-1
0
1
2
3
4
5
0.992580.985170.977750.962920.94808
0.93325
0.911
B
A-5 -4 -3 -2 -1 0 1 2 3 4 5
-5
-4
-3
-2
-1
0
1
2
3
4
5
0.992580.985170.977750.962920.94808
0.93325
0.911
B
A

Chapter IV
158
derived in two different ways. First, k0·a was calculated according clearance data reported by the manufacturer, and assuming homogeneous flows. Second, the influence of non-uniform flows was considered by applying mass transfer area coefficients for the local blood and dialysate flow. The clearance dependency on dialysate flow was used, as found in literature reported by Leypoldt at al. [128] for urea and by Eloot et al. [241] for vitamin B12 (see also paragraph 4.2). Diffusive dialysance D was found to be enhanced by 12% and 41% for urea and vitamin B12, respectively, when increasing dialysate flow from 500 up to 800mL/min.
The results of both methods are illustrated in Fig. IV-12 for urea and Fig. IV-13 for vitamin B12. The left panels show the local extraction ratio based on the velocities found in the yz-plane, while the right panels show the results for the xz-plane. The extraction ratio for the case of absolutely homogeneous flows is indicated in dotted line.
Fig. IV-12: Local extraction ratio for urea in the yz-plane (left panel) and xz-plane (right panel) for homogeneous flows (dotted line), and non-homogeneous flows with constant (squares) and
varying (crosses) mass transfer area coefficient.
Fig. IV-13: Local extraction ratio for vitamin B12 in the yz-plane (left panel) and xz-plane (right panel) for homogeneous flows (dotted line), and non-homogeneous flows with constant (squares)
and varying (crosses) mass tansfer area coefficient.
0,0
0,2
0,4
0,6
0,8
1,0
0 1 2 3 4 5 6 7 8 9 10 11 12 13 14 15 16
radial position (slice)
extra
ctio
n ra
tio e
(-)
0,0
0,2
0,4
0,6
0,8
1,0
0 1 2 3 4 5 6 7 8 9 10 11 12 13 14 15 16
radial position (slice)
0,0
0,2
0,4
0,6
0,8
1,0
0 1 2 3 4 5 6 7 8 9 10 11 12 13 14 15 16
radial position (slice)
extra
ctio
n ra
tio e
(-)
0,0
0,2
0,4
0,6
0,8
1,0
0 1 2 3 4 5 6 7 8 9 10 11 12 13 14 15 16
radial position (slice)
0,0
0,1
0,2
0,3
0,4
0,5
0,6
0 1 2 3 4 5 6 7 8 9 10 11 12 13 14 15 16
radial position (slice)
extra
ctio
n ra
tio e
(-)
0,0
0,1
0,2
0,3
0,4
0,5
0,6
0 1 2 3 4 5 6 7 8 9 10 11 12 13 14 15 16
radial position (slice)
0,0
0,1
0,2
0,3
0,4
0,5
0,6
0 1 2 3 4 5 6 7 8 9 10 11 12 13 14 15 16
radial position (slice)
extra
ctio
n ra
tio e
(-)
0,0
0,1
0,2
0,3
0,4
0,5
0,6
0 1 2 3 4 5 6 7 8 9 10 11 12 13 14 15 16
radial position (slice)

Mass transport in a hemodialyzer
159
With non-homogeneous dialysate flows, regions of preferential flow paths result in enhanced mass transfer efficiency compared to mean mass transport found with homogeneously distributed flows. Although low dialysate velocities are localized near the dialyzer axis, those impeded dialysate flows have a non-negligble impact on the overall extraction ratio.
Integration of the local extraction ratio over the yz and xz-plane renders an overall planar extraction ratio that can be compared to the dialyzer extraction ratio as reported by the manufacturer (Table IV-5). The latter is 0.79 and 0.31 for urea and vitamin B12 mass removal, respectively.
For the non-uniform dialysate flow, accounting with the varying k0·a value, the extraction ratio for urea is decreased by 1.6 and 3.5% in the yz and xz-plane, respectively, while it is decreased by only 1% for vitamin B12 in both planes. It should be remarked however that the local k0·a values for the increased local dialysate flows might be too optimistic as not all fibers are bathing in a surrounding dialysate flow in case of flow channeling. As a consequence, mass transfer deteriorations as found using a constant k0·a value might be more realistic.
Table IV-5: Dialyzer extraction ratio E for urea and vitamin B12 in the case of homogeneous and non-homogeneous flow distribution.
Homogeneous Non-homogeneous distribution Constant k0·a Varying k0·a
Solute Section E (-) E (-) decrease (%) E (-) decrease (%)Urea YZ 0.790 0.749 5.2 0.777 1.6
XZ 0.790 0.721 8.7 0.762 3.5 VitB12 YZ 0.310 0.300 3.2 0.307 1.0
XZ 0.310 0.295 4.8 0.307 1.0 extraction ratio E, mass transfer area coefficient K0·A

Chapter IV
160
4. Experimental analysis of mass transport
Two experimental test sessions were carried out to investigate diffusive dialyzer clearance of small (paragraph 4.1) and middle molecules (paragraph 4.2) in different low flux dialyzer configurations.
4.1. Diffusive clearance of small molecules in different dialyzer flow configurations†
4.1.1. Abstract
Clearance of low (LMW) and small middle molecular weight (MMW) solutes was investigated in vitro for different dialyzer configurations and mutual flow directions. Single pass tests were performed with two low flux Fresenius F6HPS hemodialyzers placed in series (12 tests) and in parallel (6 tests), and results were compared with those for one single dialyzer (2 tests). Either high concentrated (45mS/cm) bicarbonate dialysis fluid (surrogate LMW) or trisodiumphosphate (surrogate MMW) concentration (31mS/cm) was used as blood substitution fluid. Standard blood and dialysate flows of 250 and 500mL/min, respectively, were prescribed. Clearance was derived from conductivity measurements in blood and dialysate compartment, correcting for the overall ultrafiltration rate of 0.1-0.5L/h.
In a single dialyzer, changing the counter current flow to co-current deteriorates diffusive clearance by 14% (LMW) and 18% (MMW). Compared to one single dialyzer using counter current flow, clearance increases by 3 and 8% (LMW) and by 15 and 18% (MMW) using two dialyzers in parallel and in series, respectively. As a consequence, the benefit of using a second dialyzer is more prominent for larger molecules. Moreover, pressure profiles drawn for the different configurations show the impact of limited convection on diffusive clearance.
4.1.2. Introduction
Adequate dialysis can be characterized by clearance index K·t/Vurea equal to 1.2-1.4 [231,242]. This indicator is larger for better clearance, K, longer dialysis time, t, and/or for a smaller patient distribution volume, Vurea. In general, an increase in
† The contents of this section was published in Int J Artif Organs 2004;27(3):205-213.
Diffusive clearance of small and middle-sized molecules in combined dialyzer flow configurations S. Eloot, JY. De Vos, R. Hombrouckx, and P. Verdonck

Mass transport in a hemodialyzer
161
K·t/Vurea by 0.1 is associated with a substantially decreased risk of death from cardiac, cerebrovascular, and infectious diseases [90]. This clearance index, however, measures only the removal of low molecular weight (LMW) substances, which occurs predominantly by diffusion, and does not consider clearance of larger molecules. Babb et al. [91] was the first to introduce the term ‘middle molecular weight’ (MMW) solutes, playing an important role in uremic toxicity, especially in processes related to inflammation, atherogenesis and malnutrition. Moreover, he defined their clearance as the product of overall mass transfer coefficient, K0 (proportional to solute diffusivity and inversely proportional to diffusion distance), and membrane area, A. Both parameters (K·t/Vurea and K0·A) are linked by the Michaels equation [85], which states that diffusive clearance, K, is a function of blood and dialysate flow rates and of the dialyzer specific parameter K0·A.
To investigate impact of dialyzer membrane area, A, Scribner [243] connected three hemodialyzers in series in order to create a 3m² unit. Doubling the surface area using two dialyzers in parallel does not result in a doubling of urea clearance [244]. Several strategies have been proposed in the past to increase dialysis efficiency, K, so as to allow shorter dialysis treatment time, t, while maintaining adequacy. Paired filtration dialysis, using two units in series (hemofilter and hemodialyzer), was first introduced in the 80’s and was later optimized by Ronco et al. [245]. Jaffrin [246] described clearance in such hemodiafiltration models for the case in which the hemofilter is located upstream from the dialyzer using mid-re-infusion or post dilution, as well as for the case the hemodialyzer is placed upstream the hemofilter. Utilizing two high flux hemodialyzers placed in series, with blood flows of 500mL/min, von Albertini et al. [247] evaluated shortened dialysis sessions (i.e. 115 minutes). Although they reported good biochemical control in the patients, precautions were taken with respect to hypotension due to the fast body fluid removal. With an analogous hemodiafiltration strategy, Velasquez et al. [248] found a 28% increase in K·t/Vurea, compared with conventional hemodialysis.
In the present study, the diffusive clearance in parallel and serial placed low flux dialyzers was measured in vitro for different flow configurations. The aim was to better understand the underlying mechanism in dialyzer performance, rather than to find a method to minimize dialysis session time neither to ameliorate dialysis adequacy with obese patients. In particular, diffusion of small molecules was investigated and compared with the kinetics of a middle molecular weight solute, which is small enough to be mainly transported by diffusion. With this in mind, the influence of mutual flow directions was studied in low flux dialyzers placed

Chapter IV
162
in series and in parallel. By splitting the blood and/or dialysate lines over both dialyzers, the influence of mutual flow rates was also investigated. Without considering the individual contributions of each dialyzer, the overall solute removal in each configuration was then compared with the results for a single dialyzer.
4.1.3. Materials and Methods
An experimental in vitro setup (Fig. IV-14) was developed, mimicking clinical dialysis using a Formula 2000 dialysis machine (Bellco Spa, Mirandola, Italy). As a consequence, blood, dialysate and ultrafiltration flow inside low flux F6HPS dialyzers (Fresenius Medical Care, Bad Homburg, Germany) were easily adjusted within physiological range. Overall blood and dialysate flow rates were chosen constant at 250 and 500mL/min, respectively, while an ultrafiltration rate was prescribed of 0.5 and 0.1L/h for the measurements with the LMW and MMW molecules, respectively.
Fig. IV-14: Scheme of the in vitro setup. Blood substitution fluid (full line) and dialysis fluid (dotted line) are flowing single pass through the F6HPS dialyzer(s).
Bicarbonate dialysis fluid of 14mS/cm conductivity was flowing in the dialysate compartment, while a concentrated solution of successively LMW and MMW molecules was used single pass in the blood compartment. These blood-substituting fluids were heated up to 37°C by recirculation using a Simplex machine (Bellco Spa, Mirandola, Italy). To investigate clearance of LMW
Bellco Formula
250mL/min
Blood substitution fluid
Bellco Simplex 37°C
Dialyzer configuration
500mL/minDialysis fluid generation
RO water
A B
S/cm S/cm
S/cm
Balance
Balance
Bellco Formula
250mL/min
Blood substitution fluid
Bellco Simplex 37°C
Dialyzer configuration
500mL/minDialysis fluid generation
RO water
A B
S/cm S/cm
S/cm
Balance
Balance

Mass transport in a hemodialyzer
163
molecules, standard bicarbonate dialysis fluid was mixed with A84 (acid) and B84 (bicarbonate) concentrates (producer: Sterima nv, Bissegem, Belgium; distributor: Fresenius Medical Care, Wilrijk, Belgium) up to 45mS/cm conductivity and obeying the prescribed A to B volume ratio. As middle-sized molecules are defined in the ‘European Best Practice Guidelines for Haemodialysis’ [84] by a molecular weight in the range of 300-12000Da, the conductive trisodiumphosphate Na3PO4 (Vel Chemicals, Belgium) with a MW equal to 395Da was chosen as small middle molecule. This molecule was dissolved in bicarbonate dialysis fluid (41g Na3PO4 / L dialysis fluid) and the solution reached an overall conductivity of 31mS/cm.
Potential precipitation as well as stability of both solutions was controlled in the blood substitute reservoir during the whole test session (i.e. 4h for tests with one type of solution) performing temperature and conductivity measurements with an LF340 conductivity probe (WTW, Weilheim, Germany). To quantify dialyzer clearance, two extra conductivity probes were foreseen on blood outlet and dialysate outlet line, respectively, in specially developed probe chambers (Fig. IV-14). All conductivity probes were calibrated before each test session by immersing the probes into a control standard solution of 0.01mol/L potassium chloride (KCl). Out of the measured conductivity values COND (mS/cm), corresponding concentrations C ((L AB / L dialysis fluid) for LMW and (g Na3PO4 / L dialysis fluid) for MMW molecules) were calculated from calibration curves derived in advance:
13.620COND0.425COND0.043C :PONa
0.02027COND0.00286COND0.00018C :AB2
43
2
−⋅−⋅=
+⋅−⋅= Eq. IV-25
Analyzing experimental data, the dependence of ultrafiltration QUF (mL/min) on total blood-side clearance Kblood (mL/min) is assumed to be linear [249]:
UFblood QTrKK ⋅+= Eq. IV-26
The diffusive clearance, K, is a function of blood inlet and outlet concentrations, CBi and CBo, and inlet blood flow rate QB (mL/min):
B
Bi
BoBi QC
CCK ⋅
−= Eq. IV-27
The transmittance coefficient Tr is defined as [250]:
⋅=
BQK-1STr Eq. IV-28

Chapter IV
164
For the considered molecules, the sieving coefficient S (-) can be assumed equal to one such that Eq. IV-26 can be written as:
UF
Bi
BoB
Bi
BoBiblood Q
CC
QC
CCK ⋅+⋅
−= Eq. IV-29
From dialysate outlet concentration, CDo, and inlet dialysate flow rate, QD (mL/min), total dialysate-side clearance Kdialysate (mL/min) is defined as [85]:
UFD
Bi
Dodialysate QQ
CC
K +⋅= Eq. IV-30
Both fluid flow rates were derived from gravimetrically measured blood and dialysate outflow (Fig. IV-14), accounting for the corresponding ultrafiltration rate.
For each test solution, 20 different dialyzer flow configurations were investigated in a cross over study by changing the number of dialyzers (1 or 2), the positioning of dialyzers (in series (IS) or in parallel (IP)), the mutual flow directions inside one dialyzer (co-current (CC) or counter current (CTC) flow), and by choosing a split or chain dialysate flow of 250 or 500mL/min, respectively (Fig. IV-15, Fig. IV-16, and Fig. IV-17). Conductivities for each single pass test with a certain configuration were registered after the probe values remained constant during 5 minutes.
Fig. IV-15: Clearance tests with AB and trisodiumphosphate solution in a single dialyzer (S). Pressure profiles of blood substitution fluid (bold line) and dialysis fluid (thin line for AB
solution tests; dotted line for Na3PO4 tests) are drawn.
S 1 S 2
30
40
50
60
70
80
90
100
pres
sure
(mm
Hg)

Mass transport in a hemodialyzer
165
Fig. IV-16: Tests with the AB and trisodiumphosphate solution flowing inside in series placed dialyzers (IS). Pressure profiles of blood substitution fluid (bold line) and dialysis
fluid (thin line for AB solution tests; dotted line for Na3PO4 tests) are drawn.
4.1.4. Experimental results
An overview of blood clearances, Kblood, for both LMW and MMW molecules is given in Table IV-6 for the 20 different dialyzer flow combinations. The dialysate clearances, Kdialysate, which were calculated as verification, deviate no more than 5% from the clearances calculated at dialyzer blood side.
IS 1 IS 2 IS 3 IS 4
30
40
50
60
70
80
90
100
pres
sure
(mm
Hg)
IS 5 IS 6 IS 7 IS 8
30
40
50
60
70
80
90
100
pres
sure
(mm
Hg)
IS 9 IS 10 IS 11 IS 12
30
40
50
60
70
80
90
100
pres
sure
(mm
Hg)

Chapter IV
166
Fig. IV-17: In parallel placed dialyzers (IP) investigating the clearance of AB and trisodiumphosphate. Pressure profiles of blood substitution fluid (bold line) and dialysis fluid
(thin line for AB solution tests; dotted line for Na3PO4 tests) are drawn.
For standard clinical dialysis, using one single dialyzer with counter current flows, a clearance of 215mL/min and 176mL/min is found for small and middle-sized molecules, respectively. However, the clearance decreases by 14% (LMW) and 18% (MMW) changing the counter current flow to co-current.
The results of serial configurations (IS) are clustered in three virtual groups (Table IV-6 and Fig. IV-16). In a first group (IS1-4), blood and dialysate inflow are in different dialyzers and both flows pass through both devices. In the second group (IS5-8), blood and dialysate again pass through both dialyzers, but in this case, the inflow of blood and dialysate is in the same dialyzer. In the final subgroup (IS9-12), a chain blood flow is combined with a dialysate flow split over the two dialyzers. It can be observed from Table IV-6 that although flow directions are changed within one category, the effect on LMW and MMW clearances is limited (small standard deviation) (Table IV-6). The combination
IP 1 IP 2 IP 3
30
40
50
60
70
80
90
100
pres
sure
(mm
Hg)
IP 5IP 4 IP 6
30
40
50
60
70
80
90
100
pres
sure
(mm
Hg)

Mass transport in a hemodialyzer
167
IS1-4, with a chain blood and dialysate flow and each inlet in a different dialyzer, gives the best results (225 and 193mL/min for LMW and MMW molecules, respectively). Compared to twice counter current flows, the co-current flow configuration deteriorates clearance by 2% (LMW) and 8% (MMW). Having the inlet chain flows in the same dialyzer (IS 5-8), decreases the clearance by 16% for LMW as well as for MMW molecules (189 compared to 225mL/min for LMW, and 163 compared to 193mL/min for MMW). Splitting dialysate flow over two dialyzers (IS 9-12), results in a QB/QD ratio of 1 and yields results in between those of the former described categories (211 and 173mL/min for LMW and MMW molecule removal, respectively).
Table IV-6: Overview of the blood clearances Kblood (mL/min), calculated for the low and middle molecular weight molecules.
ID CTC - CC QD split LMW : AB solution MMW : Na3PO4
S 1 CTC - 215 176 S 2 CC - 184 145 IS 1 CTC - CTC I 233 209 IS 2 CC - CTC I 230 196 IS 3 CTC - CC I 225 190 IS 4 CC - CC I 213
225 ± 8
177
193 ± 13
IS 5 CTC - CTC I 185 166 IS 6 CC - CTC I 190 162 IS 7 CTC - CC I 193 165 IS 8 CC - CC I 187
189 ± 4
158
163 ± 4
IS 9 CTC - CTC V 219 188 IS 10 CC - CTC V 215 170 IS 11 CTC - CC V 213 171 IS 12 CC - CC V 198
211 ± 9
161
173 ± 11
IP 1 CTC - CTC V 221 202 IP 2 CC - CTC V 207 171 IP 3 CC - CC V 176 154 IP 4 CTC - CTC I 213 180 IP 5 CC - CTC I 204 170 IP 6 CC - CC I 190 156
Column 2 indicates whether the flow in the dialyzers is CTC (counter current) or CC (co-current), column 3 indicates whether dialysis fluid flow is split (V) over the dialyzers or not (I).
In the case two dialyzers are placed in parallel, for a blood flow rate of 125mL/min in each dialyzer, we can distinguish between a split (IP 1-3) and a chain (IP 4-6) dialysate flow of 250 and 500mL/min, respectively (Table IV-6 and Fig. IV-17). A split dialysate flow is better in the case of twice counter current flows, while clearance results are equal and even worse for co-current

Chapter IV
168
flow in one or two dialyzers, respectively. Although the use of two dialyzers in parallel results in clearance increase by 3% (LMW) and 15% (MMW) compared with one single dialyzer for counter current flows, two dialyzers placed in series ameliorates the clearance even more (8% and 18% for LMW and MMW, respectively).
4.1.5. Discussion
4.1.5.1. The experimental method The technique of monitoring conductivity is a practical method to derive solute clearance, and is already clinically used at the dialysate-side to derive urea clearance [251]. The choice of potential blood substitution fluids in vitro is, however, limited. A and B concentrates, composed by molecules with a molecular weight in the range of 20-180Da, as well as Na3PO4 (MW=395Da), could be dissolved efficiently in dialysis fluid resulting in a stable mixture with appropriate conductivity (45 and 31mS/cm, respectively). By dissolving the molecules of interest in bicarbonate dialysis fluid of 14mS/cm, no unwanted ion exchanges took place between blood and dialysate compartment.
To investigate, in particular, diffusive clearance in different dialyzer configurations, low flux dialyzers as well as a limited ultrafiltration rate was proposed. Kerr et al. [252] did not find any differences between membrane types of six different low flux dialyzers with respect to urea and phosphate clearance in clinical practice. As a consequence, the results found here for a polysulphone membrane (thickness 40µm, fiber inner diameter 200µm, ultrafiltration coefficient 8.5mL/h/mmHg) may be extrapolated for other membrane types (i.e. cuprammonium, hemophan,…). To avoid substantial backfiltration as would occur e.g. in the case of zero overall ultrafiltration, the ultrafiltration rate was set to 0.5L/h for the tests with the 45mS/cm AB concentration. However, for the trisodiumphosphate solution with analogous conductivity and ultrafiltration rate values, concentration polarisation resulted in a blockage of the membrane. The blood substitute concentration was therefore diluted to a conductivity of 31mS/cm and an ultrafiltration flow of only 0.1L/h was applied.
The flow rate in the blood compartment was chosen in the range of clinical European practice, i.e. 250mL/min [31]. Since a low flux dialyzer is used, clearance is not limited by the relative low applied blood flow. Although mass transfer in large area devices is increased for high dialysate flow rates [253], Sigdell and Tersteegen [32] found, in the case of zero ultrafiltration, a practically feasible limit for any clinical dialysis situation of a dialysate flow twice as high

Mass transport in a hemodialyzer
169
as blood flow. Therefore, dialysate flow rate was chosen constant at 500mL/min. To ensure that split flows were well balanced over both dialyzers, dialysis lines were taken perfectly symmetric and the used dialyzers were samples from the same lot number to obtain comparable individual dialyzer resistances. Moreover, the crossover studies were concluded with clearance measurements using the single dialyzer configuration, showing no differences with previously performed measurements.
4.1.5.2. Which configuration to choose Although it is obvious that the configuration using two dialyzers placed in series or in parallel with counter current flows gives the best and second best clearance results, it is very interesting to have an idea about the advantage of making the extra cost by consuming a second dialyzer. With respect to the small molecules, the concentration reduction increases only from 89 up to 93% and 90% if a second dialyzer is added in series or in parallel, respectively. Trisodiumphosphate removal, however, rises from 68 up to 81% with both configurations. As a consequence, although small molecules are cleared more efficiently in all configurations, middle-sized molecules gain more advantage of an increased surface area by using a second dialyzer, as described earlier by Henderson et al. [254]. It should be remarked however that with respect to practical usage, the parallel configuration is preferable as deaeration of the dialyzers is easier to perform. In case water quality is in doubt, dialyzers in parallel should be considered, as backfiltration is less likely to occur.
With counter current flows, clearance increases by 3-8% (LMW) and 15-19% (MMW) adding a second dialyzer in parallel or in series, respectively. However, increasing blood and dialysate flow rates from QB300-QD600mL/min up to QB400-QD800mL/min, Allen et al. [253] found a urea clearance increase of about 25%. As a consequence, dealing with an adequate vascular access and as long as the water use is economically sensible, increasing blood and dialysate flow rates results in better clearances.
4.1.5.3. Comparison of in vitro results with clinical data With respect to mutual blood and dialysate flow directions, co-current flow decreases clearance of small molecules (ureum, creatinine) even more in vivo (21-26%) [255] compared to in vitro (-14%). Compared with a single dialyzer, Fritz et al. [256] found urea (single pool) spK·t/Vurea increase of 14.4% and 16.8% for parallel and serial placed dialyzers, respectively, in large hemodialysis patients. Using two high flux F80A (Fresenius, Bad Homburg, Germany) dialyzers in parallel with a split blood and a split dialysate flow rate of each 200

Chapter IV
170
and 400mL/min, respectively, urea spK·t/Vurea increases by 15% while the clearance of MMW molecules (surrogate iohexol of MW 821D) increases by 39% [244]. Both clinical studies report equal LMW clearance improvements for the parallel setup, while less expressed ameliorations are found in our in vitro study. The discrepancy might be due to the fact that high flux dialyzers are used in vivo to obtain sufficient body fluid loss, while we were especially interested in pure diffusive clearances using low flux dialyzers. This assumption implies that the higher the convection, the higher the clearance, even more expressed for larger molecules [100,129].
4.1.5.4. Correlation of clearance with pressure distribution To explain the discrepancies between the results for a serial and parallel setup, as well as for the different virtual groups, pressure distribution and ultrafiltration profile per dialyzer are pointed out for each test setup. The pressure drop, ∆P, in the blood compartment is described theoretically by Poiseuille’s law for laminar flow in a circular tube:
B4 Q
DπLµ128∆P ⋅
⋅⋅⋅
= Eq. IV-31
With µ the dynamic viscosity of the blood substitute solution at 37°C (0.78·E-3 Pa·s), L the length of a hollow fiber (0.23m), D the fiber inner diameter (200µm) and QB the mean blood flow rate in a single fiber (m3/s) (total number of fibers is 9200). For an overall blood flow rate of 250mL/min the pressure drop is 15.5mmHg. As the velocity profile in the non-circular inner space of the dialysate compartment differs from a parabolic one, Poiseuille’s law is not applicable. The dialysis fluid pressure drop was therefore taken from a previous developed numerical model of the same dialyzer [141] where a pressure drop of 7.5mmHg was found for an overall dialysate flow rate of 500mL/min. Dealing with laminar blood and dialysate flows, pressure drops are proportional with the corresponding flow rates and are, as a consequence, divided by two as blood or dialysate lines are split over two dialyzers. The transmembrane pressure TMP (mmHg) is defined as a function of ultrafiltration flow QUF (mL/h) and the ultrafiltration coefficient KUF (8.5mL/h/mmHg for the F6HPS):
UF
UF
KQTMP = Eq. IV-32
This results in a TMP of 58.8mmHg and 11.8mmHg for QUF equal to 0.5L/h and 0.1L/h, respectively. For dialyzers placed in series or in parallel, overall TMP values are divided by two as the ultrafiltration coefficient is doubled. Assuming a fictitious inlet blood pressure of 100mmHg, the blood-side pressure drop over

Mass transport in a hemodialyzer
171
both dialyzers is drawn as a linear function of axial distance (bold line in Fig. IV-15, Fig. IV-16, and Fig. IV-17). Moreover, the linear pressure drop in the dialysate compartment (thin (AB) and dotted line (Na3PO4) in Fig. IV-15, Fig. IV-16, and Fig. IV-17) is derived from the corresponding transmembrane pressure, which is the mean difference between blood and dialysate pressure. The area in between both curves is then a measure for the ultrafiltration flow rate such that backfiltration may occur whenever the dialysate pressure exceeds the blood pressure (Fig. IV-15, Fig. IV-16, and Fig. IV-17).
This theoretical derivation of pressure profiles allows us to calculate the ultrafiltration flow per dialyzer for the different configurations (Table IV-7). It can be remarked that for the test setups belonging to the same virtual group, the overall ultrafiltration rate is divided over both dialyzers according to the same ratio. For serial placed dialyzers, there is a correlation of dialyzer clearance with pressure and ultrafiltration distributions. Moreover, the clearance of small as well as middle-sized molecules increases as the difference in amount of ultrafiltration per dialyzer increases (Table IV-7 and Fig. IV-16). As a consequence, the occurrence of backfiltration in one of the dialyzers, which is more likely to happen in smaller dialyzer fibers [129] or/and for dialyzers placed in series compared with the parallel configuration [257], ameliorates the overall clearance. This phenomenon, previously proven for larger molecules [100,129], seems to have a similar effect for smaller molecules.
Table IV-7: Ultrafiltration flow (forward positive and backward negative) in the individual dialyzers for the single, serial and parallel configurations.
LMW : AB solution MMW : Na3PO4 ID Quf dialyzer1
mL/min Quf dialyzer2 mL/min
QUF total L/h
Quf dialyzer1 mL/min
Quf dialyzer2 mL/min
QUF total L/h
S1 8.33 - 0.5 1.67 - 0.1 S2 8.33 - 0.5 1.67 - 0.1
IS 1-4 5.80 2.53 0.5 2.46 -0.79 0.1 IS 5-8 4.73 3.60 0.5 1.40 0.27 0.1
IS 9-12 5.26 3.07 0.5 1.93 -0.26 0.1 IP 1-3 4.17 4.17 0.5 0.83 0.83 0.1 IP 4-6 4.70 3.63 0.5 1.37 0.30 0.1
Considering dialyzers in a parallel setup, it can be remarked that an equal ultrafiltration distribution favors overall molecule clearance (Table IV-7 and Fig. IV-17), except for co-current flows. Moreover, the more dialysate flow exceeds

Chapter IV
172
blood flow (IP4-6), co-current flow configurations become even more adequate, as published before [100].
4.1.6. Conclusion
The developed in vitro setup investigates the influence of dialyzer and flow configurations on the diffusive clearance of small and middle-sized molecules. The benefits of using an extra dialyzer are quite limited for small molecules. For small MMW solutes, however, the diffusive clearance is significantly ameliorated when the surface area is doubled. The best configuration consists of serially placed dialyzers with chain blood and dialysate flows entering different dialyzers. Interpreting pressure profiles for the different configurations, it seems that the ultrafiltration distribution in dual dialyzers plays an even more important role than the mutual blood and dialysate flow directions. As a consequence, although convection and diffusion are described as two separate phenomena, in practice we cannot distinguish the single contributions given by the two transport mechanisms.
4.1.7. Acknowledgements
The authors wish to thank H Aldakkak for her assistance and S Bliki for his technical support.
4.2. Diffusive clearance of middle molecules in different dialyzer flow configurations†
4.2.1. Abstract
Some studies found that the removal of middle molecules has a long-term effect on mortality and, even more, is enhanced by high flux dialysis. In order to enhance middle molecule removal in a low flux dialyzer, the present study aimed at investigating the combined impact of dialyzer flows and membrane surface area.
Blood and dialysate flows were varied within the clinical range 300-500mL/min and 500-800mL/min, respectively, while ultrafiltration rate was kept constant at 0.1L/h. Single pass tests were performed in vitro in a single Fresenius F6HPS
† The contents of this section was submitted for publication
Middle molecule removal in low-flux polysulphone dialyzers: impact of flow and surface area on whole-body and dialyzer clearances
S. Eloot, JY. De Vos, F. De Vos, R. Hombrouckx, and P. Verdonck

Mass transport in a hemodialyzer
173
dialyzer (3 tests) and in serially (5 tests) and parallel (3 tests) connected dialyzers. The blood substitute fluid consisted of dialysis fluid in which radioactive labeled vitamin B12 (MW1355) was dissolved. Dialyzer clearance as well as whole-body clearance was calculated from radioactivity concentrations of samples taken at the inlet and outlet blood line.
Adding a second dialyzer in series or parallel ameliorated significantly overall dialyzer and whole-body clearance, except for the highest applied blood flows of 500mL/min. Better solute removal was also obtained with higher dialysate flows, while the use of higher blood flows seemed only advantageous when using a single dialyzer. Analysis of the ultrafiltration profiles in the different configurations illustrated that enhancing the internal filtration rate ameliorates convective transport of middle molecules.
In conclusion, adequate solute removal results from a number of interactions, as there are, blood and dialysate flows, membrane surface area, filtration profile, and concentration profiles in the blood and dialysate compartment.
4.2.2. Introduction
The adequacy of chronic dialysis therapy is determined by the amount of solute removal from the patient. Although not necessarily toxic in its free form, urea is still currently used as the standard marker for small molecule removal, and the clearance index K·t/Vurea is calculated and compared to the target number 1.2-1.4 [231]. Small molecule removal is mainly achieved by diffusion and is influenced by blood and dialysate flows, membrane thickness and dialyzer surface area.
Although refuted by the HEMO study [258], several other studies [110,230] reported the long-term effect of larger uremic solutes on mortality and morbidity. Using vitamin B12 as a surrogate marker for middle molecule transport, the mortality risk lowered by approximately 5% in patients treated with a 10% higher K·t/VvitB12, independent of K·t/Vurea [259]. For middle molecules, which are substantially larger than urea (MW≥500Da) [229] and predominantly removed by convection, Babb et al. [91] defined the square meter hypothesis, stating that increasing dialyzer surface area only becomes advantageous for higher molecular weight solutes. Moreover, middle molecules are characterized by a kinetic behavior not resembling that of urea during hemodialysis using low flux membranes [260].
The present study aimed to investigate the diffusive solute removal of middle molecules (i.e. vitamin B12) by performing in vitro experiments in low flux dialyzers mimicking clinical dialysis. Due to its importance for small molecule

Chapter IV
174
removal [261], the impact of an increased blood and/or dialysate flow was studied. Furthermore, surface area was substantially enlarged by performing in vitro clearance tests with two low flux dialyzers placed either in series or in parallel. As dialyzer clearances do not reveal directly any changes within the uremic patient, a theoretical description of vitamin B12 compartmental kinetics was performed. An analysis of the impact of dialyzer flow and membrane area on the whole-body clearance allows formulating some recommendations to improve middle molecule removal, and, with it, patient survival rate.
4.2.3. Materials and Methods
4.2.3.1. Experiments In an experimental in vitro setup, solute removal was investigated in different flow configurations using low flux F6HPS dialyzers (Fresenius Medical Care, Bad Homburg, Germany). Mimicking clinical dialysis using a Formula 2000 dialysis machine (Bellco Spa, Mirandola, Italy), blood and dialysate flows were easily set in the range 300-500mL/min and 500-800mL/min, respectively. Ultrafiltration rate was limited and prescribed at 0.1L/h. During the experiments, blood flow was measured gravimetrically at the outflow, accounting for the applied ultrafiltration rate, while dialysate and ultrafiltration flow were read from the dialysis machine display.
Conductivity, concentration, and temperature of the dialysis fluid were monitored and adjusted by the dialysis machine in order to keep them constant. Vitamin B12 (MW1355) was chosen as an in vitro surrogate marker in the blood compartment to investigate clearance of middle molecules. For the preparation of the blood substitution fluid, three vitamin B12 capsules of each 20µg and labeled with Cobalt-57 (0.1 µCi/capsule) (Amersham Health, UK) were dissolved in a reservoir containing 30L dialysis fluid. The mixed solution was maintained thermostatic at 37°C by recirculation using a Simplex machine (Bellco Spa, Mirandola, Italy). Cobalt-57 is a radionuclide with a half-life of 271.7 days, and energy of 122.1keV. An adequacy test was performed to ascertain that no free Cobalt was present in the blood substitute solution. After the test session, all waste fluids were stored in tanks and, together with the dialysis lines and dialyzers, put in isolation during one year.
For each configuration and under steady flow conditions, 2mL samples were taken at the inlet and outlet blood line. After the test session, all samples were placed during 20min in a Cobra gamma-multichannel-counter equipped with a 3x3" NaI(Tl) crystal set at 122±18keV (Canberra-Packard, USA). Total numbers

Mass transport in a hemodialyzer
175
of counts of 1521±217 and 952±210 were recorded for the inlet and outlet samples, respectively. From the detected number of counts per minute CPM, sample solute concentrations C (ng/L) were calculated using the following calibration curve:
CPM3,98C ⋅= Eq. IV-33
4.2.3.2. Dialyzer clearance Total blood-side clearance Kblood (mL/min) is function of diffusive clearance K (mL/min), and varies linearly with the ultrafiltration flow QUF (mL/min) [250]:
UF
BB
Bi
BoBiUFblood Q
QK1SQ
CCC
QTrKK ⋅
−⋅+⋅
−=⋅+= Eq. IV-34
with Tr the transmittance coefficient [262], defined as a function of flow conditions and membrane properties [263], CBi and CBo the blood inlet and outlet concentrations, and QB the blood inlet flow (mL/min). The sieving coefficient S (-) is the proportionality factor between the solute flux and fluid flux across the membrane. Although often considered constant for a given solute-membrane combination, S varies depending on the ultrafiltration flux. For the low ultrafiltration flow of 1.67mL/min applied here, the sieving coefficient can be approximated equal to one, even for vitamin B12 with a molecular weight of 1355Da [226,264]. Eq. IV-34 can then be rewritten as:
UF
Bi
BoB
Bi
BoBiblood Q
CC
QC
CCK ⋅+⋅
−= Eq. IV-35
The overall mass transfer area coefficient K0·A (mL/min) represents the theoretical maximal clearance for a particular solute-dialyzer combination [265] and determines the solute clearance for a given set of blood and dialysate flows. For counter current flows and a negligible ultrafiltration rate, K0·A is defined as [85]:
−
−
⋅
−
=⋅
D
B
D
B
B0
QK1
QK1
ln
1
QAK Eq. IV-36
Whereas diffusive clearance K and mass transfer area coefficient K0·A depend directly on the blood flow, an adequate comparison between solute removal in different flow configurations is performed by considering the extraction ratio E (%) [108], defined as the diffusive clearance normalized by blood flow:

Chapter IV
176
100
CCC
100QKE
Bi
BoBi
B
⋅−
=⋅= Eq. IV-37
4.2.3.3. Whole-body clearance From a clinical point of view it is more appropriate to investigate whole-body clearance, which is a better measure of overall treatment efficacy [266]. Therefore, two-pool kinetic modeling was performed using input from literature and the in vitro tests (Fig. IV-18).
Fig. IV-18: Two-pool model to assess the whole-body clearance with respect to the middle molecule vitamin B12.
Total distribution volume (Vtot=40L) consisted of two distinct volumes: the perfused or extracellular compartment (V1=13.3L) and the non-perfused or intracellular compartment (V2=26.7L) [267]. Ultrafiltration QUF=1.67mL/min (cf. in vitro) was assumed to occur in both compartments (-dV1/dt and -dV2/dt) in proportion to the compartmental volume ratio.
Each compartment was theoretically characterized by a homogeneous solute concentration with pre-dialysis concentration C1_pre=C2_pre=1.997µg/L (cf. in vitro). Solute generation rate and access and cardiopulmonary recirculation have a negligible influence on whole-body clearance and were neglected in this study. During dialysis, solute removal is driven by the patient’s concentration (C) and the concentration difference between both compartments (C2-C1), and is proportional with dialyzer clearance (K) and inter-compartmental clearance (K12=125mL/min [267]), respectively. Dialyzer clearance K was different for each configuration (cf. in vitro), and was assumed to be constant throughout the entire dialysis session.
K
CBi
CDi
CDo
CBo
dialyzer
QB
QD
QB - QUF
QD + QUF
V1, C1V2, C2K12
Vtot = 40L
26.7L 13.3L
K
CBi
CDi
CDo
CBo
dialyzer
QB
QD
QB - QUF
QD + QUF
V1, C1V2, C2K12
Vtot = 40L
26.7L 13.3L

Mass transport in a hemodialyzer
177
The time variation of the compartment concentration was, for a particular solute, determined by solving a series of mass balance equations for both compartments [268,269]:
( ) ( )
( ) ( )
−⋅−=
−⋅+⋅=
121222
1212111
CCKdt
CVd
CCKCKdt
CVd
Eq. IV-38
Equations were solved for a complete dialysis session time of 240min, using the JSim software (National Simulation Resource, Seattle, W).
In analogy with the well-known urea reduction rate, URR, the middle molecule reduction rate in the patient, MRR (%), is defined as a function of pre (C1_pre) and immediate post-dialysis vitamin B12 concentration (C1_post) in the perfused compartment:
100
CCC
MRR1_pre
1_post1_preB12vit ⋅
−= Eq. IV-39
4.2.3.4. Study parameters In a crossover study, 11 different flow configurations were investigated (Table IV-8 and Fig. IV-19): 3 configurations using a single dialyzer (S1-S3), 5 configurations with two dialyzers placed in series (IS1-IS5), and 3 using a parallel dialyzer configuration (IP1-IP3). The test with the first configuration was repeated to check reproducibility. The main parameters under study were the blood and dialysate flows, varying within the clinical range of 300-500mL/min and 500-800mL/min, respectively. All tests were performed with counter current flows. In each parallel configuration dialysate flow was distributed to both dialyzers. With the serially connected dialyzers, however, the influence of splitting the dialysate lines (X) or not (I) was investigated.
4.2.3.5. Ultrafiltration profiles When using two dialyzers in series or in parallel, the applied ultrafiltration rate (1.67mL/min) was divided over both dialyzers. In order to better understand the intrinsic contribution of convection to the overall clearance, a previously described theoretical method [239] was used to calculate the pressure distribution and, with it, the ultrafiltration profile in each dialyzer configuration. From the latter, the ultrafiltration flow in each single dialyzer was derived, accounting for an ultrafiltration coefficient, KUF, of 8.5mL/h/mmHg for the F6HPS.

Chapter IV
178
Fig. IV-19: Overview of the different investigated dialyzer flow configurations: three configurations using a single dialyzer (S1-3), three configurations using a linked dialysate flow
in two dialyzers in series (IS1-3), two configurations using a split dialysate flow in two dialyzers in series (IS4-5), and three configurations using parallel placed dialyzers (IP1-3).
4.2.3.6. Statistical analysis Values are reported as mean ± standard deviation. Correlations between parameters were investigated by performing linear regression analysis (Pearson). Statistical analysis was carried out using the Student t-Test on normally distributed populations, with P<0.05 as the limit of significant difference (Sigmastat, Jandel Corporation, US).
4.2.4. Experimental results
An overview of dialyzer clearance (K), mass transfer area coefficient (K0·A), extraction rate (E), and whole-body clearance (MRR) is shown in Table IV-8 for the different flow configurations. Besides the overall flow rates, blood and dialysate flows in each dialyzer were also added (noted as qB and qD) in order to give a better idea about mutual flow rates in each dialyzer within a serial and parallel configuration. The theoretical blood flows of 300 and 500mL/min corresponded to a measured flow rate of 296±2 and 500±2mL/min, respectively.
For standard clinical dialysis, using a single dialyzer with a counter current blood and dialysate flow of 300 and 500mL/min, respectively, we found a blood-side clearance Kblood of 76mL/min, extraction ratio E of 25%, and middle molecule whole-body clearance MRR of 47%. Fig. IV-20 shows E and MRR as a function of clearance Kblood: E and MRR increase monotonically for higher clearances according Eq. IV-37 and Eq. IV-39. Strong correlation was found between dialyzer clearance K and whole-body clearance MRR (P<0.001, R=0.984).
IS 1-3 IS 4-5 IP 1-3S 1-3
2
1
2
1
IS 1-3 IS 4-5 IP 1-3S 1-3
2
1
2
1
2
1
2
1

Mass transport in a hemodialyzer
179
Because the extraction ratio E is, in contrast with Kblood and MRR, smaller for larger blood flows (500mL/min), E was only correlated with Kblood when considering a constant blood flow of 300 or 500mL/min (P<0.001, R=0.999 and P=0.0016, R=0.998, respectively).
Table IV-8: Efficiency parameters for the different studied flow configurations.
Overall flow Flow in 1 dialyzer Ultrafiltration QB
mL/min QD
mL/min qB
mL/min qD
mL/minKblood
mL/minK0·A
mL/minE %
MRR %
QUF 1 mL/min
QUF 2 mL/min
Single dialyzer S1 300 500 300 500 76 94 25 47 1.67 n.a. S2 300 800 300 800 107 142 36 57 1.67 n.a. S3 500 800 500 800 174 241 34 71 1.67 n.a.
Dialyzers in series IS1 300 500 (I) 300 500 128 193 42 63 1.76 -0.09 IS2 300 800 (I) 300 800 162 263 54 69 1.92 -0.25 IS3 500 800 (I) 500 800 182 257 36 72 2.36 -0.69 IS4 300 800 (X) 300 400 170 286 57 71 1.71 -0.04 IS5 500 800 (X) 500 400 142 183 28 66 2.15 -0.47
Dialyzers in parallel IP1 300 500 (X) 150 250 119 174 40 61 0.84 0.84 IP2 300 800 (X) 150 400 145 220 49 66 0.84 0.84 IP3 500 800 (X) 250 400 167 228 33 70 0.84 0.84
overall blood flow QB; overall dialysate flow QD; flow is not split (I); flow is split over both dialyzers (X); blood flow in one dialyzer qB; dialysate flow in one dialyzer qD; blood-side
clearance Kblood; overall mass transfer area coefficient K0·A; extraction ratio E; middle molecule reduction rate MRR; ultrafiltration rates in each dialyzer QUF1 and QUF2.
Fig. IV-20: Correlations between extraction ratio E (%) and middle molecule reduction rate MRR (%), and clearance K (mL/min): E with QB 300mL/min (circles) and 500mL/min
(rhombs), MRR with QB 300mL/min (crosses) and 500mL/min (triangles).
0
20
40
60
80
50 100 150 200K (mL/min)
E (%
) - M
RR
(%)

Chapter IV
180
The mass transfer area coefficient K0·A in a single dialyzer increased from 94mL/min for QB/QD 300/500mL/min up to 142 and 214mL/min when increasing QB and QD, respectively (Table IV-8). For each flow setting, except for the serial configuration with QB/QD 300/500mL/min, the use of two dialyzers did not result in a doubling of mass transfer area coefficient, as would be expected theoretically. Although not significant (P=0.083), doubling of membrane area resulted in a lower K0·A, most expressed with the parallel setup (7-53% decrease), and the 500/800mL/min flow setting (46-62% decrease).
The benefit of adding a second dialyzer in series or in parallel is shown in Table IV-9 by means of percentage increase (%) of the extraction ratio E and the reduction rate MRR, compared to the single dialyzer setup. For standard clinical overall flow rates (QB/QD=300/500mL/min), the highest efficiency increase was obtained for the serially connected dialyzers. It is worth noticing, however, that solute removal effectiveness became negligible and even disadvantageous for a blood/dialysate flow of 500/800mL/min in a serial and parallel dialyzer configuration.
Table IV-9: Influence of adding an extra dialyzer in series or in parallel for a similar overall blood and dialysate flow.
Overall flow (mL/min) Configuration E increase MRR increase QB QD comparison % % 300 500 S1 → IS1 69 32
S1 → IP1 58 28 300 800 S2 → IS2 50 21
S2 → IS4 57 23 S2 → IP2 34 15
500 800 S3 → IS3 4 2 S3 → IS5 -19 -8 S3 → IP3 -4 -1
overall blood flow QB; overall dialysate flow QD; (S1)…(S3): see Fig. IV-19; extraction ratio E; middle molecule reduction rate MMR
Increasing dialysate flow from 500mL/min up to 800mL/min favored middle molecule reduction rate MRR in the single dialyzer (+21%) as well as in the serial (+11/+13%) and parallel (+9%) configurations (Table IV-10). In series placed dialyzers rendered a better performance if dialysate flow was split over both dialyzers (+13% with IS4), compared to the use of a linked dialysate flow (+11% with IS2). Increasing blood flow from 300mL/min to 500mL/min deteriorated the extraction ratio E in a single (-4%), serial (-33/-51%), and parallel (-31%) dialyzer configuration (Table IV-11). The middle molecule

Mass transport in a hemodialyzer
181
reduction rate MRR, however, was significantly increased in a single dialyzer (+24%), while it was slightly increased in a serial configuration with no split dialysate lines (+4%) and in a parallel configuration (+6%) (Table IV-11).
Table IV-10: Influence of augmenting the overall dialysate flow from 500mL/min up to 800mL/min, for a constant blood flow of 300mL/min.
Configuration E increase MRR increase comparison % %
S1 → S2 44 21
IS1 → IS2 27 11
IS1 → IS4 34 13
IP1 → IP2 22 9 (S1)…(IP1): see Fig. IV-19; SR: extraction ratio
E; middle molecule reduction rate MRR.
The ultrafiltration rates corresponding to each dialyzer in a serial and parallel setup are shown in Table IV-8. For the investigated parallel configurations, ultrafiltration was equally divided over both dialyzers, independently of blood and dialysate flow, and no backfiltration occurred. Dialyzers placed in series, on the contrary, were characterized by a resulting forward filtration in the first and backfiltration in the second dialyzer (for numbering see Fig. IV-19). Moreover, efficiency parameters increased as the difference in amount of ultrafiltration per dialyzer increased, except when higher blood flows (500mL/min) and/or a split dialysate flow was applied.
Table IV-11: Influence of augmenting the overall blood flow from 300mL/min up to 500mL/min, for a constant dialysate flow of 800mL/min.
Configuration E increase MRR increase comparison % %
S2 → S3 -4 24
IS2 → IS3 -33 4
IS4 → IS5 -51 -7
IP2 → IP3 -31 6 (S2)…(IP2): see Fig. IV-19; extraction ratio E;
middle molecule reduction rate MRR. A negative increase corresponds to a decrease.
4.2.5. Discussion
The present study aimed to study the combined influence of flow and area parameters on dialyzer and whole-body clearance of middle molecules in a low flux dialyzer. For this purpose, in vitro experiments were performed using radioactive labeled vitamin B12 as a surrogate middle molecule marker

Chapter IV
182
(MW1355). The latter was dissolved in dialysis fluid in order to impede any other net solute transport between blood and dialysate compartment. To investigate in particular diffusive clearance with different dialyzer and flow combinations, low flux dialyzers (KUF = 8.5mL/h/mmHg) as well as a limited ultrafiltration rate (1.67mL/min) was applied. Whole-body clearance was derived from a theoretical description of middle molecule kinetics using a two-pool model.
The most striking results of this study are summarized as follows. First, adding a second dialyzer in series or parallel ameliorates overall dialyzer and whole-body clearance, except for the highest applied blood flows of 500mL/min (Table IV-9). Most advantage of the surface area doubling was obtained with dialyzers placed in series (Table IV-8). Second, whole-body clearance is, compared to the extraction ratio, less effectuated if an additional dialyzer (Table IV-9) or a higher dialysate flow (Table IV-10) is used. And third, while an augmented dialysate flow ameliorates whole-body clearance as well as extraction ratio (Table IV-10), the latter is even negatively influenced when using an increased blood flow of 500mL/min (Table IV-11).
4.2.5.1. Influence of increased surface area Doubling the surface area, using two identical dialyzers in parallel, was found to ameliorate vitamin B12 (MW1355) MRR with 40%, while an increase of MRR by 38% was found previously for the surrogate iohexol (MW821) [244]. While the urea reduction rate, URR, increases only 3.7% and 5.2% for parallel and serially connected dialyzers using a split dialysate line [256], Mandolfo et al. [261] found an increase of β-2 microglobulin (MW11800) reduction rate by 39% enlarging the surface area with 57%. These results imply that molecules with a higher molecular weight gain more advantage of an increased surface area, compared to the smaller molecules [254]. Our results are in very good agreement with those findings.
There is a considerable difference in overall mass transfer coefficient, K0, between a single (A=1.3m²) and dual (A=2.6m²) dialyzer configuration. This phenomenon is more explicit for the parallel dialyzer setup, as the higher blood and dialysate flows in the serial setup ameliorate mass transfer. The discrepancies with respect to K0 are even more important using blood flows of 500mL/min (46/62% decrease in the serial and 53% decrease in the parallel setup). As a linked counter current dialysate flow is used for serially connected dialyzers, spent dialysate enters the first dialyzer and diminishes the transmembrane concentration gradient, and with it, the diffusive transport in the

Mass transport in a hemodialyzer
183
first dialyzer (IS3, IS5). Furthermore, in the parallel dialyzer configuration (IP3), using fresh dialysate in each dialyzer, the solute removed from the blood cannot be drained efficiently with the lower dialysate flow of 400mL/min. In agreement with earlier performed studies [244,253], improvement in effective performance due to surface area increase is lower than theoretically assumed.
4.2.5.2. Influence of dialysate flow Increasing overall dialysate flow from 500 to 800mL/min resulted in an improved middle molecule reduction rate in all configurations. It is known from previous studies that the clearance of small solutes largely depends on dialysate flow [128,253], while the clearance of middle molecules, and especially low molecular weight proteins, largely depends on convective transport induced by high ultrafiltration rates [249]. In general, the clearance responsiveness to dialysate flow variations decreases with increasing molecular weight [270], but still seems to be important for MW of 1355Da (vitamin B12) as shown in the present study.
Splitting the dialysate lines in the serial configuration (IS4-5) results in a lower dialysate flow in each dialyzer (factor 2). Such a reduced dialysate flow can limit mass transport, as equilibration between plasma water and dialysate concentrations may occur prior to dialysate drainage from the dialyzer [254]. It can be seen however from our results, that the advantage of using fresh dialysate at each dialyzer inlet is more important than the impact of a lower dialysate flow (IS4 versus IS2), except for the highest applied blood flows (IS5 versus IS3). Furthermore, it should be remarked that applying lower dialysate flows, deviating from the common clinical practice of 2-2.5 times the blood flow [32], is still appropriate when using dialyzers with a higher fiber packing or with fibers with a micro wave design [121,261], instead of using the here presented F6HPS dialyzer.
Both findings, improving mass transport by using a higher dialysate flow [253] or using a modified dialyzer design [261,271], are dealing with a decrease in dialysate-side mass transfer resistance. The latter was found to be proportional with 1/QD
0.8 [272] and seems to match for our experimental data. The decrease in resistance, and, with it, the increase in overall mass transfer, is due to the presence of turbulence in the dialysate pathway [253], the decrease in boundary layer resistance, and/or the reduction in flow channeling with improved fiber bundle perfusion [117,119,120,128].
4.2.5.3. Influence of blood flow In combination with a dialysate flow of 800mL/min, an increase of blood flow from 300 to 500mL/min resulted in a lower extraction ratio in all configurations,

Chapter IV
184
while only a remarkable MRR increase was observed when using a single dialyzer. With a low flux polysulfone dialyzer (F6HPS), the lower membrane permeability limits mass transport of larger solutes. Under these circumstances, increasing overall blood flow has a reduced effect on solute clearance. This limitation of dialyzer efficiency is even more pronounced when using a dialysate flow equal to blood flow (IS5). While we found a decreased extraction rate in a single dialyzer of 4% with QB/QD 500/800mL/min (compared to 300/800mL/min), others have shown that vitamin B12 extraction rate decreased by 71% using the mid flux Filtral AN69 dialyzer with QB/QD 500/500mL/min (compared to 100/500mL/min) [222,226].
Next to the membrane limiting aspect, which is important in our case of predominantly diffusive transport, the use of increased blood flows is more advantageous in case convection comes into play. An increased blood flow exerts higher shear rates at the wall, such that the polarization layer thickness is diminished. Moreover, the rate of ultrafiltration as well as the sieving coefficient is, on its turn, considerably influenced by the thickness of this layer [273]. Due to the interaction between diffusion and convection, total clearance is significantly less than the sum of diffusive and convective clearances. This is due to the fact that convective mass transport, proportional to local solute concentrations, is reduced by diffusion. Moreover, the decrease in local blood flow, induced by ultrafiltration, causes the blood-side resistance gradually to increase, and, with it, the diffusive clearance to decrease. This problem is even more complicated for solutes with a molecular weight exceeding 2000Da [226], as these are partially rejected by the dialysis membrane.
4.2.5.4. Ultrafiltration profiles Although the overall applied ultrafiltration was limited, the pressure drop profiles in blood and dialysate may induce an important amount of forward filtration, cancelled by a corresponding rate of backfiltration. This Starling cycle effect of ultrafiltration-backfiltration, also referred to as internal filtration, was earlier found to increase the clearance by 2mL/min in the absence of overall ultrafiltration [246]. Moreover, for a fixed TMP, an increased internal filtration, by using fibers with smaller inner diameter [274] or by using longer fibers [131], increases the convective contribution to overall mass transport. The latter phenomenon can explain why the serial setup (doubling of length) is more advantageous with respect to dialyzer and whole-body clearances, compared to the parallel setup.

Mass transport in a hemodialyzer
185
4.2.5.5. Model limitations Finally, it should be noted that care must be taken when using calculated vitamin B12 clearances to assess whole-body middle molecule removal, as in vitro measured clearances may differ from clinical results. This is due to in vivo membrane fouling by protein deposition [56,142], protein binding of the solute [275], and non-equilibrated solute distribution between blood cells and plasma. Furthermore, it is unclear to what extent the kinetics and dialyzer clearance of vitamin B12 are similar to those of other middle molecules. Because vitamin B12 is not useful as an in vivo surrogate due to extensive protein binding [276], its kinetic behavior within the patient was derived theoretically using in vitro and literature data. Although most of our findings were reported earlier in numerous studies, our study is unique in coupling the different influencing parameters.
4.2.6. Conclusion
The present study investigated dialyzer and whole-body clearances of middle molecules in low flux dialyzers. The benefits of using an increased membrane surface area and/or increased blood and dialysate flow were investigated using a radioactive tracer. The best configuration consisted of serially connected dialyzers, as this gains most advantage of doubling the membrane surface area. A better extraction ratio is also obtained with higher dialysate flows. The use of higher blood flows, however, seemed only advantageous when using a single dialyzer, as other aspects like blood-dialysate flow ratio, internal filtration, and blood-dialysate concentration profiles, come into play when using serially or parallel connected dialyzers. For small ultrafiltration rates using low flux dialyzers, enhancing the rate of internal filtration by elongating the fibers using two dialyzers in series, ameliorates the convective transport of middle molecules. In conclusion, adequate solute removal results from a number of parameters, which continuously interact with each other.
4.2.7. Acknowledgements
The authors wish to thank Dr. De Sadeleer for making the nuclear room to our disposal, H. Marzougui for his technical contribution, and D. De Wachter for his review.

Chapter IV
186
5. Numerical analysis of mass transport†
5.1. Influence of dialyzer geometry on mass transport
5.1.1. Abstract
While dialyzer manufacturers only provide information about mass removal under well-defined flow and solute conditions in commercially available dialyzers, this study aimed at evaluating dialyzer performance numerically for different dialyzer geometries.
A three-dimensional finite volume model of a single fiber in a high flux polysulphone dialyzer (Fresenius F60) was developed. Different equations describe blood and dialysate flow (Navier-Stokes), radial filtration flow (Darcy), and solute transport (convection-diffusion). Fluid and membrane properties were derived from in vitro and in vivo tests as well as from literature data. Urea (MW60) was used as marker to simulate small molecule removal, while middle molecule transport was modeled using vitamin B12 (MW1355) and inulin (MW5200). Fiber diameter and length were changed in a wide range for evaluation of solute removal efficiency. The latter was found enhanced for larger fiber lengths and/or smaller diameters. Furthermore, the impact of fiber dimensions was more pronounced for the middle molecules compared to urea.
5.1.2. Background
During the progression of renal failure, a host of solutes, normally cleared by the healthy kidneys, is retained in the body of the uremic patient. This retention gives rise to a progressive deterioration of physiologic functions and of the clinical condition [277]. Hemodialysis is one of the possible treatments to remove those solutes from the blood when the human kidneys have lost their native function. During this therapy, blood is pumped out of the body into an extracorporeal circuit that contains a hollow fiber dialyzer. The latter is built of thousands of small fibers with a diameter of approximately 200µm and a total area of 0.8-2.5m². Blood and dialysate are circulated counter currently at the interior and exterior of the fibers, respectively. Those fibers are constructed from a semi-permeable membrane, which permits the diffusive and/or convective passage of
† The contents of this section was submitted for publication
Optimization of dialyzer performance using a three-dimensional finite volume model S. Eloot, J. Vierendeels, D. De Wachter, and P. Verdonck

Mass transport in a hemodialyzer
187
uremic solutes but restricts the transfer of blood proteins and cells from the blood towards the dialysate compartment.
Recently, the European Uremic Toxin Work Group (EUTox) published a comprehensive list of all uremic solutes known to date [229]. Based on their physicochemical characteristics, one can distinguish between three major groups of uremic retention solutes: small water-soluble compounds (MW<500), the protein-bound solutes (MW also mostly <500), and the so-called middle molecules (MW>500). Of the 90 compounds identified, 68 belong to the low molecular weight range, whereby 23 of these are protein-bound. Of the remaining 22 middle molecules, 12 even exceeded MW15000.
While the small molecules are dominantly removed by diffusion, larger molecules are better removed by convection. Although diffusion is the major transport process in hemodialysis, a transmembrane pressure is applied in order to restore the fluid balance in the patient by ultrafiltration. Furthermore, both transport processes interfere continuously with each other, such that it is impossible to specify theoretically the exact contribution of diffusion and convection to the overall dialyzer clearance.
Since the validated basic work of Villarroel et al. [278], describing diffusive and convective solute transport in hemodialyzers, numerous other studies were done to optimize the theoretical description [222,223,226,264,279-281]. While some of them did not count for the flow variation along the dialyzer length [264,279-281], others [222,223] assumed a linear ultrafiltration profile, but neglected the non-Newtonian blood characteristics.
The present study aimed at investigating solute transport accounting for the local flow and fluid properties, using a three-dimensional numerical model. After calibration and validation of the model, the impact of dialyzer dimensions on dialyzer clearance was studied. Small (i.e. urea MW60) as well as middle molecules (i.e. vitamin B12 MW1355 and inulin MW5200) were used as markers for dialyzer performance.
5.1.3. Materials and Methods
5.1.3.1. Geometry and domain characterization A three-dimensional numerical model was developed of the blood-membrane interface in a single fiber over the entire dialyzer length. The parameter settings were assessed for a high flux polysulphone Fresenius F60 dialyzer (Fresenius Medical Care, Bad Homburg, Germany), consisting of 9200 fibers. Each fiber is

Chapter IV
188
characterized by an inner diameter of 200µm, membrane thickness of 40µm, and active length of 230mm.
Abstraction was made of the fiber packing (733 fibers/cm²) in the dialyzer to isolate a twelfth part of a single fiber with its surrounding membrane and dialysate compartment (Fig. IV-21). For the implementation in the numerical model, properties of the three domains, i.e. blood, dialysate, and the semi-permeable membrane, were derived from literature and experimental investigations [141].
Fig. IV-21: Schematic illustration of a hollow fiber dialyzer on macroscopic (dialyzer) and microscopic (fiber) level. Blood and dialysate inlet (subscript i) and outlet (subscript o) flows
and concentrations are indicated as QBi, QBo, QDi, QDo, CBi, CBo, CDi, and CDo.
Membrane permeability characteristics were obtained from filtration tests through the membrane [142]. The tests were performed for forward and backfiltration using sterile dialyzers as well as samples in which a protein layer was induced on the membrane simulating a clinical session. The permeabilities of the skin (inner layer) and bulk (outer layer) of the polysulphone membrane were implemented as a series of two resistances. Furthermore, the influence of a protein layer on the overall permeability of the membrane was incorporated as a higher resistive inner layer, based on an overall membrane permeability of 3650nm²/s/Pa.
From dialysate samples taken in vivo from the supply and the drain of the dialyzer, dynamic viscosity and density were determined. As both properties were not influenced by dialysis, dialysate flow was assumed as an incompressible, isothermal, laminar Newtonian flow with a constant viscosity (0.687mPa·s) and density (1008kg/m³).
dialysate inflow QDi CDi
blood outflow QBo CBo
Dialyzer
QDo CDo Ultrafiltration Quf > 0
Quf < 0Blood capillary
Membrane
Dialysate
QBi CBi
QDi CDi
QBo CBo
Fiber bundle Fiber
z
x
dialysate outflow QDo CDo
blood inflow QBi CBi
dialysate inflow QDi CDi
blood outflow QBo CBo
Dialyzer
QDo CDo Ultrafiltration Quf > 0
Quf < 0Blood capillary
Membrane
Dialysate
QBi CBi
QDi CDi
QBo CBo
Fiber bundle Fiber
z
x
dialysate outflow QDo CDo
blood inflow QBi CBi

Mass transport in a hemodialyzer
189
An extensive literature study preceded an accurate modeling of the non-Newtonian blood flow, characterized by a viscosity varying in radial and axial direction. The shear thinning behavior as well as the dependence of the blood viscosity on the local hematocrit was described by the Quemada model [63]. Furthermore, the redistribution of the red blood cells in capillary blood flow results in a plasma skimming layer near the wall, and was described by Fahraeus and Lindqvist [65,147]. The radial variation of the hematocrit was deduced by Lerche et al. [66]. Blood density was defined as a function of plasma density (1030kg/m³) and varied with the local hematocrit. An inlet hematocrit of 30% was considered.
5.1.3.2. Governing equations The calculation of dialyzer transport consists of two phases (Fluent, Sheffield, UK). With the fluid dynamic computation, velocities and pressures were obtained in the entire domain, while mass transfer calculation rendered the solute concentration distribution. With respect to the three domains, different equations were used.
In the blood and dialysate domain, conservation of mass and momentum were described by the Navier-Stokes equations:
0uµ-puuρ
0u
=∆⋅∇+∇•⋅
=•∇ Eq. IV-40
With u the local mass average fluid velocity vector (m/s), ρ the local density (kg/m³), p the local pressure (Pa), ∇ is the gradient operator in three-dimensional
Cartesian coordinates
∂∂
∂∂
∂∂
=∇z
,y
,x
, and ∆ the Laplace operator
2
2
2
2
2
2
zyx ∂∂
+∂∂
+∂∂
=∆ .
The transmembrane transport, function of the membrane permeability k (m²/s/Pa), was described by the Darcy equation for porous media:
pku ∇⋅= Eq. IV-41
This equation is only valid when the local Reynolds number is small enough (Re<1), which is the case for small ultrafiltration rates.
Knowing the velocities in all nodes of the finite volumes, the mass transfer can be calculated with the stationary convection-diffusion equation in the absence of a source or sink reaction:

Chapter IV
190
( ) ( ) 0CDCuS S =∇⋅∇−∇•⋅ Eq. IV-42
DS represents the solute diffusion coefficient (m²/s) and C the solute concentration (mol/m³). Although this equation is valid for all domains, note that the diffusion coefficient DS is different for the three domains. Furthermore, while the sieving coefficient S (-) can be eliminated in the blood and dialysate domain, S can deviate from unity in the membrane domain [101,236,237]. A sieving coefficient equal to unity corresponds to unhindered solute transport through the membrane (e.g. small molecules like urea), while S equal to zero implies that the membrane is impermeable to the considered solute (e.g. large proteins like albumin).
5.1.3.3. Boundary conditions In the blood and dialysate inlet, a Poiseuille respectively uniform velocity profile was defined (Dirichlet boundary condition). Furthermore, a constant solute concentration was described at the blood inlet, while the inlet dialysate concentration was assumed zero. The outlet flow conditions were specified as a flow percentage distribution in both domains to apply the desired ultrafiltration flow. A Neumann boundary condition was defined for the concentrations at the
outlets, stating that the concentration gradient is zero in flow direction: 0nC
=∂∂
Oncotic pressure, which is exerted by the plasma proteins and opposes the hydrostatic transmembrane pressure, was implemented as a discontinuous pressure drop at the skin-bulk interface. Moreover, as hemoconcentration takes place in axial direction, the oncotic pressure was varying with hematocrit. At the blood inlet, an oncotic pressure of 25mmHg was considered [30,101].
The domain boundaries were modeled either as symmetry or as wall where no-slip occurs. At symmetry planes, Neumann conditions were applied to eliminate velocity components and concentration differences perpendicular to the symmetry plane. At fixed walls, no-slip conditions were applied, resulting in a Dirichlet boundary condition for the velocity ( u =0).
5.1.3.4. Calibration and validation of the diffusivities While the solute diffusion coefficients in blood and dialysate were known from literature [282], membrane diffusivity was derived from the inlet and outlet blood (CBi and CBo) and dialysate (CDi and CDo) concentrations. Blood concentrations (mol/L) were assessed from the definition of the diffusive dialyzer clearance K (mL/min) for a given blood flow QB (mL/min):

Mass transport in a hemodialyzer
191
B
Bi
BoBi QC
CCK ⋅
−= Eq. IV-43
The manufacturer typically reports K values for given blood/dialysate flow combinations (e.g. 300/500mL/min) [238,283]. Dialysate concentrations (mol/L) were calculated from the mass balance of the dialyzer, which is a function of blood and dialysate flows QB and QD (mL/min) [85] (Fig. IV-21):
( ) ( ) DDiDoBBoBi QCCQCC ⋅−=⋅− Eq. IV-44
Although the concentration difference between blood and dialysate, ∆C, will decrease exponentially along the dialyzer length, a linear approximation is allowed for low and middle molecules [226]:
( )L∆C∆C
dz∆Cd oi −
= Eq. IV-45
With ∆Ci and ∆Co the blood-dialysate concentration difference at the blood inlet and outlet, respectively.
By multiplying both terms with the mass flux J (mol/s), as defined by Fick’s law:
∆CAKJ 0 ⋅⋅= Eq. IV-46
And after integration of Eq. IV-45 and solving it for the mass flux J, clearance K can then be written as a function of the mass transfer coefficient K0 (m/s), the reciprocal of total resistance R0, and the logarithmic mean concentration difference ∆Clm [85]:
( ) ( )
−−
−−−⋅⋅=⋅
⋅=
DiBo
DoBi
DiBoDoBi
Bi0lm
Bi
0
CCCC
ln
CCCCCA
R1∆C
CAK
K Eq. IV-47
Furthermore, as the mass transfer coefficient K0 for radial diffusive mass transfer (x-direction) is equal to DS/∆x, membrane diffusivity DM (m²/s) can be derived from total resistance R0 and the convective mass transfer coefficients 1/RB and 1/RD (m/s):
D
D
M
M
B
BDMB0 D
∆xD∆x
D∆x
RRRR ++=++= Eq. IV-48
RB, RM, and RD represent the blood-side, membrane and dialysate-side resistance, respectively. ∆xB and ∆xD symbolize a characteristic distance for diffusion in the blood and dialysate domain, while ∆xM is the membrane thickness. As ∆xB and ∆xD were not a priori known, the diffusion coefficient in the membrane for a

Chapter IV
192
particular solute was derived iteratively until the clearance as found with the simulations matches the manufacturer’s data for a QB/QD ratio equal to 250/500mL/min. The power of the numerical model was checked performing simulations for a QB and QD equal to 300 and 500mL/min, and comparing the numerically derived clearance value with the manufacturer’s data [238,283].
5.1.3.5. Parameter study The influence on dialyzer performance of different dialyzer dimensions was investigated for solutes of distinct molecular weight. All simulations were performed with an overall blood and dialysate flow of 250 and 500mL/min, while an ultrafiltration rate of 2L/h was maintained.
The choice of the uremic solutes was mainly driven by the available clearance data from the manufacturer. Urea (MW60) was used as marker for small water-soluble solutes, while vitamin B12 (MW1355) and inulin (MW5200) were used as middle molecule markers. The main input parameters for those solutes are given in Table IV-12.
Table IV-12: Mass transport parameters for urea, vitamin B12, and inulin in a high flux polysulphone F60 dialyzer with QB/QD equal to 250/500mL/min.
Solute MW Da
K mL/min
S -
DB m²/s
DD m²/s
DM m²/s
Urea 60 213 1 17.5·E-10 19.0·E-10 3.9·E-10 Vitamin B12 1355 126 1 4.0·E-10 4.2·E-10 1.5·E-10
Inulin 5200 61 1 1.65·E-10 1.74·E-10 0.54·E-10 molecular weight MW; diffusive clearance K; sieving coefficient S; diffusion coefficient in
blood, dialysate, and membrane DB, DD, and DM, respectively.
The effect on solute clearance of the fiber and dialyzer dimensions was investigated for different radial and axial sizes. Fiber inner diameters of 150-200-250µm were studied, with corresponding size scaling in the membrane and dialysate domain to maintain the relative fiber packing. The membrane characteristics, permeability and diffusivity, were however adapted to maintain the original properties. Keeping the total membrane area constant, the number of fibers was changed. The mean velocity in both compartments was calculated accounting for the radial dimensions, the total number of fibers, and the constant overall blood and dialysate flow of 250 and 500mL/min.
Active fiber lengths of 180-230-280mm were examined, as well as a dialyzer fiber one and a half times as long (345mm) and two times as long (460mm) as the standard fiber of 230mm in length with an inner diameter of 200µm.

Mass transport in a hemodialyzer
193
In order to perform a transparent evaluation of the influence of the different investigated parameters, the extraction ratio E (-), defined as clearance K normalized by blood flow QB, was calculated with each simulation [108]:
Bi
BoBi
B CCC
QKE
−== Eq. IV-49
5.1.3.6. Statistical analysis Correlations between parameters were investigated by performing linear regression analysis (Pearson). A general linear model (GLM) multivariate procedure was used to investigate differences in curve slopes. The GLM multivariate procedure provides regression analysis and analysis of variance for multiple dependent variables by one or more factor variables. The limit of significant difference was set to P<0.05.
5.1.4. Results
5.1.4.1. Calibration and validation of the diffusivities The membrane diffusion coefficients, obtained by calibrating the numerical model with QB and QD equal to 250 and 500mL/min, are given in Table IV-12, together with the blood and dialysate diffusivities. Membrane diffusivities were adapted iteratively until the dialyzer clearance, calculated from the blood-side inlet and outlet concentrations, matched the data given by the manufacturer. Membrane diffusivities were found a factor 2.7-4.9 smaller than blood and dialysate diffusivities. Furthermore, urea diffusion in blood and dialysate is a factor 4 and 11 higher compared to vitamin B12 and inulin diffusion, respectively, while the diffusion of urea through the membrane is a factor 3-7 higher compared to the diffusion of the studied middle molecules.
Simulating mass transport for a QB and QD of 300 and 500mL/min, respectively, no significant differences were found between the clearance values as derived from the simulations and those reported by Fresenius Medical Care (Table IV-13). For a blood flow increased from 250 up to 300mL/min, urea clearance and extraction ratio were enhanced by 14%, resulting in an extraction ratio of 0.96 (compared to 0.85). The middle molecule clearances of vitamin B12 and inulin were increased by 6 and 20%, corresponding with extraction ratios of 0.54 and 0.29, respectively (compared to 0.51 and 0.24).

Chapter IV
194
Table IV-13: Mass transport parameters for urea, vitamin B12, and inulin in a polysulphone F60 dialyzer with QB and QD equal to 250 or 300, and 500mL/min.
QB=250mL/min QB=300mL/min Solute MW
Da K
mL/min KFresenius
mL/min Ksimulation
mL/min Deviation
% Urea 60 213 242 241 0.4
Vitamin B12 1355 126 134 134 0 Inulin 5200 61 73 73 0
molecular weight MW; diffusive clearance K; Deviation between simulated and published data.
5.1.4.2. Influence of molecular weight Fig. IV-22 shows the concentration profiles in the xz-plane (indicated on Fig. IV-21) for urea, vitamin B12, and inulin in a standard F60 dialyzer with overall blood and dialysate flows of 250 and 500mL/min, respectively. The radial concentration variation, most pronounced for inulin, illustrates the lower diffusivities in blood and dialysate compared to urea. Comparing outlet with inlet solute concentrations, an extraction ratio of 0.85, 0.51 and 0.24 were found for urea, vitamin B12, and inulin.
Fig. IV-22: Concentration profiles in the xz-plane of the dialzyer fiber (diameter 200µm and length 230mm) for urea (top panel), vitamin B12 (middle panel), and inulin (bottom panel). The
relative blood start concentration was 100, while blood and dialysate flows were 250 and 500mL/min.
Urea
Vit B12
Inulin
100 92 83 75 67
0817
08
10092 83
100 83 67 50 33
08172533
z
x
Urea
Vit B12
Inulin
100 92 83 75 67
0817
08
10092 83
100 83 67 50 33
08172533
z
x

Mass transport in a hemodialyzer
195
5.1.4.3. Influence of fiber diameter on solute transport The impact of radial dialyzer dimensions on solute clearance is shown in Fig. IV-23 and Table IV-14 for the solutes under study. For an overall blood and dialysate flow of 250 and 500mL/min, total fiber number was adapted in order to maintain total membrane area of 1.33m² (Table IV-14). Solute clearances K were found to vary parabolically with fiber inner diameter, most pronounced for larger molecular weight solutes (Fig. IV-23). Decreasing the fiber inner diameter from 200 to 150µm ameliorates the extraction ratio with 5.5 and 21% for vitamin B12 and inulin, respectively. No significant gain was however observed for urea.
Table IV-14: Extraction ratio E (-) and percentage increase in solute removal for different fiber diameters, compared to the results for the standard dialyzer with 200µm
fiber diameter.
Fiber diameter 150µm 200µm 250µm E % E E %
Urea 0.85 0 0.85 0.84 -0.9 Vit B12 0.54 5.5 0.51 0.50 -2.3 Inulin 0.30 21 0.24 0.25 1.6
# fibers 12271 9200 7360
Fig. IV-23: Influence of fiber diameter on the solute clearance of urea (squares), vitamin B12 (triangles) and inulin (rhombs).
5.1.4.4. Influence on fiber length on solute transport The effect on solute removal of variations in dialyzer length is illustrated in Fig. IV-24 and Table IV-15. A linear regression could be drawn for urea (R=0.928), vitamin B12 (R=0.995), and inulin (R=0.997). Furthermore, multiple linear regression showed that the slopes of the relations were not significantly different for the different solutes, except between vitamin B12 and inulin (P=0.022).
0
50
100
150
200
250
100 150 200 250 300
fiber diameter (µm)
solu
te c
lear
ance
(mL/
min
)

Chapter IV
196
Fig. IV-24: Influence of fiber length on the solute clearance of urea (squares), vitamin B12 (triangles) and inulin (rhombs).
Enlarging the active dialyzer length by 50mm has not much influence on urea removal (E increased by only 0.9%), while a significant increase in extraction ratio was observed for vitamin B12 (14%) and inulin (25%). On the other hand, shortening the dialyzer by 50mm has similar influence on small and middle molecules (-14/-12%). Doubling the active fiber length enhances the extraction ratio by 13% (urea), 50% (vitamin B12), and even 89% (inulin).
Table IV-15: Extraction ratio E (-) and percentage increase in solute removal for different fiber lengths, compared to the results for the standard dialyzer with 230mm
active fiber length.
Length 180mm 230mm 280mm 345mm 460mm E % E E % E % E %
Urea 0.74 -14 0.85 0.86 0.9 0.91 7.0 0.96 13 Vit B12 0.45 -12 0.51 0.58 14 0.66 30 0.76 50 Inulin 0.21 -13 0.24 0.30 25 0.37 51 0.46 89
Area (m²) 1.04 1.33 1.62 2.00 2.66
5.1.5. Discussion
The aim of the present study was to investigate the impact of fiber and dialyzer dimensions on the removal of solutes of different molecular weight. Therefore, a three-dimensional microscopic model of the blood-membrane interface was developed and mass transfer parameters were calibrated using dialyzer clearance data published by the manufacturer. The extraction ratio for one small molecule (urea MW60) and two middle molecules (vitamin B12 MW1355 and inulin MW5200) were investigated in a high flux polysulphone dialyzer. Fiber diameter and length were varied in a wide range.
0
50
100
150
200
250
150 200 250 300 350 400 450 500
fiber length (mm)
solu
te c
lear
ance
(mL/
min
)

Mass transport in a hemodialyzer
197
The major conclusions of this study are: first, membrane diffusivities were found up to five times smaller compared to blood and dialysate diffusivities; second, the extraction ratio was increased for smaller fiber diameters, most pronounced for the middle molecules; and third, solute removal varied linearly with increasing fiber lengths (and membrane area) up to twice the original length.
With respect to the last conclusion, it could be suggested to use two dialyzers in series to obtain better dialyzer performance as an alternative of doubling the fiber length. Previous performed in vitro studies, investigating solute transport in different dialyzer flow configurations using low flux Fresenius F6HPS dialyzers, reported an increase of the extraction ratio by 8% and 68% for small (MW20-180) and middle (MW1355) molecules, respectively [239,241]. The present study found increases in E by 13 and 50%, respectively. The extra pressure loss in between two dialyzers placed in series, compared to simply elongated fibers, might ameliorate the internal filtration and, with it, the convective contribution to overall transport. Because this phenomenon only becomes important for increasing molecular weights, it might explain why better removal was found for vitamin B12 (MW1355) in the in vitro experiments, compared to the numerical simulations.
Because of the importance regarding the uremic syndrome, several theoretical studies have been performed previously describing transport phenomena in hemodialyzers. Although those studies were accounting for the module geometry, the membrane properties, and the operating conditions [264,279-281], most of them did not consider the real ultrafiltration profile along the dialyzer length. Because the assumption of a zero or constant ultrafiltration velocity was not realistic, Ross [223] analyzed the mass transport through a permeable tubular membrane using an ultrafiltration velocity depending on hydrostatic and oncotic pressure differences. Legallais et al. [222] incorporated a varying ultrafiltration, by assuming the pressure in both compartments to drop following the Haegen-Poiseuille equation. Both groups did however not consider the non-Newtonian fluid behavior of blood.
The present numerical model, however, solves the convection-diffusion equation based on the local flow results as found with Navier-Stokes. Furthermore, local flows and pressures were calculated taking into account hemoconcentration due to ultrafiltration by the implementation of a viscosity model for blood.
It should be remarked however that only small and middle molecules, with a sieving coefficient equal to unity, are modeled adequately with the present model. To simulate middle molecule removal in low flux dialyzers or large

Chapter IV
198
molecule removal in high flux dialyzers, some additional aspects should be implemented. Because relative larger molecules are mainly transported by convection, the influence of the sieving coefficient must be considered [222,223,284]. Furthermore, the accumulation of larger molecules near the membrane causes concentration polarization to develop [222,284].
Finally, as diffusive and convective solute transport are influenced by blood and dialysate flows, the overall dialyzer performance might be different from calculated, if for instance dialysate flow channeling occurs [112,118,285]. This phenomenon might be even more pronounced when elongating the fibers.
The present model however offers a useful tool to count for those maldistributions by implementing the local flow rates in the fiber model. Integration over the entire dialyzer renders the overall solute removal.
5.1.6. Conclusion
While the manufacturer only provides dialyzer clearance information for the commercially available dialyzers, the aim of the present study was to investigate the impact of geometry adaptations on solute removal of small and middle molecules. The developed three-dimensional finite volume model incorporates blood, dialysate, and membrane flow in hollow fiber dialyzers allowing an accurate investigation of solute transport. While theoretical models on dialyzer mass transport often make abstraction of the ultrafiltration flow that is varying over the dialyzer length, the present numerical model combines flow and mass transport at once. With the simulations for different dialyzer geometries, it was found that mass transfer is enhanced for longer or wider fibers. The model will be extended in the future for mass transport in the case convection becomes the dominant transport phenomena.
5.2. Influence of flow distribution on mass transport
5.2.1. Objective and methods
The present study was set out to evaluate numerically the impact of flow maldistributions on solute transfer efficiency. Therefore, the results as obtained from the SPECT measurements with the F6HPS dialyzer (Chapter II) were used in the previous described numerical model for the F60 dialyzer (paragraph 5.1.3).
The F6HPS and the F60 dialyzer only differ with respect to their membrane permeability, while flow maldistributions in a dialyzer are mainly affected by the

Mass transport in a hemodialyzer
199
fiber shape (i.e. ondulations), fiber dimensions, and fiber packing density. As a consequence, it can be assumed that similar non-homogeneous dialysate flow distributions will also be observed in the F60.
Mass transfer calculation was performed for urea and vitamin B12 in the case of maximum and minimum dialysate flow velocity, as found in the yz-plane (Chapter II). Instead of using the mean dialysate velocity of 12.1mm/s, a mean velocity of 20.5mm/s and 4.3mm/s was applied to simulate both extreme situations. Meanwhile, blood flow was considered homogeneously distributed, and a Poiseuille velocity profile with mean velocity of 17.3mm/s was used at the blood inlet, corresponding to a uniform overall blood flow of 300mL/min. Overall ultrafiltration was set to 2L/h, but was found not to influence the diffusive clearances of urea and vitamin B12.
For both simulations of mass transfer in a single fiber, the extraction ratio e (-) in the single fiber was calculated and compared to the value obtained for a homogeneously assumed flow distribution. Furthermore, the extraction ratio for intermediate dialysate flows was derived by linear interpolation, such that an overall planar extraction ratio was obtained by integration over the yz-plane.
5.2.2. Results and discussion
The results for the extraction ratio e (-) in a single fiber of a high flux F60 dialyzer are given in Table IV-16 for the extreme considered flow conditions. While the observed maximum dialysate velocity resulted in an extraction ratio increase of 1.3 and 12% for urea and vitamin B12, the minimum dialysate velocity deteriorated solute removal by 12 and 28%, respectively.
Table IV-16: Extraction ratio in a single fiber e (-) and percentage increase with non-homogeneous flow distributions compared to the results for a uniform dialysate flow.
Homogeneous Non-homogeneous flow Solute e
(-) Dialysate velocity
(mm/s) e
(-) Increase
% Urea 0.80 Max: 20.5 0.81 1.3
0.80 Min: 4.3 0.70 -12 Vitamin B12 0.45 Max: 20.5 0.50 12
0.45 Min: 4.3 0.32 -28
Fig. IV-25 illustrates the vitamin B12 concentration profile in one fiber considering maximum (top panel) and minimum (bottom panel) velocity. It is obvious from the figure that solute removal is hampered for lower flow rates, as

Chapter IV
200
the solutes diffused through the membrane are not adequately drained by the dialysate flow.
Fig. IV-25: Concentration profiles in the xz-plane of the dialzyer fiber (diameter 200µm and length 230mm) for vitamin B12 with dialysate inlet velocity equal to 20.5mm/s (top panel) and
4.3mm/s (bottom panel).
By calculating the extraction ratio for intermediate blood-dialysate flow combinations, the extraction profile over the entire cross section (the dialyzer yz-plane in Chapter II) was derived for urea and vitamin B12 (Fig. IV-26). By integration over the considered plane, an overall planar extraction ratio of 0.77 and 0.43 was obtained for urea and vitamin B12. This corresponds to an overall decrease in solute removal efficiency by 3.8 and 4.4%, respectively.
Comparing the numerical findings with the previous described theoretical results (paragraph 3.2.2.3) shows that the numerically derived extraction ratio is less influenced for the lowest dialysate flows. The overall extraction ratios are however in better agreement.
With the theoretical derivation, it was found that the extraction ratio was decreased by 5.2% (urea) and 3.2% (vitamin B12) in the F6HPS dialyzer when assuming a constant k0·a (Table IV-5). Because much lower decreases (range 1-1.6%) were found with a variable k0·a value (Table IV-5), our numerical findings are an indication that the theoretical results for a constant k0·a value are more approaching reality, as stated before.
Analyses with imaging techniques revealed that flow distribution was more homogeneous when using spacing yarns or undulated fibers. In vivo urea extraction ratio was found 24% lower in a standard polyacrylonitrile dialyzer
vD MAX
vD MIN
100 92 83
042 1750 33
z
x
08
100 83 67
vD MAX
vD MIN
100 92 83
042 1750 33
z
x
08
100 83 67

Mass transport in a hemodialyzer
201
compared to a cellulose diacetate dialyzer with undulated fibers [121]. Compared to a polyacrylonitrile dialyzer with spacing yarns, extraction ratio was decreased by 19%.
Fig. IV-26: Local extraction ratio for urea (crosses) and vitamin B12 (squares) as derived numerically for non-homogeneous flow distribution. The results are compared to those for
uniform flows (dotted line).
The fact that vitamin B12 clearances were found more affected by dialysate flow inhomogeneities in the high flux F60 compared to the low flux F6HPS, might be due to positive contribution of ultrafiltration for middle molecules compared to urea.
5.2.3. Conclusion
With the numerical model, local flow inhomogeneities can be investigated in detail. Deviations were found with theory when considering the extreme situation of minimum dialysate flow. The influence of flow maldistributions on the overall extraction ratio was however in good agreement comparing the results of both techniques.
0,0
0,2
0,4
0,6
0,8
1,0
0 1 2 3 4 5 6 7 8 9 10 11 12 13 14 15 16
radial position (slice)
extra
ctio
n ra
tio e
(-)
0,0
0,2
0,4
0,6
0,8
1,0
0 1 2 3 4 5 6 7 8 9 10 11 12 13 14 15 16
radial position (slice)
extra
ctio
n ra
tio e
(-)


Chapter V Intra-dialytic kinetic behavior of uremic solutes

Chapter V
204
1. Chapter overview
This chapter starts with an introduction on the uremic syndrome and the uremic solutes retained in patients with renal failure. The categorization as well as the major characteristics of the uremic toxins are presented. Furthermore, the shortcomings of in vitro analyses are discussed together with the advantages of kinetic modeling.
A two-pool kinetic model was developed and applied to investigate and distinguish between the intra-dialytic behavior of small and water-soluble compounds like urea and some guanidino compounds (paragraph 3) and that of protein-bound solutes like p-cresol and indoxyl sulphate (paragraph 4).

Intra-dialytic kinetic behavior of uremic solutes
205
2. Introduction
2.1. Uremic toxins
The uremic syndrome results from the retention of solutes that are normally cleared by healthy kidneys and secreted into the urine. The gradual retention of a large number of organic metabolites of proteins, fatty acids, and carbohydrates characterizes the progression of renal failure. In parallel, clinical alterations occur, which are related to the cardiovascular, nervous, hematological, immunological, endocrine, bone, gastro-intestinal, skin, and pulmonary system [3]. Although the link between clinical deterioration and uremia was recognized already many decades ago, the responsible factors are still partially unknown.
Molecular weight is traditionally used as the parameter to classify uremic toxins, resulting in three groups of retention solutes: the toxin class of low molecular weight (MW<500), middle molecular weight (500<MW<15000), and high molecular weight solutes (MW>15000). They can further be subdivided in protein-bound and nonprotein-bound solutes. Recently, an encyclopedic list of uremic retention solutes was composed by the European Uremic Toxin Work Group (EUTox), distinguishing between small molecules (MW<500), small protein-bound solutes (MW mostly <500), and middle molecules (MW>500) [229]. The main known uremic retention solutes are given in Table V-1 [277].
At present, about 90 uremic retention solutes have been identified. Forty-five of them are small molecules without known protein binding. Twenty-five compounds belong to the group of protein-bound solutes, with a molecular weight smaller than 500Da, except two (i.e Leptin and Retinal-binding protein). From the 22 recognized middle molecules, 12 have a molecular weight exceeding 15000Da [229].
Low molecular weight molecules are water-soluble and are relatively easy to remove using standard low flux dialysis membranes. Because the removal of small protein-bound solutes is hampered due to protein binding, their dialytic behavior is comparable to that of larger molecules. The so-called middle molecules can only be removed using high flux dialysis membranes with large pores, unless they are adsorbed on the membrane.

Chapter V
206
Table V-1: Main known uremic retention solutes
Small water-soluble solutes Protein-bound solutes Middle molecules Asymmetric dimethylarginine 3-Deoxyglucosone Adrenomedullin
Benzylalcolhol CMPF * Atrial natrioretic peptide β-Guanidinopropionic acid Fructoselysine β2-Microglobulin
β-Lipotropin Glyoxal β-Endorphin Creatinine Hippuric acid Cholecystokinin Cytidine Homocysteine Clara cell protein
Guanidine Hydroquinone Complement factor D Guanidinoacetic acid Indole-3-acetic acid Cystatin C
Guanidinosuccinic acid Indoxyl sulfate Degranulation inhibiting protein IHypoxanthine Kinurenine Delta-sleep-inducing peptide
Malondialdehyde Kynurenic acid Endothelin Methylguanidine Methylglyoxal Hyaluronic acid
Myoinositol N-carboxymethyllysine Interleukin 1β Orotic acid P-cresol Interleukin 6 Orotidine Pentosidine Kappa-Ig light chain Oxalate Phenol Lambda-Ig light chain
Pseudouridine P-OH hippuric acid Leptin Symmetric dimethylarginine Quinolinic acid Methionine-enkepahlin
Urea Spermidine Neuropeptide Y Uric acid Spermine Parathyroid hormone Xanthine Retinal binding protein
Tumor necrosis factor alpha * CMPF: carboxy-methyl-propyl-furanpropionic acid
In spite of this wide variety of uremic retention solutes, urea removal is still used as the standard marker for dialysis efficiency, with a target K·t/V of at least 1.2. The good correlation between the intra-dialytic kinetic behavior of urea and potassium might be the reason for the impact of K·t/V on patient survival, as hyperkalemia is an important cause of death among dialysis patients [286,287]. This might imply that urea removal remains a valuable parameter with impact on patient survival.
The intra-dialytic kinetic behavior of numerous other toxins is however different from that of urea. While it is quite obvious that this is the case for the protein-bound [286,288] and middle molecules, an intra-dialytic kinetic behavior not conform that of urea was also found for a number of small molecules. Examples of this are the purines xanthine and hypoxanthine [286,288], and phosphate [289,290].
Urea, the main marker of dialysis adequacy, was however proven to exert not much toxity by itself [291,292], in contrast with other small and water-soluble

Intra-dialytic kinetic behavior of uremic solutes
207
compounds. The purines have been linked to resistance to vitamin D [293,294], while phosphate is related to cardiovascular damage, probably due to the deposition of calcium in the vessel wall [295]. Furthermore, several guanidino compounds have been related to neurotoxicity [296,297] and inhibition of the leukocyte function [298]. One of them, asymmetric dimethylarginine (ADMA) has been strongly related to cardiovascular mortality as a possible result of inhibition of nitric oxide synthase [299,300].
2.2. The importance of kinetic modeling
Up to now, numerous studies have been performed analyzing the behavior of uremic solutes, other than urea. They show however some important drawbacks [301]. To evaluate the biological impact of certain uremic solutes, artificially generated surrogates are studied instead of the genuine compound that is retained in uremia [302]. Likewise, concentrations applied in the in vitro studies are often diverging from the uremic levels. Furthermore, the role of metabolism in the decrease of concentration and the interference of different toxic compounds are neglected in in vitro studies.
Kinetic modeling (explained in detail in Chapter I, paragraph 5.5) is a promising tool to counter some of those shortcomings. Using patient blood and/or plasma concentration data during and after dialysis, much can be learned about the inter and intra-compartmental behavior of the solutes under study. Because metabolism and solute interferences influence patient’s blood data, appropriate mathematical formulations can be implemented to model those phenomena.
Recently, kinetic modeling has been used extensively to optimize the description of urea kinetics and to derive appropriate dialysis adequacy parameters [303,304]. In spite of this, however, besides urea, only a few uremic solutes have been kinetically investigated (e.g. creatinine, vitamin B12, β2-microglobulin) [267,268,305]. Those solutes were all modeled using a two-pool model, only differing in volume partitioning and inter-compartmental clearance [267]. The most striking results were found for phosphate, behaving as distributed in three and even in four different pools [290].
The latter is an indication that uremic toxins, even if they are small and water-soluble, might behave totally different from the marker molecule urea. Furthermore, if solutes are characterized by complex kinetics, the number of compartments and/or the blood sampling time points must be well chosen in order to describe the kinetic model properly, and to obtain reliable results.

Chapter V
208
In what follows, two studies will be reported, considering the kinetics of small and water-soluble compounds (i.e. several guanidino compounds) (paragraph 3) and those of protein-bound solutes (paragraph 4).

Intra-dialytic kinetic behavior of uremic solutes
209
3. Intra-dialytic kinetic behavior of small water-soluble uremic toxins, the case of the guanidino compounds†
3.1. Abstract
Although patients with renal failure retain a large variety of solutes, urea is virtually the only currently applied marker for adequacy of dialysis. Only a limited number of other compounds have up till now been investigated regarding their intra-dialytic kinetics. Scanty data suggests that large solutes show a kinetic behavior that is different from urea. The question investigated in this study is whether other small water-soluble solutes such as some guanidino compounds show a kinetic behavior comparable or dissimilar to that of urea.
This study included 7 stable conventional hemodialysis patients without native kidney function undergoing low flux polysulphone dialysis (F8 and F10HPS). Blood samples were collected from the inlet and outlet blood lines immediately before the dialysis session, after 5, 15, 30, 120 minutes, and immediately after discontinuation of the session. Plasma concentrations of urea, creatinine (CTN), creatine (CT), guanidinosuccinic acid (GSA), guanidinoacetic acid (GAA), guanidine (G), and methylguanidine (MG) were used to calculate corresponding dialyzer clearances. A two-pool kinetic model was fitted to the measured plasma concentration profiles, resulting in the calculation of the perfused volume (V1), the total distribution volume (Vtot), and the inter-compartmental clearance (K12); solute generation and overall ultrafiltration were determined independently.
No significant differences were observed between V1 and K12 for urea (6.4±3.3L and 822±345mL/min, respectively) and for the guanidino compounds. However, with respect to Vtot, GSA was distributed in a smaller volume (30.6±4.2L) compared to urea (42.7±6.0L) (P<0.001), while CTN, CT, GAA, G, and MG showed significantly higher volumes (54.0±5.9L, 98.0±52.3L, 123.8±66.9L, 89.7±21.4L, 102.6±33.9L, respectively; P=0.004, =0.033, =0.003, <0.001, =0.001, respectively). These differences resulted in divergent effective solute
† The contents of this section is accepted for publication in Kidney Int
Kinetic behavior of urea is different from that of other water-soluble compounds: the case of the guanidino compounds
S. Eloot, A. Torremans, R. De Smet, B. Marescau, D. De Wachter, PP. De Deyn, N. Lameire, P. Verdonck, and R. Vanholder

Chapter V
210
removal: 67% (urea), 58% (CTN), 42% (CT), 76% (GSA), 37% (GAA), 43% (G), and 42% (MG).
In conclusion, the kinetics of the guanidino compounds under study are different from that of urea; hence, urea kinetics are not representative for the removal of other uremic solutes, even if they are small and water-soluble like urea.
3.2. Introduction
Urea kinetic modeling has become one of the cornerstones of estimation of dialysis adequacy. In uncontrolled studies, urea removal parameters have been related to morbidity and mortality of dialysis patients [90]. Two recent controlled studies, however, showed that giving more dialysis, defined as a higher clearance of smaller solutes like urea, did not improve survival [258,306].
For that reason, it might be considered that molecules with a kinetic behavior different from that of urea play an equal if not more important role in the patho-physiologic deterioration of patients with renal dysfunction. Differences in kinetic behavior can be conceived for some uremic retention solutes that are difficult to remove due to their high molecular weight and/or lipophilic properties. However, the kinetic behavior of small water-soluble molecules may also differ from that of urea, possibly accounting for the failure of urea clearance to predict outcome, once a certain threshold has been exceeded.
The guanidino compounds are a large group of solutes, resulting from protein and amino acid metabolism. Among them, only some small and water-soluble guanidino compounds were considered in this study: four well known [307-309] uremic retention solutes (creatinine, guanidinosuccinic acid, guanidine, and methylguanidine) together with guanidinoacetic acid and creatine, which show a decreased serum concentration in the patients included in this study and in non-dialyzed patients with chronic renal insufficiency [309]. Guanidino compounds can interfere with neuronal [310], cardiovascular [311], leukocyte [312], platelet [313], and erythrocyte function [314]. Of note, several of the guanidino compounds have concentrations relative to normal that are proportionately much higher than urea [229,308,309].
Considering this important contribution of the guanidino compounds to clinical disturbances related to the uremic syndrome, the present study has been undertaken to quantify their kinetics. Therefore, a two-pool model was applied for kinetic calculations based on fitting profiles of plasma concentrations during hemodialysis. The kinetic parameters, i.e. perfused volume, total distribution

Intra-dialytic kinetic behavior of uremic solutes
211
volume, and inter-compartmental clearance, were compared to the values obtained for urea.
3.3. Patients and methods
3.3.1. Patients and dialysis strategies
The study was performed in seven stable dialysis patients (three women and four men) without residual renal function. The study was approved by the local ethical committee, and written informed consent was obtained. The patients were 68±11 years old and had spent 78±32 months on dialysis. Conventional hemodialysis was performed during 253±16 minutes using low flux polysulphone dialyzers: F8 (n=3) and F10HPS (n=4) (Fresenius Medical Care, Bad Homburg, Germany). The main characteristics of the patients and their dialysis sessions are shown in Table V-2.
Table V-2: Main characteristics of the patients
Patient
No.
Sex Age
years
Time on dialysis months
Blood flow
mL/min
Body weight*
kg
H*
%
Total serum protein*
g/L
UF
L
Session duration
min
Dialyzer
1 F 79 76 287 73.8 40 67.2 3.1 240 F8 2 F 53 80 349 95.6 41 72.0 3.2 240 F8 3 M 73 30 318 71.8 37 72.4 4.5 270 F10HPS4 F 81 97 326 69.8 36 65.9 2.3 240 F10HPS5 M 56 113 330 70.1 34 57.0 3.5 270 F10HPS6 M 73 42 350 75.8 33 57.6 4.3 240 F10HPS7 M 60 106 350 88.4 40 62.2 4.7 270 F8
MEAN - 68 78 330 77.9 37 64.9 3.7 253 - SD - 11 32 23 10.1 3 6.3 0.9 16 -
* pre-dialysis ; hematocrit H; ultrafiltration UF; standard deviation SD.
The composition of the dialysate was: 38.5mmol/L bicarbonate, 138mmol/L sodium, 104mmol/L chloride, 4mmol/L acetate, 1.25mmol/L calcium, and 0.5mmol/L magnesium. The dialysate potassium concentration was adapted to the needs of the patients and ranged from 1 to 3mmol/L. A constant dialysate flow rate of 500mL/min was applied using a Fresenius FO1 or FO3 dialysis machine. Blood flow rates of 330±23mL/min and ultrafiltration rates of 0.85±0.19L/h were obtained (Table V-2). Mean K·t/Vurea in this population was 1.77±0.17 by routine monthly assessment according to the single-pool Daugirdas formula [303], immediately prior to the study.

Chapter V
212
3.3.2. Blood and dialysate sampling
For each patient, blood samples were taken at the inlet and outlet blood lines immediately before the onset of dialysis, after 5, 15, 30, 120 minutes, and immediately after discontinuation of the dialysis session, without slowing down the blood pump. Blood samples were immediately centrifuged during 10 minutes at 1900g (CR 412, Jouan, Saint-Herblain, France), after which the plasma was stored at -80°C until analysis. From the outlet dialysate line, dialysate was sampled after 5, 15, 30, 120 minutes after the start of dialysis, and immediately before the end of dialysis.
From a preliminary study in two patients, taking samples at 14 time points during the dialysis session, it was concluded that all investigated solutes were characterized by a two-pool kinetic behavior. As a consequence, the number of data points could be limited to those reported here.
3.3.3. Analyses
Total protein was determined photometrically by the biuret method (Genesys 10vis, Spectronic, Unicam, Rochester, USA). Hematocrit was measured with the capillary centrifugation technique. Urea concentrations were determined with the method of Ceriotti et al. [315]. The concentrations of creatinine (CTN), creatine (CT), guanidinosuccinic acid (GSA), guanidinoacetic acid (GAA), guanidine (G), and methylguanidine (MG) were determined with a Biotronic LC 6001 amino acid analyzer (Biotronik, Maintal, Germany) adapted for guanidino compound determination [316].
3.3.4. Kinetic model
A flow chart of the two-pool model used in the present study is shown in Fig. V-1. The total distribution volume (Vtot) was assumed to consist of two distinct volumes: the perfused volume (V1) and the non-perfused (V2). Each compartment was theoretically characterized by a homogeneous solute concentration with variable inputs and outputs. The solute transport between two compartments was considered to be driven by concentration gradients (diffusion), and/or pressure gradients (convection).

Intra-dialytic kinetic behavior of uremic solutes
213
Fig. V-1: Flow chart of the two-pool kinetic model. V1: perfused volume; V2: non-perfused volume; Vtot: total distribution volume; C1: concentration in perfused compartment; C2:
concentration in non-perfused compartment; CBi: concentration at blood inlet; CBo: concentration at blood outlet; CDi: concentration at dialysate inlet; CDo: concentration at
dialysate outlet; Kblood: dialyzer clearance; K12: inter-compartmental clearance; GS: solute generation rate; QB: dialyzer blood flow; QD: dialyzer dialysate flow; QUF: ultrafiltration flow.
As a compartment does not necessarily coincide with an anatomical entity [269], the perfused volume was not taken a priori equal to the plasma volume, but was assumed not being smaller than the pre-dialysis plasma volume, Vplasma. The latter was calculated from total blood volume as 1/13 of total body weight (BW-kg), followed by subtraction of the contribution of the pre-dialysis hematocrit H:
H)(113
BWVplasma −⋅= Eq. V-1
From the inlet and outlet plasma concentrations, CPi and CPo, the blood flow, QB, and the ultrafiltration rate, QUF, total blood-side clearance Kblood (mL/min) was calculated considering diffusive as well as convective contribution to overall clearance [85]:
UF
Pi
Po B
Pi
Po Piblood Q
CC
QC
CCK ⋅+⋅
−= Eq. V-2
For each solute, clearances at different time points throughout the dialysis session remained stable (standard deviation less than 3%) so that the mean of these individual clearances was used.
The solute generation rate GS (mmol/min) in the interdialytic period, Tinter (min), was assumed equal to the amount of solutes collected in the dialysate [268]. Therefore, it was calculated as a function of the solute concentration, CD (mmol/L), in the collected dialysate volume, VD (L):
Kblood
CPi
CDi
CDo
CPo
dialyzer
QB
QD
QB - QUF
QD + QUF
V1, C1V2, C2
K12
G
Vtot
Kblood
CPi
CDi
CDo
CPo
dialyzer
QB
QD
QB - QUF
QD + QUF
V1, C1V2, C2
K12
G
Vtot

Chapter V
214
inter
DDS T
CVG
⋅= Eq. V-3
This method of calculating the generation rate excludes the amount of solutes that is metabolized after generation in the non-perfused volume. Furthermore, no significant differences in the kinetic parameters were found considering generation as taking place in the perfused or non-perfused compartment. Therefore, although CTN is known as being generated in the muscles, solute generation rate was generally considered to take place in the perfused compartment, a rationale also followed in previous studies [267]. A similar rationale was followed as well for the other guanidino compounds studied.
Ultrafiltration QUF (0.85±0.19L/h) was taken into account to calculate convective clearance (Eq. V-2) and to vary total distribution volume in time. Ultrafiltration was assumed to occur in both compartments, dV1/dt and dV2/dt, in proportion to the compartment volume ratio.
The time variation of the compartment concentration was, for a particular solute, determined by solving a series of mass balance equations for both compartments [268,269]:
( ) ( )
( ) ( )
−⋅−=
−⋅+⋅−=
121222
12121bloodS11
CCKdt
CVd
CCKCKGdt
CVd
Eq. V-4
The pre-dialysis concentration in the perfused and non-perfused compartment was assumed equal to the pre-dialysis plasma solute concentration. The model, developed with JSim 1.5 (National Simulation Resource, Seattle, W), iteratively solved the mass balance equations for the complete dialysis session time (either 240 or 270min). The perfused volume, V1 (L), total distribution volume, Vtot (L), as well as the inter-compartmental clearance, K12 (mL/min), were calculated from fitting the solution to the measured plasma concentrations.
The JSIM Mathematical Modeling Language (MML), following standard mathematical nomenclature, was used to define the equations of the problem to be solved. The applied software used the Dopri5 method to solve the differential equations [317] and the Simplex method was used to minimize the standard errors on the fitting.
In a preliminary study, our data was also fitted calculating only two kinetic parameters (Vtot and K12), as proposed by the HEMO study [304]. The a priori assumption of V1/V2 equal to 1 by 2 for urea, as used in the HEMO method,

Intra-dialytic kinetic behavior of uremic solutes
215
resulted in larger standard errors on the fitting compared to our method. As a consequence of this observation and the fact that no a priori assumptions can be made with respect to the guanidino compounds, we have decided to consider the perfused volume as one of the three fitting parameters.
In conclusion, dialyzer clearance (Kblood) and solute generation rate (GS) were calculated from plasma and dialysate concentrations, respectively. Together with the ultrafiltration rate (QUF), they were used as known input parameters in the kinetic model. The sampled concentrations were fitted with a bi-exponential curve determining the perfused volume (V1), the total distribution volume (Vtot), and the inter-compartmental clearance (K12). The volume of the non-perfused compartment (V2) was calculated from the fitted parameters V1 and Vtot.
3.3.5. Effective solute removal
In analogy with the definition for the urea reduction ratio, URR, the reduction ratio RR (%) of the guanidino compounds can be defined as a function of pre (C1_pre) and immediate post-dialysis concentration (C1_post) in the perfused compartment:
100
CCC
RR1_pre
1_post1_pre ⋅−
= Eq. V-5
Due to redistribution in the body compartments following dialysis, the effective reduction ratio will be smaller than calculated with Eq. V-5 if a multi-compartmental distribution is present. Therefore, concentration profiles in both compartments were calculated during the 60 minutes following discontinuation of the dialysis session using the same kinetic model as mentioned above. Dialyzer clearance was set equal to zero, while solute generation was assumed to occur continuously in the perfused compartment, according to the same conditions as accepted before. Solute concentration after 60 minutes (C1_60post), was calculated from the immediate post-dialysis concentration in the perfused volume (C1_post) and the previously obtained kinetic characteristics. C1_60post allowed calculating the effective reduction ratio RReff (%) for the different solutes:
100
CCC
RR1_pre
1_60post1_preeff ⋅
−= Eq. V-6
To define the removal from the non-perfused compartment, which corresponds to removal from tissues and organs where biological/biochemical activity is displayed, the effective relative decline of concentration (slope: delta SC2eff) was

Chapter V
216
calculated from the pre (C2_pre) and immediate post-dialysis concentration in the non-perfused volume (C2_post), normalized to a total dialysis session duration ttotal of 240 minutes:
100
t240
CCC
SC deltatotal2_pre
2_post2_preeff 2 ⋅
−= Eq. V-7
3.3.6. Statistical analysis
Data are expressed as mean ± standard deviations. Correlations between parameters were investigated by performing linear regression analysis (Pearson). Statistical analyses were carried out using the Student t-Test for unpaired samples on normally distributed populations, with P<0.05 as the limit of significant difference.
3.4. Results
For the different studied compounds, Fig. V-2 illustrates the concentration profiles in the perfused and non-perfused compartments as fitted on the measured data points during dialysis in one of the patients evaluated in the present study. As compared to urea, the concentration profiles in the perfused volume for most of the guanidino compounds show a more pronounced bi-exponential profile. This corresponds to larger non-perfused volumes (see below), and is indicated by a steep exponential decline (according Kblood/V1) when dialysis starts, followed by a gentle exponential slope (determined by K12/Vtot) (e.g. CT, GAA, G, and MG). The relative distance in between both curves is a measure for the inter-compartmental clearance: closer curves corresponds to a higher rate of solute exchange in between both pools such that concentration equilibriums are reached more easily (e.g. G and MG). More importantly, the relative slope of the concentration curve of the non-perfused compartment (bold line) offers an idea about the effective clearance from the patients’ tissues (delta SC2eff). The latter is more efficient for steeper slopes (e.g. urea, CTN, and GSA) (see below) (The reader must pay attention to the different scales on the y-axis as applied for the different solutes).

Intra-dialytic kinetic behavior of uremic solutes
217
Fig. V-2: Concentration profiles (mmol/L) during the dialysis session of urea and the different investigated guanidine compounds in a representative patient. The asterisks * plot the measured data, while the thin and bold line are the fitted concentration profiles in the perfused (V1), and
non-perfused compartment (V2), respectively. The angle in between the dotted lines is a measure for the solute removed from the non-perfused compartment (delta SC2eff).
In Table V-3, solute generation rate (GS), dialyzer clearance (Kblood), and the fitted kinetic parameters [perfused volume (V1), total distribution volume (Vtot), and inter-compartmental clearance (K12)] are shown for the different investigated solutes.
Urea
0
5
10
15
20
25
0 60 120 180 240 300
time (min)
conc
entra
tion
(mm
ol/L
)
CTN
0
0,2
0,4
0,6
0,8
1
0 60 120 180 240 300
time (min)
conc
entra
tion
(mm
ol/L
)
CT
0
0,01
0,02
0,03
0,04
0,05
0 60 120 180 240 300
time (min)
conc
entra
tion
(mm
ol/L
)
delta SC2eff= 65%
delta SC2eff= 23%delta SC2eff= 57%
GSA
0
0,005
0,01
0,015
0 60 120 180 240 300
time (min)
conc
entra
tion
(mm
ol/L
)
GAA
0
0,0005
0,001
0,0015
0,002
0 60 120 180 240 300
time (min)
conc
entra
tion
(mm
ol/L
)
G
0
0,0005
0,001
0,0015
0,002
0 60 120 180 240 300
time (min)
conc
entra
tion
(mm
ol/L
)
MG
0
0,0005
0,001
0,0015
0,002
0 60 120 180 240 300
time (min)
conc
entra
tion
(mm
ol/L
)
delta SC2eff= 73%delta SC2eff= 19%
delta SC2eff= 31% delta SC2eff= 43%
Urea
0
5
10
15
20
25
0 60 120 180 240 300
time (min)
conc
entra
tion
(mm
ol/L
)
CTN
0
0,2
0,4
0,6
0,8
1
0 60 120 180 240 300
time (min)
conc
entra
tion
(mm
ol/L
)
CT
0
0,01
0,02
0,03
0,04
0,05
0 60 120 180 240 300
time (min)
conc
entra
tion
(mm
ol/L
)
delta SC2eff= 65%
delta SC2eff= 23%delta SC2eff= 57%
GSA
0
0,005
0,01
0,015
0 60 120 180 240 300
time (min)
conc
entra
tion
(mm
ol/L
)
GAA
0
0,0005
0,001
0,0015
0,002
0 60 120 180 240 300
time (min)
conc
entra
tion
(mm
ol/L
)
G
0
0,0005
0,001
0,0015
0,002
0 60 120 180 240 300
time (min)
conc
entra
tion
(mm
ol/L
)
MG
0
0,0005
0,001
0,0015
0,002
0 60 120 180 240 300
time (min)
conc
entra
tion
(mm
ol/L
)
delta SC2eff= 73%delta SC2eff= 19%
delta SC2eff= 31% delta SC2eff= 43%

Chapter V
218
Table V-3: Kinetic modeling parameters
Compound GS
mmol/24h V1 L
Vtot L
Vtot / BW L/kg
Kblood
mL/min K12
mL/min Urea 310 ± 86 6.4 ± 3.3 42.7 ± 6.0 0.55 ± 0.09 261 ± 17 822 ± 345 CTN 9.83 ± 3.90 7.6 ± 3.4 54.0 ± 5.9 0.70 ± 0.09 264 ± 14 618 ± 113 CT 0.557 ± 0.354 4.2 ± 1.3 98.0 ± 52.3 1.38 ± 0.72 257 ± 21 588 ± 84
GSA 0.087 ± 0.037 5.7 ± 1.9 30.6 ± 4.2 0.39 ± 0.05 235 ± 29 625 ± 138 GAA 0.019 ± 0.006 8.1 ± 5.1 123.8 ± 66.9 1.65 ± 0.93 266 ± 16 715 ± 288
G 0.021 ± 0.004 8.4 ± 6.2 89.7 ± 21.4 1.17 ± 0.34 267 ± 25 918 ± 362 MG 0.046 ± 0.028 8.0 ± 3.7 102.6 ± 33.9 1.32 ± 0.39 278 ± 15 1025 ± 498
solute generation rate GS; perfused volume V1; total distribution volume Vtot; total distribution volume normalized for body weight Vtot/BW; dialyzer clearance Kblood; inter-compartmental
clearance K12; creatinine CTN; creatine CT; guanidinosuccinic acid GSA; guanidinoacetic acid GAA; guanidine G; methylguanidine MG.
For urea and creatinine, mean total distribution volumes were equal to 42.7±6.0L and 54.0±5.9L, while the perfused compartment volumes were 6.4±3.3L and 7.6±3.4L, respectively. The perfused and total distribution volumes of the guanidino compounds were 4.2±1.3L and 98.0±52.3L (CT), 5.7±1.9L and 30.6±4.2L (GSA), 8.1±5.1L and 123.8±66.9L (GAA), 8.4±6.2L and 89.7±21.4L (G), and 8.0±3.7L and 102.6±33.9L (MG). Total distribution volumes normalized for patient’s body weight were 0.55±0.09L/kg (urea), 0.70±0.09L/kg (CTN), 1.38±0.72L/kg (CT), 0.39±0.05L/kg (GSA), 1.65±0.93L/kg (GAA), 1.17±0.34L/kg (G), and 1.32±0.39L/kg (MG).
No significant differences were observed between the volumes of the perfused compartment among all the compounds under study. With respect to the total distribution volumes, there were, however, significant differences between the values for urea and those for CTN (P=0.004), CT (P=0.033), GSA (P<0.001), GAA (P=0.003), G (P<0.001), and MG (P=0.001) (Table V-4). While most guanidino compounds showed a total distribution volume exceeding that of urea, GSA was distributed in a smaller volume. Analogous significant differences were observed for the total distribution volume normalized for body weight between urea and CTN (P=0.008), CT (P=0.017), GSA (P=0.001), GAA (P=0.003), G (P<0.001), and MG (P<0.001). In addition to the differences with urea, total distribution volumes of CTN and GSA were significantly lower compared to the other guanidino compounds. Moreover, Vtot for GSA was remarkably lower (P<0.001) than for CTN. As a consequence, CT, GAA, G, and MG showed a similar behavior, while other compounds (urea, CTN, and GSA) each had a specific behavioral pattern.

Intra-dialytic kinetic behavior of uremic solutes
219
No significant differences were observed between the inter-compartmental clearances among the investigated compounds, except between the K12 for G and GSA (P=0.017). With respect to the dialyzer clearance of the different solutes, only some singular significant differences were found (Table V-4).
Table V-4: Levels of significance for the differences between modeled parameters of the different compounds.
Urea CTN CT GSA GAA G MG Urea Vtot \ Kblood NS NS NS NS NS 0.026 CTN 0.004 Vtot \ Kblood NS 0.040 NS NS NS CT 0.033 NS Vtot \ Kblood NS NS NS 0.044
GSA < 0.001 < 0.001 0.017 Vtot \ Kblood 0.030 NS 0.005 GAA 0.003 0.005 NS 0.003 Vtot \ Kblood NS NS
G < 0.001 0.001 NS < 0.001 NS Vtot \ Kblood NS MG 0.001 0.001 NS < 0.001 NS NS Vtot \ Kblood
P-levels for dialyzer clearance Kblood above the diagonal and for total distribution volume Vtot below the diagonal; no significant differences were found for the perfused compartment V1; no significant differences were found for the inter-compartmental clearance K12, except between G
and GSA (P=0.017).
The pre and post-dialysis concentrations in the perfused volume, as well as the reduction ratios RR and RReff, as calculated with Eq. V-5 and Eq. V-6, are specified in Table V-5. With the immediate post-dialysis concentration, RR values were 75±4% (urea), 69±4% (CTN), 59±12% (CT), 82±5% (GSA), 53±12% (GAA), 56±6% (G), and 55±8% (MG). Applying the perfused volume concentration corresponding to the 60th minute post-dialysis, however, RReff values of 67±4% (urea), 58±6% (CTN), 42±16% (CT), 76±6% (GSA), 37±14% (GAA), 43±7% (G), and 42±12% (MG) were found. There was a significant difference between the RR and RReff values for urea and those for CTN (P=0.024 and 0.006), CT (P=0.033 and 0.017), GSA (P=0.014 and 0.006), GAA (P=0.005 and 0.003), G (P<0.001 both), and MG (P<0.001 both). While all other guanidino compounds showed RR and RReff values lower than urea, GSA was removed more efficiently compared to urea.
Solute removal from the non-perfused compartment (delta SC2eff), indicated by the slope of the corresponding concentration curve in Fig. V-2, as explained above, is also shown in Table V-5 for the different investigated compounds. Solute removal of GSA (delta SC2eff=73±4%) was significantly more pronounced as compared to urea (65±7%) (P=0.019), while GAA (34±15%), G (41±8%), and MG (40±12%) were significantly less efficiently removed from the non-perfused compartment (P=0.005, <0.001, and <0.001, respectively).

Chapter V
220
Table V-5: Molecular weight (MW), reduction ratio (RR), corrected reduction ratio (RReff), and the concentration decline in the non-perfused compartment (delta SC2eff) for
the different compounds.
Compound MW Da
C1_pre µmol/L
C1_post µmol/L
C1_60post µmol/L
RR %
RReff
% delta SC2eff
% Urea 60 24 ± 9 * 6.1 ± 2.6 * 8.0 ± 3.3 * 75 ± 4 67 ± 4 65 ± 7 CTN 113 1015 ± 286 312 ± 93 427 ± 138 69 ± 4 † 58 ± 6 † 55 ± 3 † CT 131 50 ± 42 24 ± 14 35 ± 22 59 ± 12 † 42 ± 16 † 52 ± 28
GSA 175 12.0 ± 4.4 2.1 ± 0.9 2.8 ± 1.1 82 ± 5 † 76 ± 6 † 73 ± 4 † GAA 117 1.7 ± 0.6 0.8 ± 0.1 1.1 ± 0.2 53 ± 12 † 37 ± 14 † 34 ± 15 †
G 59 1.8 ± 0.3 0.8 ± 0.1 1.0 ± 0.2 56 ± 6 † 43 ± 7 † 41 ± 8 † MG 73 3.7 ± 2.0 0.2 ± 0.1 2.3 ± 1.4 55 ± 8 † 42 ± 12 † 40 ± 12 †
* Urea concentration in mmol/L; † P<0.05 compared to urea; pre-dialysis plasma concentration C1_pre; post-dialysis plasma concentration C1_post; plasma concentration 60 minutes after dialysis C1_60post; creatinine CTN; creatine CT; guanidinosuccinic acid GSA; guanidinoacetic acid GAA;
guanidine G; methylguanidine MG.
No correlations were found between urea and the guanidino compounds for the different model parameters (V1, Vtot, Kblood, and K12), nor for the derived parameters (RR, RReff, and delta SC2eff). RR, RReff, and delta SC2eff percentages, however, were found to correlate inversely with the total distribution volumes (R= -0.97 - P<0.001 for RR and RReff, and R= -0.94 - P=0.002 for delta SC2eff) (Fig. V-3). As a consequence, solute removal of CT, GAA, G, and MG, characterized by similar and large total distribution volumes, occurred with a comparable efficiency, which was smaller than that of urea, CTN, and GSA.
Fig. V-3: Correlations between total distribution volume and reduction ratio RR (+), effective reduction, RReff (x), and effective relative concentration decline, delta SC2eff (o).
R=-0.97
R=-0.94R=-0.97
20
40
60
80
100
0 20 40 60 80 100 120 140
Total distribution volume (L)
RR
- R
Ref
f - d
elta
SC
2eff
(%)

Intra-dialytic kinetic behavior of uremic solutes
221
Considering the mean parameter values as shown in Table V-3, dialyzer clearance, Kblood, and inter-compartmental clearance, K12, were negatively correlated with solute molecular weight, and correlation coefficients R were equal to –0.78 and –0.79 (P=0.037 and P=0.033) (Fig. V-4). The perfused and total distribution volume, however, did not correlate with solute molecular weight.
Fig. V-4: Correlations between solute molecular weight and dialyzer clearance Kblood (+), and inter-compartmental clearance K12 (x).
3.5. Discussion
The present study sets out to evaluate the kinetic characteristics of several guanidino compounds and to compare them with a standard marker of dialysis adequacy, urea. For this purpose, a two-pool kinetic model was applied, as plasma concentrations during dialysis showed a bi-exponential profile. For each solute, both differential equations were solved using three parameters to fit the measured data: the perfused compartment volume, V1, total distribution volume, Vtot, and the inter-compartmental clearance, K12. The differences in kinetic behavior can be determined by assessing the relationship between dialyzer clearance, inter-compartmental clearance, and compartment volumes for each solute.
The most striking results of this study are: first, most of the studied guanidino compounds show a kinetic behavior that is different from that of urea; second, the distribution volume of CT, GAA, G, and MG is substantially larger than that of urea, while the distribution volume of GSA is significantly smaller; third, these differences occur in spite of similar dialyzer and inter-compartmental
R=-0.78
R=-0.79
100
150
200
250
300
50 100 150 200
Molecular weight (Da)
Kbl
ood (m
L/m
in)
400
600
800
1000
1200
K12 (m
L/min)

Chapter V
222
clearance values; fourth, urea does not correlate with the guanidino compounds for any of the kinetic parameters.
Although the plasma and organ systems of patients with renal failure contain a large amount of retention compounds [229], many of which have a potential for toxicity, data on solute removal pattern during dialysis have been collected only for a limited number of compounds. In addition, these studies not always contain a comparison regarding the kinetic behavior. Our study essentially emanated from the question whether urea, which is a currently applied marker for dialysis adequacy, shows a kinetic behavior that is comparable to that of guanidino compounds. This question was especially addressed since the guanidino compounds are, like urea, degradation products from proteins and amino acids, with an almost similar dialyzer clearance and molecular weight, and the same hydrophilic physico-chemical characteristics.
Most serum guanidino compound concentrations are increased in hemodialysis patients [307,308] and in non-dialyzed patients with chronic renal failure [309]. Mean uremic GSA and MG serum levels are up to respectively 200 and 100 times higher compared to controls, while guanidine and creatinine concentrations are approximately 10 times increased [229,308,309]. For urea, the corresponding increase is only 6-fold [229]. The highest absolute concentrations were found for urea, creatinine and creatine. A high solute concentration, however, does not necessarily imply a strong biologic toxicity. While, urea and creatinine have a rather limited biologic toxicity, several guanidino compounds, on the contrary, are related to neurotoxicity [318], cardiovascular [311] and hematological complications [313,314], and alterations of leukocyte function [312]. GSA has been associated to uremic bleeding diathesis [313] and contributes to the toxic phenomena affecting the function of the central nervous system [319]. Moreover, it has, together with G, been held responsible for hemolysis [314,320]. MG and G have been suggested to relate to uremic polyneuropathy [320] and are considered to be epileptogenic [321]. Despite their potential for toxicity, guanidino compound kinetics during dialysis have never been the subject of investigation.
In one study, it was indirectly suggested that guanidino compounds display a different intra-dialytic behavior compared to urea, suggesting differences in compartmental behavior [322]. The present study corroborates this impression by direct calculations.
As can be observed from Table V-3 and Fig. V-2, guanidinoacetic acid, methylguanidine, and guanidine show a remarkable similarity for the four model parameters: perfused and non-perfused volume, and dialyzer and inter-

Intra-dialytic kinetic behavior of uremic solutes
223
compartmental clearances. Although their dialyzer clearance is similar to (for GAA and G) or even higher (for MG) than that of urea, the effective removal, expressed by RReff, is significantly lower than for urea (Table V-5). This potential for different removal behavior is mainly attributable to the significantly larger non-perfused volume for GAA, G and MG. As a consequence, GAA, G and MG concentrations diminish only slightly in the non-perfused compartment, as indicated by their significantly smaller delta SC2eff values, in spite of similar speed of redistribution between both pools. It should be remarked, however, that CT and GAA, the precursor of CT, both play an important role with respect to the energy metabolism. As a consequence, the larger distribution volume as found for both solutes must be considered as a positive feature in avoiding unwanted solute deficiency caused by dialysis.
Guanidinosuccinic acid, on the contrary, is distributed in a much smaller volume, while it is, however, characterized by an analogous dialyzer clearance as urea. Although inter-compartmental solute transport is significantly slower than for guanidine (G), GSA shows a kinetic behavior approaching that of a single pool model (Fig. V-2). As a consequence, effective clearance is highly adequate, even as compared to urea.
Up till now, few kinetic analyses have been undertaken for other molecules than urea. Some of those have concentrated on β2-microglobulin, which has a relatively high molecular weight, as compared to urea and the studied guanidino compounds [305,323]. Not surprisingly, molecules like β2-microglobulin show a kinetic behavior different from urea, essentially attributable to the resistance imposed by their molecular weight on the transfer from one compartment to another. Surprisingly, in the present study, we found an aberrant kinetic behavior for the guanidino compounds, which are small and water-soluble like urea.
In previous studies, applying less refined tools for the estimation of intra-dialytic behavior, it has been shown that urea removal did not correlate with removal of several protein bound compounds [286,288]. In addition, a similar discrepancy was shown for urea and three small water-soluble compounds, phosphate [289,290], xanthine, and hypoxanthine [286,288]. The latter three solutes are known to interfere with biological/biochemical functions [293,294], in contrast to urea, for which few interactions are known, even at the clinical level [258]. Our data add to the perception that urea is not representative as a marker for the removal of other uremic solutes. According to the present data, this is even true for equally small and water-soluble compounds.

Chapter V
224
Why do small water-soluble compounds behave differently from urea? Virtually none of uremic retention solutes kinetically behave like urea, even not creatinine, as also demonstrated by our own data. Previous studies, a priori assuming a total distribution volume equal to that of urea [267], found inter-compartmental CTN transport about half as efficient as that of urea. Without preliminary assumptions, we found a significantly larger total distribution volume for CTN, while no difference was found between the inter-compartmental clearances. Both approaches for CTN kinetic modeling, however, imply a lower effective clearance, which is reflected by significantly lower RReff and delta SC2eff values (Table V-5), as compared to urea. In a seminal study, Langsdorf et al. [324] demonstrated that removal of creatinine and uric acid, two small water-soluble compounds, from intracellular to extracellular, was hampered in dialysis patients as compared to urea. These data suggest that the transfer of molecules through the cell membrane is restricted by other uremic solutes, perhaps due to the induction of structural changes.
Originally, urea kinetics were mainly modeled using a single pool model that allows an easy derivation of the dialysis adequacy parameter K·t/V [325]. At a later stage, corrections were introduced accounting for the varying distribution volume during dialysis due to ultrafiltration [326]. According to recent data [267,268,327,328], the interpretation of urea kinetics is most accurate when a two-pool kinetic model is applied. Although most previously performed two-pool urea kinetic studies used different a priori assumptions with respect to total distribution volume and inter-compartmental clearance, our approach, based on fitting those parameters, results in analogous conclusions. First, we found a mean urea total distribution volume of 55% of mean body weight (Table V-2), which closely corresponds with the theoretical value of total body water (56-58% of BW) [269,327]. Second, our inter-compartmental urea clearance (822±345mL/min) is in good agreement with previous publications reporting K12 values ranging from 700 up to 960mL/min [267,268]. Furthermore, it should be remarked that our calculated effective reduction ratio is comparable to the results of previous clinical studies [329].
Finally, the question should be raised whether the presented data indicate that follow-up of urea removal in dialysis patients is irrelevant? Two recent studies showed no differences in survival while two different levels of urea removal were pursued [258,306]. Although observational, other studies, however, highlight the value of estimating urea removal as an index of dialysis adequacy [90,330]. Therefore, the conclusion of the present study is rather that, apart from urea, we should consider that many other changes occur in uremia and dialysis, and that

Intra-dialytic kinetic behavior of uremic solutes
225
not all of them are representatively reflected by urea kinetics, even when considering other small water-soluble compounds such as the guanidino compounds.
3.6. Conclusion
Because urea is virtually the only clinically applied marker for adequacy of dialysis, few analyses have been concentrated on the intra-dialytic kinetic behavior of other uremic solutes. While scanty data suggests that large solutes show a kinetic behavior different from urea, the question investigated in this study is whether other small water-soluble compounds such as the guanidino compounds studied here show a kinetic behavior that is comparable or not to that of urea. As creatinine, creatine, guanidinoacetic acid, guanidine and methylguanidine have a significantly larger distribution volume compared to urea, those compounds are removed less efficiently from the body than urea. Guanidinosuccinic acid, on the contrary, characterized by a significantly smaller distribution volume, is removed more efficiently than urea. In conclusion, the kinetics of the guanidino compounds under study are different from that of urea; hence, urea kinetics are not representative for the removal of other uremic solutes, even small and water-soluble uremic solutes.
3.7. Acknowledgements
The authors were supported by the Belgian Fund for Scientific Research-Flanders (FWO Grant # 6.0394.00). Financial support was also obtained from the University of Antwerp, the Flemish Ministry of Education, the Born-Bunge Foundation, OCMW Medical Research Foundation and Neurosearch Antwerp.

Chapter V
226
4. Intra-dialytic kinetic behavior of protein- bound uremic toxins†
4.1. Introduction
The role that protein-bound solutes play in the uremic syndrome has been partly neglected because their identification in uremic serum is not easy [331,332]. The measurement of protein-bound solutes in serum is mainly based on high performance liquid chromatography (HPLC) on reverse phase columns. To determine the total concentration of compounds (bound and unbound fraction), serum deproteinization is needed in order to release the ligands from the protein-binding sites [333].
Protein-bound compounds share some important characteristics. They may have an impact on the biological activity of protein-bound drugs and other protein-bound solutes by increasing the free fraction of ligands. Furthermore, they are not efficiently removed by classical dialysis, even when using large pore dialysis membranes [334]. As a consequence, they are retained in renal failure and affect major biochemical/biological functions involved in the uremic syndrome [292]. Two recent studies reported the correlation of protein-bound uremic solutes with indications of clinical condition [335,336].
To have better insight in the kinetic behavior of protein-bound solutes, the present preliminary study has been undertaken to quantify the kinetics of major protein-bound substances. With a two-pool model, kinetic calculations were performed fitting plasma concentrations during hemodialysis. Three kinetic parameters were derived, i.e. perfused volume, total distribution volume, and inter-compartmental clearance.
4.2. Patients and Methods
4.2.1. Patients and dialysis strategies
Five stable dialysis patients without residual renal function included this study. The local ethical committee approved the study, and written informed consent was obtained. The patients were 71±11 years old and were 71.9±2.8kg of body
† The results for indoxyl sulphate were adapted from the submitted publication
Removal mechanisms of protein bound uremic toxins by super flux cellulose triacetate dialyzers: a crossover prospective analysis
R. De Smet, S. Eloot, M.A. Waterloos, A. Dhondt, N. Lameire, and R. Vanholder

Intra-dialytic kinetic behavior of uremic solutes
227
weight. Conventional hemodialysis was performed during 258±16 minutes using the low flux polysulphone F10HPS dialyzer (Fresenius Medical Care, Bad Homburg, Germany). Dialysate was prepared conform to the criteria of purity, as proposed by the European Best Practice Guidelines [214]. A constant dialysate flow of 500mL/min was applied, while blood flows were 331±14mL/min and ultrafiltration flows were 0.86±0.23L/h. The patients had a pre-dialysis hematocrit of 35±2% and total serum protein of 63.2±7.3g/L. The mean K·t/Vurea in the period preceding the experiment was 1.78±0.20 [303].
4.2.2. Blood and dialysate sampling
For each patient, blood was sampled from the inlet and outlet blood lines immediately before the onset of dialysis, after 5, 15, 30, 120 minutes, and post dialysis. Blood samples were centrifuged at 1900g (CR 412, Jouan, Saint-Herblain, France), after which the serum was stored at -80°C until analysis. From the outlet dialysate line, dialysate was sampled after 5, 15, 30, 120 minutes after the start of dialysis, and immediately prior to the end of dialysis.
4.2.3. Analyses
Total protein was determined photometrically by the biuret method (Genesys 10vis, Spectronic, Unicam, Rochester, USA). Hematocrit was obtained with the capillary centrifugation technique.
Table V-6: Main characteristics of several protein-bound solutes.
Protein binding Compound MW
Da Normal conc
mg/L Uremic conc
mg/L Normal
% Uremic
% Hippuric acid 179 < 5.0 247.0 ± 112 56 - 68 34
Indoxyl sulphate 251 0.6 ± 5.4 53.0 ± 91.5 90 - 99.9 89 IAA (µg/L) 175 17.5 ± 17.5 875 ± 560 93.6 81
P-cresol 108 0.6 ± 1.0 20.1 ± 10.3 99.9 88 CMPF 240 7.7 ± 3.3 61.0 ± 16.5 99.9 99.9
molecular weight MW; indole-3-acetic acid IAA; 3-carboxy-4-methyl-5-propyl-2-furanpropionic acid CMPF. Normal and uremic concentrations adapted from Vanholder et al. [229]; normal and uremic protein binding adapted from McTique et al. [337] and De
Smet et al. [unpublished data].
Analyses of several protein-bound compounds were performed on dialysate and diluted (1:3) plasma: hippuric acid, indoxyl sulphate, indole-3-acetic acid (IAA), p-cresol, and 3-carboxy-4-methyl-5-propyl-2-furanpropionic acid (CMPF). The main characteristics of those compounds are shown in Table V-6.

Chapter V
228
Total (bound and unbound) concentrations were determined by deproteinization based on heat denaturation, and consecutive ultrafiltration. The obtained ultrafiltered samples were submitted to high performance liquid chromatography (HPLC) as described previously [288].
4.2.4. Kinetic model
The two-pool model as described in paragraph 3.3.4 and illustrated in Fig. V-1, was used to derive the kinetic behavior of the protein-bound compounds under study.
Blood-side dialyzer clearance (Kblood) and solute generation rate (GS) were calculated from plasma and dialysate concentrations, respectively. The ultrafiltration rate (QUF) was applied on both volumes proportionally. The sampled concentrations were fitted with a bi-exponential curve determining the perfused volume (V1), the total distribution volume (Vtot), and the inter-compartmental clearance (K12).
4.2.5. Solute removal
In analogy with the urea reduction ratio (URR), the reduction ratio RR (%) of the protein-bound solutes was determined from the pre-dialysis and immediately post-dialysis plasma concentration in the perfused compartment, C1_pre and C1_post, respectively (Eq. V-5).
4.2.6. Statistical analysis
Data are expressed as mean ± standard deviations. Correlations between parameters were investigated by performing linear regression analysis (Pearson). Statistical analyses were carried out using the Student t-Test for unpaired samples on normally distributed populations, with P<0.05 as the limit of significant difference.
4.3. Results
Fig. V-5 illustrates the plasma concentration profiles for the five patients of p-cresol (left panel) and CMPF (right panel) as measured in vivo with the five patients. It is obvious from Fig. V-5 that both protein-bound solutes do not follow a bi-exponential concentration decline. As a consequence, both solutes could not be modeled using the proposed two-pool kinetic model. P-cresol was found to fluctuate in the beginning of the dialysis session, but showed an intra-

Intra-dialytic kinetic behavior of uremic solutes
229
dialytic decrease from 7.8±1.6mg/L to 5.8±1.5mg/L. Even more, CMPF plasma concentrations were increased from 6.5±2.3mg/L pre-dialysis up to 7.1±2.3mg/L post dialysis.
Fig. V-5: Intra-dialytic concentrations of p-cresol (left panel) and CMPF (right panel).
For hippuric acid, indoxyl sulphate, and IAA plasma concentrations, reliable kinetic results were obtained with the two-pool model. The fitted kinetic parameters i.e. perfused volume (V1), total distribution volume (Vtot), and inter-compartmental clearance (K12), as well as the solute generation rate (GS) and dialyzer clearance (Kblood), are shown in Table V-7. The values are compared with those found for the small and water-soluble compound urea [338].
Table V-7: Kinetic modeling parameters for three protein-bound solutes compared to urea.
Compound GS
mg/24h V1 L
Vtot L
Vtot / BW L/kg
Kblood
mL/min K12
mL/min Urea 18600±5160 6.4 ± 3.3 42.7 ± 6.0 0.55 ± 0.09 261 ± 17 822 ± 345
Hippuric acid 347 ± 9 5.2 ± 1.7 29.8 ± 2.6 0.42 ± 0.03 184 ± 9 426 ± 303Indoxyl sulphate 54 ± 21 3.9 ± 0.5 25.6 ± 7.5 0.36 ± 0.10 31 ± 9 288 ± 320
IAA 7.4 ± 4.0 4.5 ± 1.9 42.8 ± 9.9 0.60 ± 0.15 69 ± 8 526 ± 671solute generation rate GS; perfused volume V1; total distribution volume Vtot; total distribution volume normalized for body weight Vtot/BW; dialyzer clearance Kblood; inter-compartmental
clearance K12; indole-3-acetic acid IAA.
The mean total distribution volumes were equal to 29.8±2.6L (hippuric acid), 25.6±7.5L (indoxyl sulphate), and 42.8±9.9L (IAA), while the perfused volumes were respectively 5.2±1.7L, 3.9±0.5L, and 4.5±1.9L.
No significant differences were observed between the perfused volumes among the protein-bound solutes under study. Even compared to the results as found for urea, no differences were seen.
0
2
4
6
8
10
12
0 60 120 180 240 300
time (min)
conc
entra
tion
(mg/
L)
0
2
4
6
8
10
12
0 60 120 180 240 300
time (min)
0
2
4
6
8
10
12
0 60 120 180 240 300
time (min)
conc
entra
tion
(mg/
L)
0
2
4
6
8
10
12
0 60 120 180 240 300
time (min)

Chapter V
230
With respect to the total distribution volumes, however, there were significant differences between Vtot and Vtot/BW for IAA and those for hippuric acid (P=0.022 and P=0.025) and indoxyl sulphate (P=0.001 and P=0.005, respectively). Compared to urea, hippuric acid and indoxylsulphate were characterized by a significant smaller total distribution volume (P=0.001 both), while IAA is distributed in a volume comparable to that of urea.
Considering the inter-compartmental clearance K12, the only significant difference was found between the value for indoxyl sulphate and that for urea (P=0.022), the value for indoxyl sulphate being lower.
No correlations were found between the kinetic parameters for the different investigated protein-bound compounds, nor between the parameters for urea and those for the protein-bound solutes.
The reduction rates for the different protein-bound compounds are given in Table V-8 and are compared to the urea reduction ratio URR [338]. The post-dialysis concentration for hippuric acid, indoxyl sulphate, and IAA were taken at the kinetic model, whereas for p-cresol and CMPF the in vivo measured data was used for the calculation of RR.
Table V-8: Reduction ratio for protein-bound solutes.
Compound C1_pre mg/L
C1_post mg/L
RR %
Urea 1440 ± 540 366 ± 156 75 ± 4 Hippuric acid 89.5 ± 38.6 20.1 ± 90.6 78 ± 3
Indoxyl sulphate 32.0 ± 13.8 21.2 ± 9.7 34 ± 6 IAA 2.5 ± 1.0 1.5 ± 0.7 43 ± 7
P-cresol 7.8 ± 1.6 5.8 ± 1.5 26 ± 6 CMPF 6.5 ± 2.3 7.1 ± 2.3 -13 ± 20
pre-dialysis plasma concentration C1_pre; post-dialysis plasma concentration C1_post ; reduction ratio RR.
All protein-bound solutes were characterized by a reduction ratio that is significantly smaller compared to urea, except hippuric acid. The RR for CMPF was even found negative, although with a large standard deviation. While most solutes under study showed a reduction ratio that is significantly different from each other, a comparable RR was found for urea and hippuric acid, indoxyl sulphate and IAA, and indoxyl sulphate and p-cresol.

Intra-dialytic kinetic behavior of uremic solutes
231
4.4. Discussion
In the present study, the kinetic behavior of several protein-bound compounds was examined, and comparisons were made with the small and water-soluble molecule urea. Plasma concentrations during dialysis were evaluated and for those solutes following a bi-exponential profile, a two-pool kinetic model was applied to describe the kinetics. The measured concentration data was fitted using three parameters: perfused volume V1, total distribution volume Vtot, and inter-compartmental clearance K12.
The major results of this study are: first, the removal of p-cresol is non efficient and concentrations vary arbitrarily at least during the first half hour of dialysis; second, CMPF is characterized by a concentration increase towards the end of dialysis; third, hippuric acid, indoxyl sulphate, and IAA show a bi-exponential concentration decline during dialysis, and, even more, the compartmentalization of IAA is comparable to that of urea; and fourth, hippuric acid is removed from the body according a reduction ratio similar to that of urea.
P-cresol (4-methylphenol), which is partially hydrophilic and lipophilic, shows very tight binding to serum proteins (Table V-6), especially to albumin (factor 1.78 from total serum protein). Evaluation of the intra-dialytic variation of total serum protein (Fig. V-6), however, cannot explain the behavior of p-cresol.
Fig. V-6: Mean total serum protein (with SD) in samples from the inlet (rhombs) and outlet blood line (triangles), as a function of dialysis time.
While normally eliminated by the healthy kidneys, serum concentrations are much increased in renal insufficiency, and even more, p-cresol generation was found increased in uremic patients [339]. Several findings suggested that p-cresol plays a role in the enhanced susceptibility to infection [340,341]. Because of its protein binding, it was however found that the biologic activity is especially exerted by the free p-cresol fraction [336,341]. As a consequence, instead of
50
60
70
80
90
0 60 120 180 240 300
time (min)
Tota
l ser
um p
rote
in (m
g/L)

Chapter V
232
focusing only on total p-cresol concentrations during dialysis, it is more appropriate to determine total as well as free fractions of the plasma samples. Combining those results with the change in total serum protein might learn us more about binding and p-cresol removal.
The intra-dialytic increase in plasma concentrations of the strongly lipophilic solute CMPF can be explained, as reported earlier, by hemoconcentration according to the removal of plasma water [334,342]. Its totally different behavior during dialysis as compared to hippuric acid and indoxyl sulphate might be explained by the fact that CMPF is the strongest protein-bound compound [342]. Although CMPF and p-cresol are both strong protein binders, p-cresol plasma concentrations did not merely increase due to hemoconcentration. As a consequence, their different intra-dialytic behavior suggests an important role of free p-cresol, while no free fraction can be observed with CMPF.
The reduction rates as found for indoxyl sulphate and hippuric acid correspond well with earlier reported values for uremic patients [334,343]. The kinetic behavior of hippuric acid, characterized by an RR of 78±3%, can be explained as follows. First, in spite of its protein binding, it is distributed in a significantly smaller volume compared to urea, approaching a single pool behavior. And second, although its distribution is similar to that of indoxyl sulphate, hippuric acid shows a markedly lower protein binding, resulting in a better clearance (Table V-7). In analogy, although IAA is distributed in a volume similar to that of urea, protein binding impeded adequate solute removal.
In conclusion, some protein-bound compounds can be evaluated using a two-pool kinetic model (i.e. hippuric acid, indoxyl sulphate, indole-3-acetic acid IAA). Because the reduction ratio is depending on the degree of compartmentalization and protein binding, each protein-bound solute is characterized by a specific kinetic behavior. Furthermore, other protein-bound solutes, like p-cresol and CMPF, cannot at all be modeled with the proposed kinetic model and need further solute-specific investigation.
4.5. Conclusion
It is known from literature that protein-bound compounds affect major biochemical and biological functions involved in the uremic syndrome and are directly related to clinical conditions. Less is known, however, about their intra-dialytic kinetic behavior and the processes impeding efficient solute removal. Therefore, major protein-bound solutes were preliminary investigated using a two-pool kinetic model. While the kinetics of hippuric acid, indoxyl sulphate,

Intra-dialytic kinetic behavior of uremic solutes
233
and indole-3-acetic acid (IAA) could be explained with the proposed model, p-cresol and carboxy-methyl-propyl-furanpropionic acid (CMPF) need further investigation. It can be concluded that the combination of compartmentalization and affinity for protein binding and/or release results in a solute-specific kinetic behavior.


Chapter VI Analysis of dialysis using a single-pass batch system

Chapter VI
236
1. Chapter overview
This chapter starts with a presentation of the Genius single-pass batch system consisting of a dialysate container in which fresh as well as spent dialysate are stored. The principle of fluid separation and the impacting factors, i.e. temperature and solute concentrations, are explained.
A theoretical, experimental, and numerical analysis was applied to investigate and describe fluid separation.
The theoretical analysis was set out to predict mixing of fresh with spent dialysate for standardized as well as non-standardized dialysis, based on a limited number of data. Therefore, the heat and mass transfer in the entire Genius circuit was described theoretically and a number of parameters were derived empirically with in vitro and in vivo measurements. The theoretical derivation was validated with in vivo data.
With an in vitro setup, the influence of both parameters, i.e temperature and concentration, was investigated experimentally. Suggestions were formulated to maintain dialysis adequacy when performing protracted dialysis.
Finally, a numerical model was developed to visualize the temperature and concentration variations of the fresh and spent dialysate inside the container. This allows a better understanding of the relative impact on mixing of both parameters.

Analysis of dialysis using a single-pass batch system
237
2. Introduction
The Genius single-pass batch system (Fresenius Medical Care, Bad Homburg, Germany) was originally developed by Tersteegen and Van Endert [344]. The mobile system contains a closed loop dialysate circuit with a container of 75L of prepared dialysate.
Fig. VI-1 shows a diagram of the Genius system. A double-sided roller pump (1) simultaneously generates blood and dialysate flow (maximum 300mL/min) in the dialyzer (2). The ultrafiltered fluid is collected in the filtrate recipient (3). In the isolated closed dialysate container of 75L (4), the spent dialysate (5) is drained at the bottom, while the fresh dialysate (6) is expelled from the top.
It has been claimed that an adequate separation of spent and fresh dialysate is maintained during the entire dialysis session based on differences in fluid density [344]. Because density is mainly determined by temperature and concentration, both aspects are further investigated theoretically, with experiments, and numerically.
Fig. VI-1: Flow chart of the Genius dialysis system. Double-sided roller pump (1), dialyzer (2), ultrafiltrate recipient (3), closed container with 75L dialysate (4), spent dialysate (5), fresh dialysate (6), arterial blood line (7), venous blood line (8), sampling port for fresh dialysate (9),
sampling port for spent dialysate (10).
1
2 3
4
5
6
7
8
9
10

Chapter VI
238
3. Theoretical analysis of Genius dialysis†
3.1. Abstract
Hemodialysis remains up till now the most frequently applied technique to remove uremic retention solutes from patients with severe chronic and acute renal failure. In contrast to the standard stationary dialysis setup using online dialysate production, the Genius single-pass batch system, containing a closed dialysate reservoir of 75 liters and a closed-loop circuit, offers a mobile configuration. The fresh dialysate is expelled at the top of the reservoir, while the spent dialysate is drained at the bottom. Although it has been claimed that fluid separation in the container between fresh and spent dialysate is maintained during an entire dialysis session of 4 hours, there are no studies that challenge this hypothesis under extreme conditions. Therefore, the present study was undertaken to investigate whether this separation is guaranteed under whatever clinical circumstance. This question was especially addressed since partial recirculation of spent dialysate results in a significant decrease of dialysis adequacy. Fluid separation is based on density differences. Because concentrations and temperatures affect density, a theoretical description of mass and heat transport in the Genius circuit was derived and validated performing in vivo and in vitro experiments. The derived theory was found adequate to predict dialysate mixing. Moreover, the key conclusion of this study was that dialysate mixing inside the container is more likely when temperature differences between fresh and spent dialysate are reduced.
3.2. Background
Kidney failure is a major and still expanding problem in our modern society. One of the most frequently applied therapies for removal of the solutes retained during renal failure is hemodialysis, a blood purification technique in which the patient’s blood is circulated extra-corporeally through an artificial kidney. In the latter, also called hemodialyzer, blood and dialysate are circulated counter currently on opposite sides of a semi-permeable membrane. This membrane permits the diffusive and/or convective passage of waste metabolites but restricts the transfer of blood proteins and cells from the blood towards the dialysate.
† The contents of this section was submitted for publication
Temperature and urea concentrations as determinants of correct Genius operation. S. Eloot, A. Dhondt, J. Vierendeels, D. De Wachter, R. Vanholder, and P. Verdonck

Analysis of dialysis using a single-pass batch system
239
During a regular hemodialysis session, the patient’s blood is pumped through the dialyzer using one or two cannulas as the patient’s vascular access. The dialysis machine continuously monitors the on-line production of dialysate, a mixture of reverse osmosis water with concentrated salts. Fresh dialysate is pumped into the dialyzer, where it is loaded with waste products, and subsequently the spent dialysate is eliminated from the dialyzer into the waste system.
The Genius single-pass batch system for hemodialysis (Fresenius Medical Care, Bad Homburg, Germany), however, contains a closed loop dialysate circuit with a container of 75L of prepared dialysate. Originally developed by Tersteegen and Van Endert [344], the system is characterized by some important advantages, such as no need for dialysate preparation on the spot, the use of ultrapure dialysate, the efficient controllability of ultrafiltration, its user-friendliness, and its easy transportability.
A diagram of the Genius system is presented in Fig. VI-1. In several aspects, the single-pass batch system differs from other currently used dialysis machines as it contains a closed reservoir in which fresh and spent dialysate are stored. A double-sided roller pump (1) simultaneously generates blood and dialysate flow in the dialyzer (2), so that blood inlet and dialysate outlet flow (fresh dialysate plus ultrafiltration flow) are the same (maximum 300mL/min). The excess body water that is ultrafiltered out of the blood plasma of the patient is collected in a filtrate recipient (3). Instead of a fixed water connection and on-line purification plant, the system contains an isolated closed dialysate container of 75L (4), and the dialysate is produced in a separate preparator to which the tank is connected prior to its use. The spent dialysate (5) is drained at the bottom of the container by flowing downward through a central glass tube, while the fresh dialysate (6) is expelled from the top. It has been claimed that an adequate separation of spent and fresh dialysate is maintained during the entire dialysis session based on differences in fluid density [344]. If mixing would occur, dialysis efficiency would decrease and partial recirculation of spent dialysate results in patient re-intoxication by backdiffusion and/or backfiltration of uremic toxins. The earlier this mixing occurs, the more important the loss in adequacy.
In the present study, we investigated whether and when the main advantage of the Genius system, i.e. the closed dialysate circuit and container, is turned into a disadvantage. Is fluid separation in the container guaranteed under any clinical circumstance? As concentration and fluid temperature mainly determine the density of the spent dialysate, it is conceivable that mixing might be induced with specific dialysis treatment conditions. To better understand all impacting factors

Chapter VI
240
influencing the incidence of dialysate mixing in the container, in the present analysis, mass and heat transport will be described theoretically in the entire Genius circuit and a number of parameters will be derived empirically from in vitro and in vivo measurements. In vivo data was used to validate our theoretical approach. Finally, this study is concluded by a formulation of some recommendations in order to avoid dialysate mixing in the container, such that dialysis adequacy is maintained.
3.3. Materials and methods
3.3.1. Theoretical approach
Since temperature and concentration may influence density differences between the spent and fresh dialysate inside the container, a good understanding of heat and mass transfer in the dialysis circuit is necessary to investigate or prevent dialysate mixing in the container. Therefore, heat and mass transfer in the entire dialysis circuit is analyzed theoretically in order to define the distribution of the temperatures and concentrations in the container.
3.3.1.1. Heat transfer Heat transfer processes involve one or more of the following modes: conduction, convection and/or radiation. In the Genius dialysis setup, we can distinguish between energy transfer to and from the patient, in the dialyzer, in the dialysis tubings, and in the container.
Patient’s blood and body temperature The temperature of blood extracted from the patient’s vascular access does not necessarily reflect body temperature (Tbody) because of possible access and cardiopulmonary recirculation. Therefore, the temperature of the blood fowing into the arterial blood line (Tart) must be corrected by the degree of recirculation R (%) of the blood flowing back from the venous blood line with a temperature Tven
[345]:
R1
RTR1
1TT venartbody −⋅−
−⋅= Eq. VI-1
Temperature balance in the dialyzer Inside a hollow fiber dialyzer, blood and dialysate flow in a counter current fashion at each side of a semi-permeable membrane. As a consequence, radial heat transport between both fluids will take place from the warmer to the colder fluid, according to the local temperature gradient. In the following mathematical

Analysis of dialysis using a single-pass batch system
241
derivation, dialysate inflow temperature is assumed to exceed blood inflow temperature. For a negligible contribution of ultrafiltration to heat transport, the overall heat balance in the dialyzer could be described in the direction of flow as:
( ) dxPT-ThdTcmdTcm FBDMBpBBDpDD ⋅⋅⋅−=⋅⋅−=⋅⋅ && Eq. VI-2
With Dm& and Bm& , respectively, the applied dialysate and blood mass flow rates (kg/s), which vary slightly with temperature, cp the specific heat capacity of the fluids (J/kg/K), T the absolute temperature (K), hM the heat transfer coefficient through the membrane (W/m²/K), PF the summation of the perimeters of all dialyzer fibers (m) and x the considered axial direction (m).
Fig. VI-2: Pressure, temperature, and concentration profiles in a hemodialyzer with the presentation of forward (0,xt) and backfiltration (xt,LF).
Integration over the entire fiber length LF renders the unknown outlet temperatures (subscript o) as a function of the a priori known inlet temperatures (subscript i) (Fig. VI-2):
QD QD - QUF
QB QB - QUF
dx
xLF
pBi
pBo
pDipDo
QUF
dpB
dpD
p
TDoTBo
TDi
TBi
T
CDo CBo
CDi
CBi
C
xt
QD QD - QUF
QB QB - QUF
dx
xLF
pBi
pBo
pDipDo
QUF
dpB
dpD
p
TDoTBo
TDi
TBi
T
TDoTBo
TDi
TBi
T
CDo CBo
CDi
CBi
C
CDo CBo
CDi
CBi
C
xt

Chapter VI
242
( )( ) ( )
( )( )( ) ( )
−⋅⋅−⋅−⋅−−⋅
−=
−⋅⋅−⋅−
⋅−−+=
⋅ BiDiF
FDiDo
BiDiF
FBiBo
TTLβexpα1Lβexp1αTT
TTLβexpα1
Lβexp1TT
Eq. VI-3
With the coefficients α (-) and β (1/m) defined as:
( )( )
( )( )
⋅⋅⋅
=
⋅
⋅=
Dp
FM
Bp
Dp
cmα-1Phβ
cmcm
α
&
&
&
Eq. VI-4
To calculate the blood and dialysate temperatures at an arbitrary position in the dialyzer (Fig. VI-2), LF should be substituted by (x) in the equation for TBo and by (LF-x) in the equation for TDo (Eq. VI-3).
Besides heat conduction over the dialyzer membrane, blood and dialysate temperatures are also influenced by the convection of plasma ultrafiltrate (in case of forward filtration) and dialysate (in case of backfiltration) through the membrane. If the local ultrafiltration rate becomes non-negligible, the overall heat balance in the dialyzer (Eq. VI-2) must be extended, accounting for the convective heat transfer:
( ) ( )( ) UFpUFUFUFFBDM
BpBBDpDD
TcρdQdxPT-Th
TcmdTcmd
⋅⋅⋅±⋅⋅⋅−=
⋅⋅−=⋅⋅ && Eq. VI-5
With ρUF, cpUF, and TUF the density, specific heat capacity, and local temperature of the filtration fluid. The positive sign in the last right-hand term corresponds to forward filtration, while the negative sign is related to backfiltration. The ultrafiltration flow dQUF (m³/s) is driven by the local pressure gradient between the blood and dialysate compartment ∆p = pB-pD (Pa) (Fig. VI-2), and is further function of the membrane permeability coefficient kM (m²/s/Pa) and the membrane surface area dAM (m²):
∆r∆pdAkdQ MMUF ⋅⋅= Eq. VI-6
As ultrafiltration takes place in radial direction, ∆r is equal to the membrane thickness dM (m), and the ultrafiltration flow can be written as a function of the membrane characteristic dKUF, also called ultrafiltration coefficient (m³/s/Pa):

Analysis of dialysis using a single-pass batch system
243
( ) ( )DBUFDB
M
MMUF ppdKpp
ddAk
dQ −⋅=−⋅⋅
= Eq. VI-7
The occurrence and localization of forward and backfiltration can be determined by considering the pressure distributions in blood and dialysate. Poiseuille’s law, valid for laminar flow in circular tubes, can be applied to determine the local pressure drop dpB in the blood compartment:
dx
Dπnρmµ128
dp 4FFB
BBB ⋅
⋅⋅⋅⋅⋅
=&
Eq. VI-8
With µB and ρB the dynamic blood viscosity (0.003Pa·s) and density (1054kg/m³), nF the total number of fibers in the dialyzer (-), and DF the fiber diameter (m). For the non-circular inner space of the dialysate compartment, an equivalent diameter Deq can be derived from dpD as found in a previous performed numerical study [141] and by using Eq. VI-8. Both pressure drops, dpB and dpD, reflect the slope of the pressure distribution at each side of the membrane (Fig. VI-2). The total area in between both curves is a measure for the overall ultrafiltration flow rate as set by the dialysis machine, QUFtot (m³/s), and is determined by the transmembrane pressure TMP (Pa) and the oncotic pressure ∆π (Pa):
UF
UFtotDoDiBoBi
KQ
∆π2
pp2
ppTMP =−
+−
+= Eq. VI-9
As a consequence, backfiltration may occur wherever the dialysate pressure exceeds the blood pressure (Fig. VI-2).
Due to ultrafiltration, the blood mass flow rate, Bm& , in Eq. VI-8 is decreasing over the dialyzer length in the x-direction, resulting in a corresponding increase of dialysate mass flow rate Dm& in the opposite x-direction. This phenomenon results in a pressure drop profile slightly deviating from linearity. The deviation was found, however, insignificant for forward ultrafiltration flow rates restricted to 2L/h [141].
Neglecting the non-linearity of the pressure distributions, ultrafiltration can be written as a linear function of the position x:

Chapter VI
244
( ) ( ) ( )( )
( )
( ) ( )
⋅
⋅⋅⋅⋅⋅
−⋅−
⋅
⋅⋅⋅⋅⋅
−⋅=
−⋅=
x-LDπnρmµ128LpK
xDπnρmµ1280pK
xpxpKxQ
F4eqFD
D DFDUF
4FFB
B BBUF
DBUFUF
&
& Eq. VI-10
If forward as well as backfiltration occurs, Eq. VI-5 should be used for each part of the dialyzer separated by the transition point, xt, where forward filtration switches to backfiltration. In the part of forward filtration, (0,xt), the inlet dialysate temperature is TD(xt), whereas for backfiltration, the inlet blood temperature is TB(xt). As a consequence, to determine the temperature distribution in a dialyzer in which forward and backfiltration take place simultaneously, Eq. VI-5 should be solved iteratively.
Heat transfer in the tubings When blood and dialysate are pumped through the dialysis tubings, their temperature will decrease by heat loss to the ambient room temperature, Troom. The heat exchange phenomenon is described by:
( ) TroomTp dATThdTcm ⋅−⋅=⋅⋅& Eq. VI-11
With hT the effective heat loss coefficient through the tubing wall (W/m²/K), and AT the heat exchange area (m²), which is equal to the product of the perimeter PT with the considered tubing length LT. The dialysate temperature at a distance LT of the tubing, T(LT), can be calculated from the solution of the differential Eq. VI-11, and is function of the dialysate temperature at zero distance T(0):
( ) ( )[ ]
⋅
⋅⋅
−⋅−+= Tp
TTroomroomT L
cmPh
expT0TTLT&
Eq. VI-12
Temperature distribution in the dialysate container Because the fresh dialysate can only be heated during the preparation procedure, prior to the dialysis session, spontaneous cooling of the dialysate starts immediately after the preparation, by heat exchange with the cooler room temperature, Troom. Furthermore, the temperature of the spent dialysate inside the container is influenced by the convective inflow (dV) of new additional spent dialysate if it has a different temperature from the already present spent dialysate, and by heat conduction from the warmer fresh to colder spent dialysate or vice versa. Because the thermal conductivity is only 0.6W/m/K [62], conduction can be considered not important compared to convection, and total change in heat in the volume of spent dialysate can be described as:

Analysis of dialysis using a single-pass batch system
245
( ) ( ) ( ) ( ) ( ) ( )[ ]( ) dVpdVroomCC
ppp
TcmTTA-h
tTtctm∆ttT∆ttc∆ttm∆t1
dtdTcm
⋅⋅+−⋅⋅=
⋅⋅−+⋅+⋅+⋅=⋅⋅
&
& Eq. VI-13
with hC the effective heat transfer coefficient (W/m²/K), AC the interface surface between fresh and spent dialysate (m²), cpdV and TdV the specific heat capacity (J/kg/K) and temperature (K) of the inflowing spent dialysate, and the mass
( ) ( ) ∆tmtm∆ttm ⋅+=+ & .
Because the specific heat capacity, cp, can be assumed constant in the clinical temperature range of 34-38°C, Eq. VI-13 can be solved for T(t + ∆t):
( ) ( )( ) ( )
( )( )( )
( )( ) p
roomCCdV c∆tmtm
∆tTtTAh-T∆tmtm
∆tm
tT∆tmtm
tm∆ttT
⋅⋅+⋅−⋅⋅
⋅⋅+
⋅+
⋅⋅+
=+
&&
& Eq. VI-14
in which the thermal transport velocity k (1/s) can be substituted by:
( )( ) p
CC
c∆tmtmAhk
⋅⋅+⋅
=&&
Eq. VI-15
Finally, the spent dialysate flows downward through the central glass tube entering the container cavity at the bottom side (Fig. VI-1). As a consequence, the temperatures of the surrounding fresh and/or spent dialysate inside the container, as well as the inflowing spent dialysate, are influenced by coupled heat transport (i.e., convection and conduction). Because of the limited heat exchange area of the central tube (≈0.09m²) compared to the total container surface (≈0.93m²), heat exchange near the central tube affects a much smaller dialysate volume inside the container, compared to the heat exchange near the wall.
3.3.1.2. Mass transfer of solutes Although numerous other retention compounds [229,292] could be used to describe mass transport in a dialyzer, the small molecule urea was used as marker in the present study. During dialysis, the patient’s body urea concentration is diminishing (whole-body clearance) as urea is transported, mainly by diffusion, over the dialyzer membrane (dialyzer clearance) towards the dialysate compartment (Fig. VI-3).
Whole-body clearance Since urea is a small water-soluble molecule, which is easily transferred among the intra and extra-cellular compartments in the patient, urea body levels were

Chapter VI
246
assumed to obey single-pool kinetics [325,346]. The mass balance of such a model can be described in terms of a differential equation (Fig. VI-3):
( ) ( )DiBiSBiurea CCDG
dtCVd
−⋅−=⋅ Eq. VI-16
Vurea, the patient’s urea distribution volume (L), is supposed to equal 58% of total body weight [347,348], CBi is the urea blood concentration at the dialyzer inlet (mol/L), GS the urea generation rate (mol/min), CDi the dialysate inlet urea concentration, and D the diffusive dialysance (L/min). The latter is a dialyzer characteristic and is defined as the ratio of the blood-side concentration change to the concentration driving force [86]:
Bi
DiBi
BoBi QCCCC
D ⋅−−
= Eq. VI-17
Fig. VI-3: Single-pool model to evaluate the whole-body and dialyzer clearance with respect to the small molecule urea.
Eq. VI-16 should be numerically integrated. If, however, the change in distribution volume, dV/dt, due to ultrafiltration, can be neglected, and the inlet dialysate concentration can be assumed constant, the urea concentration variation in time, CBi(t), is an exponential function of the start concentration, CBi(0):
( ) ( )
⋅−−⋅
++
⋅
⋅=V
tDexp1DGC
VtD-exp0CtC S
DiBiBi Eq. VI-18
0
5
10
15
20
0 60 120 180 240 300
time (min)
C (m
mol
/L)
V = 35L
D·CBi
CBi
CBi
CDi
CDo
CBo
dialyzer
QB
QD
QB - QUF
QD + QUF
whole-body
V = 75L
Genius
GS
0
5
10
15
20
0 60 120 180 240 300
time (min)
C (m
mol
/L)
V = 35L
D·CBi
CBi
CBi
CDi
CDo
CBo
dialyzer
QB
QD
QB - QUF
QD + QUF
whole-body
V = 75L
Genius
GS

Analysis of dialysis using a single-pass batch system
247
For an urea generation rate GS of 300mmol/24h [338], and a zero dialysate inlet concentration if no dialysate mixing occurs inside the container, CBi increases by only 0.08%, such that the right-hand term in Eq. VI-18 can be neglected.
Mass transfer in the dialyzer The small and water-soluble molecule urea is easily transported by diffusion through the dialyzer membrane without any adsorption. The contribution of convection to the overall solute removal is negligible for small molecules like urea, such that the influence of ultrafiltration might be neglected. In analogy with the description of the heat balance inside a dialyzer, the mass balance is in the flow direction given by (Fig. VI-2):
( )( ) dxC-CPK
C-CdAKdCQdCQ
DBF0
DBM0DDBB
⋅⋅⋅−=⋅⋅−=⋅−=⋅
Eq. VI-19
QB and QD represent the blood and dialysate flow rates (m³/s), C the urea concentration (mol/m³) in blood (subscript B) and in dialysate (subscript D), K0 the overall mass transfer coefficient (m/s), AM the mass exchange area (m²), PF the summation of the perimeters of all fibers (m²), and x the axial direction (m).
Integration over the fiber length LF, in the special considered case of equal blood and dialysate flow rates, results in the following expressions for the outlet blood and dialysate concentrations as a function of the inlet concentrations:
( )( )( )( ) ( )
( )
( )( )( )( ) ( )
( )
−⋅+⋅
⋅+=
−⋅
⋅−⋅−⋅−−
⋅+=
−⋅+⋅
⋅−=
−⋅
⋅−⋅−⋅−−
−=
→→
→→
DiBiDM0
M0Di
DiBiF
FDi0ε1,δDo
DiBiBM0
M0Bi
DiBiF
FBi0ε1,δBo
CCQAK
AKC
CCLεexpδ1
Lεexp1δClimC
CCQAK
AKC
CCLεexpδ1
Lεexp1ClimC
Eq. VI-20
With the coefficients δ and ε equal to:
( )
⋅⋅=
=
B
F0
D
B
Qδ-1PK
ε
QQδ
Eq. VI-21

Chapter VI
248
In order to obtain the blood and dialysate concentrations at an arbitrary distance x, LF should be substituted by (x) in the equation for CBo and by (LF-x) in the equation of CDo (Eq. VI-20).
Mass transfer inside the dialysate container Mass is often transferred simultaneously by two possible mechanisms: diffusion and convection. Diffusion is the result of concentration differences and occurs from a region of higher concentration to one of lower concentration. Convective mass transfer, however, is due to bulk motion of the fluid. In case of natural convection, this motion is induced by density differences, which result from concentration and temperature variations, while forced convection can take place due to mass inflow in the container. The general convection-diffusion equation is defined as:
( )uuρuρn ureaureaureaurea −⋅+⋅= Eq. VI-22
With nurea the urea mass flux (kg/m²/s), ρurea the urea density (1323kg/m³), u the fluid velocity (m/s), and (uurea-u) the diffusional velocity of urea in the fluid (m/s). The second right-hand term in Eq. VI-22, describing diffusive transport (jurea), can be expressed by Fick’s law:
( ) ( )dsωd
Dρuuρj ureaureaureaureaurea ⋅⋅−=−⋅= Eq. VI-23
With Durea the diffusion coefficient of urea in dialysate (m²/s), ρ the total density (kg/m³), and dωurea/ds the urea mass fraction gradient in the s direction.
The dimensionless Péclet number describes the relative importance of convection compared to diffusion, and is defined as the ratio of a convective term to a diffusive term:
urea
C
DLu
Pe⋅
= Eq. VI-24
LC represents a characteristic length of the container (m) (eg. container height).
To have an idea about the relative importance of buoyancy forces acting in the fluid, we can consider the dimensionless drag coefficient, DDC, defined as the ratio of the gravitational force to the inertial force:
( )2C
uρgLρ'-ρ
DDC⋅
⋅⋅= Eq. VI-25
With (ρ’- ρ) the density difference between the reservoir’s and inflowing spent dialysate, and u the local convective fluid velocity.

Analysis of dialysis using a single-pass batch system
249
It should be remarked that the buoyancy force in a fluid results in a tendency for the upper regions to be composed of lower density material than the lower regions. This phenomenon, also referred to as mass stratification, may be discrete or continuous.
Because no direct data was available of the densities inside the container, density of fresh and spent dialysate were calculated accounting for the temperature and concentration influence. Density of fresh dialysate was determined from the concentration of its components (paragraph 3.3.2.2) and was found 1004.37g/L at 37°C. Spent dialysate consists of water, electrolytes and uremic solutes. Neglecting electrolyte, glucose and acid base shifts during dialysis, the amount of electrolytes can be considered similar as in fresh dialysate. The density of spent dialysate was determined based on the measured urea concentrations in dialysate, simultaneously measured concentrations of protein-bound solutes [unpublished data], and calculations using reported uremic solute serum concentrations [229].
3.3.2. Validation study
3.3.2.1. In vitro experiments Dialysate temperature variation over the tubing length was measured in order to calculate empirically the effective heat transfer coefficient through the tubing wall, hT (Eq. VI-12). More specific, temperature was registered using two probes, which were placed consecutively at different mutual distances in the dialysate line (0.225, 1.05, and 2.01m) upstream from the dialyzer. Room temperature was measured simultaneously.
3.3.2.2. In vivo experiments A uremic patient, regularly dialyzed with standard hemodialysis, was experimentally dialyzed twice with the Genius single-pass batch system [349]. A high-flux polysulfone 70S dialyzer (Fresenius Medical Care, Bad Homburg, Germany) was used in combination with a blood and dialysate flow of 300mL/min. The composition of the dialysate was: 35mmol/L bicarbonate, 140mmol/L sodium, 111.5mmol/L chloride, 5.5mmol/L glucose, 0.084mmol/L citrate, 1.25mmol/L calcium, 0.5mmol/L magnesium, and 1mmol/L potassium. Two dialysis sessions were performed using a dialysate start temperature either of 36.4°C or 37.6°C. The ultrafiltration volume was 3.6L (QUF 13.3mL/min) and 4.2L (QUF 15.5mL/min) during the session with the low and higher dialysate start temperature, respectively.
Dialysate temperatures were registered at 5, 30, 60, 90, 120, 150, 180, 210, 225, 230, 235, 240, 255, and 270 minutes after the onset of dialysis at the entrance and

Chapter VI
250
exit of the container. The patient’s body temperature was measured at the start and after 120 and 240 minutes.
In order to determine urea mass transport, dialysate was sampled from the container exit and entrance line (numbers 9 and 10 in Fig. VI-1) after 5, 60, 180, 210, 225, 230, 235, 240, 255, and 270 minutes. The samples were stored at -20°C until analysis. Blood samples were taken at the arterial blood line at the start of dialysis and after 240 and 270 minutes. After immediate centrifugation at 3000rpm (CR 412, Jouan, Saint-Herblain, France), the serum samples were stored at -20°C until analysis. Urea concentrations (mmol/L) were determined by the Urease/Berthelot reaction and measured photometrically at 570nm (Genesys 10 vis, Spectronic, Unicam, Rochester, NY, USA).
3.3.2.3. Theoretical predictions Two major questions were investigated to check the validity of the theoretical approach. First, is it possible to determine the temperature and urea concentration at the container entrance based on the temperature and concentration measured at the container exit and accounting for the influence of dialysis? And second, is it possible to predict the temperature and concentration variations inside the container with the known entrance and exit temperatures and concentrations? In other words, is it possible to predict mixing? If so, the described theory would be applicable to calculate mixing for less current dialysis strategies (e.g. long slow dialysis) by performing a limited number of tests, and to determine which setups can be applied to prevent mixing as long as possible and to offer as adequate as possible dialysis.
3.4. Results
3.4.1. Prediction of temperature at the container entrance
3.4.1.1. Measured data Fig. VI-4 illustrates the dialysate temperatures as measured at the container entrance (squares) and exit (triangles) at different time points during in vivo dialysis. The patient’s body temperature was measured at 0, 120, and 240 minutes (rhombs). Those measured data were linearly interpolated (dotted line in Fig. VI-4) and a mean body temperature of 36.0±0.2°C (colder dialysis) and 36.3±0.1°C (warmer dialysis) was found.

Analysis of dialysis using a single-pass batch system
251
3.4.1.2. Calculated data As validation of the theory, the dialysate temperature at the container entrance was calculated theoretically based on the measured exit temperature and patient’s body temperature, and the results were compared to the measured data.
Fig. VI-4: Blood and dialysate temperature time course at the inlet and outlet of the dialyzer for a dialysate start temperature of 36.4°C (left panel) and 37.6°C (right panel). Measured temperature of the patient’s body (rhombs), fresh dialysate at the container exit (triangles), and spent dialysate
at the container entrance (squares). Calculated temperature of the patient’s body (dotted line), blood at dialyzer inlet (thin line), blood at dialyzer outlet (crossed line), and dialysate at the
container entrance (bold line).
In order to account for the influence of dialysis, the ultrafiltration profile in the dialyzer might play a role and was first calculated. For the Fresenius F70S dialyzer with 10800 fibers (inner diameter 200µm), the pressure drop in the blood compartment is 61mmHg. An equivalent fiber diameter of 259µm corresponds with a dialysate flow of 300mL/min and dialysate pressure drop of 5mmHg. The F70S dialyzer is characterized by an ultrafiltration coefficient of 122mL/h/mmHg, derived with the in vitro method earlier described by Eloot et al. [142]. An ultrafiltration flow of 13.3mL/min (cf. the colder dialysis session) results in a mean transmembrane pressure (TMP) of 6.7mmHg. Calculated pressure and flow distributions are illustrated in Fig. VI-5. For the applied blood, dialysate and ultrafiltration flows, forward filtration converts into backfiltration at 60% of the dialyzer length (xt = 0.138m). This results in a total amount of forward and backfiltration of 39.6mL/min and 26.3mL/min, respectively. Despite the considerable amount of forward and backfiltration, heat transfer owing to the ultrafiltrate flow inside the dialyzer was rather limited (less than 5% contribution) compared to the conductive heat flow.
In order to quantify heat loss in the tubings, dialysate temperatures were measured in vitro at different distances LT in the dialysate line. For a dialysate mass flow of 5.04·E-3kg/s (corresponding to 300mL/min), a room temperature of
34
35
36
37
38
0 60 120 180 240 300
time (minutes)
tem
pera
ture
(°C
)
34
35
36
37
38
0 60 120 180 240 300time (minutes)
34
35
36
37
38
0 60 120 180 240 300
time (minutes)
tem
pera
ture
(°C
)
34
35
36
37
38
0 60 120 180 240 300time (minutes)

Chapter VI
252
25.5±0.2°C, and a start dialysate temperature of 37.5±0.6°C, an effective heat transfer coefficient hT of 35.2±14.2W/m²/K was found using Eq. VI-12.
Fig. VI-5: Pressure and flow along an F70S hemodialyzer for QB=QD=300mL/min and QUF=13.3mL/min.
Accounting for the dialysate cooling when flowing through the dialysis tubings, we calculated the dialysate temperature at the dialyzer inlet (TDi). From the measured patient’s body temperature (Tbody) and accounting for the heat loss in the tubings, blood temperature at the dialyzer inlet (TBi) was calculated iteratively using Eq. VI-1 (Fig. VI-4, thin line). Assuming a realistic heat transfer coefficient hM in the dialyzer of 300W/m²/K, blood outlet temperature (TBo) (crossed line) and dialysate outlet temperature (TDo) were determined using Eq. VI-3. The latter was further used to determine the dialysate temperature at the container entrance (bold line in Fig. VI-4), which was compared to the measured data (squares). Deviations between calculations and measurements were 2.1±0.9% (number of data points n=14) and 1.0±0.9% (n=14) for the colder and warmer dialysis, respectively.
3.4.2. Prediction of concentration at the container entrance
3.4.2.1. Measured data The patient’s urea concentrations sampled at the arterial blood line are given in Table VI-1 for the colder and warmer dialysis session, while Fig. VI-6 shows the measured dialysate urea concentrations at the container entrance (crosses) and exit (rhombs).
QD QD - QUF
QB QB - QUF
dx
61mmHg
0mmHg
dpB = 61mmHg
dpD= 5mmHg
p
0x (m)
0.230.145
QD QD - QUF
QB QB - QUF
dx
61mmHg
0mmHg
dpB = 61mmHg
dpD= 5mmHg
p
0x (m)
0.230
18.9mL/min32.2mL/min
19.4mmHg24.4mmHg
QD QD - QUF
QB QB - QUF
dx
61mmHg
0mmHg
dpB = 61mmHg
dpD= 5mmHg
p
0x (m)
0.230.145
QD QD - QUF
QB QB - QUF
dx
61mmHg
0mmHg
dpB = 61mmHg
dpD= 5mmHg
p
0x (m)
0.230
18.9mL/min32.2mL/min
19.4mmHg24.4mmHg

Analysis of dialysis using a single-pass batch system
253
3.4.2.2. Calculated data To validate the theory, the urea concentration at the container entrance was determined applying the data as measured at the container exit and in the patient’s blood, and the results were compared to the measurements.
Table VI-1: Blood urea concentrations CBi (mmol/L).
Time point minutes
CBi for colder dialyis mmol/L
CBi for warmer dialysis mmol/L
0 15.67 16.67 240 4.43 4.50 270 4.70 4.83
Fig. VI-6: Time course of urea concentration in blood and dialysate for a dialysate start temperature of 36.4°C (left panel) and 37.6°C (right panel). Measured urea concentrations of
fresh dialysate at the container exit (rhombs), and spent dialysate at the container entrance (crosses). Calculated urea concentrations of blood at dialyzer inlet (thin line), blood at dialyzer
outlet (dotted line), and spent dialysate (bold line).
For the patient of 55kg body weight, the urea distribution volume is equal to 32L. From the urea blood concentration measured at the start of dialysis and after 240 minutes, urea dialysance D was calculated using Eq. VI-18 (with CDi=0 and G≈0), and was found equal to 168mL/min and 174mL/min for the dialysis session with a dialysate start temperature of 36.4°C and 37.6°C, respectively. Furthermore, the blood inlet concentrations (CBi) during the entire dialysis session were derived (Eq. VI-18) and are illustrated in Fig. VI-6 (thin line). The dialysate concentrations at the dialyzer inlet (CDi) are equal to those measured at the container exit (see rhombs in Fig. VI-6).
From the blood and dialysate concentrations at the dialyzer inlet (CBi and CDi), blood and dialysate outlet concentrations (CBo and CDo: dotted and bold line in Fig. VI-6, respectively) were derived using Eq. VI-20. As can be observed from Fig. VI-6, good agreement was found between measurements and calculations
0
5
10
15
20
0 60 120 180 240 300
time (minutes)
urea
con
cent
ratio
n (m
mol
/L)
0
5
10
15
20
0 60 120 180 240 300
time (minutes)
0
5
10
15
20
0 60 120 180 240 300
time (minutes)
urea
con
cent
ratio
n (m
mol
/L)
0
5
10
15
20
0 60 120 180 240 300
time (minutes)
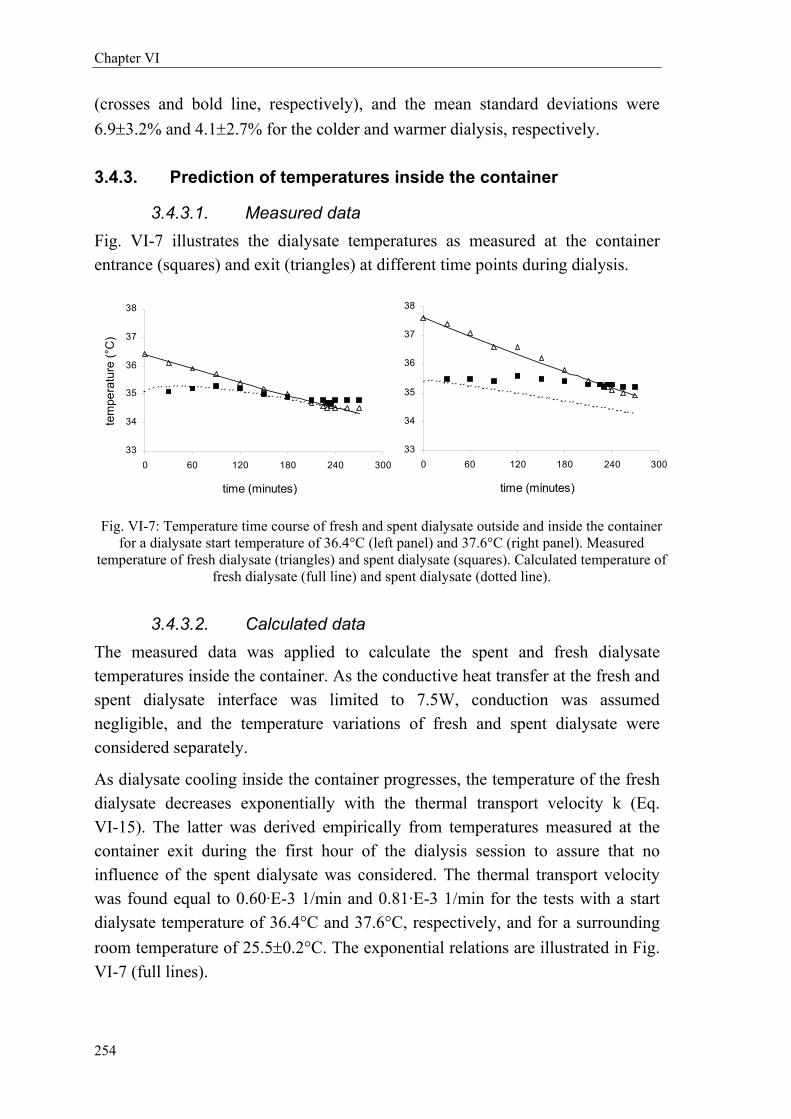
Chapter VI
254
(crosses and bold line, respectively), and the mean standard deviations were 6.9±3.2% and 4.1±2.7% for the colder and warmer dialysis, respectively.
3.4.3. Prediction of temperatures inside the container
3.4.3.1. Measured data Fig. VI-7 illustrates the dialysate temperatures as measured at the container entrance (squares) and exit (triangles) at different time points during dialysis.
Fig. VI-7: Temperature time course of fresh and spent dialysate outside and inside the container for a dialysate start temperature of 36.4°C (left panel) and 37.6°C (right panel). Measured
temperature of fresh dialysate (triangles) and spent dialysate (squares). Calculated temperature of fresh dialysate (full line) and spent dialysate (dotted line).
3.4.3.2. Calculated data The measured data was applied to calculate the spent and fresh dialysate temperatures inside the container. As the conductive heat transfer at the fresh and spent dialysate interface was limited to 7.5W, conduction was assumed negligible, and the temperature variations of fresh and spent dialysate were considered separately.
As dialysate cooling inside the container progresses, the temperature of the fresh dialysate decreases exponentially with the thermal transport velocity k (Eq. VI-15). The latter was derived empirically from temperatures measured at the container exit during the first hour of the dialysis session to assure that no influence of the spent dialysate was considered. The thermal transport velocity was found equal to 0.60·E-3 1/min and 0.81·E-3 1/min for the tests with a start dialysate temperature of 36.4°C and 37.6°C, respectively, and for a surrounding room temperature of 25.5±0.2°C. The exponential relations are illustrated in Fig. VI-7 (full lines).
33
34
35
36
37
38
0 60 120 180 240 300
time (minutes)
33
34
35
36
37
38
0 60 120 180 240 300
time (minutes)
tem
pera
ture
(°C
)
33
34
35
36
37
38
0 60 120 180 240 300
time (minutes)
33
34
35
36
37
38
0 60 120 180 240 300
time (minutes)
tem
pera
ture
(°C
)

Analysis of dialysis using a single-pass batch system
255
The temperature profile of the spent dialysate, however, was calculated from the measured dialysate temperature at the container entrance (squares) using Eq. VI-14, and is shown in Fig. VI-7 (dotted line). Although the measured dialysate entrance temperature (squares) exceeded the exit temperature (triangles) at 210 and 225 minutes after the start of the colder and warmer dialysis, respectively, important heat transfer inside the container was only obtained at 225 minutes for the colder start dialysate (intersection of full and dotted line), while no significant heat transfer between the fresh and spent dialysate was observed starting with a higher dialysate temperature. This phenomenon is also reflected in the dialysate temperatures at the container exit (triangles), as they turn out to be constant when entrance and exit temperatures become equal at 210 minutes, while they continue decreasing exponentially for the warmer dialysis session. As a consequence, the described theoretical method forms a satisfactory approximation for determination of temperatures inside the container.
3.4.4. Prediction of concentrations inside the container
3.4.4.1. Measured data The concentrations at the container entrance and exit are shown in Fig. VI-6. Fresh dialysate was contaminated at 235 and 255 minutes after the start of dialysis for the colder and warmer dialysis session, respectively.
3.4.4.2. Calculated data For a mean upward velocity of the spent dialysate front of 3.8·E-5m/s (2.3mm/min) and a diffusion coefficient of urea in water of 1.9·E-9m²/s, a Péclet number of 12000 was found inside the container (average height of 0.65m and virtual diameter of 0.40m). As a consequence, forced convection is much more pronounced compared to diffusion. It should be remarked, however, that, apart from the entrance zone where inflow velocities are in the order of 0.01m/s, kinetic energy is absorbed in the container, resulting in smaller fluid velocities and a much greater influence for the buoyancy forces (Eq. VI-25). As a consequence, buoyancy induced transport is the critical transport phenomenon for potential urea mixing.
Fig. VI-8 shows the calculated densities of fresh and spent dialysate as measured at the container exit and entrance, respectively. The time point at which both densities equalize was determined from the intersection of the corresponding linear regressions. Equal densities at the entrance and exit were found at 200 and 230 minutes for the colder and warmer dialysis, respectively. Those time points are 30.0±7.1 minutes before the expelled fresh dialysate was contaminated. This

Chapter VI
256
retardation can be explained as follows: while the inflowing spent dialysate is climbing in the container towards regions of similar density, it will be further cooled down resulting in a relative density increase, such that it settles at a point in the container not as high as expected.
Fig. VI-8: Density of fresh (rhombs) and spent dialysate (crosses) corresponding to the measurements at the container exit and entrance, respectively. Data is fitted by linear regression: R=0.987 and 0.910 for fresh and spent dialysate with colder dialysis (left panel) and R=0.997 and
0.810 for fresh and spent dialysate with warmer dialysis (right panel).
3.5. Discussion
The aim of the present study was to develop a validated theoretical approach to predict dialysate mixing in the container of the Genius dialysis batch system. Because the adequacy of fluid separation is based on density differences, the main influencing factors, i.e. concentration and temperature, play a key role. Therefore, mass and heat transport in the different parts of the dialysis circuit were described. Validation of theory was performed in two steps. First, the concentrations and temperatures at the container entrance were calculated and compared to the measured data; and second, predictions of the concentrations and temperatures inside the container were compared to the measurements at the entrance and exit.
Relating to the first step, several striking conclusions can be drawn from this study: 1) The spent dialysate temperature was calculated within close limits using fresh dialysate temperatures and only three measurements of body temperature. As a matter of fact, considering the small standard deviation, body temperature can be assumed constant in the theoretical calculation. 2) With respect to concentration, the assumption of a single pool model for urea distribution in the patient, described with good agreement the in vivo results. Furthermore, after
1004,2
1004,4
1004,6
1004,8
1005,0
1005,2
1005,4
1005,6
0 60 120 180 240 300
time (minutes)
dens
ity (g
/L)
1004,2
1004,4
1004,6
1004,8
1005,0
1005,2
1005,4
1005,6
0 60 120 180 240 300
time (minutes)
1004,2
1004,4
1004,6
1004,8
1005,0
1005,2
1005,4
1005,6
0 60 120 180 240 300
time (minutes)
dens
ity (g
/L)
1004,2
1004,4
1004,6
1004,8
1005,0
1005,2
1005,4
1005,6
0 60 120 180 240 300
time (minutes)

Analysis of dialysis using a single-pass batch system
257
applying the mass balance in the dialyzer, dialysate concentrations at the container entrance were found conform to the measured data.
Relating to the second step, major conclusions are: 1) Temperatures inside the container could be predicted theoretically, and the time point at which fresh and spent dialysate temperatures became identical is reflected in the temperature profile as measured at the container exit. 2) The densities at the container entrance and exit equalize at 30 minutes before contamination of the fresh dialysate.
The density of the spent dialysate at the container entrance is changed by 0.4g/L/K assuming constant concentration, while it is increased by 0.24g/L for each additional g/L urea assuming constant temperature. Because concentrations are non-controllable, temperature must be controlled in order to postpone dialysate mixing inside the container. It is obvious from Fig. VI-8 that dialysate of 36°C causes advanced mixing. Considering the measured concentration data at the container exit, it can be calculated by interpolation that mixing can be postponed until the 240th or 250th minute when using a start dialysate temperature of 36.7 and 37.3°C, respectively.
Furthermore, because the thermal conductivity for heat conduction between the spent and fresh dialysate inside the container is 0.6W/m²/K, homogenization of the temperature distribution in the container was faster established for smaller temperature gradients between fresh and spent dialysate (i.e. start dialysate temperature approaching the patient’s temperature as with the colder dialysis).
As diffusive dialysance remains constant for one set of dialyzer and operational conditions, dialysis adequacy decreases from the moment fresh dialysate is contaminated (CDi≠0). Clearance was found to decrease from 172mL/min to 18mL/min at the 235th minute of the colder dialysis session, while it decreased from 179mL/min to 25mL/min at the 255th minute of the warmer dialysis session. As a consequence, the efficiency of dialysis decreases significantly if mixing occurs.
Based on the key conclusion that dialysate mixing is enhanced for a smaller temperature difference between spent and fresh dialysate, some guidelines for clinical practice can be summarized. With a standard dialysis session during 240 minutes, in a program of three times per week, and with standard blood and dialysate flow rates of 300mL/min, fresh dialysate contamination can be postponed by using a start dialysate temperature of at least 37°C. For non-standardized dialysis, the described theory can be applied in advance to calculate mixing.
Chapter VI
258
3.6. Conclusion
The Genius single-pass batch system is a mobile dialysis system with numerous advantages if no mixing of fresh and spent dialysate occurs during dialysis. The present study was undertaken to investigate whether fluid separation is guaranteed under any clinical circumstance. Therefore, a theoretical description of mass and heat transport in the entire Genius circuit was derived and validated with in vivo and in vitro experiments. It was illustrated and explained that dialysate mixing is postponed when using fresh dialysate of higher temperature, i.e. higher than 37.3°C for mixing after the 250th minute of dialysis. Finally, the derived theory was found adequate to investigate in advance the risk factors of dialysate contamination and to determine precautions to take with a non-standardized dialysis session.

Analysis of dialysis using a single-pass batch system
259
4. Experimental analysis of Genius dialysis†
4.1. Introduction
One of the most intriguing features of the Genius system is that both fresh and spent dialysate are stored in the same container, with a separation among both compartments until the container is almost entirely filled with spent dialysate, as demonstrated before [349]. Although this remarkable characteristic is attributed to physical effects, related to the density of the dialysate, caused by its temperature and solute content, no studies are available in the literature evaluating the conditions that influence this separation either positively or negatively.
Knowledge of these factors might be of importance especially since the Genius dialysis system has recently been recommended for daily protracted use in critically ill patients with acute renal failure [350,351]. In this specific population, the plasma and dialysate concentrations of uremic retention solutes tend to become low because of a combination of protracted dialysis and low solute generation due to wasting and/or malnutrition. Likewise, because of the long duration of the sessions, fresh dialysate may cool progressively and eventually may become cooler than the spent dialysate. Hence, in these conditions both factors that are supposed to stabilise the partitioning between both compartments are reduced or even absent.
In the present in vitro study, we investigated the role of differences in density in the partitioning between spent and fresh dialysate. Density of spent dialysate was manipulated by varying its solute content and by warming spent dialysate at the container entrance. The relative contribution of both uremic solute concentration and temperature differences was analyzed.
4.2. Materials and methods
An experimental in vitro setup (Fig. VI-9) was developed mimicking clinical dialysis using the Genius system (Fresenius Medical Care, Bad Homburg, Germany). During the preparation procedure, the dialysate in the Genius container was heated to 37.6±0.2°C. A high flux F70S dialyzer was applied with
† The results of this section were adapted from the submitted publication
In vitro dialysis with the Genius batch system: differentiating the effect of temperature and solute concentration on the partitioning of dialysate
A. Dhondt, S. Eloot, D. De Wachter, R. De Smet, A.M. Waterloos, G. Glorieux, N. Lameire, P. Verdonck, and R. Vanholder

Chapter VI
260
blood and dialysate flows of 300mL/min. The sessions lasted 270 minutes and no ultrafiltration was imposed.
Fig. VI-9: In vitro setup with the Genius dialysis system.
An open tank replaced the patient, assuming a single pool kinetic behavior of the studied solute, i.e. urea, which is a good approximation as demonstrated in paragraph 3.4.2. The tank was filled with 30L fresh dialysate (simulating a patient of 52kg of body weight), in which an a priori known amount of urea was solved (10g, 20g, 30g, or 45g). This corresponds to a pre-dialysis urea concentration of 0.33, 0.67, 1.0, and 1.5g/L. Dialysate composition was similar to that described in paragraph 3.3.2.2. Hydrochloric acid, 9.87mL, was added for pH adjustment. To avoid recirculation, inlet and outlet blood lines were fixed in the tank as far as possible from each other and a blender mixed the fluid continuously.
At the container entrance, the dialysate line was connected to a heat exchanger originating from a Centri 3 (Cobe, Zaventem, Belgium) in connection with a water bath heated by an immersion circulator (Julabo P, Belgolabo, Overijse, Belgium) (Fig. VI-9). The heat exchanger was adjusted manually to obtain the target temperatures.
Dialysate temperature was measured digitally (Oregon scientific, Inc, Tualatin, OR, USA) both at the inlet and outlet dialysate line every 5 minutes during the first half hour of the session and subsequently every quarter until 210 minutes.
1
2
30L
F70S
Patient substitute
Heat exchanger
Genius container
Circulator
1
2
30L
F70S
Patient substitute
Heat exchanger
Genius container
Circulator

Analysis of dialysis using a single-pass batch system
261
From then on measurements were again recorded more frequently: at 220, 225, 230, 235, 240, 250, 260 and 270 min. The progressive cooling of the fresh dialysate, as measured at the container exit, follows initially a first order cooling process described as:
( ) ( )[ ] ( )tkexpT0TTtT roomrrrm ⋅−⋅−+= Eq. VI-26
with Troom the room temperature (°C), T(0) the temperature at the start (°C), T(t) the actual temperature at time point t (°C), and k the thermal transport velocity determining the speed of cooling (1/s). To avoid influences by heat transfer from the tubings at room temperature at the dialysis start, and from the spent dialysate inside the container, k was determined considering data between 30 and 120 minutes.
Three different modalities were studied: first, spontaneous cooling of the dialysate without heating of the spent dialysate; second, heating of the spent dialysate such that container entrance and exit dialysate temperatures were continuously equal, and third, heating of the spent dialysate in order to obtain temperatures at the container entrance corresponding to those observed during in vivo experiments. The first 2 temperature patterns were applied with all 4 urea concentrations, the last one only with 0.33 and 0.67g/L urea. In total 10 different combinations were examined and each combination was tested 6 times.
Dialysate was sampled in polystyrene tubes (Merck Eurolab, Leuven, Belgium) at different time points during the dialysis sessions: at the container entrance every 30 minutes and at the container exit at 5, 30, 60, 90 minutes, and subsequently every quarter until 210 min. From then on samples were again taken more frequently: at 220, 225, 230, 235, 240, 250, 260 and 270 minutes. All samples were tested for urea concentration. Urea (g/L) was determined by an enzymatic urease reaction (Roche Diagnostics, Mannheim, Germany).
Data were expressed as means ± standard deviation (SD). One way analysis of variance (Kruskal-Wallis) followed by Mann Whitney test was applied (GraphPad Prism® 3.0, Graphpad Software, San Diego, California, USA). Significance was accepted if P<0.05.

Chapter VI
262
4.3. Experimental results
4.3.1. Temperature profiles
Fig. VI-10, Fig. VI-11, and Fig. VI-12 display the mean temperatures measured at the container entrance and exit for different urea concentrations of the temperature schedule without heating, with heating until equal temperatures, and with heating as in vivo, respectively.
Fig. VI-10: Temperature profile (mean ± SD) at the container exit (rhombs) and entrance (triangles) with no external heating and for a urea start concentration of 0.33g/L (left panel) and
1.5g/L (right panel).
With the three heating schedules, progressive cooling at the container exit was observed. The thermal transport velocity k was found equal to 0.96±0.12mmin-1 for the experiments without external heating, 0.61±0.07mmin-1 for the experiments in which the spent dialysate was heated to obtain the same temperature as fresh dialysate, and 0.58±0.04mmin-1 for external heating simulating in vivo temperatures of spent dialysate.
Fig. VI-11: Temperature profile (mean ± SD) at the container exit for a urea start concentration of 0.33g/L (rhombs) and 1.5g/L (triangles) with heating until equal temperatures.
30
31
32
33
34
35
36
37
0 60 120 180 240 300time (minutes)
tem
pera
ture
(°C
)
30
31
32
33
34
35
36
37
0 60 120 180 240 300
time (minutes)
30
31
32
33
34
35
36
37
0 60 120 180 240 300time (minutes)
tem
pera
ture
(°C
)
30
31
32
33
34
35
36
37
0 60 120 180 240 300
time (minutes)
34,0
34,5
35,0
35,5
36,0
36,5
37,0
0 60 120 180 240 300time (minutes)
tem
pera
ture
(°C
)

Analysis of dialysis using a single-pass batch system
263
Comparing the experiments without heating to these with heating until equal temperatures, a faster decline of container outlet temperature was noted in the schedule without heating (P<0.0001), pointing to the fact that the temperature of spent dialysate influences that of fresh dialysate. For the tests with heating as in vivo, a slower temperature decline was observed compared to the schedule without heating (P<0.0001), while no difference was observed compared to the schedule with heating until equal temperatures (P=0.127).
Fig. VI-12: Temperature profile (mean ± SD) at the container exit (rhombs) and entrance (triangles) for a urea start concentration of 0.67g/L with heating as in vivo.
4.3.2. Urea concentration profiles
Fig. VI-13 shows urea concentrations at the container entrance (triangles) and exit (rhombs) in a representative experiment with urea start concentration 0.67g/L without heating (left panel) and with heating to equal temperatures (right panel).
Fig. VI-13: Urea concentrations at the container entrance (triangles) and exit (rhombs) in a representative experiment with urea start concentration of 0.67g/L without heating (left panel)
and with heating until equal temperatures (right panel).
0
0,1
0,2
0,3
0,4
0,5
0 60 120 180 240 300
time (minutes)
urea
con
cent
ratio
n (g
/L)
0
0,1
0,2
0,3
0,4
0,5
0 60 120 180 240 300
time (minutes)
0
0,1
0,2
0,3
0,4
0,5
0 60 120 180 240 300
time (minutes)
urea
con
cent
ratio
n (g
/L)
0
0,1
0,2
0,3
0,4
0,5
0 60 120 180 240 300
time (minutes)
34,0
34,5
35,0
35,5
36,0
36,5
37,0
0 60 120 180 240 300
time (minutes)
tem
pera
ture
(°C
)

Chapter VI
264
At the container entrance, a progressive decline in urea concentration was observed, reflecting the decreasing concentration in the tank used as patient substitute. At the container exit, an abrupt increase in urea concentration was remarked between 105 and 235 minutes.
After the appearance of urea at the container exit, the concentration exceeded that measured at the entrance in the experiments with 0.67g/L urea without heating (Fig. VI-13) and with 1.0 and 1.5g/L urea irrespective of heating schedule. In the experiments where urea appeared earlier at the container exit, the concentration was equal or lower than that measured at the entrance.
The mean time points at which urea appeared at the container exit are displayed per experimental setting in Table VI-2. Contamination occured progressively later with increasing urea concentrations: from 185±20 (0.33g/L urea) to 227±5 min (1.5g/L) for the experiments without heating, from 122±11 (0.33g/L urea) to 232±3 min (1.5g/L) for heating until equal temperatures, and from 175±12 (0.33g/L urea) to 202±8 min (0.67g/L).
For each urea concentration, except for 150mg/dL, contamination occurs earlier when the dialysate outlet is heated compared to the experiments without heating. In the experiments with heating as in vivo, intermediate results between the two temperature patterns were obtained.
Table VI-2: Time points at which urea appeared at the container exit (minutes after dialysis start)
g/L urea No heating Heating as in vivo Heating until outlet= inlet 0.33 185 ± 20 175 ± 12 122 ± 11 * & 0.67 219 ± 5 + 202 ± 8 * + 162 ± 11 * + & 1.0 224 ± 2 + ° - 204 ± 14 * + °° 1.5 227 ± 5 + ° - 232 ± 3 + °° #
*: P<0.01 vs no heating, &: P<0.01 vs heating as in vivo, +: P<0.01 vs 33mg/dL urea, °: P<0.05 vs 67mg/dL urea, °°: P<0.01 vs 67mg/dL urea, #: P<0.01 vs 100mg/dL urea
4.4. Discussion
In the present study, the impact of differences in dialysate density on the separation between spent and fresh dialysate was investigated during in vitro dialysis with the Genius system. We demonstrated that both urea concentration and temperature play a role in the partitioning between spent and fresh dialysate. The higher the urea concentration in the container used as patient substitute and the higher the temperature difference between warm fresh and cool spent

Analysis of dialysis using a single-pass batch system
265
dialysate, the later urea appeared at the container exit, which corresponds to the moment that adequate dialysis is no longer possible.
A difference in density is necessary to maintain the partitioning between spent and fresh dialysate and both temperature and solute concentration can contribute to this density. With the highest urea concentration, however, no reinforcing effect on partitioning was obtained by a temperature difference. In addition, with the highest temperature difference also no reinforcing effect was obtained by increasing the urea concentration from 1.0 to 1.5g/L. Hence the second contributing factor becomes relatively irrelevant if one factor is altered to a sufficient extent to have an overriding effect.
The more pronounced the exponential decrease of urea concentration at the container entrance, the better the substitute patient was cleared (higher K·t/V). This was especially found with 0.67g/L urea without heating (Fig. VI-13) and with 1.0 and 1.5g/L urea irrespective of heating schedule. It should be remarked however that in case of contamination, high urea concentrations are flowing back to the dialyzer, diminishing dialysis adequacy.
On one hand, a reduced solute content of spent dialysate may be encountered in the application of daily protracted dialysis in the intensive care patient, as well as in the detoxification of non-renal patients after poisoning with highly toxic low molecular weight substances. In order to obtain a larger density difference, trisodiumcitrate (258D) could be infused at the inlet blood line, as applied for loco-regional anticoagulation. As almost 70% of citrate is dialyzed [352], an increase in solute concentration of spent dialysate of 0.76g/L is expected for a citrate blood inlet concentration of 4.3mmol/L [353].
On the other hand, it can be expected that during the progression of a protracted dialysis, fresh dialysate can become as warm as, or even cooler than spent dialysate. To ensure higher fresh dialysate temperatures, spent dialysate should be additionally cooled by the use of longer dialysate outlet tubings or a heat exchanger. Another possible solution is to prepare the fresh dialysate at a higher start temperature, which can lead however to hemodynamic instability due to heat transfer to the patient.
In conclusion, it is demonstrated that with the Genius dialysis system both uremic solute concentration and temperature contribute to the separation between fresh and spent dialysate. The higher the urea concentration in the container used as patient substitute and the higher the temperature difference between the warm fresh and cool spent dialysate, the later urea appears at the container outlet.

Chapter VI
266
4.5. Conclusion
The present study was set out to evaluate the influence of solute concentration and temperature distribution on the occurrence of dialysate mixing inside the container of the Genius dialysis system. Therefore, in vitro tests were performed measuring urea concentrations and temperatures at the container entrance and exit. Fresh dialysate contamination was found enhanced by using a lower urea start concentration and for warmer spent dialysate temperatures. As a consequence, special precautions, e.g. cooling of spent dialysate, should be considered with protracted dialysis.
4.6. Acknowledgements
The authors are indebted to J Calus, S Claus, and J Van Dijck for their assistance.

Analysis of dialysis using a single-pass batch system
267
5. Numerical analysis of Genius dialysis
5.1. Background
While the former studies indicated the importance of temperature and solute concentration of the spent dialysate entering the Genius container, the present computational study was set out to visualize the variation of those parameters inside the container. A numerical evaluation was chosen, as this results in a better understanding of all impacting factors that influence the time point of mixing.
When focusing on the density stratification inside the container, different transport phenomena come into play influencing local temperatures and solute concentrations. Besides the direct influence by the concentration and temperature of the inflowing spent dialysate, other phenomena influence the temperature distribution. First, the fluid in the container near the outer wall is subject to cooling by the colder room temperature; and second, the temperature of the spent dialysate flowing down in the central tube has an impact on the temperature of the fluid surrounding the central tube.
Accounting for all those impacting factors, two different strategies as measured in vitro (paragraph 4) were simulated during a dialysis session of 300 minutes. The urea start concentration was defined corresponding to the tests with 1g/L urea (30g urea in a 30L dialysate tank). The case with spontaneous cooling as well as the case with heating of the spent dialysate until equal temperatures was considered.
5.2. Materials and Methods
5.2.1. Geometry and domain characterization
A two-dimensional axi-symmetrical numerical model was developed of the Genius dialysis container. The model has a cylindrical shape with height 340mm and internal diameter 400mm. On the top and bottom, the container geometry describes a half sphere with internal radius of 200mm. The wall thickness of the container is 40mm.
The central tube contains an ultraviolet tube of 10mm radius, surrounded axi-symmetrically by an inlet ring for spent dialysate of 7mm in width and a glass wall of 3mm thick. The inner and outer shell of the inlet tube ends 27mm and 20mm above the bottom of the container, respectively. The fresh dialysate outlet

Chapter VI
268
section at the container top and surrounding the central tube, consists of a ring of width 15mm.
5.2.2. Governing equations
5.2.2.1. Fluid dynamic equations The fluid flow is described by the unsteady incompressible continuity and momentum equations using a time step of 6s. Because the fluid properties (density ρ and viscosity µ) are temperature dependent, the energy equation was solved simultaneously.
5.2.2.2. Convection-diffusion equation The transport of urea in the container, driven by pressure and concentration differences, is described by the convection-diffusion equation (paragraph 3.3.1.2). The mass fraction of urea is defined as:
Du
uurea ρC
Cω
+= Eq. VI-27
with Cu the time-varying urea concentration (g/L) and ρD the dialysate density (g/L).
5.2.2.3. Fluid property equations The fluid properties (density and viscosity) are dependent on the temperature and the solute concentration.
The influence of dialysate viscosity on density was not taken into account, as the viscosity variation due to temperature differences is much greater than the variation due to density differences. The temperature T dependency (°C) of dialysate viscosity µ (Pa·s) is described by [62]:
( )T3 0.98101.465µ ⋅⋅= − Eq. VI-28
The temperature dependency of the dialysate density ρD (kg/m³) is described as a function of the density ρ0 (1007 kg/m³) at temperature T0 (30°C), and the volumetric thermal expansion coefficient of dialysate β (β·ρ0=0.3kg/m³/K):
( ))T(Tβ1ρρ 00D −⋅+⋅= Eq. VI-29
The density of the urea-dialysate mixture ρm (kg/m³) is calculated as a volumetric average with Vu and VD the volumes of urea and dialysate, respectively, and ρu the density of urea (1323kg/m³):

Analysis of dialysis using a single-pass batch system
269
( )uu
Duu
Du
DDuum Cρ
ρCρVV
ρVρVρ
++⋅
≅+
⋅+⋅= Eq. VI-30
5.2.2.4. Heat transfer equations The heat transfer inside the reservoir is governed by Fourier’s law of conduction and the mixing of warm and cold dialysate:
( )u
2
pDm JTk2
vρvtTcρ ⋅−∇⋅∇=
+⋅⋅∇+
∂∂
⋅⋅ uhh Eq. VI-31
with k the heat conduction coefficient for water (0.6W/m/K), cpD the heat capacity of the dialysis fluid (4178 J/kg/K at 37°C), h the (total) enthalpy, hu the relative enthalpy for urea, and Ju the diffusional urea flux.
At the outer wall of the container, heat loss is described in terms of natural (air) convection, described with Newton’s law of cooling:
( )roomTThQ −⋅= Eq. VI-32
with Q the heat flux through the wall (W/m²), Troom the ambient room temperature (25°C), and h the convective heat transport coefficient as assumed constant (5W/m²/K). The latter was calculated accounting for the container dimensions, the temperature difference between dialysate at the container entrance and exit, and the thermal transport velocity k (1/s) as derived from the in vitro experiments (paragraph 4.2).
At the glass interface of the central tube, heat transfer between the inflow tube and the container is described with Fourier’s law, as a function of the heat conduction coefficient k for glass (1.3W/m/K), the glass density ρG (2200kg/m³), and the heat capacity of glass cpG (840 J/kg/K).
( )TktTcρ pGG ∇⋅∇=
∂∂
⋅⋅ Eq. VI-33
5.2.3. Boundary conditions
The container wall is modeled as a wall where no-slip occurs, while the container axis is defined as symmetry axis. On top of the container, the exit is defined as a zero outlet pressure, while the entrance is defined as a mass flow rate of 5g/s of the spent dialysate. This corresponds to an overall dialysate flow of approximately 300mL/min as used for the in vitro experiments.

Chapter VI
270
The temperature measurements during the in vitro tests with spontaneous cooling showed an approximately constant temperature difference between the fresh and spent dialysate during the entire dialysis (Fig. VI-10). For the start concentration of 30g/30L, a mean temperature difference of 2.5°C was measured. As a consequence, the temperature of the spent dialysate as applied at the container entrance was calculated from the temperature of the fresh dialysate at the container exit, accounting for the 2.5°C difference. The fresh dialysate was characterized by a temperature of 36.2°C at the start of dialysis.
For simulation of the tests with heating until equal temperatures, the temperature of the spent dialysate was taken instantaneously equal to those of the fresh dialysate.
To calculate the urea concentration in the spent dialysate, the single pool model as described in paragraph 3.3.1.2 was used to simulate the substitute patient. Because the urea removal from the patient depends on the urea concentration in the dialysate at the dialyzer inlet (CDi), the differential equation was solved numerically (JSim, National Simulation Resource, Seattle, USA). From fitting the measured dialysate concentrations at the dialyzer outlet, a urea start concentration in the patient substitute of 33.91g/30L and 31.28g/30L was found for the tests with spontaneous cooling and heating, respectively. A diffusive dialysance D of 180mL/min and 214mL/min was obtained for the considered tests.
The dialyzer outlet concentration of the dialysate (CDo) is the concentration at the container entrance and can be calculated using the formula for dialysate-side dialysance D (Eq. I-10) with QDi the dialysate flow in the dialyzer:
( )Di
D
DiBiDo C
QCC
C +−⋅
=D Eq. VI-34
To obtain the concentrations and temperatures at the container exit, a velocity-weighted integration was performed for use in further calculations.
5.3. Results
For each time step, heat and mass distributions can be visualized in a cross-section of the container. Fig. VI-14 shows temperatures and concentrations in the container for the case of spontaneous cooling (left panel) and heating until equal temperatures (right panel) at 90 minutes after the start of dialysis.
In both cases, the isotherms illustrate the cooling of the dialysate near the container wall. With spontaneous cooling, the temperature of the dialysate

Analysis of dialysis using a single-pass batch system
271
surrounding the central tube is influenced by the inflowing spent dialysate. In the upper part of the container, the dialysate is cooled down due to the 2.5°C difference between fresh and spent dialysate. In the lowest part of the container, however, dialysate is heated as the inflowing spent dialysate temperature increases gradually when flowing downward through the central tube. For the tests with heating of spent dialysate, the inflowing dialysate is warmer than the surrounding dialysate over the entire height of the container, resulting in heat transfer towards the dialysate inside the container.
While the separation between fresh and spent dialysate is well maintained for the tests with spontaneous cooling (Fig. VI-14, left panel), the separation was more diluted and laying higher when heating spent dialysate (Fig. VI-14, right panel).
Fig. VI-14: Concentration C (g/L) and temperature T distribution (°C) at 90 minutes after the start of dialysis for a start concentration of 1.13g/L and 1.04g/L, respectively, in the case of
spontaneous cooling (left panel) and in the case of heating of the spent dialysate (right panel).
2 2
33.6
34.0
34.4
34.8
35.2
35.0
33.4
35.4
35.5
35.5
35.6
35.7
35.4
35.3
35.2
35.4
0.540.51
0.480.42
0.03
0.57
0.06 0.40
0.36
0.320.32
0.04
0.080.12
0.40
0.28
T (°C)C (g/L) T (°C)C (g/L)
2 2
33.6
34.0
34.4
34.8
35.2
35.0
33.4
35.4
35.5
35.5
35.6
35.7
35.4
35.3
35.2
35.4
0.540.51
0.480.42
0.03
0.57
0.06 0.40
0.36
0.320.32
0.04
0.080.12
0.40
0.28
T (°C)C (g/L) T (°C)C (g/L)
2 2
33.6
34.0
34.4
34.8
35.2
35.0
33.4
35.4
35.5
35.5
35.6
35.7
35.4
35.3
35.2
35.4
0.540.51
0.480.42
0.03
0.57
0.06 0.40
0.36
0.320.32
0.04
0.080.12
0.40
0.28
T (°C)C (g/L) T (°C)C (g/L)
2 2
33.6
34.0
34.4
34.8
35.2
35.0
33.4
35.4
35.5
35.5
35.6
35.7
35.4
35.3
35.2
35.4
0.540.51
0.480.42
0.03
0.57
0.06 0.40
0.36
0.320.32
0.04
0.080.12
0.40
0.28
T (°C)C (g/L) T (°C)C (g/L)

Chapter VI
272
5.4. Discussion
The differences between the results for spontaneous cooling and dialysate heating can be explained as follows: independent of temperature and concentration, it is expected that a stratification based on density is present inside the container with the highest density at the bottom layers.
From the start of dialysis, dialysate at the outer wall of the container is cooling, resulting in a sinking of the cooler dialysate by gravity. Hence a temperature gradient, similar to the density gradient, comes into being with at the bottom heavy cool and at the top the lighter warmer dialysate. The temperature of the dialysate near the central tube is also disturbed by heat transport to and from the inflowing warmer or colder dialysate. As a consequence, the temperature profile inside the container will not show smooth stratification in vertical direction. Because density increases for higher urea concentrations and lower temperatures, the isotherms as well determine the concentration profile inside the container.
In the case of spontaneous dialysate cooling, the highest temperatures, and with it, relative higher urea concentrations will be observed in between the central tube and the container wall (left panel in Fig. VI-14). The inflowing dialysate intends to migrate towards zones of equal density and will rise upward along the central tube until it reaches a fluid layer with similar density (see arrow in Fig. VI-14, left panel). As a consequence, the speed of the spent dialysate front (most pronounced halfway the glass tube and the container wall) is higher than theoretically expected. In addition, this phenomenon is more prominent for lower urea start concentrations.
In the experiments where spent dialysate is heated at the container entrance until equal temperatures as measured at the container exit, the spent dialysate reinfused at the bottom of the container might be warmer than the cool fresh dialysate already present at the bottom. Hence this drained warm spent dialysate will rise above the cooler and heavier fresh dialysate, unless solute content results in a higher density and counteracts this upward movement. Fig. VI-14 shows that the inflowing spent dialysate (with a concentration of 0.40g/L at 90 minutes) rises towards the virtual separation layer (see arrow in right panel). Furthermore, the maintenance of fresh dialysate sinking along the container wall results in a dilution of the urea concentrations in the lower regions. Due to this continuous dilution by fresh dialysate, the contaminated volume is larger than theoretically predicted. This clarifies why recirculation of spent dialysate occurs earlier when spent dialysate is heated at the container entrance compared with no heating unless high urea concentrations were applied (paragraph 4).

Analysis of dialysis using a single-pass batch system
273
For the test with spontaneous cooling, temperature variation over the container height is around 2.4°C, while a concentration difference of 0.57g/L is found in the spent dialysate. When spent dialysate is heated, a temperature and concentration difference of 0.7°C and 0.40g/L is observed. Because the variation of density due to temperature and concentration variations can be described as dρ/dT equal to 0.4g/L/°C and dρ/dC equal to 0.24, it is obvious that temperature is the major impacting factor determining the time point of dialysate mixing.
5.5. Conclusion
It was stated before (paragraph 3 and 4) that urea mixing is enhanced for a spent dialysate temperature approaching the temperature of the fresh dialysate, and for lower urea concentrations in the spent dialysate. The present numerical technique offers a better insight in the relative importance of the impacting factors determining dialysate mixing inside the Genius container.


Chapter VII Conclusion and future work

Chapter VII
276
1. Conclusion
While most studies for analyzing dialyzer performance are based on clinical data, a decoupling of dialyzer and patient was done in the scope of this dissertation. Therefore, separate analyses were performed to investigate either dialyzer or patient clearance using experimental techniques and developing theoretical and numerical models.
1.1. Summary of quantifying dialyzer performance
The efficiency of mass transport in a dialyzer is influenced by numerous parameters like membrane and fluid properties, dialyzer design and geometry, and flow distributions. Although solute removal is a phenomenon that takes place on microscale in a single fiber, information about flow distributions on macroscale was initially achieved by an experimental and numerical approach. A medical imaging technique (i.e. SPECT) was used to visualize dialyzer flow, and showed homogeneously distributed flow in the blood compartment while preferential flow paths with decreased fiber bundle resistance were observed in the dialysate flow. Those results were further applied for validating the numerical model of each compartment, which offers detailed information about local pressure and velocity.
An experimental technique for the analysis of particle transport in impermeable microcapillaries, based on the electronic detection of particles, was found unsatisfactory for analyzing blood flow in a dialyzer fiber. Hence, for the investigation of the flow on microscale, a numerical model of a single fiber with its surrounding dialysate domain was developed. After validation with ex vivo experiments, the model was found useful to give a detailed description of fluid property variations, and according pressure and flow profiles.
Furthermore, the micromodel was extended to study mass transport of small solutes (i.e. urea) and middle molecules with a sieving coefficient equal to unity in the dialyzer under study (i.e. vitamin B12 and inulin). After derivation of the diffusion coefficients in the three domains (blood, membrane and dialysate), a parameterstudy was performed varying radial and axial dimensions. Solute transfer was found more effective for larger fiber diameters and lengths. Besides the numerical approach, the influence on mass transfer of different impacting factors like flow direction, flow rate, and flow distribution, were investigated either theoretically or performing in vitro experiments. Although the latter
Conclusion and future work
277
approaches confirmed earlier clinical findings, they were especially useful to define the individual influence of each parameter. In conlusion, solute removal was found enhanced for lower blood and higher dialysate flows, and in dialyzers with an increased mass transfer area coefficient.
To draw the link between flow distributions and mass transfer, the results of the SPECT measurements were applied as flow input parameters, and overall dialyzer efficiency was calculated. Although large differences in dialysate velocities were observed with the experiments, the decrease in solute removal, compared to the case of homogeneously distributed flows, was found limited to 10%.
1.2. Summary of quantifying patient clearance
Up till now, around 90 uremic solutes have been identified and classified according their molecular weight and their potential for protein binding. Although the large variety in uremic retention products, urea is still used as the marker for dialyis adequacy. While extensive research has been done on the kinetics of urea, not much is known about the intra-dialytic kinetic behavior of the other solutes.
In the attempt to find a correlation between the kinetics of small and water-soluble compounds, significant differences were found and no specific correlations could be drawn. For the analysis, a two-pool kinetic model was used and kinetic parameters like distribution volumes and inter-compartmental clearance were derived fitting on the intra-dialytic measured concentrations. Some guanidino compounds (e.g. CTN, CT, GAA, G and MG) are distributed in a larger volume compared to urea, hampering adequate solute removal from the deeper tissues of the patient’s body. Guanidinosuccinic acid (GSA) however was found distributed in a significantly smaller volume, resulting in a better reduction ratio. As a result, urea kinetics may not be used as a standard example of the kinetic behavior of other small and water-soluble compounds.
The two-pool model was however found inappropriate to model the kinetics of some protein-bound solutes (e.g. p-cresol, CMPF), since concentrations were fluctuating or even increasing during dialysis. Furthermore, for those compounds that could be evaluated with the two-pool model, the degree of protein binding must be considered when interpreting the kinetic results.

Chapter VII
278
1.3. Summary of analyzing batch dialysis
As final application, the knowledge of different transport phenomena was merged for the investigation of dialysis adequacy using the Genius single-pass batch system. Since the system consists of a closed dialysate container in which the separation of fresh and spent dialysate is based on density differences, it was investigated whether fluid separation remains guaranteed under varying conditions. The impact of the two major parameters influencing fluid density, i.e. temperature and concentration, were studied with a theoretical, an experimental, and a computational approach.
It was concluded from all three studies that dialysate mixing inside the container is enhanced for lower concentrations in the spent dialysate, and with more equal temperatures of fresh and spent dialysate. Since those aspects become important with a protracted dialysis session, suggestions are formulated in order to maintain dialysis adequacy.
1.4. Final summary
In the present dissertation, different experimental techniques were applied and mathematical and numerical models were developed to study the dialyzer and patient clearance. The combination of the developed tools allows a detailed investigation of solute transport in order to define the adequacy of dialysis.

Conclusion and future work
279
2. Future work
Although the described models are helpful to study mass removal from the patient with a particular dialyzer, some shortcomings can be drawn. Consequently, in the following paragraphs, suggestions are formulated for further impovement of the models to quantify dialyzer and patient clearances.
2.1. Suggestions for optimizing the dialyzer model
The method as applied for the macroscopic study of dialyzer flow can be utilized to investigate and/or optimize different designs of manifold or fiber bundle.
The numerical micromodel, investigating mass transport between blood and dialysate, was up til now only applicable for the removal of solutes with a sieving coefficient equal to unity. As a consequence, the important contribution of convection of larger solutes should be implemented. Furthermore, solutes that are hampered in passing the membrane causes the occurrence of concentration polarization and influences overall mass removal. The description of those phenomena as well as their influence on flow and mass transport must be implemented accurately.
Going even one step further, it might be of interest for the device manufacturers to develop a model of the membrane itself. In such a model, the membrane is not longer defined as a porous medium with an overall permeability. The model should be rather on nanoscale visualizing the flow inside the membrane pores. Consequently, the solutes are then modeled as individual particles with various shapes and specific deformations. Such a model would allow detailed information on the formation and movement of the boundary and protein layer.
2.2. Suggestions for optimizing the patient model
It would be advantageous to have different kinetic models to our disposal for the investigation of the kinetic behavior of a particular solute. Up till now only a two-pool model was optimized and applied within the scope of this dissertation. It was however found for protein-bound solutes that a different approach is required. Clinical studies, determining for instance the free and bound concentration separately on different and even more time points during dialysis, might reveal the behavior of those solutes, such that appropriate new models can be developed for kinetic modeling of other uremic solutes.


REFERENCES
1. Gartner LP, Hiatt JL: Color textbook of Histology. Philadelphia, W.B. Saunders Company, 1997
2. Kjellstrand CM, Brendan PT: Acute renal failure, in Replacement of renal function by dialysis, edited by Jacobs C, Kjellstrand CM, Koch KM, Winchester JF, 4th ed, Dordrecht, Kluwer Academic Publisher, 1996, pp 821-862
3. Vanholder R, De Smet R, Vogeleere P, Hsu CH, Ringoir SM: The uraemic syndrome, in Replacement of renal function by dialysis, edited by Jacobs C, Kjellstrand CM, Koch KM, Winchester JF, 4th ed, Dordrecht, Kluwer Academic Publisher, 1996, pp 103-113
4. Lazarus JM, Lowrie EG, Hampers CL, Merrill JP: Cardiovascular disease in uremic patients on hemodialysis. Kidney Int Suppl:167-175, 1975
5. Mall G, Rambausek M, Neumeister A, Kollmar S, Vetterlein F, Ritz E: Myocardial interstitial fibrosis in experimental uremia-implications for cardiac compliance. Kidney Int 33:804-811, 1988
6. Parfrey PS, Harnett JD, Griffiths SM, Gault MH, Barre PE: Congestive heart failure in dialysis patients. Arch Intern Med 148:1519-1525, 1988
7. Fraser CL, Arieff AI: Nervous system complications in uremia. Ann Intern Med 109:143-153, 1988
8. Kimmel PL, Miller G, Mendelson WB: Sleep apnea syndrome in chronic renal disease. Am J Med 86:308-314, 1989
9. Pavlovic-Kentera V, Clemons GK, Djukanovic L, Biljanovic-Paunovic L: Erythropoietin and anemia in chronic renal failure. Exp Hematol 15:785-789, 1987
10. Bogin E, Massry SG, Levi J, Djaldeti M, Bristol G, Smith J: Effect of parathyroid hormone on osmotic fragility of human erythrocytes. J Clin Invest 69:1017-1025, 1982
11. Vanholder R, Ringoir S: Infectious morbidity and defects of phagocytic function in end-stage renal disease: a review. J Am Soc Nephrol 3:1541-1554, 1993
12. Lewis SL, Van Epps DE: Neutrophil and monocyte alterations in chronic dialysis patients. Am J Kidney Dis 9:381-395, 1987
13. Goldblum SE, Reed WP: Host defenses and immunologic alterations associated with chronic hemodialysis. Ann Intern Med 93:597-613, 1980
14. Guyton AC: Textbook of medical physiology, 7th ed. Philadelphia, WB Saunders Company, 1986
15. Carrel A: La technique opératoire des anastomoses vasculaires et la transplantation des viscères. Lyon Méd 98:859-864, 1902
16. Cunningham BA: The structure and function of histocompatibility antigens. Sci Am 237:96-107, 1977
17. Zmijewski CM: Human leukocyte antigen matching in renal transplantation: review and current status. J Surg Res 38:66-87, 1985
18. Kahan BD, van Buren CT, Flechner SM, Jarowenko M, Yasumura T, Rogers AJ, Yoshimura N, LeGrue S, Drath D, Kerman RH: Clinical and experimental studies with cyclosporine in renal transplantation. Surgery 97:125-140, 1985

References
282
19. Mion CM: Continuous peritoneal dialysis, in Replacement of renal function by dialysis, edited by Jacobs C, Kjellstrand CM, Koch KM, Winchester JF, 4th ed, Dordrecht, Kluwer Academic Publisher, 1996, pp 562-602
20. Feriani M, Ronco C, La Greca G: Solutions for peritoneal dialysis, in Replacement of renal function by dialysis, edited by Jacobs C, Kjellstrand CM, Koch KM, Winchester JF, 4th ed, Dordrecht, Kluwer Academic Publisher, 1996, pp 103-113
21. Tenckhoff H, Schechter H: A bacteriologically safe peritoneal access device. Trans Am Soc Artif Intern Organs 14:181-187, 1968
22. Khanna R, Izatt S, Burke D, Mathews R, Vas S, Oreopoulos DG: Experience with the Toronto Western Hospital permanent peritoneal catheter. Perit Dial Bullet 4:95, 1984
23. Kim D, Burke D, Izatt S, Mathews R, Wu G, Khanna R, Vas S, Oreopoulos DG: Single- or double-cuff peritoneal catheters? A prospective comparison. Trans Am Soc Artif Intern Organs 30:232-235, 1984
24. Ash SR: Chronic peritoneal dialysis catheters: overview of design, placement, and removal procedures. Semin Dial 16:323-334, 2003
25. Moncrief JW, Popovich RP, Broadrick LJ, He ZZ, Simmons EE, Tate RA: The Moncrief-Popovich catheter. A new peritoneal access technique for patients on peritoneal dialysis. Asaio J 39:62-65, 1993
26. Popovich RP, Moncrief JW, Nolph KD, Ghods AJ, Twardowski ZJ, Pyle WK: Continuous ambulatory peritoneal dialysis. Ann Intern Med 88:449-456, 1978
27. Nakagawa D, Price C, Stinebaugh B, Suki W: Continuous cycling peritoneal dialysis: a viable option in the treatment of chronic renal failure. Trans Am Soc Artif Intern Organs 27:55-57, 1981
28. Diaz-Buxo JA, Farmer CD, Walker PJ, Chandler JT, Holt KL: Continuous cyclic peritoneal dialysis: a preliminary report. Artif Organs 5:157-161, 1981
29. Doolan PD, Murphy WP, Jr., Wiggins RA, Carter NW, Cooper WC, Watten RH, Alpen EL: An evaluation of intermittent peritoneal lavage. Am J Med 26:831-844, 1959
30. Hoenich NA, Woffindin C, Ronco C: Haemodialysers and associated devices, in Replacement of renal function by dialysis, edited by Jacobs C, Kjellstrand CM, Koch KM, Winchester JF, 4th ed, Dordrecht, Kluwer Academic Publisher, 1996, pp 188-230
31. Van Waeleghem JP, Elseviers MM, Lindley EJ: Management of the vascular access in Europe. Part I - A study of centre based policies. EDTNA/ERCA J 26:28-33, 2000
32. Sigdell JE, Tersteegen B: Clearance of a dialyzer under varying operating conditions. Artif Organs 10:219-225, 1986
33. Quinton W, Dillard D, Scribner BH: Cannulation of blood vessels for prolonged hemodialysis. Trans Am Soc Artif Intern Organs 6:104-113, 1960
34. Brescia MJ, Cimino JE, Appel K, Hurwich BJ: Chronic hemodialysis using venipuncture and a surgically created arteriovenous fistula. N Engl J Med 275:1089-1092, 1966
35. Bay WH, Van Cleef S, Owens M: The hemodialysis access: preferences and concerns of patients, dialysis nurses and technicians, and physicians. Am J Nephrol 18:379-383, 1998
36. Valenta J, Bilek J, Opantmry K: Autogenous saphenous vein grafts as secondary vascular access for hemodialysis. Dial Transpl 14:567-571, 1985
37. Coburn MC, Carney WI, Jr.: Comparison of basilic vein and polytetrafluoroethylene for brachial arteriovenous fistula. J Vasc Surg 20:896-902, 1994

References
283
38. Hatjibaloglou A, Grekas D, Saratzis N, Megalopoulos A, Moros I, Kiskinis D, Dalainas V: Transposed basilic vein-brachial arteriovenous fistula: an alternative vascular access for hemodialysis. Artif Organs 16:623-625, 1992
39. Dardik HD, Ibrahim IM, Sprayregen S, Dardik, II: Clinical experience with modified human umbilical cord vein for arterial bypass. Surgery 79:618-624, 1976
40. Haimov M, Jacobson JH, 2nd: Experience with the modified bovine arterial heterograft in peripheral vascular reconstruction and vascular access for hemodialysis. Ann Surg 180:291-295, 1974
41. Flores L, Dunn I, Frumkin E, Forte R, Requena R, Ryan J, Knopf M, Kirschner J, Levowitz BS: Dacron arterio-venous shunts for vascular access in hemodialysis. Trans Am Soc Artif Intern Organs 19:33-37, 1973
42. Tordoir JH, Herman JM, Kwan TS, Diderich PM: Long-term follow-up of the polytetrafluoroethylene (PTFE) prosthesis as an arteriovenous fistula for haemodialysis. Eur J Vasc Surg 2:3-7, 1988
43. Shusterman NH, Kloss K, Mullen JL: Successful use of double-lumen, silicone rubber catheters for permanent hemodialysis access. Kidney Int 35:887-890, 1989
44. Moss AH, Vasilakis C, Holley JL, Foulks CJ, Pillai K, McDowell DE: Use of a silicone dual-lumen catheter with a Dacron cuff as a long-term vascular access for hemodialysis patients. Am J Kidney Dis 16:211-215, 1990
45. Uldall R, DeBruyne M, Besley M, McMillan J, Simons M, Francoeur R: A new vascular access catheter for hemodialysis. Am J Kidney Dis 21:270-277, 1993
46. Ringoir S, Vanholder R: An introduction to biocompatibility. Artif Organs 10:20-27, 1986
47. Vanholder R, Ringoir S: Bioincompatibility: an overview. Int J Artif Organs 12:356-365, 1989
48. Joist JH, Pennington DG: Platelet reactions with artificial surfaces. ASAIO Trans 33:341-344, 1987
49. Marshall JW, Ahearn DJ, Nothum RJ, Esterly J, Nolph KD, Maher JF: Adherence of blood components to dialyzer membranes: morphological studies. Nephron 12:157-170, 1974
50. Lyman DJ, Knutson K, McNeil B, Shibatani K: The effects of chemical structure and surface properties of synthetic polymers on the coagulation of blood. IV. The relation between polymer morphology and protein adsorption. Trans Am Soc Artif Intern Organs 21:49-54, 1975
51. Kaplow LS, Goffinet JA: Profound neutropenia during the early phase of hemodialysis. Jama 203:1135-1137, 1968
52. Craddock PR, Fehr J, Dalmasso AP, Brighan KL, Jacob HS: Hemodialysis leukopenia. Pulmonary vascular leukostasis resulting from complement activation by dialyzer cellophane membranes. J Clin Invest 59:879-888, 1977
53. Keane WF, Shapiro FL, Raij L: Incidence and type of infections occurring in 445 chronic hemodialysis patients. Trans Am Soc Artif Intern Organs 23:41-47, 1977
54. Belcon MC, Smith EK, Kahana LM, Shimizu AG: Tuberculosis in dialysis patients. Clin Nephrol 17:14-18, 1982
55. Bommer J, Ritz E: Spallation of dialysis materials-problems and perspectives. Nephron 39:285-289, 1985

References
284
56. Bosch T, Schmidt B, Samtleben W, Gurland HJ: Effect of protein adsorption on diffusive and convective transport through polysulfone membranes. Contrib Nephrol 46:14-22, 1985
57. Villarroel F, Ciarkowski AA: A survey on hypersensitivity reactions in hemodialysis. Artif Organs 9:231-238, 1985
58. Daugirdas JT, Ing TS: First-use reactions during hemodialysis: a definition of subtypes. Kidney Int 24:S37-43, 1988
59. Leonard EF, Van Vooren C, Hauglustaine D, Haumont S: Shear-induced formation of aggregates during hemodialysis. Contrib Nephrol 36:34-45, 1983
60. Quereda C, Orofino L, Marcen R, Sabater J, Matesanz R, Ortuno J: Influence of dialysate and membrane biocompatibility on hemodynamic stability in hemodialysis. Int J Artif Organs 11:259-264, 1988
61. Baurmeister U, Vienken J, Daum V: High-flux dialysis membranes:endotoxin transfer by backfiltration can be a problem. Nephrol Dial Transplant 4:89-93, 1989
62. Welty JR, Wicks CE, Wilson RE, Rorrer GL: Fundamentals of momentum, heat, and mass transfer. New York, John Wiley & Sons, 2001
63. Quemada D: General features of blood circulation in narrow vessels, in Arteries and arterial blood flow: biological and physiological aspects, edited by Rodkiewicz CM, Wien, Springer-Verlag, 1983
64. Cokelet GR: The rheology and tube flow of blood, in Handbook of bioengineering, edited by Shalak R, Chien S, London, Mc Green Hill, 1987
65. Gaehtgens P: Flow of blood through narrow capillaries: rheological mechanisms determining capillary hematocrit and apparent viscosity. Biorheology 17:183-189, 1980
66. Lerche D, Oelke R: Theoretical model of blood flow through hollow fibres considering hematocrit-dependent, non-Newtonian blood properties. Int J Artif Organs 13:742-746, 1990
67. Ronco C, Fabris A, Feriani M: Hemodialysis fluid composition, in Replacement of renal function by dialysis, edited by Jacobs C, Kjellstrand CM, Koch KM, Winchester JF, 4th ed, Dordrecht, Kluwer Academic Publisher, 1996, pp 256-276
68. Merrill JP, Schupak E, Cameron E, Hampers CL: Hemodialysis in the Home. Jama 190:468-470, 1964
69. Serfass EJ, Troutner VH: Portable dialysate supply system, in, US, Milton Roy Comp, 1970
70. Canaud BJ, Mion CM: Water treatment for contemporary haemodialysis, in Replacement of renal function by dialysis, edited by Jacobs C, Kjellstrand CM, Koch KM, Winchester JF, 4th ed, Dordrecht, Kluwer Academic Publisher, 1996, pp 231-255
71. Madsen RF, Nielsen B, Olsen OJ, Raaschou F: Reverse osmosis as a method of preparing dialysis water. Nephron 7:545-558, 1970
72. Petrie JJ, Fleming R, McKinnon P, Winney RJ, Cowie J: The use of ion exchange to remove aluminum from water used in hemodialysis. Am J Kidney Dis 4:69-74, 1984
73. Klinkmann H, Vienken J: Membranes for dialysis. Nephrol Dial Transplant 10:39-45, 1995
74. Colton CK, Lysaght MJ: Membranes for hemodialysis, in Replacement of renal function by dialysis, edited by Jacobs C, Kjellstrand CM, Koch KM, Winchester JF, 4th ed, Dordrecht, Kluwer Academic Publisher, 1996, pp 103-113

References
285
75. Floege J, Granolleras C, Deschodt G, Heck M, Baudin G, Branger B, Tournier O, Reinhard B, Eisenbach GM, Smeby LC, Koch KM, Shaldon S: High-flux synthetic versus cellulosic membranes for beta 2-microglobulin removal during hemodialysis, hemodiafiltration and hemofiltration. Nephrol Dial Transplant 4:653-657, 1989
76. Lonnemann G, Koch KM, Shaldon S, Dinarello CA: Studies on the ability of hemodialysis membranes to induce, bind, and clear human interleukin-1. J Lab Clin Med 112:76-86, 1988
77. Fujimori A, Naito H, Miyazaki T: Adsorption of complement, cytokines, and proteins by different dialysis membrane materials: evaluation by confocal laser scanning fluorescence microscopy. Artif Organs 22:1014-1017, 1998
78. Beek WJ, Muttzall KMK, van Heuvel JW: Transport phenomena, 2nd ed. Chichester, John Wiley & Sons, 1999
79. Byrne JH, Schultz SG: An introduction to membrane transport and bioelectricity: foundation of general physiology and electrochemical signalling, 2nd ed. New York, Raven Press, 1994
80. Geiger A: A method of ultrafiltration in vivo. J Physiol 71:111-120, 1931 81. Kramer P, Wigger W, Rieger J, Matthaei D, Scheler F: [Arteriovenous haemofiltration: a
new and simple method for treatment of over-hydrated patients resistant to diuretics]. Klin Wochenschr 55:1121-1122, 1977
82. Henderson LW, Besarab A, Michaels A, Bluemle LW: Blood purification by ultrafiltration and fluid replacement (diafiltration). Trans Am Soc Artif Intern Organs 16:216, 1967
83. Quellhorst E, Plashues E: Ultrafiltration: elimination harnpflichtiger substanzen mit hilfe neuartiger membranen, in Aktuelle probleme der dialyseverfahren und der niereninsuffizienz, edited by Ditrich P, Skrabel F, Friedberg, Bindernagel, 1971
84. Kessler M, Canaud B, Pedrini LA, Tattersall J, ter Wee PM, Vanholder R, Wanner C: European Best Practice Guidelines for Haemodialysis (part 1): Section II: Haemodialysis adequacy. Neprol Dial Transpl 17:16-31, 2002
85. Sargent JA, Gotch FA: Principles and biophysics of dialysis, in Replacement of renal function by dialysis, edited by Jacobs C, Kjellstrand CM, Koch KM, Winchester JF, 4th ed, Dordrecht, Kluwer Academic Publishers, 1996, pp 34-102
86. Wolf AV, Remp DG, Kiley JE, Currie GD: Artificial kidney function; kinetics of hemodialysis. J Clin Invest 30:1062-1070, 1951
87. Smith HW: The kidney: structure and function in health and disease. New York, Oxford University Press, 1951
88. Morcos AWB, Nissensen AR: Erythropoietin and high-efficiency dialysis, in Contemporary Issues in Nephrology vol 27 - Hemodialysis: high-efficiency treatments, edited by Bosch JP, New York, W.B. Saunders Company, 1993
89. National KF: K/DOQI Clinical Practice Guidelines for Hemodialysis Adequacy, 2000. Am J Kidney Dis 37:S7-S64, 2001
90. Bloembergen WE, Stannard DC, Port FK, Wolfe RA, Pugh JA, Jones CA, Greer JW, Golper TA, Held PJ: Relationship of dose of hemodialysis and cause-specific mortality. Kidney Int 50:557-565, 1996
91. Babb AL, Popovich RP, Christopher TG, Scribner BH: The genesis of the square meter-hour hypothesis. Trans Am Soc Artif Intern Organs 17:81-91, 1971

References
286
92. Ofsthun NJ, Leypoldt JK: Ultrafiltration and backfiltration during hemodialysis. Artif Organs 19:1143-1161, 1995
93. Ofsthun NJ, Zydney AL: Importance of convection in artificial kidney treatment, in Effective hemodiafiltration: new methods, edited by Maeda K, Shinzato T, Basel, Karger Publisher, 1994, pp 54-70
94. Kanamori T, Sakai K, Awaka T, Fukuda M: An improvement on the method of determining the solute permeability of hollow-fiber dialysis membranes photometrically using optical fibers and comparison of the method with ordinary techniques. J Membr Sc 88:159-165, 1994
95. Ronco C: Backfiltration: a controversial issue in modern dialysis. Int J Artif Organs 11:69-74, 1988
96. Schmidt M, Baldamus CA, Schoeppe W: Backfiltration in hemodialysers with high permeable membranes. Blood Purif 2:108-114, 1984
97. Hyver SW, Petersen J, Cajias J: An in vivo analysis of reverse ultrafiltration during high-flux and high-efficiency dialysis. Am J Kidney Dis 19:439-443, 1992
98. Leypoldt JK, Schmidt B, Gurland HJ: Measurement of backfiltration rates during hemodialysis with highly permeable membranes. Blood Purif 9:74-84, 1991
99. Leypoldt JK, Schmidt B, Gurland HJ: Net ultrafiltration may not eliminate backfiltration during hemodialysis with highly permeable membranes. Artif Organs 15:164-170, 1991
100. Ronco C: Backfiltration in clinical dialysis: nature of the phenomenon, mechanisms and possible solutions. Int J Artif Organs 13:11-21, 1990
101. Henderson LW: Biophysics of ultrafiltration and hemofiltration, in Replacement of renal function by dialysis, edited by Jacobs C, Kjellstrand CM, Koch KM, Winchester JF, 4th ed, Dordrecht, Kluwer Academic Publisher, 1996, pp 114-145
102. Ofsthun NJ, Colton CK, Lysaght MJ: Determination of fluid and solute removal rates during hemofiltration, in Hemofiltration, edited by Henderson LW, Quellhorst EA, Baldamus CA, Lysaght MJ, Berlin, Springer-Verlag, 1986, pp 17-39
103. Drukker W: Haemodialysis: a historical review, in Replacement of renal function by dialysis, edited by Maher JF, 3rd ed, Dordrecht, Kluwer Academic Publisher, 1989, pp 20-85
104. Necheles H: A method of vivi-dialysis. Chin J Physiol 1:69-80, 1927 105. Polaschegg HD, Levin NW: Hemodialysis machines and monitors, in Replacement of
renal function by dialysis, edited by Jacobs C, Kjellstrand CM, Koch KM, Winchester JF, 4th ed, Dordrecht, Kluwer Academic Publisher, 1996, pp 333-379
106. Sorensen J, Phelps M: Physics in nuclear medicine. Orlando, Grune and Stratton, 1987 107. Kak AC, Slaney M: Principles of computerized tomographic imaging. New York, IEEE
Press, 1988 108. Vander Velde C, Leonard EF: Theoretical assessment of the effect of flow
maldistributions on the mass transfer efficiency of artificial organs. Med Biol Eng Comput 23:224-229, 1985
109. Held PJ, Port FK, Wolfe RA, Stannard DC, Carroll CE, Daugirdas JT, Bloembergen WE, Greer JW, Hakim RM: The dose of hemodialysis and patient mortality. Kidney Int 50:550-556, 1996
110. Woods HF, Nandakumar M: Improved outcome for haemodialysis patients treated with high-flux membranes. Nephrol Dial Transplant 15:36-42, 2000

References
287
111. Nordon RE, Schindhelm K: Design of hollow fiber modules for uniform shear elution affinity cell separation. Artif Organs 21:107-115, 1997
112. Ronco C, Brendolan A, Crepaldi C, Rodighiero M, Scabardi M: Blood and dialysate flow distributions in hollow-fiber hemodialyzers analyzed by computerized helical scanning technique. J Am Soc Nephrol 13:S53-61, 2002
113. Ronco C, Ballestri M, Brendolan A: New developments in hemodialyzers. Blood Purif 18:267-275, 2000
114. Shinaberger JH, Miller JH, Gardner PW: Erythropoietin alert: risks of high hematocrit hemodialysis. ASAIO Trans 34:179-184, 1988
115. Babb AL, Popovich RP, Farrell PC, Blagg CR: The effects of erythrocyte mass transfer rates on solute clearance measurements during haemodialysis. Proc Eur Dial Transplant Assoc 9:303-321, 1972
116. Descombes E, Perriard F, Fellay G: Diffusion kinetics of urea, creatinine and uric acid in blood during hemodialysis. Clinical implications. Clin Nephrol 40:286-295, 1993
117. Osuga T, Obata T, Ikehira H, Tanada S, Sasaki Y, Naito H: Dialysate pressure isobars in a hollow-fiber dialyzer determined from magnetic resonance imaging and numerical simulation of dialysate flow. Artif Organs 22:907-909, 1998
118. Takesawa S, Terasawa M, Sakagami M, Kobayashi T, Hidai H, Sakai K: Nondestructive evaluation by x-ray computed tomography of dialysate flow patterns in capillary dialyzers. ASAIO Trans 34:794-799, 1988
119. Zhang J, Parker DL, Leypoldt JK: Flow distributions in hollow fiber hemodialyzers using magnetic resonance Fourier velocity imaging. Asaio J 41:M678-682, 1995
120. Ronco C, Scabardi M, Goldoni M, Brendolan A, Crepaldi C, La Greca G: Impact of spacing filaments external to hollow fibers on dialysate flow distribution and dialyzer performance. Int J Artif Organs 20:261-266, 1997
121. Ronco C, Brendolan A, Crepaldi C, Rodighiero M, Everard P, Ballestri M, Cappelli G, Spittle M, La Greca G: Dialysate flow distribution in hollow fiber hemodialyzers with different dialysate pathway configurations. Int J Artif Organs 23:601-609, 2000
122. Poh CK, Hardy PA, Liao Z, Huang Z, Clark WR, Gao D: Effect of spacer yarns on the dialysate flow distribution of hemodialyzers: a magnetic resonance imaging study. Asaio J 49:440-448, 2003
123. Uhlenbusch-Körwer I, Bonnie-Schorn E, Grassmann A, Vienken J: Good dialysis practice: part 5: Understanding membranes and dialysis. Lengerich, Pabst Science Publishers, 2004
124. Gastaldon F, Brendolan A, Crepaldi C, Frisone P, Zamboni S, d'Intini V, Poulin S, Hector R, Granziero A, Martins K, Gellert R, Inguaggiato P, Ronco C: Effects of novel manufacturing technology on blood and dialysate flow distribution in a new low flux "alpha Polysulfone" hemodialyzer. Int J Artif Organs 26:105-112, 2003
125. Tsunoda N, Kokubo K, Sakai K, Fukuda M, Miyazaki M, Hiyoshi T: Surface roughness of cellulose hollow fiber dialysis membranes and platelet adhesion. Asaio J 45:418-423, 1999
126. Ronco C, Crepaldi C, Brendolan A, Bragantini L, d'Intini V, Inguaggiato P, Bonello M, Krause B, Deppisch R, Goehl H, Scabardi A: Evolution of synthetic membranes for blood purification: the case of the Polyflux family. Nephrol Dial Transplant 18:10-20, 2003
127. Hoenich NA, Woffindin C, Cox PJ, Goldfinch M, Roberts SJ: Clinical characterization of Dicea a new cellulose membrane for haemodialysis. Clin Nephrol 48:253-259, 1997

References
288
128. Leypoldt JK, Cheung AK, Agodoa LY, Daugirdas JT, Greene T, Keshaviah PR: Hemodialyzer mass transfer-area coefficients for urea increase at high dialysate flow rates. The Hemodialysis (HEMO) Study. Kidney Int 51:2013-2017, 1997
129. Ronco C, Brendolan A, Lupi A, Metry G, Levin NW: Effects of a reduced inner diameter of hollow fibers in hemodialyzers. Kidney Int 58:809-817, 2000
130. Vienken J, Pohlmeier R: How to improve convective removal of LMW proteins during hemodialysis (Abstract). Artif Organs 23:658, 1999
131. Sato Y, Mineshima M, Ishimori I, Kaneko I, Akiba T, Teraoka S: Effect of hollow fiber length on solute removal and quantification of internal filtration rate by Doppler ultrasound. Int J Artif Organs 26:129-134, 2003
132. Zaltzman J: Optimum geometry for artificial kidney dialyzers. Chem Eng Prog Symp Ser 64:101-104, 1968
133. Poh CK, Hardy PA, Liao Z, Huang Z, Clark WR, Gao D: Effect of flow baffles on the dialysate flow distribution of hollow-fiber hemodialyzers: a nonintrusive experimental study using MRI. J Biomech Eng 125:481-489, 2003
134. Wang KL, Cussler EL: Baffled membrane modules made with hollow-fiber fabric. J Membr Sc 85:265-278, 1993
135. Ronco C, Bowry SK, Brendolan A, Crepaldi C, Soffiati G, Fortunato A, Bordoni V, Granziero A, Torsello G, La Greca G: Hemodialyzer: from macro-design to membrane nanostructure; the case of the FX-class of hemodialyzers. Kidney Int Suppl:126-142, 2002
136. Ouseph R, Ward RA: Increasing dialysate flow rate increases dialyzer urea mass transfer-area coefficients during clinical use. Am J Kidney Dis 37:316-320, 2001
137. Leypoldt JK, Cheung AK, Chirananthavat T, Gilson JF, Kamerath CD, Deeter RB: Hollow fiber shape alters solute clearances in high flux hemodialyzers. Asaio J 49:81-87, 2003
138. Verdonck P: Special Issue dedicated to the abstracts of the XXVIII ESAO Congress "Bridging the Interdisciplinarity". Int J Artif Organs 24, 2001
139. Verdonck P: The role of computational fluid dynamics for artificial organ design. Artif Organs 26:569-570, 2002
140. Mockros LF, Leonard R: Compact cross-flow tubular oxygenators. Trans Am Soc Artif Intern Organs 31:628-633, 1985
141. Eloot S, De Wachter D, Van Tricht I, Verdonck P: Computational flow modeling in hollow-fiber dialyzers. Artif Organs 26:590-599, 2002
142. Eloot S, De Wachter D, Vienken J, Pohlmeier R, Verdonck P: In vitro evaluation of the hydraulic permeability of polysulfone dialysers. Int J Artif Organs 25:210-216, 2002
143. Feng J, Hu HH, Joseph DD: Direct simulation of initial-value problems for the motion of solid bodies in a Newtonian fluid. part 2: Couette and Poiseuille flows. J Fluid Mech 277:271-301, 1994
144. Reinke W, Gaehtgens P, Johnson PC: Blood viscosity in small tubes: effect of shear rate, aggregation, and sedimentation. Am J Physiol 253:H540-547, 1987
145. Kiani MF, Hudetz AG: A semi-empirical model of apparent blood viscosity as a function of vessel diameter and discharge hematocrit. Biorheology 28:65-73, 1991
146. Pries AR, Neuhaus D, Gaehtgens P: Blood viscosity in tube flow: dependence on diameter and hematocrit. Am J Physiol 263:H1770-1778, 1992

References
289
147. Fahraeus R, Linqvist T: The viscosity of blood in narrow capillary tubes. Am J Physiol 96:562-568, 1931
148. Miyazaki K, Bedeaux D, Avalos JB: Drag on a sphere in slow shear-flow. J Fluid Mech 296:373-390, 1995
149. Kurose R, Komori S: Drag and lift forces on a rotating sphere in a linear shear flow. J Fluid Mech 384:183-206, 1999
150. Bretherton F: Slow viscous motion round a cylinder in a simple shear. J Fluid Mech 12:591-613, 1962
151. Segré G, Silberberg A: Behaviour of macroscopic rigid spheres in Poiseuille flow. Part 2: Experimental results and interpretation. J Fluid Mech 14:136-157, 1962
152. Rubinow SI, Keller JB: The transverse force on a spinning sphere moving in a viscous fluid. J Fluid Mech 11:447-459, 1961
153. Saffman P: The lift on a small sphere in a slow shear flow. J Fluid Mech 22:385-400, 1965
154. Cox RG, Brenner H: The lateral migration of solid particles in Poiseuille flow - I theory. Chem Eng Sci 23:147-163, 1968
155. Ho BP, Leal LG: Inertial migration of rigid spheres in 2-dimensional unidirectional flows. J Fluid Mech 65:365-400, 1974
156. Tachibana M: On the behavior of a sphere in the laminar tube flows. Rheol Acta 12:58, 1973
157. Vasseur P, Cox RG: Lateral migration of a spherical-particle in 2-dimensional shear flows. J Fluid Mech 78:385-413, 1976
158. Cox RJ, Hsu SK: The lateral migration of solid particles in a laminar flow near a plane. Int J Multiphase Flow 3:201-222, 1977
159. Karnis A, Goldsmith HL, Mason SG: The flow of suspensions through tubes. part 5: inertial effects. Can J Chem Eng 44:181-193, 1966
160. Repetti RV, Leonard EF: Segré-Silberberg annulus formation: a possible explanation. Nature 203:1346-1348, 1964
161. Repetti RV, Leonard EF: Physical basis for the axial accumulation of red blood cells. Chem Eng Prog Symp Ser 62:80, 1966
162. Jeffrey RC, Pearson JRA: Particle motion in laminar vertical tube flow. J Fluid Mech 22, 1965
163. Oliver D: Influence of particle rotation on radial migration in the Poiseuille flow of suspensions. Nature 194:1269-1271, 1962
164. Schonberg JA, Hinch EJ: Inertial migration of a sphere in Poiseuille flow. J Fluid Mech 203:517-524, 1989
165. Schonberg JA, Drew DA, Belfort G: Viscous interactions of many neutrally buoyant spheres in Poiseuille flow. J Fluid Mech 167:415-426, 1986
166. Mclaughlin JB: Inertial migration of a small sphere in linear shear flows. J Fluid Mech 224:261-274, 1991
167. Asmolov ES: The inertial lift on a spherical particle in a plane Poiseuille flow at large channel Reynolds number. J Fluid Mech 381:63-87, 1999
168. Hogg AJ: The inertial migration of non-neutrally buoyant spherical-particles in 2-dimensional shear flows. J Fluid Mech 272:285-318, 1994

References
290
169. Mclaughlin JB: The lift on a small sphere in wall-bounded linear shear flows. J Fluid Mech 246:249-265, 1993
170. Cherukat P, Mclaughlin JB, Graham AL: The inertial lift on a rigid sphere in a linear shear flow field. Int J Multiphase Flow 20:339-353, 1994
171. Cherukat P, Mclaughlin JB: The inertial lift on a rigid sphere in a linear shear-flow field near a flat wall. J Fluid Mech 263:1-18, 1994
172. Leighton D, Acrivos A: The lift on a small sphere touching a plane in the presence of a simple shear-flow. Z. Angew. Math. Phys. 36:174-178, 1985
173. Gondret P, Lance M, Petit L: Bouncing motion of spherical particles in fluids. Phys Fluids 14:643-652, 2002
174. De Bisschop F, Lambert H, De Mey G: Improved precision of electronic gating technique for particle counting and sizing in liquids. Med Biol Eng Comput 29:NS49, 1991
175. De Bisschop F, Vandewege J, Wei L, De Mets M: Low frequency electronic gate detection for the counting and sizing of cells, bactreria and colloidal particles in liquids. IEEE Trans Instrum Meas 52:891-895, 2003
176. Gregg EC, Steidley KD: Electrical counting and sizing of mammalian cells in suspension. Biophys J 5:393-405, 1995
177. Soh WY, Berger SA: Fully-developed flow in a curved pipe of arbitrary curvature ratio. Int J Numer Methods Fluids 7:733-755, 1987
178. Collins WM, Dennis SCR: The steady motion of a viscous fluid in a curved tube. Q J Mech Appl Math 28:133-156, 1975
179. Einstein A: Eine neue bestimmung der molekuldimensionen. Ann Phys 19:289-306, 1906 180. Batchelor GK, Green JT: The determination of the bulk stress in a suspension of spherical
particles to order c². J Fluid Mech 56:401-427, 1972 181. Batchelor GK: Sedimentation in a dilute dispersion of spheres. J Fluid Mech 52:245-268,
1972 182. Han M, Kim C, Kim M, Lee S: Particle migration in tube flow of suspensions. J Rheol
43:1157-1173, 1999 183. Asmolov ES: The inertial lift on a small particle in a weak-shear parabolic flow. Phys
Fluids 14:15-28, 2002 184. De Bisschop F, Eloot S, De Mets M, Verdonck P: Instrumental method for quantitative
evaluation of cell/particle adhesion based on transport measurements in capillary flow. Part II: Experimental feasibility study, in IEEE Instrum Meas (vol 2), Anchorage, 2002, pp 1243-1247
185. Leighton D, Acrivos A: The shear-induced migration of particles in concentrated suspensions. J Fluid Mech 181:415-439, 1987
186. Nott PR, Brady JF: Pressure-driven flow of suspensions - simulation and theory. J Fluid Mech 275:157-199, 1994
187. Leighton D, Acrivos A: Measurement of shear-induced self-diffusion in concentrated suspensions of spheres. J Fluid Mech 177:109-131, 1987
188. van Oss CJ: Interfacial forces in aqueous media. New York, Marcel Dekker, 1994 189. Fowkes FM: Predicting attractive forces at interfaces. Ind Eng Chem 56:40-52, 1964 190. Girifalco LA, Good RJ: A theory for the estimation of surface and interfacial energies. I.
Derivation and application to interfacial tension. J Phys Chem 61:904-909, 1957

References
291
191. Johnson KL, Kendall K, Roberts AD: Surface energy and the contact of elastic solids. Proc R Soc London Ser A 324:301, 1971
192. Eloot S, De Bisschop F, De Mets M, Lepercq R, De Wachter D, Verdonck P: Particle transport and adhesion in capillary flow. Int J Artif Organs 24:581, 2001
193. Kedem O, Katchalsky A: Thermodynamic analysis of the permeability of biological membranes to non-electrolytes. Biochim Biophys Acta 27:229-246, 1958
194. Kargol A: A mechanistic model of transport processes in porous membranes generated by osmotic and hydrostatic pressure. J Membr Sc 191:61-69, 2001
195. Wupper A, Dellanna F, Baldamus CA, Woermann D: Local transport processes in high-flux hollow fiber dialyzers. J Membr Sc 131:181-193, 1997
196. Karode SK: Laminar flow in channels with porous walls, revisited. J Membr Sc 191:237-241, 2001
197. Berman A: Laminar flow in channels with porous walls. J Appl Phys 24:1232-1235, 1953 198. Miranda JM, Campos JB: An improved numerical scheme to study mass transfer over a
separation membrane. J Membr Sc 188:49-59, 2001 199. Michaels AS: New separation tehcnique for the CPI. Chem Eng Prog 64:31-40, 1968 200. Zydney AL, Colton CK: A concentration polarization model for the filtrate flux in cross-
flow microfiltration of particulate suspensions. Chem Eng Prog 47:1-21, 1986 201. Eckstein EC, Bailey DG, Shapiro AH: Self-diffusion of particles in shear flow of a
suspension. J Fluid Mech 79:191-208, 1974 202. Romero CA, Davis RH: Global-model of cross-flow microfiltration based on
hydrodynamic particle diffusion. J Membr Sc 39:157-185, 1988 203. Lee Y, Clark MM: A numerical model of steady-state permeate flux during cross-flow
ultrafiltration. Desalination 109:241-251, 1997 204. Zydney AL: Stagnant film model for concentration polarization in membrane systems. J
Membr Sc 130:275-281, 1997 205. Bhattacharyya D, Back SL, Kermode RI: Prediction of concentration polarisation and
flux behaviour in reverse osmosis by numerical analysis. J Membr Sc 48:231-262, 1990 206. Rosen C, Tragardh C: Computer simulation of mass transfer in the concentration
boundary layer over ultrafiltration membranes. J Membr Sc 85:139-156, 1993 207. Vold MJ: Computer simulation of the floc formation in a colloidal suspension. J Colloid
Sci 18:684-695, 1963 208. Tassopoulos MJ, O'Brien JA, Rosner DE: Simulation of microstructure/mechanism
relationship in particle deposition. AIChE J 35:967-980, 1989 209. Kawakatsu T, Nakajima M, Nakao S, Kimura S: Three-dimensional simulation of random
packing and pore blocking phenomena during microfiltration. Desalination 101:203-209, 1995
210. Yoon SH, Lee CH, Kim KJ, Fane AG: Three-dimensional simulation of the deposition of multi-dispersed charged particles and prediction of resulting flux during cross-flow microfiltration. J Membr Sc 161:7-20, 1999
211. Zhang K, Acrivos A: Viscous resuspension in fully developed laminar pipe flows. Int J Multiphase Flow 20:579-591, 1994
212. Hofer M, Perktold K: Computer simulation of concentrated fluid-particle suspension flows in axisymmetric geometries. Biorheology 34:261-279, 1997

References
292
213. Phillips RJ, Armstrong RC, Brown RA: A constitutive equation for concentrated suspensions that accounts for shear-induced particle migration. Phys Fluids 4:30-40, 1992
214. Kessler M, Canaud B, Pedrini LA, Tattersall J, ter Wee PM, Vanholder R, Wanner C: European Best Practice Guidelines for Haemodialysis (Part 1): Section IV: Dialysis fluid purity. Nephrol Dial Transplant 17:45-62, 2002
215. Viet Bui A, Nguyen MH: Prediction of viscosity of glucose and calcium chloride solutions. J Food Eng 62:345-349, 2004
216. Stiller S, Mann H, Brunner H: Backfiltration in hemodialysis with highly permeable membranes. Contrib Nephrol 46:23-32, 1985
217. Robertson BC, Curtin C: Effects of EPO therapy on backfiltration of dialysate in high flux dialysis. Trans ASAIO 36:M447-452, 1990
218. Pallone TL, Hyver SW, J. P: A model of the volumetrically-controlled hemodialysis circuit. Kidney Int 41:1366-1373, 1992
219. Soltys PJ, Ofsthun NJ, Leypoldt JK: Critical analysis of formulas for estimating backfiltration in hemodialysis. Blood Purif 10:326-332, 1992
220. Vanholder R: Review paper. Biocompatibility issues in hemodialysis. Clin Mater 10:87-133, 1992
221. Ronco C, Fabris A, Feriani M, Brendolan A, Chiaramonte S, La Greca G: Hydraulic properties and flow-dynamic characteristics of the new low flux polysulfone F6 membrane. Contrib Nephrol 74:34-42, 1989
222. Legallais C, Catapano G, von Harten B, Baurmeister U: A theoretical model to predict the in vitro performance of hemodiafilters. J Membr Sc 168:3-15, 2000
223. Ross SM: Mathematical-model of mass-transport in a long permeable tube with radial convection. J Fluid Mech 63:157-175, 1974
224. Karode SK, Kumar A: Flow visualization through spacer filled channels by computational fluid dynamics I. Pressure drop and shear rate calculations for flat sheet geometry. J Membr Sc 193:69-84, 2001
225. Eloot S, Dierickx P, Bouwens L, Cuvelier B, Dierckx R, Verdonck P: Blood flow visualization in a hollow fiber dialyzer using CFD and SPECT, in Scientific Meeting SBN-BVN, Brussels, 2001, p 14
226. Jaffrin MY, Ding LH, Laurent JM: Simultaneous convective and diffusive mass transfers in a hemodialyser. J Biomech Eng 112:212-219, 1990
227. Pallone TL, Terson J: A mathematical model of continuous arteriovenous hemofiltration predicts performance. Trans Am Soc Artif Intern Organs 33:304-308, 1987
228. Landis EM, Pappenheimer JR: Handbook of Physiology, Circulation. Washington, American Physiological Society, 1963
229. Vanholder R, De Smet R, Glorieux G, Argiles A, Baurmeister U, Brunet P, Clark W, Cohen G, De Deyn PP, Deppisch R, Descamps-Latscha B, Henle T, Jorres A, Lemke HD, Massy ZA, Passlick-Deetjen J, Rodriguez M, Stegmayr B, Stenvinkel P, Tetta C, Wanner C, Zidek W: Review on uremic toxins: classification, concentration, and interindividual variability. Kidney Int 63:1934-1943, 2003
230. Koda Y, Nishi S, Miyazaki S, Haginoshita S, Sakurabayashi T, Suzuki M, Sakai S, Yuasa Y, Hirasawa Y, Nishi T: Switch from conventional to high-flux membrane reduces the risk of carpal tunnel syndrome and mortality of hemodialysis patients. Kidney Int 52:1096-1101, 1997

References
293
231. Sargent JA: Shortfalls in the delivery of dialysis. Am J Kidney Dis 15:500-510, 1990 232. DOQI: National Kidney Dialysis Outcome Quality Initiative (DOQI): Clinical practice
guidelines: hemodialysis adequacy and peritoneal dialysis adequacy. Am J Kidney Dis 30:S1-S64, 1997
233. Clark WR, Hamburger RH, Lysaght MJ: Effect of membrane composition and structure on solute removal and biocompatibility in hemodialysis. Kidney Int 56:2005-2015, 1999
234. Jindal KK, McDougall J, Woods B, Nowakowski L, Goldstein MB: A study of the basic principles determining the performance of several high-flux dialyzers. Am J Kidney Dis 14:507-511, 1989
235. Ronco C, Heifetz A, Fox K, Curtin C, Brendolan A, Gastaldon F, Crepaldi C, Fortunato A, Pietribasi G, Caberlotto A, Brunello A, Milan Manani S, Zanella M, La Greca G: Beta 2-microglobulin removal by synthetic dialysis membranes. Mechanisms and kinetics of the molecule. Int J Artif Organs 20:136-143, 1997
236. Colton CK, Henderson LW, Ford CA, Lysaght MJ: Kinetics of hemodiafiltration. I. In vitro transport characteristics of a hollow-fiber blood ultrafilter. J Lab Clin Med 85:355-371, 1975
237. Henderson LW, Colton CK, Ford CA: Kinetics of hemodiafiltration. II. Clinical characterization of a new blood cleansing modality. J Lab Clin Med 85:372-391, 1975
238. Fresenius: Product brochure: Hemoflow F-series Fresenius Polysulfone Capillary Dialysers.
239. Eloot S, De Vos JY, Hombrouckx R, Verdonck P: Diffusive clearance of small and middle-sized molecules in combined dialyzer flow configurations. Int J Artif Organs 27:205-213, 2004
240. DIN: German standards for haemodialysis (part 3) DIN 58352, in, 1988 241. Eloot S, De Vos JY, De Vos F, Hombrouckx R, Verdonck P: Middle molecule removal in
low flux polysulphone dialyzers: impact of flows and surface area on whole-body and dialyzer clearances. submitted, 2004
242. Gotch FA, Sargent JA: A mechanistic analysis of the National Cooperative Dialysis Study (NCDS). Kidney Int 28:526-534, 1985
243. Scribner BH: A personalized history of chronic hemodialysis. Am J Kidney Dis 16:511-519, 1990
244. Powers KM, Wilkowski MJ, Helmandollar AW, Koenig KG, Bolton WK: Improved urea reduction ratio and Kt/V in large hemodialysis patients using two dialyzers in parallel. Am J Kidney Dis 35:266-274, 2000
245. Ronco C, Feriani M, Brendolan A, Chiaramonte S, Milan M, Dell'Aquila R, Scabardi M, Bragantini L, Conz P, La Greca G: Paired filtration dialysis: studies on efficiency, flow dynamics and hydraulic properties of the system. Blood Purif 8:126-140, 1990
246. Jaffrin MY: Convective mass transfer in hemodialysis. Artif Organs 19:1162-1171, 1995 247. von Albertini B, Miller JH, Gardner PW, Shinaberger JH: High-flux hemodiafiltration:
under six hours/week treatment. Trans Am Soc Artif Intern Organs 30:227-231, 1984 248. Velasquez MT, von Albertini B, Lew SQ, Mishkin GJ, Bosch JP: Equal levels of blood
pressure control in ESRD patients receiving high-efficiency hemodialysis and conventional hemodialysis. Am J Kidney Dis 31:618-623, 1998
249. Leypoldt JK: Solute fluxes in different treatment modalities. Nephrol Dial Transplant 15 Suppl 1:3-9, 2000

References
294
250. Granger A, Vantard G, Vantelon J, Perrone B: A mathematical approach of simultaneous dialysis and filtration (SDF). Proc Eur Soc Artif Organs 5:174-177, 1978
251. Lindsay RM, Sternby J: Future directions in dialysis quantification. Semin Dial 14:300-307, 2001
252. Kerr PG, Lo A, Chin M, Atkins RC: Dialyzer performance in the clinic: comparison of six low-flux membranes. Artif Organs 23:817-821, 1999
253. Allen R, Frost TH, Hoenich NA: The influence of the dialysate flow rate on hollow fiber hemodialyzer performance. Artif Organs 19:1176-1180, 1995
254. Henderson LW, Clark WR, Cheung AK: Quantification of middle molecular weight solute removal in dialysis. Semin Dial 14:294-299, 2001
255. Davenport A, Will EJ, Davison AM: Effect of the direction of dialysate flow on the efficiency of continuous arteriovenous haemodialysis. Blood Purif 8:329-336, 1990
256. Fritz BA, Doss S, McCann LM, Wrone EM: A comparison of dual dialyzers in parallel and series to improve urea clearance in large hemodialysis patients. Am J Kidney Dis 41:1008-1015, 2003
257. Yeh HM, Wu HH: Membrane ultrafiltration in combined hollow-fiber module systems. J Membr Sc 124:93-105, 1997
258. Eknoyan G, Beck GJ, Cheung AK, Daugirdas JT, Greene T, Kusek JW, Allon M, Bailey J, Delmez JA, Depner TA, Dwyer JT, Levey AS, Levin NW, Milford E, Ornt DB, Rocco MV, Schulman G, Schwab SJ, Teehan BP, Toto R: Effect of dialysis dose and membrane flux in maintenance hemodialysis. N Engl J Med 347:2010-2019, 2002
259. Leypoldt JK, Cheung AK, Carroll CE, Stannard DC, Pereira BJ, Agodoa LY, Port FK: Effect of dialysis membranes and middle molecule removal on chronic hemodialysis patient survival. Am J Kidney Dis 33:349-355, 1999
260. Cheung AK: Quantitation of dialysis. The importance of membrane and middle molecules. Blood Purif 12:42-53, 1994
261. Mandolfo S, Malberti F, Imbasciati E, Cogliati P, Gauly A: Impact of blood and dialysate flow and surface on performance of new polysulfone hemodialysis dialyzers. Int J Artif Organs 26:113-120, 2003
262. Green DM, Antwiler GD, Moncrief JW, Decherd JF, Popovich RP: Measurement of the transmittance coefficient spectrum of Cuprophan and RP69 membranes: applications to middle molecule removal via ultrafiltration. Trans Am Soc Artif Intern Organs 22:627-636, 1976
263. Werynski A: Evaluation of the impact of ultrafiltration on dialyzer clearance. Artif Organs 3:140-142, 1979
264. Werynski A, Waniewski J: Theoretical description of mass transport in medical membrane devices. Artif Organs 19:420-427, 1995
265. Daugirdas JT, Depner TA: A nomogram approach to hemodialysis urea modeling. Am J Kidney Dis 23:33-40, 1994
266. Clark WR, Rocco MV, Collins AJ: Quantification of hemodialysis: analysis of methods and the relevance to patient outcome. Blood Purif 15:92-111, 1997
267. Clark WR, Leypoldt JK, Henderson LW, Mueller BA, Scott MK, Vonesh EF: Quantifying the effect of changes in the hemodialysis prescription on effective solute removal with a mathematical model. J Am Soc Nephrol 10:601-609, 1999

References
295
268. Maasrani M, Jaffrin MY, Fischbach M, Boudailliez B: Urea, creatinine and phosphate kinetic modeling during dialysis: application to pediatric hemodialysis. Int J Artif Organs 18:122-129, 1995
269. Schneditz D, Daugirdas JT: Compartment effects in hemodialysis. Semin Dial 14:271-277, 2001
270. Hauk M, Kuhlmann MK, Riegel W, Kohler H: In vivo effects of dialysate flow rate on Kt/V in maintenance hemodialysis patients. Am J Kidney Dis 35:105-111, 2000
271. Clark WR, Shinaberger JH: Effect of dialysate-side mass transfer resistance on small solute removal in hemodialysis. Blood Purif 18:260-263, 2000
272. Hoenich NA, Frost TH: Influence of design and operating variables on conventional haemodialysis, in Renal dialysis, edited by Whelpton D, London, Sector Publishing, 1974, pp 85-104
273. Ronco C, Ghezzi PM, Brendolan A, Crepaldi C, La Greca G: The haemodialysis system: basic mechanisms of water and solute transport in extracorporeal renal replacement therapies. Nephrol Dial Transplant 13 Suppl 6:3-9, 1998
274. Dellanna F, Wupper A, Baldamus CA: Internal filtration-advantage in haemodialysis? Nephrol Dial Transplant 11 Suppl 2:83-86, 1996
275. Leypoldt JK, Cheung AK: Characterization of molecular transport in artificial kidneys. Artif Organs 20:381-389, 1996
276. Scott JM: Bioavailability of vitamin B12. Eur J Clin Nutr 51 Suppl 1:S49-53, 1997 277. Vanholder R, Glorieux G, De Smet R, Lameire N: New insights in uremic toxins. Kidney
Int Suppl:S6-10, 2003 278. Villarroel F, Klein E, Holland F: Solute flux in hemodialysis and hemofiltration
membranes. Trans Am Soc Artif Intern Organs 23:225-233, 1977 279. Abbas M, Tyagi VP: On the mass transfer in a circular conduit dialyzer when
ultrafiltration is coupled with dialysis. Int J Heat Mass Transfer 31:591-602, 1988 280. Jaffrin MY, Gupta BB, Malbrancq JM: A one-dimensional model of simultaneous
hemodialysis and ultrafiltration with highly permeable membranes. J Biomech Eng 103:261-266, 1981
281. Sigdell JE: Calculation of combined diffusive and convective mass transfer. Int J Artif Organs 5:361-372, 1982
282. Colton C, Smith K, Merrill E, Friedman S: Diffusion of urea in flowing blood. AIChE Journal 17:800-808, 1971
283. Ronco C: Hemofiltration and hemodiafiltration, in Contemp Issues in Nephrol (vol 27), edited by JP B, New York, Churchill-Livingstone, 1993, pp 119-133
284. Raff M, Welsch M, Gohl H, Hildwein H, Storr M, Wittner B: Advanced modeling of highflux hemodialysis. J Membr Sc 216:1-11, 2003
285. Eloot S, D'Asseler Y, De Bondt P, Verdonck P: Combining SPECT medical imaging and computational fluid dynamics for analyzing blood and dialysate flow in hemodialyzers. submitted, 2004
286. Vanholder RC, De Smet RV, Ringoir SM: Assessment of urea and other uremic markers for quantification of dialysis efficacy. Clin Chem 38:1429-1436, 1992
287. Gutzwiller JP, Schneditz D, Huber AR, Schindler C, Garbani E, Zehnder CE: Increasing blood flow increases kt/V(urea) and potassium removal but fails to improve phosphate removal. Clin Nephrol 59:130-136, 2003

References
296
288. Fagugli RM, De Smet R, Buoncristiani U, Lameire N, Vanholder R: Behavior of non-protein-bound and protein-bound uremic solutes during daily hemodialysis. Am J Kidney Dis 40:339-347, 2002
289. Schuck O, Kaslikov J: Kinetics of phosphorus during hemodialysis and the calculation of its effective dialysis clearance. Clin Nephrol 47:379-383, 1997
290. Spalding EM, Chamney PW, Farrington K: Phosphate kinetics during hemodialysis: Evidence for biphasic regulation. Kidney Int 61:655-667, 2002
291. Johnson WJ, Hagge WW, Wagoner RD, Dinapoli RP, Rosevear JW: Effects of urea loading in patients with far-advanced renal failure. Mayo Clin Proc 47:21-29, 1972
292. Vanholder R, De Smet R: Pathophysiologic effects of uremic retention solutes. J Am Soc Nephrol 10:1815-1823, 1999
293. Glorieux G, Hsu CH, de Smet R, Dhondt A, van Kaer J, Vogeleere P, Lameire N, Vanholder R: Inhibition of calcitriol-induced monocyte CD14 expression by uremic toxins: role of purines. J Am Soc Nephrol 9:1826-1831, 1998
294. Hsu CH, Patel SR, Young EW, Vanholder R: Effects of purine derivatives on calcitriol metabolism in rats. Am J Physiol 260:F596-601, 1991
295. Block GA, Hulbert-Shearon TE, Levin NW, Port FK: Association of serum phosphorus and calcium x phosphate product with mortality risk in chronic hemodialysis patients: a national study. Am J Kidney Dis 31:607-617, 1998
296. De Deyn PP, Macdonald RL: Guanidino compounds that are increased in cerebrospinal fluid and brain of uremic patients inhibit GABA and glycine responses on mouse neurons in cell culture. Ann Neurol 28:627-633, 1990
297. De Deyn PP, D'Hooge R, Van Bogaert PP, Marescau B: Endogenous guanidino compounds as uremic neurotoxins. Kidney Int Suppl 78:S77-83, 2001
298. Hirayama A, Noronha-Dutra AA, Gordge MP, Neild GH, Hothersall JS: Inhibition of neutrophil superoxide production by uremic concentrations of guanidino compounds. J Am Soc Nephrol 11:684-689, 2000
299. Kielstein JT, Bode-Boger SM, Frolich JC, Haller H, Boger RH: Relationship of asymmetric dimethylarginine to dialysis treatment and atherosclerotic disease. Kidney Int 78:S9-13, 2001
300. Fliser D, Kielstein JT, Haller H, Bode-Boger SM: Asymmetric dimethylarginine: a cardiovascular risk factor in renal disease? Kidney Int 84:S37-40, 2003
301. Boure T, Vanholder R: Biochemical and clinical evidence for uremic toxicity. Artif Organs 28:248-253, 2004
302. Bernheim J, Rashid G, Gavrieli R, Korzets Z, Wolach B: In vitro effect of advanced glycation end-products on human polymorphonuclear superoxide production. Eur J Clin Invest 31:1064-1069, 2001
303. Daugirdas JT: Second generation logarithmic estimates of single-pool variable volume Kt/V: an analysis of error. J Am Soc Nephrol 4:1205-1213, 1993
304. Daugirdas JT, Smye SW: Effect of a two compartment distribution on apparent urea distribution volume. Kidney Int 51:1270-1273, 1997
305. Stiller S, Xu XQ, Gruner N, Vienken J, Mann H: Validation of a two-pool model for the kinetics of beta2-microglobulin. Int J Artif Organs 25:411-420, 2002
306. Paniagua R, Amato D, Vonesh E, Correa-Rotter R, Ramos A, Moran J, Mujais S: Effects of increased peritoneal clearances on mortality rates in peritoneal dialysis: ADEMEX, a prospective, randomized, controlled trial. J Am Soc Nephrol 13:1307-1320, 2002

References
297
307. De Deyn P, Marescau B, Lornoy W, Becaus I, Lowenthal A: Guanidino compounds in uraemic dialysed patients. Clin Chim Acta 157:143-150, 1986
308. De Deyn P, Marescau B, Lornoy W, Becaus I, Van Leuven I, Van Gorp L, Lowenthal A: Serum guanidino compound levels and the influence of a single hemodialysis in uremic patients undergoing maintenance hemodialysis. Nephron 45:291-295, 1987
309. Marescau B, Nagels G, Possemiers I, De Broe ME, Becaus I, Billiouw JM, Lornoy W, De Deyn PP: Guanidino compounds in serum and urine of nondialyzed patients with chronic renal insufficiency. Metabolism 46:1024-1031, 1997
310. D'Hooge R, Pei YQ, Marescau B, De Deyn PP: Convulsive action and toxicity of uremic guanidino compounds: behavioral assessment and relation to brain concentration in adult mice. J Neurol Sci 112:96-105, 1992
311. MacAllister RJ, Whitley GS, Vallance P: Effects of guanidino and uremic compounds on nitric oxide pathways. Kidney Int 45:737-742, 1994
312. Glorieux G, Dhondt A, Jacobs P, Van Langeraert J, Lameire N, De Deyn PP, Vanholder R: In vitro study of the potential role of guanidines in leukocyte functions related to atherogenesis and infection. Kidney Int 65:1-9, 2004
313. Horowitz HI, Cohen BD, Martinez P, Papayoanou MF: Defective ADP-induced platelet factor 3 activation in uremia. Blood 30:331-340, 1967
314. Giovannetti S, Cioni L, Balestri PL, Biagnini M: Evidence that guanidines and some related compounds cause haemolysis in chronic uraemia. Clin Sci 34:141-148, 1968
315. Ceriotti G: Ultramicrodetermination of plasma urea by reaction with diacetylmonoxime--antipyrine without deproteinization. Clin Chem 17:400-402, 1971
316. Marescau B, Qureshi IA, De Deyn PP, Letarte J, Ryba R, Lowenthal A: Guanidino compounds in plasma, urine and cerebrospinal fluid of hyperargininemic patients during therapy. Clin Chim Acta 146:21-27, 1985
317. Hairer E, Lubich C, Wanner G: Structure-preserving algorithms for ordinary differential equations, 2004
318. D'Hooge R, De Deyn PP, Van de Vijver G, Antoons G, Raes A, Van Bogaert PP: Uraemic guanidino compounds inhibit gamma-aminobutyric acid-evoked whole cell currents in mouse spinal cord neurones. Neurosci Lett 265:83-86, 1999
319. De Deyn PP, Vanholder R, D'Hooge R: Nitric oxide in uremia: effects of several potentially toxic guanidino compounds. Kidney Int Suppl:S25-28, 2003
320. Giovannetti S, Biagini M, Balestri PL, Navalesi R, Giagnoni P, De Matteis A, Ferro-Milone P, Perfetti C: Uraemia-like syndrome in dogs chronically intoxicated with methylguanidine and creatinine. Clin Sci 36:445-452, 1969
321. Matsumoto M, Mori A: Convulsive activity of methylguanidine in cat and rabbits. IRCS Med Sci 4:65, 1976
322. De Deyn PP, Robitaille P, Vanasse M, Qureshi IA, Marescau B: Serum guanidino compound levels in uremic pediatric patients treated with hemodialysis or continuous cycle peritoneal dialysis. Correlations between nerve conduction velocities and altered guanidino compound concentrations. Nephron 69:411-417, 1995
323. Leypoldt JK, Cheung AK, Deeter RB: Rebound kinetics of beta2-microglobulin after hemodialysis. Kidney Int 56:1571-1577, 1999
324. Langsdorf LJ, Zydney AL: Effect of uremia on the membrane transport characteristics of red blood cells. Blood 81:820-827, 1993

References
298
325. Sargent JA, Gotch FA: Mathematical modeling of dialysis therapy. Kidney Int 18:S2-10, 1980
326. Gotch FA: Evolution of the single-pool urea kinetic model. Semin Dial 14:252-256, 2001 327. Koike J, Ujiie K, Owada A, Shiigai T, Matsui N, Nonoguchi H, Tomita K, Marumo F:
Quasi-steadiness approximation for the two-compartment solute kinetic model. Kidney Int 52:821-831, 1997
328. Ziolko M, Pietrzyk JA, Grabska-Chrzastowska J: Accuracy of hemodialysis modeling. Kidney Int 57:1152-1163, 2000
329. Maduell F, Garcia-Valdecasas J, Garcia H, Hdez-Jaras J, Siguenza F, del Pozo C, Giner R, Moll R, Garrigos E: Urea reduction ratio considering urea rebound. Nephron 78:143-147, 1998
330. Shinzato T, Nakai S, Akiba T, Yamazaki C, Sasaki R, Kitaoka T, Kubo K, Shinoda T, Kurokawa K, Marumo F, Sato T, Maeda K: Survival in long-term haemodialysis patients: results from the annual survey of the Japanese Society for Dialysis Therapy. Nephrol Dial Transplant 12:884-888, 1997
331. Vanholder R, De Smet R, Lameire N: Protein-bound uremic solutes: the forgotten toxins. Kidney Int 59:S266-270, 2001
332. Vanholder R, De Smet R, Lameire NH: Redesigning the map of uremic toxins. Contrib Nephrol:42-70, 2001
333. Vanholder R, Hoefliger N, De Smet R, Ringoir S: Extraction of protein bound ligands from azotemic sera: comparison of 12 deproteinization methods. Kidney Int 41:1707-1712, 1992
334. Lesaffer G, De Smet R, Lameire N, Dhondt A, Duym P, Vanholder R: Intradialytic removal of protein-bound uraemic toxins: role of solute characteristics and of dialyser membrane. Nephrol Dial Transplant 15:50-57, 2000
335. Bammens B, Evenepoel P, Verbeke K, Vanrenterghem Y: Removal of middle molecules and protein-bound solutes by peritoneal dialysis and relation with uremic symptoms. Kidney Int 64:2238-2243, 2003
336. De Smet R, Van Kaer J, Van Vlem B, De Cubber A, Brunet P, Lameire N, Vanholder R: Toxicity of free p-cresol: a prospective and cross-sectional analysis. Clin Chem 49:470-478, 2003
337. McTigue JJ, Henderson SJ, Lindup WE: Excretion of the uraemic metabolite 3-carboxy-4-methyl-5-propyl-2-furanpropanoic acid in human urine. Nephron 55:214-215, 1990
338. Eloot S, Torremans A, De Smet R, Marescau B, De Wachter D, De Deyn PP, Lameire N, Verdonck P, Vanholder R: Kinetic behavior of urea is different from that of other water-soluble compounds: the case of the guanidino compounds. submitted, 2004
339. Hida M, Aiba Y, Sawamura S, Suzuki N, Satoh T, Koga Y: Inhibition of the accumulation of uremic toxins in the blood and their precursors in the faeces after oral administration of Lebenin, a lactic acid bacteria preparation, to uremic patients undergoing hemodialysis. Nephron 74:349-355, 1996
340. Vanholder R, De Smet R, Waterloos MA, Van Landschoot N, Vogeleere P, Hoste E, Ringoir S: Mechanisms of uremic inhibition of phagocyte reactive species production: characterization of the role of p-cresol. Kidney Int 47:510-517, 1995
341. Dou L, Cerini C, Brunet P, Guilianelli C, Moal V, Grau G, De Smet R, Vanholder R, Sampol J, Berland Y: P-cresol, a uremic toxin, decreases endothelial cell response to inflammatory cytokines. Kidney Int 62:1999-2009, 2002

References
299
342. Niwa T, Takeda N, Maeda K, Shibata M, Tatematsu A: Accumulation of furancarboxylic acids in uremic serum as inhibitors of drug binding. Clin Chim Acta 173:127-138, 1988
343. Zimmerman L, Jornvall H, Bergstrom J: Phenylacetylglutamine and hippuric acid in uremic and healthy subjects. Nephron 55:265-271, 1990
344. Tersteegen B, Van Endert G: Patent DE198 31 15 665 A1. Bundesrepublik Deutschland, 1982
345. Schneditz D: Temperature and thermal balance in hemodialysis. Semin Dial 14:357-364, 2001
346. Smye SW, Hydon PE, Will E: An analysis of the single-pool urea kinetic model and estimation of errors. Phys Med Biol 38:115-122, 1993
347. Steffenson K: Some determinations of the total body water in man by means of intravenous injections of urea. Acta Physiol Scand 13:282, 1947
348. Maduell F, Siguenza F, Caridad A, Miralles F, Serrato F: Analysis of urea distribution volume in hemodialysis. Nephron 66:312-316, 1994
349. Dhondt AW, Vanholder RC, De Smet RV, Claus SA, Waterloos MA, Glorieux GL, Delanghe JR, Lameire NH: Studies on dialysate mixing in the Genius single-pass batch system for hemodialysis therapy. Kidney Int 63:1540-1547, 2003
350. Lonnemann G, Floege J, Kliem V, Brunkhorst R, Koch KM: Extended daily veno-venous high-flux haemodialysis in patients with acute renal failure and multiple organ dysfunction syndrome using a single path batch dialysis system. Nephrol Dial Transplant 15:1189-1193, 2000
351. Kielstein JT, Kretschmer U, Ernst T, Hafer C, Bahr MJ, Haller H, Fliser D: Efficacy and cardiovascular tolerability of extended dialysis in critically ill patients: a randomized controlled study. Am J Kidney Dis 43:342-349, 2004
352. Evenepoel P, Maes B, Vanwalleghem J, Kuypers D, Messiaen T, Vanrenterghem Y: Regional citrate anticoagulation for hemodialysis using a conventional calcium-containing dialysate. Am J Kidney Dis 39:315-323, 2002
353. Dhondt A, Vanholder R, Waterloos MA, Glorieux G, De Smet R, Lameire N: Citrate anticoagulation does not correct cuprophane bioincompatibility as evaluated by the expression of leukocyte surface molecules. Nephrol Dial Transplant 13:1752-1758, 1998