491.full.pdf - Journal of Clinical Pathology
88
Chemical pathology in relation to clinical medicine RENAL FUNCTION The proceedings of a symposium organized by the Association of Clinical Pathologists held in London at the Westminster Hospital 16-17 October 1964 Contents Correlation of renal function and structure E. M. Detection of renal insufficiency in children J. A. BLACK. . DARMADY ............................. page 493 ......................................... page 546 Electron microscopy of the kidney D. B. BREWER ...... Urinary cell counts and their value w. BRUMF .T.I .........................................page 500 .........................................page 550 Estimation of the glomerular filtration rate J. D. Diagnostic criteria of pyelonephritis P. j. L..LE. BLAINEY ................................... page 511 page 556 Tubular reabsorption and secretion M. D. MILNE...... .........................................page 515 Significance of quantitative and qualitative analysis of the proteinuria in the nephrotic syndrome J. HARD- Urinary hydrogen ion excretion OLIVER WRONG .. WICKE ..... page 559 ......................................... page 520 Functional renal disorders in primary vascular disease Control of sodium metabolism IVOR H. MILLS.- .page 527 .... s. PEART ..... page 564 Cellular mode of action of antidiuretic hormone JACK ORLOFF and JOSEPH s. HANDLER ...............page 533 FInvestgation of nephrocalcinosis and nephrolithiasis PAUL FOURMAN.page 568 Value and limitations of renal function tests D. A. K. BLACK .. page 543 Renal function after burning SIMON SEVITI.... page 572 9 on February 12, 2022 by guest. Protected by copyright. http://jcp.bmj.com/ J Clin Pathol: first published as 10.1136/jcp.18.4.491 on 1 July 1965. Downloaded from
-
Upload
khangminh22 -
Category
Documents
-
view
1 -
download
0
Transcript of 491.full.pdf - Journal of Clinical Pathology

Chemical pathologyin relation to clinical medicine
RENAL FUNCTIONThe proceedings of a symposium
organized by the
Association of Clinical Pathologists
held in London at the
Westminster Hospital
16-17 October 1964
Contents
Correlation of renal function and structure E. M. Detection of renal insufficiency in children J. A. BLACK. .DARMADY............................. page 493 .........................................page 546
Electron microscopy of the kidney D. B. BREWER...... Urinary cell counts and their value w. BRUMF .T.I.........................................page 500 .........................................page 550
Estimation of the glomerular filtration rate J. D. Diagnostic criteria of pyelonephritis P. j.L..LE.BLAINEY...................................page 511 page 556
Tubular reabsorption and secretion M. D. MILNE...............................................page 515 Significance of quantitative and qualitative analysis of
the proteinuria in the nephrotic syndrome J. HARD-Urinary hydrogen ion excretion OLIVER WRONG.. WICKE..... page 559.........................................page 520
Functional renal disorders in primary vascular diseaseControl of sodium metabolism IVOR H. MILLS.- .page 527 ....s. PEART..... page 564Cellular mode of action of antidiuretic hormone JACKORLOFF and JOSEPH s. HANDLER...............page 533 FInvestgationof nephrocalcinosis and nephrolithiasis
PAUL FOURMAN.page 568Value and limitations of renal function tests D. A. K.BLACK.. page 543 Renal function after burning SIMON SEVITI.... page 572
9
on February 12, 2022 by guest. P
rotected by copyright.http://jcp.bm
j.com/
J Clin P
athol: first published as 10.1136/jcp.18.4.491 on 1 July 1965. Dow
nloaded from
J. clin. Path. (1965), 18, 492
PrefaceG. K. McGOWAN
From the United Bristol Hospitals
This is the third symposium of a series 'Chemical pathology in relation to clinical medicine' organ-ized by the Association of Clinical Pathologists with the object of bringing together those who carryout research and devise new laboratory tests, those who carry out the laboratory tests, and thosewho apply them to the diagnosis and treatment of disease.The function of the kidney is probably better known than that of any other organ. Nevertheless
there has been comparatively little advance in the routine methods of testing renal function over thelast 40 years. This is partly because some of the tests which have become available, such as the inulinand p-aminohippurate clearances, are too elaborate for routine clinical use. It is also due in part toa tendency for clinicians to cling to old-established tests, even to the urine dilution test, althoughthis is now known to be of little value as a routine test of renal function. This symposium signpostssome new advances, and indicates that the use of a wider range of tests may bring an increasedprecision to the diagnosis of kidney diseases.The symposium is intended to cover four aspects of the study of kidney function. It includes
reviews of existing routine tests in adults and children, and of some less routine procedures fordefining tubular function. There are also papers on the investigation of particular diseases of thekidney such as infection, calcification and calculi, and the renal complications of primary vasculardisease and of burns. Thirdly there are descriptions of some of the newer techniques such as theuse of the electron microscope and the assessment of renal permeability by determining the sizedistribution of urinary proteins. Fourthly, some recent advances in renal research are presented,including studies of the mode of action of the antidiuretic hormone and of the way in which thekidney controls sodium metabolism and hence the extracellular volume.As Chairman of the A.C.P. Committee on Chemical Pathology, which is responsible for organ-
izing these symposia, I am glad to have the opportunity of thanking, on behalf of the Association,all the speakers taking part, and in particular E. M. Darmady who not only :contributes a paperon the important results which have been obtained from micro-dissection of the kidney, but wasalso responsible for gathering together this distinguished team of speakers. Finally I would like toacknowledge the generosity of the Editor of the American Journal of Medicine in allowing us toprint the paper given by Jack Orloff and Joseph S. Handler, even though it has already been pub-lished in that journal.
Acknowledgments are made to the authors, editors, and publishers for permission to reproduce certain of the illustra-tions appearing in this symposium from the following publications: In International Symposium on the Biology ofPyelonephritis (edited by E. L. Quiin and E. H. Kass) Little, Brown & Co., Boston, Mass. (Darmady, Fig. 6); ClinicalScience, 19, 299, Cambridge University Press, London (Darmady, Fig. 12); Renal Biopsy, Edward Arnold & Co. Ltd.,London (Brewer, Fig. 7); Recent Advances in Renal Disease, Pitman Medical Publishing Co. Ltd., London (Wrong,Figs. 1, 2, and 8); Quarterly Journal ofMedicine, 28, 259, 1959, Oxford University Press, London (Wrong, Figs. 3, 4,6, and 8); Minerva Nefrologica, 6, suppl., 1959 (Giovannetti and Pasero), Ed. Minerva Medica, Turin (Wrong, Fig. 7);Renal Disease, Blackwell Scientific Publications Ltd., Oxford (Wrong, Fig. 9); The Lancet, 1, 1264, 1962, London(Mills, Fig. 1); Clinical Science, 21, 249 and 259, 1961 (de Wardener et al.), Cambridge University Press, London(Mills, Figs. 2, 3, 4, 5, 6, and 7); Clinical Science, 28, 69, 1965 (Barraclough and Mills), Cambridge University Press,London (Mills, Fig. 10); Journal of Clinical Investigation, 43, 177, 1954 (Gill et al.), American Society for ClinicalInvestigation, New Haven, Conn. (Mills, Fig. 9); in Renal Biopsy (Ciba Foundation), 1961 (Hardwicke and Soothill),Messrs. J. & A. Churchill Ltd., London (Hardwicke, Fig. 3); Clinical chimica acta, 12, 89, 1965, Elsevier PublishingCo., Amsterdam (Hardwicke, Fig. 4).
492
on February 12, 2022 by guest. P
rotected by copyright.http://jcp.bm
j.com/
J Clin P
athol: first published as 10.1136/jcp.18.4.491 on 1 July 1965. Dow
nloaded from
J. clin. Path. (1965), 18, 493
Correlation of renal function and structure1E. M. DARMADY
The kidney is a unique organ because it is composedof a number of distinct components (the nephrons),each portion having a specific function to perform.Furthermore each nephron is of a different length.It therefore follows that if part of the nephron isdamaged then the whole balance of the urinarycomposition is disturbed.The variation in size arises as the result of the
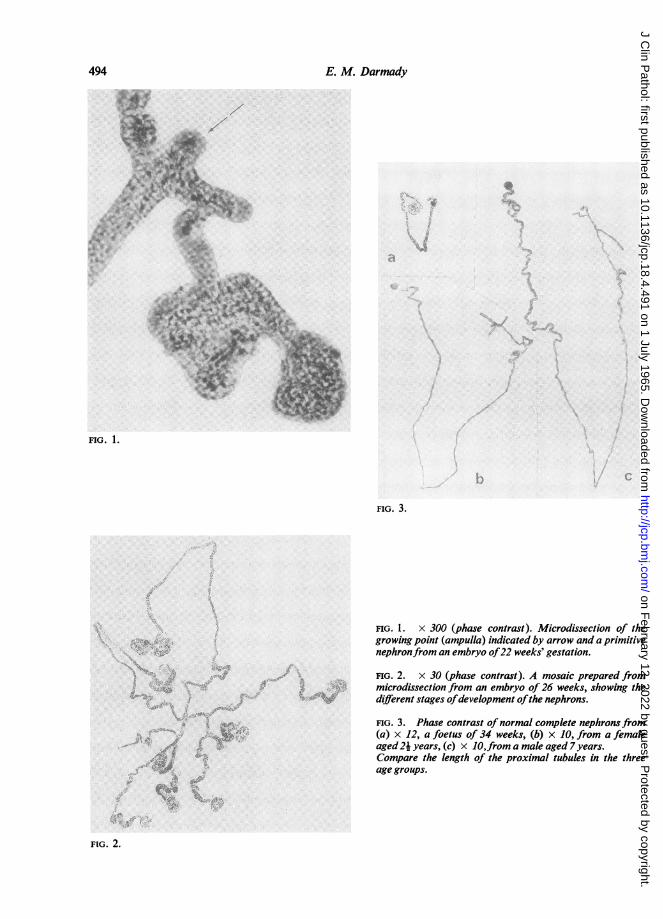
development of the kidney. This can be demonstratedby microdissection (Oliver, 1960; Osathanondh andPotter, 1963). Their investigations show that theureteral bud, in spite of previous claims, developsinto an irregular number of branches and first formsthe pelvis and minor calyces. Branching of the tubulecontinues until a total of six to nine generations ofcollecting tubules are formed distal to the minorcalyces. Branching ceases between 20 and 36 weeks.In the meantime the nephrons continue to grow(Fig. 1), and differentiate into their precise segments.At the same time many of the nephrons will be atdifferent stages of development (Fig. 2). Usuallyabout 15 main branches are formed. On the fourthor fifth branches arcades are formed which mayhave three to four nephrons on each. Normally nomore nephrons are developed after 35 weeks,although they do in fact elongate or atrophy. Nor-mally it is the proximal convoluted tubule whichenlarges to the greatest extent with age (Fig. 3a, b, c).
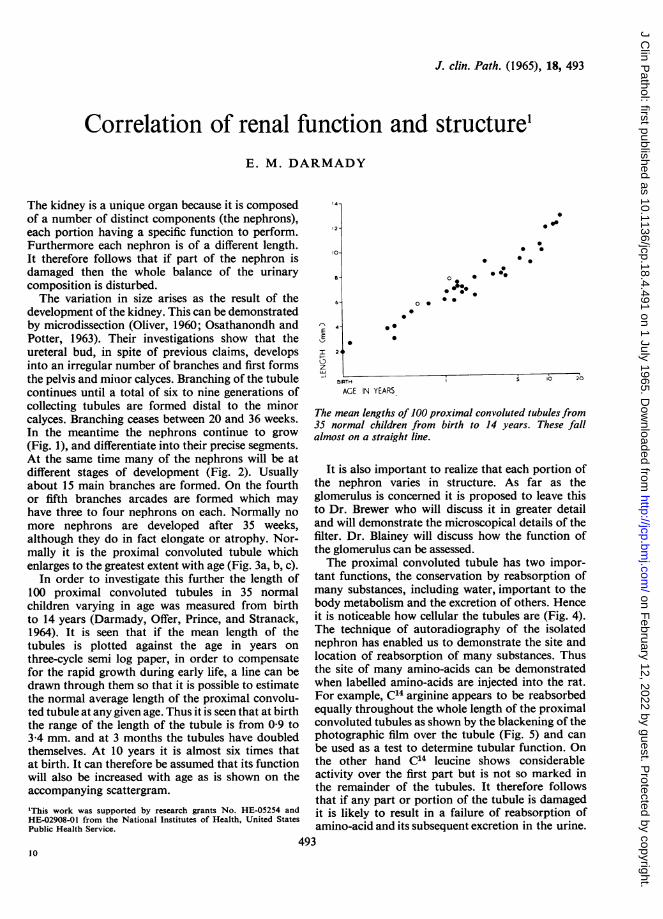
In order to investigate this further the length of100 proximal convoluted tubules in 35 normalchildren varying in age was measured from birthto 14 years (Darmady, Offer, Prince, and Stranack,1964). It is seen that if the mean length of thetubules is plotted against the age in years onthree-cycle semi log paper, in order to compensatefor the rapid growth during early life, a line can bedrawn through them so that it is possible to estimatethe normal average length of the proximal convolu-ted tubule at any given age. Thus it is seen that at birththe range of the length of the tubule is from 0-9 to3-4 mm. and at 3 months the tubules have doubledthemselves. At 10 years it is almost six times thatat birth. It can therefore be assumed that its functionwill also be increased with age as is shown on theaccompanying scattergram.
'This work was supported by research grants No. HE-05254 andHE-02908-01 from the National Institutes of Health, United StatesPublic Health Service.
12-
10-
EE
I
z
0
S..0
00
o * *
0.
6- O * *
4- TH 0 2
AGE IN YEARS_
The mean lengths of 100 proximal convoluted tubules from35 normal children from birth to 14 years. These fallalmost on a straight line.
It is also important to realize that each portion ofthe nephron varies in structure. As far as theglomerulus is concerned it is proposed to leave thisto Dr. Brewer who will discuss it in greater detailand will demonstrate the microscopical details of thefilter. Dr. Blainey will discuss how the function ofthe glomerulus can be assessed.The proximal convoluted tubule has two impor-
tant functions, the conservation by reabsorption ofmany substances, including water, important to thebody metabolism and the excretion of others. Henceit is noticeable how cellular the tubules are (Fig. 4).The technique of autoradiography of the isolatednephron has enabled us to demonstrate the site andlocation of reabsorption of many substances. Thusthe site of many amino-acids can be demonstratedwhen labelled amino-acids are injected into the rat.For example, C14 arginine appears to be reabsorbedequally throughout the whole length of the proximalconvoluted tubules as shown by the blackening of thephotographic film over the tubule (Fig. 5) and canbe used as a test to determine tubular function. Onthe other hand C14 leucine shows considerableactivity over the first part but is not so marked inthe remainder of the tubules. It therefore followsthat if any part or portion of the tubule is damagedit is likely to result in a failure of reabsorption ofamino-acid and its subsequent excretion in the urine.
493
14
on February 12, 2022 by guest. P
rotected by copyright.http://jcp.bm
j.com/
J Clin P
athol: first published as 10.1136/jcp.18.4.491 on 1 July 1965. Dow
nloaded from
49 El. M.Drmd
.~~~~~R JN~~~~~~~~~~~~~
FIG. .
FIG. 3.
FIG. 1. x 300 (phase contrast). Microdissection of thegrowing point (ampulla) indicated by arrow and a primitivenephronfrom an embryo of22 weeks' gestation.
FIG. 2. x 30 (phase contrast). A mosaic prepared frommicrodissection from an embryo of 26 weeks, showing thedifferent stages ofdevelopment ofthe nephrons.
* ~~~~~~~~~FIG.3. Phase contrast of normal complete nephrons from(a) x 12, a foetus of 34 weeks, (b) x JO, from a femaleaged24 years, (c) x J0,from a male aged 7 years.Compare the length of the proximal tubules in the three
.~~~~~~A~~~~~age groups.
FIG. 2.
494 E. M. Darmady
on February 12, 2022 by guest. P
rotected by copyright.http://jcp.bm
j.com/
J Clin P
athol: first published as 10.1136/jcp.18.4.491 on 1 July 1965. Dow
nloaded from

Correlation of renal function and structure
FIG. 4. x 600 (phase contrast). The cellularity of the FIG. 6. x 15. Mosaic of an autoradiograph of the proxi-proximal convoluted tubule. The white round clear space mal convoluted tubule of a rat injected half an hour beforeindicates the number ofnuclei that are present. death with 50pte. P31 insulin.
m;0 af4t
~~~~ ~ ~ ~ ~ ~ ~ ~ ~ ~ e + ^ it-A SF,N I.
.ft,N,t
,s;.-'
FIG. 5. x 15. Mosaic of an autoradiograph of the proximal convoluted tubule of a normal rat injected 30 minutesbefore death with 20,ic. C14 arginine.
495
on February 12, 2022 by guest. P
rotected by copyright.http://jcp.bm
j.com/
J Clin P
athol: first published as 10.1136/jcp.18.4.491 on 1 July 1965. Dow
nloaded from
|l~ ~ ~ ~ "e
.L.16-
4 4t S
4,*
+s'~~ ~ ~ ~ ~ ~ ~ ~ ~ 9
FIG. 9.
FIG. 7.
.. *. ,
_u..w.::
*C...._x
k.,,0
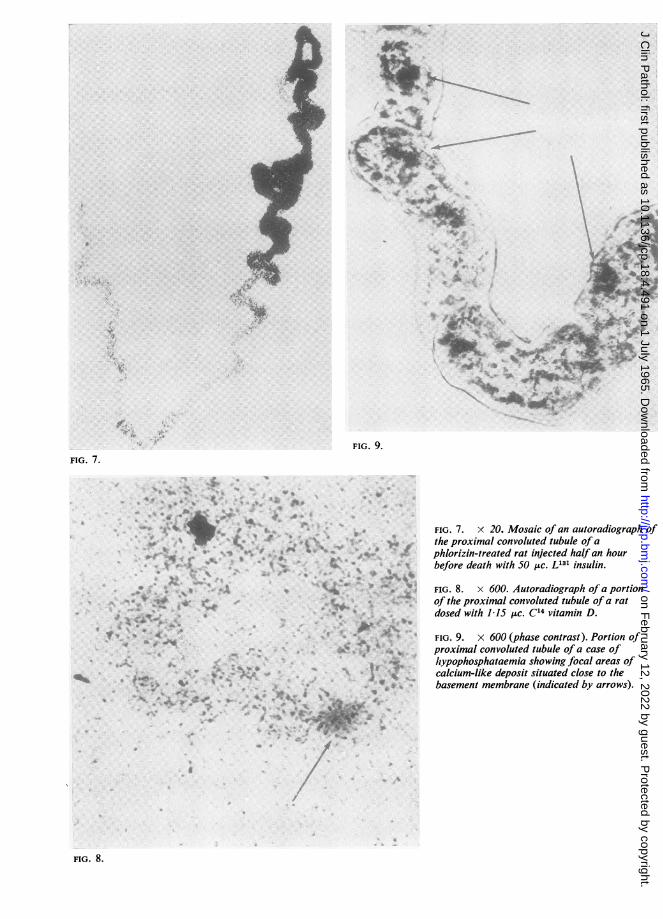
FIG. 7. x 20. Mosaic of an autoradiograph ofthe proximal convoluted tubule of aphlorizin-treated rat injected half an hourbefore death with 50 lic. L131 insulin.
4r
.9
t 9''.9
'4-4 4
.4, t
.4 A
to.::.:; 3 *.
Vxf.
FIG. 8. x 600. Autoradiograph of a portionof the proximal convoluted tubule of a ratdosed with 115 jLc. C14 vitamin D.
FIG. 9. x 600 (phase contrast). Portion ofproximal convoluted tubule of a case oflhypophosphataemia showing focal areas ofcalcium-like deposit situated close to thebasement membrane (indicated by arrows).
FIG. 8.
.0 S:'.ik
.-P
*t'
on February 12, 2022 by guest. P
rotected by copyright.http://jcp.bm
j.com/
J Clin P
athol: first published as 10.1136/jcp.18.4.491 on 1 July 1965. Dow
nloaded from
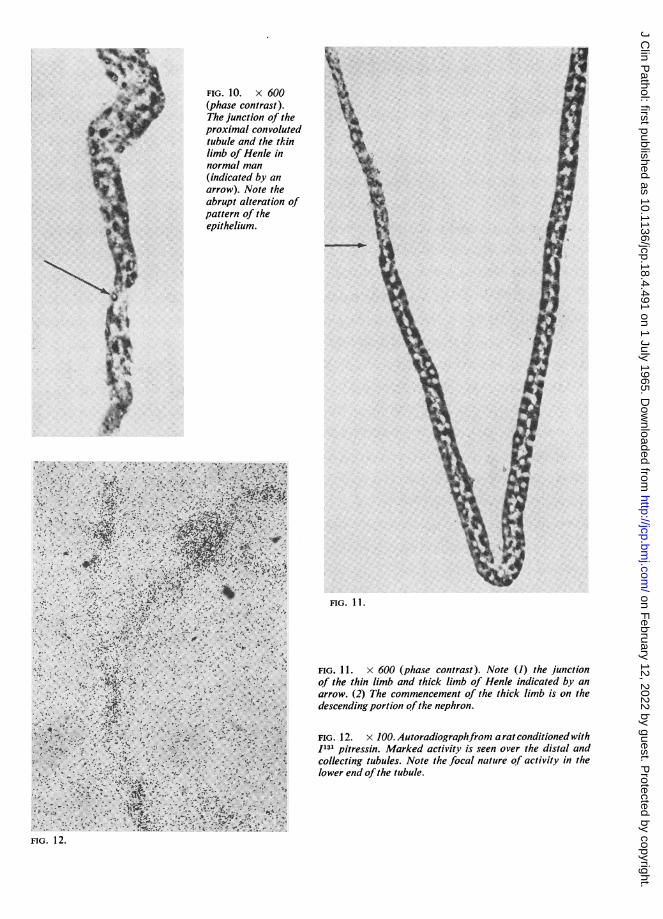
FIG. 10. X 600(phase contrast).The junction of theproximal convolutedtubule and the thinlimb of Henle innormal man(indicated by anarrow). Note theabrupt alteration ofpattern of theepithelium.
21'~~ ~ ~ ~ ~ F
4.
FIG. 1 2.
FIG. 11.
FIG. 1L. x 600 (phase contrast). Note (1) the junctionof the thin limb and thick limb of Henle indicated by anarrow. (2) The commencement of the thick limb is on thedescending portion ofthe nephron.
FIG. 12. x 100. Autoradiographfrom arat conditioned withI131 pitressin. Marked activity is seen over the distal andcollecting tubules. Note the focal nature of activity in thelower end ofthe tubule.
on February 12, 2022 by guest. P
rotected by copyright.http://jcp.bm
j.com/
J Clin P
athol: first published as 10.1136/jcp.18.4.491 on 1 July 1965. Dow
nloaded from
E. M. Darmady
-..X...-,
A,
FIG. 13.
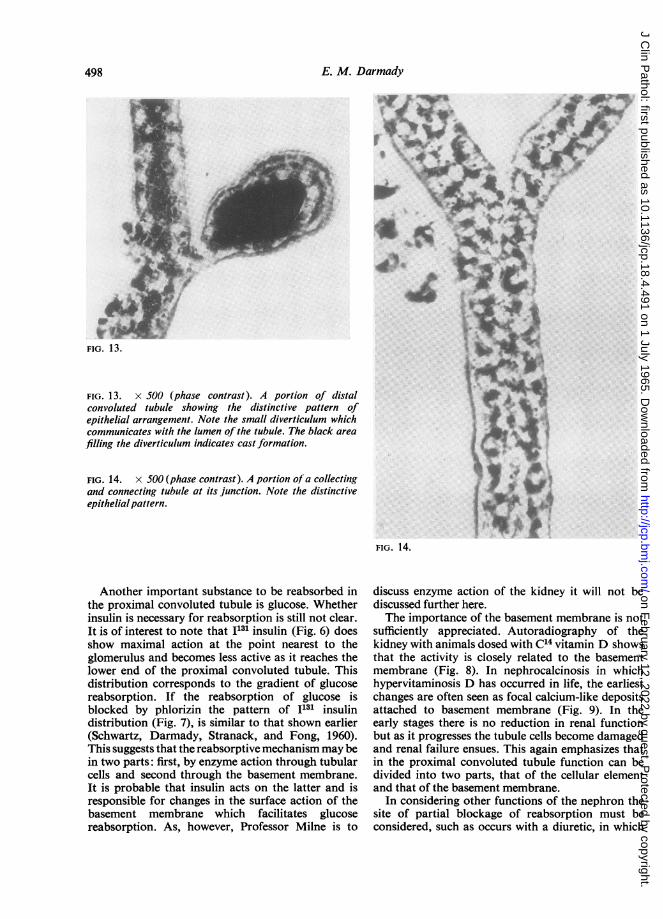
FIG. 13. x 500 (phase contrast). A portion of distalconvoluted tubule showing the distinctive pattern ofepithelial arrangement. Note the small diverticulum whichcommunicates with the lumen of the tubule. The black areafilling the diverticulum indicates cast formation.
FIG. 14. x 500 (phase contrast). A portion of a collectingand connecting tubule at its junction. Note the distinctiveepithelialpattern.
FIG. 14.
Another important substance to be reabsorbed inthe proximal convoluted tubule is glucose. Whetherinsulin is necessary for reabsorption is still not clear.It is of interest to note that 1131 insulin (Fig. 6) doesshow maximal action at the point nearest to theglomerulus and becomes less active as it reaches thelower end of the proximal convoluted tubule. Thisdistribution corresponds to the gradient of glucosereabsorption. If the reabsorption of glucose isblocked by phlorizin the pattern of I131 insulindistribution (Fig. 7), is similar to that shown earlier(Schwartz, Darmady, Stranack, and Fong, 1960).This suggests that the reabsorptive mechanism may bein two parts: first, by enzyme action through tubularcells and second through the basement membrane.It is probable that insulin acts on the latter and isresponsible for changes in the surface action of thebasement membrane which facilitates glucosereabsorption. As, however, Professor Milne is to
discuss enzyme action of the kidney it will not bediscussed further here.The importance of the basement membrane is not
sufficiently appreciated. Autoradiography of thekidney with animals dosed with C14 vitamin D showsthat the activity is closely related to the basementmembrane (Fig. 8). In nephrocalcinosis in whichhypervitaminosis D has occurred in life, the earliestchanges are often seen as focal calcium-like depositsattached to basement membrane (Fig. 9). In theearly stages there is no reduction in renal functionbut as it progresses the tubule cells become damagedand renal failure ensues. This again emphasizes thatin the proximal convoluted tubule function can bedivided into two parts, that of the cellular elementand that of the basement membrane.
In considering other functions of the nephron thesite of partial blockage of reabsorption must beconsidered, such as occurs with a diuretic, in which
I
498
on February 12, 2022 by guest. P
rotected by copyright.http://jcp.bm
j.com/
J Clin P
athol: first published as 10.1136/jcp.18.4.491 on 1 July 1965. Dow
nloaded from
Correlation of renal function and structure
the reabsorption of various substances such as
sodium are blocked. Autoradiographs show thatin the dog with Hg203 mersalyl the activity is in thelower end of the proximal convoluted tubule, but inH3 hydrochlorothiazide the activity is in the middlesection of the proximal and distal convoluted tubule(Darmady, Mowles, Renzi, Sheppard, and Stranack,1962). This suggests that each area of the nephronsmay have some specific function, which whendamaged, results in an increased excretion of solute.Thus in disease many combinations of tubulardisorder may occur which may result in glycosuria,amino aciduria, or other conditions depending upon
the extent and damage to the nephron.This specificity is noticeable since it is possible to
observe the abrupt alteration in tubular epithelialpattern, as for example at thejunction of the end oftheproximal convoluted tubule and thin limb of Henle(Fig. 10), and indeed the ascending limb of Henle. Theposition of the change is of some importance. Itis now usually accepted that the ascending limb ofHenle is responsible for the differential pumping ofsodium into the interstitial tissue, causing a rise inosmolarity. In turn the rise in osmolarity acts on theurinary filtrate. This differential pumping of sodiumfrom the ascending limb also explains the relativehypotonicity of the filtrate when it enters the distalconvoluted tubule. In man the junction of the limbto the ascending or thick limb of Henle is invariablyfound on the descending portion of the loop ofHenle (Fig. 11) and not at the bend as it is oftenshown.A more active control of the urine osmolarity
occurs as the result of the action of the antidiuretichormone or vasopressin. Autoradiography suggeststhat the site of action might be in the distal or
collecting tubule as demonstrated by 1131 vasopressinin the rat (Fig. 12).The success of urinary concentration will also
depend on the volume of solute presented to distalconvoluted tubules. Biber, Mytle, and Gottschalk(1963) have recently shown that when a portion ofthe proximal convoluted tubule isdamaged bypoison,such as potassium dichromate, the effective lengthof the proximal convoluted tubule is reduced. Inspite of the increased volume of fast moving filtrate,the filtrate is hypotonic when passing through the
distal convoluted tubule. This is of some interest,since in children suffering from nephrogenic diabetesinsipidus, the proximal convoluted tubule is approxi-mately half that of a normal child of the same age.This suggests that the ascending tubule of Henleis highly efficient in pumping large quantitiesof sodium into interstitial tissue and that theincreased volume of filtrate overwhelms the actionof the antidiuretic hormone. Similar findings arealso found in cystinosis (Darmady et al., 1964).Once again the pattern of the epithelium lining the
nephron and that of the distal convoluted tubule isdistinct (Fig. 13). It is, of course, closely attached tothe glomerulus by the macula densa in which is founda high concentration of renin, the function of whichis far from clear.Another point of difference in the distal con-
voluted tubule is the occurrence of small diverticula,which in places communicate with the lumen of thetubule (Fig. 13). Their function is unknown, but attimes these are seen to be packed with organisms.This suggests that they may be responsible forsymptomless bacteruria or even recurrent attacks ofpyelonephritis. Certainly in this position they couldgive rise to the focal and wedge-shaped lesions thatwe associate with this disease.
Finally, although the structures of the collectingand connecting tubules (Fig. 14) are again different,it is still not possible to say exactly what functionoccurs here in relation to epithelial structure exceptto say that it is in this area that urine is finallyconcentrated.
My thanks are due to Dr. Fay Stranack, Ph.D., and Mr.John Offer, B.Sc., for performing the microdissections.
REFERENCES
Biber, Th. U. L., Mytle, M., and Gottschalk, C. W. (1963). ExcerptaMedica. International Congress No. 78. Proceedings 2ndInternational Congress of Nephrology, Prague, Amsterdam.
-, Mowles, T. T., Renzi, A. A., Sheppard, H., and Stranack, F.(1962). Ibid., 22, 295.
-, Offer, J., Prince, J., and Stranack, F. (1964). Lancet, 2, 1254.Oliver, J. (1960). Glomerulare und Tubulare Nierenerkrankungen. In
Internationales Nierensymposion Wurzburg, edited by H. E.Schafer and A. Heidland, p. 29. Thieme, Stuttgart.
Osathanondh, V., and Potter, E. L. (1963). Arch. Path., 76, 271.Schwartz, I., Darmady, E. M., Stranack, F., and Fong, C. T. 0. (1960).
Unpublished Data.
499
on February 12, 2022 by guest. P
rotected by copyright.http://jcp.bm
j.com/
J Clin P
athol: first published as 10.1136/jcp.18.4.491 on 1 July 1965. Dow
nloaded from
J. clin. Path. (1965), 18, 500
Electron microscopy of the kidneyD. B. BREWER
From the Department ofPathology, University of Birmingham
The total activity of the kidney in man is the sumof the activities of two million nephrons. Theactivity of each nephron depends on the directedactivity of the cells forming it. From the glomerulusto the tip of the renal papilla are many differentsorts of cells. The functions of some we can suspectfrom knowledge from other sources. Their finestructure must condition, to some extent, the way thecells perform their function.
Theoretically the function of an entire nephroncould be explained if we knew the function of eachindividual cell and considered it in relation to thecapillaries and the tubular lumen. Clearly for somefunctions organization on a larger scale than intra-cellular is important. The obvious example is theloop of Henle and the medullary capillary bed.
In attempting to equate structure with functionusing the electron microscope it is as well to remem-ber the case of the medulla. Peter in 1909 demonstra-ted a correlation between the length of the thinsegment of the loops of Henle and the ability toform a concentrated urine. The medulla is obviouslyfitted for a counter-current system, yet it was manyyears before the theory was developed.Our knowledge of the structure of the cell cyto-
plasm and of cytoplasmic bodies has been revolution-ized in the last 10 years. Features of cell structurecommon to many cells are found in the kidney cells.No longer can a cell be thought of as a blob ofcytoplasm including a few mitochondria and anucleus. The cytoplasm of many of the renal cells isdivided up into small compartments by complexinfolding of the outer cell membrane. Other complexmembrane systems are present within the cytoplasm.In addition there are several different sorts of cyto-plasmic bodies. Mitochondria are concerned withthe Krebs cycle and oxidative phosphorylation;we have no clear idea why from the amoeba to manthey should have the same basic structure, but thereis some very striking evidence that enzymes of therespiratory chain are arranged in rows in theirappropriate order on the mitochondrial wall sothat electrons can be passed from one enzyme toanother down the chain (Fernandez-Moran, 1962).This fascinating idea is the subject of current con-troversy (Sjostrand, Andersson, and Karlsson, 1964)
but it shows how ideas regarding cellular mech-anisms are developing and how at this level structureand function become almost indistinguishable.The lysosome is another recently recognized
cytoplasmic body. It is a striking example of 'com-partmentalization' in the cytoplasm as it containswithin its membrane a collection of hydrolyticenzymes. It appears to be a mechanism whereby thecell can contain and at the same time be protectedfrom such enzymes.A great deal has been written about the inter-
relationship of the various cytoplasmic bodies. Themost extreme view is that almost all the membranesystems throughout the cell are continuous one withanother so that the endoplasmic reticulum is con-tinuous with the outer cell membrane and also withthe nuclear membrane. The mobility of the nucleuswithin the living cel makes it unlikely that there ispermanent physical continuity but there is un-doubtedly functional continuity. Substances takeninto the cell, e.g., protein in the proximal tubular cell(Brewer and Eguren, 1962, Miller, 1960), or thoro-trast in the liver cell (Hampton, 1958), are containedin membrane-bound vacuoles that fuse with thelysosomes. In the same way products formed by thecell are contained within the cytoplasm in minutemembrane-bound vacuoles which ultimately pass upto the cell surface and so are secreted. This has beenbrilliantly demonstrated by Caro and Palade (1964)in the case of enzymes formed by the pancreaticcells. Clearly the concept of the cell as a complexmembrane system of many compartments, somewithin others, is of fundamental importance and onewhich must be incorporated into our theoriesregarding cell activity and intracellular water andelectrolytes.
In the cells of the nephron we see these generalfeatures of cell structure in varying degree as well asmany special features found only in the kidney.
THE GLOMERULUS
The glomerular capillaries have the relatively simplefunction of providing an ultrafiltrate of the plasmaalmost free of protein. However, the wall ofthe capil-
500
on February 12, 2022 by guest. P
rotected by copyright.http://jcp.bm
j.com/
J Clin P
athol: first published as 10.1136/jcp.18.4.491 on 1 July 1965. Dow
nloaded from
Electron microscopy of the kidney
¼:~~~~~~~~~~~~~~~~~~~~~~~~~~~~~P
...'Sk V 0 " r
t 0 6'28 f 0 'X, -"I
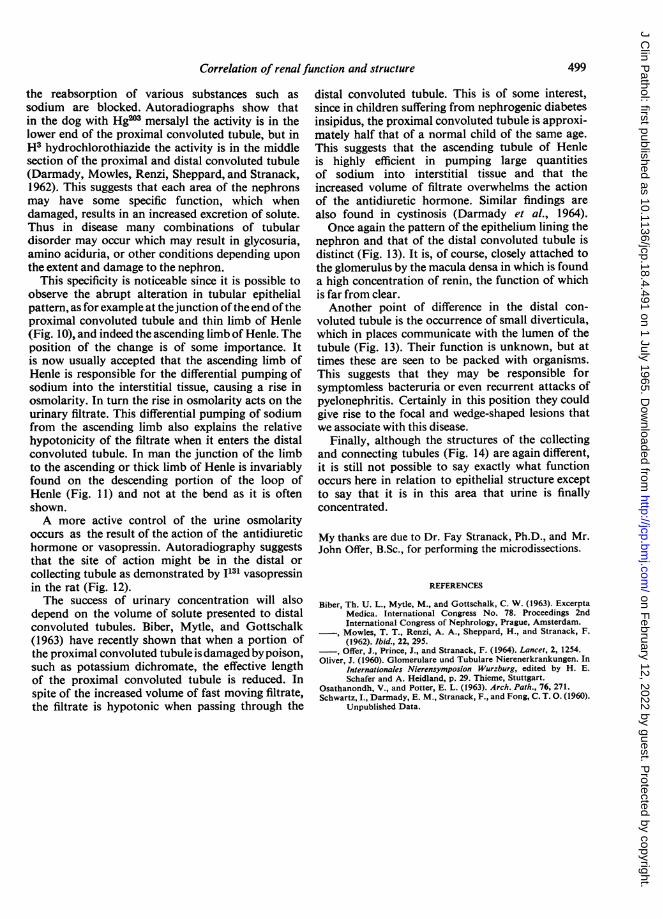
FIG. 1. A glomervlar capillary loop.Foot processes of epithelial cells onits outer surface. Osmic fixed x15,000.
...
i.
?
FIG. 2. FI1G. J.
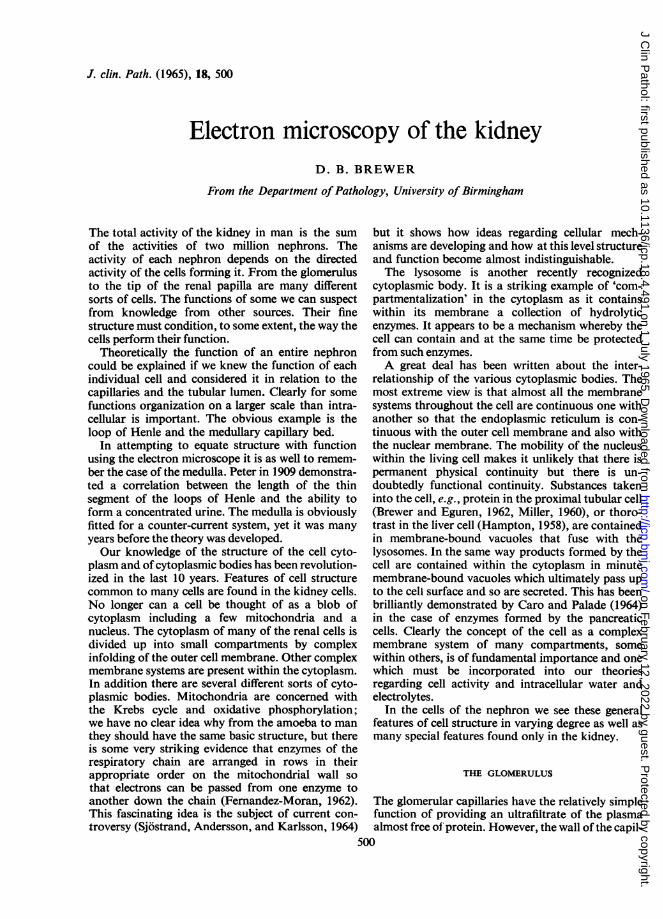
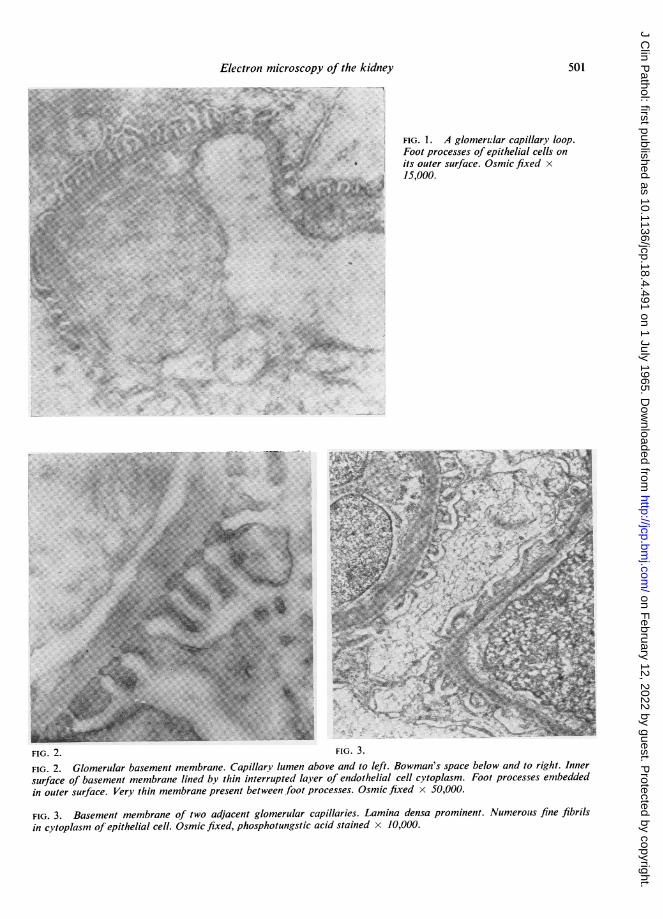
FIG. 2. Glomerular basement membrane. Capillary lumen above and to left. Bowman's space below and to right. Innersurface of basement membrane lined by thin interrupted layer of endothelial cell cytoplasm. Foot processes embeddedin outer surface. Very thin membrane present between foot processes. Osmic fixed x 50,000.
FIG. 3. Basement membrane of two adjacent glomerular capillaries. Lamina densa prominent. Numerous fine fibrilsin cytoplasm of epithelial cell. Osmic fixed, phosphotungstic acid stained x 10,000.
501
IrTf-l- I
on February 12, 2022 by guest. P
rotected by copyright.http://jcp.bm
j.com/
J Clin P
athol: first published as 10.1136/jcp.18.4.491 on 1 July 1965. Dow
nloaded from
D. B. Brewer
lary is quite complicated and it is by no meansclear what purpose is served by the various ultra-structural features (Fig. 1). On its inner surface areendothelial cells. The main cell body and nucleusare usually situated away from the free membrane.The inner surface of the loop of the membrane islined by an extremely thin layer of cytoplasm andeven within this layer are numerous circular fenestra-tions 200-900 AU in diameter (Fig. 2). This type ofendothelium is found in some, but not all, types ofcapillaries elsewhere in the body. The basementmembrane is a solid structure up to 3,000 AU thickin the human. It often has a central darker zone, thelamina densa, and a pale boundary on either side,the lamina rara (Fig. 3). The significance of thisappearance is not certain. It varies with the proces-sing technique used. Sometimes the basementmembrane appears dark throughout its full thickness(Figs. 1 and 2).Most workers have not found any fibrils in the
basement membrane; this is somewhat surprisingas it is birefringent. Kurtz and McManus (1960) andFarquhar, Wissig, and Palade (1961), however,describe fibrils 30-40 AU diameter. They are moreeasily seen after staining with heavy metals. As theyare so thin and not very highly orientated it is notsurprising that they are difficult to see in sections400-500 AU thick. Some doubt has been expressedas to the reality of this fibre structure. It has beensuggested that it might be an artefact of fixation andprocessing. The fact that the basement membraneis birefringent in formalin-fixed frozen sections issome support for the existence of such fibres.The idea that the basement membrane is fibrillar
is of some importance because, as Sitte (1959)amongst others has suggested, such a membranecould swell and become more permeable because thefibrils were further apart. The membrane, althoughmore permeable, would appear thicker.
It would seem probable that normally the base-ment membrane is not very active metabolically;as in tendons the turnover of its constituents islikely to be very slow. However, in disease, newbasement membrane is formed so presumably themembrane is a product of cellular activity. It hasbeen suggested that it might be formed either by theendothelial or epithelial cells. The most convincingevidence suggests that normal basement membraneis formed by the epithelial cells. This is the result ofthe work of Kurtz and Feldman (1962). who inducedargyria in young rats by giving them silver nitratein their drinking water. The silver is deposited in theglomerular basement membrane and is readily seenwith the electron microscope. In the normal processof ageing the membrane thickens and the thickeningoccurs on the epithelial side of the membrane. The
thickening following the administration of amino-nucleoside occurs similarly on the epithelial side.Some support for this function of the epithelial cellis the fact that numerous fine fibrils are found in thecytoplasm, particularly prominent after staining withphosphotungstic acid (Fig. 3).The epithelial cells presumably have some function
other than the maintenance of the basement mem-brane. They have, of course, a unique structure, withcomplex processes which branch progressively toform foot processes firmly applied to, and in factslightly embedded in, the substance of the basementmembrane (Fig. 2). The spaces between the footprocesses, the slit pores, have been assumed to bethe route through which the glomerular filtratepasses. The basement membrane is not, however,bare to Bowman's space but between the foot pro-cesses is covered by a thin membrane. (Fig. 2).Probably the most striking finding in relation to theepithelial cell is the fact that in 'nil change' nephroticsyndrome, aminonucleoside nephrosis, and manyother conditions in which proteinuria occurs, thefoot processes disappear and the cytoplasm is evenlyand continuouslyapplied to the basementmembrane.Apparently protein escapes more readily from aglomerulus with a continuous covering of cellcytoplasm than from one with an intermittentcovering.
This is rather difficult to understand, and in anattempt to find a way out of this difficulty it has beensuggested that the loss of foot processes is a resultrather than a cause of the proteinuria. Severalstudies have been reported claiming that the footprocesses are lost in proteinuria induced by in-jecting a large amount of a number of differentproteins in various animals (Ashworth and James,1961; Anderson and Recant, 1962; Fisher andHellstrom, 1962). I find the illustrations in thesepapers unconvincing. The loss of foot processes isvery small in extent compared with that found inspontaneous or experimental lesions. MoreoverLannigan and McQueen (1962) have shown thatfoot processes may appear normal in kidneyssecreting large amounts of protein.The epithelial cells take into their cytoplasm
proteins that cross the basement membrane. Far-quhar et al. (1961) found this in their studies withferritin. They suggest that the cells act as a monitorof the filter, though precisely what they mean bythis is by no means clear.
THE PROXIMAL CONVOLUTED TUBULES
The cells of the proximal convoluted tubules areamongst the most active in the kidney and notsurprisingly have a very complex structure (Fig. 4).
502
on February 12, 2022 by guest. P
rotected by copyright.http://jcp.bm
j.com/
J Clin P
athol: first published as 10.1136/jcp.18.4.491 on 1 July 1965. Dow
nloaded from
Electron microscopy of the kidney
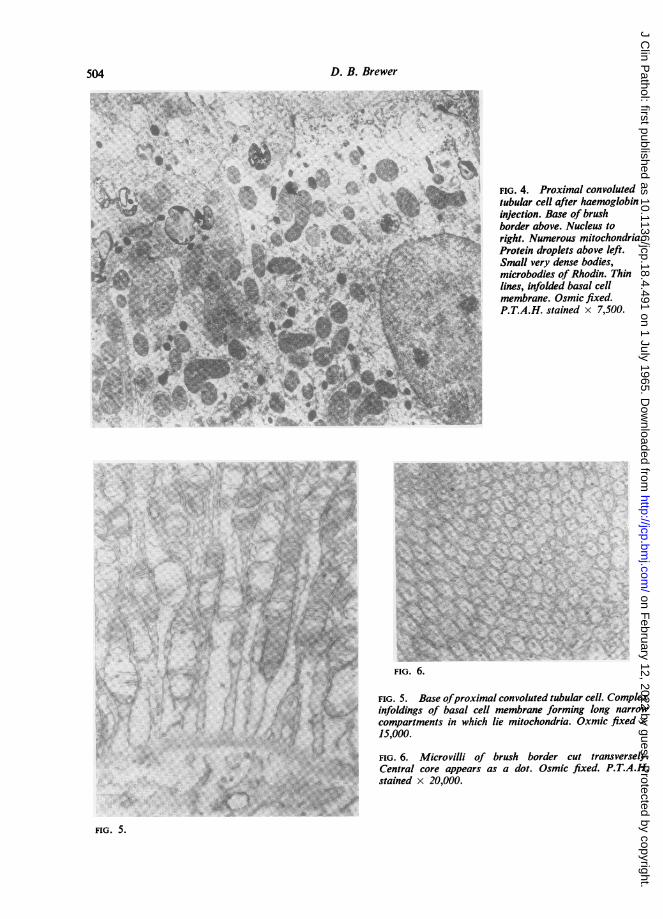
On the luminal surface is the brush border andwithin the cytoplasm are a variety of cytoplasmicbodies including large numbers of mitochondria.There is a very complex arrangement of infoldingsof membrane at the base of the cell (Fig. 5).The brush border of the cells has a striking resem-
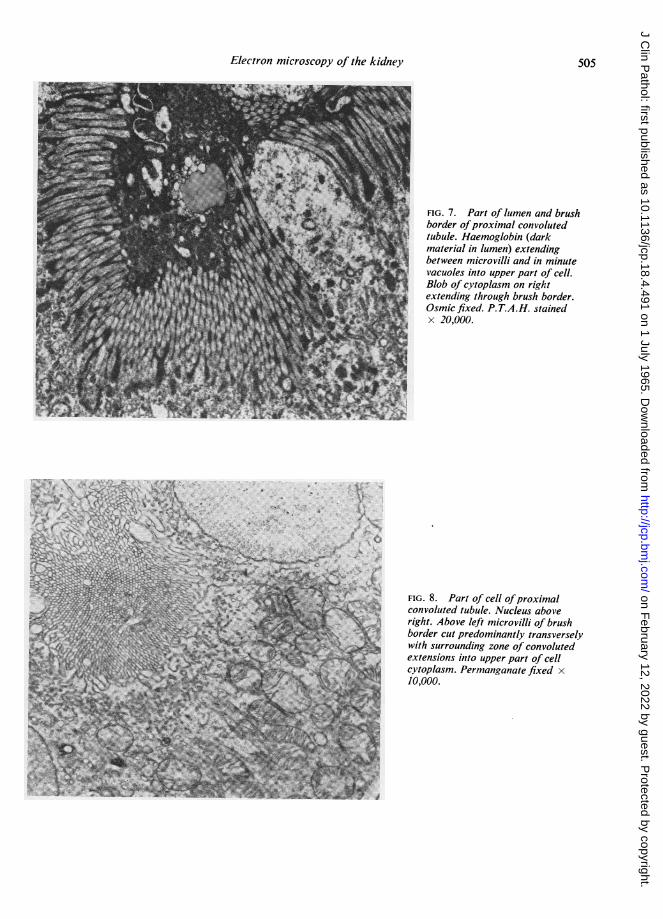
blance to the other very actively absorbing brushborder, that of the small intestine. It is made up oflong, thin, finger-like microvilli that appear roundedin cross section (Fig. 6). The core of a microvillusconsists of cytoplasm but after staining with phos-photungstic acid I have found a dark rod-likestructure within it particularly well seen in trans-verse section (Brewer and Eguren, 1962). The brushborder is usually thought of as a rather permanentrigid structure but one occasionally sees quite largevesicles forming in it and extending through it intothe tubular lumen. This is seen quite strikingly inanimals excreting large amounts of haemoglobin.The pale cytoplasmic blebs stand out against the darkhaemoglobin in the tubular lumen (Fig. 7). It hasbeen suggested at various times that this phenome-non is a physiological one but it seems most probablethat it is a fixation effect. The increase in cell surfaceproduced by the microvilli is thought by some to beimportant for the absorptive function of the cell andindeed this seems to be supported by the fact thatwith the electron microscope alkaline phosphataseand A.T.P.-ase are found over the whole of thesurface of the villi. However, there is a very strikingformation of vacuoles and long curving diverticulaextending from the base of the brush border into theupper part of the cell cytoplasm (Fig. 8). I and severalother investigators have been particularly struck bythe fact that during protein reabsorption thesebecome filled with protein which is apparently takeninto the cell in little vacuoles (Fig. 7). In the case ofprotein the absorptive activity appears to be mainlyat the base of the space between the microvilli. Thereis no convincing evidence that the same applies tothe absorption of sodium or glucose.
In the proximal convoluted tubular cell the cyto-plasmic bodies found in the zone between the brushborder and the nucleus differ from those found inthe zone between the nucleus and the base of the cell.Immediately beneath the brush border is a zone offine vacuoles and curved tubules presumed to beextensions of the intervillous spaces. Beneath thisare found a number of bodies of variable form andstructure (Fig. 9). There is some difference of opinionas to their nature. Rhodin (1954) eescribed them asbig granules and recognized two types. Miller (1960)recognized a further body which he called 'vacuo-lated body'. In considering the significance of thesestructures it must be remembered that lysosomesvary much in structure. Miller (1962) has recently
shown that the 'big granules' of Rhodin and his own'vacuolated bodies' both contain acid phosphataseso that they may indeed represent lysosomes invarying states of activity.
Situated mainly below the nucleus are greatnumbers of mitochondria. There are also presentsmall rounded bodies, microbodies, the function ofwhich is not known.
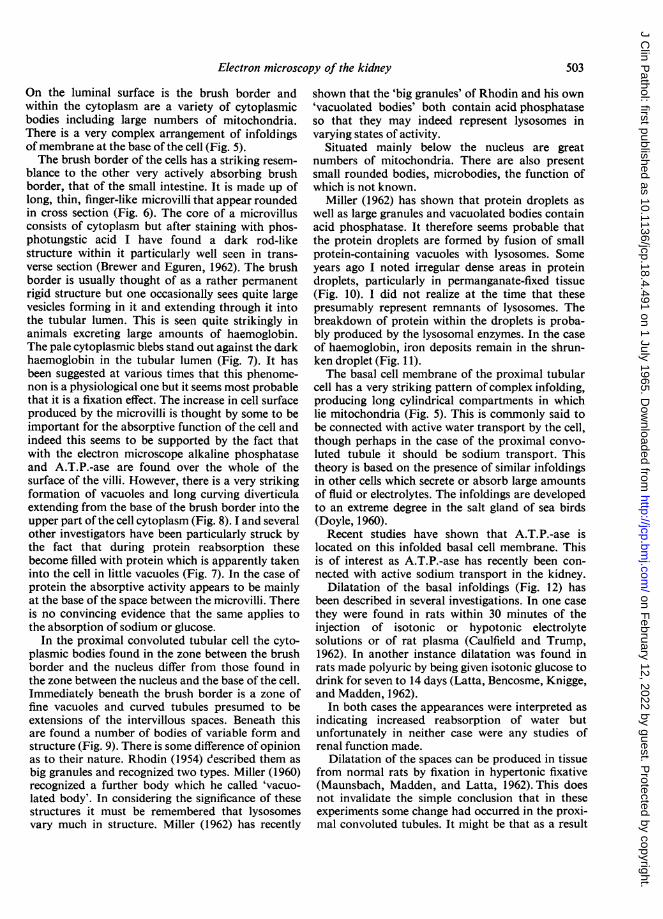
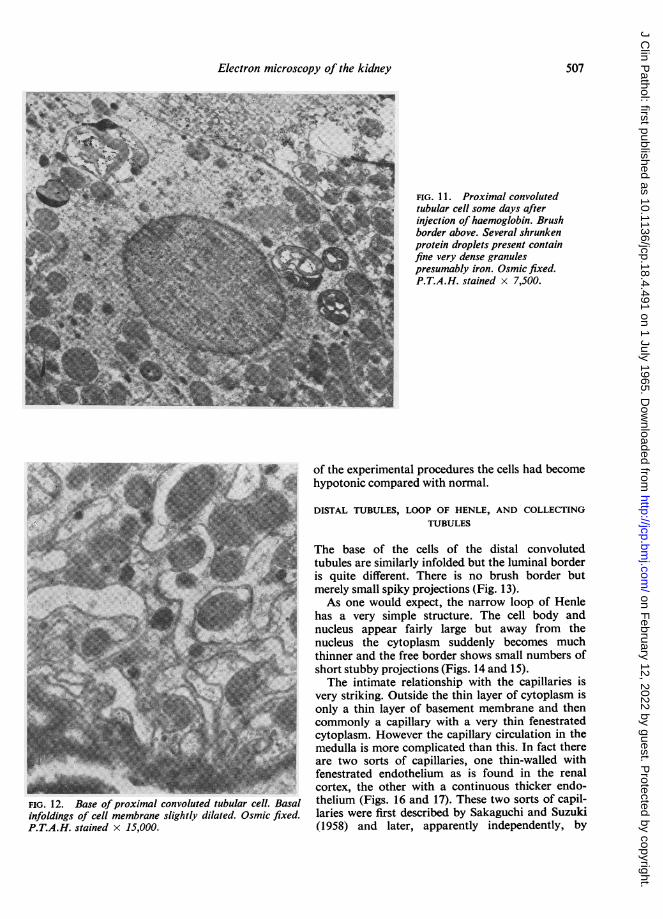
Miller (1962) has shown that protein droplets aswell as large granules and vacuolated bodies containacid phosphatase. It therefore seems probable thatthe protein droplets are formed by fusion of smallprotein-containing vacuoles with lysosomes. Someyears ago I noted irregular dense areas in proteindroplets, particularly in permanganate-fixed tissue(Fig. 10). I did not realize at the time that thesepresumably represent remnants of lysosomes. Thebreakdown of protein within the droplets is proba-bly produced by the lysosomal enzymes. In the caseof haemoglobin, iron deposits remain in the shrun-ken droplet (Fig. 11).The basal cell membrane of the proximal tubular
cell has a very striking pattern ofcomplex infolding,producing long cylindrical compartments in whichlie mitochondria (Fig. 5). This is commonly said tobe connected with active water transport by the cell,though perhaps in the case of the proximal convo-luted tubule it should be sodium transport. Thistheory is based on the presence of similar infoldingsin other cells which secrete or absorb large amountsof fluid or electrolytes. The infoldings are developedto an extreme degree in the salt gland of sea birds(Doyle, 1960).
Recent studies have shown that A.T.P.-ase islocated on this infolded basal cell membrane. Thisis of interest as A.T.P.-ase has recently been con-nected with active sodium transport in the kidney.
Dilatation of the basal infoldings (Fig. 12) hasbeen described in several investigations. In one casethey were found in rats within 30 minutes of theinjection of isotonic or hypotonic electrolytesolutions or of rat plasma (Caulfield and Trump,1962). In another instance dilatation was found inrats made polyuric by being given isotonic glucose todrink for seven to 14 days (Latta, Bencosme, Knigge,and Madden, 1962).
In both cases the appearances wvere interpreted asindicating increased reabsorption of water butunfortunately in neither case were any studies ofrenal function made.
Dilatation of the spaces can be produced in tissuefrom normal rats by fixation in hypertonic fixative(Maunsbach, Madden, and Latta, 1962). This doesnot invalidate the simple conclusion that in theseexperiments some change had occurred in the proxi-mal convoluted tubules. It might be that as a result
503
on February 12, 2022 by guest. P
rotected by copyright.http://jcp.bm
j.com/
J Clin P
athol: first published as 10.1136/jcp.18.4.491 on 1 July 1965. Dow
nloaded from
D. B. Brewer
'V ti"
'a
* .:
..1 >&S I
I
FIG. 4. Proximal convolutedtubular cell after haemoglobininjection. Base of brushborder above. Nucleus toright. Numerous mitochondria.Protein droplets above left.Small very dense bodies,microbodies of Rhodin. Thinlines, infolded basal cellmembrane. Osmic fixed.P.T.A.H. stained x 7,500.
...............
FIG. 6.
FIG. 5 Base ofproximal convoluted tubular cell. Complexinfoldings of basal cell membrane forming long narrowcompartments in which lie mitochondria. Oxmic fixed xi ooo00
...- }*'::Y- M;:v
-~
FIG. 6. Microvilli of brush border cut transversely.Central core appears as a dot. Osmic fixed. P.T.A.H.stained x 20,000.
.... ..~.::
..... * '
K
A
ifC
FIG. 5.
504
.A. ....:
on February 12, 2022 by guest. P
rotected by copyright.http://jcp.bm
j.com/
J Clin P
athol: first published as 10.1136/jcp.18.4.491 on 1 July 1965. Dow
nloaded from
Electron microscopy of the kidney
! FIG. 7. Part of lumen and brushborder ofproximal convoluted
r tubule. Haemoglobin (darkt material in lumen) extending
between microvilli and in minutel vacuoles into upper part of cell.
Blob of cytoplasm on righti extending through brush border.
Osmic fixed. P.T.A.H. stainedx 20,000.
h
FIG. 8. Part of cell ofproximalconvoluted tubule. Nucleus aboveright. Above left microvilli of brushborder cut predominantly transverselywith surrounding zone of convolutedextensions into upper part of cellcytoplasm. Permanganate fixed x10,000.
505
on February 12, 2022 by guest. P
rotected by copyright.http://jcp.bm
j.com/
J Clin P
athol: first published as 10.1136/jcp.18.4.491 on 1 July 1965. Dow
nloaded from

D. B. Brewer
FIG. 9. Upper part of three adjacent cells of proximal convoluted tubule. Brush borderabove left. The four dark oval bodies are the 'large bodies' ofRhodin, presumably lysosomes.Osmic fixed. P.T.A.H. stained x 15,000.
FIG. 1O. Proximal convoluted tubular cellsafter egg white injection. Basementmembrane lower right corner. Brush borderabove left. Numerous protein droplets boundedby a membrane with small irregular darkareas within. Permanganate fixed x 7,500.
506
oz
on February 12, 2022 by guest. P
rotected by copyright.http://jcp.bm
j.com/
J Clin P
athol: first published as 10.1136/jcp.18.4.491 on 1 July 1965. Dow
nloaded from
Electron microscopy of the kidney
.........e..o
FIG. 12. Base ofproximal convoluted tubular cell. Basalinfoldings of cell membrane slightly dilated. Osmic fixed.P.T.A.H. stained x 15,000.
FIG. 11. Proximal convolutedtubular cell some days afterinjection of haemoglobin. Brushborder above. Several shrunkenprotein droplets present containfine very dense granules
T presumably iron. Osmic fixed.P.T.A.H. stained x 7,500.
of the experimental procedures the cells had becomehypotonic compared with normal.
DISTAL TUBULES, LOOP OF HENLE, AND COLLECTINGTUBULES
The base of the cells of the distal convolutedtubules are similarly infolded but the luminal borderis quite different. There is no brush border butmerely small spiky projections (Fig. 13).As one would expect, the narrow loop of Henle
has a very simple structure. The cell body andnucleus appear fairly large but away from thenucleus the cytoplasm suddenly becomes muchthinner and the free border shows small numbers ofshort stubby projections (Figs. 14 and 15).The intimate relationship with the capillaries is
very striking. Outside the thin layer of cytoplasm isonly a thin layer of basement membrane and thencommonly a capillary with a very thin fenestratedcytoplasm. However the capillary circulation in themedulla is more complicated than this. In fact thereare two sorts of capillaries, one thin-walled withfenestrated endothelium as is found in the renalcortex, the other with a continuous thicker endo-thelium (Figs. 16 and 17). These two sorts of capil-laries were first described by Sakaguchi and Suzuki(1958) and later, apparently independently, by
507
MEMIN-MALJK'
on February 12, 2022 by guest. P
rotected by copyright.http://jcp.bm
j.com/
J Clin P
athol: first published as 10.1136/jcp.18.4.491 on 1 July 1965. Dow
nloaded from
D. B. Brewer
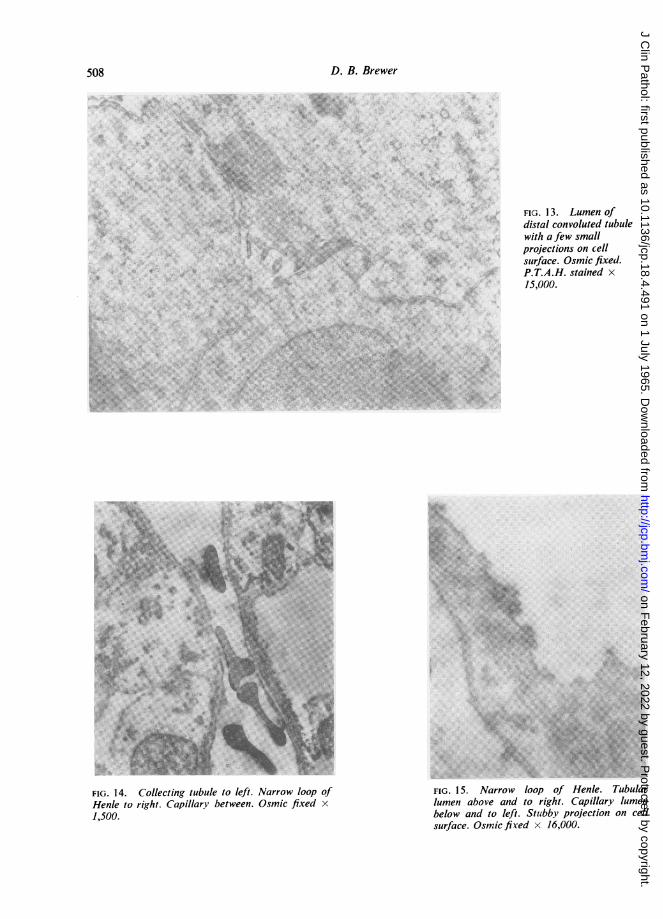
FIG. 14. Collecting tubule to left. Narrow loop ofHenle to right. Capillary between. Osmic fixed x
1,500.
FIG. 13. Lumen ofdistal convoluted tubulewith a few smallprojections on cellsurface. Osmic fixed.P.T.A.H. stained x15,000.
FIG. 15. Narrow loop of Henle. Tubularlumen above and to right. Capillary lumenbelow and to left. Stutbby projection on cellsurface. Osmic fired x 16,000.
508
on February 12, 2022 by guest. P
rotected by copyright.http://jcp.bm
j.com/
J Clin P
athol: first published as 10.1136/jcp.18.4.491 on 1 July 1965. Dow
nloaded from
Electron microscopy of thekidney50
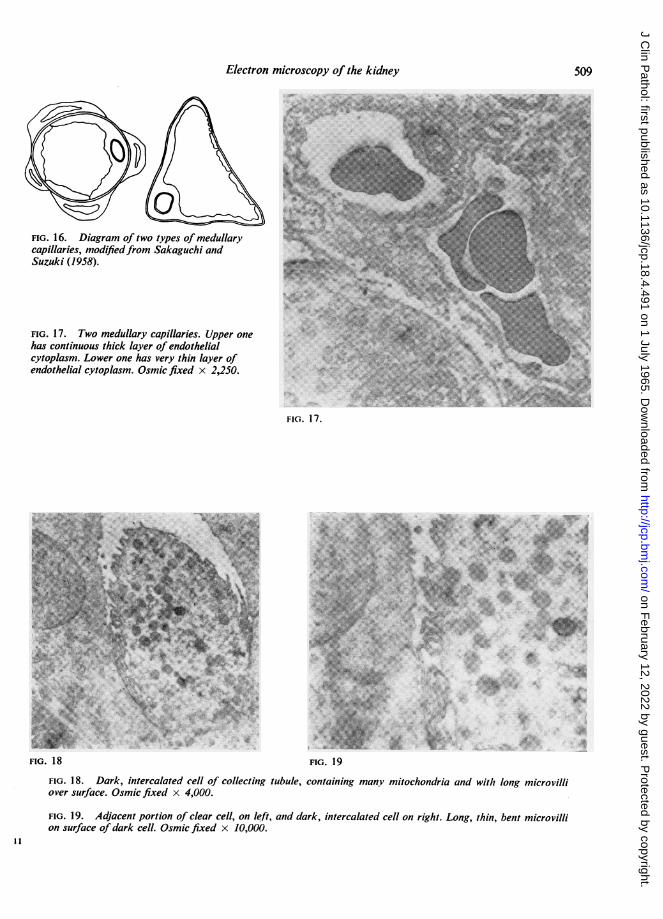
FIG. 16. Diagram of two types of medullarycapillaries, modifiedfrom Sakaguchi andSuzuki (1958).
FIG. 17. Two meduilary capillaries. Upper onehas continuous thick layer of endothelialcytoplasm. Lower one has very thin layer ofendothielial cytoplasm. Osmic fixed x 2,250.
FIG. 17.
4~~~~~~ ~~ ~ ~~~ ~ ~~~~~~~~~~~~~~~.....
4.V
FIG. 19
containing many mitochondria and with long microvilli
FIG. 19. Adjacent portion of clear cell, on left, and dark, intercalated cell on right. Long, thin, bent microvillion surface of dark cell. Osmic fixed x 10,000.
509
on February 12, 2022 by guest. P
rotected by copyright.http://jcp.bm
j.com/
J Clin P
athol: first published as 10.1136/jcp.18.4.491 on 1 July 1965. Dow
nloaded from

D. B. Brewer
Longley, Banfield, and Brindley (1960). Longleystates that the vessels with the thick endothelium arepost-glomerular capillaries bringing blood to themedulla and those with thin fenestrated endothe-lium are venous capillaries.
Partly as a result ofthe development ofthe counter-current theory of urinary concentration, interest hasbeen aroused in the tubular basement membrane.Sabour, MacDonald, Lambie, and Robson (1964)at Edinburgh found quite striking changes in the base-ment membrane ofthe straight portion ofthe proximalconvoluted tubule and the descending loop of Henle.They claim that in hydrated rats the basementmembrane becomes thickened, possibly as a result ofhydration. As a result it becomes less permeable tothe outer passage of water and to the inward passageof sodium and urea.The cells of the collecting tubules, as might be
expected from light microscopy, have rather paleempty cytoplasm; but light microscopy also revealstwo types of cells, pale and dark. The dark cells,also known as the intercalated cells, occur pre-dominantly in the cortical collecting tubules. In theelectron microscope they appear very different fromthe light cells. They contain many more mitochon-dria and over their surface they have long ratherbent microvilli (Figs. 18-19). Nothing is known ofthe function of these cells. They increase in number inpotassium deficiency. When preparing this paper Iwas struck by their resemblance in the electronmicroscope to the oxyntic cells of the stomach
(Helander, 1962). It may be that they are concernedwith acid excretion in the renal tubules.
REFERENCES
Anderson, M. S., and Recant, L. (1962). Amer. J. Path., 40, 555.Ashworth, C. T., and James, J. A. (1961). Ibid., 39, 307.Brewer, D. B., and Eguren, L. M. (1962). J. Path. Bact., 83, 107.Caro, L. G., and Palade, G. E. (1964). J. cell. Biol., 20, 473.Caulfield, J. B., and Trump, B. F. (1962). Amer. J. Path., 40, 199.Doyle, W. L. (1960). Exp. Cell Res., 21, 386.Farquhar, M. G., Wissig, S. L., and Palade, G. E. (1961). J. exp. Med.,
113, 47.Fernandez-Moran, H. (1962). Circulation, 26, 1039.Fisher, E. R., and Hellstrom, H. R. (1962). Lab. Invest., 11, 617.Hampton, J. C. (1958). Acta anat. (Basel), 32,262.Helander, H. F. (1962). J. Ultrastruct. Res., suppl. 4.Kurtz, S. M., and Feldman, J. D. (1962). Ibid., 6, 19.-, and McManus, J. F. A. (1960). Ibid., 6,81.Lannigan, R., and McQueen, E. G. (1962). Brit. J. exp. Path., 43, 549.Latta, H., Bencosme, S. A., Knigge, K. M., and Madden, S. C. (1962).
Lab. Invest., 11, 569.Longley, J. B., Banfield, W. G., and Brindley, D. C. (1960). J. biophys.
biochem. Cytol., 7, 103.Maunsbach, A. B., Madden, S. C., and Latta, H. (1962). J. Ultrastruct.
Res., 6, 511.Miller, F. (1960). J. biophys. biochem. Cytol., 8, 689.
(1962). In Proc. 5th Conference on Electron Microscopy, vol.2, p. Q.2.
Rhodin, J. (1954). Correlation of Ultrastructural Organization andFunction in Normal and Experimentally Changed ProximalConvoluted Tubule Cells of the Mouse Kidney. KarolinskaInstitutet, Stockholm.
Sabour, M. S., MacDonald, M. K., Lambie., A. T., and Robson, J. S.(1964). Quart. J. exp. Physiol., 49, 162.
Sakaguchi, H., and Suzuki, Y. (1958). Keio J. Med., 7, 17.Sitte, H. (1959). Verh. dtsch. path. Ges., 43, 225.Sjostrand, F. S., Andersson, Cedergren E., and Karlsson, U. (1964).
Nature (Lond.), 202, 1075.
510
on February 12, 2022 by guest. P
rotected by copyright.http://jcp.bm
j.com/
J Clin P
athol: first published as 10.1136/jcp.18.4.491 on 1 July 1965. Dow
nloaded from

J. clin. Path. (1965), 18, 511
Estimation of the glomerular filtration rateJ. D. BLAINEY
From the Department of Experimental Pathology, University of Birmingham, andQueen Elizabeth Hospital, Birmingham
The measurement of the rate of formation of glo-merular filtrate is one of the main problems of renalphysiology since quantitative studies of renalfunction, both glomerular and tubular, depend uponaccurate determination of the volume of the filtrateformed and of the load of various substancesreaching the tubules. In disease, quantitative in-formation regarding the degree of renal impairmentor of the effect of therapy is impossible to obtainwithout knowledge of the filtration rate. Measure-ments of the volume of filtrate formed at the glo-merulus in the human are necessarily indirect andinvolve the estimation of the clearance of somesuitable substances, i.e., the rate of removal of asubstance per unit of plasma concentration. Clearlyif any material can be found which is neither ab-sorbed nor secreted by the renal tubules the clearancewill be equal to the rate of glomerular filtration.Smith (1951) defined the requirements which mustbe fulfilled to justify the use of a given compoundfor measurement of filtration rate as follows:-1 It must be freely diffusible from plasma throughartificial membranes.2 It should not be excreted by aglomerular kidneys.3 The rate of excretion of the substance must varyin a linear manner with plasma concentration, i.e.,the clearance must be independent of the plasmalevel over a wide range.4 If the clearances of several such substances areidentical under widely varying conditions, thissuggests that all are excreted without tubular re-absorption or secretion.5 If substances Y and Z are believed by independentevidence to be absorbed or secreted by a tubularmechanism, the clearances of Y and Z shouldapproach that ofX as an asymptote when the plasmaconcentrations of Y and Z are raised to high levels.
The fructose polysaccaride inulin, with a meanmolecular weight of 5000, and a radius of 15 A,satisfies the above characteristics in the normalkidney. Inulin is chemically inert, non-toxic, and isnot appreciably metabolized. The inulin clearanceremains constant in a given individual over a widerange of plasma inulin concentrations (Shannon and
Smith, 1935). Allantoin, sorbitol, dulcitol, mannitol,and sorbitan all behave similarly in man. Phlorizinhas no effect upon the inulin clearance, and in allspecies this technique of inulin infusion has re-mained the 'reference' method to which the clearanceof other substances has been referred. The accuratemeasurement of inulin clearance necessitates thecontinuous intravenous infusion of inulin overtimed periods to ensure constant blood levels,together with the frequent collection of samples ofblood and urine. A priming injection of 50 to 75 mg./kg. of inulin is necessary, followed by a rate of infu-sion of about 1 g./hour of inulin. The plasma con-centration of inulin is measured by hydrolysis tofructose under standard conditions of time and tem-perature after the plasma samples have been depro-teinized. The protein free filtrate is combined withresorcinol to form an orange-red compound thedensity ofwhich can be read in a spectrophotometer.A single injection technique for the measurement
of inulin clearance has been widely used but issubject to serious errors, arising largely from variablerates of mixing between the inulin present in theplasma and the extracellular fluid and in the urineat any given time.A simplification of the method has recently been
introduced in animals by the use of iodine-labelled1125 allyl inulin (Concannon, Summers, Brewer, Cole,Weil, and Foster, 1964). Iodinated radioactive allylinulin is freed from uncombined iodide I125 bypassage through an ion exchange resin and aftermixing with inert inulin is injected by intravenousinfusion as for an ordinary inulin clearance. Plasmaand urine levels of inulin are calculated from theradioactivity instead of by chemical means. In 164clearances in dogs, at varying inulin concentrations,excellent agreement was obtained between the radio-active method and the chemical method. The radio-activity technique has the advantage that countingcan be automatic and smaller doses of inulin canbe used satisfactorily with less risk of reaction.Similarly, carbon-labelled inulin has been used andthere seems no obvious objection to using otherlabelled inert, low molecular weight substances nowavailable, such as dextran. Radioactive cyanoco-
11
on February 12, 2022 by guest. P
rotected by copyright.http://jcp.bm
j.com/
J Clin P
athol: first published as 10.1136/jcp.18.4.491 on 1 July 1965. Dow
nloaded from
J. D. Blainey
balamin (vitamin B12) has also been used, andappears to give clearance values similar to inulin.This apparently simple technique may prove to bevaluable although it is subject to the necessity ofmaintaining a constant plasma level of radioactivityby intravenous infusion.The use of creatinine clearance (Brod and Sirota,
1948) as a measure of filtration rate has beenextensively discussed but the value of the methodis still in some doubt. There is abundant evidenceof tubular excretion of creatinine at high plasmaconcentrations, and creatinine to inulin clearanceratios of 1-1 to 1-3 have usually been reported(Hare,Goldstein,Bamett,McNamara andHare, 1949).Phlorizin reduces the ratio of creatinine to inulinclearance to 10. This evidence suggests that theinfusion of creatinine or the exogenous creatinineclearance is of little value as a measure of filtrationrate in man because of tubular excretion, althoughit has been shown to be of great value in the dog.The endogenous creatinine clearance, however, hasbeen extensively used by many clinicians as an indexof renal function since no infusion is necessary andthe measurement can be undertaken in the wards orclinics on repeated occasions.
Criticism of the value of creatinine clearance hasalso arisen on account of the difficulty of the chemi-cal estimation of creatinine in the serum and urine.The reaction with alkaline picrate to form an orange-red compound (the Jaffe reaction) is not specific forcreatinine; other 'chromogens,' particularly in theplasma, produce the same colour reaction. Methodsof estimation of the chromogen value after destruc-tion of creatinine by a specific enzyme or absorptionof creatinine on to fuller's earth or Lloyd's reagent(hydrated aluminium silicate) have been used toavoid this problem and were reviewed critically byOwen, Iggo, Scandrett, and Stewart (1954). Theseworkers showed that the method of protein precipi-tation from plasma was important and that acidfiltrates allowed apparently higher recovery ofcreatinine than neutral filtrates. They showed thatapproximately 20% of the total chromogen presentin plasma and 5% of the chromogen in diluted urinewas not due to creatinine but that this discrepancycould be almost completely avoided by adsorptionof creatinine on to Lloyd's reagent or by the use ofa specific creatinine-destroying enzyme from Coryne-bacterium urifaciens. Further experiments alsoshowed that all the creatinine and very little of thenon-creatinine chromogen was dialysable.The development of the AutoTechnicon analyser
provided a useful method for the determination ofserum and urine creatinine without adsorption ontoLloyd's reagent. This technique uses a double-dialysis system at 37°C. to ensure adequate transfer
of creatinine without chromogen or protein fromthe sample to the reaction coil, where it is mixedwith alkaline picrate. The colour is fully developedin a time-delay coil at 25°C. and the density is readautomatically in a flow-through cuvette at 505 m,u.This method has proved satisfactory and repro-ducible with recoveries of 97 to 100% of creatinineadded to normal serum. In occasional blood samplesin our laboratories, the plasma levels obtained bythe autoanalyser were higher than with a manualmethod using Lloyd's reagent, but these differenceswere not statistically significant in a group of 20duplicate analyses of plasma and urine creatinineestimated by both methods.The method with Lloyd's reagent (or since 1963)
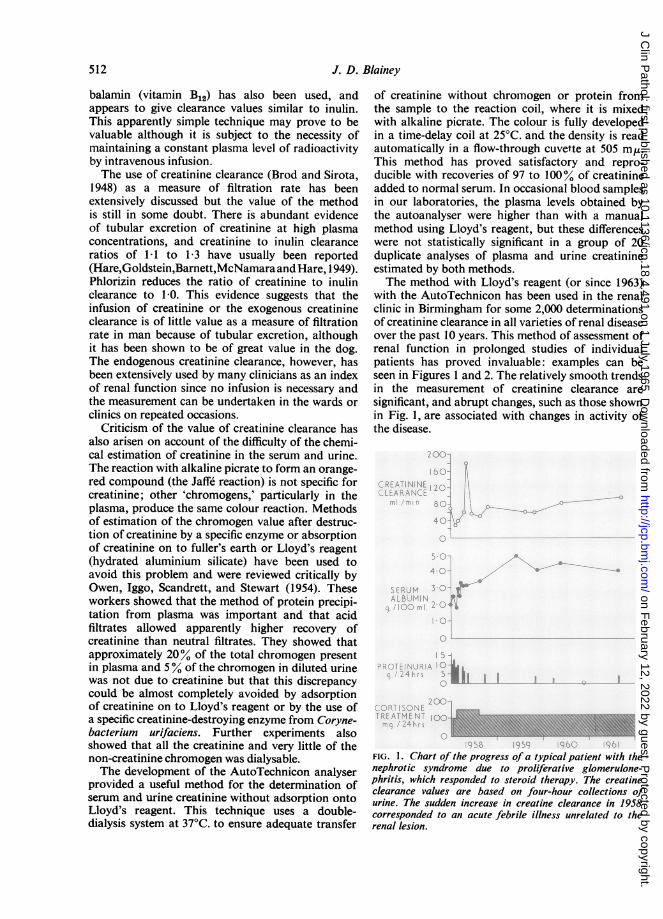
with the AutoTechnicon has been used in the renalclinic in Birmingham for some 2,000 determinationsof creatinine clearance in all varieties of renal diseaseover the past 10 years. This method of assessment ofrenal function in prolonged studies of individualpatients has proved invaluable: examples can beseen in Figures 1 and 2. The relatively smooth trendsin the measurement of creatinine clearance aresignificant, and abrupt changes, such as those shownin Fig. 1, are associated with changes in activity ofthe disease.
..~~~~~~~~~~~~~~R
FIG. 1. Chart of the progress of a typical patient with thenephrotic syndrome due to proliferative glomerulone-phritis, which responded to steroid therapy. The creatineclearance values are based on four-hour collections ofurine. The sudden increase in creatine clearance in 1958corresponded to an acute febrile illness unrelated to therenal lesion.
512
on February 12, 2022 by guest. P
rotected by copyright.http://jcp.bm
j.com/
J Clin P
athol: first published as 10.1136/jcp.18.4.491 on 1 July 1965. Dow
nloaded from

Estimation of the glomerular filtration rate
10CREATININECLEARANCEml. /min./kg
4.013*0-
SERUMALBUMIN 2 0-9.q [OOmI
1.0-
L
1 0-
PROTEINURIAq./kg./day 0.5-
BO
8 0-CORTI SONETREATMENT 4 01mq./ k./dcy -
0
Il liiil D
IE IllIlI I I Ii I II I
t----------1---t1956 t 1957 1958 1959RENALBIOPSY
FIG. 2. Chart of the progress ofa patient with membran-ous glomerulonephritis. The slow decrease of creatinineclearance provides valuable evidence of the deterioration ofrenalfunction during the four-year period of observation.
200-
C
ff 150-
z
LU
LU
LU
,,100-~~~~e_:J..
6 2 4 6 8 10 12 14SERUM CREATININE (mg./ lOOmI.)
FIG. 3. The relationship between creatinine clearance andserum creatinine for 200 four-hour creatinine clearancescarried out in the out-patient renal clinic on 180 patients.
While creatinine clearance, therefore, provides avaluable clinical measure of kidney function in theprogress of a patient with renal disease, examinationof clearance data from large numbers of patients
indicates that there is not a simple linear relationshipbetween plasma creatinine concentration and crea-tinine clearance.
Figure 3 shows the relationship between 200four-hour clearance values in 180 patients plottedagainst the corresponding plasma creatinine con-centration, and it is seen that a wide scatter of clear-ance values ranging from over 200 ml. per minute to25 ml. per minute are observed, corresponding toplasma creatinine concentrations below the normalupper limit of 1-4 mg./100 ml. These apparent dis-crepancies could arise from inadequate collection ofthe four-hour urine, i.e., too large or too small avolume resulting from inadequate emptying of thebladder at the b_ginning or end of the collectionperiod. Careful written instructions to patients willusually eliminate this error which is obvious oninspection of the data: a small number of obviouserrors have been eliminated before plotting the datain Figure 3. Another source of error could arise ifcreatinine were actually excreted by the renal tubuleat low plasma levels as well as at the levels attainedby infusion. Under these circumstances, varyingrates of production of endogenous creatinine couldproduce apparently wide variation in clearance eventhough the plasma level might change through onlya small range.The rate of endogenous creatinine formation and
excretion in a steady state has been shown to varywidely in different individuals and to be closelyrelated to lean body mass. The normal range usuallyquoted is from 107 to 3-21 g. creatinine per 24 hours.In children and old people, the daily excretion isconsiderably less than this amount. Howell (1956)showed a mean 24-hour creatinine output of 0-48 g.for men and 0-46 g. for women over the age of 80,although in both these groups the serum creatininelevel was within the normal range of 0-8 to 1-4mg./100 ml and a value of the creatinine clearance inthese subjects would therefore be significantly belowthe normal range of inulin clearance. Similarly in thedata presented in Fig. 3, the large muscular subjectshave a higher creatinine excretion per 24 hours, butthere is no corresponding increase in the plasmalevels of creatinine in these subjects. This suggeststhat even at normal plasma concentrations of crea-tinine, some creatinine is excreted by the renaltubule, especially when the rate of production ofcreatinine is increased from a larger muscle mass orfrom increased formation of creatinine as in fever.In renal disease also the simultaneous measurementof creatinine clearance and inulin clearance oftenindicates that ratios as high as 2 : 1 may be observed.The value for the normal creatinine clearance in a
given individual should therefore include a correctionfor the rate of creatinine production; the usual
I ".
I
513
on February 12, 2022 by guest. P
rotected by copyright.http://jcp.bm
j.com/
J Clin P
athol: first published as 10.1136/jcp.18.4.491 on 1 July 1965. Dow
nloaded from
J. D. Blainey
500-
E
E 200-
Z 100-
U 50-
z
< 20-
10-
HFog
i.e.'.-
5*-
01 02 040C- 0 2-0 4-0 60 10SERUM CREATININE (mg. / 10ml. )
FIG. 4.
UNCORRECTED CORRECTED30
<0.59 20- n 710-E O
8EL,.060- 20- n=2
U O -
z1- 20liniOiuJ< 139 -
zz 1-40- 20- -
1-79 _ n41 L
a: 11:180- 20 1 8=1D 2-19 4
2 20- 20-2 59 n=12
040 80 120 160 200 40 80 120 160 200
CREATININE CLEARANCE Cml /min.)
FIG. 5.
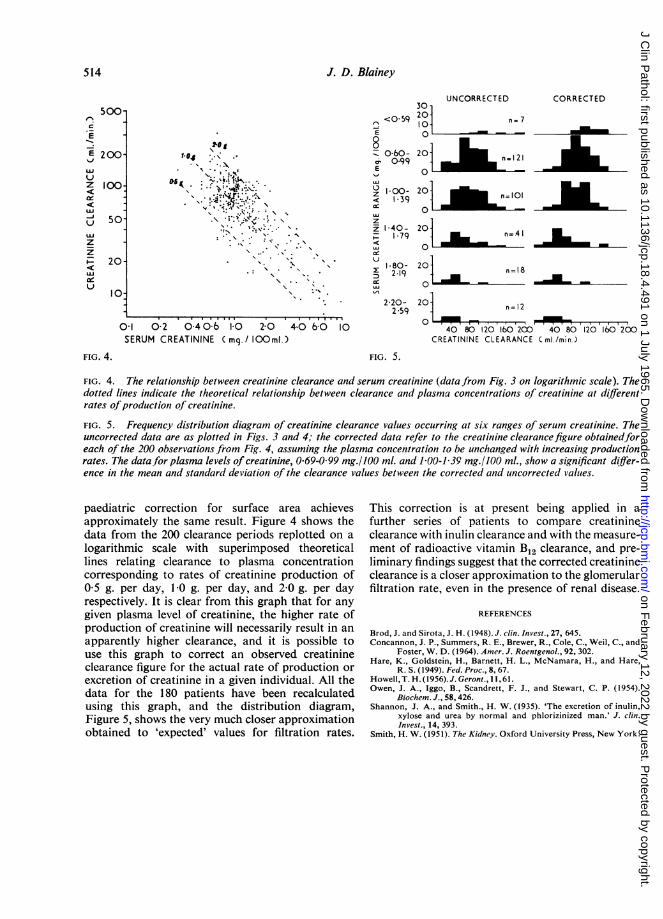
FIG. 4. The relationship between creatinine clearance and serum creatinine (data from Fig. 3 on logarithmic scale). Thedotted lines indicate the theoretical relationship between clearance and plasma concentrations of creatinine at differentrates ofproduction of creatinine.
FIG. 5. Frequency distribution diagram of creatinine clearance values occurring at six ranges of serum creatinine. Theuncorrected data are as plotted in Figs. 3 and 4; the corrected data refer to the creatinine clearancefigure obtainedforeach of the 200 observations from Fig. 4, assuming the plasma concentration to be unchanged with increasing productionrates. The data,for plasma levels of creatinine, 0-69-0 99 mg./100 ml. and 1 00-1 39 mg./100 ml., show a significant differ-ence in the mean and standard deviation of the clearance values between the corrected and uncorrected values.
paediatric correction for surface area achievesapproximately the same result. Figure 4 shows thedata from the 200 clearance periods replotted on alogarithmic scale with superimposed theoreticallines relating clearance to plasma concentrationcorresponding to rates of creatinine production of0-5 g. per day, 1 0 g. per day, and 2-0 g. per dayrespectively. It is clear from this graph that for anygiven plasma level of creatinine, the higher rate ofproduction of creatinine will necessarily result in anapparently higher clearance, and it is possible touse this graph to correct an observed creatinineclearance figure for the actual rate of production orexcretion of creatinine in a given individual. All thedata for the 180 patients have been recalculatedusing this graph, and the distribution diagram,Figure 5, shows the very much closer approximationobtained to 'expected' values for filtration rates.
This correction is at present being applied in afurther series of patients to compare creatinineclearance with inulin clearance and with the measure-ment of radioactive vitamin B12 clearance, and pre-liminary findings suggest that the corrected creatinineclearance is a closer approximation to the glomerularfiltration rate, even in the presence of renal disease.
REFERENCES
Brod, J. and Sirota, J. H. (1948). J. clin. Invest., 27, 645.Concannon, J. P., Summers, R. E., Brewer, R., Cole, C., Weil, C., and
Foster, W. D. (1964). Amer. J. Roentgenol., 92, 302.Hare, K., Goldstein, H., Barnett, H. L., McNamara, H., and Hare,
R. S. (1949). Fed. Proc., 8, 67.Howell, T. H. (1956). J. Geront., 11, 61.Owen, J. A., Iggo, B., Scandrett, F. J., and Stewart, C. P. (1954).
Biochem. J., 58, 426.Shannon, J. A., and Smith., H. W. (1935). 'The excretion of inulin,
xylose and urea by normal and phlorizinized man.' J. clin.Invest., 14, 393.
Smith, H. W. (1951). The Kidney. Oxford University Press, New York.
514
on February 12, 2022 by guest. P
rotected by copyright.http://jcp.bm
j.com/
J Clin P
athol: first published as 10.1136/jcp.18.4.491 on 1 July 1965. Dow
nloaded from

J. clin. Path. (1965), 18, 515
Tubular reabsorption and secretionM. D. MILNE
I think I shall restrict myself more to the proximaltubule in this talk because many ofmy colleagues aredealing with matters more referable to distal tubularfunction.
First of all, with this audience chiefly of clinicalpathologists, I need hardly warn you that you mustbeware of the parasitical physician, or more com-monly these days the parasitical registrar. These areindividuals who instruct nurses to collect specimens,send them to the laboratory, expect the most com-plicated investigations to be done, and then publisha paper saying that 'thanks are due to my colleague,Dr. X., who carried out a few biochemical investiga-tions'. The reason I say that is that the proximaltubule brings out the worst in physicians. It seemsto excite people to do tests which are purely ofresearch interest and of no practical importance inthe management of the patient. If tests are beingdone purely for research then the man who does thework should, of course, have a predominant positionin any published work. Many things that one talksabout in the proximal tubule are frankly researchprocedures and, in my opinion, in no way connectedwith the usual management of renal disease.One can say, besides the reabsorption of sodium
chloride and with it, iso-osmotically of water, thatthe functions of the proximal tubule certainly includereabsorption of glucose, amino-acids, phosphate,and uric acid, and they include secretion of a widevariety of organic acids and bases. Of the last, farmore is known of the organic acid secretory system,but we do know that secretion of acids and bases areseparate processes. Probenecid, for example, willinhibit the secretion of organic acids but will leaveunaffected the secretion of organic bases, and al-though we use extraneous acids of no physiologicalimportance, such as para-aminohippurate, as testsubstances, these proximal tubular functions wereprobably evolved to excrete more efficiently toxicproducts of bacterial action from the colon. Thereare many potentially toxic organic acids and basesproduced by bacteria which are very rapidly dealtwith by the normal kidney. So effective is theirexcretion that it is very difficult indeed to detectthese substances in normal blood but very easy todetect them in urine.
This is the familiar slide (Fig. 1) relating the
amount excreted of a substance, U. . V, against theplasma level of that substance. I have used as typesubstances inulin, measuring the glomerular filtra-tion rate, glucose, a substance which is reabsorbedproximally, and p-aminohippurate (P.A.H.), aforeign substance of the organic acid secretorysystem which has the advantage of being very easyto estimate chemically. As you are well aware,glucose is a so-called threshold substance, it does notappear until the plasma level is well abovenormal, and P.A.H. has a clearance many timeshigher than that of inulin, being excreted at a lowplasma concentration at the level of the renalplasma flow, 600 mnl. per minute. There are twofunctional tests using P.A.H., namely, the measure-ment of renal plasma flow and the measurement ofTmp.A.H, the maximum secretory capacity of theproximal tubule for organic acids. Measurement of
500-
D
400-~~~~~~~~~~~400-
.E300 TmG. B
E200P.A.H. IULIN GCOE
Px. C mg. / ml.)FIG. 1. Graphs of equations
U:r . V = Px Cin (inulin)Ux. V = Px Cin - TmG (glucose)Ux. V = Ps. Cin + TmP.AH. (P.A.H.)
Assumed constants are Cn= 125 l.min., TmG =305 mg./min., and TmpAH = 79 mg./min. Point A is'mean threshold', point E is 'appearance threshold', andpoint F is 'maximal threshold' for glucose. Below plasmalevels of P.A.H. of about 016 mg./ml., the excretion ofP.A.H. is limited bvthe renalplasma flow. Actual excretionis indicated by the broken line OH.
515
on February 12, 2022 by guest. P
rotected by copyright.http://jcp.bm
j.com/
J Clin P
athol: first published as 10.1136/jcp.18.4.491 on 1 July 1965. Dow
nloaded from

M. D. Milne
renal plasma flow is the easier of the two. This mustbe done with a slow infusion of this non-toxicorganic acid. It would be quite useless in such arapidly excreted compound, with a half-life in theaverage adult of 16 minutes, to expect useful resultswith any method other than a slow continuous in-fusion. The clearance of P.A.H. will measure therenal plasma flow, provided the kidney is reasonablynormal. This immediately restricts the method tophysiology rather than to the investigation ofdisease. If the glomerular filtration rate is signi-ficantly reduced below 70% or 80% of the averagenormal, then the extraction of P.A.H. from the renalvenous blood will be incomplete and assessment ofrenal plasma flow will only be accurate if a catheteris simultaneously placed in the renal vein which, ofcourse, makes this a somewhat major procedure.The method, even with renal vein catheterization, isgrossly inaccurate in cases of oliguria, and in acuteoliguric renal failure the only methods available formeasuring the renal blood flow are the radioactiveKrypton and dye methcds in which cannulae haveto be placed both in the renal artery and the renalvein, making these procedures major researchmethods and ones which I would resist very forciblyif I were ever admitted to hospital as a consciouscase of acute oliguric renal failure. Determination ofTmp.A.AH is purely a research procedure. One needshere, of course, to have high plasma levels of P.A.H.by means of a rapid infusion, and it is necessary atthe same time to measure the inulin clearance becausethe amount secreted must be found by subtractionof the amount -filtered from the total amount ex-creted. It is, however, perhaps the most accuratemethod of measuring total cellular mass in thekidney, but a measurement that is not required intreatment of cases of renal disease.
Glucose, perhaps, is in a more important categorybecause it is a physiological substance, but the onlyoccasions when Tmg, which is the measure of tubularreabsorption of glucose, would have to be measuredis in research on renal glycosuria. Renal glycosuriais now reasonably well understood from a clinicalpoint of view. There are two types: that due toheterogeneity of nephrons in relation to glucose re-absorption, in which case glucose will appear in theurine at low plasma levels, say at 150 mg. per100 ml., but excretion at high levels is normal, orthat due to a true reduction of Tmg, in which casethe excretion will be abnormal both at low and highplasma levels. However, the differentiation of thesetwo types does not greatly matter in managing thecase and is not necessary in recognition of renalglycosuria. In the hereditary cases. in which glucoseleak is the sole abnormality, most are due to hetero-geneity of nephrons but some to lowering of the
Tmg, whereas in renal glycosuria associated withmore generalized diseases, such as the Fanconisyndrome and cystinosis, the abnormality is alwaysdue to lowering of the Tmg. In the measurement ofTmg, a high plasma glucose level has to be main-tained by constant infusion up to 400 mg./100 ml.,and this causes a massive osmotic diuresis withsodium depletion which will secondarily reduce theTmg so that a sodium balance must be maintainedthroughout the test. It is, in my opinion, wholly aresearch method and one unnecessary in thediagnosis of proximal tubular disease.
Figure 2 gives the same data where clearance isgraphed against plasma levels. The clearances ofglucose and p-amino-hippurate are hyperboliccurves approaching the constant value of inulinclearance asymptotically at high plasma concentra-tions. At normal plasma glucose values, all filteredglucose is reabsorbed by the proximal tubule cells.
Direct recognition of renal glycosuria, of course,is extremely important in differentiation fromdiabetes, and this can be easily carried out byanalysing short collections of urine with a diuresis ifnecessary and simultaneously analysing plasmaglucose. This gives a reasonable assessment of theplasma level at which glucose is appearing in theurine. The standard glucose tolerance test is defini-
700-C
600 \
500-\
400-\i \ ~~~~P.A.H.
300l
200t
INULIN12 510075-B50 GLUCOSE251A0
G. 0 2 3 4 5 6 7 8P.A.H. 0 01 0-2 0-3 0-4 0-5 0-6 0-7 0-8
Px. (mg. /ml.)
FIG. 2. Graphs of equationsUz. V
Uz V
PxU V
x
TMG (glucose)Cin +-mP H(pp H
Px
Assumed constants are identical with those of Figure 1.
516
Ci,, (inulin)
on February 12, 2022 by guest. P
rotected by copyright.http://jcp.bm
j.com/
J Clin P
athol: first published as 10.1136/jcp.18.4.491 on 1 July 1965. Dow
nloaded from
Tubular reabsorption and secretion
tive for the diagnosis of diabetes mellitus. Thedifferential diagnosis of the melliturias has beenmade easier by automation analysis, by chromato-graphy, and by special tests like the glucose oxidasemethod, so I will not discuss renal glycosuria further.From the differential diagnosis of proximal
tubular disease I personally consider that amino-acidreabsorption is the most important test, as amino-acids are of course absorbed by active transport andthe pattern of excretion is different in many diseases.I would remind you of the principles of active trans-port in the body. It occurs against a concentrationgradient, the substance passing from areas of low tohigher concentration of the compound being trans-ported. There is considerable resemblance of chem-ical structure in groups of substances involved in thesame transport system; presumably the activegroupings are combining with active centres in theunknown transporting enzymes involved. There iscompetitive inhibition between two substancessharing the same transport system and the transportis reduced non-competitively by anoxia or substancesdepressing cellular energy, such as dinitrophenol andother cellular poisons.The study of amino-aciduria in renal disease is the
best indication that amino-acids are grouped incellular transport systems. The results do notentirely agree with all the animal experiments, but Ithink that in this aspect there is considerable speciesdifference. There are about 20 different amino-acidsderived from protein hydrolysis. They could all bereabsorbed separately, in which case there would be20 distinct transport systems, or they could all beabsorbed together, which is perhaps unlikely becausethey are a very diverse set of chemical compounds.Indeed not all of them are truly amino-acids, asproline and hydroxy-proline have an imino-nitrogengroup. Alternatively, they may be divided into smallgroups which share a transport system and thisappears most likely and in fact actually occurs. Theevidence is based particularly on observations inhuman disease, but, in the case of glutamic andaspartic acids, depends on infusion experiments inthe dog. There are many monoamino-mono-carboxylic amino-acids in the largest group, which Iconsider is specially involved in the defective trans-port in Hartnup disease, a rare but physiologicallyimportant condition. By contrast the basic amino-acids-lysine, ornithine, arginine, and cystine-arespecifically involved in the disease cystinuria. Theimino-glycine group-proline, hydroxy-proline, andglycine-is specifically involved in certain varieties ofhereditary nephritis. The dicarboxylic amino-acids,glutamic and aspartic acids, have a separate transportsystem and the evidence for this depends entirely onmutual competition for their proximal tubular re-
absorption in the dog. Similar experiments have not,to my knowledge, been performed to date in man.We can now classify proximal tubular disease and
diseases concerned with amino-acid absorptionreasonably accurately. There has been a tremendousamount of work done on these conditions in the last20 years and the old classification of Dent into anoverflow and a renal amino-aciduria, although avery fine concept, is far too simple alone to explainall the ramifications of amino-acid excretion. Theoverflow amino-acidurias are comparable to diabetesmellitus in respect of glucose reabsorption. Theplasma level is high and the amino-acids appear inthe urine by simple saturation of proximal tubulartransport. The familiar examples are thresholdvarieties, such as phenylketonuria, where phenyl-alanine is involved; branched-chain amino-aciduriaor maple syrup urine disease, in which valine,leucine, and iso-leucine are involved; histidinuria,which is clinically less severe; and hyperglycinaemia,all causing various degrees of mental deficiency.The interesting thing to me from the physiological
point of view is why these amino-acidurias do notsaturate the transport system for mono-amino-monocarboxylic acids and cause a generalizedamino-aciduria. I think that usually the amount in-volved is insufficient, but it is perhaps not alwaysinsufficient in many cases of maple syrup urinedisease. The large amounts of excreted leucine, iso-leucine, and valine saturate the reabsorptive mech-anism and there is also, in many cases, someassociated renal amino-aciduria due to saturation ofthe proximal transport of monoamino-mono-carboxylic acids, but this certainly does not occur inphenylketonuria, histidinuria, and hyperglycinaemia.There are also amino-acidurias due to the excretionof simple non-threshold amino-acids. These arecompounds which are normally intracellular. If theyget into the plasma they are treated as foreignsubstances and are excreted at the level of theglomerular filtration rate, and therefore are veryeasy to detect in urine but very difficult to detect inplasma. Examples are the harmless anomaly off-amino-iso-butyric-acidaemia, arginino-succinaci-duria causing mental deficiency and hair changes,cystathioninuria, again causing mental deficiency,and the excretion of phospho-ethanolamine in theserious hereditary disease, phosphatasia.There are amino-acidurias in which there is a
mixed overflow and renal element. Levels of amino-acids due to a metabolic defect are high in theplasma and are filtered at the glomerulus in sufficientamounts to saturate the appropriate transportsystem, and therefore competitively inhibit the re-absorption of other members of the same amino-acidtransport group. A typical example is the rare
517
on February 12, 2022 by guest. P
rotected by copyright.http://jcp.bm
j.com/
J Clin P
athol: first published as 10.1136/jcp.18.4.491 on 1 July 1965. Dow
nloaded from
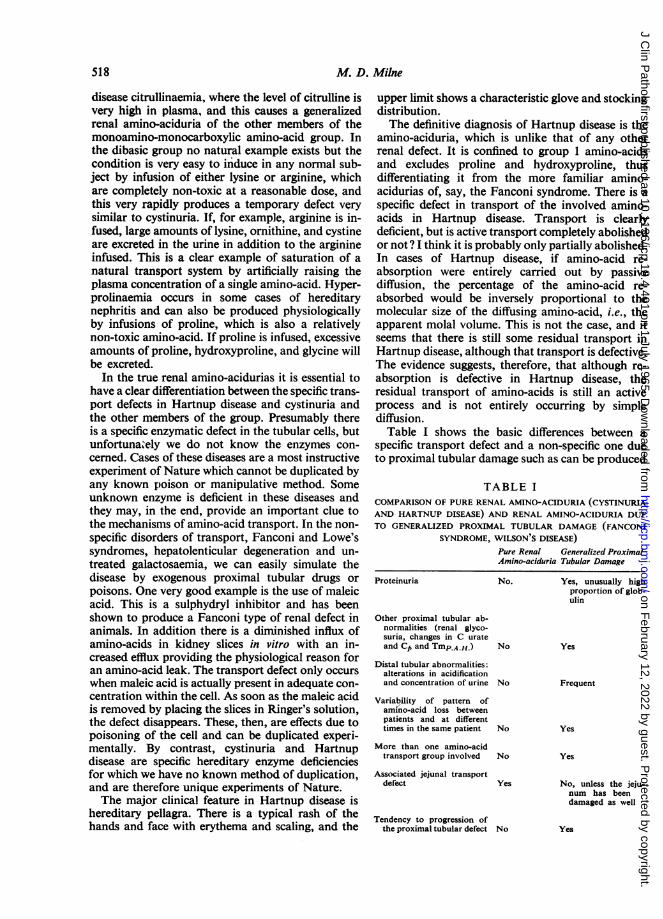
M. D. Milne
disease citrullinaemia. where the level of citrulline isvery high in plasma, and this causes a generalizedrenal amino-aciduria of the other members of themonoamino-monocarboxylic amino-acid group. Inthe dibasic group no natural example exists but thecondition is very easy to induce in any normal sub-ject by infusion of either lysine or arginine, whichare completely non-toxic at a reasonable dose, andthis very rapidly produces a temporary defect verysimilar to cystinuria. If, for example, arginine is in-fused, large amounts of lysine, ornithine, and cystineare excreted in the urine in addition to the arginineinfused. This is a clear example of saturation of anatural transport system by artificially raising theplasma concentration of a single amino-acid. Hyper-prolinaemia occurs in some cases of hereditarynephritis and can also be produced physiologicallyby infusions of proline, which is also a relativelynon-toxic amino-acid. If proline is infused, excessiveamounts of proline, hydroxyproline, and glycine willbe excreted.
In the true renal amino-acidurias it is essential tohave a clear differentiation between the specific trans-port defects in Hartnup disease and cystinuria andthe other members of the group. Presumably thereis a specific enzymatic defect in the tubular cells, butunfortunately we do not know the enzymes con-cerned. Cases of these diseases are a most instructiveexperiment of Nature which cannot be duplicated byany known poison or manipulative method. Someunknown enzyme is deficient in these diseases andthey may, in the end, provide an important clue tothe mechanisms of amino-acid transport. In the non-specific disorders of transport, Fanconi and Lowe'ssyndromes, hepatolenticular degeneration and un-treated galactosaemia, we can easily simulate thedisease by exogenous proximal tubular drugs orpoisons. One very good example is the use of maleicacid. This is a sulphydryl inhibitor and has beenshown to produce a Fanconi type of renal defect inanimals. In addition there is a diminished influx ofamino-acids in kidney slices in vitro with an in-creased efflux providing the physiological reason foran amino-acid leak. The transport defect only occurswhen maleic acid is actually present in adequate con-centration within the cell. As soon as the maleic acidis removed by placing the slices in Ringer's solution,the defect disappears. These, then, are effects due topoisoning of the cell and can be duplicated experi-mentally. By contrast, cystinuria and Hartnupdisease are specific hereditary enzyme deficienciesfor which we have no known method of duplication,and are therefore unique experiments of Nature.The major clinical feature in Hartnup disease is
hereditary pellagra. There is a typical rash of thehands and face with erythema and scaling, and the
upper limit shows a characteristic glove and stockingdistribution.The definitive diagnosis of Hartnup disease is the
amino-aciduria, which is unlike that of any otherrenal defect. It is confined to group 1 amino-acidsand excludes proline and hydroxyproline, thusdifferentiating it from the more familiar amino-acidurias of, say, the Fanconi syndrome. There is aspecific defect in transport of the involved amino-acids in Hartnup disease. Transport is clearlydeficient, but is active transport completely abolishedor not? I think it is probably only partially abolished.In cases of Hartnup disease, if amino-acid re-absorption were entirely carried out by passivediffusion, the percentage of the amino-acid re-absorbed would be inversely proportional to themolecular size of the diffusing amino-acid, i.e., theapparent molal volume. This is not the case, and itseems that there is still some residual transport inHartnup disease, although that transport is defective.The evidence suggests, therefore, that although re-absorption is defective in Hartnup disease, theresidual transport of amino-acids is still an activeprocess and is not entirely occurring by simplediffusion.Table I shows the basic differences between a
specific transport defect and a non-specific one dueto proximal tubular damage such as can be produced
TABLE ICOMPARISON OF PURE RENAL AMINO-ACIDURIA (CYSTINURIAAND HARTNUP DISEASE) AND RENAL AMINO-ACIDURIA DUETO GENERALIZED PROXIMAL TUBULAR DAMAGE (FANCONI
SYNDROME, WILSON'S DISEASE)Pure Renal Generalized ProximalAmino-aciduria Tubular Damage
No. Yes, unusually highproportion of glob-ulin
Other proximal tubular ab-normalities (renal glyco-suria, changes in C urateand Ck and TmP.A.H.) No
Distal tubular abnormalities:alterations in acidificationand concentration of urine No
Variability of pattern ofamino-acid loss betweenpatients and at differenttimes in the same patient No
More than one amino-acidtransport group involved No
Associated jejunal transportdefect Yes
Tendency to progression ofthe proximal tubular defect No
Yes
Frequent
Yes
Yes
No, unless the jeju-num has beendamaged as well
Yes
S18
Proteinuria
on February 12, 2022 by guest. P
rotected by copyright.http://jcp.bm
j.com/
J Clin P
athol: first published as 10.1136/jcp.18.4.491 on 1 July 1965. Dow
nloaded from
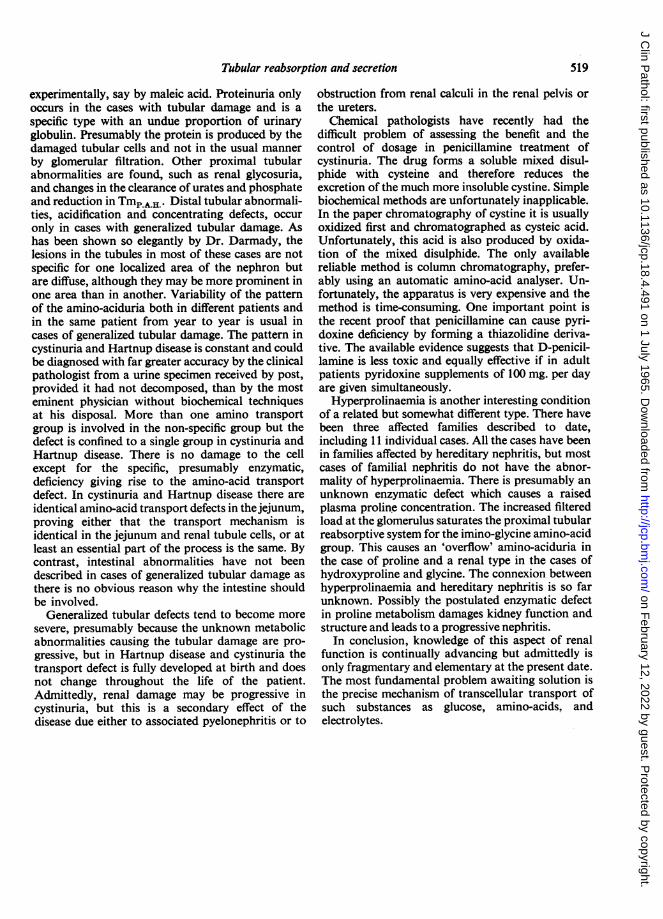
Tubular reabsorption and secretion
experimentally, say by maleic acid. Proteinuria onlyoccurs in the cases with tubular damage and is a
specific type with an undue proportion of urinaryglobulin. Presumably the protein is produced by thedamaged tubular cells and not in the usual manner
by glomerular filtration. Other proximal tubularabnormalities are found, such as renal glycosuria,and changes in the clearance of urates and phosphateand reduction in TmP.A.H.. Distal tubular abnormali-ties, acidification and concentrating defects, occur
only in cases with generalized tubular damage. Ashas been shown so elegantly by Dr. Darmady, thelesions in the tubules in most of these cases are notspecific for one localized area of the nephron butare diffuse, although they may be more prominent inone area than in another. Variability of the patternof the amino-aciduria both in different patients andin the same patient from year to year is usual incases of generalized tubular damage. The pattern incystinuria and Hartnup disease is constant and couldbe diagnosed with far greater accuracy by the clinicalpathologist from a urine specimen received by post,provided it had not decomposed, than by the mosteminent physician without biochemical techniquesat his disposal. More than one amino transportgroup is involved in the non-specific group but thedefect is confined to a single group in cystinuria andHartnup disease. There is no damage to the cellexcept for the specific, presumably enzymatic,deficiency giving rise to the amino-acid transportdefect. In cystinuria and Hartnup disease there areidentical amino-acid transport defects in thejejunum,proving either that the transport mechanism isidentical in the jejunum and renal tubule cells, or atleast an essential part of the process is the same. Bycontrast, intestinal abnormalities have not beendescribed in cases of generalized tubular damage as
there is no obvious reason why the intestine shouldbe involved.
Generalized tubular defects tend to become more
severe, presumably because the unknown metabolicabnormalities causing the tubular damage are pro-gressive, but in Hartnup disease and cystinuria thetransport defect is fully developed at birth and doesnot change throughout the life of the patient.Admittedly, renal damage may be progressive incystinuria, but this is a secondary effect of thedisease due either to associated pyelonephritis or to
obstruction from renal calculi in the renal pelvis orthe ureters.
Chemical pathologists have recently had thedifficult problem of assessing the benefit and thecontrol of dosage in penicillamine treatment ofcystinuria. The drug forms a soluble mixed disul-phide with cysteine and therefore reduces theexcretion of the much more insoluble cystine. Simplebiochemical methods are unfortunately inapplicable.In the paper chromatography of cystine it is usuallyoxidized first and chromatographed as cysteic acid.Unfortunately, this acid is also produced by oxida-tion of the mixed disulphide. The only availablereliable method is column chromatography, prefer-ably using an automatic amino-acid analyser. Un-fortunately, the apparatus is very expensive and themethod is time-consuming. One important point isthe recent proof that penicillamine can cause pyri-doxine deficiency by forming a thiazolidine deriva-tive. The available evidence suggests that D-penicil-lamine is less toxic and equally effective if in adultpatients pyridoxine supplements of 100 mg. per dayare given simultaneously.
Hyperprolinaemia is another interesting conditionof a related but somewhat different type. There havebeen three affected families described to date,including 11 individual cases. All the cases have beenin families affected by hereditary nephritis, but mostcases of familial nephritis do not have the abnor-mality of hyperprolinaemia. There is presumably anunknown enzymatic defect which causes a raisedplasma proline concentration. The increased filteredload at the glomerulus saturates the proximal tubularreabsorptive system for the imino-glycine amino-acidgroup. This causes an 'overflow' amino-aciduria inthe case of proline and a renal type in the cases ofhydroxyproline and glycine. The connexion betweenhyperprolinaemia and hereditary nephritis is so farunknown. Possibly the postulated enzymatic defectin proline metabolism damages kidney function andstructure and leads to a progressive nephritis.
In conclusion, knowledge of this aspect of renalfunction is continually advancing but admittedly isonly fragmentary and elementary at the present date.The most fundamental problem awaiting solution isthe precise mechanism of transcellular transport ofsuch substances as glucose, amino-acids. andelectrolytes.
519
on February 12, 2022 by guest. P
rotected by copyright.http://jcp.bm
j.com/
J Clin P
athol: first published as 10.1136/jcp.18.4.491 on 1 July 1965. Dow
nloaded from
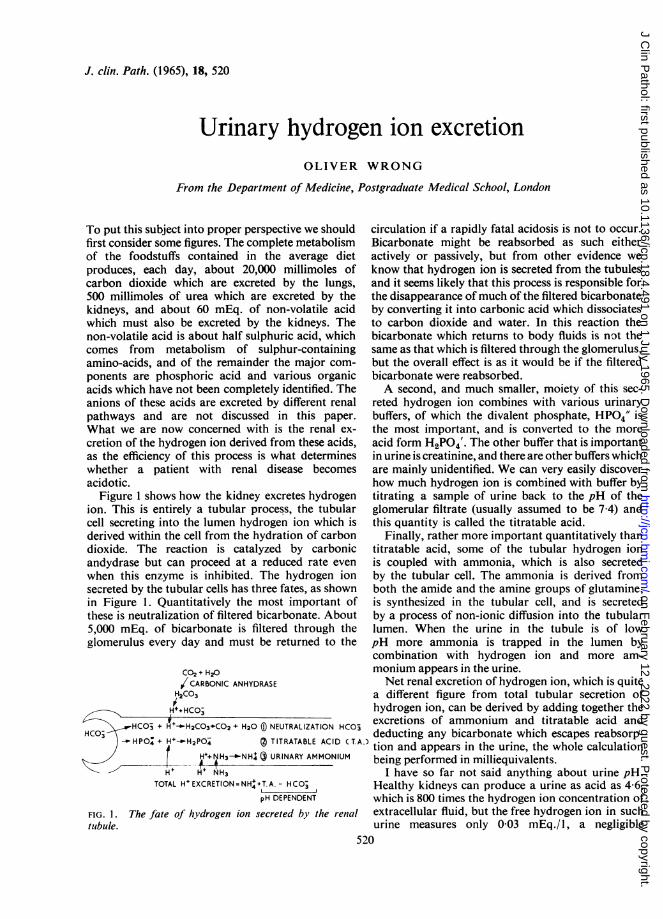
J. clin. Path. (1965), 18, 520
Urinary hydrogen ion excretionOLIVER WRONG
From the Department of Medicine, Postgraduate Medical School, London
To put this subject into proper perspective we should circulation if a rapidly fatal acidosis is not to occur.first consider some figures. The complete metabolism Bicarbonate might be reabsorbed as such eitherof the foodstuffs contained in the average diet actively or passively, but from other evidence weproduces, each day, about 20,000 millimoles of know that hydrogen ion is secreted from the tubulescarbon dioxide which are excreted by the lungs, and it seems likely that this process is responsible for500 millimoles of urea which are excreted by the the disappearance of much of the filtered bicarbonatekidneys, and about 60 mEq. of non-volatile acid by converting it into carbonic acid which dissociateswhidh must also be excreted by the kidneys. The to carbon dioxide and water. In this reaction thenon-volatile acid is about half sulphuric acid, which bicarbonate which returns to body fluids is not thecomes from metabolism of sulphur-containing same as that which is filtered through the glomerulus,amino-acids, and of the remainder the major com- but the overall effect is as it would be if the filteredponents are phosphoric acid and various organic bicarbonate were reabsorbed.acids which have not been completely identified. The A second, and much smaller, moiety of this sec-anions of these acids are excreted by different renal reted hydrogen ion combines with various urinarypathways and are not discussed in this paper. buffers, of which the divalent phosphate, HP04' isWhat we are now concerned with is the renal ex- the most important, and is converted to the morecretion of the hydrogen ion derived from these acids, acid form H2P04'. The other buffer that is importantas the efficiency of this process is what determines in urine is creatinine, and there are other buffers whichwhether a patient with renal disease becomes are mainly unidentified. We can very easily discoveracidotic. how much hydrogen ion is combined with buffer by
Figure 1 shows how the kidney excretes hydrogen titrating a sample of urine back to the pH of theion. This is entirely a tubular process, the tubular glomerular filtrate (usually assumed to be 7 4) andcell secreting into the lumen hydrogen ion which is this quantity is called the titratable acid.derived within the cell from the hydration of carbon Finally, rather more important quantitatively thandioxide. The reaction is catalyzed by carbonic titratable acid, some of the tubular hydrogen ionandydrase but can proceed at a reduced rate even is coupled with ammonia, which is also secretedwhen this enzyme is inhibited. The hydrogen ion by the tubular cell. The ammonia is derived fromsecreted by the tubular cells has three fates, as shown both the amide and the amine groups of glutamine,in Figure 1. Quantitatively the most important of is synthesized in the tubular cell, and is secretedthese is neutralization of filtered bicarbonate. About by a process of non-ionic diffusion into the tubular5,000 mEq. of bicarbonate is filtered through the lumen. When the urine in the tubule is of lowglomerulus every day and must be returned to the pH more ammonia is trapped in the lumen by
combination with hydrogen ion and more am-C02+ H20 monium appears in the urine.CARBONIC ANHYDRASE Net renal excretion of hydrogen ion, which is quite
H2CO3 a different figure from total tubular secretion ofH+HCO hydrogen ion, can be derived by adding together the
IHC03+4+Hc3C2 2 NURLZTo C3excretions of ammonium and titratable acid andHCO3 C deducting any bicarbonate which escapes reabsorp-
HPO: + H-HN2PO4 TITRATABLE ACID CTA.) tion and appears in the urine, the whole calculationH++NH3--NH: 0 URINARY AMMONIUM being performed in milliequivalents.
H+ N NH3 I have so far not said anything about urine pH.TOTAL H+EXCRETION=NH4+T.A.- HCO3 Healthy kidneys can produce a urine as acid as 4 6,
pH DEPENDENT which is 800 times the hydrogen ion concentration ofFIG. 1. The fate of hydrogen ion secreted by the renal extracellular fluid, but the free hydrogen ion in suchtubule. urine measures only 0 03 mEq./l, a negligible
520
on February 12, 2022 by guest. P
rotected by copyright.http://jcp.bm
j.com/
J Clin P
athol: first published as 10.1136/jcp.18.4.491 on 1 July 1965. Dow
nloaded from
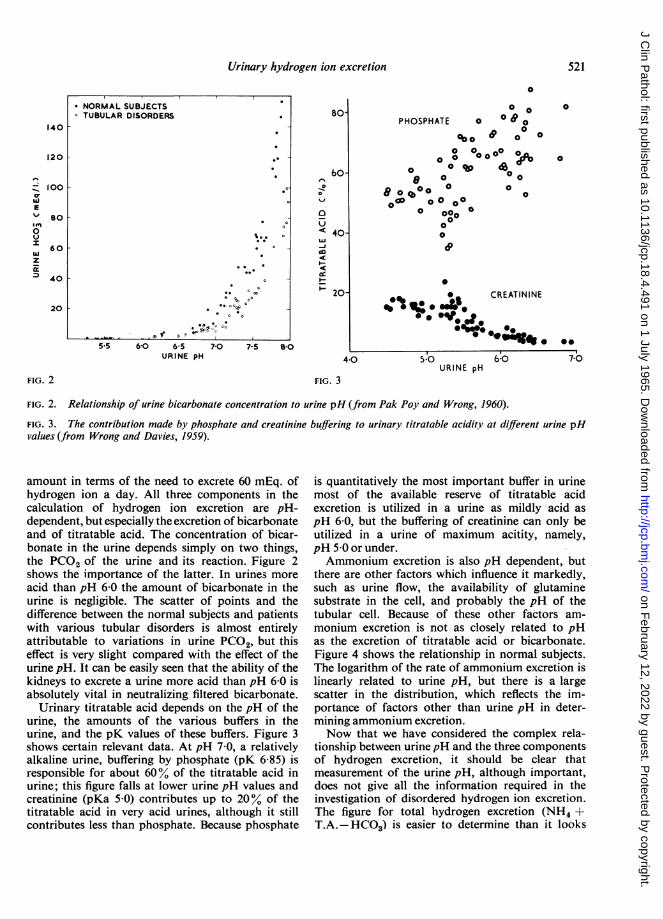
Urinary hydrogen ion excretion
5.5 6-0 6-5 7-0 7-5URINE pH
80-
60-
0
v
%J
<40-
I-
20-
804-0
FIG. 3
0
0 0
PHOSPHATE 0 0 ° 0
o o °0 o°e 00 0
0 0R:P:I004a0 0 0
8o0 ° 0 0 0o0 ~0 cO0
0 00 00
00
;0w 0
0 CREATININE% 0%1* : .X*.
*0o.p Jo.%00g.s
5-0URINE pH
6:o
FIG. 2. Relationship of urine bicarbonate concentration to urine pH (from Pak Poy and Wrong, 1960).
FIG. 3. The contribution made by phosphate and creatinine buffering to urinary titratable acidity at different urine pHvalues (from Wrong and Davies, 1959).
amount in terms of the need to excrete 60 mEq. ofhydrogen ion a day. All three components in thecalculation of hydrogen ion excretion are pH-dependent, but especially the excretion of bicarbonateand of titratable acid. The concentration of bicar-bonate in the urine depends simply on two things,the PCO2 of the urine and its reaction. Figure 2shows the importance of the latter. In urines moreacid than pH 6 0 the amount of bicarbonate in theurine is negligible. The scatter of points and thedifference between the normal subjects and patientswith various tubular disorders is almost entirelyattributable to variations in urine PCO2, but thiseffect is very slight compared with the effect of theurine pH. It can be easily seen that the ability of thekidneys to excrete a urine more acid than pH 6-0 isabsolutely vital in neutralizing filtered bicarbonate.
Urinary titratable acid depends on the pH of theurine, the amounts of the various buffers in theurine, and the pK values of these buffers. Figure 3shows certain relevant data. At pH 7 0, a relativelyalkaline urine, buffering by phosphate (pK 6-85) isresponsible for about 60% of the titratable acid inurine; this figure falls at lower urine pH values andcreatinine (pKa 5-0) contributes up to 20% of thetitratable acid in very acid urines, although it stillcontributes less than phosphate. Because phosphate
is quantitatively the most important buffer in urinemost of the available reserve of titratable acidexcretion is utilized in a urine as mildly acid aspH 6-0, but the buffering of creatinine can only beutilized in a urine of maximum acitity, namely,pH 5-0 or under.Ammonium excretion is also pH dependent, but
there are other factors which influence it markedly,such as urine flow, the availability of glutaminesubstrate in the cell, and probably the pH of thetubular cell. Because of these other factors am-monium excretion is not as closely related to pHas the excretion of titratable acid or bicarbonate.Figure 4 shows the relationship in normal subjects.The logarithm of the rate of ammonium excretion islinearly related to urine pH, but there is a largescatter in the distribution, which reflects the im-portance of factors other than urine pH in deter-mining ammonium excretion.Now that we have considered the complex rela-
tionship between urinepH and the three componentsof hydrogen excretion, it should be clear thatmeasurement of the urine pH, although important,does not give all the information required in theinvestigation of disordered hydrogen ion excretion.The figure for total hydrogen excretion (NH4 +T.A.-HCO3) is easier to determine than it looks
*NORMAL SU BJECTS°TUBULAR DISORDEP6ta
w. .
*sl
140 r
120 F
100 k
E
0u
z2
8O 1
60 [
40 F
20 [
0
0
*-
FIG. 2
70
521
on February 12, 2022 by guest. P
rotected by copyright.http://jcp.bm
j.com/
J Clin P
athol: first published as 10.1136/jcp.18.4.491 on 1 July 1965. Dow
nloaded from
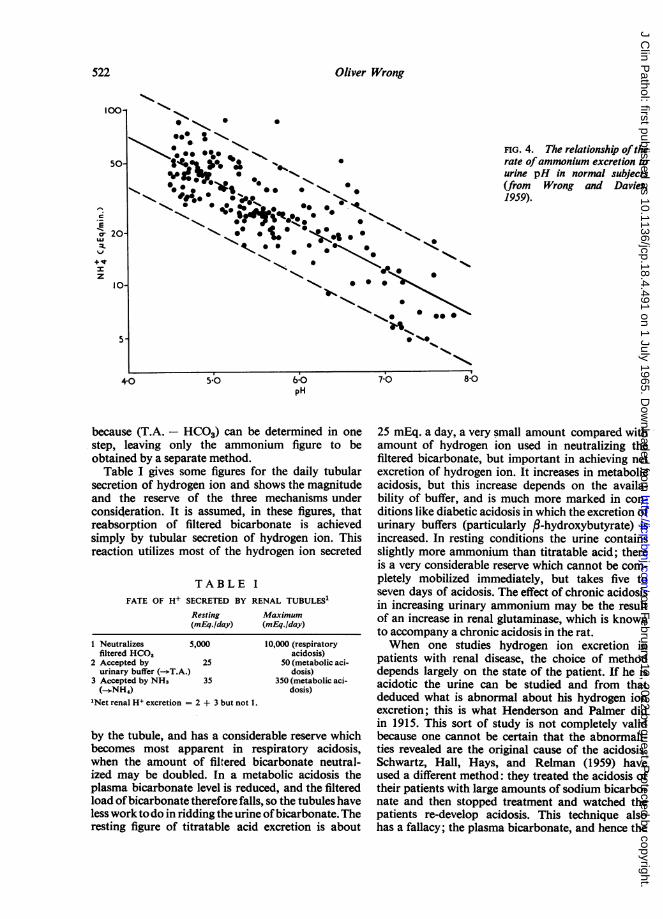
Oliver Wrong
c
0-Ecr
I..
z
FIG. 4. The relationship oftherate ofammonium excretion tourine pH in normal subjects(from Wrong and Davies,1959).
because (T.A. - HCO3) can be determined in onestep, leaving only the ammonium figure to beobtained by a separate method.
Table I gives some figures for the daily tubularsecretion of hydrogen ion and shows the magnitudeand the reserve of the three mechanisms underconsideration. It is assumed, in these figures, thatreabsorption of filtered bicarbonate is achievedsimply by tubular secretion of hydrogen ion. Thisreaction utilizes most of the hydrogen ion secreted
TABLE IFATE OF H+ SECRETED BY RENAL TUBULES'
Resting Maximum(mEq./day) (mEq./day)
1 Neutralizes 5,000filtered HCO,
2 Accepted by 25urinary buffer (-T.A.)
3 Accepted by NH3 35(--NH,)
'Net renal H+ excretion = 2 + 3 but not 1.
10,000 (respiratoryacidosis)
50 (metabolic aci-dosis)
350 (metabolic aci-dosis)
by the tubule, and has a considerable reserve whichbecomes most apparent in respiratory acidosis,when the amount of filtered bicarbonate neutral-ized may be doubled. In a metabolic acidosis theplasma bicarbonate level is reduced, and the filteredload ofbicarbonate therefore falls, so the tubules haveless work todo in ridding the urine ofbicarbonate. Theresting figure of titratable acid excretion is about
25 mEq. a day, a very small amount compared withamount of hydrogen ion used in neutralizing thefiltered bicarbonate, but important in achieving netexcretion of hydrogen ion. It increases in metabolicacidosis, but this increase depends on the availa-bility of buffer, and is much more marked in con-ditions like diabetic acidosis in which the excretion ofurinary buffers (particularly /3-hydroxybutyrate) isincreased. In resting conditions the urine containsslightly more ammonium than titratable acid; thereis a very considerable reserve which cannot be com-pletely mobilized immediately, but takes five toseven days of acidosis. The effect of chronic acidosisin increasing urinary ammonium may be the resultof an increase in renal glutaminase, which is knownto accompany a chronic acidosis in the rat.When one studies hydrogen ion excretion in
patients with renal disease, the choice of methoddepends largely on the state of the patient. If he isacidotic the urine can be studied and from thatdeduced what is abnormal about his hydrogen ionexcretion; this is what Henderson and Palmer didin 1915. This sort of study is not completely validbecause one cannot be certain that the abnormali-ties revealed are the original cause of the acidosis.Schwartz, Hall, Hays, and Relman (1959) haveused a different method: they treated the acidosis oftheir patients with large amounts of sodium bicarbo-nate and then stopped treatment and watched thepatients re-develop acidosis. This technique alsohas a fallacy; the plasma bicarbonate, and hence the
522
on February 12, 2022 by guest. P
rotected by copyright.http://jcp.bm
j.com/
J Clin P
athol: first published as 10.1136/jcp.18.4.491 on 1 July 1965. Dow
nloaded from
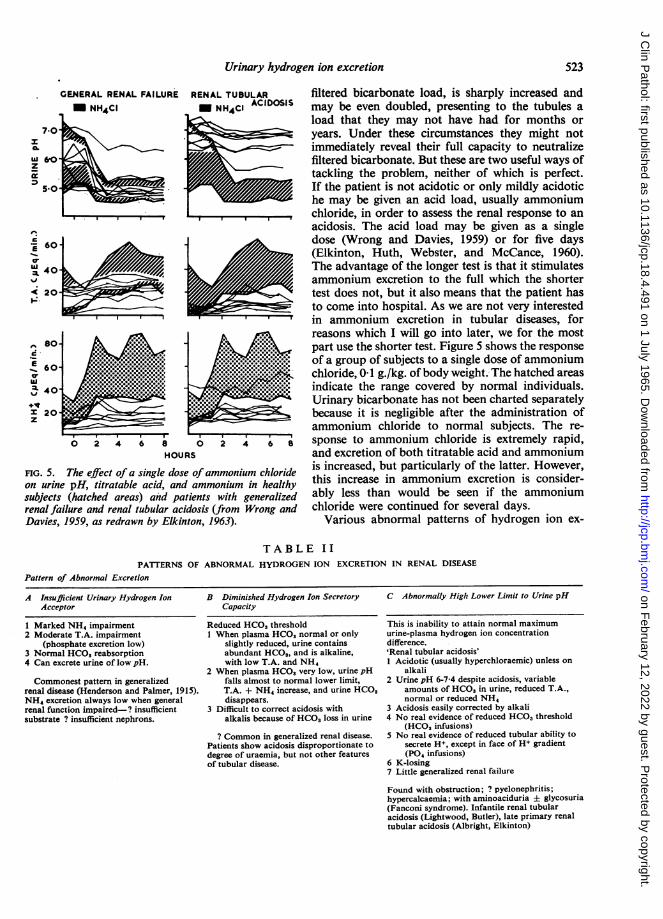
Urinary hydrogen ion excretion
RENAL TUBULARM NH4CI ACIDOSIS
A660.
0 240
3C 20z
4 '8a 2 4 6
HOURS
FIG. 5. The effect of a single dose ofammonium chlorideon urine pH, titratable acid, and ammonium in healthysubjects (hatched areas) and patients with generalizedrenal failure and renal tubular acidosis (from Wrong andDavies, 1959, as redrawn by Elkinton, 1963).
filtered bicarbonate load, is sharply increased andmay be even doubled, presenting to the tubules aload that they may not have had for months oryears. Under these circumstances they might notimmediately reveal their full capacity to neutralizefiltered bicarbonate. But these are two useful ways oftackling the problem, neither of which is perfect.If the patient is not acidotic or only mildly acidotiche may be given an acid load, usually ammoniumchloride, in order to assess the renal response to anacidosis. The acid load may be given as a singledose (Wrong and Davies, 1959) or for five days(Elkinton, Huth, Webster, and McCance, 1960).The advantage of the longer test is that it stimulatesammonium excretion to the full which the shortertest does not, but it also means that the patient hasto come into hospital. As we are not very interestedin ammonium excretion in tubular diseases, forreasons which I will go into later, we for the mostpart use the shorter test. Figure 5 shows the responseof a group of subjects to a single dose of ammoniumchloride, 0-1 g./kg. of body weight. The hatched areasindicate the range covered by normal individuals.Urinary bicarbonate has not been charted separatelybecause it is negligible after the administration ofammonium chloride to normal subjects. The re-sponse to ammonium chloride is extremely rapid,and excretion of both titratable acid and ammoniumis increased, but particularly of the latter. However,this increase in ammonium excretion is consider-ably less than would be seen if the ammoniumchloride were continued for several days.
Various abnormal patterns of hydrogen ion ex-
TABLE IIPATIERNS OF ABNORMAL HYDROGEN ION EXCRETION IN RENAL DISEASE
Pattern of Abnormal Excretion
A Insufficient Urinary Hydrogen IonAcceptor
1 Marked NH4 impairment2 Moderate T.A. impairment
(phosphate excretion low)3 Normal HCOS reabsorption4 Can excrete urine of low pH.
Commonest pattern in generalizedrenal disease (Henderson and Palmer, 1915).NH4 excretion always low when generalrenal function impaired-? insufficientsubstrate ? insufficient nephrons.
B Diminished Hydrogen Ion SecretoryCapacity
Reduced HCO3 threshold1 When plasma HCO3 normal or only
slightly reduced, urine containsabundant HCO3, and is alkaline,with low T.A. and NH4
2 When plasma HCO3 very low, urine pHfalls almost to normal lower limit,T.A. + NH4 increase, and urine HCO3disappears.
3 Difficult to correct acidosis withalkalis because of HCO3 loss in urine
? Common in generalized renal disease.Patients show acidosis disproportionate todegree of uraemia, but not other featuresof tubular disease.
C Abnormally High Lower Limit to Urine pH
This is inability to attain normal maximumurine-plasma hydrogen ion concentrationdifference.'Renal tubular acidosis'1 Acidotic (usually hyperchloraemic) unless on
alkali2 Urine pH 6-7-4 despite acidosis, variable
amounts of HCO3 in urine, reduced T.A.,normal or reduced NH,
3 Acidosis easily corrected by alkali4 No real evidence of reduced HCO3 threshold
(HCO3 infusions)5 No real evidence of reduced tubular ability to
secrete H+, except in face of H+ gradient(P04 infusions)
6 K-losing7 Little generalized renal failure
Found with obstruction; ? pyelonephritis;hypercalcaemia; with aminoaciduria ± glycosuria(Fanconi syndrome). Infantile renal tubularacidosis (Lightwood, Butler), late primary renaltubular acidosis (Albright, Elkinton)
GENERAL RENAL FAILURE
- m NH4CI
523
on February 12, 2022 by guest. P
rotected by copyright.http://jcp.bm
j.com/
J Clin P
athol: first published as 10.1136/jcp.18.4.491 on 1 July 1965. Dow
nloaded from
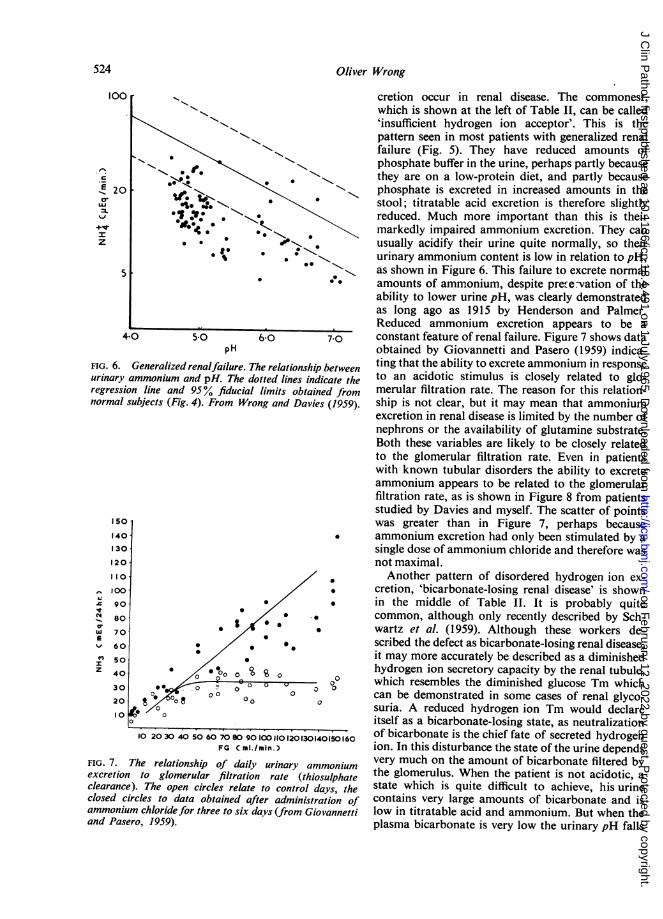
Oliver Wrong
5'
pH
FIG. 6. Generalized renalfailure. The relationship betweenurinary ammonium and pH. The dotted lines indicate theregression line and 95% fiducial limits obtained fromnormal subjects (Fig. 4). From Wrong and Davies (1959).
0
OstI/* v
0o0 U0
0 00 0C
00 0
FIG. 7. The relationship of daily urinary ammoniumexcretion to glomerular filtration rate (thiosulphateclearance). The open circles relate to control days, theclosed circles to data obtained after administration ofammonium chloride for three to six days (from Giovannettiand Pasero, 1959).
cretion occur in renal disease. The commonest,which is shown at the left of Table II, can be called'insufficient hydrogen ion acceptor'. This is thepattern seen in most patients with generalized renalfailure (Fig. 5). They have reduced amounts ofphosphate buffer in the urine, perhaps partly becausethey are on a low-protein diet, and partly becausephosphate is excreted in increased amounts in thestool; titratable acid excretion is therefore slightlyreduced. Much more important than this is theirmarkedly impaired ammonium excretion. They canusually acidify their urine quite normally, so theirurinary ammonium content is low in relation to pH,as shown in Figure 6. This failure to excrete normalamounts of ammonium, despite prefe-vation of theability to lower urine pH, was clearly demonstratedas long ago as 1915 by Henderson and Palmer.Reduced ammonium excretion appears to be aconstant feature of renal failure. Figure 7 shows dataobtained by Giovannetti and Pasero (1959) indica-ting that the ability to excrete ammonium in responseto an acidotic stimulus is closely related to glo-merular filtration rate. The reason for this relation-ship is not clear, but it may mean that ammoniumexcretion in renal disease is limited by the number ofnephrons or the availability of glutamine substrate.Both these variables are likely to be closely relatedto the glomerular filtration rate. Even in patientswith known tubular disorders the ability to excreteammonium appears to be related to the glomerularfiltration rate, as is shown in Figure 8 from patientsstudied by Davies and myself. The scatter of pointswas greater than in Figure 7, perhaps becauseammonium excretion had only been stimulated by asingle dose of ammonium chloride and therefore wasnot maximal.Another pattern of disordered hydrogen ion ex-
cretion, 'bicarbonate-losing renal disease' is shownin the middle of Table IT. It is probably quitecommon, although only recently described by Sch-wartz et al. (1959). Although these workers de-scribed the defect as bicarbonate-losing renal disease,it may more accurately be described as a diminishedhydrogen ion secretory capacity by the renal tubule,which resembles the diminished glucose Tm whichcan be demonstrated in some cases of renal glyco-suria. A reduced hydrogen ion Tm would declareitself as a bicarbonate-losing state, as neutralizationof bicarbonate is the chief fate of secreted hydrogenion. In this disturbance the state of the urine dependsvery much on the amount of bicarbonate filtered bythe glomerulus. When the patient is not acidotic, astate which is quite difficult to achieve, his urinecontains very large amounts of bicarbonate and islow in titratable acid and ammonium. But when theplasma bicarbonate is very low the urinary pH falls
524
100
E 200r
z
150
1401130
120
110.
100
90
80
70
60
50
40
30
20
10
Itz1
10
10 2030 40 50 60 7080 90100110120130140150160FG C ml./min.)
on February 12, 2022 by guest. P
rotected by copyright.http://jcp.bm
j.com/
J Clin P
athol: first published as 10.1136/jcp.18.4.491 on 1 July 1965. Dow
nloaded from
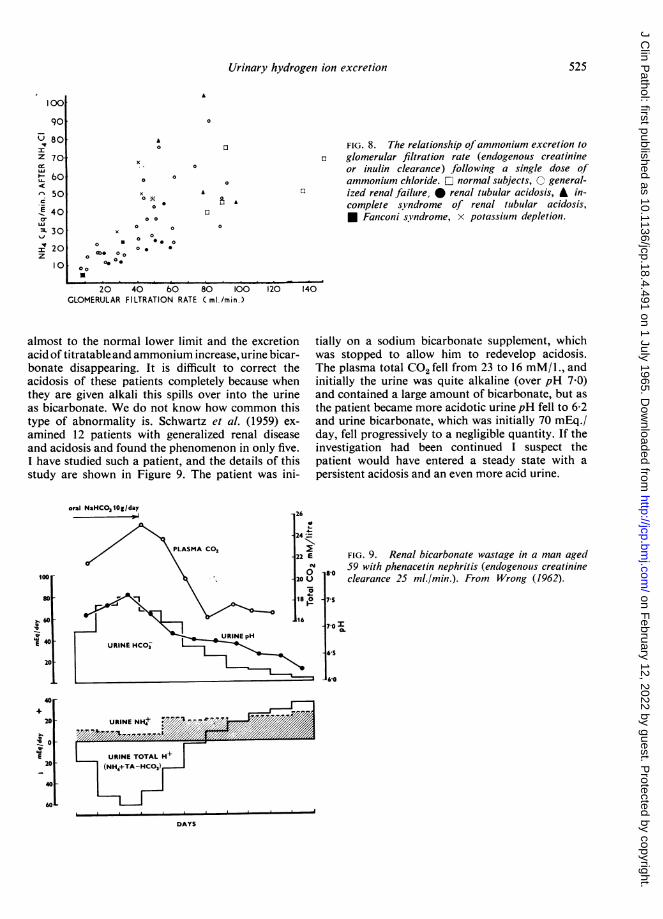
Urinary hydrogen ion excretion
A
0 0
x
00
00
0 * 0 000*O o
06 0 .
03 FIG. 8. The relationship ofammonium excretion toa glomerular filtration rate (endogenous creatinine
or inulin clearance) following a single dose ofammonium chloride. O normal subjects, C general-
0 ized renal failure, * renal tubular acidosis, A in-complete syndrome of renal tubular acidosis,* Faniconi syndrome, x potassium depletion.
A
20 40 bO 80 100 120GLOMERULAR FILTRATION RATE Cml./min.)
almost to the normal lower limit and the excretionacid of titratable and ammonium increase, urine bicar-bonate disappearing. It is difficult to correct theacidosis of these patients completely because whenthey are given alkali this spills over into the urineas bicarbonate. We do not know how common thistype of abnormality is. Schwartz et al. (1959) ex-
amined 12 patients with generalized renal diseaseand acidosis and found the phenomenon in only five.I have studied such a patient, and the details of thisstudy are shown in Figure 9. The patient was ini-
oral NaHCO3 1Og/day14
100
80
60
E 40
20
40
20
E20
40
60L
140
tially on a sodium bicarbonate supplement, whichwas stopped to allow him to redevelop acidosis.The plasma total CO2 fell from 23 to 16 mM/1., andinitially the urine was quite alkaline (over pH 7 0)and contained a large amount of bicarbonate, but as
the patient became more acidotic urine pH fell to 6-2and urine bicarbonate, which was initially 70 mEq./day, fell progressively to a negligible quantity. If theinvestigation had been continued I suspect thepatient would have entered a steady state with a
persistent acidosis and an even more acid urine.
8-0
FIG. 9. Renal bicarbonate wastage in a man aged59 with phenacetin nephritis (endogenous creatinineclearance 25 ml./min.). From Wrong (1962).
75
70 I
*S
6-0
URINE NH,+ F//.'NmXorUro 7///URINE TOTAL H+
(NH4+TA-HC03)
DAYS
100
90U 80Z 70
t b0
q 50
-E 40cT
=L 30
I 20z
I0X
525
8 A
I
on February 12, 2022 by guest. P
rotected by copyright.http://jcp.bm
j.com/
J Clin P
athol: first published as 10.1136/jcp.18.4.491 on 1 July 1965. Dow
nloaded from

The third abnormal pattern of- hydrogen ionexcretion is shown at the bottom of Table II. In thisthere is an abnormally high lower limit to urine pH.The tubules apparently cannot maintain the normalgradient of about 800 to 1 between tubular lumenand capillary blood, and the minimal urine pH isfixed somewhere between 6-0 and 70 in mostpatients. Although all renal acidosis is truly tubular,it is to this condition that the term 'renal tubularacidosis" is usually applied. Such patients areusually acidotic when first seen, and the acidosis isusually accompanied by hyperchloraemia. As judgedby nitrogen retention they have little renal failureand they do not therefore tend to retain anions suchas sulphate and phosphate. There are variableamounts of bicarbonate in the urine, as one wouldexpect from the urine pH (Fig. 2) and the titratableacidity is reduced: these two factors result in a lowexcretion of total hydrogen ion (NH4 + T.A.HCO3). The amount of ammonium in the urine isvariable; in some it is normal and in others it is low,depending apparently on the degree of generalizedrenal damage (Fig. 5). The acidosis is easily correctedby giving alkali, and if the filtered bicarbonate isincreased these patients can reabsorb normalamounts of it provided they can do so withoutlowering their urinary pH below its abnormallyhigh minimum. They can increase their total hydro-gen ion excretion if their urinary buffer content israised by an intravenous phosphate infusion, sothere does not seem to be any limitation on hydrogenion secretion except that they cannot achieve thenormal gradient of 800 to 1. These patients oftenlose potassium and may also develop osteomalacia.This type of disordered acid excretion may occurwith obstructive renal disease, in pyeloriephritis, orin hypercalcaemic renal damage. It may be found inassociation with amino-aciduria or glycosuria, inwhich case it is called the Fanconi syndrome. Ininfants it may be associated with histological nephro-calcinosis (Lightwood-Butler type of renal tubularacidosis), a type of renal disease which is rarely seennowadays and tended to disappear with advancingage. In older children and adults the functionalabnormality is often accompanied by gross radio-'The expression 'renal tubular acidosis' has been applied to manydifferent states. In its correct etymological sense the term can beapplied to all cases of renal acidosis, as pointed out by Schwartz andRelman (1957), for the tubules are entirely responsible for renalexcretion of hydrogen ion. In its most restricted sense the term hasbeen confined to patients with hyperchloraemic acidosis and aninappropriately high urine pH, in the absence of renal glycosuria oramino-aciduria
logical nephrocalcinosis (Albright type of renaltubular acidosis).The behaviour of these patients to ammonium
chloride is shown in the second part of Figure 5. Theurinary pH does not fall normally after this acidoticstimulus, and hence the excretion of titratable acidis reduced; some of these patients excrete ammoniumnormally, but in most it is slightly reduced.One of the chief values of a short ammonium test
is in uncovering undiagnosed cases of renal tubularacidosis in those who have the functional defect buthappen to have no acidosis when they are first seen.These patients may present with nephrocalcinosis ora potassium-losing renal lesion, yet the defect intotal hydrogen ion excretion may not be sufficientto give rise to acidosis although perfectly obviousafter the administration of ammonium chloride.Davies and I described three such patients in 1959and called the condition an 'incomplete form of renaltubular acidosis'. I have studied a further five suchpatients since then, all with nephrocalcinosis and twoof them with potassium depletion. Two of thesepatients have since spontaneously developed acidosiswhile under observation. It appears that thesepatients are at first prevented from developingacidosis by their efficient ammonium excretion, butthat this later fails as a result of general renal de-struction (perhaps on the basis of their renal calcifi-cation) and acidosis results. The cause of the renalcalcification in renal tubular acidosis is not certain,but there is some evidence that reduced citrate ex-cretion plays a part (Dedmon and Wrong, 1962).In some cases prolonged alkali administration hasbeen followed by disappearance or lessening of renalcalcification. The possible improvement in prognosiswith this treatment and the benefits to be obtainedby treating osteomalacia on potassium depletion arethe chief reasons for attempting to diagnose thisform of renal disease at an early stage.
REFERENCES
Dedmon, R. E., and Wrong, 0. (1962). Clin. Sci., 22, 19.Elkinton, J. R. (1963). Med. Clin. N. Amer., 47. 935.-, Huth, E. J., Webster, G. D. Jr., and McCance, R. A. (1960).
Amer. J. Med., 29, 554.Giovannetti, S., and Pasero. G. (1959). Minerva nefrol., 6, 119.Henderson, L. J., and Palmer, W. W. (1915). J. biol. Chem., 21, 37Pak Poy, R. K., and Wrong, 0. (1960). Clin. Sci., 19, 631.Schwartz, W. B., Hall, P. W., II1, Hays, R. M., and Relman, A. S.
(1959). J. clin. Invest., 38, 39.and Relman, A. S. (1957). New Engl. J. Med., 256, 1184.
Wrong, 0. M. (1962). Tests of renal function. In Renal Disease,edited by D. A. K. Black. pp. 440-460. Blackwell, Oxford.
--and Davies, H. E. F. (1959). Quart. J. Med., 28, 259.
Oliver Wrong526
on February 12, 2022 by guest. P
rotected by copyright.http://jcp.bm
j.com/
J Clin P
athol: first published as 10.1136/jcp.18.4.491 on 1 July 1965. Dow
nloaded from
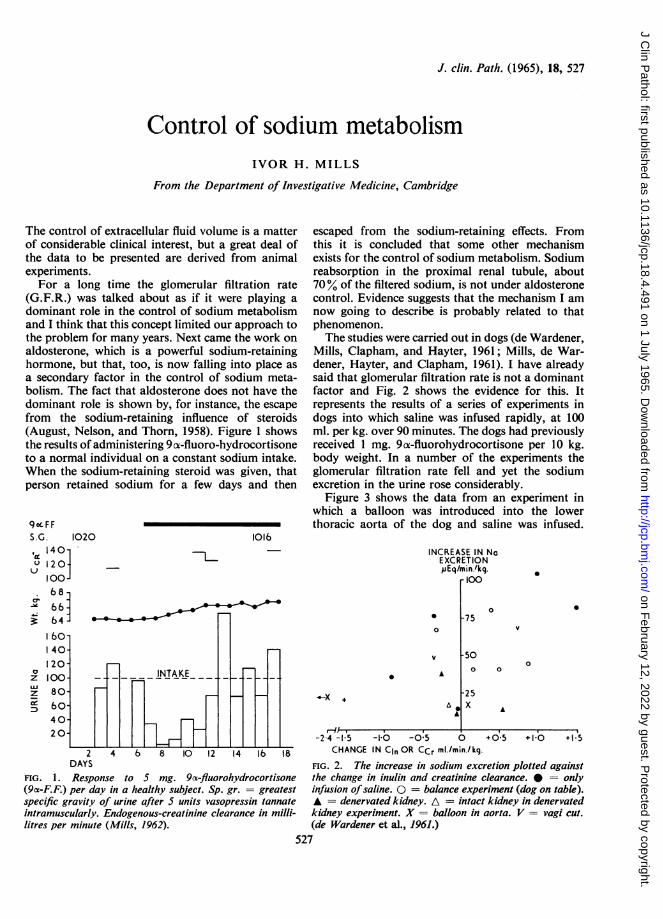
J. clin. Path. (1965), 18, 527
Control of sodium metabolismIVOR H. MILLS
From the Department of Investigative Medicine, Cambridge
The control of extracellular fluid volume is a matterof considerable clinical interest, but a great deal ofthe data to be presented are derived from animalexperiments.
For a long time the glomerular filtration rate(G.F.R.) was talked about as if it were playing adominant role in the control of sodium metabolismand I think that this concept limited our approach tothe problem for many years. Next came the work onaldosterone, which is a powerful sodium-retaininghormone, but that, too, is now falling into place asa secondary factor in the control of sodium meta-bolism. The fact that aldosterone does not have thedominant role is shown by, for instance, the escapefrom the sodium-retaining influence of steroids(August, Nelson, and Thorn, 1958). Figure 1 showsthe results of administering 9 ox-fluoro-hydrocortisoneto a normal individual on a constant sodium intake.When the sodium-retaining steroid was given, thatperson retained sodium for a few days and then
90o F FS.G. 1020,< 1401u 120
10068666460-I40-120-100-80-60-4020
1016
Th-
n INTAKE n n
I
escaped from the sodium-retaining effects. Fromthis it is concluded that some other mechanismexists for the control of sodium metabolism. Sodiumreabsorption in the proximal renal tubule, about70% of the filtered sodium, is not under aldosteronecontrol. Evidence suggests that the mechanism I amnow going to describe is probably related to thatphenomenon.The studies were carried out in dogs (de Wardener,
Mills, Clapham, and Hayter, 1961; Mills, de War-dener, Hayter, and Clapham, 1961). I have alreadysaid that glomerular filtration rate is not a dominantfactor and Fig. 2 shows the evidence for this. Itrepresents the results of a series of experiments indogs into which saline was infused rapidly, at 100ml. per kg. over 90 minutes. The dogs had previouslyreceived 1 mg. 9(x-fluorohydrocortisone per 10 kg.body weight. In a number of the experiments theglomerular filtration rate fell and yet the sodiumexcretion in the urine rose considerably.
Figure 3 shows the data from an experiment inwhich a balloon was introduced into the lowerthoracic aorta of the dog and saline was infused.
INCREASE IN NaEXCRETION,uEq/min./kg.
r 00
0
0
'F._L
2 4 6 8 10 12 14 lb 18DAYS
FIG. 1. Response to S mg. 9oc-fluorohydrocortisone(9ca-F.F.) per day in a healthy subject. Sp. gr. = greatestspecific gravity of urine after S units vasopressin tannateintramuscularly. Endogenous-creatinine clearance in milli-litres per minute (Mills, 1962).
A
X +
A
A~
-75
0
0
-500 0
-25X A
0
-2-4 -1I5 -1t0 -0 5 0 +0.5 +1 0 +1 5CHANGE IN Cln OR CCr mi./min./ kg.
FIG. 2. The increase in sodium excretion plotted againstthe change in inulin and creatinine clearance. 0 = onlyinfusion ofsaline. 0 = balance experiment (dog on table).A = denervated kidney. A = intact kidney in denervatedkidney experiment. X = balloon in aorta. V = vagi cut.
(de Wardener et al., 1961.)527
0
z
zcrl
HEi I I
s s 1 | l E X
" I 12.li!7.
on February 12, 2022 by guest. P
rotected by copyright.http://jcp.bm
j.com/
J Clin P
athol: first published as 10.1136/jcp.18.4.491 on 1 July 1965. Dow
nloaded from
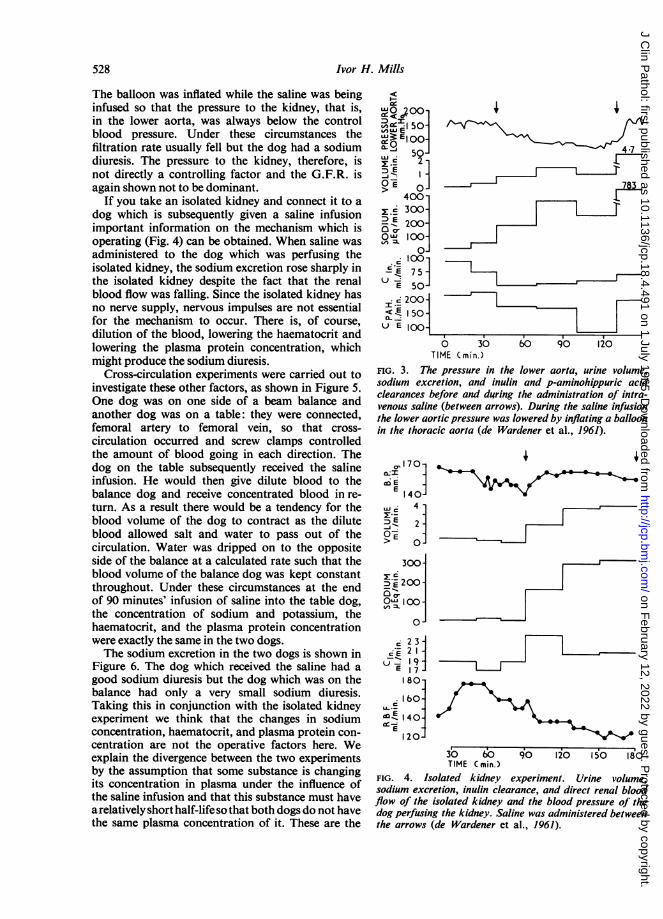
Ivor H. Mills
The balloon was inflated while the saline was beinginfused so that the pressure to the kidney, that is,in the lower aorta, was always below the controlblood pressure. Under these circumstances thefiltration rate usually fell but the dog had a sodiumdiuresis. The pressure to the kidney, therefore, isnot directly a controlling factor and the G.F.R. isagain shown not to be dominant.
If you take an isolated kidney and connect it to adog which is subsequently given a saline infusionimportant information on the mechanism which isoperating (Fig. 4) can be obtained. When saline wasadministered to the dog which was perfusing theisolated kidney, the sodium excretion rose sharply inthe isolated kidney despite the fact that the renalblood flow was falling. Since the isolated kidney hasno nerve supply, nervous impulses are not essentialfor the mechanism to occur. There is, of course,dilution of the blood, lowering the haematocrit andlowering the plasma protein concentration, whichmight produce the sodium diuresis.
Cross-circulation experiments were carried out toinvestigate these other factors, as shown in Figure 5.One dog was on one side of a beam balance andanother dog was on a table: they were connected,femoral artery to femoral vein, so that cross-circulation occurred and screw clamps controlledthe amount of blood going in each direction. Thedog on the table subsequently received the salineinfusion. He would then give dilute blood to thebalance dog and receive concentrated blood in re-turn. As a result there would be a tendency for theblood volume of the dog to contract as the diluteblood allowed salt and water to pass out of thecirculation. Water was dripped on to the oppositeside of the balance at a calculated rate such that theblood volume of the balance dog was kept constantthroughout. Under these circumstances at the endof 90 minutes' infusion of saline into the table dog,the concentration of sodium and potassium, thehaematocrit, and the plasma protein concentrationwere exactly the same in the two dogs.The sodium excretion in the two dogs is shown in
Figure 6. The dog which received the saline had agood sodium diuresis but the dog which was on thebalance had only a very small sodium diuresis.Taking this in conjunction with the isolated kidneyexperiment we think that the changes in sodiumconcentration, haematocrit, and plasma protein con-centration are not the operative factors here. Weexplain the divergence between the two experimentsby the assumption that some substance is changingits concentration in plasma under the influence ofthe saline infusion and that this substance must havea relatively short half-life so that both dogs do not havethe same plasma concentration of it. These are the
50-V)UJE1
,,, ., 50ss 2 -
> O4001s 300-
5E 200-° 1001
loE7 5 -
E 50-
I '- 200-
< E 150-U E 10 {-
0 30TIME (min.)
/ //~~~~~~~47
= ~~~~_783
IgI
60 90 120
FIG. 3. The pressure in the lower aorta, urine volume,sodium excretion, and inulin and p-aminohippuric acidclearances before and during the administration of intra-venous saline (between arrows). During the saline infusionthe lower aortic pressure was lowered by inflating a balloonin the thoracic aorta (de Wardener et al., 1961).
C, 170 -
1E 40-LLI 4E.
2j
> 0
300-
D E 200-
OQa I1001
80]
cE23
-
-- 19E 17
80-
160-,._
E 1401E l
20-30630 60 90 120 50 180
TIME ( min.)FIG. 4. Isolated kidney experiment. Urine volume,sodium excretion, inulin clearance, and direct renal bloodflow of the isolated kidney and the blood pressure of thedog perfusing the kidney. Saline was administered betweenthe arrows (de Wardener et al., 1961).
528
on February 12, 2022 by guest. P
rotected by copyright.http://jcp.bm
j.com/
J Clin P
athol: first published as 10.1136/jcp.18.4.491 on 1 July 1965. Dow
nloaded from

Control of sodium mzetabolisin
VP BP
PAH /INSULINVASOPRESSIN
VP
BP
SCREWCLAMPS I %u, \ VP CAPACITANCE
ARTERIAL Liii VENOUS MANOMETERCANNULA URINE CANNULA
characteristics of a hormone and it seems, therefore,that the sodium diuresis is produced by the changein concentration of a hormone. Whether it is asodium-retaining or sodium-excreting hormone can-not be concluded from these experiments.
In Fig. 7 is shown the relationship between therise in sodium excretion per minute per kilogram of
CROSS CIRCULATION
2 -
2:., 8 -
M E _
07- 4-
.1,000-I.
23E bOO-I0o -Ow 1- 1 200]
80-a IbvE0-IUl- J
E 40J300-
C, -4
<: E 2001U E 100-_
0 30 90 120 O50170TIME (min.)
FIG. 6. Cross circulation experiment. The urine volume,sodium excretion and clearances of creatinine and P.A.H.Saline was administered between arrows. = dog on
table receiving saline, = dog on balance. Tabledog = 15 kg.; Balance dog = 12 kg. (de Wardener et al.,1961).
_ _ w _ _ _ _ _ _ _~~~~~~~~~~~~~~~~~~~~~~_~~~~~~~~~~~~~~~~~~~~~~
I
;~~~~~~r.1 i 1
dog and the rise in venous pressure. Some of theanimals had an infusion of dextran in saline and thevenous pressure then rose much more. As thevenous pressure rose, less sodium was excreted.When 6% dextran in saline was infused, there was
virtually no increase in sodium excretion but thevenous pressure rose. It was never allowed to go
above 20 cm. This suggests the relationship thatoccurs in heart failure; the more severe the heartfailure, the higher the venous pressure, the less thesodium excretion. This may be of some importancefrom the point of view of trying to work out how themechanism operates.The efferent mechanism seems to be a circulating
hormone but the afferent or monitoring system is notshown in these experiments. Another series of ex-
periments has thrown light on this. We have dividedthe vagus, the depressor nerves which carry thebarorceptor impulses from the aortic arch and we
have cut the upper four thoracic sympathetic rami
120
L 90--i
.E
6o-UJ
> 30
06.0
*
2fI -
-1 0 5A VENOUS PRESSURE cm.
10 15 20
FIG. 7. The increase in sodium excretion plotted againstthe change in venous pressure (Mills et al., 1961).
529
SALINE -
INFUSION
FIG. 5. The arrangement ofthe dogs and apparatus in the'balance' experiments (deWardener et al., 1961).
1
*
on February 12, 2022 by guest. P
rotected by copyright.http://jcp.bm
j.com/
J Clin P
athol: first published as 10.1136/jcp.18.4.491 on 1 July 1965. Dow
nloaded from

Ivor H. Mills
which carry afferent impulses from inside the chest.We have also, as mentioned above, put a balloon inthe lower thoracic aorta. All these experiments,which interfere with the arterial side of the tree,have little effect on the sodium excretion and fromthem it is concluded that the arterial side is not themonitoring system. We have constricted the brachio-cephalic artery while saline is being infused, therebyreducing the cerebral blood flow. This also has noeffect upon the sodium excretion. Anything whichtends to raise venous pressure depresses sodiumoutput and does not increase it, and it seems mostlikely, therefore, that the systemic venous system isnot the monitoring system. This leaves thepulmonarycirculation: anything which interferes with the pul-monary circulation usually has a considerable effectupon the sodium diuresis. Davis, Hyatt, and Howell(1955) showed that constriction of the main pulmon-ary artery causes sodium retention. It seems mostprobable that the monitoring side of this system issomewhere in the pulmonary circulation. Where thehormone comes from we have no idea.The effect of changing the pH of the infusion of
saline and of differing depths of anaesthesia hasbeen studied (Mills, de Bono, Semple, and Robson,1965). In dogs which are relatively deeply anaes-thetized and have a high pCO2, the sodium excretionwas almost abolished, whereas in a few dogs whichwere hyperventilating and lowering their PCO2 agreater response than normal was recorded.The P value for the fitted regression line to these
SALINE INFUSION IOmI!min.110 ,
70
D 12 Left kidney2- Renal artery denervated
caIO0 Right kidney----
0.A
E 2-
FIG. 8
findings is very highly significant. If the PCO2 was30, then the average sodium excretion was 82,uEq.per minute per kilogram, but if the PCO2 rose to 60,then the sodium excretion was only 30 pEq. perminute per kilogram.The arterial pH can be influenced not only by
depth of anaesthesia but also by the pH of thesolution that we are infusing. With acidosis, thesodium excretion was almost abolished; withalkalosis, the sodium excretion was potentiated. Thissystem can be influenced by changing the PCO2 andthe arterial pH. This correlates well with the fact thatpatients with cor pulmonale retain salt and water.Although the blood pressure is not the main
factor controlling sodium excretion, it does influencethe response. In the experiment shown in Fig. 8,one renal artery was denervated, the other was not.The filtration rate was not greatly different in thetwo kidneys. A slow saline infusion was given(10 ml. a minute to a dog of 65 lb.). The sodiumexcretion rose much more rapidly in the denervatedkidney than it did on the side with the nerves intact.Data obtained by Gill, Mason, and Bartter (1964)
are shown in Figure 9. Saline was infused beforeand during the administration of guanethidine, andthe sodium excretion was much higher while guane-thidine was being given. However, the filtration raterose significantly when saline was infused andguanethidine given.
Bradykinin was infused into one renal artery byBarraclough and Mills (1965). This caused a sharp
NORMAL SALINE INFUSION
pOQO-> .800-
, 00-0200
.= 1 50-> El()Q0 Uc 50.1
501ZiE 00-
ci73: 5t)E o.475
-3 7 5-
0 20 40 6O 8O 100I20 140 1O60 80TIME (min.) o-o GUANETHIDINE
* CONTROLFIG. 9
FIG. 8. The sodium excretion and creatinine clearance from the left kidney (after denervation) and right kidney (nervesintact) during saline infusion.FIG. 9. Changes in sodium and potassium excretion and inulin and P.A.H. clearances before and during treatmentwith guanethidine. UNaV = sodium excretion. UP.A.H. = P.A.H. clearance (Gill et al., 1964).
530
on February 12, 2022 by guest. P
rotected by copyright.http://jcp.bm
j.com/
J Clin P
athol: first published as 10.1136/jcp.18.4.491 on 1 July 1965. Dow
nloaded from
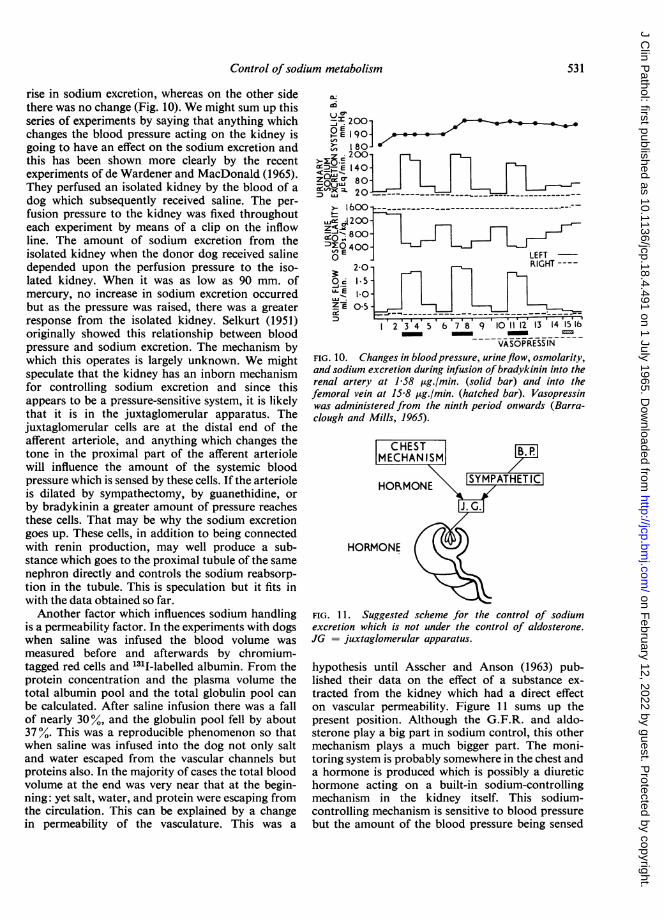
Control of sodium metabolism
rise in sodium excretion, whereas on the other sidethere was no change (Fig. 10). We might sum up thisseries of experiments by saying that anything whichchanges the blood pressure acting on the kidney isgoing to have an effect on the sodium excretion andthis has been shown more clearly by the recentexperiments of de Wardener and MacDonald (1965).They perfused an isolated kidney by the blood of adog which subsequently received saline. The per-fusion pressure to the kidney was fixed throughouteach experiment by means of a clip on the inflowline. The amount of sodium excretion from theisolated kidney when the donor dog received salinedepended upon the perfusion pressure to the iso-lated kidney. When it was as low as 90 mm. ofmercury, no increase in sodium excretion occurredbut as the pressure was raised, there was a greaterresponse from the isolated kidney. Selkurt (1951)originally showed this relationship between bloodpressure and sodium excretion. The mechanism bywhich this operates is largely unknown. We mightspeculate that the kidney has an inborn mechanismfor controlling sodium excretion and since thisappears to be a pressure-sensitive system, it is likelythat it is in the juxtaglomerular apparatus. Thejuxtaglomerular cells are at the distal end of theafferent arteriole, and anything which changes thetone in the proximal part of the afferent arteriolewill influence the amount of the systemic bloodpressure which is sensed by these cells. If the arterioleis dilated by sympathectomy, by guanethidine, orby bradykinin a greater amount of pressure reachesthese cells. That may be why the sodium excretiongoes up. These cells, in addition to being connectedwith renin production, may well produce a sub-stance which goes to the proximal tubule of the samenephron directly and controls the sodium reabsorp-tion in the tubule. This is speculation but it fits inwith the data obtained so far.Another factor which influences sodium handling
is a permeability factor. In the experiments with dogswhen saline was infused the blood volume wasmeasured before and afterwards by chromium-tagged red cells and 131I-labelled albumin. From theprotein concentration and the plasma volume thetotal albumin pool and the total globulin pool canbe calculated. After saline infusion there was a fallof nearly 30%, and the globulin pool fell by about37%. This was a reproducible phenomenon so thatwhen saline was infused into the dog not only saltand water escaped from the vascular channels butproteins also. In the majority of cases the total bloodvolume at the end was very near that at the begin-ning: yet salt, water, and protein were escaping fromthe circulation. This can be explained by a changein permeability of the vasculature. This was a
gliUc0:~'. 2001-
P E 1 90]
> l8O-
200
D-E 140-
c 80-
600 __ _ _ _ _ _ _ _ _ _ ___
F . n--
2 3 4 5 6 7 8 9 10 1112 13 14 ISIS- -~~~~~~~~~-
VASOPRESS INFIG. 10. Changes in bloodpressure, urineflow, osmolarity,and sodium excretion during infusion ofbradykinin into therenal artery at 1-58 pg./min. (solid bar) and into thefemoral vein at 15J8 ,ug./min. (hatched bar). Vasopressinwas administered from the ninth period onwards (Barra-clough and Mills, 1965).
C HESTMECHAN ISI
NHORMONE
HORMONE
FIG. 1l. Suggested scheme for the control of sodiumexcretion which is not under the control of aldosterone.JG = juxtaglomerular apparatus.
hypothesis until Asscher and Anson (1963) pub-lished their data on the effect of a substance ex-tracted from the kidney which had a direct effecton vascular permeability. Figure 11 sums up thepresent position. Although the G.F.R. and aldo-sterone play a big part in sodium control, this othermechanism plays a much bigger part. The moni-toring system is probably somewhere in the chest anda hormone is produced which is possibly a diuretichormone acting on a built-in sodium-controllingmechanism in the kidney itself. This sodium-controlling mechanism is sensitive to blood pressurebut the amount of the blood pressure being sensed
531
on February 12, 2022 by guest. P
rotected by copyright.http://jcp.bm
j.com/
J Clin P
athol: first published as 10.1136/jcp.18.4.491 on 1 July 1965. Dow
nloaded from
532 Ivor H. Mills
by the kidney is going to be influenced by the toneon the afferent arteriole. This mechanism is influ-enced by pH and pCO9. Sodium control is a verycomplex process, and it is perhaps not surprising,therefore, that patients with oedema fall into manydifferent categories.
REFERENCES
Asscher, A. W., and Anson, S. G. (1963). Nature (Lond.), 198, 1097.August, J. T., Nelson, D. H., and Thorn, G. W. (1958). J. clin. Invest.,
37, 1549.
Barraclough, M. A., and Mills, I. H. (1965). Clin. Sci., 28, 69.Davis, J. O., Hyatt, R. E., and Howell, D. S. (1955). Circulat. Res., 3,
252.de Wardener, H. E., and McDonald, S. J. (1965). J. Endocr., 32, in
the press.Mills, I. H., Clapham, W. F., and Hayter, C. J. (1961). ClinSci., 21, 249.
Gill, J. R. Jr., Mason, D. T., and Bartter, F. C. (1964). J. clin. Inrcst.,43, 177.
Mills, T. H., de Wardener, H. E., Hayter, C. J., and Clapham, W. F.(1961). Clin. Sci., 21, 259.de Bono, E. F., Semple, S. J. G., and Robson, Ann E. (1965). Inpreparation.
Selkurt, E. E. (1951). Circulation, 4, 541.
on February 12, 2022 by guest. P
rotected by copyright.http://jcp.bm
j.com/
J Clin P
athol: first published as 10.1136/jcp.18.4.491 on 1 July 1965. Dow
nloaded from
J. clin. Path. (1965), 18, 533
Cellular mode of action of antidiuretic hormone1JACK ORLOFF AND JOSEPH S. HANDLER
From the Laboratory of Kidney and Electrolyte Metabolism, National Heart Institute,Bethesda, Maryland, U.S.A.
The role of antidiuretic hormone in the regulation ofwater balance in the mammal is now generallyappreciated. Water conservation is effected by avasopressin-induced reduction in urine flow and anincrease in urine osmolality. These effects and theosmotic nature of the stimulus for the release ofantidiuretic hormone from the pituitary were clearlydefined by Verney in the 1940s (Verney, 1947).Subsequent to these studies, Smith and associates(Smith, 1951; Wesson and Anslow, 1952) proposedthat vasopressin reduces urine flow by increasing thepermeability of the distal nephron to water, therebypermitting osmotic flow of water into the sur-rounding renal interstitium. The mechanism of theelaboration of urine more concentrated thanplasma, not understood at the time, has since beenclarified by Wirz, Hargitay, and Kuhn (1951). Theirthesis, together with the extensive contributions ofGottschalk (1961), Ullrich, Kramer, and Boylan(1961), Berliner, Levinsky, Davidson, and Eden(1958), has been discussed elsewhere. The presentpaper will be concerned with a summary of thecurrent knowledge of the cellular mode of action ofantidiuretic hormone in the renal tubule and respon-sive amphibian epithelial structures: skin and urinarybladder.For the purposes of this discussion, vasopressin
will serve as the prototype for all the neurohypo-physeal hormones, including oxytocin. Although therenal tubule in man is considerably more responsiveto arginine vasopressin, the naturally occurringantidiuretic hormone, and is virtually unresponsiveto oxytocin, the amphibian bladder and skin areless discriminating and respond to many of theoctapeptide analogues (Sawyer, 1961; Rasmussen,Schwartz, Young, and Marc-Aurele, 1963). Thequantitative differences in potency which do existare of no consequence to the current discussion. Thereader interested in a detailed analysis of thestructural requirements for hormone action, whichwill not be discussed in this paper, as well as in thewealth of information concerning the nature of thespecies-specific cctapeptides, is referred to the'Reprinted from The American Journal of Medicine by permission ofthe Editor and Publishers, 466 Lexington Avenue, New York, N.Y.
excellent reviews by Sawyer (1961) and Boissonnas,Guttmann, Berde, and Konzett (1961).
EFFECT OF ANTIDIURETIC HORMONEON PERMEABILITY TO WATER
The view that vasopressin increases the permeabilityof the distal nephron to water derives mainly fromstudies utilizing amphibian skin and bladder. Muchof the early information stems from the work ofUssing and his collaborators (1960) on amphibianskin. Their conclusions concerning the action ofvasopressin have been confirmed and extended inrecent years by Bentley (1958; 1960), Sawyer (1961),and Leaf (1960) on the basis of similar studieson amphibian bladder. Although the two tissuesdiffer anatomically, in that amphibian skin is amultilayered epithelial structure containing severalcell types whereas toad bladder is thought tobe composed of a single layer of relatively uniformepithelial cells, they may be considered to be similarfrom a functional standpoint. In fact, a model forfrog skin proposed by Keofoed-Johnsen and Ussing(1958) is sufficiently general to serve as a prototypefor both the simpler bladder and the more complexdistal tubule, and will be so considered in thisreview.The maintenance of the steady state concentration
of electrolytes and other constituents within theinterior of all living cells is dependent upon theprecise relationship between diffusional processeswhich tend to eliminate the concentration gradientbetween cells and their environment, and activetransport systems which oppose this tendency. Theepithelial cells of skin, bladder, and tubule, althoughsimilar to non-secretory cells in this regard, inaddition have the capacity to transfer sodiumchloride and water across the entire tissue. There-fore, unlike the red cell, for example, they are notsurrounded by a homogeneous or uniform plasmamembrane, but instead possess at the very least twodistinct diffusion barriers, one at each surface. Anouter barrier separates the cell interior from theoutside environment, which is the air or the pond inthe case of skin, and urine in the case of bladder and
533
on February 12, 2022 by guest. P
rotected by copyright.http://jcp.bm
j.com/
J Clin P
athol: first published as 10.1136/jcp.18.4.491 on 1 July 1965. Dow
nloaded from

Jack Orloff and Joseph S. Handler
tubule. The inner barrier, which is analogous to theplasma membrane of non-secretory cells, separatesthe cell interior from the extracellular fluid. Thediffering properties of these membranous barriersprovide the cell with a mechanism both for themaintenance of the steady state concentration ofintracellular constituents and for the net transfer ofsalt and water across the tissue.
Perhaps the first observation that posteriorpituitary hormones affect the rate of movement ofwater across a tissue was made by Brunn in 1921.He reported that an injection of posterior pituitaryextract given to the intact frog resulted in a markedacceleration of water uptake through the skin. Thephenomenon was subsequently re-examined indetail by Ussing and his co-workers (1960), whosystematically studied the physiological character-istics of isolated amphibian skin. Utilizing atechnique in which a segment of skin is supportedbetween two halves of a chamber containing appro-priate solutions, they demonstrated unequivocallythat the addition of neurohypophyseal hormone tothe solution bathing the inner or blood surface ofisolated skin elicits two characteristic responses:(1) an increase in the permeability to water, asmanifested by an acceleration in the net flow ofwater along an osmotic gradient, and (2) an increasein the net inward transport of sodium. Similarobservations have been made in amphibian bladder(Bentley, 1958 and 1960; Leaf, 1960; Sawyer, 1961;Orloff and Handler, 1962).The augmentation in water movement afforded by
vasopressin is illustrated in Table 1. In this study theisolated toad bladder sac was used according to themethod of Bentley (1958). After removal from the
TABLE INET FLOW OF WATER SIMULTANEOUSLY IN SACS A AND B
Solution Flow (gl./min.)
Sac ARinger's 0-8Vasopressin (100 mU./ml.) 18-0Ringer's 0-5
Sac BRinger's 0-6Insulin (1 unit/ml.) 0-3Ringer's 0 7
Outer solution 40 mOsm., per kg. H2O (urine side). Inner solution200 mOsm. per kg. H20 (blood side). Hormone added to innersolution only.
toad, the bilobed bladder is divided into two sacs,into each of which dilute Ringer's solution isintroduced. In order to examine water flow along anosmotic gradient, the sac is inserted into a beakercontaining isotonic Ringer's solution. Net watermovement along the osmotic gradient is thenestimated by measuring the weight loss of the sac at
appropriate intervals. In the control period, whenno hormone is present, net water movement isnegligible despite the osmotic gradient. In contrast,the addition of vasopressin to the solution bathingthe blood surface of the bladder results in a rapidincrease in the net flow of water. The effect isreversible, and is not elicited by addition of vaso-pressin to the urinary surface of the tissue. Thesechanges are analogous to those observed in skin andare presumed to be similar to those elicited by thehormone in both the distal convolution and collect-ing duct of the renal tubule.The mechanism of the increase in osmotic
permeability has been extensively investigated byKoefoed-Johnsen and Ussing (1953) by Hays andLeaf (1962), and by Leaf and Hays (1962). Koefed-Johnsen and Ussing (1953) measured the diffusionalpermeability of frog skin to water with D20 andobserved that the simultaneously determined netflow along an osmotic gradient in the presence ofantidiuretic hormone was considerably greater thanthat predicted were water moving by diffusion aloneacross the tissue. A similar discrepancy betweenpredicted diffusional net flow and the observedosmotic net flow without hormone in the intact froghad been reported by Hevesy, Hofer. and Krogh(1935). This was difficult to explain on the basis ofthe information available at the time. It had beenassumed that water crosses living membranes byrandom movement of the particles, that is by simplediffusion, in accordance with Fick's law. Con-sequently, it was expected that the unidirectionalflux of water would be proportional to the activityof water on the side of origin and the opposing fluxacross the membrane would be proportional to theactivity of water on that side, and therefore that theratio of the two fluxes would be equal to the ratio ofthe corresponding activities. The experimentalobservations are not consistent with this prediction,since the flux ratio for water greatly exceeds theactivity ratio. Thus, as already indicated, theobserved net movement of water along an osmoticgradient is considerably greater than that calculatedon the basis of free diffusion from the observedunidirectional flux and the known activities of wateron both sides of the membrane. Hays and Leaf (1962)subsequently excluded the possible involvement ofan active transport system for water to account forthe discrepant finding. They noted that net flow ofwater across the toad bladder was directly pro-portional to the imposed osmotic gradient, indica-tive of the passive nature of the process. Keofoed-Johnsen and Ussing (1953) concluded, as did Haysand Leaf (1962), that the assumption of randomdiffusional movement as the mechanism of osmoticflow of water across the skin and bladder is in-
534
on February 12, 2022 by guest. P
rotected by copyright.http://jcp.bm
j.com/
J Clin P
athol: first published as 10.1136/jcp.18.4.491 on 1 July 1965. Dow
nloaded from
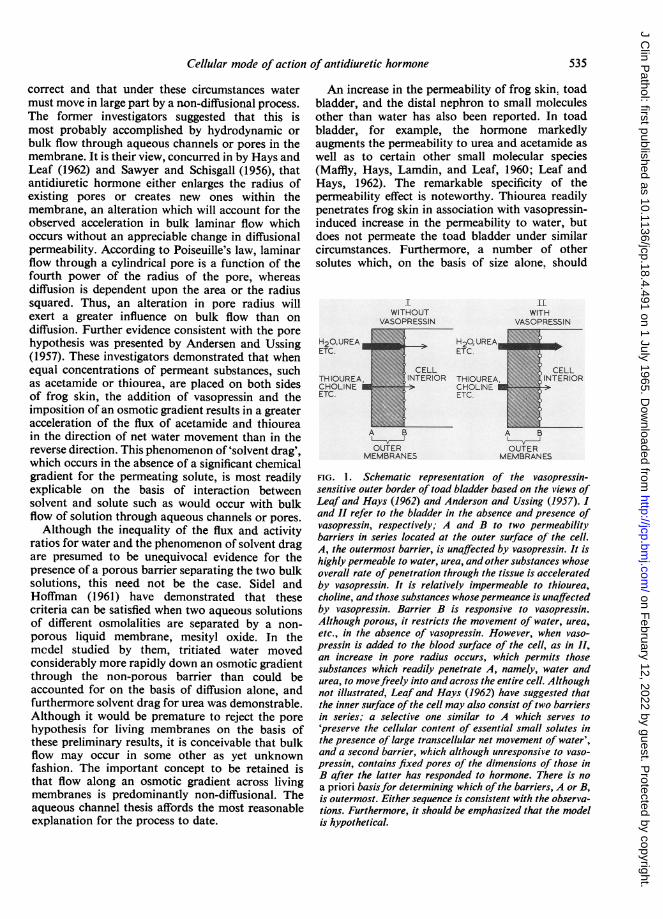
Cellular mode of action of antidiuretic hormone
correct and that under these circumstances watermust move in large part by a non-diffusional process.The former investigators suggested that this ismost probably accomplished by hydrodynamic orbulk flow through aqueous channels or pores in themembrane. It is their view, concurred in by Hays andLeaf (1962) and Sawyer and Schisgall (1956), thatantidiuretic hormone either enlarges the radius ofexisting pores or creates new ones within themembrane, an alteration which will account for theobserved acceleration in bulk laminar flow whichoccurs without an appreciable change in diffusionalpermeability. According to Poiseuille's law, laminarflow through a cylindrical pore is a function of thefourth power of the radius of the pore, whereasdiffusion is dependent upon the area or the radiussquared. Thus, an alteration in pore radius willexert a greater influence on bulk flow than ondiffusion. Further evidence consistent with the porehypothesis was presented by Andersen and Ussing(1957). These investigators demonstrated that whenequal concentrations of permeant substances, suchas acetamide or thiourea, are placed on both sidesof frog skin, the addition of vasopressin and theimposition of an osmotic gradient results in a greateracceleration of the flux of acetamide and thioureain the direction of net water movement than in thereverse direction. This phenomenon of 'solvent drag',which occurs in the absence of a significant chemicalgradient for the permeating solute, is most readilyexplicable on the basis of interaction betweensolvent and solute such as would occur with bulkflow of solution through aqueous channels or pores.Although the inequality of the flux and activity
ratios for water and the phenomenon of solvent dragare presumed to be unequivocal evidence for thepresence of a porous barrier separating the two bulksolutions, this need not be the case. Sidel andHoffman (1961) have demonstrated that thesecriteria can be satisfied when two aqueous solutionsof different osmolalities are separated by a non-porous liquid membrane, mesityl oxide. In themcdel studied by them, tritiated water movedconsiderably more rapidly down an osmotic gradientthrough the non-porous barrier than could beaccounted for on the basis of diffusion alone, andfurthermore solvent drag for urea was demonstrable.Although it would be premature to reject the porehypothesis for living membranes on the basis ofthese preliminary results, it is conceivable that bulkflow may occur in some other as yet unknownfashion. The important concept to be retained isthat flow along an osmotic gradient across livingmembranes is predominantly non-diffusional. Theaqueous channel thesis affords the most reasonableexplanation for the process to date.
An increase in the permeability of frog skin. toadbladder, and the distal nephron to small moleculesother than water has also been reported. In toadbladder, for example, the hormone markedlyaugments the permeability to urea and acetamide aswell as to certain other small molecular species(Maffly, Hays, Lamdin, and Leaf, 1960; Leaf andHays, 1962). The remarkable specificity of thepermeability effect is noteworthy. Thiourea readilypenetrates frog skin in association with vasopressin-induced increase in the permeability to water, butdoes not permeate the toad bladder under similarcircumstances. Furthermore, a number of othersolutes which, on the basis of size alone, should
WI THOUT
H20,UREA IETC.
THIOUREA,CHOLINE IETC.
H 2O, UREAETC.
R THIOUREACHOLINEETC.
. 0
OUTERMEMBRANES
LlWITH
VASOPRESSIN
CELL
k INT ERIOR
A B
OUTERMEMBRANES
FIG. 1. Schematic representation of the vasopressin-sensitive outer border of toad bladder based on the views ofLeaf and Hays (1962) and Anderson and Ussing (1957). 1and II refer to the bladder in the absence and presence ofvasopressin, respectively; A and B to two permeabilitybarriers in series located at the outer surface of the cell.A, the outermost barrier, is unaffected by vasopressin. It ishighly permeable to water, urea, and other substances whoseoverall rate ofpenetration through the tissue is acceleratedby vasopressin. It is relatively impermeable to thiourea,choline, and those substances whosepermeance is unaffectedby vasopressin. Barrier B is responsive to vasopressin.Although porous, it restricts the movement of water, urea,etc., in the absence of vasopressin. However, when vaso-pressin is added to the blood surface of the cell, as in II,an increase in pore radius occurs, which permits thosesubstances which readily penetrate A, namely, water andurea, to movefreely into and across the entire cell. Althoughnot illustrated, Leaf and Hays (1962) have suggested thatthe inner surface of the cell may also consist oftwo barriersin series; a selective one similar to A which serves to'preserve the cellular content of essential small solutes inthe presence of large transcellular net movement of water',and a second barrier, which although unresponsive to vaso-pressin, contains fixed pores of the dimensions of those inB after the latter has responded to hormone. There is noa priori basisfor determining which ofthe barriers, A or B,is outermost. Either sequence is consistent with the observa-tions. Furthermore, it should be emphasized that the modelis hypothetical.
535
on February 12, 2022 by guest. P
rotected by copyright.http://jcp.bm
j.com/
J Clin P
athol: first published as 10.1136/jcp.18.4.491 on 1 July 1965. Dow
nloaded from
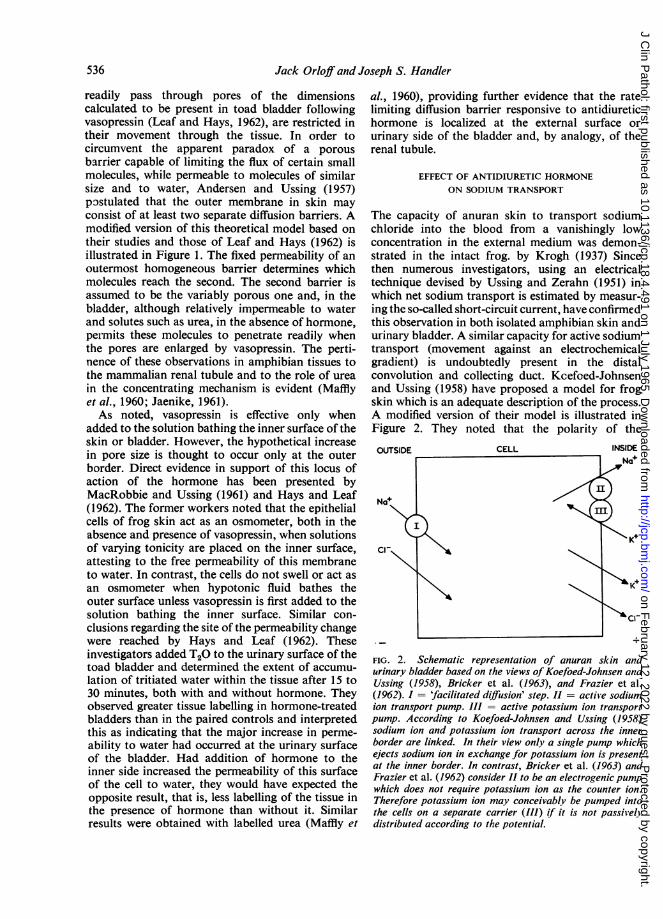
Jack Orloff and Joseph S. Handler
readily pass through pores of the dimensionscalculated to be present in toad bladder followingvasopressin (Leaf and Hays, 1962), are restricted intheir movement through the tissue. In order tocircumvent the apparent paradox of a porousbarrier capable of limiting the flux of certain smallmolecules, while permeable to molecules of similarsize and to water, Andersen and Ussing (1957)postulated that the outer membrane in skin mayconsist of at least two separate diffusion barriers. Amodified version of this theoretical model based ontheir studies and those of Leaf and Hays (1962) isillustrated in Figure 1. The fixed permeability of anoutermost homogeneous barrier determines whichmolecules reach the second. The second barrier isassumed to be the variably porous one and, in thebladder, although relatively impermeable to waterand solutes such as urea, in the absence of hormone,peimits these molecules to penetrate readily whenthe pores are enlarged by vasopressin. The perti-nence of these observations in amphibian tissues tothe mammalian renal tubule and to the role of ureain the concentrating mechanism is evident (Mafflyet al., 1960; Jaenike, 1961).As noted, vasopressin is effective only when
added to the solution bathing the inner surface of theskin or bladder. However, the hypothetical increasein pore size is thought to occur only at the outerborder. Direct evidence in support of this locus ofaction of the hormone has been presented byMacRobbie and Ussing (1961) and Hays and Leaf(1962). The former workers noted that the epithelialcells of frog skin act as an osmometer, both in theabsence and presence of vasopressin, when solutionsof varying tonicity are placed on the inner surface,attesting to the free permeability of this membraneto water. In contrast, the cells do not swell or act asan osmometer when hypotonic fluid bathes theouter surface unless vasopressin is first added to thesolution bathing the inner surface. Similar con-clusions regarding the site of the permeability changewere reached by Hays and Leaf (1962). Theseinvestigators added T20 to the urinary surface of thetoad bladder and determined the extent of accumu-lation of tritiated water within the tissue after 15 to30 minutes, both with and without hormone. Theyobserved greater tissue labelling in hormone-treatedbladders than in the paired controls and interpretedthis as indicating that the major increase in perme-ability to water had occurred at the urinary surfaceof the bladder. Had addition of hormone to theinner side increased the permeability of this surfaceof the cell to water, they would have expected theopposite result, that is, less labelling of the tissue inthe presence of hormone than without it. Similarresults were obtained with labelled urea (Maffly et
al., 1960), providing further evidence that the ratelimiting diffusion barrier responsive to antidiuretichormone is localized at the external surface orurinary side of the bladder and, by analogy, of therenal tubule.
EFFECT OF ANTIDIURETIC HORMONEON SODIUM TRANSPORT
The capacity of anuran skin to transport sodiumchloride into the blood from a vanishingly lowconcentration in the external medium was demon-strated in the intact frog. by Krogh (1937) Sincethen numerous investigators, using an electricaltechnique devised by Ussing and Zerahn (1951) inwhich net sodium transport is estimated by measur-ing the so-called short-circuit current, have confirmedthis observation in both isolated amphibian skin andurinary bladder. A similar capacity for active sodiumtransport (movement against an electrochemicalgradient) is undoubtedly present in the distalconvolution and collecting duct. Kcefoed-Johnsenand Ussing (1958) have proposed a model for frogskin which is an adequate description of the process.A modified version of their model is illustrated inFigure 2. They noted that the polarity of the
OUTSIDE CELL INSIDE
FIG. 2. Schematic representation of anuran skin andurinary bladder based on the views ofKoefoed-Johnsen andUssing (1958), Bricker et al. (1963), and Frazier et al.(1962). I = 'facilitated diffusion' step. II = active sodiumion transport pump. III = active potassium ion transportpump. According to Koefoed-Johnsen and Ussing (1958)sodium ion and potassium ion transport across the innerborder are linked. In their view only a single pump whichejects sodium ion in exchange for potassium ion is presentat the inner border. In contrast, Bricker et al. (1963) andFrazier et al. (1962) consider II to be an electrogenic pumpwhich does not require potassium ion as the counter ion.Therefore potassium ion may conceivably be pumped intothe cells on a separate carrier (III) if it is not passivelydistributed according to the potential.
536
on February 12, 2022 by guest. P
rotected by copyright.http://jcp.bm
j.com/
J Clin P
athol: first published as 10.1136/jcp.18.4.491 on 1 July 1965. Dow
nloaded from
Cellular mode of action of antidiuretic hormonie
electrical potential across skin (subsequently foundto be similar in bladder and tubule) is such that theblood surface is positive with respect to the externalenvironment. Furthermore, the external membraneis freely permeable to sodium but not to potassium,whereas the reverse is true for the inner membrane.In their view, the potential difference across theskin is the sum of two diffusion potentials, the onefor sodium across the outer surface and the otherfor potassium across the inner surface of the cell.They have postulated that the active transportpump necessary to account for the uphill move-ment of sodium ion into the extracellular fluid islocalized in or near the inner membrane and is anelectrically neutral system which ejects sodium ionfrom the cell only in exchange for potassium ion.Recently, Bricker, Biber, and Ussing (1963) andFrazier and Leaf (1963) have challenged this concept.They have suggested that the pump is electrogenicand therefore capable of transporting sodiumactively across the membrane without the inter-position of potassium ion as a counter ion. Althoughthe validity of their conclusion is not established,the consequences of their hypothesis with respectto vasopressin action do not differ appreciably fromthat of Koefoed-Johnsen and Ussing (1958).According to the last authors, net sodium iontransport is accomplished by the passive penetrationof sodium ion down its electrochemical gradient intothe cell and its subsequent ejection by the pumpacross the inner border. The accompanying anion,chloride, is thought to move passively through theentire tissue. Similar considerations apply to toadbladder and perhaps to renal tubule, although thesituation is considerably more complex in the lattertissue.As noted earlier, vasopressin characteristically
increases the rate of net sodium ion transport acrossamphibian skin and urinary bladder. A similareffect has not been demonstrated unequivocally inthe renal tubule, although Jard and Morel (1963)consider that this may occur in Rana esculenta. Thehormone, on the basis of the model illustrated inFig. 2, could stimulate sodium ion transport byacting at either of two sites. It could accelerate nettransport (1) by directly stimulating the activetransport pump, or (2) by permitting more rapidentry of sodium ion into the cell by increasing thepermeability to sodium ion of the outward facingborder. In the latter case the delivery of more sodiumion to an unsaturated pump would result in anacceleration of net transport. Ussing (Ussing et al.,1960) considers that the first possibility has beenexcluded in frog skin on the basis of electricalmeasurements in which the so-called driving forcefor sodium ion was found to be unaltered by hormone
despite the augmentation in net flux, whereas theinternal resistance to sodium ion fell markedly(Ussing and Zerahn, 1951). He concluded that vaso-pressin must affect the permeability of the outerborder to sodium ion. This unitary hypothesislimits the site of action of vasopressin to the outerborder wherein an increase in pore size alone couldconceivably account for the characteristic alterationin water, urea, and sodium ion movement. However,the necessity for postulating a path for the pene-tration of sodium ion through the outer border,distinct from the aqueous channels through whichwater and non-electrolytes move, is evident fromthe studies of Frazier, Dempsey, and Leaf (1962).In agreement with Ussing, they consider the rate-limiting step in sodium ion transport to be thepenetration of sodium ion through the outer border.However, this penetration, although down anelectrochemical gradient and therefore passive,appears to have, in toad bladder, at least one of thecharacteristics of a carrier-mediated process. Thus,they have shown that the process is saturable withrespect to sodium ion penetration both in thepresence and absence of antidiuretic hormone. It isapparent that a simple increase in the size of aqueouschannels, while sufficient to account for the alter-ations in water and urea movement, may not beadequate to account for the accelerated penetrationof sodium ion through the same border. It isconceivable that the hormone has a separate effecton a carrier system at the outer surface which movessodium ion down its electrochemical gradient intothe cell through a path distinct from that followedby water and urea. More recently Frazier andHammer (1963) have offered further support for theview that vasopressin affects the rate of penetrationof sodium ion across the outer border of the cell,and does not stimulate the inner membrane pump.They reported that vasopressin increased the rate ofwashout of isotopic sodium ion from pre-labelledtoad bladder only across the outer border. Theabsence of augmentation in the rate of washout ofisotopic sodium across the inner border in theirstudies appears to exclude an effect of the hormoneon the energy-requiring active transport step.
Despite this evidence, the situation is still unsettled,and a number of investigators subscribe to the viewthat 'things are not so simple' (Orloff and Handler,1964). The experiments are difficult to perform, andthe inherent variability in the responsiveness of thesetissues to experimental manipulations requirescaution before final acceptance of the results andconclusions of any of the studies. Bourguet andMaetz (1961), for example, have questioned theobservations of Ussing and Zerahn (1951) regardingthe absence of an effect of vasopressin on the active
537
on February 12, 2022 by guest. P
rotected by copyright.http://jcp.bm
j.com/
J Clin P
athol: first published as 10.1136/jcp.18.4.491 on 1 July 1965. Dow
nloaded from

Jack Orloff and Joseph S. Handler
sodium ion transport pump. In contrast, they reportan increase in the driving force for sodium ion infrog skin in response to neurohypophyseal hormone,evidence which they consider consistent with a directstimulatory effect of the hormone on the sodium ionpump. They have also stated that certain analoguesof vasopressin, although yielding equal effects onwater movement across frog skin, have unequaleffects on net sodium ion transport. Bourguet andMaetz (1961) consider these observations consistentwith two effects of the hormone, one on water andthe other on the activation of the inner transportpump. This is not necessarily correct since similarresults would occur were the hormone to affect thefacilitated diffusion step separately rather than theactive transport process. In any event the results oftheir studies are somewhat equivocal since measure-ments of sodium ion and water movement were notmade simultaneously or in the same tissues.A definite separation of the effects of the
hormone on sodium ion and water movement in toadbladder can be elicited by increasing the concen-tration of calcium in the inner bathing solution. Asfirst reported by Bentley (1959), this manipulationprevents the increase in permeability to waterproduced by the hormone, but does not interferewith the stimulation of sodium ion transport. Theseresults have been confirmed and extended byPetersen and Edelman (1963), who in additionobserved that elevation of the calcium concentrationin the bathing medium does not separate the effectson sodium and water movement of another agentwhich mimics antidiuretic hormone in toad bladder,namely, adenosine 3',5'-monophosphate. Theyconcluded that vasopressin has two independenteffects, one on sodium ion and the other on water,a view which also requires two separate sites ofaction of the polypeptide.
It is of importance to note that the increase inwater permeability produced by the hormone is notdependent upon the presence of sodium in the inneror outer bathing solution. Substitution of cholinefor sodium does not eliminate the water permeabilityeffect of the hormone in toad bladder, although it issomewhat attenuated. The absence of potassium ionin the inner bathing solution (Bentley, 1959) alsodissociates the effect of vasopressin on sodium andwater movement. Removal of potassium ion virtuallyeliminates both basal sodium ion transport and itsacceleration by vasopressin. Whether this is indica-tive ofan obligatory requirement ofthe active sodiumion transport pump for potassium ion, or is aconsequence of a potassium ion mediated decreasein the permeability of the outer facing border tosodium ion, which would limit its transcellularpenetration, as suggested by Essig and Leaf (1963),
is not yet established. In contrast to the effect onsodium transport, potassium ion removal does noteliminate the water permeability response to vaso-pressin in toad bladder (Hays and Leaf, 1961; Finnand Orloff, unpublished observations), at a timewhen no stimulation in short circuit current isobservable. Similarly, cardiac glycosides, althoughthey interfere with the capacity of the membrane totransport sodium ion (MacRobbie and Ussing, 1961;Finn and Orloff, unpublished observations), bothwith and without hormone, presumably owing tospecific inhibition of the active transport system, donot diminish the vasopressin-induced augmentationin net water flow.The functional significance of the acceleration in
sodium ion transport elicited by vasopressin acrossamphibian skin and bladder is reasonably clear inthat it may serve a role in sodium ion conservation.An increase in the renal tubular reabsorption ofsodium ion in Rana esculenta following hormoneinjection has been reported on the basis of clearancemeasurements by Jard and Morel (1963). Similareffects of the hormone on tubular transport have notbeen observed in other amphibian species, nor isthere any direct evidence that vasopressin enhancessodium ion reabsorption in the mammalian kidney.Were an increase in sodium ion reabsorption afeature of vasopressin action in the mammaliantubule, as some have suggested on the basis ofanalogy alone, it is not clear how this wouldfacilitate urinary concentration. In order for it todo so, it would be necessary to separate spatiallythe vasopressin effect on water and salt. An increase insodium ion transport without an associated increasein water permeability in the ascending limb would,of course, increase interstitial osmolality, in conse-quence of which a more concentrated urine could beelaborated in the collecting duct. If, on the otherhand, vasopressin acted in the tubule as in bladderand skin, that is, simultaneously stimulating sodiumion and water movement, no increase in interstitialosmolality would be achieved. Recently, Clapp,Watson, and Berliner (1963) have presented evidencethat the hormone does enhance proximal reabsorp-tion of salt and water in the dog. The significance oftheir findings is as yet unclear, particularly in view ofthe fact that net sodium ion excretion in the dog isgenerally not diminished by the administration ofantidiuretic hormone.
THE CELLULAR MODE OF ACTION OFANTIDIURETIC HORMONE
Although most investigators agree that vasopressinexerts its permeability effect by increasing either thesize or number of aqueous channels in responsive
538
on February 12, 2022 by guest. P
rotected by copyright.http://jcp.bm
j.com/
J Clin P
athol: first published as 10.1136/jcp.18.4.491 on 1 July 1965. Dow
nloaded from
Cellular mode of action of antidiuretic hormone
membranes, this is merely a conjecture and the true
nature of the structural alterations is unknown. Thehormone undoubtedly reacts with some receptor
site in the membrane or cell, or in some other fashioninitiates a chain of chemical and physical reactionswhich ultimately result in a rearrangement of thestructure of the cell so as to permit more rapidpenetration of solvent and solute. How this occurs
or what kind of a process is involved is not under-stood. There are, however, currently at least threehypotheses regarding the cellular mode of action ofvasopressin. The first is attributable to Ginetzinsky(1961), who suggested that vasopressin stimulatesthe secretion of a depolymerizing enzyme, hyaluroni-dase, by the renal tube. The second, that of Schwartz,Fong, Rasmussen, and their associates (Fong,Silver, Christman, and Schwartz, 1960; Rasmussen,Schwartz, Schoessler, and Hochster, 1960; Schwartz,Rasmussen, Schoessler, Silver, and Fong, 1960),involves a mechanical system, non-metabolic innature, in which interaction of vasopressin withspecific tissue receptors directly initiates structuralchanges within the membranes. The third, proposedby us (Orloff and Handler, 1962) involves an
intracellular intermediate, adenosine 3',5'-mono-phosphate (cyclic 3 ',5'-AMP), which is thought to bethe agent responsible for the permeability changes;the concentration of this compound in the receptortissues is regulated by antidiuretic hormone. Thesetheories will be discussed separately.
According to Ginetzinsky (1961) antidiuretichormone has no direct effect on the permeability ofthe tubule cells, but instead stimulates the secretionby these cells of hyaluronidase into urine. Sub-sequent depolymerization of mucopolysaccharidecomplexes of the intercellular spaces and basementmembrane by the enzyme is thought to result in thecharacteristic increase in the permeability of thecollecting duct to water. The following evidence hasbeen presented in support of the theory (Ginetzinsky,1961). Hyaluronidase activity in urine is constantand independent of urine flow in osmotic diuresis inthe rat at a time when antidiuretic hormone secretionis assumed to be maximal, but this is not the case inthe animal undergoing water diuresis. In the lattersituation, when antidiuretic hormone secretion is inabeyance, urinary hyaluronidase activity is inverselyrelated to urine flow. This is as would be expectedif the development of antidiuresis requires secretionof the depolymerizing enzyme. Furthermore, on thebasis of histochemical studies, Ginetzinsky reportedthat a marked reduction in mucopolysaccharidematerial occurs in the papilla of rats in antidiuresisas compared to that in the papilla of animals follow-ing 20 to 60 minutes of water diuresis. Finally,changes in the size and shape of collecting duct cells
which were attributed to antidiuretic hormone weresaid to be compatible with apocrine secretoryactivity. Additional support for the theory wassupplied by Dicker and Eggleton (1960) who, inagreement with Ginetzinsky's animal studies,reported that the rate of excretion of hyaluronidasein urine of human subjects undergoing waterdiuresis varied inversely with urine flow. They wereunable to detect hyaluronidase activity in the urineof patients with diabetes insipidus.The hyaluronidase theory has been severely
criticized by Berlyne (1960). The reliability andspecificity of the hyaluronidase assay used byGinetzinsky have been questioned, and whenBerlyne used an assay which he considered superiorhe was unable to find any relationship between therate of excretion of the enzyme and urine flow eitherin water diuresis or in osmotic diuresis. He alsodisagrees with Ginetzinsky's analysis of data. Onreplotting the original observations of Ginetzinsky,Berlyne found that the rate of secretion of thehyaluronidase-like material in urine was constantin water diuresis, and rose linearly with flow inosmotic diuresis. Similar criticisms may be directedat some of the data of Dicker and Eggleton (1960).The histochemical observations were not confirmedby Breddy, Cooper, and Boss (1961) who suggestedthat the pattern observed by Ginetzinsky in ratpapilla may have been the result of sampling atdifferent depths of the medulla in diuretic and non-diuretic animals. Also, although Thorn, Knudsen,and Koefoed (1961) reported that the injection oflarge amounts of hyaluronidase reduced urine flowand increased urine osmolality in alcohol-anaesthet-ized rats undergoing water diuresis, an effect similarto that of antidiuretic hormone, their results werenot convincing. As Thorn himself pointed out, itwas not possible to ascribe the effect with certaintyto a direct tubular action of the enzyme sincefiltration rate was not measured in these studies.Furthermore, the urinary response was delayed forapproximately 20 minutes after the injection ofhyaluronidase, whereas that evoked by exogenoushormones is virtually immediate. Rosenfeld, Hirata,and Brest (1963) were unable to demonstrate anyeffect of the injection of testicular hyaluronidaseinto the renal artery of the dog which could not beascribed to concurrent changes in haemodynamics.Finally, neither Leaf (1960) nor Bentley (1962)observed any effect of hyaluronidase on the per-meability to water of toad or frog urinary bladder.It now seems reasonable to disregard the hyaluroni-dase thesis since none of the data marshalled in itssupport has withstood critical evaluation.
In 1960 Fong, Rasmussen, and Schwartz and theircolleagues proposed that vasopressin binds to toad
539
on February 12, 2022 by guest. P
rotected by copyright.http://jcp.bm
j.com/
J Clin P
athol: first published as 10.1136/jcp.18.4.491 on 1 July 1965. Dow
nloaded from
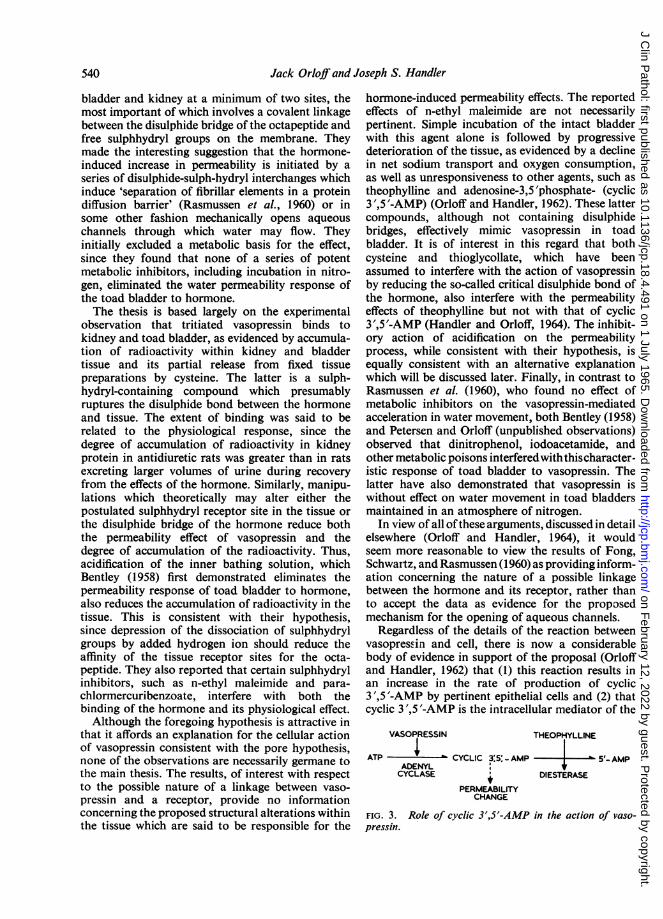
Jack Orloff and Joseph S. Handler
bladder and kidney at a minimum of two sites, themost important of which involves a covalent linkagebetween the disulphide bridge of the octapeptide andfree sulphhydryl groups on the membrane. Theymade the interesting suggestion that the hormone-induced increase in permeability is initiated by aseries of disulphide-sulph-hydryl interchanges whichinduce 'separation of fibrillar elements in a proteindiffusion barrier' (Rasmussen et al, 1960) or insome other fashion mechanically opens aqueouschannels through which water may flow. Theyinitially excluded a metabolic basis for the effect,since they found that none of a series of potentmetabolic inhibitors, including incubation in nitro-gen, eliminated the water permeability response ofthe toad bladder to hormone.The thesis is based largely on the experimental
observation that tritiated vasopressin binds tokidney and toad bladder, as evidenced by accumula-tion of radioactivity within kidney and bladdertissue and its partial release from fixed tissuepreparations by cysteine. The latter is a sulph-hydryl-containing compound which presumablyruptures the disulphide bond between the hormoneand tissue. The extent of binding was said to berelated to the physiological response, since thedegree of accumulation of radioactivity in kidneyprotein in antidiuretic rats was greater than in ratsexcreting larger volumes of urine during recoveryfrom the effects of the hormone. Similarly. manipu-lations which theoretically may alter either thepostulated sulphhydryl receptor site in the tissue orthe disulphide bridge of the hormone reduce boththe permeability effect of vasopressin and thedegree of accumulation of the radioactivity. Thus,acidification of the inner bathing solution, whichBentley (1958) first demonstrated eliminates thepermeability response of toad bladder to hormone,also reduces the accumulation of radioactivity in thetissue. This is consistent with their hypothesis,since depression of the dissociation of sulphhydrylgroups by added hydrogen ion should reduce theaffinity of the tissue receptor sites for the octa-peptide. They also reported that certain sulphhydrylinhibitors, such as n-ethyl maleimide and para-chlormercuribenzoate, interfere with both thebinding of the hormone and its physiological effect.Although the foregoing hypothesis is attractive in
that it affords an explanation for the cellular actionof vasopressin consistent with the pore hypothesis,none of the observations are necessarily germane tothe main thesis. The results, of interest with respectto the possible nature of a linkage between vaso-pressin and a receptor, provide no informationconcerning the proposed structural alterations withinthe tissue which are said to be responsible for the
hormone-induced permeability effects. The reportedeffects of n-ethyl maleimide are not necessarilypertinent. Simple incubation of the intact bladderwith this agent alone is followed by progressivedeterioration of the tissue, as evidenced by a declinein net sodium transport and oxygen consumption,as well as unresponsiveness to other agents, such astheophylline and adenosine-3,5'phosphate- (cyclic3 ',5'-AMP) (Orloff and Handler, 1962). These lattercompounds, although not containing disulphidebridges, effectively mimic vasopressin in toadbladder. It is of interest in this regard that bothcysteine and thioglycollate, which have beenassumed to interfere with the action of vasopressinby reducing the so-called critical disulphide bond ofthe hormone, also interfere with the permeabilityeffects of theophylline but not with that of cyclic3',5'-AMP (Handler and Orloff, 1964). The inhibit-ory action of acidification on the permeabilityprocess, while consistent with their hypothesis, isequally consistent with an alternative explanationwhich will be discussed later. Finally, in contrast toRasmussen et al. (1960), who found no effect ofmetabolic inhibitors on the vasopressin-mediatedacceleration in water movement, both Bentley (1958)and Petersen and Orloff (unpublished observations)observed that dinitrophenol, iodoacetamide, andother metabolic poisons interferedwiththischaracter-istic response of toad bladder to vasopressin. Thelatter have also demonstrated that vasopressin iswithout effect on water movement in toad bladdersmaintained in an atmosphere of nitrogen.
In view of all of these arguments, discussed in detailelsewhere (Orloff and Handler, 1964), it wouldseem more reasonable to view the results of Fong,Schwartz, and Rasmussen (1960) as providing inform-ation concerning the nature of a possible linkagebetween the hormone and its receptor, rather thanto accept the data as evidence for the proposedmechanism for the opening of aqueous channels.
Regardless of the details of the reaction betweenvasopressin and cell, there is now a considerablebody of evidence in support of the proposal (Orloffand Handler, 1962) that (1) this reaction results inan increase in the rate of production of cyclic3',5'-AMP by pertinent epithelial cells and (2) thatcyclic 3',5'-AMP is the intracellular mediator of the
VASOPRESSIN THEOPHYLLINE
ATP CYCLIC 3 5 -AMP 5'- AMPADENYLCYCLASE DIESTERASE
PERMEABILITYCHANGE
FIG. 3. Role of cyclic 3',5'-AMP in the action of vaso-pressin.
540
on February 12, 2022 by guest. P
rotected by copyright.http://jcp.bm
j.com/
J Clin P
athol: first published as 10.1136/jcp.18.4.491 on 1 July 1965. Dow
nloaded from

Cellular mode of action of antidiuretic hormone
previously noted permeability response to vaso-pressin. The hypothesis is illustrated in Fig. 3, and isbased on a comparable scheme for the role of thiscyclic nucleotide in the action of certain otherhormones in their specific receptor tissues, asdeveloped by Sutherland and Rall (1960). Theconversion of adenosine triphosphate to cyclic3 ',5'-AMP is catalyzed by the enzyme adenylcyclase, which is probably located in the cellmembrane (Davoren and Sutherland, 1963). Therate of this reaction, and therefore the concentrationof cyclic 3',5'-AMP in kidney and in toad bladder,is increased by antidiuretic hormone. Furthermore,cyclic 3',5'-AMP is inactivated by conversion to5'-AMP, a reaction catalyzed by cyclic nucleotidephosphodiesterase and inhibited by methyl xanthines(Butcher and Sutherland, 1962) such as theophylline.The suggestion that cyclic 3',5'-AMP is the cellularintermediate responsible for the unique permeabilityeffects of vasopressin was based initially on theobservation that the nucleotide mimics vasopressin(Table II). The response of the toad bladder to
TABLE IINET FLOW OF WATER SIMULTANEOUSLY IN SACS A AND B
Solution Flow (Ml./min.)
Sac ARinger'sRinger'sRinger'sSac BCyclic-3',5'-AMP (10 ,uM per ml.)Theophylline (20 MM per ml.)Vasopressin (100 mU. per ml.)
1 0
060-8
26-718 226-5
Outer solution 40 mOsm. per kg. H,O (urine side). Inner solution200 mOsm. per kg. H.O (blocd side). Agents added to innersolution only.
cyclic 3',5'-AMP has all the characteiistics of thevasopressin effect. It occurs only when the agent isadded to the inner bathing solution, is reversible,and associated with an increase in net sodiumtransport. Furthermore, it is specific in that neitheradenosine triphosphate not 5'-AMP has such effects.A similar hormone-like response is elicited bytheophylline which, within the context of the presenthypothesis, does so by inhibiting the inactivation ofendogenously-formed cyclic 3',5'-AMP. As notedearlier, acidification of the inner bathing solutioneliminates the permeability effects of vasopressin intoad bladder. Similarly, the response to theophyllineis prevented by acidification, whereas that toexogenous cyclic 3',5'-AMP is not. These resultsare consistent with the foregoing hypothesis, sincethe rate of conversion of adenosine triphosphate tocyclic 3',5'-AMP is markedly reduced in an acid
solution (Sutherland, Rall, and Menon, 1962). Thus,neither vasopressin nor theophylline would beexpected to alter permeability. This interpretation ofthe effect of acidification differs from, but does notnecessarily exclude, that offered by Rasmussen et al.(1960).The hypothesis concerning the regulation by
vasopressin of the concentration of cyclic 3 ',5'-AMPgained additional support when it was observed thatvasopressin increased the rate of prcduction of cyclic3',5'-AMP by particles of dog kidney (Brown,Clarke, Roux, and Sherman, 1963) and that incu-bation of the intact urinary bladder of the toad withthe hormone or with theophylline resulted in amarked increase in the concentration of the cyclicnucleotide in this tissue (Handler, Butcher, Suther-land, and Orloff, unpublished observations). Further-more, as would be predicted, vasopressin andtheophylline have a synergistic effect on the con-centration of cyclic 3',5'-AMP in the bladder.The major problem at this time is how cyclic
3 ',5 '-AMP elicits the permeability changes character-istic of the response to vasopressin. Cyclic 3 ',5 '-AMPis known to alter the activity of a number of enzymesystems (Sutherland and Rall, 1960). Althoughcertain of these may be involved in the permeabilityresponse, at present there is inadequate informationregarding the structural changes and the chemicalpathways involved to permit reasonable speculationconcerning their role. With the exception of theaforementioned stimulation of cyclic 3',5'-AMPproduction, the known metabolic effects of vaso-pressin include an increase in oxygen consumptionand glycogen breakdown (Leaf and Dempsey, 1960).These changes are not evident when the bladder isincubated in a solution free of sodium, although thehormone is still capable of eliciting the characteristiceffect on water movement under these circumstances.It is apparent that the stimulation of oxygen con-sumption and glycogenolysis reflects the metabolicrequirement for sodium ion transport (Leaf andDempsey, 1960). The effects of cyclic 3',5'-AMP onoxygen consumption and glycogenolysis resemblethose of vasopressin and are similarly dependent onthe presence of sodium ion in the bathing medium(Handler, 1964).
Cyclic 3',5'-AMP has also been shown to activatephosphofructokinase in certain tissues (Mansourand Mansour, 1962) in which this enzyme is rate-limiting in glycogenolysis. Vasopressin has no effecton phosphofructokinase activity in toad bladder,although cyclic 3',5'-AMP in concentrations belowthose needed to affect the permeability of the bladderdoes increase the activity of the enzyme (Handler,Petersen, and Orloff, unpublished observations).However, the same concentration of 5'-AMP
541
on February 12, 2022 by guest. P
rotected by copyright.http://jcp.bm
j.com/
J Clin P
athol: first published as 10.1136/jcp.18.4.491 on 1 July 1965. Dow
nloaded from
Jack Orloffand Joseph S. Handler
produces similar activation, and each nucleotide hasthis effect in a tissue homogenate. Since 5'-AMPdoes not mimic vasopressin, it is possible that cyclic3 ',5'-AMP does not exert its metabolic effects onthis tissue by activating phosphofructokinase.
Phosphorylase activity in toad bladder andkidney is also increased by vasopressin (Handlerand Orloff, 1963). This enzyme, which catalyzes theconversion of glycogen to glucose-l-phosphate, isalso activated by cyclic 3',5'-AMP. Furthermore, itis activated in other tissues by each of the diversehormones known to stimulate cyclic 3,'5'-AMPproduction in their specific receptor tissues (Suther-land and Rall, 1960). In view of this, the results ofthe kidney and bladder studies add further supportto the concept that cyclic 3',5'-AMP is involved inthe vasopressin-induced response to toad bladderand kidney. However, an increase in phosphorylaseactivity is observed in toad bladder incubated incholine (sodium-free) Ringer's solution, a situationin which vasopressin has no observed effect onglycogenolysis, although it does alter the permea-bility to water of the tissue. Consequently, it isunlikely that phosphorylase has an important role inthe regulation of glycogenolysis in this tissue.Furthermore, although phosphorylase activationparallels the water permeability response of toadbladder to hormone, its function, if any, in thepermeability process in unknown.
In the light of the evidence, it may be concludedthat the role of cyclic 3',5'-AMP as an intracellularintermediate in the action of vasopressin has beenestablished with reasonable certainty. The importantproblem, that is, the nature of the chemical andphysical transformation which must occur in thetissue in order to account for the unique changes inpermeability elicited by vasopressin, remains un-solved.
REFERENCES
Andersen, B., and Ussing, H. H. (1957). Acta physiol. scand., 39, 228.Bentley, P. J. (1958). J. Endocr., 17, 210.
(1959). Ibid., 18, 327.(1960). Ibid., 21, 161.(1962). Ibid., 24, 407.
Berliner, R. W., Levinsky, N. G., Davidson, D. G., and Eden, M.(1958). Amer. J. Med., 24, 730.
Berlyne, G. M. (1960). Clin. Sci., 19, 12.Boissonnas, R. A., Guttmann, St., Berde, B., and Konzett, H. (1961).
Experientia (Basel), 17, 377.Bourguet, J., and Maetz, J. (1961). Biochim. biophys. Acta (Amst.), 52,
552.Breddy, P., Cooper, G. F., and Boss, J. M. N. (1961). Nature (Lond.),
192, 76.Bricker, N. S., Biber, T., and Ussing, H. H. (1963). J. clin. Invest., 42,
88.Brown, E., Clarke, D. L., Roux, V., and Sherman, G. H. (1963).
J. biol. Chem., 238, PC 852.Brunn, F. (1921). Z. ges. exp. Med., 25, 170.
Butcher, R. W., and Sutherland, E. W. (1962). J. biol. Chem., 237,1244.
Clapp, J. R., Watson, J. F., and Berliner, R. W. (1963). Amer. J.Physiol., 205, 273.
Davoren, P. R., and Sutherland, E. W. (1963). J. biol. Chem., 238,3016.
Dicker, S. E., and Eggleton, M. G. (1960). J. Physiol., (Lond.), 154, 378.Essig, A., and Leaf, A. (1963). J. gen. Physiol., 46, 505.Finn, A. L., and Orloff, J. Unpublished observations.Fong, C. T. O., Silver, L., Christman, D. R., and Schwartz, T. L.
(1960). Proc. nat. Acad. Sci. (Wash.), 46, 1273.Frazier, H. S., Dempsey, E. F., and Leaf, A. (1962). J. gen. Physiol.,
45, 529.-, and Hammer, E. I. (1963). Amer. J. Physiol., 205, 718.
and Leaf, (1963). J. gen. Physiol., 46, 491.Ginetzinsky, A. G. (1961). Nature (Lond.), 189, 236.Gottschalk, C. W. (1961). Physiologist, 4, 35.Hays, R. M., and Leaf, A. (1961). Ann. intern. Med., 54, 700.- - (1962). J. gen. Physiol., 45, 905.Handler, J. S., Butcher, R. W. Jr., Sutherland, E. W., and Orloff, J.
Unpublished observations.Handler, J. S. (1964). In Proceedings of the 15th Annual Meeting on the
Kidney. Swampscott, Mass. National Kidney Disease Found-ation.
and Orloff, J. (1963). Amer. J. Physiol., 205, 298.- (1964). Ibid., in the press.Petersen, J., and Orloff, J. Unpublished observations.
Hevesy, G., Hofer, E., and Krogh, A. (1935). Skans. Arch. Physiol., 72,199.
Jaenike, J. R. (1961). J. clin. Invest., 30, 144.Jard, S., and Morel, F. (1963). Amer. J. Physiol., 204, 222.Koefoed-Johnsen, V., and Ussing, H. H. (1953). Acta physiol. scand.
28, 60.-,- (1958). Ibid., 42, 298.Krogh, A. (1937). Skand. Arch. Physiol., 76, 60.Leaf, A. (1960). J. gen. Physiol., 43, suppl. 1, 175.
and Dempsey, E. (1960). J. biol. Chem., 235, 2160.and Hays, R. M. (1962). J. gen. Physiol., 45, 921.
MacRobbie, E. A. C., and Ussing, H. H. (1961). Acta physiol. scand.,53, 348.
Maffly, R. H., Hays, R. M., Lamdin, E., and Leaf, A. (1960). J. cin.Invest., 39, 630.
Mansour, T. E., and Mansour, J. M. (1962). J. biol. Chem., 237, 629.Orloff, J., and Handler, J. S. (1962). J. clin. Invest., 41, 702.
(1964). In Cellular Function of Membrane Transport,edited by J. Hoffman, and N. J. Englewood Cliffs. Prentice-Hall, Inc.
Petersen, M. J., and Edelman, 1. S. (1963). Fed. Proc., 21, 146.- and Orloff, J. Unpublished observations.Rasmussen, H., Schwartz, I. L., Schoessler, M. A., and Hochster, G.
(1960). Proc. nat. Acad. Sci. (Wash). 46, 1278.,, Young, R., and Marc-Aurele, J. (1963). J. gen. Physiol.,46, 1171.
Rosenfeld, J. B., Hirata, K., and Brest, A. (1963). Amer. J. med. Sci.,245, 761.
Sawyer, W. H. (1961). Pharmacol. Rev., 13, 225.-and Schisgall, R. M. (1956). Amer. J. Physiol., 187, 312.Schwartz, I. L., Rasmussen, H., Schoelsser, M. A., Silver, L., and
Fong, C. T. 0. (1960). Proc. nat. Acad. Sci. (Wash.), 46, 1288.Sidel, V. W., and Hoffman, J. F. (1961). Fed. Proc. 20, 137.Smith, H. W. (1951). The Kidney, Structure and Function in Health and
Disease. Oxford University Press, New York.Sutherland, E. W., and Rall, T. W. (1960). Pharmacol. Rev., 12, 265.
, and Menon, T. (1962). J. biol. Chem., 237, 1220.Thorn, N. A., Knudsen, P. J., and Koeford, J. (1961). Acta endocr.
(Kbh.), 38, 571.Ullrich, K. J., Kramer, K., and Boylan, J. W. (1961). Progr. cardio-
vasc. Dis., 3, 395.Ussing, H. H., Kruhoffer, P., Thaysen, J. H., and Thorn, N. A. (1960).
The Alkali Metal Ions in Biology, p. 127. Springer-Verlag,Berlin.
and Zerahn, K. (1951). Acta physiol. scand., 23, 110.Verney, E. B. (1947). Proc. roy. Soc. B., 135, 25.Wesson, L. G. Jr., and Anslow, W. P. Jr. (1952). Amer. J. Physiol.,
170, 225.Wirz, H., Hargitay, B., and Kuhn, W. (1951). Helv. physiol. pharmacol.
Acta, 9, 196.
542
on February 12, 2022 by guest. P
rotected by copyright.http://jcp.bm
j.com/
J Clin P
athol: first published as 10.1136/jcp.18.4.491 on 1 July 1965. Dow
nloaded from
J. clin. Path. (1965), 18, 543
Value and limitations of renal function tests
D. A. K. BLACK
Other papers in this symposium deal in reasonabledetail with the performance and interpretation ofindividual renal function tests. In this communica-tion, I shall limit myself to two more generalobjectives: the broad grouping of renal functiontests, and the clinical situations in which the testingof renal function may be helpful.
CATEGORIES OF RENAL FUNCTION TESTS
While functional inferences can be made from theappearance of the urinary deposit, or of renal tissueobtained at biopsy, it is conventional to limit theterm 'renal function tests' to the appraisal of thebiochemical performance of the kidneys. This maybe examined under natural conditions; it may be putunder stress, as by water deprivation; or foreignsubstances, such as inulin or p-aminohippurate, maybe administered to allow the measurement of filtra-tion rate or renal plasma flow. I must admit to acertain inclination, in clinical practice at least,towards the more 'natural' tests, which may be morerelevant to the patient's normal situation, and whichmake no assumption that the diseased kidney willhandle a foreign substance in the same way as doesthe healthy kidney. In saying this, I do not under-estimate the contribution which the deployment ofthe so-called 'discrete tests of renal function' hasmade to our understanding of renal disease; but ourpatients can often reap the benefit of this under-standing, without having themselves to undergo theexacting tests on which it is based.
It is convenient to divide renal function tests intothose which assess excretory function, and thosewhich assess homeostatic function. This importantdistinction, originally made by W. B. Cannon, iscertainly familiar to you as applied physiologists;but it does not seem invariably to inform the practiceof what we may call the occasional nephrologist. Itmay be suggested that the assessment of excretoryfunction tells us how far away the patient is fromterminal uraemia, and so is even more useful inprognosis than in diagnosis, whereas study of thehomeostatic function of the kidneys can be criticalin diagnosis, e.g., the tubular syndromes, and canalso point to important lines of substitution therapy.Another possible generalization is that the excretoryfunction depends very much on glomerular filtration
(or on the blood-flow underlying it), whereas homeo-static function is very largely dependent on theefficiency of the tubules in modifying the compositionof the glomerular filtrate.
ASSESSMENT OF EXCRETORY FUNCTION The mostcommonly applied test of excretory function is anindirect one, the level of the blood urea. The con-venience of this simple test ensures that any labora-tory undertaking clinical chemistry has plenty ofexperience in this estimation, and the result is likelyto be accurate. The subsequent interpretation maybe more difficult. The level of blood urea depends onthe balance between the renal excretion of urea andthe production of urea from the breakdown ofprotein; the precise level of blood urea is also afunction of the total body water, but variation in thisis seldom great enough to make any materialdifference to the blood-urea level. It is prettygenerally appreciated now that excretory functionmust be severely impaired before the blood urea isunequivocally raised, and also that excessive break-down of body protein can cause a misleading in-crease in blood urea. It is well realized that inade-quate blood supply to the kidneys can impair theirexcretory function without producing organic renaldamage. Not quite so much attention seems to havebeen paid to the effect on urea production of eitherincreased anabolism or a low protein intake. Themother building up the tissues of the womb andfoetus, and later on the infant building up his owntissues, have both got low rates of net urea produc-tion, and consequently low levels of blood urea andof urea excretion. The effect of a low-protein diet inlowering the blood urea has been strikingly shownby Giovannetti and Maggiore (1964); in patientswhose urea clearance was lower than 5 ml./min.,they were able to reduce the blood urea from levelsuniformly above 200 mg./100 ml. to levels as low as60 mg./100 ml. by the use of a diet containing 20 g.of protein per day.By relating blood urea level to the rate of urea
excretion, the urea clearance test of Van Slyke is amore precise measure of the excretory powers of thekidney. In spite of this obvious advantage, I havethe impression that it is less used than it was 10 yearsago: the result depends very much on accurate urinecollection, and the use of catheters to this end is
543
on February 12, 2022 by guest. P
rotected by copyright.http://jcp.bm
j.com/
J Clin P
athol: first published as 10.1136/jcp.18.4.491 on 1 July 1965. Dow
nloaded from

D. A. K. Black
certainly not justified. For detecting gross renalfailure, the blood urea level is sufficient, while inassessing minor degrees of excretory impairment, theendogenous creatinine clearance is more specific, andapproximates more closely to the glomerular filtra-tion rate. For measurement of the glomerular filtra-tion rate in special investigations, the clearance ofinulin, thiosulphate, allantoin, amylase, and B12 can
be used, with some of the difficulties of analysisobviated by isotope methods.
ASSESSMENT OF HOMEOSTATIC FUNCTION Among theproperties of body fluid which are conserved withinquite narrow limits by the kidneys are the volume,hydrion concentration, and osmolality. In renaldisease, homeostatic failure is perhaps detected morecommonly by clinical observation of the oedematousor of the dehydrated patient than by the applicationof formal tests, but these have their place in definingtubular lesions, both qualitatively and quantitatively.The proximal tubular syndromes are sometimes re-
vealed by the detection of glycosuria and/or amino-aciduria; in either case it is important to confirm thatthe site of abnormality is in the kidneys, by showingthat the plasma level of glucose or amino-acids isnormal or reduced. The extent of proximal tubuleimpairment can be assessed quantitatively bymeasuring the tubular maxima for glucose re-
absorption or secretion of p-aminohippurate. Re-absorption of important organic substances in theproximal tubule is associated with a considerablereabsorption of water and electrolyte, the transportof sodium being the active process, closely linkedwith oxygen consumption. There is, however, littleselectivity in this reabsorption, so far as water andelectrolytes are concerned; the fluid leaving theproximal tubule is probably very like glomerularfiltrate, but there is only about one-sixth of theamount. The final adjustments of volume, acidity,and osmolality are made in the distal nephron, partlyin the hyperosmolar zone of the medulla, partly byreabsorption or secretion of individual electrolytes.Much of our knowledge of these processes hasaccrued from clearance techniques, and more recentlyfrom micro-puncture, tissue-slice, and stop-flowstudies; but in clinical work these refined methodscannot be applied, and we can only study the overallperformance, often after the application of some
stress, e.g., water deprivation or vasopressin, in theassessment of concentrating power (de Wardener,1956); or ammonium chloride in assessing theexcretion of ammonium and titratable acidity(Wrong and Davies, 1959).Although the distinction between excretory and
homeostatic function is worth making, it has to berecognized that excretory impairment due to loss of
nephrons can greatly modify the homeostatic per-formance of the remaining functioning nephrons. Inmany patients with renal failure, we need notpostulate any specific tubular impairment, as theloss of homeostatic adaptability is the consequenceof sustained osmotic diuresis in the residual intactnephrons (Platt, 1952). In other patients, however,the defect in urinary concentrating and acidifyingcapacity is out of proportion to the degree ofexcretory impairment, e.g., the comparison by Brod(1962) of maximal urinary concentration in nephro-sclerosis, glomerulonephritis, and pyelonephritis.
CLINICAL APPLICATION OF RENAL FUNCTION TESTS
In exemplifying the clinical situations in which testscan be helpful, I deliberately exclude the investiga-Eion of polyuria, of renal acidosis, of other renaltubular disorders, of primary disorders of bodyfluid, of urinary infection, renal calcification, andrenal ischaemia, which are the subjects of separatepapers. This will allow me to concentrate myremarks on the functional investigation of acute andchronic renal failure, of symptomless proteinuria,and of the nephrotic syndrome.
RENAL FAILURE Here we are concerned above allwith prognosis. This in turn depends on a distinctionbetween acute and chronic renal failure, and on thedetection of any reversible cause; the clinicalevidence is paramount, and a single evaluation ofrenal excretory function tells us only that there isgross impairment, not how things are going. Serialobservations can be much more helpful in assessingboth the natural prognosis, and the effect of anyspecific treatment. These patients should generallybe on a controlled diet, and intercurrent infection ordehydration should be recorded, so that the bloodurea is often a sufficient guide to progress. Dailyestimation of the blood urea in acute renal failuregives more practical help than less fiequent estima-tion of urea or creatinine clearance, even if urine isbeing formed. In chronic renal failure, less frequentestimation of the blood urea can draw attention toextrarenal factors, as well as to the slow progressionof the intrinsic renal damage. I need hardly stress theimportance of the serum sodium level as a measureof hydration, and of the serum potassium level as awarning of hyperkalaemic toxicity.
SYMPTOMLESS PROTEINURA The clinical problemhere is again very largely one of prognosis, and itseems to me legitimate to approach it with a strongbias towards finding justification for reassurance.Biopsy studies suggest that when there is a renallesion it is a progressive glomerulonephritis, not
544
on February 12, 2022 by guest. P
rotected by copyright.http://jcp.bm
j.com/
J Clin P
athol: first published as 10.1136/jcp.18.4.491 on 1 July 1965. Dow
nloaded from
Value and limitations of renal function tests
likely to be influenced by any treatment. The amountand if possible the intermittency of proteinuriashould be measured. But it is not possible to admitall these patients, and measuring the blood urea canbe used to exclude renal failure, not, of course, thesame thing as renal disease, while the serum proteinsgive indirect evidence as to whether the proteinuriais scanty or massive. Scanty proteinuria can signifyrenal damage, but at least it will not lead to thenephrotic syndrome. The urea clearance provides afigure for insurance purposes, but the blood ureasometimes makes better reading, and the solvency ofinsurance companies is scarcely a paramount part ofour responsibility to our patients. I am much moreconcerned, in young people at least, to establisheither the cause or the innocence of proteinuria, andurinary cell counts, pyelography, or biopsy may allbe useful.
MASSIVE RENAL OEDEMA (NEPHROTIC SYNDROME,PROTEIN-LOSING NEPHRITIS) Tests of renal functiondo not distinguish between the various causes of thissyndrome, although the nature of the proteins lostin the urine may contribute (Blainey, Brewer,Hardwicke, and Soothill, 1960). The results of testsof excretory function, such as urea clearance, may
even be above normal in the early stages ofglomerulonephritis, especially in children, and mayreflect increased glomerular permeability. In thelater stages, the blood urea level and serum proteinsare useful guides to prognosis.
These clinical examples may have brought outthe limitations rather than the value of renal functiontests; this view is perhaps not unacceptable topractising clinical biochemists faced with over-whelming requests. Before accepting it too hastily,however, we must remember that the more specificapplications of renal function tests have beenexcluded from this general survey.
REFERENCES
Blainey, J. D., Brewer, D. B., Hardwicke, J., and Soothill, J. F.(1960). The nephrotic syndrome. Diagnosis by renal biopsy andbiochemical and immunological analysis related to the responseto steroid therapy. Quart. J. Med., 29, 235.
Brod, J. (1962). Chronic pyelonephritis. In Renal Disease, edited byD. A. K. Black. Blackwell, Oxford.
de Wardener, H. E. (1956). Vasopressin tannate in oil and the urineconcentration test. Lancet, 1, 1037.
Giovannetti, S., and Maggiore, Q. (1964). A low-nitrogen diet withproteins of high biological value for severe chronic uraemia.Ibid., 1, 1000.
Platt, R. (1952). Structural and functional adaptation in renal failure.Brit. med. J., 1, 1313.
Wrong, O., and Davies, H. E. F. (1959). The excretion of acid in renaldisease. Quart. J. Med., 28, 259.
13
545
on February 12, 2022 by guest. P
rotected by copyright.http://jcp.bm
j.com/
J Clin P
athol: first published as 10.1136/jcp.18.4.491 on 1 July 1965. Dow
nloaded from
J. clin. Path. (1965), 18, 546
Detection of renal insufficiency in childrenJ. A. BLACK
From the Children's Hospital, Sheffield
Renal insufficiency in children frequently goes un-detected, and just as often is wrongly suspected. Thereasons for this are as follows: first it is oftendifficult to obtain adequate and reliable specimens ofblood and urine; secondly there may be errors in theinterpretation of the results because of the differencesin renal function at different ages; and thirdlybecause the presenting symptoms of renal insuffi-ciency and early childhood are very different fromthose in the older child or adult.
URINE SPECIMENS
If the child can pass urine voluntarily there are fewdifficulties in obtaining specimens of urine if one isprepared to be patient. Catheterization should neverbe used routinely, and for bacteriological purposesa mid-stream specimen can be obtained fromboys and girls if care and gentleness are used. Thetroubles arise with the infants and toddlers; at thisage it is necessary to use some form of collectingapparatus attached to or around the genitalia. Smallinfants can, if necessary, be immobilized quiteeasily for this purpose, but the toddler resents anyrestraint intensely and therefore the best form ofcollecting apparatus is one which can be kept onwhen the child is walking about. Probably the mostsuccessful of such collecting bags (Baldwin, Clayton,Jenkins, Mitchell, and Renwick, 1962) is that de-signed at The Hospital for Sick Children, London,which has an adhesive area which fits over the geni-talia. When urine has been passed, the bag isemptied by aspiration through a catheter insertedthrough a small hole in the upper part of the bag.These plastic bags are not sterilized by the manu-facturers but culture from their interior seldomproduces a significant growth of bacteria. The big-gest difficulty is contamination from the skin andgenitalia and this can be minimized by aspirating theurine as soon as it has been passed. This type of bagcan also be used for 24-hour collections.
BLOOD SPECIMENS
Micro or ultramicro methods should be used. Forroutine estimation of the plasma electrolytes and
urea 1 ml. of blood should be sufficient if micromethods are used, and 0-15 ml. will be adequate ifultramicro methods are employed. Any hospitalwith children's beds should use micro methods forall patients, to avoid the confusion of two sets ofnormal ranges. Not to use micro methods in a burnsunit is indefensible.
SOME COMMON ERRORS IN INTERPRETATION
THE BLOOD UREA Perhaps the commonest mistakein interpreting the significance of a raised blood urealevel is a failure to appreciate its extreme lability ininfancy, and to consider a level of 70 to 100 mg.% asindicating a serious degree of renal insufficiency. Itis easy for the clinician inexperienced with childrento overlook a moderate degree of dehydration in aninfant especially if there is also wasting. In certaindisorders associated with anorexia and vomiting,or with polyuria, the blood urea level is oftenraised due to dehydration but returns to normalwhen an adequate fluid intake is achieved and theelectrolyte disturbance is rectified. A good exampleof this situation is the infant with nephrogenicdiabetes insipidus; in these babies there is consi-derable dehydration and wasting, with a raised bloodurea and a high serum sodium (150 mEq. per litre ormore). When adequate fluid is given the ureareturns to normal and a normal glomerular filtrationrate can easily be demonstrated by clearance tests.Other conditions in which one finds a temporaryelevation of the blood urea level are untreated casesof the adrenogenital syndrome, the early stages ofcystinosis (cystine storage disease), idiopathic hyper-calcaemia, and infantile renal acidosis. In a secondgroup of cases renal function is entirely normal andthere is no demonstrable biochemical disorder in theblood apart from a raised blood urea; this is some-times seen when an infant is given a high-proteindiet (Barnett and Vesterdal, 1953) and also incertain types of dwarfism without any demonstrableendocrine abnormality. It appears that in both theseexamples the amino-acids not incorporated into newtissue are converted into urea.
PROTEINURIA In dehydration, proteinuria is oftenpresent but usually disappears when the patient
546
on February 12, 2022 by guest. P
rotected by copyright.http://jcp.bm
j.com/
J Clin P
athol: first published as 10.1136/jcp.18.4.491 on 1 July 1965. Dow
nloaded from

Detection of renal insufficiency in children
returns to normal. However, in the recovery phase ofsevere gastroenteritis proteinuria is sometimes found(Black, 1959) and this indicates some degree of renaltubular necrosis: it is important to realize that up to800 mg.0% protein may be present in the urine inthese cases and that this does not indicate irrever-sible renal disease. In idiopathic hypercalcaemia andin infantile renal acidosis proteinuria is often presentin the untreated state of chronic dehydration andwasting: it is a serious error to dismiss such childrenas having a chronic renal insufficiency without moredetailed investigation.
CELLS IN THE URINE The presence of renal epithelialcells in the urine may be evidence of temporarydamage to the tubules, as in renal tubular necrosis.If the cellular deposit is not examined carefully thesmall tubular epithelial cells may be reported as puscells and a diagnosis of pyelonephritis will be made.Tubular epithelial cells may also be found in anycondition in which nephrocalcinosis is present, as inidiopathic hypercalcaemia, infantile renal acidosis,and chronic vitamin D poisoning. These cellsprobably indicate the shedding of epithelium dam-aged by the deposition of calcium salts in the lumenof the tubule.
RENAL FUNCTION TESTS
It would be wrong to lay down any set order fordoing renal function tests, but it is generally best todo the simplest test first and then, if necessary, pro-ceed to the more complicated, and often the moreunpleasant investigations.
weighed and blood is taken for sodium and ureaestimations. The urine is collected as it is passed inseparate containers and the volume and specificgravity are determined. In the normal child there willbe a negligible loss of weight and no change in theserum sodium and urea. In, for example, nephro-genic diabetes insipidus the urinary output willremain high and there will be a rise in the serumsodium and marked loss in weight, sometimes asmuch as 8 oz. (250g.) (Luder and Burnett, 1954). Itis worth pointing out that in this condition urinewith a specific gravity as high as 1010 may occasion-ally be found when dehydration is very severe.
THE PITRESSIN TEST The fluid deprivation test willnot distinguish between pitressin-resistant and pit-ressin-sensitive diabetes insipidus, and it is thereforesometimes necessary to use the pitressin test. Thistest can be done with the long-acting pitressintannate or with the ordinary water-soluble pitressin.The results are generally easier to interpret if thewater-soluble pitressin is used, provided a sufficientnumber of urine specimens can be obtained duringthe three hours when the pitressin is active. Thedosage scale is as follows:
Age PitressinDosage (units)
Under 3 months 1-23 months = 1 year 21 year = 3 years 33 years = 6 years 46 years = 8 years 58 years = Il years 611 years = 13 years 8Adult 10
(Dosage scale from Royer, Habib, and Mathieu, 1963)
THE WATER DEPRIVATION TEST In children under 1year of age the period of deprivation should notexceed 12 hours; if the test is carried out overnightfrom 8 p.m. till 8 a.m. there is little upset in thefeeding routine. The normal response, excludingthe newborn, is a specific gravity of 1025 or 900m. osmols per litre. In older children the same type oftest can be used, but at any age it is unwise to do anovernight fluid deprivation test if a severe defect oftubular water reabsorption is suspected, as extremedehydration and collapse may occur which may notbe recognized during the night. The conditions inwhich special precautions are necessary are nephro-genic diabetes insipidus, cystinosis, certain cases ofidiopathic hypercalcaemia, and in the polyuricphase of renal tubular necrosis. Instead, a four-hourdeprivation test may be used which can be stoppedat any time if required. It is of course necessaryto ensure an adequate fluid intake until the begin-ning of the test which should begin after the bladderhas been emptied spontaneously; the infant is then14
An alternative method, using water deprivation andpitressin tannate in oil, is described by Winberg(1959a).
It is unusual to obtain values for specific gravitywith the pitressin test as high as are obtained withfluid deprivation, and a value of 1020 would beconsidered a normal response to pitressin.
GLOMERULAR FILTRATION RATE The choice here liesbetween the use of inulin, urea, and creatinine. Aninulin clearance, if performed with an intravenousinfusion, is probably the best method for researchpurposes but the discomfort produced by the in-fusion may cause a reduction in glomerular filtrationrate, particularly in small babies (Vesterdal andTudvad, 1949). An alternative method, using asubcutaneous injection of inulin, is quite practicable(Vesterdal, 1949); but it is difficult to obtain aconstant inulin level in the blood. The urea clearanceis the simplest to perform but perhaps the mostdifficult to interpret, even when adjustment has been
547
on February 12, 2022 by guest. P
rotected by copyright.http://jcp.bm
j.com/
J Clin P
athol: first published as 10.1136/jcp.18.4.491 on 1 July 1965. Dow
nloaded from
made for surface area (as is necessary in all clearancestudies in children); in small infants the alterationsin urea clearance in relation to flow of urine aremuch greater than they are in adults. Whereas in theadult a plateau for urea clearance values is reachedat flows of over 1 ml./min./sq. m., this useful rela-tionship does not hold in the infant (Barnett andVesterdal, 1953).The endogenous creatinine clearance appears to
be the most satisfactory way of estimating theglomerular filtration rate in children. This methodhas the advantage that the level of creatinine in theblood changes very little over the course of 24 hours,thiat only one blood sample is required, and that noadditional creatinine need be given. The true crea-tinine must be measured, otherwise clearance valueswill be too low. Winberg's (1959b) results are pro-bibly the most satisfactory available, and his papershould be consulted for the actual figures for differentages, with correction for surface area. The figures forglomerular filtration rates in children only reachadult levels between the ages of 2 and 3 years; forexample, Winberg gives a value of 40 ml./min. per1 73 sq. m. at the age of 10 days and 60 ml./min. per1 73 sq. m. at 3 months.
SOME SPECIAL PROBLEMS IN INFANTS
It is helpful to be aware of those conditions in thenewborn which are likely to be associated with renalabnormalities. In the mother oligohydramnios,particularly when associated with amnion nodosum,is likely to be associated with agenesis of the kidneysin the infant (Bourne, 1962). A single umbilical arteryis often found with abnormal kidneys or occasionallya kidney is absent on one side (Feingold, Fine, andIngall, 1964; McKay and Smith, 1964). Lastly inthat curious condition, deficiency of the abdominalmusculature ('prune-skin abdomen'), there is usuallyan obstructive condition of the urinary tract con-sisting of an enlarged bladder with or withouthydroureter and hydronephrosis (Mathieu, Goldow-sky, Chaset, and Mathieu, 1953). The actual sym-toms of renal insufficiency in infancy are easily con-fused with those of gastrointestinal disorders such aspyloric stenosis. There is reluctance to feed, failureto gain weight, and often persistent and forciblevomiting. Particularly in severe lower obstructiverenal disease in the newborn, the forcing of fluidssuch as glucose water may cause fits from water in-toxication. In this condition the serum sodium isusually in the region of 120 mEq. per litre, but theserum potassium level may be slightly raised (byadult standards) giving a picture similar to that inacute adrenal failure. However, these infants are
usually overhydrated and oedematous with palpablyenlarged bladder and kidneys, while the infant withadrenal failure is collapsed and dehydrated.The urine in the newborn may present difficulties
in interpretation. There is the question of proteinuriain the newborn; this was finally dealt with by Doxia-dis, Goldfinch, and Cole (1952) who showed thatprotein is not normally present in the urine of thenewborn infant, and that previous observations hadbeen based upon an artefact due to the presence ofurates. Nevertheless even the presence of urates cancause alarm if the salmon-pink deposit on the napkinin the first few days after birth is mistaken for blood:if the deposit is examined on a slide the distinctionis obvious. During the first week of life, the numberof red cells and epithelial cells in the urine is slightlyin excess of the usual normal values (Lawson andHewstone, 1964).The level of blood urea in the newborn needs care
in its interpretation. The ability of urea to diffusereadily across biological membranes means that thelevels of urea in maternal and foetal blood are likelyto be the same (McKay and Kilpatrick, 1964);therefore any factor, such as chronic renal disease,or prolonged labour, which raises the mother's bloodurea level, will cause a similar rise in that of thefoetus, and high levels may also be found in thenewborn baby. Also, McCance and Widdowson(1954) have shown that a difficult delivery may causethe level of blood urea in the infant to rise. In thepremature baby, dehydration and acidosis fromprolonged starvation may produce a transient risein the blood urea.
SOME PROBLEMS IN THE FIRST YEAR
In the second half of the first year many types ofrenal disease become apparent. The development ofsymptoms of renal insufficiency between the ages of6 months and 9 months is common to a number ofconditions; it seems possible that renal insufficiencyis exacerbated by increases in electrolyte load suchas occur on changing from human to cows' milk orto mixed feeding, or by the reduction in fluid intakewhich is common when mixed feeding is fully es-tablished. Renal insufficiency at this age is usuallyprecipitated by dehydration, due to polyuria or toinadequate fluid intake or both. Polyuria is notusually observed because the child is in napkins,and an inadequate intake is not suspected because theinfant, though thirsty, is unable to state its wants.The dehydrated infant may actually refuse milkfeeds and solids though it will take water or glucosewater avidly if this is offered. As the child becomesprogressively more dehydrated the amount of water
548 J. A. Black
on February 12, 2022 by guest. P
rotected by copyright.http://jcp.bm
j.com/
J Clin P
athol: first published as 10.1136/jcp.18.4.491 on 1 July 1965. Dow
nloaded from
Detection of renal insufficiency in children
absorbed from the faeces by the large intestineincreases, and results in the infrequent passage of thesmall hard 'rabbitty' pellets so characteristic ofwater lack in the infant. Finally, as dehydrationprogresses and renal function deteriorates the elec-trolyte disturbances become more marked andvomiting occurs. In this manner the symptoms ofrenal insufficiency in late infancy develop: anorexia,vomiting, constipation, and failure to thrive. Theconditions which are likely to present with thesesymptoms are chronic obstructive renal diseaseaffecting both kidneys, chronic pyelonephritis,bilateral hypoplastic kidneys, cystic renal disease,idiopathic hypercalcaemia, infantile renal acidosis,cystinosis, and nephrogenic diabetes insipidus.
There are of course many other aspects of renalinsufficiency in children which could be discussed,but this paper has been largely concerned with an
attempt to elucidate some of the difficulties whichconfront those who have to assess renal function inchildren.
REFERENCES
Baldwin, E. M., Clayton, B. E., Jenkins, P., Mitchell, J., and Renwick,A. G. C. (1962). Arch. Dis. Childh., 37,488.
Barnett, H. L., and Vesterdal, J. (1953). J. Pediat., 42, 99.Black, J. (1959). Arch. Dis. Childh., 34, 158.Bourne, G. L. (1962). In The Human Amnion and Chorion, p. 196.
Lloyd-Luke, London.Doxiadis, S. A., Goldfinch, M. K., and Cole, N. (1952). Lancet, 2, 1242,Feingold, M., Fine, R. N., and Ingall, D. (1964). New Engl. J. Med.,
270,1178.Lawson, J. S., and Hewstone, A. S. (1964). Arch. Dis. Childh., 39, 287.Luder, J., and Burnett, D. (1954). Ibid., 29, 44.Mathieu, B. J., Goldowsky, S., Chaset, N. and Mathieu, P. L. Jr.
(1953). J. Pediat. 42, 92.McCance, R. A., and Widdowson, E. M. (1954). Arch. Dis. Childh.,
29,495.McKay, E., and Kilpatrick, S J. (1964). J. Obstet. Gynaec. Brit. Cwlth,
71,449.McKay, R. J. Jr., and Smith, C. A. (1964). In Textbook of Pediatrics,
8th ed., edited by W. E. Nelson, p. 387. Saunders, Philadelphiaand London.
Royer, P., Habib, R., and Mathieu, H. (1963). Problmes Actuels deNephrologie Infantile, p. 23. Editions Medicales Flammarion,Paris.
Vesterdal, J. (1949). Acta paediat. (Uppsala), 37, 421.-, and Tudvad, F. (1949). Ibid., 37, 429.Winberg, J. (1959a). Ibid., 48, 318.
(1959b). Ibid., 48,443.
549
on February 12, 2022 by guest. P
rotected by copyright.http://jcp.bm
j.com/
J Clin P
athol: first published as 10.1136/jcp.18.4.491 on 1 July 1965. Dow
nloaded from
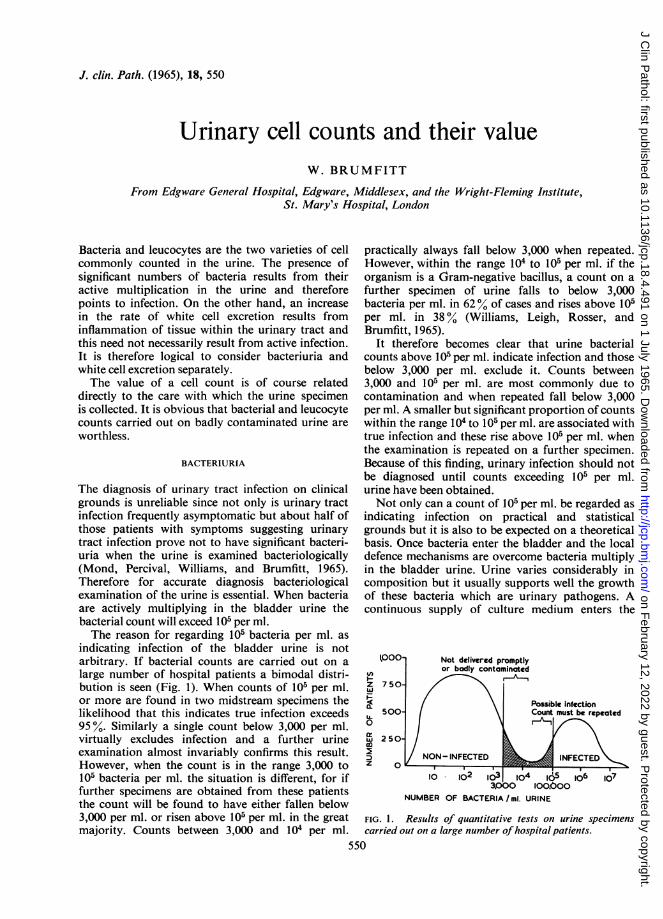
J. clin. Path. (1965), 18, 550
Urinary cell counts and their valueW. BRUMFITT
From Edgware General Hospital, Edgware, Middlesex, and the Wright-Fleming Institute,St. Mary's Hospital, London
Bacteria and leucocytes are the two varieties of cellcommonly counted in the urine. The presence ofsignificant numbers of bacteria results from theiractive multiplication in the urine and thereforepoints to infection. On the other hand, an increasein the rate of white cell excretion results frominflammation of tissue within the urinary tract andthis need not necessarily result from active infection.It is therefore logical to consider bacteriuria andwhite cell excretion separately.The value of a cell count is of course related
directly to the care with which the urine specimenis collected. It is obvious that bacterial and leucocytecounts carried out on badly contaminated urine areworthless.
BACTERIURIA
The diagnosis of urinary tract infection on clinicalgrounds is unreliable since not only is urinary tractinfection frequently asymptomatic but about half ofthose patients with symptoms suggesting urinarytract infection prove not to have significant bacteri-uria when the urine is examined bacteriologically(Mond, Percival, Williams, and Brumfitt, 1965).Therefore for accurate diagnosis bacteriologicalexamination of the urine is essential. When bacteriaare actively multiplying in the bladder urine thebacterial count will exceed 105 per ml.The reason for regarding 105 bacteria per ml. as
indicating infection of the bladder urine is notarbitrary. If bacterial counts are carried out on alarge number of hospital patients a bimodal distri-bution is seen (Fig. 1). When counts of 105 per ml.or more are found in two midstream specimens thelikelihood that this indicates true infection exceeds95 %. Similarly a single count below 3,000 per ml.virtually excludes infection and a further urineexamination almost invariably confirms this result.However, when the count is in the range 3,000 to105 bacteria per ml. the situation is different, for iffurther specimens are obtained from these patientsthe count will be found to have either fallen below3,000 per ml. or risen above 105 per ml. in the greatmajority. Counts between 3,000 and 104 per ml.
practically always fall below 3,000 when repeated.However, within the range 104 to 105 per ml. if theorganism is a Gram-negative bacillus, a count on afurther specimen of urine falls to below 3,000bacteria per ml. in 620% of cases and rises above 105per ml. in 38% (Williams, Leigh, Rosser, andBrumfitt, 1965).
It therefore becomes clear that urine bacterialcounts above 105 per ml. indicate infection and thosebelow 3,000 per ml. exclude it. Counts between3,000 and 105 per ml. are most commonly due tocontamination and when repeated fall below 3,000per ml. A smaller but significant proportion of countswithin the range 104 to l05 per ml. are associated withtrue infection and these rise above 105 per ml. whenthe examination is repeated on a further specimen.Because of this finding, urinary infection should notbe diagnosed until counts exceeding 105 per ml.urine have been obtained.Not only can a count of 105 per ml. be regarded as
indicating infection on practical and statisticalgrounds but it is also to be expected on a theoreticalbasis. Once bacteria enter the bladder and the localdefence mechanisms are overcome bacteria multiplyin the bladder urine. Urine varies considerably incomposition but it usually supports well the growthof these bacteria which are urinary pathogens. Acontinuous supply of culture medium enters the
1,000U,
zW
U.0a:wo
z
750-
500-
2 50-
0
Not delivered promptlyor bodly contaminated
NON - INFECTED
10 02O0 lO4
Possible infectionCount must be repeated
INFECTED
I 10,^s5 106 107
3,000 100.600NUMBER OF BACTERIA /mi. URINE
FIG. 1. Results of quantitative tests on urine specimenscarried out on a large number of hospital patients.
550
4-ff
on February 12, 2022 by guest. P
rotected by copyright.http://jcp.bm
j.com/
J Clin P
athol: first published as 10.1136/jcp.18.4.491 on 1 July 1965. Dow
nloaded from
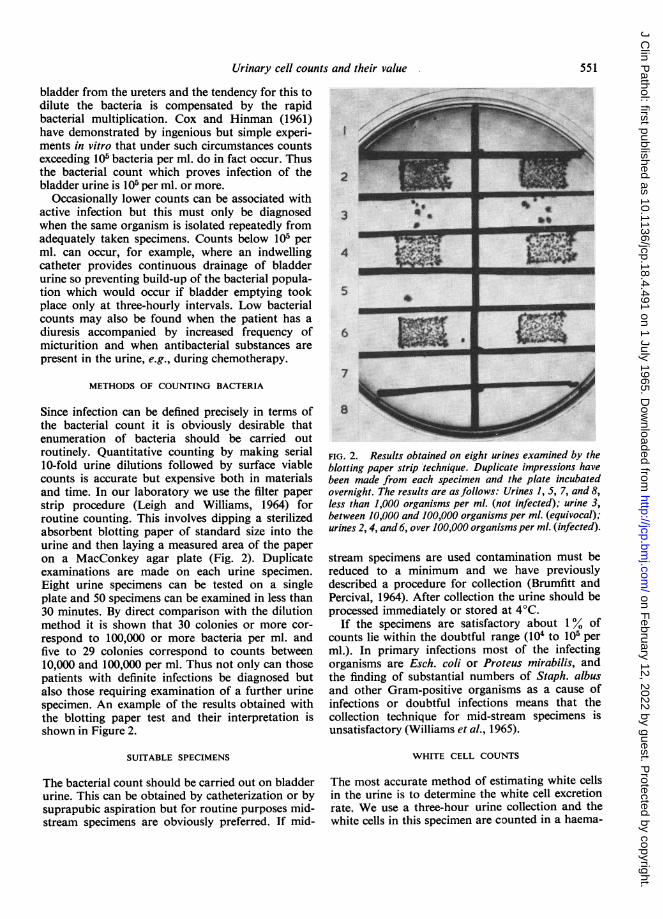
Urinary cell counts and their value
bladder from the ureters and the tendency for this todilute the bacteria is compensated by the rapidbacterial multiplication. Cox and Hinman (1961)have demonstrated by ingenious but simple experi-ments in vitro that under such circumstances countsexceeding 105 bacteria per ml. do in fact occur. Thusthe bacterial count which proves infection of thebladder urine is 105 per ml. or more.
Occasionally lower counts can be associated withactive infection but this must only be diagnosedwhen the same organism is isolated repeatedly fromadequately taken specimens. Counts below 105 perml. can occur, for example, where an indwellingcatheter provides continuous drainage of bladderurine so preventing build-up of the bacterial popula-tion which would occur if bladder emptying tookplace only at three-hourly intervals. Low bacterialcounts may also be found when the patient has adiuresis accompanied by increased frequency ofmicturition and when antibacterial substances arepresent in the urine, e.g., during chemotherapy.
METHODS OF COUNTING BACTERIA
Since infection can be defined precisely in terms ofthe bacterial count it is obviously desirable thatenumeration of bacteria should be carried outroutinely. Quantitative counting by making serial10-fold urine dilutions followed by surface viablecounts is accurate but expensive both in materialsand time. In our laboratory we use the filter paperstrip procedure (Leigh and Williams, 1964) forroutine counting. This involves dipping a sterilizedabsorbent blotting paper of standard size into theurine and then laying a measured area of the paperon a MacConkey agar plate (Fig. 2). Duplicateexaminations are made on each urine specimen.Eight urine specimens can be tested on a singleplate and 50 specimens can be examined in less than30 minutes. By direct comparison with the dilutionmethod it is shown that 30 colonies or more cor-respond to 100,000 or more bacteria per ml. andfive to 29 colonies correspond to counts between10,000 and 100,000 per ml. Thus not only can thosepatients with definite infections be diagnosed butalso those requiring examination of a further urinespecimen. An example of the results obtained withthe blotting paper test and their interpretation isshown in Figure 2.
SUITABLE SPECIMENS
The bacterial count should be carried out on bladderurine. This can be obtained by catheterization or bysuprapubic aspiration but for routine purposes mid-stream specimens are obviously preferred. If mid-
2
J 6
6 _
7U-
8
FIG. 2. Results obtained on eight urines examined by theblotting paper strip technique. Duplicate impressions havebeen made from each specimen and the plate incubatedovernight. The results are as follows: Urines 1, 5, 7, and 8,less than 1,000 organisms per ml. (not infected); urine 3,between 10,000 and 100,000 organisms per ml. (equivocal);urines 2, 4, and 6, over 100,000 organisms per ml. (infected).
stream specimens are used contamination must bereduced to a minimum and we have previouslydescribed a procedure for collection (Brumfitt andPercival, 1964). After collection the urine should beprocessed immediately or stored at 4°C.
If the specimens are satisfactory about 1% ofcounts lie within the doubtful range (104 to 105 perml.). In primary infections most of the infectingorganisms are Esch. coli or Proteus mirabilis, andthe finding of substantial numbers of Staph. albusand other Gram-positive organisms as a cause ofinfections or doubtful infections means that thecollection technique for mid-stream specimens isunsatisfactory (Williams et al., 1965).
WHITE CELL COUNTS
The most accurate method of estimating white cellsin the urine is to determine the white cell excretionrate. We use a three-hour urine collection and thewhite cells in this specimen are counted in a haema-
551
qjmmw- v-- --m w-
%,#3 * 0
t
0 60
IN-74 ;W,# 1
m m
on February 12, 2022 by guest. P
rotected by copyright.http://jcp.bm
j.com/
J Clin P
athol: first published as 10.1136/jcp.18.4.491 on 1 July 1965. Dow
nloaded from

tological counting chamber. Since three-hour urinecollections are more liable to contamination thanare mid-stream specimens, especially in women withvaginal discharge, collection must be carefullysupervised. An excretion of 400,000 W.B.C. per hourhas been suggested as the upper limit of normal(Hutt, Chalmers, MacDonald, and de Wardener,1961; Little, 1962) and in fact this level representsonly a small concentration of white cells in the urine.A concentration of 10 W.B.C. per c.mm. urine isalways associated with a white cell excretion rate inexcess of 400,000 per hr.; 3-10 W.B.C. per c.mm.may or may not be associated with a raised white cellexcretion rate but where there are less than 3 W.B.C.per c.mm. the white cell excretion rate is alwayswithin normal limits (Little, 1964).
THE DIAGNOSTIC VALUE OF PYURIA
ACUTE SYMPTOMATIC INFECTIONS Taking 10 whitecells per c.mm. as a definite indication of an increasedwhite cell excretion, we found that 45 patients fromgeneral practice with symptoms of acute urinarytract infection and significant bacteriuria all had anincreased excretion of white cells (Mond et al., 1965).However, 47% of a further 45 patients with similarsymptoms but without significant bacteriuria alsohad increased white cell excretion (Table I). This was
TABLE IURINARY WHITE CELL CONCENTRATION IN
MID-STREAM URINE SPECIMENS FROM 90 PATIENTSWITH SYMPTOMS OF URINARY TRACT INFECTION
White Cells Infection Confirmed Infection Not Present(per c.mm.) (> 105 bacteria per ml.) (<106 bacteria per ml.)
TABLE IICORRELATION BETWEEN WHITE CELL AND BACTERIALCOUNTS ON MID-STREAM URINE SPECIMENS FROM 56 PATIENTSWITH SYMPTOMS OF URINARY TRACT INFECTION BUT WITH-
OUT SIGNIFICANT BACTERIURIA
Bacterial Count
W.B.C.per c.mm.
Above 5010-50Below 10
Below 1,000per ml.
43
29
Above 1,000per ml.
1552
neously and the urinary white cell concentrationreturns to normal.
ASYMPTOMATIC BACTERIURIA In bacteriuria of preg-nancy we found that at the time the bacteriuria wasfirst detected only 49% of patients had a urinarywhite cell concentration exceeding 10 per c.mm. andof the remainder 41 % had counts below 5 per c.mm.(Williams et al., 1965). Thus only 49% had anexcretion definitely in excess of 400,000 per ml.
OTHER CAUSES Pyuria without significant bacteriais found in association with a number of conditions,including tuberculosis, stone, following operationson the urinary tract, for some days after successfulchemotherapy of urinary tract infection, and in aproportion of post-partum women (Brumfitt, Davies,and Rosser, 1961). These causes of pyuria will not bedealt with in detail here.
THE DIAGNOSTIC VALUE OF PYURIA AND WHITE CELL
PROVOCATION TESTS IN THE ABSENCE OF SIGNIFICANTBACTERIURIA
Above 10Below 10
45 (100%)0
21 (47%)24 (53%)
not due to poor collection technique since vaginitiswas excluded and 94% of a control group of 53patients without urinary symptoms had normalwhite cell excretion. We considered that the ab-normal white cell excretion was due to a urethritiswhich also accounted for the patients' symptoms.When the urinary white cell concentration wascorrelated with bacterial counts above and below1,000 bacteria per ml. of urine (Table II) a definiterelation was found between bacterial counts ofabove 1,000 per ml. and pyuria. These findingssuggest that many women seen in general practicewith symptoms of urinary tract infection haveurethritis without infection of the bladder urine. Bywithholding treatment in such patients and carryingout daily examination of the urine it can be observedthat significant bacteriuria develops in some caseswhereas in others the symptoms disappear sponta-
It has already been stressed that white cell excretiongives an indication of inflammation within the urin-ary tract. From the preceding section it is clear thatbacteria multiplying in the urine without tissueinvasion may not be associated with pyuria, whereasinflammation of the urinary tract without infectionof the bladder urine can be associated with pyuria.The finding of an abnormal white cell excretion
rate in the absence of significant bacteriuria isevidence of inflammation within the urinary tract anddemands investigation. However, in chronic renaldisease the urine is frequently sterile and the whitecell excretion rate is within normal limits. Pears andHoughton (1959) studied the effect of administra-tion of bacterial cell wall lipo-polysaccharide (bac-terial pyrogen) to such patients and found that thosewith chronic pyelonephritis showed a significant in-crease in white cell excretion whereas those with otherchronic renal diseases, as well as normal subjects,did not respond in this way. Further investigations
552 W. Brumfitt
on February 12, 2022 by guest. P
rotected by copyright.http://jcp.bm
j.com/
J Clin P
athol: first published as 10.1136/jcp.18.4.491 on 1 July 1965. Dow
nloaded from
Urinary cell counts and their value
by Hutt et al. (1961) and Leather, Wills, and Gault(1963) showed that only about half the patients withdefinite evidence of chronic pyelonephritis gave apositive result and furthermore, a smaller proportionof patients with glomerulonephritis also gave apositive result.
Injection of bacterial lipo-polysaccharide leads toan increase in the level of circulating corticosteroids(Melby, Egdahl, and Spink, 1960) and this may occuras a result of pituitary stimulation (Conn, Fajans,Louis, Seltzer, and Kaine, 1954; Wexler, 1957;Wexler, Doglin, and Tryczynski, 1957). The findingthat corticosteroids given parenterally were them-selves able to stimulate the excretion of cells in theurine of pyelonephritic dogs and humans (Katz,Bourdo, and Moore, 1962) suggested that lipo-polysaccharide might produce its action by thispathway and in any case had the important advan-tage of not causing the unpleasant side effects whichfollow the injection of lipo-polysaccharide. Whenthe lipo-polysaccharide and prednisolone stimu-lation tests were carried out sequentially in the samegroup of patients a somewhat higher incidence ofpositive tests was found with prednisolone. Theprovocation of urinary cell excretion by injectedsteroids has, therefore, been used as a diagnosticmeasure for pyelonephritis (Katz, Valasquez, andBourdo, 1962; Little and de Wardener, 1962).Hutt et al. (1961) also used the lipo-polysaccha-
ride stimulation test in patients who had sufferedfrom upper urinary tract infection but where treat-ment had made the urine sterile and the white cellexcretion had returned to normal. They consideredthat a significant rise in white cell excretion followingpyrogen reveals that inflammation is persisting andis an indication for further chemotherapy.We carried out the prednisolone stimulation test
on the three groups of patients shown in Table III.
TABLE IIIRESULTS OF THE PREDNISOLONE STIMULATION TEST
IN VARIOUS GROUPS OF PATIENTS
Diagnosis Number Studied Test Positive
Chronic pyelonephritis 50Following apparentlysuccessful treatment ofacute pyelonephritis 26Chronic glomerulonephritis 7
20 (40%)
8 (30%)2
In patients with chronic pyelonephritis the test waspositive in 40 / of the patients but of seven patientswith glomerulonephritis positive tests were obtainedin two (29 %). Following apparently successfulantibiotic therapy for acute pyelonephritis the testwas positive in 30%. These patients were not givenfurther treatment and urine specimens were ex-amined over the next two years but none of these
patients have shown relapse due to the same or-ganism.We conclude from these findings that in patients
with chronic renal disease a positive stimulation testgives support to the diagnosis of chronic pyelo-nephritis but it must be remembered that positivetests can also occur in chronic glomerulonephritis.Tests carried out after treatment of acute pyeloneph-ritis must be interpreted with considerable cautionsince positive results may be obtained in the absenceof a progressive or chronic lesion as judged by theabsence of recurrent bacteriuria or subsequentclinical findings. In such patients we were unable tofind evidence that a positive stimulation test indi-cated foci of infection within the renal substance.The appearance of bacteria in the urine in associa-tion with a positive stimulation test is very unusual.Where unilateral chronic pyelonephritis is present
individual specimens collected by ureteric cathe-terization show a positive stimulation test on the sideof the lesion.The use of stimulation tests to differentiate
between pyelonephritis and infection confined to thelower urinary tract has not been explored.
LOCALIZATION OF THE SITE OF INFECTION WITHIN THEURINARY TRACT
It must be stressed that the finding of significantbacteriuria in a mid-stream specimen of urineprovides proof that bacteria are actively multiplyingin the bladder urine but gives no information aboutthe upper urinary tract. Similarly, the presence ofan abnormal white cell excretion reflects inflam-mation within the urinary tract but gives no indica-tion of its location or its aetiology. Because of thepresence of a valve mechanism at the lower end ofthe ureters and the peristaltic action of the ureters,infection of the bladder urine may be prevented frominvolving the upper urinary tract. Unfortunatelyit is becoming increasingly clear that the absenceof upper urinary tract symptoms is no guaranteeagainst renal involvement. In the individual patientwith significant bacteriuria it would be valuable todecide whether or not there is such renal involve-ment. We have approached this problem by meas-uring the serum antibody response to the infectingorganism and have shown that patients with titresabove the normal range can regularly be shown tohave infection of the upper urinary tract (Brumfittand Percival, 1963; Percival, Brumfitt, and deLouvois, 1964).An alternative method of demonstrating involve-
ment of the upper urinary tract is by means ofureteric catheterization. Cystoscopy is carried outduring diuresis and a specimen of bladder urine
553
on February 12, 2022 by guest. P
rotected by copyright.http://jcp.bm
j.com/
J Clin P
athol: first published as 10.1136/jcp.18.4.491 on 1 July 1965. Dow
nloaded from
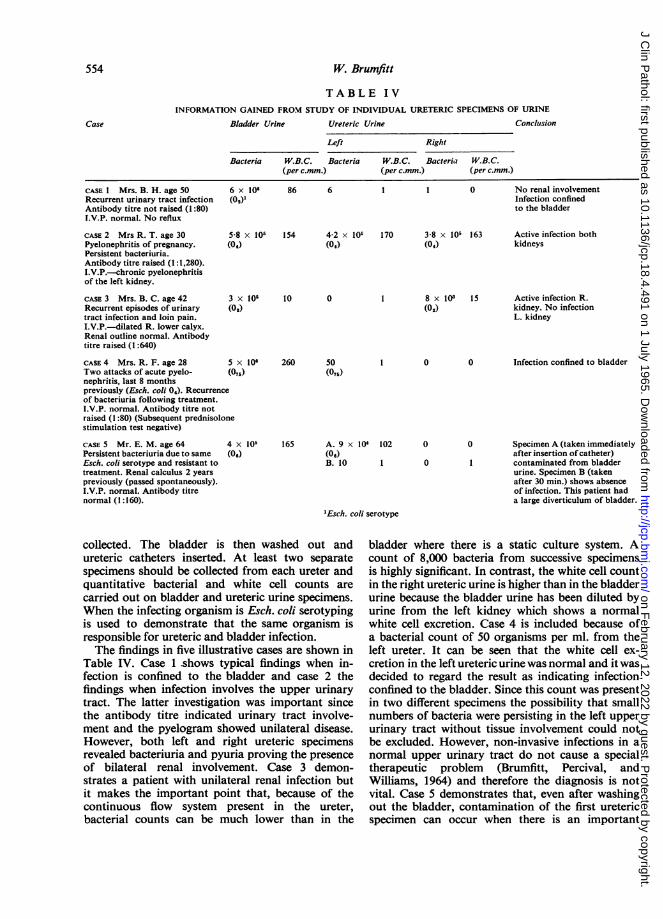
W. Brumfitt
TABLE IVINFORMATION GAINED FROM STUDY OF INDIVIDUAL URETERIC SPECIMENS OF URINE
Bladder Urine Ureteric Urine Conclusion
Left Right
Bacteria W.B.C. Bacteria W.B.C. Bacteria W.B.C.(per c.mm.) (per c.mm.) (per c.mm.)
CASE I Mrs. B. H. age 50Recurrent urinary tract infectionAntibody titre not raised (1:80)T.V.P. normal. No reflux
CASE 2 Mrs R. T. age 30Pyelonephritis of pregnancy.Persistent bacteriuria.Antibody titre raised (1: 1,280).I.V.P.-chronic pyelonephritisof the left kidney.
CASE 3 Mrs. B. C. age 42Recurrent episodes of urinarytract infection and loin pain.I.V.P.-dilated R. lower calyx.Renal outline normal. Antibodytitre raised (1:640)
CASE 4 Mrs. R. F. age 28 5Two attacks of acute pyelo- (07nephritis, last 8 monthspreviously (Esch. coli 04). Recurrenceof bacteriuria following treatment.I.V.P. normal. Antibody titre notraised (1:80) (Subsequent prednisolonestimulation test negative)
CASE S Mr. E. M. age 64 4,Persistent bacteriuria due to same (06Esch. coli serotype and resistant totreatment. Renal calculus 2 yearspreviously (passed spontaneously).I.V.P. normal. Antibody titrenormal (1:160).
6 x 10⁶(00)1
5-8 x 10⁵(0w)
3 x 10⁵(0,)
x 106s)
86 6 1 1 0 No renal involvementInfection confinedto the bladder
154
10
4-2 x 10r(04)
0
170 3-8 x 10⁵ 163(04)
8 x 10³ 15(02)
260 50(075)
x 105 1656)
A. 9 x I04 102(06)B. 10 I
0
Active infection bothkidneys
Active infection R.kidney. No infectionL. kidney
0 Infection confined to bladder
Specimen A (taken immediatelyafter insertion ofcatheter)contaminated from bladderurine. Specimen B (takenafter 30 min.) shows absenceof infection. This patient hada large diverticulum of bladder.
'Esch. coli serotype
collected. The bladder is then washed out andureteric catheters inserted. At least two separatespecimens should be collected from each ureter andquantitative bacterial and white cell counts arecarried out on bladder and ureteric urine specimens.When the infecting organism is Esch. coli serotypingis used to demonstrate that the same organism isresponsible for ureteric and bladder infection.The findings in five illustrative cases are shown in
Table IV. Case 1 shows typical findings when in-fection is confined to the bladder and case 2 thefindings when infection involves the upper urinarytract. The latter investigation was important sincethe antibody titre indicated urinary tract involve-ment and the pyelogram showed unilateral disease.However, both left and right ureteric specimensrevealed bacteriuria and pyuria proving the presenceof bilateral renal involvement. Case 3 demon-strates a patient with unilateral renal infection butit makes the important point that, because of thecontinuous flow system present in the ureter,bacterial counts can be much lower than in the
bladder where there is a static culture system. Acount of 8,000 bacteria from successive specimensis highly significant. In contrast, the white cell countin the right ureteric urine is higher than in the bladderurine because the bladder urine has been diluted byurine from the left kidney which shows a normalwhite cell excretion. Case 4 is included because ofa bacterial count of 50 organisms per ml. from theleft ureter. It can be seen that the white cell ex-cretion in the left ureteric urine was normal and it wasdecided to regard the result as indicating infectionconfined to the bladder. Since this count was presentin two different specimens the possibility that smallnumbers of bacteria were persisting in the left upperurinary tract without tissue involvement could notbe excluded. However, non-invasive infections in anormal upper urinary tract do not cause a specialtherapeutic problem (Brumfitt, Percival, andWilliams, 1964) and therefore the diagnosis is notvital. Case 5 demonstrates that, even after washingout the bladder, contamination of the first uretericspecimen can occur when there is an important
Case
554
on February 12, 2022 by guest. P
rotected by copyright.http://jcp.bm
j.com/
J Clin P
athol: first published as 10.1136/jcp.18.4.491 on 1 July 1965. Dow
nloaded from
Urinary cell counts and their value
source of infection in the bladder (in this case adiverticulum). This danger is overcome if more thana single specimen is collected.
CONCLUSIONS
To diagnose urinary tract infection quantitativebacterial counting is essential. The method chosenmust be accurate but sufficiently simple and cheap toallow it to be applied to routine examination of allurine specimens. Significant bacteriuria is evidence ofinfection in the bladder urine and other techniquesare required for localization of infection within theurinary tract.An increased white cell excretion rate is evidence
of inflammation at some point within the urinarytract. Increased white cell excretion may be found inthe absence of significant bacteriuria and normalwhite cell excretion when significant bacteriuria ispresent.
Pyuria and bacteriuria in a mid-stream specimenof urine can occur when infection is confined to thebladder but it must be stressed that the absence ofpyuria in no way excludes involvement of the kidney.Finally in advanced chronic renal disease, includingpyelonephritis, the urine is frequently sterile andthe white cell excretion normal.
ACKNOWLEDGEMENT
I am grateful to Dr. A. Percival who collaborated withme in much of the unpublished work described in thispaper.
REFERENCES
Brumfitt, W., Davies, B. I., and Rosser, E. ap I. (1961). Lancet, 2, 1059.and Percival, A. (1963). Proceedings of2nd international Congressof Nephrology, p. 260.
, (1964). J. clin. Path., 17, 482.-, and Williams, J. D. (1964). Brit. J. clin. Pract., 18, 503.
Conn, J. W., Fajans, S. S., Louis, L. H., Seltzer, H. S., and Kaine,H. D. (1954). Recent Progr. Hormone Res., 10, 471.
Cox, C. E., and Hinman, F. Jr. (1961). J. Urol. (Baltimore), 86, 739.Hutt, M. S. R., Chalmers, J. A., MacDonald, J. S., and de Wardener,
H. E. (1961). Lancet, 1, 351.Katz, Y. J., Bourdo, S. R., and Moore, R. S. (1962). Ibid., 1, 1140.-, Velasquez, A., and Bourdo, S. R. (1962). Ibid., 1, 1144.Leather, H. M., Wills, M. R., and Gault, H. M. (1963). Brit. med. J.,
1, 92.Leigh, D. A., and Williams, J. D. (1964). J. clin. Path., 17, 498.Little, P. J. (1962). Lancet, 1, 1149.
, (1964). Brit. J. Urol., 36, 360.-and de Wardener, H. E. (1962). Lancet, 1, 1145.Melby, J. C., Egdahl, R. H., and Spink, W. W. (1960). J. Lab. clin.
Med., 56, 50.Mond, N. C., Percival, A., Williams, J. D., and Brumfitt, W. (1965).
Lancet, 1, 514.Pears, M. A., and Houghton, B. J. (1959). Ibid., 2, 1167.Percival, A., Brumfitt, W., and de Louvois, J. (1964). Ibid., 2, 1027.Wexler, B. C., Doglin, A. E., and Tryczynski, E. W. (1957). Endo-
crinology, 61, 300., (1957). Ibid., 61, 488.
Williams, J. D., Leigh, D. A., Rosser, E. ap I., and Brumfitt, W. (1965).J. Obstet. Gynaec. Brit. Emp., in the press.
555
on February 12, 2022 by guest. P
rotected by copyright.http://jcp.bm
j.com/
J Clin P
athol: first published as 10.1136/jcp.18.4.491 on 1 July 1965. Dow
nloaded from

J. clin. Path. (1965), 18, 556
Diagnostic criteria of pyelonephritisP. J. LITTLE
From the Department of Medicine, Charing Cross Hospital Medical School,Fulham Hospital, London
It is said that the commonest cause of death fromrenal failure is pyelonephritis (Keuhnelian, Bartone,and Marshall, 1964). However, of all instances ofpyelonephritis found at necropsy only one thirdhave been diagnosed during life (Neumann andPryles, 1962; Kass, 1962). This implies that theclinical criteria by which we diagnose pyelonephritisare inadequate. It is important therefore that theinformation which is obtained from the urine aboutinfection of the urinary tract should be as accurate aspossible, for it is this information which drawsattention to the renal tract as a source of diseaseeven in the absence of symptoms.The extent to which accurate quantitative infor-
mation may assist in the diagnosis of pyelone-phritis is illustrated by the following patient.CASE 1 A 24-year-old woman, 16 weeks pregnant, wasadmitted complaining of shivering and vomiting threedays previously. She had been treat-d for two days withtetracycline. She had suffered from acute glomerularnephritis eight years previously. On examination noabnormality was found. The blood urea was 100 mg.%and the creatinine clearance 30 ml./min. There wasproteinuria, the urinary white cell excretion rate wasbelow 200,000 cells/hr. on three occasions, and the urinewas sterile. After an injection of prednisolone phosphatethe urine contained over 1 million white cells/hr. and arenal biopsy showed changes of acute pyelonephritiswith normal glomeruli. Recovery was complete followingtreatment with antibiotics and a subsequent pregnancywas uncomplicated.
To establish a diagnosis of pyelonephritis in sucha patient one relies heavily on information given bythe bacteriologist. The finding of a 'few pus cells'and 'scanty growth of E. coli' is quite inadequate.Such findings will be regarded as confirmation of adiagnosis only if it fits the clinical picture and dis-missed as due to contamination if it does not.
If accurate information about the urine is to beobtained the first responsibility falls on the clinicianto deliver carefully collected and fresh specimens ofurine to the laboratory. It is not justifiable to use acatheter to obtain urine for diagnostic purposes(Beeson, 1958). Some form of mid-stream samplingmust be employed. Inevitably such samples will be
slightly contaminated, especially when collected fromwomen. Contamination can be reduced by carefulcleaning of the perineum and by making the col-lection directly into a sterile wide-mouthed container.If there is a delay before the urine is delivered to thelaboratory the specimen should be stored in a re-frigerator or an iced thermos flask so that contamina-ting organisms will not multiply and reach significantnumbers. Urinary pathogen counts will not changemore than twofold in 48 hours in urines stored at40C.The urine must be examined to detect the presence
of inflammation as well as infection.The presence of inflammation is manifest by the
release of leucocytes into the urine. Normal urinecontains some leucocytes and so an upper limit ofnormal urinary white cell excretion measured by anytechnique must be established. Previous workers(Hamburger, Mathd, and de Verbizier, 1950; Hough-ton and Pears, 1957) have shown that the white cell
FEMALES
500.000X:
300.000
0
CL.3
ui
I1~0.000
1000
10.000-
.0
.00
0
.0o o 8ooo:000
0
o o 000 000-
MALES
. 0
0
0
0
0
.0
:00
FIG. 1. Urinary white cell excretion rates in normalsubjects. * = convalescent patients; 0 = nurses. Thebroken line is at 400,000 cells per hour (Lancet, 1962).
556
- - - - - w w w w
on February 12, 2022 by guest. P
rotected by copyright.http://jcp.bm
j.com/
J Clin P
athol: first published as 10.1136/jcp.18.4.491 on 1 July 1965. Dow
nloaded from

Diagnostic criteria ofpyelonephritis
excretion rate as measured in a timed urine sampleis remarkably constant in normal subjects when theurine is collected with a catheter. Figure 1 shows theurinary white cell excretion rates of 67 normalsubjects from whom urine was collected by a 'cleancatch' technique into two sterile containers (Little,1962). In all but two the urinary white cell excretionrate was below 400,000 cells per hour and this wehave accepted as our upper limit of normal. It hasbeen the custom in some laboratories to report thenumber of cells in the urine as 'cells per high-powerfield'. The inherent defect of this method is that thereis no upper limit of normal and its inaccuracy isdemonstrated by Figure 2. The white cell excretionrate is compared with the number of cells seen perhigh-power field in 304 urines. In 42 of the 155urines containing less than five cells per high-powerfield the white cell excretion rate is abnormal. Whenthe urinary white cell concentration in uncentrifugedurine is measured in a Fuchs Rosenthal countingchamber this simple technique gives a fairly closecorrelation with the white cell excretion rate (Fig. 3).When there are more than 10 cells per c.mm. thethe white cell excretion rate is abnormally high,whereas if there are less than 3 cells per c.mm. thewhite cell excretion rate is normal (Little, 1964).
In some patients with pyelonephritis there is not aconstant pyuria. A convenient method of showingthe presence of urinary tract inflammation in some ofthese patients is to examine the urine one-and-a-half,three, and 24 hours after an intravenous injection of40 mg. of prednisolone phosphate (Little and deWardener, 1962). Figure 4 shows the effect of suchan injection on the urinary white cell excretion ratein 25 patients with previously normal white cellexcretion rates and uninfected urine. In 12 theurinary white cell excretion rate rose to abnormallevels, demonstrating that there is some inflammationin the tissues adjoining the urinary tract.
Infection in the urinary tract may be accompaniedby evidence of inflammation. That this is not alwaystrue is demonstrated in Figure 5. There are 29patients shown, all of whom had asymptomaticbacteriuria, that is, their urine contained more than100,000 organisms per millilitre on two or moreconsecutive examinations, although they had nosymptoms of urinary tract infection. Fifteen had anormal white cell excretion rate. Two points may bemade from this. The first is that the absence ofpyuria does not absolve one from carrying out aurine culture, and secondly there is a group ofpatients with no pyuria or symptoms who neverthe-less have an infected urine. These patients are especi-ally liable to develop pyelonephritis and have a highincidence of renal tract abnormalities (Kincaid-Smith and Bullen, 1965). They can only be detected
100,000,000-
40,O,0000-
200QO,000
QO.OCO.QOO
0
,, 4,000.000-a-
u 1,000.000-0
4,00,000-EJ 400,CODOco
- 200,0C03II:1r lehlA-A-J
20,CO-
O,CO0
0
x
X Xxx x
XXx x x x
0 xx x x9 so* ,xxtl ~~~~x
000 IX xi* @0. x~
ixX x
Ex lxxx
0iI
X X
xPx x x
s x x
xx
sxxXX
2 8 32W. B.C. per HIGH POWER FIELD
FIG. 2. Urinary white cell excretion rate compared withthe number of cells seen by 'high-power field examination'in the same urines (Lancet, 1962).
1.000-
z
a 100-
z
U 0z
E 3
-
-I
.
me
*.
.00t0t GP .
0
* .*0 0
io0,o0o 10.000,000I,000,000 100,000,000
WHITE CELLS /hour CENTRIFUGED URINE
FIG. 3. Comparison of the white cell concentration (whitecells per c.mm.) with the white cell excretion rate (whitecells per hr.) (Brit. J. Urol., 1964).
xx x
xx
x xx X
K
li8+I
Ii
557
uL)ULU
-1
-A-9- i,4m 0
:. 'a
.-- -.-!b..t .
on February 12, 2022 by guest. P
rotected by copyright.http://jcp.bm
j.com/
J Clin P
athol: first published as 10.1136/jcp.18.4.491 on 1 July 1965. Dow
nloaded from

558
0
-J0
zu
-3
P. J. Little
FIG. 4. White cell excretion rates before and after theadministration of prednisolone phosphate to 25 patientswith chronic pyelonephritis.
100.000.0001
i0,000,000-
tI1,000.000
100,000
0
S
S
0
.00
0 0
0
0
.
The diagnosis of urinary tract infection carriesserious implications and necessitates careful studyand follow-up of the patient.Although the full natural history of the disease
has not been adequately studied, it is evident that ifinfection can be detected and eradicated, and anystructural abnormalities contributing to the renaldamage corrected, the progress of the disease can beslowed or even arrested. In some patients worthwhileimprovement in renal function can be attained, as forexample in the following patient.
CASE 2 A 45-year-old woman was admitted in oliguric
3 9 15 21 S 7 qDAYS WEEKS
FIG. 6. Reduction in blood urea and increase in creatinineclearance obtained during treatment.
renal failure. Both kidneys felt enlarged and tender. Herurine contained no excess of white cells but more than35 million E. coli/ml. and a trace of protein. She had nofever but her blood contained 50,000 W.B.C./c.mm. Therewas no evidence of renal tract obstruction, and a renalbiopsy showed the changes of acute pyelonephritis.Figure 6 shows the improvement in creatinine clearanceand blood urea which occurred after treatment withantibiotics. Clinical recovery was complete, and anintravenous pyelogram two years after the attack showedno obvious abnormality.
REFERENCES
Beeson, P. B. (1958). Amer. J. Med., 24, 1.Hamburger, J., MathM, G., and Verbizier, J. de (1950). Ann. Biol.
clin., 8, 627.Houghton, B. J., and Pears, M. A. (1957). Brit. med. J., 1, 622.Kass, E. H. (1962). Ann. intern. Med., 56, 46.Keuhnelian, J. G., Bartone, F., and Marshall, V. F. (1964). J. Urol.
(Baltimore), 91, 467.Kincaid-Smith, P., and Bullen, M. (1965). Lancet, 1, 395.Little, P. J. (1962). Ibid., 1, 1149.
(1964). Brit. J. Urol., 36, 360.- and de Wardener, H. E. (1962). Lancet, 1, 1145.Neumann, C. G., and Pryles, C. V. (1962). Amer. J. Dis. Child., 104,
215.
E
8E
uJ
W-
8in
* *~
E0 L-~~~
u
0
1.000,)IOOPOO.000100.000 0.C00:000
W.B.C. / hour
FIG. 5. Comparison of the urinary bacterial count andwhite cell excretion rate in 29 patients with asymptomaticbacteriuria.
if some form of quantitative culture is carried out onall urine specimens submitted for examination.
This quantitation does not need to be elaborate aslong as some care is taken in the method used andthought given to the significance of the resultsobtained. Because some contamination of the urineis inevitable when a clean-catch technique is used asingle positive culture is not diagnostic of urinarytract infection (Kass, 1962). The collection andculture must be repeated two or even three timesaccording to the limitations of the methods used.
V t * o
on February 12, 2022 by guest. P
rotected by copyright.http://jcp.bm
j.com/
J Clin P
athol: first published as 10.1136/jcp.18.4.491 on 1 July 1965. Dow
nloaded from
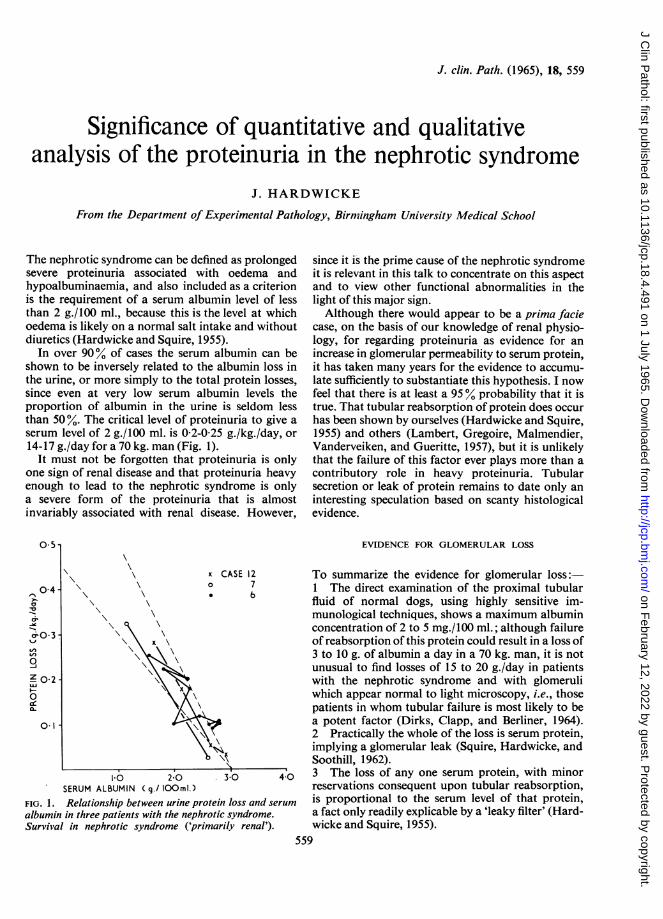
J. clin. Path. (1965), 18, 559
Significance of quantitative and qualitativeanalysis of the proteinuria in the nephrotic syndrome
J. HARDWICKE
From the Department of Experimental Pathology, Birmingham University Medical School
The nephrotic syndrome can be defined as prolongedsevere proteinuria associated with oedema andhypoalbuminaemia, and also included as a criterionis the requirement of a serum albumin level of lessthan 2 g./100 ml., because this is the level at whichoedema is likely on a normal salt intake and withoutdiuretics (Hardwicke and Squire, 1955).
In over 90% of cases the serum albumin can beshown to be inversely related to the albumin loss inthe urine, or more simply to the total protein losses,since even at very low serum albumin levels theproportion of albumin in the urine is seldom lessthan 50%. The critical level of proteinuria to give aserum level of 2 g./100 ml. is 0-2-0-25 g./kg./day, or14-17 g./day for a 70 kg. man (Fig. 1).
It must not be forgotten that proteinuria is onlyone sign of renal disease and that proteinuria heavyenough to lead to the nephrotic syndrome is onlya severe form of the proteinuria that is almostinvariably associated with renal disease. However,
0.5s
since it is the prime cause of the nephrotic syndromeit is relevant in this talk to concentrate on this aspectand to view other functional abnormalities in thelight of this major sign.Although there would appear to be a prima facie
case, on the basis of our knowledge of renal physio-logy, for regarding proteinuria as evidence for anincrease in glomerular permeability to serum protein,it has taken many years for the evidence to accumu-late sufficiently to substantiate this hypothesis. I nowfeel that there is at least a 95% probability that it istrue. That tubular reabsorption of protein does occurhas been shown by ourselves (Hardwicke and Squire,1955) and others (Lambert, Gregoire, Malmendier,Vanderveiken, and Gueritte, 1957), but it is unlikelythat the failure of this factor ever plays more than acontributory role in heavy proteinuria. Tubularsecretion or leak of protein remains to date only aninteresting speculation based on scanty histologicalevidence.
EVIDENCE FOR GLOMERULAR LOSS
x
0
.
CASE 127b
x \
\x
N\
10 2-0 3-0 40SERUM ALBUMIN Cg./ lOOml.)
FIG. 1. Relationship between urine protein loss and serum
albumin in three patients with the nephrotic syndrome.Survival in nephrotic syndrome ('primarily renal').
To summarize the evidence for glomerular loss:1 The direct examination of the proximal tubularfluid of normal dogs, using highly sensitive im-munological techniques, shows a maximum albuminconcentration of 2 to 5 mg./100 ml.; although failureof reabsorption of this protein could result in a loss of3 to 10 g. of albumin a day in a 70 kg. man, it is notunusual to find losses of 15 to 20 g./day in patientswith the nephrotic syndrome and with glomeruliwhich appear normal to light microscopy, i.e., thosepatients in whom tubular failure is most likely to bea potent factor (Dirks, Clapp, and Berliner, 1964).2 Practically the whole of the loss is serum protein,implying a glomerular leak (Squire, Hardwicke, andSoothill, 1962).3 The loss of any one serum protein, with minorreservations consequent upon tubular reabsorption,is proportional to the serum level of that protein,a fact only readily explicable by a 'leaky filter' (Hard-wicke and Squire, 1955).
559
0-4
0-1
11
I on February 12, 2022 by guest. P
rotected by copyright.http://jcp.bm
j.com/
J Clin P
athol: first published as 10.1136/jcp.18.4.491 on 1 July 1965. Dow
nloaded from
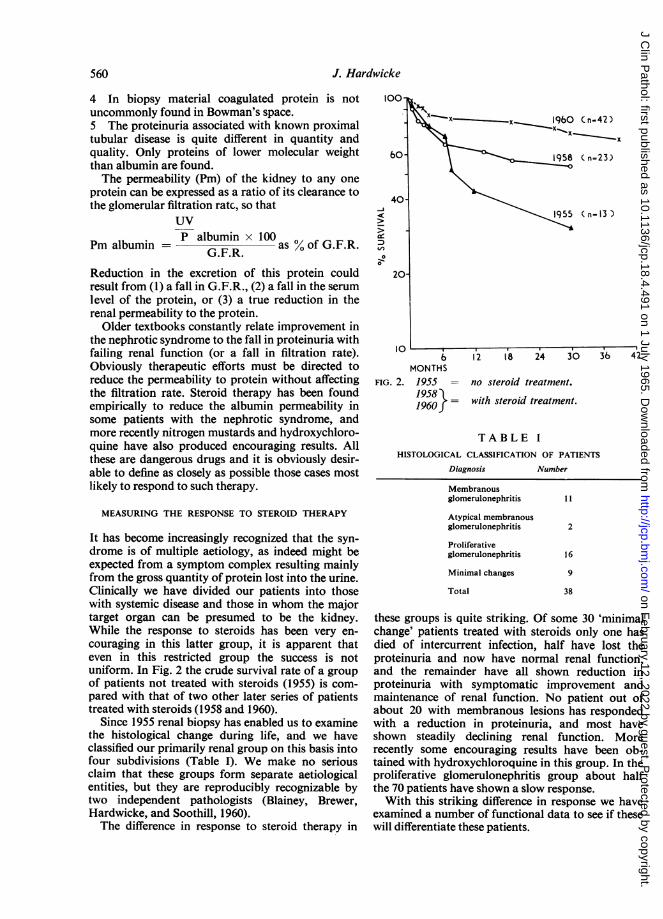
J. Hardwicke
4 In biopsy material coagulated protein is notuncommonly found in Bowman's space.5 The proteinuria associated with known proximaltubular disease is quite different in quantity andquality. Only proteins of lower molecular weightthan albumin are found.The permeability (Pm) of the kidney to any one
protein can be expressed as a ratio of its clearance tothe glomerular filtration ratc, so that
UV
albumin albuminPm albumin = as % of G.F.R.
Reduction in the excretion of this protein couldresult from (1) a fall in G.F.R., (2) a fall in the serumlevel of the protein, or (3) a true reduction in therenal permeability to the protein.
Older textbooks constantly relate improvement inthe nephrotic syndrome to the fall in proteinuria withfailing renal function (or a fall in filtration rate).Obviously therapeutic efforts must be directed toreduce the permeability to protein without affectingthe filtration rate. Steroid therapy has been foundempirically to reduce the albumin permeability insome patients with the nephrotic syndrome, andmore recently nitrogen mustards and hydroxychloro-quine have also produced encouraging results. Allthese are dangerous drugs and it is obviously desir-able to define as closely as possible those cases mostlikely to respond to such therapy.
MEASURING THE RESPONSE TO STEROID THERAPY
It has become increasingly recognized that the syn-drome is of multiple aetiology, as indeed might beexpected from a symptom complex resulting mainlyfrom the gross quantity of protein lost into the urine.Clinically we have divided our patients into thosewith systemic disease and those in whom the majortarget organ can be presumed to be the kidney.While the response to steroids has been very en-couraging in this latter group, it is apparent thateven in this restricted group the success is notuniform. In Fig. 2 the crude survival rate of a groupof patients not treated with steroids (1955) is com-pared with that of two other later series of patientstreated with steroids (1958 and 1960).
Since 1955 renal biopsy has enabled us to examinethe histological change during life, and we haveclassified our primarily renal group on this basis intofour subdivisions (Table I). We make no seriousclaim that these groups form separate aetiologicalentities, but they are reproducibly recognizable bytwo independent pathologists (Blainey, Brewer,Hardwicke, and Soothill, 1960).The difference in response to steroid therapy in
100-
so-
40-
20
10
10 i-
6
MONTHSFIG. 2. 1955
195819601
Membranousglomerulonephritis
Atypical membranousglomerulonephritis
Proliferativeglomerulonephritis
Minimal changes
Total
11
2
16
9
38
these groups is quite striking. Of some 30 'minimalchange' patients treated with steroids only one hasdied of intercurrent infection, half have lost theproteinuria and now have normal renal function,and the remainder have all shown reduction inproteinuria with symptomatic improvement andmaintenance of renal function. No patient out ofabout 20 with membranous lesions has respondedwith a reduction in proteinuria, and most haveshown steadily declining renal function. Morerecently some encouraging results have been ob-tained with hydroxychloroquine in this group. In theproliferative glomerulonephritis group about halfthe 70 patients have shown a slow response.With this striking difference in response we have
examined a number of functional data to see if thesewill differentiate these patients.
( n=23)
(n=13 )
12 18 24 36 42
no steroid treatment.
with steroid treatment.
TABLE IHISTOLOGICAL CLASSIFICATION OF PATIENTS
Diagnosis Number
560
on February 12, 2022 by guest. P
rotected by copyright.http://jcp.bm
j.com/
J Clin P
athol: first published as 10.1136/jcp.18.4.491 on 1 July 1965. Dow
nloaded from
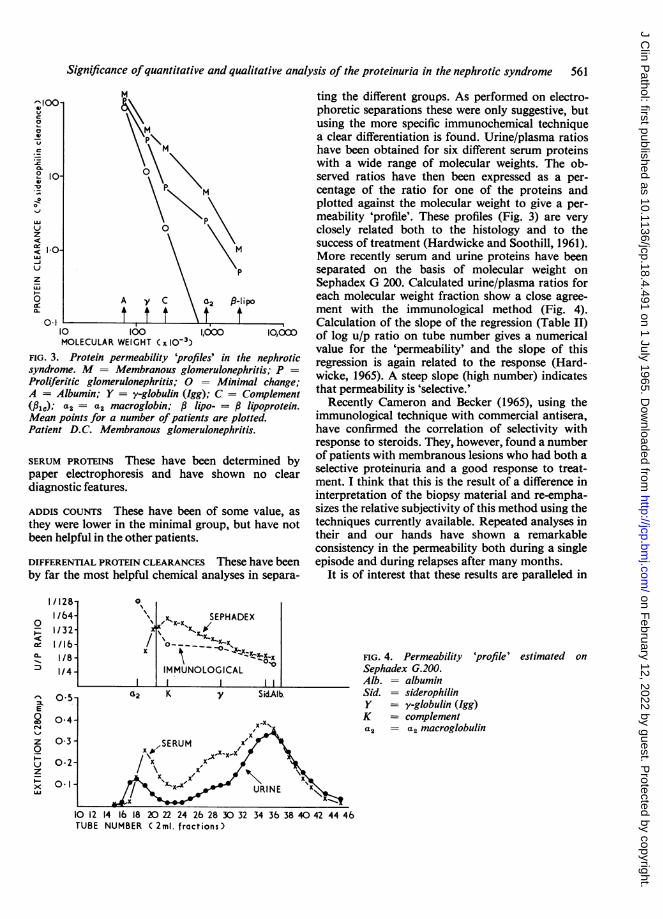
Significance ofquantitative and qualitative analysis of the proteinuria in the nephrotic syndrome 561
P-lipo
10 100 1,000 10,000MOLECULAR WEIGHT C x 10-3)
FIG. 3. Protein permeability 'profiles' in the nephroticsyndrome. M = Membranous glomerulonephritis; P =
Proliferitic glomerulonephritis; 0 = Minimal change;A = Albumin; Y = y-globulin (Igg); C = Complement(P¢); a2 = a2 macroglobin; , lipo- = lipoprotein.Mean points for a number ofpatients are plotted.Patient D.C. Membranous glomerulonephritis.
SERUM PROTEINS These have been determined bypaper electrophoresis and have shown no cleardiagnostic features.
ADDIS COUNTS These have been of some value, asthey were lower in the minimal group, but have notbeen helpful in the other patients.
DIFFERENTIAL PROTEIN CLEARANCES These have beenby far the most helpful chemical analyses in separa-
ting the different groups. As performed on electro-phoretic separations these were only suggestive, butusing the more specific immunochemical techniquea clear differentiation is found. Urine/plasma ratioshave been obtained for six different serum proteinswith a wide range of molecular weights. The ob-served ratios have then been expressed as a per-centage of the ratio for one of the proteins andplotted against the molecular weight to give a per-meability 'profile'. These profiles (Fig. 3) are veryclosely related both to the histology and to thesuccess of treatment (Hardwicke and Soothill, 1961).More recently serum and urine proteins have beenseparated on the basis of molecular weight onSephadex G 200. Calculated urine/plasma ratios foreach molecular weight fraction show a close agree-ment with the immunological method (Fig. 4).Calculation of the slope of the regression (Table II)of log u/p ratio on tube number gives a numericalvalue for the 'permeability' and the slope of thisregression is again related to the response (Hard-wicke, 1965). A steep slope (high number) indicatesthat permeability is 'selective.'
Recently Cameron and Becker (1965), using theimmunological technique with commercial antisera,have confirmed the correlation of selectivity withresponse to steroids. They, however, found a numberof patients with membranous lesions who had both aselective proteinuria and a good response to treat-ment. I think that this is the result of a difference ininterpretation of the biopsy material and re-empha-sizes the relative subjectivity of this method using thetechniques currently available. Repeated analyses intheir and our hands have shown a remarkableconsistency in the permeability both during a singleepisode and during relapses after many months.
It is of interest that these results are paralleled in
FIG. 4. PermeabilitySephadex G.200.Alb. = albuminSid. = siderophilinY = y-globulin (Ig}K = complementa2 = a2 macroglob
'profile' estimated on
TUBE NUMBER ( 2ml. fractions)
0
-
0t.
E0
zoI-
z
xLAJ
I
on February 12, 2022 by guest. P
rotected by copyright.http://jcp.bm
j.com/
J Clin P
athol: first published as 10.1136/jcp.18.4.491 on 1 July 1965. Dow
nloaded from
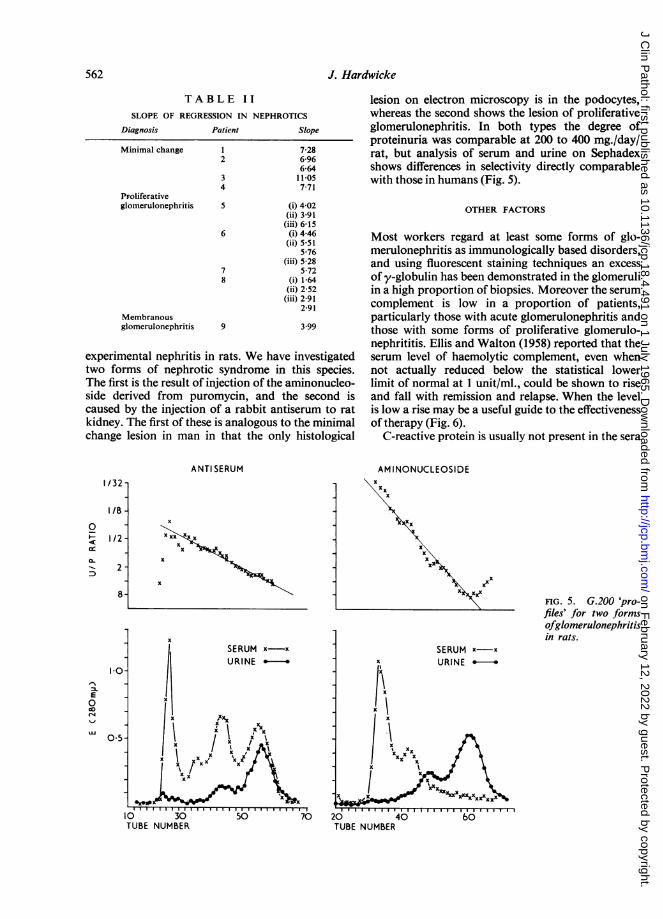
J. Hardwicke
TABLE IISLOPE OF REGRESSION IN NEPHROTICS
Diagnosis Patient
Minimal change 12
4PFoliferativeglomerulonephritis 5
6
78
Membranousglomerulonephritis 9
Slope
7-286-966-6411-05771
(i) 4-02(ii) 3-91(iii) 6-15(i) 4-46(ii) 5-51
5-76(iii) 5-28
5-72(i) 1-64(ii) 2-52(iii) 2-91
2-91
3.99
experimental nephritis in rats. We have investigatedtwo forms of nephrotic syndrome in this species.The first is the result of injection of the aminonucleo-side derived from puromycin, and the second iscaused by the injection of a rabbit antiserum to ratkidney. The first of these is analogous to the minimalchange lesion in man in that the only histological
lesion on electron microscopy is in the podocytes,whereas the second shows the lesion of proliferativeglomerulonephritis. In both types the degree ofproteinuria was comparable at 200 to 400 mg./day/rat, but analysis of serum and urine on Sephadexshows differences in selectivity directly comparablewith those in humans (Fig. 5).
OTHER FACTORS
Most workers regard at least some forms of glo-merulonephritis as immunologically based disorders,and using fluorescent staining techniques an excessof y-globulin has been demonstrated in the glomeruliin a high proportion of biopsies. Moreover the serumcomplement is low in a proportion of patients,particularly those with acute glomerulonephritis andthose with some forms of proliferative glomerulo-nephrititis. Ellis and Walton (1958) reported that theserum level of haemolytic complement, even whennot actually reduced below the statistical lowerlimit of normal at 1 unit/ml., could be shown to riseand fall with remission and relapse. When the levelis low a rise may be a useful guide to the effectivenessof therapy (Fig. 6).
C-reactive protein is usually not present in the sera
ANTI SERUM
x
Xx
XXx,
X o
AM INONUCLEOS IDEIx~
FIG. 5. G.200 'pro-files' for two formsofglomerulonephritisin rats.
TUBE NUMBER
I/32 -
1/8 -
I12 -
8-
0
CLI-
1.
E0
0-5
10 30TUBE NUMBER
562
on February 12, 2022 by guest. P
rotected by copyright.http://jcp.bm
j.com/
J Clin P
athol: first published as 10.1136/jcp.18.4.491 on 1 July 1965. Dow
nloaded from
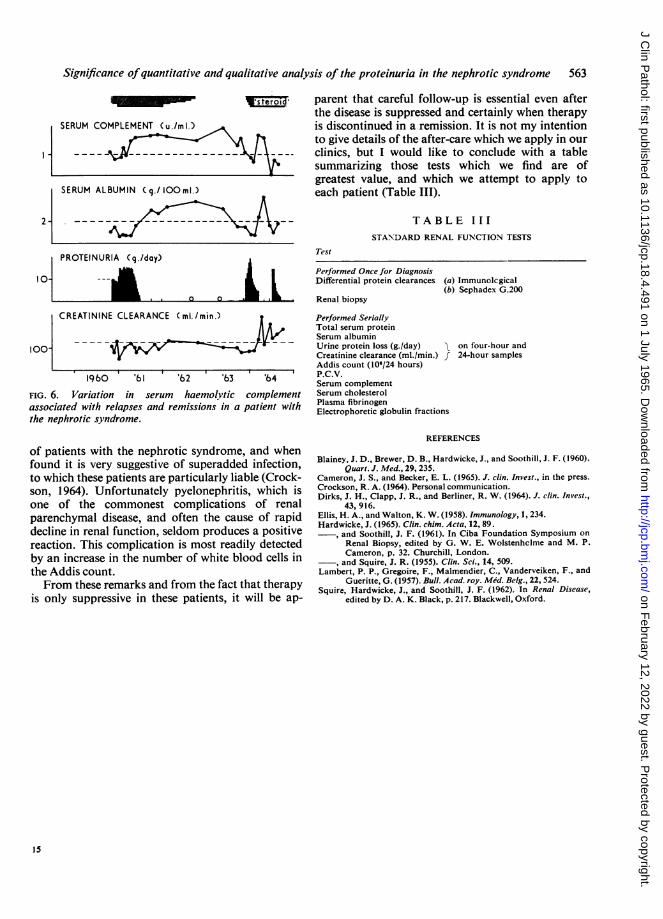
Significance ofquantitative and qualitative analysis of the proteinuria in the nephrotic syndrome 563
SERUM COMPLEMENT (u./mi.)
_~~~ ~~~~_-^ ______
SERUM ALBUMIN (q./1ooml.)
2-
PROTEINURIA (q./day)
I0- _
XLLe roi4,parent that careful follow-up is essential even afterthe disease is suppressed and certainly when therapyis discontinued in a remission. It is not my intentionto give details of the after-care which we apply in ourclinics, but I would like to conclude with a table
bsummarizing those tests which we find are ofgreatest value, and which we attempt to apply toeach patient (Table III).
TABLE IIISTANDARD RENAL FUNCTION TESTS
Test
Performed Once for DiagnosisDifferential protein clearances (a) Immunolcgical
(b) Sephadex G.200Renal biopsy
CREATININE CLEARANCE (ml./min.) Performed Serially
Total serum proteinSerum albumin
IOO- i t Urine protein loss (g./day) Q on four-hour and
Creatinine clearance (ml./min.) f 24-hour samplesAddis count (106/24 hours)
196bO 6'1 'b2 6tz3 6tz4 P.C.V.Serum complement
FIG. 6. Variation in serum haemolvtic complement Serum cholesterolassociated with relapses and remissions in a patient with Plasma fibrinogenthe nephrotic syndrome.
Electrophoretic globulin fractions
of patients with the nephrotic syndrome, and whenfound it is very suggestive of superadded infection,to which these patients are particularly liable (Crock-son, 1964). Unfortunately pyelonephritis, which isone of the commonest complications of renalparenchymal disease, and often the cause of rapiddecline in renal function, seldom produces a positivereaction. This complication is most readily detectedby an increase in the number of white blood cells inthe Addis count.From these remarks and from the fact that therapy
is only suppressive in these patients, it will be ap-
REFERENCES
Blainey, J. D., Brewer, D. B., Hardwicke, J., and Soothill, J. F. (1960).Quart. J. Med., 29, 235.
Cameron, J. S., and Becker, E. L. (1965). J. clin. Invest., in the press.Crockson, R. A. (1964). Personal communication.Dirks, J. H., Clapp, J. R., and Berliner, R. W. (1964). J. clin. Invest.,
43, 916.Ellis, H. A., and Walton, K. W. (1958). Immunology, 1, 234.Hardwicke, J. (1965). Clin. chim. Acta, 12, 89.
and Soothill, J. F. (1961). In Ciba Foundation Symposium onRenal Biopsy, edited by G. W. E. Wolstenhclme and M. P.Cameron, p. 32. Churchill, London.and Squire, J. R. (1955). Clin. Sci., 14, 509.
Lambert, P. P., Gregoire, F., Malmendier, C., Vanderveiken, F., andGueritte, G. (1957). Bull. Acad. roy. Med. Belg., 22, 524.
Squire, Hardwicke, J., and Soothill, J. F. (1962). In Renal Disease,edited by D. A. K. Black, p. 217. Blackwell, Oxford.
0 0
on February 12, 2022 by guest. P
rotected by copyright.http://jcp.bm
j.com/
J Clin P
athol: first published as 10.1136/jcp.18.4.491 on 1 July 1965. Dow
nloaded from
J. clin. Path. (1965), 18, 564
Functional renal disorders in primary vascular diseaseW. S. PEART
From St. Mary's Hospital, Paddington, London
What I wish to discuss initially is the ability to distin-guish disorders in the kidney induced by blocks inmajor or relatively minor renal arteries, how onesets about it, and the limitations of the methods.Arteriography may show a typical atheromatousblock in the renal artery, and the difficulty is that wecannot say in every case, for obvious reasons,whether this is a primary cause of hypertension or issecondary to hypertension. This is the starting point.What are the consequences of interfering with themain arterial pressure in the renal artery? Thesehave been studied experimentally by a number ofpeople, and Selkurt (1951) made the first definitivestudies on the subject. His conclusions were thatwhen the arterial pressure to the kidney is reduced,water reabsorption increases as the glomerular fil-tration rate (G.F.R.) goes down. This is the firstpoint on which I want to concentrate, i.e., theincreased water reabsorption from a reduced glo-merular filtrate. This has certain consequences, asshown in the Table, which represents periods ofurine collection from both kidneys by uretericcatheter, and, as far as I am concerned, there is onlyone real way of detecting an obstruction to bloodflow in a main renal artery and that is by collectingthe urine from the two kidneys separately. All othermethods are approximate and not so good. In period11, with urine collections for equivalent time from thetwo kidneys, the urine flow was 9-2 ml. a minute onthe right as opposed to 2-7 ml. a minute on the op-posite side. What I wish to discuss in this paper arethose substances such as creatinine or inulin whichenter at the glomerulus and are neither added tonor subtracted in their passage down the tubule.In period lIthe inulin concentrations were 130 mg.per 100 ml. on the right as opposed to 375 mg.per 100 ml. on the left with the reduction inurine flow; in other words, with increased waterreabsorption, the concentration of inulin goes up,as in this period. When p-amino hippuric acid(P.A.H.) is considered, and this, at these sort ofconcentrations, is excreted by the tubules, it can beseen that this substance was also concentrated to133 mg. per 100 ml. as opposed to 44 mg. per 100ml. It will also be noted that the inulin clearance onthe affected side, the left side, was 38 ml. a minute as
opposed to 45 ml. a minute. It is very uncommonas long as there is an intact kidney beyond thestenosis, not to find a reduced clearance. If theclearances on the two sides are the same, thenusually the opposite kidney is damaged by someprocess, e.g., hypertensive vascular disease. And it isvery important to keep this principle in mind becausevarious workers have concentrated on indices: thetaking of a variety of figures, multiplying them, thendividing by another set of figures derived from theopposite kidney, and thus producing an index. Suchindices tend to obscure as much as they reveal, andI prefer to look at the figures set out and contem-plate what may be happening in the kidney. Thusyou can readily detect that both of the kidneys arediseased and not just one.One of the ways in which this is brought out is
in the pyelogram where there is a difference betweenthe two kidneys due to the fact that the density ofdye on one side is greater than on the other. Dyesused in pyelography are excreted with the glomerularfiltrate. They behave like creatinine or inulin andtherefore the figures for these substances will applyto the pyelogram and the density of the iodinatedsubstance used (sodium acetrizoate) is similarlyincreased.The Table shows a relatively easy situation to
diagnose with current techniques, including thebiochemical studies of the urine. Just to stress thedifficulty of diagnosis by arteriography, this in-vestigation sometimes only shows tiny abnormalitieswhich would often be overlooked if the arteriographywere not good but divided renal function studies willoften show the presence of an obstruction in thistype of case.
Other difficulties also arise where the stenosedartery is only supplying about a third of the kidney.How is this diagnosed? If there is a balanced ob-struction of the two sides, as sometimes occurs,then whatever method is used, the diagnosis isdifficult, except by arteriography and demonstrationof the pressure drop across the artery at operation.When there is a small area of the kidney involved,divided renal function studies will usually reveal adifference if about one-third of one kidney is in-volved. By doing repeated periods of collection,
564
on February 12, 2022 by guest. P
rotected by copyright.http://jcp.bm
j.com/
J Clin P
athol: first published as 10.1136/jcp.18.4.491 on 1 July 1965. Dow
nloaded from
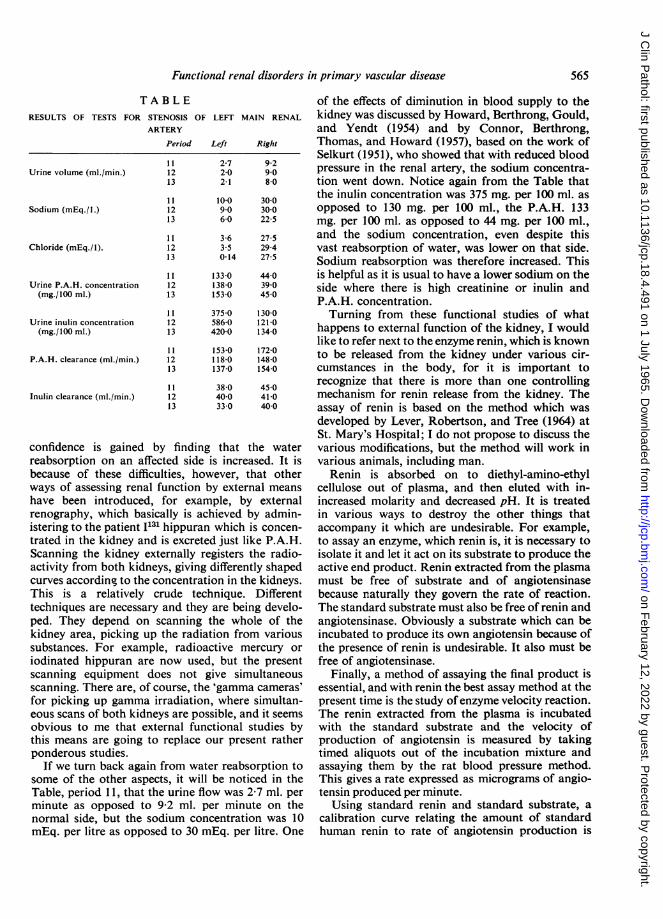
Functional renal disorders in primary vascular disease
T A B L ERESULTS OF TESTS FOR STENOSIS OF LEFT MAIN RENAL
ARTERY
Period
Urine volume (ml./min.)
Sodium (mEq./l.)
Chloride (mEq./1).
Urine P.A.H. concentration(mg./100 ml.)
Urine inulin concentration(mg./100 ml.)
P.A.H. clearance (ml./min.)
Inulin clearance (ml./min.)
111213
111213
111213
111213
111213
111213
111213
Left
2-7202-1
10-0906-0
3-63.50-14
Right
9-29 08-0
30030022 5
27-529-427-5
1330 440138-0 39 0153-0 45 0
375 0 130 0586-0 121 0420-0 134 0
153-0 172-0118-0 148-0137-0 154-0
38-0400330
45 041-0400
confidence is gained by finding that the waterreabsorption on an affected side is increased. It isbecause of these difficulties, however, that otherways of assessing renal function by external meanshave been introduced, for example, by externalrenography, which basically is achieved by admin-istering to the patient I131 hippuran which is concen-trated in the kidney and is excreted just like P.A.H.Scanning the kidney externally registers the radio-activity from both kidneys, giving differently shapedcurves according to the concentration in the kidneys.This is a relatively crude technique. Differenttechniques are necessary and they are being develo-ped. They depend on scanning the whole of thekidney area, picking up the radiation from varioussubstances. For example, radioactive mercury oriodinated hippuran are now used, but the presentscanning equipment does not give simultaneousscanning. There are, of course, the 'gamma cameras'for picking up gamma irradiation, where simultan-eous scans of both kidneys are possible, and it seemsobvious to me that external functional studies bythis means are going to replace our present ratherponderous studies.
If we turn back again from water reabsorption tosome of the other aspects, it will be noticed in theTable, period 11, that the urine flow was 2-7 ml. perminute as opposed to 9-2 ml. per minute on thenormal side, but the sodium concentration was 10mEq. per litre as opposed to 30 mEq. per litre. One
of the effects of diminution in blood supply to thekidney was discussed by Howard, Berthrong, Gould,and Yendt (1954) and by Connor, Berthrong,Thomas, and Howard (1957), based on the work ofSelkurt (1951), who showed that with reduced bloodpressure in the renal artery, the sodium concentra-tion went down. Notice again from the Table thatthe inulin concentration was 375 mg. per 100 ml. asopposed to 130 mg. per 100 ml., the P.A.H. 133mg. per 100 ml. as opposed to 44 mg. per 100 ml.,and the sodium concentration, even despite thisvast reabsorption of water, was lower on that side.Sodium reabsorption was therefore increased. Thisis helpful as it is usual to have a lower sodium on theside where there is high creatinine or inulin andP.A.H. concentration.Turning from these functional studies of what
happens to external function of the kidney, I wouldlike to refer next to the enzyme renin, which is knownto be released from the kidney under various cir-cumstances in the body, for it is important torecognize that there is more than one controllingmechanism for renin release from the kidney. Theassay of renin is based on the method which wasdeveloped by Lever, Robertson, and Tree (1964) atSt. Mary's Hospital; I do not propose to discuss thevarious modifications, but the method will work invarious animals, including man.Renin is absorbed on to diethyl-amino-ethyl
cellulose out of plasma, and then eluted with in-increased molarity and decreased pH. It is treatedin various ways to destroy the other things thataccompany it which are undesirable. For example,to assay an enzyme, which renin is, it is necessary toisolate it and let it act on its substrate to produce theactive end product. Renin extracted from the plasmamust be free of substrate and of angiotensinasebecause naturally they govern the rate of reaction.The standard substrate must also be free of renin andangiotensinase. Obviously a substrate which can beincubated to produce its own angiotensin because ofthe presence of renin is undesirable. It also must befree of angiotensinase.
Finally, a method of assaying the final product isessential, and with renin the best assay method at thepresent time is the study ofenzyme velocity reaction.The renin extracted from the plasma is incubatedwith the standard substrate and the velocity ofproduction of angiotensin is measured by takingtimed aliquots out of the incubation mixture andassaying them by the rat blood pressure method.This gives a rate expressed as micrograms of angio-tensin produced per minute.
Using standard renin and standard substrate, acalibration curve relating the amount of standardhuman renin to rate of angiotensin production is
565
on February 12, 2022 by guest. P
rotected by copyright.http://jcp.bm
j.com/
J Clin P
athol: first published as 10.1136/jcp.18.4.491 on 1 July 1965. Dow
nloaded from

drawn. With the unknown, having calculated therate of production, the equivalent amounts ofstandard human renin are read off the curve. Asthere is no uniform standard throughout the world asyet, this is then related to the standard used in ourown laboratory, and we can compare one situationor change with another. Using this technique, Brown,Davies, Doak, Lever, and Roberton (1963), Brown,Davies, Lever, Parker, and Roberton (1965a),Brown, Davies, Lever, and Robertson (1964),Brown, Davies, Lever, Robertson, and Skinner,(1965b) have described a number of things aboutthe controlling mechanisms for renin level in plasma.The method is sensitive to about 1/10 of the lowerlimit of normal, so measurements below normallevels are possible. This is important because reninlevels in plasma are often below normal.The situation in renal vascular disease will always
be somewhat complex because of the various factorswhich control the output of renin from the kidney.With any decrease of renal artery pressure, there isreasonable evidence that renal receptor is stimulatedwhich leads to increased output of renin. We callthis sensitive complex the juxtaglomerular apparatus.It is highly likely that one receptor site in the kidneyis in the afferent arteriole. We know from the workof various groups of people (Gross, 1958, 1960;Davis, 1961; Laragh, Angers, Kelly, and Lieber-mann, 1960; Mulrow and Ganong, 1961; Genest,Nowacznyski, Koiw, Sandor, and Biron, 1960) thatangiotensin will stimulate the production of aldo-sterone, which acts on renal tubules, leading toinitial sodium retention.From the renin assays in man, it is also known that
sodium depletion causes an increased plasma level ofrenin. The receptor site here may be in the distaltubule because one of the controlling mechanismsmight be the molality or the sodium concentrationin the distal convoluted tubule, therefore affectingthe macula densa. Decrease of renal artery pressure,leading to alteration of glomerular filtration rate,increases water and sodium reabsorption, altersurine molality and the sodium concentration in thedistal convoluted tubule, and it may well be thatapart from acting as a direct stimulus to the afferentarteriole, the effect could be on the composition ofthe urine as well.Renin plasma level rises in normal subjects when
sodium is restricted so that urinary sodium fallsmarkedly. Again in Addison's disease, with sodiumdepletion the renin level is markedly increased. Thisincidentally is very much higher than anythingusually seen in hypertension and renal vasculardisease. Patients who show clearly evidence of secon-dary aldosteronism with cirrhosis of the liver andascites, have a renin level increased well above
normal. Sodium retention is a distinct feature,those without ascites usually do not retain sodiumand the renin levels then are close to normal ornormal.
In hypertension, in patients who have renal arterialstenosis, and by that I mean those patients in whomdivided renal function studies have shown thechanges consistent with arterial obstruction, there isa scatter of values, many falling within the normalrange. Those without renal arterial stenosis fallusually within the normal range. With malignanthypertension, the amount of renin in the peripheralblood usually rises. It is obvious that renin levels willnot be a simple straightforward test of renal vasculardisease as such. Many factors must be considered.
Patients with renal artery stenosis and hyperten-sion, who have a plasma potassium level below 3 1mEq. per litre, frequently are increased aldosteronesecretion and there is no simple relation: some havehigh but others low renin levels.Some of these variable factors and the reason for
this variation will show in three patients. One,who was in the care of Dr. Barraclough at St.Thomas's Hospital, had a normal blood pressurein December 1963. He became abruptly hypertensiveand presented signs of malignant hypertension witha blood pressure of 260/160 mm. Hg. His plasmasodium level, as in many of these patients, was ratherlow, but of even greater interest was that his plasmapotassium level was 2 5 mEq. per litre. His aldo-sterone secretion rate was 2,000 ,tg. per 24 hours.The plasma renin was 200 times normal. A tightrenal artery stenosis was discovered, a reconstruc-tive operation was performed with success, and theblood pressure came down to 140/90 mm. Hg. Theplasma sodium rose, the plasma potassium rose, andthe aldosterone secretion rate went down to normal,as did the plasma renin. That is a clear-cut demon-stration at first sight of the effect on plasma reninlevel of obstructing the renal artery. It must bepointed out that as sodium depletion is a cause of arise in renin, this must be taken into account as well,and it is not as straightforward as it looks. The angio-tensin produced by the renin might then be respon-sible for a large part of the aldosterone secretion.Another patient presented with quite severe
hypertension, low plasma potassium and total ex-changeable potassium, high exchangeable sodiumand aldosterone secretion rate over 100,0 /tg.per 24 hours, with the plasma renin below normal.He was treated with Aldactone and the plasmapotassium rose promptly, the blood pressure camedown slowly to normal, and after a time the reninlevel rose to the top level of normal; the aldosteronesecretion rate went on unabated showing thataldosterone in the blood alone is not sufficient to
W. S. Peart566
on February 12, 2022 by guest. P
rotected by copyright.http://jcp.bm
j.com/
J Clin P
athol: first published as 10.1136/jcp.18.4.491 on 1 July 1965. Dow
nloaded from
Functional renal disorders in primary vascular disease
depress renin; the exchangeable sodium and potas-sium levels returned to normal. Here, therefore, is agood example of the fact that if the effects of aldo-sterone are antagonised, then the output of renininto the blood is increased. This patient was curedby removal of a Conn's tumour.The last patient had a combination of effects
showing that if there is suprarenal activity sufficientto affect sodium and potassium balance, it is quitelikely that the effects of a renal artery stenosis can bereversed, because this patient had a renal arterystenosis which was operated upon successfully. Shehad been known to have high blood pressure for 15years; her plasma potassium level had been knownto be low for a large part of that time and after thereconstructive operation it stayed below normal. Atthis point we put her on Aldactone, corrected thepotassium deficit and brought her blood pressuredown to normal, where it has remained fortwo years. The plasma renin rose from its subnormallevel and it has stayed up within or near normalrange ever since. The significance is this. It wasshown very definitely on functional studies thatthis was an effective renal artery stenosis and at opera-tion a pressure gradient across it, but if, as is likely,this patient has a Conn's tumour in the supra-renal cortex, the effect of aldosterone on sodium andelectrolyte balance is capable of overcoming theeffects of renal artery stenosis which would, on thewhole, be tending to increase the renin level.To summarize, one can say that the major factors,
as far as we know at present, affecting renin
plasma levels, are interference with blood pressure,at any rate in the renal artery, and also, but verymarkedly so, effects on sodium balance in the body.Whether they operate through changing urine osmo-lality or sodium, particularly in the distal convolutedtubule, or not is a subject which is being studiedintensively at the present time, and it seems as if thisstimulus might be more potent under certain circum-stances than obstruction to blood flow.
Thanks are due to Blackwell Scientific Publications forpermission to reproduce the Table.
REFERENCES
Brown, J. J., Davies, D. L., Doak, P. B., Lever, A. F., and Robertson,J. I. S. (1963). Lancet, 2, 900.,, Lever, A. F., Parker, R. A., and Robertson, J. 1. S.(1965a). J. Physiol. (Lond.), 176, 418.,-, and Robertson, J. 1. S. (1964). Canad. med. Ass. J.,
90, 201.,-, ,1 , and Skinner, S. L. (1965b). In preparation.
Connor, T. B., Berthrong, M., Thomas, W. C., and Howard, J. E.(1957). Bull. Johns Hopk. Hosp., 100, 241.
Davis, J. 0. (1961). Recent Progr. Hormone Res., 17, 293.Genest, J., Nowaczynski, W., Koiw, E., Sandor, T., and Biron, P.
(1960). In Essential Hypertension: An International Symposium,edited by K. D. Bock and P. T. Cottier, p. 126. Springer-Verlag, Berlin.
Gross, F. (1958). Klin. Wschr., 36, 693.(1960). In Essential Hypertension: An International Symposium,edited by K. D. Bock and P. T. Cottier, p. 92. Springer-Verlag, Berlin.
Howard, J. E., Berthrong, M., Gould, D. M., and Yendt, E. R. (1954).Bull. Johns Hopk. Hosp., 94, 51.
Laragh, J. H., Angers, M., Kelly, W. G., and Liebermann, S. (1960).J. Amer. med. Ass., 174, 234.
Lever, A. F., Robertson, J. I. S., and Tree, M. (1964). Biochem. J., 91,346.
Mulrow, P. J., and Ganong, W. F. (1961). Yale J. biol. Med., 33, 386.Selkurt, E. E. (1951). Circulation, 4, 541.
567
on February 12, 2022 by guest. P
rotected by copyright.http://jcp.bm
j.com/
J Clin P
athol: first published as 10.1136/jcp.18.4.491 on 1 July 1965. Dow
nloaded from

J. clin. Path. (1965), 18, 568
Investigation of nephrocalcinosis and nephrolithiasisPAUL FOURMAN
From the Leeds General Infirmary
The problem of stone has always intrigued people.If you travel down the Roman road in the valley ofthe Tauber in Franconia you encounter the woodcarvings of Tilman Riemenschneider. One, in Bam-berg, on the tomb of Wilhelm II of Bavaria, showsSt. Benedict holding a large stone taken from theking's bladder. (The attending physician is asleep.)A stone of that size is quite likely to havebeen a cystine stone, cystine being so named becauseit was first isolated from bladder stones. I do notthink surgeons always exclude cystinuria in cases ofstone but this is easily done by a nitroprusside test.Cystine stones are the only organic ones that areopaque to x rays. Uric acid stones and the rarexanthine stones are not.Most stones are calcium stones, and nephro-
calcinosis always means a deposition of calcium inthe kidney. Nephrocalcinosis producing a radio-logical shadow is rare. As a necropsy finding it iscommon (Pyrah and Hodgkinson, 1960).
Table I lists some of the causes, and it will be seenthat the classification is not a satisfying one. Apart
TABLE ICONDMONS ASSOCIATED WITH NEPHROCALCINOSIS
Hypercalcaemia orHypercalciuria
The microradiograph (Fig. 1) shows the resultingcalcification of the cortex.Calcium deposited in a renal infarct may be seen
on radiographs.Renal tubular acidosis may be familial or it can be
acquired, as in one of a pair of identical twins undermy care; infantile renal acidosis does not produceradiological calcification. This condition, like in-fantile hypercalcaemia, was common 10 or 15 yearsago but is uncommon since the intake of vitamin Din infants has been more rigidly controlled. Thesefacts are not necessarily related.A rare cause of clinical nephrocalcinosis is oxalo-
sis, a failure in the metabolism of glycolic acid whenoxalic acid builds up and is excreted in abnormallylarge amounts. Calcium deposits from other causesare likely to be in the form of oxalate, for example,in uraemia. Indeed not all calcium in the kidney isnecessarily oxalate or phosphate; much of it may becarbonate. Renal acidosis and hyperparathyroidismare the main causes of radiological nephrocalcinosis.
Alkaline Urine? Kidney Cell Damage
Hyperparathyroidism Alkalosis MagnesiumVitamin D poisoning Renal tubular aci- deficiency
Infantile hypercalcaemia dosis Heavy metalSarcoidosis poisoning
also beryllium poisoningCarcinomaIdiopathic hypercalciuria
from metastatic calcification in the kidney fromhypercalcaemia, there is a group, which probablyincludes hyperparathyroidism and calciferol poison-ing and perhaps renal tubular acidosis, in which thedeposition of calcium may reflect alterations in therenal connective tissue, perhaps in the basementmembrane. Finally any form of cell damage maylead to dystrophic calcification. Of this I haveencountered an unusual example. We kept thepatient alive for six weeks by haemodialysis aftershe had post-partum cortical necrosis of the kidneys.
4
FIG. 1. Microradiograph showing cortical necrosis ofthe kidneys.
568
on February 12, 2022 by guest. P
rotected by copyright.http://jcp.bm
j.com/
J Clin P
athol: first published as 10.1136/jcp.18.4.491 on 1 July 1965. Dow
nloaded from
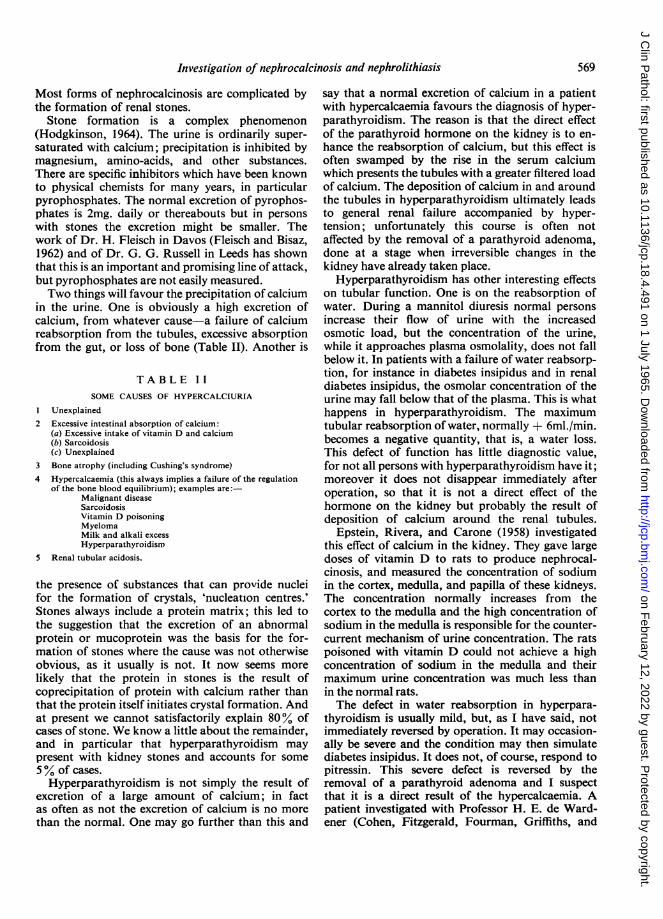
Investigation of nephrocalcinosis and nephrolithiasis
Most forms of nephrocalcinosis are complicated bythe formation of renal stones.
Stone formation is a complex phenomenon(Hodgkinson, 1964). The urine is ordinarily super-saturated with calcium; precipitation is inhibited bymagnesium, amino-acids, and other substances.There are specific inhibitors which have been knownto physical chemists for many years, in particularpyrophosphates. The normal excretion of pyrophos-phates is 2mg. daily or thereabouts but in persons
with stones the excretion might be smaller. Thework of Dr. H. Fleisch in Davos (Fleisch and Bisaz,1962) and of Dr. G. G. Russell in Leeds has shownthat this is an important and promising line of attack,but pyrophosphates are not easily measured.Two things will favour the precipitation of calcium
in the urine. One is obviously a high excretion ofcalcium, from whatever cause-a failure of calciumreabsorption from the tubules, excessive absorptionfrom the gut, or loss of bone (Table II). Another is
TABLE IlSOME CAUSES OF HYPERCALCIURIA
I Unexplained2 Excessive intestinal absorption of calcium:
(a) Excessive intake of vitamin D and calcium(b) Sarcoidosis(c) Unexplained
3 Bone atrophy (including Cushing's syndrome)
4 Hypercalcaemia (this always implies a failure of the regulationof the bone blood equilibrium); examples are:-
Malignant diseaseSarcoidosisVitamin D poisoningMyelomaMilk and alkali excess
Hyperparathyroidisnm
5 Renal tubular acidosis.
the presence of substances that can provide nucleifor the formation of crystals, 'nucleation centres.'Stones always include a protein matrix; this led tothe suggestion that the excretion of an abnormalprotein or mucoprotein was the basis for the for-mation of stones where the cause was not otherwiseobvious, as it usually is not. It now seems morelikely that the protein in stones is the result ofcoprecipitation of protein with calcium rather thanthat the protein itself initiates crystal formation. Andat present we cannot satisfactorily explain 80% ofcases of stone. We know a little about the remainder,and in particular that hyperparathyroidism maypresent with kidney stones and accounts for some5% of cases.
Hyperparathyroidism is not simply the result ofexcretion of a large amount of calcium; in factas often as not the excretion of calcium is no morethan the normal. One may go further than this and
say that a normal excretion of calcium in a patientwith hypercalcaemia favours the diagnosis of hyper-parathyroidism. The reason is that the direct effectof the parathyroid hormone on the kidney is to en-hance the reabsorption of calcium, but this effect isoften swamped by the rise in the serum calciumwhich presents the tubules with a greater filtered loadof calcium. The deposition of calcium in and aroundthe tubules in hyperparathyroidism ultimately leadsto general renal failure accompanied by hyper-tension; unfortunately this course is often notaffected by the removal of a parathyroid adenoma,done at a stage when irreversible changes in thekidney have already taken place.
Hyperparathyroidism has other interesting effectson tubular function. One is on the reabsorption ofwater. During a mannitol diuresis normal personsincrease their flow of urine with the increasedosmotic load, but the concentration of the urine,while it approaches plasma osmolality, does not fallbelow it. In patients with a failure of water reabsorp-tion, for instance in diabetes insipidus and in renaldiabetes insipidus, the osmolar concentration of theurine may fall below that of the plasma. This is whathappens in hyperparathyroidism. The maximumtubular reabsorption of water, normally + 6ml./min.becomes a negative quantity, that is, a water loss.This defect of function has little diagnostic value,for not all persons with hyperparathyroidism have it;moreover it does not disappear immediately afteroperation, so that it is not a direct effect of thehormone on the kidney but probably the result ofdeposition of calcium around the renal tubules.
Epstein, Rivera, and Carone (1958) investigatedthis effect of calcium in the kidney. They gave largedoses of vitamin D to rats to produce nephrocal-cinosis, and measured the concentration of sodiumin the cortex, medulla, and papilla of these kidneys.The concentration normally increases from thecortex to the medulla and the high concentration ofsodium in the medulla is responsible for the counter-current mechanism of urine concentration. The ratspoisoned with vitamin D could not achieve a highconcentration of sodium in the medulla and theirmaximum urine concentration was much less thanin the normal rats.The defect in water reabsorption in hyperpara-
thyroidism is usually mild, but, as I have said, notimmediately reversed by operation. It may occasion-ally be severe and the condition may then simulatediabetes insipidus. It does not, of course, respond topitressin. This severe defect is reversed by theremoval of a parathyroid adenoma and I suspectthat it is a direct result of the hypercalcaemia. Apatient investigated with Professor H. E. de Ward-ener (Cohen, Fitzgerald, Fourman, Griffiths, and
569
on February 12, 2022 by guest. P
rotected by copyright.http://jcp.bm
j.com/
J Clin P
athol: first published as 10.1136/jcp.18.4.491 on 1 July 1965. Dow
nloaded from
de Wardener, 1957) presented with thirst andpolyuria. He had neither kidney stones nor bonelesions. He was cured by the removal of a para-thyroid adenoma. In other renal disorders defectsin water reabsorption are linked with defects inhydrogen-ion excretion, for instance, in the Fanconisyndrome and in renal tubular acidosis. This led usto examine the hydrogen-ion excretion in certainpatients with hyperparathyroidism. Our patientswith hyperparathyroidism and renal stones were notable to achieve a normal excretion of lhydrogen ionafter ammonium chloride, and those without stonesexcreted hydrogen ion normally. Therefore thefailure to excrete hydrogen-ion is not a specific effectof the parathyroid hormone but it may contributeto the formation of stones (Fourman, McConkey,and Smith, 1960). It is interesting that Willsand McGowan (1964) in Bristol have comsistentlyfound a mild hyperchloraemic acidosis in hyper-parathyroidism. This acidosis may help to distinguishhyperparathyroidism from other causes of hyper-calcaemia which generally produce a mild alkalosiswith an excessive excretion of hydrogen ion in theurine.The essential step in determining whether a
patient with calcium containing renal stones hashyperparathyroidism is to establish whether he hasa raised serum calcium level. The rise may be smalland the standards of accuracy must therefore behigh. This is a difficult thing to achieve in the hurly-burly of routine work with the classical method ofShohl and Pedley, especially if the analysis is notundertaken very frequently. A variety of complexi-metric methods now make it possible to do theanalysis reliably and with the minimum expenditureof time in routine laboratories. Results are satis-factory with the E.E.L. machine. Flame photometricmethods require more supervision and the values innormals by this method are larger than by othermethods, possibly leading to difficulties in inter-pretation.The normal range by compleximetric methods is
9-1 to 10 7 mg./100 ml; a lot may depend on smalldeviations round about 10-7 mg./100 ml., a valuewhich a few years ago would probably have beenaccepted as normal. Some patients may have anabnormal value at one time and not at anotheraccording to the variation in their parathyroid acti-vity. It is important to avoid venous stasis whentaking blood and to correct the serum calcium forthe plasma albumin content.The serum calcium measures one effect of the
parathyroid hormone, its property of releasing cal-cium from the bone. Because of the difficulties indiagnosis by this method many people have tried totake advantage of the second effect of the hormone,
an increase in the urinary excretion of phosphorus,to establish parathyroid overactivity. The enhancedexcretion of phosphorus is not obvious in the steadystate of a patient on a normal diet. Normal persons,patients with hyperparathyroidism, with uraemia,with refractory rickets, and with renal stones fromother causes all excrete similar amounts of phos-phosphorus on normal diets and this is not surprisingas they must excrete what they absorb.
But is is possible of course that the kidney ex-cretes this amount of phosphorus at a lower bloodlevel in persons with parathyroid overactivity. Sopeople have tried to estimate the clearance ofphosphorus in hyperparathyroidism. With normaldiets the clearance does not differ consistentlybetween normal persons and patients with hyper-parathyroidism but the clearances spread out betterif the intake of phosphorus is held low before andduring the test. The clearance of phosphorus issupposed to be calculateJ by the usual clearance
UVformula C - where C is the clearance, U is the
P
concentration, V the urine volume, and P the plasmaconcentration. Rewritten this is CP = UV, and C isthe slope of the straight line relating P to UV; it is aconstant independent of P. But Milne, Stanbury, andThomson (1952) showed that C for phosphorus, farfrom being constant, increased as P, the serumconcentration of phosphorus, increased. A clearancefor phosphorus cannot be calculated without de-fining the conditions so narrowly that the word losesits original meaning.
Milne et al. (1952) investigated the clearance ofphosphorus in relation to the plasma level of phos-phorus which they varied by infusing phosphate.These results, derived from an acute experiment,are not directly applicable to the study of a patientin a steady state.
In an effort to circumvent these problems otherworkers have resorted to looking at the tubularreabsorption of phosphate, i.e., the proportion offiltered phosphate which is reabsorbed by the tubules(T.R.P.). The phosphorus presented for reabsorptionis the filtered phosphorus, i.e., plasma inorganicphosphorus (mg. per ml.) x glomerular filtration rate(ml. per min.) or Pp x G.F.R. This assumes (wrongly)that all the plasma inorganic phosphorus is filterable.Then the proportion of filtered P reabsorbed is
TRP Pp x GFR - P,VPp x GFR
PuVPp x GFR
where Pu is the concentration of phosphorus in theurine (mg. per ml.) and V is the urine volume (ml. per
570 Paul Fourman
on February 12, 2022 by guest. P
rotected by copyright.http://jcp.bm
j.com/
J Clin P
athol: first published as 10.1136/jcp.18.4.491 on 1 July 1965. Dow
nloaded from

Investigation of nephrocalcinosis and nephrolithiasis
min.). The glomeruler filtration rate is usually mea-
sured as the creatinine clearance, Cru
and (1) becomes
_ Pu x CrpPp x Cru
the term for volume cancelling out, which is con-venient as the minute volume is difficult to measure.The term
Pu x CrpPp x Cru
is in fact the ratio of clearances of phosphorus andcp
creatinine CCcr
_c-px-x v in other wordsCcr Pp Cru x V
TRP=I1-cpcr
This fact is perhaps disguised when TRP is expressedas a percentage as is often done:
%TRP I )p x 0cp.~ ~ ~ ~ ~ c
C P is usually less than 0 2. The variations are wide.CcrThe results are easier to interpret if the measure-ments are always made at the same time of the dayto overcome the effect of the diurnal rhythm and ifthe intake of phosphorus is standardized. Yamahiroand Reynolds (1962) used a daily intake of 600 mg.The T.R.P. is reduced in hyperparathyroidism andalso in osteomalacia, Cushing's syndrome, K-defici-ency, sarcoid, malignant disease (with and withouthypercalcaemia), multiple myeloma, cirrhosis, renaltubular acidosis, and renal lithiasis.The main point is that you are really looking at
the same thing when you are considering the tubularreabsorption ofphosphorus or the ratio of phosphateclearance to creatinine clearance. One is a simplefunction of the other and if the result of calculating
values for T.R.P. is not helpful, the result for C willCcr
not be useful either.Nordin and Fraser (1956) related the ratio of the
clearances of phosphorus and creatinine to the seruminorganic phosphorus concentration. Basing their
work partly on the data of Milne et al. (1952) they
drew a linear regression line for CP against serum PCcr
values ranging from 2mg./100 ml. to 8mg./100 ml.It is doubtful whether this is a linear function but themain question is what is the relation for the values ofthe serum P in which we are generally interested, i.e.,between 2mg. and 4 5 mg./100 ml.? No one wouldcare to draw a regression line for the points in thisinterval. Nordin and Fraser (1956) used the re-gression line, based on a wide variation in serum Pachieved by the infusion of phosphate to interpret
the -P in the steady state. The equation of theCcr
regression line was CP = 2 0-0 05 ± 0 12.Ccr 20
It will be noted that in this regression equation the
dependent variable, CP, includes P, the independentCcr
variable. No limits of error are given for the slope of
the regression line 20. But based on this equation the
authors have devised an index of phosphate excre-tion (P.E.I.).
P.E.I. - C- -2 + 0-05. They state that the normalCcr 20
P.E.I. is 0 + 0 12.Dr. Nordin tells me that whatever the theoreticalobjections, in his experience, the index serves as adiagnostic test of parathyroid function. It may bepossible to give it a sounder mathematical basis.
REFERENCES
Cohen, S. 1., Fitzgerald, M. G., Fourman, P., Griffiths, W. J., andde Wardener, H. E. (1957). Quart. J. Med., 26, 423.
Epstein, F. H., Rivera, M. J., and Carone, F. A. (1958). J. clin.Invest., 37, 1702.
Fleisch, H., and Bisaz, S. (1962). Amer. J. Physiol., 203, 671.Fourman, P., McConkey, B., and Smith, J. W. G. (1960). Lancet, 1,
619.Hodgkinson, A. (1964). Postgrad. med. J., 40, 130.Milne, M. D., Stanbury, S. W., and Thomson, A. E. (1952). Quart. J.
Med., 21, 61.Nordin, B. E. C., and Fraser, R. (1956). The indirect assessment of
parathyroid function. In Ciba Foundation Symposium on BoneStructure and Metabolism, edited by G. E. W. Wolstenholmeand C. M. O'Connor, pp. 222-238. Churchill, London.
Pyrah, L. N., and Hodgkins.n, A. (1960). Brit. J. Urol., 32, 361.Wills, M. R., and McGowan, G. K. (1964). Brit. med. J., 1, 1153.Yamahiro, H. S., and Reynolds, T. B. (1962). Metabolism, 11, 213.
571
on February 12, 2022 by guest. P
rotected by copyright.http://jcp.bm
j.com/
J Clin P
athol: first published as 10.1136/jcp.18.4.491 on 1 July 1965. Dow
nloaded from
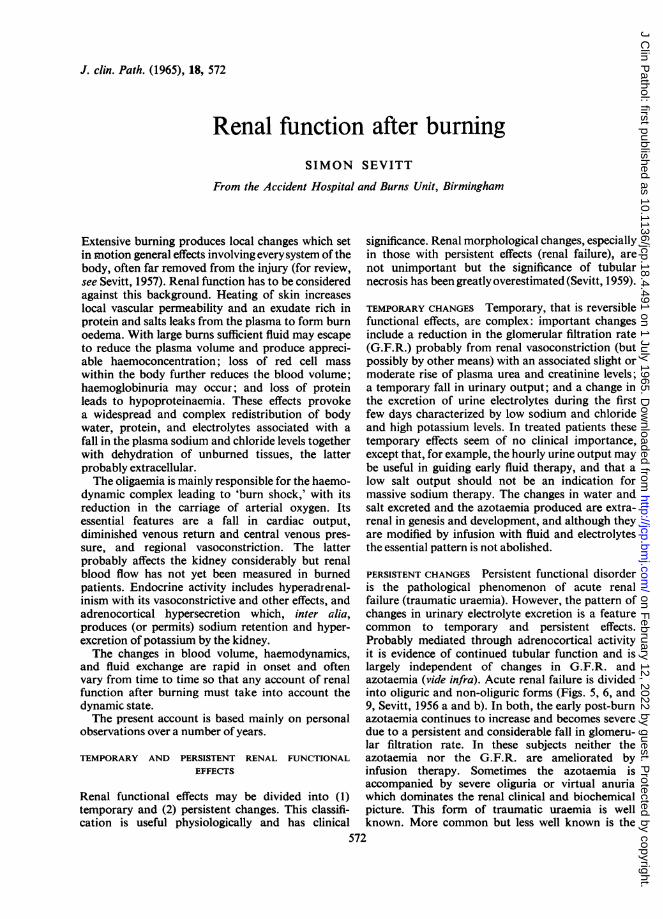
J. clin. Path. (1965), 18, 572
Renal function after burningSIMON SEVITT
From the Accident Hospital and Burns Unit, Birmingham
Extensive burning produces local changes which setin motion general effects involving everysystem of thebody, often far removed from the injury (for review,see Sevitt, 1957). Renal function has to be consideredagainst this background. Heating of skin increaseslocal vascular permeability and an exudate rich inprotein and salts leaks from the plasma to form burnoedema. With large bums sufficient fluid may escapeto reduce the plasma volume and produce appreci-able haemoconcentration; loss of red cell masswithin the body further reduces the blood volume;haemoglobinuria may occur; and loss of proteinleads to hypoproteinaemia. These effects provokea widespread and complex redistribution of bodywater, protein, and electrolytes associated with afall in the plasma sodium and chloride levels togetherwith dehydration of unburned tissues, the latterprobably extracellular.The oligaemia is mainly responsible for the haemo-
dynamic complex leading to 'burn shock,' with itsreduction in the carriage of arterial oxygen. Itsessential features are a fall in cardiac output,diminished venous return and central venous pres-sure, and regional vasoconstriction. The latterprobably affects the kidney considerably but renalblood flow has not yet been measured in burnedpatients. Endocrine activity includes hyperadrenal-inism with its vasoconstrictive and other effects, andadrenocortical hypersecretion which, inter alia,produces (or permits) sodium retention and hyper-excretion of potassium by the kidney.The changes in blood volume, haemodynamics,
and fluid exchange are rapid in onset and oftenvary from time to time so that any account of renalfunction after burning must take into account thedynamic state.The present account is based mainly on personal
observations over a number of years.
TEMPORARY AND PERSISTENT RENAL FUNCTIONALEFFECTS
Renal functional effects may be divided into (1)temporary and (2) persistent changes. This classifi-cation is useful physiologically and has clinical
significance. Renal morphological changes, especiallyin those with persistent effects (renal failure), arenot unimportant but the significance of tubularnecrosis has been greatly overestimated (Sevitt, 1959).
TEMPORARY CHANGES Temporary, that is reversiblefunctional effects, are complex: important changesinclude a reduction in the glomerular filtration rate(G.F.R.) probably from renal vasoconstriction (butpossibly by other means) with an associated slight ormoderate rise of plasma urea and creatinine levels;a temporary fall in urinary output; and a change inthe excretion of urine electrolytes during the firstfew days characterized by low sodium and chlorideand high potassium levels. In treated patients thesetemporary effects seem of no clinical importance,except that, for example, the hourly urine output maybe useful in guiding early fluid therapy, and that alow salt output should not be an indication formassive sodium therapy. The changes in water andsalt excreted and the azotaemia produced are extra-renal in genesis and development, and although theyare modified by infusion with fluid and electrolytesthe essential pattern is not abolished.
PERSISTENT CHANGES Persistent functional disorderis the pathological phenomenon of acute renalfailure (traumatic uraemia). However, the pattern ofchanges in urinary electrolyte excretion is a featurecommon to temporary and persistent effects.Probably mediated through adrenocortical activityit is evidence of continued tubular function and islargely independent of changes in G.F.R. andazotaemia (vide infra). Acute renal failure is dividedinto oliguric and non-oliguric forms (Figs. 5, 6, and9, Sevitt, 1956 a and b). In both, the early post-burnazotaemia continues to increase and becomes severedue to a persistent and considerable fall in glomeru-lar filtration rate. In these subjects neither theazotaemia nor the G.F.R. are ameliorated byinfusion therapy. Sometimes the azotaemia isaccompanied by severe oliguria or virtual anuriawhich dominates the renal clinical and biochemicalpicture. This form of traumatic uraemia is wellknown. More common but less well known is the
572
on February 12, 2022 by guest. P
rotected by copyright.http://jcp.bm
j.com/
J Clin P
athol: first published as 10.1136/jcp.18.4.491 on 1 July 1965. Dow
nloaded from
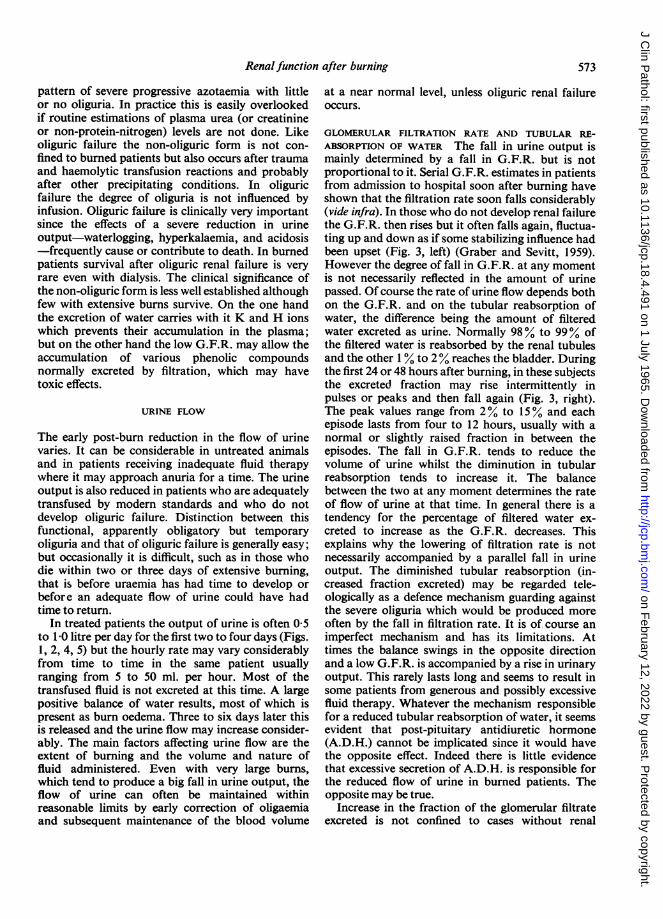
Renal function after burning
pattern of severe progressive azotaemia with littleor no oliguria. In practice this is easily overlookedif routine estimations of plasma urea (or creatinineor non-protein-nitrogen) levels are not done. Likeoliguric failure the non-oliguric form is not con-fined to burned patients but also occurs after traumaand haemolytic transfusion reactions and probablyafter other precipitating conditions. In oliguricfailure the degree of oliguria is not influenced byinfusion. Oliguric failure is clinically very importantsince the effects of a severe reduction in urineoutput-waterlogging, hyperkalaemia, and acidosis-frequently cause or contribute to death. In burnedpatients survival after oliguric renal failure is veryrare even with dialysis. The clinical significance ofthe non-oliguric form is less well established althoughfew with extensive burns survive. On the one handthe excretion of water carries with it K and H ionswhich prevents their accumulation in the plasma;but on the other hand the low G.F.R. may allow theaccumulation of various phenolic compoundsnormally excreted by filtration, which may havetoxic effects.
URINE FLOW
The early post-burn reduction in the flow of urinevaries. It can be considerable in untreated animalsand in patients receiving inadequate fluid therapywhere it may approach anuria for a time. The urineoutput is also reduced in patients who are adequatelytransfused by modern standards and who do notdevelop oliguric failure. Distinction between thisfunctional, apparently obligatory but temporaryoliguria and that of oliguric failure is generally easy;but occasionally it is difficult, such as in those whodie within two or three days of extensive burning,that is before uraemia has had time to develop orbefore an adequate flow of urine could have hadtime to return.
In treated patients the output of urine is often 0 5to 1-0 litre per day for the first two to four days (Figs.1, 2, 4, 5) but the hourly rate may vary considerablyfrom time to time in the same patient usuallyranging from 5 to 50 ml. per hour. Most of thetransfused fluid is not excreted at this time. A largepositive balance of water results, most of which ispresent as burn oedema. Three to six days later thisis released and the urine flow may increase consider-ably. The main factors affecting urine flow are theextent of burning and the volume and nature offluid administered. Even with very large burns,which tend to produce a big fall in urine output, theflow of urine can often be maintained withinreasonable limits by early correction of oligaemiaand subsequent maintenance of the blood volume
at a near normal level, unless oliguric renal failureoccurs.
GLOMERULAR FILTRATION RATE AND TUBULAR RE-ABSORPTION OF WATER The fall in urine output ismainly determined by a fall in G.F.R. but is notproportional to it. Serial G.F.R. estimates in patientsfrom admission to hospital soon after burning haveshown that the filtration rate soon falls considerably(vide infra). In those who do not develop renal failurethe G.F.R. then rises but it often falls again, fluctua-ting up and down as if some stabilizing influence hadbeen upset (Fig. 3, left) (Graber and Sevitt, 1959).However the degree of fall in G.F.R. at any momentis not necessarily reflected in the amount of urinepassed. Of course the rate of urine flow depends bothon the G.F.R. and on the tubular reabsorption ofwater, the difference being the amount of filteredwater excreted as urine. Normally 98% to 99% ofthe filtered water is reabsorbed by the renal tubulesand the other 1 % to 2% reaches the bladder. Duringthe first 24 or 48 hours after burning, in these subjectsthe excreted fraction may rise intermittently inpulses or peaks and then fall again (Fig. 3, right).The peak values range from 2% to 15% and eachepisode lasts from four to 12 hours, usually with anormal or slightly raised fraction in between theepisodes. The fall in G.F.R. tends to reduce thevolume of urine whilst the diminution in tubularreabsorption tends to increase it. The balancebetween the two at any moment determines the rateof flow of urine at that time. In general there is atendency for the percentage of filtered water ex-creted to increase as the G.F.R. decreases. Thisexplains why the lowering of filtration rate is notnecessarily accompanied by a parallel fall in urineoutput. The diminished tubular reabsorption (in-creased fraction excreted) may be regarded tele-ologically as a defence mechanism guarding againstthe severe oliguria which would be produced moreoften by the fall in filtration rate. It is of course animperfect mechanism and has its limitations. Attimes the balance swings in the opposite directionand a low G.F.R. is accompanied by a rise in urinaryoutput. This rarely lasts long and seems to result insome patients from generous and possibly excessivefluid therapy. Whatever the mechanism responsiblefor a reduced tubular reabsorption of water, it seemsevident that post-pituitary antidiuretic hormone(A.D.H.) cannot be implicated since it would havethe opposite effect. Indeed there is little evidencethat excessive secretion of A.D.H. is responsible forthe reduced flow of urine in burned patients. Theopposite may be true.
Increase in the fraction of the glomerular filtrateexcreted is not confined to cases without renal
573
on February 12, 2022 by guest. P
rotected by copyright.http://jcp.bm
j.com/
J Clin P
athol: first published as 10.1136/jcp.18.4.491 on 1 July 1965. Dow
nloaded from
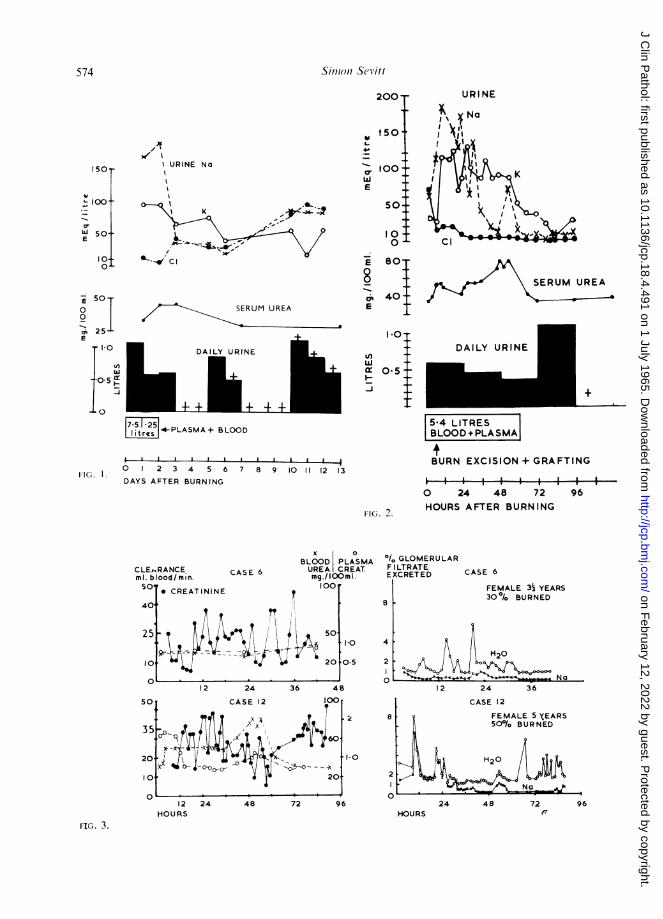
.,II URINE No
SEU URE
DAILY URINE
URINE
SERUM UREA
DAILY URINE
4-PLASMA + BLO(OD
I II I I I
5 4 LITRESBLOOD+PLASMAj
BURN EXCISION + GRAFTING11G.. 0 2 3 4 5 6 7 8 9 10 11 12 13
DAYS AFTER BURNING
FIG. 2.
0 24 48 72 96HOURS AFTER BURNING
CASE 6
x 0BLOOD PLASMAUREA CREAT.mg./ lOOm I.100r
* CREATININE t
50s
I ~J~ 20
aOl GLOMERULARF LTRATEEXCRETED
8
10
0s
4
2
12 24 36 48
a
2
12 24HOURS
48 72 96
CASE 6
FEMALE 332 YEARS30% BURNED
2 24 36
CASE 12
FEMALE 5 XEARS500%a BURNED
H20
No )
24 48 72 96HOURS (
574 Sim,oni Sevitt
200-
t50 .9-
ab too'-
w IE
50-.
100
r= 801-
8 -
cr 40
E_
150J-
u
U 50Q4E
lo-
O.L
,; 251-E
1.0
tn
-0-5 lxI-
.L 0
IO
0.5 -
Uf)w
I--J
RANCEood/min.
CLEkIml. blI50,
401
251
0
FIG. 3.
aI
, o
n = _-OrL
M20
A No
on February 12, 2022 by guest. P
rotected by copyright.http://jcp.bm
j.com/
J Clin P
athol: first published as 10.1136/jcp.18.4.491 on 1 July 1965. Dow
nloaded from
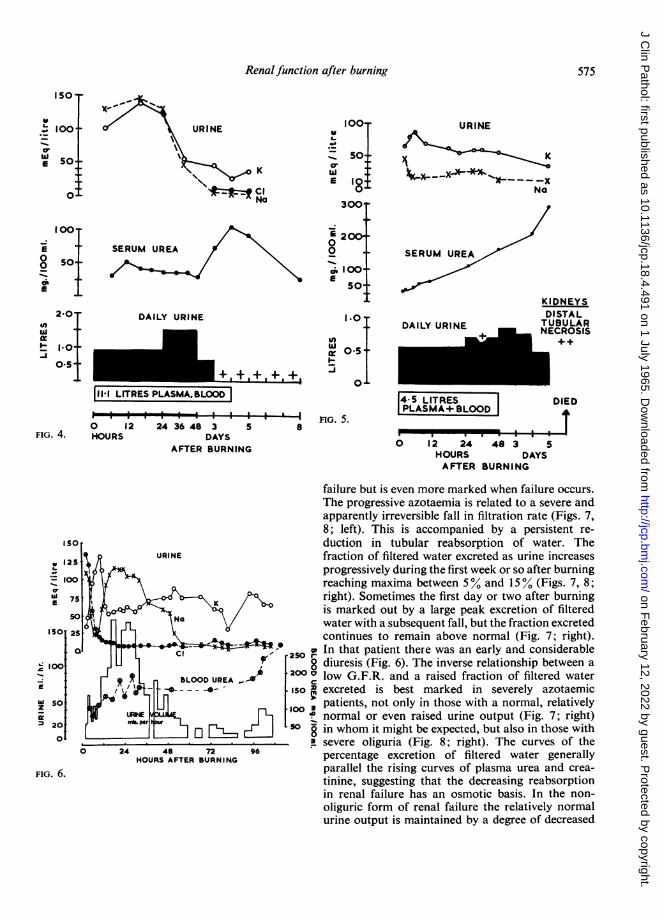
Renal function after burning
ISO,
' 100 X~~ * URINE 100 URINE100. URINE
Ew 50: so K
t u K ~~~~~~~~~~~~~~~E10t X-X '0I ~cI 0 Na-0 NatClONNa 300 .
0012
E 100+ SERUM UREA 0 SERUM UREA0So- 1_.~~~2 ERM RE
O@ 50_ g 0-.oIi I 00
KIDNEYS2-0 DAILY URINE I 0 DISTAL
nte DAILY URINE TUBULAR
~~;{ + + 01 ~~~~~~~~~E C R O SI~NCRSI0-5- " F~~~~~~0: I* _ O- .
11-1 LITRES PLASMA,BLOOD 4-5 LITRES DIED
-I--I--I-I It I I I I I I nG. 5. OPLASMA+BLOOD I0 12 24 36 48 3 5 8
FIG. 4. HOURS DAYS ' *I IU
AFTER BURNING0 12 24 48 3 5AFTERBURNING ~~~~~~~~~HOURSDAYS
AFTER BURNING
failure but is even more marked when failure occurs.The progressive azotaemia is related to a severe andapparently irreversible fall in filtration rate (Figs. 7,8; left). This is accompanied by a persistent re-
so duction in tubular reabsorption of water. The125 t URINE fraction of filtered water excreted as urine increases
progressively during the first week or so after burning-_00loo j greaching maxima between 5% and 15% (Figs. 7, 8;f 75 right). Sometimes the first day or two after burning
1* K+ / is marked out by a large peak excretion of filteredlsoao2; _ R XNe v water with a subsequent fall, but the fraction excretedISO 25 continues to remain above normal (Fig. 7; right).Q- 250 ,w In that patient there was an early and considerable
v0loo ,250 diuresis (Fig. 6). The inverse relationship between a_ * 2 _ BLOOD UREA X 200 I low G.F.R. and a raised fraction of filtered waterE -.- \._-__ -iso excreted is best marked in severely azotaemicZ so @1~ S oo 3 patients, not only in those with a normal, relativelyv:ffi P16normal or even raised urine output (Fig. 7; right)20 M per so8-j in whom it might be expected, but also in those with0._________________ *-asevere oliguria (Fig. 8; right). The curves of the
0 24 48 72 96 percentage excretion of filtered water generallyFIG. 6. parallel the rising curves of plasma urea and crea-tinine, suggesting that the decreasing reabsorption
in renal failure has an osmotic basis. In the non-oliguric form of renal failure the relatively normalurine output is maintained by a degree of decreased
575
on February 12, 2022 by guest. P
rotected by copyright.http://jcp.bm
j.com/
J Clin P
athol: first published as 10.1136/jcp.18.4.491 on 1 July 1965. Dow
nloaded from

Simon Sevitt
tubular reabsorption which compensates in waterexcretion for the reduced glomerular filtration rate.In the oliguric form of renal failure the reduction intubular reabsorption of water is insufficient tobalance the decrease in water filtered, hence theoliguria.
GLOMERULAR FILTRATION AND AZOTAEMIA
Graber and Sevitt (1959) carried out serial estimatesof G.F.R. by endogeneous creatinine (and some
inulin) clearances in a series of burned patients,beginning soon after burning. In this way the onsetof changes were timed and related to other observa-tions and to a changing state. In all subjects within a
few hours of beginning therapy the clearance valueswere found to be falling from a relatively normal or
even raised value or were already grossly reduced.In many subjects the G.F.R. soon rose and then
fell again, fluctuating considerably within hoursduring the first day or two (Fig. 3; left): in themazotaemia occurred only when the fluctuations in theG.F.R. were below a mean value of about 50% ofnormal for about 24 hours; azotaemia was absent or
insignificant with higher mean values when theperiods of fall in G.F.R. seemed to be too short toproduce a significant effect on nitrogen retention.Thus, in these subjects the considerable but tem-porary reduction in G.F.R. was either withoutazotaemia or coincided with a phase of moderateazotaemia. The lowest values of the fluctuatingG.F.R. ranged from 5% to 40% of normal; themean values in the different patients were from 30%to 500% during the first 12 hours after burning, from20o% to 900% during the second 12 hours, and from45 % to 110% of normal during the second 24 hours.After the third day relatively normal values were
obtained. When azotaemia occurred the plasma urea
level rose for a few days and then fell to normal;the maxima reached varied from 80 to 120 mg. per
100 ml. The corresponding maxima for plasmacreatinine were from 1 1 to 4-5 mg. %. Most ofthese patients were children; the majority survivedand the urine output never gave cause for anxiety.Another group of patients developed a persistent
reduction in G.F.R. associated with a considerableand progressive azotaemia (Figs. 7, 8; left). Somebecame severely oliguric but in most there was littleor no reduction in the urine flow, except for shortperiods during resuscitation and terminally. Most ofthese were adults and all of them died. Comparedwith those developing a temporary azotaemia or
without azotaemia (vide supra) the difference betweenthe two groups may represent a renal haemodynamicresiliency in children which is deficient in adults. Inmost of these the G.F.R. fell to very low values (8%
to 17% of the normal) within a few hours of burningand remained at these or even lower levels untildeath supervened (Fig. 8; left). In a few, the meanG.F.R. fell moderately during the first 24 hours andthen declined further during the next few days (Fig.7). This may have some aetiological significance:if the early fall represents early effects of burning thesecond phase may indicate the intervention of alater event (possibly septicaemia). In all patients themaximal plasma urea levels were considerable,ranging up to 500 mg. per 100 ml. before death andwith creatinine levels up to 15-1 mg. %.
EXCRETION OF ELECTROLYTES
The essential pattern is a fall in the concentration ofsodium and chloride and a rise in that of potassium,the effects lasting three to six days or even longerdepending on the extent of burning. Extrarenalcauses are responsible and oversecretion of aldo-sterone probably plays an important role. Thepattern occurs in patients with or without azotaemia,renal failure, or oliguria. Since sodium reabsorptionand potassium excretion are renal tubular pheno-mena they are evidence of continued tubular activityeven in subjects who subsequently die and whosekidneys show tubular necrosis.
In patients treated with intravenous plasma duringthe shock phase, variations occur in the pattern ofsodium excretion. In some, the urinary sodiumconcentration falls sharply and low values (10 to 30mEq. per litre) are reached by 12 to 24 hours afterburning. This may continue uninterrupted for days(Figs. 5 and 9) or may be soon followed by a periodof high sodium concentrations (Fig. 6). In othersburning is followed by a period of sodium diuresis(concentrations up to 100 to 200 mEq. per litre)which lasts 24 or 48 hours (Figs 1, 2, and 4) andthen the sodium level falls considerably. Sometimesa phase of sodium diuresis recurs followed by lowlevels (Fig. 6). In such patients the sodium diuresismay be accompanied by a phase of increased waterdiuresis (Fig. 6). Temporary diuresis of sodiumoccurs during the period of maximal fluid therapyand may be related either to restoration of the bloodvolume or to the giving of sodium-containing fluidor to both causes. In exceptional subjects the earlyfall in sodium is shortlived. Chloride concentratianfalls to very low levels (1 to 20 mEq. per litre)within 12 hours of burning and the low concentra-tion continues for days (Figs. 1, 2, 6, 9). The lowchloride level is independent of the sodium andpotassium levels: chloride falls and remains lowwhen sodium rises or falls. Urinary potassiumconcentration rapidly increases soon after burningand may reach values up to 150 mEq. per litre or
576
on February 12, 2022 by guest. P
rotected by copyright.http://jcp.bm
j.com/
J Clin P
athol: first published as 10.1136/jcp.18.4.491 on 1 July 1965. Dow
nloaded from
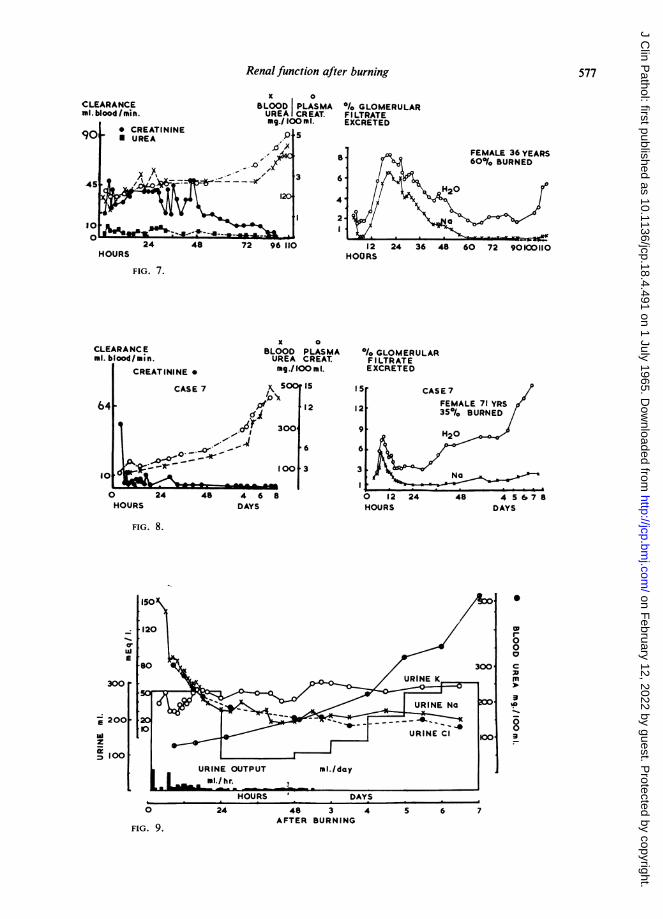
Renal function after burning 577
K aCLEARANCE BLOOD PLASMA .1. GLOMERULARml.blood/min. UREA CREAT. FILTRATE
mg9./ 100 m 1. EXCRETEDCREATININE
p S90 0 UREA-0F 8*791FEMALE 36 YEARS
//~~:--~~ ~ I . ~ ~ H : O60% BURNED45|10~~~~~~~~~~~~~~~~~~~~~~~~~~~~~~~~~1I
24 48 7 6101 24 36 48 60 72 901001102448~~~~~~~~4
HOURS HOURS
FIG. 7.
x 0CLEARANCE BLOOD PLASMA / GLOMERULARml. blood/min. UREA CREAT. FILTRATE
CREATININE * mg./lOO n 1. EXCRETEDCASE 7 5 IS I S CASE7
/O4 $fv 1 2 1 2 ~~~~~~~~~FEMALE71 YRS 564 P 12124 350/ BURNED
HOURSDAYS 300 9 H206 6.
zzool~~1 4t 8
A-~I0 24 48 4 68 0 12 24 48 45 678aHOURS DAYS HOURS DAYS
FIG. 8.
150~~~~~~~~~~~~~~~
I-o00* ~~~~~~~~~~~~~~0Li 0
300
100URINE OUTPUT mi./day
mI./hr.
HOURS DAYS0 24 48 3 4 5 6 7
AFTER BURNINGFIG. 9.
on February 12, 2022 by guest. P
rotected by copyright.http://jcp.bm
j.com/
J Clin P
athol: first published as 10.1136/jcp.18.4.491 on 1 July 1965. Dow
nloaded from

even more during the first two days; thereafter itoften declines but remains elevated for days. Inchildren the amount of potassium lost relative tototal body potassium may be considerable and mayaccount for the fall in serum potassium levels whichsometimes occurs in burned children. The combina-tion of a low sodium and high potassium concentra-tion changes the normal urinary sodium: potassiumratio (in equivalent values) from 2 or 3 to 1 to lessthan unity and aften to 1: 3 or 4. This change inratio is said to be a useful index of aldosteronehyperactivity.The pattern of electrolyte change is influenced by
therapy but it is not abolished. In this sense it isobligatory. When large amounts of salt are givenduring the first 24 hours the onset of a low urinarysodium level may be delayed, but only a fraction ofthe salt administered is excreted at this time and a
large positive balance of sodium (largely into theburn oedema) occurs. At this time the urinary ex-
cretion of salt is only a fraction of the intake. Thisis important, since some surgeons still believe thata low urinary sodium or chloride level is sufficientindication for salt therapy. Retention of sodium isactive, hormone-induced, largely obligatory andassociated with a fall in plasma sodium and chloridelevels. Mistaken therapy might lead to givingsufficient salt to restore the urinary concentrationsof sodium or chloride to normal for a time, and if theattempt is made to maintain a 'normal level' ofoutput overloading the body with enormous quan-tities of salt may occur.
TUBULAR REABSORPTION OF SODIUM The percentageof sodium in the glomerular filtrate which reaches
the bladder is calculated from the formula Na xP U
creatinine x 100. This is derived from the amount of
sodium filtered (plasma sodium x G.F.R. or p
creatinine) and the amount of sodium in the urine(U Na). One hundred per cent minus this value is thefraction reabsorbed by the tubules. Normally thefraction of filtered sodium excreted is very low,0 5% to 1%. Most is reabsorbed by the tubules.After burning the excretion of filtered sodium isgenerally lower than normal (Fig. 3; right). However,in treated patients the pattern varies during the first24 hours. Often the percentage excretion becomeslow early and remains low for days. More often thefraction excreted increases for one or more periodsduring the first day with peak values up to about8%; then it falls to normal or subnormal values
(Figs. 3, 7, 8; right). Generally there is a closerelationship between the patterns of excretion offiltered sodium and that of urinary sodium concen-tration; but this is not absolute since the percentageof filtered sodium excreted also depends on theglomerular filtration rate. A low percentage offiltered sodium is excreted not only in patientswithout azotaemia and in those with temporaryazotaemia (Fig. 3; right) but also in those withrenal failure (Figs. 7 and 8; right).
SIGNIFICANCE OF SODIUM AND WATER REABSORPTIONThe excretion of filtered sodium and of filtered waterbehaves independently. Simultaneous values of araised excretion of filtered water and of a lowexcretion of filtered sodium are often found. Thecombination indicates differential tubular activity ofa high degree. Such divergent patterns occur in non-azotaemic and temporary azotaemic subjects duringthe shock period (Fig. 3; right) and in all those withsevere azotaemia. In the latter group the divergencepersists and even increases until death (Figs. 7 and 8;right). The reduced tubular reabsorption of water inacute renal failure has been interpreted by some asimpairment of tubular functicn due to tubularnecrosis or blockage by casts. This cannot be truebecause, if it were, the impairmer t of function wouldbe selective, since the absorptive tubular powers forsodium (and chloride) are unimpaired and evenhyperactive. Moreover tubular ability to excreteconsiderable amounts of potassium is unimpairedand the absence of glycosuria in renal failure alsoindicates that selective tubular reabsorption ofglucose continues. For these and other reasonscriticism has been levelled at the concept that acuterenal failure after burning (or injury) is due to lossof tubular function from tubular necrosis (Sevitt,1959; Finckh, 1962). Evidence has been presentedthat the functional defect is glomerular, and due toa persistent fall in G.F.R., even though tubularnecrosis or blockage by casts is often present. Thecause of the persistently low G.F.R. remains obscurealthough different attempts to explain it have beenmade. This aspect is beyond the scope of the presentcommunication.
REFERENCES
Finckh, E. S. (1962). Lancet, 2, 330.Graber, I. G., and Sevitt, S. (1959). J. clin. Path., 12, 25.Sevitt, S. (1956a). Ibid., 9, 12.
(1956b). Ibid., 9,279.(1957). Burns. Pathology and Therapeutic Applications. Butter-worth, London.
(1959). Lancet, 2, 135.
578 Simon Sevitt
on February 12, 2022 by guest. P
rotected by copyright.http://jcp.bm
j.com/
J Clin P
athol: first published as 10.1136/jcp.18.4.491 on 1 July 1965. Dow
nloaded from