223.full.pdf - Thorax (BMJ)
11
Thorax (1956), 11, 223. THE DIRECT INTERPRETATION OF THE FAST VITAL CAPACITY RECORD BY R. J. SHEPHARD Fromti the R.A.F. Institute of Aviation Medicine, Farnzborough, Hants (RECEIVED FOR PUBLICATION JANUARY 30, 1956) The standard maximum breathing capacity test (Hermannsen, 1933; Gilson and Hugh-Jones, 1949) places a severe strain on a patient who is unwell, and in a diseased lung it may lead to struc- tural damage with exacerbation or spread of in- fection (Simonin, 1954; Needham, Rogan, and McDonald, 1955). The search for an alternative and less exhausting procedure has concentrated increasingly on the fast vital capacity (F.V.C.) manceuvre. This has been considered largely as a means of predicting maximum breathing capacity (the relevant literature is reviewed by Kennedy, 1953), although there have also been pleas for a more direct interpretation of F.V.C. tracings (Bernstein and Kazantzis, 1954; Shephard, 1955). If F.V.C. tracings are to be interpreted directly, it is necessary to be certain to what extent the form of the tracing is affected by slight variations in the apparatus or the technique adopted by the patient. Instrumental errors may be of consider- able importance. In the past, records (sometimes termed fast vital spirograms) have been obtained by means of a spirometer fitted with either a standard brass bell (Kennedy, 1953 ; Needham and others, 1955) or a light-weight bell (Bernstein, 1954); the two methods yield tracings that differ considerably from each other, and neither corre- sponds very closely with the pattern of flow re- corded by the pneumotachograph (Shephard, 1955). The present paper reports an investigation of errors underlying the spirometer methods of measuring F.V.C. and a study of the stability of the various F.V.C. parameters by repeated pneu- motachograph measurements on a small group of normal subjects. METHODS THE PNEUMOTACHOGRAPH.-Details of the pneumo- tachograph have been given in previous reports (Shep- hard, 1955; 1956). This apparatus has a 95% re- sponse time of under 100 milliseconds, and the accu- racy is not less than 1 even with the high rates of gas flow found in very fit subjects. THE SPIROMETER.-A Knipping type spirometer was adapted for electrical recording by bolting a ball- bearing mounted potentiometer to the pulley. Careful comparison of pressure tracings obtained from the bell during fast vital capacity manceuvres failed to reveal any significant change following attachment of the potentiometer. A light-weight celluloid bell (Bern- stein and Mendel, 1951) was used in some experiments. With this bell, the total weight of the moving parts was reduced to 612 g., and a maximum unbalance of 75 g. occurred with full immersion. THE SUBJECTS.-The male subjects were fairly repre- sentative of the range of physiques likely to be en- countered in healthy young men. On the other hand the female subjects represent only the two extremes of physical development, one (V. G.) being a championship swimmer, the other (V. B.) being small, with poor musculature. The physical characteristics of all except V. G. have been summarized in a pre- vious report (Shephard, 1955). She had a height of 5 ft. 61 in. (169 cm.), a weight of 142 lb. (64.2 kg.), and a body surface of 1.74 sq. m. ERRORS ASSOCIATED WITH SPIROMETER METHOD OF RECORDING FAST VITAL CAPACITY SIMULTANEOUS PNEUMOTACHOGRAPH AND SPIRO- METER RECORDS.-In order to determine whether the pattern of gas flow during a fast vital capacity manceuvre is distorted by the physical character- istics of the spirometer system, a pneumotacho- graph was inserted in the tubing leading to the spirometer and gas flows recorded during move- ment of the spirometer bell. Tracings obtained in this way were compared with (a) previously ob- tained normal pneumotachograph tracings for the same subject and (b) the simultaneously recorded spirometer volume. Comparison with normal pneumotachograph tracings (Table I) shows that there is little change in the total time taken over the fast vital capacity copyright. on February 12, 2022 by guest. Protected by http://thorax.bmj.com/ Thorax: first published as 10.1136/thx.11.3.223 on 1 September 1956. Downloaded from
-
Upload
khangminh22 -
Category
Documents
-
view
1 -
download
0
Transcript of 223.full.pdf - Thorax (BMJ)

Thorax (1956), 11, 223.
THE DIRECT INTERPRETATION OF THE FAST VITALCAPACITY RECORD
BY
R. J. SHEPHARDFromti the R.A.F. Institute of Aviation Medicine, Farnzborough, Hants
(RECEIVED FOR PUBLICATION JANUARY 30, 1956)
The standard maximum breathing capacity test(Hermannsen, 1933; Gilson and Hugh-Jones,1949) places a severe strain on a patient who isunwell, and in a diseased lung it may lead to struc-tural damage with exacerbation or spread of in-fection (Simonin, 1954; Needham, Rogan, andMcDonald, 1955). The search for an alternativeand less exhausting procedure has concentratedincreasingly on the fast vital capacity (F.V.C.)manceuvre. This has been considered largely asa means of predicting maximum breathing capacity(the relevant literature is reviewed by Kennedy,1953), although there have also been pleas for amore direct interpretation of F.V.C. tracings(Bernstein and Kazantzis, 1954; Shephard, 1955).
If F.V.C. tracings are to be interpreted directly,it is necessary to be certain to what extent theform of the tracing is affected by slight variationsin the apparatus or the technique adopted by thepatient. Instrumental errors may be of consider-able importance. In the past, records (sometimestermed fast vital spirograms) have been obtainedby means of a spirometer fitted with either astandard brass bell (Kennedy, 1953 ; Needham andothers, 1955) or a light-weight bell (Bernstein,1954); the two methods yield tracings that differconsiderably from each other, and neither corre-sponds very closely with the pattern of flow re-corded by the pneumotachograph (Shephard,1955). The present paper reports an investigationof errors underlying the spirometer methods ofmeasuring F.V.C. and a study of the stability ofthe various F.V.C. parameters by repeated pneu-motachograph measurements on a small group ofnormal subjects.
METHODSTHE PNEUMOTACHOGRAPH.-Details of the pneumo-
tachograph have been given in previous reports (Shep-hard, 1955; 1956). This apparatus has a 95% re-sponse time of under 100 milliseconds, and the accu-
racy is not less than 1 even with the high rates ofgas flow found in very fit subjects.THE SPIROMETER.-A Knipping type spirometer was
adapted for electrical recording by bolting a ball-bearing mounted potentiometer to the pulley. Carefulcomparison of pressure tracings obtained from thebell during fast vital capacity manceuvres failed toreveal any significant change following attachment ofthe potentiometer. A light-weight celluloid bell (Bern-stein and Mendel, 1951) was used in some experiments.With this bell, the total weight of the moving partswas reduced to 612 g., and a maximum unbalance of75 g. occurred with full immersion.THE SUBJECTS.-The male subjects were fairly repre-
sentative of the range of physiques likely to be en-countered in healthy young men. On the other handthe female subjects represent only the two extremesof physical development, one (V. G.) being achampionship swimmer, the other (V. B.) being small,with poor musculature. The physical characteristicsof all except V. G. have been summarized in a pre-vious report (Shephard, 1955). She had a height of5 ft. 61 in. (169 cm.), a weight of 142 lb. (64.2 kg.),and a body surface of 1.74 sq. m.
ERRORS ASSOCIATED WITH SPIROMETER METHODOF RECORDING FAST VITAL CAPACITY
SIMULTANEOUS PNEUMOTACHOGRAPH AND SPIRO-METER RECORDS.-In order to determine whetherthe pattern of gas flow during a fast vital capacitymanceuvre is distorted by the physical character-istics of the spirometer system, a pneumotacho-graph was inserted in the tubing leading to thespirometer and gas flows recorded during move-ment of the spirometer bell. Tracings obtainedin this way were compared with (a) previously ob-tained normal pneumotachograph tracings for thesame subject and (b) the simultaneously recordedspirometer volume.Comparison with normal pneumotachograph
tracings (Table I) shows that there is little changein the total time taken over the fast vital capacity
copyright. on F
ebruary 12, 2022 by guest. Protected by
http://thorax.bmj.com
/T
horax: first published as 10.1136/thx.11.3.223 on 1 Septem
ber 1956. Dow
nloaded from
R. J. SHEPHARD
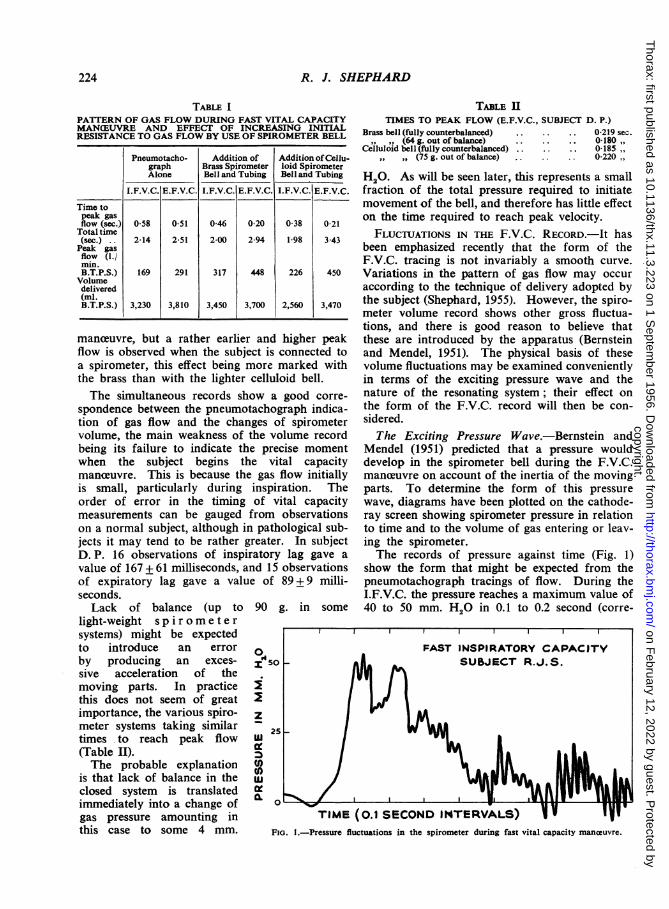
TABLE IPATTERN OF GAS FLOW DURING FAST VITAL CAPACITYMANCEUVRE AND EFFECT OF INCREASING INITIALRESISTANCE TO GAS FLOW BY USE OF SPIROMETER BELL
Pneumotacho- Addition of Addition ofCellu-graph Brass Spirometer loid SpirometerAlone Bell and Tubing Bell and Tubing
I.F.V.C. E.F.V.C. I.F.V.C. E.F.V.C. I.F.V.C. E.F.V.C.
Time topeak gasflow (sec.) 0-58 0-51 0-46 0-20 0-38 0-21
Total time(sec.) . . 2-14 2-51 2-00 2-94 1-98 3-43Peak gasflow (1./min.B.T.P.S.) 169 291 317 448 226 450Volumedelivered(ml.B.T.P.S.) 3,230 3,810 3,450 3,700 2,560 3,470
manceuvre, but a rather earlier and higher peakflow is observed when the subject is connected toa spirometer, this effect being more marked withthe brass than with the lighter celluloid bell.The simultaneous records show a good corre-
spondence between the pneumotachograph indica-tion of gas flow and the changes of spirometervolume, the main weakness of the volume recordbeing its failure to indicate the precise momentwhen the subject begins the vital capacitymanceuvre. This is because the gas flow initiallyis small, particularly during inspiration. Theorder of error in the timing of vital capacitymeasurements can be gauged from observationson a normal subject, although in pathological sub-jects it may tend to be rather greater. In subjectD. P. 16 observations of inspiratory lag gave avalue of 167 + 61 milliseconds, and 15 observationsof expiratory lag gave a value of 89 + 9 milli-seconds.
Lack of balance (up to 90 g. in somelight-weight s p i r o m e t e rsystems) might be expectedto introduce an error 0by producing an exces- s _sive acceleration of themoving parts. In practice >this does not seem of great 2importance, the various spiro- zmeter systems taking similar - 25times to reach peak flow W(Table II).The probable explanation (I)
is that lack of balance in the uwclosed system is translated t _immediately into a change of 0 °gas pressure amounting in TIMEthis case to some 4 mm. FIG. 1.-Pressure flu
TABLE 11TIMES TO PEAK FLOW (E.F.V.C., SUBJECT D. P.)
Brass bell (fully counterbalanced). 0-219 sec.(64 g. out of balance) 0-180,,
Celluloid bell (fully counterbalanced). 0185,, ,,3(75 g. out ofbalance). 0-220 ,,
H20. As will be seen later, this represents a smallfraction of the total pressure required to initiatemovement of the bell, and therefore has little effecton the time required to reach peak velocity.FLUCTUATIONS IN THE F.V.C. RECORD.-It has
been emphasized recently that the form of theF.V.C. tracing is not invariably a smooth curve.Variations in the pattern of gas flow may occuraccording to the technique of delivery adopted bythe subject (Shephard, 1955). However, the spiro-meter volume record shows other gross fluctua-tions, and there is good reason to believe thatthese are introduced by the apparatus (Bernsteinand Mendel, 1951). The physical basis of thesevolume fluctuations may be examined convenientlyin terms of the exciting pressure wave and thenature of the resonating system; their effect onthe form of the F.V.C. record will then be con-sidered.The Exciting Pressure Wave.-Bernstein and
Mendel (1951) predicted that a pressure woulddevelop in the spirometer bell during the F.V.C.manceuvre on account of the inertia of the movingparts. To determine the form of this pressurewave, diagrams have been plotted on the cathode-ray screen showing spirometer pressure in relationto time and to the volume of gas entering or leav-ing the spirometer.The records of pressure against time (Fig. 1)
show the form that might be expected from thepneumotachograph tracings of flow. During theI.F.V.C. the pressure reaches a maximum value of40 to 50 mm. H2O in 0.1 to 0.2 second (corre-
(0.1 SECOND INTERVALS)luctuations in the spirometer during fast vital capacity maneuvre.
224
copyright. on F
ebruary 12, 2022 by guest. Protected by
http://thorax.bmj.com
/T
horax: first published as 10.1136/thx.11.3.223 on 1 Septem
ber 1956. Dow
nloaded from

THE DIRECT INTERPRETATION OF THE FAST VITAL CAPACITY RECORD 225
sponding with the period of maximum <tion of the bell), and has fallen virtuallyat 0.5 second (corresponding with the poiideceleration of the bell begins). Superimithis main pressure wave are a number ofrhythmic fluctuations of pressure. TIobvious of these has a medium fi(c. 600/minute), but there is also a welfluctuation of smaller amplitude and Iquency (c. 60/minute), and in some trapparently when a high velocity is reachedfrequency component (c. 3 to 3,500/miniDuring expiration a more rapid maximi
sure is attained (0.07 to 0.1 second), theachieved is higher (100 to 110 mm. H20),fall to zero pressure is more rapid (often 1little as 0.2 to 0.3 second). The superrhythmic fluctuations of pressure are sithose seen during inspira-tion, although the high fre- .Oquency component is moreconsistently present.When a light-weight
spirometer bell is used thetiming of the main pres-sure wave is not substan-tially altered, but its 5'0 _magnitude is approxi-mately halved (inspiration20 to 25 mm. H20, expira- Etion 45 to 55 mm. H20). uThe three frequencies of zrhythmic pressure fluctua- 4.0 -
tion are observed as be- zfore, and the amplitude >of the high and medium O.
0frequency components is usomewhat increased. z
Pressure / volume loops 30.0obtained for the brass (spirometer bell confirm the ¢above findings. During u.inspiration a peak pressure 0of about 40 mm. H2O is Zreached with the move- 0ment of a few millilitres 20of gas; the pressure then A CRIfalls rather slowly to about25 mm. H20 at a pointhalf-way through inspira-tion. The second half ofthe fast inspiration shows arapid fall of the spirometerpressure towards zero. FIG. 2.-RelaDuring expiration a peak oscillation
pressure of about 100 mm. H20 is reached withvirtually no movement of gas. After the expulsionof a few hundred millilitres of gas the pressurefalls rapidly, and during the last half of expirationis not greater than 10 mm. H20.Nature of the Resonating System.-Theoretic-
ally, the spirometer is a rather complex resonator.Two oscillating systems of considerable mass anddiffering natural period (the bell-chain-counter-weight system, and the U-loop of the water seal)are connected by a highly elastic system-a gasspace containing air or oxygen.
Further, the gas has a variable distribution be-tween subject and apparatus. Two compoundpendulums connected by a light spring of variabletension provide a simple physical analogy. A pre-cise mathematical determination of natural fre-quency is difficult for such a complex system, but
0
0
ITCAL POINT - -
* .0 0.10.08 0 0
0a 0.,
0.30 040 050 060 070 080a 00. 1.00 1NATURAL PERIOD OF OSCILLATION IN SECONDS
1.10 1O0
ationship between square root of length of water column and natural period ofof spirometer. (Brass bell, oscillations induced by removal of standard mass.)
I .
copyright. on F
ebruary 12, 2022 by guest. Protected by
http://thorax.bmj.com
/T
horax: first published as 10.1136/thx.11.3.223 on 1 Septem
ber 1956. Dow
nloaded from

R. J. SHEPHARD
it can readily be seen that the dominant frequencywill be determined by the relative masses of thewater column and the bell-counterweight systems;where these are of similar mass, interference be-tween the two systems may give rise to " beats."From the practical point of view, it is obvious
that the water column has much the greater masswhen the bell is fully immersed, but it is importantto be certain whether the water loop continues toact as the dominant resonating system over theuseful range of the apparatus. To investigate thenatural frequency with differing lengths of watercolumn, oscillations were induced by the suddenremoval of a standard mass (600 g.) from the topof the spirometer bell. There was a close rela-tionship between the period of the oscillations andthe square root of the length of the water column(Fig. 2) until the depth of immersion reached acritical value (about 4 cm. for the brass bell). Atthis point the oscillations became irregular incharacter; sometimes excessive damping occurred,and sometimes " beats " were observed. It is diffi-cult to make an exact comparison between themass of the water column and the mass of the bellin this experiment, since the " loop " of water ex-tends for an unknown distance below the edge ofthe bell. However, if an " end-correction" of6 cm.-a not unreasonable figure-is assumed, themass of the two systems would be approximatelyequal when the bell was immersed to 4 cm. Thisseems at least a tenable explanation of the unstablefrequency observed at this level. Since the mass ofthe light-weight bell system is only about one-thirdof that of the brass bell, the critical frequencywould be expected to occur with even less immer-sion of the bell. It is difficult to produce satisfac-tory oscillations with a water column less than 1cm. in length, but it can be shown that down toabout 1 cm. there is a close linear relationship be-tween the natural period and the square root of thelength of the water column. Thus these observa-tions establish two important practical facts-thelowest frequency fluctuations observed with bothtypes of spirometer bell are governed by the lengthof the water column down to a certain criticalpoint, and this point is not reached unless the bellis overfilled with gas or the water-level is low.The medium and high frequency vibrations are
not of great practical importance, since they areboth associated with the use of the spirometer,and the normal recording system-the ink-writingspirometer pen-is not capable of responding tosuch frequencies. They are both rather rapid tobe attributed to the moving parts of the spiro-meter, and probably represent resonance of the
gas spaces in the apparatus and patient. Theiramplitude is much increased if the "noise" levelis raised by an increased speed of delivery orvoluntary modifications in the shape of the sub-ject's airway.
Wave-form during F.V.C. Manweuvre.-Detailsof the wave-form produced by removal of thestandard mass are summarized in Fig. 3a. Avirtually " square " pressure change of 27 mm.H20 gives rise to a chain of vibrations with aninitial amplitude of some 200 ml. The dampingconstant (time required for the amplitude to fallto e-1 of a given value) is greater with a long watercolumn (due mainly to the lower frequency), andis also considerably increased with the celluloidbell (probably due to its more highly polished sur-face). The pattern of damping conforms fairlyclosely to an exponential curve, suggesting that theviscous component exceeds frictional resistance byat least an order of magnitude.
Do the less regular pressure changes associatedwith the F.V.C. manceuvre produce similar fluctua-tions in the spirometer volume record ? In orderto calculate the wave form during an F.V.C. test,it is necessary to correct for the overall movementof the bell. This may be done if it is assumedthat a given half-wave is equal in amplitude to themean of preceding and succeeding half-waves-anapproximation that is correct to about 5% underthe conditions of the experiment. The observedfrequency of the oscillations is close to that pro-duced by the "square," pressure wave, but thedegree of damping is appreciably greater, particu-larly during the E.F.V.C. The most strikingdifference is in the amplitude of vibration. Al-though the pressure developed during an E.F.V.C.is about four times that produced by removal ofthe standard mass, the unfavourable shape of thepressure wave results in an oscillation of littlegreater initial amplitude. The pressure wave pro-duced by the light-weight bell apparently has aneven less favourable shape, and the initial ampli-tude is only about one-quarter of that observedwith the brass bell.
The effect of these oscillations on the accuracyof volume recordings must finally be considered.It seems obvious that neither type of spirometerbell is capable of giving an accurate picture ofevents occurring during the first second, but ifonly the capacity at one second is being measuredthe situation is less serious. The error will varysomewhat according to the precise phase of thewave cycle at one second, but is of the order 100to 120 ml. (2.5 to 3.0%) for the brass bell, and
226
copyright. on F
ebruary 12, 2022 by guest. Protected by
http://thorax.bmj.com
/T
horax: first published as 10.1136/thx.11.3.223 on 1 Septem
ber 1956. Dow
nloaded from

THE DIRECT INTERPRETATION OF THE FAST VITAL CAPACITY RECORD
(a) BRASS BELL
Lomy vaver co/vmn2 200 Danm,pmi conv/anl 1'45 oWS
21500
I.F0Toh2-IO0> -200.
z _ (b) BRASS BELL,\ ShAOi wrA*r co/o,,n
0y ""' I mn4' 1 OS9o
I / Tine /n seconds
0), -200
Z zoQ
o O-
-200
z 200
GnoIL 120
hI< 0
I I -¶00
i0o -zoo
(c) CELLULOID BELL(NI\ ColuMN
Dam nq coisfam t2-63stcs5I" \ \ /1- -_
T ceC/ secdJs
Oe SS Id) CELLULOID BELL\SAorf war.- cd/n,n
°.0020,',9lcCa= n / 82 scc-,
T.VnCm sesnconds
2
de0
W-J a
21
0
ke) BRASS BELL IF VC.DaP;y; C.rshnt/l0secs
% Time77, A scconids
- ~~~(F, BRASS BELL E.F.V.C.
I .I -~
v Timc int secoJds
(3) CELLULOID BELL E F.VC.
Danriny constant 1 72 secs
FIG. 3.-Wave form of spirometer oscillations. (a)-(d) Oscillations induced by "square" pressure change of 27 mm. H20; (e)-(g)reconstructed wave form from actual fast vital capacity tracings. Solid lines indicate waves actually measured.
40 ml. (1%) for the celluloid bell. Errors of thismagnitude may not be of clinical importance, buttheir existence must be remembered when compar-ing results with those obtained by the pneumo-tachograph.
THE PARAMETERS OF FAST VITAL CAPACITYWhen instructed to perform a vital capacity
manceuvre as rapidly as possible, subjects varyconsiderably in the time taken. In normal sub-jects a " fast inspiratory capacity" may occupy1.1 to 2.1 seconds, and a " fast expiratorycapacity " 2.2 to 4.6 seconds. If patients are beingexamined the range of times is even wider(Shephard, 1956). It is therefore of some import-ance to ascertain how a variation in the total timetaken over delivery affects other parameters of thefast vital capacityTo investigate this point, two normal subjects
delivered nearly 200 expiratory and inspiratoryu
vital capacity samples, taking one to ten secondsover the delivery. Twelve tracings were also ob-tained from each of six other normal subjects. Thefollowing features of the individual pneumotacho-graph records were noted:TOTAL GAS VOLUME DELIVERED.-The total
volume delivered is closely dependent on the timetaken over delivery. It may conveniently beexpressed as a percentage of the untimed vitalcapacity measured by the spirometer. There isno significant difference between the percentagevalues for the two principal subjects, and, to facili-tate graphic analysis, results from these two sub-jects have therefore been pooled (Fig. 4). A con-sistently larger fraction of the expiratory capacitythan of the inspiratory is delivered in a given time,98 to 100% of the total capacity being achieved inthree seconds. The inspiratory capacity appar-ently reaches a limiting level in about two and ahalf seconds, and if longer time is taken may even
227
Z 2i
ItInft
U-4(
.1,0>-Z4
-IJ
9 2_13C
° 2
COC
:Co
III
10 \-
a3
copyright. on F
ebruary 12, 2022 by guest. Protected by
http://thorax.bmj.com
/T
horax: first published as 10.1136/thx.11.3.223 on 1 Septem
ber 1956. Dow
nloaded from

R. J. SHEPHARD
IC, It
2
4- 5 6 7 8OVER DELIVERY (SECONDS)
FIG. 4.-Relationship between volume of fast vital capacity and time taken over delivery of sample.
show a slight decrease. It does not rise aboveabout 95% of the untimed expiratory capacity.
Values for most of the other male subjects fallfairly closely along these curves. One female sub-ject (V. B.) delivers a much smaller fraction of theuntimed capacity in a given time, but this isprobably related to her build rather than her sex,
since the other (V. G) is even somewhat above theaverage male percentage.
GAS VOLUME DELIVERED IN ONE SECOND.-Inorder to assess the fast vital capacity most pre-vious authors have selected an arbitrary (usuallyone second) fraction of a fast spirometer tracing.A corresponding volume can be obtained by thepneumotachograph technique if the area of a one-
second portion of the tracing is measured by a
planimeter.If the total untimed vital capacity is taken as a
standard, and the percentage of this standard de-livered in one second is plotted against the timetaken over delivery (Fig. 5), it can be seen thatthe " one-second capacity" is not a constantentity. Considering first the pooled results for thetwo principal subjects, the curve relating the one-second expiratory capacity to delivery time ap-proximates to a sigmoid form. Over the section1 to 3 seconds there is virtually no change ofcapacity, values being mainly in the "normal"range (70 to 80% of untimed capacity) (Hirdes andvan Veen, 1952; Gaensler, 1951 ; Simonin, 1954;Drutel and Dechoux, 1952). From 3 to 6 secondsthe capacity falls rapidly to some 35% of the un-timed value, but there is little further deteriorationin isolated observations where the delivery timehas been prolonged even to 12 seconds. With theinspiratory capacity, speed of delivery is even more
important. Values in the " normal range " (70 to
228
1OO r
901-
80-
-
m0.4I
z
-j4
0
-0
%.W
-j4
LL
K EY
r----- Fasf Ex,iratory (apfaciltZ__ t (mea, w-A SE forRJS £ DP)rZT FaskA/s,prot0ory C(a)oaci=2...~(mea1 wIAAS.EforRJS. DP)
d Va/les for olber sm§ec/s
60 -
2 3TOTAL TIME TAKEN
F.( I.
-70F
copyright. on F
ebruary 12, 2022 by guest. Protected by
http://thorax.bmj.com
/T
horax: first published as 10.1136/thx.11.3.223 on 1 Septem
ber 1956. Dow
nloaded from

THE DIRECT INTERPRETATION OF THE FAST VITAL CAPACITY RECORD 229
80% of untimed capacity) cannotbe achieved unless the inspirationis completed within 2 seconds. Iflonger is taken over inspirationthe one-second capacity rapidlyfalls to about 35 % of the untimed 80capacity, the course of the curvelying significantly to the left of >that for the one-second expiratory Xcapacity. Results for the other <male subjects fall closely along <these curves. There are again con- 6-siderable differences between the ,two female subjects, one showing Xlow values (particularly for ex- i:
zpiratory capacity) and the other 2exceeding the average male values. *3The magnitude of the one- ,4_
second capacity bears a close frelationship to the peak rate of gas <flow (Fig. 6). The two principal asubjects had to achieve a peak °flow of 300 1./min. during expira- io'tion and 275 1./min. during z 2-
inspiration in order to attain a 0capacity 70% of the untimedvalue. The inspiratory curve liesconsistently to the left of expira-tory, this difference being statistic-ally significant in its upper part.THE PEAK RATE OF GAS FLOW. TOTAL TIa
-There is a highly significant FIG. 5.-Effet ofrelationship between the totaltime taken over delivery of thesample and the peak flow rate achieved (Fig. 7).The behaviour during the expiratory manceuvrecan be described quite satisfactorily by means of alinear regression, and there is no evidence that alimiting velocity is being approached even if as littleas one second is taken over delivery. The inspira-tory values are described less completely by a linearregression, since there is some evidence of a dispro-portionate change of flow rate over the range1 to 2 seconds; however, from 2 to 6 seconds thepoints again fall fairly closely about a straight line.It will be noted that the expiratory regression liessignificantly to the right of the inspiratory(P<0.001), although the slopes of the two lines arevery similar.THE FLOW RATE AT ONE SECOND.-The original
premise underlying the "one-second capacity "was that the gas flow during the F.V.C. manceuvreremained at or near a maximum for about onesecond in normal subjects (Hirdes and van Veen,
&r
2 3 4
ME TAKEN OVER DELIVERY
KEY
- Fxa- 1c ovy capacJy 'SE( D. S R.J-S.)
Fas* ~sirSor CApoc*y tS.EB D~P.& R.J S.)i SE
OA/ cr, subjecfs
5 6 7
Y OF SAMPLE (SECONOS)
total time taken over delivery of sample on magnitude of one-secondcapacity.
1952). The validity of this concept has been testedby calculating the flow rate at one second as apercentage of the peak flow in any given tracing.It was found that the one-second velocity variedconsiderably with the total time taken over de-livery of the sample. However, in 85 of 103 ex-piratory tracings and 80 of 88 inspiratory tracings,the peak velocity had been passed, and mostobservations with a normal delivery time had aone-second flow rate that was only 40 to 60% ofthe peak value.
If the period of measurement was shortened to0.75 second, as suggested by Kennedy (1953), therewas some increase in the number of readingswhere the peak flow had yet to be reached, butthis was not great-19 of 88 inspiratory tracings,and 33 of 103 expiratory tracings. In most trac-ings the velocity at 0.75 second was only slightlygreater than at 1 second, and there was no evi-dence of a sharp break in the velocity curve at
copyright. on F
ebruary 12, 2022 by guest. Protected by
http://thorax.bmj.com
/T
horax: first published as 10.1136/thx.11.3.223 on 1 Septem
ber 1956. Dow
nloaded from

R. J. SHEPHARD
FIG. 6.-Relationship between peakrate of gas flow and magnitudeof one-second capacity.
100 200 300PEAK GAS FLOW (L./MIN. BTPS)
either time. The one-second capacity can bemeasured more accurately because the volume isgreater and (if a spirometer is used) the oscilla-tions are of smaller amplitude, so that there seems
little advantage to be gained by the adoption ofthe shorter time interval.TIME REQUIRED TO REACH A PEAK FLOW.-This
gives some expression of the capacity of an in-dividual to develop a high respiratory velocityfrom a given chest position (maximum inspirationor maximum expiration). The rate of increase ofvelocity in any one tracing is fairly constant, par-ticularly at the higher velocities, and it is there-fore possible to calculate an average value for therespiratory "acceleration " for the period duringwhich respiratory velocity is increasing. Thereis a fairly wide individual variation in the magni-tude of this acceleration, but both the principalsubjects and five of the other six normal subjectsdevelop a greater acceleration during expiration.It can be seen also that the acceleration decreasesprogressively as the total time taken over deliveryis increased (Fig. 8).
TIME REQUIRED FOR GAS FLOW TO FALL TO A
Low LEVEL.-The length of the "exponentialtail" in individual tracings has been analysed bynoting the time taken for the rate of flow to fallto a low level (30 1./min.). The difference betweenthis time and the total time taken for deliveryindicates the magnitude of the "tail." There isno significant difference between results for thetwo principal subjects, and both inspiratory andexpiratory curves have a similar form (Fig. 9).As the delivery time is prolonged, the exponentialtail increases in length, at first quite slowly, butif more than 6 seconds is taken all the additionaltime is added to the length of the " tail."
DISCUSSIONIn any procedure involving measurements over
short periods of time it is desirable to useapparatus possessing a high natural frequency.However, until recently it was necessary to usea low frequency system (the spirometer) for theF.V.C. test, since no more suitable apparatus wasavailable. The pneumotachograph provides a use-
60 F
I.0
w
z
-j
I-0I--
0.
u
10z0Uw
z0
40 V
20 V
K EY
--F Fast Ey,oratory (C,?acLf(meea for RJS. R DPwItSE.)Fast /IsDiraoloC( c:C E
- (mc CAn fo6rR D.S8 "DPw(E
0 4-00
230
80 r
copyright. on F
ebruary 12, 2022 by guest. Protected by
http://thorax.bmj.com
/T
horax: first published as 10.1136/thx.11.3.223 on 1 Septem
ber 1956. Dow
nloaded from

THE DIRECT INTERPRETATION OF THE FAST VITAL CAPACITY RECORD 231
400 1
300 1
FIG. 7.-Relationship between peakrate of gas flow and time takenover delivery of gas sample.(Subject D. P.)
(ACL
zi-i
z
0-JIL
(w0.
SUBJECT D.P
Fast Expirafory (afacily---0--- Fast /ispiratory Cafaci'y
200 _-
l00o
.~~~~~~~~~~1 2 3 4 5 6 7
TOTAL TIME TAKEN OVER DELIVERY (SECONDS)8
ful alternative apparatus with much higher fre-quency, and permits the investigation of a numberof parameters of the F.V.C. It must now be con-
sidered how many of these have sufficient stabilityto be of clinical importance.The conventional "one-second capacity"
(Tiffeneau, Bousser, and Drutel, 1949; Roche andThivollet, 1949; Gaensler, 1951; Hirdes and van
Veen, 1952) is seriously influenced by the totaltime that the subject takes over the F.V.C. test;many even of the normal subjects tend to takelonger than the optimal time for a good result.However, this difficulty can be overcome eitherby relating the one-second capacity to total de-livery time (as in Fig. 5), or by measuring the totalfast capacity and relating this to delivery time (asin Fig. 4). The first procedure seems likely to bea more sensitive indicator of respiratory disability,although in normal subjects the second measure-ment shows a smaller variation, and is less affectedby changes in the peak rate of gas flow. Thepeak gas flow also shows a fairly stable relation-ship with delivery time in a given subject, but therange of standardized values in different normal
subjects is rather large, and clinical significancecould be attached only to gross departures fromnormality. The same seems true of the one-second flow-rate. The respiratory " acceleration "is a more promising measurement; during inspira-tion in particular, the curve relating the accelera-tion to total delivery time shows a comparativelysmall variation. Finally, the length of the " ex-ponential tail" seems a useful quantity. Thevariation in normal subjects is fairly small, andon general grounds it seems probable that thetail will be lengthened in conditions where the air-way is narrowed.
In some laboratories it may still prove expedientto measure at least the one-second capacity bymeans of a spirometer. Where this is necessary,errors may be minimized by (i) a light-weight bell(Bernstein, D'Silva, and Mendel, 1952) to minimizethe initial rise of pressure; (ii) a liquid of highviscosity, such as glycerol, in place of the waterseal, to give increased damping of the oscillationsthat are induced; (iii) an approximate correctionfor the oscillations, based on a reconstruction ofthe actual wave form, as in Fig. 3.
o
.
0 1 11
9 a10%I,.1I
I
I0
0 0 %
0 . -%
00 ol
1 -1,0
copyright. on F
ebruary 12, 2022 by guest. Protected by
http://thorax.bmj.com
/T
horax: first published as 10.1136/thx.11.3.223 on 1 Septem
ber 1956. Dow
nloaded from

R. J. SHEPHARD
K EY
* D.P MEAN ± S.E.
----- R.J.S. MEANt S.E.
Values foroiACrsuA bJectsFIG. 8.-The average respiratory
",acceleration" for the periodduring which respiratory velo-Cityj is increasing in relation tototal time taken over deliveryof sample. (a) I.F.V.C. (b)E.F.V.C.
1 2 3 4- 5 6TOTAL TIME IN SECONDS
FIG. 8a
7 b
KEY
t---R.J.S. MEAN +- S.E
3 D.P MEAN t S E
VALUES FOR
I OTHER SUBJECTS
10 7 8
1I\
\:
\
kI
%
sk
I z 3 + 5
TOTAL TIME IN SECONDS
FiG. 8b
232
40
G$
4.
Lu
Lu-
zI
z
I
LU
0:<
w
I-Lu
30
20 H
10
0
35
M
UJ'U
30NOu)
_U I
z
Z 200
4
15
'U
10
o-0)
iiL
0.- -1 -1 I -,
I
copyright. on F
ebruary 12, 2022 by guest. Protected by
http://thorax.bmj.com
/T
horax: first published as 10.1136/thx.11.3.223 on 1 Septem
ber 1956. Dow
nloaded from

THE DIRECT INTERPRETATION OF THE FAST VITAL CAPACITY RECORD 233
K EY
Fast yri7 jacf(Can WtA5EforRJSe DsJ
0)o9 FJtst IespvA8rs fait
z (Mcan wt 5E forfS'D °0u
wU)
03-Jw
IL0
-3
4
zz0xwU.0
z
0 2 3 4 5 s 7 8
TOTALTIME TAKEN OVER DELIVERY (SECONDS)FIG. 9.-The length of the exponential tail of the gas flow curve (flow less than 30
1.!min.) in relation to the total time taken over delivery of the gas sample.
SUMMARYSources of error in the spirometer method of
recording F.V.C. have been re-examined by simul-taneous pneumotachograph and F.V.C. tracings,direct recording of pressure fluctuations in thespirometer bell, and detailed study of the wave
form of oscillations induced under static anddynamic conditions. During the F.V.C. test,possible errors include (i) failure to indicate thetrue starting point of the test; (ii) the initiation ofa more rapid respiratory acceleration than isfound under conditions of minimal resistance ; and(iii) an obscuring of the end-point for the one-second capacity due to oscillations of the spiro-meter bell.The pneumotachograph avoids these difficul-
ties, and permits a reasonably accurate measure-ment of a number of parameters of the F.V.C.
The one-second capacity still seems the most use-ful of these measures, but it must be assessed inrelation to the total time taken over delivery ofthe sample. Other values that may prove ofclinical interest are the respiratory accelerationand the length of the " exponential tail " of thevelocity tracings.
REFERENCESBernstein, L. (1954). Thorax, 9, 63.
and Kazantzis, G. (1954). Ibid., 9, 326.and Mendel, D. (1951). Ibid., 6, 297.
- D'Silva, J. L., and Mendel, D. (1951). Ibid., 7, 255.Drutel, P., and Dechoux, J. (1952). J.franC. Mid. chir. thorac.,6, 517.Gaensler, E. A. (1951). Amer. Rev. Tuberc., 64, 256.Gilson, J. C., and Hugh-Jones, P. (1949). Clin. Sci., 7, 185.Hermannsen, J. (1933). Z. ges. exp. Med., 90, 130.Hirdes, J. J., and van Veen, G. (1952). Acta tuberc. scand., 26, 264.Kennedy, M. C. S. (1953). Thorax, 8, 73.Needham, C. D., Rogan, M. C., and McDonald, I. (1955). Brit. J
Trberc., 49, 30.Roche, L., and Thivollet, J. (1949). Arch. Mal. prof., 10, 448.Shephard, R. J. (1955). Thorax, 10, 258.- (1956). Flying Personnel Research Committee Report.Simonin, P. (1954). Sem. H8p. Paris, 30, 352.Tiffeneau, R., Bousser, J., and Drutel, P. (1949). Paris med. (partie
med), 137, 543.
copyright. on F
ebruary 12, 2022 by guest. Protected by
http://thorax.bmj.com
/T
horax: first published as 10.1136/thx.11.3.223 on 1 Septem
ber 1956. Dow
nloaded from