BMJ Paediatrics Open is committed to open peer review. As part of ...
Upload
khangminh22Category
view
0download
0
For peer review only
Predicting Myocardial Infarction in the Wisconsin Longitudinal Study
Journal: BMJ Open
Manuscript ID bmjopen-2016-011529
Article Type: Research
Date Submitted by the Author: 11-Mar-2016
Complete List of Authors: Gonzales, Tina; University of Wisconsin-Madison, Sociology Yonker, James; UW-Madison, Scoiology Chang, Vicky; UW-Madison, Scoiology Roan, Carol; UW-Madison, Scoiology Herd, Pamela; University of Wisconsin-Madison, Sociology Atwood, Craig; University of Wisconsin, Medicine
<b>Primary Subject Heading</b>:
Epidemiology
Secondary Subject Heading: Public health, Cardiovascular medicine
Keywords: Myocardial infarction < CARDIOLOGY, Wisconsin Longitudinal Study, gene-environment interactions, SOCIAL MEDICINE, gender
For peer review only - http://bmjopen.bmj.com/site/about/guidelines.xhtml
BMJ Open on January 9, 2022 by guest. P
rotected by copyright.http://bm
jopen.bmj.com
/B
MJ O
pen: first published as 10.1136/bmjopen-2016-011529 on 23 January 2017. D
ownloaded from
For peer review only
1
Predicting Myocardial Infarction in the Wisconsin Longitudinal Study
Tina Gonzales1, James A. Yonker1, Vicky Chang1, Carol L. Roan1, Pamela Herd1,2 and
Craig S. Atwood, Ph.D.3,4,5
1Department of Sociology, University of Wisconsin, Madison, WI 53705, USA
2La Follete School of Public Affairs, University of Wisconsin, Madison, WI 53705, USA
3Department of Medicine, University of Wisconsin-Madison School of Medicine and Public Health, Madison,
WI 53705, USA
4Geriatric Research, Education and Clinical Center, Veterans Administration Hospital, Madison, WI 53705,
USA
5School of Exercise, Biomedical and Health Sciences, Edith Cowan University, Joondalup, 6027 WA, Australia.
Running Title: Predicting Heart Attack
Corresponding Author:
Craig S. Atwood, Ph.D.
University of Wisconsin-Madison Medical School
William S. Middleton Memorial VA (GRECC 11G)
2500 Overlook Terrace
Madison, WI 53705
(608)-256-1901, Ext. 11664 (phone)
(608)-280-7291 (fax)
Keywords: myocardial infarction, Wisconsin Longitudinal Study, gene-environment interactions, social
medicine, gender
Page 1 of 80
For peer review only - http://bmjopen.bmj.com/site/about/guidelines.xhtml
BMJ Open
123456789101112131415161718192021222324252627282930313233343536373839404142434445464748495051525354555657585960
on January 9, 2022 by guest. Protected by copyright.
http://bmjopen.bm
j.com/
BM
J Open: first published as 10.1136/bm
jopen-2016-011529 on 23 January 2017. Dow
nloaded from
For peer review only
2
Abstract
Objectives: This study examined how environmental, health, socio-behavioral, and genetic
factors interact to contribute to myocardial infarction (MI) risk.
Design: Survey data collected by the Wisconsin Longitudinal Study (WLS), USA from 1957-2011,
including 235 environmental, health, and socio-behavioral factors, and 77 single-nucleotide
polymorphisms, were analyzed for association with MI.
Participants: 6,198 WLS participants (2,938 men, 3,260 women) who 1) had a MI before 72
years, and 2) had a MI between 65-72 years.
Results: In men, stroke (LR odds ratio: 5.01, 95% confidence interval: 3.36-7.48), high
cholesterol (3.29, 2.59-4.18), diabetes (3.24, 2.53-4.15), and high blood pressure (2.39, 1.92-
2.96) increased MI risk up to 72 years of age. For those with high cholesterol, the interaction of
smoking and lower alcohol consumption increased risk from 23% to 41%, with exposure to
dangerous working conditions, a factor not previously linked with MI, further increasing risk to
50%. Conversely, low cholesterol and no history of diabetes or depression lowered risk below
2.5%. Only stroke (4.08, 2.17-7.65) and having diabetes (2.71, 1.81-4.04) by 65 remained risk
factors for men who experienced their MI after age 65. For women, diabetes (5.62, 4.08-7.75),
high blood pressure (3.21, 2.34-4.39), high cholesterol (2.03, 1.38-3.00), and dissatisfaction with
their financial situation (4.00, 1.94-8.27) increased MI risk up to 72 years of age. Conversely,
often engaging in physical activity alone (0.53, 0.32-0.89) or with others (0.34, 0.21-0.57) was
associated with largest reduction in MI risk. Not having diabetes or high blood pressure and
engaging in physical activity lowered MI risk to 0.2%.
Conclusions: Together these results indicate important differences in risk factors for MI
between genders, that combinations of risk factors greatly influence the likelihood of MI, that
MI risk factors become less predictive after 65 years, and that genetic factors assessed were
secondary to environmental factors in terms of predictability.
Article Summary
Strengths and limitations of this study:
Page 2 of 80
For peer review only - http://bmjopen.bmj.com/site/about/guidelines.xhtml
BMJ Open
123456789101112131415161718192021222324252627282930313233343536373839404142434445464748495051525354555657585960
on January 9, 2022 by guest. Protected by copyright.
http://bmjopen.bm
j.com/
BM
J Open: first published as 10.1136/bm
jopen-2016-011529 on 23 January 2017. Dow
nloaded from
For peer review only
3
• 58-year longitudinal survey study (WLS) containing a breadth of data, including
environmental, health, socio-behavioral, and genetic
• Environmental, health and socio-behavioral data was collected through survey methods
• Genetic data used in this study was limited to previously selected SNPs from studies of
age-related diseases and neurological conditions
• WLS participants are almost exclusively middle- to upper-middle-class, non-Hispanic
Whites from Wisconsin, therefore social- and genetic-factor homogeneities reduce
generalizability
Page 3 of 80
For peer review only - http://bmjopen.bmj.com/site/about/guidelines.xhtml
BMJ Open
123456789101112131415161718192021222324252627282930313233343536373839404142434445464748495051525354555657585960
on January 9, 2022 by guest. Protected by copyright.
http://bmjopen.bm
j.com/
BM
J Open: first published as 10.1136/bm
jopen-2016-011529 on 23 January 2017. Dow
nloaded from

For peer review only
4
Introduction
Heart disease impacts ~26.6 million U.S. adults and is the leading cause of death among men
and women in the United States, accounting for 25% of deaths (~600,000 people) annually 1 2.
An estimated 935,000 people in the United States suffer from a myocardial infarction (MI)
every year 3.
MI is a symptom of advanced or severe heart disease 4-6 and the major modifiable risk factors
for MI include high blood pressure 3 7 8, high blood cholesterol 9-13, diabetes (mellitus) 14-16,
smoking/tobacco use 17-21, obesity and being overweight 22-27, poor nutrition/diet 28-36, physical
inactivity 37-41, and (no or excessive) alcohol use 42-47. Stress has also been shown to be an
important (modifiable) risk factor for MI 48-51. The major non-modifiable risk factors for MI
include gender 52-57, age 3 58 59, family history 60-63, and race 1 3 64. However, not all individuals
with these risk factors experience a MI. Thus, it is likely that combinations of these risk factors,
or as yet unknown risk factors, are important in the etiology of the disease.
Other non-modifiable risk factors include genetic polymorphisms such as the apolipoprotein E
(apoE) gene polymorphisms 65 66, the cholesteryl ester transfer protein gene (CETP) 67-69, and the
CDKN2B-AS1 RNA gene (9p21.3 variant) 70 71, but there is no consensus about which gene(s) are
most predictive of MI. In addition, there are few large-scale studies that have looked at the
interactions between genetic and environmental, health, and socio-behavioral factors that
predict MI.
Research has shown that risk factors for heart disease and MI are moderated by gender and
age, and the interaction of environmental, social, and genetic factors with heart disease and MI
affect men and women differently at different ages throughout their lives 53-55 57 72. For
example, women are more likely than men to die within one year of experiencing an MI when
younger 73 74, but in general first experience MI later in life than do men 55, although men are
more likely to experience MI overall 3. Identification of gender specific risk factors and how they
change over time is important for predicting disease risk throughout life.
In this study, we examined how environmental, health, or socio-behavioral (E) factors interact
with genetic (G) factors to contribute to MI risk, with the goal of determining: 1) which
interactions among these factors increase or decrease the predictability of a MI; 2) differences
in risk factor(s) between men and women, with a focus on the interaction among factors that
lead to MI; 3) how MI risks change over a person’s lifetime, again with a focus on the
interaction among factors; and 4) what factors may combine to reduce a person’s risk of having
a MI, even in the presence of other risk factors. Data was analyzed from the Wisconsin
Longitudinal Study (WLS). Our results demonstrate that: 1) there are major differences in risk
factors for MI between the genders; 2) that combinations of risk factors greatly influence the
Page 4 of 80
For peer review only - http://bmjopen.bmj.com/site/about/guidelines.xhtml
BMJ Open
123456789101112131415161718192021222324252627282930313233343536373839404142434445464748495051525354555657585960
on January 9, 2022 by guest. Protected by copyright.
http://bmjopen.bm
j.com/
BM
J Open: first published as 10.1136/bm
jopen-2016-011529 on 23 January 2017. Dow
nloaded from
For peer review only
5
likelihood of an MI; 3) that risk factors become less predictive in those who have a MI after 65
years of age in both genders; and 4) genetic factors assessed were secondary to E factors in
terms of predictability.
Page 5 of 80
For peer review only - http://bmjopen.bmj.com/site/about/guidelines.xhtml
BMJ Open
123456789101112131415161718192021222324252627282930313233343536373839404142434445464748495051525354555657585960
on January 9, 2022 by guest. Protected by copyright.
http://bmjopen.bm
j.com/
BM
J Open: first published as 10.1136/bm
jopen-2016-011529 on 23 January 2017. Dow
nloaded from
For peer review only
6
Methods
Study Participants and WLS Survey Data
The Wisconsin Longitudinal Study (WLS) is a 54-year-long survey study on the lives of a cohort
of 1957 Wisconsin high-school graduates. The original cohort of participants was made up of
10,317 men and women, randomly selected from those graduating from a Wisconsin high
school in 1957. Survey data was collected from WLS graduate participants in 1957, 1964, 1975,
1993, 2004, and 2011. Data from each of the aforementioned survey rounds was included in
this study, with many of the selected variables representing the same questions asked at
multiple time points (WLS survey rounds). All of the environmental, health, and socio-
behavioral data described herein will be labeled as ‘E’ data for the purposes of this study. In
addition, DNA saliva samples were provided by a subset of the WLS (4,562 graduates) and 77
single-nucleotide polymorphisms (SNPs) were genotyped for each of these participants in 2009,
providing genetic data for a subset of the WLS as well. These SNPs will be labeled as ‘G’ data for
the purposes of this study. Additional information about the WLS survey data and participants
can be found elsewhere 75 76 (http://www.ssc.wisc.edu/wlsresearch/).
The Wisconsin Longitudinal Study has enjoyed high response rates across multiple survey
waves. The data for the current analyses come primarily from the 1993, 2004, and 2011 survey
waves when the cohort was 53, 64, and 71 years old, respectively. In 1993, 8493 cohort
members participated in the telephone survey, 588 refused to participate, 587 were deceased,
and 649 were unfielded for either administrative reasons or permanent disability. In 2004,
7265 cohort members participated in the telephone survey, 956 refused, 1287 were deceased,
and 809 were unfielded. Finally, for the 2011 in-home interview, 5968 cohort members
participated in the survey, 1088 refused, 1587 were deceased, and 1674 were unfielded (see
Supplemental Table 1). Among those not deceased, response rates for these survey waves
were 87%, 80%, and 60%, respectively. Also excluding unfielded cases from the denominator
brings the response rates to 94%, 88%, and 85%.
Study Question and Risk Factors for MI
This study examined possible risk factors for MI using E and G data available through the WLS.
Two sets of data were analyzed based on survey years of data collected, looking at those who
had a MI up to 72 years of age and those that experienced a MI between 65-72 years. We did
this for two reasons: 1) to examine MI up to 72 years and what factors would be associated
with this group regardless of when their MI occurred, and 2) an analysis of factors that occurred
only BEFORE a MI. Because of the timing of the survey years (the majority of participants having
reached 65 and 72 years old by 2004 and 2011, respectively), this allowed us to look at MI at
any point in one’s lifetime (up to 72 years), versus a MI in “older age” (65-72 years).
Page 6 of 80
For peer review only - http://bmjopen.bmj.com/site/about/guidelines.xhtml
BMJ Open
123456789101112131415161718192021222324252627282930313233343536373839404142434445464748495051525354555657585960
on January 9, 2022 by guest. Protected by copyright.
http://bmjopen.bm
j.com/
BM
J Open: first published as 10.1136/bm
jopen-2016-011529 on 23 January 2017. Dow
nloaded from

For peer review only
7
Serendipitously, this also allowed us to determine how risk factors change with age as well as
how predictive risk factors remain over time.
In order to create our dependent MI variables, we compiled data from the 2004 and 2011 WLS
surveys and the National Death Index (NDI). From this we created two dependent variables
(DV) and two separate associated datasets. The first DV, ‘MI by 72 Years of Age’, was coded as
“Yes” if a participant reported experiencing a MI in 2004 or 2011 or died of MI according to the
NDI (ICD-9 or ICD-10 codes; Note: NDI data was collected by the WLS only up to 2006 at the
time of the current study), thereby including anyone who reported having a MI to the WLS. The
DV was coded “No” only if no previous MI’s were reported and the participant reported no MI’s
in 2011. This resulted in MI data for 6,198 graduates, with 776 participants coded as “Yes” and
5,422 coded as “No” for the given variable. Additionally, this DV was linked to a dataset which
included independent variables (IV) from all WLS survey years, 1957-2011. Characteristics of
the WLS participants included in this study population are shown in Table 1. The second DV, ‘MI
Between 65-72 Years of Age’, was coded similarly to the first, but included ONLY those
participants who reported no MI’s by 2004. This DV was coded as “Yes” if the participant
reported having a MI between 2004 and 2011 (in 2011) or died of acute MI after 2004, and was
coded as “No” if the participant reported no MI’s in 2011. This resulted in MI data for 5,321
graduates, with 213 participants coded as “Yes” and 5,108 coded as “No”. This DV was linked to
a dataset which included only IV collected during the 2004 survey year or earlier. Information
about specific WLS variables used to create the two DV for the current study is provided in
Supplemental Information 1.
I. Environmental, Health, and Socio-Behavioral Data
From the data generated by the WLS, official release version 13.01, we analyzed 235
environmental, health, and socio-behavioral variables (E data) against MI data for WLS
participants included in this study. E data variables included descriptive, family, spouse,
children, personality, medical history, family’s medical history, general health and weight,
exercise, sleep, smoking, alcohol consumption, social, work-related, socio-economic, life-
satisfaction, stress-related and coping, stressful life events (SLEs), summary psychological and
personality variables (Supplemental Information 2). We analyzed an additional 26 variables in
all female-specific analyses, which included variables related to menstruation, menopause,
reproductive surgeries, and hormone replacement therapies.
One variable, ‘Summary Score Anger Index, 2004’, was updated by the WLS during the course of
this study, in July 2014. Therefore, for this variable the updated version 13.02 data was
substituted for the version 13.01 data for all analyses conducted. Additionally, in the WLS
surveys there were some questions that were asked of only a subset of the WLS participants,
Page 7 of 80
For peer review only - http://bmjopen.bmj.com/site/about/guidelines.xhtml
BMJ Open
123456789101112131415161718192021222324252627282930313233343536373839404142434445464748495051525354555657585960
on January 9, 2022 by guest. Protected by copyright.
http://bmjopen.bm
j.com/
BM
J Open: first published as 10.1136/bm
jopen-2016-011529 on 23 January 2017. Dow
nloaded from
For peer review only
8
specifically, the alcohol- and depression-related questions were only asked of a 79% random
subset of the WLS.
II. SNP Genotyping Data
Of the 4,562 graduates who provided DNA saliva samples to the WLS, 4,012 also answered the
MI questions and were therefore included in the SNP analyses for this study. A total of 77 SNPs
were genotyped for each of these participants in 2009, as described in Roetker et al. 77. This
study also included 5 additional G variables based on genotype data from the apolipoprotein E
(ApoE) gene, because of its known association with cardiovascular and other disease states 65 78-
80. Three ApoE alleles: APOE ɛ2, APOE ɛ3, and APOE ɛ4, determined by the SNPs rs429358 and
rs7412 were used to determine ApoE status 81 82. From this we created 5 variables, allele ApoE4
+/-, allele ApoE2 +/-, genotype E4/E4, genotype E2/E2, and specific ApoE genotype
(Supplemental Information 2).
Statistical Analyses
This study looked for independent as well as interactive effects of E variables (E x E) for the
6,198 and 5,321 WLS graduates for which data was available for our two dependent MI
variables, respectively. Of these, 4,012 and 3,684 respectively, also provided G data which was
analyzed for independent as well as interactive effects separately (G x G) and in combination
with E data (G x E), in order to identify different genetic and environmental factors that may
combine to contribute to MI risk. In order to address possible collinearity of covariates
measured in multiple survey rounds, we first completed a recursive partitioning and random
forest analysis in order to reduce the number of variables analyzed, and then ran independent
logistic regression analysis for each predictor variable identified, rather than a multiple
regression analysis of all predictors. A similar strategy, using machine-learning methodologies
to identify risks followed by logistic regression analysis of individual factors, has been used in
prior studies 77.
I. Recursive Partitioning
Recursive partitioning (RP) was used to create classification trees in order to determine main
factor and interactive effects associated with MI risk using E variables (E x E), G variables (G x
G), and E and G variables combined (E x G) in order to assess whether MI risk is better explained
by our environment, our genetics, or a combination of both. All RP analyses were completed
using the R program, version 2.15.2 83 with package ‘rpart’ 84, based on Breiman’s classification
and regression trees algorithm 85. Priors were set to 0.5, 0.5, the usesurrogate parameter was
set to 0, maxcompete was set to 0, maxsurrogate was set to 0, and the complexity parameter
(cp) was set to 0.01. A 10-fold cross-validation procedure was used to determine how far back
to prune the trees. Odds ratios (OR) and 95% confidence intervals (CI) were calculated using
Page 8 of 80
For peer review only - http://bmjopen.bmj.com/site/about/guidelines.xhtml
BMJ Open
123456789101112131415161718192021222324252627282930313233343536373839404142434445464748495051525354555657585960
on January 9, 2022 by guest. Protected by copyright.
http://bmjopen.bm
j.com/
BM
J Open: first published as 10.1136/bm
jopen-2016-011529 on 23 January 2017. Dow
nloaded from
For peer review only
9
MedCalc (www.medcalc.org/calc/ odds_ratio.php; calculations according to Altman 86). When
zeros appeared in the terminal nodes of the RP trees, MedCalc used an ad hoc method to
determine estimates of OR 87 88.
II. Random Forest
Random forest (RF) 89-92 was used in our association analyses 93-96 and was conducted using the
‘randomForest’ package 97 98 available with the R program. We chose to use ‘margin measure’
or mean decrease in accuracy to determine variable importance 99 100. Missing values were
imputed for predictor variables using the ‘na.roughfix’ command, which imputes missing values
using either the median value for numeric variables, or the most frequent level for factor
variables. Using imputed values with the ‘rfImpute’ command for missing data was considered
here, but the bias that was noted in preliminary analyses was considered too great. Three trials
of RF were conducted for each ‘variable importance’ measure, to determine the replicability of
the results, in large part because of the randomness associated with this particular test. Using
the DV ‘MI by 72 Years of Age’ and associated dataset the ‘mtry’ parameter was set to 34 for
males and 36 for females, based on the lowest out-of-bag (OOB) estimate of error rate of
12.25% and 5.09%, respectively. Using the DV ‘MI Between 65-72 Years of Age’ and associated
dataset the ‘mtry’ parameter was set to 30 for males and 32 for females, based on the OOB
estimate of error rate of 5.87% and 2.47%, respectively. The number of trees in the forest, the
‘ntree’ parameter, was set to 5000 for both males and females in both analyses.
III. Logistic Regression and Chi-square
Single-factor associations with MI risk were determined for all E and G variables that appeared
in either the RP tree(s) or the RF list(s) of important variables generated for each of the DV
analyses, using a logistic regression (LR) model and Chi-square (X2) test with R. For those cases
where the sample size (one or more categories) was too small for a X2 test (n< 5), Fisher’s Exact
test was used to calculate significance. When necessary, Fisher’s Exact test p-values were
obtained using Monte Carlo simulation. LR odds ratios were determined by exponentiating the
coefficients of the regression models using the R program. All p-values generated from these
tests were adjusted for multiple testing using a q-value adjustment, with the R program version
2.15.2, package ‘qvalue’ 101 102, which has been shown to be less stringent than the Bonferroni
adjustment. All significance findings from LR and X2 (or Fisher’s Exact test) reported herein refer
to these adjusted values.
Only those factors that were identified by at least three of the four analyses employed in this
study and meaningfully affected MI risk (increased or decreased odds by at least 40%) were
further considered as possible risk factors for MI by this study and included herein.
Furthermore, in order to address any bias that may have been created due to missing data
Page 9 of 80
For peer review only - http://bmjopen.bmj.com/site/about/guidelines.xhtml
BMJ Open
123456789101112131415161718192021222324252627282930313233343536373839404142434445464748495051525354555657585960
on January 9, 2022 by guest. Protected by copyright.
http://bmjopen.bm
j.com/
BM
J Open: first published as 10.1136/bm
jopen-2016-011529 on 23 January 2017. Dow
nloaded from
For peer review only
10
(non-response) in this study, we performed a ‘logical bounding’ procedure in which we logically
filled in missing data points in our dataset, first with all participants who were not included due
to missing values coded as “Yes” for MI and then as “No” for MI. We then reran our logistic
regression analyses in order to see if our ‘overall’ risks or predictors of MI remained statistically
significant, and thereby determine if our results were robust. All p-values generated from this
logical bounding were also adjusted for multiple testing using q-value adjustment.
Page 10 of 80
For peer review only - http://bmjopen.bmj.com/site/about/guidelines.xhtml
BMJ Open
123456789101112131415161718192021222324252627282930313233343536373839404142434445464748495051525354555657585960
on January 9, 2022 by guest. Protected by copyright.
http://bmjopen.bm
j.com/
BM
J Open: first published as 10.1136/bm
jopen-2016-011529 on 23 January 2017. Dow
nloaded from
For peer review only
11
Results
To assess changes in risk factors over a person’s lifetime, separate analyses were performed on
individuals ever having a MI up to 72 years of age compared to those having a MI between 65-
72 years of age (see Methods). Participants included in the ‘MI by 72 Years of Age’ DV were
47.4% male, had an average IQ of 102.1 with an average 13.75 years of regular education. At
the time of the 2004 interview the average age of participants was 64.3 years, 78.6% were
married, with an average total household income of $30,619. 11.6% of participants were
smokers, consumed alcohol on average 7.6 days/month, and 12.5% have ever reported a MI to
the WLS (see Table 1). Of these participants, 85.9% were also included in the ‘MI Between 65-
72 Years of Age’ DV. Men in the WLS were significantly more likely to experience MI than were
women, to have more education, to be married, to have a higher household income, and to
drink alcohol more days per month than women in the WLS (Table 1; based on t-test or equal
proportions test). All analyses identified gender as one of the best predictors of MI risk
(Supplemental Information 3), therefore men and women were analyzed separately throughout
this study. Note to readers, we reported results in terms of MI ‘by 72’ years and MI ‘between
65-72’ years because the majority of participants were 65 or younger during the 2004 survey
and 72 or younger during the 2011 survey.
I. Males
MI Risk to Age 72
Interactive Effects
RP analysis indicated that overall MI prevalence was 18.1% for men. High cholesterol by 65
years old was the most significant factor for increased odds of MI among males (Figure 1), with
a prevalence of 23.1% versus 8.4% (odds ratio: 3.29, 95% confidence interval: 2.59-4.18). For
those men without high cholesterol by 65, the interactions among risk factors creating the
largest MI risk overall were having diabetes by 65, summary score for openness at 65, and
genotype for the CYP11B2 gene (rs1799998 SNP), increasing MI prevalence to 30.6% versus
0.0% (20.22, 1.15-355.10). For those men with no high cholesterol and no diabetes by 65,
important interactions included their summary score for (psychological) distress/depression at
65 and having high blood pressure by 65, with MI prevalence at 27.5% versus 7.5% (4.66, 1.90-
11.38). Among those men with a lower summary score for depression, important interactions
included having high cholesterol by 72 and alcohol consumption at 72, with MI prevalence at
26.9% versus 4.4% (6.89, 2.12-22.44). For those men who did have high cholesterol by 65, the
interactions among risk factors creating the largest MI risks overall were the number of years
the participant had smoked by 54, alcohol consumption at 65, exposure to dangerous
conditions at work at 65, and genotype for the FADS2 gene (rs174575 SNP), with MI prevalence
Page 11 of 80
For peer review only - http://bmjopen.bmj.com/site/about/guidelines.xhtml
BMJ Open
123456789101112131415161718192021222324252627282930313233343536373839404142434445464748495051525354555657585960
on January 9, 2022 by guest. Protected by copyright.
http://bmjopen.bm
j.com/
BM
J Open: first published as 10.1136/bm
jopen-2016-011529 on 23 January 2017. Dow
nloaded from
For peer review only
12
at 46.7% versus 7.1% (11.38, 1.96-66.12). For males who had high cholesterol by 65, but had
smoked fewer years by 54, important interactions among MI risk factors included having
diabetes by 65, the extent to which one agreed that family worries or problems distracted from
work at 65, and total years of college completed, with MI prevalence increased to 53.3% versus
0.0% (19.34, 1.02-365.26). For the men who did have high cholesterol by 65, but smoked fewer
years by 54 and did not have diabetes by 65, important interactions included having a biological
parent or sibling who had a MI before age 55, the most the man had ever weighed in pounds by
72, total household income (THI) at 65, and genotype for the IL6 gene (rs1800795 SNP), with MI
prevalence at 32.6% versus 5.3% (8.69, 1.83-41.36) (Figure 1).
Single Factor Effects
For men up to 72 years old, the ten most important MI risk factors determined using RF were:
1) days/month drinking alcohol, 2) total household income, 3) satisfaction with financial
situation, 4) alcoholic drinks/month, 5) high blood pressure, 6) number of children, 7) high
cholesterol, 8) the frequency that work required physical effort, 9) pack-years smoked, and 10)
worrying a lot, all at 72 years old (see Supplemental Information 4 for additional ‘important’ MI
risk factors by RF).
Of the factors that were found significant by RP or RF, LR identified having high cholesterol by
65 (3.29, 2.59-4.18) and 72 (3.32, 2.50-4.42), diabetes by 65 (3.24, 2.53-4.15) and 72 (2.26,
1.78-2.88), stroke by 65 (5.01, 3.36-7.48), high blood pressure by 65 (2.39, 1.92-2.96) and 72
(2.16, 1.67-2.79), exposure to dangerous conditions at work at 65 (1.41, 1.11-1.79), and having
a parent or sibling who had a MI before age 55 (1.89, 1.43-2.49) as significantly associated with
MI risk for males (Table 2a). Chi-square also identified each of the listed factors as significantly
associated with MI risk for males.
Overall Risks for MI by 72 Years of Age
MI risks supported by at least three of the analyses employed by this study were compiled in
order to determine which risks were most predictive of MI in the WLS cohort. For males up to
72 years of age, the MI risks supported by all four analyses used in this study were having high
cholesterol by 65, having high cholesterol by 72, and having diabetes by 65, which were all
highly significant by LR and X2 (Table 2a). These results are supported by the male RP tree, as
having high cholesterol by 65 and diabetes by 65 were the first and second most predictive
nodes in that tree (Figure 1). The MI risks for males that were supported by three of the
analyses in this study including RF were having diabetes by 72, having had a stroke by 65, and
having high blood pressure by 72, which were all highly significant by LR and X2. The risks that
were supported by three of the analyses including RP were having high blood pressure by 65,
Page 12 of 80
For peer review only - http://bmjopen.bmj.com/site/about/guidelines.xhtml
BMJ Open
123456789101112131415161718192021222324252627282930313233343536373839404142434445464748495051525354555657585960
on January 9, 2022 by guest. Protected by copyright.
http://bmjopen.bm
j.com/
BM
J Open: first published as 10.1136/bm
jopen-2016-011529 on 23 January 2017. Dow
nloaded from
For peer review only
13
exposure to dangerous conditions at work at 65, and having a parent or sibling who had a MI
before age 55, which were all significant by LR and X2 (Table 2a).
MI Risks Between 65-72 Years of Age
Interactive Effects
MI prevalence in males between 65-72 years of age was 5.9%. Days/month drinking alcoholic
beverages at 65 years old was the only significant factor for increasing the odds of MI among
males 65-72 years old (Figure 2), increasing MI prevalence to 7.7% among those who drank <
8.5 days/month versus 2.9% among those who drank ≥ 8.5 days/month (2.77, 1.80-4.25).
Single Factor Effects
For men between 65-72 years of age, the ten most important MI risk factors by RF were: 1)
alcoholic drinks/month at 65 years old, 2) summary score for distress/depression at 54, 3) body
mass index at 54, 4) alcoholic drinks/month at 54, 5) summary score for neuroticism at 54, 6)
the most ever weighed (at 65), 7) days/month drinking alcohol at 65, 8) body mass index at 65,
9) pack-years smoked at 54, and 10) years smoked at 54 (see Supplemental Information 5 for
additional ‘important’ MI risk factors by RF).
Of the factors that were found significant by RP or RF, LR identified having had a stroke by 65
(4.08, 2.17-7.65) and having diabetes by 65 (2.71, 1.81-4.04) as significantly associated with MI
risk for males (Table 2b). Chi-square also identified these two factors as significantly associated
with MI risk for males 65-72 years old (Table 2b).
Overall Risks for Having a MI Between 65-72 Years of Age
For males between 65-72 years old, the MI risks supported by at least three of the four analyses
employed by this study were having had a stroke by 65 and having diabetes by 65, which were
both highly significant by LR and X2 and ‘important’ risks by RF (Table 2b).
II. Females
MI Risk to Age 72
Interactive Effects
For women up to 72 years of age, RP analysis indicated that overall MI prevalence was 7.5%,
which was 10.6% below that of men. For women, having diabetes by 65 was the most
significant factor for increased odds of MI, with a prevalence of 22.4% versus 4.9% (5.62, 4.08-
7.75; Figure 3). For the latter group, the interactions among risk factors creating the largest MI
risks overall were having high blood pressure by 65 and how often they engaged in light
Page 13 of 80
For peer review only - http://bmjopen.bmj.com/site/about/guidelines.xhtml
BMJ Open
123456789101112131415161718192021222324252627282930313233343536373839404142434445464748495051525354555657585960
on January 9, 2022 by guest. Protected by copyright.
http://bmjopen.bm
j.com/
BM
J Open: first published as 10.1136/bm
jopen-2016-011529 on 23 January 2017. Dow
nloaded from

For peer review only
14
physical activities with others at 67, with MI prevalence at 3.7% versus 0.2% (18.39, 2.49-
135.77). And among the women who did not have diabetes, but did have high blood pressure
by 65, important interactions included how many years they had smoked by age 54 (≥ 24.5
years = 16.6% prevalence) and how often the participant blamed themselves when they
experienced a difficult or stressful event at 72 years old, with MI prevalence at 11.8% versus
2.7% (4.87, 2.25-10.55; Figure 3).
Single Factor Effects
For women up to 72 years old, the ten most important MI risk factors determined using RF
were: 1) days/month drinking alcohol at 72, 2) satisfaction with financial situation at 72, 3) total
household income at 72, 4) high blood pressure at 72, 5) worrying a lot at 72, 6) alcoholic
drinks/month at 72, 7) diabetes by 65, 8) number of children, 9) body mass index at 72, and 10)
the most ever weighed (at 72) (see Supplemental Information 6 for additional ‘important’ MI
risk factors by RF).
Of the factors that were found significant by RP or RF, LR identified having diabetes by 54 (6.93,
4.18-11.49), 65 (5.62, 4.08-7.75), and 72 (4.24, 3.04-5.91), high cholesterol by 72 (2.03, 1.38-
3.00), not being married at 72 (1.59, 1.16-2.18), satisfaction with financial situation at 72 ([not
at all] 4.00, 1.94-8.27; [somewhat] 2.02, 1.31-3.12; multiple coefficients significant by LR),
engaging in vigorous physical activity alone at 67 (0.53, 0.32-0.89), high blood pressure at 65
(3.21, 2.34-4.39) and 72 (3.37, 2.23-5.09), and engaging in light physical activity with others at
67 (0.34, 0.21-0.57) as significantly associated with MI risk for females (Table 3a). Chi-square
also identified these factors as significantly associated with MI risk for females (Table 3a).
Overall Risks for MI by 72 Years of Age
The MI risk factor for females up to 72 years old that was supported by all four analyses was
having diabetes by 65 years old, which was also highly significant by LR and X2 (Table 3a), and
was the most predictive MI risk according to the female RP tree (Figure 3). The MI risks for
females that were supported by at least three of the analyses in this study including RF were
having diabetes by 54 and 72, having high cholesterol by 72, not being married at 72,
satisfaction with financial situation at 72, engaging in vigorous physical activity alone at 67, and
having high blood pressure at 72, which were all significant by LR and X2. The MI risks for
females that were supported by three of the analyses in this study including RP were having
high blood pressure by 65 and engaging in light physical activity with others at 67, which were
both highly significant by LR and X2 (Table 3a).
MI Risks Between 65-72 Years of Age
Interactive Effects
Page 14 of 80
For peer review only - http://bmjopen.bmj.com/site/about/guidelines.xhtml
BMJ Open
123456789101112131415161718192021222324252627282930313233343536373839404142434445464748495051525354555657585960
on January 9, 2022 by guest. Protected by copyright.
http://bmjopen.bm
j.com/
BM
J Open: first published as 10.1136/bm
jopen-2016-011529 on 23 January 2017. Dow
nloaded from

For peer review only
15
MI prevalence in females between 65-72 years of age was 2.5%. Having diabetes by 65 years
old was again the most significant factor for increased odds of MI among females in this age
bracket (Figure 4), with a MI prevalence of 7.8% among those with diabetes by 65 and a
prevalence of 2.0% among those with no diabetes by 65 (4.25, 2.50-7.24). For females who had
diabetes by 65 years old, the interactions among risk factors creating the largest MI risk overall
were their summary score for agreeableness at 65 and not having had a menstrual period in the
last 12 months by 54 years of age, increasing MI prevalence to 14.0% versus 0.0% (13.58, 0.79-
233.29). For those females who did not have diabetes by 65, important interactions included
IQ, genotype for the Inhibin Beta B gene (rs11902591 SNP), and how often their work required
physical effort at 54, with MI prevalence at 25.0% versus 0.0% (37.95, 1.81-795.67). And among
those women with a lower IQ score, important interactions included their summary score for
extraversion at 54, how often they engaged in light physical activities alone at 65, the number
of alcoholic drinks consumed/month at 65, body mass index at 65, genotype for the A2M gene
(rs669 SNP), how often they worked under the pressure of time at 54, and the age at which
they had last menstruated, with MI prevalence increasing to 13.8% versus 0.0% (12.42, 0.72-
215.47) (Figure 4).
Single Factor Effects
For women between 65-72 years of age, the ten most important MI risk factors were: 1)
alcoholic drinks/month at 65 years old, 2) summary score for distress/depression at 65, 3)
diabetes at 65, 4) body mass index at 65, 5) the most ever weighed (at 65), 6) days/month
drinking alcohol at 54, 7) days/month drinking alcohol at 65, 8) drinks/day on days when drank
alcohol at 65, 9) age when had surgery to remove uterus and/or ovaries, and 10) summary
score for distress/depression at 54 (see Supplemental Information 7 for additional ‘important’
MI risk factors by RF). None of the G variables appeared among the RF important factors for
males or females, in either analysis.
Of the factors that were found significant by RP or RF, LR identified having diabetes by 65 (4.25,
2.50-7.24), exposure to dangerous conditions at work at 54 (2.24, 1.36-3.69), and having had a
menstrual period in the last 12 months at 54 (0.46, 0.23-0.91) as significantly associated with
MI risk for females between 65-72 years of age (Table 3b). Chi-square also identified these
factors as significantly associated with MI risk for females in this age bracket (Table 3b).
Overall Risks for Having a MI Between 65-72 Years of Age
For females between 65-72 years old, the MI risk that was supported by all four analyses was
having diabetes by 65, which was highly significant by LR and X2 (Table 3b), and was the most
predictive MI risk according to the female RP tree for this age group (Figure 4). The MI risks for
females that were supported by at least three of the analyses employed in this study were
Page 15 of 80
For peer review only - http://bmjopen.bmj.com/site/about/guidelines.xhtml
BMJ Open
123456789101112131415161718192021222324252627282930313233343536373839404142434445464748495051525354555657585960
on January 9, 2022 by guest. Protected by copyright.
http://bmjopen.bm
j.com/
BM
J Open: first published as 10.1136/bm
jopen-2016-011529 on 23 January 2017. Dow
nloaded from

For peer review only
16
exposure to dangerous conditions at work at 54, which was significantly associated with MI by
LR and X2 and deemed an ‘important’ MI risk factor by RF, and having menstruated in the last
12 months at 54, which was significantly associated by LR and X2 and present in the RP tree
(Table 3b).
Logical bounding of missing data and subsequent logistic regression analysis (see Methods)
showed that all but one of the overall risks for MI identified by this study were robust to
missing data, as they all remained statistically significant on both sides of the logical bounding
procedure (results not shown). The only risk that did not remain significant was exposure to
dangerous conditions at work for females experiencing MI between 65-72 years of age, when
all missing data points were coded as “Yes”, suggesting that this result was less robust or more
sensitive to missing data, which should be considered when evaluating the results.
Page 16 of 80
For peer review only - http://bmjopen.bmj.com/site/about/guidelines.xhtml
BMJ Open
123456789101112131415161718192021222324252627282930313233343536373839404142434445464748495051525354555657585960
on January 9, 2022 by guest. Protected by copyright.
http://bmjopen.bm
j.com/
BM
J Open: first published as 10.1136/bm
jopen-2016-011529 on 23 January 2017. Dow
nloaded from

For peer review only
17
Discussion
This study identified risk factors for MI among participants in the Wisconsin Longitudinal Study.
Our results show that for men the greatest risk factor by 72 years of age is having a stroke by
65. High cholesterol, diabetes, high blood pressure, and family history were also identified as
top risks for men who ever had a MI by 72 years old, as well as exposure to dangerous working
conditions, which has not previously been identified as a risk factor for MI in men. Stroke or
diabetes by 65 were the greatest risk factors for MI in men over 65 years in the WLS cohort.
Among women we identified diabetes by 65 as the greatest MI risk factor for women of any
age. Among those women who ever had a MI by 72 years old, diabetes, high cholesterol,
whether they were married, satisfaction with finances, engaging in physical activity, and high
blood pressure were also identified as top MI risk factors. Among those women who
experienced their MI after age 65, diabetes remained the top risk. However, exposure to
dangerous working conditions, also a new risk factor for women, and whether they still had
their menstrual period at 53 were also determined to be top MI risk factors for women in this
group. For most of the factors listed, exposure time had a large effect on overall MI risk, for
both men and women in the WLS cohort. Interactions among these and other risk factors
greatly affected MI risk in both men and women. Furthermore, results showed that for both
men and women, not only do the known MI risk factors become less predictive as people age,
but many of the factors change or are different between younger and older people.
Males
MI by 72 Years of Age
The prevalence of MI in men to age 72 in the WLS was 18.1%, which is significantly higher than
the national average of 11.3% for those aged 60-79 years 3. Stroke by 65 conferred the greatest
increase in LR odds of MI among those men who ever experienced MI by 72 years old (Table
2a). The other top risk factors for males who ever had a MI by 72 include having high
cholesterol, diabetes, high blood pressure, exposure to dangerous working conditions, and
having a parent or sibling who had a MI before age 55. Stroke has been cited as a risk factor for
MI 103 104 and MI has been established as a risk factor for stroke in prior studies 105-107, and
according to the American Stroke Association 108 stroke risk is doubled among those who have
experienced MI due to atherosclerosis. Furthermore, high cholesterol, diabetes, and high blood
pressure represent 3 of the 4 conventional ‘key' risk factors for myocardial infarction, and their
association with heart disease and MI risk is well characterized in the literature 5 6 9 10 109 110. A
family history of heart disease has been shown to be a significant contributor to MI risk in
previous studies 61 62 111 112. However, our study is the first to identify a link between exposure
to dangerous working conditions and MI risk. Consistent with this, a number of studies show
that stress in the workplace is associated with an increased risk of MI 49 113-115. The increased
Page 17 of 80
For peer review only - http://bmjopen.bmj.com/site/about/guidelines.xhtml
BMJ Open
123456789101112131415161718192021222324252627282930313233343536373839404142434445464748495051525354555657585960
on January 9, 2022 by guest. Protected by copyright.
http://bmjopen.bm
j.com/
BM
J Open: first published as 10.1136/bm
jopen-2016-011529 on 23 January 2017. Dow
nloaded from
For peer review only
18
odds of MI noted with a diagnosis by 65 years old rather than 72 (among above factors)
suggests that exposure time to different risks is an important determinant in whether one
experiences a MI or not. Although in this particular cohort having high cholesterol increased
one’s odds of MI by 3.3-fold, regardless of whether it was diagnosed by 65 or 72, prior studies
have shown that those who are diagnosed with high cholesterol at a younger age (<50 years)
are more likely to experience heart disease in their lifetime 116-118.
This study demonstrates that interactions among MI risk factors lead to large changes in MI
prevalence (Figure 1). While combinations of high cholesterol, diabetes, smoking, and lower
alcohol consumption tended to increase risk, and interacted with lesser-known risk factors like
dangerous working conditions, depression, and genetic factors to increase prevalence up to
50%, other factors including personality type, increased alcohol consumption, higher household
income, and higher education tended to lower risk, in some cases down to 0.0% even when
other top MI risk factors were present. For example, those experiencing high cholesterol,
smoking, and diabetes have a larger risk of MI, but for the subset who completed more than 5.5
years of college, prevalence in the WLS dropped to 0.0% compared to those completing less
than 5.5 years of college, whose MI prevalence was a whopping 53.3%. This suggests that risk
factors should not be evaluated individually, but rather the interactions among risk factors have
to be considered when predicting MI risk (additional discussion of RP results can be found in
Supplemental Information 8).
MI Between 65-72 Years of Age
A MI prevalence of 5.9% among men aged 65-72 years was much lower than that noted among
men who ever had a MI by 72 years of age (18.1%). The top risk factors for men who
experienced a MI between the ages of 65-72 years old were having had a stroke and having
diabetes, both by 65 years old (Table 2b). These two factors were included in results for both
analyses of MI risk in males, suggesting that these risks are good predictors of MI in males at
any age. Interestingly, the odds of MI in the first analysis for men who ever had a MI by 72 were
increased compared to the odds of MI between 65-72 years old, both for having had a stroke by
65 (5.0- versus 4.1-fold increase, respectively) and for having diabetes by 65 (3.2- versus 2.7-
fold increase, respectively), suggesting that the key risk factors for MI become less predictive as
men age, as supported by previous studies 5 55. Additionally, the loss of two of the most
predictive risk factors for men who experienced a MI by 72 years old, having high cholesterol or
having high blood pressure (at any age), in the top risks for having a MI between 65-72 years
old (Table 2b) suggests that risk factors for MI are different in younger versus older men. This
result is supported by the fact that RP analysis identified fewer days/month drinking alcoholic
beverages at 65 years old as the only factor affecting MI risk among men 65-72 years old, with a
2.7-fold increase in MI prevalence among those who drank alcohol < 8.5 days/month (7.7%
Page 18 of 80
For peer review only - http://bmjopen.bmj.com/site/about/guidelines.xhtml
BMJ Open
123456789101112131415161718192021222324252627282930313233343536373839404142434445464748495051525354555657585960
on January 9, 2022 by guest. Protected by copyright.
http://bmjopen.bm
j.com/
BM
J Open: first published as 10.1136/bm
jopen-2016-011529 on 23 January 2017. Dow
nloaded from
For peer review only
19
versus 2.9%; Figure 2). This supports prior studies proposing an insulating effect of regular
moderate alcohol consumption, specifically in older adults (≥65 years) 119-121, but still suggests
that the ‘known’ risk factors for MI change with age, at least for men in the WLS cohort.
Nevertheless, LR odds ratios from both analyses of MI risk in men suggest that stroke by 65 is
the number one risk factor for men of any age.
Females
MI by 72 Years of Age
For females who ever had a MI by 72 years old, prevalence in the WLS cohort was 7.5%, which
is slightly higher than the national average for this age group (4.2%) 3, similar to the results we
found in men. LR odds ratios indicated that diabetes by 65 conferred the greatest increase in
odds of experiencing an MI among those women who ever had a MI by 72 years of age (Table
3a). The other top MI risk factors for females who ever had a MI by 72 include having diabetes
(any age), high cholesterol, not being married, satisfaction with financial situation, engaging in
physical activity, and high blood pressure. Diabetes by 65 was also the single most important
risk for females ever experiencing a MI by 72 according to RP analysis (Figure 3), with a 4.6-fold
increase in MI prevalence among those women with diabetes (22.4% versus 4.9%). Diabetes has
been shown in prior studies to be a strong predictor of MI risk in women 122. As seen in men in
this study, high cholesterol and high blood pressure are both strong predictors of MI risk in
women, as supported by previous studies. Marriage is a well-accepted indicator of MI risk and
an even better indicator of one’s recovery and health after experiencing an MI 123-128.
Satisfaction with one’s financial situation was linked with MI risk in women in one prior study 129, and another study showed an association between ‘perceived financial status’ and MI risk
among employed women 130. Satisfaction with one’s financial situation could also be associated
with financial stress, which has been linked to increased MI risk in multiple studies 49 55 131. Life
satisfaction has been positively associated with CVD and CHD risk and other chronic diseases,
specifically in women 132-134, but this may be the first study to identify an association between
life satisfaction and MI risk. Reduced risk of MI in women in the WLS cohort who engaged in
physical activity when they were about 67 years old is supported by numerous studies on the
effects of physical inactivity and MI risk 3 5 40 55. An even larger reduction in MI prevalence was
noted among those who often engaged in light physical activity with others when 67 (0.34)
versus those who often engaged in vigorous physical activity alone when 67 (0.53), suggesting
that type of physical activity is less important and spending time with others may play a larger
role for women when it comes to reducing MI risk. This is supported by previous studies
showing that for women having ‘social support’ is a very strong predictor of MI risk 135 136.
Furthermore, our study suggests that physical inactivity may play a more important role for
Page 19 of 80
For peer review only - http://bmjopen.bmj.com/site/about/guidelines.xhtml
BMJ Open
123456789101112131415161718192021222324252627282930313233343536373839404142434445464748495051525354555657585960
on January 9, 2022 by guest. Protected by copyright.
http://bmjopen.bm
j.com/
BM
J Open: first published as 10.1136/bm
jopen-2016-011529 on 23 January 2017. Dow
nloaded from
For peer review only
20
women than for men when it comes to MI risk (Table 3a), specifically concerning MI risk in
those < 65 years old, supported by previous studies 55.
In addition to identifying diabetes by 65 years old as the most important risk for females ever
experiencing a MI by 72 in the WLS cohort (Figure 3), RP analysis showed that among those
women who did not have diabetes by 65, the interaction of having high blood pressure by 65
and smoking ≥24.5 years by 54 more than tripled MI prevalence, again demonstrating the
importance of considering interactions among risk factors when predicting MI risk. However,
there were no interactions among factors that increased MI prevalence to that noted among
those with diabetes by 65 (22.4%; additional discussion of RP results can be found in
Supplemental Information 9).
As in men, our study suggests that exposure time to certain risks seems to be an important
determinant in whether a woman experiences a MI or not. For example, the risk of MI increases
for women who develop diabetes, but the younger a woman is when she is diagnosed, the
higher her odds for eventually experiencing a MI, with a 6.9-, 5.6-, and 4.2-fold increase in odds
among those diagnosed by 54, 65, and 72 years old, respectively (R2=0.98). However, this
association does not hold for all medical health conditions in women in the WLS, as having high
blood pressure by 65 increases one’s odds by 3.2-fold while having high blood pressure by 72
increases one’s odds by 3.4-fold. Further study will need to be conducted in order to determine
the exact mechanisms by which exposure time affects one’s odds of having a MI, and which risk
factors are more susceptible to this effect.
MI Between 65-72 Years of Age
Among those women in the WLS cohort who experienced a MI between 65-72 years of age, MI
prevalence was 2.5% - much lower than that noted among women who ever had a MI by 72
years old (7.5%) and lower than the national average (4.2%) 3. The top risk for women who
experienced a MI between the ages of 65-72 years was having diabetes by 65 years old (Table
3b), just as was seen in the previous analysis of women who have ever had a MI by 72 years. RP
analysis confirmed this as the top risk factor for MI among women 65-72 years old (Figure 4),
again suggesting that this is the most important predictor for MI risk in women. However, just
as in men, this factor is more predictive of MI risk among younger women, or those who ever
had a MI by 72 years old including those < 65 years old, with a LR odds ratio of 5.62 as
compared to the 4.25-fold increase in odds among those who experienced a MI > 65 years old
(Table 3b). However, this remained the most important predictor of MI risk among women in
the WLS for both analyses, having the largest impact on whether a woman experienced a MI at
any age. This result is in agreement with what is known about diabetes and MI risk for women,
as it has been shown that diabetes not only increases a woman’s MI risk, but her risk for fatal
CHD, ischemic stroke, cardiovascular mortality, and all-cause mortality 122 137-139.
Page 20 of 80
For peer review only - http://bmjopen.bmj.com/site/about/guidelines.xhtml
BMJ Open
123456789101112131415161718192021222324252627282930313233343536373839404142434445464748495051525354555657585960
on January 9, 2022 by guest. Protected by copyright.
http://bmjopen.bm
j.com/
BM
J Open: first published as 10.1136/bm
jopen-2016-011529 on 23 January 2017. Dow
nloaded from
For peer review only
21
Additionally and interestingly, exposure to dangerous conditions at work (at 54 years old) was
determined to be a top risk for women experiencing a MI between 65-72 years old (2.2-fold
increase; Table 3b), just as exposure to dangerous conditions at work (at 65 years) was a top
risk for men who ever experienced a MI by 72 years old (1.4-fold increase; Table 2a). This again
may represent a ‘new’ or unknown risk for MI, although more research is needed to confirm
this result. Still it suggests that not only do the top MI risk factors become less predictive as
women age, but the risk factors for MI change between younger and older women. This is
supported by the last ‘top’ predictor for women experiencing a MI between 65-72 years old,
whether she still had a menstrual period at 53 years old (0.46-fold decrease in odds). The age at
which a woman experiences her last menstrual cycle affects the age at which large, lasting
hormonal changes take place in her body and has a very large impact on her aging and overall
health. Supporting the results of this study, it has been shown that the earlier a woman stops
menstruating, the shorter her lifespan and the more health problems she will encounter in later
years, including an increased risk of MI 140-150. Our results are further supported by studies
showing that hormone replacement therapy can ameliorate the effects of natural or surgical
menopause, specifically in younger women 151 152. In other words, the longer a woman’s
hormones remain in-balance, the lower her odds of experiencing a MI later in life (between 65-
72 years old). The exposure to dangerous conditions at work risk factor was shown to be more
sensitive to missing data points in our logical bounding procedure, therefore additional work is
needed to follow up on this finding. However, this same risk was identified in men in this study,
lending support to our result.
Among those women 65-72 years old in the ‘riskiest’ group, those having diabetes by 65, the
interaction of being less agreeable and having stopped menstruating by 53 doubled their MI
risk, while those who were more agreeable or who did still menstruate when they were 53
experienced no MI, despite having the top MI risk factor for women (Figure 4). Among those
without diabetes by 65, the interaction of three other identified factors increased their MI risk
to 25% - 3.2 times higher prevalence than that noted amongst those with just the top risk
factor. Furthermore, among those women with lower IQ scores, each interaction (factor)
contributed to MI prevalence such that it either increased with each additional interaction or
reduced risk to (near) zero, highlighting the importance of interactions among factors when
predicting one’s MI risk (Figure 4; additional discussion of RP results can be found in
Supplemental Information 10).
Limitations
Few studies have included the breadth of factors evaluated in the present study; however,
despite high participant response rates to the WLS, our largest limitation was the loss of WLS
participants due to the design of the two dependent variables, attrition from the WLS, and
Page 21 of 80
For peer review only - http://bmjopen.bmj.com/site/about/guidelines.xhtml
BMJ Open
123456789101112131415161718192021222324252627282930313233343536373839404142434445464748495051525354555657585960
on January 9, 2022 by guest. Protected by copyright.
http://bmjopen.bm
j.com/
BM
J Open: first published as 10.1136/bm
jopen-2016-011529 on 23 January 2017. Dow
nloaded from
For peer review only
22
missing data common to survey studies (Supplemental Table 1). If the population of
participants excluded from the study was somehow different from the population included, it
may have created a bias which could affect our results. However, as stated above, missing data
is a limitation in every observational study and is an unavoidable consequence of using
longitudinal survey data. Furthermore, the logical bounding procedure we performed showed
that all but one of the ‘overall’ MI risk factors identified were robust to missing data, lending
support to our results.
An additional limitation in this study is that it is likely that some reported MI’s may have
occurred before some of the predictor variables were measured, specifically for the ‘MI by 72
Years of Age’ analysis. Our dataset did not include the dates of occurrence of all predictor
variables, therefore it was impossible to run a ‘time-to-event’ or survival analysis on this data.
However, we were interested in factors present in participants who ever experienced a MI in
their lifetime (up to 72 years), regardless of when their MI occurred. Therefore this part of our
analysis is a case-control retrospective study. Due to the mentioned complications with the first
analysis, we completed a second analysis in which all of the predictor variables occurred before
the participant’s reported MI. Although this design reduced the number of participants
included in the second analysis, it also allowed us to determine which factors are associated
with MI BEFORE the MI occurs, and therefore are potentially predictive of MI. Therefore this
part of our analysis is a true cohort study.
Additional limitations of the current study include limitations associated with ICD codes in
death records and limitations in death records recovered by the WLS. Furthermore, Rosamond
et al. 153 found that when MI are self-reported, the numbers are often an overestimation.
Again, these limitations are an unavoidable consequence of using longitudinal survey data, but
still must be considered when interpreting results. Additionally, the predictive value of our
genetic data is limited because of user bias in selection of SNPs; other genetic variants that we
did not examine in this study may have provided information about crucial interactions
involved with MI. And the WLS has social-factor homogeneities, such as participants being
almost exclusively non-Hispanic White people with middle- to upper-middle-class backgrounds.
Future directions for research will involve using these same machine learning methodologies on
more complete genetic profiles, such as from genome-wide SNP or sequencing data, with which
we will be able to explore all genetic interaction possibilities rather than a limited subset of
variants.
Conclusions
It has been shown that at least one of four key risk factors - smoking, high blood pressure, high
cholesterol, or diabetes (mellitus) - was observed in more than 80%-90% of patients
experiencing MI, and all of these risks combined account for a population attributable risk (PAR)
Page 22 of 80
For peer review only - http://bmjopen.bmj.com/site/about/guidelines.xhtml
BMJ Open
123456789101112131415161718192021222324252627282930313233343536373839404142434445464748495051525354555657585960
on January 9, 2022 by guest. Protected by copyright.
http://bmjopen.bm
j.com/
BM
J Open: first published as 10.1136/bm
jopen-2016-011529 on 23 January 2017. Dow
nloaded from
For peer review only
23
greater than 90% for all MI - for men and women, old and young, worldwide 5 55. However our
study indicated that the main risk factors for MI are different between men and women, and
change as people age. We also showed that interactions among factors have a large influence
on one’s MI risk, and can reduce one’s risk of MI to near zero even in the presence of other
known risk factors. Additionally, we found previously unidentified factors affecting MI risk
among WLS participants. Although major genetic risk factors were not identified in this study,
we were able to show G x E interactions that both increased and decreased one’s risk of MI.
Acknowledgments
This research used data from the Wisconsin Longitudinal Study (WLS) of the University of
Wisconsin–Madison. Since 1991, the WLS has been supported principally by the National
Institute on Aging (AG-9775, AG-21079, and AG-033285), with additional support from the Vilas
Estate Trust, the National Science Foundation, the Spencer Foundation, and the Graduate
School of the University of Wisconsin–Madison. A public use file of data from the Wisconsin
Longitudinal Study is available from the WLS, University of Wisconsin–Madison, 1180
Observatory Drive, Madison, WI 53706, and at http://www.ssc.wisc.edu/wlsresearch/data. This
material is the result of work supported with resources at the William S. Middleton Memorial
Veterans Hospital, Madison, WI.
Note. The opinions expressed herein are those of the authors. The contents do not represent
the views of the Department of Veterans Affairs or the U.S. government. This article is
Geriatrics Research, Education and Clinical Center VA paper 2015–xx.
Human Participant Protection
Ethics approval was provided by the health sciences institutional review board, University of
Wisconsin–Madison.
Page 23 of 80
For peer review only - http://bmjopen.bmj.com/site/about/guidelines.xhtml
BMJ Open
123456789101112131415161718192021222324252627282930313233343536373839404142434445464748495051525354555657585960
on January 9, 2022 by guest. Protected by copyright.
http://bmjopen.bm
j.com/
BM
J Open: first published as 10.1136/bm
jopen-2016-011529 on 23 January 2017. Dow
nloaded from
For peer review only
24
a. Contributorship Statement
CSA and TG conceptualized the study. CLR, PH and CSA collected saliva samples and performed
genotyping analyses. TG, JAY, VC, and CL identified the variables and performed the statistical analyses
on the Wisconsin Longitudinal Study data set. CSA, JAY and PH directed the statistical analyses. TG and
CSA drafted the manuscript. All authors critically reviewed the manuscript and approved the final
version.
b. Competing Interests
The authors have no competing interests.
c. Funding
Was provided by the National Institute on Aging (AG-9775, AG-21079, and AG-033285), the National
Science Foundation, The Spencer Foundation and the Vilas Estate Trust.
d. Data Sharing Statement
A public use file of data from the Wisconsin Longitudinal Study collected over the last 58 years is
available online at http://www.ssc.wisc.edu/wlsresearch/data.
Page 24 of 80
For peer review only - http://bmjopen.bmj.com/site/about/guidelines.xhtml
BMJ Open
123456789101112131415161718192021222324252627282930313233343536373839404142434445464748495051525354555657585960
on January 9, 2022 by guest. Protected by copyright.
http://bmjopen.bm
j.com/
BM
J Open: first published as 10.1136/bm
jopen-2016-011529 on 23 January 2017. Dow
nloaded from
For peer review only
25
Figure Legend
Figure 1: RP tree showing interactions among MI risk factors for males who ever experienced a
MI by 72 years of age in the WLS cohort, with MI prevalence listed at each node in the tree.
Figure 2: RP tree showing the only MI risk factor interaction found significant for males who
experienced a MI between 65-72 years of age in the WLS cohort.
Figure 3: RP tree showing interactions among MI risk factors for females who ever experienced
a MI by 72 years of age in the WLS cohort, with MI prevalence listed at each node in the tree.
Figure 4: RP tree showing interactions among MI risk factors for females who experienced a MI
between 65-72 years of age in the WLS cohort, with MI prevalence listed at each node.
Page 25 of 80
For peer review only - http://bmjopen.bmj.com/site/about/guidelines.xhtml
BMJ Open
123456789101112131415161718192021222324252627282930313233343536373839404142434445464748495051525354555657585960
on January 9, 2022 by guest. Protected by copyright.
http://bmjopen.bm
j.com/
BM
J Open: first published as 10.1136/bm
jopen-2016-011529 on 23 January 2017. Dow
nloaded from
For peer review only
26
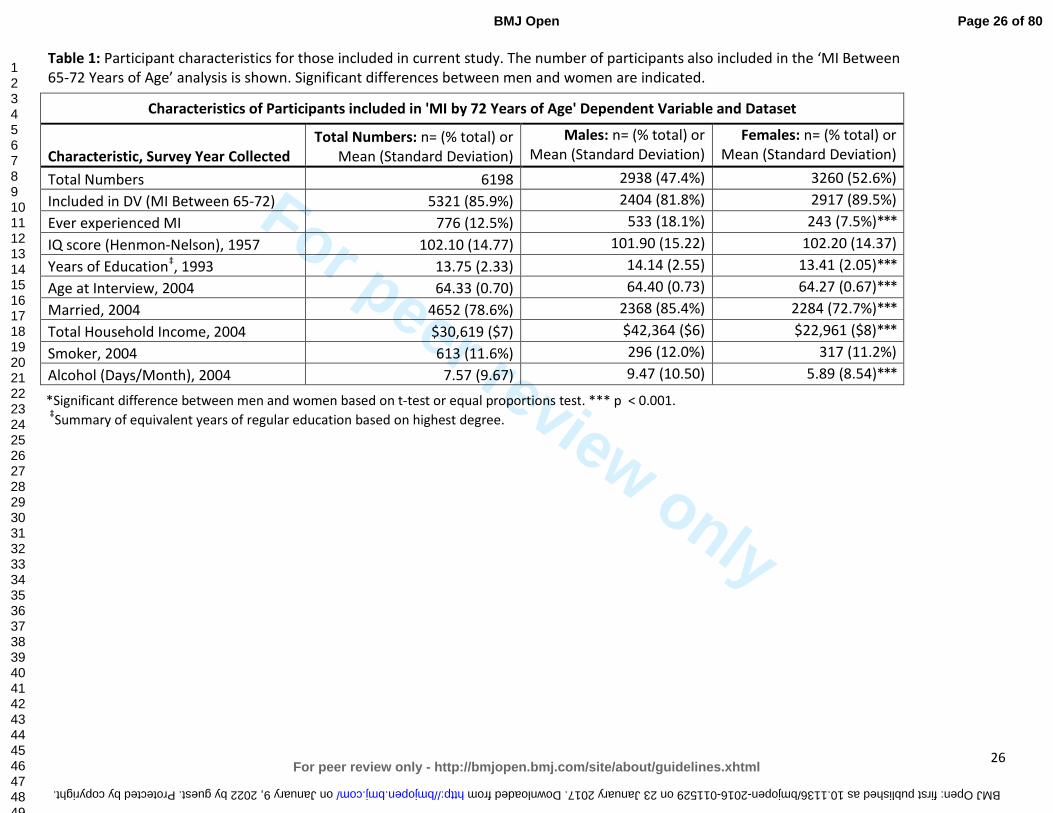
Table 1: Participant characteristics for those included in current study. The number of participants also included in the ‘MI Between 65-72 Years of Age’ analysis is shown. Significant differences between men and women are indicated.
Characteristics of Participants included in 'MI by 72 Years of Age' Dependent Variable and Dataset
Characteristic, Survey Year Collected
Total Numbers: n= (% total) or Mean (Standard Deviation)
Males: n= (% total) or Mean (Standard Deviation)
Females: n= (% total) or Mean (Standard Deviation)
Total Numbers 6198 2938 (47.4%) 3260 (52.6%)
Included in DV (MI Between 65-72) 5321 (85.9%) 2404 (81.8%) 2917 (89.5%)
Ever experienced MI 776 (12.5%) 533 (18.1%) 243 (7.5%)***
IQ score (Henmon-Nelson), 1957 102.10 (14.77) 101.90 (15.22) 102.20 (14.37)
Years of Education‡, 1993 13.75 (2.33) 14.14 (2.55) 13.41 (2.05)***
Age at Interview, 2004 64.33 (0.70) 64.40 (0.73) 64.27 (0.67)***
Married, 2004 4652 (78.6%) 2368 (85.4%) 2284 (72.7%)***
Total Household Income, 2004 $30,619 ($7) $42,364 ($6) $22,961 ($8)***
Smoker, 2004 613 (11.6%) 296 (12.0%) 317 (11.2%)
Alcohol (Days/Month), 2004 7.57 (9.67) 9.47 (10.50) 5.89 (8.54)***
*Significant difference between men and women based on t-test or equal proportions test. *** p < 0.001.
‡Summary of equivalent years of regular education based on highest degree.
Page 26 of 80
For peer review only - http://bmjopen.bmj.com/site/about/guidelines.xhtml
BMJ Open
123456789101112131415161718192021222324252627282930313233343536373839404142434445464748495051525354555657585960
on January 9, 2022 by guest. Protected by copyright. http://bmjopen.bmj.com/ BMJ Open: first published as 10.1136/bmjopen-2016-011529 on 23 January 2017. Downloaded from

For peer review only
27
Table 2: MI risk factors found significant by at least 3 of the 4 statistical analyses employed by this study, listing the ‘overall’ risks for males a) who
ever experienced an MI by 72 years of age, and b) who experienced a MI between 65-72 years of age. The ‘Age at Survey Year’ of 65 and 72
represent survey years 2004 and 2011, respectively. Analyses associated with the ‘MI by 72 Years of Age’ dataset included predictor variables from
all WLS survey years, 1957-2011, while analyses associated with the ‘MI Between 65-72 Years of Age’ dataset included only predictor variables from
WLS survey year 2004 or earlier.
Males, ‘MI by 72 Years of Age’ MI Risk Factor Description (Age at Survey Year)
MI case/ non-case
n =
Random Forest
Important Variables
Logistic Regression Odds Ratio (95%
Confidence Interval)
Chi-Square (adjusted p-value)
Recursive Partitioning (Tree Nodes)
Have High Cholesterol (by 65 Years) 269/893 Yes 3.29 (2.59-4.18)*** <0.0001C Present
Have High Cholesterol (by 72 Years) 221/987 Yes 3.32 (2.50-4.42)*** <0.0001C Present
Have Diabetes (by 65 Years) 124/254 Yes 3.24 (2.53-4.15)*** <0.0001C Present
Have Diabetes (by 72 Years) 122/458 Yes 2.26 (1.78-2.88)*** <0.0001C
Had a Stroke (by 65 Years) 48/56 Yes 5.01 (3.36-7.48)*** <0.0001C
Have High Blood Pressure (by 72 Years) 269/1428 Yes 2.16 (1.67-2.79)*** <0.0001C
Have High Blood Pressure (by 65 Years) 283/1023 2.39 (1.92-2.96)*** <0.0001C Present
Exposed to Dangerous Conditions at Work (by 65 Years) 174/784 1.41 (1.11-1.79)** 0.0080C Present
Parent or Sibling had a MI before age 55 (by 65 Years) 82/267 1.89 (1.43-2.49)*** <0.0001C Present
Males, ‘MI Between 65-72 Years of Age’ MI Risk Factor Description (Age at Survey Year)
Had a Stroke (by 65 Years) 13/55 Yes 4.08 (2.17-7.65)*** 0.0002F
Have Diabetes (by 65 Years) 36/254 Yes 2.71 (1.81-4.04)*** <0.0001C
C=Chi-square test; F=Fisher's Exact test; Significance codes: 0 ‘***’ 0.001 ‘**’ 0.01 ‘*’ 0.05.
Table 2a:
Table 2b:
Page 27 of 80
For peer review only - http://bmjopen.bmj.com/site/about/guidelines.xhtml
BMJ Open
123456789101112131415161718192021222324252627282930313233343536373839404142434445464748495051525354555657585960
on January 9, 2022 by guest. Protected by copyright. http://bmjopen.bmj.com/ BMJ Open: first published as 10.1136/bmjopen-2016-011529 on 23 January 2017. Downloaded from
For peer review only
28
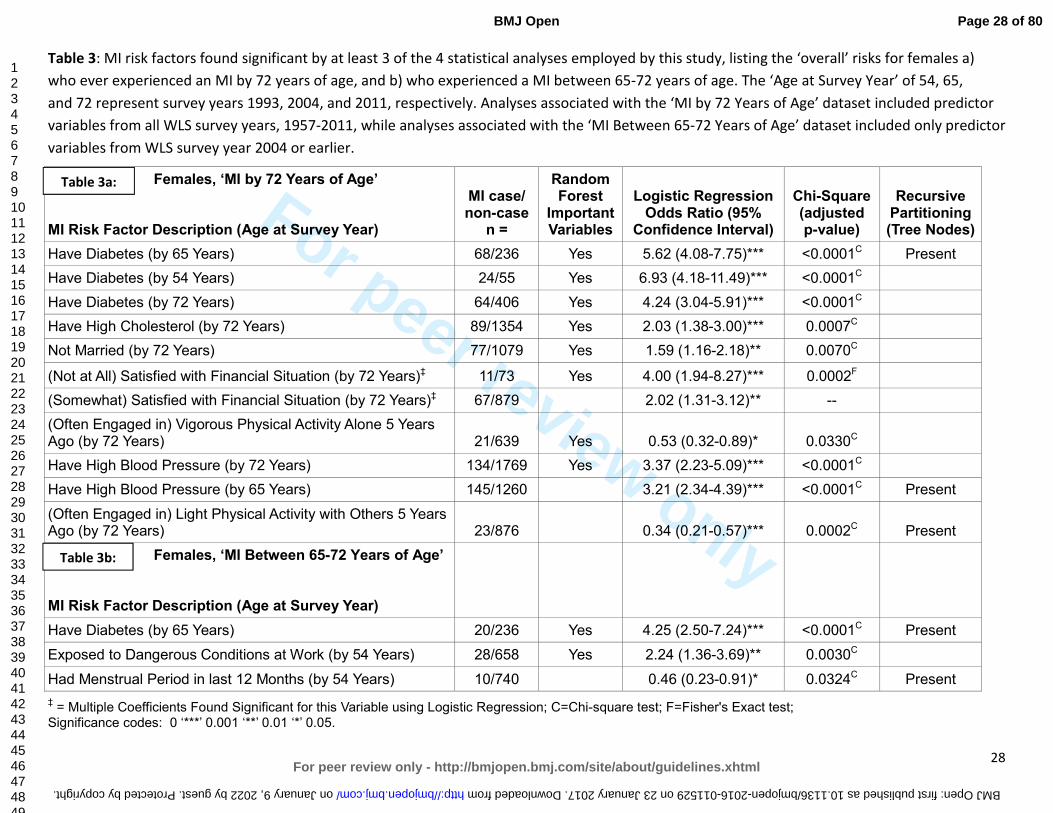
Table 3: MI risk factors found significant by at least 3 of the 4 statistical analyses employed by this study, listing the ‘overall’ risks for females a)
who ever experienced an MI by 72 years of age, and b) who experienced a MI between 65-72 years of age. The ‘Age at Survey Year’ of 54, 65,
and 72 represent survey years 1993, 2004, and 2011, respectively. Analyses associated with the ‘MI by 72 Years of Age’ dataset included predictor
variables from all WLS survey years, 1957-2011, while analyses associated with the ‘MI Between 65-72 Years of Age’ dataset included only predictor
variables from WLS survey year 2004 or earlier.
‡ = Multiple Coefficients Found Significant for this Variable using Logistic Regression; C=Chi-square test; F=Fisher's Exact test;
Significance codes: 0 ‘***’ 0.001 ‘**’ 0.01 ‘*’ 0.05.
Females, ‘MI by 72 Years of Age’ MI Risk Factor Description (Age at Survey Year)
MI case/ non-case
n =
Random Forest
Important Variables
Logistic Regression Odds Ratio (95%
Confidence Interval)
Chi-Square (adjusted p-value)
Recursive Partitioning (Tree Nodes)
Have Diabetes (by 65 Years) 68/236 Yes 5.62 (4.08-7.75)*** <0.0001C Present
Have Diabetes (by 54 Years) 24/55 Yes 6.93 (4.18-11.49)*** <0.0001C
Have Diabetes (by 72 Years) 64/406 Yes 4.24 (3.04-5.91)*** <0.0001C
Have High Cholesterol (by 72 Years) 89/1354 Yes 2.03 (1.38-3.00)*** 0.0007C
Not Married (by 72 Years) 77/1079 Yes 1.59 (1.16-2.18)** 0.0070C
(Not at All) Satisfied with Financial Situation (by 72 Years)‡ 11/73 Yes 4.00 (1.94-8.27)*** 0.0002F
(Somewhat) Satisfied with Financial Situation (by 72 Years)‡ 67/879 2.02 (1.31-3.12)** --
(Often Engaged in) Vigorous Physical Activity Alone 5 Years Ago (by 72 Years) 21/639 Yes 0.53 (0.32-0.89)* 0.0330C
Have High Blood Pressure (by 72 Years) 134/1769 Yes 3.37 (2.23-5.09)*** <0.0001C
Have High Blood Pressure (by 65 Years) 145/1260 3.21 (2.34-4.39)*** <0.0001C Present
(Often Engaged in) Light Physical Activity with Others 5 Years Ago (by 72 Years) 23/876 0.34 (0.21-0.57)*** 0.0002C Present
Females, ‘MI Between 65-72 Years of Age’ MI Risk Factor Description (Age at Survey Year)
Have Diabetes (by 65 Years) 20/236 Yes 4.25 (2.50-7.24)*** <0.0001C Present
Exposed to Dangerous Conditions at Work (by 54 Years) 28/658 Yes 2.24 (1.36-3.69)** 0.0030C
Had Menstrual Period in last 12 Months (by 54 Years) 10/740 0.46 (0.23-0.91)* 0.0324C Present
Table 3a:
Table 3b:
Page 28 of 80
For peer review only - http://bmjopen.bmj.com/site/about/guidelines.xhtml
BMJ Open
123456789101112131415161718192021222324252627282930313233343536373839404142434445464748495051525354555657585960
on January 9, 2022 by guest. Protected by copyright. http://bmjopen.bmj.com/ BMJ Open: first published as 10.1136/bmjopen-2016-011529 on 23 January 2017. Downloaded from

For peer review only
29
Diabetes by 65 yrs Prevalence=33.0%
N=109
Summary Score Openness
<18.5 at 65 yrs Prevalence=
2.9% N=35
High Cholesterol
by 72 yrs Prevalence=
8.6% N=210
Males MI Prevalence = 18.1%
N=2938
‘MI by 72 Years of Age’ MI Risks for Males
No High Cholesterol by 65 yrs
Prevalence=8.4% N=1288
Summary Score Distress/
Depression <20.5 at 65 yrs
Prevalence= 5.0%
N=904
No High Cholesterol
by 72 yrs Prevalence=
2.4% N=592
Drank ≥5.5 Alcoholic Drinks/
Month at 72 yrs
Prevalence=4.4%
N=136
No High Blood
Pressure by 65 yrs
Prevalence=7.5%
N=106
High Blood Pressure by 65 yrs
Prevalence=27.5% N=69
Summary Score Openness
≥18.5 at 65 yrs Prevalence=
26.7% N=105
Genotype A:A
CYP11B2 gene
Prevalence= 0.0% N=22
Genotype A:G or G:G CYP11B2
gene Prevalence=
30.6% N=49
Smoked <22.5 Years by 54 yrs
Prevalence=16.6% N=721
Drank Alcohol ≥24.5
Days/Month at 65 yrs
Prevalence=10.7% N=56
No Dangerous Conditions
at Work at 65 yrs
Prevalence= 19.4% N=67
Strongly Agree, or Do Not Agree that
Family Worries Distract from
Work at 65 yrs Prevalence=
39.3% N=89
No Diabetes by 65 yrs Prevalence=13.4%
N=606
Completed ≥5.5 Years of College by 54 yrs
Prevalence=0.0% N=8
Parent or Sibling
MI before Age 55
Prevalence=31.5% N=89
No Parent or Sibling MI
before Age 55 Prevalence=
10.3% N=495
At Most Weighed ≥226.5 lb. by 72 yrs
Prevalence=17.8% N=135
At Most Weighed <226.5 lb. by 72 yrs
Prevalence=5.3%
N=301
Total Household Income <$130,918
at 65 yrs Prevalence=
22.6% N=106
Genotype C:G or G:G
FADS2 gene
Prevalence=46.7% N=15
Genotype C:C
FADS2 gene
Prevalence=7.1% N=28
Completed <5.5 Years of College by 54 yrs
Prevalence=53.3% N=30
Total Household Income ≥$130,918
at 65 yrs Prevalence=
0.0% N=29
High Cholesterol by 65 yrs
Prevalence=23.1% N=1162
No Diabetes by 65 yrs
Prevalence=6.7% N=1098
Diabetes by 65 yrs
Prevalence=21.3% N=141
Summary Score Distress/
Depression ≥20.5 at 65 yrs
Prevalence= 15.4% N=175
Drank <5.5 Alcoholic Drinks/
Month at 72 yrs
Prevalence=26.9% N=26
Smoked ≥22.5 Years by 54 yrs
Prevalence=35.2% N=281
Agree that Family
Worries Distract
from Work at 65 yrs
Prevalence=5.3% N=19
Genotype C:C or G:G
IL6 gene Prevalence=32.6%
N=43
Genotype C:G IL6 gene
Prevalence= 5.3% N=38
Drank Alcohol <24.5
Days/Month at 65 yrs
Prevalence=40.9% N=215
Dangerous Conditions
at Work at 65 yrs
Prevalence= 50.0% N=96
Figure 1:
Page 29 of 80
For peer review only - http://bmjopen.bmj.com/site/about/guidelines.xhtml
BMJ Open
123456789101112131415161718192021222324252627282930313233343536373839404142434445464748495051525354555657585960
on January 9, 2022 by guest. Protected by copyright. http://bmjopen.bmj.com/ BMJ Open: first published as 10.1136/bmjopen-2016-011529 on 23 January 2017. Downloaded from
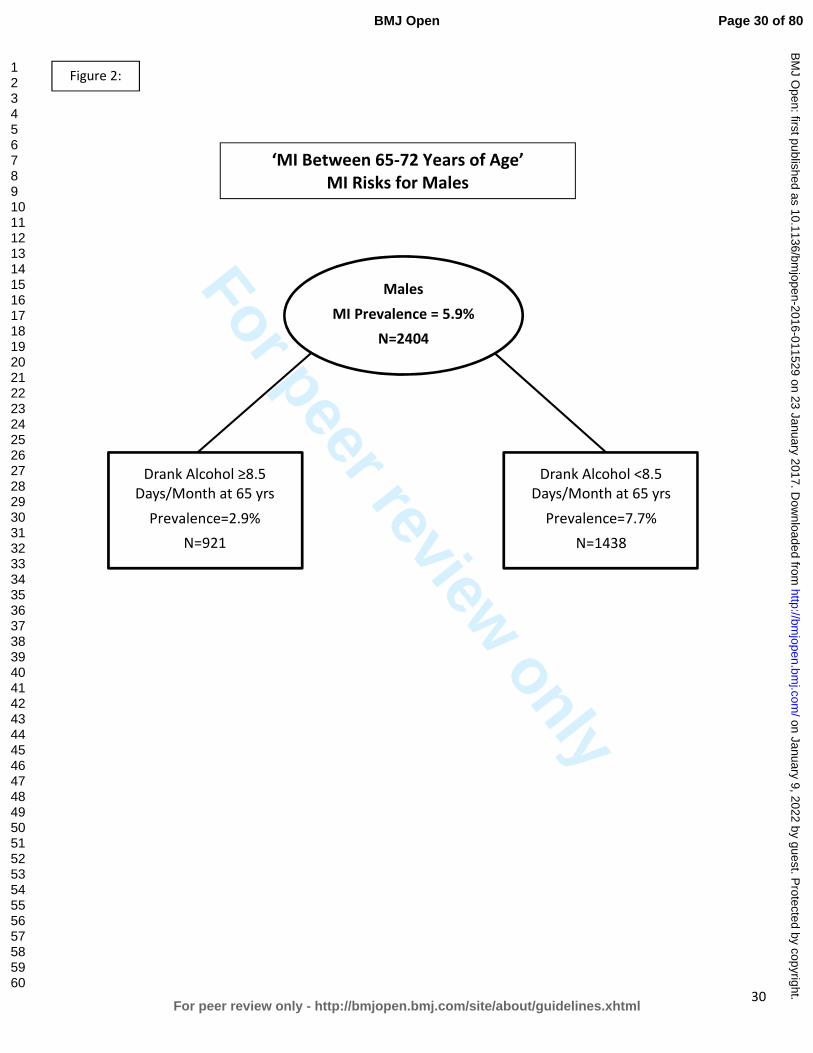
For peer review only
30
Males
MI Prevalence = 5.9%
N=2404
Drank Alcohol ≥8.5 Days/Month at 65 yrs
Prevalence=2.9%
N=921
Drank Alcohol <8.5 Days/Month at 65 yrs
Prevalence=7.7%
N=1438
‘MI Between 65-72 Years of Age’
MI Risks for Males
Figure 2:
Page 30 of 80
For peer review only - http://bmjopen.bmj.com/site/about/guidelines.xhtml
BMJ Open
123456789101112131415161718192021222324252627282930313233343536373839404142434445464748495051525354555657585960
on January 9, 2022 by guest. Protected by copyright.
http://bmjopen.bm
j.com/
BM
J Open: first published as 10.1136/bm
jopen-2016-011529 on 23 January 2017. Dow
nloaded from

For peer review only
31
Females
MI Prevalence = 7.5%
N=3260
No Diabetes by 65 yrs Prevalence=4.9%
N=2748
Diabetes by 65 yrs Prevalence=22.4%
N=304
‘MI by 72 Years of Age‘
MI Risks for Females
No High Blood Pressure by 65 yrs
Prevalence=2.8% N=1562
High Blood Pressure by 65 yrs
Prevalence=7.6% N=1184
Light Physical Activities with Others Often
5 Years Ago (at 72 yrs) Prevalence=0.2%
N=477
Light Physical Activities with Others
Rarely or Never 5 Years Ago (at 72 yrs)
Prevalence=3.7% N=726
Smoked <24.5 Years by 54 yrs
Prevalence=5.1% N=783
When Stressed Blame Self Only a Little Bit or
Not At All at 72 yrs Prevalence=2.7%
N=560
When Stressed Blame Self a Medium Amount
or A Lot at 72 yrs Prevalence=11.8%
N=110
Smoked ≥24.5 Years by 54 yrs
Prevalence=16.6% N=223
Figure 3:
Page 31 of 80
For peer review only - http://bmjopen.bmj.com/site/about/guidelines.xhtml
BMJ Open
123456789101112131415161718192021222324252627282930313233343536373839404142434445464748495051525354555657585960
on January 9, 2022 by guest. Protected by copyright.
http://bmjopen.bm
j.com/
BM
J Open: first published as 10.1136/bm
jopen-2016-011529 on 23 January 2017. Dow
nloaded from
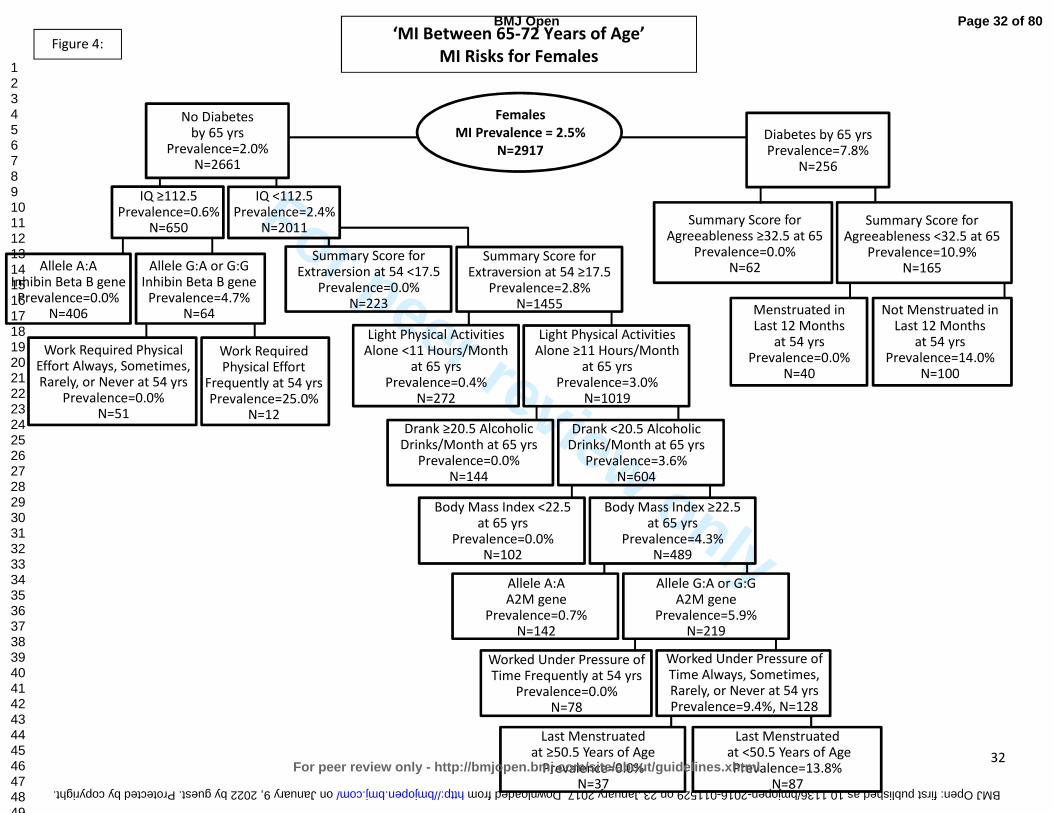
For peer review only
32
Figure 4:
Females
MI Prevalence = 2.5%
N=2917
Summary Score for Agreeableness ≥32.5 at 65
Prevalence=0.0% N=62
‘MI Between 65-72 Years of Age’
MI Risks for Females
No Diabetes by 65 yrs
Prevalence=2.0% N=2661
Diabetes by 65 yrs Prevalence=7.8%
N=256
Summary Score for Agreeableness <32.5 at 65
Prevalence=10.9% N=165
Not Menstruated in Last 12 Months
at 54 yrs Prevalence=14.0%
N=100
Menstruated in Last 12 Months
at 54 yrs Prevalence=0.0%
N=40
IQ ≥112.5 Prevalence=0.6%
N=650
IQ <112.5 Prevalence=2.4%
N=2011
Allele G:A or G:G Inhibin Beta B gene
Prevalence=4.7% N=64
Allele A:A Inhibin Beta B gene Prevalence=0.0%
N=406
Work Required Physical Effort Always, Sometimes, Rarely, or Never at 54 yrs
Prevalence=0.0% N=51
Work Required Physical Effort
Frequently at 54 yrs Prevalence=25.0%
N=12
Summary Score for Extraversion at 54 <17.5
Prevalence=0.0% N=223
Summary Score for Extraversion at 54 ≥17.5
Prevalence=2.8% N=1455
Light Physical Activities Alone <11 Hours/Month
at 65 yrs Prevalence=0.4%
N=272
Light Physical Activities Alone ≥11 Hours/Month
at 65 yrs Prevalence=3.0%
N=1019
Drank ≥20.5 Alcoholic Drinks/Month at 65 yrs
Prevalence=0.0% N=144
Drank <20.5 Alcoholic Drinks/Month at 65 yrs
Prevalence=3.6% N=604
Body Mass Index <22.5 at 65 yrs
Prevalence=0.0% N=102
Body Mass Index ≥22.5 at 65 yrs
Prevalence=4.3% N=489
Allele A:A A2M gene
Prevalence=0.7% N=142
Allele G:A or G:G A2M gene
Prevalence=5.9% N=219
Worked Under Pressure of Time Frequently at 54 yrs
Prevalence=0.0% N=78
Worked Under Pressure of Time Always, Sometimes, Rarely, or Never at 54 yrs Prevalence=9.4%, N=128
Last Menstruated at ≥50.5 Years of Age
Prevalence=0.0% N=37
Last Menstruated at <50.5 Years of Age
Prevalence=13.8% N=87
Page 32 of 80
For peer review only - http://bmjopen.bmj.com/site/about/guidelines.xhtml
BMJ Open
123456789101112131415161718192021222324252627282930313233343536373839404142434445464748495051525354555657585960
on January 9, 2022 by guest. Protected by copyright. http://bmjopen.bmj.com/ BMJ Open: first published as 10.1136/bmjopen-2016-011529 on 23 January 2017. Downloaded from
For peer review only
33
References:
1. Prevention CfDCa. Heart Disease Facts: Centers for Disease Control and Prevention; 2014 [updated October 29, 2014. Available from: http://www.cdc.gov/heartdisease/facts.htm.
2. Murphy SL, Xu J, Kochanek KD. Deaths: final data for 2010. National vital statistics reports: from the Centers for Disease Control and Prevention, National Center for Health Statistics, National Vital Statistics System 2013;61(4):1-117.
3. Mozaffarian D, Benjamin EJ, Go AS, et al. Heart Disease and Stroke Statistics—2015 Update: A Report From the American Heart Association. Circulation 2015;131(4):e29-e322.
4. Gonzalez-Pacheco H, Vargas-Barron J, Vallejo M, et al. Prevalence of conventional risk factors and lipid profiles in patients with acute coronary syndrome and significant coronary disease. Ther Clin Risk Manag 2014;10:815-23.
5. Yusuf S, Hawken S, Ounpuu S, et al. Effect of potentially modifiable risk factors associated with myocardial infarction in 52 countries (the INTERHEART study): case-control study. Lancet 2004;364(9438):937-52.
6. Khot UN, Khot MB, Bajzer CT, et al. Prevalence of conventional risk factors in patients with coronary heart disease. Jama 2003;290(7):898-904.
7. James PA, Oparil S, Carter BL, et al. 2014 evidence-based guideline for the management of high blood pressure in adults: report from the panel members appointed to the Eighth Joint National Committee (JNC 8). Jama 2014;311(5):507-20.
8. Psaty BM, Furberg CD, Kuller LH, et al. Association between blood pressure level and the risk of myocardial infarction, stroke, and total mortality: the cardiovascular health study. Arch Intern Med 2001;161(9):1183-92.
9. Stone NJ, Robinson JG, Lichtenstein AH, et al. 2013 ACC/AHA Guideline on the Treatment of Blood Cholesterol to Reduce Atherosclerotic Cardiovascular Risk in Adults: A Report of the American College of Cardiology/American Heart Association Task Force on Practice Guidelines. Circulation 2014;129(25 suppl 2):S1-S45.
10. Langsted A, Freiberg JJ, Tybjaerg-Hansen A, et al. Nonfasting cholesterol and triglycerides and association with risk of myocardial infarction and total mortality: the Copenhagen City Heart Study with 31 years of follow-up. J Intern Med 2011;270(1):65-75.
11. Wilson PWF, D’Agostino RB, Levy D, et al. Prediction of Coronary Heart Disease Using Risk Factor Categories. Circulation 1998;97(18):1837-47.
12. Austin MA, Breslow JL, Hennekens CH, et al. Low-density lipoprotein subclass patterns and risk of myocardial infarction. Jama 1988;260(13):1917-21.
13. Stamler J, Wentworth D, Neaton JD. Is relationship between serum cholesterol and risk of premature death from coronary heart disease continuous and graded? Findings in 356,222 primary screenees of the Multiple Risk Factor Intervention Trial (MRFIT). Jama 1986;256(20):2823-8.
14. Huxley R, Barzi F, Woodward M. Excess risk of fatal coronary heart disease associated with diabetes in men and women: meta-analysis of 37 prospective cohort studies. Bmj 2006;332(7533):73-8.
15. Hanefeld M, Fischer S, Julius U, et al. Risk factors for myocardial infarction and death in newly detected NIDDM: the Diabetes Intervention Study, 11-year follow-up. Diabetologia 1996;39(12):1577-83.
16. Koskinen P, Manttari M, Manninen V, et al. Coronary heart disease incidence in NIDDM patients in the Helsinki Heart Study. Diabetes Care 1992;15(7):820-5.
17. Öberg M, Jaakkola MS, Woodward A, et al. Worldwide burden of disease from exposure to second-hand smoke: a retrospective analysis of data from 192 countries. The Lancet 2011;377(9760):139-46.
Page 33 of 80
For peer review only - http://bmjopen.bmj.com/site/about/guidelines.xhtml
BMJ Open
123456789101112131415161718192021222324252627282930313233343536373839404142434445464748495051525354555657585960
on January 9, 2022 by guest. Protected by copyright.
http://bmjopen.bm
j.com/
BM
J Open: first published as 10.1136/bm
jopen-2016-011529 on 23 January 2017. Dow
nloaded from
For peer review only
34
18. Critchley JA, Capewell S. Mortality risk reduction associated with smoking cessation in patients with coronary heart disease: a systematic review. Jama 2003;290(1):86-97.
19. Prescott E, Hippe M, Schnohr P, et al. Smoking and risk of myocardial infarction in women and men: longitudinal population study. Bmj 1998;316(7137):1043-7.
20. Parish S, Collins R, Peto R, et al. Cigarette smoking, tar yields, and non-fatal myocardial infarction: 14,000 cases and 32,000 controls in the United Kingdom. The International Studies of Infarct Survival (ISIS) Collaborators. BMJ : British Medical Journal 1995;311(7003):471-77.
21. Neaton JD, Wentworth D. Serum cholesterol, blood pressure, cigarette smoking, and death from coronary heart disease. Overall findings and differences by age for 316,099 white men. Multiple Risk Factor Intervention Trial Research Group. Arch Intern Med 1992;152(1):56-64.
22. Thomsen M, Nordestgaard BG. Myocardial infarction and ischemic heart disease in overweight and obesity with and without metabolic syndrome. JAMA Intern Med 2014;174(1):15-22.
23. Després J-P. Body Fat Distribution and Risk of Cardiovascular Disease: An Update. Circulation 2012;126(10):1301-13.
24. Logue J, Murray HM, Welsh P, et al. Obesity is associated with fatal coronary heart disease independently of traditional risk factors and deprivation. Heart 2011;97(7):564-8.
25. Yusuf S, Hawken S, Ounpuu S, et al. Obesity and the risk of myocardial infarction in 27,000 participants from 52 countries: a case-control study. Lancet 2005;366(9497):1640-9.
26. Willett WC, Manson JE, Stampfer MJ, et al. Weight, weight change, and coronary heart disease in women. Risk within the 'normal' weight range. Jama 1995;273(6):461-5.
27. Hubert HB, Feinleib M, McNamara PM, et al. Obesity as an independent risk factor for cardiovascular disease: a 26-year follow-up of participants in the Framingham Heart Study. Circulation 1983;67(5):968-77.
28. Hoekstra T, Beulens JWJ, van der Schouw YT. Cardiovascular disease prevention in women: Impact of dietary interventions. Maturitas 2009;63(1):20-27.
29. Iqbal R, Anand S, Ounpuu S, et al. Dietary patterns and the risk of acute myocardial infarction in 52 countries: results of the INTERHEART study. Circulation 2008;118(19):1929-37.
30. Hu FB. Diet and cardiovascular disease prevention the need for a paradigm shift. J Am Coll Cardiol. United States, 2007:22-4.
31. Rivellese AA. Diet and cardiovascular disease: Beyond cholesterol. Nutrition, Metabolism and Cardiovascular Diseases 2005;15(6):395-98.
32. Martínez-González MA, Fernandez-Jarne E, Serrano-Martinez M, et al. Mediterranean diet and reduction in the risk of a first acute myocardial infarction: an operational healthy dietary score. Eur J Nutr 2002;41(4):153-60.
33. Joshipura KJ, Hu FB, Manson JE, et al. The effect of fruit and vegetable intake on risk for coronary heart disease. Ann Intern Med 2001;134(12):1106-14.
34. Liu S, Stampfer MJ, Hu FB, et al. Whole-grain consumption and risk of coronary heart disease: results from the Nurses' Health Study. Am J Clin Nutr 1999;70(3):412-9.
35. Daviglus ML, Stamler J, Orencia AJ, et al. Fish Consumption and the 30-Year Risk of Fatal Myocardial Infarction. New England Journal of Medicine 1997;336(15):1046-53.
36. Ascherio A, Hennekens CH, Buring JE, et al. Trans-fatty acids intake and risk of myocardial infarction. Circulation 1994;89(1):94-101.
37. Lee IM, Shiroma EJ, Lobelo F, et al. Effect of physical inactivity on major non-communicable diseases worldwide: an analysis of burden of disease and life expectancy. Lancet 2012;380(9838):219-29.
38. Li J, Siegrist J. Physical activity and risk of cardiovascular disease—a meta-analysis of prospective cohort studies. International journal of environmental research and public health 2012;9(2):391-407.
Page 34 of 80
For peer review only - http://bmjopen.bmj.com/site/about/guidelines.xhtml
BMJ Open
123456789101112131415161718192021222324252627282930313233343536373839404142434445464748495051525354555657585960
on January 9, 2022 by guest. Protected by copyright.
http://bmjopen.bm
j.com/
BM
J Open: first published as 10.1136/bm
jopen-2016-011529 on 23 January 2017. Dow
nloaded from
For peer review only
35
39. Chomistek AK, Chiuve SE, Jensen MK, et al. Vigorous physical activity, mediating biomarkers, and risk of myocardial infarction. Med Sci Sports Exerc 2011;43(10):1884-90.
40. Sattelmair J, Pertman J, Ding EL, et al. Dose-Response Between Physical Activity and Risk of Coronary Heart Disease: A Meta-Analysis. Circulation 2011;124(7):789-95.
41. Lakka TA, Venalainen JM, Rauramaa R, et al. Relation of Leisure-Time Physical Activity and Cardiorespiratory Fitness to the Risk of Acute Myocardial Infarction in Men. New England Journal of Medicine 1994;330(22):1549-54.
42. Leong DP, Smyth A, Teo KK, et al. Patterns of Alcohol Consumption and Myocardial Infarction Risk: Observations from 52 Countries in the INTERHEART Case-Control Study. Circulation 2014.
43. Roerecke M, Rehm J. Alcohol consumption, drinking patterns, and ischemic heart disease: a narrative review of meta-analyses and a systematic review and meta-analysis of the impact of heavy drinking occasions on risk for moderate drinkers. BMC Medicine 2014;12(1):1-11.
44. Brien SE, Ronksley PE, Turner BJ, et al. Effect of alcohol consumption on biological markers associated with risk of coronary heart disease: systematic review and meta-analysis of interventional studies. Bmj 2011;342:d636.
45. Ronksley PE, Brien SE, Turner BJ, et al. Association of alcohol consumption with selected cardiovascular disease outcomes: a systematic review and meta-analysis. Bmj 2011;342:d671.
46. Camargo CA, Jr., Stampfer MJ, Glynn RJ, et al. Moderate alcohol consumption and risk for angina pectoris or myocardial infarction in U.S. male physicians. Ann Intern Med 1997;126(5):372-5.
47. Gaziano JM, Buring JE, Breslow JL, et al. Moderate alcohol intake, increased levels of high-density lipoprotein and its subfractions, and decreased risk of myocardial infarction. N Engl J Med 1993;329(25):1829-34.
48. Mostofsky E, Maclure M, Sherwood JB, et al. Risk of Acute Myocardial Infarction after Death of a Significant Person in One’s Life: The Determinants of MI Onset Study. Circulation 2012;125(3):491-96.
49. Rosengren A, Hawken S, Ôunpuu S, et al. Association of psychosocial risk factors with risk of acute myocardial infarction in 11 119 cases and 13 648 controls from 52 countries (the INTERHEART study): case-control study. The Lancet 2004;364(9438):953-62.
50. Peter R, Siegrist J, Hallqvist J, et al. Psychosocial work environment and myocardial infarction: improving risk estimation by combining two complementary job stress models in the SHEEP Study. Journal of Epidemiology and Community Health 2002;56(4):294-300.
51. Mittleman MA, Maclure M, Sherwood JB, et al. Triggering of Acute Myocardial Infarction Onset by Episodes of Anger. Circulation 1995;92(7):1720-25.
52. van Loo HM, van den Heuvel ER, Schoevers RA, et al. Sex dependent risk factors for mortality after myocardial infarction: individual patient data meta-analysis. BMC Med 2014;12(1):242.
53. Evangelista O, McLaughlin MA. Review of cardiovascular risk factors in women. Gender Medicine 2009;6, Part 1:17-36.
54. Schenck-Gustafsson K. Risk factors for cardiovascular disease in women. Maturitas 2009;63(3):186-90.
55. Anand SS, Islam S, Rosengren A, et al. Risk factors for myocardial infarction in women and men: insights from the INTERHEART study. European Heart Journal 2008;29(7):932-40.
56. Ordovas JM. Gender, a significant factor in the cross talk between genes, environment, and health. Gend Med 2007;4 Suppl B:S111-22.
57. Regitz-Zagrosek V, Lehmkuhl E, Mahmoodzadeh S. Gender aspects of the role of the metabolic syndrome as a risk factor for cardiovascular disease. Gend Med 2007;4 Suppl B:S162-77.
58. Jousilahti P, Vartiainen E, Tuomilehto J, et al. Sex, age, cardiovascular risk factors, and coronary heart disease: a prospective follow-up study of 14 786 middle-aged men and women in Finland. Circulation 1999;99(9):1165-72.
Page 35 of 80
For peer review only - http://bmjopen.bmj.com/site/about/guidelines.xhtml
BMJ Open
123456789101112131415161718192021222324252627282930313233343536373839404142434445464748495051525354555657585960
on January 9, 2022 by guest. Protected by copyright.
http://bmjopen.bm
j.com/
BM
J Open: first published as 10.1136/bm
jopen-2016-011529 on 23 January 2017. Dow
nloaded from
For peer review only
36
59. Castelli WP, Wilson PWF, Levy D, et al. Cardiovascular risk factors in the elderly. The American Journal of Cardiology 1989;63(16):12-19.
60. Canto JG, Kiefe CI, Rogers WJ, et al. Number of coronary heart disease risk factors and mortality in patients with first myocardial infarction. Jama 2011;306(19):2120-7.
61. Chow CK, Islam S, Bautista L, et al. Parental history and myocardial infarction risk across the world: the INTERHEART Study. J Am Coll Cardiol 2011;57(5):619-27.
62. Friedlander Y, Siscovick DS, Weinmann S, et al. Family history as a risk factor for primary cardiac arrest. Circulation 1998;97(2):155-60.
63. Myers RH, Kiely DK, Cupples LA, et al. Parental history is an independent risk factor for coronary artery disease: the Framingham Study. Am Heart J 1990;120(4):963-9.
64. Hunt KJ, Williams K, Resendez RG, et al. All-cause and cardiovascular mortality among diabetic participants in the San Antonio Heart Study: evidence against the "Hispanic Paradox". Diabetes Care 2002;25(9):1557-63.
65. Yang Y, Ruiz-Narvaez E, Kraft P, et al. Effect of apolipoprotein E genotype and saturated fat intake on plasma lipids and myocardial infarction in the Central Valley of Costa Rica. Hum Biol 2007;79(6):637-47.
66. Lambert JC, Brousseau T, Defosse V, et al. Independent association of an APOE gene promoter polymorphism with increased risk of myocardial infarction and decreased APOE plasma concentrations-the ECTIM study. Hum Mol Genet 2000;9(1):57-61.
67. Freeman DJ, Samani NJ, Wilson V, et al. A polymorphism of the cholesteryl ester transfer protein gene predicts cardiovascular events in non-smokers in the West of Scotland Coronary Prevention Study. Eur Heart J 2003;24(20):1833-42.
68. Kuivenhoven JA, Jukema JW, Zwinderman AH, et al. The Role of a Common Variant of the Cholesteryl Ester Transfer Protein Gene in the Progression of Coronary Atherosclerosis. New England Journal of Medicine 1998;338(2):86-93.
69. Fumeron F, Betoulle D, Luc G, et al. Alcohol intake modulates the effect of a polymorphism of the cholesteryl ester transfer protein gene on plasma high density lipoprotein and the risk of myocardial infarction. J Clin Invest 1995;96(3):1664-71.
70. Ardissino D, Berzuini C, Merlini PA, et al. Influence of 9p21.3 genetic variants on clinical and angiographic outcomes in early-onset myocardial infarction. J Am Coll Cardiol 2011;58(4):426-34.
71. Qi L, Ma J, Qi Q, et al. Genetic risk score and risk of myocardial infarction in Hispanics. Circulation 2011;123(4):374-80.
72. Levy D, Wilson PWF, Anderson KM, et al. Stratifying the patient at risk from coronary disease: New insights from the framingham heart study. American Heart Journal 1990;119(3, Part 2):712-17.
73. Canto JG, Rogers WJ, Goldberg RJ, et al. Association of age and sex with myocardial infarction symptom presentation and in-hospital mortality. Jama 2012;307(8):813-22.
74. Hanratty B, Lawlor D, Robinson M, et al. Sex differences in risk factors, treatment and mortality after acute myocardial infarction: an observational study. Journal of Epidemiology and Community Health 2000;54(12):912-16.
75. Sewell WH, University of Wisconsin--Madison. Center for Demography and Ecology. As we age : the
Wisconsin Longitudinal Study, 1957-2001. Madison, WI: Center for Demography and Ecology, University of Wisconsin--Madison, 2001.
76. Herd P, Carr D, Roan C. Cohort Profile: Wisconsin longitudinal study (WLS). International Journal of Epidemiology 2014;43(1):34-41.
77. Roetker NS, Yonker JA, Lee C, et al. Multigene interactions and the prediction of depression in the Wisconsin Longitudinal Study. BMJ Open 2012;2(4).
Page 36 of 80
For peer review only - http://bmjopen.bmj.com/site/about/guidelines.xhtml
BMJ Open
123456789101112131415161718192021222324252627282930313233343536373839404142434445464748495051525354555657585960
on January 9, 2022 by guest. Protected by copyright.
http://bmjopen.bm
j.com/
BM
J Open: first published as 10.1136/bm
jopen-2016-011529 on 23 January 2017. Dow
nloaded from
For peer review only
37
78. Belbin O, Dunn JL, Ling Y, et al. Regulatory region single nucleotide polymorphisms of the apolipoprotein E gene and the rate of cognitive decline in Alzheimer's disease. Hum Mol Genet 2007;16(18):2199-208.
79. Lahoz C, Schaefer EJ, Cupples LA, et al. Apolipoprotein E genotype and cardiovascular disease in the Framingham Heart Study. Atherosclerosis 2001;154(3):529-37.
80. Corder EH, Saunders AM, Risch NJ, et al. Protective effect of apolipoprotein E type 2 allele for late onset Alzheimer disease. Nat Genet 1994;7(2):180-4.
81. Weisgraber KH, Rall SC, Mahley RW. Human E apoprotein heterogeneity. Cysteine-arginine interchanges in the amino acid sequence of the apo-E isoforms. J Biol Chem 1981;256(17):9077-83.
82. Weisgraber KH, Innerarity TL, Mahley RW. Abnormal lipoprotein receptor-binding activity of the human E apoprotein due to cysteine-arginine interchange at a single site. J Biol Chem 1982;257(5):2518-21.
83. R: A language and environment for statistical computing [program]. Vienna, Austria: R Foundation for Statistical Computing, 2008.
84. rpart: Recursive Partitioning. [program]. R package version 3.1-55. version, 2012. 85. Breiman L, Friedman JH, Olshen RA, et al. Classification and Regression Trees. Boca Raton: Chapman
and Hall/CRC, 1984:368. 86. Altman DG. Practical statistics for medical research. London ; New York: Chapman and Hall, 1991. 87. Haldane JB. The estimation and significance of the logarithm of a ratio of frequencies. Ann Hum
Genet 1956;20(4):309-11. 88. Gart JJ, Zweifel JR. On the bias of various estimators of the logit and its variance with application to
quantal bioassay. Biometrika 1967;54(1):181-7. 89. Strobl C, Malley J, Tutz G. An introduction to recursive partitioning: rationale, application, and
characteristics of classification and regression trees, bagging, and random forests. Psychol Methods 2009;14(4):323-48.
90. Breiman L. Random Forests. Machine Learning 2001;45(1):5-32. 91. Breiman L. Bagging Predictors. Machine Learning 1996;24(2):123-40. 92. Amit Y, Geman D. Shape quantization and recognition with randomized trees. Neural Computation
1997;9(7):1545-88. 93. Roshan U, Chikkagoudar S, Wei Z, et al. Ranking causal variants and associated regions in genome-
wide association studies by the support vector machine and random forest. Nucleic Acids Res 2011;39(9):e62.
94. Jiang R, Tang W, Wu X, et al. A random forest approach to the detection of epistatic interactions in case-control studies. BMC Bioinformatics 2009;10 Suppl 1:S65.
95. Shi T, Seligson D, Belldegrun AS, et al. Tumor classification by tissue microarray profiling: random forest clustering applied to renal cell carcinoma. Mod Pathol 2005;18(4):547-57.
96. Lunetta KL, Hayward LB, Segal J, et al. Screening large-scale association study data: exploiting interactions using random forests. BMC Genet 2004;5:32.
97. Liaw A, Wiener M. Classification and Regression by randomForest. R News 2002;2(3):18-22. 98. Online R documentation for the package 'randomForest' [program]. 4.6-10 version, 2014. 99. Neville PG. Controversy of Variable Importance in Random Forests. Journal of Unified Statistical
Techniques 2013;1(1):15-20. 100. Breiman L, Cutler A. Manual--Setting Up, Using, And Understanding Random Forests V4.0. Berkeley,
California: University of California, Berkeley, 2003:33. 101. Storey JD. A direct approach to false discovery rates. Journal of the Royal Statistical Society: Series
B (Statistical Methodology) 2002;64(3):479-98.
Page 37 of 80
For peer review only - http://bmjopen.bmj.com/site/about/guidelines.xhtml
BMJ Open
123456789101112131415161718192021222324252627282930313233343536373839404142434445464748495051525354555657585960
on January 9, 2022 by guest. Protected by copyright.
http://bmjopen.bm
j.com/
BM
J Open: first published as 10.1136/bm
jopen-2016-011529 on 23 January 2017. Dow
nloaded from
For peer review only
38
102. qvalue: Q-value estimation for false discovery rate control [program]. R package version 1.32.0 version, 2014.
103. Dhamoon MS, Tai W, Boden-Albala B, et al. Risk of myocardial infarction or vascular death after first ischemic stroke: the Northern Manhattan Study. Stroke. United States, 2007:1752-8.
104. Touzé E, Varenne O, Chatellier G, et al. Risk of Myocardial Infarction and Vascular Death After Transient Ischemic Attack and Ischemic Stroke: A Systematic Review and Meta-Analysis. Stroke 2005;36(12):2748-55.
105. Tabrizchi R. Incidence of Stroke After Myocardial Infarction. Vascular Health and Risk Management 2006;2(1):1-2.
106. Lichtman JH, Krumholz HM, Wang Y, et al. Risk and Predictors of Stroke After Myocardial Infarction Among the Elderly: Results From the Cooperative Cardiovascular Project. Circulation 2002;105(9):1082-87.
107. Loh E, Sutton MSJ, Wun C-CC, et al. Ventricular Dysfunction and the Risk of Stroke after Myocardial Infarction. New England Journal of Medicine 1997;336(4):251-57.
108. Association AH. How Cardiovascular & Stroke Risks Relate: American Stroke Association; 2014 [Available from: http://www.strokeassociation.org/STROKEORG/LifeAfterStroke/HealthyLivingAfterStroke/UnderstandingRiskyConditions/How-Cardiovascular-Stroke-Risks-Relate_UCM_310369_Article.jsp.
109. González-Pacheco H, Vargas-Barron J, Vallejo M, et al. Prevalence of conventional risk factors and lipid profiles in patients with acute coronary syndrome and significant coronary disease. Ther Clin Risk Manag 2014;10:815-23.
110. Magnus P, Beaglehole R. The real contribution of the major risk factors to the coronary epidemics: time to end the "only-50%" myth. Arch Intern Med 2001;161(22):2657-60.
111. Leander K, Hallqvist J, Reuterwall C, et al. Family history of coronary heart disease, a strong risk factor for myocardial infarction interacting with other cardiovascular risk factors: results from the Stockholm Heart Epidemiology Program (SHEEP). Epidemiology 2001;12(2):215-21.
112. Roncaglioni MC, Santoro L, D'Avanzo B, et al. Role of family history in patients with myocardial infarction. An Italian case-control study. GISSI-EFRIM Investigators. Circulation 1992;85(6):2065-72.
113. Gafarov VV, Gromova EA, Gafarova AV, et al. [Myocardial infarction and stress at work place and in the family: 10-year risk of development in an open population of 2564 year old men (epidemiological study in a framework of the WHO program MONICA-PSYCHOSOCIAL)]. Kardiologiia 2011;51(3):10-6.
114. Chandola T, Brunner E, Marmot M. Chronic stress at work and the metabolic syndrome: prospective study. BMJ 2006;332(7540):521-25.
115. Kivimäki M, Leino-Arjas P, Luukkonen R, et al. Work stress and risk of cardiovascular mortality: prospective cohort study of industrial employees. BMJ 2002;325(7369):857.
116. Stamler J, Daviglus ML, Garside DB, et al. Relationship of baseline serum cholesterol levels in 3 large cohorts of younger men to long-term coronary, cardiovascular, and all-cause mortality and to longevity. Jama 2000;284(3):311-8.
117. Klag MJ, Ford DE, Mead LA, et al. Serum Cholesterol in Young Men and Subsequent Cardiovascular Disease. New England Journal of Medicine 1993;328(5):313-18.
118. Anderson KM, Castelli WP, Levy D. Cholesterol and mortality. 30 years of follow-up from the Framingham study. Jama 1987;257(16):2176-80.
119. Mukamal KJ, Chung H, Jenny NS, et al. Alcohol consumption and risk of coronary heart disease in older adults: the Cardiovascular Health Study. J Am Geriatr Soc. United States, 2006:30-7.
120. Mukamal KJ, Kuller LH, Fitzpatrick AL, et al. Prospective study of alcohol consumption and risk of dementia in older adults. JAMA. United States, 2003:1405-13.
Page 38 of 80
For peer review only - http://bmjopen.bmj.com/site/about/guidelines.xhtml
BMJ Open
123456789101112131415161718192021222324252627282930313233343536373839404142434445464748495051525354555657585960
on January 9, 2022 by guest. Protected by copyright.
http://bmjopen.bm
j.com/
BM
J Open: first published as 10.1136/bm
jopen-2016-011529 on 23 January 2017. Dow
nloaded from
For peer review only
39
121. Abramson JL, Williams SA, Krumholz HM, et al. Moderate alcohol consumption and risk of heart failure among older persons. JAMA. United States, 2001:1971-7.
122. Manson JE, Colditz GA, Stampfer MJ, et al. A prospective study of maturity-onset diabetes mellitus and risk of coronary heart disease and stroke in women. Arch Intern Med 1991;151(6):1141-7.
123. Yokoyama H, Higuma T, Nishizaki F, et al. Abstract 16483: Marital Status and Long-Term Mortality of Male Patients Presenting With Acute Myocardial Infarction. Circulation 2014;130(Suppl 2):A16483-A83.
124. Kriegbaum M, Christensen U, Andersen PK, et al. Does the association between broken partnership and first time myocardial infarction vary with time after break-up? International Journal of Epidemiology 2013;42(6):1811-19.
125. Lammintausta A, Airaksinen JKE, Immonen-Räihä P, et al. Prognosis of acute coronary events is worse in patients living alone: the FINAMI myocardial infarction register. European Journal of Preventive Cardiology 2013.
126. Hu B, Li W, Wang X, et al. Marital Status, Education, and Risk of Acute Myocardial Infarction in Mainland China: The INTER-HEART Study. Journal of Epidemiology 2012;22(2):123-29.
127. Waltz M. Marital context and post-infarction quality of life: Is it social support or something more? Social Science & Medicine 1986;22(8):791-805.
128. Chandra V, Szklo M, Goldberg R, et al. THE IMPACT OF MARITAL STATUS ON SURVIVAL AFTER AN ACUTE MYOCARDIAL INFARCTION: A POPULATION-BASED STUDY. American Journal of Epidemiology 1983;117(3):320-25.
129. Welin C, Rosengren A, Wedel H, et al. Myocardial infarction in relation to work, family and life events. Cardiovascular Risk Factors 1995;5(1):30-38.
130. Eaker ED, Pinsky J, Castelli WP. Myocardial Infarction and Coronary Death among Women: Psychosocial Predictors from a 20-Year Follow-up of Women in the Framingham Study. American Journal of Epidemiology 1992;135(8):854-64.
131. Lanas F, Avezum A, Bautista LE, et al. Risk Factors for Acute Myocardial Infarction in Latin America: The INTERHEART Latin American Study. Circulation 2007;115(9):1067-74.
132. Feller S, Teucher B, Kaaks R, et al. Life Satisfaction and Risk of Chronic Diseases in the European Prospective Investigation into Cancer and Nutrition (EPIC)-Germany Study. PLoS ONE 2013;8(8):e73462.
133. Łopuszańska M, Szklarska A, Lipowicz A, et al. Life satisfaction and cardiovascular disease risk in Poland. Archives of Medical Science : AMS 2013;9(4):629-34.
134. Boehm JK, Peterson C, Kivimaki M, et al. Heart health when life is satisfying: evidence from the Whitehall II cohort study. Eur Heart J. England, 2011:2672-7.
135. Welin C, Lappas G, Wilhelmsen L. Independent importance of psychosocial factors for prognosis after myocardial infarction. J Intern Med. England, 2000:629-39.
136. Brezinka V, Kittel F. Psychosocial factors of coronary heart disease in women: a review. Soc Sci Med 1996;42(10):1351-65.
137. Juutilainen A, Lehto S, Ronnemaa T, et al. Type 2 diabetes as a "coronary heart disease equivalent": an 18-year prospective population-based study in Finnish subjects. Diabetes Care. United States, 2005:2901-7.
138. Hu FB, Stampfer MJ, Solomon CG, et al. The impact of diabetes mellitus on mortality from all causes and coronary heart disease in women: 20 years of follow-up. Arch Intern Med. United States, 2001:1717-23.
139. Haffner SM, Lehto S, Rönnemaa T, et al. Mortality from Coronary Heart Disease in Subjects with Type 2 Diabetes and in Nondiabetic Subjects with and without Prior Myocardial Infarction. New England Journal of Medicine 1998;339(4):229-34.
Page 39 of 80
For peer review only - http://bmjopen.bmj.com/site/about/guidelines.xhtml
BMJ Open
123456789101112131415161718192021222324252627282930313233343536373839404142434445464748495051525354555657585960
on January 9, 2022 by guest. Protected by copyright.
http://bmjopen.bm
j.com/
BM
J Open: first published as 10.1136/bm
jopen-2016-011529 on 23 January 2017. Dow
nloaded from
For peer review only
40
140. Parker WH, Feskanich D, Broder MS, et al. Long-term mortality associated with oophorectomy compared with ovarian conservation in the nurses' health study. Obstet Gynecol. United States, 2013:709-16.
141. Wellons M, Ouyang P, Schreiner PJ, et al. Early menopause predicts future coronary heart disease and stroke: the Multi-Ethnic Study of Atherosclerosis. Menopause 2012;19(10):1081-7.
142. Ingelsson E, Lundholm C, Johansson AL, et al. Hysterectomy and risk of cardiovascular disease: a population-based cohort study. Eur Heart J. England, 2011:745-50.
143. Parker WH, Broder MS, Chang E, et al. Ovarian conservation at the time of hysterectomy and long-term health outcomes in the nurses' health study. Obstet Gynecol. United States, 2009:1027-37.
144. Dørum A, Tonstad S, Liavaag AH, et al. Bilateral oophorectomy before 50 years of age is significantly associated with the metabolic syndrome and Framingham risk score: A controlled, population-based study (HUNT-2). Gynecologic Oncology 2008;109(3):377-83.
145. Lobo RA. Surgical menopause and cardiovascular risks. Menopause. United States, 2007:562-6. 146. Simon T, Mary-Krause M, Cambou JP, et al. Impact of age and gender on in-hospital and late
mortality after acute myocardial infarction: increased early risk in younger women: results from the French nation-wide USIC registries. Eur Heart J. England, 2006:1282-8.
147. Falkeborn M, Schairer C, Naessen T, et al. Risk of myocardial infarction after oophorectomy and hysterectomy. J Clin Epidemiol. England, 2000:832-7.
148. Stampfer MJ, Colditz GA, Willett WC. Menopause and Heart Disease. Annals of the New York Academy of Sciences 1990;592(1):193-203.
149. Colditz GA, Willett WC, Stampfer MJ, et al. Menopause and the risk of coronary heart disease in women. N Engl J Med 1987;316(18):1105-10.
150. Rosenberg L, Hennekens CH, Rosner B, et al. Early menopause and the risk of myocardial infarction. Am J Obstet Gynecol. United States, 1981:47-51.
151. Schierbeck LL, Rejnmark L, Tofteng CL, et al. Effect of hormone replacement therapy on cardiovascular events in recently postmenopausal women: randomised trial. BMJ 2012;345.
152. Falkeborn M, Persson I, Adami H-O, et al. The risk of acute myocardial infarction after oestrogen and oestrogen-progestogen replacement. BJOG: An International Journal of Obstetrics & Gynaecology 1992;99(10):821-28.
153. Rosamond WD, Sprafka JM, McGovern PG, et al. Validation of Self-Reported History of Acute Myocardial Infarction: Experience of the Minnesota Heart Survey Registry. Epidemiology 1995;6(1):67-69.
Page 40 of 80
For peer review only - http://bmjopen.bmj.com/site/about/guidelines.xhtml
BMJ Open
123456789101112131415161718192021222324252627282930313233343536373839404142434445464748495051525354555657585960
on January 9, 2022 by guest. Protected by copyright.
http://bmjopen.bm
j.com/
BM
J Open: first published as 10.1136/bm
jopen-2016-011529 on 23 January 2017. Dow
nloaded from
For peer review only
41
Find below our responses to the reviewer’s concerns and constructive comments. Changes to
the manuscript have been underlined in the text.
Reviewer #1
Abstract
1. There is no information provided on the types of statistical analyses used. It is
important to describe the phases of analysis including the recursive partitioning and
logistic regression.
Thank you for this suggestion. We have now listed the statistical analyses included in the
study, with a short description of the phases of analysis. We have also included a description
of the two separate sets of analyses based on our two dependent variables and datasets.
2. For readers who know the WLS, they will not understand why only 6198 of the
original 10,317 participants were included in the current study. Would it be possible to
indicate the criteria to be included in your study?
We have clarified subject participation.
3. The purpose is stated to be related to environmental, health, sociobehavioral
and genetic factors yet there is no mention of genetic factors in
the results section.
We have included a sentence regarding the genetic results. No genetic risk factors for MI
were identified by our study. We address more fully the genetic factors tested in the methods
section of the manuscript and the limitations of these analyses in the discussion.
4. On pg 2, line 38, It is stated “Bhad the largest protective effect”. This suggests
causation though causation cannot be inferred from the analysis conducted. Suggest
to amend to “was associated with theB”.
Page 41 of 80
For peer review only - http://bmjopen.bmj.com/site/about/guidelines.xhtml
BMJ Open
123456789101112131415161718192021222324252627282930313233343536373839404142434445464748495051525354555657585960
on January 9, 2022 by guest. Protected by copyright.
http://bmjopen.bm
j.com/
BM
J Open: first published as 10.1136/bm
jopen-2016-011529 on 23 January 2017. Dow
nloaded from
For peer review only
42
We have corrected this sentence.
Introduction
1. Line 36, page 4. “Brisk factors for heart disease and MI are mediated by gender and
ageB..”. Shouldn’t this read “B.are moderated by gender and age BB”.?
Yes, we have made the suggested change.
2. The results presented at the end of the section are more succinctly presented than
those in the abstract. Why not use some of these as I expect that they would speak to
more readers?
We have modeled the wording of the results in the abstract to more closely mirror the results
presented at the end of the Introduction.
Study Question and Risk Factors for MI
1. When were the saliva data collected? Page 6, line 20. What are the implications of
using data that might have been collected after the MI?
We have included the year when saliva was genotyped and data collected (2009). We agree
that it is a limitation of our study that the MI may have occurred before some of the predictor
variables were measured, specifically for the ‘MI by 72 Years of Age’ dependent variable. This
was in part why we includes a second analysis, ‘MI Between 65-72 Years of Age’ and dataset,
which includes only independent variables collected BEFORE a MI. We have included a
section addressing this in the limitations section of the discussion.
2. This section, which is central to the whole thesis of the paper, is not easy to read.
There is no clear rationale presented here for:
a. Generating two separate data sets with two different outcomes.
i. Those who are classified as having “MI between ages 65-72” is conditional on
responding to the 2004 survey, on not having had an MI before the 2004 survey and, as
consequence, not having died before aged 65. The authors do not clearly describe why
Page 42 of 80
For peer review only - http://bmjopen.bmj.com/site/about/guidelines.xhtml
BMJ Open
123456789101112131415161718192021222324252627282930313233343536373839404142434445464748495051525354555657585960
on January 9, 2022 by guest. Protected by copyright.
http://bmjopen.bm
j.com/
BM
J Open: first published as 10.1136/bm
jopen-2016-011529 on 23 January 2017. Dow
nloaded from
For peer review only
43
they view it to be a reasonable outcome measure. Surely this measure is subject to
some kind of survivors’ bias?
We agree with your comments regarding this section. We have rewritten this section of the
paper to address your comments and make it easier to read. We have also included our
rationale for having two dependent variables.
Attrition numbers are given in a new Supplemental Table 1, including those who died before
each survey round. Unfortunately because of the nature of longitudinal survey study we had to
make some concessions about how to design the study, but this has now been addressed (in
the limitations section of the discussion). Thank you.
ii. Similarly, the age range 65-72 is an artefact of the timing of the surveys. The
authors should comment on this as in the results section and the abstract it reads as if
this is some scientific feature.
We have clarified this in the text (this section, the results, and a sentence in the abstract).
iii. It appears that the outcome of “MI by 72 years of age” includes MI that occurred at
any time prior to age 72 for those who have survey data and/or died from an MI. What
do the authors do for people who died of a non-MI cause between, say, the 2004 and
2011 survey and had not had an MI by the 2004 survey? It is not known with certainty
that this person died MI-free. These considerations should be more carefully described.
The authors claim (line 43, page 6): “thereby including anyone who ever reported
having a MI” but based on the information provided and my previous comments, I am
not convinced that this is true. The authors would need to describe this much more
clearly and justify their rationale in order to convince me. It would be important, for
example, to compare characteristics (at study baseline and at earlier waves) of
participants for whom the outcome could be derived and for whom it could not to gain
an understanding as to who has outcome data available. This would still not be the
whole picture but may at least alleviate some uneasiness.
We changed our wording [line 9, page 7] to “thereby including anyone who reported having a
MI to the WLS” in order to be more clear on this point. We also included a new list of
participant characteristics (Table 1). Furthermore, we made a notation in the discussion about
this point, and indicated a possible bias due to inclusion/exclusion criteria.
Page 43 of 80
For peer review only - http://bmjopen.bmj.com/site/about/guidelines.xhtml
BMJ Open
123456789101112131415161718192021222324252627282930313233343536373839404142434445464748495051525354555657585960
on January 9, 2022 by guest. Protected by copyright.
http://bmjopen.bm
j.com/
BM
J Open: first published as 10.1136/bm
jopen-2016-011529 on 23 January 2017. Dow
nloaded from
For peer review only
44
In order to address your concern of bias due to missing data, we performed a ‘logical
bounding’ procedure in which we reran our logistic regression analyses with all missing values
(due to non-response) coded first as “Yes” and then as “No”, to see if our results were robust
against this missing data. We found that only one predictor in the second analysis in women
was sensitive to this missing data, and have now addressed this in the text as well.
Therefore, the majority of our data was not sensitive to missing data points.
iv. Although the denominator for the outcome “MI 65-72” must be smaller than for “MI
by age 72” since the former conditions on not having an MI, being alive at age 65 and
responding to the survey at age 65, it would benefit the reader to understand more
about the differences in the size of the denominator. Moreover, it would greatly help the
reader if there was, say, a table or flow chart, that shows who drops out of the WLS at
different survey waves (e.g. by attrition or death) and who has an MI before age 65 and
then who is considered eligible for the analyses in the current paper. As it stands, there
are a lot of remaining questions about inclusion criteria and outcome definition. This
section has left me really dissatisfied. A recommendation to help with this would be to
use the STROBE statement for reporting of observational studies, which I cannot find
in the supplemental material.
We have included a table that lists attrition for each survey wave, including numbers for total
WLS response, those included in the current study, those who died before each wave, and
attrition for other reasons (Supplemental Table 1). We have also included a STROBE
statement for reporting of observational studies when uploading the paper. Please see above
for additional response concerning attrition. Thank you for these suggestions.
b. Why not use a time-to-event approach to the analysis to account for the time of
death and/or MI in a finer way?
Unfortunately our dataset did not include the dates of occurrence of all predictor variables (or
even the dependent variable), so it was impossible to run a ‘time-to-event’ or survival analysis
on this data. This was addressed in the discussion.
c. Issues of possible sample bias due to non-response to surveys and limitations of
the ICD-9 codes in death records. In particular, bias may arise because:
i. People with an MI who were not in the 2004 or 2011 survey and had not died would
not be included in the two derived samples. If these people were more likely to be of
poor health and experience a non-fatal MI (or experience death due to other causes so
Page 44 of 80
For peer review only - http://bmjopen.bmj.com/site/about/guidelines.xhtml
BMJ Open
123456789101112131415161718192021222324252627282930313233343536373839404142434445464748495051525354555657585960
on January 9, 2022 by guest. Protected by copyright.
http://bmjopen.bm
j.com/
BM
J Open: first published as 10.1136/bm
jopen-2016-011529 on 23 January 2017. Dow
nloaded from
For peer review only
45
that the MI was not detected) then this would mean that the derived data sets may not
include a large slice of people who have different characteristics to those analyzed. A
time-to-event analysis would enable these people to be included in the risk set whilst
they were know to be at risk of an MI. I am not opposed to analyzing binary outcomes
for data such as the ones described but I would certainly like to understand more about
the characteristics of the people not included at all. Right now the authors do not
provide this information.
We have included a statement about limitations of the ICD codes in death records, and limited
death records obtained by the WLS in the limitations section of the discussion.
ii. Given there is so much attrition in the WLS, it is essential to extensively examine
and explore these issues before proceeding with outcomes analysis.
Please see above.
3. Without a more detailed and clear description of the issues described above, I would
feel really uncomfortable considering the results presented valid and unbiased. For this
reason, until I would be convinced that the outcome measures being analyzed and the
analytic method used (i.e. logistic regression rather than a time-to-event analysis) are
valid, I will provide only general, not detailed, comments below.
The findings in this study are consistent with previous studies examining risk factors for heart
disease, and therefore add credibility to our results as being valid and unbiased. Our results
extend previous findings by demonstrating that there are important differences in MI risk
factors between genders, that combinations of risk factors greatly influences risk, and that
factors change and become less predictive over time.
4. It would help the reader if it was clearly stated from which survey wave the
independent variables were taken. From the Figures it appears to be from both 2004
and 2011 for the “72 years” outcome. It would be good to describe this. What about
collinearity of covariates measured in both years. Presumably the RP, and
subsequently the LR, would take care of this? It would help the reader to clarify this.
Page 45 of 80
For peer review only - http://bmjopen.bmj.com/site/about/guidelines.xhtml
BMJ Open
123456789101112131415161718192021222324252627282930313233343536373839404142434445464748495051525354555657585960
on January 9, 2022 by guest. Protected by copyright.
http://bmjopen.bm
j.com/
BM
J Open: first published as 10.1136/bm
jopen-2016-011529 on 23 January 2017. Dow
nloaded from
For peer review only
46
This was mentioned in the Methods Section and in the legends for Tables 2 and 3. In order to
address collinearity of covariates measured in multiple survey rounds (years), we first
completed a recursive partitioning analysis in order to reduce the number of variables
analyzed, and then ran independent logistic regression analysis for each independent
variable, to take into account the collinearity of independent variables. We added a section to
address this in the ‘Statistical Analyses’ portion of the Methods section to clarify this point for
the readers.
Statistical Analysis
1. The use of binary recursive partitioning and random forests is a good choice to try to
reduce the set of 235 predictors.
Agreed.
2. Pg 9, line 26: It is stated that “All p-values generated from these tests were adjusted
for multiple testing using the R program, with package qvalue”. What adjustment was
used? Bonferroni? What else?
We have clarified this in part III of the Statistical Analysis section of the methods.
3. Pg. 9, line 35: “B.. and meaningfully affected MI risk (increased or decreased LR
odds ratios by at least 40%)”. Don’t you mean “increased or decreased odds by at least
40%” i.e. rather than odds ratio? And, if so, on what scale? If on odds ratio scale it
would still be valuable to describe this statement in more detail.
Yes, logistic regression odds ratios were determined by exponentiating the coefficients of the
regression models, using the R program, and were included only if they increased or
decreased odds by at least 40%. Thanks for this suggestion.
Page 46 of 80
For peer review only - http://bmjopen.bmj.com/site/about/guidelines.xhtml
BMJ Open
123456789101112131415161718192021222324252627282930313233343536373839404142434445464748495051525354555657585960
on January 9, 2022 by guest. Protected by copyright.
http://bmjopen.bm
j.com/
BM
J Open: first published as 10.1136/bm
jopen-2016-011529 on 23 January 2017. Dow
nloaded from

For peer review only
47
Results
1. The results section is clearly laid out and well structured.
Thank you!
2. The results section and supplemental tables do not contain any basic description
statistics on the participants in the data sets. Why? Whilst there are a lot of variables at
235, it is still important for the reader to see some basic descriptive statistics or at least
descriptive statistics for the variables that are finally included in the LR models.
We have included a new Table 1 and added a statement about basic descriptive statistics to
the beginning of the results section.
Limitations
1. The authors correctly state that a limitation is that data were collected through
survey methods (pg 19, line 53). I would argue that the study attrition and possible bias
is a potentially larger limitation, which seems to have been ignored throughout the
paper. Since all inference relies on lack of bias (whether than bias arises through
sample selection, outcome definition or some other way), the authors should clearly
address this early in their paper and here in the limitations section.
We have added a full description of the limitations and associated bias due to attrition from the
WLS study, as well as exclusion from the current study populations in the limitations section.
We demonstrate that missing data points did not attribute to bias.
Page 47 of 80
For peer review only - http://bmjopen.bmj.com/site/about/guidelines.xhtml
BMJ Open
123456789101112131415161718192021222324252627282930313233343536373839404142434445464748495051525354555657585960
on January 9, 2022 by guest. Protected by copyright.
http://bmjopen.bm
j.com/
BM
J Open: first published as 10.1136/bm
jopen-2016-011529 on 23 January 2017. Dow
nloaded from

For peer review only
48
Reviewer #2
- Abstract: As a reader I was confused by the diversity of results. Could you focus the
results section a bit more? Also, the statistical method was not explained, and, thus,
the results section reads like a "fishing expedition."
Please see response to Reviewer 1.
- The description of outcome assessment in the Methods section is very hard to follow.
Please see response to Reviewer 1. We have clarified the Methods section.
- According to supplement information 1, exposure variables were mostly assessed
1993 and onward. However, some cases might have already occurred before that date.
How did the authors take this into account?
Please see response to Reviewer 1.
- In tables with log. regression results, it would be good to see the number of cases and
non-cases.
Agreed. We have added a column to the log regression tables (Tables 2 and 3) including the
number of MI cases and non-cases.
- The major limitation of the study is the study outcome: MI is only self-reported. The
authors only discuss this with one small sentence. Some diagnoses likely occurred
many years ago. This needs to be discussed in more detail.
Page 48 of 80
For peer review only - http://bmjopen.bmj.com/site/about/guidelines.xhtml
BMJ Open
123456789101112131415161718192021222324252627282930313233343536373839404142434445464748495051525354555657585960
on January 9, 2022 by guest. Protected by copyright.
http://bmjopen.bm
j.com/
BM
J Open: first published as 10.1136/bm
jopen-2016-011529 on 23 January 2017. Dow
nloaded from

For peer review only
49
Although MI is only self-reported, we have reasonable expectation that this is an event that is
not easily forgotten. We have addressed the fact that this is only self-reported in the limitations
section of the discussion. The time component to diagnoses was part of the rationale behind
examining only those who had a MI after 65 years of age in the 65-72 year group.
- A further limitation is the statistical analysis. Baseline assessment was in the 1950s
but follow-up lasted for more than 50 years. However, follow-up time was not taken into
account in the analysis (at least, the authors did not describe it). I realize that other
types of analysis such as Cox regression could not be used because of missing
information on date of MI analysis. But the authors should discuss whether this limits
the interpretation of their results.
Thank you, we have addressed this point in the Statistical Analyses portion of the Methods
section, and in the Limitations section of the Discussion. We ran independent logistic
regression analysis for each predictor variable, including the same factors measured at
multiple time points to try to gauge the differences in association with MI based on when a
factor was measured (survey year). However, not using a ‘time-to-event’ or survival analysis
was a limitation to this study, which has now been addressed in the text. Please see additional
response to Reviewer 1.
- The STROBE checklist was not filled in.
We have included a STROBE checklist when uploading the paper.
- It would be nice to see a proper table 1, which describes the baseline characteristics
of the cohort.
We have included a table of participant characteristics (Table 1), with most characteristics
measured in 2004, the first year that MI questions were asked by the WLS.
- 10,317 men and women participated in the survey. How many of them had died in the
meantime? How many up to each follow-up?
Page 49 of 80
For peer review only - http://bmjopen.bmj.com/site/about/guidelines.xhtml
BMJ Open
123456789101112131415161718192021222324252627282930313233343536373839404142434445464748495051525354555657585960
on January 9, 2022 by guest. Protected by copyright.
http://bmjopen.bm
j.com/
BM
J Open: first published as 10.1136/bm
jopen-2016-011529 on 23 January 2017. Dow
nloaded from
For peer review only
50
We have included a table that lists attrition for each survey wave, including numbers for total
WLS response, those included in the current study, those who died before each survey wave,
and attrition for other reasons (Supplemental Table 1).
Page 50 of 80
For peer review only - http://bmjopen.bmj.com/site/about/guidelines.xhtml
BMJ Open
123456789101112131415161718192021222324252627282930313233343536373839404142434445464748495051525354555657585960
on January 9, 2022 by guest. Protected by copyright.
http://bmjopen.bm
j.com/
BM
J Open: first published as 10.1136/bm
jopen-2016-011529 on 23 January 2017. Dow
nloaded from

For peer review only
Supplemental Table 1: WLS participant response and attrition for survey waves 1993, 2004, and 2011. The number of participants from each survey wave included in the ‘MI by 72 Years of Age’ analysis, as well as the number of participants who died before each survey wave is included.
Participant Attrition 1993 Survey Wave 2004 Survey Wave 2011 Survey Wave
Total participant response to WLS (n =) 8493 7265 5968
Included in 'MI by 72 Years of Age' analysis (n =) 6013 5757 5939
Non-respondents who died before survey wave (n =) 587 1287 1587
Attrition from WLS for other reasons (n=) 1237 1765 2762
Page 51 of 80
For peer review only - http://bmjopen.bmj.com/site/about/guidelines.xhtml
BMJ Open
123456789101112131415161718192021222324252627282930313233343536373839404142434445464748495051525354555657585960
on January 9, 2022 by guest. Protected by copyright. http://bmjopen.bmj.com/ BMJ Open: first published as 10.1136/bmjopen-2016-011529 on 23 January 2017. Downloaded from
For peer review only
Supplemental Information 1: Explanation of WLS variables used to create the two dependent
variables for the current study.
This study examined possible risk factors for MI using E and G data available through the WLS.
In order to create our dependent MI variables, we compiled data from the 2004 and 2011 WLS
surveys and the National Death Index (NDI). From this we created two dependent variables and
two separate associated datasets. The first dependent variable created by this study, ‘MI by 72
Years of Age’, was coded as “Yes” if a participant answered ‘yes’ to the question, “Did you have
a heart attack or myocardial infarction?” during the 2004 telephone interview, or answered
‘yes’ to the question, “Did participant ever have a heart attack or myocardial infarction?” during
the 2011 in-person or telephone interview, or if the participant ever died of an acute MI
according to the National Death Index (ICD-9 or ICD-10 codes; collected by the WLS through
2006 at the time of this study), thereby including anyone who ever reported having a MI to the
WLS. The ‘MI by 72 Years of Age’ dependent variable was coded “No” if the participant
answered ‘no’ to the question, “Has a doctor ever told participant they had a heart attack,
coronary heart disease, angina, congestive heart failure, or other heart problems?” during the
2011 survey round, or ‘no’ to the question, “Did participant ever have a heart attack or
myocardial infarction?” during the same survey period. This resulted in MI data for 6,198
graduates, with 776 participants coded as “Yes” and 5,422 coded as “No” for the given MI
variable. Additionally, this dependent variable was linked to a dataset which included
independent variables collected from all WLS survey years, 1957-2011.
The second dependent variable, ‘MI Between 65-72 Years of Age’, included ONLY those
participants who answered ‘no’ to the question, “Has a doctor ever told you that you had a
heart attack, coronary heart disease, angina, congestive heart failure, or other heart
problems?” or answered ‘no’ to the question, “Did you have a heart attack or myocardial
infarction?” during the 2004 telephone interview, and thereby only included those who had not
had a MI yet by 2004. The variable was coded as “Yes” if the participant answered ‘yes’ to the
question, “Did participant ever have a heart attack or myocardial infarction?” during the 2011
in-person or telephone interview, or if the participant died of an acute MI after 2004 according
to the National Death Index (ICD-9 or ICD-10 codes; collected by the WLS through 2006 at the
time of this study). This MI variable was coded “No” if the participant answered ‘no’ to the
question, “Has a doctor ever told participant they had a heart attack, coronary heart disease,
angina, congestive heart failure, or other heart problems?” during the 2011 survey round, or
‘no’ to the question, “Did participant ever have a heart attack or myocardial infarction?” during
the same survey period. This resulted in MI data for 5,321 graduates, with 213 participants
coded as “Yes” and 5,108 coded as “No” for the given (dependent) MI variable. In addition, this
dependent variable was linked to a dataset which included only independent variables collected
during the 2004 survey year or earlier.
Page 52 of 80
For peer review only - http://bmjopen.bmj.com/site/about/guidelines.xhtml
BMJ Open
123456789101112131415161718192021222324252627282930313233343536373839404142434445464748495051525354555657585960
on January 9, 2022 by guest. Protected by copyright.
http://bmjopen.bm
j.com/
BM
J Open: first published as 10.1136/bm
jopen-2016-011529 on 23 January 2017. Dow
nloaded from
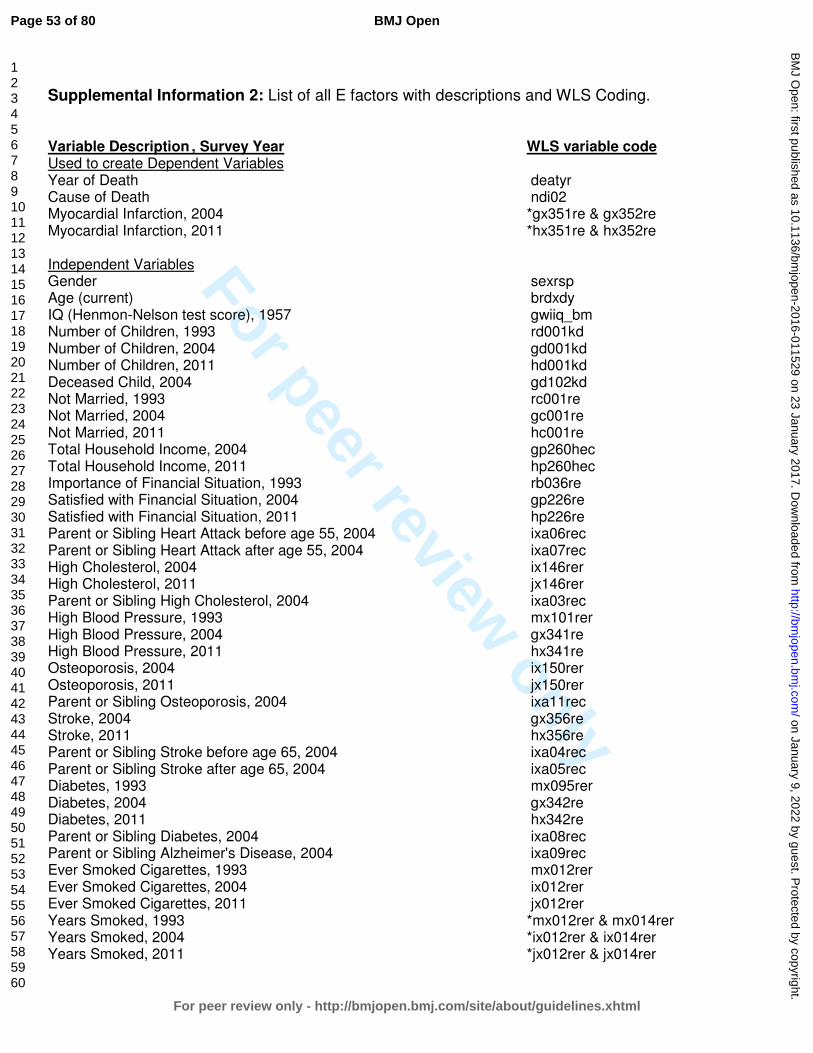
For peer review only
Supplemental Information 2: List of all E factors with descriptions and WLS Coding. Variable Description , Survey Year WLS variable code Used to create Dependent Variables Year of Death deatyr Cause of Death ndi02 Myocardial Infarction, 2004 *gx351re & gx352re Myocardial Infarction, 2011 *hx351re & hx352re Independent Variables Gender sexrsp Age (current) brdxdy IQ (Henmon-Nelson test score), 1957 gwiiq_bm Number of Children, 1993 rd001kd Number of Children, 2004 gd001kd Number of Children, 2011 hd001kd Deceased Child, 2004 gd102kd Not Married, 1993 rc001re Not Married, 2004 gc001re Not Married, 2011 hc001re Total Household Income, 2004 gp260hec Total Household Income, 2011 hp260hec Importance of Financial Situation, 1993 rb036re Satisfied with Financial Situation, 2004 gp226re Satisfied with Financial Situation, 2011 hp226re Parent or Sibling Heart Attack before age 55, 2004 ixa06rec Parent or Sibling Heart Attack after age 55, 2004 ixa07rec High Cholesterol, 2004 ix146rer High Cholesterol, 2011 jx146rer Parent or Sibling High Cholesterol, 2004 ixa03rec High Blood Pressure, 1993 mx101rer High Blood Pressure, 2004 gx341re High Blood Pressure, 2011 hx341re Osteoporosis, 2004 ix150rer Osteoporosis, 2011 jx150rer Parent or Sibling Osteoporosis, 2004 ixa11rec Stroke, 2004 gx356re Stroke, 2011 hx356re Parent or Sibling Stroke before age 65, 2004 ixa04rec Parent or Sibling Stroke after age 65, 2004 ixa05rec Diabetes, 1993 mx095rer Diabetes, 2004 gx342re Diabetes, 2011 hx342re Parent or Sibling Diabetes, 2004 ixa08rec Parent or Sibling Alzheimer's Disease, 2004 ixa09rec Ever Smoked Cigarettes, 1993 mx012rer Ever Smoked Cigarettes, 2004 ix012rer Ever Smoked Cigarettes, 2011 jx012rer Years Smoked, 1993 *mx012rer & mx014rer Years Smoked, 2004 *ix012rer & ix014rer Years Smoked, 2011 *jx012rer & jx014rer
Page 53 of 80
For peer review only - http://bmjopen.bmj.com/site/about/guidelines.xhtml
BMJ Open
123456789101112131415161718192021222324252627282930313233343536373839404142434445464748495051525354555657585960
on January 9, 2022 by guest. Protected by copyright.
http://bmjopen.bm
j.com/
BM
J Open: first published as 10.1136/bm
jopen-2016-011529 on 23 January 2017. Dow
nloaded from

For peer review only
Variable Description , Survey Year WLS variable code Packs/Day Smoked, 1993 *mx012rer & mx015rer Packs/Day Smoked, 2004 *ix012rer & ix015rer Packs/Day Smoked, 2011 *jx012rer & jx015rer Pack-Years Smoked, 1993 *mx012rer & mx014rer & mx015rer Pack-Years Smoked, 2004 *ix012rer & ix014rer & ix015rer Pack-Years Smoked, 2011 *jx012rer & jx014rer & jx015rer Ever Smoked Pipe, Cigars, or used Snuff or Chewing Tobacco Regularly, 2004 ixt01rer Body Mass Index, 1993 mx011rec Body Mass Index, 2004 ix011rec Body Mass Index, 2011 jx011rec Age Weighed Most, 2004 ixw02rer Age Weighed Most, 2011 jxw02rer Overweight, Underweight, or Right Weight, 2004 ixw05rer Overweight, Underweight, or Right Weight, 2011 jxw05rer Using Exercise to Lose or Maintain Weight, 2004 ixw08rer Using Exercise to Lose or Maintain Weight, 2011 jxw08rer Most Ever Weighed, 2004 ixw01rer Most Ever Weighed, 2011 jxw01rer Hours/Month Light Activity, Alone or with Others, 2004 ixe01rer Hours/Month Vigorous Activity, Alone or with Others, 2004 ixe02rer Hours/Month Light Activity Alone, 2004 iz165rer Hours/Month Light Activity Alone, 2011 jz165rer Hours/Month Light Activity with Others, 2004 iz168rer Hours/Month Light Activity with Others 2011 jz168rer Light Activity Alone 10 Years Ago, 2004 iz166rer Light Activity Alone 5 Years Ago, 2011 jz166rer Light Activity with Others 10 Years Ago, 2004 iz169rer Light Activity with Others 5 Years Ago, 2011 jz169rer Light Activity Alone when 35, 2004 iz167rer Light Activity with Others when 35, 2004 iz170rer Hours/Month Vigorous Activity Alone, 2004 iz171rer Hours/Month Vigorous Activity Alone, 2011 jz171rer Hours/Month Vigorous Activity with Others, 2004 iz174rer Hours/Month Vigorous Activity with Others, 2011 jz174rer Vigorous Activity Alone 10 Years Ago, 2004 iz172rer Vigorous Activity Alone 5 Years Ago, 2011 jz172rer Vigorous Activity with Others 10 Years Ago, 2004 iz175rer Vigorous Activity with Others 5 Years Ago, 2011 jz175rer Vigorous Activity Alone when 35, 2004 iz173rer Vigorous Activity with Others when 35, 2004 iz176rer Hours/Week Watch T.V., 2004 iz108rer Hours/Week Watch T.V., 2011 jz108rer How often Watched T.V. 10 Years Ago, 2004 iz109rer How often Watched T.V. when 35, 2004 iz110rer How often Watched T.V. 5 Years Ago, 2011 jz109rer Person in Family to Share Feelings and Concerns, 1993 mv053rer Person in Family to Share Feelings and Concerns, 2004 iv053rer Person in Family to Share Feelings and Concerns, 2011 jv053rer Friend Outside Family to Share Feelings and Concerns, 1993 mv054rer Friend Outside Family to Share Feelings and Concerns, 2004 iv054rer
Page 54 of 80
For peer review only - http://bmjopen.bmj.com/site/about/guidelines.xhtml
BMJ Open
123456789101112131415161718192021222324252627282930313233343536373839404142434445464748495051525354555657585960
on January 9, 2022 by guest. Protected by copyright.
http://bmjopen.bm
j.com/
BM
J Open: first published as 10.1136/bm
jopen-2016-011529 on 23 January 2017. Dow
nloaded from

For peer review only
Variable Description , Survey Year WLS variable code Friend Outside Family to Share Feelings and Concerns, 2011 jv054rer Trouble Sleeping in Past 6 Months, 1993 mx019rer Trouble Sleeping in Past 6 Months, 2004 ix019rer Days/Week Sleep Restlessly, 1993 mu020rer Days/Week Sleep Restlessly, 2004 iu020rer Days/Week Sleep Restlessly, 2011 ju020rer Hours of Sleep on a Weekday, 2011 jxsl11re Worry a Lot, 1993 mh029rer Worry a Lot, 2004 ih029rer Worry a Lot, 2011 jh029rer Feel Confident and Positive about Yourself, 1993 mn049rer Feel Confident and Positive about Yourself, 2004 in049rer Feel Confident and Positive about Yourself, 2011 jn049rer Created Lifestyle to Your Liking, 1993 mn017rer Created Lifestyle to Your Liking, 2004 in017rer Created Lifestyle to Your Liking, 2011 jn017rer Days/Week Feel Fearful, 1993 mu019rer Days/Week Feel Fearful, 2004 iu019rer Days/Week Feel Fearful, 2011 ju019rer Days/Week Feel Relaxed, 2004 iu047rer Days/Week Feel Relaxed, 2011 ju047rer Are Relaxed and Handle Stress Well, 1993 rh020re Summary Score Speilberger Anger Index, 2004 iuc34rec Summary Score Speilberger Anger Index, 2011 jua34rec Summary Score Hostility Index, 2004 iu026rec Summary Score Speilberger Anxiety Index, 2004 iua33rec Summary Score Speilberger Anxiety Index, 2011 jua33rec Summary Score Psychological Well-Being, 1993 rn014rei Summary Score Distress/Depression, 1993 mu001rec Summary Score Distress/Depression, 2004 iu001rec Summary Score Distress/Depression, 2011 ju001rec Days/Week Feel Depressed, 1993 mu013rer Days/Week Feel Depressed, 2004 iu013rer Days/Week Feel Depressed, 2011 ju013rer Ever Drank Alcohol, 1993 ru025re Ever Drank Alcohol, 2004 gu025re Ever Drank Alcohol, 2011 hu025re Days/Month Drink Alcohol, 1993 *ru025re & ru026re Days/Month Drink Alcohol, 2004 *gu025re & gu026re Days/Month Drink Alcohol, 2011 *hu025re & hu026re Drinks/Day on Days Drank Alcohol, 1993 *ru025re & ru027re Drinks/Day on Days Drank Alcohol, 2004 *gu025re & gu027re Drinks/Day on Days Drank Alcohol, 2011 *hu025re & hu027re Alcoholic Drinks/Month, 1993 *ru025re & ru028re Alcoholic Drinks/Month, 2004 *gu025re & gu028re Alcoholic Drinks/Month, 2011 *hu025re & hu028re Days/Month Drank 5+ Alcoholic Drinks/Day, 1993 *ru025re & ru029re Days/Month Drank 5+ Alcoholic Drinks/Day, 2004 *gu025re & gu029re Days/Month Drank 5+ Alcoholic Drinks/Day, 2011 *hu025re & hu029re Family Worries Distract from Work, 1993 my004rer Family Worries Distract from Work, 2004 iy004rer
Page 55 of 80
For peer review only - http://bmjopen.bmj.com/site/about/guidelines.xhtml
BMJ Open
123456789101112131415161718192021222324252627282930313233343536373839404142434445464748495051525354555657585960
on January 9, 2022 by guest. Protected by copyright.
http://bmjopen.bm
j.com/
BM
J Open: first published as 10.1136/bm
jopen-2016-011529 on 23 January 2017. Dow
nloaded from
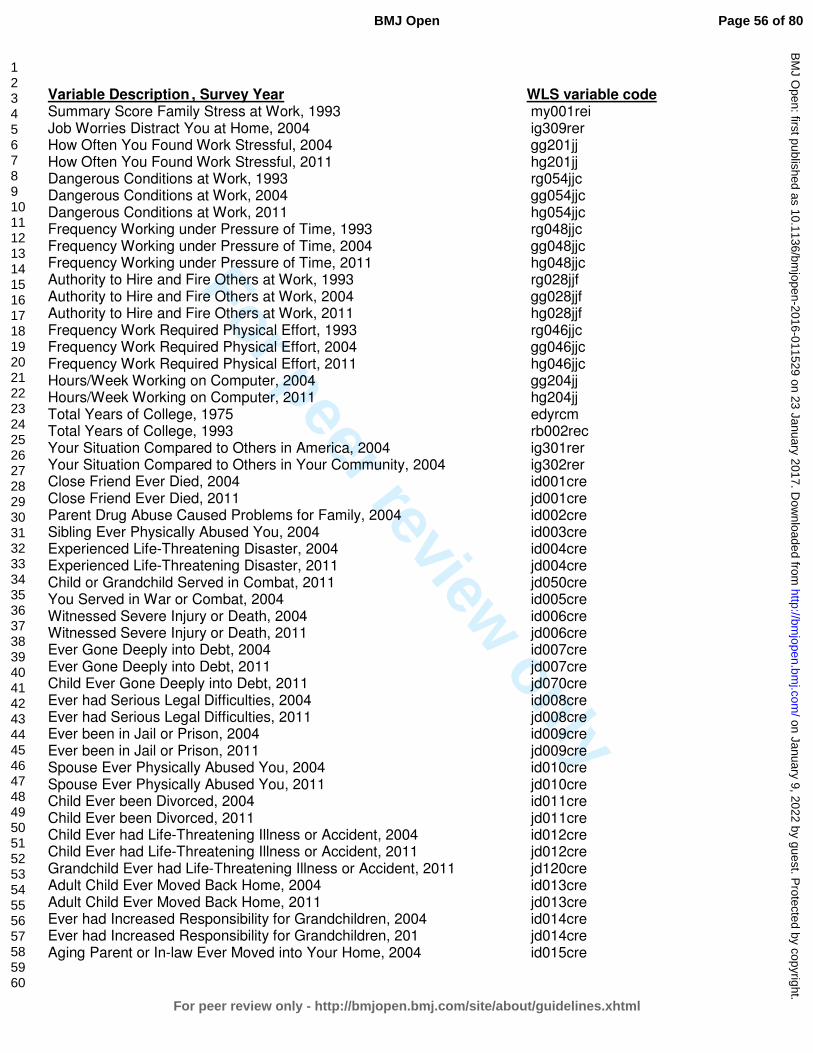
For peer review only
Variable Description , Survey Year WLS variable code Summary Score Family Stress at Work, 1993 my001rei Job Worries Distract You at Home, 2004 ig309rer How Often You Found Work Stressful, 2004 gg201jj How Often You Found Work Stressful, 2011 hg201jj Dangerous Conditions at Work, 1993 rg054jjc Dangerous Conditions at Work, 2004 gg054jjc Dangerous Conditions at Work, 2011 hg054jjc Frequency Working under Pressure of Time, 1993 rg048jjc Frequency Working under Pressure of Time, 2004 gg048jjc Frequency Working under Pressure of Time, 2011 hg048jjc Authority to Hire and Fire Others at Work, 1993 rg028jjf Authority to Hire and Fire Others at Work, 2004 gg028jjf Authority to Hire and Fire Others at Work, 2011 hg028jjf Frequency Work Required Physical Effort, 1993 rg046jjc Frequency Work Required Physical Effort, 2004 gg046jjc Frequency Work Required Physical Effort, 2011 hg046jjc Hours/Week Working on Computer, 2004 gg204jj Hours/Week Working on Computer, 2011 hg204jj Total Years of College, 1975 edyrcm Total Years of College, 1993 rb002rec Your Situation Compared to Others in America, 2004 ig301rer Your Situation Compared to Others in Your Community, 2004 ig302rer Close Friend Ever Died, 2004 id001cre Close Friend Ever Died, 2011 jd001cre Parent Drug Abuse Caused Problems for Family, 2004 id002cre Sibling Ever Physically Abused You, 2004 id003cre Experienced Life-Threatening Disaster, 2004 id004cre Experienced Life-Threatening Disaster, 2011 jd004cre Child or Grandchild Served in Combat, 2011 jd050cre You Served in War or Combat, 2004 id005cre Witnessed Severe Injury or Death, 2004 id006cre Witnessed Severe Injury or Death, 2011 jd006cre Ever Gone Deeply into Debt, 2004 id007cre Ever Gone Deeply into Debt, 2011 jd007cre Child Ever Gone Deeply into Debt, 2011 jd070cre Ever had Serious Legal Difficulties, 2004 id008cre Ever had Serious Legal Difficulties, 2011 jd008cre Ever been in Jail or Prison, 2004 id009cre Ever been in Jail or Prison, 2011 jd009cre Spouse Ever Physically Abused You, 2004 id010cre Spouse Ever Physically Abused You, 2011 jd010cre Child Ever been Divorced, 2004 id011cre Child Ever been Divorced, 2011 jd011cre Child Ever had Life-Threatening Illness or Accident, 2004 id012cre Child Ever had Life-Threatening Illness or Accident, 2011 jd012cre Grandchild Ever had Life-Threatening Illness or Accident, 2011 jd120cre Adult Child Ever Moved Back Home, 2004 id013cre Adult Child Ever Moved Back Home, 2011 jd013cre Ever had Increased Responsibility for Grandchildren, 2004 id014cre Ever had Increased Responsibility for Grandchildren, 201 jd014cre Aging Parent or In-law Ever Moved into Your Home, 2004 id015cre
Page 56 of 80
For peer review only - http://bmjopen.bmj.com/site/about/guidelines.xhtml
BMJ Open
123456789101112131415161718192021222324252627282930313233343536373839404142434445464748495051525354555657585960
on January 9, 2022 by guest. Protected by copyright.
http://bmjopen.bm
j.com/
BM
J Open: first published as 10.1136/bm
jopen-2016-011529 on 23 January 2017. Dow
nloaded from

For peer review only
Variable Description , Survey Year WLS variable code Aging Parent or In-law Ever Moved into Your Home, 2011 jd015cre Ever Placed Spouse, Parent, or In-law into Nursing Home, 2004 id016cre Ever Placed Spouse, Parent, or In-law into Nursing Home, 2011 jd016cre Ever Seriously Thought about Taking Your Own Life, 2004 id017cre Ever Seriously Thought about Taking Your Own Life, 2011 jd017cre When Stressed Turn to Work, 2004 id101rer When Stressed Turn to Work, 2011 jd101rer When Stressed Concentrate Your Efforts, 2004 id102rer When Stressed Concentrate Your Efforts, 2011 jd102rer When Stressed Pretend it's Not Real, 2004 id103rer When Stressed Pretend it's Not Real, 2011 jd103rer When Stressed Give up Trying to Deal, 2004 id104rer When Stressed Give up Trying to Deal, 2011 jd104rer When Stressed Say Things to let Negative Feelings Go, 2004 id107rer When Stressed Say Things to let Negative Feelings Go, 2011 jd107rer When Stressed Try to Make Situation Positive, 2004 id108rer When Stressed Try to Make Situation Positive, 2011 jd108rer When Stressed Criticize Yourself, 2004 id109rer When Stressed Criticize Yourself, 2011 jd109rer When Stressed Try to Think About it Less, 2004 id113rer When Stressed Try to Think About it Less, 2011 jd113rer When Stressed Express Negative Feelings, 2004 id115rer When Stressed Express Negative Feelings, 2011 jd115rer When Stressed Learn to Live with It, 2004 id116rer When Stressed Learn to Live with It, 2011 jd116rer When Stressed Think Hard about Steps to Take, 2004 id117rer When Stressed Think Hard about Steps to Take, 2011 jd117rer When Stressed Blame Yourself, 2004 id118rer When Stressed Blame Yourself, 2011 jd118rer Summary Score Extraversion, 1993 mh001rei Summary Score Extraversion, 2004 ih001rei Summary Score Extraversion, 2011 jh001rei Summary Score Openness, 1993 mh032rei Summary Score Openness, 2004 ih032rei Summary Score Openness, 2011 jh032rei Summary Score Neuroticism, 1993 mh025rei Summary Score Neuroticism, 2004 ih025rei Summary Score Neuroticism, 2011 jh025rei Summary Score Conscientiousness, 1993 mh017rei Summary Score Conscientiousness, 2004 ih017rei Summary Score Conscientiousness, 2011 jh017rei Summary Score Agreeableness, 1993 mh009rei Summary Score Agreeableness, 2004 ih009rei Summary Score Agreeableness, 2011 jh009rei Female-Specific Variables Age First Menstruated, 2004 in190rer Menstruated in Last 12 Months, 1993 mn119rer Age Last Menstruated, 1993 mn120rer Age Last Menstruated, 2004 in120rer Gone through Menopause, 1993 mn121rer
Page 57 of 80
For peer review only - http://bmjopen.bmj.com/site/about/guidelines.xhtml
BMJ Open
123456789101112131415161718192021222324252627282930313233343536373839404142434445464748495051525354555657585960
on January 9, 2022 by guest. Protected by copyright.
http://bmjopen.bm
j.com/
BM
J Open: first published as 10.1136/bm
jopen-2016-011529 on 23 January 2017. Dow
nloaded from
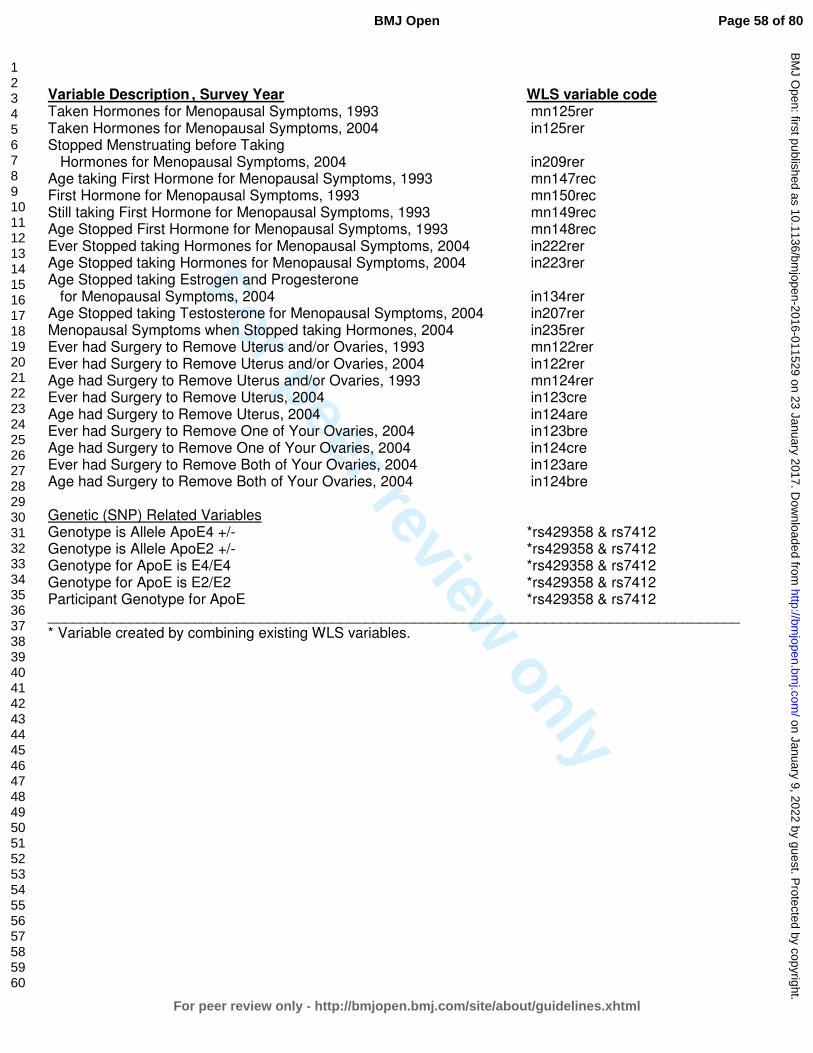
For peer review only
Variable Description , Survey Year WLS variable code Taken Hormones for Menopausal Symptoms, 1993 mn125rer Taken Hormones for Menopausal Symptoms, 2004 in125rer Stopped Menstruating before Taking Hormones for Menopausal Symptoms, 2004 in209rer Age taking First Hormone for Menopausal Symptoms, 1993 mn147rec First Hormone for Menopausal Symptoms, 1993 mn150rec Still taking First Hormone for Menopausal Symptoms, 1993 mn149rec Age Stopped First Hormone for Menopausal Symptoms, 1993 mn148rec Ever Stopped taking Hormones for Menopausal Symptoms, 2004 in222rer Age Stopped taking Hormones for Menopausal Symptoms, 2004 in223rer Age Stopped taking Estrogen and Progesterone for Menopausal Symptoms, 2004 in134rer Age Stopped taking Testosterone for Menopausal Symptoms, 2004 in207rer Menopausal Symptoms when Stopped taking Hormones, 2004 in235rer Ever had Surgery to Remove Uterus and/or Ovaries, 1993 mn122rer Ever had Surgery to Remove Uterus and/or Ovaries, 2004 in122rer Age had Surgery to Remove Uterus and/or Ovaries, 1993 mn124rer Ever had Surgery to Remove Uterus, 2004 in123cre Age had Surgery to Remove Uterus, 2004 in124are Ever had Surgery to Remove One of Your Ovaries, 2004 in123bre Age had Surgery to Remove One of Your Ovaries, 2004 in124cre Ever had Surgery to Remove Both of Your Ovaries, 2004 in123are Age had Surgery to Remove Both of Your Ovaries, 2004 in124bre Genetic (SNP) Related Variables Genotype is Allele ApoE4 +/- *rs429358 & rs7412 Genotype is Allele ApoE2 +/- *rs429358 & rs7412 Genotype for ApoE is E4/E4 *rs429358 & rs7412 Genotype for ApoE is E2/E2 *rs429358 & rs7412 Participant Genotype for ApoE *rs429358 & rs7412 _____________________________________________________________________________________ * Variable created by combining existing WLS variables.
Page 58 of 80
For peer review only - http://bmjopen.bmj.com/site/about/guidelines.xhtml
BMJ Open
123456789101112131415161718192021222324252627282930313233343536373839404142434445464748495051525354555657585960
on January 9, 2022 by guest. Protected by copyright.
http://bmjopen.bm
j.com/
BM
J Open: first published as 10.1136/bm
jopen-2016-011529 on 23 January 2017. Dow
nloaded from

For peer review only
Supplemental Information 3: Description of statistics showing gender as one of the top risk factors for MI among WLS participants.
All analyses identified gender as one of the best predictors of MI risk. Recursive partitioning
showed that among those who ever had a MI by 72 years old, with all participants combined
(males and females) the second highest risk factor for MI was gender, with prevalence among
males in the WLS cohort at 13.1% and among females at 4.9% (OR=2.94, 95% CI= 2.38-3.63;
tree not shown). Among those who experience d their MI between 65-72 years old, RP revealed
that the first risk for MI was gender, with prevalence among males at 5.9% and among females
at 2.5% (2.46, 1.84-3.29; tree not shown). In addition, RF selected gender as one of the
‘important’ MI risk factors for those who ever experienced a MI before 72 and as the most
‘important’ (top) risk for those having a MI between 65-72 years (not shown). Finally, both LR
and X2 analyses identified gender as a major risk factor for MI at any age (p-values <0.0001),
with males in the WLS cohort more likely to have had a MI than females by 72 (2.75, 2.34-3.23)
and between 65-72 (2.46, 1.84-3.29). Males and females were therefore analyzed separately
throughout this study.
Page 59 of 80
For peer review only - http://bmjopen.bmj.com/site/about/guidelines.xhtml
BMJ Open
123456789101112131415161718192021222324252627282930313233343536373839404142434445464748495051525354555657585960
on January 9, 2022 by guest. Protected by copyright.
http://bmjopen.bm
j.com/
BM
J Open: first published as 10.1136/bm
jopen-2016-011529 on 23 January 2017. Dow
nloaded from
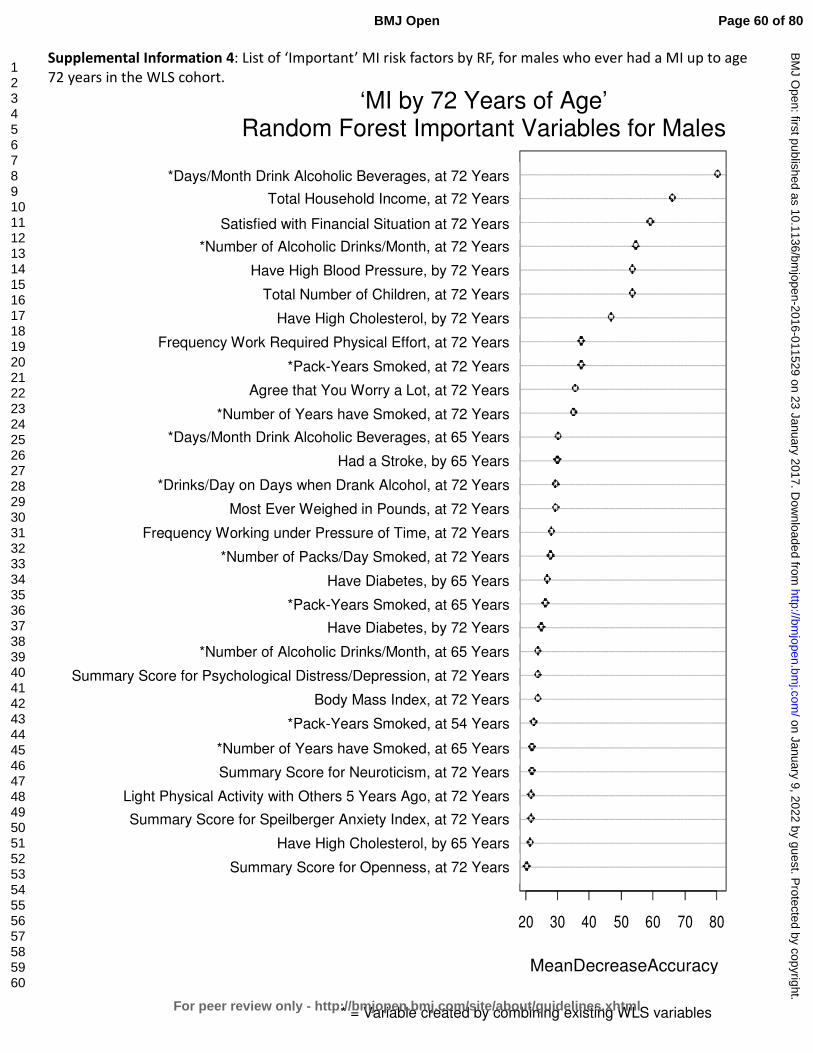
For peer review only
Supplemental Information 4: List of ‘Important’ MI risk factors by RF, for males who ever had a MI up to age 72 years in the WLS cohort.
openness2011g
highchol2004g
sumanxietyindex2011g
ltactothers5yrsago2011g
neuroticism2011g
smokyrsX2004g
smokpkyrs1993g
BMI2011g
sumdepressionindex2011g
alcoholdrinkstotalX2004g
diabetes2011g
smokpkyrs2004g
diabetes2004g
smokpkdayX2011g
worktimepressure2011g
mosteverweigh2011g
alcoholdrinksdayX2011g
stroke2004g
alcoholdaysX2004g
smokyrsX2011g
worryalot2011g
smokpkyrs2011g
workphyeffort2011g
highchol2011g
child2011g
highbp2011g
alcoholdrinkstotalX2011g
satfin2011g
THI2011g
alcoholdaysX2011g
20 30 40 50 60 70 80
MeanDecreaseAccuracy
‘MI by 72 Years of Age’ Random Forest Important Variables for Males
*Days/Month Drink Alcoholic Beverages, at 72 Years
Total Household Income, at 72 Years
Satisfied with Financial Situation at 72 Years
*Number of Alcoholic Drinks/Month, at 72 Years
Have High Blood Pressure, by 72 Years
Total Number of Children, at 72 Years
Have High Cholesterol, by 72 Years
Frequency Work Required Physical Effort, at 72 Years
*Pack-Years Smoked, at 72 Years
Agree that You Worry a Lot, at 72 Years
*Number of Years have Smoked, at 72 Years
*Days/Month Drink Alcoholic Beverages, at 65 Years
Had a Stroke, by 65 Years
*Drinks/Day on Days when Drank Alcohol, at 72 Years
Most Ever Weighed in Pounds, at 72 Years
Frequency Working under Pressure of Time, at 72 Years
*Number of Packs/Day Smoked, at 72 Years
Have Diabetes, by 65 Years
*Pack-Years Smoked, at 65 Years
Have Diabetes, by 72 Years
*Number of Alcoholic Drinks/Month, at 65 Years
Summary Score for Psychological Distress/Depression, at 72 Years
Body Mass Index, at 72 Years
*Pack-Years Smoked, at 54 Years
*Number of Years have Smoked, at 65 Years
Summary Score for Neuroticism, at 72 Years
Light Physical Activity with Others 5 Years Ago, at 72 Years
Summary Score for Speilberger Anxiety Index, at 72 Years
Have High Cholesterol, by 65 Years
Summary Score for Openness, at 72 Years
MeanDecreaseAccuracy
* = Variable created by combining existing WLS variables
Page 60 of 80
For peer review only - http://bmjopen.bmj.com/site/about/guidelines.xhtml
BMJ Open
123456789101112131415161718192021222324252627282930313233343536373839404142434445464748495051525354555657585960
on January 9, 2022 by guest. Protected by copyright.
http://bmjopen.bm
j.com/
BM
J Open: first published as 10.1136/bm
jopen-2016-011529 on 23 January 2017. Dow
nloaded from
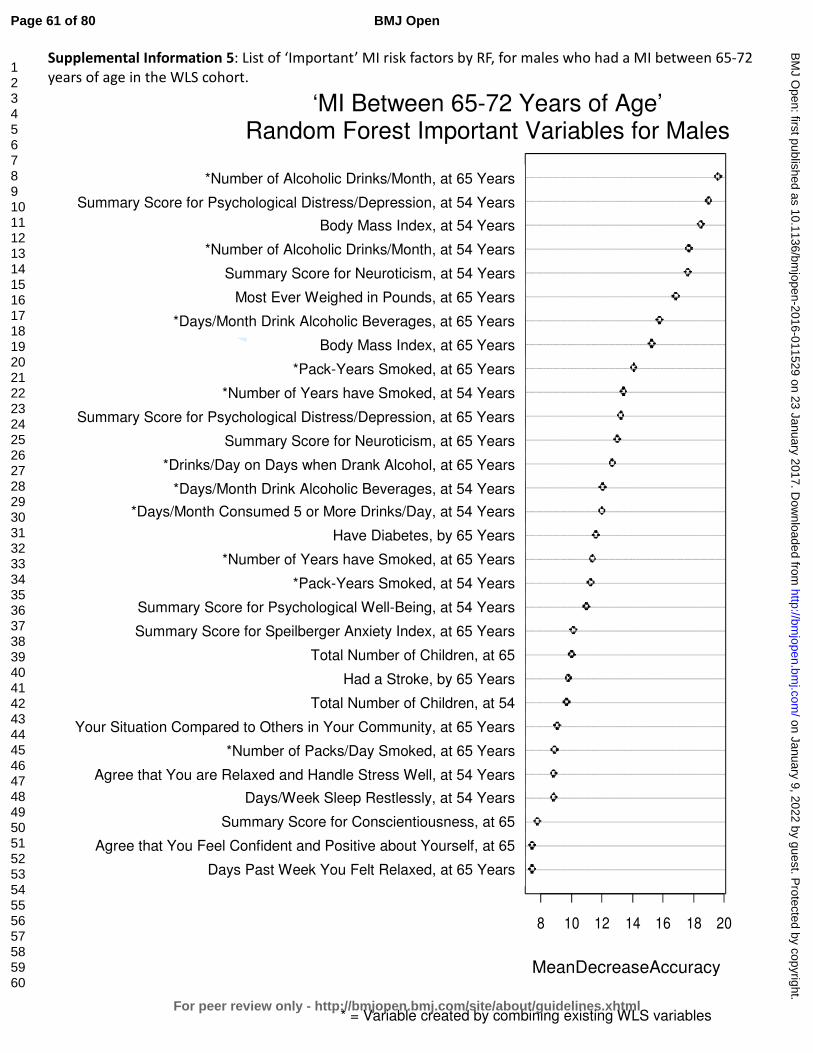
For peer review only
Supplemental Information 5: List of ‘Important’ MI risk factors by RF, for males who had a MI between 65-72 years of age in the WLS cohort.
pastweekrelaxed2004g
confident2004g
conscientiousness2004g
sleeprestlessly1993g
handlestresswell1993g
smokpkdayX2004g
comparecommunity2004g
child1993g
stroke2004g
child2004g
sumanxietyindex2004g
sumwellbeing1993g
smokpkyrs1993g
smokyrsX2004g
diabetes2004g
alcohol5ormoreX1993g
alcoholdaysX1993g
alcoholdrinksdayX2004g
neuroticism2004g
sumdepressionindex2004g
smokyrsX1993g
smokpkyrs2004g
BMI2004g
alcoholdaysX2004g
mosteverweigh2004g
neuroticism1993g
alcoholdrinkstotalX1993g
BMI1993g
sumdepressionindex1993g
alcoholdrinkstotalX2004g
8 10 12 14 16 18 20
MeanDecreaseAccuracy
‘MI Between 65-72 Years of Age’ Random Forest Important Variables for Males
*Number of Alcoholic Drinks/Month, at 65 Years
Summary Score for Psychological Distress/Depression, at 54 Years
Body Mass Index, at 54 Years
*Number of Alcoholic Drinks/Month, at 54 Years
Summary Score for Neuroticism, at 54 Years
Most Ever Weighed in Pounds, at 65 Years
*Days/Month Drink Alcoholic Beverages, at 65 Years
Body Mass Index, at 65 Years
*Pack-Years Smoked, at 65 Years
*Number of Years have Smoked, at 54 Years
Summary Score for Psychological Distress/Depression, at 65 Years
Summary Score for Neuroticism, at 65 Years
*Drinks/Day on Days when Drank Alcohol, at 65 Years
*Days/Month Drink Alcoholic Beverages, at 54 Years
*Days/Month Consumed 5 or More Drinks/Day, at 54 Years
Have Diabetes, by 65 Years
*Number of Years have Smoked, at 65 Years
*Pack-Years Smoked, at 54 Years
Summary Score for Psychological Well-Being, at 54 Years
Summary Score for Speilberger Anxiety Index, at 65 Years
Total Number of Children, at 65
Years Had a Stroke, by 65 Years
Total Number of Children, at 54
Years Your Situation Compared to Others in Your Community, at 65 Years
*Number of Packs/Day Smoked, at 65 Years
Agree that You are Relaxed and Handle Stress Well, at 54 Years
Days/Week Sleep Restlessly, at 54 Years
Summary Score for Conscientiousness, at 65
Years Agree that You Feel Confident and Positive about Yourself, at 65
Years Days Past Week You Felt Relaxed, at 65 Years
MeanDecreaseAccuracy
* = Variable created by combining existing WLS variables
Page 61 of 80
For peer review only - http://bmjopen.bmj.com/site/about/guidelines.xhtml
BMJ Open
123456789101112131415161718192021222324252627282930313233343536373839404142434445464748495051525354555657585960
on January 9, 2022 by guest. Protected by copyright.
http://bmjopen.bm
j.com/
BM
J Open: first published as 10.1136/bm
jopen-2016-011529 on 23 January 2017. Dow
nloaded from

For peer review only
Supplemental Information 6: List of ‘Important’ MI risk factors by RF, for females who ever had a MI up to age 72 years in the WLS cohort.
conscientiousness2011g
vgactalone5yrsago2011g
worktimepressure2011g
BMI1993g
agreeableness2011g
diabetes1993g
neuroticism2011g
highchol2011g
smokyrsX1993g
BMI2004g
removeuterusovariesage1993g
workphyeffort2011g
openness2011g
sumanxietyindex2011g
ageweighmost2011g
alcoholdaysX2004g
married2011g
sumdepressionindex2011g
likelifestyle2011g
diabetes2011g
mosteverweigh2011g
BMI2011g
child2011g
diabetes2004g
alcoholdrinkstotalX2011g
worryalot2011g
highbp2011g
THI2011g
satfin2011g
alcoholdaysX2011g
20 30 40 50 60
MeanDecreaseAccuracy
‘MI by 72 Years of Age’ Random Forest Important Variables for Females
*Days/Month Drink Alcoholic Beverages, at 72 Years
Satisfied with Financial Situation at 72 Years
Total Household Income, at 72 Years
Have High Blood Pressure, by 72 Years
Agree that You Worry a Lot, at 72 Years
*Number of Alcoholic Drinks/Month, at 72 Years
Have Diabetes, by 65 Years
Total Number of Children, at 72 Years
Body Mass Index, at 72 Years
Most Ever Weighed in Pounds, at 72 Years
Have Diabetes, by 72 Years
Agree that You Created Lifestyle to Your Liking, at 72 Years
Summary Score for Psychological Distress/Depression, at 72 Years
Not Married, at 72 Years
*Days/Month Drink Alcoholic Beverages, at 65 Years
Age when Weighed the Most, at 72 Years
Summary Score for Speilberger Anxiety Index, at 72 Years
Summary Score for Openness, at 72 Years
Frequency Work Required Physical Effort, at 72 Years
Age when had Surgery to Remove Uterus and/or Ovaries, at 54 Years
Body Mass Index, at 65 Years
*Number of Years have Smoked, at 54 Years
Have High Cholesterol, by 72 Years
Summary Score for Neuroticism, at 72 Years
Have Diabetes, by 54 Years
Summary Score for Agreeableness, at 72 Years
Body Mass Index, at 54 Years
Frequency Working under Pressure of Time, at 72 Years
Vigorous Physical Activity Alone 5 Years Ago, at 72 Years
Summary Score for Conscientiousness, at 72 Years
MeanDecreaseAccuracy
* = Variable created by combining existing WLS variables
Page 62 of 80
For peer review only - http://bmjopen.bmj.com/site/about/guidelines.xhtml
BMJ Open
123456789101112131415161718192021222324252627282930313233343536373839404142434445464748495051525354555657585960
on January 9, 2022 by guest. Protected by copyright.
http://bmjopen.bm
j.com/
BM
J Open: first published as 10.1136/bm
jopen-2016-011529 on 23 January 2017. Dow
nloaded from
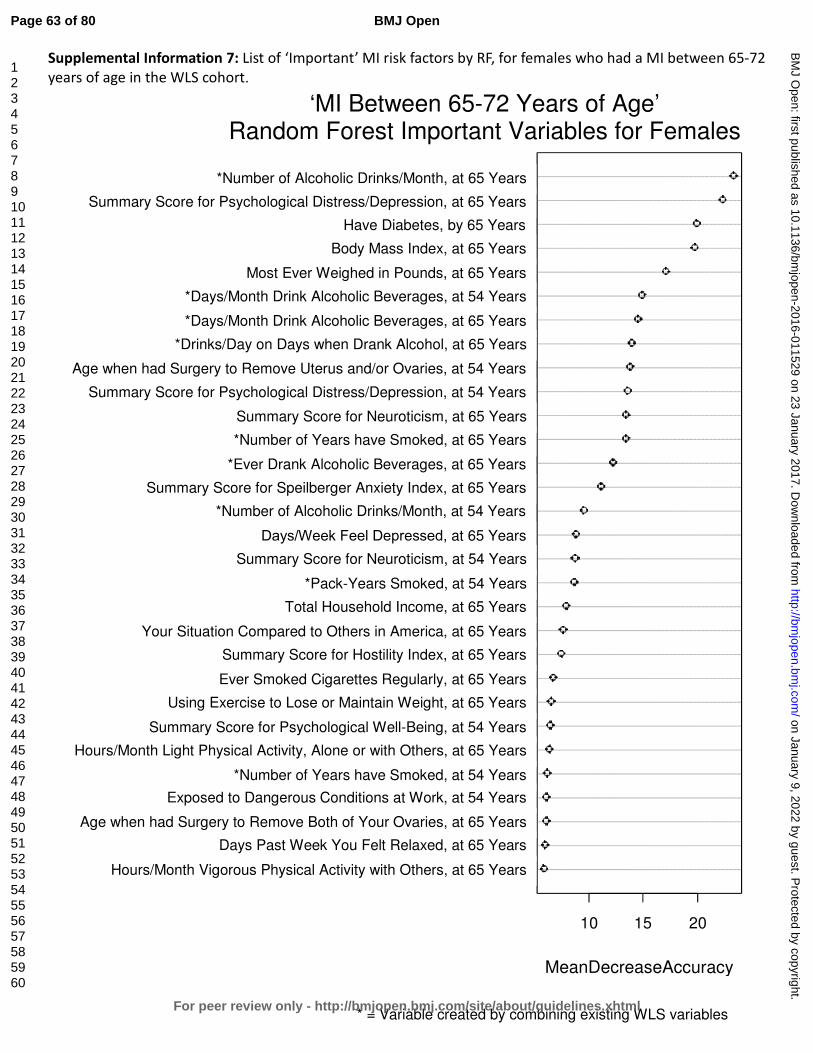
For peer review only
Supplemental Information 7: List of ‘Important’ MI risk factors by RF, for females who had a MI between 65-72 years of age in the WLS cohort.
vgactothers2004g
pastweekrelaxed2004g
removebothovariesage2004g
workdangercond1993g
smokyrsX1993g
ltactaloneothers2004g
sumwellbeing1993g
exerweight2004g
smokever2004g
sumhostilityindex2004g
compareAmerica2004g
THI2004g
smokpkyrs1993g
neuroticism1993g
depresseddays2004g
alcoholdrinkstotalX1993g
sumanxietyindex2004g
drinkalcohol2004g
smokyrsX2004g
neuroticism2004g
sumdepressionindex1993g
removeuterusovariesage1993g
alcoholdrinksdayX2004g
alcoholdaysX2004g
alcoholdaysX1993g
mosteverweigh2004g
BMI2004g
diabetes2004g
sumdepressionindex2004g
alcoholdrinkstotalX2004g
10 15 20
MeanDecreaseAccuracy
‘MI Between 65-72 Years of Age’ Random Forest Important Variables for Females
*Number of Alcoholic Drinks/Month, at 65 Years
Summary Score for Psychological Distress/Depression, at 65 Years
Have Diabetes, by 65 Years
Body Mass Index, at 65 Years
Most Ever Weighed in Pounds, at 65 Years
*Days/Month Drink Alcoholic Beverages, at 54 Years
*Days/Month Drink Alcoholic Beverages, at 65 Years
*Drinks/Day on Days when Drank Alcohol, at 65 Years
Age when had Surgery to Remove Uterus and/or Ovaries, at 54 Years
Summary Score for Psychological Distress/Depression, at 54 Years
Summary Score for Neuroticism, at 65 Years
*Number of Years have Smoked, at 65 Years
*Ever Drank Alcoholic Beverages, at 65 Years
Summary Score for Speilberger Anxiety Index, at 65 Years
*Number of Alcoholic Drinks/Month, at 54 Years
Days/Week Feel Depressed, at 65 Years
Summary Score for Neuroticism, at 54 Years
*Pack-Years Smoked, at 54 Years
Total Household Income, at 65 Years
Your Situation Compared to Others in America, at 65 Years
Summary Score for Hostility Index, at 65 Years
Ever Smoked Cigarettes Regularly, at 65 Years
Using Exercise to Lose or Maintain Weight, at 65 Years
Summary Score for Psychological Well-Being, at 54 Years
Hours/Month Light Physical Activity, Alone or with Others, at 65 Years
*Number of Years have Smoked, at 54 Years
Exposed to Dangerous Conditions at Work, at 54 Years
Age when had Surgery to Remove Both of Your Ovaries, at 65 Years
Days Past Week You Felt Relaxed, at 65 Years
Hours/Month Vigorous Physical Activity with Others, at 65 Years
MeanDecreaseAccuracy
* = Variable created by combining existing WLS variables
Page 63 of 80
For peer review only - http://bmjopen.bmj.com/site/about/guidelines.xhtml
BMJ Open
123456789101112131415161718192021222324252627282930313233343536373839404142434445464748495051525354555657585960
on January 9, 2022 by guest. Protected by copyright.
http://bmjopen.bm
j.com/
BM
J Open: first published as 10.1136/bm
jopen-2016-011529 on 23 January 2017. Dow
nloaded from
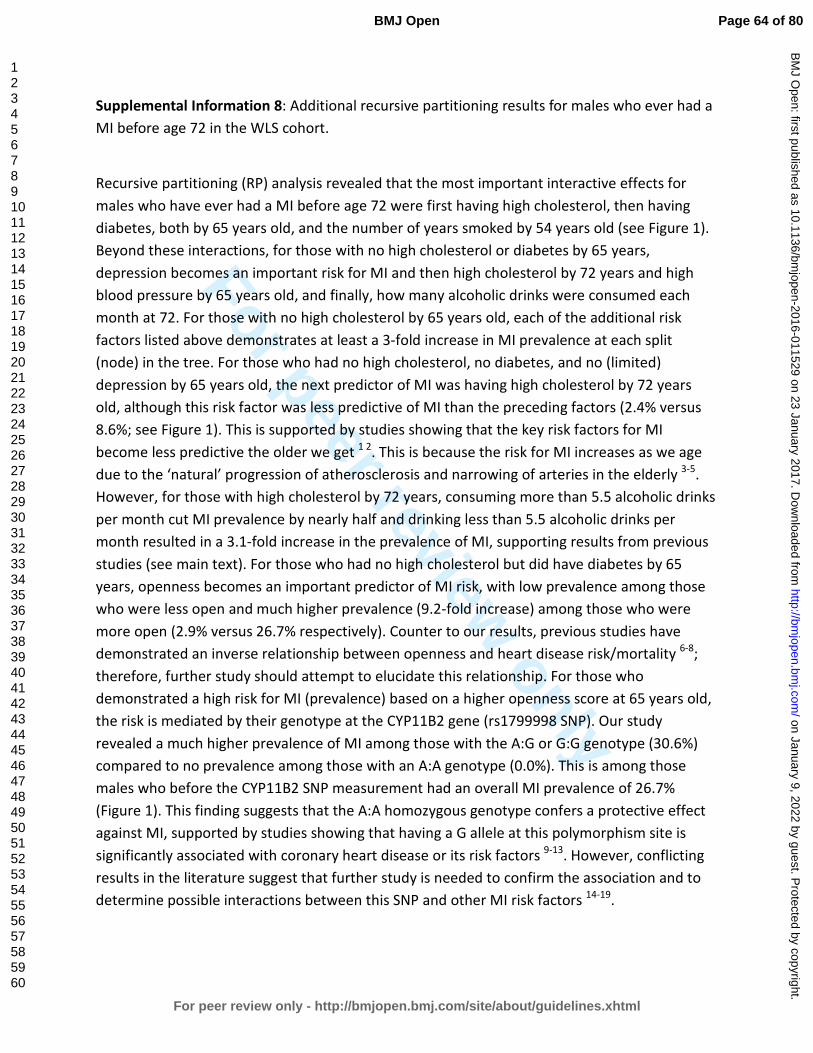
For peer review only
Supplemental Information 8: Additional recursive partitioning results for males who ever had a
MI before age 72 in the WLS cohort.
Recursive partitioning (RP) analysis revealed that the most important interactive effects for
males who have ever had a MI before age 72 were first having high cholesterol, then having
diabetes, both by 65 years old, and the number of years smoked by 54 years old (see Figure 1).
Beyond these interactions, for those with no high cholesterol or diabetes by 65 years,
depression becomes an important risk for MI and then high cholesterol by 72 years and high
blood pressure by 65 years old, and finally, how many alcoholic drinks were consumed each
month at 72. For those with no high cholesterol by 65 years old, each of the additional risk
factors listed above demonstrates at least a 3-fold increase in MI prevalence at each split
(node) in the tree. For those who had no high cholesterol, no diabetes, and no (limited)
depression by 65 years old, the next predictor of MI was having high cholesterol by 72 years
old, although this risk factor was less predictive of MI than the preceding factors (2.4% versus
8.6%; see Figure 1). This is supported by studies showing that the key risk factors for MI
become less predictive the older we get 1 2. This is because the risk for MI increases as we age
due to the ‘natural’ progression of atherosclerosis and narrowing of arteries in the elderly 3-5.
However, for those with high cholesterol by 72 years, consuming more than 5.5 alcoholic drinks
per month cut MI prevalence by nearly half and drinking less than 5.5 alcoholic drinks per
month resulted in a 3.1-fold increase in the prevalence of MI, supporting results from previous
studies (see main text). For those who had no high cholesterol but did have diabetes by 65
years, openness becomes an important predictor of MI risk, with low prevalence among those
who were less open and much higher prevalence (9.2-fold increase) among those who were
more open (2.9% versus 26.7% respectively). Counter to our results, previous studies have
demonstrated an inverse relationship between openness and heart disease risk/mortality 6-8;
therefore, further study should attempt to elucidate this relationship. For those who
demonstrated a high risk for MI (prevalence) based on a higher openness score at 65 years old,
the risk is mediated by their genotype at the CYP11B2 gene (rs1799998 SNP). Our study
revealed a much higher prevalence of MI among those with the A:G or G:G genotype (30.6%)
compared to no prevalence among those with an A:A genotype (0.0%). This is among those
males who before the CYP11B2 SNP measurement had an overall MI prevalence of 26.7%
(Figure 1). This finding suggests that the A:A homozygous genotype confers a protective effect
against MI, supported by studies showing that having a G allele at this polymorphism site is
significantly associated with coronary heart disease or its risk factors 9-13. However, conflicting
results in the literature suggest that further study is needed to confirm the association and to
determine possible interactions between this SNP and other MI risk factors 14-19.
Page 64 of 80
For peer review only - http://bmjopen.bmj.com/site/about/guidelines.xhtml
BMJ Open
123456789101112131415161718192021222324252627282930313233343536373839404142434445464748495051525354555657585960
on January 9, 2022 by guest. Protected by copyright.
http://bmjopen.bm
j.com/
BM
J Open: first published as 10.1136/bm
jopen-2016-011529 on 23 January 2017. Dow
nloaded from

For peer review only
In addition to the interactions listed above, for those who do have high cholesterol by 65 years,
the number of years smoking cigarettes by 54 years, days/month drinking alcohol, dangerous
conditions at work, and genotype at the FADS2 gene polymorphism become important
interactive predictors of MI risk (see Figure 1). Smoking fewer than 22.5 years by 54 years old
interacts with having diabetes by 65 years, a familial history of MI, family worries at work, the
most ever weighed, number of years of college completed, total household income, and
genotype at the IL6 gene polymorphism site all interact to contribute to MI risk among
individuals in this group. Among those with high cholesterol by 65 years old who have smoked
more than 22.5 years, regular moderate alcohol consumption provides an insulating effect
against MI, with a 3.8-fold increase in the prevalence of MI among those who drank less than
24.5 days/month (40.9% versus 10.7%; Figure 1). This relationship is mediated by experiencing
dangerous conditions in the workplace (at 65 years), with a 2.6-fold increase among those who
work under dangerous conditions and half of the men in this group experiencing MI at some
point in their lives (50% versus 19.4%). This supports the assertion that this factor may
represent a ‘new’ MI risk, as stated in the main text. For those experiencing no dangerous
conditions at work, prevalence increases by having a C:G or GG genotype at the FADS2 gene
polymorphism (rs174575), resulting in a 6.6-fold increase in MI prevalence over those with the
homozygous C:C genotype (46.7% versus 7.1%). Although one study was identified in which this
polymorphism was analyzed against coronary artery disease risk, no association was found 20.
Further study is needed to determine if this gene locus is indeed associated with MI risk, as
supported by this study. Among those who had high cholesterol by 65 years, smoked less than
22.5 years by 54 years, and did not have diabetes by 65 years, whether one had a familial
history of MI (before age 55) was the next interactive factor leading to MI risk, with a 3.1-fold
increase among those with a familial history of heart disease (31.5% versus 10.3%; Figure 1).
For those with no familial history, the most ever weighed becomes an important MI risk with a
3.4-fold increase in prevalence among those who had weighed more than 226.5 lb. at their
greatest (17.8% versus 5.3%), which is supported by association studies outlining the risk of MI
based on obesity 21-24. For those who weighed more than 226.5 lb. at their greatest, total
household income of less than $130,918 at 65 years old leads to an MI prevalence of 22.6%
compared to 0.0% among those with a total household income greater than $130,918 (Figure
1). This suggests that making a higher salary confers a protective effect against MI risk.
However, previous studies looking at socioeconomic factors such as income, education, and
occupation have found mixed results 25-27, with lower income as an MI risk factor in developed
countries versus the opposite effect in less developed countries 28. Furthermore, income seems
to interact with education, such that those with more education and lower income have a
higher risk for MI, while those with more education and higher income are protected from MI 28. In the U.S., lower income has been strongly associated with all-cause mortality and the
disparity has gotten worse over time, specifically for men 29, and is stronger in younger men
Page 65 of 80
For peer review only - http://bmjopen.bmj.com/site/about/guidelines.xhtml
BMJ Open
123456789101112131415161718192021222324252627282930313233343536373839404142434445464748495051525354555657585960
on January 9, 2022 by guest. Protected by copyright.
http://bmjopen.bm
j.com/
BM
J Open: first published as 10.1136/bm
jopen-2016-011529 on 23 January 2017. Dow
nloaded from
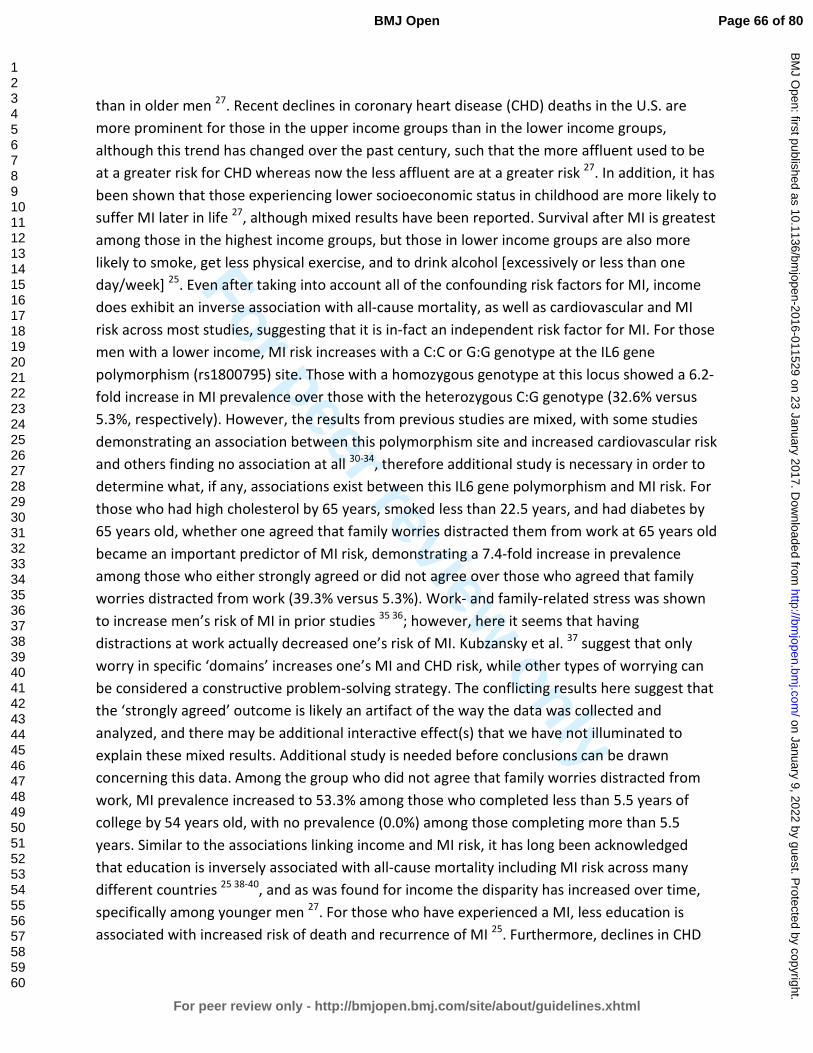
For peer review only
than in older men 27. Recent declines in coronary heart disease (CHD) deaths in the U.S. are
more prominent for those in the upper income groups than in the lower income groups,
although this trend has changed over the past century, such that the more affluent used to be
at a greater risk for CHD whereas now the less affluent are at a greater risk 27. In addition, it has
been shown that those experiencing lower socioeconomic status in childhood are more likely to
suffer MI later in life 27, although mixed results have been reported. Survival after MI is greatest
among those in the highest income groups, but those in lower income groups are also more
likely to smoke, get less physical exercise, and to drink alcohol [excessively or less than one
day/week] 25. Even after taking into account all of the confounding risk factors for MI, income
does exhibit an inverse association with all-cause mortality, as well as cardiovascular and MI
risk across most studies, suggesting that it is in-fact an independent risk factor for MI. For those
men with a lower income, MI risk increases with a C:C or G:G genotype at the IL6 gene
polymorphism (rs1800795) site. Those with a homozygous genotype at this locus showed a 6.2-
fold increase in MI prevalence over those with the heterozygous C:G genotype (32.6% versus
5.3%, respectively). However, the results from previous studies are mixed, with some studies
demonstrating an association between this polymorphism site and increased cardiovascular risk
and others finding no association at all 30-34, therefore additional study is necessary in order to
determine what, if any, associations exist between this IL6 gene polymorphism and MI risk. For
those who had high cholesterol by 65 years, smoked less than 22.5 years, and had diabetes by
65 years old, whether one agreed that family worries distracted them from work at 65 years old
became an important predictor of MI risk, demonstrating a 7.4-fold increase in prevalence
among those who either strongly agreed or did not agree over those who agreed that family
worries distracted from work (39.3% versus 5.3%). Work- and family-related stress was shown
to increase men’s risk of MI in prior studies 35 36; however, here it seems that having
distractions at work actually decreased one’s risk of MI. Kubzansky et al. 37 suggest that only
worry in specific ‘domains’ increases one’s MI and CHD risk, while other types of worrying can
be considered a constructive problem-solving strategy. The conflicting results here suggest that
the ‘strongly agreed’ outcome is likely an artifact of the way the data was collected and
analyzed, and there may be additional interactive effect(s) that we have not illuminated to
explain these mixed results. Additional study is needed before conclusions can be drawn
concerning this data. Among the group who did not agree that family worries distracted from
work, MI prevalence increased to 53.3% among those who completed less than 5.5 years of
college by 54 years old, with no prevalence (0.0%) among those completing more than 5.5
years. Similar to the associations linking income and MI risk, it has long been acknowledged
that education is inversely associated with all-cause mortality including MI risk across many
different countries 25 38-40, and as was found for income the disparity has increased over time,
specifically among younger men 27. For those who have experienced a MI, less education is
associated with increased risk of death and recurrence of MI 25. Furthermore, declines in CHD
Page 66 of 80
For peer review only - http://bmjopen.bmj.com/site/about/guidelines.xhtml
BMJ Open
123456789101112131415161718192021222324252627282930313233343536373839404142434445464748495051525354555657585960
on January 9, 2022 by guest. Protected by copyright.
http://bmjopen.bm
j.com/
BM
J Open: first published as 10.1136/bm
jopen-2016-011529 on 23 January 2017. Dow
nloaded from
For peer review only
and MI deaths over the past few decades are least evident among those in the lowest SES
groups, although again as was found for income these associations are strongest in high-income
countries 41 42, and can even be reversed in less developed countries 28. As stated above, one
study showed that education interacts with income such that more education only provides a
protective effect against MI if a person also has a higher income 28. Nevertheless, education has
been found to be an independent predictor of MI risk, regardless of other known risk factors 43.
Surprisingly, in this study years of college education represented the largest gap in prevalence
among those men who ‘ever’ experienced a MI before age 72 (53.3% versus 0.0%; Figure 1).
Despite having high cholesterol and diabetes by 65 years old, 2 of 4 conventional risk factors for
MI, men having completed more than 5.5 years of college were essentially protected from MI in
the WLS cohort.
References:
1. Anand SS, Islam S, Rosengren A, et al. Risk factors for myocardial infarction in women and men: insights from the INTERHEART study. European Heart Journal 2008;29(7):932-40.
2. Yusuf S, Hawken S, Ounpuu S, et al. Effect of potentially modifiable risk factors associated with myocardial infarction in 52 countries (the INTERHEART study): case-control study. Lancet 2004;364(9438):937-52.
3. Wang JC, Bennett M. Aging and Atherosclerosis: Mechanisms, Functional Consequences, and Potential Therapeutics for Cellular Senescence. Circulation Research 2012;111(2):245-59.
4. O'Leary DH, Polak JF, Kronmal RA, et al. Carotid-Artery Intima and Media Thickness as a Risk Factor for Myocardial Infarction and Stroke in Older Adults. New England Journal of Medicine 1999;340(1):14-22.
5. Bots ML, Hoes AW, Koudstaal PJ, et al. Common Carotid Intima-Media Thickness and Risk of Stroke and Myocardial Infarction: The Rotterdam Study. Circulation 1997;96(5):1432-37.
6. Lee HB, Offidani E, Ziegelstein RC, et al. Five-Factor Model Personality Traits as Predictors of Incident Coronary Heart Disease in the Community: A 10.5-Year Cohort Study Based on the Baltimore Epidemiologic Catchment Area Follow-Up Study. Psychosomatics 2014;55(4):352-61.
7. Taylor MD, Whiteman MC, Fowkes GR, et al. Five Factor Model personality traits and all-cause mortality in the Edinburgh Artery Study cohort. Psychosom Med 2009;71(6):631-41.
8. Jonassaint CR, Boyle SH, Williams RB, et al. Facets of openness predict mortality in patients with cardiac disease. Psychosom Med 2007;69(4):319-22.
9. Jia EZ, Xu ZX, Guo CY, et al. Renin-angiotensin-aldosterone system gene polymorphisms and coronary artery disease: detection of gene-gene and gene-environment interactions. Cell Physiol Biochem 2012;29(3-4):443-52.
10. Oki K, Yamane K, Satoh K, et al. Aldosterone synthase (CYP11B2) C-344T polymorphism affects the association of age-related changes of the serum C-reactive protein. Hypertens Res 2010;33(4):326-30.
11. Kumar NN, Benjafield AV, Lin RCY, et al. Haplotype analysis of aldosterone synthase gene (CYP11B2) polymorphisms shows association with essential hypertension. Journal of Hypertension 2003;21(7).
Page 67 of 80
For peer review only - http://bmjopen.bmj.com/site/about/guidelines.xhtml
BMJ Open
123456789101112131415161718192021222324252627282930313233343536373839404142434445464748495051525354555657585960
on January 9, 2022 by guest. Protected by copyright.
http://bmjopen.bm
j.com/
BM
J Open: first published as 10.1136/bm
jopen-2016-011529 on 23 January 2017. Dow
nloaded from

For peer review only
12. Tsukada K, Ishimitsu T, Teranishi M, et al. Positive association of CYP11B2 gene polymorphism with genetic predisposition to essential hypertension. J Hum Hypertens 2002;16(11):789-93.
13. Tamaki S, Iwai N, Tsujita Y, et al. Genetic Polymorphism of CYP11B2 Gene and Hypertension in Japanese. Hypertension 1999;33(1):266-70.
14. Borzyszkowska J, Stanislawska-Sachadyn A, Wirtwein M, et al. Angiotensin converting enzyme gene polymorphism is associated with severity of coronary artery disease in men with high total cholesterol levels. J Appl Genet 2012;53(2):175-82.
15. Mishra A, Srivastava A, Mittal T, et al. Impact of renin-angiotensin-aldosterone system gene polymorphisms on left ventricular dysfunction in coronary artery disease patients. Dis Markers 2012;32(1):33-41.
16. Sookoian S, Gianotti TF, Gonzalez CD, et al. Association of the C-344T aldosterone synthase gene variant with essential hypertension: a meta-analysis. J Hypertens 2007;25(1):5-13.
17. Davies E, Kenyon CJ. CYP11B2 polymorphisms and cardiovascular risk factors. Journal of Hypertension 2003;21(7).
18. Patel S, Steeds R, Channer K, et al. Analysis of promoter region polymorphism in the aldosterone synthase gene (CYP11B2) as a risk factor for myocardial infarction. American Journal of Hypertension 2000;13(2):134-39.
19. Hautanen A, Toivanen P, Mänttäri M, et al. Joint Effects of an Aldosterone Synthase (CYP11B2) Gene Polymorphism and Classic Risk Factors on Risk of Myocardial Infarction. Circulation 1999;100(22):2213-18.
20. Kwak JH, Paik JK, Kim OY, et al. FADS gene polymorphisms in Koreans: association with omega6 polyunsaturated fatty acids in serum phospholipids, lipid peroxides, and coronary artery disease. Atherosclerosis 2011;214(1):94-100.
21. Thomsen M, Nordestgaard BG. Myocardial infarction and ischemic heart disease in overweight and obesity with and without metabolic syndrome. JAMA Intern Med 2014;174(1):15-22.
22. Després J-P. Body Fat Distribution and Risk of Cardiovascular Disease: An Update. Circulation 2012;126(10):1301-13.
23. Logue J, Murray HM, Welsh P, et al. Obesity is associated with fatal coronary heart disease independently of traditional risk factors and deprivation. Heart 2011;97(7):564-8.
24. Yusuf S, Hawken S, Ounpuu S, et al. Obesity and the risk of myocardial infarction in 27,000 participants from 52 countries: a case-control study. Lancet 2005;366(9497):1640-9.
25. Coady S, Johnson N, Hakes J, et al. Individual education, area income, and mortality and recurrence of myocardial infarction in a Medicare cohort: the National Longitudinal Mortality Study. BMC Public Health 2014;14(1):1-11.
26. Ismail J, Jafar TH, Jafary FH, et al. Risk factors for non-fatal myocardial infarction in young South Asian adults. Heart 2004;90(3):259-63.
27. Kaplan GA, Keil JE. Socioeconomic factors and cardiovascular disease: a review of the literature. Circulation 1993;88(4 Pt 1):1973-98.
28. Piegas LS, Avezum Á, Pereira JCR, et al. Risk factors for myocardial infarction in Brazil. American Heart Journal 2003;146(2):331-38.
29. Lynch JW, Kaplan GA, Cohen RD, et al. Do Cardiovascular Risk Factors Explain the Relation between Socioeconomic Status, Risk of All-Cause Mortality, Cardiovascular Mortality, and Acute Myocardial Infarction? American Journal of Epidemiology 1996;144(10):934-42.
30. Gigante B, Bennet AM, Leander K, et al. The interaction between coagulation factor 2 receptor and interleukin 6 haplotypes increases the risk of myocardial infarction in men. PLoS One 2010;5(6):e11300.
31. Bis JC, Heckbert SR, Smith NL, et al. Variation in inflammation-related genes and risk of incident nonfatal myocardial infarction or ischemic stroke. Atherosclerosis 2008;198(1):166-73.
Page 68 of 80
For peer review only - http://bmjopen.bmj.com/site/about/guidelines.xhtml
BMJ Open
123456789101112131415161718192021222324252627282930313233343536373839404142434445464748495051525354555657585960
on January 9, 2022 by guest. Protected by copyright.
http://bmjopen.bm
j.com/
BM
J Open: first published as 10.1136/bm
jopen-2016-011529 on 23 January 2017. Dow
nloaded from
For peer review only
32. Liu Y, Berthier-Schaad Y, Fallin MD, et al. IL-6 Haplotypes, Inflammation, and Risk for Cardiovascular Disease in a Multiethnic Dialysis Cohort. Journal of the American Society of Nephrology 2006;17(3):863-70.
33. Rosner S, Ridker P, Zee RL, et al. Interaction between inflammation-related gene polymorphisms and cigarette smoking on the risk of myocardial infarction in the Physician’s Health Study. Human Genetics 2005;118(2):287-94.
34. Bennet AM, Prince JA, Fei G-Z, et al. Interleukin-6 serum levels and genotypes influence the risk for myocardial infarction. Atherosclerosis 2003;171(2):359-67.
35. Gafarov VV, Gromova EA, Gafarova AV, et al. [Myocardial infarction and stress at work place and in the family: 10-year risk of development in an open population of 2564 year old men (epidemiological study in a framework of the WHO program MONICA-PSYCHOSOCIAL)]. Kardiologiia 2011;51(3):10-6.
36. Rosengren A, Hawken S, Ôunpuu S, et al. Association of psychosocial risk factors with risk of acute myocardial infarction in 11 119 cases and 13 648 controls from 52 countries (the INTERHEART study): case-control study. The Lancet 2004;364(9438):953-62.
37. Kubzansky LD, Kawachi I, Spiro A, et al. Is Worrying Bad for Your Heart?: A Prospective Study of Worry and Coronary Heart Disease in the Normative Aging Study. Circulation 1997;95(4):818-24.
38. Igland J, Vollset SE, Nygård OK, et al. Educational inequalities in acute myocardial infarction incidence in Norway: a nationwide cohort study. PLoS One 2014;9(9):e106898.
39. Guo J, Li W, Wang Y, et al. Influence of socioeconomic status on acute myocardial infarction in the Chinese population: the INTERHEART China study. Chin Med J (Engl) 2012;125(23):4214-20.
40. Hu B, Li W, Wang X, et al. Marital Status, Education, and Risk of Acute Myocardial Infarction in Mainland China: The INTER-HEART Study. Journal of Epidemiology 2012;22(2):123-29.
41. Manrique-Garcia E, Sidorchuk A, Hallqvist J, et al. Socioeconomic position and incidence of acute myocardial infarction: a meta-analysis. Journal of Epidemiology and Community Health 2011;65(4):301-09.
42. Rosengren A, Subramanian SV, Islam S, et al. Education and risk for acute myocardial infarction in 52 high, middle and low-income countries: INTERHEART case-control study. Heart. England, 2009:2014-22.
43. Qureshi AI, Suri MF, Saad M, et al. Educational attainment and risk of stroke and myocardial infarction. Med Sci Monit. Poland, 2003:CR466-73.
Page 69 of 80
For peer review only - http://bmjopen.bmj.com/site/about/guidelines.xhtml
BMJ Open
123456789101112131415161718192021222324252627282930313233343536373839404142434445464748495051525354555657585960
on January 9, 2022 by guest. Protected by copyright.
http://bmjopen.bm
j.com/
BM
J Open: first published as 10.1136/bm
jopen-2016-011529 on 23 January 2017. Dow
nloaded from
For peer review only
Supplemental Information 9: Additional recursive partitioning results for females who ever had
a MI before age 72 in the WLS cohort.
Using recursive partitioning (RP), this study found that the most important interactive effects
for risk factors in females who ever had a MI by 72 years old was first having diabetes by 65
years old (see Figure 3). For those who did not have diabetes by 65, the next most important
factor was having high blood pressure by 65, with a 2.7-fold increase in prevalence among
those women who did have high blood pressure by 65 (7.6% versus 2.8%), followed by how
often one engaged in light physical activity with others when about 67 years old (asked at 72
years) for those who did not have high blood pressure by 65. For those who engaged in light
physical activity with others often, prevalence decreased from 2.8% to 0.2%, with MI risk nearly
disappearing among this group in the WLS cohort. However, for those who engaged in light
physical activity with others rarely or never when about 67, prevalence increased from 2.8% to
3.7%, demonstrating an 18.5-fold increase over those who engaged in light activity often
(Figure 3). This result supports what is already understood about the effect of physical inactivity
on MI risk (see main text). For those who did have high blood pressure by 65 years old, the
number of years one had smoked by 54 and whether one blames themselves when stressed (at
72 years old). For women, diabetes, high blood pressure, and smoking all act to increase one’s
MI risk, which (as in men) represent 3 of the 4 key or conventional risk factors for MI 1-6.
Smoking more than 24.5 years by 54 years old increased the prevalence of MI by 3.3-fold within
this group (16.6% versus 5.1%; see Figure 3). Additionally, those who blamed themselves a
medium amount or a lot when stressed showed a 4.4-fold increase in MI prevalence over those
who blamed themselves only a little bit or not at all (11.8% versus 2.7%; Figure 3). This factor
represents (a facet of) one’s coping strategy and it has been shown in prior studies that an
unhealthy coping strategy, such as blaming oneself when under stress can lead to an increase in
overall ill-health, as well as increased risk for MI 7 8. Blaming oneself when under stress has also
been linked to depression 9 10, which is associated with increased MI risk, and one’s general
state of mind after MI can affect post-MI risk for recurrent MI or death 11-16. The largest gap in
prevalence was seen between those who reported engaging in light physical activity with others
often versus those who reported rarely or never; although, this risk factor was less predictive of
MI than the other above listed factors. Furthermore, only women diagnosed with diabetes by
65 years old had a MI prevalence higher than that demonstrated among men in the WLS
cohort. And even considering interactions among all other risk factors in the RP tree, no other
group of women who ever had a MI by 72 years old (nodes in the tree) reached the prevalence
achieved by those who had diabetes by 65 years old. This suggests that diabetes truly is the
single most important risk factor determining whether a woman had a MI in the WLS, and
points to this as a very important predictor for whether a woman will have a MI in her lifetime.
Page 70 of 80
For peer review only - http://bmjopen.bmj.com/site/about/guidelines.xhtml
BMJ Open
123456789101112131415161718192021222324252627282930313233343536373839404142434445464748495051525354555657585960
on January 9, 2022 by guest. Protected by copyright.
http://bmjopen.bm
j.com/
BM
J Open: first published as 10.1136/bm
jopen-2016-011529 on 23 January 2017. Dow
nloaded from

For peer review only
References:
1. González-Pacheco H, Vargas-Barron J, Vallejo M, et al. Prevalence of conventional risk factors and lipid profiles in patients with acute coronary syndrome and significant coronary disease. Ther Clin Risk Manag 2014;10:815-23.
2. Stone NJ, Robinson JG, Lichtenstein AH, et al. 2013 ACC/AHA Guideline on the Treatment of Blood Cholesterol to Reduce Atherosclerotic Cardiovascular Risk in Adults: A Report of the American College of Cardiology/American Heart Association Task Force on Practice Guidelines. Circulation 2014;129(25 suppl 2):S1-S45.
3. Langsted A, Freiberg JJ, Tybjaerg-Hansen A, et al. Nonfasting cholesterol and triglycerides and association with risk of myocardial infarction and total mortality: the Copenhagen City Heart Study with 31 years of follow-up. J Intern Med 2011;270(1):65-75.
4. Yusuf S, Hawken S, Ounpuu S, et al. Effect of potentially modifiable risk factors associated with myocardial infarction in 52 countries (the INTERHEART study): case-control study. Lancet 2004;364(9438):937-52.
5. Khot UN, Khot MB, Bajzer CT, et al. Prevalence of conventional risk factors in patients with coronary heart disease. Jama 2003;290(7):898-904.
6. Magnus P, Beaglehole R. The real contribution of the major risk factors to the coronary epidemics: time to end the "only-50%" myth. Arch Intern Med 2001;161(22):2657-60.
7. Roohafza H, Talaei M, Pourmoghaddas Z, et al. Association of social support and coping strategies with acute coronary syndrome: A case–control study. Journal of Cardiology 2012;59(2):154-59.
8. Penley J, Tomaka J, Wiebe J. The Association of Coping to Physical and Psychological Health Outcomes: A Meta-Analytic Review. Journal of Behavioral Medicine 2002;25(6):551-603.
9. Garnefski N, Kraaij V, Spinhoven P. Negative life events, cognitive emotion regulation and emotional problems. Personality and Individual Differences 2001;30(8):1311-27.
10. Anderson CA, Miller RS, Riger AL, et al. Behavioral and characterological attributional styles as predictors of depression and loneliness: review, refinement, and test. J Pers Soc Psychol 1994;66(3):549-58.
11. Bennett KK, Howarter AD, Clark JM. Self-blame attributions, control appraisals and distress among cardiac rehabilitation patients. Psychol Health 2013;28(6):637-52.
12. Arnold SV, Smolderen KG, Buchanan DM, et al. Perceived stress in myocardial infarction: long-term mortality and health status outcomes. J Am Coll Cardiol 2012;60(18):1756-63.
13. Garnefski N, Kraaij V, Schroevers MJ, et al. Post-traumatic growth after a myocardial infarction: a matter of personality, psychological health, or cognitive coping? J Clin Psychol Med Settings 2008;15(4):270-7.
14. Frasure-Smith N, Lesperance F. Depression and other psychological risks following myocardial infarction. Arch Gen Psychiatry. United States, 2003:627-36.
15. Welin C, Lappas G, Wilhelmsen L. Independent importance of psychosocial factors for prognosis after myocardial infarction. J Intern Med. England, 2000:629-39.
16. Affleck G, Tennen H, Croog S, et al. Causal attribution, perceived benefits, and morbidity after a heart attack: an 8-year study. J Consult Clin Psychol 1987;55(1):29-35.
Page 71 of 80
For peer review only - http://bmjopen.bmj.com/site/about/guidelines.xhtml
BMJ Open
123456789101112131415161718192021222324252627282930313233343536373839404142434445464748495051525354555657585960
on January 9, 2022 by guest. Protected by copyright.
http://bmjopen.bm
j.com/
BM
J Open: first published as 10.1136/bm
jopen-2016-011529 on 23 January 2017. Dow
nloaded from
For peer review only
Supplemental Information 10: Additional recursive partitioning results for females who had a
MI between 65-72 years of age in the WLS cohort.
Using recursive partitioning (RP), this study found that the most important interactive effects
for risk factors in females who had a MI between 65-72 years of age was first having diabetes
by 65 years old (see Figure 4), with a 3.9-fold increase in MI prevalence among those with
diabetes by 65 years (7.8% versus 2.0%), again suggesting that this is the most important
predictor for MI risk in women. For those who did have diabetes by 65, the next most
important factor was their summary score for agreeableness at 65 years, and then whether
they had menstruated in the last 12 months at 54 years old. Those women who had an
agreeableness score < 32.5 at 65 had a 10.9% MI prevalence, while those whose agreeableness
score was ≥ 32.5 at 65 years reported no MIs (0.0% prevalence; Figure 4), which is supported by
previous studies in which agreeableness was shown to have an inverse relationship with CHD
risk 1 2. Among those women whose agreeableness score was <32.5 at 65 years old, MI
prevalence increased further for those who had not menstruated in the last 12 months at 54 to
14.0%, while those who had menstruated in the last 12 months at 54 saw prevalence once
again drop to 0.0% (Figure 4). Therefore even for those women who were diagnosed with
diabetes by 65, the top MI risk for women in the WLS cohort, and who reported a lower
agreeableness score at 65, still having their menstrual cycle at 53 years old seems to have
provided a protective effect against MI. Further research is needed to confirm this finding, but
prior research on hormonal imbalance due to menopause and MI risk in women lends support 3-10. Among those women who did not have diabetes by 65 years old, the factors that interacted
to affect MI risk were IQ, genotype for the Inhibin Beta B gene, and whether her work required
physical effort at 54 years old. If a woman had an IQ < 112.5 then her risk was 4.0-fold higher
than if her IQ was ≥ 112.5, although prevalence was relatively low among both of these groups
(2.4% versus 0.6%; Figure 4). Prior studies have shown that IQ relates to CVD, CHD, and all-
cause mortality, however there are mixed results in the literature suggesting the association is
linked with socioeconomic status in adulthood and other known risk factors 11-15. For those with
a higher IQ (≥ 112.5), having a G:A or G:G genotype for the Inhibin Beta B gene polymorphism
(rs11902591 SNP) resulted in an increased MI prevalence of 4.7% compared to no prevalence
(0.0%) among those with the A:A genotype at this polymorphism site. This suggests that the A:A
genotype confers a protective effect against MI risk, or at least that the G allele may leave
someone at risk. However, there are no prior studies linking MI risk to the Inhibin Beta B gene,
therefore further investigation is necessary. For those women carrying the G allele at the
Inhibin Beta B polymorphism site, whether her work required physical effort at 54 years
mediated the (above) proposed effect (Figure 4). Prevalence among those women whose work
required physical effort frequently was 25%, while those whose work required physical effort
always, sometimes, rarely or never reported no MIs (0.0% prevalence). Although previous
Page 72 of 80
For peer review only - http://bmjopen.bmj.com/site/about/guidelines.xhtml
BMJ Open
123456789101112131415161718192021222324252627282930313233343536373839404142434445464748495051525354555657585960
on January 9, 2022 by guest. Protected by copyright.
http://bmjopen.bm
j.com/
BM
J Open: first published as 10.1136/bm
jopen-2016-011529 on 23 January 2017. Dow
nloaded from

For peer review only
research has supported an association between physical activity and MI risk, this result may be
an artifact of the way the data was collected (ie. survey) and how participants chose to answer
the question. Sedentary behavior has been shown to increase one’s risk of all-cause mortality,
including CVD and CHD mortality and incidence, specifically when one is sedentary in their
occupation as well as at home 16-20. However, it has been suggested that physical activity in the
workplace does not have the same effect as physical leisure activity when it comes to MI risk,
and may in fact increase one’s risk of MI if the occupational activity is highly strenuous or
repetitive 21-25; therefore, further study is warranted.
Among those women who did not have diabetes but had a lower IQ (< 112.5), one’s summary
score for extraversion at 54 years, how many hours/month she engaged in light physical
activities alone at 65, how many alcoholic drinks she consumed per month at 65, body mass
index at 65, genotype for the A2M gene polymorphism, how often she worked under the
pressure of time at 54, and the age at which she last menstruated (reported at 65 years old)
become important interactive predictors of MI risk (see Figure 4). Each of the aforementioned
factors interacted with its preceding factor to either increase a woman’s MI risk, or drop it
down to zero (or nearly zero), suggesting that each of these factors confers some kind of
protective effect against MI risk. For women whose summary score for extraversion at 54 years
was ≥ 17.5, prevalence was 2.8%, while for those whose summary score for extraversion was <
17.5, prevalence was 0.0%. Although our study demonstrated a positive relationship between
extraversion and MI risk, results produced by previous studies suggest a negative association 26,
therefore more study is needed. Among those women who demonstrated a higher score for
extraversion, MI prevalence increased to 3.0% among those who engaged in light physical
activities alone ≥ 11 hours/month at 65, a 7.5-fold increase over those who engaged in light
physical activities alone < 11 hours/month at 65 (0.4% prevalence). However, it is widely agreed
that more physical leisure activity reduces one’s MI risk, and runs counter to the results
produced by this study’s analysis of women who ever experienced a MI by 72 (see Figure 3) in
which those women who often engaged in light physical activities with other when ~ 67 years
old (asked at 72) showed a reduced risk of MI compared to those who engaged in these
activities rarely or never. Therefore we suggest that there may be an effect of women feeling
they participated in activities ‘alone’ versus ‘with others’ during this time period in their lives,
as it has been shown that a woman’s MI risk is increased when she feels she lacks a strong
social support or a strong social network 27 28, but this remains an anomaly amongst our results.
For women who drank < 20.5 alcoholic drinks/month at 65 years, MI prevalence was increased
to 3.6%, while dropping to 0.0% among those who drank ≥ 20.5 alcoholic drinks/month at 65,
once again supporting that regular, moderate alcohol consumption helps protect against MI
risk. A body mass index of ≥ 22.5 at 65 years interacted to increase MI prevalence among
women to 4.3%, while a body mass index < 22.5 at 65 years resulted in a prevalence of 0.0%
(Figure 4). Body mass index interacted with a woman’s genotype for the A2M gene
Page 73 of 80
For peer review only - http://bmjopen.bmj.com/site/about/guidelines.xhtml
BMJ Open
123456789101112131415161718192021222324252627282930313233343536373839404142434445464748495051525354555657585960
on January 9, 2022 by guest. Protected by copyright.
http://bmjopen.bm
j.com/
BM
J Open: first published as 10.1136/bm
jopen-2016-011529 on 23 January 2017. Dow
nloaded from

For peer review only
polymorphism (rs669 SNP) site, such that those with a G:A or G:G genotype experienced an
increase in MI prevalence to 5.9%, an 8.4-fold increase over those with the A:A genotype (0.7%
prevalence). However, there are no prior studies linking MI risk to the A2M gene, therefore
further study concerning this association is warranted. One’s genotype at the A2M gene
polymorphism interacted with how often a woman worked under the pressure of time at 54
years old, such that those who did always, sometimes, rarely, or never showed a MI prevalence
of 9.4%, while those who worked under the pressure of time frequently at 54 years
experienced no MIs (0.0% prevalence; Figure 4). Working under the pressure of time has not
specifically been associated with MI risk in prior studies; however, other types of job stress
have been linked to increased MI risk in prior studies 29-33. Unfortunately, the results from the
current study are unclear about whether the identified association is positive or negative, and
again may be an artifact of the way the data was collected and how participants chose to
answer the question; therefore, additional study is necessary. Finally, working under the
pressure of time interacted with the age at which a woman last menstruated, such that those
who had last menstruated at < 50.5 years (reported at 65 years old) showed a MI prevalence of
13.8%, while those who last menstruated at ≥ 50.5 years of age had no MIs (0.0%) by 72 years
old. This result is supported by previous studies (concerning hormonal imbalance, as described
in main text) and by other results in this study, for example, whether a woman had not
menstruated in the last 12 months at 54 years old (14% prevalence; see above). This finding
lends support to the assertion that a woman’s MI risk increases inversely to the age at which
she stops menstruating, at which time her hormonal levels become out of balance. It seems
that for women, the state of her hormonal balance in her younger years (< 65) becomes a
stronger risk factor for MI as she ages and affects who experiences a MI in their later years
(between 65-72 years old). Each of the risk factors listed above interacted to either increase a
woman’s risk of MI or drop it down to zero, suggesting that these are critical (interactive)
factors for MI risk among women who experienced a MI between 65-72 years old in the WLS
cohort. Even among those women who appeared in the ‘riskier’ group for each factor listed, the
next factor could interact to drop MI prevalence down to 0.0% (or close to zero) for these
women (Figure 4).
References:
1. Sutin AR, Scuteri A, Lakatta EG, et al. Trait antagonism and the progression of arterial thickening: women with antagonistic traits have similar carotid arterial thickness as men. Hypertension. United States, 2010:617-22.
2. Costa PT, Stone SV, McCrae RR, et al. Hostility, Agreeableness-Antagonism, and Coronary Heart Disease. Holistic Medicine 1987;2(3):161-67.
Page 74 of 80
For peer review only - http://bmjopen.bmj.com/site/about/guidelines.xhtml
BMJ Open
123456789101112131415161718192021222324252627282930313233343536373839404142434445464748495051525354555657585960
on January 9, 2022 by guest. Protected by copyright.
http://bmjopen.bm
j.com/
BM
J Open: first published as 10.1136/bm
jopen-2016-011529 on 23 January 2017. Dow
nloaded from
For peer review only
3. Parker WH, Feskanich D, Broder MS, et al. Long-term mortality associated with oophorectomy compared with ovarian conservation in the nurses' health study. Obstet Gynecol. United States, 2013:709-16.
4. Wellons M, Ouyang P, Schreiner PJ, et al. Early menopause predicts future coronary heart disease and stroke: the Multi-Ethnic Study of Atherosclerosis. Menopause 2012;19(10):1081-7.
5. Ingelsson E, Lundholm C, Johansson AL, et al. Hysterectomy and risk of cardiovascular disease: a population-based cohort study. Eur Heart J. England, 2011:745-50.
6. Parker WH, Broder MS, Chang E, et al. Ovarian conservation at the time of hysterectomy and long-term health outcomes in the nurses' health study. Obstet Gynecol. United States, 2009:1027-37.
7. Lobo RA. Surgical menopause and cardiovascular risks. Menopause. United States, 2007:562-6. 8. Stampfer MJ, Colditz GA, Willett WC. Menopause and Heart Disease. Annals of the New York
Academy of Sciences 1990;592(1):193-203. 9. Colditz GA, Willett WC, Stampfer MJ, et al. Menopause and the risk of coronary heart disease in
women. N Engl J Med 1987;316(18):1105-10. 10. Rosenberg L, Hennekens CH, Rosner B, et al. Early menopause and the risk of myocardial
infarction. Am J Obstet Gynecol. United States, 1981:47-51. 11. Calvin CM, Deary IJ, Fenton C, et al. Intelligence in youth and all-cause-mortality: systematic
review with meta-analysis. International Journal of Epidemiology 2011;40(3):626-44. 12. Batty GD, Shipley MJ, Mortensen LH, et al. IQ in late adolescence/early adulthood, risk factors in
middle age and later all-cause mortality in men: the Vietnam Experience Study. Journal of Epidemiology and Community Health 2008;62(6):522-31.
13. Batty GD, Deary IJ, Gottfredson LS. Premorbid (early life) IQ and Later Mortality Risk: Systematic Review. Annals of Epidemiology 2007;17(4):278-88.
14. Hart CL, Taylor MD, Smith G, et al. Childhood IQ and all-cause mortality before and after age 65: Prospective observational study linking the Scottish Mental Survey 1932 and the Midspan studies. British Journal of Health Psychology 2005;10(2):153-65.
15. Hart CL, Taylor MD, Davey Smith G, et al. Childhood IQ, social class, deprivation, and their relationships with mortality and morbidity risk in later life: prospective observational study linking the Scottish Mental Survey 1932 and the Midspan studies. Psychosom Med 2003;65(5):877-83.
16. Biswas A, Oh PI, Faulkner GE, et al. Sedentary time and its association with risk for disease incidence, mortality, and hospitalization in adults: a systematic review and meta-analysis. Ann Intern Med 2015;162(2):123-32.
17. Mozumdar A, Liguori G, DuBose K. Occupational physical activity and risk of coronary heart disease among active and non-active working-women of North Dakota: a Go Red North Dakota Study. Anthropol Anz 2012;69(2):201-19.
18. Berlin JA, Colditz GA. A META-ANALYSIS OF PHYSICAL ACTIVITY IN THE PREVENTION OF CORONARY HEART DISEASE. American Journal of Epidemiology 1990;132(4):612-28.
19. Salonen JT, Slater JS, Tuomilehto J, et al. Leisure time and occupational physical activity: risk of death from ischemic heart disease. Am J Epidemiol 1988;127(1):87-94.
20. Salonen JT, Puska P, Tuomilehto J. Physical activity and risk of myocardial infarction, cerebral stroke and death: a longitudinal study in Eastern Finland. Am J Epidemiol 1982;115(4):526-37.
21. Holtermann A, Marott JL, Gyntelberg F, et al. Occupational and leisure time physical activity: risk of all-cause mortality and myocardial infarction in the Copenhagen City Heart Study. A prospective cohort study. BMJ Open 2012;2(1).
Page 75 of 80
For peer review only - http://bmjopen.bmj.com/site/about/guidelines.xhtml
BMJ Open
123456789101112131415161718192021222324252627282930313233343536373839404142434445464748495051525354555657585960
on January 9, 2022 by guest. Protected by copyright.
http://bmjopen.bm
j.com/
BM
J Open: first published as 10.1136/bm
jopen-2016-011529 on 23 January 2017. Dow
nloaded from
For peer review only
22. Sofi F, Capalbo A, Marcucci R, et al. Leisure time but not occupational physical activity significantly affects cardiovascular risk factors in an adult population. Eur J Clin Invest. England, 2007:947-53.
23. Fransson E, De Faire U, Ahlbom A, et al. The risk of acute myocardial infarction: interactions of types of physical activity. Epidemiology. United States, 2004:573-82.
24. Mittleman MA, Maclure M, Tofler GH, et al. Triggering of Acute Myocardial Infarction by Heavy Physical Exertion -- Protection against Triggering by Regular Exertion. New England Journal of Medicine 1993;329(23):1677-83.
25. Gyntelberg F, Lauridsen L, Schubell K. Physical fitness and risk of myocardial infarction in Copenhagen males aged 40-59: A five- and seven-year follow-up study. Scandinavian Journal of Work, Environment & Health 1980;6(3):170-78.
26. Andre-Petersson L, Schlyter M, Engstrom G, et al. Behavior in a stressful situation, personality factors, and disease severity in patients with acute myocardial infarction: baseline findings from the prospective cohort study SECAMI (the Secondary Prevention and Compliance following Acute Myocardial Infarction study). BMC Cardiovasc Disord 2011;11:45.
27. Welin C, Lappas G, Wilhelmsen L. Independent importance of psychosocial factors for prognosis after myocardial infarction. J Intern Med. England, 2000:629-39.
28. Brezinka V, Kittel F. Psychosocial factors of coronary heart disease in women: a review. Soc Sci Med 1996;42(10):1351-65.
29. Moller J, Theorell T, de Faire U, et al. Work related stressful life events and the risk of myocardial infarction. Case-control and case-crossover analyses within the Stockholm heart epidemiology programme (SHEEP). J Epidemiol Community Health. England, 2005:23-30.
30. Liu Y, Tanaka H. Overtime work, insufficient sleep, and risk of non-fatal acute myocardial infarction in Japanese men. Occupational and Environmental Medicine 2002;59(7):447-51.
31. Yoshimasu K. Relation of type A behavior pattern and job-related psychosocial factors to nonfatal myocardial infarction: a case-control study of Japanese male workers and women. Psychosom Med 2001;63(5):797-804.
32. Welin C, Rosengren A, Wedel H, et al. Myocardial infarction in relation to work, family and life events. Cardiovascular Risk Factors 1995;5(1):30-38.
33. Karasek RA, Theorell T, Schwartz JE, et al. Job characteristics in relation to the prevalence of myocardial infarction in the US Health Examination Survey (HES) and the Health and Nutrition Examination Survey (HANES). American Journal of Public Health 1988;78(8):910-18.
Page 76 of 80
For peer review only - http://bmjopen.bmj.com/site/about/guidelines.xhtml
BMJ Open
123456789101112131415161718192021222324252627282930313233343536373839404142434445464748495051525354555657585960
on January 9, 2022 by guest. Protected by copyright.
http://bmjopen.bm
j.com/
BM
J Open: first published as 10.1136/bm
jopen-2016-011529 on 23 January 2017. Dow
nloaded from

For peer review only
Page 77 of 80
For peer review only - http://bmjopen.bmj.com/site/about/guidelines.xhtml
BMJ Open
123456789101112131415161718192021222324252627282930313233343536373839404142434445464748495051525354555657585960
on January 9, 2022 by guest. Protected by copyright. http://bmjopen.bmj.com/ BMJ Open: first published as 10.1136/bmjopen-2016-011529 on 23 January 2017. Downloaded from
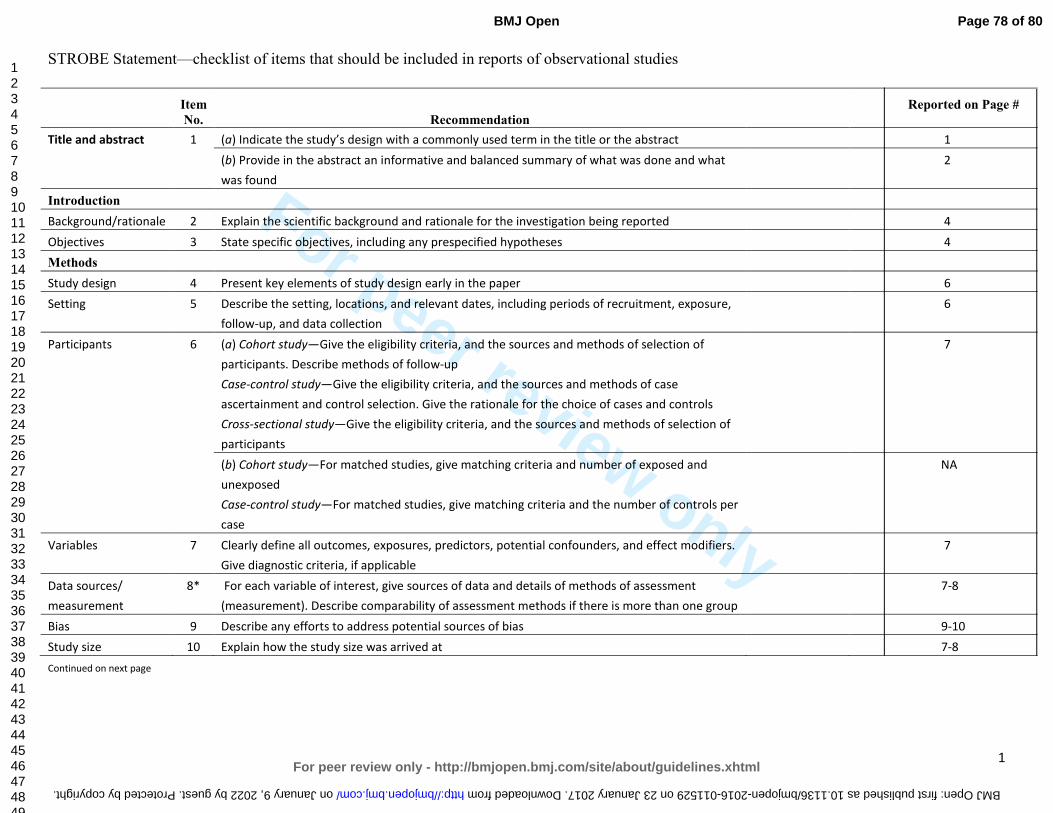
For peer review only
1
STROBE Statement—checklist of items that should be included in reports of observational studies
Item
No. Recommendation
Reported on Page #
Title and abstract 1 (a) Indicate the study’s design with a commonly used term in the title or the abstract 1
(b) Provide in the abstract an informative and balanced summary of what was done and what
was found
2
Introduction
Background/rationale 2 Explain the scientific background and rationale for the investigation being reported 4
Objectives 3 State specific objectives, including any prespecified hypotheses 4
Methods
Study design 4 Present key elements of study design early in the paper 6
Setting 5 Describe the setting, locations, and relevant dates, including periods of recruitment, exposure,
follow-up, and data collection
6
Participants 6 (a) Cohort study—Give the eligibility criteria, and the sources and methods of selection of
participants. Describe methods of follow-up
Case-control study—Give the eligibility criteria, and the sources and methods of case
ascertainment and control selection. Give the rationale for the choice of cases and controls
Cross-sectional study—Give the eligibility criteria, and the sources and methods of selection of
participants
7
(b) Cohort study—For matched studies, give matching criteria and number of exposed and
unexposed
Case-control study—For matched studies, give matching criteria and the number of controls per
case
NA
Variables 7 Clearly define all outcomes, exposures, predictors, potential confounders, and effect modifiers.
Give diagnostic criteria, if applicable
7
Data sources/
measurement
8* For each variable of interest, give sources of data and details of methods of assessment
(measurement). Describe comparability of assessment methods if there is more than one group
7-8
Bias 9 Describe any efforts to address potential sources of bias 9-10
Study size 10 Explain how the study size was arrived at 7-8
Continued on next page
Page 78 of 80
For peer review only - http://bmjopen.bmj.com/site/about/guidelines.xhtml
BMJ Open
123456789101112131415161718192021222324252627282930313233343536373839404142434445464748495051525354555657585960
on January 9, 2022 by guest. Protected by copyright. http://bmjopen.bmj.com/ BMJ Open: first published as 10.1136/bmjopen-2016-011529 on 23 January 2017. Downloaded from
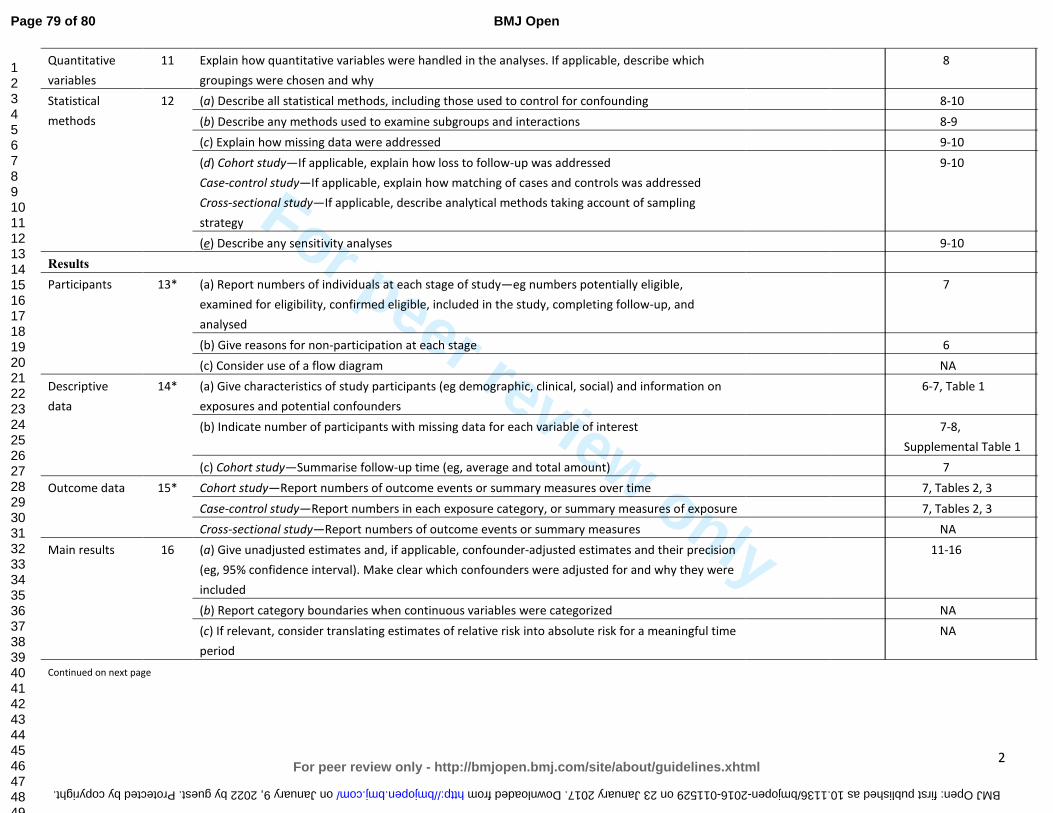
For peer review only
2
Quantitative
variables
11 Explain how quantitative variables were handled in the analyses. If applicable, describe which
groupings were chosen and why
8
Statistical
methods
12 (a) Describe all statistical methods, including those used to control for confounding 8-10
(b) Describe any methods used to examine subgroups and interactions 8-9
(c) Explain how missing data were addressed 9-10
(d) Cohort study—If applicable, explain how loss to follow-up was addressed
Case-control study—If applicable, explain how matching of cases and controls was addressed
Cross-sectional study—If applicable, describe analytical methods taking account of sampling
strategy
9-10
(e) Describe any sensitivity analyses 9-10
Results
Participants 13* (a) Report numbers of individuals at each stage of study—eg numbers potentially eligible,
examined for eligibility, confirmed eligible, included in the study, completing follow-up, and
analysed
7
(b) Give reasons for non-participation at each stage 6
(c) Consider use of a flow diagram NA
Descriptive
data
14* (a) Give characteristics of study participants (eg demographic, clinical, social) and information on
exposures and potential confounders
6-7, Table 1
(b) Indicate number of participants with missing data for each variable of interest 7-8,
Supplemental Table 1
(c) Cohort study—Summarise follow-up time (eg, average and total amount) 7
Outcome data 15* Cohort study—Report numbers of outcome events or summary measures over time 7, Tables 2, 3
Case-control study—Report numbers in each exposure category, or summary measures of exposure 7, Tables 2, 3
Cross-sectional study—Report numbers of outcome events or summary measures NA
Main results 16 (a) Give unadjusted estimates and, if applicable, confounder-adjusted estimates and their precision
(eg, 95% confidence interval). Make clear which confounders were adjusted for and why they were
included
11-16
(b) Report category boundaries when continuous variables were categorized NA
(c) If relevant, consider translating estimates of relative risk into absolute risk for a meaningful time
period
NA
Continued on next page
Page 79 of 80
For peer review only - http://bmjopen.bmj.com/site/about/guidelines.xhtml
BMJ Open
123456789101112131415161718192021222324252627282930313233343536373839404142434445464748495051525354555657585960
on January 9, 2022 by guest. Protected by copyright. http://bmjopen.bmj.com/ BMJ Open: first published as 10.1136/bmjopen-2016-011529 on 23 January 2017. Downloaded from
For peer review only
3
Other analyses 17 Report other analyses done—eg analyses of subgroups and interactions, and sensitivity analyses 11-16
Discussion
Key results 18 Summarise key results with reference to study objectives 17
Limitations 19 Discuss limitations of the study, taking into account sources of potential bias or imprecision. Discuss
both direction and magnitude of any potential bias
21-22
Interpretation 20 Give a cautious overall interpretation of results considering objectives, limitations, multiplicity of
analyses, results from similar studies, and other relevant evidence
17-21
Generalisability 21 Discuss the generalisability (external validity) of the study results 22-23
Other information
Funding 22 Give the source of funding and the role of the funders for the present study and, if applicable, for the
original study on which the present article is based
23
*Give information separately for cases and controls in case-control studies and, if applicable, for exposed and unexposed groups in cohort and cross-sectional studies.
Note: An Explanation and Elaboration article discusses each checklist item and gives methodological background and published examples of transparent reporting. The STROBE
checklist is best used in conjunction with this article (freely available on the Web sites of PLoS Medicine at http://www.plosmedicine.org/, Annals of Internal Medicine at
http://www.annals.org/, and Epidemiology at http://www.epidem.com/). Information on the STROBE Initiative is available at www.strobe-statement.org.
Page 80 of 80
For peer review only - http://bmjopen.bmj.com/site/about/guidelines.xhtml
BMJ Open
123456789101112131415161718192021222324252627282930313233343536373839404142434445464748495051525354555657585960
on January 9, 2022 by guest. Protected by copyright. http://bmjopen.bmj.com/ BMJ Open: first published as 10.1136/bmjopen-2016-011529 on 23 January 2017. Downloaded from
For peer review only
Myocardial Infarction in the Wisconsin Longitudinal Study: The Interaction Among Environmental, Health, Social,
Behavioral, and Genetic Factors
Journal: BMJ Open
Manuscript ID bmjopen-2016-011529.R1
Article Type: Research
Date Submitted by the Author: 01-Sep-2016
Complete List of Authors: Gonzales, Tina; University of Wisconsin-Madison, Sociology Yonker, James; UW-Madison, Scoiology Chang, Vicky; UW-Madison, Scoiology
Roan, Carol; UW-Madison, Scoiology Herd, Pamela; University of Wisconsin-Madison, Sociology Atwood, Craig; University of Wisconsin, Medicine
<b>Primary Subject Heading</b>:
Epidemiology
Secondary Subject Heading: Public health, Cardiovascular medicine
Keywords: Myocardial infarction < CARDIOLOGY, Wisconsin Longitudinal Study, gene-environment interactions, SOCIAL MEDICINE, gender
For peer review only - http://bmjopen.bmj.com/site/about/guidelines.xhtml
BMJ Open on January 9, 2022 by guest. P
rotected by copyright.http://bm
jopen.bmj.com
/B
MJ O
pen: first published as 10.1136/bmjopen-2016-011529 on 23 January 2017. D
ownloaded from
For peer review only
1
Myocardial Infarction in the Wisconsin Longitudinal Study:
The Interaction Among Environmental, Health, Social, Behavioral, and Genetic Factors
Tina Gonzales1, James A. Yonker1, Vicky Chang1, Carol L. Roan1, Pamela Herd1,2 and
Craig S. Atwood, Ph.D.3,4,5
1Department of Sociology, University of Wisconsin, Madison, WI 53705, USA
2La Follete School of Public Affairs, University of Wisconsin, Madison, WI 53705, USA
3Department of Medicine, University of Wisconsin-Madison School of Medicine and Public Health, Madison,
WI 53705, USA
4Geriatric Research, Education and Clinical Center, Veterans Administration Hospital, Madison, WI 53705,
USA
5School of Exercise, Biomedical and Health Sciences, Edith Cowan University, Joondalup, 6027 WA, Australia.
Running Title: Myocardial Infarction in the WLS
Corresponding Author:
Craig S. Atwood, Ph.D.
University of Wisconsin-Madison Medical School
William S. Middleton Memorial VA (GRECC 11G)
2500 Overlook Terrace
Madison, WI 53705
(608)-256-1901, Ext. 11664 (phone)
(608)-280-7291 (fax)
Keywords: heart attack, myocardial infarction, Wisconsin Longitudinal Study, environment, social, gene
Page 1 of 70
For peer review only - http://bmjopen.bmj.com/site/about/guidelines.xhtml
BMJ Open
123456789101112131415161718192021222324252627282930313233343536373839404142434445464748495051525354555657585960
on January 9, 2022 by guest. Protected by copyright.
http://bmjopen.bm
j.com/
BM
J Open: first published as 10.1136/bm
jopen-2016-011529 on 23 January 2017. Dow
nloaded from
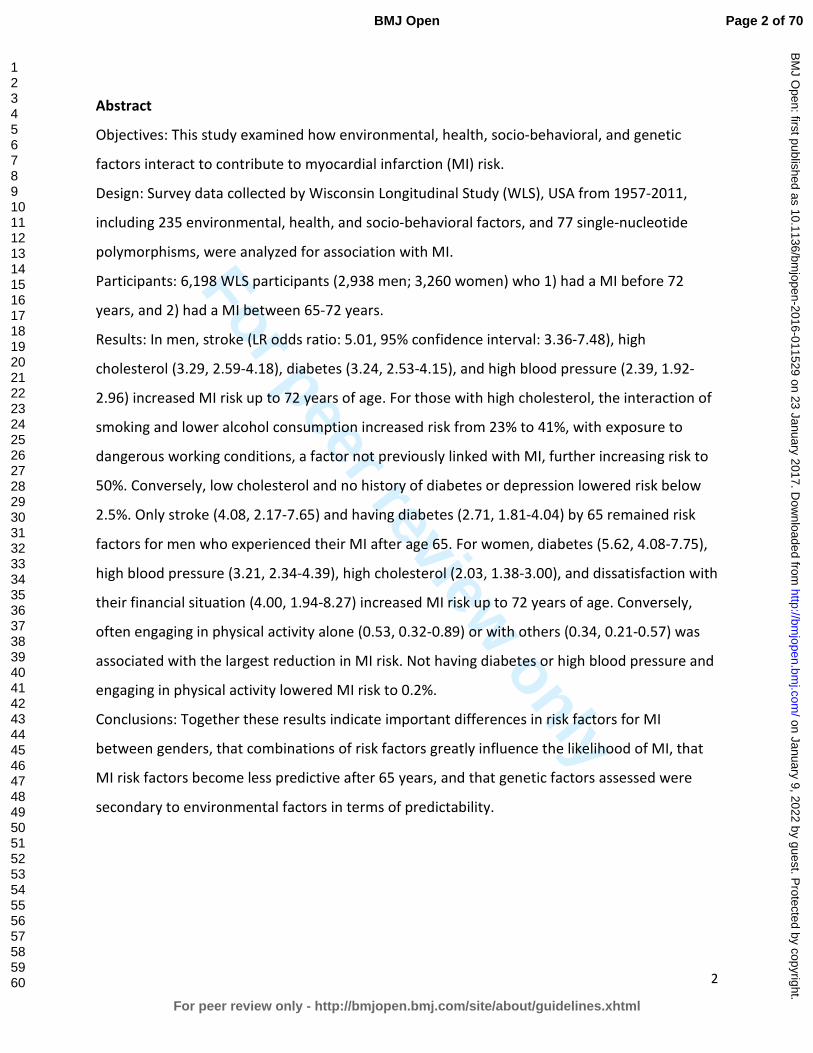
For peer review only
2
Abstract
Objectives: This study examined how environmental, health, socio-behavioral, and genetic
factors interact to contribute to myocardial infarction (MI) risk.
Design: Survey data collected by Wisconsin Longitudinal Study (WLS), USA from 1957-2011,
including 235 environmental, health, and socio-behavioral factors, and 77 single-nucleotide
polymorphisms, were analyzed for association with MI.
Participants: 6,198 WLS participants (2,938 men; 3,260 women) who 1) had a MI before 72
years, and 2) had a MI between 65-72 years.
Results: In men, stroke (LR odds ratio: 5.01, 95% confidence interval: 3.36-7.48), high
cholesterol (3.29, 2.59-4.18), diabetes (3.24, 2.53-4.15), and high blood pressure (2.39, 1.92-
2.96) increased MI risk up to 72 years of age. For those with high cholesterol, the interaction of
smoking and lower alcohol consumption increased risk from 23% to 41%, with exposure to
dangerous working conditions, a factor not previously linked with MI, further increasing risk to
50%. Conversely, low cholesterol and no history of diabetes or depression lowered risk below
2.5%. Only stroke (4.08, 2.17-7.65) and having diabetes (2.71, 1.81-4.04) by 65 remained risk
factors for men who experienced their MI after age 65. For women, diabetes (5.62, 4.08-7.75),
high blood pressure (3.21, 2.34-4.39), high cholesterol (2.03, 1.38-3.00), and dissatisfaction with
their financial situation (4.00, 1.94-8.27) increased MI risk up to 72 years of age. Conversely,
often engaging in physical activity alone (0.53, 0.32-0.89) or with others (0.34, 0.21-0.57) was
associated with the largest reduction in MI risk. Not having diabetes or high blood pressure and
engaging in physical activity lowered MI risk to 0.2%.
Conclusions: Together these results indicate important differences in risk factors for MI
between genders, that combinations of risk factors greatly influence the likelihood of MI, that
MI risk factors become less predictive after 65 years, and that genetic factors assessed were
secondary to environmental factors in terms of predictability.
Page 2 of 70
For peer review only - http://bmjopen.bmj.com/site/about/guidelines.xhtml
BMJ Open
123456789101112131415161718192021222324252627282930313233343536373839404142434445464748495051525354555657585960
on January 9, 2022 by guest. Protected by copyright.
http://bmjopen.bm
j.com/
BM
J Open: first published as 10.1136/bm
jopen-2016-011529 on 23 January 2017. Dow
nloaded from
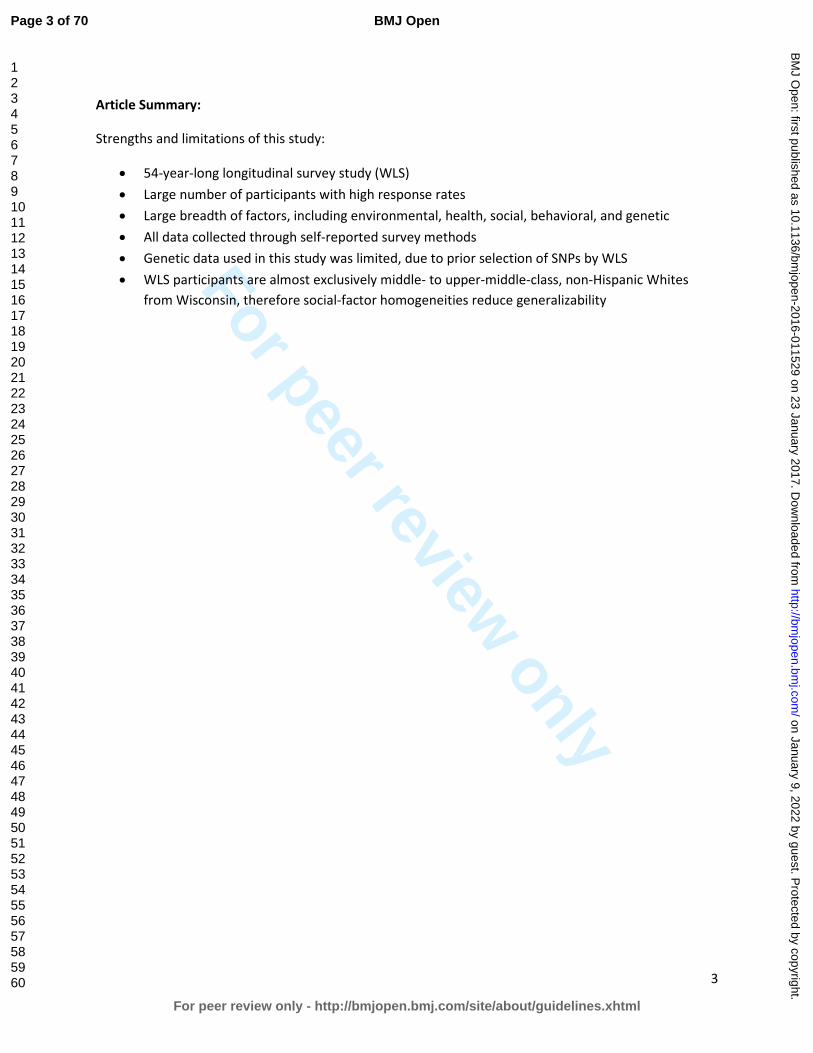
For peer review only
3
Article Summary:
Strengths and limitations of this study:
• 54-year-long longitudinal survey study (WLS)
• Large number of participants with high response rates
• Large breadth of factors, including environmental, health, social, behavioral, and genetic
• All data collected through self-reported survey methods
• Genetic data used in this study was limited, due to prior selection of SNPs by WLS
• WLS participants are almost exclusively middle- to upper-middle-class, non-Hispanic Whites
from Wisconsin, therefore social-factor homogeneities reduce generalizability
Page 3 of 70
For peer review only - http://bmjopen.bmj.com/site/about/guidelines.xhtml
BMJ Open
123456789101112131415161718192021222324252627282930313233343536373839404142434445464748495051525354555657585960
on January 9, 2022 by guest. Protected by copyright.
http://bmjopen.bm
j.com/
BM
J Open: first published as 10.1136/bm
jopen-2016-011529 on 23 January 2017. Dow
nloaded from

For peer review only
4
Introduction
Heart disease impacts ~26.6 million U.S. adults and is the leading cause of death among men
and women in the United States, accounting for 25% of deaths (~600,000 people) annually 1 2.
An estimated 935,000 people in the United States suffer from a myocardial infarction (MI)
every year 3.
MI is a symptom of advanced or severe heart disease 4-6 and the major modifiable risk factors
for MI include high blood pressure 3 7 8, high blood cholesterol 9-13, diabetes (mellitus) 14-16,
smoking/tobacco use 17-21, obesity and being overweight 22-27, poor nutrition/diet 28-36, physical
inactivity 37-41, and (no or excessive) alcohol use 42-47. Stress has also been shown to be an
important (modifiable) risk factor for MI 48-51. The major non-modifiable risk factors for MI
include sex 52-57, age 3 58 59, family history 60-63, and race 1 3 64. However, not all individuals with
these risk factors experience a MI. Thus, it is likely that combinations of these risk factors, or as
yet unknown risk factors, are important in the etiology of the disease.
Other non-modifiable risk factors include genetic polymorphisms such as the apolipoprotein E
(apoE) gene polymorphisms 65 66, the cholesteryl ester transfer protein gene (CETP) 67-69, and the
CDKN2B-AS1 RNA gene (9p21.3 variant) 70 71, but there is no consensus about which gene(s) are
most predictive of MI. In addition, there are few large-scale studies that have looked at the
interactions between genetic and environmental, health, social, and behavioral factors that
predict MI.
Research has shown that risk factors for heart disease and MI are moderated by sex and age,
and the interaction of risk factors with heart disease and MI affect men and women differently
at different ages throughout their lives 53-55 57 72. For example, women are more likely than men
to die within one year of experiencing an MI when younger 73 74, but in general first experience
MI later in life than do men 55, although men are more likely to experience MI overall 3.
Identification of sex specific factors associated with MI and how those associations change over
time is important for predicting disease risk throughout life.
In this study, we examined how the interaction among environmental, health, social,
behavioral, and genetic factors associates with MI, with the goal of determining: 1) differences
in factors associated with MI between men and women, with a focus on the interaction among
factors; 2) how interactions among these factors affect MI occurrence; 3) how factors
associated with MI change over a person’s lifetime, again with a focus on the interaction among
factors; and 4) what combined factors are associated with reduced occurrence of MI, even in
the presence of other known risk factors.
Page 4 of 70
For peer review only - http://bmjopen.bmj.com/site/about/guidelines.xhtml
BMJ Open
123456789101112131415161718192021222324252627282930313233343536373839404142434445464748495051525354555657585960
on January 9, 2022 by guest. Protected by copyright.
http://bmjopen.bm
j.com/
BM
J Open: first published as 10.1136/bm
jopen-2016-011529 on 23 January 2017. Dow
nloaded from
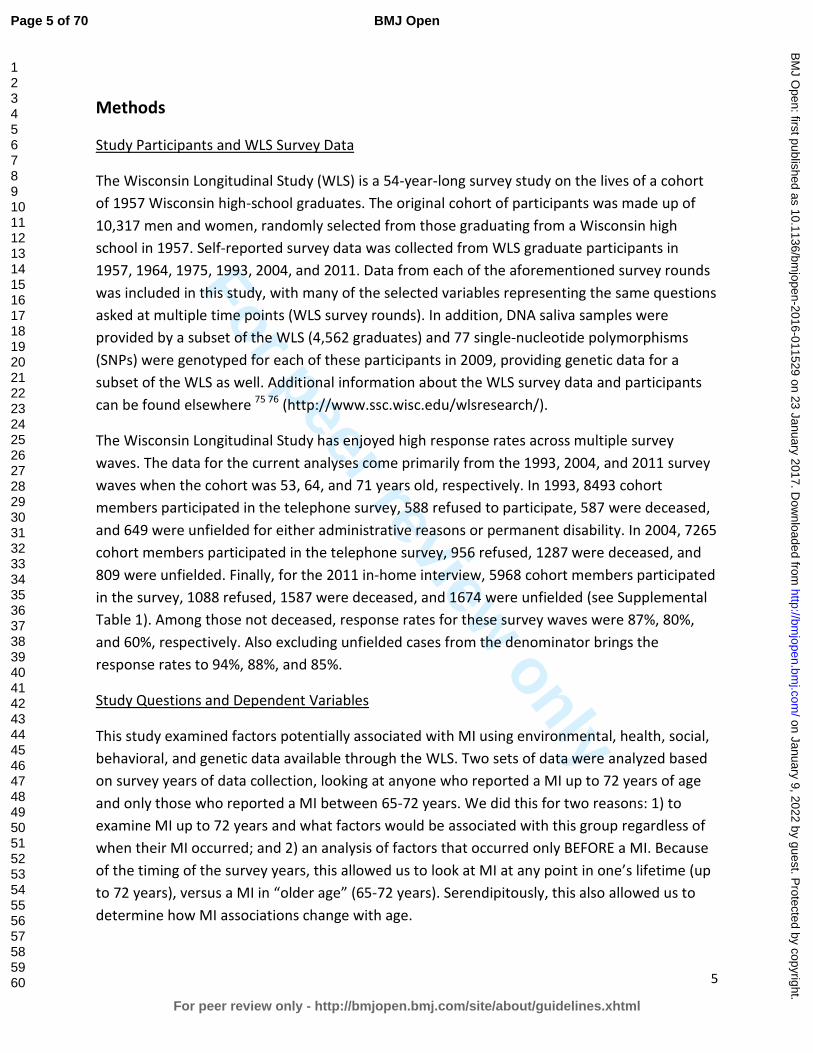
For peer review only
5
Methods
Study Participants and WLS Survey Data
The Wisconsin Longitudinal Study (WLS) is a 54-year-long survey study on the lives of a cohort
of 1957 Wisconsin high-school graduates. The original cohort of participants was made up of
10,317 men and women, randomly selected from those graduating from a Wisconsin high
school in 1957. Self-reported survey data was collected from WLS graduate participants in
1957, 1964, 1975, 1993, 2004, and 2011. Data from each of the aforementioned survey rounds
was included in this study, with many of the selected variables representing the same questions
asked at multiple time points (WLS survey rounds). In addition, DNA saliva samples were
provided by a subset of the WLS (4,562 graduates) and 77 single-nucleotide polymorphisms
(SNPs) were genotyped for each of these participants in 2009, providing genetic data for a
subset of the WLS as well. Additional information about the WLS survey data and participants
can be found elsewhere 75 76 (http://www.ssc.wisc.edu/wlsresearch/).
The Wisconsin Longitudinal Study has enjoyed high response rates across multiple survey
waves. The data for the current analyses come primarily from the 1993, 2004, and 2011 survey
waves when the cohort was 53, 64, and 71 years old, respectively. In 1993, 8493 cohort
members participated in the telephone survey, 588 refused to participate, 587 were deceased,
and 649 were unfielded for either administrative reasons or permanent disability. In 2004, 7265
cohort members participated in the telephone survey, 956 refused, 1287 were deceased, and
809 were unfielded. Finally, for the 2011 in-home interview, 5968 cohort members participated
in the survey, 1088 refused, 1587 were deceased, and 1674 were unfielded (see Supplemental
Table 1). Among those not deceased, response rates for these survey waves were 87%, 80%,
and 60%, respectively. Also excluding unfielded cases from the denominator brings the
response rates to 94%, 88%, and 85%.
Study Questions and Dependent Variables
This study examined factors potentially associated with MI using environmental, health, social,
behavioral, and genetic data available through the WLS. Two sets of data were analyzed based
on survey years of data collection, looking at anyone who reported a MI up to 72 years of age
and only those who reported a MI between 65-72 years. We did this for two reasons: 1) to
examine MI up to 72 years and what factors would be associated with this group regardless of
when their MI occurred; and 2) an analysis of factors that occurred only BEFORE a MI. Because
of the timing of the survey years, this allowed us to look at MI at any point in one’s lifetime (up
to 72 years), versus a MI in “older age” (65-72 years). Serendipitously, this also allowed us to
determine how MI associations change with age.
Page 5 of 70
For peer review only - http://bmjopen.bmj.com/site/about/guidelines.xhtml
BMJ Open
123456789101112131415161718192021222324252627282930313233343536373839404142434445464748495051525354555657585960
on January 9, 2022 by guest. Protected by copyright.
http://bmjopen.bm
j.com/
BM
J Open: first published as 10.1136/bm
jopen-2016-011529 on 23 January 2017. Dow
nloaded from
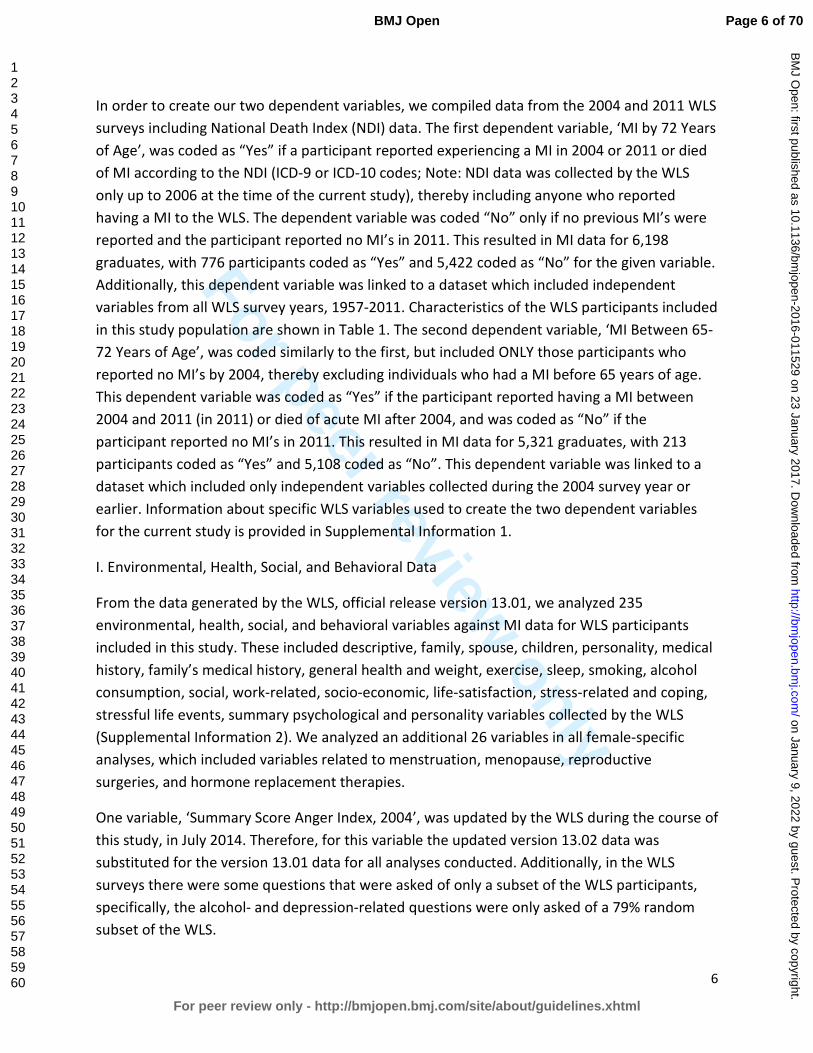
For peer review only
6
In order to create our two dependent variables, we compiled data from the 2004 and 2011 WLS
surveys including National Death Index (NDI) data. The first dependent variable, ‘MI by 72 Years
of Age’, was coded as “Yes” if a participant reported experiencing a MI in 2004 or 2011 or died
of MI according to the NDI (ICD-9 or ICD-10 codes; Note: NDI data was collected by the WLS
only up to 2006 at the time of the current study), thereby including anyone who reported
having a MI to the WLS. The dependent variable was coded “No” only if no previous MI’s were
reported and the participant reported no MI’s in 2011. This resulted in MI data for 6,198
graduates, with 776 participants coded as “Yes” and 5,422 coded as “No” for the given variable.
Additionally, this dependent variable was linked to a dataset which included independent
variables from all WLS survey years, 1957-2011. Characteristics of the WLS participants included
in this study population are shown in Table 1. The second dependent variable, ‘MI Between 65-
72 Years of Age’, was coded similarly to the first, but included ONLY those participants who
reported no MI’s by 2004, thereby excluding individuals who had a MI before 65 years of age.
This dependent variable was coded as “Yes” if the participant reported having a MI between
2004 and 2011 (in 2011) or died of acute MI after 2004, and was coded as “No” if the
participant reported no MI’s in 2011. This resulted in MI data for 5,321 graduates, with 213
participants coded as “Yes” and 5,108 coded as “No”. This dependent variable was linked to a
dataset which included only independent variables collected during the 2004 survey year or
earlier. Information about specific WLS variables used to create the two dependent variables
for the current study is provided in Supplemental Information 1.
I. Environmental, Health, Social, and Behavioral Data
From the data generated by the WLS, official release version 13.01, we analyzed 235
environmental, health, social, and behavioral variables against MI data for WLS participants
included in this study. These included descriptive, family, spouse, children, personality, medical
history, family’s medical history, general health and weight, exercise, sleep, smoking, alcohol
consumption, social, work-related, socio-economic, life-satisfaction, stress-related and coping,
stressful life events, summary psychological and personality variables collected by the WLS
(Supplemental Information 2). We analyzed an additional 26 variables in all female-specific
analyses, which included variables related to menstruation, menopause, reproductive
surgeries, and hormone replacement therapies.
One variable, ‘Summary Score Anger Index, 2004’, was updated by the WLS during the course of
this study, in July 2014. Therefore, for this variable the updated version 13.02 data was
substituted for the version 13.01 data for all analyses conducted. Additionally, in the WLS
surveys there were some questions that were asked of only a subset of the WLS participants,
specifically, the alcohol- and depression-related questions were only asked of a 79% random
subset of the WLS.
Page 6 of 70
For peer review only - http://bmjopen.bmj.com/site/about/guidelines.xhtml
BMJ Open
123456789101112131415161718192021222324252627282930313233343536373839404142434445464748495051525354555657585960
on January 9, 2022 by guest. Protected by copyright.
http://bmjopen.bm
j.com/
BM
J Open: first published as 10.1136/bm
jopen-2016-011529 on 23 January 2017. Dow
nloaded from
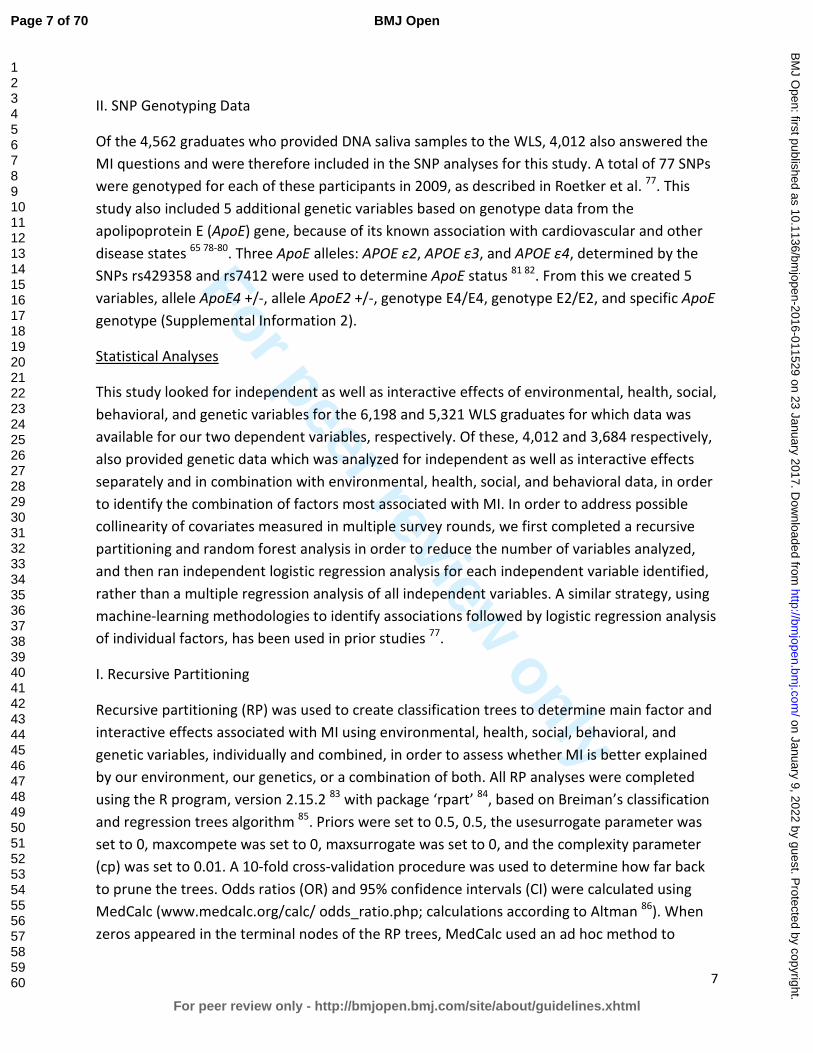
For peer review only
7
II. SNP Genotyping Data
Of the 4,562 graduates who provided DNA saliva samples to the WLS, 4,012 also answered the
MI questions and were therefore included in the SNP analyses for this study. A total of 77 SNPs
were genotyped for each of these participants in 2009, as described in Roetker et al. 77. This
study also included 5 additional genetic variables based on genotype data from the
apolipoprotein E (ApoE) gene, because of its known association with cardiovascular and other
disease states 65 78-80. Three ApoE alleles: APOE ɛ2, APOE ɛ3, and APOE ɛ4, determined by the
SNPs rs429358 and rs7412 were used to determine ApoE status 81 82. From this we created 5
variables, allele ApoE4 +/-, allele ApoE2 +/-, genotype E4/E4, genotype E2/E2, and specific ApoE
genotype (Supplemental Information 2).
Statistical Analyses
This study looked for independent as well as interactive effects of environmental, health, social,
behavioral, and genetic variables for the 6,198 and 5,321 WLS graduates for which data was
available for our two dependent variables, respectively. Of these, 4,012 and 3,684 respectively,
also provided genetic data which was analyzed for independent as well as interactive effects
separately and in combination with environmental, health, social, and behavioral data, in order
to identify the combination of factors most associated with MI. In order to address possible
collinearity of covariates measured in multiple survey rounds, we first completed a recursive
partitioning and random forest analysis in order to reduce the number of variables analyzed,
and then ran independent logistic regression analysis for each independent variable identified,
rather than a multiple regression analysis of all independent variables. A similar strategy, using
machine-learning methodologies to identify associations followed by logistic regression analysis
of individual factors, has been used in prior studies 77.
I. Recursive Partitioning
Recursive partitioning (RP) was used to create classification trees to determine main factor and
interactive effects associated with MI using environmental, health, social, behavioral, and
genetic variables, individually and combined, in order to assess whether MI is better explained
by our environment, our genetics, or a combination of both. All RP analyses were completed
using the R program, version 2.15.2 83 with package ‘rpart’ 84, based on Breiman’s classification
and regression trees algorithm 85. Priors were set to 0.5, 0.5, the usesurrogate parameter was
set to 0, maxcompete was set to 0, maxsurrogate was set to 0, and the complexity parameter
(cp) was set to 0.01. A 10-fold cross-validation procedure was used to determine how far back
to prune the trees. Odds ratios (OR) and 95% confidence intervals (CI) were calculated using
MedCalc (www.medcalc.org/calc/ odds_ratio.php; calculations according to Altman 86). When
zeros appeared in the terminal nodes of the RP trees, MedCalc used an ad hoc method to
Page 7 of 70
For peer review only - http://bmjopen.bmj.com/site/about/guidelines.xhtml
BMJ Open
123456789101112131415161718192021222324252627282930313233343536373839404142434445464748495051525354555657585960
on January 9, 2022 by guest. Protected by copyright.
http://bmjopen.bm
j.com/
BM
J Open: first published as 10.1136/bm
jopen-2016-011529 on 23 January 2017. Dow
nloaded from
For peer review only
8
determine estimates of OR 87 88.
II. Random Forest
Random forest (RF) 89-92 was used in our association analyses 93-96 and was conducted using the
‘randomForest’ package 97 98 available with the R program. We chose to use ‘margin measure’
or mean decrease in accuracy to determine variable importance 99 100. Missing values were
imputed for independent variables using the ‘na.roughfix’ command, which imputes missing
values using either the median value for numeric variables, or the most frequent level for factor
variables. Using imputed values with the ‘rfImpute’ command for missing data was considered
here, but the bias that was noted in preliminary analyses was considered too great. Three trials
of RF were conducted for each ‘variable importance’ measure, to determine the replicability of
the results, in large part because of the randomness associated with this particular test. Using
the dependent variable ‘MI by 72 Years of Age’ and associated dataset the ‘mtry’ parameter
was set to 34 for males and 36 for females, based on the lowest out-of-bag (OOB) estimate of
error rate of 12.25% and 5.09%, respectively. Using the dependent variable ‘MI Between 65-72
Years of Age’ and associated dataset the ‘mtry’ parameter was set to 30 for males and 32 for
females, based on the OOB estimate of error rate of 5.87% and 2.47%, respectively. The
number of trees in the forest, the ‘ntree’ parameter, was set to 5000 for both males and
females in both analyses.
III. Logistic Regression and Chi-square
Single-factor associations with MI were determined for all environmental, health, social,
behavioral, and genetic variables that appeared in either the RP tree(s) or the RF list(s) of
important variables generated for each of the dependent variable analyses, using a logistic
regression (LR) model and Chi-square (X2) test with R. For those cases where the sample size
(one or more categories) was too small for a X2 test (n< 5), Fisher’s Exact test was used to
calculate significance. When necessary, Fisher’s Exact test p-values were obtained using Monte
Carlo simulation. LR odds ratios were determined by exponentiating the coefficients of the
regression models using the R program. All p-values generated from these tests were adjusted
for multiple testing using a q-value adjustment, with the R program version 2.15.2, package
‘qvalue’ 101 102, which has been shown to be less stringent than the Bonferroni adjustment. All
significance findings from LR and X2 (or Fisher’s Exact test) reported herein refer to these
adjusted values.
Only those factors that were identified by at least three of the four analyses employed and
increased or decreased odds of MI by at least 40% were considered significantly associated with
MI in this study and included herein. Furthermore, in order to address any bias that may have
been created due to missing data (non-response) in this study, we performed a ‘logical
Page 8 of 70
For peer review only - http://bmjopen.bmj.com/site/about/guidelines.xhtml
BMJ Open
123456789101112131415161718192021222324252627282930313233343536373839404142434445464748495051525354555657585960
on January 9, 2022 by guest. Protected by copyright.
http://bmjopen.bm
j.com/
BM
J Open: first published as 10.1136/bm
jopen-2016-011529 on 23 January 2017. Dow
nloaded from
For peer review only
9
bounding’ procedure in which we logically filled in missing data points in our dataset, first with
all participants who were not included due to missing values coded as “Yes” for MI and then as
“No” for MI. We then reran our logistic regression analyses in order to see if our ‘overall’
factors associated with MI remained statistically significant, and thereby determine if our
results were robust. All p-values generated from this logical bounding were also adjusted for
multiple testing using q-value adjustment.
Page 9 of 70
For peer review only - http://bmjopen.bmj.com/site/about/guidelines.xhtml
BMJ Open
123456789101112131415161718192021222324252627282930313233343536373839404142434445464748495051525354555657585960
on January 9, 2022 by guest. Protected by copyright.
http://bmjopen.bm
j.com/
BM
J Open: first published as 10.1136/bm
jopen-2016-011529 on 23 January 2017. Dow
nloaded from
For peer review only
10
Results
To assess changes in MI associated factors over a person’s lifetime, separate analyses were
performed on individuals who ever had a MI up to 72 years of age compared to those who had
a MI between 65-72 years of age (see Methods). Participants included in the ‘MI by 72 Years of
Age’ dependent variable were 47.4% male, had an average IQ of 102.1 with an average 13.75
years of regular education. At the time of the 2004 interview the average age of participants
was 64.3 years, 78.6% were married, with an average total household income of $30,619.
11.6% of participants were smokers, consumed alcohol on average 7.6 days/month, and 12.5%
have ever reported a MI to the WLS (see Table 1). Of these participants, 85.9% were also
included in the ‘MI Between 65-72 Years of Age’ dependent variable. Men in the WLS were
significantly more likely to experience MI than were women, to have more education, to be
married, to have a higher household income, and to drink alcohol more days per month than
women in the WLS (Table 1; based on t-test or equal proportions test). All analyses identified
sex as the factor most associated with MI (Supplemental Information 3), therefore men and
women were analyzed separately throughout this study. Note to readers, we reported results in
terms of MI ‘by 72’ years and MI ‘between 65-72’ years because the majority of participants
were 65 or younger during the 2004 survey and 72 or younger during the 2011 survey.
I. Males
MI Up to Age 72
Interactive Effects
RP analysis indicated that 18.1% of men in this study reported a MI by age 72. High cholesterol
by 65 years old was the most significant factor associated with MI among males according to RP
(Figure 1), with a prevalence of 23.1% versus 8.4% (odds ratio: 3.29, 95% confidence interval:
2.59-4.18). For men without high cholesterol by 65, the interactions among factors associated
with the largest increase in MI prevalence were having diabetes by 65, summary score for
openness at 65, and genotype for the CYP11B2 gene (rs1799998 SNP), increasing MI prevalence
to 30.6% versus 0.0% (20.22, 1.15-355.10). For men with no high cholesterol and no diabetes by
65, important interactions included their summary score for (psychological) distress/depression
at 65 and having high blood pressure by 65, with MI prevalence at 27.5% versus 7.5% (4.66,
1.90-11.38). Among those men with a lower summary score for depression, important
interactions included having high cholesterol by 72 and alcohol consumption at 72, with MI
prevalence at 26.9% versus 4.4% (6.89, 2.12-22.44).
For men who did have high cholesterol by 65, important interactions among factors associated
with MI include the number of years the participant had smoked by 54, alcohol consumption at
Page 10 of 70
For peer review only - http://bmjopen.bmj.com/site/about/guidelines.xhtml
BMJ Open
123456789101112131415161718192021222324252627282930313233343536373839404142434445464748495051525354555657585960
on January 9, 2022 by guest. Protected by copyright.
http://bmjopen.bm
j.com/
BM
J Open: first published as 10.1136/bm
jopen-2016-011529 on 23 January 2017. Dow
nloaded from

For peer review only
11
65, exposure to dangerous work conditions at 65, and genotype for the FADS2 gene (rs174575
SNP), with MI prevalence at 46.7% versus 7.1% (11.38, 1.96-66.12). For men who had high
cholesterol by 65, but had smoked fewer years by 54, important interactions included having
diabetes by 65, the extent to which one agreed that family worries or problems distracted from
work at 65, and total years of college completed, with MI prevalence increased to 53.3% versus
0.0% (19.34, 1.02-365.26). For the men who did have high cholesterol by 65, but smoked fewer
years by 54 and did not have diabetes by 65, important interactions among factors included
having a biological parent or sibling who had a MI before age 55, the most he ever weighed in
pounds by 72, total household income at 65, and genotype for the IL6 gene (rs1800795 SNP),
with MI prevalence at 32.6% versus 5.3% (8.69, 1.83-41.36) (Figure 1).
Single Factor Effects
For men up to 72 years old, the ten most important factors associated with MI determined
using RF were: 1) days/month drinking alcohol, 2) total household income, 3) satisfaction with
financial situation, 4) alcoholic drinks/month, 5) high blood pressure, 6) number of children, 7)
high cholesterol, 8) the frequency that work required physical effort, 9) pack-years smoked, and
10) worrying a lot, each at 72 years old (see Supplemental Information 4 for additional
‘important’ factors associated with MI by RF).
Of the factors that were associated with MI by RP or RF, LR identified having high cholesterol by
65 (3.29, 2.59-4.18) and 72 (3.32, 2.50-4.42), diabetes by 65 (3.24, 2.53-4.15) and 72 (2.26,
1.78-2.88), stroke by 65 (5.01, 3.36-7.48), high blood pressure by 65 (2.39, 1.92-2.96) and 72
(2.16, 1.67-2.79), exposure to dangerous conditions at work at 65 (1.41, 1.11-1.79), and having
a parent or sibling who had a MI before age 55 (1.89, 1.43-2.49) as significantly associated with
MI for males in this study (Table 2a). Chi-square also identified these factors as significantly
associated with MI.
Overall Associations with MI by 72 Years of Age
Factors identified by at least three of the analyses employed by this study as associated with MI
were compiled in order to determine which factors were most associated with MI in the WLS
cohort. For males who had a MI any time up to 72 years of age, the factors associated with MI
by all four analyses were having high cholesterol by 65, having high cholesterol by 72, and
having diabetes by 65, which were all highly significant by LR and X2 (Table 2a). These results
are supported by the male RP tree, as having high cholesterol by 65 and diabetes by 65 were
the first and second nodes in that tree (Figure 1). The factors that were associated with MI by
three of the analyses in this study including RF were having diabetes by 72, having had a stroke
by 65, and having high blood pressure by 72, which were all highly significant by LR and X2. The
factors that were associated with MI by three of the analyses including RP were having high
Page 11 of 70
For peer review only - http://bmjopen.bmj.com/site/about/guidelines.xhtml
BMJ Open
123456789101112131415161718192021222324252627282930313233343536373839404142434445464748495051525354555657585960
on January 9, 2022 by guest. Protected by copyright.
http://bmjopen.bm
j.com/
BM
J Open: first published as 10.1136/bm
jopen-2016-011529 on 23 January 2017. Dow
nloaded from
For peer review only
12
blood pressure by 65, exposure to dangerous conditions at work at 65, and having a parent or
sibling who had a MI before age 55, which were all significant by LR and X2 (Table 2a).
MI Between 65-72 Years of Age
Interactive Effects
In the second set of analyses, 5.9% of men reported a MI between 65-72 years of age.
Days/month drinking alcoholic beverages at 65 years old was the only significant factor
identified as associated with MI among males 65-72 according to RP (Figure 2), with incidence
at 7.7% among those who drank < 8.5 days/month versus 2.9% among those who drank ≥ 8.5
days/month (2.77, 1.80-4.25).
Single Factor Effects
For men between 65-72 years of age, the ten most important factors associated with MI
determined using RF were: 1) alcoholic drinks/month at 65 years old, 2) summary score for
distress/depression at 54, 3) body mass index at 54, 4) alcoholic drinks/month at 54, 5)
summary score for neuroticism at 54, 6) the most ever weighed (at 65), 7) days/month drinking
alcohol at 65, 8) body mass index at 65, 9) pack-years smoked at 54, and 10) years smoked at 54
(see Supplemental Information 5 for additional ‘important’ factors associated with MI by RF).
Of the factors that were associated with MI by RP or RF, LR identified having had a stroke by 65
(4.08, 2.17-7.65) and having diabetes by 65 (2.71, 1.81-4.04) as significantly associated with MI
for males 65-72 years old (Table 2b). Chi-square also identified these two factors as significantly
associated with MI for males in this age group (Table 2b).
Overall Associations with MI Between 65-72 Years of Age
For males between 65-72 years old, the factors associated with MI by at least three of the four
analyses employed by this study were having had a stroke by 65 and having diabetes by 65,
which were both highly significant by LR and X2 and ‘important’ factors by RF (Table 2b).
II. Females
MI Up to Age 72
Interactive Effects
RP analysis indicated that 7.5% of women in this study reported a MI by age 72, which was
10.6% less than that reported in men. For women, having diabetes by 65 was the most
significant factor associated with MI according to RP, with a prevalence of 22.4% versus 4.9%
(5.62, 4.08-7.75; Figure 3). For the latter group, important interactions among factors
Page 12 of 70
For peer review only - http://bmjopen.bmj.com/site/about/guidelines.xhtml
BMJ Open
123456789101112131415161718192021222324252627282930313233343536373839404142434445464748495051525354555657585960
on January 9, 2022 by guest. Protected by copyright.
http://bmjopen.bm
j.com/
BM
J Open: first published as 10.1136/bm
jopen-2016-011529 on 23 January 2017. Dow
nloaded from
For peer review only
13
associated with MI included having high blood pressure by 65 and how often they engaged in
light physical activities with others at 67, with MI prevalence at 3.7% versus 0.2% (18.39, 2.49-
135.77). And among the women who did not have diabetes, but did have high blood pressure
by 65, important interactions included how many years they had smoked by age 54 (≥ 24.5
years = 16.6% prevalence) and how often the participant blamed themselves when they
experienced a difficult or stressful event at 72 years old, with MI prevalence at 11.8% versus
2.7% (4.87, 2.25-10.55; Figure 3).
Single Factor Effects
For women up to 72 years old, the ten most important factors associated with MI determined
using RF were: 1) days/month drinking alcohol at 72, 2) satisfaction with financial situation at
72, 3) total household income at 72, 4) high blood pressure at 72, 5) worrying a lot at 72, 6)
alcoholic drinks/month at 72, 7) diabetes by 65, 8) number of children, 9) body mass index at
72, and 10) the most ever weighed (at 72) (see Supplemental Information 6 for additional
‘important’ factors associated with MI by RF).
Of the factors that were associated with MI by RP or RF, LR identified having diabetes by 54
(6.93, 4.18-11.49), 65 (5.62, 4.08-7.75), and 72 (4.24, 3.04-5.91), high cholesterol by 72 (2.03,
1.38-3.00), not being married at 72 (1.59, 1.16-2.18), satisfaction with financial situation at 72
([not at all] 4.00, 1.94-8.27; [somewhat] 2.02, 1.31-3.12; multiple coefficients significant by LR),
engaging in vigorous physical activity alone at 67 (0.53, 0.32-0.89), high blood pressure at 65
(3.21, 2.34-4.39) and 72 (3.37, 2.23-5.09), and engaging in light physical activity with others at
67 (0.34, 0.21-0.57) as significantly associated with MI for females in this study (Table 3a). Chi-
square also identified these factors as significantly associated with MI (Table 3a).
Overall Associations with MI by 72 Years of Age
For females who reported a MI any time up to 72 years of age, the factor associated with MI by
all four analyses was having diabetes by 65 years old, which was highly significant by LR and X2
(Table 3a), and was the most associated factor according to the female RP tree (Figure 3). The
factors associated with MI by three of the analyses in this study including RF were having
diabetes by 54 and 72, having high cholesterol by 72, not being married at 72, satisfaction with
financial situation at 72, engaging in vigorous physical activity alone at 67, and having high
blood pressure at 72, which were all significant by LR and X2. The factors associated with MI in
females by three of the analyses in this study including RP were having high blood pressure by
65 and engaging in light physical activity with others at 67, which were both highly significant
by LR and X2 (Table 3a).
MI Between 65-72 Years of Age
Page 13 of 70
For peer review only - http://bmjopen.bmj.com/site/about/guidelines.xhtml
BMJ Open
123456789101112131415161718192021222324252627282930313233343536373839404142434445464748495051525354555657585960
on January 9, 2022 by guest. Protected by copyright.
http://bmjopen.bm
j.com/
BM
J Open: first published as 10.1136/bm
jopen-2016-011529 on 23 January 2017. Dow
nloaded from

For peer review only
14
Interactive Effects
In the second set of analyses, 2.5% of women reported a MI between 65-72 years of age.
Having diabetes by 65 years old was again the most significant factor associated with MI among
females in this age bracket according to RP (Figure 4), with a MI incidence of 7.8% versus 2.0%
(4.25, 2.50-7.24). For females who had diabetes by 65 years old, important interactions among
factors associated with MI included their summary score for agreeableness at 65 and not
having had a menstrual period in the last 12 months by 54 years of age, increasing MI incidence
to 14.0% versus 0.0% (13.58, 0.79-233.29). For those females who did not have diabetes by 65,
important interactions included IQ, genotype for the Inhibin Beta B gene (rs11902591 SNP), and
how often their work required physical effort at 54, with MI incidence at 25.0% versus 0.0%
(37.95, 1.81-795.67). And among those women with a lower IQ score, important interactions
included their summary score for extraversion at 54, how often they engaged in light physical
activities alone at 65, the number of alcoholic drinks consumed/month at 65, body mass index
at 65, genotype for the A2M gene (rs669 SNP), how often they worked under the pressure of
time at 54, and the age at which they had last menstruated, with MI incidence increasing to
13.8% versus 0.0% (12.42, 0.72-215.47) (Figure 4).
Single Factor Effects
For women between 65-72 years of age, the ten most important factors associated with MI
determined by RF were: 1) alcoholic drinks/month at 65 years old, 2) summary score for
distress/depression at 65, 3) diabetes at 65, 4) body mass index at 65, 5) the most ever weighed
(at 65), 6) days/month drinking alcohol at 54, 7) days/month drinking alcohol at 65, 8)
drinks/day on days when drank alcohol at 65, 9) age when had surgery to remove uterus and/or
ovaries, and 10) summary score for distress/depression at 54 (see Supplemental Information 7
for additional ‘important’ factors associated with MI by RF).
Of the factors associated with MI by RP or RF, LR identified having diabetes by 65 (4.25, 2.50-
7.24), exposure to dangerous work conditions at 54 (2.24, 1.36-3.69), and having had a
menstrual period in the last 12 months at 54 (0.46, 0.23-0.91) as significantly associated with
MI for females between 65-72 years of age (Table 3b). Chi-square also identified these factors
as significantly associated with MI for females in this age group (Table 3b).
Overall Associations with MI Between 65-72 Years of Age
For females between 65-72 years old, the factor associated with MI by all four analyses was
having diabetes by 65, which was highly significant by LR and X2 (Table 3b), and was the factor
most associated with MI according to the female RP tree for this age group (Figure 4). The
factors associated with MI by at least three of the analyses employed in this study were
exposure to dangerous work conditions at 54, which was significantly associated with MI by LR
Page 14 of 70
For peer review only - http://bmjopen.bmj.com/site/about/guidelines.xhtml
BMJ Open
123456789101112131415161718192021222324252627282930313233343536373839404142434445464748495051525354555657585960
on January 9, 2022 by guest. Protected by copyright.
http://bmjopen.bm
j.com/
BM
J Open: first published as 10.1136/bm
jopen-2016-011529 on 23 January 2017. Dow
nloaded from

For peer review only
15
and X2 and deemed an ‘important’ factor by RF, and having menstruated in the last 12 months
at 54, which was significantly associated by LR and X2 and present in the RP tree (Table 3b).
SNP Associations with MI
None of the genetic variables tested appeared among the RF ‘important’ factors in any of the
groups analyzed. Although this study found several SNPs that were associated with MI by RP,
specifically the CYP11B2 (rs1799998), the FADS2 (rs174575), and the IL6 (rs1800795) gene SNPs
in males up to 72, and the Inhibin Beta B (rs11902591) and A2M (rs669) SNPs in females
between 65-72 years, none of these were significantly associated with MI according to LR or X2
after adjustment for multiple testing.
Logical Bounding
Logical bounding of missing data and subsequent logistic regression analysis (see Methods)
showed that all but one of the factors associated with MI identified by this study were robust to
missing data, as they all remained statistically significant on both sides of the logical bounding
procedure (results not shown). The only factor that did not remain significant was exposure to
dangerous work conditions for females who had a MI between 65-72 years of age, when all
missing data points were coded as “Yes”, suggesting that this result was less robust or more
sensitive to missing data, which should be considered when evaluating the results.
Page 15 of 70
For peer review only - http://bmjopen.bmj.com/site/about/guidelines.xhtml
BMJ Open
123456789101112131415161718192021222324252627282930313233343536373839404142434445464748495051525354555657585960
on January 9, 2022 by guest. Protected by copyright.
http://bmjopen.bm
j.com/
BM
J Open: first published as 10.1136/bm
jopen-2016-011529 on 23 January 2017. Dow
nloaded from
For peer review only
16
Discussion
This study identified factors associated with MI among participants in the Wisconsin
Longitudinal Study. For men, the factor most associated with reported MI by 72 years old is
having a stroke by 65. High cholesterol, diabetes, high blood pressure, and family history were
also identified as top factors for men up to 72 years, as well as exposure to dangerous working
conditions, which has not previously been identified as associated with MI in men. Stroke and
diabetes by 65 were most associated with MI in men over 65 years in the WLS cohort. We
identified diabetes by 65 as the factor most associated with reported MI in women up to 72
years old. High cholesterol, whether they were married, satisfaction with finances, engaging in
physical activity, and high blood pressure were also identified as associated with MI in women
up to 72 years. Among women who had their MI after age 65, diabetes remained the most
associated factor. However, exposure to dangerous working conditions, also newly associated
with MI in women, and whether they still had their menstrual period at 53 were also
determined to be associated with MI for women in this group. For most of the factors listed,
exposure time had a large effect on MI occurrence, for both men and women in the WLS
cohort. Interactions among these and other factors greatly affected MI occurrence in both men
and women. Furthermore, results showed that for both men and women, not only do the MI
associated factors become less so as people age, but many of the factors change or are
different between younger and older people.
Males
MI by 72 Years of Age
Results showed that 18.1% of men reported a MI to the WLS by age 72, which is significantly
higher than the national average of 11.3% for those aged 60-79 years 3. Stroke by 65 was
associated with the greatest increase in LR odds of MI among these men (Table 2a). The other
factors associated with MI in this group include having high cholesterol, diabetes, high blood
pressure, exposure to dangerous working conditions, and having a parent or sibling who had a
MI before age 55. Stroke has been cited as a risk factor for MI 103 104 and MI has been
established as a risk factor for stroke in prior studies 105-107, and according to the American
Stroke Association 108 stroke risk is doubled among those who have experienced MI due to
atherosclerosis. Furthermore, high cholesterol, diabetes, and high blood pressure represent 3
of the 4 conventional ‘key' risk factors for myocardial infarction, and their association with
heart disease and MI risk is well characterized in the literature 5 6 9 10 109 110. A family history of
heart disease has been shown to be a significant contributor to MI risk in previous studies 61 62
111 112. However, our study is the first to identify a link between exposure to dangerous working
conditions and MI. Consistent with this, a number of studies show that stress in the workplace
is associated with an increased risk of MI 49 113-115. The increased odds of MI noted with a
Page 16 of 70
For peer review only - http://bmjopen.bmj.com/site/about/guidelines.xhtml
BMJ Open
123456789101112131415161718192021222324252627282930313233343536373839404142434445464748495051525354555657585960
on January 9, 2022 by guest. Protected by copyright.
http://bmjopen.bm
j.com/
BM
J Open: first published as 10.1136/bm
jopen-2016-011529 on 23 January 2017. Dow
nloaded from
For peer review only
17
diagnosis by 65 years old rather than 72 (among above factors) suggests that exposure time is
an important determinant in whether one experiences a MI or not. Although in this particular
cohort having high cholesterol increased one’s odds of MI by 3.3-fold, regardless of whether it
was diagnosed by 65 or 72, prior studies have shown that those who are diagnosed with high
cholesterol at a younger age (<50 years) are more likely to experience heart disease in their
lifetime 116-118.
This study demonstrates that interactions among factors associated with MI lead to large
changes in MI prevalence (Figure 1). While combinations of high cholesterol, diabetes, smoking,
and lower alcohol consumption were associated with increased prevalence, and interacted with
lesser-known factors like dangerous working conditions, depression, and genetic factors to
increase prevalence to 50%, other factors including personality type, increased alcohol
consumption, higher household income, and higher education tended to lower prevalence, in
some cases down to 0.0% even when other top MI risk factors were present. For example, high
cholesterol, smoking, and diabetes are associated with higher MI prevalence, but for the subset
of men who completed more than 5.5 years of college, prevalence in the WLS dropped to 0.0%
compared to those completing less than 5.5 years of college, whose MI prevalence was a
whopping 53.3%. This suggests that factors should not be evaluated individually, but rather the
interaction among factors has to be considered when determining associations with MI
(additional discussion of RP results can be found in Supplemental Information 8).
MI Between 65-72 Years of Age
Only 5.9% of men reported a MI between 65-72 years to the WLS, versus 18.1% who ever
reported MI by 72 years, therefore the majority of MIs reported to the WLS and included in this
study occurred before age 65. The factors most associated with MI for men between the ages
of 65-72 years were having had a stroke and having diabetes, both by 65 years old (Table 2b).
These two factors were identified by both analyses of MI in males, suggesting that these factors
are strongly associated with MI in males at any age. Interestingly, the odds of MI in the first
analysis for men who ever had a MI by 72 were increased compared to the odds of MI between
65-72 years old, both for having had a stroke by 65 (5.0- versus 4.1-fold increase, respectively)
and for having diabetes by 65 (3.2- versus 2.7-fold increase, respectively), suggesting that the
key risk factors for MI become less predictive as men age, as supported by previous studies 5 55.
Additionally, the loss of two factors associated with MI in men from the first analysis, having
high cholesterol or having high blood pressure (Table 2b), suggests that factors associated with
MI are different in younger versus older men. This result is supported by the fact that RP
analysis identified fewer days/month drinking alcoholic beverages at 65 as the only factor
affecting MI among men 65-72 years old, with a 2.7-fold increase in odds of MI among those
who drank alcohol < 8.5 days/month (7.7% versus 2.9%; Figure 2). This supports prior studies
Page 17 of 70
For peer review only - http://bmjopen.bmj.com/site/about/guidelines.xhtml
BMJ Open
123456789101112131415161718192021222324252627282930313233343536373839404142434445464748495051525354555657585960
on January 9, 2022 by guest. Protected by copyright.
http://bmjopen.bm
j.com/
BM
J Open: first published as 10.1136/bm
jopen-2016-011529 on 23 January 2017. Dow
nloaded from

For peer review only
18
proposing an insulating effect of regular moderate alcohol consumption, specifically in older
adults (≥65 years) 119-121, but still suggests that the ‘known’ risk factors for MI change with age,
at least for men in the WLS cohort.
Females
MI by 72 Years of Age
This study found that 7.5% of women reported MI to the WLS by age 72, which is slightly higher
than the national average for this age group (4.2%) 3, similar to the results we found in men. LR
odds ratios indicated that diabetes by 54 was associated with the greatest increase in odds of
MI (Table 3a). The other factors associated with MI for females in this group include having
diabetes (any age), high cholesterol, not being married, satisfaction with financial situation,
engaging in physical activity, and high blood pressure. Diabetes (by 65) was also the single most
important factor for MI among females up to 72 according to RP results (Figure 3), with a 4.6-
fold increase in MI prevalence among women with diabetes (22.4% versus 4.9%). Diabetes has
been shown in prior studies to be a strong predictor of MI risk in women 122. As seen in men in
this study, high cholesterol and high blood pressure are both strongly associated with MI risk in
women, as supported by previous studies. Marriage is a well-accepted indicator of MI risk and
an even better indicator of one’s recovery and health after experiencing an MI 123-128.
Satisfaction with one’s financial situation was linked with MI risk in women in one prior study 129, and another study showed an association between ‘perceived financial status’ and MI risk
among employed women 130. Satisfaction with one’s financial situation could also be associated
with financial stress, which has been linked to increased MI risk in multiple studies 49 55 131. Life
satisfaction has been positively associated with CVD and CHD risk and other chronic diseases,
specifically in women 132-134, but this may be the first study to identify an association between
life satisfaction and MI. Reduced prevalence of MI in women in the WLS cohort who engaged in
physical activity when they were about 67 years old is supported by numerous studies on the
effects of physical inactivity and MI risk 3 5 40 55. An even larger reduction in MI prevalence was
noted among those who often engaged in light physical activity with others when 67 (0.34)
versus those who often engaged in vigorous physical activity alone when 67 (0.53), suggesting
that type of physical activity is less important and spending time with others may play a larger
role for women when it comes to reducing MI risk. This is supported by previous studies
showing that for women having ‘social support’ is a very strong predictor of MI risk 135 136.
Furthermore, our study suggests that physical inactivity may play a more important role for
women than for men when it comes to MI (Table 3a), specifically concerning MI in those < 65
years old, supported by previous studies 55.
In addition to identifying diabetes by 65 as the most associated factor for females up to 72
years in the WLS cohort (Figure 3), RP analysis showed that among those women who did not
Page 18 of 70
For peer review only - http://bmjopen.bmj.com/site/about/guidelines.xhtml
BMJ Open
123456789101112131415161718192021222324252627282930313233343536373839404142434445464748495051525354555657585960
on January 9, 2022 by guest. Protected by copyright.
http://bmjopen.bm
j.com/
BM
J Open: first published as 10.1136/bm
jopen-2016-011529 on 23 January 2017. Dow
nloaded from
For peer review only
19
have diabetes by 65, the interaction of having high blood pressure by 65 and smoking ≥24.5
years by 54 more than tripled MI prevalence, again demonstrating the importance of
considering interactions among factors when predicting MI risk (additional discussion of RP
results can be found in Supplemental Information 9). As in men, our study suggests that
exposure time to certain factors is an important determinant in whether a woman has a MI or
not. For example, odds of MI increase for women who develop diabetes, but the younger a
woman is when she is diagnosed, the higher her odds for eventually experiencing a MI, with a
6.9-, 5.6-, and 4.2-fold increase in odds among those diagnosed by 54, 65, and 72 years old,
respectively (R2=0.98). However, this association does not hold for all medical health conditions
in women in the WLS, as having high blood pressure by 65 increases one’s odds by 3.2-fold
while having high blood pressure by 72 increases one’s odds by 3.4-fold. Further study will need
to be conducted in order to determine the exact mechanisms by which exposure time affects
one’s odds of having a MI, and which MI associated factors are more susceptible to this effect.
MI Between 65-72 Years of Age
Only 2.5% of women reported a MI between 65-72 years to the WLS - much lower than that
noted among women who ever reported a MI by 72 years old (7.5%) and lower than the
national average (4.2%) 3. The factor associated with the highest odds of MI for women in this
age group was having diabetes by 65 years old (Table 3b), similar to women who ever had a MI
by 72 years. RP analysis confirmed this as the top factor associated with MI among women 65-
72 years old (Figure 4), again suggesting that this is potentially the most important factor
associated with MI in women. However, just as in men, this factor is more associated with MI
among younger women, or including those < 65 years old, with a LR odds ratio of 5.62 as
compared to the 4.25-fold increase in odds among those who experienced a MI > 65 years old
(Table 3b). Even so, this remained the most important factor associated with MI among women
in the WLS at any age. This result is in agreement with what is known about diabetes and MI
risk for women, as it has been shown that diabetes not only increases a woman’s MI risk, but
her risk for fatal CHD, ischemic stroke, cardiovascular mortality, and all-cause mortality 122 137-
139.
Additionally and interestingly, exposure to dangerous conditions at work (at 54 years old) was
determined to be associated with MI for women 65-72 years old (2.2-fold increase; Table 3b),
just as exposure to dangerous work conditions (at 65 years) was a top factor for men who ever
had a MI by 72 years (1.4-fold increase; Table 2a). This may represent a possible new risk factor
for MI, although more research is needed to confirm this result. Still it suggests that not only do
MI associated factors become less so as women age, but those factors may change between
younger and older women. This is supported by the last ‘top’ factor associated with MI for
women 65-72 years old, whether she still had a menstrual period at 53 (0.46-fold decrease in
Page 19 of 70
For peer review only - http://bmjopen.bmj.com/site/about/guidelines.xhtml
BMJ Open
123456789101112131415161718192021222324252627282930313233343536373839404142434445464748495051525354555657585960
on January 9, 2022 by guest. Protected by copyright.
http://bmjopen.bm
j.com/
BM
J Open: first published as 10.1136/bm
jopen-2016-011529 on 23 January 2017. Dow
nloaded from
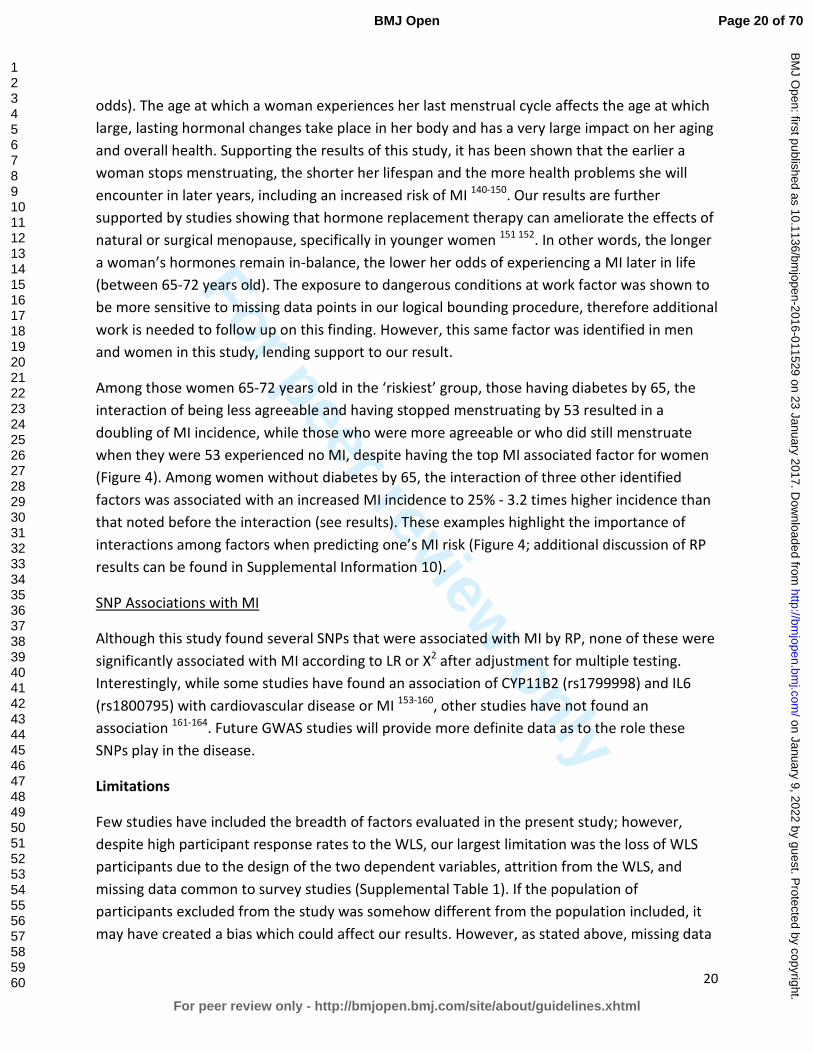
For peer review only
20
odds). The age at which a woman experiences her last menstrual cycle affects the age at which
large, lasting hormonal changes take place in her body and has a very large impact on her aging
and overall health. Supporting the results of this study, it has been shown that the earlier a
woman stops menstruating, the shorter her lifespan and the more health problems she will
encounter in later years, including an increased risk of MI 140-150. Our results are further
supported by studies showing that hormone replacement therapy can ameliorate the effects of
natural or surgical menopause, specifically in younger women 151 152. In other words, the longer
a woman’s hormones remain in-balance, the lower her odds of experiencing a MI later in life
(between 65-72 years old). The exposure to dangerous conditions at work factor was shown to
be more sensitive to missing data points in our logical bounding procedure, therefore additional
work is needed to follow up on this finding. However, this same factor was identified in men
and women in this study, lending support to our result.
Among those women 65-72 years old in the ‘riskiest’ group, those having diabetes by 65, the
interaction of being less agreeable and having stopped menstruating by 53 resulted in a
doubling of MI incidence, while those who were more agreeable or who did still menstruate
when they were 53 experienced no MI, despite having the top MI associated factor for women
(Figure 4). Among women without diabetes by 65, the interaction of three other identified
factors was associated with an increased MI incidence to 25% - 3.2 times higher incidence than
that noted before the interaction (see results). These examples highlight the importance of
interactions among factors when predicting one’s MI risk (Figure 4; additional discussion of RP
results can be found in Supplemental Information 10).
SNP Associations with MI
Although this study found several SNPs that were associated with MI by RP, none of these were
significantly associated with MI according to LR or X2 after adjustment for multiple testing.
Interestingly, while some studies have found an association of CYP11B2 (rs1799998) and IL6
(rs1800795) with cardiovascular disease or MI 153-160, other studies have not found an
association 161-164. Future GWAS studies will provide more definite data as to the role these
SNPs play in the disease.
Limitations
Few studies have included the breadth of factors evaluated in the present study; however,
despite high participant response rates to the WLS, our largest limitation was the loss of WLS
participants due to the design of the two dependent variables, attrition from the WLS, and
missing data common to survey studies (Supplemental Table 1). If the population of
participants excluded from the study was somehow different from the population included, it
may have created a bias which could affect our results. However, as stated above, missing data
Page 20 of 70
For peer review only - http://bmjopen.bmj.com/site/about/guidelines.xhtml
BMJ Open
123456789101112131415161718192021222324252627282930313233343536373839404142434445464748495051525354555657585960
on January 9, 2022 by guest. Protected by copyright.
http://bmjopen.bm
j.com/
BM
J Open: first published as 10.1136/bm
jopen-2016-011529 on 23 January 2017. Dow
nloaded from

For peer review only
21
is a limitation in every observational study and is an unavoidable consequence of using
longitudinal survey data. Furthermore, the logical bounding procedure we performed showed
that all but one of the ‘overall’ MI associated factors identified were robust to missing data,
lending support to our results.
An additional limitation in this study is that it is likely that some reported MI’s may have
occurred before some of the independent variables were measured, specifically for the ‘MI by
72 Years of Age’ analyses. Our dataset did not include the dates of occurrence of all
independent variables, therefore it was impossible to run a ‘time-to-event’ or survival analysis
on this data. However, we were interested in factors present in participants who ever
experienced a MI in their lifetime (up to 72 years), regardless of when their MI occurred.
Therefore, this part of our analysis is a case-control retrospective study. Due to the mentioned
complications with the first analysis, we completed a second analysis in which all of the
independent variables occurred before the participant’s reported MI. Although this design
reduced the number of participants included in the second analysis, it allowed us to determine
which factors are associated with MI BEFORE the MI occurs, and therefore are potentially
predictive of MI. Therefore, this part of our analysis is a true cohort study.
Additional limitations of the current study include limitations associated with ICD codes in
death records and limitations in death records recovered by the WLS. Furthermore, Rosamond
et al. 165 found that when MI are self-reported, the numbers are often an overestimation.
Again, these limitations are an unavoidable consequence of using longitudinal survey data, but
still must be considered when interpreting results. Additionally, the predictive value of our
genetic data was limited because of user bias in selection of SNPs; other genetic variants that
we did not examine in this study may have provided information about crucial interactions
involved with MI. And the WLS has social-factor homogeneities, such as participants being
almost exclusively non-Hispanic White people with middle- to upper-middle-class backgrounds.
Future directions for research will involve using these same machine learning methodologies on
more complete genetic profiles, such as from genome-wide SNP or sequencing data, with which
we will be able to explore all genetic interaction possibilities rather than a limited subset of
variants.
Conclusions
It has previously been shown that at least one of four key risk factors - smoking, high blood
pressure, high cholesterol, or diabetes (mellitus) - was observed in more than 80%-90% of
patients experiencing MI, and all of these risks combined account for a population attributable
risk (PAR) greater than 90% for all MI - for men and women, old and young, worldwide 5 55.
However, our study indicated that: 1) the main factors associated with MI are different
between men (high cholesterol, diabetes, stroke, high blood pressure, and family history) and
Page 21 of 70
For peer review only - http://bmjopen.bmj.com/site/about/guidelines.xhtml
BMJ Open
123456789101112131415161718192021222324252627282930313233343536373839404142434445464748495051525354555657585960
on January 9, 2022 by guest. Protected by copyright.
http://bmjopen.bm
j.com/
BM
J Open: first published as 10.1136/bm
jopen-2016-011529 on 23 January 2017. Dow
nloaded from
For peer review only
22
women (diabetes, high cholesterol, marriage, satisfaction with financial situation, physical
activity, high blood pressure, and loss of menstruation); 2) interactions among MI associated
factors have a large influence on MI occurrence; 3) factors associated with MI change and
associations weaken after 65 years of age in both sexes; and 4) the interaction of factors can be
associated with large reductions in MI prevalence, to near zero, even in the presence of other
known risk factors. In addition to identifying the above recognized factors associated with MI,
we found one previously unidentified factor associated with MI (exposure to dangerous
conditions at work) among WLS participants, which may represent a ‘new’ risk factor for MI.
Larger genetic studies are required to elaborate upon the modest genetic interactions
identified in this study.
Acknowledgments
This research used data from the Wisconsin Longitudinal Study (WLS) of the University of
Wisconsin–Madison. Since 1991, the WLS has been supported principally by the National
Institute on Aging (AG-9775, AG-21079, and AG-033285), with additional support from the Vilas
Estate Trust, the National Science Foundation, the Spencer Foundation, and the Graduate
School of the University of Wisconsin–Madison. A public use file of data from the Wisconsin
Longitudinal Study is available from the WLS, University of Wisconsin–Madison, 1180
Observatory Drive, Madison, WI 53706, and at http://www.ssc.wisc.edu/wlsresearch/data. This
material is the result of work supported with resources at the William S. Middleton Memorial
Veterans Hospital, Madison, WI.
Note. The opinions expressed herein are those of the authors. The contents do not represent
the views of the Department of Veterans Affairs or the U.S. government. This article is
Geriatrics Research, Education and Clinical Center VA paper 2015–xx.
Human Participant Protection
Ethics approval was provided by the health sciences institutional review board, University of
Wisconsin–Madison.
Page 22 of 70
For peer review only - http://bmjopen.bmj.com/site/about/guidelines.xhtml
BMJ Open
123456789101112131415161718192021222324252627282930313233343536373839404142434445464748495051525354555657585960
on January 9, 2022 by guest. Protected by copyright.
http://bmjopen.bm
j.com/
BM
J Open: first published as 10.1136/bm
jopen-2016-011529 on 23 January 2017. Dow
nloaded from
For peer review only
23
Figure Legend
Figure 1: RP tree showing interactions among MI associated factors for males who ever had a
MI by 72 years of age in the WLS cohort, with MI prevalence listed at each node in the tree.
Figure 2: RP tree showing the only factor associated with MI by RP for males between 65-72
years of age in the WLS cohort, with MI incidence listed at the terminal nodes of the tree.
Figure 3: RP tree showing interactions among MI associated factors for females who ever had a
MI by 72 years of age in the WLS cohort, with MI prevalence listed at each node in the tree.
Figure 4: RP tree showing interactions among MI associated factors for females who had a MI
between 65-72 years of age in the WLS cohort, with MI incidence listed at each node.
Page 23 of 70
For peer review only - http://bmjopen.bmj.com/site/about/guidelines.xhtml
BMJ Open
123456789101112131415161718192021222324252627282930313233343536373839404142434445464748495051525354555657585960
on January 9, 2022 by guest. Protected by copyright.
http://bmjopen.bm
j.com/
BM
J Open: first published as 10.1136/bm
jopen-2016-011529 on 23 January 2017. Dow
nloaded from
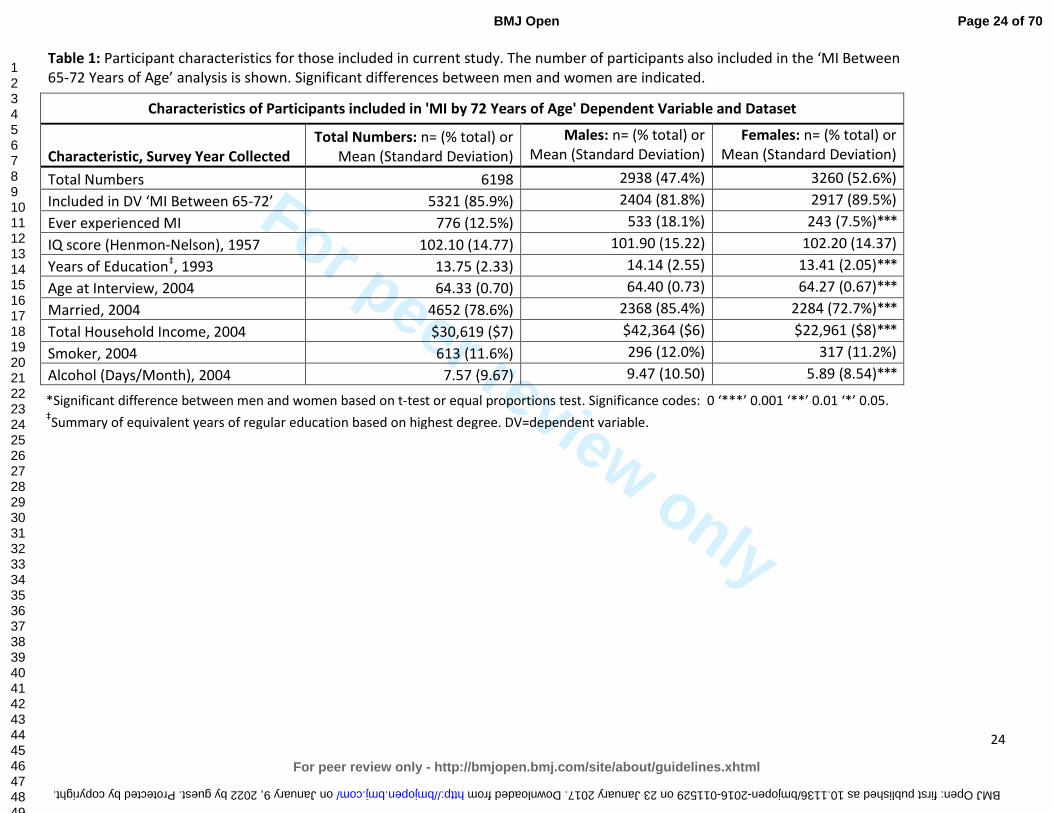
For peer review only
24
Table 1: Participant characteristics for those included in current study. The number of participants also included in the ‘MI Between 65-72 Years of Age’ analysis is shown. Significant differences between men and women are indicated.
Characteristics of Participants included in 'MI by 72 Years of Age' Dependent Variable and Dataset
Characteristic, Survey Year Collected
Total Numbers: n= (% total) or Mean (Standard Deviation)
Males: n= (% total) or Mean (Standard Deviation)
Females: n= (% total) or Mean (Standard Deviation)
Total Numbers 6198 2938 (47.4%) 3260 (52.6%)
Included in DV ‘MI Between 65-72’ 5321 (85.9%) 2404 (81.8%) 2917 (89.5%)
Ever experienced MI 776 (12.5%) 533 (18.1%) 243 (7.5%)***
IQ score (Henmon-Nelson), 1957 102.10 (14.77) 101.90 (15.22) 102.20 (14.37)
Years of Education‡, 1993 13.75 (2.33) 14.14 (2.55) 13.41 (2.05)***
Age at Interview, 2004 64.33 (0.70) 64.40 (0.73) 64.27 (0.67)***
Married, 2004 4652 (78.6%) 2368 (85.4%) 2284 (72.7%)***
Total Household Income, 2004 $30,619 ($7) $42,364 ($6) $22,961 ($8)***
Smoker, 2004 613 (11.6%) 296 (12.0%) 317 (11.2%)
Alcohol (Days/Month), 2004 7.57 (9.67) 9.47 (10.50) 5.89 (8.54)***
*Significant difference between men and women based on t-test or equal proportions test. Significance codes: 0 ‘***’ 0.001 ‘**’ 0.01 ‘*’ 0.05. ‡Summary of equivalent years of regular education based on highest degree. DV=dependent variable.
Page 24 of 70
For peer review only - http://bmjopen.bmj.com/site/about/guidelines.xhtml
BMJ Open
123456789101112131415161718192021222324252627282930313233343536373839404142434445464748495051525354555657585960
on January 9, 2022 by guest. Protected by copyright. http://bmjopen.bmj.com/ BMJ Open: first published as 10.1136/bmjopen-2016-011529 on 23 January 2017. Downloaded from
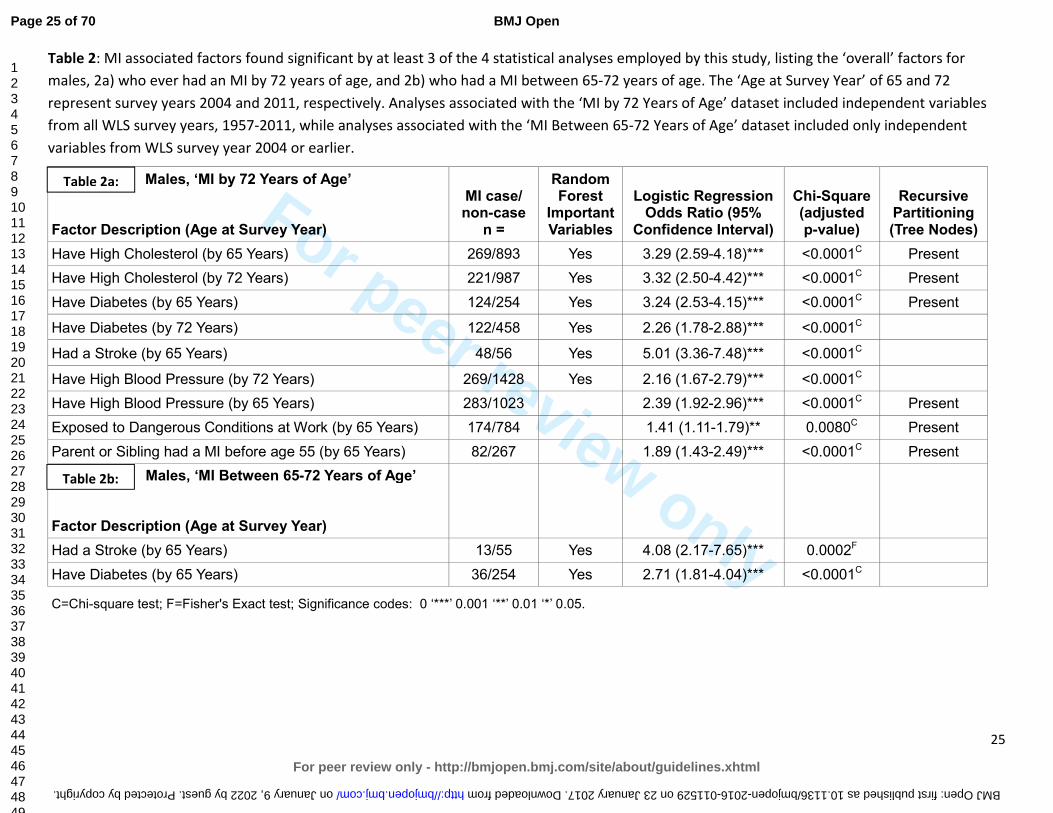
For peer review only
25
Table 2: MI associated factors found significant by at least 3 of the 4 statistical analyses employed by this study, listing the ‘overall’ factors for
males, 2a) who ever had an MI by 72 years of age, and 2b) who had a MI between 65-72 years of age. The ‘Age at Survey Year’ of 65 and 72
represent survey years 2004 and 2011, respectively. Analyses associated with the ‘MI by 72 Years of Age’ dataset included independent variables
from all WLS survey years, 1957-2011, while analyses associated with the ‘MI Between 65-72 Years of Age’ dataset included only independent
variables from WLS survey year 2004 or earlier.
Males, ‘MI by 72 Years of Age’ Factor Description (Age at Survey Year)
MI case/ non-case
n =
Random Forest
Important Variables
Logistic Regression Odds Ratio (95%
Confidence Interval)
Chi-Square (adjusted p-value)
Recursive Partitioning (Tree Nodes)
Have High Cholesterol (by 65 Years) 269/893 Yes 3.29 (2.59-4.18)*** <0.0001C Present
Have High Cholesterol (by 72 Years) 221/987 Yes 3.32 (2.50-4.42)*** <0.0001C Present
Have Diabetes (by 65 Years) 124/254 Yes 3.24 (2.53-4.15)*** <0.0001C Present
Have Diabetes (by 72 Years) 122/458 Yes 2.26 (1.78-2.88)*** <0.0001C
Had a Stroke (by 65 Years) 48/56 Yes 5.01 (3.36-7.48)*** <0.0001C
Have High Blood Pressure (by 72 Years) 269/1428 Yes 2.16 (1.67-2.79)*** <0.0001C
Have High Blood Pressure (by 65 Years) 283/1023 2.39 (1.92-2.96)*** <0.0001C Present
Exposed to Dangerous Conditions at Work (by 65 Years) 174/784 1.41 (1.11-1.79)** 0.0080C Present
Parent or Sibling had a MI before age 55 (by 65 Years) 82/267 1.89 (1.43-2.49)*** <0.0001C Present
Males, ‘MI Between 65-72 Years of Age’ Factor Description (Age at Survey Year)
Had a Stroke (by 65 Years) 13/55 Yes 4.08 (2.17-7.65)*** 0.0002F
Have Diabetes (by 65 Years) 36/254 Yes 2.71 (1.81-4.04)*** <0.0001C
C=Chi-square test; F=Fisher's Exact test; Significance codes: 0 ‘***’ 0.001 ‘**’ 0.01 ‘*’ 0.05.
Table 2a:
Table 2b:
Page 25 of 70
For peer review only - http://bmjopen.bmj.com/site/about/guidelines.xhtml
BMJ Open
123456789101112131415161718192021222324252627282930313233343536373839404142434445464748495051525354555657585960
on January 9, 2022 by guest. Protected by copyright. http://bmjopen.bmj.com/ BMJ Open: first published as 10.1136/bmjopen-2016-011529 on 23 January 2017. Downloaded from
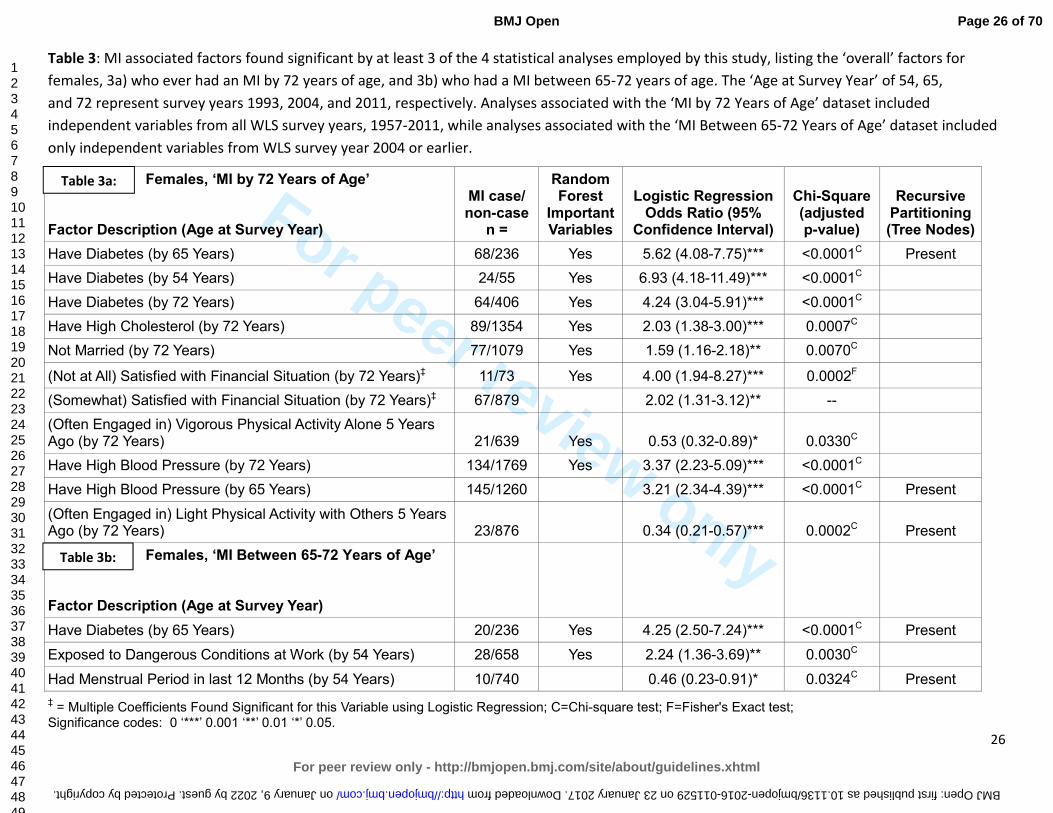
For peer review only
26
Table 3: MI associated factors found significant by at least 3 of the 4 statistical analyses employed by this study, listing the ‘overall’ factors for
females, 3a) who ever had an MI by 72 years of age, and 3b) who had a MI between 65-72 years of age. The ‘Age at Survey Year’ of 54, 65,
and 72 represent survey years 1993, 2004, and 2011, respectively. Analyses associated with the ‘MI by 72 Years of Age’ dataset included
independent variables from all WLS survey years, 1957-2011, while analyses associated with the ‘MI Between 65-72 Years of Age’ dataset included
only independent variables from WLS survey year 2004 or earlier.
‡ = Multiple Coefficients Found Significant for this Variable using Logistic Regression; C=Chi-square test; F=Fisher's Exact test;
Significance codes: 0 ‘***’ 0.001 ‘**’ 0.01 ‘*’ 0.05.
Females, ‘MI by 72 Years of Age’ Factor Description (Age at Survey Year)
MI case/ non-case
n =
Random Forest
Important Variables
Logistic Regression Odds Ratio (95%
Confidence Interval)
Chi-Square (adjusted p-value)
Recursive Partitioning (Tree Nodes)
Have Diabetes (by 65 Years) 68/236 Yes 5.62 (4.08-7.75)*** <0.0001C Present
Have Diabetes (by 54 Years) 24/55 Yes 6.93 (4.18-11.49)*** <0.0001C
Have Diabetes (by 72 Years) 64/406 Yes 4.24 (3.04-5.91)*** <0.0001C
Have High Cholesterol (by 72 Years) 89/1354 Yes 2.03 (1.38-3.00)*** 0.0007C
Not Married (by 72 Years) 77/1079 Yes 1.59 (1.16-2.18)** 0.0070C
(Not at All) Satisfied with Financial Situation (by 72 Years)‡ 11/73 Yes 4.00 (1.94-8.27)*** 0.0002F
(Somewhat) Satisfied with Financial Situation (by 72 Years)‡ 67/879 2.02 (1.31-3.12)** --
(Often Engaged in) Vigorous Physical Activity Alone 5 Years Ago (by 72 Years) 21/639 Yes 0.53 (0.32-0.89)* 0.0330C
Have High Blood Pressure (by 72 Years) 134/1769 Yes 3.37 (2.23-5.09)*** <0.0001C
Have High Blood Pressure (by 65 Years) 145/1260 3.21 (2.34-4.39)*** <0.0001C Present
(Often Engaged in) Light Physical Activity with Others 5 Years Ago (by 72 Years) 23/876 0.34 (0.21-0.57)*** 0.0002C Present
Females, ‘MI Between 65-72 Years of Age’ Factor Description (Age at Survey Year)
Have Diabetes (by 65 Years) 20/236 Yes 4.25 (2.50-7.24)*** <0.0001C Present
Exposed to Dangerous Conditions at Work (by 54 Years) 28/658 Yes 2.24 (1.36-3.69)** 0.0030C
Had Menstrual Period in last 12 Months (by 54 Years) 10/740 0.46 (0.23-0.91)* 0.0324C Present
Table 3b:
Table 3a:
Page 26 of 70
For peer review only - http://bmjopen.bmj.com/site/about/guidelines.xhtml
BMJ Open
123456789101112131415161718192021222324252627282930313233343536373839404142434445464748495051525354555657585960
on January 9, 2022 by guest. Protected by copyright. http://bmjopen.bmj.com/ BMJ Open: first published as 10.1136/bmjopen-2016-011529 on 23 January 2017. Downloaded from
For peer review only
27
a. Contributorship Statement
CSA and TG conceptualized the study. CLR, PH and CSA collected saliva samples and performed genotyping analyses. TG,
JAY, VC, and CL identified the variables and performed the statistical analyses on the Wisconsin Longitudinal Study data
set. CSA, JAY and PH directed the statistical analyses. TG and CSA drafted the manuscript. All authors critically reviewed
the manuscript and approved the final version.
b. Competing Interests
The authors have no competing interests.
c. Funding
Was provided by the National Institute on Aging (AG-9775, AG-21079, and AG-033285), the National Science
Foundation, The Spencer Foundation and the Vilas Estate Trust.
d. Data Sharing Statement
A public use file of data from the Wisconsin Longitudinal Study collected over the last 58 years is available online at
http://www.ssc.wisc.edu/wlsresearch/data.
Page 27 of 70
For peer review only - http://bmjopen.bmj.com/site/about/guidelines.xhtml
BMJ Open
123456789101112131415161718192021222324252627282930313233343536373839404142434445464748495051525354555657585960
on January 9, 2022 by guest. Protected by copyright.
http://bmjopen.bm
j.com/
BM
J Open: first published as 10.1136/bm
jopen-2016-011529 on 23 January 2017. Dow
nloaded from
For peer review only
28
References:
1. Prevention CfDCa. Heart Disease Facts: Centers for Disease Control and Prevention; 2014 [updated October 29, 2014. Available from: http://www.cdc.gov/heartdisease/facts.htm accessed December 11 2014.
2. Murphy SL, Xu J, Kochanek KD. Deaths: final data for 2010. National vital statistics reports: from the
Centers for Disease Control and Prevention, National Center for Health Statistics, National Vital
Statistics System 2013;61(4):1-117. 3. Mozaffarian D, Benjamin EJ, Go AS, et al. Heart Disease and Stroke Statistics—2015 Update: A Report
From the American Heart Association. Circulation 2015;131(4):e29-e322. doi: 10.1161/CIR.0000000000000152
4. Gonzalez-Pacheco H, Vargas-Barron J, Vallejo M, et al. Prevalence of conventional risk factors and lipid profiles in patients with acute coronary syndrome and significant coronary disease. Ther Clin
Risk Manag 2014;10:815-23. doi: 10.2147/tcrm.s67945 [published Online First: 2014/10/21] 5. Yusuf S, Hawken S, Ounpuu S, et al. Effect of potentially modifiable risk factors associated with
myocardial infarction in 52 countries (the INTERHEART study): case-control study. Lancet 2004;364(9438):937-52. doi: 10.1016/s0140-6736(04)17018-9 [published Online First: 2004/09/15]
6. Khot UN, Khot MB, Bajzer CT, et al. Prevalence of conventional risk factors in patients with coronary heart disease. Jama 2003;290(7):898-904. doi: 10.1001/jama.290.7.898 [published Online First: 2003/08/21]
7. James PA, Oparil S, Carter BL, et al. 2014 evidence-based guideline for the management of high blood pressure in adults: report from the panel members appointed to the Eighth Joint National Committee (JNC 8). Jama 2014;311(5):507-20. doi: 10.1001/jama.2013.284427 [published Online First: 2013/12/20]
8. Psaty BM, Furberg CD, Kuller LH, et al. Association between blood pressure level and the risk of myocardial infarction, stroke, and total mortality: the cardiovascular health study. Arch Intern
Med 2001;161(9):1183-92. [published Online First: 2001/05/18] 9. Stone NJ, Robinson JG, Lichtenstein AH, et al. 2013 ACC/AHA Guideline on the Treatment of Blood
Cholesterol to Reduce Atherosclerotic Cardiovascular Risk in Adults: A Report of the American College of Cardiology/American Heart Association Task Force on Practice Guidelines. Circulation 2014;129(25 suppl 2):S1-S45. doi: 10.1161/01.cir.0000437738.63853.7a
10. Langsted A, Freiberg JJ, Tybjaerg-Hansen A, et al. Nonfasting cholesterol and triglycerides and association with risk of myocardial infarction and total mortality: the Copenhagen City Heart Study with 31 years of follow-up. J Intern Med 2011;270(1):65-75. doi: 10.1111/j.1365-2796.2010.02333.x [published Online First: 2011/01/05]
11. Wilson PWF, D’Agostino RB, Levy D, et al. Prediction of Coronary Heart Disease Using Risk Factor Categories. Circulation 1998;97(18):1837-47. doi: 10.1161/01.CIR.97.18.1837
12. Austin MA, Breslow JL, Hennekens CH, et al. Low-density lipoprotein subclass patterns and risk of myocardial infarction. Jama 1988;260(13):1917-21. [published Online First: 1988/10/07]
13. Stamler J, Wentworth D, Neaton JD. Is relationship between serum cholesterol and risk of premature death from coronary heart disease continuous and graded? Findings in 356,222 primary screenees of the Multiple Risk Factor Intervention Trial (MRFIT). Jama 1986;256(20):2823-8. [published Online First: 1986/11/28]
14. Huxley R, Barzi F, Woodward M. Excess risk of fatal coronary heart disease associated with diabetes in men and women: meta-analysis of 37 prospective cohort studies. Bmj 2006;332(7533):73-8. doi: 10.1136/bmj.38678.389583.7C [published Online First: 2005/12/24]
Page 28 of 70
For peer review only - http://bmjopen.bmj.com/site/about/guidelines.xhtml
BMJ Open
123456789101112131415161718192021222324252627282930313233343536373839404142434445464748495051525354555657585960
on January 9, 2022 by guest. Protected by copyright.
http://bmjopen.bm
j.com/
BM
J Open: first published as 10.1136/bm
jopen-2016-011529 on 23 January 2017. Dow
nloaded from

For peer review only
29
15. Hanefeld M, Fischer S, Julius U, et al. Risk factors for myocardial infarction and death in newly detected NIDDM: the Diabetes Intervention Study, 11-year follow-up. Diabetologia 1996;39(12):1577-83. [published Online First: 1996/12/01]
16. Koskinen P, Manttari M, Manninen V, et al. Coronary heart disease incidence in NIDDM patients in the Helsinki Heart Study. Diabetes Care 1992;15(7):820-5. [published Online First: 1992/07/01]
17. Öberg M, Jaakkola MS, Woodward A, et al. Worldwide burden of disease from exposure to second-hand smoke: a retrospective analysis of data from 192 countries. The Lancet 2011;377(9760):139-46. doi: 10.1016/S0140-6736(10)61388-8
18. Critchley JA, Capewell S. Mortality risk reduction associated with smoking cessation in patients with coronary heart disease: a systematic review. Jama 2003;290(1):86-97. doi: 10.1001/jama.290.1.86 [published Online First: 2003/07/03]
19. Prescott E, Hippe M, Schnohr P, et al. Smoking and risk of myocardial infarction in women and men: longitudinal population study. Bmj 1998;316(7137):1043-7. [published Online First: 1998/04/29]
20. Parish S, Collins R, Peto R, et al. Cigarette smoking, tar yields, and non-fatal myocardial infarction: 14,000 cases and 32,000 controls in the United Kingdom. The International Studies of Infarct Survival (ISIS) Collaborators. BMJ : British Medical Journal 1995;311(7003):471-77.
21. Neaton JD, Wentworth D. Serum cholesterol, blood pressure, cigarette smoking, and death from coronary heart disease. Overall findings and differences by age for 316,099 white men. Multiple Risk Factor Intervention Trial Research Group. Arch Intern Med 1992;152(1):56-64. [published Online First: 1992/01/01]
22. Thomsen M, Nordestgaard BG. Myocardial infarction and ischemic heart disease in overweight and obesity with and without metabolic syndrome. JAMA Intern Med 2014;174(1):15-22. doi: 10.1001/jamainternmed.2013.10522 [published Online First: 2013/11/13]
23. Després J-P. Body Fat Distribution and Risk of Cardiovascular Disease: An Update. Circulation 2012;126(10):1301-13. doi: 10.1161/CIRCULATIONAHA.111.067264
24. Logue J, Murray HM, Welsh P, et al. Obesity is associated with fatal coronary heart disease independently of traditional risk factors and deprivation. Heart 2011;97(7):564-8. doi: 10.1136/hrt.2010.211201 [published Online First: 2011/02/18]
25. Yusuf S, Hawken S, Ounpuu S, et al. Obesity and the risk of myocardial infarction in 27,000 participants from 52 countries: a case-control study. Lancet 2005;366(9497):1640-9. doi: 10.1016/s0140-6736(05)67663-5 [published Online First: 2005/11/08]
26. Willett WC, Manson JE, Stampfer MJ, et al. Weight, weight change, and coronary heart disease in women. Risk within the 'normal' weight range. Jama 1995;273(6):461-5. [published Online First: 1995/02/08]
27. Hubert HB, Feinleib M, McNamara PM, et al. Obesity as an independent risk factor for cardiovascular disease: a 26-year follow-up of participants in the Framingham Heart Study. Circulation 1983;67(5):968-77. [published Online First: 1983/05/01]
28. Hoekstra T, Beulens JWJ, van der Schouw YT. Cardiovascular disease prevention in women: Impact of dietary interventions. Maturitas 2009;63(1):20-27. doi: http://dx.doi.org/10.1016/j.maturitas.2009.02.003
29. Iqbal R, Anand S, Ounpuu S, et al. Dietary patterns and the risk of acute myocardial infarction in 52 countries: results of the INTERHEART study. Circulation 2008;118(19):1929-37. doi: 10.1161/circulationaha.107.738716 [published Online First: 2008/10/22]
30. Hu FB. Diet and cardiovascular disease prevention the need for a paradigm shift. J Am Coll Cardiol. United States2007:22-4.
31. Rivellese AA. Diet and cardiovascular disease: Beyond cholesterol. Nutrition, Metabolism and
Cardiovascular Diseases 2005;15(6):395-98. doi: 10.1016/j.numecd.2005.10.004
Page 29 of 70
For peer review only - http://bmjopen.bmj.com/site/about/guidelines.xhtml
BMJ Open
123456789101112131415161718192021222324252627282930313233343536373839404142434445464748495051525354555657585960
on January 9, 2022 by guest. Protected by copyright.
http://bmjopen.bm
j.com/
BM
J Open: first published as 10.1136/bm
jopen-2016-011529 on 23 January 2017. Dow
nloaded from
For peer review only
30
32. Martínez-González MA, Fernandez-Jarne E, Serrano-Martinez M, et al. Mediterranean diet and reduction in the risk of a first acute myocardial infarction: an operational healthy dietary score. Eur J Nutr 2002;41(4):153-60. doi: 10.1007/s00394-002-0370-6 [published Online First: 2002/09/21]
33. Joshipura KJ, Hu FB, Manson JE, et al. The effect of fruit and vegetable intake on risk for coronary heart disease. Ann Intern Med 2001;134(12):1106-14. [published Online First: 2001/06/20]
34. Liu S, Stampfer MJ, Hu FB, et al. Whole-grain consumption and risk of coronary heart disease: results from the Nurses' Health Study. Am J Clin Nutr 1999;70(3):412-9. [published Online First: 1999/09/09]
35. Daviglus ML, Stamler J, Orencia AJ, et al. Fish Consumption and the 30-Year Risk of Fatal Myocardial Infarction. New England Journal of Medicine 1997;336(15):1046-53. doi: 10.1056/NEJM199704103361502
36. Ascherio A, Hennekens CH, Buring JE, et al. Trans-fatty acids intake and risk of myocardial infarction. Circulation 1994;89(1):94-101. [published Online First: 1994/01/01]
37. Lee IM, Shiroma EJ, Lobelo F, et al. Effect of physical inactivity on major non-communicable diseases worldwide: an analysis of burden of disease and life expectancy. Lancet 2012;380(9838):219-29. doi: 10.1016/s0140-6736(12)61031-9 [published Online First: 2012/07/24]
38. Li J, Siegrist J. Physical activity and risk of cardiovascular disease—a meta-analysis of prospective cohort studies. International journal of environmental research and public health 2012;9(2):391-407.
39. Chomistek AK, Chiuve SE, Jensen MK, et al. Vigorous physical activity, mediating biomarkers, and risk of myocardial infarction. Med Sci Sports Exerc 2011;43(10):1884-90. doi: 10.1249/MSS.0b013e31821b4d0a [published Online First: 2011/03/31]
40. Sattelmair J, Pertman J, Ding EL, et al. Dose-Response Between Physical Activity and Risk of Coronary Heart Disease: A Meta-Analysis. Circulation 2011;124(7):789-95. doi: 10.1161/CIRCULATIONAHA.110.010710
41. Lakka TA, Venalainen JM, Rauramaa R, et al. Relation of Leisure-Time Physical Activity and Cardiorespiratory Fitness to the Risk of Acute Myocardial Infarction in Men. New England
Journal of Medicine 1994;330(22):1549-54. doi: 10.1056/NEJM199406023302201 42. Leong DP, Smyth A, Teo KK, et al. Patterns of Alcohol Consumption and Myocardial Infarction Risk:
Observations from 52 Countries in the INTERHEART Case-Control Study. Circulation 2014 doi: 10.1161/CIRCULATIONAHA.113.007627
43. Roerecke M, Rehm J. Alcohol consumption, drinking patterns, and ischemic heart disease: a narrative review of meta-analyses and a systematic review and meta-analysis of the impact of heavy drinking occasions on risk for moderate drinkers. BMC Medicine 2014;12(1):1-11. doi: 10.1186/s12916-014-0182-6
44. Brien SE, Ronksley PE, Turner BJ, et al. Effect of alcohol consumption on biological markers associated with risk of coronary heart disease: systematic review and meta-analysis of interventional studies. Bmj 2011;342:d636. doi: 10.1136/bmj.d636 [published Online First: 2011/02/24]
45. Ronksley PE, Brien SE, Turner BJ, et al. Association of alcohol consumption with selected cardiovascular disease outcomes: a systematic review and meta-analysis. Bmj 2011;342:d671. doi: 10.1136/bmj.d671 [published Online First: 2011/02/24]
46. Camargo CA, Jr., Stampfer MJ, Glynn RJ, et al. Moderate alcohol consumption and risk for angina pectoris or myocardial infarction in U.S. male physicians. Ann Intern Med 1997;126(5):372-5. [published Online First: 1997/03/01]
47. Gaziano JM, Buring JE, Breslow JL, et al. Moderate alcohol intake, increased levels of high-density lipoprotein and its subfractions, and decreased risk of myocardial infarction. N Engl J Med
Page 30 of 70
For peer review only - http://bmjopen.bmj.com/site/about/guidelines.xhtml
BMJ Open
123456789101112131415161718192021222324252627282930313233343536373839404142434445464748495051525354555657585960
on January 9, 2022 by guest. Protected by copyright.
http://bmjopen.bm
j.com/
BM
J Open: first published as 10.1136/bm
jopen-2016-011529 on 23 January 2017. Dow
nloaded from
For peer review only
31
1993;329(25):1829-34. doi: 10.1056/nejm199312163292501 [published Online First: 1993/12/16]
48. Mostofsky E, Maclure M, Sherwood JB, et al. Risk of Acute Myocardial Infarction after Death of a Significant Person in One’s Life: The Determinants of MI Onset Study. Circulation 2012;125(3):491-96. doi: 10.1161/CIRCULATIONAHA.111.061770
49. Rosengren A, Hawken S, Ôunpuu S, et al. Association of psychosocial risk factors with risk of acute myocardial infarction in 11 119 cases and 13 648 controls from 52 countries (the INTERHEART study): case-control study. The Lancet 2004;364(9438):953-62. doi: http://dx.doi.org/10.1016/S0140-6736(04)17019-0
50. Peter R, Siegrist J, Hallqvist J, et al. Psychosocial work environment and myocardial infarction: improving risk estimation by combining two complementary job stress models in the SHEEP Study. Journal of Epidemiology and Community Health 2002;56(4):294-300. doi: 10.1136/jech.56.4.294
51. Mittleman MA, Maclure M, Sherwood JB, et al. Triggering of Acute Myocardial Infarction Onset by Episodes of Anger. Circulation 1995;92(7):1720-25. doi: 10.1161/01.CIR.92.7.1720
52. van Loo HM, van den Heuvel ER, Schoevers RA, et al. Sex dependent risk factors for mortality after myocardial infarction: individual patient data meta-analysis. BMC Med 2014;12(1):242. doi: 10.1186/preaccept-1708900131424681 [published Online First: 2014/12/18]
53. Evangelista O, McLaughlin MA. Review of cardiovascular risk factors in women. Gender Medicine 2009;6, Part 1:17-36. doi: http://dx.doi.org/10.1016/j.genm.2009.02.004
54. Schenck-Gustafsson K. Risk factors for cardiovascular disease in women. Maturitas 2009;63(3):186-90. doi: http://dx.doi.org/10.1016/j.maturitas.2009.02.014
55. Anand SS, Islam S, Rosengren A, et al. Risk factors for myocardial infarction in women and men: insights from the INTERHEART study. European Heart Journal 2008;29(7):932-40.
56. Ordovas JM. Gender, a significant factor in the cross talk between genes, environment, and health. Gend Med 2007;4 Suppl B:S111-22. [published Online First: 2007/12/25]
57. Regitz-Zagrosek V, Lehmkuhl E, Mahmoodzadeh S. Gender aspects of the role of the metabolic syndrome as a risk factor for cardiovascular disease. Gend Med 2007;4 Suppl B:S162-77. [published Online First: 2007/12/25]
58. Jousilahti P, Vartiainen E, Tuomilehto J, et al. Sex, age, cardiovascular risk factors, and coronary heart disease: a prospective follow-up study of 14 786 middle-aged men and women in Finland. Circulation 1999;99(9):1165-72. [published Online First: 1999/03/09]
59. Castelli WP, Wilson PWF, Levy D, et al. Cardiovascular risk factors in the elderly. The American
Journal of Cardiology 1989;63(16):12-19. doi: http://dx.doi.org/10.1016/0002-9149(89)90110-0 60. Canto JG, Kiefe CI, Rogers WJ, et al. Number of coronary heart disease risk factors and mortality in
patients with first myocardial infarction. Jama 2011;306(19):2120-7. doi: 10.1001/jama.2011.1654 [published Online First: 2011/11/18]
61. Chow CK, Islam S, Bautista L, et al. Parental history and myocardial infarction risk across the world: the INTERHEART Study. J Am Coll Cardiol 2011;57(5):619-27. doi: 10.1016/j.jacc.2010.07.054 [published Online First: 2011/01/29]
62. Friedlander Y, Siscovick DS, Weinmann S, et al. Family history as a risk factor for primary cardiac arrest. Circulation 1998;97(2):155-60. [published Online First: 1998/01/28]
63. Myers RH, Kiely DK, Cupples LA, et al. Parental history is an independent risk factor for coronary artery disease: the Framingham Study. Am Heart J 1990;120(4):963-9. [published Online First: 1990/10/01]
64. Hunt KJ, Williams K, Resendez RG, et al. All-cause and cardiovascular mortality among diabetic participants in the San Antonio Heart Study: evidence against the "Hispanic Paradox". Diabetes
Care 2002;25(9):1557-63. [published Online First: 2002/08/28]
Page 31 of 70
For peer review only - http://bmjopen.bmj.com/site/about/guidelines.xhtml
BMJ Open
123456789101112131415161718192021222324252627282930313233343536373839404142434445464748495051525354555657585960
on January 9, 2022 by guest. Protected by copyright.
http://bmjopen.bm
j.com/
BM
J Open: first published as 10.1136/bm
jopen-2016-011529 on 23 January 2017. Dow
nloaded from
For peer review only
32
65. Yang Y, Ruiz-Narvaez E, Kraft P, et al. Effect of apolipoprotein E genotype and saturated fat intake on plasma lipids and myocardial infarction in the Central Valley of Costa Rica. Hum Biol 2007;79(6):637-47. doi: 10.1353/hub.2008.0010
66. Lambert JC, Brousseau T, Defosse V, et al. Independent association of an APOE gene promoter polymorphism with increased risk of myocardial infarction and decreased APOE plasma concentrations-the ECTIM study. Hum Mol Genet 2000;9(1):57-61. [published Online First: 1999/12/10]
67. Freeman DJ, Samani NJ, Wilson V, et al. A polymorphism of the cholesteryl ester transfer protein gene predicts cardiovascular events in non-smokers in the West of Scotland Coronary Prevention Study. Eur Heart J 2003;24(20):1833-42. [published Online First: 2003/10/18]
68. Kuivenhoven JA, Jukema JW, Zwinderman AH, et al. The Role of a Common Variant of the Cholesteryl Ester Transfer Protein Gene in the Progression of Coronary Atherosclerosis. New England
Journal of Medicine 1998;338(2):86-93. doi: 10.1056/NEJM199801083380203 69. Fumeron F, Betoulle D, Luc G, et al. Alcohol intake modulates the effect of a polymorphism of the
cholesteryl ester transfer protein gene on plasma high density lipoprotein and the risk of myocardial infarction. J Clin Invest 1995;96(3):1664-71. doi: 10.1172/jci118207 [published Online First: 1995/09/01]
70. Ardissino D, Berzuini C, Merlini PA, et al. Influence of 9p21.3 genetic variants on clinical and angiographic outcomes in early-onset myocardial infarction. J Am Coll Cardiol 2011;58(4):426-34. doi: 10.1016/j.jacc.2010.11.075 [published Online First: 2011/07/16]
71. Qi L, Ma J, Qi Q, et al. Genetic risk score and risk of myocardial infarction in Hispanics. Circulation 2011;123(4):374-80. doi: 10.1161/circulationaha.110.976613 [published Online First: 2011/01/19]
72. Levy D, Wilson PWF, Anderson KM, et al. Stratifying the patient at risk from coronary disease: New insights from the framingham heart study. American Heart Journal 1990;119(3, Part 2):712-17. doi: http://dx.doi.org/10.1016/S0002-8703(05)80050-X
73. Canto JG, Rogers WJ, Goldberg RJ, et al. Association of age and sex with myocardial infarction symptom presentation and in-hospital mortality. Jama 2012;307(8):813-22. doi: 10.1001/jama.2012.199 [published Online First: 2012/02/24]
74. Hanratty B, Lawlor D, Robinson M, et al. Sex differences in risk factors, treatment and mortality after acute myocardial infarction: an observational study. Journal of Epidemiology and Community
Health 2000;54(12):912-16. doi: 10.1136/jech.54.12.912 75. Sewell WH, University of Wisconsin--Madison. Center for Demography and Ecology. As we age : the
Wisconsin Longitudinal Study, 1957-2001. Madison, WI: Center for Demography and Ecology, University of Wisconsin--Madison 2001.
76. Herd P, Carr D, Roan C. Cohort Profile: Wisconsin longitudinal study (WLS). International Journal of
Epidemiology 2014;43(1):34-41. doi: 10.1093/ije/dys194 77. Roetker NS, Yonker JA, Lee C, et al. Multigene interactions and the prediction of depression in the
Wisconsin Longitudinal Study. BMJ Open 2012;2(4) doi: 10.1136/bmjopen-2012-000944 78. Belbin O, Dunn JL, Ling Y, et al. Regulatory region single nucleotide polymorphisms of the
apolipoprotein E gene and the rate of cognitive decline in Alzheimer's disease. Hum Mol Genet 2007;16(18):2199-208. doi: 10.1093/hmg/ddm171
79. Lahoz C, Schaefer EJ, Cupples LA, et al. Apolipoprotein E genotype and cardiovascular disease in the Framingham Heart Study. Atherosclerosis 2001;154(3):529-37. [published Online First: 2001/03/21]
80. Corder EH, Saunders AM, Risch NJ, et al. Protective effect of apolipoprotein E type 2 allele for late onset Alzheimer disease. Nat Genet 1994;7(2):180-4. doi: 10.1038/ng0694-180
Page 32 of 70
For peer review only - http://bmjopen.bmj.com/site/about/guidelines.xhtml
BMJ Open
123456789101112131415161718192021222324252627282930313233343536373839404142434445464748495051525354555657585960
on January 9, 2022 by guest. Protected by copyright.
http://bmjopen.bm
j.com/
BM
J Open: first published as 10.1136/bm
jopen-2016-011529 on 23 January 2017. Dow
nloaded from
For peer review only
33
81. Weisgraber KH, Rall SC, Mahley RW. Human E apoprotein heterogeneity. Cysteine-arginine interchanges in the amino acid sequence of the apo-E isoforms. J Biol Chem 1981;256(17):9077-83.
82. Weisgraber KH, Innerarity TL, Mahley RW. Abnormal lipoprotein receptor-binding activity of the human E apoprotein due to cysteine-arginine interchange at a single site. J Biol Chem 1982;257(5):2518-21.
83. R: A language and environment for statistical computing [program]. Vienna, Austria: R Foundation for Statistical Computing, 2008.
84. rpart: Recursive Partitioning. [program]. R package version 3.1-55. version, 2012. 85. Breiman L, Friedman JH, Olshen RA, et al. Classification and Regression Trees. Boca Raton: Chapman
and Hall/CRC, 1984:368. 86. Altman DG. Practical statistics for medical research. London ; New York: Chapman and Hall 1991. 87. Haldane JB. The estimation and significance of the logarithm of a ratio of frequencies. Ann Hum
Genet 1956;20(4):309-11. doi: 10.1111/j.1469-1809.1955.tb01285.x 88. Gart JJ, Zweifel JR. On the bias of various estimators of the logit and its variance with application to
quantal bioassay. Biometrika 1967;54(1):181-7. doi: 10.2307/2333861 89. Strobl C, Malley J, Tutz G. An introduction to recursive partitioning: rationale, application, and
characteristics of classification and regression trees, bagging, and random forests. Psychol
Methods 2009;14(4):323-48. doi: 10.1037/a0016973 90. Breiman L. Random Forests. Machine Learning 2001;45(1):5-32. doi: 10.1023/A:1010933404324 91. Breiman L. Bagging Predictors. Machine Learning 1996;24(2):123-40. doi: 10.1023/A:1018054314350 92. Amit Y, Geman D. Shape quantization and recognition with randomized trees. Neural Computation
1997;9(7):1545-88. doi: 10.1162/neco.1997.9.7.1545 93. Roshan U, Chikkagoudar S, Wei Z, et al. Ranking causal variants and associated regions in genome-
wide association studies by the support vector machine and random forest. Nucleic Acids Res 2011;39(9):e62. doi: 10.1093/nar/gkr064
94. Jiang R, Tang W, Wu X, et al. A random forest approach to the detection of epistatic interactions in case-control studies. BMC Bioinformatics 2009;10 Suppl 1:S65. doi: 10.1186/1471-2105-10-S1-S65
95. Shi T, Seligson D, Belldegrun AS, et al. Tumor classification by tissue microarray profiling: random forest clustering applied to renal cell carcinoma. Mod Pathol 2005;18(4):547-57. doi: 10.1038/modpathol.3800322
96. Lunetta KL, Hayward LB, Segal J, et al. Screening large-scale association study data: exploiting interactions using random forests. BMC Genet 2004;5:32. doi: 10.1186/1471-2156-5-32
97. Liaw A, Wiener M. Classification and Regression by randomForest. R News 2002;2(3):18-22. 98. Online R documentation for the package 'randomForest' [program]. 4.6-10 version, 2014. 99. Neville PG. Controversy of Variable Importance in Random Forests. Journal of Unified Statistical
Techniques 2013;1(1):15-20. 100. Breiman L, Cutler A. Manual--Setting Up, Using, And Understanding Random Forests V4.0. Berkeley,
California: University of California, Berkeley, 2003:33. 101. Storey JD. A direct approach to false discovery rates. Journal of the Royal Statistical Society: Series B
(Statistical Methodology) 2002;64(3):479-98. doi: 10.1111/1467-9868.00346 102. qvalue: Q-value estimation for false discovery rate control [program]. R package version 1.32.0
version, 2014. 103. Dhamoon MS, Tai W, Boden-Albala B, et al. Risk of myocardial infarction or vascular death after
first ischemic stroke: the Northern Manhattan Study. Stroke. United States2007:1752-8.
Page 33 of 70
For peer review only - http://bmjopen.bmj.com/site/about/guidelines.xhtml
BMJ Open
123456789101112131415161718192021222324252627282930313233343536373839404142434445464748495051525354555657585960
on January 9, 2022 by guest. Protected by copyright.
http://bmjopen.bm
j.com/
BM
J Open: first published as 10.1136/bm
jopen-2016-011529 on 23 January 2017. Dow
nloaded from

For peer review only
34
104. Touzé E, Varenne O, Chatellier G, et al. Risk of Myocardial Infarction and Vascular Death After Transient Ischemic Attack and Ischemic Stroke: A Systematic Review and Meta-Analysis. Stroke 2005;36(12):2748-55. doi: 10.1161/01.STR.0000190118.02275.33
105. Tabrizchi R. Incidence of Stroke After Myocardial Infarction. Vascular Health and Risk Management 2006;2(1):1-2.
106. Lichtman JH, Krumholz HM, Wang Y, et al. Risk and Predictors of Stroke After Myocardial Infarction Among the Elderly: Results From the Cooperative Cardiovascular Project. Circulation 2002;105(9):1082-87. doi: 10.1161/hc0902.104708
107. Loh E, Sutton MSJ, Wun C-CC, et al. Ventricular Dysfunction and the Risk of Stroke after Myocardial Infarction. New England Journal of Medicine 1997;336(4):251-57. doi: 10.1056/NEJM199701233360403
108. Association AH. How Cardiovascular & Stroke Risks Relate: American Stroke Association; 2014 [Available from: http://www.strokeassociation.org/STROKEORG/LifeAfterStroke/HealthyLivingAfterStroke/UnderstandingRiskyConditions/How-Cardiovascular-Stroke-Risks-Relate_UCM_310369_Article.jsp accessed February 26 2015.
109. González-Pacheco H, Vargas-Barron J, Vallejo M, et al. Prevalence of conventional risk factors and lipid profiles in patients with acute coronary syndrome and significant coronary disease. Ther
Clin Risk Manag 2014;10:815-23. doi: 10.2147/tcrm.s67945 [published Online First: 2014/10/21] 110. Magnus P, Beaglehole R. The real contribution of the major risk factors to the coronary epidemics:
time to end the "only-50%" myth. Arch Intern Med 2001;161(22):2657-60. [published Online First: 2001/12/26]
111. Leander K, Hallqvist J, Reuterwall C, et al. Family history of coronary heart disease, a strong risk factor for myocardial infarction interacting with other cardiovascular risk factors: results from the Stockholm Heart Epidemiology Program (SHEEP). Epidemiology 2001;12(2):215-21. [published Online First: 2001/03/15]
112. Roncaglioni MC, Santoro L, D'Avanzo B, et al. Role of family history in patients with myocardial infarction. An Italian case-control study. GISSI-EFRIM Investigators. Circulation 1992;85(6):2065-72. [published Online First: 1992/06/01]
113. Gafarov VV, Gromova EA, Gafarova AV, et al. [Myocardial infarction and stress at work place and in the family: 10-year risk of development in an open population of 2564 year old men (epidemiological study in a framework of the WHO program MONICA-PSYCHOSOCIAL)]. Kardiologiia 2011;51(3):10-6. [published Online First: 2011/06/02]
114. Chandola T, Brunner E, Marmot M. Chronic stress at work and the metabolic syndrome: prospective study. BMJ 2006;332(7540):521-25.
115. Kivimäki M, Leino-Arjas P, Luukkonen R, et al. Work stress and risk of cardiovascular mortality: prospective cohort study of industrial employees. BMJ 2002;325(7369):857.
116. Stamler J, Daviglus ML, Garside DB, et al. Relationship of baseline serum cholesterol levels in 3 large cohorts of younger men to long-term coronary, cardiovascular, and all-cause mortality and to longevity. Jama 2000;284(3):311-8. [published Online First: 2000/07/13]
117. Klag MJ, Ford DE, Mead LA, et al. Serum Cholesterol in Young Men and Subsequent Cardiovascular Disease. New England Journal of Medicine 1993;328(5):313-18. doi: 10.1056/NEJM199302043280504
118. Anderson KM, Castelli WP, Levy D. Cholesterol and mortality. 30 years of follow-up from the Framingham study. Jama 1987;257(16):2176-80. [published Online First: 1987/04/24]
119. Mukamal KJ, Chung H, Jenny NS, et al. Alcohol consumption and risk of coronary heart disease in older adults: the Cardiovascular Health Study. J Am Geriatr Soc. United States2006:30-7.
Page 34 of 70
For peer review only - http://bmjopen.bmj.com/site/about/guidelines.xhtml
BMJ Open
123456789101112131415161718192021222324252627282930313233343536373839404142434445464748495051525354555657585960
on January 9, 2022 by guest. Protected by copyright.
http://bmjopen.bm
j.com/
BM
J Open: first published as 10.1136/bm
jopen-2016-011529 on 23 January 2017. Dow
nloaded from
For peer review only
35
120. Mukamal KJ, Kuller LH, Fitzpatrick AL, et al. Prospective study of alcohol consumption and risk of dementia in older adults. JAMA. United States2003:1405-13.
121. Abramson JL, Williams SA, Krumholz HM, et al. Moderate alcohol consumption and risk of heart failure among older persons. JAMA. United States2001:1971-7.
122. Manson JE, Colditz GA, Stampfer MJ, et al. A prospective study of maturity-onset diabetes mellitus and risk of coronary heart disease and stroke in women. Arch Intern Med 1991;151(6):1141-7. [published Online First: 1991/06/01]
123. Yokoyama H, Higuma T, Nishizaki F, et al. Abstract 16483: Marital Status and Long-Term Mortality of Male Patients Presenting With Acute Myocardial Infarction. Circulation 2014;130(Suppl 2):A16483-A83.
124. Kriegbaum M, Christensen U, Andersen PK, et al. Does the association between broken partnership and first time myocardial infarction vary with time after break-up? International Journal of
Epidemiology 2013;42(6):1811-19. doi: 10.1093/ije/dyt190 125. Lammintausta A, Airaksinen JKE, Immonen-Räihä P, et al. Prognosis of acute coronary events is
worse in patients living alone: the FINAMI myocardial infarction register. European Journal of
Preventive Cardiology 2013 doi: 10.1177/2047487313475893 126. Hu B, Li W, Wang X, et al. Marital Status, Education, and Risk of Acute Myocardial Infarction in
Mainland China: The INTER-HEART Study. Journal of Epidemiology 2012;22(2):123-29. doi: 10.2188/jea.JE20100175
127. Waltz M. Marital context and post-infarction quality of life: Is it social support or something more? Social Science & Medicine 1986;22(8):791-805. doi: http://dx.doi.org/10.1016/0277-9536(86)90233-9
128. Chandra V, Szklo M, Goldberg R, et al. THE IMPACT OF MARITAL STATUS ON SURVIVAL AFTER AN ACUTE MYOCARDIAL INFARCTION: A POPULATION-BASED STUDY. American Journal of
Epidemiology 1983;117(3):320-25. 129. Welin C, Rosengren A, Wedel H, et al. Myocardial infarction in relation to work, family and life
events. Cardiovascular Risk Factors 1995;5(1):30-38. 130. Eaker ED, Pinsky J, Castelli WP. Myocardial Infarction and Coronary Death among Women:
Psychosocial Predictors from a 20-Year Follow-up of Women in the Framingham Study. American Journal of Epidemiology 1992;135(8):854-64.
131. Lanas F, Avezum A, Bautista LE, et al. Risk Factors for Acute Myocardial Infarction in Latin America: The INTERHEART Latin American Study. Circulation 2007;115(9):1067-74. doi: 10.1161/CIRCULATIONAHA.106.633552
132. Feller S, Teucher B, Kaaks R, et al. Life Satisfaction and Risk of Chronic Diseases in the European Prospective Investigation into Cancer and Nutrition (EPIC)-Germany Study. PLoS ONE 2013;8(8):e73462. doi: 10.1371/journal.pone.0073462
133. Łopuszańska M, Szklarska A, Lipowicz A, et al. Life satisfaction and cardiovascular disease risk in Poland. Archives of Medical Science : AMS 2013;9(4):629-34. doi: 10.5114/aoms.2013.36909
134. Boehm JK, Peterson C, Kivimaki M, et al. Heart health when life is satisfying: evidence from the Whitehall II cohort study. Eur Heart J. England2011:2672-7.
135. Welin C, Lappas G, Wilhelmsen L. Independent importance of psychosocial factors for prognosis after myocardial infarction. J Intern Med. England2000:629-39.
136. Brezinka V, Kittel F. Psychosocial factors of coronary heart disease in women: a review. Soc Sci Med 1996;42(10):1351-65. [published Online First: 1996/05/01]
137. Juutilainen A, Lehto S, Ronnemaa T, et al. Type 2 diabetes as a "coronary heart disease equivalent": an 18-year prospective population-based study in Finnish subjects. Diabetes Care. United States2005:2901-7.
Page 35 of 70
For peer review only - http://bmjopen.bmj.com/site/about/guidelines.xhtml
BMJ Open
123456789101112131415161718192021222324252627282930313233343536373839404142434445464748495051525354555657585960
on January 9, 2022 by guest. Protected by copyright.
http://bmjopen.bm
j.com/
BM
J Open: first published as 10.1136/bm
jopen-2016-011529 on 23 January 2017. Dow
nloaded from

For peer review only
36
138. Hu FB, Stampfer MJ, Solomon CG, et al. The impact of diabetes mellitus on mortality from all causes and coronary heart disease in women: 20 years of follow-up. Arch Intern Med. United States2001:1717-23.
139. Haffner SM, Lehto S, Rönnemaa T, et al. Mortality from Coronary Heart Disease in Subjects with Type 2 Diabetes and in Nondiabetic Subjects with and without Prior Myocardial Infarction. New
England Journal of Medicine 1998;339(4):229-34. doi: 10.1056/NEJM199807233390404 140. Parker WH, Feskanich D, Broder MS, et al. Long-term mortality associated with oophorectomy
compared with ovarian conservation in the nurses' health study. Obstet Gynecol. United States2013:709-16.
141. Wellons M, Ouyang P, Schreiner PJ, et al. Early menopause predicts future coronary heart disease and stroke: the Multi-Ethnic Study of Atherosclerosis. Menopause 2012;19(10):1081-7. doi: 10.1097/gme.0b013e3182517bd0 [published Online First: 2012/06/14]
142. Ingelsson E, Lundholm C, Johansson AL, et al. Hysterectomy and risk of cardiovascular disease: a population-based cohort study. Eur Heart J. England2011:745-50.
143. Parker WH, Broder MS, Chang E, et al. Ovarian conservation at the time of hysterectomy and long-term health outcomes in the nurses' health study. Obstet Gynecol. United States2009:1027-37.
144. Dørum A, Tonstad S, Liavaag AH, et al. Bilateral oophorectomy before 50 years of age is significantly associated with the metabolic syndrome and Framingham risk score: A controlled, population-based study (HUNT-2). Gynecologic Oncology 2008;109(3):377-83. doi: http://dx.doi.org/10.1016/j.ygyno.2008.02.025
145. Lobo RA. Surgical menopause and cardiovascular risks. Menopause. United States2007:562-6. 146. Simon T, Mary-Krause M, Cambou JP, et al. Impact of age and gender on in-hospital and late
mortality after acute myocardial infarction: increased early risk in younger women: results from the French nation-wide USIC registries. Eur Heart J. England2006:1282-8.
147. Falkeborn M, Schairer C, Naessen T, et al. Risk of myocardial infarction after oophorectomy and hysterectomy. J Clin Epidemiol. England2000:832-7.
148. Stampfer MJ, Colditz GA, Willett WC. Menopause and Heart Disease. Annals of the New York
Academy of Sciences 1990;592(1):193-203. doi: 10.1111/j.1749-6632.1990.tb30329.x 149. Colditz GA, Willett WC, Stampfer MJ, et al. Menopause and the risk of coronary heart disease in
women. N Engl J Med 1987;316(18):1105-10. doi: 10.1056/nejm198704303161801 [published Online First: 1987/04/30]
150. Rosenberg L, Hennekens CH, Rosner B, et al. Early menopause and the risk of myocardial infarction. Am J Obstet Gynecol. United States1981:47-51.
151. Schierbeck LL, Rejnmark L, Tofteng CL, et al. Effect of hormone replacement therapy on cardiovascular events in recently postmenopausal women: randomised trial. BMJ 2012;345
152. Falkeborn M, Persson I, Adami H-O, et al. The risk of acute myocardial infarction after oestrogen and oestrogen-progestogen replacement. BJOG: An International Journal of Obstetrics &
Gynaecology 1992;99(10):821-28. doi: 10.1111/j.1471-0528.1992.tb14414.x 153. Jia EZ, Xu ZX, Guo CY, et al. Renin-angiotensin-aldosterone system gene polymorphisms and
coronary artery disease: detection of gene-gene and gene-environment interactions. Cell Physiol
Biochem 2012;29(3-4):443-52. doi: 10.1159/000338498 [published Online First: 2012/04/18] 154. Oki K, Yamane K, Satoh K, et al. Aldosterone synthase (CYP11B2) C-344T polymorphism affects the
association of age-related changes of the serum C-reactive protein. Hypertens Res 2010;33(4):326-30. doi: 10.1038/hr.2009.233 [published Online First: 2010/01/23]
155. Kumar NN, Benjafield AV, Lin RCY, et al. Haplotype analysis of aldosterone synthase gene (CYP11B2) polymorphisms shows association with essential hypertension. Journal of Hypertension 2003;21(7)
Page 36 of 70
For peer review only - http://bmjopen.bmj.com/site/about/guidelines.xhtml
BMJ Open
123456789101112131415161718192021222324252627282930313233343536373839404142434445464748495051525354555657585960
on January 9, 2022 by guest. Protected by copyright.
http://bmjopen.bm
j.com/
BM
J Open: first published as 10.1136/bm
jopen-2016-011529 on 23 January 2017. Dow
nloaded from

For peer review only
37
156. Tsukada K, Ishimitsu T, Teranishi M, et al. Positive association of CYP11B2 gene polymorphism with genetic predisposition to essential hypertension. J Hum Hypertens 2002;16(11):789-93. doi: 10.1038/sj.jhh.1001484 [published Online First: 2002/11/22]
157. Tamaki S, Iwai N, Tsujita Y, et al. Genetic Polymorphism of CYP11B2 Gene and Hypertension in Japanese. Hypertension 1999;33(1):266-70. doi: 10.1161/01.HYP.33.1.266
158. Gigante B, Bennet AM, Leander K, et al. The interaction between coagulation factor 2 receptor and interleukin 6 haplotypes increases the risk of myocardial infarction in men. PLoS One 2010;5(6):e11300. doi: 10.1371/journal.pone.0011300
159. Liu Y, Berthier-Schaad Y, Fallin MD, et al. IL-6 Haplotypes, Inflammation, and Risk for Cardiovascular Disease in a Multiethnic Dialysis Cohort. Journal of the American Society of Nephrology 2006;17(3):863-70. doi: 10.1681/ASN.2005050465
160. Bennet AM, Prince JA, Fei G-Z, et al. Interleukin-6 serum levels and genotypes influence the risk for myocardial infarction. Atherosclerosis 2003;171(2):359-67. doi: 10.1016/j.atherosclerosis.2003.08.029
161. Borzyszkowska J, Stanislawska-Sachadyn A, Wirtwein M, et al. Angiotensin converting enzyme gene polymorphism is associated with severity of coronary artery disease in men with high total cholesterol levels. J Appl Genet 2012;53(2):175-82. doi: 10.1007/s13353-012-0083-3 [published Online First: 2012/02/07]
162. Mishra A, Srivastava A, Mittal T, et al. Impact of renin-angiotensin-aldosterone system gene polymorphisms on left ventricular dysfunction in coronary artery disease patients. Dis Markers 2012;32(1):33-41. doi: 10.3233/dma-2012-0858 [published Online First: 2012/02/03]
163. Patel S, Steeds R, Channer K, et al. Analysis of promoter region polymorphism in the aldosterone synthase gene (CYP11B2) as a risk factor for myocardial infarction. American Journal of
Hypertension 2000;13(2):134-39. doi: 10.1016/S0895-7061(99)00176-4 164. Bis JC, Heckbert SR, Smith NL, et al. Variation in inflammation-related genes and risk of incident
nonfatal myocardial infarction or ischemic stroke. Atherosclerosis 2008;198(1):166-73. doi: http://dx.doi.org/10.1016/j.atherosclerosis.2007.09.031
165. Rosamond WD, Sprafka JM, McGovern PG, et al. Validation of Self-Reported History of Acute Myocardial Infarction: Experience of the Minnesota Heart Survey Registry. Epidemiology 1995;6(1):67-69. doi: 10.2307/3702452
Page 37 of 70
For peer review only - http://bmjopen.bmj.com/site/about/guidelines.xhtml
BMJ Open
123456789101112131415161718192021222324252627282930313233343536373839404142434445464748495051525354555657585960
on January 9, 2022 by guest. Protected by copyright.
http://bmjopen.bm
j.com/
BM
J Open: first published as 10.1136/bm
jopen-2016-011529 on 23 January 2017. Dow
nloaded from

For peer review only
Figure 1
131x99mm (300 x 300 DPI)
Page 38 of 70
For peer review only - http://bmjopen.bmj.com/site/about/guidelines.xhtml
BMJ Open
123456789101112131415161718192021222324252627282930313233343536373839404142434445464748495051525354555657585960
on January 9, 2022 by guest. Protected by copyright.
http://bmjopen.bm
j.com/
BM
J Open: first published as 10.1136/bm
jopen-2016-011529 on 23 January 2017. Dow
nloaded from
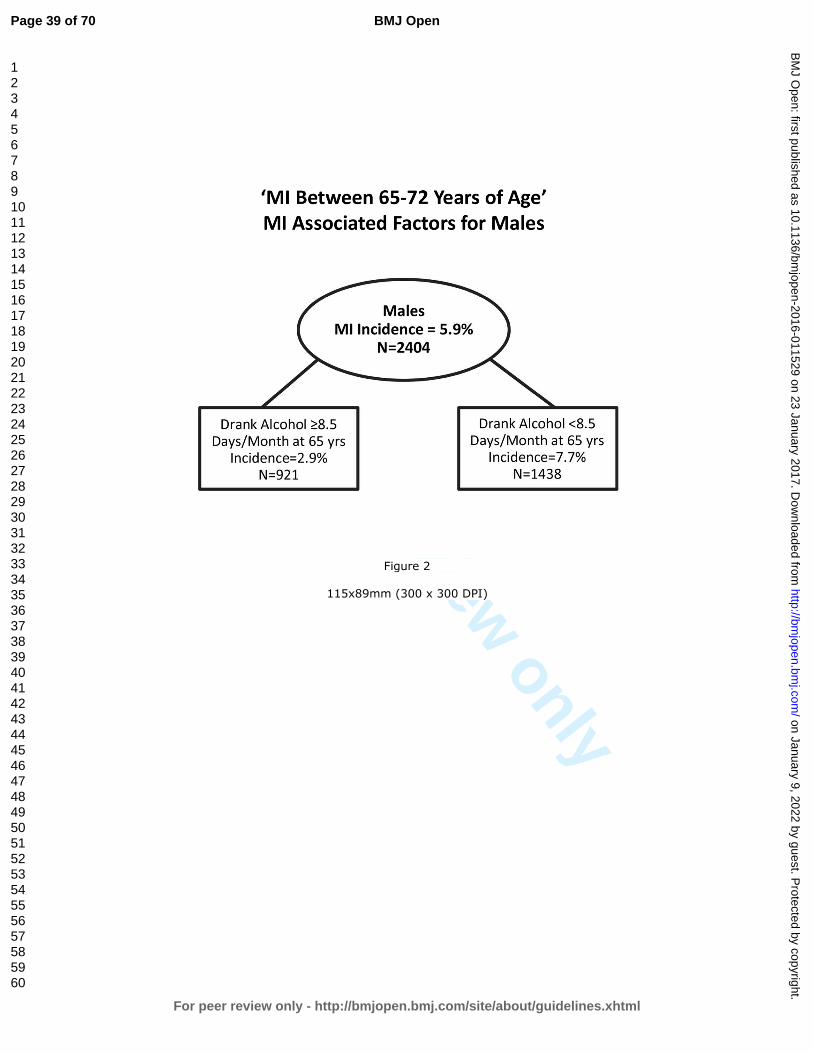
For peer review only
Figure 2
115x89mm (300 x 300 DPI)
Page 39 of 70
For peer review only - http://bmjopen.bmj.com/site/about/guidelines.xhtml
BMJ Open
123456789101112131415161718192021222324252627282930313233343536373839404142434445464748495051525354555657585960
on January 9, 2022 by guest. Protected by copyright.
http://bmjopen.bm
j.com/
BM
J Open: first published as 10.1136/bm
jopen-2016-011529 on 23 January 2017. Dow
nloaded from
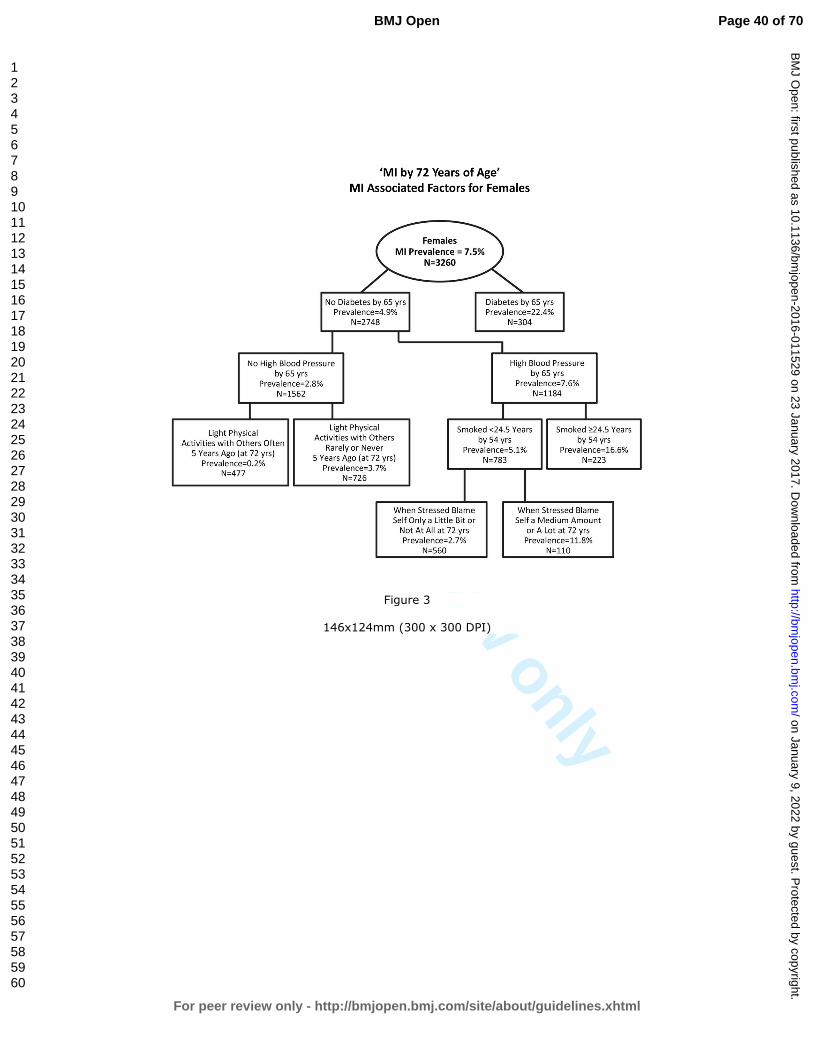
For peer review only
Figure 3
146x124mm (300 x 300 DPI)
Page 40 of 70
For peer review only - http://bmjopen.bmj.com/site/about/guidelines.xhtml
BMJ Open
123456789101112131415161718192021222324252627282930313233343536373839404142434445464748495051525354555657585960
on January 9, 2022 by guest. Protected by copyright.
http://bmjopen.bm
j.com/
BM
J Open: first published as 10.1136/bm
jopen-2016-011529 on 23 January 2017. Dow
nloaded from

For peer review only
Figure 4
137x108mm (300 x 300 DPI)
Page 41 of 70
For peer review only - http://bmjopen.bmj.com/site/about/guidelines.xhtml
BMJ Open
123456789101112131415161718192021222324252627282930313233343536373839404142434445464748495051525354555657585960
on January 9, 2022 by guest. Protected by copyright.
http://bmjopen.bm
j.com/
BM
J Open: first published as 10.1136/bm
jopen-2016-011529 on 23 January 2017. Dow
nloaded from

For peer review only
Supplemental Table 1: WLS participant response and attrition for survey waves 1993, 2004, and 2011. The number of participants from each survey wave included in the ‘MI by 72 Years of Age’ analysis, as well as the number of participants who died before each survey wave is included.
Participant Attrition 1993 Survey Wave 2004 Survey Wave 2011 Survey Wave Total participant response to WLS (n =) 8493 7265 5968 Included in 'MI by 72 Years of Age' analysis (n =) 6013 5757 5939 Non-respondents who died before survey wave (n =) 587 1287 1587 Attrition from WLS for other reasons (n=) 1237 1765 2762
Page 42 of 70
For peer review only - http://bmjopen.bmj.com/site/about/guidelines.xhtml
BMJ Open
123456789101112131415161718192021222324252627282930313233343536373839404142434445464748495051525354555657585960
on January 9, 2022 by guest. Protected by copyright.
http://bmjopen.bm
j.com/
BM
J Open: first published as 10.1136/bm
jopen-2016-011529 on 23 January 2017. Dow
nloaded from
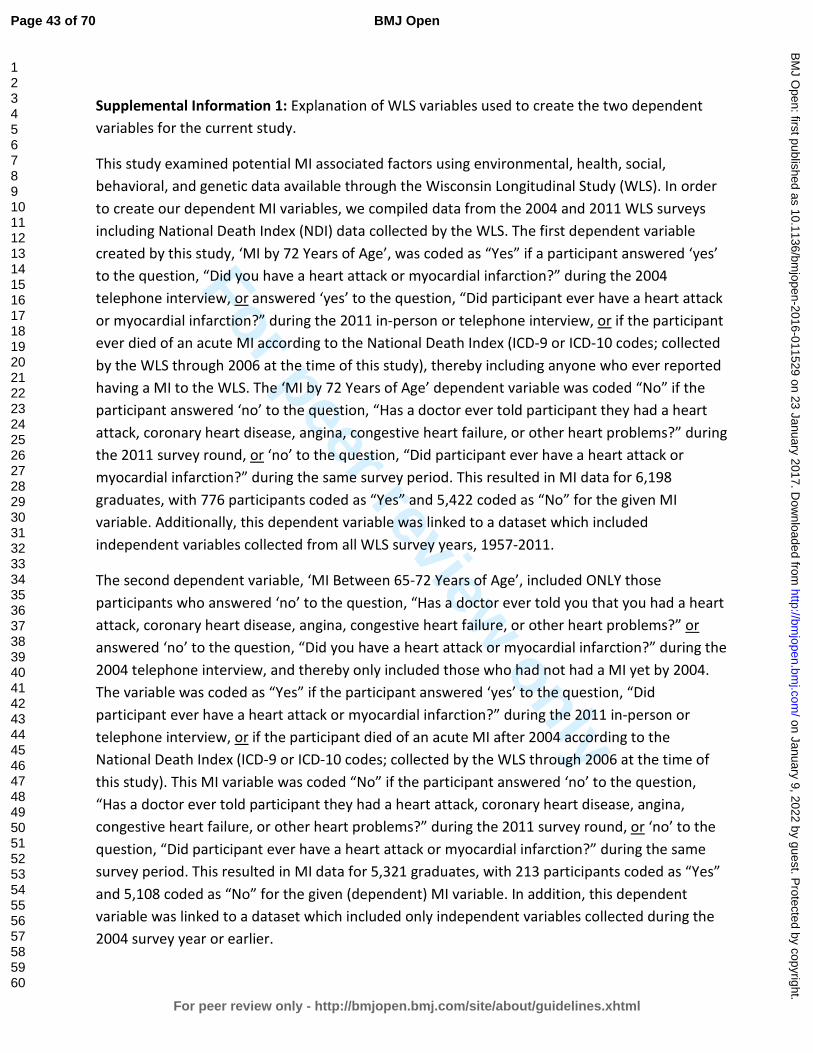
For peer review only
Supplemental Information 1: Explanation of WLS variables used to create the two dependent variables for the current study.
This study examined potential MI associated factors using environmental, health, social, behavioral, and genetic data available through the Wisconsin Longitudinal Study (WLS). In order to create our dependent MI variables, we compiled data from the 2004 and 2011 WLS surveys including National Death Index (NDI) data collected by the WLS. The first dependent variable created by this study, ‘MI by 72 Years of Age’, was coded as “Yes” if a participant answered ‘yes’ to the question, “Did you have a heart attack or myocardial infarction?” during the 2004 telephone interview, or answered ‘yes’ to the question, “Did participant ever have a heart attack or myocardial infarction?” during the 2011 in-person or telephone interview, or if the participant ever died of an acute MI according to the National Death Index (ICD-9 or ICD-10 codes; collected by the WLS through 2006 at the time of this study), thereby including anyone who ever reported having a MI to the WLS. The ‘MI by 72 Years of Age’ dependent variable was coded “No” if the participant answered ‘no’ to the question, “Has a doctor ever told participant they had a heart attack, coronary heart disease, angina, congestive heart failure, or other heart problems?” during the 2011 survey round, or ‘no’ to the question, “Did participant ever have a heart attack or myocardial infarction?” during the same survey period. This resulted in MI data for 6,198 graduates, with 776 participants coded as “Yes” and 5,422 coded as “No” for the given MI variable. Additionally, this dependent variable was linked to a dataset which included independent variables collected from all WLS survey years, 1957-2011.
The second dependent variable, ‘MI Between 65-72 Years of Age’, included ONLY those participants who answered ‘no’ to the question, “Has a doctor ever told you that you had a heart attack, coronary heart disease, angina, congestive heart failure, or other heart problems?” or answered ‘no’ to the question, “Did you have a heart attack or myocardial infarction?” during the 2004 telephone interview, and thereby only included those who had not had a MI yet by 2004. The variable was coded as “Yes” if the participant answered ‘yes’ to the question, “Did participant ever have a heart attack or myocardial infarction?” during the 2011 in-person or telephone interview, or if the participant died of an acute MI after 2004 according to the National Death Index (ICD-9 or ICD-10 codes; collected by the WLS through 2006 at the time of this study). This MI variable was coded “No” if the participant answered ‘no’ to the question, “Has a doctor ever told participant they had a heart attack, coronary heart disease, angina, congestive heart failure, or other heart problems?” during the 2011 survey round, or ‘no’ to the question, “Did participant ever have a heart attack or myocardial infarction?” during the same survey period. This resulted in MI data for 5,321 graduates, with 213 participants coded as “Yes” and 5,108 coded as “No” for the given (dependent) MI variable. In addition, this dependent variable was linked to a dataset which included only independent variables collected during the 2004 survey year or earlier.
Page 43 of 70
For peer review only - http://bmjopen.bmj.com/site/about/guidelines.xhtml
BMJ Open
123456789101112131415161718192021222324252627282930313233343536373839404142434445464748495051525354555657585960
on January 9, 2022 by guest. Protected by copyright.
http://bmjopen.bm
j.com/
BM
J Open: first published as 10.1136/bm
jopen-2016-011529 on 23 January 2017. Dow
nloaded from
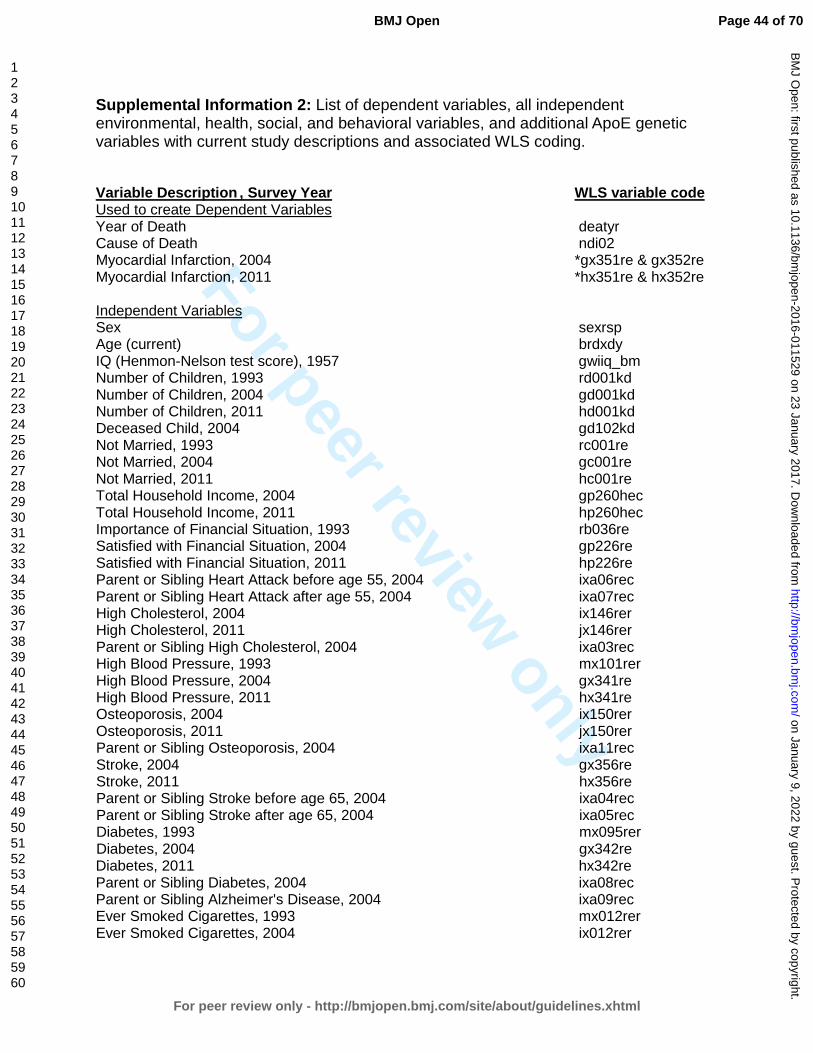
For peer review only
Supplemental Information 2: List of dependent variables, all independent environmental, health, social, and behavioral variables, and additional ApoE genetic variables with current study descriptions and associated WLS coding. Variable Description , Survey Year WLS variable code Used to create Dependent Variables Year of Death deatyr Cause of Death ndi02 Myocardial Infarction, 2004 *gx351re & gx352re Myocardial Infarction, 2011 *hx351re & hx352re Independent Variables Sex sexrsp Age (current) brdxdy IQ (Henmon-Nelson test score), 1957 gwiiq_bm Number of Children, 1993 rd001kd Number of Children, 2004 gd001kd Number of Children, 2011 hd001kd Deceased Child, 2004 gd102kd Not Married, 1993 rc001re Not Married, 2004 gc001re Not Married, 2011 hc001re Total Household Income, 2004 gp260hec Total Household Income, 2011 hp260hec Importance of Financial Situation, 1993 rb036re Satisfied with Financial Situation, 2004 gp226re Satisfied with Financial Situation, 2011 hp226re Parent or Sibling Heart Attack before age 55, 2004 ixa06rec Parent or Sibling Heart Attack after age 55, 2004 ixa07rec High Cholesterol, 2004 ix146rer High Cholesterol, 2011 jx146rer Parent or Sibling High Cholesterol, 2004 ixa03rec High Blood Pressure, 1993 mx101rer High Blood Pressure, 2004 gx341re High Blood Pressure, 2011 hx341re Osteoporosis, 2004 ix150rer Osteoporosis, 2011 jx150rer Parent or Sibling Osteoporosis, 2004 ixa11rec Stroke, 2004 gx356re Stroke, 2011 hx356re Parent or Sibling Stroke before age 65, 2004 ixa04rec Parent or Sibling Stroke after age 65, 2004 ixa05rec Diabetes, 1993 mx095rer Diabetes, 2004 gx342re Diabetes, 2011 hx342re Parent or Sibling Diabetes, 2004 ixa08rec Parent or Sibling Alzheimer's Disease, 2004 ixa09rec Ever Smoked Cigarettes, 1993 mx012rer Ever Smoked Cigarettes, 2004 ix012rer
Page 44 of 70
For peer review only - http://bmjopen.bmj.com/site/about/guidelines.xhtml
BMJ Open
123456789101112131415161718192021222324252627282930313233343536373839404142434445464748495051525354555657585960
on January 9, 2022 by guest. Protected by copyright.
http://bmjopen.bm
j.com/
BM
J Open: first published as 10.1136/bm
jopen-2016-011529 on 23 January 2017. Dow
nloaded from
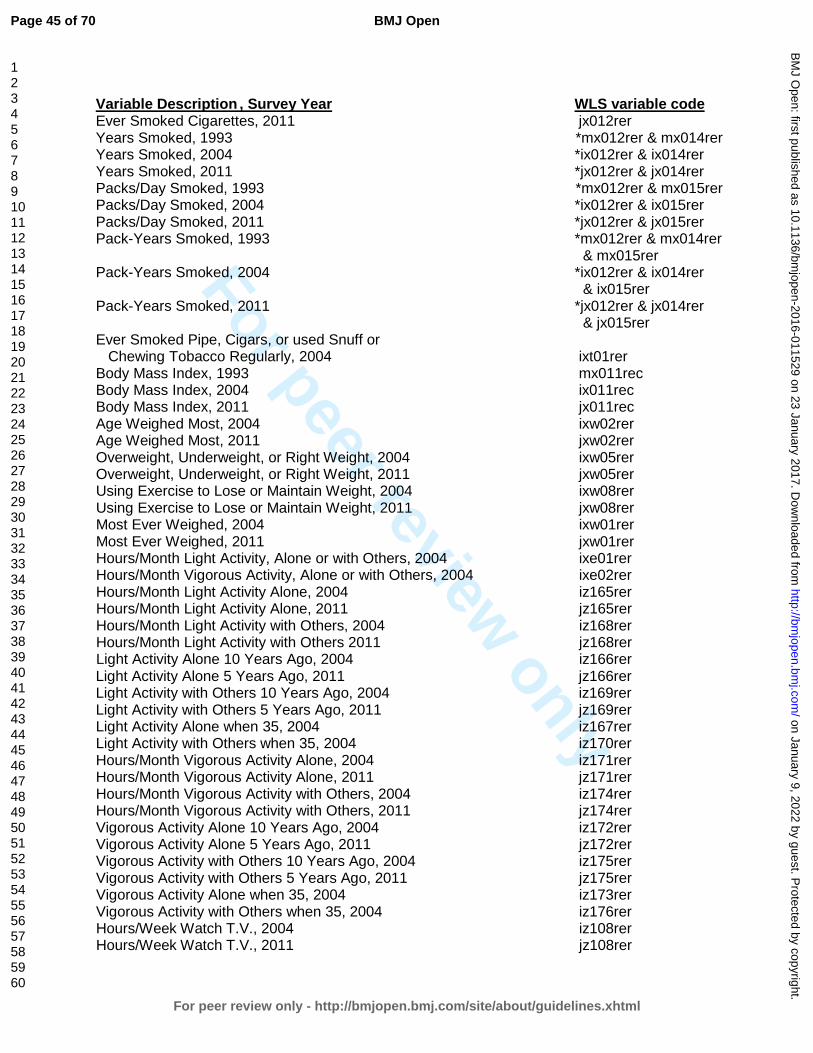
For peer review only
Variable Description , Survey Year WLS variable code Ever Smoked Cigarettes, 2011 jx012rer Years Smoked, 1993 *mx012rer & mx014rer Years Smoked, 2004 *ix012rer & ix014rer Years Smoked, 2011 *jx012rer & jx014rer Packs/Day Smoked, 1993 *mx012rer & mx015rer Packs/Day Smoked, 2004 *ix012rer & ix015rer Packs/Day Smoked, 2011 *jx012rer & jx015rer Pack-Years Smoked, 1993 *mx012rer & mx014rer & mx015rer Pack-Years Smoked, 2004 *ix012rer & ix014rer & ix015rer Pack-Years Smoked, 2011 *jx012rer & jx014rer & jx015rer Ever Smoked Pipe, Cigars, or used Snuff or Chewing Tobacco Regularly, 2004 ixt01rer Body Mass Index, 1993 mx011rec Body Mass Index, 2004 ix011rec Body Mass Index, 2011 jx011rec Age Weighed Most, 2004 ixw02rer Age Weighed Most, 2011 jxw02rer Overweight, Underweight, or Right Weight, 2004 ixw05rer Overweight, Underweight, or Right Weight, 2011 jxw05rer Using Exercise to Lose or Maintain Weight, 2004 ixw08rer Using Exercise to Lose or Maintain Weight, 2011 jxw08rer Most Ever Weighed, 2004 ixw01rer Most Ever Weighed, 2011 jxw01rer Hours/Month Light Activity, Alone or with Others, 2004 ixe01rer Hours/Month Vigorous Activity, Alone or with Others, 2004 ixe02rer Hours/Month Light Activity Alone, 2004 iz165rer Hours/Month Light Activity Alone, 2011 jz165rer Hours/Month Light Activity with Others, 2004 iz168rer Hours/Month Light Activity with Others 2011 jz168rer Light Activity Alone 10 Years Ago, 2004 iz166rer Light Activity Alone 5 Years Ago, 2011 jz166rer Light Activity with Others 10 Years Ago, 2004 iz169rer Light Activity with Others 5 Years Ago, 2011 jz169rer Light Activity Alone when 35, 2004 iz167rer Light Activity with Others when 35, 2004 iz170rer Hours/Month Vigorous Activity Alone, 2004 iz171rer Hours/Month Vigorous Activity Alone, 2011 jz171rer Hours/Month Vigorous Activity with Others, 2004 iz174rer Hours/Month Vigorous Activity with Others, 2011 jz174rer Vigorous Activity Alone 10 Years Ago, 2004 iz172rer Vigorous Activity Alone 5 Years Ago, 2011 jz172rer Vigorous Activity with Others 10 Years Ago, 2004 iz175rer Vigorous Activity with Others 5 Years Ago, 2011 jz175rer Vigorous Activity Alone when 35, 2004 iz173rer Vigorous Activity with Others when 35, 2004 iz176rer Hours/Week Watch T.V., 2004 iz108rer Hours/Week Watch T.V., 2011 jz108rer
Page 45 of 70
For peer review only - http://bmjopen.bmj.com/site/about/guidelines.xhtml
BMJ Open
123456789101112131415161718192021222324252627282930313233343536373839404142434445464748495051525354555657585960
on January 9, 2022 by guest. Protected by copyright.
http://bmjopen.bm
j.com/
BM
J Open: first published as 10.1136/bm
jopen-2016-011529 on 23 January 2017. Dow
nloaded from

For peer review only
Variable Description , Survey Year WLS variable code How often Watched T.V. 10 Years Ago, 2004 iz109rer How often Watched T.V. when 35, 2004 iz110rer How often Watched T.V. 5 Years Ago, 2011 jz109rer Person in Family to Share Feelings and Concerns, 1993 mv053rer Person in Family to Share Feelings and Concerns, 2004 iv053rer Person in Family to Share Feelings and Concerns, 2011 jv053rer Friend Outside Family to Share Feelings and Concerns, 1993 mv054rer Friend Outside Family to Share Feelings and Concerns, 2004 iv054rer Friend Outside Family to Share Feelings and Concerns, 2011 jv054rer Trouble Sleeping in Past 6 Months, 1993 mx019rer Trouble Sleeping in Past 6 Months, 2004 ix019rer Days/Week Sleep Restlessly, 1993 mu020rer Days/Week Sleep Restlessly, 2004 iu020rer Days/Week Sleep Restlessly, 2011 ju020rer Hours of Sleep on a Weekday, 2011 jxsl11re Worry a Lot, 1993 mh029rer Worry a Lot, 2004 ih029rer Worry a Lot, 2011 jh029rer Feel Confident and Positive about Yourself, 1993 mn049rer Feel Confident and Positive about Yourself, 2004 in049rer Feel Confident and Positive about Yourself, 2011 jn049rer Created Lifestyle to Your Liking, 1993 mn017rer Created Lifestyle to Your Liking, 2004 in017rer Created Lifestyle to Your Liking, 2011 jn017rer Days/Week Feel Fearful, 1993 mu019rer Days/Week Feel Fearful, 2004 iu019rer Days/Week Feel Fearful, 2011 ju019rer Days/Week Feel Relaxed, 2004 iu047rer Days/Week Feel Relaxed, 2011 ju047rer Are Relaxed and Handle Stress Well, 1993 rh020re Summary Score Speilberger Anger Index, 2004 iuc34rec Summary Score Speilberger Anger Index, 2011 jua34rec Summary Score Hostility Index, 2004 iu026rec Summary Score Speilberger Anxiety Index, 2004 iua33rec Summary Score Speilberger Anxiety Index, 2011 jua33rec Summary Score Psychological Well-Being, 1993 rn014rei Summary Score Distress/Depression, 1993 mu001rec Summary Score Distress/Depression, 2004 iu001rec Summary Score Distress/Depression, 2011 ju001rec Days/Week Feel Depressed, 1993 mu013rer Days/Week Feel Depressed, 2004 iu013rer Days/Week Feel Depressed, 2011 ju013rer Ever Drank Alcohol, 1993 ru025re Ever Drank Alcohol, 2004 gu025re Ever Drank Alcohol, 2011 hu025re Days/Month Drink Alcohol, 1993 *ru025re & ru026re Days/Month Drink Alcohol, 2004 *gu025re & gu026re Days/Month Drink Alcohol, 2011 *hu025re & hu026re Drinks/Day on Days Drank Alcohol, 1993 *ru025re & ru027re Drinks/Day on Days Drank Alcohol, 2004 *gu025re & gu027re
Page 46 of 70
For peer review only - http://bmjopen.bmj.com/site/about/guidelines.xhtml
BMJ Open
123456789101112131415161718192021222324252627282930313233343536373839404142434445464748495051525354555657585960
on January 9, 2022 by guest. Protected by copyright.
http://bmjopen.bm
j.com/
BM
J Open: first published as 10.1136/bm
jopen-2016-011529 on 23 January 2017. Dow
nloaded from
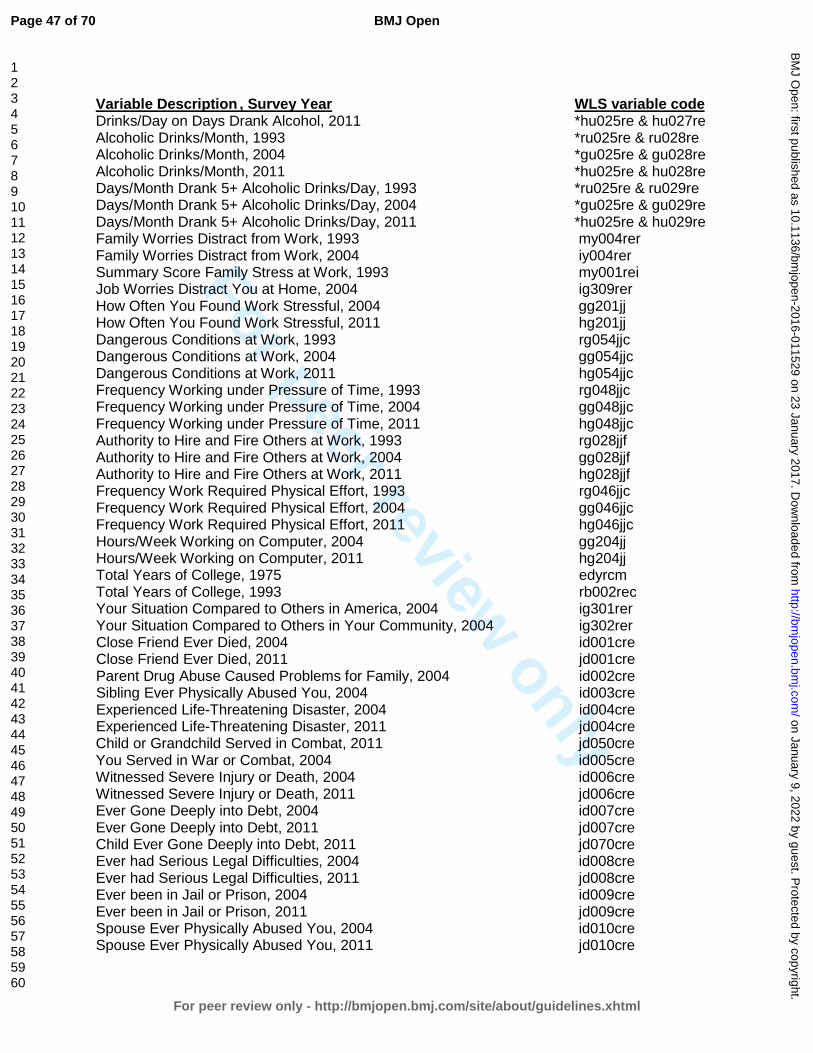
For peer review only
Variable Description , Survey Year WLS variable code Drinks/Day on Days Drank Alcohol, 2011 *hu025re & hu027re Alcoholic Drinks/Month, 1993 *ru025re & ru028re Alcoholic Drinks/Month, 2004 *gu025re & gu028re Alcoholic Drinks/Month, 2011 *hu025re & hu028re Days/Month Drank 5+ Alcoholic Drinks/Day, 1993 *ru025re & ru029re Days/Month Drank 5+ Alcoholic Drinks/Day, 2004 *gu025re & gu029re Days/Month Drank 5+ Alcoholic Drinks/Day, 2011 *hu025re & hu029re Family Worries Distract from Work, 1993 my004rer Family Worries Distract from Work, 2004 iy004rer Summary Score Family Stress at Work, 1993 my001rei Job Worries Distract You at Home, 2004 ig309rer How Often You Found Work Stressful, 2004 gg201jj How Often You Found Work Stressful, 2011 hg201jj Dangerous Conditions at Work, 1993 rg054jjc Dangerous Conditions at Work, 2004 gg054jjc Dangerous Conditions at Work, 2011 hg054jjc Frequency Working under Pressure of Time, 1993 rg048jjc Frequency Working under Pressure of Time, 2004 gg048jjc Frequency Working under Pressure of Time, 2011 hg048jjc Authority to Hire and Fire Others at Work, 1993 rg028jjf Authority to Hire and Fire Others at Work, 2004 gg028jjf Authority to Hire and Fire Others at Work, 2011 hg028jjf Frequency Work Required Physical Effort, 1993 rg046jjc Frequency Work Required Physical Effort, 2004 gg046jjc Frequency Work Required Physical Effort, 2011 hg046jjc Hours/Week Working on Computer, 2004 gg204jj Hours/Week Working on Computer, 2011 hg204jj Total Years of College, 1975 edyrcm Total Years of College, 1993 rb002rec Your Situation Compared to Others in America, 2004 ig301rer Your Situation Compared to Others in Your Community, 2004 ig302rer Close Friend Ever Died, 2004 id001cre Close Friend Ever Died, 2011 jd001cre Parent Drug Abuse Caused Problems for Family, 2004 id002cre Sibling Ever Physically Abused You, 2004 id003cre Experienced Life-Threatening Disaster, 2004 id004cre Experienced Life-Threatening Disaster, 2011 jd004cre Child or Grandchild Served in Combat, 2011 jd050cre You Served in War or Combat, 2004 id005cre Witnessed Severe Injury or Death, 2004 id006cre Witnessed Severe Injury or Death, 2011 jd006cre Ever Gone Deeply into Debt, 2004 id007cre Ever Gone Deeply into Debt, 2011 jd007cre Child Ever Gone Deeply into Debt, 2011 jd070cre Ever had Serious Legal Difficulties, 2004 id008cre Ever had Serious Legal Difficulties, 2011 jd008cre Ever been in Jail or Prison, 2004 id009cre Ever been in Jail or Prison, 2011 jd009cre Spouse Ever Physically Abused You, 2004 id010cre Spouse Ever Physically Abused You, 2011 jd010cre
Page 47 of 70
For peer review only - http://bmjopen.bmj.com/site/about/guidelines.xhtml
BMJ Open
123456789101112131415161718192021222324252627282930313233343536373839404142434445464748495051525354555657585960
on January 9, 2022 by guest. Protected by copyright.
http://bmjopen.bm
j.com/
BM
J Open: first published as 10.1136/bm
jopen-2016-011529 on 23 January 2017. Dow
nloaded from

For peer review only
Variable Description , Survey Year WLS variable code Child Ever been Divorced, 2004 id011cre Child Ever been Divorced, 2011 jd011cre Child Ever had Life-Threatening Illness or Accident, 2004 id012cre Child Ever had Life-Threatening Illness or Accident, 2011 jd012cre Grandchild Ever had Life-Threatening Illness or Accident, 2011 jd120cre Adult Child Ever Moved Back Home, 2004 id013cre Adult Child Ever Moved Back Home, 2011 jd013cre Ever had Increased Responsibility for Grandchildren, 2004 id014cre Ever had Increased Responsibility for Grandchildren, 201 jd014cre Aging Parent or In-law Ever Moved into Your Home, 2004 id015cre Aging Parent or In-law Ever Moved into Your Home, 2011 jd015cre Ever Placed Spouse, Parent, or In-law into Nursing Home, 2004 id016cre Ever Placed Spouse, Parent, or In-law into Nursing Home, 2011 jd016cre Ever Seriously Thought about Taking Your Own Life, 2004 id017cre Ever Seriously Thought about Taking Your Own Life, 2011 jd017cre When Stressed Turn to Work, 2004 id101rer When Stressed Turn to Work, 2011 jd101rer When Stressed Concentrate Your Efforts, 2004 id102rer When Stressed Concentrate Your Efforts, 2011 jd102rer When Stressed Pretend it's Not Real, 2004 id103rer When Stressed Pretend it's Not Real, 2011 jd103rer When Stressed Give up Trying to Deal, 2004 id104rer When Stressed Give up Trying to Deal, 2011 jd104rer When Stressed Say Things to let Negative Feelings Go, 2004 id107rer When Stressed Say Things to let Negative Feelings Go, 2011 jd107rer When Stressed Try to Make Situation Positive, 2004 id108rer When Stressed Try to Make Situation Positive, 2011 jd108rer When Stressed Criticize Yourself, 2004 id109rer When Stressed Criticize Yourself, 2011 jd109rer When Stressed Try to Think About it Less, 2004 id113rer When Stressed Try to Think About it Less, 2011 jd113rer When Stressed Express Negative Feelings, 2004 id115rer When Stressed Express Negative Feelings, 2011 jd115rer When Stressed Learn to Live with It, 2004 id116rer When Stressed Learn to Live with It, 2011 jd116rer When Stressed Think Hard about Steps to Take, 2004 id117rer When Stressed Think Hard about Steps to Take, 2011 jd117rer When Stressed Blame Yourself, 2004 id118rer When Stressed Blame Yourself, 2011 jd118rer Summary Score Extraversion, 1993 mh001rei Summary Score Extraversion, 2004 ih001rei Summary Score Extraversion, 2011 jh001rei Summary Score Openness, 1993 mh032rei Summary Score Openness, 2004 ih032rei Summary Score Openness, 2011 jh032rei Summary Score Neuroticism, 1993 mh025rei Summary Score Neuroticism, 2004 ih025rei Summary Score Neuroticism, 2011 jh025rei Summary Score Conscientiousness, 1993 mh017rei Summary Score Conscientiousness, 2004 ih017rei
Page 48 of 70
For peer review only - http://bmjopen.bmj.com/site/about/guidelines.xhtml
BMJ Open
123456789101112131415161718192021222324252627282930313233343536373839404142434445464748495051525354555657585960
on January 9, 2022 by guest. Protected by copyright.
http://bmjopen.bm
j.com/
BM
J Open: first published as 10.1136/bm
jopen-2016-011529 on 23 January 2017. Dow
nloaded from
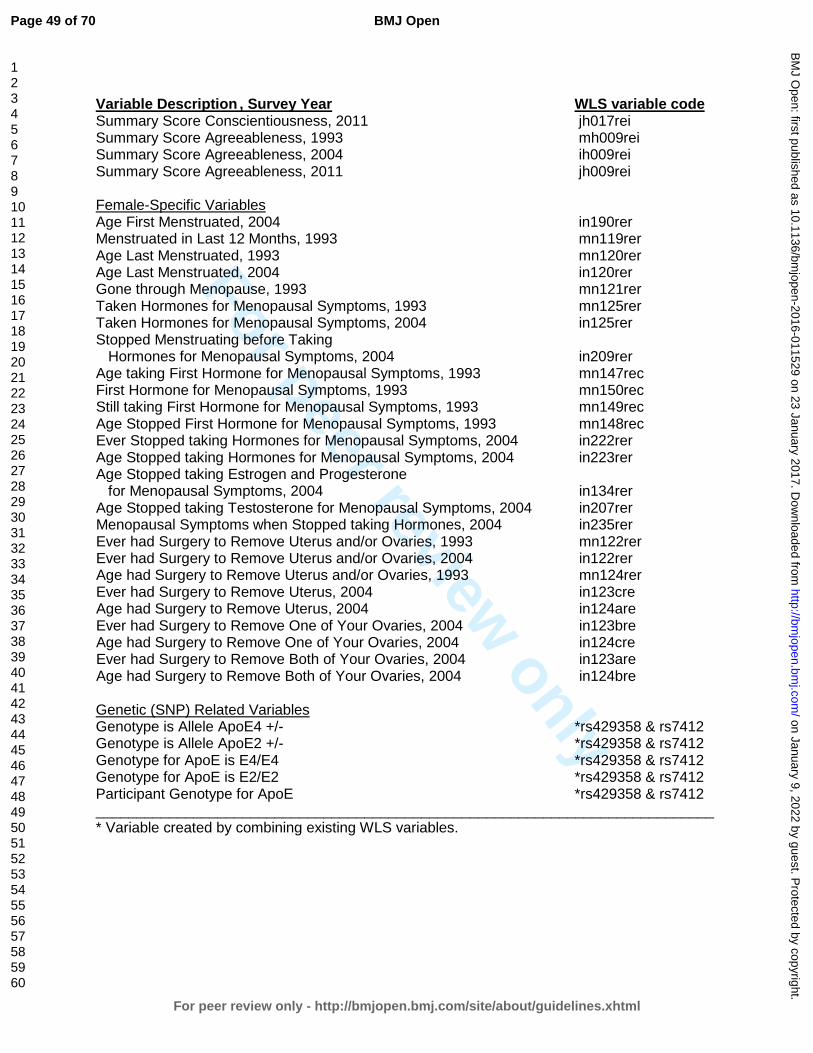
For peer review only
Variable Description , Survey Year WLS variable code Summary Score Conscientiousness, 2011 jh017rei Summary Score Agreeableness, 1993 mh009rei Summary Score Agreeableness, 2004 ih009rei Summary Score Agreeableness, 2011 jh009rei Female-Specific Variables Age First Menstruated, 2004 in190rer Menstruated in Last 12 Months, 1993 mn119rer Age Last Menstruated, 1993 mn120rer Age Last Menstruated, 2004 in120rer Gone through Menopause, 1993 mn121rer Taken Hormones for Menopausal Symptoms, 1993 mn125rer Taken Hormones for Menopausal Symptoms, 2004 in125rer Stopped Menstruating before Taking Hormones for Menopausal Symptoms, 2004 in209rer Age taking First Hormone for Menopausal Symptoms, 1993 mn147rec First Hormone for Menopausal Symptoms, 1993 mn150rec Still taking First Hormone for Menopausal Symptoms, 1993 mn149rec Age Stopped First Hormone for Menopausal Symptoms, 1993 mn148rec Ever Stopped taking Hormones for Menopausal Symptoms, 2004 in222rer Age Stopped taking Hormones for Menopausal Symptoms, 2004 in223rer Age Stopped taking Estrogen and Progesterone for Menopausal Symptoms, 2004 in134rer Age Stopped taking Testosterone for Menopausal Symptoms, 2004 in207rer Menopausal Symptoms when Stopped taking Hormones, 2004 in235rer Ever had Surgery to Remove Uterus and/or Ovaries, 1993 mn122rer Ever had Surgery to Remove Uterus and/or Ovaries, 2004 in122rer Age had Surgery to Remove Uterus and/or Ovaries, 1993 mn124rer Ever had Surgery to Remove Uterus, 2004 in123cre Age had Surgery to Remove Uterus, 2004 in124are Ever had Surgery to Remove One of Your Ovaries, 2004 in123bre Age had Surgery to Remove One of Your Ovaries, 2004 in124cre Ever had Surgery to Remove Both of Your Ovaries, 2004 in123are Age had Surgery to Remove Both of Your Ovaries, 2004 in124bre Genetic (SNP) Related Variables Genotype is Allele ApoE4 +/- *rs429358 & rs7412 Genotype is Allele ApoE2 +/- *rs429358 & rs7412 Genotype for ApoE is E4/E4 *rs429358 & rs7412 Genotype for ApoE is E2/E2 *rs429358 & rs7412 Participant Genotype for ApoE *rs429358 & rs7412 ____________________________________________________________________________ * Variable created by combining existing WLS variables.
Page 49 of 70
For peer review only - http://bmjopen.bmj.com/site/about/guidelines.xhtml
BMJ Open
123456789101112131415161718192021222324252627282930313233343536373839404142434445464748495051525354555657585960
on January 9, 2022 by guest. Protected by copyright.
http://bmjopen.bm
j.com/
BM
J Open: first published as 10.1136/bm
jopen-2016-011529 on 23 January 2017. Dow
nloaded from
For peer review only
Supplemental Information 3: Description of statistics showing sex as one of the top MI associated factors among WLS participants.
All analyses identified sex as one of the factors most associated with MI among WLS participants. Recursive partitioning showed that among those who ever had a MI by 72 years old, with all participants combined (males and females) the second highest factor associated with MI was sex, with prevalence among males in the WLS cohort at 13.1% and among females at 4.9% (OR=2.94, 95% CI= 2.38-3.63; tree not shown). Among those who experienced their MI between 65-72 years old, RP revealed that the top factor for MI was sex, with prevalence among males at 5.9% and among females at 2.5% (2.46, 1.84-3.29; tree not shown). In addition, RF selected sex as one of the ‘important’ MI associated factors for those who ever experienced a MI before 72 and as the most ‘important’ factor for those having a MI between 65-72 years (not shown). Finally, both LR and X2 analyses identified sex as a significant factor for MI at any age (p-values <0.0001), with males in the WLS cohort more likely to have had a MI than females by 72 (2.75, 2.34-3.23) and between 65-72 (2.46, 1.84-3.29). Males and females were therefore analyzed separately throughout this study.
Page 50 of 70
For peer review only - http://bmjopen.bmj.com/site/about/guidelines.xhtml
BMJ Open
123456789101112131415161718192021222324252627282930313233343536373839404142434445464748495051525354555657585960
on January 9, 2022 by guest. Protected by copyright.
http://bmjopen.bm
j.com/
BM
J Open: first published as 10.1136/bm
jopen-2016-011529 on 23 January 2017. Dow
nloaded from
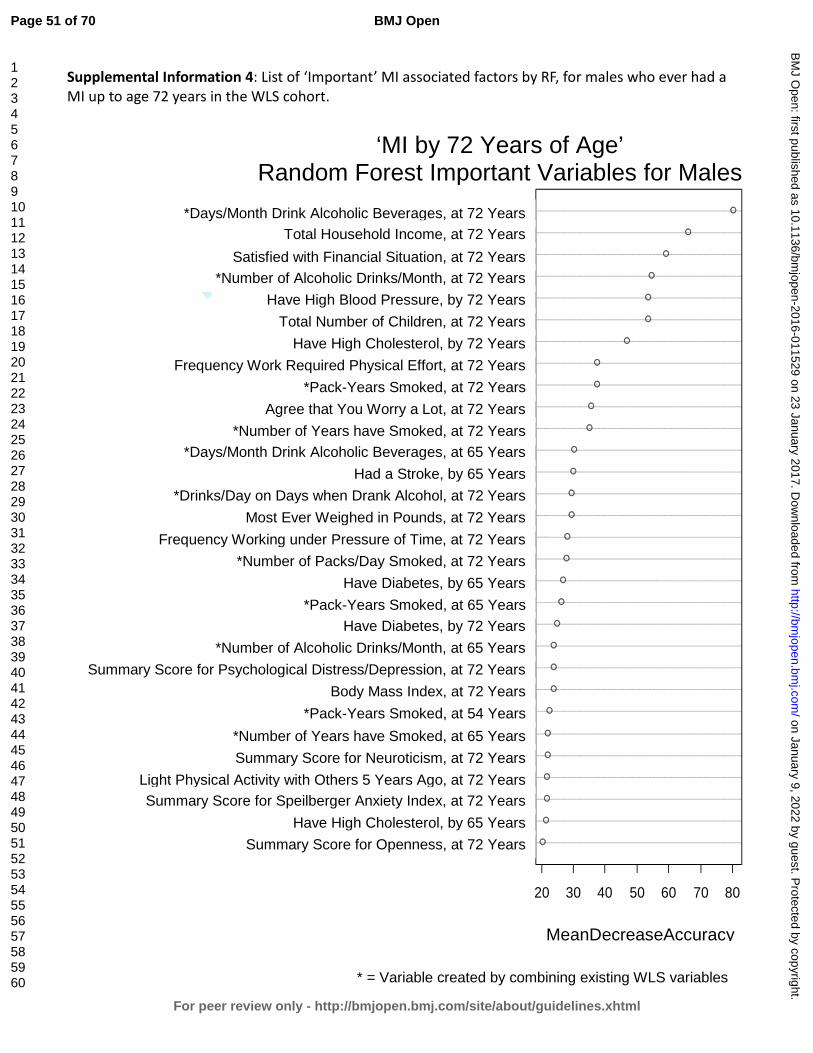
For peer review only
Supplemental Information 4: List of ‘Important’ MI associated factors by RF, for males who ever had a MI up to age 72 years in the WLS cohort.
openness2011ghighchol2004gsumanxietyindex2011gltactothers5yrsago2011gneuroticism2011gsmokyrsX2004gsmokpkyrs1993gBMI2011gsumdepressionindex2011galcoholdrinkstotalX2004gdiabetes2011gsmokpkyrs2004gdiabetes2004gsmokpkdayX2011gworktimepressure2011gmosteverweigh2011galcoholdrinksdayX2011gstroke2004galcoholdaysX2004gsmokyrsX2011gworryalot2011gsmokpkyrs2011gworkphyeffort2011ghighchol2011gchild2011ghighbp2011galcoholdrinkstotalX2011gsatfin2011gTHI2011galcoholdaysX2011g
20 30 40 50 60 70 80
MeanDecreaseAccuracy
‘MI by 72 Years of Age’ Random Forest Important Variables for Males
*Days/Month Drink Alcoholic Beverages, at 72 Years
Total Household Income, at 72 Years Satisfied with Financial Situation, at 72 Years
*Number of Alcoholic Drinks/Month, at 72 Years Have High Blood Pressure, by 72 Years
Total Number of Children, at 72 Years Have High Cholesterol, by 72 Years
Frequency Work Required Physical Effort, at 72 Years *Pack-Years Smoked, at 72 Years
Agree that You Worry a Lot, at 72 Years *Number of Years have Smoked, at 72 Years
*Days/Month Drink Alcoholic Beverages, at 65 Years Had a Stroke, by 65 Years
*Drinks/Day on Days when Drank Alcohol, at 72 Years Most Ever Weighed in Pounds, at 72 Years
Frequency Working under Pressure of Time, at 72 Years *Number of Packs/Day Smoked, at 72 Years
Have Diabetes, by 65 Years *Pack-Years Smoked, at 65 Years
Have Diabetes, by 72 Years *Number of Alcoholic Drinks/Month, at 65 Years
Summary Score for Psychological Distress/Depression, at 72 Years Body Mass Index, at 72 Years
*Pack-Years Smoked, at 54 Years *Number of Years have Smoked, at 65 Years Summary Score for Neuroticism, at 72 Years
Light Physical Activity with Others 5 Years Ago, at 72 Years Summary Score for Speilberger Anxiety Index, at 72 Years
Have High Cholesterol, by 65 Years Summary Score for Openness, at 72 Years
MeanDecreaseAccuracy
* = Variable created by combining existing WLS variables
Page 51 of 70
For peer review only - http://bmjopen.bmj.com/site/about/guidelines.xhtml
BMJ Open
123456789101112131415161718192021222324252627282930313233343536373839404142434445464748495051525354555657585960
on January 9, 2022 by guest. Protected by copyright.
http://bmjopen.bm
j.com/
BM
J Open: first published as 10.1136/bm
jopen-2016-011529 on 23 January 2017. Dow
nloaded from
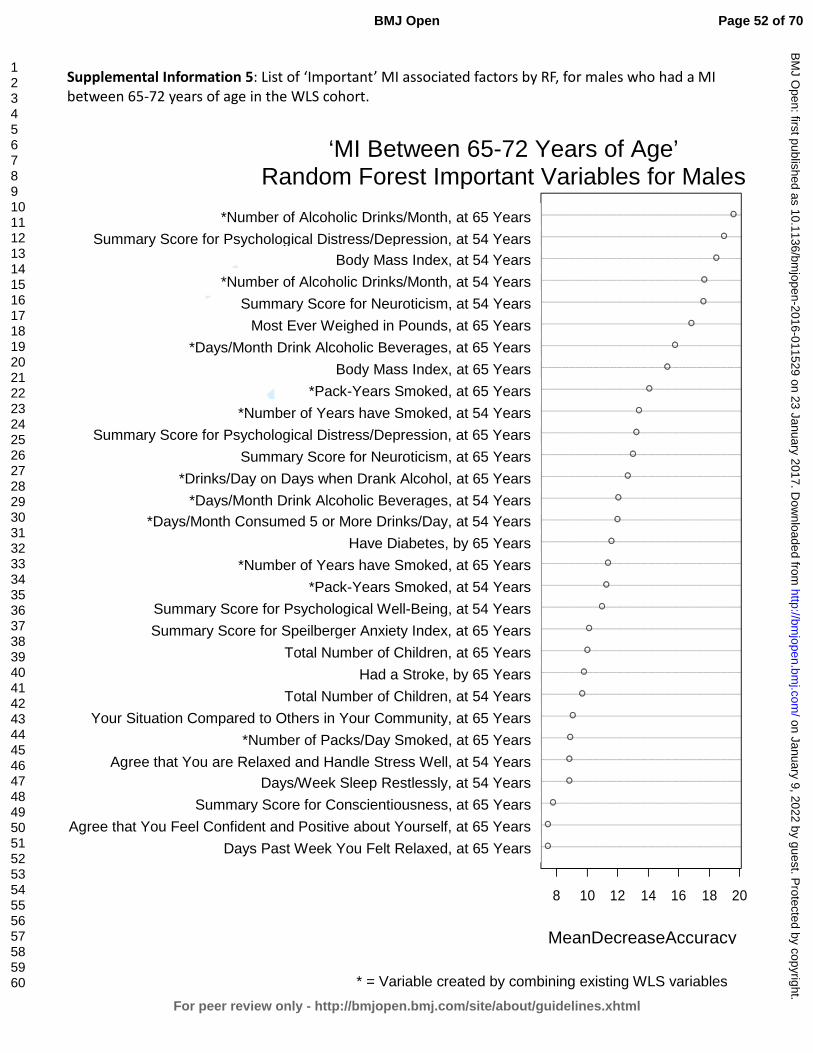
For peer review only
Supplemental Information 5: List of ‘Important’ MI associated factors by RF, for males who had a MI between 65-72 years of age in the WLS cohort.
pastweekrelaxed2004gconfident2004gconscientiousness2004gsleeprestlessly1993ghandlestresswell1993gsmokpkdayX2004gcomparecommunity2004gchild1993gstroke2004gchild2004gsumanxietyindex2004gsumwellbeing1993gsmokpkyrs1993gsmokyrsX2004gdiabetes2004galcohol5ormoreX1993galcoholdaysX1993galcoholdrinksdayX2004gneuroticism2004gsumdepressionindex2004gsmokyrsX1993gsmokpkyrs2004gBMI2004galcoholdaysX2004gmosteverweigh2004gneuroticism1993galcoholdrinkstotalX1993gBMI1993gsumdepressionindex1993galcoholdrinkstotalX2004g
8 10 12 14 16 18 20
MeanDecreaseAccuracy
‘MI Between 65-72 Years of Age’ Random Forest Important Variables for Males
*Number of Alcoholic Drinks/Month, at 65 Years
Summary Score for Psychological Distress/Depression, at 54 Years Body Mass Index, at 54 Years
*Number of Alcoholic Drinks/Month, at 54 Years Summary Score for Neuroticism, at 54 Years
Most Ever Weighed in Pounds, at 65 Years *Days/Month Drink Alcoholic Beverages, at 65 Years
Body Mass Index, at 65 Years *Pack-Years Smoked, at 65 Years
*Number of Years have Smoked, at 54 Years Summary Score for Psychological Distress/Depression, at 65 Years
Summary Score for Neuroticism, at 65 Years *Drinks/Day on Days when Drank Alcohol, at 65 Years
*Days/Month Drink Alcoholic Beverages, at 54 Years *Days/Month Consumed 5 or More Drinks/Day, at 54 Years
Have Diabetes, by 65 Years *Number of Years have Smoked, at 65 Years
*Pack-Years Smoked, at 54 Years Summary Score for Psychological Well-Being, at 54 Years Summary Score for Speilberger Anxiety Index, at 65 Years
Total Number of Children, at 65 Years Had a Stroke, by 65 Years
Total Number of Children, at 54 Years Your Situation Compared to Others in Your Community, at 65 Years
*Number of Packs/Day Smoked, at 65 Years Agree that You are Relaxed and Handle Stress Well, at 54 Years
Days/Week Sleep Restlessly, at 54 Years Summary Score for Conscientiousness, at 65 Years
Agree that You Feel Confident and Positive about Yourself, at 65 Years Days Past Week You Felt Relaxed, at 65 Years
MeanDecreaseAccuracy
* = Variable created by combining existing WLS variables
Page 52 of 70
For peer review only - http://bmjopen.bmj.com/site/about/guidelines.xhtml
BMJ Open
123456789101112131415161718192021222324252627282930313233343536373839404142434445464748495051525354555657585960
on January 9, 2022 by guest. Protected by copyright.
http://bmjopen.bm
j.com/
BM
J Open: first published as 10.1136/bm
jopen-2016-011529 on 23 January 2017. Dow
nloaded from

For peer review only
Supplemental Information 6: List of ‘Important’ MI associated factors by RF, for females who ever had a MI up to age 72 years in the WLS cohort.
conscientiousness2011gvgactalone5yrsago2011gworktimepressure2011gBMI1993gagreeableness2011gdiabetes1993gneuroticism2011ghighchol2011gsmokyrsX1993gBMI2004gremoveuterusovariesage1993gworkphyeffort2011gopenness2011gsumanxietyindex2011gageweighmost2011galcoholdaysX2004gmarried2011gsumdepressionindex2011glikelifestyle2011gdiabetes2011gmosteverweigh2011gBMI2011gchild2011gdiabetes2004galcoholdrinkstotalX2011gworryalot2011ghighbp2011gTHI2011gsatfin2011galcoholdaysX2011g
20 30 40 50 60
MeanDecreaseAccuracy
‘MI by 72 Years of Age’ Random Forest Important Variables for Females
*Days/Month Drink Alcoholic Beverages, at 72 Years
Satisfied with Financial Situation, at 72 Years Total Household Income, at 72 Years
Have High Blood Pressure, by 72 Years Agree that You Worry a Lot, at 72 Years
*Number of Alcoholic Drinks/Month, at 72 Years Have Diabetes, by 65 Years
Total Number of Children, at 72 Years Body Mass Index, at 72 Years
Most Ever Weighed in Pounds, at 72 Years Have Diabetes, by 72 Years
Agree that You Created Lifestyle to Your Liking, at 72 Years Summary Score for Psychological Distress/Depression, at 72 Years
Not Married, at 72 Years *Days/Month Drink Alcoholic Beverages, at 65 Years
Age when Weighed the Most, at 72 Years Summary Score for Speilberger Anxiety Index, at 72 Years
Summary Score for Openness, at 72 Years Frequency Work Required Physical Effort, at 72 Years
Age when had Surgery to Remove Uterus and/or Ovaries, at 54 Years Body Mass Index, at 65 Years
*Number of Years have Smoked, at 54 Years Have High Cholesterol, by 72 Years
Summary Score for Neuroticism, at 72 Years Have Diabetes, by 54 Years
Summary Score for Agreeableness, at 72 Years Body Mass Index, at 54 Years
Frequency Working under Pressure of Time, at 72 Years Vigorous Physical Activity Alone 5 Years Ago, at 72 Years
Summary Score for Conscientiousness, at 72 Years
MeanDecreaseAccuracy
* = Variable created by combining existing WLS variables
Page 53 of 70
For peer review only - http://bmjopen.bmj.com/site/about/guidelines.xhtml
BMJ Open
123456789101112131415161718192021222324252627282930313233343536373839404142434445464748495051525354555657585960
on January 9, 2022 by guest. Protected by copyright.
http://bmjopen.bm
j.com/
BM
J Open: first published as 10.1136/bm
jopen-2016-011529 on 23 January 2017. Dow
nloaded from
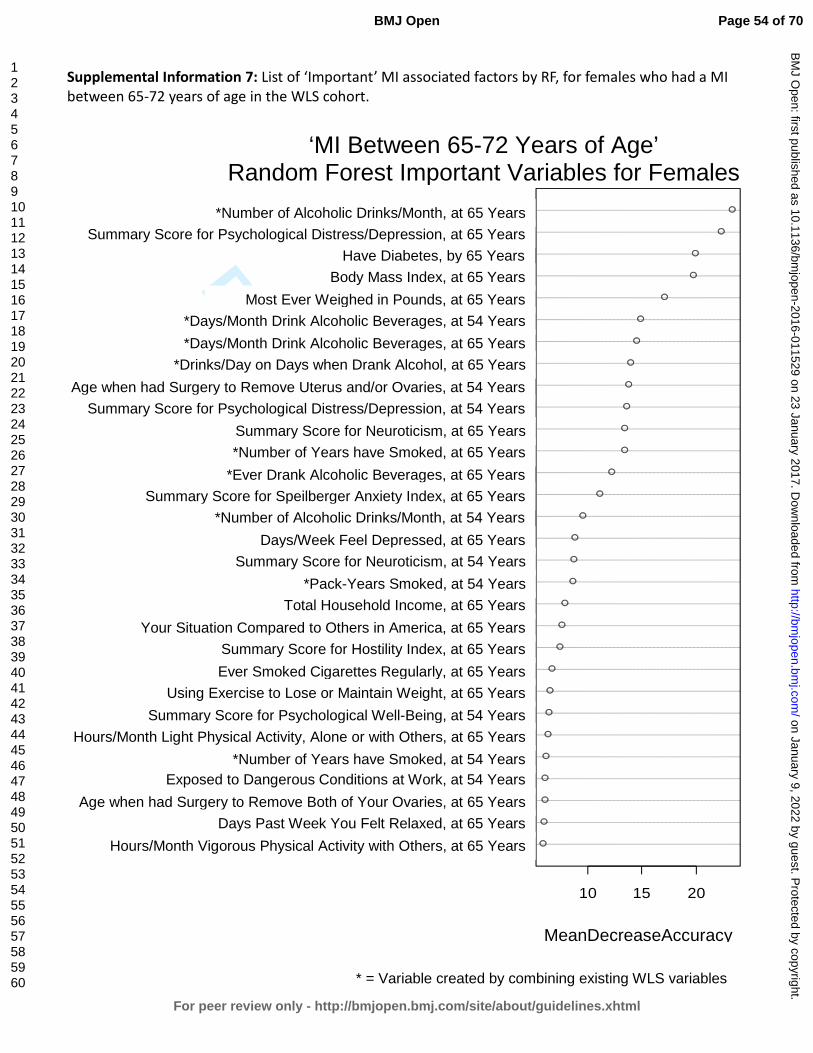
For peer review only
Supplemental Information 7: List of ‘Important’ MI associated factors by RF, for females who had a MI between 65-72 years of age in the WLS cohort.
vgactothers2004gpastweekrelaxed2004gremovebothovariesage2004gworkdangercond1993gsmokyrsX1993gltactaloneothers2004gsumwellbeing1993gexerweight2004gsmokever2004gsumhostilityindex2004gcompareAmerica2004gTHI2004gsmokpkyrs1993gneuroticism1993gdepresseddays2004galcoholdrinkstotalX1993gsumanxietyindex2004gdrinkalcohol2004gsmokyrsX2004gneuroticism2004gsumdepressionindex1993gremoveuterusovariesage1993galcoholdrinksdayX2004galcoholdaysX2004galcoholdaysX1993gmosteverweigh2004gBMI2004gdiabetes2004gsumdepressionindex2004galcoholdrinkstotalX2004g
10 15 20
MeanDecreaseAccuracy
‘MI Between 65-72 Years of Age’ Random Forest Important Variables for Females
*Number of Alcoholic Drinks/Month, at 65 Years Summary Score for Psychological Distress/Depression, at 65 Years
Have Diabetes, by 65 Years Body Mass Index, at 65 Years
Most Ever Weighed in Pounds, at 65 Years *Days/Month Drink Alcoholic Beverages, at 54 Years *Days/Month Drink Alcoholic Beverages, at 65 Years
*Drinks/Day on Days when Drank Alcohol, at 65 Years Age when had Surgery to Remove Uterus and/or Ovaries, at 54 Years
Summary Score for Psychological Distress/Depression, at 54 Years Summary Score for Neuroticism, at 65 Years *Number of Years have Smoked, at 65 Years
*Ever Drank Alcoholic Beverages, at 65 Years Summary Score for Speilberger Anxiety Index, at 65 Years
*Number of Alcoholic Drinks/Month, at 54 Years Days/Week Feel Depressed, at 65 Years
Summary Score for Neuroticism, at 54 Years *Pack-Years Smoked, at 54 Years
Total Household Income, at 65 Years Your Situation Compared to Others in America, at 65 Years
Summary Score for Hostility Index, at 65 Years Ever Smoked Cigarettes Regularly, at 65 Years
Using Exercise to Lose or Maintain Weight, at 65 Years Summary Score for Psychological Well-Being, at 54 Years
Hours/Month Light Physical Activity, Alone or with Others, at 65 Years *Number of Years have Smoked, at 54 Years
Exposed to Dangerous Conditions at Work, at 54 Years Age when had Surgery to Remove Both of Your Ovaries, at 65 Years
Days Past Week You Felt Relaxed, at 65 Years Hours/Month Vigorous Physical Activity with Others, at 65 Years
MeanDecreaseAccuracy
* = Variable created by combining existing WLS variables
Page 54 of 70
For peer review only - http://bmjopen.bmj.com/site/about/guidelines.xhtml
BMJ Open
123456789101112131415161718192021222324252627282930313233343536373839404142434445464748495051525354555657585960
on January 9, 2022 by guest. Protected by copyright.
http://bmjopen.bm
j.com/
BM
J Open: first published as 10.1136/bm
jopen-2016-011529 on 23 January 2017. Dow
nloaded from

For peer review only
Supplemental Information 8: Additional discussion of recursive partitioning results for males who ever had a MI before age 72 in the WLS cohort.
Recursive partitioning (RP) analysis revealed that the most important interactive effects among factors associated with MI for males in the WLS who ever had a MI before age 72 were first having high cholesterol, then having diabetes, both by 65 years old, and the number of years smoked by 54 years old (see Figure 1). Beyond these interactions, for those with no high cholesterol or diabetes by 65 years, depression becomes an important factor associated with MI and then high cholesterol by 72 years and high blood pressure by 65 years old, and finally, how many alcoholic drinks were consumed each month at 72. For those with no high cholesterol by 65 years old, each of the additional factors listed above demonstrates at least a 3-fold increase in MI prevalence at each split (node) in the tree. For those who had no high cholesterol, no diabetes, and no (limited) depression by 65 years old, the next MI associated factor was having high cholesterol by 72 years old, although this factor was associated with lower MI prevalence than the preceding factors (2.4% versus 8.6%; see Figure 1). This result is supported by studies showing that the key risk factors for MI become less predictive the older we get 1 2. That is because the risk for MI increases as we age due to the ‘natural’ progression of atherosclerosis and narrowing of arteries in the elderly 3-5. However, for those with high cholesterol by 72 years, consuming more than 5.5 alcoholic drinks per month cut MI prevalence by nearly half and drinking less than 5.5 alcoholic drinks per month was associated with a 3.1-fold increase in the prevalence of MI, supporting results from previous studies (see main text). For those who had no high cholesterol but did have diabetes by 65 years, openness becomes an important factor, with low prevalence among those who were less open and much higher prevalence (9.2-fold increase) among those who were more open (2.9% versus 26.7% respectively). Counter to our results, previous studies have demonstrated an inverse relationship between openness and heart disease risk/mortality 6-8; therefore, further study should attempt to elucidate this relationship. For those with a higher openness score at 65, MI prevalence is mediated by their genotype at the CYP11B2 gene (rs1799998 SNP). Our study revealed a much higher prevalence of MI among those with the A:G or G:G genotype (30.6%) compared to no prevalence among those with an A:A genotype (0.0%). This is among those males who before the CYP11B2 SNP measurement had an overall MI prevalence of 26.7% (Figure 1). This finding suggests that the A:A homozygous genotype confers a protective effect against MI, supported by studies showing that having a G allele at this polymorphism site is significantly associated with coronary heart disease or its risk factors 9-13. However, conflicting results in the literature suggest that further study is needed to confirm the association and to determine possible interactions between this SNP and other MI risk factors 14-19.
Page 55 of 70
For peer review only - http://bmjopen.bmj.com/site/about/guidelines.xhtml
BMJ Open
123456789101112131415161718192021222324252627282930313233343536373839404142434445464748495051525354555657585960
on January 9, 2022 by guest. Protected by copyright.
http://bmjopen.bm
j.com/
BM
J Open: first published as 10.1136/bm
jopen-2016-011529 on 23 January 2017. Dow
nloaded from

For peer review only
In addition to the interactions listed above, for those who do have high cholesterol by 65 years, the number of years smoking cigarettes by 54 years, days/month drinking alcohol, dangerous conditions at work, and genotype at the FADS2 gene polymorphism become important interactive associations (see Figure 1). Smoking fewer than 22.5 years by 54 years old interacts with having diabetes by 65 years, a familial history of MI, family worries at work, the most ever weighed, number of years of college completed, total household income, and genotype at the IL6 gene polymorphism site. Among those with high cholesterol by 65 years old who have smoked more than 22.5 years, regular moderate alcohol consumption seems to provide an insulating effect against MI, with a 3.8-fold increase in prevalence of MI among those who drank less than 24.5 days/month (40.9% versus 10.7%; Figure 1). This relationship is mediated by experiencing dangerous conditions in the workplace (at 65 years), with a 2.6-fold increase among those who work under dangerous conditions and half of the men in this group experiencing MI at some point in their lives (50% versus 19.4%). This supports the assertion that this factor may represent a ‘new’ MI risk, as stated in the main text. For those experiencing no dangerous conditions at work, prevalence increases by having a C:G or G:G genotype at the FADS2 gene polymorphism (rs174575) site, resulting in a 6.6-fold increase in MI prevalence over those with the homozygous C:C genotype (46.7% versus 7.1%). Although one study was identified in which this polymorphism was analyzed against coronary artery disease risk, no association was found 20. Further study is needed to determine if this gene locus is indeed associated with MI, as supported by this study. Among those who had high cholesterol by 65 years, smoked less than 22.5 years by 54 years, and did not have diabetes by 65 years, a familial history of MI (before age 55) was the next interactive factor associated with MI, with a 3.1-fold increase in prevalence among men in this group (31.5% versus 10.3%; Figure 1).
For those with no familial history of MI, the most ever weighed becomes an important factor with a 3.4-fold increase in prevalence among those who had weighed more than 226.5 lb. at their greatest (17.8% versus 5.3%), which is supported by association studies outlining the risk of MI based on obesity 21-24. For those who weighed more than 226.5 lb. at their greatest, total household income of less than $130,918 at 65 years old lead to an MI prevalence of 22.6% compared to 0.0% among those with a total household income greater than $130,918 (Figure 1). This suggests that making a higher salary confers a protective effect against MI. However, previous studies looking at socioeconomic factors such as income, education, and occupation have found mixed results 25-27, with lower income as an MI risk factor in developed countries versus the opposite effect in less developed countries 28. Furthermore, income seems to interact with education, such that those with more education and lower income have a higher risk for MI, while those with more education and higher income are protected from MI 28. In the U.S., lower income has been strongly associated with all-cause mortality and the disparity has gotten worse over time, specifically for men 29, and is stronger in younger men than in older men 27. Recent declines in coronary heart disease (CHD) deaths in the U.S. are more prominent
Page 56 of 70
For peer review only - http://bmjopen.bmj.com/site/about/guidelines.xhtml
BMJ Open
123456789101112131415161718192021222324252627282930313233343536373839404142434445464748495051525354555657585960
on January 9, 2022 by guest. Protected by copyright.
http://bmjopen.bm
j.com/
BM
J Open: first published as 10.1136/bm
jopen-2016-011529 on 23 January 2017. Dow
nloaded from
For peer review only
for those in the upper income groups than in the lower income groups, although this trend has changed over the past century, such that the more affluent used to be at a greater risk for CHD whereas now the less affluent are at a greater risk 27. In addition, it has been shown that those experiencing lower socioeconomic status in childhood are more likely to suffer MI later in life 27, although mixed results have been reported. Survival after MI is greatest among those in the highest income groups, but those in lower income groups are also more likely to smoke, get less physical exercise, and to drink alcohol [excessively or less than one day/week] 25. Even after taking into account all of the confounding factors associated with MI, income does exhibit an inverse association with all-cause mortality, as well as cardiovascular and MI risk across most studies, suggesting that it is in-fact an independent risk factor for MI.
For men with a lower income, MI prevalence increased among those with a C:C or G:G genotype at the IL6 gene polymorphism (rs1800795) site. Those with a homozygous genotype at this locus showed a 6.2-fold increase in MI prevalence over those with the heterozygous C:G genotype (32.6% versus 5.3%, respectively). However, the results from previous studies are mixed, with some studies demonstrating an association between this polymorphism site and increased cardiovascular risk and others finding no association at all 30-34, therefore additional study is necessary in order to determine what, if any, associations exist between this IL6 gene polymorphism and MI. For men who had high cholesterol by 65 years, smoked less than 22.5 years, and had diabetes by 65 years old, whether one agreed that family worries distracted them from work at 65 years old became an important MI associated factor, demonstrating a 7.4-fold increase in prevalence among those who either strongly agreed or did not agree over those who agreed that family worries distracted from work (39.3% versus 5.3%). Work- and family-related stress has been shown to increase men’s risk of MI in prior studies 35 36; however, here it seems that having distractions at work actually decreased MI prevalence. Kubzansky et al. 37 suggest that only worry in specific ‘domains’ increases one’s MI and CHD risk, while other types of worrying can be considered a constructive problem-solving strategy. The conflicting results here suggest that the ‘strongly agreed’ outcome is likely an artifact of the way the data was collected and analyzed, and there may be additional interactive effect(s) that we have not illuminated to explain these mixed results. Additional study is needed before conclusions can be drawn concerning this data.
Among the group who did not agree that family worries distracted from work, MI prevalence increased to 53.3% among those who completed less than 5.5 years of college by 54 years old, with no prevalence (0.0%) among those completing more than 5.5 years. Similar to the associations linking income and MI, it has long been acknowledged that education is inversely associated with all-cause mortality including MI across many different countries 25 38-40, and as was found for income the disparity has increased over time, specifically among younger men 27. For those who have had a MI, less education is associated with increased risk of death and
Page 57 of 70
For peer review only - http://bmjopen.bmj.com/site/about/guidelines.xhtml
BMJ Open
123456789101112131415161718192021222324252627282930313233343536373839404142434445464748495051525354555657585960
on January 9, 2022 by guest. Protected by copyright.
http://bmjopen.bm
j.com/
BM
J Open: first published as 10.1136/bm
jopen-2016-011529 on 23 January 2017. Dow
nloaded from

For peer review only
recurrence of MI 25. Furthermore, declines in CHD and MI deaths over the past few decades are least evident among those in the lowest SES groups, although again as was found for income these associations are strongest in high-income countries 41 42, and can even be reversed in less developed countries 28. As stated above, one study showed that education interacts with income such that more education only provides a protective effect against MI if a person also has a higher income 28. Nevertheless, education has been found to be an independent predictor of MI, regardless of other known risk factors 43. Surprisingly, in this study years of college education represented the largest gap in prevalence among men who ever had a MI before age 72 (53.3% versus 0.0%; Figure 1). Despite having high cholesterol and diabetes by 65 years old, 2 of the 4 conventional risk factors for MI, men in this group having completed more than 5.5 years of college experienced no MI in the WLS cohort.
References:
1. Anand SS, Islam S, Rosengren A, et al. Risk factors for myocardial infarction in women and men: insights from the INTERHEART study. European Heart Journal 2008;29(7):932-40.
2. Yusuf S, Hawken S, Ounpuu S, et al. Effect of potentially modifiable risk factors associated with myocardial infarction in 52 countries (the INTERHEART study): case-control study. Lancet 2004;364(9438):937-52.
3. Wang JC, Bennett M. Aging and Atherosclerosis: Mechanisms, Functional Consequences, and Potential Therapeutics for Cellular Senescence. Circulation Research 2012;111(2):245-59.
4. O'Leary DH, Polak JF, Kronmal RA, et al. Carotid-Artery Intima and Media Thickness as a Risk Factor for Myocardial Infarction and Stroke in Older Adults. New England Journal of Medicine 1999;340(1):14-22.
5. Bots ML, Hoes AW, Koudstaal PJ, et al. Common Carotid Intima-Media Thickness and Risk of Stroke and Myocardial Infarction: The Rotterdam Study. Circulation 1997;96(5):1432-37.
6. Lee HB, Offidani E, Ziegelstein RC, et al. Five-Factor Model Personality Traits as Predictors of Incident Coronary Heart Disease in the Community: A 10.5-Year Cohort Study Based on the Baltimore Epidemiologic Catchment Area Follow-Up Study. Psychosomatics 2014;55(4):352-61.
7. Taylor MD, Whiteman MC, Fowkes GR, et al. Five Factor Model personality traits and all-cause mortality in the Edinburgh Artery Study cohort. Psychosom Med 2009;71(6):631-41.
8. Jonassaint CR, Boyle SH, Williams RB, et al. Facets of openness predict mortality in patients with cardiac disease. Psychosom Med 2007;69(4):319-22.
9. Jia EZ, Xu ZX, Guo CY, et al. Renin-angiotensin-aldosterone system gene polymorphisms and coronary artery disease: detection of gene-gene and gene-environment interactions. Cell Physiol Biochem 2012;29(3-4):443-52.
10. Oki K, Yamane K, Satoh K, et al. Aldosterone synthase (CYP11B2) C-344T polymorphism affects the association of age-related changes of the serum C-reactive protein. Hypertens Res 2010;33(4):326-30.
11. Kumar NN, Benjafield AV, Lin RCY, et al. Haplotype analysis of aldosterone synthase gene (CYP11B2) polymorphisms shows association with essential hypertension. Journal of Hypertension 2003;21(7).
Page 58 of 70
For peer review only - http://bmjopen.bmj.com/site/about/guidelines.xhtml
BMJ Open
123456789101112131415161718192021222324252627282930313233343536373839404142434445464748495051525354555657585960
on January 9, 2022 by guest. Protected by copyright.
http://bmjopen.bm
j.com/
BM
J Open: first published as 10.1136/bm
jopen-2016-011529 on 23 January 2017. Dow
nloaded from

For peer review only
12. Tsukada K, Ishimitsu T, Teranishi M, et al. Positive association of CYP11B2 gene polymorphism with genetic predisposition to essential hypertension. J Hum Hypertens 2002;16(11):789-93.
13. Tamaki S, Iwai N, Tsujita Y, et al. Genetic Polymorphism of CYP11B2 Gene and Hypertension in Japanese. Hypertension 1999;33(1):266-70.
14. Borzyszkowska J, Stanislawska-Sachadyn A, Wirtwein M, et al. Angiotensin converting enzyme gene polymorphism is associated with severity of coronary artery disease in men with high total cholesterol levels. J Appl Genet 2012;53(2):175-82.
15. Mishra A, Srivastava A, Mittal T, et al. Impact of renin-angiotensin-aldosterone system gene polymorphisms on left ventricular dysfunction in coronary artery disease patients. Dis Markers 2012;32(1):33-41.
16. Sookoian S, Gianotti TF, Gonzalez CD, et al. Association of the C-344T aldosterone synthase gene variant with essential hypertension: a meta-analysis. J Hypertens 2007;25(1):5-13.
17. Davies E, Kenyon CJ. CYP11B2 polymorphisms and cardiovascular risk factors. Journal of Hypertension 2003;21(7).
18. Patel S, Steeds R, Channer K, et al. Analysis of promoter region polymorphism in the aldosterone synthase gene (CYP11B2) as a risk factor for myocardial infarction. American Journal of Hypertension 2000;13(2):134-39.
19. Hautanen A, Toivanen P, Mänttäri M, et al. Joint Effects of an Aldosterone Synthase (CYP11B2) Gene Polymorphism and Classic Risk Factors on Risk of Myocardial Infarction. Circulation 1999;100(22):2213-18.
20. Kwak JH, Paik JK, Kim OY, et al. FADS gene polymorphisms in Koreans: association with omega6 polyunsaturated fatty acids in serum phospholipids, lipid peroxides, and coronary artery disease. Atherosclerosis 2011;214(1):94-100.
21. Thomsen M, Nordestgaard BG. Myocardial infarction and ischemic heart disease in overweight and obesity with and without metabolic syndrome. JAMA Intern Med 2014;174(1):15-22.
22. Després J-P. Body Fat Distribution and Risk of Cardiovascular Disease: An Update. Circulation 2012;126(10):1301-13.
23. Logue J, Murray HM, Welsh P, et al. Obesity is associated with fatal coronary heart disease independently of traditional risk factors and deprivation. Heart 2011;97(7):564-8.
24. Yusuf S, Hawken S, Ounpuu S, et al. Obesity and the risk of myocardial infarction in 27,000 participants from 52 countries: a case-control study. Lancet 2005;366(9497):1640-9.
25. Coady S, Johnson N, Hakes J, et al. Individual education, area income, and mortality and recurrence of myocardial infarction in a Medicare cohort: the National Longitudinal Mortality Study. BMC Public Health 2014;14(1):1-11.
26. Ismail J, Jafar TH, Jafary FH, et al. Risk factors for non-fatal myocardial infarction in young South Asian adults. Heart 2004;90(3):259-63.
27. Kaplan GA, Keil JE. Socioeconomic factors and cardiovascular disease: a review of the literature. Circulation 1993;88(4 Pt 1):1973-98.
28. Piegas LS, Avezum Á, Pereira JCR, et al. Risk factors for myocardial infarction in Brazil. American Heart Journal 2003;146(2):331-38.
29. Lynch JW, Kaplan GA, Cohen RD, et al. Do Cardiovascular Risk Factors Explain the Relation between Socioeconomic Status, Risk of All-Cause Mortality, Cardiovascular Mortality, and Acute Myocardial Infarction? American Journal of Epidemiology 1996;144(10):934-42.
30. Gigante B, Bennet AM, Leander K, et al. The interaction between coagulation factor 2 receptor and interleukin 6 haplotypes increases the risk of myocardial infarction in men. PLoS One 2010;5(6):e11300.
31. Bis JC, Heckbert SR, Smith NL, et al. Variation in inflammation-related genes and risk of incident nonfatal myocardial infarction or ischemic stroke. Atherosclerosis 2008;198(1):166-73.
Page 59 of 70
For peer review only - http://bmjopen.bmj.com/site/about/guidelines.xhtml
BMJ Open
123456789101112131415161718192021222324252627282930313233343536373839404142434445464748495051525354555657585960
on January 9, 2022 by guest. Protected by copyright.
http://bmjopen.bm
j.com/
BM
J Open: first published as 10.1136/bm
jopen-2016-011529 on 23 January 2017. Dow
nloaded from
For peer review only
32. Liu Y, Berthier-Schaad Y, Fallin MD, et al. IL-6 Haplotypes, Inflammation, and Risk for Cardiovascular Disease in a Multiethnic Dialysis Cohort. Journal of the American Society of Nephrology 2006;17(3):863-70.
33. Rosner S, Ridker P, Zee RL, et al. Interaction between inflammation-related gene polymorphisms and cigarette smoking on the risk of myocardial infarction in the Physician’s Health Study. Human Genetics 2005;118(2):287-94.
34. Bennet AM, Prince JA, Fei G-Z, et al. Interleukin-6 serum levels and genotypes influence the risk for myocardial infarction. Atherosclerosis 2003;171(2):359-67.
35. Gafarov VV, Gromova EA, Gafarova AV, et al. [Myocardial infarction and stress at work place and in the family: 10-year risk of development in an open population of 2564 year old men (epidemiological study in a framework of the WHO program MONICA-PSYCHOSOCIAL)]. Kardiologiia 2011;51(3):10-6.
36. Rosengren A, Hawken S, Ôunpuu S, et al. Association of psychosocial risk factors with risk of acute myocardial infarction in 11 119 cases and 13 648 controls from 52 countries (the INTERHEART study): case-control study. The Lancet 2004;364(9438):953-62.
37. Kubzansky LD, Kawachi I, Spiro A, et al. Is Worrying Bad for Your Heart?: A Prospective Study of Worry and Coronary Heart Disease in the Normative Aging Study. Circulation 1997;95(4):818-24.
38. Igland J, Vollset SE, Nygård OK, et al. Educational inequalities in acute myocardial infarction incidence in Norway: a nationwide cohort study. PLoS One 2014;9(9):e106898.
39. Guo J, Li W, Wang Y, et al. Influence of socioeconomic status on acute myocardial infarction in the Chinese population: the INTERHEART China study. Chin Med J (Engl) 2012;125(23):4214-20.
40. Hu B, Li W, Wang X, et al. Marital Status, Education, and Risk of Acute Myocardial Infarction in Mainland China: The INTER-HEART Study. Journal of Epidemiology 2012;22(2):123-29.
41. Manrique-Garcia E, Sidorchuk A, Hallqvist J, et al. Socioeconomic position and incidence of acute myocardial infarction: a meta-analysis. Journal of Epidemiology and Community Health 2011;65(4):301-09.
42. Rosengren A, Subramanian SV, Islam S, et al. Education and risk for acute myocardial infarction in 52 high, middle and low-income countries: INTERHEART case-control study. Heart. England, 2009:2014-22.
43. Qureshi AI, Suri MF, Saad M, et al. Educational attainment and risk of stroke and myocardial infarction. Med Sci Monit. Poland, 2003:CR466-73.
Page 60 of 70
For peer review only - http://bmjopen.bmj.com/site/about/guidelines.xhtml
BMJ Open
123456789101112131415161718192021222324252627282930313233343536373839404142434445464748495051525354555657585960
on January 9, 2022 by guest. Protected by copyright.
http://bmjopen.bm
j.com/
BM
J Open: first published as 10.1136/bm
jopen-2016-011529 on 23 January 2017. Dow
nloaded from
For peer review only
Supplemental Information 9: Additional discussion of recursive partitioning results for females who ever had a MI before age 72 in the WLS cohort.
Using recursive partitioning (RP), this study found that the most important interactive effects among factors associated with MI in females who ever had a MI by 72 years old was first having diabetes by 65 years old (see Figure 3). For those who did not have diabetes by 65, the next most important factor was having high blood pressure by 65, with a 2.7-fold increase in prevalence among those women who did have high blood pressure by 65 (7.6% versus 2.8%), followed by how often one engaged in light physical activity with others when about 67 years old (asked at 72 years) for those who did not have high blood pressure by 65. For those who engaged in light physical activity with others often, prevalence decreased from 2.8% to 0.2%, with MI nearly disappearing among this group in the WLS cohort. However, for those who engaged in light physical activity with others rarely or never when about 67, prevalence increased from 2.8% to 3.7%, demonstrating an 18.5-fold increase over those who engaged in light activity often (Figure 3). This result supports what is already understood about the effect of physical inactivity on MI risk (see main text). For those who did have high blood pressure by 65 years old, important interactions included the number of years one had smoked by 54 and whether one blames themselves when stressed (at 72 years old). For women, diabetes, high blood pressure, and smoking all act to increase one’s MI risk, which (as in men) represent 3 of the 4 key or conventional risk factors for MI 1-6. Smoking more than 24.5 years by 54 years old increased the prevalence of MI by 3.3-fold within this group (16.6% versus 5.1%; see Figure 3). Additionally, those who blamed themselves a medium amount or a lot when stressed showed a 4.4-fold increase in MI prevalence over those who blamed themselves only a little bit or not at all (11.8% versus 2.7%; Figure 3). This factor represents (a facet of) one’s coping strategy and it has been shown in prior studies that an unhealthy coping strategy, such as blaming oneself when under stress can lead to an increase in overall ill-health, as well as increased risk for MI 7 8. Blaming oneself when under stress has also been linked to depression 9 10, which is associated with increased MI risk, and one’s general state of mind after MI can affect post-MI risk for recurrent MI or death 11-16. The largest gap in prevalence was seen between those who reported engaging in light physical activity with others often versus those who reported rarely or never; although, this factor was associated with lower MI prevalence than the above listed factors. Furthermore, only women diagnosed with diabetes by 65 years old had a MI prevalence higher than that demonstrated among men in the WLS cohort. And even considering interactions among all other factors in the RP tree, no other group of women who ever had a MI by 72 years old (nodes in the tree) reached the prevalence achieved by those who had diabetes by 65 years old. This suggests that diabetes truly is the single most important factor associated with MI for women in the WLS, and points to this as a potentially important predictor for whether a woman will have a MI in her lifetime.
Page 61 of 70
For peer review only - http://bmjopen.bmj.com/site/about/guidelines.xhtml
BMJ Open
123456789101112131415161718192021222324252627282930313233343536373839404142434445464748495051525354555657585960
on January 9, 2022 by guest. Protected by copyright.
http://bmjopen.bm
j.com/
BM
J Open: first published as 10.1136/bm
jopen-2016-011529 on 23 January 2017. Dow
nloaded from
For peer review only
References:
1. González-Pacheco H, Vargas-Barron J, Vallejo M, et al. Prevalence of conventional risk factors and lipid profiles in patients with acute coronary syndrome and significant coronary disease. Ther Clin Risk Manag 2014;10:815-23.
2. Stone NJ, Robinson JG, Lichtenstein AH, et al. 2013 ACC/AHA Guideline on the Treatment of Blood Cholesterol to Reduce Atherosclerotic Cardiovascular Risk in Adults: A Report of the American College of Cardiology/American Heart Association Task Force on Practice Guidelines. Circulation 2014;129(25 suppl 2):S1-S45.
3. Langsted A, Freiberg JJ, Tybjaerg-Hansen A, et al. Nonfasting cholesterol and triglycerides and association with risk of myocardial infarction and total mortality: the Copenhagen City Heart Study with 31 years of follow-up. J Intern Med 2011;270(1):65-75.
4. Yusuf S, Hawken S, Ounpuu S, et al. Effect of potentially modifiable risk factors associated with myocardial infarction in 52 countries (the INTERHEART study): case-control study. Lancet 2004;364(9438):937-52.
5. Khot UN, Khot MB, Bajzer CT, et al. Prevalence of conventional risk factors in patients with coronary heart disease. Jama 2003;290(7):898-904.
6. Magnus P, Beaglehole R. The real contribution of the major risk factors to the coronary epidemics: time to end the "only-50%" myth. Arch Intern Med 2001;161(22):2657-60.
7. Roohafza H, Talaei M, Pourmoghaddas Z, et al. Association of social support and coping strategies with acute coronary syndrome: A case–control study. Journal of Cardiology 2012;59(2):154-59.
8. Penley J, Tomaka J, Wiebe J. The Association of Coping to Physical and Psychological Health Outcomes: A Meta-Analytic Review. Journal of Behavioral Medicine 2002;25(6):551-603.
9. Garnefski N, Kraaij V, Spinhoven P. Negative life events, cognitive emotion regulation and emotional problems. Personality and Individual Differences 2001;30(8):1311-27.
10. Anderson CA, Miller RS, Riger AL, et al. Behavioral and characterological attributional styles as predictors of depression and loneliness: review, refinement, and test. J Pers Soc Psychol 1994;66(3):549-58.
11. Bennett KK, Howarter AD, Clark JM. Self-blame attributions, control appraisals and distress among cardiac rehabilitation patients. Psychol Health 2013;28(6):637-52.
12. Arnold SV, Smolderen KG, Buchanan DM, et al. Perceived stress in myocardial infarction: long-term mortality and health status outcomes. J Am Coll Cardiol 2012;60(18):1756-63.
13. Garnefski N, Kraaij V, Schroevers MJ, et al. Post-traumatic growth after a myocardial infarction: a matter of personality, psychological health, or cognitive coping? J Clin Psychol Med Settings 2008;15(4):270-7.
14. Frasure-Smith N, Lesperance F. Depression and other psychological risks following myocardial infarction. Arch Gen Psychiatry. United States, 2003:627-36.
15. Welin C, Lappas G, Wilhelmsen L. Independent importance of psychosocial factors for prognosis after myocardial infarction. J Intern Med. England, 2000:629-39.
16. Affleck G, Tennen H, Croog S, et al. Causal attribution, perceived benefits, and morbidity after a heart attack: an 8-year study. J Consult Clin Psychol 1987;55(1):29-35.
Page 62 of 70
For peer review only - http://bmjopen.bmj.com/site/about/guidelines.xhtml
BMJ Open
123456789101112131415161718192021222324252627282930313233343536373839404142434445464748495051525354555657585960
on January 9, 2022 by guest. Protected by copyright.
http://bmjopen.bm
j.com/
BM
J Open: first published as 10.1136/bm
jopen-2016-011529 on 23 January 2017. Dow
nloaded from
For peer review only
Supplemental Information 10: Additional discussion of recursive partitioning results for females who had a MI between 65-72 years of age in the WLS cohort.
Using recursive partitioning (RP), this study found that the most important interactive effects among factors associated with MI in females between 65-72 years of age was first having diabetes by 65 years old (see Figure 4), with a 3.9-fold increase in MI incidence among those with diabetes by 65 years (7.8% versus 2.0%), suggesting that this is the most important MI associated factor for women in the WLS. For those who did have diabetes by 65, the next most important factor was their summary score for agreeableness at 65 years, and then whether they had menstruated in the last 12 months at 54 years old. Those women who had an agreeableness score < 32.5 at 65 had a 10.9% MI incidence rate, while those whose agreeableness score was ≥ 32.5 at 65 years reported no MIs (0.0% incidence; Figure 4), which is supported by previous studies in which agreeableness was shown to have an inverse relationship with CHD risk 1 2. Among those women whose agreeableness score was <32.5 at 65 years old, MI incidence increased further for those who had not menstruated in the last 12 months at 54 to 14.0%, while those who had menstruated in the last 12 months at 54 saw incidence once again drop to 0.0% (Figure 4). Therefore, even for those women who were diagnosed with diabetes by 65, the top factor associated with MI for women in the WLS cohort, and who reported a lower agreeableness score at 65, still having their menstrual cycle at 53 years old seems to have provided a protective effect against MI. Further research is needed to confirm this finding, but prior research on hormonal imbalance due to menopause and MI risk in women lends support 3-10. Among those women who did not have diabetes by 65 years old, the factors that interacted to affect MI incidence were IQ, genotype for the Inhibin Beta B gene, and whether her work required physical effort at 54 years old. Women with an IQ < 112.5 had an incidence rate 4.0-fold higher than women with an IQ ≥ 112.5, although incidence was relatively low among both of these groups (2.4% versus 0.6%; Figure 4). Prior studies have shown that IQ relates to CVD, CHD, and all-cause mortality, however there are mixed results in the literature suggesting the association is linked with socioeconomic status in adulthood and other known risk factors 11-15. For those with a higher IQ (≥ 112.5), having a G:A or G:G genotype for the Inhibin Beta B gene polymorphism (rs11902591 SNP) resulted in an increased MI incidence of 4.7% compared to no incidence (0.0%) among those with the A:A genotype at this polymorphism site. This suggests that the A:A genotype confers a protective effect against MI, or at least that the G allele may leave someone at risk. However, there are no prior studies linking MI to the Inhibin Beta B gene, therefore further investigation is necessary. For those women carrying the G allele at the Inhibin Beta B polymorphism site, whether her work required physical effort at 54 years mediated the (above) proposed effect (Figure 4). Incidence among those women whose work required physical effort frequently was 25%, while those whose work required physical effort always, sometimes, rarely or never reported no MIs (0.0%
Page 63 of 70
For peer review only - http://bmjopen.bmj.com/site/about/guidelines.xhtml
BMJ Open
123456789101112131415161718192021222324252627282930313233343536373839404142434445464748495051525354555657585960
on January 9, 2022 by guest. Protected by copyright.
http://bmjopen.bm
j.com/
BM
J Open: first published as 10.1136/bm
jopen-2016-011529 on 23 January 2017. Dow
nloaded from
For peer review only
incidence). Although previous research has supported an association between physical activity and MI, this result may be an artifact of the way the data was collected (ie. survey) and how participants chose to answer the question. Sedentary behavior has been shown to increase one’s risk of all-cause mortality, including CVD and CHD mortality and incidence, specifically when one is sedentary in their occupation as well as at home 16-20. However, it has been suggested that physical activity in the workplace does not have the same effect as physical leisure activity when it comes to MI, and may in fact increase one’s risk of MI if the occupational activity is highly strenuous or repetitive 21-25; therefore, further study is warranted.
Among those women who did not have diabetes but had a lower IQ (< 112.5), one’s summary score for extraversion at 54 years, how many hours/month she engaged in light physical activities alone at 65, how many alcoholic drinks she consumed per month at 65, body mass index at 65, genotype for the A2M gene polymorphism, how often she worked under the pressure of time at 54, and the age at which she last menstruated (reported at 65 years old) become important interactions associated with MI (see Figure 4). Each of the aforementioned factors interacted with its preceding factor to either increase MI incidence, or drop it down to zero (or nearly zero), suggesting a potential protective effect against MI. For women whose summary score for extraversion at 54 years was ≥ 17.5, incidence was 2.8%, while for those whose summary score for extraversion was < 17.5, incidence was 0.0%. Although our study demonstrated a positive relationship between extraversion and MI, results produced by previous studies suggest a negative association 26, therefore more study is needed. Among those women who demonstrated a higher score for extraversion, MI incidence increased to 3.0% among those who engaged in light physical activities alone ≥ 11 hours/month at 65, a 7.5-fold increase over those who engaged in light physical activities alone < 11 hours/month at 65 (0.4% incidence). However, it is widely agreed that more physical leisure activity reduces one’s MI risk, and runs counter to the results produced by this study’s analysis of women who ever had a MI by 72 (see Figure 3) in which those women who often engaged in light physical activities with others when ~ 67 years old (asked at 72) showed a reduced incidence of MI compared to those who engaged in these activities rarely or never. Therefore we suggest that there may be an effect of women feeling they participated in activities ‘alone’ versus ‘with others’ during this time period in their lives, as it has been shown that a woman’s MI risk is increased when she feels she lacks a strong social support or a strong social network 27 28, but this remains an anomaly amongst our results. For women who drank < 20.5 alcoholic drinks/month at 65 years, MI incidence was increased to 3.6%, while dropping to 0.0% among those who drank ≥ 20.5 alcoholic drinks/month at 65, once again supporting that regular, moderate alcohol consumption helps protect against MI. A body mass index of ≥ 22.5 at 65 years interacted to increase MI incidence among women to 4.3%, while a body mass index < 22.5 at 65 years resulted in an incidence of 0.0% (Figure 4). Body mass index interacted with a
Page 64 of 70
For peer review only - http://bmjopen.bmj.com/site/about/guidelines.xhtml
BMJ Open
123456789101112131415161718192021222324252627282930313233343536373839404142434445464748495051525354555657585960
on January 9, 2022 by guest. Protected by copyright.
http://bmjopen.bm
j.com/
BM
J Open: first published as 10.1136/bm
jopen-2016-011529 on 23 January 2017. Dow
nloaded from
For peer review only
woman’s genotype for the A2M gene polymorphism (rs669 SNP) site, such that those with a G:A or G:G genotype experienced an increase in MI incidence to 5.9%, an 8.4-fold increase over those with the A:A genotype (0.7% incidence). However, there are no prior studies linking MI to the A2M gene, therefore further study concerning this association is warranted. One’s genotype at the A2M gene polymorphism interacted with how often a woman worked under the pressure of time at 54 years old, such that those who did always, sometimes, rarely, or never showed a MI incidence of 9.4%, while those who worked under the pressure of time frequently at 54 years experienced no MIs (0.0% incidence; Figure 4). Working under the pressure of time has not specifically been associated with MI in prior studies; however, other types of job stress have been linked to increased MI 29-33. Unfortunately, the results from the current study are unclear about whether the identified association is positive or negative, and again may be an artifact of the way the data was collected and how participants chose to answer the question; therefore, additional study is necessary. Finally, working under the pressure of time interacted with the age at which a woman last menstruated, such that those who had last menstruated at < 50.5 years (reported at 65 years old) showed a MI incidence of 13.8%, while those who last menstruated at ≥ 50.5 years of age had no MIs (0.0%) by 72 years old. This result is supported by previous studies (concerning hormonal imbalance, as described in main text) and by other results in this study, for example, whether a woman had not menstruated in the last 12 months at 54 years old (14% incidence; see above). This finding lends support to the assertion that a woman’s MI risk increases inversely to the age at which she stops menstruating, at which time her hormonal levels become out of balance. It seems that for women, the state of her hormonal balance in her younger years (< 65) becomes a stronger factor for MI as she ages and may affect who experiences a MI in their later years (between 65-72 years old). Each of the interactions listed above was associated with either an increased MI incidence or no incidence, suggesting that these are critical (interactive) factors for MI among women between 65-72 years old in the WLS cohort. Even among those women who appeared in the ‘riskier’ group for each factor listed, the next factor could interact to drop MI incidence down to 0.0% (or close to zero) for these women (Figure 4).
References:
1. Sutin AR, Scuteri A, Lakatta EG, et al. Trait antagonism and the progression of arterial thickening: women with antagonistic traits have similar carotid arterial thickness as men. Hypertension. United States, 2010:617-22.
2. Costa PT, Stone SV, McCrae RR, et al. Hostility, Agreeableness-Antagonism, and Coronary Heart Disease. Holistic Medicine 1987;2(3):161-67.
3. Parker WH, Feskanich D, Broder MS, et al. Long-term mortality associated with oophorectomy compared with ovarian conservation in the nurses' health study. Obstet Gynecol. United States, 2013:709-16.
Page 65 of 70
For peer review only - http://bmjopen.bmj.com/site/about/guidelines.xhtml
BMJ Open
123456789101112131415161718192021222324252627282930313233343536373839404142434445464748495051525354555657585960
on January 9, 2022 by guest. Protected by copyright.
http://bmjopen.bm
j.com/
BM
J Open: first published as 10.1136/bm
jopen-2016-011529 on 23 January 2017. Dow
nloaded from
For peer review only
4. Wellons M, Ouyang P, Schreiner PJ, et al. Early menopause predicts future coronary heart disease and stroke: the Multi-Ethnic Study of Atherosclerosis. Menopause 2012;19(10):1081-7.
5. Ingelsson E, Lundholm C, Johansson AL, et al. Hysterectomy and risk of cardiovascular disease: a population-based cohort study. Eur Heart J. England, 2011:745-50.
6. Parker WH, Broder MS, Chang E, et al. Ovarian conservation at the time of hysterectomy and long-term health outcomes in the nurses' health study. Obstet Gynecol. United States, 2009:1027-37.
7. Lobo RA. Surgical menopause and cardiovascular risks. Menopause. United States, 2007:562-6. 8. Stampfer MJ, Colditz GA, Willett WC. Menopause and Heart Disease. Annals of the New York
Academy of Sciences 1990;592(1):193-203. 9. Colditz GA, Willett WC, Stampfer MJ, et al. Menopause and the risk of coronary heart disease in
women. N Engl J Med 1987;316(18):1105-10. 10. Rosenberg L, Hennekens CH, Rosner B, et al. Early menopause and the risk of myocardial
infarction. Am J Obstet Gynecol. United States, 1981:47-51. 11. Calvin CM, Deary IJ, Fenton C, et al. Intelligence in youth and all-cause-mortality: systematic
review with meta-analysis. International Journal of Epidemiology 2011;40(3):626-44. 12. Batty GD, Shipley MJ, Mortensen LH, et al. IQ in late adolescence/early adulthood, risk factors in
middle age and later all-cause mortality in men: the Vietnam Experience Study. Journal of Epidemiology and Community Health 2008;62(6):522-31.
13. Batty GD, Deary IJ, Gottfredson LS. Premorbid (early life) IQ and Later Mortality Risk: Systematic Review. Annals of Epidemiology 2007;17(4):278-88.
14. Hart CL, Taylor MD, Smith G, et al. Childhood IQ and all-cause mortality before and after age 65: Prospective observational study linking the Scottish Mental Survey 1932 and the Midspan studies. British Journal of Health Psychology 2005;10(2):153-65.
15. Hart CL, Taylor MD, Davey Smith G, et al. Childhood IQ, social class, deprivation, and their relationships with mortality and morbidity risk in later life: prospective observational study linking the Scottish Mental Survey 1932 and the Midspan studies. Psychosom Med 2003;65(5):877-83.
16. Biswas A, Oh PI, Faulkner GE, et al. Sedentary time and its association with risk for disease incidence, mortality, and hospitalization in adults: a systematic review and meta-analysis. Ann Intern Med 2015;162(2):123-32.
17. Mozumdar A, Liguori G, DuBose K. Occupational physical activity and risk of coronary heart disease among active and non-active working-women of North Dakota: a Go Red North Dakota Study. Anthropol Anz 2012;69(2):201-19.
18. Berlin JA, Colditz GA. A META-ANALYSIS OF PHYSICAL ACTIVITY IN THE PREVENTION OF CORONARY HEART DISEASE. American Journal of Epidemiology 1990;132(4):612-28.
19. Salonen JT, Slater JS, Tuomilehto J, et al. Leisure time and occupational physical activity: risk of death from ischemic heart disease. Am J Epidemiol 1988;127(1):87-94.
20. Salonen JT, Puska P, Tuomilehto J. Physical activity and risk of myocardial infarction, cerebral stroke and death: a longitudinal study in Eastern Finland. Am J Epidemiol 1982;115(4):526-37.
21. Holtermann A, Marott JL, Gyntelberg F, et al. Occupational and leisure time physical activity: risk of all-cause mortality and myocardial infarction in the Copenhagen City Heart Study. A prospective cohort study. BMJ Open 2012;2(1).
22. Sofi F, Capalbo A, Marcucci R, et al. Leisure time but not occupational physical activity significantly affects cardiovascular risk factors in an adult population. Eur J Clin Invest. England, 2007:947-53.
23. Fransson E, De Faire U, Ahlbom A, et al. The risk of acute myocardial infarction: interactions of types of physical activity. Epidemiology. United States, 2004:573-82.
Page 66 of 70
For peer review only - http://bmjopen.bmj.com/site/about/guidelines.xhtml
BMJ Open
123456789101112131415161718192021222324252627282930313233343536373839404142434445464748495051525354555657585960
on January 9, 2022 by guest. Protected by copyright.
http://bmjopen.bm
j.com/
BM
J Open: first published as 10.1136/bm
jopen-2016-011529 on 23 January 2017. Dow
nloaded from

For peer review only
24. Mittleman MA, Maclure M, Tofler GH, et al. Triggering of Acute Myocardial Infarction by Heavy Physical Exertion -- Protection against Triggering by Regular Exertion. New England Journal of Medicine 1993;329(23):1677-83.
25. Gyntelberg F, Lauridsen L, Schubell K. Physical fitness and risk of myocardial infarction in Copenhagen males aged 40-59: A five- and seven-year follow-up study. Scandinavian Journal of Work, Environment & Health 1980;6(3):170-78.
26. Andre-Petersson L, Schlyter M, Engstrom G, et al. Behavior in a stressful situation, personality factors, and disease severity in patients with acute myocardial infarction: baseline findings from the prospective cohort study SECAMI (the Secondary Prevention and Compliance following Acute Myocardial Infarction study). BMC Cardiovasc Disord 2011;11:45.
27. Welin C, Lappas G, Wilhelmsen L. Independent importance of psychosocial factors for prognosis after myocardial infarction. J Intern Med. England, 2000:629-39.
28. Brezinka V, Kittel F. Psychosocial factors of coronary heart disease in women: a review. Soc Sci Med 1996;42(10):1351-65.
29. Moller J, Theorell T, de Faire U, et al. Work related stressful life events and the risk of myocardial infarction. Case-control and case-crossover analyses within the Stockholm heart epidemiology programme (SHEEP). J Epidemiol Community Health. England, 2005:23-30.
30. Liu Y, Tanaka H. Overtime work, insufficient sleep, and risk of non-fatal acute myocardial infarction in Japanese men. Occupational and Environmental Medicine 2002;59(7):447-51.
31. Yoshimasu K. Relation of type A behavior pattern and job-related psychosocial factors to nonfatal myocardial infarction: a case-control study of Japanese male workers and women. Psychosom Med 2001;63(5):797-804.
32. Welin C, Rosengren A, Wedel H, et al. Myocardial infarction in relation to work, family and life events. Cardiovascular Risk Factors 1995;5(1):30-38.
33. Karasek RA, Theorell T, Schwartz JE, et al. Job characteristics in relation to the prevalence of myocardial infarction in the US Health Examination Survey (HES) and the Health and Nutrition Examination Survey (HANES). American Journal of Public Health 1988;78(8):910-18.
Page 67 of 70
For peer review only - http://bmjopen.bmj.com/site/about/guidelines.xhtml
BMJ Open
123456789101112131415161718192021222324252627282930313233343536373839404142434445464748495051525354555657585960
on January 9, 2022 by guest. Protected by copyright.
http://bmjopen.bm
j.com/
BM
J Open: first published as 10.1136/bm
jopen-2016-011529 on 23 January 2017. Dow
nloaded from

For peer review only
27
STROBE Statement—checklist of items that should be included in reports of observational studies Item
No. Recommendation Reported on Page #
Title and abstract 1 (a) Indicate the study’s design with a commonly used term in the title or the abstract 1 (b) Provide in the abstract an informative and balanced summary of what was done and what was found
2
Introduction Background/rationale 2 Explain the scientific background and rationale for the investigation being reported 4 Objectives 3 State specific objectives, including any prespecified hypotheses 4 Methods Study design 4 Present key elements of study design early in the paper 5-7 Setting 5 Describe the setting, locations, and relevant dates, including periods of recruitment, exposure,
follow-up, and data collection 5-7
Participants 6 (a) Cohort study—Give the eligibility criteria, and the sources and methods of selection of participants. Describe methods of follow-up Case-control study—Give the eligibility criteria, and the sources and methods of case ascertainment and control selection. Give the rationale for the choice of cases and controls Cross-sectional study—Give the eligibility criteria, and the sources and methods of selection of participants
5
(b) Cohort study—For matched studies, give matching criteria and number of exposed and unexposed Case-control study—For matched studies, give matching criteria and the number of controls per case
NA
Variables 7 Clearly define all outcomes, exposures, predictors, potential confounders, and effect modifiers. Give diagnostic criteria, if applicable
5-7
Data sources/ measurement
8* For each variable of interest, give sources of data and details of methods of assessment (measurement). Describe comparability of assessment methods if there is more than one group
5-7
Bias 9 Describe any efforts to address potential sources of bias 8-9 Study size 10 Explain how the study size was arrived at 6 Continued on next page
Page 68 of 70
For peer review only - http://bmjopen.bmj.com/site/about/guidelines.xhtml
BMJ Open
123456789101112131415161718192021222324252627282930313233343536373839404142434445464748495051525354555657585960
on January 9, 2022 by guest. Protected by copyright.
http://bmjopen.bm
j.com/
BM
J Open: first published as 10.1136/bm
jopen-2016-011529 on 23 January 2017. Dow
nloaded from

For peer review only
28
Quantitative variables
11 Explain how quantitative variables were handled in the analyses. If applicable, describe which groupings were chosen and why
7-8
Statistical methods
12 (a) Describe all statistical methods, including those used to control for confounding 7-8 (b) Describe any methods used to examine subgroups and interactions 7-8 (c) Explain how missing data were addressed 8-9 (d) Cohort study—If applicable, explain how loss to follow-up was addressed Case-control study—If applicable, explain how matching of cases and controls was addressed Cross-sectional study—If applicable, describe analytical methods taking account of sampling strategy
8-9
(e) Describe any sensitivity analyses 8-9 Results Participants 13* (a) Report numbers of individuals at each stage of study—eg numbers potentially eligible,
examined for eligibility, confirmed eligible, included in the study, completing follow-up, and analysed
5-6, 10
(b) Give reasons for non-participation at each stage 6 (c) Consider use of a flow diagram NA
Descriptive data
14* (a) Give characteristics of study participants (eg demographic, clinical, social) and information on exposures and potential confounders
10, Table 1
(b) Indicate number of participants with missing data for each variable of interest Supplemental Table 1
(c) Cohort study—Summarise follow-up time (eg, average and total amount) NA Outcome data 15* Cohort study—Report numbers of outcome events or summary measures over time Tables 2, 3
Case-control study—Report numbers in each exposure category, or summary measures of exposure Tables 2, 3 Cross-sectional study—Report numbers of outcome events or summary measures NA
Main results 16 (a) Give unadjusted estimates and, if applicable, confounder-adjusted estimates and their precision (eg, 95% confidence interval). Make clear which confounders were adjusted for and why they were included
10-15
(b) Report category boundaries when continuous variables were categorized NA (c) If relevant, consider translating estimates of relative risk into absolute risk for a meaningful time period
NA
Continued on next page
Page 69 of 70
For peer review only - http://bmjopen.bmj.com/site/about/guidelines.xhtml
BMJ Open
123456789101112131415161718192021222324252627282930313233343536373839404142434445464748495051525354555657585960
on January 9, 2022 by guest. Protected by copyright.
http://bmjopen.bm
j.com/
BM
J Open: first published as 10.1136/bm
jopen-2016-011529 on 23 January 2017. Dow
nloaded from

For peer review only
29
Other analyses 17 Report other analyses done—eg analyses of subgroups and interactions, and sensitivity analyses 10-15 Discussion Key results 18 Summarise key results with reference to study objectives 16 Limitations 19 Discuss limitations of the study, taking into account sources of potential bias or imprecision. Discuss
both direction and magnitude of any potential bias 20-21
Interpretation 20 Give a cautious overall interpretation of results considering objectives, limitations, multiplicity of analyses, results from similar studies, and other relevant evidence
21-22
Generalisability 21 Discuss the generalisability (external validity) of the study results 16-20 Other information Funding 22 Give the source of funding and the role of the funders for the present study and, if applicable, for the
original study on which the present article is based 22
*Give information separately for cases and controls in case-control studies and, if applicable, for exposed and unexposed groups in cohort and cross-sectional studies. Note: An Explanation and Elaboration article discusses each checklist item and gives methodological background and published examples of transparent reporting. The STROBE checklist is best used in conjunction with this article (freely available on the Web sites of PLoS Medicine at http://www.plosmedicine.org/, Annals of Internal Medicine at http://www.annals.org/, and Epidemiology at http://www.epidem.com/). Information on the STROBE Initiative is available at www.strobe-statement.org.
Page 70 of 70
For peer review only - http://bmjopen.bmj.com/site/about/guidelines.xhtml
BMJ Open
123456789101112131415161718192021222324252627282930313233343536373839404142434445464748495051525354555657585960
on January 9, 2022 by guest. Protected by copyright.
http://bmjopen.bm
j.com/
BM
J Open: first published as 10.1136/bm
jopen-2016-011529 on 23 January 2017. Dow
nloaded from
Copyright © 2022 FDOKUMEN