Supplemental material - BMJ Global Health
75
1 Appendix 1. Appendix 1: Databases searched March 31, 2020 Database(s) Ovid MEDLINE, EMBASE, AMED, Global Health, PSYCHInfo Global Index Medicus African Index Medicus, Latin American and Caribbean Health Sciences Literature, Index Medicus Eastern Mediterranean Region, Index Medicus South East Asia Region, Western Pacific Region Index Medicus CINAHL Plus Cochrane Database of Systematic Reviews Science Direct OpenGrey Grey Literature Report 2. Appendix 2: Systematic Search String Parameter (((assistive OR accessible Or inclusive Or adaptive OR self?help) AND (tech* OR product$ OR device$ OR software)) OR (aid OR wheelchair$ OR hearing?aid OR prosthe* OR glasses OR spectacle$ OR eyeglasses OR PDA$ OR “personal digital assistant”)) AND (coverage OR unmet OR under?met OR need OR prevalence OR distribution OR provision or suppl* OR demand) AND (impair* OR disab* OR functi* limit* OR limit* functi* OR correct* OR uncorrect*) .ab,ti 3. Appendix 3: Full data extraction details Details Publication Authors, year of publication Setting Data collection dates, geography (to the smallest scale provided), WHO region Population N included, age range Methodology Study design, sampling frame, sampling strategy Assessment Assessment approach(es), survey/tool/dataset name (if applicable), APs included, definition(s)/threshold(s) for functional difficulty Results AP indicator definition provided in text, corresponding AP indicator definition in review, AP indicator value (numerator, denominator, proportion, confidence intervals, weighted), other variables stratified Risk of Bias Overall Joanna Briggs Institute (JBI) Score, checklist items missed 4. Appendix 4: An example of indirectly extracting AP indicators. A study may report glasses coverage as 30%, because 30 of 100 total participants reported using glasses. By our definition, this would actually be an indicator of ‘use’, which is how we would extract and report it. However, if the study further specifies that of these 30, 20 had ‘normal vision’ when using their glasses and 10 had an outdated prescription, and of the 70 without glasses, 25 would benefit from having them prescribed, these data would indirectly inform other AP indicators. Using our terms and definitions out of the total population, we can therefore extract and report the met need for this study at 20%, the under-met need at 10%, and the unmet need at 25%. This demonstrates a total need of 55% and allows the calculation of coverage by our definition as met need (20) divided by total need (55), or 36.4%. 5. Appendix 5: Adapted Joanna Briggs Institute Checklist for Prevalence Studies & Common reasons for missing each Checklist Item* Common reasons for missing 1 Was the sample frame appropriate to address the target population? The sample frame is not described; the sampling frame is not suitable to get a representative sample of the target population. BMJ Publishing Group Limited (BMJ) disclaims all liability and responsibility arising from any reliance Supplemental material placed on this supplemental material which has been supplied by the author(s) BMJ Global Health doi: 10.1136/bmjgh-2021-007662 :e007662. 7 2022; BMJ Global Health , et al. Danemayer J
-
Upload
khangminh22 -
Category
Documents
-
view
1 -
download
0
Transcript of Supplemental material - BMJ Global Health

1
Appendix
1. Appendix 1: Databases searched March 31, 2020
Database(s)
Ovid MEDLINE, EMBASE, AMED, Global Health, PSYCHInfo
Global Index Medicus
African Index Medicus, Latin American and Caribbean Health Sciences Literature, Index Medicus Eastern Mediterranean Region, Index Medicus South East Asia Region, Western Pacific Region Index Medicus
CINAHL Plus
Cochrane Database of Systematic Reviews
Science Direct
OpenGrey
Grey Literature Report
2. Appendix 2: Systematic Search String
Parameter
(((assistive OR accessible Or inclusive Or adaptive OR self?help) AND (tech* OR product$ OR device$ OR software))
OR (aid OR wheelchair$ OR hearing?aid OR prosthe* OR glasses OR spectacle$ OR eyeglasses OR PDA$ OR “personal digital assistant”))
AND (coverage OR unmet OR under?met OR need OR prevalence OR distribution OR provision or suppl* OR demand)
AND (impair* OR disab* OR functi* limit* OR limit* functi* OR correct* OR uncorrect*)
.ab,ti
3. Appendix 3: Full data extraction details
Details
Publication Authors, year of publication
Setting Data collection dates, geography (to the smallest scale provided), WHO region
Population N included, age range
Methodology Study design, sampling frame, sampling strategy
Assessment Assessment approach(es), survey/tool/dataset name (if applicable), APs included, definition(s)/threshold(s) for functional difficulty
Results AP indicator definition provided in text, corresponding AP indicator definition in review, AP indicator value (numerator, denominator, proportion, confidence intervals, weighted), other variables stratified
Risk of Bias Overall Joanna Briggs Institute (JBI) Score, checklist items missed
4. Appendix 4: An example of indirectly extracting AP indicators.
A study may report glasses coverage as 30%, because 30 of 100 total participants reported using glasses. By our definition, this would actually be an indicator of ‘use’, which is how we would extract and report it. However, if the study further specifies that of these 30, 20 had ‘normal vision’ when using their glasses and 10 had an outdated prescription, and of the 70 without glasses, 25 would benefit from having them prescribed, these data would indirectly inform other AP indicators. Using our terms and definitions out of the total population, we can therefore extract and report the met need for this study at 20%, the under-met need at 10%, and the unmet need at 25%. This demonstrates a total need of 55% and allows the calculation of coverage by our definition as met need (20) divided by total need (55), or 36.4%.
5. Appendix 5: Adapted Joanna Briggs Institute Checklist for Prevalence Studies & Common reasons for missing each
Checklist Item* Common reasons for missing
1 Was the sample frame appropriate to address the target population?
The sample frame is not described; the sampling frame is not suitable to get a representative sample of the target population.
BMJ Publishing Group Limited (BMJ) disclaims all liability and responsibility arising from any relianceSupplemental material placed on this supplemental material which has been supplied by the author(s) BMJ Global Health
doi: 10.1136/bmjgh-2021-007662:e007662. 7 2022;BMJ Global Health, et al. Danemayer J

2
2 Were study participants sampled in an appropriate way? The sampling strategy is not described; non-random sampling method used.
3 Was the sample size adequate? No sample size calculation was demonstrated if presenting significance measures.
4 Were the study subjects and the setting described in detail?
Locations within a country were not provided; study dates were not provided or specified other than years; age inclusion limitations were not provided.
5 Was the data analysis conducted with sufficient coverage of the identified sample?
A substantial portion of those eligible for inclusion in the analysis were not due to incomplete data.
6 Were valid methods used for the identification of the condition?
Impairment definition unclear; threshold for classifying AP need unclear.
7 Was the condition measured in a standard, reliable way for all participants?
The assessment approach used was not validated elsewhere.
8 Was there appropriate statistical analysis? AP indicator calculations unclear and not possible to replicate with information provided; discrepancies/errors between results reported in tables and in text.
9 Was the response rate adequate, and if not, was the low response rate managed appropriately?
The response rate was below 80% and no demographic description, follow-up of non-participants, or adjustment to the study method was undertaken.
10** Was consent obtained from/for all participants and ethical guidelines followed?
Consent and ethics were not mentioned in the study.
*To assess the risk of bias in primary studies that used a pre-established method protocol, or secondary analyses that did not include all
primary study details, the study needed to cite the original record providing full details. The score was otherwise lowered for every missing
checklist item.
** The 10th item was added to the standard JBI list by review authors.
BMJ Publishing Group Limited (BMJ) disclaims all liability and responsibility arising from any relianceSupplemental material placed on this supplemental material which has been supplied by the author(s) BMJ Global Health
doi: 10.1136/bmjgh-2021-007662:e007662. 7 2022;BMJ Global Health, et al. Danemayer J

3
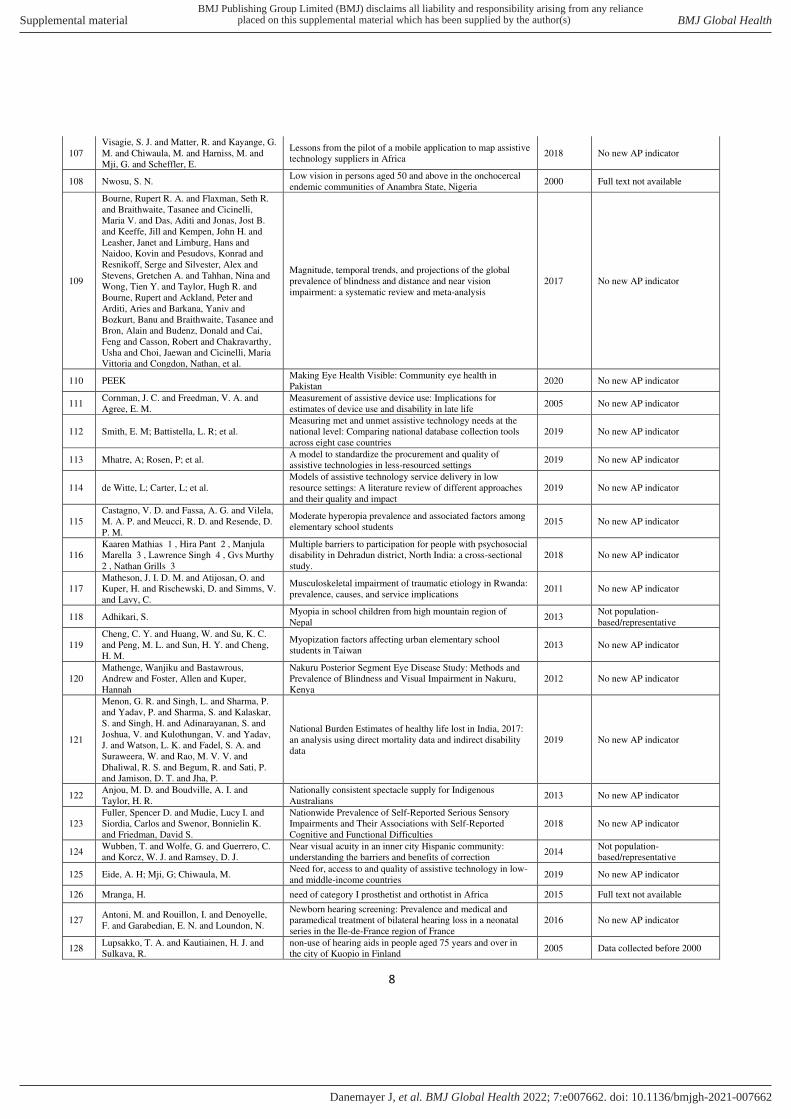
6. Appendix 6: Studies excluded during full-text review
Author(s) Title Publish date
Reason for excl.
1 Davis, A. and Smith, P. and Ferguson, M. and Stephens, D. and Gianopoulos, I.
Acceptability, benefit and costs of early screening for hearing disability: A study of potential screening tests and models
2007 Data collected before 2000
2 Contepomi, S. Access to appropriate assistive technology in less-resourced settings: Argentina's case
2019 Not population-based/representative
3 Silver, E. J. and Stein, R. E. Access to care, unmet health needs, and poverty status among children with and without chronic conditions
2001 Data collected before 2000
4 Adinanto, F. and French, A. and Rose, K. A. Access to eye care services by schoolchildren in a longitudinal cohort
2019 Full text not available
5 Mauricio III, M; Bundoc, J; et al.
Accessible Centers for Children for Empowerment and Sustainable Services: Service delivery models for children with disabilities within 7,100 islands of the Philippine archipelago
2019 No new AP indicator
6 DeCarlo, D. K. and Swanson, M. and McGwin, G. and Visscher, K. and Owsley, C.
ADHD and Vision Problems in the National Survey of Children's Health
2016 No new AP indicator
7 TÃndel, Gunhild Administrating disability: The case of "assistance need" registration in Norwegian health and care governance
2009 No new AP indicator
8 Al-Ghamdi, Abdulhamid S. Adults visual impairment and blindness – An overview of prevalence and causes in Saudi Arabia
2019 No new AP indicator
9 Ching, Teresa Y. C. and Oong, Ron and van Wanrooy, Emma
ages of intervention in regions with and without universal newborn hearing screening and prevalence of childhood hearing impairment in Australia
2006 Not population-based/representative
10 Carden, Susan M.
Analysis of the National Health and Nutrition Examination Survey: Prevalence of Visual Impairment in the United States, by S Vitale, MF Cotch, and RD Sperduto. JAMA 295:2158–63, 2006
2006 Full text not available
11 Loeb, Mitchell E. and Eide, Arne H. and Mont, Daniel
Approaching the measurement of disability prevalence: The case of Zambia
2008 No new AP indicator
12 Ramke, J. and Brian, G. Are readymade spectacles sufficient in developing countries? 2009 Not population-based/representative
13 Pressler, K. A. and Ferraro, K. F. Assistive device use as a dynamic acquisition process in later life
2010 No new AP indicator
14
Dimitra Panteli, Cornelia Henschke, Madelon Kroneman, Sabine Fuchs, Maximilien Hjortland, Giovanni Oliva, Ewout van Ginneken
Assistive Devices: Regulation and Coverage in five European Countries
2018 No new AP indicator
15
Nihei, M. and Sugawara, I. and Ehara, N. and Gondo, Y. and Masui, Y. and Inagaki, H. and Inoue, T. and MacLachlan, M. and McAuliffe, E.
Assistive products use among oldest-old people in Japan: Differences in personal attributes and living situation
Missing Full text not available
16 Wallace, Joseph Assistive technology funding in the United States 2011 Full text not available
17 Kitchener, Martin and Ng, Terence and Lee, Hyang Yuol and Harrington, Charlene
Assistive technology in Medicaid home- and community-based waiver programs
2008 Not population-based/representative
18 Orellano-ColÃn, Elsa M. and Rivero-MÃndez, Marta and Lizama, Mauricio and Jutai, Jeffrey W.
Assistive technology unmet needs of independent living older Hispanics with functional limitations
2018 Not population-based/representative
19 Claya, Shondra Loggins; Alston, Reginald; Assistive technology use and veterans: An examination of racial differences between Whites and Blacks using the HAAT model
2016 Full text not available
20 Khandaker, G.; Karim, T.; Muhit, M.; Smitherssheedy, H.; Jones, C.; Novak, I.; Badawi, N.;
Associated impairments among children with cerebral palsy in rural Bangladesh: Findings from the Bangladesh Cerebral Palsy Register (BCPR)
2017 No new AP indicator
21 Khoury, A. J. and Hall, A. and Andresen, E. and Zhang, J. and Ward, R. and Jarjoura, C.
association between chronic disease and physical disability among female Medicaid beneficiaries 18-64 years of age
2013 Not population-based/representative
22 Nathan G Congdon, Nita Patel, Paul Esteso, Florence Chikwembani, Fiona Webber, Robert Bongi Msithini, Amy Ratcliffe
association between refractive cutoffs for spectacle provision and visual improvement among school-aged children in South Africa
2008 Not population-based/representative
23 Gajapati, C. V. and Pradeep, A. V. and Kakhandaki, A. and Praveenchandra, R. K. and Rao, S.
Awareness of presbyopia among rural female population in North Karnataka
2017 Not population-based/representative
24 Clay, S. L. and Alston, R. benefits of assistive technology use by persons with physical conditions: An examination of difficulty levels in areas of functioning
2016 Full text not available
25 Finger, Robert P. and Bertram, Bernd and Wolfram, Christian and Holz, Frank G.
Blindness and visual impairment in Germany: a slight fall in prevalence
2012 No new AP indicator
26 Lim, M. and Jung, S. Brief Introduction of Assistive Technology Service Delivery System in Republic of Korea
2015 Full text not available
27 Mather, H. and Kelley, A. and Bollens-Lund, Can administrative claims be used to identify people with 2018 No new AP indicator
BMJ Publishing Group Limited (BMJ) disclaims all liability and responsibility arising from any relianceSupplemental material placed on this supplemental material which has been supplied by the author(s) BMJ Global Health
doi: 10.1136/bmjgh-2021-007662:e007662. 7 2022;BMJ Global Health, et al. Danemayer J

4
E. functional limitation? An exploration of candidate predictors in a sample of medicare beneficiaries
28 Shah, M. and Khan, M. and Khan, M. T. and Khan, M. Y. and Saeed, N.
Causes of visual impairment in children with low vision 2011 Not population-based/representative
29 Trani, Jean-François; Bakhshi, Parul; Challenges for assessing disability prevalence: The case of Afghanistan
2006 No new AP indicator
30 Mehrotra, R. and Srivastava, P. and Kumar, A.
Changing lives of hearing impaired patients in rural north india through concept of trained ear care workers with the vision of hearing for all by 2030
2016 Full text not available
31 Kang, M. T. and Li, S. and Congdon, N. G. and Jan, C. and Wang, N.
Characteristics of Pseudomyopia and Spectacles wearing in Chinese Children
2018 Full text not available
32 Sun, L. and Arshad, J. and Daboul, L. and Young, L. and Choi, H.
Characterizing ocular needs and distribution of corrective lenses in two Peruvian communities
2018 Full text not available
33 Dhivya Ramasamy 1 , Sanil Joseph, Vijayakumar Valaguru, Vinod P Mitta, Thulasiraj D Ravilla, Mary Frances Cotch
Cluster Randomized Trial to Compare Spectacle Delivery Systems at Outreach Eye Camps in South India
2013 No new AP indicator
34
Steven L Barnett 1 , Kelly A Matthews 2 , Erika J Sutter 2 , Lori A DeWindt 2 , Jacqueline A Pransky 2 , Amanda M O'Hearn 2 , Tamala M David 2 , Robert Q Pollard 3 , Vincent J Samar 3 , Thomas A Pearson
Collaboration With Deaf Communities to Conduct Accessible Health Surveillance
2017 No new AP indicator
35 Kasemsiri, P.; Yimtae, K.; Thanawirattananit, P.; Laoharsiriwong, S.; Siripaopradith, P.; Kingkaew, P.;
Community-Based Hearing Screening of Disabled Elders Using the Thai-FMHT: Clinical Implications and Cost-Effectiveness
2015 Full text not available
36 Seymour, N. Community-based rehabilitation workers’ role in wheelchair service provision
2019 Not population-based/representative
37 Lauer, Eric A. and Henly, Megan and Coleman, Rachel
Comparing estimates of disability prevalence using federal and international disability measures in national surveillance
2019 No new AP indicator
38 Miller, J. M. and Dobson, V. and Harvey, E. M. and Sherrill, D. L.
Comparison of preschool vision screening methods in a population with a high prevalence of astigmatism
2001 Not population-based/representative
39 Morjaria, P. and McCormick, I. and Gilbert, C.
Compliance and Predictors of Spectacle Wear in Schoolchildren and Reasons for Non-Wear: A Review of the Literature
2019 No new AP indicator
40 Evans, B. J. W.; Rowlands, G.; Correctable visual impairment in older people: A major unmet need
2004 Not population-based/representative
41 Esteso, P. and Castanon, A. and Toledo, S. and Pereyra Rito, M. A. and Ervin, A. and Wojciechowski, R. and Congdon, N. G.
Correction of moderate myopia is associated with improvement in self-reported visual functioning among Mexican school-aged children
2007 Not population-based/representative
42 Maini, R. and Keeffe, J. and Weih, L. A. and McCarty, C. A. and Taylor, H. R.
Correction of refractie error in the Victorian population: the feasibility of "off the shelf" spectacles
2001 Data collected before 2000
43 Baltussen, R.; Abraham, V. J.; Monica, Priya; Balraj, Achamma; Job, Anand; Norman, Gift; Joseph, Abraham;
Costs and health effects of screening and delivery of hearing aids in Tamil Nadu, India: an observational study
2009 Not population-based/representative
44 Li, L. and Guan, H. J. and Zhou, J. B. and Shi, H. H. and Xun, P. C. and Gu, H. Y. and Xie, Z. G. and Chen, Q. J. and Sun, J. Q.
cross-sectional survey of blindness and low vision among adults aged 60 years and above in Xinchengqiao Blocks, Nantong
2006 Full text not available
45 Al Allaf, A. M. Y.; Ali, A.; Muneer, M.; Deafness in children and the need for cochlear implants 2003 Full text not available
46
Delcourt, CÃcile and Le Goff, MÃlanie and von Hanno, Therese and Mirshahi, Alireza and Khawaja, Anthony P. and Verhoeven, Virginie J. M. and Hogg, Ruth E. and Anastosopoulos, Eleftherios and Cachulo, Maria Luz and HÃhn, Renà and Wolfram, Christian and Bron, Alain and Miotto, Stefania and Carrière, Isabelle and Colijn, Johanna M. and Buitendijk, GabriÃlle H. S. and Evans, Jennifer and Nitsch, Dorothea and Founti, Panayiota and Yip, Jennifer L. Y. and Pfeiffer, Norbert and Creuzot-Garcher, Catherine and Silva, Rufino and Piermarocchi, Stefano and Topouzis, Fotis and Bertelsen, Geir and Foster, Paul J. and Fletcher, Astrid and Klaver, Caroline C. W. and Korobelnik, Jean-Francois and Acar, Niyazi and Anastosopoulos, Eleftherios and Azuara-Blanco, Augusto and Berendschot, Tos and Bergen, Arthur and Bertelsen, Geir and Binquet, Christine and Bird, Alan and Bobak, Martin and Boon, Camiel, et al.
Decreasing Prevalence of Nonrefractive Visual Impairment in Older Europeans: A Meta-analysis of Published and Unpublished Data
2018 No new AP indicator
47 Vignier, N. and Ravaud, J. F. and Winance, M. and Lepoutre, F. X. and Ville, I.
Demographics of wheelchair users in France: Results of national community-based handicaps-incapacites-dependance surveys
2008 Data collected before 2000
BMJ Publishing Group Limited (BMJ) disclaims all liability and responsibility arising from any relianceSupplemental material placed on this supplemental material which has been supplied by the author(s) BMJ Global Health
doi: 10.1136/bmjgh-2021-007662:e007662. 7 2022;BMJ Global Health, et al. Danemayer J

5
48 Clay, Shondra Loggins and Alston, Reginald Difference in utilization of assistive technology across two racial groups in the aging population
2018 Full text not available
49 Carrasquillo, O. and Lantigua, R. A. and Shea, S.
Differences in functional status of Hispanic versus non- Hispanic White elders: Data from the medical expenditure panel survey
2000 Data collected before 2000
50 Lam, B. L.; Lee, D. J.; Zheng, D. D.; Davila, E. P.; Christ, S. L.; Arheart, K. L.;
Disparity in prevalence of self-reported visual impairment in older adults among U.S. race-ethnic subgroups
2009 No new AP indicator
51 Mann, W. C. and Goodall, S. and Justiss, M. D. and Tomita, M.
Dissatisfaction and Nontuse of Assistive Devices among Frail Elders
2002 Not population-based/representative
52 Rosen, Perth; distribution strategy for driving product diversity and demand creation
2020 No new AP indicator
53
Bunnag, C. and Prasansuk, S. and Nakorn, A. N. and Jareoncharsri, P. and Atipas, S. and Angsuwarangsee, T. and Tansuriyawong, P. and Thongyai, M. L. and Polpathapee, S. and Siriyananda, C. and Chongkolwatana, C. and Ungkanon, K. and Chongvisal, S. and Keskool, P. and Tantinikorn, W.
Ear diseases and hearing in the Thai elderly population. Part I. A comparative study of the accuracy of diagnosis and treatment by general practitioners vs ENT specialists
2002 Full text not available
54 Lipton, B. J. and Decker, S. L. effect of health insurance coverage on medical care utilization and health outcomes: Evidence from Medicaid adult vision benefits
2015 No new AP indicator
55 Anna T Do, Krishanmurthy Ilango, Dhivya Ramasamy, Suriya Kalidasan, Vijayakumar Balakrishnan, Robert T Chang 1
Effectiveness of low vision services in improving patient quality of life at Aravind Eye Hospital
2014 Not population-based/representative
56 Truong, L.; Briggs, B.; Weiner, L.; Mamdani, N.; Kosoko-Lasaki, O.;
Effectiveness of low-cost glasses distribution in the USA, Guatemala, Ghana, Cambodia, Peru and the Dominican Republic
2016 Full text not available
57 Uus, K. and Bamford, J. Effectiveness of population-based newborn hearing screening in England: ages of interventions and profile of cases
2006 No new AP indicator
58 Hanne Jensen, Gitte Tubæk Elderly people need an eye examination before entering nursing homes
2017 Not population-based/representative
59 Zhu, Z. and He, M. Elimination of avoidable blindness and visual impairment due to refractive error: Who are our priorities in providing spectacles?
2017 Full text not available
60
Hettiarachchi, Shyamani and Subramaniam, V. and Rajah, Emil and Gowritharan, Paramaguru and Nizar, Shamra and Saleem, Shakeela
Enabling Access': A Pilot Study on Access and Use of Assistive Products in the Northern Province, Sri Lanka
2019 Not population-based/representative
61 Wang, L. and Aili, A. and Liu, Q. and Chen, Y. and Yao, H.
Epidemiological and rehabilitation analyses of patients with hearing disabilities of Uyghur and Han Chinese ethnicities in Xinjiang, China: a comparative study
2018 Not population-based/representative
62 Zou, Y. H. and Ding, J. Y. and Peng, H. and Shi, J. L. and Qu, C. Y. and Liu, X. P.
epidemiological study of visual disability and visual rehabilitation in Beijing
2009 Full text not available
63
Pan, C. W. and Chiang, P. P. and Wong, T. Y. and Zheng, Y. F. and Chew, M. and Saw, S. M. and Lamoureux, E. L. and Cheng, C. Y.
Ethnic differences in undercorrected refractive error in Asians 2014 Full text not available
64 Chen, Nancy and Hsieh, His-Pao and Tsai, Rong-Kung and Sheu, Min-Muh
Eye care services for the populations of remote districts in eastern Taiwan: a practical framework using a Mobile Vision Van Unit
2015 Not population-based/representative
65
Vela, Claudia and Samson, Elodie and Zunzunegui, Maria Victoria and Haddad, Slim and Aubin, Marie-Josee and Freeman, Ellen E.
Eye care utilization by older adults in low, middle, and high income countries
2012 No new AP indicator
66 Khalaj, Mohammad and Barikani, Ameneh and Ghasemi, Hafez
Eye disorders in old people 2012 No new AP indicator
67 Rebecca Russ; Michael Rothschild; Jinan Saaddine; Lindsay Collin; Danny Haddad
Eye health and access to eye care among migrant farmworkers in Georgia
2015 Full text not available
68 EYElliance Eyeglasses for Global Development: Bridging the Visual Divide
2016 No new AP indicator
69
Zhou, Z. and Ma, X. and Yi, H. and Pang, X. and Shi, Y. and Meltzer, M. and He, M. and Rozelle, S. and Morgan, I. G. and Congdon, N. G.
Factors underlying large differences in myopia prevalence among primary school children in adjoining provinces of western China
2014 Full text not available
70 Donaldson, L.A; Karas, M; O'Brien, D; Woodhouse, J.M.
Findings from an opt-in eye examination service in English special schools. Is vision screening effective for this population?
2019 Not population-based/representative
71 Bisgaard, N.; Ruf, S.; Findings From EuroTrak Surveys From 2009 to 2015: Hearing Loss Prevalence, Hearing Aid Adoption, and Benefits of Hearing Aid Use
2017 Full text not available
72
Da Silva Takitani, G. E. and Fernandes, A. and Alves, M. and De Almeida, R. C. and Nascimento, R. A. and Valdrighi, N. Y. and Takashi, C.
Frequency and causes of visual impairment in the xingu indigenous park: Preliminary findings from projeto olhos do xingu
2018 Full text not available
BMJ Publishing Group Limited (BMJ) disclaims all liability and responsibility arising from any relianceSupplemental material placed on this supplemental material which has been supplied by the author(s) BMJ Global Health
doi: 10.1136/bmjgh-2021-007662:e007662. 7 2022;BMJ Global Health, et al. Danemayer J

6
73 Zeb, A. and Hamid, A. and Uppal, F. and Awan, A.
Frequency of refractive error in children of district Abbottabad 2011 Full text not available
74 Ferreira, A. S. and Barbosa, E. M. S. and Raposo, N. R. B. and Gattaz, W. F.
Functional impairment prevalence in Brazilian frailty elderly 2011 Full text not available
75
Vázquez Sánchez, M. Covadonga; Gigirey Prieto, Luz M.; Del-Oro-Saez, Carlos P.; Pifieiro-Ces, Antonio; Gandoy Crego, Manuel;
Functional Vision Screening of Older Adults in Nursing Homes: A Study from Galicia (Northwest Spain)
2018 No new AP indicator
76 Patel, I.; West, S.; Gender differences in presbyopia 2009 No new AP indicator
77 Kirtland, K. A. and Saaddine, J. B. and Geiss, L. S. and Thompson, T. J. and Cotch, M. F. and Lee, P. P.
Geographic disparity of severe vision loss - United States, 2009-2013
2015 No new AP indicator
78 Papas, E. B.; Tahhan, N.; Fricke, T. R.; Wilson, D. A.; Jong, M.; Naidoo, K. S.; Resnikoff, S.; Holden, B. A.;
Global cost-effectiveness of correcting near vision impairment due to uncorrected presbyopia
2015 Full text not available
79
Holden, B. A. and Fricke, T. R. and Ho, S. M. and Wong, R. and Schlenther, G. and Cronje, S. and Burnett, A. and Papas, E. and Naidoo, K. S. and Frick, K. D.
Global vision impairment due to uncorrected presbyopia 2008 No new AP indicator
80
Vos, Theo and Barber, Ryan M. and Bell, Brad and Bertozzi-Villa, Amelia and Biryukov, Stan and Bolliger, Ian and Charlson, Fiona and Davis, Adrian and Degenhardt, Louisa and Dicker, Daniel and Duan, Leilei and Erskine, Holly and Feigin, Valery L. and Ferrari, Alize J. and Fitzmaurice, Christina and Fleming, Thomas and Graetz, Nicholas and Guinovart, Caterina and Haagsma, Juanita and Hansen, Gillian M. and Hanson, Sarah Wulf and Heuton, Kyle R. and Higashi, Hideki and Kassebaum, Nicholas and Kyu, Hmwe and Laurie, Evan and Liang, Xiofeng and Lofgren, Katherine and Lozano, Rafael, et al.
Global, regional, and national incidence, prevalence, and years lived with disability for 301 acute and chronic diseases and injuries in 188 countries, 1990–2013: a systematic analysis for the Global Burden of Disease Study 2013
2015 No new AP indicator
81
Vos, Theo; Allen, Christine; Arora, Megha; Barber, Ryan M.; Bhutta, Zulfiqar A.; Brown, Alexandria; Carter, Austin; Casey, Daniel C.; Charlson, Fiona J.; Chen, Alan Z.; Coggeshall, Megan; Cornaby, Leslie; Dandona, Lalit; Dicker, Daniel J.; Dilegge, Tina; Erskine, Holly E.; Ferrari, Alize J.; Fitzmaurice, Christina; Fleming, Tom; Forouzanfar, Mohammad H.; Fullman, Nancy; Gething, Peter W.; Goldberg, Ellen M.; Graetz, Nicholas; Haagsma, Juanita A.; Hay, Simon I.; Johnson, Catherine O.; Kassebaum, Nicholas J.; Kawashima, Toana; Kemmer, Laura; Khalil, Ibrahim A.; Kinfu, Yohannes; Kyu, Hmwe H.; Leung, Janni; Liang, Xiaofeng; Lim, Stephen S.; Lopez, Alan D.; Lozano, Rafael; Marczak, Laurie; Mensah, George A.; Mokdad, Ali H.; Naghavi, Mohsen; Nguyen, Grant; Nsoesie, Elaine; Olsen, Helen; et al.
Global, regional, and national incidence, prevalence, and years lived with disability for 310 diseases and injuries, 1990–2015: a systematic analysis for the Global Burden of Disease Study 2015
2015 No new AP indicator
82
Vos, Theo and Abajobir, Amanuel Alemu and Abate, Kalkidan Hassen and Abbafati, Cristiana and Abbas, Kaja M. and Abd-Allah, Foad and Abdulkader, Rizwan Suliankatchi and Abdulle, Abdishakur M. and Abebo, Teshome Abuka and Abera, Semaw Ferede and Aboyans, Victor and Abu-Raddad, Laith J. and Ackerman, Ilana N. and Adamu, Abdu Abdullahi and Adetokunboh, Olatunji and Afarideh, Mohsen and Afshin, Ashkan and Agarwal, Sanjay Kumar and Aggarwal, Rakesh and Agrawal, Anurag and Agrawal, Sutapa and Ahmadieh, Hamid and Ahmed, Muktar Beshir and Aichour, Miloud Taki Eddine and Aichour, Amani Nidhal and Aichour, Ibtihel and Aiyar, Sneha and Akinyemi, Rufus Olusola and Akseer, Nadia and Al Lami, Faris Hasan and Alahdab, Fares and Al-Aly, Ziyad and Alam, Khurshid and Alam, Noore
Global, regional, and national incidence, prevalence, and years lived with disability for 328 diseases and injuries for 195 countries, 1990-2016: a systematic analysis for the Global Burden of Disease Study 2016
2017 No new AP indicator
BMJ Publishing Group Limited (BMJ) disclaims all liability and responsibility arising from any relianceSupplemental material placed on this supplemental material which has been supplied by the author(s) BMJ Global Health
doi: 10.1136/bmjgh-2021-007662:e007662. 7 2022;BMJ Global Health, et al. Danemayer J

7
and Alam, Tahiya and Alasfoor, Deena and Alene, Kefyalew Addis and Ali, Raghib and Alizadeh-Navaei, Reza and Alkerwi, Ala'a, et al.
83 Sujatha, S; Bapat, G.M; Dash, S.S. GRID: a model for the development of assistive devices in developing countries
2019 Not population-based/representative
84
Palacios-CeÃa, Domingo and JimÃnez-GarcÃa, Rodrigo and Hernández-Barrera, ValentÃn and Alonso-Blanco, Cristina and Carrasco-Garrido, Pilar and Fernández-de-las-PeÃas, CÃsar
Has the Prevalence of Disability Increased Over the Past Decade (2000–2007) in Elderly People? A Spanish Population-based Survey
2012 No new AP indicator
85 Smith, J. L.; Mitchell, P.; Wang, J. J.; Leeder, S. R.;
health policy for hearing impairment in older Australians: What should it include?
2005 Not population-based/representative
86 Baek, Min Kwan and Kim, Young Saing and Kim, Eun Young and Kim, Ae Jin and Choi, Won-Jun
Health-Related Quality of Life in Korean Adults with Hearing Impairment: The Korea National Health and Nutrition Examination Survey 2010 to 2012
2016 No new AP indicator
87 Rosenhall, U. and Espmark, A. K. Hearing aid rehabilitation: what do older people want, and what does the audiogram tell?
2003 Data collected before 2000
88 Cohen-Mansfield, J. and Taylor, J. W. Hearing aid use in nursing homes, Part 1: Prevalence rates of hearing impairment and hearing aid use
2004 Not population-based/representative
89 Flynn, M. C. and Kennedy, E. J. and Johns, J. and Stanbridge, R.
Hearing and vision loss within residential care facilities -- the need for improved service delivery
2002 No new AP indicator
90 McPherson, B. Hearing assistive technologies in developing countries: background, achievements and challenges
2014 No new AP indicator
91
Maki-Torkko, E. M. and Brorsson, B. and Davis, A. and Mair, I. W. S. and Myhre, K. I. and Parving, A. and Roine, R. P. and Rosenhall, U. and Sorri, M. J. and Stilven, S.
Hearing impairment among adults - Extent of the problem and scientific evidence on the outcome of hearing aid rehabilitation
2001 Not population-based/representative
92 Christensen, V. T. and Datta Gupta, N. Hearing loss and disability exit: Measurement issues and coping strategies
2017 No new AP indicator
93 Schneider, J. and Gopinath, B. and Karpa, M. J. and McMahon, C. M. and Rochtchina, E. and Leeder, S. R. and Mitchell, P.
Hearing loss impacts on the use of community and informal supports
2010 No new AP indicator
94
Marmamula, S. and Barrenkala, N. R. and Challa, R. and Reddy, K. T. and Yellapragada, S. and Brahmanandam, M. S. and Friedman, D. S. and Khanna, R. C.
Hyderabad Ocular Morbidity in Elderly Study (HOMES)-Rationale, Study Design and Methodology
2020 No new AP indicator
95 Layland, B. and Holden, B. and Evans, K. and Bailey, S.
ICEE/AHMRC NSW Aboriginal Eye and Visioncare Program, Australia
2004 Not population-based/representative
96 Bapat, G.M; Sujatha, S. Identification and analysis of knee–ankle–foot orthosis design requirements based on a feedback survey of orthosis users in India
2017 No new AP indicator
97 Patel, I. and Munoz, B. and Burke, A. G. and Kayongoya, A. and McHiwa, W. and Schwarzwalder, A. W. and West, S. K.
Impact of Presbyopia on Quality of Life in a Rural African Setting
2006 No new AP indicator
98 Pryor, W; Smith, F Impacts of the Nippon Foundation's Investments in Prosthetics & Orthotics
2019 Not population-based/representative
99 Jaul, E. importance of increasing awareness of hearing and vision in the elderly population
2006 Full text not available
100 Janna Lam, Kirstin Robertson, Wesley Robertson, Rebecca Bernstein
Improving Access to Vision Care for People Who are Homeless through Eyeglasses Recycling
2015 Not population-based/representative
101
Portuondo-Sao, Miriam and Cobas-Ruiz, Marcia and Zacca-Peña, Eduardo and Lantigua-Cruz, Araceli and López-GarcÃa, Josefina and Boligán-Jomarrón, Yosnel and Leyva-Serrano, Martiza and Herrera-Armenteros, Anorys and Morales-Suárez, Ileana R.
Improving Disability Care in Countries of the Bolivarian Alliance for the Peoples of Our America
2016 No new AP indicator
102
Binagwaho, A. and Scott, K. and Rosewall, T. and Mackenzie, G. and Rehnborg, G. and Hannema, S. and Presente, M. and Noe, P. and Mathenge, W. and Nkurikiye, J. and Habiyaremye, F. and Dushime, T.
Improving eye care in Rwanda 2015 No new AP indicator
103 Zhaisakova, D. and Kudaibergenova, S. and Mukanova, Z. and Djarkinbekova, G. and Kaltayeva, M. and Kuzembayev, Y.
incidence and prevalence of hearing disorders in children according to the audiological screening
2017 Full text not available
104 Mahmudi, E. and Mema, V. and Burda, N. and Selimi, B. and Zhugli, S.
Incidence of the refractive errors in children 3 to 9 years of age, in the city of Tetovo, Macedonia
2013 No new AP indicator
105 Keunen, J. E. E. and Verezen, C. A. and Imhof, S. M. and Rens, G. H. M. B. van and Asselbergs, M. B. and Limburg, J. J.
Increase in the demand for eye-care services in the Netherlands 2010-2020
2011 Full text not available
106 Mohanty, S. and Jolley, E. and Mohanty, R. N. and Buttan, S. and Schmidt, E.
Integrating geospatial data and measures of disability andwealth to assess inequalities in an eye health survey: An example from the Indian sunderbans
2019 No new AP indicator
BMJ Publishing Group Limited (BMJ) disclaims all liability and responsibility arising from any relianceSupplemental material placed on this supplemental material which has been supplied by the author(s) BMJ Global Health
doi: 10.1136/bmjgh-2021-007662:e007662. 7 2022;BMJ Global Health, et al. Danemayer J
8
107 Visagie, S. J. and Matter, R. and Kayange, G. M. and Chiwaula, M. and Harniss, M. and Mji, G. and Scheffler, E.
Lessons from the pilot of a mobile application to map assistive technology suppliers in Africa
2018 No new AP indicator
108 Nwosu, S. N. Low vision in persons aged 50 and above in the onchocercal endemic communities of Anambra State, Nigeria
2000 Full text not available
109
Bourne, Rupert R. A. and Flaxman, Seth R. and Braithwaite, Tasanee and Cicinelli, Maria V. and Das, Aditi and Jonas, Jost B. and Keeffe, Jill and Kempen, John H. and Leasher, Janet and Limburg, Hans and Naidoo, Kovin and Pesudovs, Konrad and Resnikoff, Serge and Silvester, Alex and Stevens, Gretchen A. and Tahhan, Nina and Wong, Tien Y. and Taylor, Hugh R. and Bourne, Rupert and Ackland, Peter and Arditi, Aries and Barkana, Yaniv and Bozkurt, Banu and Braithwaite, Tasanee and Bron, Alain and Budenz, Donald and Cai, Feng and Casson, Robert and Chakravarthy, Usha and Choi, Jaewan and Cicinelli, Maria Vittoria and Congdon, Nathan, et al.
Magnitude, temporal trends, and projections of the global prevalence of blindness and distance and near vision impairment: a systematic review and meta-analysis
2017 No new AP indicator
110 PEEK Making Eye Health Visible: Community eye health in Pakistan
2020 No new AP indicator
111 Cornman, J. C. and Freedman, V. A. and Agree, E. M.
Measurement of assistive device use: Implications for estimates of device use and disability in late life
2005 No new AP indicator
112 Smith, E. M; Battistella, L. R; et al. Measuring met and unmet assistive technology needs at the national level: Comparing national database collection tools across eight case countries
2019 No new AP indicator
113 Mhatre, A; Rosen, P; et al. A model to standardize the procurement and quality of assistive technologies in less-resourced settings
2019 No new AP indicator
114 de Witte, L; Carter, L; et al. Models of assistive technology service delivery in low resource settings: A literature review of different approaches and their quality and impact
2019 No new AP indicator
115 Castagno, V. D. and Fassa, A. G. and Vilela, M. A. P. and Meucci, R. D. and Resende, D. P. M.
Moderate hyperopia prevalence and associated factors among elementary school students
2015 No new AP indicator
116 Kaaren Mathias 1 , Hira Pant 2 , Manjula Marella 3 , Lawrence Singh 4 , Gvs Murthy 2 , Nathan Grills 3
Multiple barriers to participation for people with psychosocial disability in Dehradun district, North India: a cross-sectional study.
2018 No new AP indicator
117 Matheson, J. I. D. M. and Atijosan, O. and Kuper, H. and Rischewski, D. and Simms, V. and Lavy, C.
Musculoskeletal impairment of traumatic etiology in Rwanda: prevalence, causes, and service implications
2011 No new AP indicator
118 Adhikari, S. Myopia in school children from high mountain region of Nepal
2013 Not population-based/representative
119 Cheng, C. Y. and Huang, W. and Su, K. C. and Peng, M. L. and Sun, H. Y. and Cheng, H. M.
Myopization factors affecting urban elementary school students in Taiwan
2013 No new AP indicator
120 Mathenge, Wanjiku and Bastawrous, Andrew and Foster, Allen and Kuper, Hannah
Nakuru Posterior Segment Eye Disease Study: Methods and Prevalence of Blindness and Visual Impairment in Nakuru, Kenya
2012 No new AP indicator
121
Menon, G. R. and Singh, L. and Sharma, P. and Yadav, P. and Sharma, S. and Kalaskar, S. and Singh, H. and Adinarayanan, S. and Joshua, V. and Kulothungan, V. and Yadav, J. and Watson, L. K. and Fadel, S. A. and Suraweera, W. and Rao, M. V. V. and Dhaliwal, R. S. and Begum, R. and Sati, P. and Jamison, D. T. and Jha, P.
National Burden Estimates of healthy life lost in India, 2017: an analysis using direct mortality data and indirect disability data
2019 No new AP indicator
122 Anjou, M. D. and Boudville, A. I. and Taylor, H. R.
Nationally consistent spectacle supply for Indigenous Australians
2013 No new AP indicator
123 Fuller, Spencer D. and Mudie, Lucy I. and Siordia, Carlos and Swenor, Bonnielin K. and Friedman, David S.
Nationwide Prevalence of Self-Reported Serious Sensory Impairments and Their Associations with Self-Reported Cognitive and Functional Difficulties
2018 No new AP indicator
124 Wubben, T. and Wolfe, G. and Guerrero, C. and Korcz, W. J. and Ramsey, D. J.
Near visual acuity in an inner city Hispanic community: understanding the barriers and benefits of correction
2014 Not population-based/representative
125 Eide, A. H; Mji, G; Chiwaula, M. Need for, access to and quality of assistive technology in low- and middle-income countries
2019 No new AP indicator
126 Mranga, H. need of category I prosthetist and orthotist in Africa 2015 Full text not available
127 Antoni, M. and Rouillon, I. and Denoyelle, F. and Garabedian, E. N. and Loundon, N.
Newborn hearing screening: Prevalence and medical and paramedical treatment of bilateral hearing loss in a neonatal series in the Ile-de-France region of France
2016 No new AP indicator
128 Lupsakko, T. A. and Kautiainen, H. J. and Sulkava, R.
non-use of hearing aids in people aged 75 years and over in the city of Kuopio in Finland
2005 Data collected before 2000
BMJ Publishing Group Limited (BMJ) disclaims all liability and responsibility arising from any relianceSupplemental material placed on this supplemental material which has been supplied by the author(s) BMJ Global Health
doi: 10.1136/bmjgh-2021-007662:e007662. 7 2022;BMJ Global Health, et al. Danemayer J

9
129
Ferreira, B. G. and Toenjes, R. H. F. and De Sousa, P. I. G. and De Paula Souza, V. L. and Torres, G. T. and Vieira, M. I. S. and Jammal, A. A. and Rim, P. H. H. and Alves, M.
Ophthalmological Care and Eyeglasses Distribution in Brazil's Countryside: Descriptive and Epidemiological Data of Nearly Five Thousand Patients
2019 Full text not available
130 Amirozi, Ahmad and Irfan, Mohamad and Suzana, Mansor and Mohd Khairi, Daud and Dinsuhaimi, Sidek
Outcome of a newborn hearing screening program in a tertiary hospital in Malaysia: the first five years
2011 Not population-based/representative
131 Ndife, T.I; Abdullahi, S.M; Olaniyi, S. Outcome of vision screening of eye health workers at a tertiary eye hospital in north-western Nigeria
2017 Full text not available
132 Bourne, R. R. A. and Dineen, B. P. and Ali, S. M. and Huq, D. M. N. and Johnson, G. J.
Outcomes of cataract surgery in Bangladesh: results from a population based nationwide survey
2003 No new AP indicator
133 Baloyi, V. H. A.; Akinsola, H. A.; Mabunda, J. T.;
Pattern of distribution of refractive error among primary school children in Malamulele community of Limpopo province, South Africa
2018 Full text not available
134 Shaikh, S. P. and Aziz, T. M. Pattern of eye diseases in children of 5-15 years at Bazzertaline area (South Karachi) Pakistan
2005 Full text not available
135 Robaei, D. and Rose, K. and Kifley, A. and Mitchell, P.
Patterns of spectacle use in young Australian school children: Findings from a population-based study
2005 No new AP indicator
136
Ning-Chia Chang 1 2 3 , Chia-Yen Dai 4 5 , Wen-Yi Lin 3 , Chen-Yu Chien 1 2 , Meng-Hsuen Hsieh 4 5 , Kuen-Yao Ho 1 6
Perception of hearing impairment and the willingness to use hearing aids in an elderly population in southern Taiwan: A community-based study
2016 Not population-based/representative
137 Kayange, Geroge; Perspectives on a mobile application that maps assistive technology resources in Africa
2019 No new AP indicator
138 Benedict, R. E.; Baumgardner, A. M.; population approach to understanding children's access to assistive technology
2009 Not population-based/representative
139
Ramesh, Sathyamangalam Ve; George, Ronnie; Soni, Premal M.; Palaniappan, Lakshmanan; Raju, Prema; Paul, Pradeep G.; Ramsathish, Sivarathinasami; Vijaya, Lingam;
Population norms for frequency doubling perimetry with uncorrected refractive error
2007 No new AP indicator
140 Congdon, N. G.; Yi, H.; Zhang, H.; Ma, X.; Zhang, L.; Wang, X.; Naidoo, K. S.; Minto, H.; Zou, H.; Rozelle, S.;
Population prevalence of vision impairment and spectacle wear among urban migrant children in China
2015 Full text not available
141 Davis, A.; Population study of the ability to benefit from amplification and the provision of a hearing aid in 55-74-year-old first-time hearing aid users
2003 Data collected before 2000
142 Nirmalan, P. K.; Sannapaneni, Krishnaiah; Shamanna, B. R.; Rao, G. N.; Ravi, Thomas;
population-based assessment of presbyopia in the state of Andhra Pradesh, South India: the Andhra Pradesh eye disease study
2006 Data collected before 2000
143 Marmamula, S. and Khanna, R. C. Population-based assessment of prevalence and causes of visual impairment in the state of Tripura, India
2017 Full text not available
144 Dandona, R. and Dandona, L. and Kovai, V. and Giridhar, P. and Prasad, M. N. and Srinivas, M.
Population-based study of spectacles use in southern India 2002 Data collected before 2000
145
Gilbert, Clare E. and Shah, S. P. and Jadoon, M. Z. and Bourne, R. and Dineen, B. and Khan, M. A. and Johnson, G. J. and Khan, M. D. and Pakistan National Eye Survey Study, Group
Poverty and blindness in Pakistan: results from the Pakistan national blindness and visual impairment survey
2008 No new AP indicator
146
Cunha, C. C.; Munoz, S.; Furtado, J. M.; Cavascan, N. N.; Berezovsky, A.; Campos, M.; Cohen, M. J.; Cohen, J. M.; Rubens, B.; Salomao, S. R.;
Presbyopia and near vision impairment in older adults from parintins: The Brazilian amazon region eye survey (bares)
2016 Full text not available
147 Patel, I.; West, S. K.; Presbyopia: prevalence, impact, and interventions 2007 No new AP indicator
148 Maralcan, G.; Kuru, I.; Aydin, U. Y.; Altinel, L.; Bozan, M. E.; Ellidokuz, H.;
prevalance of orthopedic disabilities in the district of Cay, Afyon, Turkey
2004 No new AP indicator
149 Rajiv Khandekar 1 , Ali Jaffer Mohammed, Abdulatif Al Raisi
Prevalence and causes of blindness & low vision; before and five years after 'VISION 2020' initiatives in Oman: A review
2007 No new AP indicator
150 Ahmad, K.; Khan, M. D.; Qureshi, M. B.; Munami, S.; Shah, R. A.; Rasheed, H.; Jamali, B.; Baluch, A.; Khan, M. A.;
Prevalence and causes of blindness and low vision in a rural setting in Pakistan
2005 Data collected before 2000
151
Nakul Singh, 1 Shiva Shankar Eeda, 2 , 3 Bala Krishna Gudapati, 2 , 3 Srinivasa Reddy, 2 , 3 Pushkar Kanade, 4 Ghanshyam Palamaner Subash Shantha, 5 , 6 Padmaja Kumari Rani, 7 , 8 Subhabrata Chakrabarti, 7 and Rohit C Khanna
Prevalence and causes of blindness and visual impairment and their associated risk factors, in three tribal areas of Andhra Pradesh, India
2014 No new AP indicator
152 Taryam, M. O.; Rabiu, M. M.; Muhammad, N.; Oladigbolu, K.; Abdurrahman, H.;
Prevalence and causes of blindness and visual impairment; And cataract surgical services in Katsina state of Nigeria
2019 No new AP indicator
153 Adeoti, C. O. Prevalence and causes of blindness in a tropical African population
2004 Data collected before 2000
BMJ Publishing Group Limited (BMJ) disclaims all liability and responsibility arising from any relianceSupplemental material placed on this supplemental material which has been supplied by the author(s) BMJ Global Health
doi: 10.1136/bmjgh-2021-007662:e007662. 7 2022;BMJ Global Health, et al. Danemayer J

10
154
Furtado, J. M. and Cavascan, N. N. and Munoz, S. and Berezovsky, A. and Cohen, M. J. and Vasconcelos, G. C. and Cohen, J. M. and Watanabe, S. E. S. and Belfort, R. and Salomao, S. R.
Prevalence and causes of distance vision impairment and blindness in older adults in urban and rural areas of parintins: The Brazilian amazon region eye survey
2016 Full text not available
155 Ajaiyeoba, A. I. and Isawumi, M. A. and Adeoye, A. O. and Oluleye, T. S.
Prevalence and causes of eye diseases amongst students in south-western Nigeria
2006 No new AP indicator
156 Thapa, R.; Bajimaya, S.; Paudyal, G.; Khanal, S.; Tan, S.; Thapa, S. S.; van Rens, G. H. M. B.;
Prevalence and causes of low vision and blindness in an elderly population in Nepal: the Bhaktapur retina study
2018 No new AP indicator
157 Buch, Helena and Vinding, Troels and Nielsen, Niels Vesti
Prevalence and causes of visual impairment according to World Health Organization and United States criteria in an aged, urban Scandinavian population: The Copenhagen City Eye Study1 1The authors have no financial or commercial interests in the subject matter or materials mentioned herein
2001 Data collected before 2000
158 Dhanesha, U. and Polack, S. and Bastawrous, A. and Banks, L. M.
Prevalence and causes of visual impairment among schoolchildren in Mekelle, Ethiopia
2018 Not population-based/representative
159 Buch, Helena and Vinding, Troels and la Cour, Morten and Appleyard, Merete and Jensen, Gorm B. and Vesti Nielsen, Niels
Prevalence and causes of visual impairment and blindness among 9980 Scandinavian adults: The Copenhagen City Eye Study
2004 Data collected before 2000
160 Tang, Y. and Wang, X. and Wang, J. and Huang, W. and Gao, Y. and Luo, Y. and Lu, Y.
Prevalence and Causes of Visual Impairment in a Chinese Adult Population: The Taizhou Eye Study
2015 No new AP indicator
161 Hsu, Wen-Ming and Cheng, Ching-Yu and Liu, Jorn-Hon and Tsai, Su-Ying and Chou, Pesus
Prevalence and causes of visual impairment in an elderly Chinese population in Taiwan11The authors have no proprietary interest in any aspect of the study.: The Shihpai Eye Study
2004 Data collected before 2000
162
Tarczy-Hornoch, Kristina and Cotter, Susan A. and Borchert, Mark and McKean-Cowdin, Roberta and Lin, Jesse and Wen, Ge and Kim, Jeniffer and Varma, Rohit
Prevalence and Causes of Visual Impairment in Asian and Non-Hispanic White Preschool Children: Multi-Ethnic Pediatric Eye Disease Study
2013 No new AP indicator
163
Edussuriya, Kapila and Sennanayake, Saman and Senaratne, Tissa and Marshall, Drew and Sullivan, Thomas and Selva, Dinesh and Casson, Robert J.
Prevalence and Causes of Visual Impairment in Central Sri Lanka: The Kandy Eye Study
2009 No new AP indicator
164
Hyman, Leslie and Wu, Suh-Yuh and Connell, Anthea M. S. and Schachat, Andrew and Nemesure, Barbara and Hennis, Anselm and Leske, M. Cristina
Prevalence and causes of visual impairment in the Barbados eye study
2001 Data collected before 2000
165 Theis, Kristina, and Roblin, Douglas, and Helmick, Charles, and Luo, Ruiyan
Prevalence and causes of work disability among working-age U.S. adults, 2011–2013, NHIS
2013 No new AP indicator
166 Inam, S. and Asghar, F. and Naeem, T. and Unum, A. and Ahsan, U. and Latif, A.
Prevalence and comparison of undetected refractive errors among children of age b/w 5-10 years in public & private sector schools
2018 No new AP indicator
167 Manjula Marella 1 , Nafisa L Huq 2 , Alexandra Devine 3 , Sally M Baker 4 , Md A Quaiyum 5 , Jill E Keeffe 6
Prevalence and correlates of disability in Bogra district of Bangladesh using the rapid assessment of disability survey.
2015 No new AP indicator
168 Lasisi, A. O. and Abiona, T. and Gureje, O. prevalence and correlates of self-reported hearing impairment in the Ibadan Study of Ageing
2010 No new AP indicator
169 Erin D Bouldin 1 , Andrew Vandenberg 2 , Manan Roy 2 , Adam Hege 3 , Jennifer J Zwetsloot 3 , Jennifer S Howard 3
Prevalence and domains of disability within and outside Appalachian North Carolina: 2013–2016 Behavioral Risk Factor Surveillance System
2019 No new AP indicator
170 Ling-Lin, L. and Zheng-Zheng, W. and Dong-Feng, L. and Yin, Y.
Prevalence and influencing factors of myopia between adolescents in Chengdu and Mianyang Area
2019 Full text not available
171 Wang, W. L. and Chen, N. and Sheu, M. M. and Wang, J. H. and Hsu, W. L. and Hu, Y. J.
prevalence and risk factors of visual impairment among the elderly in Eastern Taiwan
2016 Not population-based/representative
172 Varma, Rohit and Ying-Lai, Mei and Klein, Ronald and Azen, Stanley P.
Prevalence and risk indicators of visual impairment and blindness in Latinos: the Los Angeles Latino Eye Study
2004 No new AP indicator
173 Wittich, W. and Hamalainen, A. and Pichora-Fuller, M. K. and Phillips, N. and Kolisang, L. and Guthrie, D. and Mick, P.
Prevalence and severity of dual sensory loss (vision & hearing) in the Canadian Longitudinal Study on Aging
2018 Full text not available
174
Rajavi, Z. and Sabbaghi, H. and Baghini, A. S. and Yaseri, M. and Moein, H. and Akbarian, S. and Behradfar, N. and Hosseini, S. and Rabei, H. M. and Sheibani, K.
Prevalence of amblyopia and refractive errors among primary school children
2015 No new AP indicator
175 Zhu, X. and Zhu, J. and Zou, H. and Lu, L. and Zhao, H. and Li, Q. and He, X.
Prevalence of ametropia and visual impairment in elementary school students in Baoshan District of Shanghai
2014 Full text not available
176 Rabiu, M. M. and Al-Bdour, M. D. and Ameerh, M. A. A. and Jadoon, M. Z.
Prevalence of blindness and diabetic retinopathy in northern Jordan
2015 No new AP indicator
177 Osuchukwu, N. C. Prevalence of common visual problems among primary school children in Calabar Municipality, Nigeria
2003 Data collected before 2000
178 Ramachandra, Srikrishna Sulgodu and Allagh, Komal Preet and Kumar, Hemanth
Prevalence of disability among adults using Rapid Assessment of Disability tool in a rural district of South India
2016 No new AP indicator
BMJ Publishing Group Limited (BMJ) disclaims all liability and responsibility arising from any relianceSupplemental material placed on this supplemental material which has been supplied by the author(s) BMJ Global Health
doi: 10.1136/bmjgh-2021-007662:e007662. 7 2022;BMJ Global Health, et al. Danemayer J

11
and Grills, Nathan and Marella, Manjula and Pant, Hira and Mahesh, D. and Soji, Fairlene and Mani, Srinivasan and Murthy, G. V. S.
179 Graciani, Auxiliadora and Banegas, José R. and López-Garcı̕ a, Esther and Rodrı̕ guez-Artalejo, Fernando
Prevalence of disability and associated social and health-related factors among the elderly in Spain: a population-based study
2004 No new AP indicator
180 Zhao, Guixiang and Okoro, Catherine A. and Hsia, Jason and Garvin, William S. and Town, Machell
Prevalence of Disability and Disability Types by Urban–Rural County Classification—U.S., 2016
2019 No new AP indicator
181 Venkatorao, T. and Ezhil, R. and Jabbar, S. and Ramakrishnan, R.
Prevalence of disability and handicaps in geriatric population in rural south India
2005 Data collected before 2000
182 Velayutham, Banurekha and Kangusamy, Boopathi and Joshua, Vasna and Mehendale, Sanjay
prevalence of disability in elderly in India – Analysis of 2011 census data
2016 No new AP indicator
183 Gupta, K. and Singh, K. and Aggarwal, A. and Gupta, A. and Bansal, P.
Prevalence of eye abnormalities in school going children in Amritsar - a study conducted by a tertiary eye care centre in an urban school
2015 Not population-based/representative
184 Collins, M. and Mudie, L. I. and Slavin, R. and Corcoran, R. and Owoeye, J. and Chang, D. S. T. and Repka, M. and Friedman, D. S.
Prevalence of eye disease and reading difficulty in an inner city elementary school population-preliminary results from the baltimore reading and eye disease study (BREDS)
2016 Full text not available
185 Ervin, R. B. Prevalence of functional limitations among adults 60 years of age and over: United States, 1999-2002
2006 No new AP indicator
186 Ostchega, Y. and Harris, T. B. and Hirsch, R. and Parsons, V. L. and Kington, R.
prevalence of functional limitations and disability in older persons in the US: Data from The National Health and Nutrition Examination Survey III
2000 Data collected before 2000
187
Iselin Ertzgaard, Solvang and Kristin, Naalsund and Sofie, Tønder and Giske Sindberg, Hansen and Tobias Bang, Hagan and Cosmas, Mnyanyi and Tron Vedul, Tronstad and Aslam, Nkya and Jon, Øygarden
Prevalence of hearing impairment among primary school children in the Kilimanjaro region within Tanzania
2020 No new AP indicator
188 Johansson, M. S. K. and Arlinger, S. D. Prevalence of hearing impairment in a population in Sweden 2003 Data collected before 2000
189 Schmucker, C. and Kapp, P. and Motschall, E. and Loehler, J. and Meerpohl, J. J.
Prevalence of hearing loss and use of hearing aids among children and adolescents in Germany: a systematic review
2019 No new AP indicator
190 Harvey, E. M. and Dobson, V. and Miller, J. M.
Prevalence of high astigmatism, eyeglass wear, and poor visual acuity among Native American grade school children
2006 Data collected before 2000
191 Villarreal, G. M. and Ohlsson, J. and Cavazos, H. and Abrahamsson, M. and Mohamed, J. H.
Prevalence of myopia among 12- to 13-year-old schoolchildren in Northern Mexico
2003 Data collected before 2000
192
Salomao, S. R. and Munoz, S. and Furtado, J. M. and Sacai, P. Y. and Cohen, M. J. and Cohen, J. M. and Higashi Mitsuhiro, M. R. K. and Arruda, S. B. and Belfort, R. and Berezovsky, A.
Prevalence of near vision impairment in middle-aged and older adults in an urban census sector of parintins, brazilian amazon region
2014 Full text not available
193 Dey, A. K. and Nath, A. B. Prevalence of ocular morbidities among school children in a rural block of Cachar, Assam
2017 Not population-based/representative
194 Muhammad, R. C. and Jamda, M. A. and Langnap, L.
Prevalence of presbyopia in rural Abuja, Nigeria 2015 No new AP indicator
195 Ferdausi, N.
Prevalence of presbyopia, presbyopia correction coverage and barriers to uptake eye-care services for near-vision impairments among indigenous population in northern part of bangladesh
2017 Full text not available
196 Ismond, J. M. and Timmermans, M. A. and Ubels, J. L. and Hoogewerf, A. J.
Prevalence of refractive error and need for corrective lenses in a medically underserved population in Tijuana, Mexico
2017 Not population-based/representative
197 Al-Rowaily, M. A. Prevalence of refractive errors among pre-school children at King Abdulaziz Medical City, Riyadh, Saudi Arabia
2010 No new AP indicator
198 Zoia, Atta and Arif, A. S. and Iftikhar, Ahmed and Umer, Farooq
Prevalence of refractive errors in Madrassa students of Haripur district
2015 No new AP indicator
199
Mayro, E. L. and Hark, L. A. and Shiuey, E. and Hill-Bennett, T. and Khanna, N. and Silverstein, M. and Tran, J. and Siraj, S. and Pond, M. and Donaghy, J. and Siam, L. and Zhan, T. T. and Murchison, A. P. and Levin, A. V.
Prevalence of refractive errors in school-aged children in the School District of Philadelphia
2017 Full text not available
200 Popov, I. and Valaskova, J. and Stefanickova, J. and Krasnik, V.
Prevalence of refractive errors in the Slovak population calculated using the Gullstrand schematic eye model
2017 Not population-based/representative
201 Mencher, G. T. and Madriz Alfaro, J. J. Prevalence of sensorineural hearing loss in children in Costa Rica
2000 Full text not available
202 Rose, K. and Younan, C. and Morgan, I. and Mitchell, P.
Prevalence of undetected ocular conditions in a pilot sample of school children
2003 Not population-based/representative
203 Zhao, Jialiang and Xu, Xiao and Ellwein, Leon B. and Cai, Ning and Guan, Huaijin and He, Mingguang and Liu, Ping and Lv,
Prevalence of Vision Impairment in Older Adults in Rural China in 2014 and Comparisons With the 2006 China Nine-Province Survey
2018 No new AP indicator
BMJ Publishing Group Limited (BMJ) disclaims all liability and responsibility arising from any relianceSupplemental material placed on this supplemental material which has been supplied by the author(s) BMJ Global Health
doi: 10.1136/bmjgh-2021-007662:e007662. 7 2022;BMJ Global Health, et al. Danemayer J

12
Jianhua and Sheng, Xunlun and Yang, Peizeng and Yi, Jinglin and Yang, Mei and Zhang, Rui and Ding, Xiaohu and Du, Liping and Li, Fengrong and Lu, Hong and Shao, Wenqiang and Wang, Junwei and Yuan, Yuansheng and Zhou, Rui and Zhuang, Wenjuan and An, Lei
204
Xu, Liang and Cui, Tongtong and Yang, Hua and Hu, Ailian and Ma, Ke and Zheng, Yuanyuan and Sun, Baochen and Li, Jianjun and Fan, Guizhi and Jonas, Jost B.
Prevalence of Visual Impairment among Adults in China: The Beijing Eye Study
2006 No new AP indicator
205 Ndegwa, L. K. and Karimurio, J. and Okelo, R. O. and Adala, H. S.
Prevalence of visual impairment and blindness in a Nairobi urban population
2006 No new AP indicator
206 Chin, M. P. and Siong, K. H. and Chan, K. H. and Do, C. W. and Chan, H. H. and Cheong, A. M.
Prevalence of visual impairment and refractive errors among different ethnic groups in schoolchildren in Turpan, China
2015 Not population-based/representative
207 Gresset, J. and Baumgarten, M. Prevalence of visual impairment and utilization of rehabilitation services in the visually impaired elderly population of Quebec
2002 Data collected before 2000
208 Antonelli, J. W. and Netto, A. A. and Dario, C. da S. and Ferre, L. B. and Pereira, M. C. S. R.
Prevalence of visual impairment in children from public and private schools in the city of Tubarao (Santa Catarina State)
2012 Full text not available
209
Evans, J. R. and Fletcher, A. E. and Wormald, R. P. L. and Ng, E. Siu-Woon and Stirling, S. and Smeeth, L. and Breeze, E. and Bulpitt, C. J. and Nunes, M. and Jones, D. and Tulloch, A.
Prevalence of visual impairment in people aged 75 years and older in Britain: results from the MRC trial of assessment and management of older people in the community
2002 Data collected before 2000
210 Franck, C. and Vorwerk, W. and Kohn, A. and Rismann, A. and Vorwerk, U.
Prevalence, Risk Factors and Diagnostics of Hearing Impairment in Preterm Infants
2017 Full text not available
211
Singh, N. and Khanna, R. C. and Reddy, S. and Eeda, S. S. and Gudapati, B. K. and Mettla, A. L. and Chakrabarti, S. and Kanade, P. and Shantha, G. P. S.
Prevalences, causes and risk factors of blindness and visual impairment in three tribal areas of Andhra Pradesh, India
2014 No new AP indicator
212 Ajitha, Katta and Krishna, A. K. I. and Bagavandas, M. and Anegawa, T. and Suresh, Munuswamy
Progressive disability in elderly population among tribals of Telangana: a cross sectional study
2017 No new AP indicator
213 Barton, G. and Davis, A. and Mair, I. W. S. and Parving, A. and Rosenhall, U. and Sorri, M.
Provision of hearing aid services: A comparison between the Nordic countries and the United Kingdom
2001 Data collected before 2000
214 Harkins, C. S. and McGarry, A. and Buis, A. Provision of prosthetic and orthotic services in low-income countries: A review of the literature
2013 Not population-based/representative
215 Congdon, N. G. and Ma, X. and Zhou, Z. and Yi, H. and Pang, X. and Shi, Y. and Chen, Q. and Meltzer, M. and He, M. and Rozelle, S.
Provision of spectacles improves academic performance of primary school children in a randomized trial in China
2014 Full text not available
216 Green, G. and Young, J. provision of wheelchairs for older people in the United Kingdom
2011 Not population-based/representative
217 Jan, C. and Kang, M. T. and Li, S. and Mitchell, P. and Rose, K. A. and Congdon, N. G. and Wang, N.
Pseudomyopia in China: Prevalence and impact of inaccurate spectacle power among Chinese children of different ages
2017 Full text not available
218 Congdon, N. and Li, L. and Zhang, M. and Yang, A. and Gao, Y. and Griffiths, S. and Wu, J. and Sharma, A. and Lam, D. S. C.
Randomized, controlled trial of an educational intervention to promote spectacle use in rural China: The see well to learn well study
2011 Not population-based/representative
219 Humanity & Inclusion Rapid Assessment of Disability in Kurigram and Narsingdi, Bangladesh
2017 Full text not available
220 Al-Taryar, R; Humbert, T; et al. Rapid assessment on access to assistive technology in the World Health Organization’s European Region
2019 No new AP indicator
221 Khan, S. Rapid assistive technology assessment: Survey on the use and demand for assistive products in Pakistan
2019 Full text not available
222 Hiscock, D. rapid needs analysis for North East Syria: Key findings on age, disability and technology
2019 Not population-based/representative
223
Smeeth, L. and Fletcher, A. E. and Ng, E. S. W. and Stirling, S. and Nunes, M. and Breeze, E. and Bulpitt, C. J. and Jones, D. and Tulloch, A.
Reduced hearing, ownership, and use of hearing aids in elderly people in the UK - The MRC trial of the assessment and management of older people in the community: A cross-sectional survey
2002 Data collected before 2000
224 Nacouzi, R. P. and Baz, P. Refractive disorders in a group of the Lebanese population of Armenian descent: A pilot study
2010 Full text not available
225 Trabucco, P. and Salomone, M. and Domanico, I. and Gerace, E. and Carnevale, C. and Vingolo, E.
Refractive error and amblyopia in A schoolchildren population of central italy
2013 Full text not available
226 Kannan, U. and Rajendiran, A. and Yeraballi, D. and Shanmugavel, K. and John, N. A. and Rene, S.
Refractive error and associated risk factors in 6-12 years schoolchildren
2016 No new AP indicator
227 Brian, G. and Pearce, M. G. and Ramke, J. Refractive error and presbyopia among adults in fiji 2011 Full text not available
BMJ Publishing Group Limited (BMJ) disclaims all liability and responsibility arising from any relianceSupplemental material placed on this supplemental material which has been supplied by the author(s) BMJ Global Health
doi: 10.1136/bmjgh-2021-007662:e007662. 7 2022;BMJ Global Health, et al. Danemayer J

13
228 Jeganathan, V. S. E. and Robin, A. L. and Woodward, M. A.
Refractive error in underserved adults: Causes and potential solutions
2017 Not population-based/representative
229
Nguyen, A. and Guo, X. and Inns, A. and Kretz, A. M. and Mukherjee, M. R. and Friedman, D. S. and Repka, M. X. and Collins, M. E.
Refractive error prevalence among inner-city students receiving school-based vision screenings and eye exams
2019 Full text not available
230 Schiefer, Ulrich and Kraus, Christina and Baumbach, Peter and Ungewiß, Judith and Michels, Ralf
Refractive errors 2016 Not population-based/representative
231 Nonon Saa, K. B. and Atobian, K. and Banla, M. and Redah, T. and Maneh, N. and Walser, A.
Refractive errors among schoolchildren in the central region of Togo
2013 No new AP indicator
232 Zain-Ur-Rehman, M. and Ahmad, S. R. and Mariya, Syed
Refractive errors among school-going children in Hyderabad 2017 Not population-based/representative
233 Loukil, I. and Naija, O. and Hachicha, F. and Mallouch, N. and Slim, B. and Bhiri, R. and Hijazi, A.
Refractive errors and visual impairment in Tunisian children 2011 Full text not available
234 Yingyong, P. Refractive errors survey in primary school children (6-12 year Old) in 2 provinces: Bangkok and Nakhonpathom (one year result)
2010 Full text not available
235
Schuster, Alexander Karl-Georg and Pfeiffer, Norbert and Schulz, Andreas and Hoehn, Rene and Ponto, Katharina A. and Wild, Philipp S. and Blettner, Maria and Beutel, Manfred E. and Lackner, Karl J. and Munzel, Thomas and Mirshahi, Alireza
Refractive, corneal and ocular residual astigmatism: distribution in a German population and age-dependency - the Gutenberg health study
2017 Not population-based/representative
236 Hlayisi, V. G.; Ramma, L.; Rehabilitation for disabling hearing loss: evaluating the need relative to provision of hearing aids in the public health care system
2019 Not population-based/representative
237 Golovanova, L. E. and Boboshko, M. Iu and Takhtaeva, N. Iu and Zhilinskaia, E. V.
Rehabilitation in elderly people with hearing loss 2014 Full text not available
238 Lynch, C. D. and Liu, X. H. and Landon, M. B.
Reproductive outcomes among women with a disability in the United States
2012 Full text not available
239 Ulusoy, S. and Ugras, H. and Cingi, C. and Yilmaz, H. B. and Muluk, N. B.
results of national newborn hearing screening (NNHS) data of 11,575 newborns from west part of Turkey
2014 Not population-based/representative
240 Daykhes, N. A. and Grigor'eva, E. A. and Nazarochkin, Yu V. and Davydov, V. M. and Kuznetsov, A. O.
results of universal audiological screening of newborn infants in the Astrakhan region]
2017 Full text not available
241 Razavi, H. and Burrow, S. and Trzesinski, A. Review of eye health among Aboriginal and Torres Strait Islander people
2018 No new AP indicator
242 Lindgren, B. rise in life expectancy, health trends among the elderly, and the demand for care - a selected literature review
2016 Not population-based/representative
243 Seymour, N. role of community-based rehabilitation (CBR) in effective wheelchair service provision
2015 Full text not available
244 Gonsalves, Sarita and Ganagi, Srinivas and Vivedkanad, U.
School screening in Coastal Karnataka 2019 Not population-based/representative
245 Sharma, Abhishek and Congdon, Nathan and Patel, Mehul and Gilbert, Clare
School-based approaches to the correction of refractive error in children
2012 No new AP indicator
246 Sherwin, J. C. and Dean, W. H. and Metcalfe, N.
Screening for childhood blindness and visual impairment in a secondary school in rural Malawi
2011 Not population-based/representative
247 Frick, K. D. and Riva-Clement, L. and Shankar, M. B.
Screening for refractive error and fitting with spectacles in rural and urban India: Cost-effectiveness
2009 No new AP indicator
248 Setti, A. and Bhuachalla, B. N. and Savva, G. M. and Kenny, R. A.
Self-rated vision and cognitive function in the irish population 2012 Full text not available
249
Brennan― Jones, Christopher G. and Taljaard, Dunay S. and Brennan― Jones, Sophie E. F. and Bennett, Rebecca J. and Swanepoel, De Wet and Eikelboom, Robert H.
Self-reported hearing loss and manual audiometry: A rural versus urban comparison
2016 Not population-based/representative
250 Li, C. F. and Lo, J. C. and Lau, G. C. and Gordon, N. P.
Self-reported hearing loss and use of hearing aids in older adults
2019 Full text not available
251 Bazargan, M. and Baker, R. S. and Bazargan, S. H.
Sensory impairments and subjective well-being among aged African American persons
2001 Data collected before 2000
252 Ngo, G. and Trope, G. and Buys, Y. and Jin, Y. P.
Significant disparities in eyeglass insurance coverage in Canada
2018 No new AP indicator
253 Vincent, J. E. Simple spectacles for adult refugees on the Thailand-Burma border
2006 Full text not available
254 Carlson, D. and Ehrlich, N. Sources of payment for assistive technology: findings from a national survey of persons with disabilities
2006 Not population-based/representative
255
Mudie, L. and Huang, A. and Mukherjee, R. and Madden, N. and Slavin, R. and Oweye, J. and Friedman, D. S. and Repka, M. X. and Collins, M. E.
Spectacle correction and reading ability in a school-based vision study in inner-city baltimore
2017 Full text not available
BMJ Publishing Group Limited (BMJ) disclaims all liability and responsibility arising from any relianceSupplemental material placed on this supplemental material which has been supplied by the author(s) BMJ Global Health
doi: 10.1136/bmjgh-2021-007662:e007662. 7 2022;BMJ Global Health, et al. Danemayer J

14
256 Gupta, V. and Saxena, R. and Vashist, P. and Bhardwaj, A. and Pandey, R. M. and Tandon, R. and Menon, V.
Spectacle Coverage among Urban Schoolchildren with Refractive Error Provided Subsidized Spectacles in North India
2019 Full text not available
257 Marmamula, S. and Ravuri, L. V. C. S. and Boon, M. Y. and Khanna, R. C.
Spectacle coverage and spectacles use among elderly population in residential care in the south Indian state of Andhra Pradesh
2013 Not population-based/representative
258
Vasconcelos, G. C. and Cavascan, N. N. and Berezovsky, A. and Cunha, C. C. and Munoz, S. and Furtado, J. M. and Cohen, J. M. and Cohen, M. J. and Belfort, R. and Salomao, S. R.
Spectacle coverage in older adults from parintins: The Brazilian Amazon region eye survey (BARES)
2016 Full text not available
259 Aravind Eye Hospital Spectacle dispensing for myopia at primary eye care level 2019 No new AP indicator
260 Barria Von-Bischhoffshausen, F. and Munoz, B. and Riquelme, A. and Ormeno, M. J. and Silva, J. C.
Spectacle-wear compliance in school children in Concepcion Chile
2014 Not population-based/representative
261
Salomao, S. R. and Munoz, S. and Furtado, J. M. and Ferraz, A. N. and Berezovsky, A. and Cavascan, N. N. and Sacai, P. Y. and Mitsuhiro, M. R. K. H. and Cohen, J. M. and Belfort, R.
Study design and methods for a population-based study on the prevalence and causes of distance and near vision impairment and blindness in parintins city: The Brazilian amazon region eye survey (BARES)
2016 Full text not available
262 Lin, Jin-Ding and Li, Chien-De and Lin, Lan-Ping and Hsu, Shang-Wei
study of geographic differences in the prevalence of disability among Taiwanese population
2012 No new AP indicator
263 Manasa, G. and Seran Kumar Reddy, M. and Sai Spporthy, M. and Nisar, S. and Vamsidhar and Naik, B. S.
study of prevalence of undetected refractive errors among school children in Kadapa
2012 Full text not available
264 Pannell, L; Seymour, N. Sustainability of wheelchair service provision: Perspectives from service providers
2019 Not population-based/representative
265 Bright, T. and Wallace, S. and Kuper, H. systematic review of access to rehabilitation for people with disabilities in low-and middle-income countries
2018 Not population-based/representative
266 PEEK The Peek Approach to Measuring and Creating Impact 2019 No new AP indicator
267 Garcia, Y; Pearlman, J; Rosen, P. The wheelchair user’s voice: Preliminary results related to unmet need for assistive technology in Indonesia and El Salvador
2019 Not population-based/representative
268
Cheng, Yiling J. and Gregg, Edward W. and Saaddine, Jinan B. and Imperatore, Giuseppina and Zhang, Xinzhi and Albright, Ann L.
Three decade change in the prevalence of hearing impairment and its association with diabetes in the United States
2009 No new AP indicator
269 Ajith, S. and Sandhya, R. To study the prevalence of refractory errors in school children 2015 No new AP indicator
270 Ntodie, M. and Danquah, L. and Kandel, H. and Abokyi, S.
Toward eliminating blindness due to uncorrected refractive errors: assessment of refractive services in the northern and central regions of Ghana
2014 Not population-based/representative
271
Holden, Brien A. and Tahhan, Nina and Jong, Monica and Wilson, David A. and Fricke, Timothy R. and Bourne, Rupert and Resnikoff, Serge
Towards better estimates of uncorrected presbyopia 2015 Full text not available
272 Varadaraj, V. and Frick, K. D. and Saaddine, J. B. and Friedman, D. S. and Swenor, B. K.
Trends in Eye Care Use and Eyeglasses Affordability: The US National Health Interview Survey, 2008-2016
2019 No new AP indicator
273
Lee, D. J. and Arheart, K. L. and Lam, B. L. and Zheng, D. and Christ, S. L. and McCollister, K. E. and Davila, E. P. and Caban-Martinez, A. J.
Trends in reported visual impairment in United States adults 2009 No new AP indicator
274 Lai, Der-Chung and Tseng, Yen-Cheng and Guo, How-Ran
Trends in the prevalence of childhood disability: Analysis of data from the national disability registry of Taiwan, 2000-2011
2013 No new AP indicator
275 Warkad, Vivekanand U. and Panda, Lapam and Behera, Pradeep and Das, Taraprasad and Mohanta, Bikash C. and Khanna, Rohit
Tribal Odisha Eye Disease Study (TOES) 1: prevalence and causes of visual impairment among tribal children in an urban school in Eastern India
2018 No new AP indicator
276 Giloyan, A. and Harutyunyan, T. and Petrosyan, V.
Uncorrected refractive error and associated risk factors among socially vulnerable older adult population living in Armenia
2018 Not population-based/representative
277 Ehrlich, J. R. and Laoh, A. and Kourgialis, N. and Prasetyanti, W. and Zakiyah, R. and Faillace, S. and Friedman, D. S.
Uncorrected refractive error and presbyopia among junior high school teachers in Jakarta, Indonesia
2013 Not population-based/representative
278 Uribe, J. A. and Swenor, B. K. and Munoz, B. E. and West, S. K.
Uncorrected refractive error in a latino population: Proyecto VER
2011 Data collected before 2000
279 Saw, S. M. and Foster, P. J. and Gazzard, G. and Friedman, D. and Hee, J. and Seah, S.
Undercorrected refractive error in Singaporean Chinese adults: The Tanjong Pagar survey
2004 Data collected before 2000
280 Harrington, Christina N. and Mitzner, Tracy L. and Rogers, Wendy A.
Understanding the role of technology for meeting the support needs of older adults in the USA with functional limitations
2015 No new AP indicator
281 McColl, M. A. and Jarzynowska, A. and Shortt, S. E. D.
Unmet health care needs of people with disabilities: population level evidence
2010 Data collected before 2000
282 Dusing, Stacey C. and Skinner, Asheley Cockrell and Mayer, Michelle L.
Unmet Need for Therapy Services, Assistive Devices, and Related Services: Data From the National Survey of Children
2004 No new AP indicator
BMJ Publishing Group Limited (BMJ) disclaims all liability and responsibility arising from any relianceSupplemental material placed on this supplemental material which has been supplied by the author(s) BMJ Global Health
doi: 10.1136/bmjgh-2021-007662:e007662. 7 2022;BMJ Global Health, et al. Danemayer J

15
With Special Health Care Needs
283
Abhishek, Sharma and Li, LiPing and Song, Yue and Choi, Kai and Lam, D. S. C. and Zhang, MingZhi and Zheng, MingWei and Zhou, ZhongXia and Liu, XiaoJian and Wu, Bin and Congdon, N.
Strategies to improve the accuracy of vision measurement by teachers in rural Chinese secondary schoolchildren: Xichang Pediatric Refractive Error Study (X-PRES) Report No. 6
2008 No new AP indicator
284 Mitra, M. and Bogen, K. and Long-Bellil, L. M. and Heaphy, D.
Unmet needs for home and community-based services among persons with disabilities in Massachusetts
2011 No new AP indicator
285 Emamian, M. H. and Zeraati, H. and Majdzadeh, R. and Shariati, M. and Hashemi, H. and Fotouhi, A.
Unmet refractive need and its determinants in Shahroud, Iran 2012 Full text not available
286 Clarke, N. and Shacks, J. and Kerr, A. R. E. and Bottrell, C. L. and Poulsen, M. K. and Yin, L.
Use of a noncycloplegic autorefractor to perform vision screening in preschools
2008 Not population-based/representative
287 Kwok-Tak Yeung 1 2 , Chung-Hui Lin 1 2 , Ya-Ling Teng 1 2 , Fen-Fen Chen 1 2 , Shu-Zon Lou 1 2 , Chiung-Ling Chen
Use of and Self-Perceived Need for Assistive Devices in Individuals with Disabilities in Taiwan
2016 Not population-based/representative
288 Ryskulova, A. and Klein, R. and Cotch, M. F.
Use of eye care services among U.S. Children, 2002 and 2008 2010 Full text not available
289 Hartley, D. and Rochtchina, E. and Newall, P. and Golding, M. and Mitchell, P.
Use of hearing aids and assistive listening devices in an older australian population
2010 Full text not available
290 Clarke, P. and Chan, P. and Santaguida, P. L. and Colantonio, A.
use of mobility devices among institutionalized older adults 2009 Not population-based/representative
291 Heerkens, Y. and Bougie, T. and Claus, E. use of the ICF in the process of supplying assistive products: Discussion paper based on the experience using a general Dutch prescription guideline
2011 No new AP indicator
292 Desideri, L; Salatino, C; et al. Using a standard procedure to assess assistive technology service delivery outcomes: A proposal from the Italian Network of Independent Assistive Technology Centres
2019 No new AP indicator
293
Duke, Roseline and Otong, Eyoawan and Iso, Maureen and Okorie, Uche and Ekwe, Asuquo and Courtright, Paul and Lewallen, Susan
Using key informants to estimate prevalence of severe visual impairment and blindness in children in Cross River State, Nigeria
2013 No new AP indicator
294
Zhang, X. and Cotch, M. F. and Ryskulova, A. and Primo, S. A. and Nair, P. and Chou, C. F. and Geiss, L. S. and Barker, L. E. and Elliott, A. F. and Crews, J. E. and Saaddine, J. B.
Vision health disparities in the United States by race/ethnicity, education, and economic status: Findings from two nationally representative surveys
2012 No new AP indicator
295 Unsal, A. and Ayranci, U. and Tozun, M. Vision screening among children in primary schools in a district of western Turkey: An epidemiological study
2009 Not population-based/representative
296 Ketaki, Bagchi and Subhra, Nag and Tutul, Chattopadhyaya and Amit, Dan
Vision screening programme among school children - evaluation of the outcome in a selected urban locality
2008 Full text not available
297
Marcela Colussi Cypel 1 , Solange Rios Salomão 1 , Paulo Elias Correa Dantas 2 , Claudio Luiz Lottenberg 3 , Niro Kasahara 2 , Luiz Roberto Ramos 4 , Rubens Belfort Jr
Vision status, ophthalmic assessment, and quality of life in the very old
2017 Not population-based/representative
298 Solange R. Salomão; Márcia R. K. H. Mitsuhiro; Rubens Belfort Jr
Visual impairment and blindness: An overview of prevalence and causes in Brazil
2009 No new AP indicator
299
Yekta, Reyhaneh and Hashemi, Hassan and Pakzad, Reza and Jafari, Asieh and Yekta, Abbasali and Heravian, Javad and Ostadimoghaddam, Hadi and Valadkhan, Mehrnaz and Khabazkhoob, Mehdi
Visual impairment and some of ocular problem in nursing home residents
2019 Not population-based/representative
300 Guo, Yin and Liu, LiJuan and Xu, Liang and Lv, YanYun and Tang, Ping and Feng, Yi and Meng, Lei and Jonas, J. B.
Visual impairment and spectacle use in schoolchildren in rural and urban regions in Beijing
2014 Not population-based/representative
301 Wei, S. and Sun, Y. and Wang, N. Visual impairment and spectacle use in university students in central China: The Anyang University Students Eye Study
2019 Not population-based/representative
302 Abokyi, S. and Ilechie, A. and Nsiah, P. and Darko-Takyi, C. and Abu, E. K. and Osei-Akoto, Y. J. and Youfegan-Baanam, M.
Visual impairment attributable to uncorrected refractive error and other causes in the Ghanaian youth: The University of Cape Coast Survey
2016 Not population-based/representative
303 Srinivas, Marmamula and Saggam, Narsaiah and Konegari, Shekhar and Khanna, R. C. and Rao, G. N.
Visual impairment in the South Indian state of Andhra Pradesh: Andhra Pradesh - Rapid Assessment of Visual Impairment (AP-RAVI) project
2013 No new AP indicator
304 Owsley, Cynthia; McGwin, Gerald; Scilley, Kay
visual status of older persons residing in nursing homes 2007 Not population-based/representative
305 Cox, D. L. Wheelchair needs for children and young people: a review 2003 No new AP indicator
306 Allen, M. and Gowran, R. J. and Goldberg, M. and Pearlman, J.
Wheelchair stakeholders meeting 2018 - Developing a global wheelchair sector report with priority actions toward sustainable wheelchair provision: Appropriate wheelchairs, a global challenge
2019 Full text not available
BMJ Publishing Group Limited (BMJ) disclaims all liability and responsibility arising from any relianceSupplemental material placed on this supplemental material which has been supplied by the author(s) BMJ Global Health
doi: 10.1136/bmjgh-2021-007662:e007662. 7 2022;BMJ Global Health, et al. Danemayer J

16
307 Clarke, P. and Colantonio, A. Wheelchair use among community-dwelling older adults: Prevalence and risk factors in a national sample
2005 Full text not available
BMJ Publishing Group Limited (BMJ) disclaims all liability and responsibility arising from any relianceSupplemental material placed on this supplemental material which has been supplied by the author(s) BMJ Global Health
doi: 10.1136/bmjgh-2021-007662:e007662. 7 2022;BMJ Global Health, et al. Danemayer J

17
Appendix 7: Hearing Aid Indicators
Citation Tool, Survey,
or Dataset
Study
Design Approaches Ages Participants
JBI
Score
Functional
Difficulty
Threshold
WHO
Region Country
AP access Indicator
Indicator Calculation (%) Denominator
Muga, 2003[16] None Cross-sectional
Functional; Self-report
2-9 399 4 [1, 3, 4, 7, 9, 10]
RAL AFR Kenya Need 3/399 0.8% Total participants
Rios et al, 2014[17]
Assistive Technology Banks (BAT) Client Database
Secondary cross-sectional
Clinical 0-100 839 8 [2, 10]
AP use AMR Colombia Has AP 224/839 26.7% Total participants
Vuorialho et al, 2004[18] None Secondary cross-sectional
Clinical 0-100 455200 7 [1, 4, 10]
HL>30dB EUR Finland Has AP 1294/839 89.1% Total with need
Nash et al, 2013[19] Beaver Dam Offspring Study
Secondary cross-sectional
Clinical; Self-report
21-84 3130 10 HL>25dB AMR United States
Use 42/401 10.5% Total with functional difficulty
Dawes et al, 2014[20] UK Biobank Resource
Secondary cross-sectional
Functional; Single-question self-report
40-69 164770 9 [2] AP use; Digit Triplet Test
EUR United Kingdom
Use 3295/164770 2.0% Total participants
Sawyer et al, 2019[21] UK Biobank Resource
Secondary cross-sectional
Functional; Single-question self-report
40-69 18730 9 [9] AP use; Digit Triplet Test
EUR United Kingdom
Use 1732/18730 9.2% Total with functional difficulty
Unmet 16963/18730 90.6% Total with functional difficulty
Boggs et al, 2019[22]
WGQ Child Functioning Module; WGQ Extended set
Secondary cross-sectional
Clinical; Self-report
0+ 7135 8 [4, 8] HL>41dB; RAL AFR Cameroon Coverage 3/43 7.0% Total with need
Need 43/3572 1.2% Total participants
Unmet 40/43 93.0% Total with need
Use 3/3572 0.1% Total participants
SEAR India Coverage 5/112 4.5% Total with need
Need 112/3563 3.1% Total participants
Unmet 107/112 95.5% Total with need
Use 5/3563 0.1% Total participants
Orji et al, 2020[23] GBD; National Secondary Multiple 0+ N/A 10 HL>=35dB AFR Use 3.6/36.6* 9.8% Total with
BMJ Publishing Group Limited (BMJ) disclaims all liability and responsibility arising from any relianceSupplemental material placed on this supplemental material which has been supplied by the author(s) BMJ Global Health
doi: 10.1136/bmjgh-2021-007662:e007662. 7 2022;BMJ Global Health, et al. Danemayer J

18
Health and Nutrition Examination Survey; Multi-Country Survey Study on Health and Responsiveness; Studies on Global Ageing and Adult Health
cross-sectional
secondary sources need
Unmet 33/36.6* 90.2% Total with need
AMR Use 9.9/59.4* 16.7% Total with need
Unmet 49.5/59.4* 83.3% Total with need
EMR Use 3.3/21.1* 15.6% Total with need
Unmet 17.8/21.1* 84.4% Total with need
EUR Use 12.3/545* 2.3% Total with need
Unmet 42.2/545* 7.7% Total with need
Global Use 67.9/401.4* 16.9% Total with need
Unmet 333.5/401.4* 83.1% Total with need
SEAR Use 15.7/102.3* 15.3% Total with need
Unmet 86.5/102.3* 84.6% Total with need
WPR Use 22.8/125.6* 18.2% Total with need
Unmet 102.9/125.6* 81.9% Total with need
Gondim et al, 2012[24] None Cross-sectional
Clinical; Self-report
4+ 379 10 HL>25dB AMR Brazil Need 18/379 4.7% Total participants
Danquah et Brus, 2013[25] WGQ Short set Mixed-methods
Self-report 5+ 3122 10 RAL AMR Haiti Unmet 35/178 19.7% Total with functional difficulty
Use 8/178 4.5% Total with functional difficulty
von Gablenz et al, 2017[26] Aalen Survey; HÖRSTAT
Cross-sectional
Clinical; Self-report
7+ 1866 9 [9] HL>25dB EUR Germany Use 162/3105 5.2% Total participants
BMJ Publishing Group Limited (BMJ) disclaims all liability and responsibility arising from any relianceSupplemental material placed on this supplemental material which has been supplied by the author(s) BMJ Global Health
doi: 10.1136/bmjgh-2021-007662:e007662. 7 2022;BMJ Global Health, et al. Danemayer J
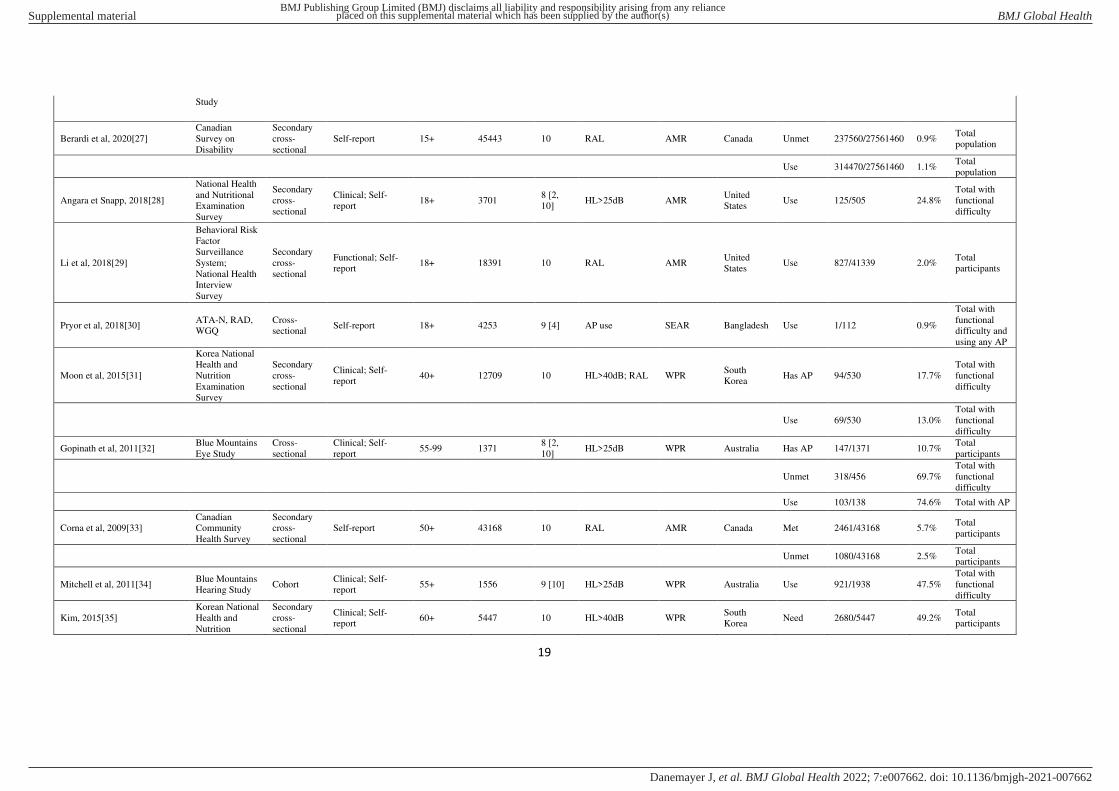
19
Study
Berardi et al, 2020[27] Canadian Survey on Disability
Secondary cross-sectional
Self-report 15+ 45443 10 RAL AMR Canada Unmet 237560/27561460 0.9% Total population
Use 314470/27561460 1.1% Total population
Angara et Snapp, 2018[28]
National Health and Nutritional Examination Survey
Secondary cross-sectional
Clinical; Self-report
18+ 3701 8 [2, 10]
HL>25dB AMR United States
Use 125/505 24.8% Total with functional difficulty
Li et al, 2018[29]
Behavioral Risk Factor Surveillance System; National Health Interview Survey
Secondary cross-sectional
Functional; Self-report
18+ 18391 10 RAL AMR United States
Use 827/41339 2.0% Total participants
Pryor et al, 2018[30] ATA-N, RAD, WGQ
Cross-sectional
Self-report 18+ 4253 9 [4] AP use SEAR Bangladesh Use 1/112 0.9%
Total with functional difficulty and using any AP
Moon et al, 2015[31]
Korea National Health and Nutrition Examination Survey
Secondary cross-sectional
Clinical; Self-report
40+ 12709 10 HL>40dB; RAL WPR South Korea
Has AP 94/530 17.7% Total with functional difficulty
Use 69/530 13.0% Total with functional difficulty
Gopinath et al, 2011[32] Blue Mountains Eye Study
Cross-sectional
Clinical; Self-report
55-99 1371 8 [2, 10]
HL>25dB WPR Australia Has AP 147/1371 10.7% Total participants
Unmet 318/456 69.7% Total with functional difficulty
Use 103/138 74.6% Total with AP
Corna et al, 2009[33] Canadian Community Health Survey
Secondary cross-sectional
Self-report 50+ 43168 10 RAL AMR Canada Met 2461/43168 5.7% Total participants
Unmet 1080/43168 2.5% Total participants
Mitchell et al, 2011[34] Blue Mountains Hearing Study
Cohort Clinical; Self-report
55+ 1556 9 [10] HL>25dB WPR Australia Use 921/1938 47.5% Total with functional difficulty
Kim, 2015[35] Korean National Health and Nutrition
Secondary cross-sectional
Clinical; Self-report
60+ 5447 10 HL>40dB WPR South Korea
Need 2680/5447 49.2% Total participants
BMJ Publishing Group Limited (BMJ) disclaims all liability and responsibility arising from any relianceSupplemental material placed on this supplemental material which has been supplied by the author(s) BMJ Global Health
doi: 10.1136/bmjgh-2021-007662:e007662. 7 2022;BMJ Global Health, et al. Danemayer J
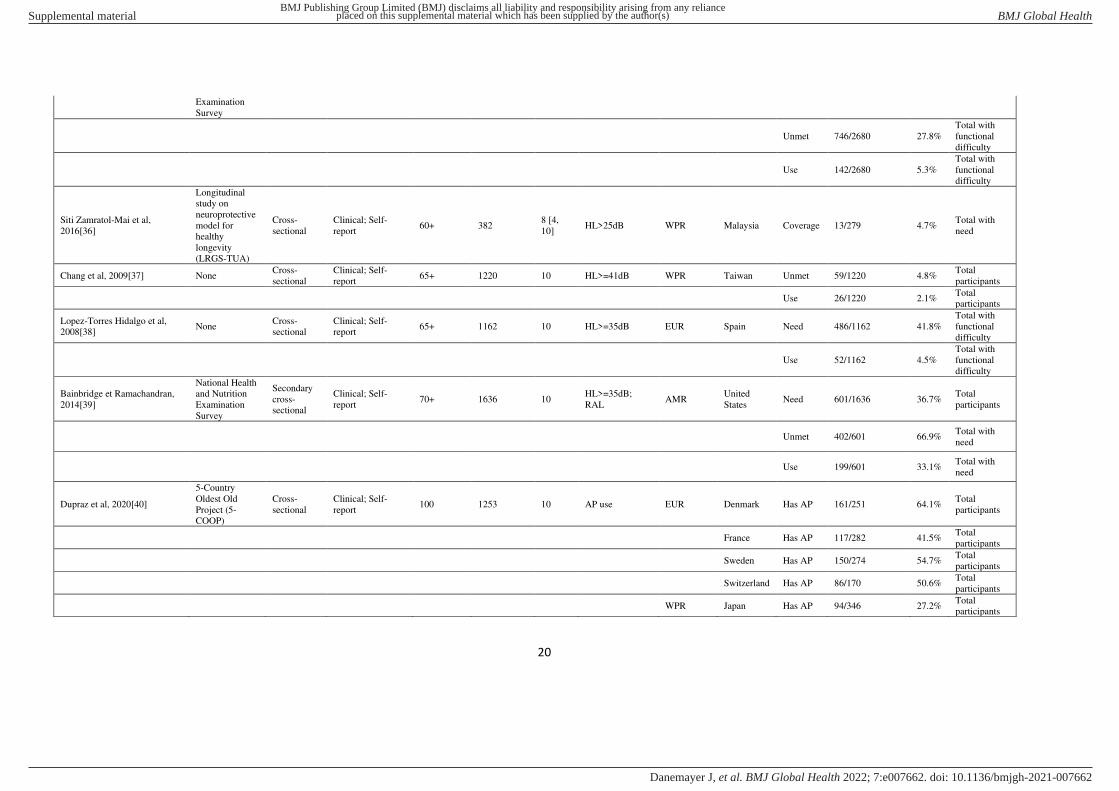
20
Examination Survey
Unmet 746/2680 27.8% Total with functional difficulty
Use 142/2680 5.3% Total with functional difficulty
Siti Zamratol-Mai et al, 2016[36]
Longitudinal study on neuroprotective model for healthy longevity (LRGS-TUA)
Cross-sectional
Clinical; Self-report
60+ 382 8 [4, 10]
HL>25dB WPR Malaysia Coverage 13/279 4.7% Total with need
Chang et al, 2009[37] None Cross-sectional
Clinical; Self-report
65+ 1220 10 HL>=41dB WPR Taiwan Unmet 59/1220 4.8% Total participants
Use 26/1220 2.1% Total participants
Lopez-Torres Hidalgo et al, 2008[38]
None Cross-sectional
Clinical; Self-report
65+ 1162 10 HL>=35dB EUR Spain Need 486/1162 41.8% Total with functional difficulty
Use 52/1162 4.5% Total with functional difficulty
Bainbridge et Ramachandran, 2014[39]
National Health and Nutrition Examination Survey
Secondary cross-sectional
Clinical; Self-report
70+ 1636 10 HL>=35dB; RAL
AMR United States
Need 601/1636 36.7% Total participants
Unmet 402/601 66.9%
Total with need
Use 199/601 33.1% Total with need
Dupraz et al, 2020[40]
5-Country Oldest Old Project (5-COOP)
Cross-sectional
Clinical; Self-report
100 1253 10 AP use EUR Denmark Has AP 161/251 64.1% Total participants
France Has AP 117/282 41.5% Total participants
Sweden Has AP 150/274 54.7% Total participants
Switzerland Has AP 86/170 50.6% Total participants
WPR Japan Has AP 94/346 27.2% Total participants
BMJ Publishing Group Limited (BMJ) disclaims all liability and responsibility arising from any relianceSupplemental material placed on this supplemental material which has been supplied by the author(s) BMJ Global Health
doi: 10.1136/bmjgh-2021-007662:e007662. 7 2022;BMJ Global Health, et al. Danemayer J

21
ATA-N=Assistive Technology Assessment-Needs. GBD=Global Burden of Disease dataset. RAD=Rapid Assessment of Disability. WGQ=Washington Group Questions. RAL=self-reported activity limitations. HL=hearing loss.
*Results are presented in millions.
BMJ Publishing Group Limited (BMJ) disclaims all liability and responsibility arising from any relianceSupplemental material placed on this supplemental material which has been supplied by the author(s) BMJ Global Health
doi: 10.1136/bmjgh-2021-007662:e007662. 7 2022;BMJ Global Health, et al. Danemayer J

22
Appendix 8: Mobility AP Indicators
AP Type Citation
Tool,
Survey, or
Dataset
Study
Design Approaches Ages Participants
JBI
Score
Functional
Difficulty
Threshold
WHO
Region Country
AP access Indicator
Indicator Calculation (%) Denominator
Limb prosthetics
Rios et al, 2014[17]
Assistive Technology Banks (BAT) Client Database
Secondary cross-sectional
Clinical 0-100
839 8 [2, 10]
AP use AMR Colombia Has AP 151/839 18.0% Total participants
Pryor et al, 2018[30]
ATA-N, RAD, WGQ
Cross-sectional
Self-report 18+ 4253 9 [4] AP use SEAR Bangladesh Use 1/112 0.9% Total with functional difficulty
Motorised wheelchairs
Berardi et al, 2020[27]
Canadian Survey on Disability
Secondary cross-sectional
Self-report 15+ 45443 10 RAL AMR Canada Unmet 32220/27561460 0.1% Total population
Giesbrecht et al, 2017[41]
Canadian Survey on Disability
Secondary cross-sectional
Self-report 15+ 45442 10 RAL AMR Canada Unmet 2531649/3775920 67.0% Total with functional difficulty
Smith et al, 2016[42]
Canadian Survey on Disability
Secondary cross-sectional
Self-report 15+ 45500 9 [10]
AP use AMR Canada Use 150910/288800 52.3% Total with AP
Pryor et al, 2018[30]
ATA-N, RAD, WGQ
Cross-sectional
Self-report 18+ 4253 9 [4] AP use SEAR Bangladesh Use 1/112 0.9% Total with functional difficulty
Gale et al, 2015[43]
English Longitudinal Study of Aging; Health Survey for England
Secondary cross-sectional
Functional; Self-report
60+ 5450 9 [2] AP use; RAL
EUR United Kingdom
Use 14/3371 0.4% Total with functional difficulty
Gell et al, 2015[44]
National Health and Aging Trends Study
Secondary cross-sectional
Self-report 65+ 7609 10 AP use AMR United States
Use 815000/35000000 2.3% Total population
BMJ Publishing Group Limited (BMJ) disclaims all liability and responsibility arising from any relianceSupplemental material placed on this supplemental material which has been supplied by the author(s) BMJ Global Health
doi: 10.1136/bmjgh-2021-007662:e007662. 7 2022;BMJ Global Health, et al. Danemayer J

23
Iwashyna et Christie, 2007[45]
Medicare Current Beneficiary Survey
Secondary cross-sectional
Self-report 65+ 4687 10 RAL AMR United States
Use 25/835 3.0% Total with functional difficulty
Wolff et al, 2005[46]
Medicare Current Beneficiary Survey
Secondary cross-sectional
Clinical; Self-report
65+ 12691 9 [7] AP use AMR United States
Has AP 158812/30000000 0.5% Total population
Manual or unspecified wheelchairs
Tataryn et al, 2017[47]
None Cross-sectional
Clinical; Self-report
0-18 7220 9 [2] RAL AFR Malawi Need 87/1094 8.0% Total with functional difficulty
Rios et al, 2014[17]
Assistive Technology Banks (BAT) Client Database
Secondary cross-sectional
Clinical 0-100
839 8 [2, 10]
AP use AMR Colombia Has AP 461/839 54.9% Total participants
Boggs et al, 2019[22]
WGQ Child Functioning Module; WGQ Extended set
Secondary cross-sectional
Clinical; Self-report
0+ 7135 8 [4, 8]
RAL AFR Cameroon Coverage 0/4 0.0% Total with need
Need 4/3572 0.1% Total participants
Unmet 4/3572 0.1% Total participants
Use 0/3572 0.0% Total participants
SEAR India Coverage 1/3 33.3% Total with need
Need 3/3563 0.1% Total participants
Unmet 2/3563 0.1% Total participants
Use 1/3563 0.0% Total participants
Danquah et Brus, 2013[25]
WGQ Short set
Mixed-methods
Self-report 5+ 3122 10 RAL AMR Haiti Need 17/178 9.7% Total with functional difficulty
BMJ Publishing Group Limited (BMJ) disclaims all liability and responsibility arising from any relianceSupplemental material placed on this supplemental material which has been supplied by the author(s) BMJ Global Health
doi: 10.1136/bmjgh-2021-007662:e007662. 7 2022;BMJ Global Health, et al. Danemayer J

24
Use 12/178 6.9% Total with functional difficulty
Giesbrecht et al, 2017[41]
Canadian Survey on Disability
Secondary cross-sectional
Self-report 15+ 45442 10 RAL AMR Canada Under-met
28880/288800 10.0% Total with AP
Unmet 662552/3775920 17.5% Total with functional difficulty
Smith et al, 2016[42]
Canadian Survey on Disability
Secondary cross-sectional
Self-report 15+ 45500 9 [10]
AP use AMR Canada Use 197560/288800 68.4% Total with AP
Pryor et al, 2018[30]
ATA-N, RAD, WGQ
Cross-sectional
Self-report 18+ 4253 9 [4] AP use SEAR Bangladesh Use 1/112 0.9%
Total with functional difficulty and using any AP
Theis et al, 2019[48]
Survey of Income and Program Participation
Secondary cross-sectional
Self-report 18+ 66410 10 AP use; RAL
AMR United States
Use 3.6/225.6* 1.6% Total population
Gale et al, 2015[43]
English Longitudinal Study of Aging; Health Survey for England
Secondary cross-sectional
Functional; Self-report
60+ 5450 9 [2] AP use; RAL
EUR United Kingdom
Use 93/3371 2.8% Total with functional difficulty
Cornman et al, 2008[49]
Health and Retirement Study
Secondary cross-sectional
Self-report 65+ 10101 8 [2, 10]
AP use AMR United States
Use 869/10101 8.6% Total participants
Gell et al, 2015[44]
National Health and Aging Trends Study
Secondary cross-sectional
Self-report 65+ 7609 10 AP use AMR United States
Use 2.1/35* 6.1% Total population
Iwashyna et Christie,
Medicare Current Beneficiary
Secondary cross-sectional
Self-report 65+ 4687 10 RAL AMR United States
Use 147/835 17.6% Total with functional difficulty
BMJ Publishing Group Limited (BMJ) disclaims all liability and responsibility arising from any relianceSupplemental material placed on this supplemental material which has been supplied by the author(s) BMJ Global Health
doi: 10.1136/bmjgh-2021-007662:e007662. 7 2022;BMJ Global Health, et al. Danemayer J

25
2007[45] Survey
Wolff et al, 2005[46]
Medicare Current Beneficiary Survey
Secondary cross-sectional
Clinical; Self-report
65+ 12691 9 [7] AP use AMR United States
Has AP 776113/30000000 2.6% Total population
Dupraz et al, 2020[40]
5-COOP Cross-sectional
Clinical; Self-report
100 1253 10 AP use EUR Denmark Use (Indoor)
37/251 14.7% Total participants
Use (Outdoor)
50/251 19.9% Total participants
EUR France Use (Indoor)
67/212 31.6% Total participants
Use (Outdoor)
67/212 31.6% Total participants
EUR Sweden Use (Indoor)
75/274 27.4% Total participants
Use (Outdoor)
90/274 32.8% Total participants
EUR Switzerland Use (Indoor)
62/170 36.5% Total participants
Use (Outdoor)
68/170 40.0% Total participants
WPR Japan Use (Indoor)
143/346 41.3% Total participants
Use (Outdoor)
186/346 53.8% Total participants
ATA-N=Assistive Technology Assessment-Needs. RAD=Rapid Assessment of Disability. WGQ=Washington Group Questions. RAL=self-reported activity limitations.
*Results are presented in millions.
BMJ Publishing Group Limited (BMJ) disclaims all liability and responsibility arising from any relianceSupplemental material placed on this supplemental material which has been supplied by the author(s) BMJ Global Health
doi: 10.1136/bmjgh-2021-007662:e007662. 7 2022;BMJ Global Health, et al. Danemayer J

26
Appendix 9: Near and Distance Glasses Indicators
AP
Type Citation
Tool,
Survey,
or
Dataset
Study
Design Approaches Ages
Partici
pants
JBI
Score
Functional
Difficulty
Threshold
WHO
Region Country
AP access Indicator
Indicator Calculation (%) Denominato
r
Near Glasses
Azizoglu et al, 2017[50]
None Cross-sectional
Clinical 3-10 823 9 [2] RE subsets EUR Turkey Need 86/823 10.4% Total participants
Use 65/823 7.9% Total participants
Marmamula et al, 2013 (a)[51]
RARE Cross-sectional
Clinical 15-49
3095 10 AP use SEAR India Use 14/325 4.3% Total with AP
Muhit et al, 2018[52]
RARE Cross-sectional
Clinical; Self-report
15-49
3050 10 PVA<6/18; UCNVA<N8
SEAR Bangladesh Coverage 28/869 3.2% Total with need
Met 28/869 3.2% Total with need
Unmet 841/869 96.8% Total with need
Chan et al, 2013[53]
RARE Cross-sectional
Clinical 15-50
3171 9 [4] UCVA<6/12 AFR Eritrea Coverage 39/394 9.9% Total with need
Met 39/394 9.9% Total with need
Unmet 355/394 90.1% Total with need
Loughman et al, 2015[54]
RARE Cross-sectional
Clinical; Self-report
15-50
3457 9 [4] PVA<6/12 AFR Mozambique Coverage 7/319 2.2% Total with need
Met 7/319 2.2% Total with need
Unmet 317/319 99.4% Total with need
Marmamula et al, 2009[55]
RARE Cross-sectional
Clinical; Self-report
15-50
3203 10 PVA<6/12; UCNVA<N8
SEAR India Coverage 130/690 18.8% Total with need
Met 130/3203 4.1% Total participants
Need 690/3203 21.5% Total participants
Unmet 560/3203 17.5% Total participants
BMJ Publishing Group Limited (BMJ) disclaims all liability and responsibility arising from any relianceSupplemental material placed on this supplemental material which has been supplied by the author(s) BMJ Global Health
doi: 10.1136/bmjgh-2021-007662:e007662. 7 2022;BMJ Global Health, et al. Danemayer J

27
Use 15/371 4.0% Total with AP
Taylor et al, 2010[56]
National Indigenous Eye Health Survey
Cross-sectional
Clinical 5-89 2883 10 VA<6/12; NVA<N8
WPR Australia Use 827/1325 62.4% Total participants
Ramke et al, 2012[57]
RAAB; Timor-Leste Eye Health Survey
Cross-sectional
Clinical; Self-report
0-100
2014 10 PVA<6/18; UCNVA<N7
SEAR Timor-Leste Coverage 166/1057 15.7% Total with need
Met 166/2014 8.2% Total participants
Unmet 891/2014 44.2% Total participants
Fricke et al, 2018[58]
None Secondary cross-sectional
Multiple secondary sources
0+ N/A 10 UCVA<N8
Andean Latin America
Unmet Not provided
51.4% Total with functional difficulty
Australasia
Unmet Not provided
1.0% Total with functional difficulty
Caribbean
Unmet Not provided
43.0% Total with functional difficulty
Central Asia
Unmet Not provided
47.4% Total with functional difficulty
Central Europe
Unmet Not provided
18.4% Total with functional difficulty
Central Latin America
Unmet Not provided
47.6% Total with functional difficulty
Central Sub-Saharan
Unmet Not provided
12.0% Total with functional difficulty
BMJ Publishing Group Limited (BMJ) disclaims all liability and responsibility arising from any relianceSupplemental material placed on this supplemental material which has been supplied by the author(s) BMJ Global Health
doi: 10.1136/bmjgh-2021-007662:e007662. 7 2022;BMJ Global Health, et al. Danemayer J

28
Africa
East Asia
Unmet Not provided
14.5% Total with functional difficulty
East Sub-Saharan Africa
Unmet Not provided
11.9% Total with functional difficulty
Eastern Europe
Unmet Not provided
30.0% Total with functional difficulty
Global Unmet Not provided
45.2% Total with functional difficulty
HI Asia Pacific
Unmet Not provided
1.0% Total with functional difficulty
HI North America
Unmet Not provided
1.0% Total with functional difficulty
North Africa and Middle East
Unmet Not provided
45.6% Total with functional difficulty
Oceania Unmet Not provided
74.2% Total with functional difficulty
South Asia
Unmet Not provided
71.7% Total with functional difficulty
Southeast Asia
Unmet Not provided
58.2% Total with functional difficulty
Southern Latin
Unmet Not provided
24.9% Total with functional
BMJ Publishing Group Limited (BMJ) disclaims all liability and responsibility arising from any relianceSupplemental material placed on this supplemental material which has been supplied by the author(s) BMJ Global Health
doi: 10.1136/bmjgh-2021-007662:e007662. 7 2022;BMJ Global Health, et al. Danemayer J

29
America
difficulty
Southern Sub-Saharan Africa
Unmet Not provided
74.3% Total with functional difficulty
Tropical Latin America
Unmet Not provided
40.9% Total with functional difficulty
West Sub-Saharan Africa
Unmet Not provided
8.6% Total with functional difficulty
Western Europe
Unmet Not provided
1.0% Total with functional difficulty
Casas Luque et al, 2019[59]
RARE Cross-sectional
Clinical; Self-report
15-99
2886 9 [4] VA<6/12 AMR Colombia Coverage 468/1379 33.9% Total with need
Met 468/1379 33.9% Total with need
Unmet 911/1379 66.1% Total with need
Robinson et al, 2013[60]
None Cross-sectional
Clinical; Self-report
39-94
1345 10 PVA<6/12 AMR Canada Use 635/768 82.7% Total participants
Umar et al, 2015[61]
None Cross-sectional
Clinical 40-97
650 10 PVA<6/18 AFR Nigeria Coverage 5/635 0.8% Total participants
Met 1/635 0.2% Total participants
Under-met 5/635 0.8% Total participants
Unmet 192/635 30.2% Total participants
Abdullah et al, 2015[62]
None Cross-sectional
Clinical; Self-report
30+ 917 9 [2] VA<6/6 EMR Pakistan Use 90/528 17.0% Total with functional difficulty
Laitinen et al, 2005[63]
Health 2000 Survey
Cross-sectional
Clinical; Self-report
30+ 7413 10 PNVA<=6/24 EUR Finland Has AP 4586/6667 68.8% Total participants
BMJ Publishing Group Limited (BMJ) disclaims all liability and responsibility arising from any relianceSupplemental material placed on this supplemental material which has been supplied by the author(s) BMJ Global Health
doi: 10.1136/bmjgh-2021-007662:e007662. 7 2022;BMJ Global Health, et al. Danemayer J

30
He et al, 2012[64]
None Cross-sectional
Clinical 35+ 17734 9 [4] UCNVA<=6/12 AFR Niger Met 60/673 8.9% Total with need
AFR Niger Unmet 613/673 91.1% Total with need
UCNVA<=6/12; AP Use
AFR Niger Use 79/869 9.1% Total with functional difficulty
UCNVA<=6/12 AFR South Africa Met 27/1521 1.8% Total with need
AFR South Africa Unmet 1494/1521 98.2% Total with need
UCNVA<=6/12; AP Use
AFR South Africa Use 15/1687 0.9% Total with functional difficulty
UCNVA<=6/12 AMR United States
Met 315/450 70.0% Total with need
AMR United States
Unmet 135/450 30.0% Total with need
UCNVA<=6/12; AP Use
AMR United States
Use 147/476 30.9% Total with functional difficulty
UCNVA<=6/12 SEAR India Met 92/1568 5.9% Total with need
SEAR India Unmet 1476/1568 94.1% Total with need
UCNVA<=6/12; AP Use
SEAR India Use 31/2169 1.4% Total with functional difficulty
UCNVA<=6/12 SEAR Nepal Met 56/1277 4.4% Total with need
SEAR Nepal Unmet 1221/1277 95.6% Total with need
UCNVA<=6/12; AP Use
SEAR Nepal Use 34/1448 2.3% Total with functional difficulty
UCNVA<=6/12 WPR China (Guangzhou)
Met 643/948 67.8% Total with need
WPR China (Guangzhou)
Unmet 305/948 32.2% Total with need
BMJ Publishing Group Limited (BMJ) disclaims all liability and responsibility arising from any relianceSupplemental material placed on this supplemental material which has been supplied by the author(s) BMJ Global Health
doi: 10.1136/bmjgh-2021-007662:e007662. 7 2022;BMJ Global Health, et al. Danemayer J

31
UCNVA<=6/12; AP Use
WPR China (Guangzhou)
Use 657/1101 59.7% Total with functional difficulty
UCNVA<=6/12 WPR China (Shunyi)
Met 3/1718 0.2% Total with need
WPR China (Shunyi)
Unmet 1715/1718 99.8% Total with need
UCNVA<=6/12; AP Use
WPR China (Shunyi)
Use 2/2435 0.1% Total with functional difficulty
He et al, 2014 (a)[65]
None Cohort Clinical; Self-report
35+ 10553 9 [4] UCVA<=6/12 SEAR India Met 175/937 18.7% Total with functional difficulty
Nepal Met 122/942 13.0% Total with functional difficulty
WPR China (Guangzhou)
Met 321/459 69.9% Total with functional difficulty
China (Shunyi)
Met 4/607 0.7% Total with functional difficulty
Hookway et al, 2016[66]
None Cross-sectional
Clinical; Self-report
35+
3390 8 [4, 9] UCVA<=6/12
AMR Nicaragua
Uncorrected refractive error
1676/1871 89.6% Total participants
Naidoo et al, 2013[67]
None Cross-sectional
Clinical; Self-report
35+ 1939 9 [4] VA<6/12 AFR South Africa Coverage 72/1488 4.8% Total with need
Met 72/1939 3.7% Total participants
Unmet 1416/1939 73.0% Total participants
Ntodie et al, 2017[68]
None Cross-sectional
Clinical; Self-report
35+ 576 10 VA<=6/18; NV<=N8
AFR Ghana Coverage 125/500 25.0% Total participants
Has AP 125/376 33.2% Total with functional difficulty
Met 56/500 11.2% Total participants
BMJ Publishing Group Limited (BMJ) disclaims all liability and responsibility arising from any relianceSupplemental material placed on this supplemental material which has been supplied by the author(s) BMJ Global Health
doi: 10.1136/bmjgh-2021-007662:e007662. 7 2022;BMJ Global Health, et al. Danemayer J

32
Under-met 69/500 13.8% Total participants
Unmet 251/500 50.2% Total participants
Sapkota et al, 2012[69]
None Cross-sectional
Clinical 35+ 2156 9 [4] UCNVA<=6/12 SEAR Nepal Met 56/1448 3.9% Total with functional difficulty
Unmet 1221/1448 84.3% Total with functional difficulty
Uche et al, 2014[70]
None Cross-sectional
Clinical; Self-report
35+ 720 10 NVA<N8 AFR Nigeria Coverage 103/371 27.8% Total need
Met 103/585 17.6% Total participants
Unmet 268/585 45.8% Total participants
Cheng et al, 2016[71]
None Cross-sectional
Clinical 40+ 5197 10 PVA<6/12 WPR China Coverage 211/4144 5.1% Total with functional difficulty
Gupta et al, 2015[72]
RAVI Cross-sectional
Clinical; Self-report
40+ 2331 10 PVA<6/18; PNVA<N8
SEAR India Use 397/798 49.7% Total with functional difficulty
Laviers et al, 2010[73]
RAAB Cross-sectional
Clinical; Self-report
40+ 381 9 [4] VA<6/18 AFR Tanzania Coverage 60/340 17.6% Total with need
Met 60/340 17.6% Total with need
Unmet 280/340 82.4% Total with need
Lu et al, 2011[74]
None Cross-sectional
Clinical; Self-report
40+ 1008 10 PVA<6/12 WPR China Coverage 343/666 51.5% Total with need
Met 343/666 51.5% Total with need
Unmet 323/666 48.5% Total with need
Mansberger, 2005[75]
None Cross-sectional
Clinical 40+ 288 7 [2, 4, 9]
PNVA<= Jaeger 4
AMR United States
Uncorrected refractive error
88/288 30.6% Total participants
Marmamula et al, 2012[76]
RAVI Cross-sectional
Clinical; Self-report
40+ 1700 9 [4] PVA<6/18; PNVA<N8
SEAR India Coverage 55/494 11.1% Total with need
BMJ Publishing Group Limited (BMJ) disclaims all liability and responsibility arising from any relianceSupplemental material placed on this supplemental material which has been supplied by the author(s) BMJ Global Health
doi: 10.1136/bmjgh-2021-007662:e007662. 7 2022;BMJ Global Health, et al. Danemayer J

33
Met 55/1094 5.0% Total with functional difficulty
Unmet 439/1094 40.1% Total with functional difficulty
Marmamula et al, 2013 (b)[77]
None Cross-sectional
Clinical; Self-report
40+ 2848 9 [4] PVA<6/18; UCNVA<N8
SEAR India Coverage 654/1513 43.2% Total with need
Met 654/2448 26.7% Total participants
Under-met 78/859 9.1% Total with functional difficulty
Unmet 859/2448 35.1% Total participants
Marmamula et al, 2014[78]
None Cross-sectional
Clinical; Self-report
40+ 7378 9 [4] VA<6/12; UCNVA<N8
SEAR India Coverage 939/3483 27.0% Total with need
Met 939/7378 12.7% Total participants
Unmet 2544/7378 34.5% Total participants
Marmamula et al, 2017 (a)[79]
RAVI Cross-sectional
Clinical 40+ 5881 10 PNVA<6/12 SEAR India Coverage 988/3734 26.5% Total with need
Met 988/5140 19.2% Total participants
Need 2996/5140 58.3% Total participants
Unmet 2746/5140 53.4% Total participants
Ramke et al, 2007[80]
RACSS Cross-sectional
Clinical; Self-report
40+ 1414 10 VA<N8 SEAR Timor-Leste Met 162/1414 11.5% Total participants
Unmet 457/1414 32.3% Total participants
Cunha et al, 2018[81]
None Cross-sectional
Clinical 45+ 2041 9 [1] UCNVA<=6/18 AMR Brazil Use 229/2025 11.3% Total participants
Sherwin et al, 2008[82]
Nakuru District Blindness Study;
Cross-sectional
Clinical; Self-report
50+ 134 8 [4, 8] NVA<N8 AFR Kenya Coverage 7/111 6.3% Total with need
BMJ Publishing Group Limited (BMJ) disclaims all liability and responsibility arising from any relianceSupplemental material placed on this supplemental material which has been supplied by the author(s) BMJ Global Health
doi: 10.1136/bmjgh-2021-007662:e007662. 7 2022;BMJ Global Health, et al. Danemayer J

34
Rift Blindness Study
Met 7/130 5.4% Total participants
Under-met 2/130 1.5% Total participants
Unmet 102/130 78.5% Total participants
Use 9/130 6.9% Total participants
Zebardast et al, 2017[83]
National Health and Nutritional Examination Survey
Cross-sectional
Clinical; Self-report
50+ 11016 9 [8] PNVA<6/12; RAL
AMR United States
Unmet 1476/11009 13.4% Total with functional difficulty
Use 9533/11009 86.6% Total with functional difficulty
Otte et al, 2018[84]
National Health and Aging Trends Study
Secondary cross-sectional
Self-report 65+ 7497 10 RAL; AP use AMR United States
Under-met 1.2/37.2* 3.2% Total with AP
Distance glasses
Kodjebacheva et al, 2011[85]
UCLA Mobile Eye Clinic Study
Cross-sectional
Clinical 5-7 11332 10 PDVA<6/12 AMR United States
Uncorrected refractive error
858/11332 7.6% Total participants
Naidoo et al, 2016[86]
RARE Cross-sectional
Self-report 15-36
1516 10 AP use AFR South Africa Use 32/58 55.2% Total with AP
Marmamula et al, 2013 (b)[77]
RARE Cross-sectional
Clinical 15-49
3095 9 [4] PVA<=6/12 SEAR India Use 130/325 40.0% Total with AP
Loughman et al, 2015[54]
RARE Cross-sectional
Clinical; Self-report
15-50
3457 9 [4] DVA<6/12; NVA<6/12
AFR Mozambique Coverage 0/90 0.0% Total with functional difficulty
Uncorrected refractive error
90/3452 2.6% Total participants
BMJ Publishing Group Limited (BMJ) disclaims all liability and responsibility arising from any relianceSupplemental material placed on this supplemental material which has been supplied by the author(s) BMJ Global Health
doi: 10.1136/bmjgh-2021-007662:e007662. 7 2022;BMJ Global Health, et al. Danemayer J

35
Marmamula et al, 2009[55]
RARE Cross-sectional
Clinical; Self-report
15-50
3203 10 UCVA<6/12; UCNVA<N8
SEAR India Coverage 58/200 29.0% Total with need
Met 58/3203 1.8% Total participants
Need 200/3203 6.2% Total participants
Uncorrected refractive error
96/109 88.1% Total with functional difficulty
Unmet 142/3203 4.4% Total participants
Use 142/371 38.3% Total with AP
Taylor et al, 2010[56]
National Indigenous Eye Health Survey
Cross-sectional
Clinical 5-89 2883 10 PVA<6/12 WPR Australia Use 513/3019 17.0% Total participants
Ramke et al, 2012[57]
RAAB; Timor-Leste Eye Health Survey
Cross-sectional
Clinical; Self-report
0-100
2014 10 PVA<6/18 SEAR Timor-Leste Coverage 71/291 24.4% Total need
Met 71/2014 3.5% Total participants
Unmet 220/2014 10.9% Total participants
Boggs et al, 2019[22]
WGQ Child Functioning Module; WGQ Extended set
Secondary cross-sectional
Clinical; Self-report
0+ 7135 8 [4, 8] VA<6/18; RAL AFR Cameroon Coverage 10/27 37.0% Total with need
Need 27/3572 0.8% Total participants
Uncorrected refractive error
17/3572 0.5% Total participants
BMJ Publishing Group Limited (BMJ) disclaims all liability and responsibility arising from any relianceSupplemental material placed on this supplemental material which has been supplied by the author(s) BMJ Global Health
doi: 10.1136/bmjgh-2021-007662:e007662. 7 2022;BMJ Global Health, et al. Danemayer J

36
Unmet 17/27 63.0% Total with need
Use 10/3572 0.3% Total participants
SEAR India Coverage 114/131 87.0% Total with need
Need 131/3563 3.7% Total participants
Uncorrected refractive error
17/3563 0.5% Total participants
Unmet 17/131 13.0% Total with need
Use 114/3563 3.2% Total participants
Casas Luque et al, 2019[59]
RARE Cross-sectional
Clinical; Self-report
15-99
2886 9 [4] UCVA<6/12 AMR Colombia Coverage 288/566 50.9% Total with need
Met 288/566 50.9% Total with need
Uncorrected refractive error
360/2877 12.5% Total participants
Unmet 278/566 49.1% Total with need
Goujon et al, 2010[87]
National Indigenous Eye Health Study
Cross-sectional
Clinical; Self-report
5+ 2883 8 [3, 9] PVA<6/12; RAL
WPR Australia Coverage 389/467 83.3% Total with need
Met 389/488 79.7% Total with functional difficulty
Under-met 32/488 6.6% Total with functional difficulty
Unmet 46/488 9.4% Total with functional difficulty
Use 243/440 55.2% Total with
BMJ Publishing Group Limited (BMJ) disclaims all liability and responsibility arising from any relianceSupplemental material placed on this supplemental material which has been supplied by the author(s) BMJ Global Health
doi: 10.1136/bmjgh-2021-007662:e007662. 7 2022;BMJ Global Health, et al. Danemayer J

37
functional difficulty
Vitale et al, 2006 (a)[88]
National Health and Aging Trends Study
Secondary cross-sectional
Clinical; Self-report
12+ 15193 10 PVA<=6/12 AMR United States
Use 4054/13075 31.0% Total participants
Malhotra et al, 2019[89]
None Cross-sectional
Clinical; Self-report
14+ 6910 9 [10] PVA<6/12 SEAR India Coverage 374/1122 33.3% Total with need
Met 374/1122 33.3% Total with need
Need 1122/6910 16.2% Total participants
Unmet 748/6910 10.8% Total participants
Use 520/6910 7.5% Total participants
Robinson et al, 2013[60]
None Cross-sectional
Clinical; Self-report
39-94
1345 10 PVA<6/12 AMR Canada Use 523/768 68.1% Total participants
Foreman et al, 2017 (a)[90]
National Eye Health Survey
Cross-sectional
Clinical 40-98
4836 9 [9] PDVA<6/12 WPR Australia Uncorrected refractive error
243/396 61.4% Total with functional difficulty
Laitinen et al, 2005[63]
Health 2000 Survey
Cross-sectional
Clinical; Self-report
30+ 7413 10 PVA<=6/24 EUR Finland Has AP 3497/6771 51.6% Total participants
Use 3419/3497 97.8% Total with AP
Shah et al, 2008[91]
National Blindness and Visual difficulty Survey
Cross-sectional
Clinical 30+ 16507 10 PVA<6/12 EMR Pakistan Coverage 293/1936 15.1% Total with need
Met 293/13981 2.1% Total participants
Need 1936/13981 13.8% Total participants
Under-met 296/1148 25.8% Total with AP
BMJ Publishing Group Limited (BMJ) disclaims all liability and responsibility arising from any relianceSupplemental material placed on this supplemental material which has been supplied by the author(s) BMJ Global Health
doi: 10.1136/bmjgh-2021-007662:e007662. 7 2022;BMJ Global Health, et al. Danemayer J

38
Unmet 1347/13981 9.6% Total participants
Use 1148/16484 7.0% Total participants
Ramsewak et al, 2016[92]
National Blindness and Low Vision Prevalence Survey of Bangladesh
Cross-sectional
Clinical; Self-report
40-103
2515 10 RE subsets AMR Trinidad and Tobago
Uncorrected refractive error
1107/2515 44.0% Total participants
Use 1349/3597 37.5% Total participants
He et al, 2012[64]
None Cross-sectional
Clinical 35+ 17734 9 [4] UCNVA<=6/12; AP use
AFR Niger Use 11/869 1.3% Total with functional difficulty
South Africa Use 66/1687 3.9% Total with functional difficulty
AMR United States
Use 4/476 0.8% Total with functional difficulty
SEAR India Use 8/2169 0.4% Total with functional difficulty
Nepal Use 48/1448 3.3% Total with functional difficulty
WPR China (Guangzhou)
Use 53/1101 4.8% Total with functional difficulty
China (Shunyi)
Use 23/2435 0.9% Total with functional difficulty
Foreman et al, 2017 (b)[93]
National Eye Health Survey
Cross-sectional
Clinical; Self-report
40+ 4836 10 PVA<6/12 WPR Australia Met 2330/2570 90.7% Total with need
BMJ Publishing Group Limited (BMJ) disclaims all liability and responsibility arising from any relianceSupplemental material placed on this supplemental material which has been supplied by the author(s) BMJ Global Health
doi: 10.1136/bmjgh-2021-007662:e007662. 7 2022;BMJ Global Health, et al. Danemayer J

39
Need 2570/4836 53.1% Total participants
Uncorrected refractive error
240/4836 5.0% Total participants
Under-corrected refractive error
175/240 72.9% Total with unmet need
Unmet 240/2570 9.3% Total with need
Use 2505/4836 51.8% Total participants
Gilbert et al, 2018[94]
Sri Lanka National Survey of Blindness and Visual difficulty
Cross-sectional
Clinical; Self-report
40+ 6713 8 [4, 10]
PVA<6/12 SEAR Sri Lanka Coverage 254/1435 17.7% Total with need
Met 254/1435 17.7% Total with need
Need 1435/5179 27.7% Total participants
Unmet 1181/1435 82.3% Total with need
Mansberger, 2005[75]
None Cross-sectional
Clinical 40+ 288 7 [2, 4, 9]
PVA<=6/12 AMR United States
Uncorrected refractive error
52/288 18.1% Total participants
Marmamula et al, 2014[78]
None Cross-sectional
Clinical; Self-report
40+ 7378 9 [4] VA<6/12; PNVA<N8
SEAR India Coverage 361/951 38.0% Total with need
Met 361/951 38.0% Total with need
Unmet 590/951 62.0% Total with need
Marmamula et al, 2016 (a)[95]
RAVI Cross-sectional
Clinical 40+ 6150 10 PVA<6/18; AP use
SEAR India Use 1694/5881 28.8% Total participants
Cunha et al, 2018[81]
None Cross-sectional
Clinical 45+ 2041 9 [1] UCNVA<=6/18 AMR Brazil Use 23/2025 1.1% Total participants
BMJ Publishing Group Limited (BMJ) disclaims all liability and responsibility arising from any relianceSupplemental material placed on this supplemental material which has been supplied by the author(s) BMJ Global Health
doi: 10.1136/bmjgh-2021-007662:e007662. 7 2022;BMJ Global Health, et al. Danemayer J

40
Flaxman et al, 2017[96]
None Secondary cross-sectional
Multiple secondary sources
50+ 3983541
10 PVA<6/18
Andean Latin America
Uncorrected refractive error
Not provided
46.1% Total population
Australasia
Uncorrected refractive error
Not provided
49.3% Total population
Caribbean
Uncorrected refractive error
Not provided
47.9% Total population
Central Asia
Uncorrected refractive error
Not provided
48.3% Total population
Central Europe
Uncorrected refractive error
Not provided
49.4% Total population
Central Latin america
Uncorrected refractive error
Not provided
47.9% Total population
Central Sub-Saharan Africa
Uncorrected refractive error
Not provided
46.5% Total population
East Asia
Uncorrected refractive error
Not provided
47.1% Total population
East Sub-Saharan Africa
Uncorrected refractive error
Not provided
46.8% Total population
Eastern Europe
Uncorrected refractive error
Not provided
48.5% Total population
Global Uncorrected refractive error
Not provided
53.8% Total population
HI Asia Pacific
Uncorrected refractive error
Not provided
49.4% Total population
BMJ Publishing Group Limited (BMJ) disclaims all liability and responsibility arising from any relianceSupplemental material placed on this supplemental material which has been supplied by the author(s) BMJ Global Health
doi: 10.1136/bmjgh-2021-007662:e007662. 7 2022;BMJ Global Health, et al. Danemayer J

41
HI North America
Uncorrected refractive error
Not provided
49.5% Total population
North Africa and Middle East
Uncorrected refractive error
Not provided
44.6% Total population
Oceania Uncorrected refractive error
Not provided
47.8% Total population
South Asia
Uncorrected refractive error
Not provided
66.4% Total population
Southeast Asia
Uncorrected refractive error
Not provided
46.1% Total population
Southern Latin America
Uncorrected refractive error
Not provided
48.2% Total population
Southern Sub-Saharan Africa
Uncorrected refractive error
Not provided
48.1% Total population
Tropical Latin America
Uncorrected refractive error
Not provided
49.3% Total population
West Sub-Saharan Africa
Uncorrected refractive error
Not provided
46.4% Total population
Western Europe
Uncorrected refractive error
Not provided
49.6% Total population
Malhotra et al, 2018[97]
None Cross-sectional
Clinical 50+ 1690 10 PVA<6/18 SEAR India Uncorrected refractive
192/386 49.7% Total with functional
BMJ Publishing Group Limited (BMJ) disclaims all liability and responsibility arising from any relianceSupplemental material placed on this supplemental material which has been supplied by the author(s) BMJ Global Health
doi: 10.1136/bmjgh-2021-007662:e007662. 7 2022;BMJ Global Health, et al. Danemayer J

42
error difficulty
Murthy et al, 2010[98]
None Cross-sectional
Clinical 50+ 5158 10 VA<6/9.5 SEAR India Use 817/4738 17.2% Total participants
Zebardast et al, 2017[83]
National Health and Nutritional Examination Survey
Cross-sectional
Clinical; Self-report
50+ 11016 9 [8] PVA<6/12; RAL
AMR United States
Uncorrected refractive error
985/11016 8.9% Total participants
Zhao et al, 2010[99]
China Nine-Province Eye Survey
Cross-sectional
Clinical 50+ 46097 10 VA<=6/12 WPR China Met 134/287 46.7% Total with AP
Need 6592/45747 14.4% Total participants
Unmet 6458/6592 98.0% Total with need
Use 287/45747 0.6% Total participants
Otte et al, 2018[84]
National Health and Aging Trends Study
Secondary cross-sectional
Self-report 65+ 7497 10 RAL; AP use AMR United States
Under-met 2.7/27* 10.0% Total with AP
Naël et al, 2019[100]
Alienor Study
Cross-sectional
Clinical; Self-report
78+ 707 9 [2] PVA<6/12 EUR France Uncorrected refractive error
274/707 38.8% Total participants
Use 540/707 76.4% Total participants
ATA-N=Assistive Technology Assessment-Needs. RAAB=Rapid Assessment of Avoidable Blindness. RAD=Rapid Assessment of Disability. RARE=Rapid Assessment of Refractive Error. RAVI=Rapid Assessment of Visual Impairment. WGQ=Washington Group Questions. RAL=self-reported activity limitations. RE=refractive error. VA=visual acuity. PVA=presenting visual acuity. UCVA=uncorrected visual acuity. DVA=distance visual acuity. NVA=near visual acuity. PNVA=presenting near visual acuity. UCNVA=uncorrected near visual acuity.
*Results are presented in millions.
Appendix 10: Grouped Glasses Indicators
BMJ Publishing Group Limited (BMJ) disclaims all liability and responsibility arising from any relianceSupplemental material placed on this supplemental material which has been supplied by the author(s) BMJ Global Health
doi: 10.1136/bmjgh-2021-007662:e007662. 7 2022;BMJ Global Health, et al. Danemayer J

43
AP Type Citation
Tool,
Survey, or
Dataset
Study
Design Approaches Ages
Participant
s
JBI
Score
Functional
Difficulty
Threshold
WHO
Regio
n
Country
AP access Indicator
Indicato
r Calculation (%)
Denomi
nator
Bifocals
Marmamula et al, 2013 (a)[51]
RARE Cross-sectional
Clinical 15-49 3095 9 [4] PVA<=6/12 SEAR India Use 181/325 55.7% Total with AP
Marmamula et al, 2009[55]
RARE Cross-sectional
Clinical; Self-report
15-50 3203 10 UCVA<6/12; UCNVA<N8
SEAR India Use 214/371 57.7% Total with AP
Gupta et al, 2015[72]
RAVI Cross-sectional
Clinical; Self-report
40+ 2331 10 AP use SEAR India Use 314/468 67.1% Total with AP
Glasses (General, unspecified, grouped)
Friedman et al, 2008[101]
Baltimore Pediatric Eye Disease Study
Cross-sectional
Clinical; Self-report
0-6 2546 10 VA<6/12 AMR United States
Has AP 26/2546 1.0% Total participants
Giordano et al, 2009[102]
Baltimore Pediatric Eye Disease Study
Cross-sectional
Clinical 1-6 2298 8 [2, 10]
RE subsets AMR United States
Need 116/2298 5.0% Total participants
Use 29/2298 1.3% Total participants
Pai et al, 2011[103]
Sydney Pediatric Eye Disease Study
Cross-sectional
Clinical; Self-report
1-6 2461 10 PVA<6/12 WPR Australia
Uncorrected refractive error
53/76 69.7%
Total with functional difficulty
Hendler et al, 2016[104]
None Cross-sectional
Clinical 3-5 11260 9 [2] RE subsets AMR United States
Under-met
174/1007 17.3%
Total with functional difficulty
Unmet 740/1007 73.5% Total
BMJ Publishing Group Limited (BMJ) disclaims all liability and responsibility arising from any relianceSupplemental material placed on this supplemental material which has been supplied by the author(s) BMJ Global Health
doi: 10.1136/bmjgh-2021-007662:e007662. 7 2022;BMJ Global Health, et al. Danemayer J

44
with functional difficulty
Margines et al, 2020[105]
None Cross-sectional
Clinical 3-5 79451 10 RE subsets AMR United States
Need 5883/8101 72.6%
Total with functional difficulty
Mehravaran et al, 2016[106]
None Cross-sectional
Clinical; Self-report
3-5 11260 9 [2] RE subsets AMR United States
Use 429/489 87.7%
Total participants (at follow-up)
Zhang et al, 2018[107]
Nanjing Eye Study
Cohort Clinical 4-5 1986 9 [2] UCVA<6/12 WPR China
Uncorrected refractive error
61/78 78.2%
Total with functional difficulty
Use 89/1961 4.5% Total participants
Ma et al, 2016[108]
Shanghai Children Eye Study
Cross-sectional
Clinical 3-10 8267 9 [1] UCVA<=6/12
WPR China Need 2346/2517 93.2%
Total with functional difficulty
Use 555/8196 6.8% Total participants
Robaei et al, 2005[109]
Sydney Myopia Study
Cross-sectional
Clinical; Self-report
5-8 1740 9 [9] UCVA<6/12 WPR Australia Met 28/77 36.4% Total with AP
Need 77/1738 4.4% Total participants
Under-met
23/77 29.9% Total with AP
Unmet 26/1738 1.5% Total
BMJ Publishing Group Limited (BMJ) disclaims all liability and responsibility arising from any relianceSupplemental material placed on this supplemental material which has been supplied by the author(s) BMJ Global Health
doi: 10.1136/bmjgh-2021-007662:e007662. 7 2022;BMJ Global Health, et al. Danemayer J

45
participants
Use 77/1738 4.4% Total participants
He et al, 2014 (b)[110]
None Cross-sectional
Clinical; Self-report
2-12 9512 10 UCVA<6/12 WPR China
Uncorrected refractive error
1795/2006 89.5%
Total with functional difficulty
Under-met
81/311 26.0% Total with AP
Use 311/2006 15.5%
Total with functional difficulty
Hashemi et al, 2017 (a)[111]
None Cross-sectional
Clinical 7 4106 10 RE subsets EMR Iran Coverage 56/168 33.3% Total participants
Met 56/4072 1.4% Total participants
Need 168/4072 4.1% Total participants
Unmet 112/4072 2.8% Total participants
Gursoy et al, 2013[112]
None Cross-sectional
Clinical; Self-report
7-8 721 9 [2] RE subsets EUR Turkey Need 145/709 20.5% Total participants
Unmet 80/145 55.2% Total with need
Use 65/145 44.8% Total with need
BMJ Publishing Group Limited (BMJ) disclaims all liability and responsibility arising from any relianceSupplemental material placed on this supplemental material which has been supplied by the author(s) BMJ Global Health
doi: 10.1136/bmjgh-2021-007662:e007662. 7 2022;BMJ Global Health, et al. Danemayer J

46
Casson et al, 2012[113]
Refractive Error Study in Children
Cross-sectional
Clinical 6-11 2899 9 [8] PVA<6/12 WPR Laos
Uncorrected refractive error
112/2842 3.9% Total participants
Use 0/2869 0.0% Total participants
Hashim et al, 2008[114]
None Cross-sectional
Clinical 6-12 705 10 UCVA<=6/12
WPR Malaysia Met 24/49 49.0%
Total with functional difficulty
Unmet 25/49 51.0%
Total with functional difficulty
Aldebasi, 2014[115]
None Cross-sectional
Clinical 6-13 5176 10 RE subsets EMR Saudi Arabia
Met 92/5176 1.8% Total participants
Uncorrected refractive error
846/5176 16.3% Total participants
Under-corrected refractive error
25/5176 0.5% Total participants
Choy et al, 2020[116]
None Cross-sectional
Clinical; Self-report
6-13 1396 8 [2, 6]
RE subsets WPR China Use 247/759 32.5%
Total with functional difficulty
Harrington et al, 2019[117]
Ireland Eye Study
Cross-sectional
Clinical; Self-report
6-13 901 10 VA<6/12 EUR Ireland Has AP 311/1626 19.1% Total participants
Use 164/1626 10.1% Total participants
BMJ Publishing Group Limited (BMJ) disclaims all liability and responsibility arising from any relianceSupplemental material placed on this supplemental material which has been supplied by the author(s) BMJ Global Health
doi: 10.1136/bmjgh-2021-007662:e007662. 7 2022;BMJ Global Health, et al. Danemayer J

47
O'Donoghue et al, 2010[118]
Northern Ireland Childhood Errors of Refraction Study
Cross-sectional
Clinical; Self-report
6-13 1053 10 VA<6/12 EUR United Kingdom
Uncorrected refractive error
271/1051 25.8% Total participants
Use 217/1053 20.6% Total participants
Al Wadaani et al, 2012[119]
None Cross-sectional
Clinical; Self-report
6-14 2002 9 [4] PVA<6/18 EMR Saudi Arabia
Use 26/274 9.5%
Total with functional difficulty
Gupta et al, 2012[120]
None Cross-sectional
Clinical; Self-report
5-15 2000 9 [10] VA<6/9 SEAR India
Uncorrected refractive error
84/2000 4.2% Total participants
Hameed, 2016[121]
None Cross-sectional
Clinical 5-15 1644 9 [2] VA<6/9 EMR Pakistan Use 92/1644 5.6% Total participants
He et al, 2004[122]
None Cross-sectional
Clinical; Self-report
5-15 4364 10 VA<6/9.5 WPR China
Uncorrected refractive error
1272/1364 93.3%
Total with functional difficulty
Use 800/4364 18.3% Total participants
He et al, 2005[123]
None Cross-sectional
Clinical; Self-report
5-15 5053 10 VA<=6/12 WPR China Coverage 684/919 (74.4) Total with need
Need 919/4359 (21.1) Total participants
Under-met
190/635 (29.9) Total with AP
Unmet 455/919 (50.6) Total with
BMJ Publishing Group Limited (BMJ) disclaims all liability and responsibility arising from any relianceSupplemental material placed on this supplemental material which has been supplied by the author(s) BMJ Global Health
doi: 10.1136/bmjgh-2021-007662:e007662. 7 2022;BMJ Global Health, et al. Danemayer J

48
need
Kassa et Alene, 2003[124]
None Cross-sectional
Clinical; Self-report
5-15 1156 9 [10] VA<6/12 AFR Ethiopia Need 86/1134 7.6% Total participants
Hu et al, 2019[125]
None Cross-sectional
Clinical 9-12 10234 10 UCVA<=6/12
WPR China Has AP 101/768 13.2% Total with need
Need 768/10037 7.7% Total participants
Kaur et al, 2016[126]
None Cross-sectional
Clinical; Self-report
5-16 30205 8 [4, 10]
VA<6/9 SEAR India Need 1581/30298 5.2% Total participants
Dandona et al, 2002[127]
None Cross-sectional
Clinical 7-15 4074 10 VA<6/12 SEAR India Has AP 23/4074 0.6% Total participants
Falkenberg et al, 2019[128]
None Secondary cross-sectional
Self-report 7-15 782 9 [2] RE subsets EUR Norway Need 384/650 59.1% Total referred
Goh et al, 2004[129]
None Cross-sectional
Clinical 7-15 4634 10 VA<6/9.5 WPR Malaysia Met 323/723 44.7% Total with need
Need 723/789 91.6%
Total with functional difficulty
Unmet 400/723 55.3% Total with need
Use 443/4615 9.6% Total participants
Kedir et Girma, 2014[130]
None Cross-sectional
Clinical 7-15 592 9 [10] VA<=6/18 AFR Ethiopia Use 0/20 0.0%
Total with functional difficulty
BMJ Publishing Group Limited (BMJ) disclaims all liability and responsibility arising from any relianceSupplemental material placed on this supplemental material which has been supplied by the author(s) BMJ Global Health
doi: 10.1136/bmjgh-2021-007662:e007662. 7 2022;BMJ Global Health, et al. Danemayer J

49
Pavithra et al, 2014[131]
None Cross-sectional
Clinical 7-15 1378 9 [4] VA<6/12 SEAR India Use 48/83 57.8%
Total with functional difficulty
Wang et al, 2015[132]
None Cross-sectional
Clinical 10-12 4376 10 RE subsets WPR China Need 674/850 79.3%
Total with functional difficulty
Use 159/674 23.6% Total with need
Yekta et al, 2010[133]
None Cross-sectional
Clinical; Self-report
7-15 1872 10 VA<=6/12 EMR Iran
Uncorrected refractive error
121/1872 6.5% Total participants
Zhu et al, 2019[134]
Refractive Error Study in Children
Secondary cross-sectional
Clinical 5-17 13702 10 UCVA<=6/12
WPR China Need 4743/12334 38.5% Total participants
Li et al, 2014[135]
Heilongjiang Eye Study
Cross-sectional
Clinical 5-18 1700 10 VA<6/9.5 WPR China Has AP 20/1675 1.2% Total participants
Barria et al, 2018[136]
Refractive Error Study in Children
Cross-sectional
Clinical 5-19 5412 10 VA<=6/12 AMR Chile Need 476/691 68.9%
Total with functional difficulty
Use 521/5412 9.6%
Total with functional difficulty
Robaei et al, 2006 (a)[137]
Sydney Childhood Eye Study
Cross-sectional
Clinical 11-13 2353 10 VA<6/12 WPR Australia Need 96/117 82.1%
Total with functional difficulty
BMJ Publishing Group Limited (BMJ) disclaims all liability and responsibility arising from any relianceSupplemental material placed on this supplemental material which has been supplied by the author(s) BMJ Global Health
doi: 10.1136/bmjgh-2021-007662:e007662. 7 2022;BMJ Global Health, et al. Danemayer J

50
Under-met
8/117 6.8%
Total with functional difficulty
Robaei et al, 2006 (b)[138]
Sydney Childhood Eye Study
Cross-sectional
Clinical; Self-report
12-12 2353 10 PVA<6/12 WPR Australia Met 403/2353 17.1% Total participants
Under-met
37/2353 1.6% Total with AP
Unmet 8/2353 0.3%
Total with functional difficulty
Use 440/2353 18.7% Total participants
Yamamah et al, 2015[139]
None Cross-sectional
Clinical; Self-report
7-17 2070 10 VA<6/9 EMR Egypt Need 218/2070 10.5% Total participants
Use 34/2070 1.6% Total participants
Mehari et al, 2013[140]
None Cross-sectional
Clinical; Self-report
7-18 5470 10 PVA<=6/12 AFR Ethiopia Met 7/11 63.6% Total with AP
Under-met
4/11 36.4% Total with AP
Use 11/4238 0.3% Total participants
Plainis et al, 2009[141]
None Cross-sectional
Clinical; Self-report
10-15 898 9 [2] VA<6/12 EUR Bulgaria Use 27/310 8.7% Total participants
Greece Use 137/588 23.3% Total participants
BMJ Publishing Group Limited (BMJ) disclaims all liability and responsibility arising from any relianceSupplemental material placed on this supplemental material which has been supplied by the author(s) BMJ Global Health
doi: 10.1136/bmjgh-2021-007662:e007662. 7 2022;BMJ Global Health, et al. Danemayer J

51
Sapkota et al, 2008[142]
None Cross-sectional
Clinical; Self-report
10-15 4282 10 VA<6/9.5 SEAR Nepal
Uncorrected refractive error
3483/4282 81.3% Total participants
Use 615/4282 14.4% Total participants
Salomão et al, 2008[143]
None Cross-sectional
Clinical 11-14 2441 10 VA<=6/12 AMR Brazil Met 52/118 44.1%
Total with functional difficulty
Under-met
11/118 9.3%
Total with functional difficulty
Unmet 55/118 46.6%
Total with functional difficulty
Use 63/118 53.4%
Total with functional difficulty
Arafa et al, 2019[144]
None Cross-sectional
Clinical; Self-report
12-14 472 10 VA<6/9 EMR Egypt Use 69/469 14.7% Total participants
Gao et al, 2012[145]
Refractive Error Study in Children
Cross-sectional
Clinical 12-14 5527 10 UCVA<=6/12
WPR Cambodia
Uncorrected refractive error
181/226 80.1%
Total with functional difficulty
Qian et al, 2018[146]
None Cross-sectional
Clinical; Self-report
13 2346 9 [2] UCVA<=6/12
WPR China Need 483/579 83.4%
Total with functional
BMJ Publishing Group Limited (BMJ) disclaims all liability and responsibility arising from any relianceSupplemental material placed on this supplemental material which has been supplied by the author(s) BMJ Global Health
doi: 10.1136/bmjgh-2021-007662:e007662. 7 2022;BMJ Global Health, et al. Danemayer J

52
difficulty
Uncorrected refractive error
579/2346 24.7% Total participants
Use 172/579 29.7%
Total with functional difficulty
Ajaiyeoba et al, 2007[147]
None Cross-sectional
Clinical 4-24 1144 8 [7, 9]
VA<6/18 AFR Nigeria Has AP 2/1144 0.2% Total participants
Need 15/1144 1.3% Total participants
Congdon et al, 2008 (a)[148]
None Cross-sectional
Clinical; Self-report
11-17 1945 10 UCVA<=6/12
WPR China Met 414/770 53.8%
Total with functional difficulty
Unmet 674/1892 35.6% Total participants
Use 500/1892 26.4% Total participants
Congdon et al, 2008 (b)[149]
Xichang Pediatric Refractive Error Study
Cross-sectional
Clinical; Self-report
11-17 1892 10 UCVA<=6/12
WPR China Has AP 647/1892 34.2% Total participants
Met 357/948 37.7%
Total with functional difficulty
Need 948/1892 50.1% Total participa
BMJ Publishing Group Limited (BMJ) disclaims all liability and responsibility arising from any relianceSupplemental material placed on this supplemental material which has been supplied by the author(s) BMJ Global Health
doi: 10.1136/bmjgh-2021-007662:e007662. 7 2022;BMJ Global Health, et al. Danemayer J

53
nts
Under-met
119/948 12.6%
Total with functional difficulty
Unmet 368/948 38.8%
Total with functional difficulty
Use 476/948 50.2%
Total with functional difficulty
Li et al, 2008[150]
Xichang Pediatric Refractive Error Study
Cross-sectional
Clinical; Self-report
11-17 1892 10 UCVA<=6/12
WPR China Met 210/597 35.2% Total with need
Need 597/1892 31.6% Total participants
Unmet 387/597 64.8% Total with need
Zhang et al, 2009[151]
See Well to Learn Well Project
Cross-sectional
Clinical; Self-report
14-15 3226 9 [4] PVA<6/12 WPR China Met 301/588 51.2%
Total with AP and complete data
Under-met
287/588 48.8%
Total with AP and complete data
Use 733/2905 25.2% Total participa
BMJ Publishing Group Limited (BMJ) disclaims all liability and responsibility arising from any relianceSupplemental material placed on this supplemental material which has been supplied by the author(s) BMJ Global Health
doi: 10.1136/bmjgh-2021-007662:e007662. 7 2022;BMJ Global Health, et al. Danemayer J

54
nts
He et al, 2007[152]
None Cross-sectional
Clinical; Self-report
13-17 2454 10 UCVA<6/12 WPR China Need 638/649 98.3%
Total with functional difficulty
Under-met
51/638 8.0% Total with need
Unmet 387/638 60.7% Total with need
Use 302/649 46.5%
Total with functional difficulty
Abu et al, 2015[153]
None Cross-sectional
Clinical 9-22 1252 9 [4] VA<=6/12 AFR Ghana Need 37/1029 3.6% Total participants
Use 7/1029 0.7% Total participants
Alsaqr et al, 2018[154]
None Cross-sectional
Clinical; Self-report
12-20 1007 9 [4] RE subsets EMR Saudi Arabia
Use 242/555 43.6%
Total with functional difficulty
Zhao et al, 2020[155]
None Cross-sectional
Clinical; Self-report
16-17 5583 9 [2] PVA<=6/12 WPR China Has AP 2763/4026 68.6%
Total with functional difficulty
Need 4026/5583 72.1% Total participants
Under-met
994/2763 36.0% Total with AP
BMJ Publishing Group Limited (BMJ) disclaims all liability and responsibility arising from any relianceSupplemental material placed on this supplemental material which has been supplied by the author(s) BMJ Global Health
doi: 10.1136/bmjgh-2021-007662:e007662. 7 2022;BMJ Global Health, et al. Danemayer J

55
Wu et al, 2015[156]
None Cross-sectional
Clinical 16-18 4798 9 [4] RE subsets WPR China Unmet 740/3773 19.6%
Total with functional difficulty
Use 1525/3773 40.4%
Total with functional difficulty
Wedner et al, 2002[157]
None Cross-sectional
Clinical; Self-report
11-27 2511 10 VA<=6/12 AFR Tanzania Met 47/154 30.5%
Total with functional difficulty
Use 126/2511 5.0% Total participants
Naidoo et al, 2016[86]
RARE Cross-sectional
Self-report 15-36 1516 10 PVA<6/12 AFR South Africa
Coverage 17/34 50.0% Total with need
Met 17/34 50.0% Total with need
Uncorrected refractive error
23/1516 1.5% Total participants
Unmet 17/34 50.0% Total with need
AP use AFR South Africa
Use 6/58 10.3% Total with AP
Marmamula et al, 2013 (a)[51]
RARE Cross-sectional
Clinical 15-49 3095 9 [4] PVA<=6/12 SEAR India
Uncorrected refractive error
111/3095 3.6% Total participants
Use 300/3095 9.7% Total participa
BMJ Publishing Group Limited (BMJ) disclaims all liability and responsibility arising from any relianceSupplemental material placed on this supplemental material which has been supplied by the author(s) BMJ Global Health
doi: 10.1136/bmjgh-2021-007662:e007662. 7 2022;BMJ Global Health, et al. Danemayer J

56
nts
Muhit et al, 2018[52]
RARE Cross-sectional
Clinical; Self-report
15-49 3050 10 PVA<6/18 SEAR Bangladesh
Coverage 19/143 13.3% Total with need
Met 19/143 13.3% Total with need
Unmet 124/143 86.7% Total with need
Chan et al, 2013[53]
RARE Cross-sectional
Clinical 15-50 3171 9 [4] PVA<6/12 AFR Eritrea Coverage 45/203 22.2% Total with need
Met 45/203 22.2% Total with need
Unmet 158/203 77.8% Total with need
Loughman et al, 2015[54]
RARE Cross-sectional
Clinical; Self-report
15-50 3457 9 [4] DVA<6/12; NVA<6/12
AFR Mozambique
Use 161/3452 4.7% Total participants
Marmamula et al, 2009[55]
RARE Cross-sectional
Clinical; Self-report
15-50 3203 10 UCVA<6/12; UCNVA<N8
SEAR India Use 371/3203 11.6% Total participants
Senicato et al, 2012[158]
Campinas Municipal Health Survey
Cross-sectional
Self-report 20-59 508 8 [2, 10]
AP use AMR Brazil Use 226/508 44.5% Total participants
Ferraz et al, 2014[159]
None Cross-sectional
Clinical 1-90 7654 10 PVA<6/12 AMR Brazil Unmet 143/2193 6.5%
Total with functional difficulty
Hashemi et al, 2015[160]
None Cross-sectional
Clinical 1-90 2635 9 [8] VA<6/12 EMR Iran
Uncorrected refractive error
85/156 54.5%
Total with functional
BMJ Publishing Group Limited (BMJ) disclaims all liability and responsibility arising from any relianceSupplemental material placed on this supplemental material which has been supplied by the author(s) BMJ Global Health
doi: 10.1136/bmjgh-2021-007662:e007662. 7 2022;BMJ Global Health, et al. Danemayer J

57
difficulty
Hashemi et al, 2017 (b)[161]
None Cross-sectional
Clinical; Self-report
1-93 3314 9 [4] RE subsets EMR Iran Met 256/3314 7.7% Total participants
Need 629/3314 19.0% Total participants
Unmet 373/3314 11.3% Total participants
Fotouhi et al, 2006[162]
Tehran Eye Study
Cross-sectional
Clinical; Self-report
5-95 4565 9 [9] PVA<6/12 EMR Iran Coverage 416/646 64.4% Total with need
Met 416/4317 9.6% Total participants
Need 646/4317 15.0% Total participants
Unmet 230/4317 5.3% Total participants
Danermark et al, 2012[163]
National Public Health Survey
Secondary cross-sectional
Self-report 18-84 Not provided
10 RAL EUR Sweden Need N/A 50.0% Total population
Desalegn et al, 2016[164]
None Cross-sectional
Self-report 18-86 780 10 AP use AFR Ethiopia Use 194/780 24.9% Total participants
Hashemi et al, 2012[165]
None Cohort Clinical; Self-report
40-64 5190 10 VA<6/18 EMR Iran
Uncorrected refractive error
45/118 38.1%
Total with functional difficulty
Ertekin et al, 2016[166]
None Cross-sectional
Clinical; Self-report
5-100 1938 10 VA<6/10 EUR Turkey Use 134/1938 6.9% Total participants
BMJ Publishing Group Limited (BMJ) disclaims all liability and responsibility arising from any relianceSupplemental material placed on this supplemental material which has been supplied by the author(s) BMJ Global Health
doi: 10.1136/bmjgh-2021-007662:e007662. 7 2022;BMJ Global Health, et al. Danemayer J

58
Latorre-Arteaga et al, 2018[167]
None Cross-sectional
Self-report 0+ 302 9 [2] RAL EUR Spain Use 22/302 7.3% Total participants
Sheeladevi et al, 2019[168]
None Meta analysis
Multiple secondary sources
0+ 34349 10 PVA<6/18 SEAR India
Uncorrected refractive error
3504/34349 10.2% Total participants
Tahhan et al, 2009[169]
None Cross-sectional
Clinical; Self-report
0+ 14669 9 [2] VA<6/12 SEAR Sri Lanka
Uncorrected refractive error
11388/14699 77.5% Total participants
Danquah et Brus, 2013[25]
WGQ Short set
Mixed-methods
Self-report 5+ 3122 10 RAL AMR Haiti Unmet 40/178 22.5% Total participants
Resnikoff et al, 2008[170]
None Secondary cross-sectional
Multiple secondary sources
5+ 1 10 PVA<6/18 AFR Mauritania
Uncorrected refractive error
6/640 0.9% Total population
AMR
Brazil; Chile; Argentina; Paraguay; Venezuela
Uncorrected refractive error
6/432 1.4% Total population
Guatemala; Peru
Uncorrected refractive error
1/66 1.5% Total population
United States
Uncorrected refractive error
6/305 2.0% Total population
EMR
Iran; Qatar; Oman; Lebanon
Uncorrected refractive error
3/264 1.1% Total population
BMJ Publishing Group Limited (BMJ) disclaims all liability and responsibility arising from any relianceSupplemental material placed on this supplemental material which has been supplied by the author(s) BMJ Global Health
doi: 10.1136/bmjgh-2021-007662:e007662. 7 2022;BMJ Global Health, et al. Danemayer J

59
EUR Armenia; Turkmenistan
Uncorrected refractive error
7/431 1.6% Total population
Ireland; Italy
Uncorrected refractive error
8/398 2.0% Total population
Global World
Uncorrected refractive error
153/5751 2.7% Total population
SEAR Bangladesh
Uncorrected refractive error
12/317 3.8% Total population
India
Uncorrected refractive error
39/967 4.0% Total population
WPR Australia
Uncorrected refractive error
1/144 0.7% Total population
China
Uncorrected refractive error
54/1229 4.4% Total population
Malaysia; Singapore; Myanmar; Philippines; Cambodia; Vietnam
Uncorrected refractive error
8/554 1.4% Total population
Rosman et al, 2009[171]
Singapore Malay Eye Study
Cross-sectional
Clinical; Self-report
40-79 3280 9 [10] RE subsets WPR Singapore Under-met
180/1250 14.4% Total with AP
BMJ Publishing Group Limited (BMJ) disclaims all liability and responsibility arising from any relianceSupplemental material placed on this supplemental material which has been supplied by the author(s) BMJ Global Health
doi: 10.1136/bmjgh-2021-007662:e007662. 7 2022;BMJ Global Health, et al. Danemayer J

60
Unmet 454/3115 14.6% Total participants
Huang et al, 2013[172]
Singapore Malay Eye Study
Cross-sectional
Clinical; Self-report
40-80 3280 10 VA<=6/18 WPR Singapore Need 1758/2112 83.2%
Total with functional difficulty
Use 1440/2112 68.2%
Total with functional difficulty
Vitale et al, 2006 (b)[173]
National Health and Nutritional Examination Survey
Cross-sectional
Clinical; Self-report
12+ 15193 9 [8] PVA<6/15 AMR United States
Met 992/1190 83.4%
Total with functional difficulty
Uncorrected refractive error
703/13265 5.3% Total participants
Berardi et al, 2020[27]
Canadian Survey on Disability
Secondary cross-sectional
Self-report 15+ 45443 10 RAL AMR Canada Unmet 72360/2710514
2.7% Total population
Use 3050750/2710514
112.6% Total population
Mashayo et al, 2014[174]
None Cross-sectional
Clinical 15+ 3230 9 [4] PVA<6/12; PNVA<6/12
AFR Tanzania Coverage 4/237 1.7% Total with need
Met 4/237 1.7% Total with need
Uncorrected refractive error
237/3230 7.3% Total participants
Under- 51/55 92.7% Total
BMJ Publishing Group Limited (BMJ) disclaims all liability and responsibility arising from any relianceSupplemental material placed on this supplemental material which has been supplied by the author(s) BMJ Global Health
doi: 10.1136/bmjgh-2021-007662:e007662. 7 2022;BMJ Global Health, et al. Danemayer J

61
met with AP
Unmet 233/237 98.3% Total with need
Pryor et al, 2018[30]
ATA-N, RAD, WGQ
Cross-sectional
Self-report 18+ 4253 9 [4] AP use SEAR Bangladesh
Use 30/112 26.8%
Total with functional difficulty and using any AP
Aljied et al, 2018[175]
Comprehensive Cohort of the Canadian Longitudinal Study on Aging
Cross-sectional
Clinical; Self-report
45-92 29666 10 PVA<6/12 AMR Canada Use 25543/29666 86.1% Total participants
Nangia et al, 2013[176]
Central India Eye and Medical Study
Cross-sectional
Clinical; Self-report
30-100
4711 9 [2] PVA<6/12 SEAR India Unmet 729/1084 67.3%
Total with functional difficulty
Abdullah et al, 2015[62]
None Cross-sectional
Clinical; Self-report
30+ 917 9 [2] PVA<6/12 EMR Pakistan
Uncorrected refractive error
199/917 21.7% Total participants
Bourne et al, 2004[177]
National Blindness and Low Vision Prevalence Survey of Bangladesh
Cross-sectional
Clinical; Self-report
30+ 11624 10 VA<6/12 SEAR Bangladesh
Coverage 282/1117 25.2% Total with need
Met 282/1117 25.2% Total with need
BMJ Publishing Group Limited (BMJ) disclaims all liability and responsibility arising from any relianceSupplemental material placed on this supplemental material which has been supplied by the author(s) BMJ Global Health
doi: 10.1136/bmjgh-2021-007662:e007662. 7 2022;BMJ Global Health, et al. Danemayer J

62
Unmet 835/1117 74.8% Total with need
Laitinen et al, 2008[178]
Health 2000 Survey
Cross-sectional
Clinical; Self-report
30+ 6645 10 VA<6/24 EUR Finland Use 103/147 70.1%
Total with functional difficulty
Han et al, 2019[179]
None Cohort Clinical 35+ 1427 10 PVA<6/12 WPR China Coverage 139/327 42.5% Total with need
Met 139/327 42.5% Total with need
Unmet 188/327 57.5% Total with need
He et al, 2012[64]
None Cross-sectional
Clinical 35+ 17734 9 [4] UCNVA<=6/12
AFR Niger Use 12/869 1.4%
Total with functional difficulty
South Africa
Use 66/1687 3.9%
Total with functional difficulty
AMR United States
Use 243/476 51.1%
Total with functional difficulty
SEAR India Use 88/2169 4.1%
Total with functional difficulty
Nepal Use 44/1448 3.0% Total with
BMJ Publishing Group Limited (BMJ) disclaims all liability and responsibility arising from any relianceSupplemental material placed on this supplemental material which has been supplied by the author(s) BMJ Global Health
doi: 10.1136/bmjgh-2021-007662:e007662. 7 2022;BMJ Global Health, et al. Danemayer J

63
functional difficulty
WPR China (Guangzhou)
Use 124/1101 11.3%
Total with functional difficulty
China (Shunyi)
Use 10/2435 0.4%
Total with functional difficulty
He et al, 2014 (a)[65]
None Cohort Clinical; Self-report
35+ 10553 9 [4] VA<=6/12 AFR Niger Met 23/144 16.0%
Total with functional difficulty
South Africa
Met 170/425 40.0%
Total with functional difficulty
AMR United States
Met 141/147 95.9%
Total with functional difficulty
Hookway et al, 2016[66]
None Cross-sectional
Clinical; Self-report
35+ 3390 8 [4, 9]
UCVA<=6/12
AMR Nicaragua Met 23/326 7.1% Total with AP
Uncorrected refractive error
1070/1836 58.3% Total participants
Use 1256/3390 37.1% Total participants
BMJ Publishing Group Limited (BMJ) disclaims all liability and responsibility arising from any relianceSupplemental material placed on this supplemental material which has been supplied by the author(s) BMJ Global Health
doi: 10.1136/bmjgh-2021-007662:e007662. 7 2022;BMJ Global Health, et al. Danemayer J

64
Budenz et al, 2012[180]
Tema Eye Survey
Cross-sectional
Clinical 40+ 5603 8 [1, 7]
PVA<6/12 AFR Ghana
Uncorrected refractive error
608/5603 10.9% Total participants
Casson et al, 2007[181]
Meiktila Eye Study
Cross-sectional
Clinical 40+ 2076 10 PVA<6/18 SEAR Myanmar
Uncorrected refractive error
254/1348 18.8%
Total with functional difficulty
Use 3/2076 0.1% Total participants
Ezelum et al, 2011[182]
None Cross-sectional
Clinical; Self-report
40+ 13599 10 VA<6/12 AFR Nigeria Met 43/1279 3.4% Total with need
Need 1279/13599 9.4% Total participants
Unmet 1236/1279 96.6% Total with need
Use 44/1279 3.4% Total with need
Gupta et al, 2015[72]
RAVI Cross-sectional
Clinical; Self-report
40+ 2331 10 PVA<6/18 SEAR India
Uncorrected refractive error
317/2331 13.6%
Total with functional difficulty
Use 468/2331 20.1% Total participants
Marmamula et al, 2012[76]
RAVI Cross-sectional
Clinical; Self-report
40+ 1700 9 [4] PVA<6/18 SEAR India Coverage 71/250 28.4% Total with need
Met 71/1560 4.6% Total participants
BMJ Publishing Group Limited (BMJ) disclaims all liability and responsibility arising from any relianceSupplemental material placed on this supplemental material which has been supplied by the author(s) BMJ Global Health
doi: 10.1136/bmjgh-2021-007662:e007662. 7 2022;BMJ Global Health, et al. Danemayer J

65
Unmet 179/1560 11.5% Total participants
Marmamula et al, 2014[78]
RAVI Cross-sectional
Clinical; Self-report
40+ 7378 9 [4] UCVA<6/12 SEAR India Coverage 361/951 38.0% Total with need
Met 361/7378 4.9% Total participants
Under-met
1001/2174 46.0% Total with AP
Unmet 590/7378 8.0% Total participants
Use 2174/7378 29.5% Total participants
Marmamula et al, 2016 (a)[95]
RAVI Cross-sectional
Clinical 40+ 6150 10 PVA<6/18 SEAR India
Uncorrected refractive error
94/741 12.7%
Total with functional difficulty
Marmamula et al, 2016 (b)[183]
RAVI Cross-sectional
Clinical 40+ 7378 10 PVA<6/18 SEAR India
Uncorrected refractive error
321/730 44.0%
Total with functional difficulty
Marmamula et al, 2017 (b)[184]
None Cross-sectional
Clinical; Self-report
40+ 5881 10 PVA<6/18 SEAR India Coverage 271/506 53.6% Total with need
Met 271/5881 4.6% Total participants
Unmet 235/5881 4.0% Total participants
Use 1694/5881 28.8% Total participa
BMJ Publishing Group Limited (BMJ) disclaims all liability and responsibility arising from any relianceSupplemental material placed on this supplemental material which has been supplied by the author(s) BMJ Global Health
doi: 10.1136/bmjgh-2021-007662:e007662. 7 2022;BMJ Global Health, et al. Danemayer J

66
nts
Marmamula et al, 2020(a)[185]
None Cross-sectional
Clinical; Self-report
40+ 10280 10 PVA<6/18 SEAR India (Khammam)
Coverage Not provided
26.9%
Total need (2011-12)
India (Khammam)
Coverage Not provided
35.6% Total need (2017)
India (Khammam)
Use 697/2485 28.0%
Total participants (2011-12)
India (Khammam)
Use 945/2711 34.9%
Total participants (2017)
India (Warangal)
Coverage Not provided
43.8%
Total need (2011-12)
India (Warangal)
Coverage Not provided
35.7% Total need (2017)
India (Warangal)
Use 793/2438 32.5%
Total participants (2011-12)
India (Warangal)
Use 769/2646 29.1%
Total participants (2017)
Marmamula et al, 2020(b)[186]
RAVI; Tripura Eye Survey
Cross-sectional
Clinical 40+ 4109 9 [8] PVA<6/12 SEAR India
Uncorrected refractive error
159/402 39.6%
Total with functional difficulty
BMJ Publishing Group Limited (BMJ) disclaims all liability and responsibility arising from any relianceSupplemental material placed on this supplemental material which has been supplied by the author(s) BMJ Global Health
doi: 10.1136/bmjgh-2021-007662:e007662. 7 2022;BMJ Global Health, et al. Danemayer J

67
Prema et al, 2008[187]
Chennai Glaucoma Study
Cross-sectional
Clinical; Self-report
40+ 7773 9 [1] VA<6/12 SEAR India Use 2728/5651 48.3% Total participants
Ramke et al, 2007[80]
RACSS Cross-sectional
Clinical; Self-report
40+ 1414 10 PVA<6/18 SEAR Timor-Leste
Met 31/1414 2.2% Total participants
Uncorrected refractive error
159/1414 11.2% Total participants
Under-met
7/1414 0.5% Total participants
Unmet 166/1414 11.7% Total participants
Use 214/1414 15.1% Total participants
Tafida et al, 2015[188]
Nigerian National Blindness and Visual Impairment Survey
Cross-sectional
Clinical; Self-report
40+ 13591 9 [8] PVA<6/12 AFR Nigeria Coverage 12/374 3.2%
Total with functional difficulty
Zheng et al, 2011[189]
Singapore Malay Eye Study
Cross-sectional
Clinical 40+ 3400 8 [4, 9]
PVA<6/12 WPR Singapore
Under-corrected refractive error
328/565 58.1%
Total with functional difficulty
Pan et al, 2016[190]
Weitang Geriatric Diseases Study
Cross-sectional
Clinical; Self-report
60-93 4611 9 [2] PVA<6/18 WPR China
Uncorrected refractive error
224/481 46.6%
Total with functional difficulty
Cunha et al, 2018[81]
None Cross-sectional
Clinical 45+ 2041 9 [1] UCNVA<=6/18
AMR Brazil Use 480/2025 23.7% Total participants
BMJ Publishing Group Limited (BMJ) disclaims all liability and responsibility arising from any relianceSupplemental material placed on this supplemental material which has been supplied by the author(s) BMJ Global Health
doi: 10.1136/bmjgh-2021-007662:e007662. 7 2022;BMJ Global Health, et al. Danemayer J

68
Furtado et al, 2019[191]
Brazilian Amazon Region Eye Survey
Cross-sectional
Clinical 45+ 2041 10 VA<6/9.5 AMR Brazil Need 1384/1963 70.5%
Total with functional difficulty
Bastawrous et al, 2013[192]
RAAB Cross-sectional
Clinical; Self-report
50+ 4414 10 PVA<6/12 AFR Kenya Coverage 122/478 25.5%
Total with functional difficulty
Met 122/478 25.5%
Total with functional difficulty
Unmet 356/478 74.5%
Total with functional difficulty
Gallarreta et al, 2014[193]
RAAB Cross-sectional
Clinical 50+ 3729 9 [4] PVA<6/18 AMR Uruguay
Uncorrected refractive error
177/3729 4.7% Total participants
Lee et al, 2019[194]
RAAB Cross-sectional
Clinical; Self-report
50+ 5000 9 [4] VA<6/12 WPR Papua New Guinea
Uncorrected refractive error
207/284 72.9%
Total with functional difficulty
Marmamula et al, 2013(c)[195]
Rapid Assessment of Visual Impairment
Cross-sectional
Clinical 50+ 494 10 PVA<6/18 SEAR India
Uncorrected refractive error
74/280 26.4%
Total with functional difficulty
Neena et al, 2008[196]
RAAB Cross-sectional
Clinical 50+ 40447 9 [4] PVA<6/12 SEAR India
Uncorrected refractive error
2233/6786 32.9%
Total with functional difficulty
BMJ Publishing Group Limited (BMJ) disclaims all liability and responsibility arising from any relianceSupplemental material placed on this supplemental material which has been supplied by the author(s) BMJ Global Health
doi: 10.1136/bmjgh-2021-007662:e007662. 7 2022;BMJ Global Health, et al. Danemayer J
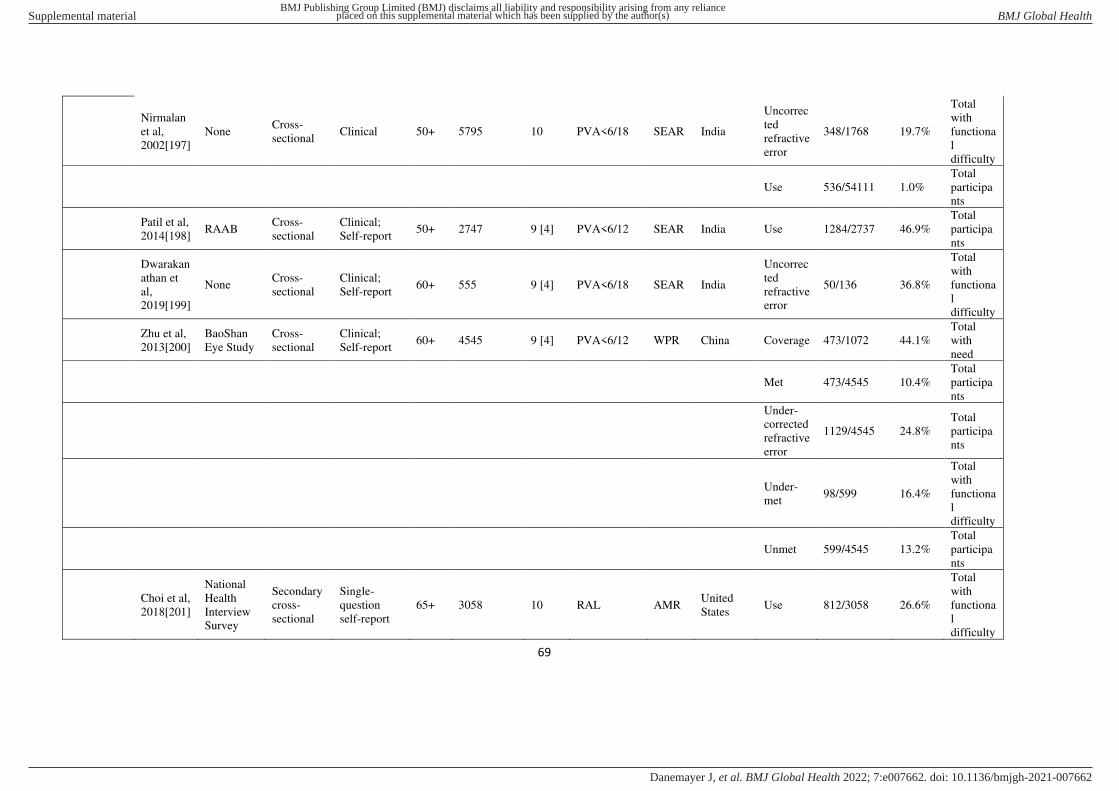
69
Nirmalan et al, 2002[197]
None Cross-sectional
Clinical 50+ 5795 10 PVA<6/18 SEAR India
Uncorrected refractive error
348/1768 19.7%
Total with functional difficulty
Use 536/54111 1.0% Total participants
Patil et al, 2014[198]
RAAB Cross-sectional
Clinical; Self-report
50+ 2747 9 [4] PVA<6/12 SEAR India Use 1284/2737 46.9% Total participants
Dwarakanathan et al, 2019[199]
None Cross-sectional
Clinical; Self-report
60+ 555 9 [4] PVA<6/18 SEAR India
Uncorrected refractive error
50/136 36.8%
Total with functional difficulty
Zhu et al, 2013[200]
BaoShan Eye Study
Cross-sectional
Clinical; Self-report
60+ 4545 9 [4] PVA<6/12 WPR China Coverage 473/1072 44.1% Total with need
Met 473/4545 10.4% Total participants
Under-corrected refractive error
1129/4545 24.8% Total participants
Under-met
98/599 16.4%
Total with functional difficulty
Unmet 599/4545 13.2% Total participants
Choi et al, 2018[201]
National Health Interview Survey
Secondary cross-sectional
Single-question self-report
65+ 3058 10 RAL AMR United States
Use 812/3058 26.6%
Total with functional difficulty
BMJ Publishing Group Limited (BMJ) disclaims all liability and responsibility arising from any relianceSupplemental material placed on this supplemental material which has been supplied by the author(s) BMJ Global Health
doi: 10.1136/bmjgh-2021-007662:e007662. 7 2022;BMJ Global Health, et al. Danemayer J

70
Kuang et al, 2007[202]
Shihpai Eye Study
Cross-sectional
Clinical 65+ 1361 10 VA<=6/12 WPR Taiwan Met 314/1330 23.6% Total participants
Under-met
13/1330 1.0% Total participants
Unmet 114/1330 8.6% Total participants
Otte et al, 2018[84]
National Health and Aging Trends Study
Secondary cross-sectional
Self-report 65+ 7497 10 RAL; AP Use
AMR United States
Use 40500000/43900000
92.3% Total population
Dupraz et al, 2020[40]
5-COOP Cross-sectional
Clinical; Self-report
100 1253 10 AP use EUR Denmark Has AP 196/251 78.1% Total participants
France Has AP 247/282 87.6% Total participants
Sweden Has AP 233/274 85.0% Total participants
Switzerland
Has AP 124/170 72.9% Total participants
WPR Japan Has AP 226/346 65.3% Total participants
ATA-N=Assistive Technology Assessment-Needs. RAAB=Rapid Assessment of Avoidable Blindness. RAD=Rapid Assessment of Disability. RACSS=Rapid Assessment of Cataract Surgical Services. RARE=Rapid Assessment of Refractive Error. RAVI=Rapid Assessment of Visual Impairment. WGQ=Washington Group Questions. RAL=self-reported activity limitations. RE=refractive error. VA=visual acuity. PVA=presenting visual acuity. UCVA=uncorrected visual acuity. DVA=distance visual acuity. NVA=near visual acuity. PNVA=presenting near visual acuity. UCNVA=uncorrected near visual acuity.
*Results are presented in millions
BMJ Publishing Group Limited (BMJ) disclaims all liability and responsibility arising from any relianceSupplemental material placed on this supplemental material which has been supplied by the author(s) BMJ Global Health
doi: 10.1136/bmjgh-2021-007662:e007662. 7 2022;BMJ Global Health, et al. Danemayer J

71
Appendix 11: Grouped and Cognitive AP Indicators
AP Type Citation Tool, Survey,
or Dataset
Study
Design Approaches Ages Participants
JBI
Score
Functional
Difficulty
Threshold
WHO
Region Country
AP access Indicator
Indicator Calculation (%) Denominator
Personal Digital Assistants (PDAs)
Lindsay et Tsybina, 2010[203]
Participation and Activity Limitation Survey
Secondary cross-sectional
Self-report 15-24 15817 10 RAL AMR Canada Unmet 2305/15817 14.6% Total with functional difficulty
Use 1323/15817 8.4% Total with functional difficulty
Grouped APs
Lindsay et Tsybina, 2010[203]
Participation and Activity Limitation Survey
Secondary cross-sectional
Self-report 15-24 15817 10 RAL AMR Canada Unmet 4710/15817 29.8% Total with functional difficulty
Use 14494/15817 91.6% Total with functional difficulty
Rios et al, 2014[17]
Assistive Technology Banks (BAT) Client Database
Secondary cross-sectional
Clinical 0-100 839 8 [2, 10]
AP use AMR Colombia Has AP 245/839 29.2% Total participants
Eide et al, 2003 (a)[204]
Living Conditions Studies
Cross-sectional
Self-report 0+ 12323 10 RAL AFR Zimbabwe Use 506/1961 25.8% Total with functional difficulty
Eide et al, 2003 (b)[205]
Living Conditions Studies
Cross-sectional
Self-report 0+ 16429 9 [8] RAL AFR Namibia Use 446/2537 17.6% Total with functional difficulty
Eide et Loeb, 2006[206]
WGQ Short set; Living Conditions Studies
Cross-sectional
Self-report 0+ 28189 9 (4) RAL AFR Zambia Use 372/2856 13.0% Total with functional difficulty
Eide et al, 2016[207]
WGQ Short set; Living Conditions Studies
Cross-sectional
Self-report 0+ 4123 8 [2, 4]
RAL SEAR Nepal Use 234/2000 11.7% Total with functional difficulty
BMJ Publishing Group Limited (BMJ) disclaims all liability and responsibility arising from any relianceSupplemental material placed on this supplemental material which has been supplied by the author(s) BMJ Global Health
doi: 10.1136/bmjgh-2021-007662:e007662. 7 2022;BMJ Global Health, et al. Danemayer J

72
Eide et Munthali, 2018[208]
WGQ Short set; Living Conditions Studies
Cross-sectional
Self-report 0+ 129988 9 [4] RAL AFR Malawi Use 196/4350 4.5% Total with functional difficulty
Eide et Jele, 2011[209]
Living Conditions Studies
Cross-sectional
Self-report 0+ 8734 9 [4] RAL AFR Swaziland Use 186/866 21.5% Total with functional difficulty
Eide et Kamaleri, 2009[210]
Living Conditions Studies
Cross-sectional
Self-report 0+ 11401 9 [4] RAL AFR Mozambique Use 107/537 19.9% Total with functional difficulty
Eide et Mmatli, 2016[211]
WGQ Short set; Living Conditions Studies
Cross-sectional
Self-report 0+ 9904 9 [4] RAL AFR Botswana Use 348/955 36.4% Total with functional difficulty
Kamaleri et Eide, 2011[212]
WGQ Short set; Living Conditions Studies
Cross-sectional
Self-report 0+ 5894 9 [4] RAL AFR Lesotho Use 86/619 13.9% Total with functional difficulty
Loeb et Eide, 2004[213]
Living Conditions Studies
Cross-sectional
Self-report 0+ 15364 10 RAL AFR Malawi Use 304/1550 19.6% Total with functional difficulty
Maart et Jelsma 2013[214]
WGQ Short set
Cross-sectional
Self-report 0+ 3464 8 [4, 8]
RAL AFR South Africa Need 110/3464 3.2% Total participants
Unmet 38/110 34.5% Total with need
Smith, 2011[215]
None Cross-sectional
Self-report 0+ 1093 7 [2, 4, 7]
RAL AFR Nigeria Has AP 403/1093 37.0%
Total with functional difficulty
Use 260/1093 23.8% Total with functional difficulty
Eide et al, 2018[216]
WGQ Child Functioning Module; WGQ Short set; Living Conditions Studies;
Cross-sectional
Self-report 2+ 9190 9 [8] RAL AFR Zambia Use 459/2294 20.0% Total with functional difficulty
BMJ Publishing Group Limited (BMJ) disclaims all liability and responsibility arising from any relianceSupplemental material placed on this supplemental material which has been supplied by the author(s) BMJ Global Health
doi: 10.1136/bmjgh-2021-007662:e007662. 7 2022;BMJ Global Health, et al. Danemayer J

73
National Disability Survey
Danquah et Brus, 2013[25]
WGQ Short set
Mixed-methods
Self-report 5+ 3122 10 RAL AMR Haiti Need 54/178 30.3% Total with functional difficulty
Unmet 37/178 20.8% Total with functional difficulty
Use 17/178 9.6% Total with functional difficulty
Visagie et al, 2017[217]
WGQ Short set
Cross-sectional
Self-report 5+ 4388 8 [4, 8]
RAL AFR Malawi Use 42/1496 2.8% Total with functional difficulty
Namibia Use 331/1118 29.6% Total with functional difficulty
South Africa Use 199/1050 19.0% Total with functional difficulty
EMR Sudan Use 142/724 19.6% Total with functional difficulty
Loggins et al, 2013[218]
National Behavioral Risk Factor Surveillance System
Secondary cross-sectional
Self-report 18-99 393949 8 [4, 10]
AP use AMR United States
Use 38499/393949 9.8% Total participants
Marella et al, 2016[219]
RAD Cross-sectional
Clinical; Self-report
18-100
2139 10 AP use WPR Philippines Met 120/265 45.3% Total with functional difficulty
Unmet 51/265 19.2% Total with functional difficulty
Berardi et al, 2020[27]
Canadian Survey on Disability
Secondary cross-sectional
Self-report 15+ 45443 10 RAL AMR Canada Unmet 1.0/3.8* 26.6% Total with functional difficulty
BMJ Publishing Group Limited (BMJ) disclaims all liability and responsibility arising from any relianceSupplemental material placed on this supplemental material which has been supplied by the author(s) BMJ Global Health
doi: 10.1136/bmjgh-2021-007662:e007662. 7 2022;BMJ Global Health, et al. Danemayer J

74
Use 3.6/3.8* 94.8% Total with functional difficulty
Matter et Eide, 2018[220]
WGQ Short set; Living Conditions Studies
Secondary cross-sectional
Self-report 15+ 818 7 [2, 3, 9]
RAL AFR Botswana Met 272/486 56.0% Total with need
Unmet 214/486 44.0% Total with need
Swaziland Met 104/332 31.3% Total with need
Unmet 222/332 66.9% Total with need
Pryor et al, 2018[30]
ATA-N, RAD, WGQ
Cross-sectional
Self-report 18+ 4253 9 [4] RAL SEAR Bangladesh Met 227/302 75.2% Total with AP
Under-met
75/1356 5.5% Total with functional difficulty
Unmet 1013/1356 74.7% Total with functional difficulty
Use 302/4250 7.1% Total participants
Goins et al, 2010[221]
Native Elder Care Study
Cross-sectional
Functional; Self-report
55+ 505 9 [4] RAL AMR United States
Use 127/505 25.1% Total participants
Frochen et Mehdizadeh, 2017[222]
National Health and Aging Trends Study
Secondary cross-sectional
Self-report 65+ 7521 10 RAL AMR United States
Use (Indoor)
489/7521 6.5% Total participants
ATA-N=Assistive Technology Assessment-Needs. RAD=Rapid Assessment of Disability. WGQ=Washington Group Questions. RAL=self-reported activity limitations.
*Results are presented in millions.
BMJ Publishing Group Limited (BMJ) disclaims all liability and responsibility arising from any relianceSupplemental material placed on this supplemental material which has been supplied by the author(s) BMJ Global Health
doi: 10.1136/bmjgh-2021-007662:e007662. 7 2022;BMJ Global Health, et al. Danemayer J