
3b-113 effect of a mediterranean diet (meddiet) - Pork CRC
22
3B-113 EFFECT OF A MEDITERRANEAN DIET (MEDDIET) WITH FRESH LEAN AUSTRALIAN PORK ON BLOOD PRESSURE, CARDIOVASCULAR RISK FACTORS AND COGNITION, MOOD AND PSYCHOLOGICAL WELLBEING IN HIGH RISK INDIVIDUALS Report prepared for the Co-operative Research Centre for High Integrity Australian Pork By Dr Karen Murphy, Alexandra Wade, Prof Jonathan Hodgson, Prof Richard Woodman, Dr Hannah Keage. University of South Australia School of Pharmacy and Medical Sciences. [email protected] Ph: 8302 1033 June, 2018
-
Upload
khangminh22 -
Category
Documents
-
view
3 -
download
0
Transcript of 3b-113 effect of a mediterranean diet (meddiet) - Pork CRC

3B-113 EFFECT OF A MEDITERRANEAN DIET (MEDDIET) WITH FRESH LEAN AUSTRALIAN PORK ON BLOOD
PRESSURE, CARDIOVASCULAR RISK FACTORS AND
COGNITION, MOOD AND PSYCHOLOGICAL
WELLBEING IN HIGH RISK INDIVIDUALS
Report prepared for the Co-operative Research Centre for High Integrity Australian Pork
By
Dr Karen Murphy, Alexandra Wade, Prof Jonathan Hodgson, Prof Richard Woodman, Dr Hannah Keage.
University of South Australia
School of Pharmacy and Medical Sciences.
[email protected] Ph: 8302 1033
June, 2018
i
Executive Summary
The Mediterranean diet is characterized by the high consumption of extra virgin olive oil, fruits, vegetables, grains, legumes and nuts; moderate consumption of fish, poultry, eggs and dairy; and low consumption of red meat and sweets and may be effective for the prevention of cardiovascular disease and dementia. Earlier research suggests that an Australian population may find red meat restrictions difficult, which could affect long-term sustainability of the diet. We have shown lean pork is equally as healthy as red meat and chicken, the two most commonly consumed meats in Australia. It is lower in saturated fat than beef and may offer a suitable alternative meat protein source to red meat in a Mediterranean dietary pattern for Australians. This study sought to examine the cardiovascular and cognitive effects of a Mediterranean diet modified to include 2-3 weekly serves of fresh, lean pork. A 24-week cross-over design trial compared a Mediterranean diet with pork (MedPork) with a low-fat control diet (LF) in 33 men and women at risk of developing cardiovascular disease. Participants followed each diet for 8-weeks, with an 8-week washout period separating interventions. Home measured systolic blood pressure was the primary outcome measure. Secondary outcomes included body mass index, body composition, fasting blood lipids, C-reactive protein (CRP), fasting plasma glucose, fasting serum insulin and cognitive function. Based on fortnightly questionnaires throughout the intervention, compliance was 93% during the LF intervention and 90% during the MedPork intervention. As expected, the MedPork intervention was associated with a significant increase in % energy consumed from fat, specifically, monounsaturated and polyunsaturated fat, and a decrease in % energy consumed from carbohydrate, driven by a significant decrease in refined carbohydrate intake. The MedPork intervention also led to a significant increase in consumption of legumes, seafood, nuts and fish, and extra virgin olive oil and mean consumption of 2.7 serves of fresh pork/wk. Our results indicate that there were no significant differences between diets for blood pressure, lipids, CRP, glucose and insulin. A small but significant effect of the LF intervention was found for weight, waist circumference, BMI and fat mass. Sensitivity analyses showed a significant reduction in systolic blood pressure and pulse pressure in participants who were overweight after the MedPork phase. Processing speed, a cognitive domain of attention improved following the MedPork intervention, but worsened following the LF intervention. Positive trends were observed across all subscales of the profile of mood state questionnaire following the MedPork intervention, with improvements in Depression and Total Mood Disturbance approaching statistical significance. It is possible that the current study failed to detect significant changes in cardiovascular measures due to the short duration of interventions despite evidence from other studies demonstrating changes in these outcomes over 8-weeks. Overall our findings indicate that 2-3 serves of fresh, lean pork can be included as part of a healthy Mediterranean dietary pattern without adverse health effects. Further, adding pork to the Mediterranean diet may have beneficial health effects in overweight individuals on vascular function, particularly blood pressure, a key risk factor for cardiovascular disease. To our knowledge, this research is the first to investigate whether an alternate source of protein can be included in the Mediterranean diet to increase sustainability and feasibility for a non-Mediterranean population. Findings will be significant for the prevention of cardiovascular disease and age-related decline, and may inform individuals, clinicians and public health policy. The use of the Mediterranean dietary pattern continues to gain momentum. The American Dietary Guidelines 2015-2020 have adopted the pattern as one of three healthy diets for good health for Americans. Our findings offer a new angle in revitalizing the healthy image of pork offering opportunity for it to be part of a healthy dietary pattern such as the Mediterranean dietary pattern and its use in dietary practice and dietary guideline revision.

ii
Table of Contents
Executive Summary ............................................................................................................................................. i
1. Introduction ................................................................................................................................................ 3
2. Methodology ................................................................................................................................................. 4
Recruitment ........................................................................................................................................................ 4
Design ................................................................................................................................................................ 5
Dietary interventions .......................................................................................................................................... 5
Dietetic Counselling ........................................................................................................................................... 6
Outcome measures ............................................................................................................................................. 7
Procedure ........................................................................................................................................................... 8
Statistical analysis .............................................................................................................................................. 9
3. Outcomes .................................................................................................................................................. 10
Results .............................................................................................................................................................. 10
Home measured blood pressure ....................................................................................................................... 22
Cardiometabolic outcomes ............................................................................................................................... 22
Cognitive Outcomes ......................................................................................................................................... 22
Nutrient intake .................................................................................................................................................. 22
Sensitivity Analyses .......................................................................................................................................... 23
Profile of Mood States ...................................................................................................................................... 23
Summary of results ........................................................................................................................................... 23
4. Application of Research ......................................................................................................................... 26
Opportunities uncovered by the research ......................................................................................................... 26
Impact of the research ...................................................................................................................................... 26
5. Conclusion ................................................................................................................................................. 27
6. Limitations/Risks ..................................................................................................................................... 27
7. Recommendations ................................................................................................................................... 27
8. Acknowledgements ................................................................................................................................. 28
9. References ................................................................................................................................................ 28
Appendices ......................................................................................................................................................... 32

3
1. Introduction
As the population ages the prevalence and impact of chronic age-related diseases and disorders is predicted to increase dramatically [1]. In the elderly, dementia and cardiovascular disease (CVD) are amongst the greatest contributors to death and disability worldwide, with their costs expected to double and triple respectively over the next 20 years [2-4]. Mediterranean populations in southern Europe, such as Greece and Italy, exhibit significantly lower rates of mortality from CVD and dementia than populations in northern Europe and the United States [5]. It has been suggested that this disparity is due to diverse dietary patterns across populations, and that a Mediterranean diet may be protective against CVD [6, 7] [8]. As cardiovascular health is a significant predictor of dementia [9, 10], the Mediterranean dietary pattern may also be responsible for lower rates of dementia. A traditional Mediterranean diet is characterised by a high intake of extra virgin olive oil (EVOO), vegetables, fruits, cereals, nuts, pulses and legumes; a moderate intake of fish, poultry, dairy and red wine; and a low intake of eggs, red and processed meat, and sweet and processed foods [11]. The Mediterranean dietary pattern is therefore rich in bioactive nutrients and phytochemicals such as monounsaturated fatty acids, polyunsaturated fatty acids (particularly omega-3s), polyphenols and flavonoids, vitamins, minerals, antioxidants and fibre. Individually, these dietary components are associated with improved cardiovascular health [12-15]. However, single nutrients are not consumed in isolation, but collectively as a dietary pattern. As such, synergistic relationships between nutrients may enhance these benefits [8, 16, 17]. When compared with other dietary patterns a Mediterranean diet has consistently improved indicators of cardiovascular health. For example, a Mediterranean diet has been shown to improve blood pressure, insulin sensitivity, lipid profiles and markers of inflammation [18-20], while reducing risk of cardiovascular events by 30% [21]. While Mediterranean populations who follow a Mediterranean diet exhibit lower risk of CVD and dementia [8, 22-25], few studies have investigated whether the diet can be successfully adopted in populations beyond the Mediterranean Sea. Notably, the MedLey study examined the effects of a Mediterranean diet over six months and found that an older Australian population was capable of adopting the Mediterranean diet [26]. However, participants indicated that one of the most difficult aspects of following the diet was restricting red meat intake [27]. A traditional Mediterranean diet is typically low in red meat products and Mediterranean dietary guidelines recommend consuming less than two serves of red meat per week [28, 29]. A recent review has reported that a traditional Mediterranean diet includes 105g, or 0.5 to 0.75 standard serves of meat and meat products per day [11]. This figure is inclusive of all processed and unprocessed red and white meat products. In contrast, Australians over the age of 19 consume an average of 184g of meat per day, or 1.7 serves of lean meats and alternates, with red meat contributing the largest proportion of this (38%) [30]. Australians are amongst the highest consumers of meat in the world [31]. Therefore, it is not surprising that restricting red meat may prove difficult. Countries with comparatively high meat intakes, such as the United States and United Kingdom, may experience similar difficulties (OECD, 2016). As socio-cultural norms and palatability are key determinants of a dietary intervention’s sustainability [32], non-Mediterranean populations may then be more likely to adhere to a diet containing more red meat or meat-protein. Prospective cohort studies have drawn attention to significant associations between red meat and poor health outcomes, including bowel cancer and CVD [33]. Proposed mechanisms point to the pro-oxidative properties of heme iron found in red meat. However, recent investigations highlight the mediating effects of other dietary components on oxidation [34]. For example, consuming EVOO with red meat has been shown to attenuate lipid oxidation and the
4
production of free radicals [35]. When vitamin E, found in green leafy vegetables and nuts, is consumed in combination with EVOO and red meat, lipid oxidation is further inhibited [35]. Moreover, the European Prospective Investigation into Cancer and Nutrition (EPIC) study reported significant interactions between red meat and dietary fibre [36]. Specifically, individuals consuming red meat every day had a reduced risk of developing colorectal cancer if they also consumed at least 26g of dietary fibre each day – that is, less dietary fibre than is provided by the Mediterranean diet [11]. The potentially harmful effects of red meat may then be mitigated when consumed within a Mediterranean dietary pattern. Australia’s most frequently consumed red meat products are chicken (44.5kg/capita) beef & veal (20.9kg/capita) and pork (20.7kg/capita) [31]. In terms of nutritional value, fresh lean beef and pork have similar nutrient profiles, however fresh lean pork contains less saturated fat per 100g than beef. Pork may then be an appropriate addition to a Mediterranean diet, which is typically low in saturated fat and heme iron sources [11]. Our previous research indicates that substituting beef and chicken with pork may be effective for improving cardiometabolic health markers, including weight, body mass index (BMI), percentage body fat, fat mass and abdominal fat, without negatively affecting blood lipids, insulin or glucose [37]. Further, when compared with ruminant meats such as beef and some methods of aquaculture, pork production is associated with significantly less agricultural greenhouse gas emissions [38]. At present, there are no studies to our knowledge that have investigated the substitution of meat protein sources in the Mediterranean diet to increase variety and sustainability for the target population and environment. The current study therefore aimed to evaluate the cardiovascular and cognitive benefits of a Mediterranean diet, supplemented with fresh, lean pork against a low-fat diet. A low-fat control diet was chosen due to its continued recommendation for the clinical management and reduction of cardiovascular risk [39]. Further, including a low-fat control will enable comparisons of our findings against larger studies of the same design, such as the Prevención con Dieta Mediterránea (PREDIMED) trial. Due to the pressing need to reduce the impact of CVD and dementia, the modified Mediterranean diet will be evaluated for its potential to improve cardiovascular health and cognitive risk in an at-risk population.
2. Methodology A methodology paper has been published: Wade A, Davis CR, Dyer KA, Woodman R, Hodgson J, Keage H, Murphy KJ. Including pork in the Mediterranean diet for an Australian population: Protocol for a randomised controlled trial assessing cardiovascular and cognitive outcomes. Nutrition J. 2017 Dec 22;16(1):84.
Recruitment
Volunteers aged between 45 and 80 who are at risk of developing CVD were recruited via electronic and paper advertisements. To meet eligibility criteria, volunteers were required to have elevated systolic blood pressure above 120 mmHg and at least two other risk factors for CVD, including: a BMI ≥ 25 kg/m2; elevated fasting total cholesterol (≥5.5 mM), triglycerides (≥2.0 mM), low-density lipoprotein (LDL) (≥3.5), or low levels of high-density lipoprotein (HDL) (≤0.9 for men and ≤1.0 for women); impaired fasting glucose tolerance (between 6.1 and 7.8 mmol/L); and/or a family history (up to one generation) of CVD or type 2 diabetes mellitus (T2DM). Exclusion criteria included: antihypertensive medication; smoking; current CVD or angina; current or recent (within 6 months) malignancies; respiratory disease; gastrointestinal disease; kidney disease; T2DM; a current or previous traumatic head or brain injury; a current neurological or psychiatric condition; antidepressant or anxiety medication; a current diagnosis of Alzheimer’s disease or dementia; or supplemental omega-3 >1000 mg daily.

5
Eligibility was assessed through a diet and lifestyle questionnaire (DLQ) and screening visit at the Sansom Institute for Health Research Clinical Trial Facility (SIHR CTF), Adelaide, South Australia. The DLQ included items regarding medical history, medications and supplements, family medical history, and dietary aversions, allergies and intolerances. Volunteers deemed eligible on the basis of their DLQ were then screened to measure systolic blood pressure, diastolic blood pressure, heart rate, height and weight, fasting cholesterol and fasting glucose. The Addenbrooke’s Cognitive Exam-Revised (ACE-R) was also administered to detect pre-existing dementia and mild cognitive impairment (MCI).
Design
A 24-week cross-over design trial compared a Mediterranean diet intervention with a low-fat diet intervention. Each participant completed both dietary interventions for 8-weeks and the two intervention phases were separated by an 8-week washout period (See Figure 1). Participants were randomly allocated to one of two groups to determine the order in which they undertook the interventions. During the washout period participants returned to their habitual diet. By reducing potential between-subject differences a cross-over design reduces the effects of potential confounding variables, and therefore enhances internal validity of the design. Further, performing repeated measures on the same individual allows for an estimation of an individual’s true value, measurement error and treatment effect, meaning that fewer participants will be required to detect a treatment effect. An 8-week intervention period was deemed adequate due to previous research, which indicates that the nutrients contained within the Mediterranean diet can improve both cardiovascular and cognitive function over similar time periods [40-42].
Dietary interventions
Neither diet restricted energy intake. Instead, participants were advised to self-regulate their food intake according to individual hunger and satiety cues and consume foods ad-libitum. The dietary design comparing a MedDiet with fresh lean pork with that of a low-fat diet was based on the landmark PREDIMED study, which compared two variations of a Mediterranean diet with a low-fat control diet [43]. A low-fat diet was used in both PREDIMED and the present study as it is still recommended as the best practice guidelines use for primary and secondary prevention of heart disease. More recently guidelines have focused on substitution of unhealthy fats (saturated fat) with healthy fats (monounsaturated and polyunsaturated fat) in the diet.
Low-fat diet Guidelines for the low-fat diet were based on and adapted from the Australian Guide to Healthy Eating and the National Heart Foundation Guidelines (2012). Participants were advised to make adjustments to their habitual diet in order to reduce total fat intake. Specifically, participants were recommended to replace high fat foods, including all types of oil, butter, margarine, processed and high fat meats, nuts, chocolates, cakes, pastry, and high or full fat dairy, with lower-fat alternatives, such as breads and cereals, legumes, rice, fruits and vegetables and low-fat varieties (e.g. low-fat dairy, low-fat sauces). Daily limits were set for oil (no more than 20mL), butter and margarine (no more than two teaspoons), and participants were instructed to remove visible fat and skin from meat and fish before cooking.

6
Mediterranean diet Guidelines for the Mediterranean diet were adapted from Estruch et al (2013) for an Australian food supply:
Minimum of one tablespoon (20 mL) of EVOO per day; ≥2–3 daily servings of fresh fruit (one serve = 150 g fresh, 30 g dried, or one cup
canned in natural juice); ≥3 weekly servings of legumes (one serve = 75 g); 2-3 weekly servings of fresh, lean pork (one serve = 100g cooked) ≥3 weekly servings of fish and seafood (at least one serving of oily fish) (one serve =
100 g cooked); ≥5 weekly serving of raw or roasted nuts or seeds, without added salt, sugar or
chocolate (one serve = 30 g; 7.5 g hazelnuts, 15 g walnuts, 7.5 g almonds supplied for each serve);
Ad-libitum consumption of wholegrain cereal products (bread, pasta, rice, cereal) and dairy
Ad-libitum consumption of eggs, not to exceed 6 serves per week (1 serve = approx. 70g or 1 egg)
Select white meats (poultry without skin) instead of red meats or processed meats; Limit consumption of red and cured meat (remove all visible fat) to ≤1 serve/week (one
serve of red meat/cured ham = 100 g); Limit consumption of chocolate to ≤1 serve/week (one serve of chocolate = 50 g); Use EVOO for cooking and dressing vegetables and salad; Cook regularly (at least twice a week) with a tomato based sauce (EVOO, tomato,
garlic and onion); Dress vegetables, pasta, rice and other dishes with EVOO, tomato, garlic and onion
sauce; Eliminate or limit the consumption of cream, butter, margarine, cold meat, pate, duck,
carbonated and or sugared beverages, pastries, commercial bakery products (cakes, donuts, cookies), desserts (puddings), French fries, potato crisps, sweets;
For usual drinkers, red wine is recommended as the main source of alcohol with a maximum of two standard drinks per day (200 mL = two standard drinks) [44]
Participants were advised to consume pork in place of chicken and red meat ensure that total meat consumption did not exceed 400g per week. To assist with adherence, the following foods were donated by food companies and provided each week: 375mL EVOO; 250g of fresh, lean pork; 150g raw, unsalted almonds, walnuts and hazelnuts; 225g (net weight) of canned chickpeas, red kidney beans, 4-bean mix and lentils; 95g of canned tuna and 95g of canned salmon.
Dietetic Counselling
To provide dietary education and advice, increase dietary adherence and maintain retention, participants had regular fortnightly contact with a dietitian. At the beginning of each phase, participants met with the dietitian to discuss dietary guidelines in detail. For the Mediterranean diet, participants were provided with a set of resources, including Mediterranean dietary guidelines (Appendix A), recommendations for inclusion of pork in the diet (Appendix B), education on serving sizes and a Mediterranean diet recipe book. For the continual

7
assessment of adherence, and to encourage familiarity of foods and serving sizes associated with a Mediterranean diet, participants were also given a semi-quantitative checklist (Appendix C) to be filled in daily, using a tick system (1 tick = 1 serve), and returned at fortnightly dietetic visits. While on the low-fat diet, similar dietetic resources were provided, including a set of low-fat diet guidelines (Appendix D), education on fat content and a food label reading guide (Appendix E) to consider when selecting packaged foods. Throughout each intervention phase participants attended fortnightly dietetic visits to discuss their progress, food intake, challenges and any adverse effects. These visits also included weight measurement to determine body mass, weight loss or weight gain. In the case of weight loss or gain the dietitian attempted to ensure that participants were eating until satiated, and discussed mindful eating and portion sizes. If a participant experienced trouble adhering to the guidelines the dietitian discussed strategies and worked to set SMART goals (S, specific; M, measureable; A, achievable; R, realistic; T, time based) for the next two weeks.
Outcome measures
Home blood pressure Home measured systolic blood pressure was be the primary outcome measure. For the reliable assessment of hypertension, home measured blood pressure is comparable to ambulatory blood pressure, and has stronger predictive power than clinic blood pressure [45-47]. Participants received training on self-administered blood pressure measurement and were instructed to measure their systolic and diastolic blood pressure and heart rate every morning, afternoon and evening for six days at the four assessment points over the course of the trial. Participants were provided with a clinically validated A&D Company Ltd. digital blood pressure monitor (model UA-767). Measurements were taken at a consistent time each day after a five-minute rested period in the seated position. Three consecutive readings were taken spaced at least one minute apart, as per Bondonno et al (2015) and participants were advised to avoid caffeine and alcohol for one hour prior to measurement, and food and exercise for 30 minutes prior. Secondary outcome measures and covariates Over the four assessment time points, home measured diastolic blood pressure and heart rate, clinic blood pressure and heart rate, BMI, waist-to-hip ratio, body composition, fasting blood lipids, C-reactive protein (CRP), fasting plasma glucose, fasting serum insulin, erythrocyte fatty acids, cognitive function, psychological health and well-being, and dementia risk were examined as secondary outcomes. Clinic blood pressure was measured using an Omron Healthcare Co. digital blood pressure monitor (model 1A1B Hem-7000-CIL). The same protocol as for home blood pressure measurement was followed, where participants were seated for five minutes and three measurements were taken spaced at least one minute apart. Waist and hip circumference were measured to determine waist-to-hip ratio. Body composition, including percentage body fat, lean mass and abdominal adiposity was measured using dual-energy x-ray absorptiometry (DEXA). Fasting venous blood was collected through venepuncture and analysed at an external NATA accredited laboratory using standard procedures. For explorative purposes, a faecal sample was also collected to examine the effects of a Mediterranean diet on gut microbiota. Faecal samples were frozen at −20 °C and have been stored at −80 °C until further funding has been secured. Cognitive function was assessed across memory, attention, processing speed and executive function using a selection of tests from the Cambridge Automated Neuropsychological Test
8
Automated Battery (CANTAB). These particular cognitive domains were examined due to their vulnerability to aging and cardiovascular health, and their demonstrated sensitivity to short term nutritional interventions [48-53]. The battery of tests included Motor Orientation Task (MOT), Paired Associates Learning (PAL), Delayed Matching to Sample (DMS), Verbal Recognition Memory (VRM), Reaction Time (RTI), Rapid Visual Information Processing (RVIP), Spatial Working Memory (SWM), One Touch Stockings of Cambridge (OTS) and Attention Switching Task (AST). A computerised mode of testing was chosen to increase accuracy and reliability, especially where sensitivity to processing speed is critical [54]. To screen for dementia and MCI, and to detect change in cognitive function associated with dementia and MCI (attention, orientation, memory, fluency, language and visuospatial abilities), the ACE-R was administered during screening visits and at the end of each dietary phase [55]. The ACE-R is frequently used in clinical and research settings, with high sensitivity and specificity for detecting both dementia and MCI. Dietary adherence A 15-item Mediterranean diet adherence survey and a 9-item low-fat diet adherence survey (Appendix F) were administered to participants bi-weekly to capture generalised patterns of food consumption during each of the intervention phases. Each survey has been adapted from the PREDIMED study to reflect an Australian food supply and national guidelines for alcohol consumption. While on the Mediterranean diet, participants also completed a semi-quantitative weekly checklist (Appendix C, described above). Adherence to the dietary phase was determined at each fortnightly visit, where participants must have met a minimum adherence requirement of 75%, as determined by checklists. If participants scored below 75% and were unable to increase their adherence in the next two weeks they were to be withdrawn from the study. To determine the impact of dietary adherence on outcomes an overall Mediterranean diet score [8, 26] was also calculated using data from a 3-day weighed food record (WFR) completed by participants before and at the end of each intervention phase.
Procedure
Data were collected by participants at home, and by study personnel during clinic assessment visits at the SIHR CTF across the course of the trial (See Figure 2). Participants attended a pre-baseline appointment at the SIHR CTF where the study was explained and informed consent was obtained by study personnel (Appendix G). Instructions and equipment were given for the collection of home measures, including blood pressure, SF-36, POMS and WFR. Participants then returned one week later for week 0 assessments. Clinic assessment visits took place at baseline of the first diet (week 0), at the end of the first diet (week 8), at baseline of the second diet, after the 8-week washout period (week 16), and at the end of the second diet (week 24). Data for home measures were collected by participants in the week prior to each of these visits. At clinic assessment visits participants were fasted from food, beverages (excluding water), alcohol and caffeine for 12 hours. Clinic assessment visits included measurement of blood pressure, body anthropometry, DEXA and collection of fasted blood samples. At weeks 0 and 16 participants were allocated to their diet and met with a dietitian to discuss dietary guidelines. Participants were then given a continental breakfast before cognitive tasks were administered. To minimise the impact and influence of external variables, cognitive testing conditions were rigorously controlled and standardised as outlined by [56].

9
Participants commenced their dietary intervention on the day following week 0 and week 16 visits, and commenced the washout period on the day of the week 8 visit. Between weeks 0 and 8, and 16 and 24 participants attended bi-weekly dietetic visits at the SIHR CTF. In the final dietetic visit of each diet phase, and at week 15, participants were provided with equipment for the collection of home measures to be returned at their next clinic assessment visit. Volunteers were instructed to continue any habitual exercise and medications for the duration of the trial. Changes to exercise and medications were monitored and recorded at bi-weekly dietetic visits and clinic assessment visits by the investigators.
Statistical analysis
Statistical analyses were conducted using SPSS for Windows, version 21.0 (SPSS Inc., Chicago, IL, USA) and Stata (version 14.2, StataCorp, College Station, TX, USA). Data is presented as means ± standard deviation (SD) for descriptive statistics and as means ± standard error (SEM) for reporting estimated effects. All tests are 2-tailed with p-values < 0.05 deemed statistically significant. Based on power calculations, a sample size of 31 volunteers was required to detect a clinically relevant difference of 2.5 mm Hg in home blood pressure, the primary outcome measure, with power of 90%. This calculation accounts for a total of 54 readings (three readings taken three times per day for 6 days) at each time point, a within-group standard deviation of 14 mm Hg, a within-subject repeated measures correlation of r = 0.6 and a between-phase within-subject correlation of ρ = 0.5. The correlation (ρ) and use of a cross-over design reduces the number of required participants by a factor of (1 − ρ)/2 = 4 [153] i.e., from approximately n = 124 for a parallel group design using ANCOVA (n = 62 per group) to n = 31 subjects in total. To calculate cognitive composite scores, individual CANTAB test scores were converted to z-scores and averaged relative to domains. For tests where lower scores indicate better performance (e.g. processing speed), raw scores were reversed. This was achieved by subtracting raw scores from a constant (maximum score obtained in test +1.0). Supplemental Table 1 lists the individual CANTAB tests included in each composite. Residuals were screened for normality. Non-normal variables were transformed using log10 and square root transformations. Where relevant, p values are presented for transformed data while original means have been retained. Preliminary analyses were conducted to detect order effects, period effects and carryover effects between dietary periods. Linear mixed effects models were then run to detect significant interactions between diet and visit over the 8-week intervention periods. Period of intervention (1 and 2) and Order in which dietary interventions were given (1 and 2) were included in the model as fixed effects while participant IDs were included as random effects. Where period effects were detected in the preliminary analysis, a Treatment*Visit*Period term was included in the model. Where carryover effects were detected, a Visit*Period term was included. As change in weight is likely to influence results weight at each time point was included as a covariate for all cardiometabolic outcomes, excluding measures of body composition and adiposity. Intention to treat analyses included all participants with baseline data (n=33). Missing data was calculated using best linear unbiased predictions (BLUP). Continuous variables are presented as mean ± standard error of mean (SEM). Difference in change between interventions (i.e. the difference between Week 0 and Week 8 following the MedPork intervention vs. the difference between Week 0 and Week 8 following the LF intervention) is presented as “mean difference” and “mean difference in 8 week change”. Positive values indicate an increase following the MedPork intervention and negative values indicate a decrease following the MedPork intervention.
10
Previous studies have indicated that BP readings taken on the first day of home BP measurement may be higher than subsequent days. Daily averages were therefore computed for home measured SBP at week 0 and paired samples t tests were conducted to compare Day 1 with all other days. No significant differences were detected at p<0.05 and therefore Day 1 of SBP readings were retained in the analysis. Averages were also computed for the first, second and third readings taken at week 0. Paired sampled t-tests revealed significant differences first readings as compared with second and third readings. First readings were therefore excluded from the final analysis.
3. Outcomes
Results
Baseline data was collected for 33 participants and a total of 31 participants completed the two dietary interventions. The following results are based on an intention to treat analysis (n=33). Figure 1 illustrates the consort flow of the study, indicating time of withdrawals. Two participants withdrew prior to baseline assessments; one participant withdrew during the MedPork intervention and one participant withdrew during the washout period, prior to commencing the LF intervention. Reasons for withdrawal included competing commitments (n=1) and illness preventing adherence to dietary intervention (n=1). Participants were randomly allocated to their starting dietary intervention. Group 1 (n=15) completed the MedPork intervention in Period 1 and the LF intervention in Period 2; Group 2 (n=18) completed the LF intervention in Period 1 and the MedPork intervention in Period 2. Baseline characteristics of each group are presented in Table 1. No significant differences were detected between groups for demographic or cardiometabolic outcomes. Period and carryover effects Period effects were detected for home measured morning DBP, total cholesterol and HDL. Carryover effects were detected for clinic DBP and LDL. Dietary adherence LF intervention Adherence to the LF intervention was measured using the 9-item low-fat questionnaire from the PREDIMED study. The 9-item questionnaire contains questions relating to the intake of high fat foods, such as butter, oil, nuts, fish, fatty meats, commercially baked goods and high fat snacks, and was completed each fortnight. The average score achieved across the four fortnights of the LF intervention was 8.4±1.1 out of a maximum of 9 points (93.3% compliance). MedPork intervention Adherence to the MedPork intervention was measured using a 15-tem MedDiet questionnaire, adapted from the PREDIMED study. This 15-item questionnaire included questions relating to fruit and vegetable intake, legume, nut and fish intake, EVOO use and restriction of sweetened

11
beverages, commercial baked goods, chocolate, and fatty meats. An additional item was added to the original questionnaire to capture data relating to pork intake. The average score during the MedPork intervention was 13.5±1.7 out of 15 (90% compliance). The questionnaire was also administered prior to the study during screening, to ensure participants did not already follow a MedDiet. The average score at screening was 6/15, thus compliance increased by 7.5 points.
Table 1. Demographic and clinical characteristics of study sample at baseline,
according to first dietary intervention.
Total
(n=33)
Group 1
(n=15)
Group 2
(n=18)
Age (years) 61.0±7.1 60.2±8.7 61.6±5.7
Gender
Males (%) 10 (30.3) 6 (40.0) 4 (22.2)
Females (%) 23 (69.7) 9 (60.0) 14 (77.8)
Education (years) 16.7±4.4 15.7±3.5 17.5±4.9
Home SBP average (mmHg) 128.9±12.1 129.2±14.0 128.5±10.4
Home DBP average (mmHg) 76.1±8.5 74.7±9.0 77.4±8.1
Home HR average (mmHg) 71.0±7.0 71.9±7.8 70.1±6.2
Insulin (mU/L) 10.7±5.2 10.0±4.5 11.2±5.7
Glucose (mmol/L) 5.4±0.6 5.3±0.6 5.4±0.6
Total cholesterol (mmol/L) 5.8±0.9 5.9±0.8 5.6±1.0
Weight (kg) 85.1±17.7 87.8±17.3 82.7±18.2
BMI (kg/m2) 30.6±5.1 31.6±5.7 29.8±4.6
Values are presented as mean (SD). Group 1 received MedPork intervention first; Group 2 received LF intervention first; SBP, systolic blood pressure; DBP, diastolic blood pressure; HR, heart rate; mmHg, millimetres of mercury; bpm, beats per minute; mU/L, milliunits per litre; mmol/L, millimoles per litre; CRP, C-reactive protein; HDL, high-density lipoprotein; LDL, low-density lipoprotein; BMI, body mass index.

12
Figure 1. Consort diagram illustrating flow of participants from recruitment through to study completion.
Response to advertisements n=395
DLQ sent n=290
DLQ returned n=98
DLQ eligible and screening booked
n=66
Screenings completed n=66
Ineligible n=27
Eligible n=39
Enrolled n=35
MedPork n=15
LF n=18
MedPork n=18
LF n=13
Withdrawal prior to baseline
n=2
Withdrawal after commencement
n=1
Withdrawal prior to commencement
n=1
Withdrawal prior to enrolment
n=4
Completed n=31

13
Table 2. Home blood pressure at Baseline and Week 8, including between group differences
MedPork diet (n=33) LF diet (n=33) Diet*Visit
Estimated mean difference
between interventions
(MedPork vs LF)1
Variable Baseline Week 8 Baseline Week 8 p value (95% CI)
SBP morning (mmHg) 126.99±0.77 126.02±1.77 125.91±1.78 124.81±1.78 0.07 1.21 (-0.12, 2.54)
SBP afternoon (mmHg) 129.62±1.66 126.53±1.66 128.06±0.67 126.91±1.66 0.60 -0.38 (-1.81, 1.05)
SBP evening (mmHg) 126.61±1.71 127.43±1.70 127.23±1.72 127.55±1.71 0.87 -0.12 (-1.54, 1.31)
SBP average (mmHg) 128.46±1.59 126.62±1.58 127.09±1.59 126.42±1.59 0.64 0.20 (-0.66, 1.06)
DBP morning (mmHg) 76.91±1.29 77.09±1.29 77.16±1.29 77.43±1.29 0.45 -0.34 (-1.23, 0.55)
DBP afternoon (mmHg) 75.83±1.24 76.38±1.24 75.63±1.25 76.19±1.24 0.71 0.19 (-0.80, 1.17)
DBP evening (mmHg) 73.92±1.31 76.24±1.31 74.51±1.32 75.76±1.31 0.34 0.48 (-0.50, 1.46)
DBP average (mmHg) 75.72±1.22 76.72±1.22 75.89±1.22 76.53±0.22 0.52 0.19 (-0.39, 0.76)
HR morning (bpm) 67.55±1.27 66.66±1.27 66.22±1.27 66.57±1.27 0.81 0.10 (-0.73, 0.92)
HR afternoon (bpm) 71.65±1.26 70.95±1.26 71.33±1.27 70.73±1.26 0.70 0.21 (-0.86, 1.28)
HR evening (bpm) 73.01±1.14 70.56±1.14 70.27±1.15 70.05±1.14 0.32 0.51 (-0.51, 1.52)
HR average (bpm) 70.25±1.51 69.20±0.51 68.81±0.51 69.03±1.51 0.60 0.17 (-0.45, 0.79)
Values are presented as observed mean±SEM. 1Estimated marginal mean difference from linear mixed effects models. Differences between interventions were analysed by linear mixed effects models, including fixed effect terms for Group, Visit, Group X Visit, Period, Order and Weight. SBP, systolic blood pressure; DBP, diastolic blood pressure; HR, heart rate; mmHg, millimetres of mercury; bpm, beats per minute.

14
Table 3. Clinic measures at Baseline and Week 8, including between group differences
MedPork diet (n=33) LF diet (n=33) Diet*Visit
Estimated mean difference
between interventions
(MedPork vs LF)1
Variable Baseline Week 8 Baseline Week 8 p value (95% CI)
SBP clinic (mmHg) 134.81±2.60 129.75±2.62 128.45±2.64 127.22±2.64 0.23 2.53 (-1.63, 6.68)
DBP clinic (mmHg) 84.91±1.57 83.23±1.58 84.04±1.59 83.77±1.59 0.66 -0.53 (-2.90, 1.84)
HR clinic (bpm) 65.92±1.44 65.57±1.45 67.12±1.47 64.86±1.47 0.59 0.71 (-1.89, 3.32)
Insulin (mU/L) 2 10.66±0.90 112.07±0.90 10.74±0.92 10.56±0.91 0.26 1.51 (-0.10, 3.12)
Glucose (mmol/L) 5.26±0.12 5.28±0.12 5.32±0.12 5.21±0.12 0.38 0.01 (-0.09, 0.11)
CRP (mg/L) 2 1.99±0.33 2.09±0.33 2.26±0.34 2.11±0.34 0.79 -0.02 (-0.39, 0.36)
Total trig (mmol/L) 2 1.51±0.11 1.50±0.11 1.49±0.11 1.54±0.11 0.22 -0.04 (-0.20, 0.11)
Total chol (mmol/L) 5.74±1.44 5.42±1.45 5.71±1.45 5.49±1.45 0.47 -0.07 (-0.26, 0.12)
HDL (mmol/L) 1.56±0.06 1.47±0.06 1.55±0.06 1.47±0.06 0.87 0.01 (-0.06, 0.07)
LDL (mmol/L) 3.46±0.13 3.24±0.13 3.45±0.13 3.32±0.13 0.36 -0.07 (-0.23, 0.08)
Chol HDL ratio 2 3.83±0.16 3.81±0.16 3.84±0.16 3.87±0.16 0.85 -0.06 (-0.21, 0.09)
Weight (kg) 84.33±2.91 83.08±2.91 84.26±2.91 82.43±2.91 0.04 0.65 (0.04, 1.25)
BMI (kg/m2) 2 30.40±0.84 29.94±0.84 30.35±0.84 29.69±0.84 0.01 0.25 (0.03, 0.47)

15
Waist circum. (cm) 99.51±2.15 98.73±2.15 99.53±2.15 97.33±2.15 <0.01 1.40 (0.45, 2.34)
Hip circum. (cm) 109.61±2.06 108.17±2.06 109.76±2.06 108.12±2.06 0.90 0.05 (-0.72, 0.81)
Fat mass (%) 42.11±1.48 41.69±1.47 43.02±1.48 41.35±1.48 0.52 0.34 (-0.70, 1.37)
Lean mass (%) 55.99±1.36 56.37±1.36 55.88±1.36 56.81±1.36 0.08 -0.44 (-0.92, 0.05)
Fat mass (kg) 2 34.88±1.92 34.04±1.92 34.92±1.92 33.46±1.92 0.04 0.58 (0.02, 1.15)
Lean mass (kg) 2 47.21±1.85 46.81±1.85 47.13±1.85 46.81±1.85 0.29 0.01 (-0.36, 0.35)
Ab fat (kg) 2 3.40±0.21 3.29±0.21 3.39±0.22 3.28±0.22 0.87 0.01 (-0.11, 0.13)
Values are presented as observed mean±SEM. 1 Estimated marginal mean difference from linear mixed effects models. Differences between interventions were analysed by linear mixed effects models, including fixed effect terms for Group, Visit, Group X Visit, Period, Order and Weight (excluding weight-related variables). 2 Transformed variable. Raw mean±SEM presented with p value from transformed data. SBP, systolic blood pressure; DBP, diastolic blood pressure; HR, heart rate; CRP, C-reactive protein; trig, triglyceride; Chol, cholesterol; HDL, high-density lipoprotein; LDL, low-density lipoprotein; BMI, body mass index; Ab, abdominal.

16
Table 4. Cognitive composite scores at Baseline and Week 8, including between group differences
MedPork diet (n=33) LF diet (n=33) Diet*Visit
Estimated mean difference
between interventions (MedPork
vs LF)1
Variable Baseline Week 8 Baseline Week 8 p value (95% CI)
Attention -0.14±0.11 0.17±0.11 -0.06±0.11 0.14±0.11 0.70 0.04 (-0.14, 0.21)
Processing speed -0.04±0.16 0.13±0.16 0.01±0.16 -0.19±0.16 0.01 0.32 (0.08, 0.57)
Memory 0.04±0.09 -0.08±0.09 0.03±0.09 0.07±0.09 0.06 -0.15 (-0.31, 0.01)
Planning -0.18±0.11 0.15±0.11 -0.05±0.11 0.09±0.11 0.56 0.06 (-0.14, 0.26)
Values are presented as observed mean±SEM. Values are composite z-scores. 1Estimated marginal mean difference from linear mixed effects models. Differences between interventions were analysed by linear mixed effects models, including fixed effect terms for Group, Visit, Group X Visit, Period, Order and Weight (excluding weight-related variables). Increase in a score for all cognitive outcomes indicates improvement.

17
Table 5. Energy and nutrient intakes at Baseline and Week 8, including between group differences
MedPork diet (n=33) LF diet (n=33) Diet*Visit
Estimated mean difference
between interventions
(MedPork vs LF)1
Nutrients Baseline Week 8 Baseline Week 8 p value (95% CI)
Energy (MJ) 8.96±0.33 8.33±0.33 9.00±0.33 7.86±0.34 0.24 0.47 (-0.32, 1.27)
% en from protein 18.40±0.65 19.71±0.67 19.45±0.66 22.21±0.68 <0.01 -2.51 (-4.10, 0.91)
% en from total fat 34.08±1.25 36.84±1.29 34.59±1.27 27.52±1.31 <0.001 9.32 (5.91, 12.74)
% en from SFA 12.07±0.57 9.18±0.58 12.24±0.57 9.23±0.59 0.94 -0.05 (-1.41, 1.31)
% en from MUFA 5.41±0.34 7.61±0.35 5.53±0.35 5.05±0.36 <0.001 2.56 (1.61, 3.51)
% en from PUFA 13.89±0.76 17.37±0.79 14.16±0.77 10.68±0.80 <0.001 6.69 (4.55, 8.83)
MUFA:SFA 2 1.24±0.09 1.99±0.09 1.19±0.09 1.18±0.09 <0.001 0.81 (0.59, 1.03)
% en from CHO 39.50±1.37 35.23±1.37 38.59±1.35 41.23±1.39 <0.001 -6.00 (-9.22, -2.79)
% en from alcohol 4.41±0.81 3.45±0.82 3.54±0.82 3.99±0.83 0.37 -0.55 (-1.75, 0.65)
Cholesterol (mg/MJ) 2 37.76±3.40 33.64±3.48 43.57±3.44 38.97±3.58 0.06 -5.33 (-12.85, 2.18)
Fibre (g/MJ) 3.03±0.19 3.98±0.19 3.06±0.19 3.84±0.20 0.54 0.14 (-0.31, 0.59)
Vitamin C (mg/MJ) 2 11.34±0.39 21.53±1.56 12.53±1.51 17.26±1.58 0.10 4.28 (0.30, 8.25)
Vitamin E (mg/MJ) 2 1.64±0.11 2.14±0.12 1.47±0.12 1.40±0.12 <0.001 0.75 (0.45, 1.04)

18
Total vit A equiv. (µg/MJ) 2 112.80±12.59 133.77±12.04 119.91±12.75 123.06±13.07 0.96 10.71 (-16.63, 38.05)
Total folate (µg/MJ) 61.65±3.56 68.28±3.68 63.94±3.63 81.11±3.74 <0.01 -12.83 (-21.57, 4.09)
β-carotene equiv. (µg/MJ) 2 489.23±74.72 673.45±77.36 513.14±75.66 581.35±77.51 0.45 92.10 (-69.96, 254.17)
Sodium (mg/MJ) 280.09±15.28 243.15±15.51 315.64±15.26 283±93±15.80 0.06 -40.78 (-82.36, 0.79)
Calcium (mg/MJ) 103.65±6.53 112.04±0.75 108.87±6.61 122.25±6.76 0.14 -10.21 (-23.76, 3.33)
Iron (mg/MJ) 2 1.48±0.07 1.48±0.07 1.39±0.07 1.63±0.07 0.21 -0.15 (-0.34, 0.03)
Zinc (mg/MJ) 1.32±0.06 1.27±0.06 1.30±0.06 1.40±0.06 0.07 -0.12 (-0.26, 0.01)
Linoleic acid (g/MJ) 1.18±0.08 1.69±0.08 1.23±0.08 1.11±0.09 <0.001 0.59 (0.36, 0.81)
α-linolenic acid (g/MJ) 2 0.17±0.01 0.23±0.02 0.16±0.02 0.16±0.02 <0.001 0.07 (0.03, 0.11)
Serves/day
Whole grains 2 2.14±0.26 2.44±0.27 1.70±0.26 2.03±0.27 0.14 0.41 (-0.20, 1.01)
Refined grains 2 3.61±0.37 1.96±0.38 3.84±0.38 3.45±0.38 <0.01 -1.49 (-2.30, -0.68)
Fruits 1.30±0.17 2.20±0.18 1.57±0.18 1.74±0.18 0.03 0.46 (0.05, 0.86)
Vegetables 2 4.39±0.60 5.83±0.62 3.66±0.61 5.02±0.64 0.10 0.82 (-0.90, 2.54)
Legumes 2 0.19±0.09 0.63±0.09 0.23±0.09 0.35±0.09 <0.01 0.28 (0.03, 0.53)
Meat/meat altern. 2.71±0.19 3.43±0.20 2.95±0.20 2.62±0.20 <0.001 0.81 (0.34, 1.27)
Red meat 2 0.64±0.13 0.85±0.13 0.78±0.13 0.71±0.13 0.27 0.14 (-0.12, 0.40)

19
Seafood 2 0.38±0.08 0.64±0.08 0.30±0.08 0.39±0.08 <0.01 0.25 (0.04, 0.46)
Nuts and seeds 2 0.47±0.08 0.96±0.08 0.50±0.08 0.22±0.08 <0.001 0.73 (0.52, 0.94)
Total dairy 2 1.84±0.20 1.60±0.20 1.92±0.20 1.93±0.20 0.15 -0.32 (-0.74, 0.09)
EVOO (tsp/day) 2 7.68±0.65 12.89±0.66 8.33±0.65 6.39±0.68 <0.001 6.51 (4.73, 8.29)
Serves/day/MJ
Whole grains 0.24±0.03 0.31±0.03 0.19±0.03 0.27±0.03 0.26 0.04 (-0.03, 0.12)
Refined grains 2 0.40±0.04 0.23±0.04 0.43±0.04 0.43±0.03 <0.001 -0.19 (-0.28, -0.11)
Fruits 0.15±0.02 0.28±0.02 0.18±0.02 0.24±0.02 0.13 0.04 (-0.01, 0.08)
Vegetables 2 0.49±0.06 0.71±0.06 0.43±0.06 0.58±0.07 0.10 0.13 (0.05, 0.30)
Legumes 2 0.02±0.01 0.08±0.01 0.02±0.01 0.04±0.01 <0.01 0.03 (0.01, 0.06)
Meat/meat altern. 0.30±0.02 0.42±0.02 0.33±0.02 0.34±0.02 <0.01 0.08 (0.03, 0.13)
Red meat 2 0.08±0.02 0.10±0.02 0.08±0.02 0.09±0.02 0.41 0.01 (-0.02, 0.04)
Seafood 2 0.04±0.01 0.08±0.01 0.04±0.01 0.04±0.01 <0.01 0.03 (0.01, 0.06)
Nuts and seeds 0.05±0.01 0.12±0.01 0.06±0.01 0.03±0.01 <0.001 0.09 (0.06, 0.11)
Total dairy 0.19±0.02 0.19±0.02 0.22±0.02 0.25±0.02 <0.01 -0.06 (-0.09, -0.02)
EVOO (tsp/day/MJ) 2 0.92±0.07 1.54±0.08 0.96±0.07 0.79±0.08 <0.001 0.75 (0.55, 0.95)
Values are mean±SEM. 1Estimated marginal mean difference from linear mixed effects models. Differences between interventions were analysed by linear mixed effects models, including fixed effect terms for Group, Visit, Group X Visit, Period, Order and Weight (excluding weight-related variables). 2Transformed variable. Raw mean±SEM presented with p value from transformed data. En, energy; SFA, saturated fat; MUFA, monounsaturated fat; PUFA, polyunsaturated fat; CHO, carbohydrates, Vit, vitamin; equiv, equivalents; altern, alternatives.

20
Table 7. Sensitivity Analysis: Average systolic blood pressure, diastolic blood pressure and pulse pressure at Baseline and Week 8, including between group differences, in overweight (BMI<30) and obese (BMI≥30) participants
MedPork diet (n=33) LF diet (n=33) Diet*Visit
Estimated mean difference
between interventions
(MedPork vs LF)1
Variable Baseline Week 8 Baseline Week 8 p value (95% CI)
SBP Average
Overweight (n=17) 127.51±1.87 124.39±1.86 126.37±1.88 125.95±1.88 0.01 -1.56 (-2.77, -0.34)
Obese (n=14) 132.71±2.40 132.22±2.38 131.35±2.38 128.54±2.36 <0.001 2.68 (1.25, 4.10)
DBP Average
Overweight (n=17) 73.49±1.36 75.24±1.36 73.82±1.37 74.02±1.36 <0.01 1.22 (0.45, 1.98)
Obese (n=14) 80.50±2.04 80.67±2.02 80.35±2.04 81.59±2.03 0.06 -0.92 (-1.87, 0.03)
Pulse Pressure
Average
Overweight (n=17) 57.71±2.81 50.75±2.81 54.68±2.89 52.96±2.89 <0.01 -2.21 (-3.55, -0.88)
Obese (n=14) 53.66±2.64 53.63±2.56 52.84±2.59 48.28±2.55 <0.001 5.36 (3.71, 7.00)
Values are presented as observed mean±SEM. 1Estimated marginal mean difference from linear mixed effects models. Differences between interventions were analysed by linear mixed effects models, including fixed effect terms for Group, Visit, Group X Visit, Period, Order and Weight.
21
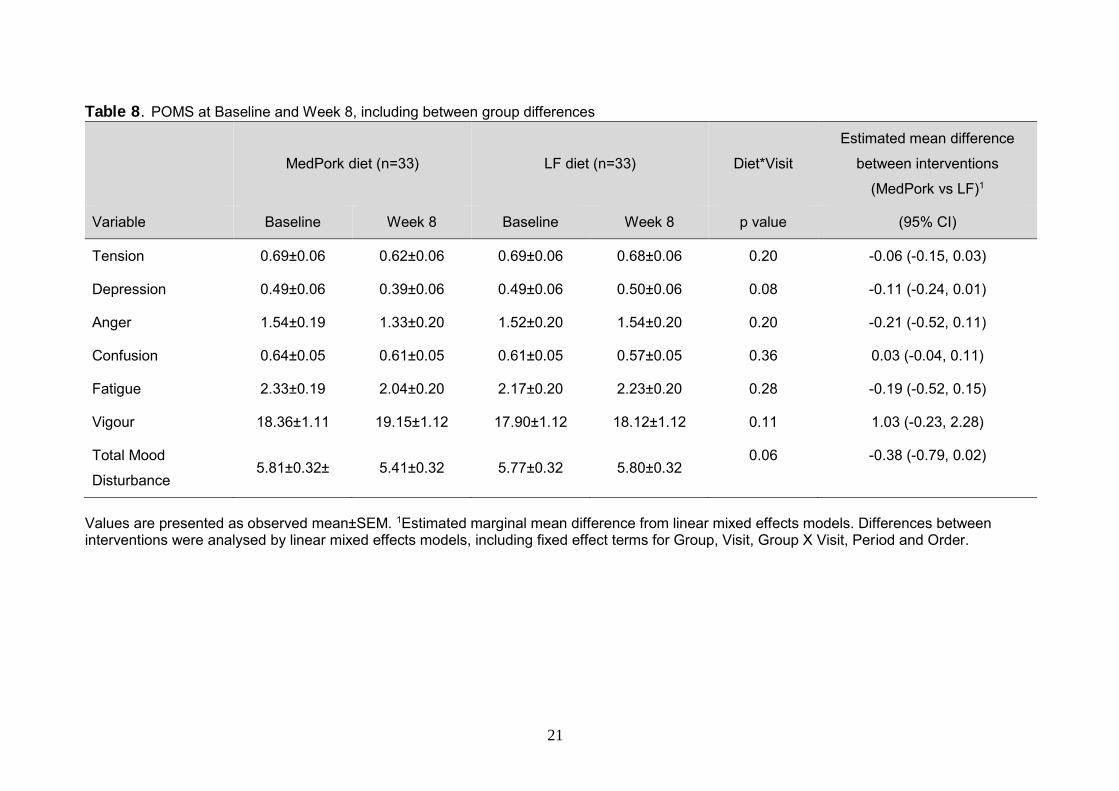
Table 8. POMS at Baseline and Week 8, including between group differences
MedPork diet (n=33) LF diet (n=33) Diet*Visit
Estimated mean difference
between interventions
(MedPork vs LF)1
Variable Baseline Week 8 Baseline Week 8 p value (95% CI)
Tension 0.69±0.06 0.62±0.06 0.69±0.06 0.68±0.06 0.20 -0.06 (-0.15, 0.03)
Depression 0.49±0.06 0.39±0.06 0.49±0.06 0.50±0.06 0.08 -0.11 (-0.24, 0.01)
Anger 1.54±0.19 1.33±0.20 1.52±0.20 1.54±0.20 0.20 -0.21 (-0.52, 0.11)
Confusion 0.64±0.05 0.61±0.05 0.61±0.05 0.57±0.05 0.36 0.03 (-0.04, 0.11)
Fatigue 2.33±0.19 2.04±0.20 2.17±0.20 2.23±0.20 0.28 -0.19 (-0.52, 0.15)
Vigour 18.36±1.11 19.15±1.12 17.90±1.12 18.12±1.12 0.11 1.03 (-0.23, 2.28)
Total Mood
Disturbance 5.81±0.32± 5.41±0.32 5.77±0.32 5.80±0.32
0.06 -0.38 (-0.79, 0.02)
Values are presented as observed mean±SEM. 1Estimated marginal mean difference from linear mixed effects models. Differences between interventions were analysed by linear mixed effects models, including fixed effect terms for Group, Visit, Group X Visit, Period and Order.