3b FORCASTING heizer om10 ch04
31
4 - 1 © 2011 Pearson Education, Inc. publishing as Prentice Hall 4 Forecasting PowerPoint presentation to PowerPoint presentation to accompany accompany Heizer and Render Heizer and Render Operations Management, 10e Operations Management, 10e Principles of Operations Principles of Operations Management, 8e Management, 8e PowerPoint slides by Jeff Heyl
-
Upload
independent -
Category
Documents
-
view
1 -
download
0
Transcript of 3b FORCASTING heizer om10 ch04

4 - 1© 2011 Pearson Education, Inc. publishing as Prentice Hall
4 Forecasting
PowerPoint presentation to PowerPoint presentation to accompany accompany Heizer and Render Heizer and Render Operations Management, 10e Operations Management, 10e Principles of Operations Principles of Operations Management, 8eManagement, 8e
PowerPoint slides by Jeff Heyl

4 - 2© 2011 Pearson Education, Inc. publishing as Prentice Hall
What is Forecasting?What is Forecasting? Process of
predicting a future event
Underlying basis of all business decisions Production Inventory Personnel Facilities
??

4 - 3© 2011 Pearson Education, Inc. publishing as Prentice Hall
Short-range forecast Up to 1 year, generally less than 3
months Purchasing, job scheduling, workforce
levels, job assignments, production levels
Medium-range forecast 3 months to 3 years Sales and production planning, budgeting
Long-range forecast 3+ years New product planning, facility location,
research and development
Forecasting Time HorizonsForecasting Time Horizons

4 - 4© 2011 Pearson Education, Inc. publishing as Prentice Hall
Influence of Influence of Product Life CycleProduct Life Cycle
Introduction and growth require longer forecasts than maturity and decline
As product passes through life cycle, forecasts are useful in projecting Staffing levels Inventory levels Factory capacity
Introduction – Growth – Maturity Introduction – Growth – Maturity – Decline– Decline
4 - 5© 2011 Pearson Education, Inc. publishing as Prentice Hall
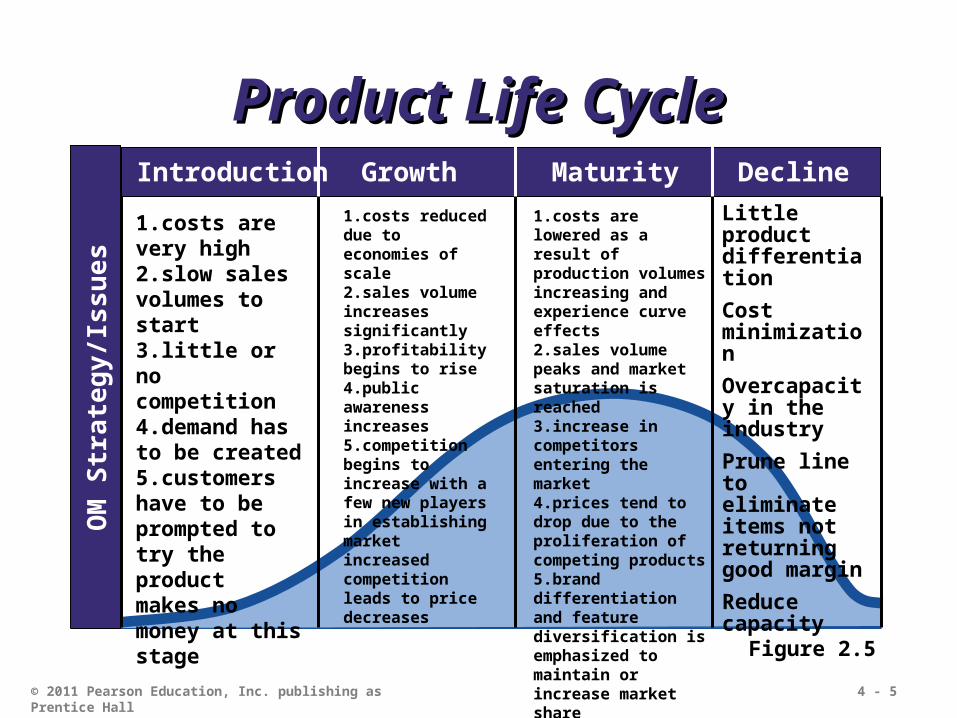
Product Life CycleProduct Life CycleIntroduction Growth Maturity Decline
OM Strategy/Issues
Little product differentiationCost minimizationOvercapacity in the industryPrune line to eliminate items not returning good marginReduce capacity
Figure 2.5
1.costs are very high2.slow sales volumes to start3.little or no competition4.demand has to be created5.customers have to be prompted to try the productmakes no money at this stage
1.costs reduced due to economies of scale2.sales volume increases significantly3.profitability begins to rise4.public awareness increases5.competition begins to increase with a few new players in establishing marketincreased competition leads to price decreases
1.costs are lowered as a result of production volumes increasing and experience curve effects2.sales volume peaks and market saturation is reached3.increase in competitors entering the market4.prices tend to drop due to the proliferation of competing products5.brand differentiation and feature diversification is emphasized to maintain or increase market shareIndustrial profits go down

4 - 6© 2011 Pearson Education, Inc. publishing as Prentice Hall
TypesTypes of Forecasts of Forecasts Economic forecasts
Address business cycle – inflation rate, money supply, housing starts, etc.
Technological forecasts Predict rate of technological progress Impacts development of new products
Demand forecasts Predict sales of existing products and
services

4 - 7© 2011 Pearson Education, Inc. publishing as Prentice Hall
Strategic ImportanceStrategic Importance of Forecastingof Forecasting
Human Resources – Hiring, training, laying off workers
Capacity – Capacity shortages can result in undependable delivery, loss of customers, loss of market share
Supply Chain Management – Good supplier relations and price advantages

4 - 8© 2011 Pearson Education, Inc. publishing as Prentice Hall
Seven Steps Seven Steps in Forecastingin Forecasting1. Determine the use of the
forecast2. Select the items to be
forecasted3. Determine the time horizon of
the forecast4. Select the forecasting model(s)5. Gather the data6. Make the forecast7. Validate and implement results

4 - 9© 2011 Pearson Education, Inc. publishing as Prentice Hall
Forecasting ApproachesForecasting Approaches
Used when situation is vague and little data exist New products New technology
Involves intuition, experience e.g., forecasting sales on
Internet
Qualitative Qualitative MethodsMethods

4 - 10© 2011 Pearson Education, Inc. publishing as Prentice Hall
Forecasting ApproachesForecasting Approaches
Used when situation is ‘stable’ and historical data exist Existing products Current technology
Involves mathematical techniques e.g., forecasting sales of
color televisions
Quantitative Quantitative MethodsMethods

4 - 11© 2011 Pearson Education, Inc. publishing as Prentice Hall
Overview of Overview of Qualitative MethodsQualitative Methods
1. Jury of executive opinion Pool opinions of high-level
experts, sometimes augment by statistical models
2. Delphi method Panel of experts, queried
iteratively

4 - 12© 2011 Pearson Education, Inc. publishing as Prentice Hall
Overview of Overview of Qualitative MethodsQualitative Methods
3. Sales force composite Estimates from individual
salespersons are reviewed for reasonableness, then aggregated
4. Consumer Market Survey Ask the customer

4 - 13© 2011 Pearson Education, Inc. publishing as Prentice Hall
Involves small group of high-level experts and managers
Group estimates demand by working together
Combines managerial experience with statistical models
Relatively quick ‘Group-think’
disadvantage
Jury of Executive OpinionJury of Executive Opinion

4 - 14© 2011 Pearson Education, Inc. publishing as Prentice Hall
Sales Force CompositeSales Force Composite
Each salesperson projects his or her sales
Combined at district and national levels
Sales reps know customers’ wants
Tends to be overly optimistic

4 - 15© 2011 Pearson Education, Inc. publishing as Prentice Hall
Delphi MethodDelphi Method Iterative group
process, continues until consensus is reached
3 types of participants Decision makers Staff Respondents
Staff(Administering survey)
Decision Makers
(Evaluate responses and
make decisions)
Respondents(People who can make valuable judgments)

4 - 16© 2011 Pearson Education, Inc. publishing as Prentice Hall
Consumer Market SurveyConsumer Market Survey
Ask customers about purchasing plans
What consumers say, and what they actually do are often different
Sometimes difficult to answer

4 - 17© 2011 Pearson Education, Inc. publishing as Prentice Hall
Overview of Overview of Quantitative ApproachesQuantitative Approaches
1.Naive approach2.Moving averages3.Exponential
smoothing4.Trend projection5.Linear regression
time-series models
associative model

4 - 18© 2011 Pearson Education, Inc. publishing as Prentice Hall
Set of evenly spaced numerical data Obtained by observing response
variable at regular time periods Forecast based only on past
values, no other variables important Assumes that factors influencing
past and present will continue influence in future
Time SeriesTime Series Forecasting Forecasting

4 - 19© 2011 Pearson Education, Inc. publishing as Prentice Hall
Trend
Seasonal
Cyclical
Random
Time SeriesTime Series Components Components

4 - 20© 2011 Pearson Education, Inc. publishing as Prentice Hall
Components of DemandComponents of DemandDe
mand
for
pro
duct
or
serv
ice
| | | |1 2 3 4
Time (years)
Average demand over 4 years
Trend component
Actual demand line
Random variation
Figure 4.1
Seasonal peaks

4 - 21© 2011 Pearson Education, Inc. publishing as Prentice Hall
Persistent, overall upward or downward pattern
Changes due to population, technology, age, culture, etc.
Typically several years duration
TrendTrend Component Component

4 - 22© 2011 Pearson Education, Inc. publishing as Prentice Hall
Regular pattern of up and down fluctuations
Due to weather, customs, etc.
Occurs within a single year
Seasonal Seasonal ComponentComponent
Number ofPeriod Length SeasonsWeek Day 7Month Week 4-4.5Month Day 28-31Year Quarter 4Year Month 12Year Week 52

4 - 23© 2011 Pearson Education, Inc. publishing as Prentice Hall
Repeating up and down movements Affected by business cycle,
political, and economic factors Multiple years duration Often causal or
associative relationships
CyclicalCyclical Component Component
0 5 10 15 20

4 - 24© 2011 Pearson Education, Inc. publishing as Prentice Hall
Erratic, unsystematic, ‘residual’ fluctuations
Due to random variation or unforeseen events
Short duration and nonrepeating
RandomRandom Component Component
M T W T F

4 - 25© 2011 Pearson Education, Inc. publishing as Prentice Hall
AssociativeAssociative Forecasting Forecasting
Used when changes in one or more independent variables can be used to predict the changes in the dependent
variableMost common technique is linear regression analysis
We apply this technique just as We apply this technique just as we did in the time series we did in the time series
exampleexample

4 - 26© 2011 Pearson Education, Inc. publishing as Prentice Hall
AssociativeAssociative Forecasting ForecastingForecasting an outcome based on predictor variables using the least squares technique
y = a + bx^
where y= computed value of the variable to be predicted (dependent variable)a= y-axis interceptb= slope of the regression linex= the independent variable though to predict the value of the dependent variable
^

4 - 27© 2011 Pearson Education, Inc. publishing as Prentice Hall
Forecasting at Disney WorldForecasting at Disney World Global portfolio includes parks
in Hong Kong, Paris, Tokyo, Orlando, and Anaheim
Revenues are derived from people – how many visitors and how they spend their money
Daily management report contains only the forecast and actual attendance at each park

4 - 28© 2011 Pearson Education, Inc. publishing as Prentice Hall
Forecasting at Disney WorldForecasting at Disney World
Disney generates daily, weekly, monthly, annual, and 5-year forecasts
Forecast used by labor management, maintenance, operations, finance, and park scheduling
Forecast used to adjust opening times, rides, shows, staffing levels, and guests admitted

4 - 29© 2011 Pearson Education, Inc. publishing as Prentice Hall
Forecasting at Disney WorldForecasting at Disney World 20% of customers come from
outside the USA Economic model includes gross
domestic product, cross-exchange rates, arrivals into the USA
A staff of 35 analysts and 70 field people survey 1 million park guests, employees, and travel professionals each year

4 - 30© 2011 Pearson Education, Inc. publishing as Prentice Hall
Forecasting at Disney WorldForecasting at Disney World Inputs to the forecasting model
include airline specials, Federal Reserve policies, Wall Street trends, vacation/holiday schedules for 3,000 school districts around the world
Average forecast error for the 5-year forecast is 5%
Average forecast error for annual forecasts is between 0% and 3%

4 - 31
THANK YOU
© 2011 Pearson Education, Inc. publishing as Prentice Hall